UNITED STATES
SECURITIES AND EXCHANGE COMMISSION
Washington, D.C. 20549
FORM
Quarterly report pursuant to Section 13 or 15(d) of the Securities Exchange Act of 1934 | |
|
|
| for the quarterly period ended |
OR
Transition report pursuant to Section 13 or 15(d) of the Securities Exchange Act of 1934 | |
|
|
| for the transition period from _________ to _________ . |
Commission File Number:
(Exact name of registrant as specified in its charter) |
(State or other jurisdiction of | (I.R.S. Employer | |
incorporation or organization) | Identification No.) |
(Address of principal executive offices) (Zip code)
(
(Registrant’s telephone number, including area code)
Indicate by check mark whether the registrant (1) has filed all reports required to be filed by Section 13 or 15(d) of the Securities Exchange Act of 1934 during the preceding 12 months (or for such shorter period that the registrant was required to file such reports), and (2) has been subject to such filing requirements for the past 90 days. ☒
Indicate by check mark whether the registrant has submitted electronically every Interactive Data File required to be submitted pursuant to Rule 405 of Regulation S-T (§232.405 of this chapter) during the preceding 12 months (or for such shorter period that the registrant was required to submit such files). ☒
Indicate by check mark whether the registrant is a large accelerated filer, an accelerated filer, a non-accelerated filer, smaller reporting company or an emerging growth company. See the definitions of “large accelerated filer,” “accelerated filer,” “smaller reporting company,” and “emerging growth company” in Rule 12b-2 of the Exchange Act.
Large accelerated filer | ☐ | Accelerated filer | ☐ |
☒ | Smaller reporting company | ||
|
| Emerging growth company |
If an emerging growth company, indicate by a check mark if the registrant has elected not to use the extended transition period for complying with any new or revised financial accounting standards provided pursuant to Section 13(a) of the Exchange Act. ☐
Indicate by check mark whether the registrant is a shell company (as defined in Rule 12b-2 of the Exchange Act).
Indicate the number of shares outstanding of each of the issuer’s classes of common stock, as of the last practicable date.
|
| Total Number of Outstanding Shares as of November 8, 2022 |
| |
Teucrium Corn Fund |
|
|
| |
Teucrium Sugar Fund |
|
|
| |
Teucrium Soybean Fund |
|
|
| |
Teucrium Wheat Fund |
|
|
| |
Teucrium Agricultural Fund |
|
|
| |
Hashdex Bitcoin Futures ETF |
|
|
| |
TEUCRIUM COMMODITY TRUST
Table of Contents
|
|
| Page |
|
|
|
| ||
|
|
|
|
|
Item 1. | Financial Statements |
| 3 |
|
|
|
|
|
|
Item 2. | Management’s Discussion and Analysis of Financial Condition and Results of Operations |
| 4 |
|
|
|
|
|
|
Item 3. | Quantitative and Qualitative Disclosures About Market Risk |
| 50 |
|
|
|
|
|
|
Item 4. | Controls and Procedures |
| 54 |
|
|
|
|
|
|
Part II. OTHER INFORMATION |
|
|
| |
|
|
|
|
|
Item 1. | Legal Proceedings |
| 55 |
|
|
|
|
|
|
Item 1A. | Risk Factors |
| 55 |
|
|
|
|
|
|
Item 2. | Unregistered Sales of Equity Securities and Use of Proceeds |
| 92 |
|
|
|
|
|
|
Item 3. | Defaults Upon Senior Securities |
| 95 |
|
|
|
|
|
|
Item 4. | Mine Safety Disclosures |
| 95 |
|
|
|
|
|
|
Item 5. | Other Information |
| 95 |
|
|
|
|
|
|
Item 6. | Exhibits |
| 96 |
|
2 |
| Table of Contents |
Part I. FINANCIAL INFORMATION
Item 1. Financial Statements.
Index to Financial Statements
Documents |
| Page |
|
TEUCRIUM COMMODITY TRUST |
|
|
|
Combined Statements of Assets and Liabilities at September 30, 2022 (Unaudited) and December 31, 2021 |
| F-1 | |
Combined Schedule of Investments at September 30, 2022 (Unaudited) and December 31, 2021 |
| F-2 |
|
Combined Statements of Operations (Unaudited) for the three and nine months ended September 30, 2022 and 2021 |
| F-4 |
|
Combined Statements of Changes in Net Assets (Unaudited) for the nine months ended September 30, 2022 and 2021 |
| F-5 |
|
Combined Statements of Cash Flows (Unaudited) for the nine months ended September 30, 2022 and 2021 |
| F-6 |
|
Notes to Combined Financial Statements |
| F-7 |
|
TEUCRIUM CORN FUND |
|
|
|
Statements of Assets and Liabilities at September 30, 2022 (Unaudited) and December 31, 2021 |
| F-24 |
|
Schedule of Investments at September 30, 2022 (Unaudited) and December 31, 2021 |
| F-25 |
|
Statements of Operations (Unaudited) for the three and nine months ended September 30, 2022 and 2021 |
| F-27 |
|
Statements of Changes in Net Assets (Unaudited) for the nine months ended September 30, 2022 and 2021 |
| F-28 |
|
Statements of Cash Flows (Unaudited) for the nine months ended September 30, 2022 and 2021 |
| F-29 |
|
Notes to Financial Statements |
| F-30 |
|
TEUCRIUM SOYBEAN FUND |
|
|
|
Statements of Assets and Liabilities at September 30, 2022 (Unaudited) and December 31, 2021 |
| F-44 |
|
Schedule of Investments at September 30, 2022 (Unaudited) and December 31, 2021 |
| F-45 |
|
Statements of Operations (Unaudited) for the three and nine months ended September 30, 2022 and 2021 |
| F-47 |
|
Statements of Changes in Net Assets (Unaudited) for the nine months ended September 30, 2022 and 2021 |
| F-48 |
|
Statements of Cash Flows (Unaudited) for the nine months ended September 30, 2022 and 2021 |
| F-49 |
|
Notes to Financial Statements |
| F-50 |
|
TEUCRIUM SUGAR FUND |
|
|
|
Statements of Assets and Liabilities at September 30, 2022 (Unaudited) and December 31, 2021 |
| F-64 |
|
Schedule of Investments at September 30, 2022 (Unaudited) and December 31, 2021 |
| F-65 |
|
Statements of Operations (Unaudited) for the three and nine months ended September 30, 2022 and 2021 |
| F-67 |
|
Statements of Changes in Net Assets (Unaudited) for the nine months ended September 30, 2022 and 2021 |
| F-68 |
|
Statements of Cash Flows (Unaudited) for the nine months ended September 30, 2022 and 2021 |
| F-69 |
|
Notes to Financial Statements |
| F-70 |
|
TEUCRIUM WHEAT FUND |
|
|
|
Statements of Assets and Liabilities at September 30, 2022 (Unaudited) and December 31, 2021 |
| F-84 |
|
Schedule of Investments at September 30, 2022 (Unaudited) and December 31, 2021 |
| F-85 |
|
Statements of Operations (Unaudited) for the three and nine months ended September 30, 2022 and 2021 |
| F-87 |
|
Statements of Changes in Net Assets (Unaudited) for the nine months ended September 30, 2022 and 2021 |
| F-88 |
|
Statements of Cash Flows (Unaudited) for the nine months ended September 30, 2022 and 2021 |
| F-89 |
|
Notes to Financial Statements |
| F-90 |
|
TEUCRIUM AGRICULTURAL FUND |
|
|
|
Statements of Assets and Liabilities at September 30, 2022 (Unaudited) and December 31, 2021 |
| F-104 |
|
Schedule of Investments at September 30, 2022 (Unaudited) and December 31, 2021 |
| F-105 |
|
Statements of Operations (Unaudited) for the three and nine months ended September 30, 2022 and 2021 |
| F-107 |
|
Statements of Changes in Net Assets (Unaudited) for the nine months ended September 30, 2022 and 2021 |
| F-108 |
|
Statements of Cash Flows (Unaudited) for the nine months ended September 30, 2022 and 2021 |
| F-109 |
|
Notes to Financial Statements |
| F-110 |
|
|
|
|
|
HASHDEX BITCOIN FUTURES ETF |
|
|
|
Statements of Assets and Liabilities at September 30, 2022 (Unaudited) |
| F-121 |
|
Schedule of Investments at September 30, 2022 (Unaudited) |
| F-122 |
|
Statements of Operations (Unaudited) from the commencement of operations (September 15, 2022) through September 30, 2022 |
| F-123 |
|
Statements of Changes in Net Assets (Unaudited) from the commencement of operations (September 15, 2022) through September 30, 2022 |
| F-124 |
|
Statements of Cash Flows (Unaudited) from the commencement of operations (September 15, 2022) through September 30, 2022 |
| F-125 |
|
Notes to Financial Statements |
| F-126 |
|
3 |
TEUCRIUM COMMODITY TRUST
COMBINED STATEMENTS OF ASSETS AND LIABILITIES
|
| September 30, 2022 |
|
| December 31, 2021 |
| ||
|
| (Unaudited) |
|
|
|
| ||
Assets |
|
|
|
|
|
| ||
Cash and cash equivalents |
| $ |
|
| $ |
| ||
Interest receivable |
|
|
|
|
|
| ||
Other assets |
|
|
|
|
|
| ||
Equity in trading accounts: |
|
|
|
|
|
|
|
|
Commodity and cryptocurrency futures contracts |
|
|
|
|
|
| ||
Due from broker |
|
|
|
|
|
| ||
Total equity in trading accounts |
|
|
|
|
|
| ||
Total assets |
| $ |
|
| $ |
| ||
|
|
|
|
|
|
|
|
|
Liabilities |
|
|
|
|
|
|
|
|
Management fee payable to Sponsor |
|
|
|
|
|
| ||
Other liabilities |
|
|
|
|
|
| ||
Equity in trading accounts: |
|
|
|
|
|
|
|
|
Commodity and cryptocurrency futures contracts |
|
|
|
|
|
| ||
Due to broker |
|
|
|
|
|
| ||
Total equity in trading accounts |
|
|
|
|
|
| ||
Total liabilities |
|
|
|
|
|
| ||
|
|
|
|
|
|
|
|
|
Net Assets |
| $ |
|
| $ |
| ||
The accompanying notes are an integral part of these financial statements.
| F-1 |
| Table of Contents |
TEUCRIUM COMMODITY TRUST
COMBINED SCHEDULE OF INVESTMENTS
September 30, 2022
(Unaudited)
|
|
|
|
| Percentage of |
|
|
|
| |||
Description: Assets |
| Fair Value |
|
| Net Assets |
|
| Shares |
| |||
|
|
|
|
|
|
|
|
|
| |||
Cash equivalents |
|
|
|
|
|
|
|
|
| |||
Money market funds |
|
|
|
|
|
|
|
|
| |||
First American Government Obligations Fund - Class X (cost $148,187,971) |
| $ |
|
|
| % |
|
|
| |||
Goldman Sachs Financial Square Government Fund - Institutional Class (cost: $153,812,157) |
|
|
|
|
|
|
|
|
| |||
Total money market funds (cost $302,000,128) |
| $ |
|
|
| % |
|
|
|
| ||
|
|
|
|
|
|
|
|
|
|
|
|
|
|
|
|
|
|
|
|
|
|
| Principal Amount |
| |
Commercial Paper |
|
|
|
|
|
|
|
|
|
|
|
|
American Electric Power Company, Inc. 3.465% (cost: $12,458,317 due: 11/03/2022) |
| $ |
|
|
| % |
|
|
| |||
AT&T Inc. 3.277% (cost: $14,906,850 due: 11/28/2022) |
|
|
|
|
|
|
|
|
| |||
Brookfield Infrastructure Holdings (Canada) Inc. 3.540% (cost: $19,895,000 due: 11/15/2022) |
|
|
|
|
|
|
|
|
| |||
Crown Castle Inc. 3.234% (cost: $7,462,667 due: 11/10/2022) |
|
|
|
|
|
|
|
|
| |||
Crown Castle Inc. 3.806% (cost: $4,504,451 due: 11/23/2022) |
|
|
|
|
|
|
|
|
| |||
E. I. du Pont de Nemours and Company 3.336% (cost: $14,923,002 due: 11/21/2022) |
|
|
|
|
|
|
|
|
| |||
Entergy Corporation 3.030% (cost: $7,462,500 due: 11/14/2022) |
|
|
|
|
|
|
|
|
| |||
Entergy Corporation 3.163% (cost: $12,403,391 due: 11/28/2022) |
|
|
|
|
|
|
|
|
| |||
Fortune Brands Home & Security, Inc. 3.040% (cost: $4,977,844 due: 10/21/2022) |
|
|
|
|
|
|
|
|
| |||
Fortune Brands Home & Security, Inc. 3.754% (cost: $2,984,851 due: 11/18/2022) |
|
|
|
|
|
|
|
|
| |||
General Motors Financial Company, Inc. 2.929% (cost: $7,457,709 due: 10/14/2022) |
|
|
|
|
|
|
|
|
| |||
General Motors Financial Company, Inc. 2.878% (cost: $4,975,062 due: 10/17/2022) |
|
|
|
|
|
|
|
|
| |||
General Motors Financial Company, Inc. 3.042% (cost: $7,456,731 due: 11/08/2022) |
|
|
|
|
|
|
|
|
| |||
Glencore Funding LLC 2.856% (cost: $4,978,775 due: 10/03/2022) |
|
|
|
|
|
|
|
|
| |||
Glencore Funding LLC 2.898% (cost: $14,924,663 due: 10/18/2022) |
|
|
|
|
|
|
|
|
| |||
Harley-Davidson Financial Services, Inc. 3.029% (cost: $6,671,525 due: 10/05/2022) |
|
|
|
|
|
|
|
|
| |||
Harley-Davidson Financial Services, Inc. 2.824% (cost: $3,488,566 due: 10/18/2022) |
|
|
|
|
|
|
|
|
| |||
Harley-Davidson Financial Services, Inc. 3.487% (cost: $9,759,616 due: 11/03/2022) |
|
|
|
|
|
|
|
|
| |||
Humana Inc. 2.518% (cost: $7,483,854 due: 10/03/2022) |
|
|
|
|
|
|
|
|
| |||
ITT Inc. 2.795% (cost: $14,935,367 due: 10/11/2022) |
|
|
|
|
|
|
|
|
| |||
ITT Inc. 2.683% (cost: $4,982,266 due: 10/24/2022) |
|
|
|
|
|
|
|
|
| |||
Jabil Inc. 3.079% (cost: $7,475,219 due: 10/17/2022) |
|
|
|
|
|
|
|
|
| |||
Jabil Inc. 3.129% (cost: $12,461,250 due: 10/21/2022) |
|
|
|
|
|
|
|
|
| |||
ONEOK, Inc. 3.159% (cost: $9,975,439 due: 10/14/2022) |
|
|
|
|
|
|
|
|
| |||
ONEOK, Inc. 3.158% (cost: $9,975,221 due: 10/14/2022) |
|
|
|
|
|
|
|
|
| |||
PVH Corp. 3.535% (cost: $7,481,043 due: 10/19/2022) |
|
|
|
|
|
|
|
|
| |||
PVH Corp. 3.434% (cost: $12,465,764 due: 10/21/2022) |
|
|
|
|
|
|
|
|
| |||
V.F. Corporation 2.539% (cost: $7,479,525 due: 10/11/2022) |
|
|
|
|
|
|
|
|
| |||
V.F. Corporation 3.282% (cost: $9,964,793 due: 11/01/2022) |
|
|
|
|
|
|
|
|
| |||
V.F. Corporation 3.759% (cost: $2,480,935 due: 12/09/2022) |
|
|
|
|
|
|
|
|
| |||
Viatris Inc. 3.473% (cost: $12,478,500 due: 10/14/2022) |
|
|
|
|
|
|
|
|
| |||
Total Commercial Paper (cost: $281,330,696) |
| $ |
|
|
| % |
|
|
|
| ||
Total Cash Equivalents |
| $ |
|
|
| % |
|
|
|
| ||
|
|
|
|
|
|
|
|
|
|
|
| |
|
|
|
|
|
|
|
|
|
| Notional Amount |
| |
|
|
|
|
|
|
|
|
|
| (Long Exposure) |
| |
Commodity futures contracts |
|
|
|
|
|
|
|
|
|
|
|
|
United States corn futures contracts |
|
|
|
|
|
|
|
|
|
|
|
|
CBOT corn futures MAR23 (2,207 contracts) |
| $ |
|
|
| % |
| $ |
| |||
|
|
|
|
|
|
|
|
|
|
|
|
|
United States wheat futures contracts |
|
|
|
|
|
|
|
|
|
|
|
|
CBOT wheat futures MAR23 (2,854 contracts) |
|
|
|
|
|
|
|
|
| |||
CBOT wheat futures MAY23 (2,430 contracts) |
|
|
|
|
|
|
|
|
| |||
Total commodity futures contracts |
| $ |
|
|
| % |
| $ |
| |||
|
|
|
|
|
|
|
|
|
|
|
|
|
|
|
|
|
|
| Percentage of |
|
| Notional Amount |
| ||
Description: Liabilities |
| Fair Value |
|
| Net Assets |
|
| (Long Exposure) |
| |||
|
|
|
|
|
|
|
|
|
|
|
|
|
Commodity and Cryptocurrency futures contracts |
|
|
|
|
|
|
|
|
|
|
|
|
United States corn futures contracts |
|
|
|
|
|
|
|
|
|
|
|
|
CBOT corn futures MAY23 (1,889 contracts) |
| $ |
|
|
| % |
| $ |
| |||
CBOT corn futures DEC23 (2,426 contracts) |
|
|
|
|
|
|
|
|
| |||
|
|
|
|
|
|
|
|
|
|
|
|
|
United States soybean futures contracts |
|
|
|
|
|
|
|
|
|
|
|
|
CBOT soybean futures JAN23 (339 contracts) |
|
|
|
|
|
|
|
|
| |||
CBOT soybean futures MAR23 (290 contracts) |
|
|
|
|
|
|
|
|
| |||
CBOT soybean futures NOV23 (356 contracts) |
|
|
|
|
|
|
|
|
| |||
|
|
|
|
|
|
|
|
|
|
|
|
|
United States sugar futures contracts |
|
|
|
|
|
|
|
|
|
|
|
|
ICE sugar futures MAY23 (471 contracts) |
|
|
|
|
|
|
|
|
| |||
ICE sugar futures JUL23 (414 contracts) |
|
|
|
|
|
|
|
|
| |||
ICE sugar futures MAR24 (475 contracts) |
|
|
|
|
|
|
|
|
| |||
|
|
|
|
|
|
|
|
|
|
|
|
|
United States wheat futures contracts |
|
|
|
|
|
|
|
|
|
|
|
|
CBOT wheat futures DEC23 (2,899 contracts) |
|
|
|
|
|
|
|
|
| |||
|
|
|
|
|
|
|
|
|
|
|
|
|
United States CME Bitcoin futures contracts |
|
|
|
|
|
|
|
|
|
|
|
|
CME Bitcoin futures Oct22 (6 contracts) |
|
|
|
|
|
|
|
|
| |||
CME Bitcoin futures Nov22 (6 contracts) |
|
|
|
|
|
|
|
|
| |||
Total commodity futures contracts |
| $ |
|
|
| % |
| $ |
| |||
|
|
|
|
|
|
|
|
|
|
|
|
|
Exchange-traded funds* |
|
|
|
|
|
|
|
|
| Shares |
| |
Teucrium Corn Fund |
| $ |
|
|
| % |
|
|
| |||
Teucrium Soybean Fund |
|
|
|
|
|
|
|
|
| |||
Teucrium Sugar Fund |
|
|
|
|
|
|
|
|
| |||
Teucrium Wheat Fund |
|
|
|
|
|
|
|
|
| |||
Total exchange-traded funds (cost $46,624,323) |
| $ |
|
|
| % |
|
|
|
| ||
*The Trust eliminates the shares owned by the Teucrium Agricultural Fund from its combined statements of assets and liabilities due to the fact that these represent holdings of the other four Funds (“Underlying Funds”) owned by the Teucrium Agricultural Fund, which are included as shares outstanding of the Underlying Funds.
The accompanying notes are an integral part of these financial statements.
| F-2 |
| Table of Contents |
TEUCRIUM COMMODITY TRUST
COMBINED SCHEDULE OF INVESTMENTS
December 31, 2021
|
|
|
| Percentage of |
|
|
| |||||
Description: Assets |
| Fair Value |
|
| Net Assets |
|
| Shares |
| |||
|
|
|
|
|
|
|
|
|
| |||
Cash equivalents |
|
|
|
|
|
|
|
|
| |||
Money market funds |
|
|
|
|
|
|
|
|
| |||
First American Government Obligations Fund - Class X 0.026% (cost $30,443,449) |
| $ |
|
|
| % |
|
|
| |||
Goldman Sachs Financial Square Government Fund - Institutional Class 0.030% (cost $2,525,384) |
|
|
|
|
|
|
|
|
| |||
Total money market funds (cost $32,968,833) |
| $ |
|
|
| % |
|
|
|
| ||
|
|
|
|
|
|
|
|
|
|
|
|
|
|
|
|
|
|
|
|
|
|
| Principal Amount |
| |
Commercial Paper |
|
|
|
|
|
|
|
|
|
|
|
|
Albemarle Corporation 0.181% (cost: $9,996,324 due 01/31/2022) |
| $ |
|
|
| % |
|
|
| |||
Albemarle Corporation 0.200% (cost: $4,998,834 due 01/11/2022) |
|
|
|
|
|
|
|
|
| |||
Brookfield Infrastructure Holdings (Canada) Inc. 0.170% (cost: $2,499,021 due 01/25/2022) |
|
|
|
|
|
|
|
|
| |||
Conagra Brands, Inc. 0.160% (cost: $7,497,300 due 01/05/2022) |
|
|
|
|
|
|
|
|
| |||
Conagra Brands, Inc. 0.150% (cost: $4,998,710 due 01/18/2022) |
|
|
|
|
|
|
|
|
| |||
General Motors Financial Company, Inc. 0.160% (cost: $4,998,000 due 01/06/2022) |
|
|
|
|
|
|
|
|
| |||
General Motors Financial Company, Inc. 0.200% (cost: $9,995,111 due 01/31/2022) |
|
|
|
|
|
|
|
|
| |||
General Motors Financial Company, Inc. 0.160% (cost: $4,998,800 due 01/03/2022) |
|
|
|
|
|
|
|
|
| |||
Harley-Davidson Financial Services, Inc. 0.167% (cost: $9,996,061 due 01/13/2022) |
|
|
|
|
|
|
|
|
| |||
Harley-Davidson Financial Services, Inc. 0.170% (cost: $4,997,876 due 02/01/2022) |
|
|
|
|
|
|
|
|
| |||
Harley-Davidson Financial Services, Inc. 0.250% (cost: $4,997,328 due 03/02/2022) |
|
|
|
|
|
|
|
|
| |||
Humana Inc. 0.140% (cost: $4,998,425 due 01/07/2022) |
|
|
|
|
|
|
|
|
| |||
Jabil Inc. 0.250% (cost: $2,499,219 due 01/20/2022) |
|
|
|
|
|
|
|
|
| |||
Jabil Inc. 0.300% (cost: $7,496,063 due 02/08/2022) |
|
|
|
|
|
|
|
|
| |||
Jabil Inc. 0.310% (cost: $4,996,900 due 02/25/2022) |
|
|
|
|
|
|
|
|
| |||
Viatris Inc. 0.250% (cost: $4,997,466 due 02/11/2022) |
|
|
|
|
|
|
|
|
| |||
Viatris Inc. 0.300% (cost: $4,996,625 due 02/11/2022) |
|
|
|
|
|
|
|
|
| |||
Viatris Inc. 0.310% (cost: $4,996,986 due 03/01/2022) |
|
|
|
|
|
|
|
|
| |||
Viatris Inc. 0.200% (cost: $4,998,584 due 01/21/2022) |
|
|
|
|
|
|
|
|
| |||
WGL Holdings, Inc. 0.220% (cost: $4,998,686 due 01/12/2022) |
|
|
|
|
|
|
|
|
| |||
WGL Holdings, Inc. 0.187% (cost: $4,998,700 due 01/06/2022) |
|
|
|
|
|
|
|
|
| |||
Total Commercial Paper (total cost: $119,951,019) |
| $ |
|
|
| % |
|
|
|
| ||
Total Cash Equivalents |
| $ |
|
|
| % |
|
|
|
| ||
|
|
|
|
|
|
|
|
|
|
|
|
|
|
|
|
|
|
|
|
|
|
| Notional Amount |
| |
|
|
|
|
|
|
|
|
|
| (Long Exposure) |
| |
Commodity futures contracts |
|
|
|
|
|
|
|
|
|
|
|
|
United States corn futures contracts |
|
|
|
|
|
|
|
|
|
|
|
|
CBOT corn futures MAY22 (1,418 contracts) |
| $ |
|
|
| % |
| $ |
| |||
CBOT corn futures JUL22 (1,218 contracts) |
|
|
|
|
|
|
|
|
| |||
CBOT corn futures DEC22 (1,558 contracts) |
|
|
|
|
|
|
|
|
| |||
|
|
|
|
|
|
|
|
|
|
|
|
|
United States soybean futures contracts |
|
|
|
|
|
|
|
|
|
|
|
|
CBOT soybean futures MAR22 (234 contracts) |
|
|
|
|
|
|
|
|
| |||
CBOT soybean futures MAY22 (199 contracts) |
|
|
|
|
|
|
|
|
| |||
CBOT soybean futures NOV22 (250 contracts) |
|
|
|
|
|
|
|
|
| |||
|
|
|
|
|
|
|
|
|
|
|
|
|
United States sugar futures contracts |
|
|
|
|
|
|
|
|
|
|
|
|
ICE sugar futures MAY22 (381 contracts) |
|
|
|
|
|
|
|
|
| |||
ICE sugar futures MAR23 (392 contracts) |
|
|
|
|
|
|
|
|
| |||
|
|
|
|
|
|
|
|
|
|
|
|
|
United States wheat futures contracts |
|
|
|
|
|
|
|
|
|
|
|
|
CBOT wheat futures MAY22 (687 contracts) |
|
|
|
|
|
|
|
|
| |||
CBOT wheat futures DEC22 (686 contracts) |
|
|
|
|
|
|
|
|
| |||
Total commodity futures contracts |
| $ |
|
|
| % |
| $ |
| |||
|
|
|
|
|
|
|
|
|
|
|
|
|
|
|
|
|
|
| Percentage of |
|
| Notional Amount |
| ||
Description: Liabilities |
| Fair Value |
|
| Net Assets |
|
| (Long Exposure) |
| |||
|
|
|
|
|
|
|
|
|
|
|
|
|
Commodity futures contracts |
|
|
|
|
|
|
|
|
|
|
|
|
United States sugar futures contracts |
|
|
|
|
|
|
|
|
|
|
|
|
ICE sugar futures JUL22 (331 contracts) |
| $ |
|
|
| % |
| $ |
| |||
|
|
|
|
|
|
|
|
|
|
|
|
|
United States wheat futures contracts |
|
|
|
|
|
|
|
|
|
|
|
|
CBOT wheat futures JUL22 (593 contracts) |
|
|
|
|
|
|
|
|
| |||
Total commodity futures contracts |
| $ |
|
|
| % |
| $ |
| |||
|
|
|
|
|
|
|
|
|
|
|
|
|
Exchange-traded funds* |
|
|
|
|
|
|
|
|
| Shares |
| |
Teucrium Corn Fund |
| $ |
|
|
| % |
|
|
| |||
Teucrium Soybean Fund |
|
|
|
|
|
|
|
|
| |||
Teucrium Sugar Fund |
|
|
|
|
|
|
|
|
| |||
Teucrium Wheat Fund |
|
|
|
|
|
|
|
|
| |||
Total exchange-traded funds (cost $12,799,498) |
| $ |
|
|
| % |
|
|
|
| ||
*The Trust eliminates the shares owned by the Teucrium Agricultural Fund from its combined statements of assets and liabilities due to the fact that these represent holdings of the Underlying Funds owned by the Teucrium Agricultural Fund, which are included as shares outstanding of the Underlying Funds.
The accompanying notes are an integral part of these financial statements.
| F-3 |
| Table of Contents |
TEUCRIUM COMMODITY TRUST
COMBINED STATEMENTS OF OPERATIONS
(Unaudited)
|
| Three months ended |
|
| Three months ended |
|
| Nine months ended |
|
| Nine months ended |
| ||||
|
| September 30, 2022(1) |
|
| September 30, 2021 |
|
| September 30, 2022(1) |
|
| September 30, 2021 |
| ||||
Income |
|
|
|
|
|
|
|
|
|
|
|
| ||||
Realized and unrealized gain (loss) on trading of commodity futures contracts: |
|
|
|
|
|
|
| |||||||||
Realized (loss) gain on commodity and cryptocurrency futures contracts |
| $ | ( | ) |
| $ |
|
| $ | ( | ) |
| $ |
| ||
Net change in unrealized (depreciation)/appreciation on commodity and cryptocurrency futures contracts |
|
|
|
|
| ( | ) |
| $ | ( | ) |
|
| ( | ) | |
Interest income |
|
|
|
|
|
|
| $ |
|
|
|
| ||||
Total income (loss) |
|
|
|
|
| ( | ) |
|
| ( | ) |
|
|
| ||
|
|
|
|
|
|
|
|
|
|
|
|
|
|
|
|
|
Expenses |
|
|
|
|
|
|
|
|
|
|
|
|
|
|
|
|
Management fees |
|
|
|
|
|
|
|
|
|
|
|
| ||||
Professional fees |
|
|
|
|
|
|
|
|
|
|
|
| ||||
Distribution and marketing fees |
|
|
|
|
|
|
|
|
|
|
|
| ||||
Custodian fees and expenses |
|
|
|
|
|
|
|
|
|
|
|
| ||||
Business permits and licenses fees |
|
|
|
|
|
|
|
|
|
|
|
| ||||
General and administrative expenses |
|
|
|
|
|
|
|
|
|
|
|
| ||||
Other expenses |
|
|
|
|
|
|
|
|
|
|
|
| ||||
Total expenses |
|
|
|
|
|
|
|
|
|
|
|
| ||||
|
|
|
|
|
|
|
|
|
|
|
|
|
|
|
|
|
Expenses waived by the Sponsor |
|
| ( | ) |
|
| ( | ) |
|
| ( | ) |
|
| ( | ) |
|
|
|
|
|
|
|
|
|
|
|
|
|
|
|
|
|
Total expenses, net |
|
|
|
|
|
|
|
|
|
|
|
| ||||
|
|
|
|
|
|
|
|
|
|
|
|
|
|
|
|
|
Net income (loss) |
| $ |
|
| $ | ( | ) |
| $ | ( | ) |
| $ |
| ||
(1) The Hashdex Bitcoin Futures ETF commenced operations on September 15, 2022.
The accompanying notes are an integral part of these financial statements.
| F-4 |
| Table of Contents |
TEUCRIUM COMMODITY TRUST
COMBINED STATEMENTS OF CHANGES IN NET ASSETS
(Unaudited)
|
| Nine months ended |
|
| Nine months ended |
| ||
|
| September 30, 2022(1) |
|
| September 30, 2021 |
| ||
Operations |
|
|
|
|
|
| ||
Net (loss) income |
| $ | ( | ) |
| $ |
| |
Capital transactions |
|
|
|
|
|
|
|
|
Issuance of Shares |
|
|
|
|
|
| ||
Redemption of Shares |
|
| ( | ) |
|
| ( | ) |
Net change in the cost of the Underlying Funds |
|
| ( | ) |
|
| ( | ) |
Total capital transactions |
|
|
|
|
| ( | ) | |
|
|
|
|
|
|
|
|
|
Net change in net assets |
|
|
|
|
| ( | ) | |
|
|
|
|
|
|
|
|
|
Net assets, beginning of period |
|
|
|
|
|
| ||
|
|
|
|
|
|
|
|
|
Net assets, end of period |
| $ |
|
| $ |
| ||
(1) The Hashdex Bitcoin Futures ETF commenced operations on September 15, 2022.
The accompanying notes are an integral part of these financial statements.
| F-5 |
| Table of Contents |
TEUCRIUM COMMODITY TRUST
COMBINED STATEMENTS OF CASH FLOWS
(Unaudited)
|
| Nine months ended |
|
| Nine months ended |
| ||
|
| September 30, 2022(1) |
|
| September 30, 2021 |
| ||
Cash flows from operating activities: |
|
|
|
|
|
| ||
Net (loss) income |
| $ | ( | ) |
| $ |
| |
Adjustments to reconcile net (loss) income to net cash (used in) provided by operating activities: |
|
|
|
|
|
|
|
|
Net change in unrealized appreciation on commodity and cryptocurrency futures contracts |
| $ |
|
|
|
| ||
Changes in operating assets and liabilities: |
|
|
|
|
|
|
|
|
Due from broker |
| $ | ( | ) |
|
| ( | ) |
Interest receivable |
|
| ( | ) |
|
| ( | ) |
Other assets |
|
| ( | ) |
|
|
| |
Due to broker |
|
| ( | ) |
|
| ( | ) |
Management fee payable to Sponsor |
|
|
|
|
| ( | ) | |
Payable for purchases of commercial paper |
|
|
|
|
| ( | ) | |
Other liabilities |
|
| ( | ) |
|
|
| |
Net cash (used in) provided by operating activities |
|
| ( | ) |
|
|
| |
|
|
|
|
|
|
|
|
|
Cash flows from financing activities: |
|
|
|
|
|
|
|
|
Proceeds from sale of Shares |
|
|
|
|
|
| ||
Redemption of Shares |
|
| ( | ) |
|
| ( | ) |
Net change in cost of the Underlying Funds |
|
| ( | ) |
|
| ( | ) |
Net cash provided by (used in) financing activities |
|
|
|
|
| ( | ) | |
|
|
|
|
|
|
|
|
|
Net change in cash and cash equivalents |
|
|
|
|
| ( | ) | |
Cash and cash equivalents beginning of period |
|
|
|
|
|
| ||
Cash and cash equivalents end of period |
| $ |
|
| $ |
| ||
(1) The Hashdex Bitcoin Futures ETF commenced operations on September 15, 2022.
The accompanying notes are an integral part of these financial statements.
| F-6 |
| Table of Contents |
NOTES TO COMBINED FINANCIAL STATEMENTS
September 30, 2022
(Unaudited)
Note 1 – Organization and Operation
Teucrium Commodity Trust (“Trust”), a Delaware statutory trust organized on September 11, 2009, is a series trust consisting of six series:
On June 7, 2010, the initial Form S-1 for CORN was declared effective by the U.S. Securities and Exchange Commission (“SEC”). On June 8, 2010, four Creation Baskets for CORN were issued representing
On June 13, 2011, the initial Forms S-1 for CANE, SOYB, and WEAT were declared effective by the SEC. On September 16, 2011, two Creation Baskets were issued for each Fund, representing
On February 10, 2012, the Form S-1 for TAGS was declared effective by the SEC. On March 27, 2012, six Creation Baskets for TAGS were issued representing
On September 14, 2022, the Form S-1 for DEFI was declared effective by the SEC. This registration statement for DEFI registered an indeterminate number of shares. On September 15, 2022, five Creation Baskets for DEFI were issued representing
Teucrium Trading, LLC is the sponsor (“Sponsor”) of the Trust. The Sponsor is a member of the National Futures Association (the “NFA”) and became a commodity pool operator (“CPO”) registered with the Commodity Futures Trading Commission (the “CFTC”) effective November 10, 2009. The Sponsor registered as a Commodity Trading Advisor (“CTA”) with the CFTC effective September 8, 2017.
The accompanying unaudited financial statements have been prepared in accordance with Rule 10-01 of Regulation S-X promulgated by the SEC and, therefore, do not include all information and footnote disclosures required under accounting principles generally accepted in the United States of America (“GAAP”). The financial information included herein is unaudited; however, such financial information reflects all adjustments which are, in the opinion of management, necessary for the fair presentation of the Trust’s financial statements for the interim period. It is suggested that these interim financial statements be read in conjunction with the audited financial statements and related notes included in the Trust’s Annual Report on Form 10-K, as well as the most recent Form S-1 filing, as applicable. The operating results for the three and nine months ended September 30, 2022, are not necessarily indicative of the results to be expected for the full year ending December 31, 2022.
| F-7 |
| Table of Contents |
Subject to the terms of the Trust Agreement, Teucrium Trading, LLC in its capacity as the Sponsor of the Trust may terminate a Fund at any time, regardless of whether the Fund has incurred losses, including, for instance, if it determines that the Fund’s aggregate net assets in relation to its operating expenses make the continued operation of the Fund unreasonable or imprudent. However, no level of losses will require the Sponsor to terminate a Fund.
Note 2 – Principal Contracts and Agreements
The Sponsor employs U.S. Bancorp Fund Services, LLC, doing business as U.S. Bank Global Fund Services (“Global Fund Services”), for Transfer Agency, Fund Accounting and Fund Administration services. The principal address for Global Fund Services is 615 E. Michigan Street, Milwaukee, WI 53202.
The Sponsor employs Foreside Fund Services, LLC (“Foreside” or the “Distributor”) as the Distributor for the Funds. The Distribution Services Agreement among the Distributor and the Sponsor calls for the Distributor to work with the Custodian in connection with the receipt and processing of orders for Creation Baskets and Redemption Baskets and the review and approval of all Fund sales literature and advertising materials. The Distributor and the Sponsor have also entered into a Securities Activities and Service Agreement (the “SASA”) under which certain employees and officers of the Sponsor are licensed as registered representatives or registered principals of the Distributor, under Financial Industry Regulatory Authority (“FINRA”) rules.
E D & F Man Capital Markets, Inc. (“E D & F Man”), StoneX Financial Inc. (“StoneX”) and Phillip Capital Inc. (“Phillip Capital”) serve as the Funds’ clearing brokers to execute and clear futures contracts and provide other brokerage-related services. E D & F Man, StoneX and Phillip Capital are each registered as futures commission merchants (“FCM”) with the U.S. CFTC and are members of the NFA. The clearing brokers are registered as broker-dealers with the SEC and are each a member of FINRA. E D & F Man, StoneX and Phillip Capital are each clearing members of ICE Futures U.S., Inc., Chicago Board of Trade, Chicago Mercantile Exchange, New York Mercantile Exchange, and all other major United States commodity exchanges. For Corn, Soybean, Sugar and Wheat Futures Contracts, E D & F Man is paid
| F-8 |
| Table of Contents |
The sole Trustee of the Trust is Wilmington Trust Company, a Delaware banking corporation. The Trustee will accept service of legal process on the Trust in the State of Delaware and will make certain filings under the Delaware Statutory Trust Act. For its services, the Trustee receives an annual fee of $3,300 from the Trust. These services are recorded in business permits and licenses fees on the combined statements of operations. A summary of these expenses is included below.
The Sponsor employs Thales Capital Partners LLC (“Thales”) for distribution and solicitation-related services.
|
| Three months ended September 30, 2022 (1) |
|
| Three months ended September 30, 2021 |
|
| Nine months ended September 30, 2022 (1) |
|
| Nine months ended September 30, 2021 |
| ||||
Amount Recognized for Custody Services |
| $ |
|
| $ |
|
| $ |
|
| $ |
| ||||
Amount of Custody Services Waived |
| $ |
|
| $ |
|
| $ |
|
| $ |
| ||||
|
|
|
|
|
|
|
|
|
|
|
|
|
|
|
|
|
Amount Recognized for Distribution Services |
| $ |
|
| $ |
|
|
|
|
| $ |
| ||||
Amount of Distribution Services Waived |
| $ |
|
| $ |
|
|
|
|
| $ |
| ||||
|
|
|
|
|
|
|
|
|
|
|
|
|
|
|
|
|
Amount Recognized for Wilmington Trust |
| $ |
|
| $ |
|
| $ |
|
| $ |
| ||||
Amount of Wilmington Trust Waived |
| $ |
|
| $ |
|
| $ |
|
| $ |
| ||||
|
|
|
|
|
|
|
|
|
|
|
|
|
|
|
|
|
Amount Recognized for Thales |
| $ |
|
| $ |
|
| $ |
|
| $ |
| ||||
Amount of Thales Waived |
| $ |
|
| $ |
|
| $ |
|
| $ |
| ||||
(1) The Hashdex Bitcoin Futures ETF commenced operations on September 15, 2022.
Note 3 – Summary of Significant Accounting Policies
Basis of Presentation
The accompanying financial statements have been prepared on a combined basis in conformity with accounting principles generally accepted in the United States of America (“U.S. GAAP”) as detailed in the Financial Accounting Standards Board’s Accounting Standards Codification and include the accounts of the Trust, CORN, CANE, SOYB, WEAT, TAGS and DEFI. Refer to the accompanying separate financial statements for each Fund for more detailed information. The periods represented by the financial statements herein contain the results of CORN, SOYB, CANE, WEAT, TAGS and DEFI for the months during which each Fund was in operation, except for eliminations for TAGS as explained below.
Given the investment objective of TAGS as described in Note 1 above, TAGS will buy, sell, and hold, as part of its normal operations, shares of the four Underlying Agricultural Funds. The Trust eliminates the shares of the other series of the Trust owned by TAGS from its combined statements of assets and liabilities. The Trust eliminates the net change in unrealized appreciation or depreciation on securities owned by TAGS from its combined statements of operations. The combined statements of changes in net assets and cash flows present a net presentation of the purchases and sales of the Underlying Funds by TAGS.
| F-9 |
| Table of Contents |
Revenue Recognition
Commodity and cryptocurrency futures contracts are recorded on the trade date. All such transactions are recorded on the identified cost basis and marked to market daily. Unrealized appreciation or depreciation on commodity and cryptocurrency futures contracts are reflected in the combined statements of operations as the difference between the original contract amount and the fair market value as of the last business day of the year or as of the last date of the financial statements. Changes in the appreciation or depreciation between periods are reflected in the combined statements of operations. Interest on cash equivalents with financial institutions are recognized on the accrual basis. The Funds earn interest on funds held at the custodian and other financial institutions at prevailing market rates for such investments.
The Sponsor invests a portion of cash in commercial paper, which is deemed a cash equivalent based on the rating and duration of contracts as described in the notes to the combined financial statements and reflected in cash and cash equivalents on the combined statements of assets and liabilities and on the combined statements of cash flows. Accretion on these investments is recognized using the effective interest method in U.S. dollars and included in interest income on the combined statements of operations.
The Sponsor invests a portion of the cash held by the broker in short term Treasury Bills as collateral for open futures contracts. Accretion on these investments is recognized using the effective interest method in U.S. dollars and included in interest income on the combined statements of operations.
Brokerage Commissions
The Sponsor recognizes the expense for brokerage commissions for futures contract trades on a per-trade basis. The below table shows the amounts included on the combined statements of operations as total brokerage commissions paid inclusive of unrealized loss for the three and nine months ended September 30, 2022.
|
| CORN |
|
| SOYB |
|
| CANE |
|
| WEAT |
|
| TAGS |
|
| DEFI |
|
| TRUST |
| |||||||
Three Months Ended September 30, 2022 (1) |
| $ |
|
| $ |
|
| $ |
|
| $ |
|
| $ |
|
| $ |
|
| $ |
| |||||||
Three Months Ended September 30, 2021 |
| $ |
|
| $ |
|
| $ |
|
| $ |
|
| $ |
|
| $ |
|
| $ |
| |||||||
Nine Months Ended September 30, 2022 (1) |
| $ |
|
| $ |
|
| $ |
|
| $ |
|
| $ |
|
| $ |
|
| $ |
| |||||||
Nine Months Ended September 30, 2021 |
| $ |
|
| $ |
|
| $ |
|
| $ |
|
| $ |
|
| $ |
|
| $ |
| |||||||
(1) The Hashdex Bitcoin Futures ETF commenced operations on September 15, 2022.
Income Taxes
The Trust is organized and will be operated as a Delaware statutory trust. For federal income tax purposes, each Fund will be treated as a publicly traded partnership. A publicly traded partnership is generally treated as a corporation for federal income tax purposes unless 90% or more of the publicly traded partnership’s gross income for each taxable year of its existence consists of qualifying income as defined in section 7704(d) of the Internal Revenue Code of 1986, as amended. Qualifying income is defined as generally including, in pertinent part, interest (other than from a financial business), dividends, and gains from the sale or disposition of capital assets held for the production of interest or dividends. In the case of a partnership of which a principal activity is the buying and selling of commodities, other than as inventory, or of futures, forwards and options with respect to commodities, qualifying income also includes income and gains from commodities and from futures, forwards, options with respect to commodities and, provided the partnership is a trader or investor with respect to such assets, swaps and other notional principal contracts with respect to commodities. Each Fund expects that at least 90% of the Fund’s gross income for each taxable year will consist of qualifying income and that the Fund will be taxed as a partnership for federal income tax purposes. Therefore, the Funds do not record a provision for income taxes because the shareholders report their share of a Fund’s income or loss on their income tax returns. The financial statements reflect the Funds’ transactions without adjustment, if any, required for income tax purposes.
| F-10 |
| Table of Contents |
The Funds are required to determine whether a tax position is more likely than not to be sustained upon examination by the applicable taxing authority, including resolution of any related appeals or litigation processes, based on the technical merits of the position. The Funds file income tax returns in the U.S. federal jurisdiction and may file income tax returns in various U.S. states and foreign jurisdictions. For all tax years 2019 to 2021, the Funds remain subject to income tax examinations by major taxing authorities. The tax benefit recognized is measured as the largest amount of benefit that has a greater than fifty percent likelihood of being realized upon ultimate settlement. De-recognition of a tax benefit previously recognized results in the Funds recording a tax liability that reduces net assets. Based on their analysis, the Funds have determined that they have not incurred any liability for unrecognized tax benefits as of September 30, 2022, and for the years ended December 31, 2021, 2020 and 2019. However, the Funds’ conclusions regarding this policy may be subject to review and adjustment at a later date based on factors including, but not limited to, ongoing analysis of and changes to tax laws, regulations, and interpretations thereof.
There is very limited authority on the U.S. federal income tax treatment of bitcoin and no direct authority on bitcoin derivatives, such as Bitcoin Futures Contracts. Bitcoin Futures Contracts more likely than not will be considered futures with respect to commodities for purposes of the qualifying income exception under section 7704 of the Code. Based on a CFTC determination that treats bitcoin as a commodity under the CEA, the Fund intends to take the position that Bitcoin Futures Contracts consist of futures on commodities for purposes of the qualifying income exception under section 7704 of the Code. Shareholders should be aware that the Fund’s position is not binding on the IRS, and no assurance can be given that the IRS will not challenge the Fund’s position, or that the IRS or a court will not ultimately reach a contrary conclusion, which would result in the material adverse consequences to Shareholders and the Fund.
The Funds recognize interest accrued related to unrecognized tax benefits and penalties related to unrecognized tax benefits in income tax fees payable, if assessed. No interest expense or penalties have been recognized as of and for the three and nine months ended September 30, 2022 and 2021.
The Funds may be subject to potential examination by U.S. federal, U.S. state, or foreign jurisdictional authorities in the area of income taxes. These potential examinations may include questioning the timing and amount of deductions, the nexus of income among various tax jurisdictions, and compliance with U.S. federal, U.S. state and foreign tax laws.
Creations and Redemptions
Authorized Purchasers may purchase Creation Baskets from each Fund. The amount of the proceeds required to purchase a Creation Basket will be equal to the NAV of the shares in the Creation Basket determined as of 4:00 p.m. (ET) time on the day the order to create the basket is received in good order.
Authorized Purchasers may redeem shares from each Fund only in blocks of shares called “Redemption Baskets.” The amount of the redemption proceeds for a Redemption Basket will be equal to the NAV of the shares in the Redemption Basket determined as of 4:00 p.m. (ET) on the day the order to redeem the basket is received in good order.
Each Fund receives or pays the proceeds from shares sold or redeemed within three business days after the trade date of the purchase or redemption. The amounts due from Authorized Purchasers are reflected in the statements of assets and liabilities as capital shares receivable. Amounts payable to Authorized Purchasers upon redemption are reflected in the statements of assets and liabilities as payable for shares redeemed.
There are a minimum number of baskets and associated Shares specified for each Fund in the Fund’s respective prospectus, as amended from time to time. If a Fund experienced redemptions that caused the number of Shares outstanding to decrease to the minimum level of Shares required to be outstanding, until the minimum number of Shares is again exceeded through the purchase of a new Creation Basket, there can be no more redemptions by an Authorized Purchaser. These minimum levels are as follows:
CORN:
SOYB:
CANE:
WEAT:
TAGS:
DEFI:
| F-11 |
| Table of Contents |
Cash and Cash Equivalents
Cash equivalents are highly liquid investments with original maturity dates of 90 days or less when acquired. The Trust reported its cash equivalents in the combined statements of assets and liabilities at market value, or at carrying amounts that approximate fair value, because of their highly liquid nature and short-term maturities. Each Fund that is a series of the Trust has the balance of its cash equivalents on deposit with financial institutions. The Trust holds a balance in money market funds that is included in cash and cash equivalents on the combined statements of assets and liabilities. The Sponsor invests a portion of the available cash for the Funds in alternative demand deposit savings accounts, which are classified as cash and not as cash equivalents. Assets deposited with the bank may, at times, exceed federally insured limits. The Sponsor invests a portion of the available cash for the Funds in investment grade commercial paper with durations of 90 days or less, which is classified as a cash equivalent and is not FDIC insured. The Sponsor may invest a portion of the cash held by the broker in short term Treasury Bills as collateral for open futures contracts, which is classified as a cash equivalent and is not FDIC insured.
|
| September 30, 2022 |
|
| December 31, 2021 |
| ||
Money Market Funds |
| $ |
|
| $ |
| ||
Demand Deposit Savings Accounts |
|
|
|
|
|
| ||
Commercial Paper |
|
|
|
|
|
| ||
Total cash and cash equivalents as presented on the combined Statement of Assets and Liabilities |
| $ |
|
| $ |
| ||
Payable for Purchases of Commercial Paper
The amount recorded by the Trust for commercial paper transactions awaiting settlement represents the amount payable for contracts purchased but not yet settled as of the reporting date. The value of the contract is included in cash and cash equivalents, and the payable amount is included as a liability.
Due from/to Broker
The amount recorded by the Trust for the amount due from and to the clearing broker includes, but is not limited to, cash held by the broker, amounts payable to the clearing broker related to open transactions, payables for commodities futures accounts liquidating to an equity balance on the clearing broker’s records, and amounts of brokerage commissions paid and recognized as unrealized losses.
Margin is the minimum amount of funds that must be deposited by a commodity interest trader with the trader’s broker to initiate and maintain an open position in futures contracts. A margin deposit acts to assure the trader’s performance of the futures contracts purchased or sold. Futures contracts are customarily bought and sold on initial margin that represents a very small percentage of the aggregate purchase or sales price of the contract. Because of such low margin requirements, price fluctuations occurring in the futures markets may create profits and losses that, in relation to the amount invested, are greater than customary in other forms of investment or speculation. As discussed below, adverse price changes in the futures contract may result in margin requirements that greatly exceed the initial margin. In addition, the amount of margin required in connection with a particular futures contract is set from time to time by the exchange on which the contract is traded and may be modified from time to time by the exchange during the term of the contract. Brokerage firms, such as the Funds’ clearing brokers, carrying accounts for traders in commodity interest contracts generally require higher amounts of margin as a matter of policy to further protect themselves. Over the counter trading generally involves the extension of credit between counterparties, so the counterparties may agree to require the posting of collateral by one or both parties to address credit exposure.
| F-12 |
| Table of Contents |
When a trader purchases an option, there is no margin requirement; however, the option premium must be paid in full. When a trader sells an option, on the other hand, he or she is required to deposit margin in an amount determined by the margin requirements established for the underlying interest and, in addition, an amount substantially equal to the current premium for the option. The margin requirements imposed on the selling of options, although adjusted to reflect the probability that out-of-the-money options will not be exercised, can in fact be higher than those imposed in dealing in the futures markets directly. Complicated margin requirements apply to spreads and conversions, which are complex trading strategies in which a trader acquires a mixture of options positions and positions in the underlying interest.
Ongoing or “maintenance” margin requirements are computed each day by a trader’s clearing broker. When the market value of a particular open futures contract changes to a point where the margin on deposit does not satisfy maintenance margin requirements, a margin call is made by the broker. If the margin call is not met within a reasonable time, the broker may close out the trader’s position. With respect to the Funds’ trading, the Funds (and not their shareholders personally) are subject to margin calls.
Finally, many major U.S. exchanges have passed certain cross margining arrangements involving procedures pursuant to which the futures and options positions held in an account would, in the case of some accounts, be aggregated, and margin requirements would be assessed on a portfolio basis, measuring the total risk of the combined positions.
Payable/Receivable for Securities Purchased/Sold
Due from/to broker for investments in securities are securities transactions pending settlement. The Trust and the Funds are subject to credit risk to the extent any broker with whom it conducts business is unable to fulfill contractual obligations on its behalf. The management of the Trust and the Funds monitors the financial condition of such brokers and does not anticipate any losses from these counterparties. The principal broker through which the Trust and TAGS can execute securities transactions for TAGS is U.S. Bank N.A.
Sponsor Fee, Allocation of Expenses and Related Party Transactions
The Sponsor is responsible for investing the assets of the Fund in accordance with the objectives and policies of the Fund. In addition, the Sponsor arranges for one or more third parties to provide administrative, custodial, accounting, transfer agency, compliance, and other necessary services to the Fund, including services directly attributable to the Fund such as accounting, financial reporting, regulatory compliance, and trading activities. In some cases, at its discretion, the Sponsor may elect not to outsource certain of these expenses.
In addition, the Agricultural Funds, except for TAGS, which has no such fee are contractually obligated to pay a monthly management fee to the Sponsor, based on average daily net assets, at a rate equal to 1.00% per annum.
The Agricultural Funds generally pay for all brokerage fees, taxes, and other expenses, including licensing fees for the use of intellectual property, registration or other fees paid to the SEC, the Financial Industry Regulatory Authority (“FINRA”), or any other regulatory agency in connection with the offer and sale of subsequent Shares after its initial registration and all legal, accounting, printing and other expenses associated therewith. Each Fund also pays its portion of the fees and expenses associated with the Trust’s tax accounting and reporting requirements. Certain aggregate expenses common to all Funds within the Trust are allocated by the Sponsor to the respective Funds based on activity drivers deemed most appropriate by the Sponsor for such expenses, including but not limited to relative assets under management and creation order activity. These aggregate common expenses include, but are not limited to, legal, auditing, accounting and financial reporting, tax-preparation, regulatory compliance, trading activities, and insurance costs, as well as fees paid to the Distributor, which are included in the related line item in the statements of operations. A portion of these aggregate common expenses are related to services provided by the Sponsor or related parties of principals of the Sponsor; these are necessary services to the Funds, which are primarily the cost of performing accounting and financial reporting, regulatory compliance, and trading activities that are directly attributable to the Funds and are, primarily, included as distribution and marketing fees on the statements of operations. These amounts, for the Trust and for each Fund, are detailed in the notes to the financial statements included in Part I of this filing.
| F-13 |
| Table of Contents |
DEFI is contractually obligated to pay a monthly management fee to the Sponsor, based on average daily net assets, at a rate equal to 0.94% per annum. From the Management Fee, the Sponsor pays all of the routine operational, administrative and other ordinary expenses of the Fund, generally as determined by the Sponsor, including but not limited to, fees and expenses of the Administrator, Custodian, Distributor, Transfer Agent, licensors, accounting and audit fees expenses, tax preparation expenses, legal fees, ongoing SEC registration fees, individual Schedule K-1 preparation and mailing fees, and report preparation and mailing expenses. These fees and expenses are not included in the breakeven table because they are paid for by the Sponsor through the proceeds from the Management Fee. The Fund pays all of its non-recurring and unusual fees and expenses, if any, as determined by the Sponsor. Non-recurring and unusual fees and expenses are unexpected or unusual in nature, such as legal claims and liabilities and litigation costs or indemnification or other unanticipated expenses. Extraordinary fees and expenses also include material expenses which are not currently anticipated obligations of the Fund. Routine operational, administrative, and other ordinary expenses are not deemed extraordinary expenses.
|
| Three months ended September 30, 2022 (1) |
|
| Three months ended September 30, 2021 |
|
| Nine months ended September 30, 2022 (1) |
|
| Nine months ended September 30, 2021 |
| ||||
Recognized Related Party Transactions |
| $ |
|
| $ |
|
| $ |
|
| $ |
| ||||
Waived Related Party Transactions |
| $ |
|
| $ |
|
| $ |
|
| $ |
| ||||
(1) The Hashdex Bitcoin Futures ETF commenced operations on September 15, 2022.
The Sponsor has the ability to elect to pay certain expenses on behalf of the Funds or waive the management fee. This election is subject to change by the Sponsor, at its discretion. Expenses paid by the Sponsor and Management fees waived by the Sponsor are, if applicable, presented as waived expenses in the statements of operations for each Fund. The Sponsor has determined that there will be no recovery sought for the amounts below in any future period.
|
| CORN |
|
| SOYB |
|
| CANE |
|
| WEAT |
|
| TAGS |
|
| DEFI |
|
| TRUST |
| |||||||
Three months ended September 30, 2022 (1) |
| $ |
|
| $ |
|
| $ |
|
| $ |
|
| $ |
|
| $ |
|
| $ |
| |||||||
Three months ended September 30, 2021 |
| $ |
|
| $ |
|
| $ |
|
| $ |
|
| $ |
|
| $ |
|
| $ |
| |||||||
Nine months ended September 30, 2022 (1) |
| $ |
|
| $ |
|
| $ |
|
| $ |
|
| $ |
|
| $ |
|
| $ |
| |||||||
Nine months ended September 30, 2021 |
| $ |
|
| $ |
|
| $ |
|
| $ |
|
| $ |
|
| $ |
|
| $ |
| |||||||
(1) The Hashdex Bitcoin Futures ETF commenced operations on September 15, 2022.
Use of Estimates
The preparation of financial statements in conformity with U.S. GAAP requires management to make estimates and assumptions that affect the reported amounts of assets and liabilities and disclosure of contingent assets and liabilities at the date of the financial statements, and the reported amounts of the revenue and expenses during the reporting period. Actual results could differ from those estimates.
| F-14 |
| Table of Contents |
Fair Value - Definition and Hierarchy
In accordance with U.S. GAAP, fair value is defined as the price that would be received to sell an asset or paid to transfer a liability (i.e., the “exit price”) in an orderly transaction between market participants at the measurement date.
In determining fair value, the Trust uses various valuation approaches. In accordance with U.S. GAAP, a fair value hierarchy for inputs is used in measuring fair value that maximizes the use of observable inputs and minimizes the use of unobservable inputs by requiring that the most observable inputs be used when available. Observable inputs are those that market participants would use in pricing the asset or liability based on market data obtained from sources independent of the Trust. Unobservable inputs reflect the Trust’s assumptions about the inputs market participants would use in pricing the asset or liability developed based on the best information available in the circumstances. The fair value hierarchy is categorized into three levels based on the inputs as follows:
Level 1 - Valuations based on unadjusted quoted prices in active markets for identical assets or liabilities that the Trust has the ability to access. Valuation adjustments and block discounts are not applied to Level 1 futures contracts held by CORN, SOYB, CANE, WEAT and DEFI, the securities of the Underlying Funds held by TAGS, and any other securities held by any Fund, together referenced throughout this filing as “financial instruments.” Since valuations are based on quoted prices that are readily and regularly available in an active market, valuation of these securities does not entail a significant degree of judgment.
Level 2 - Valuations based on quoted prices in markets that are not active or for which all significant inputs are observable, either directly or indirectly.
Level 3 - Valuations based on inputs that are unobservable and significant to the overall fair value measurement.
The availability of valuation techniques and observable inputs can vary from financial instrument to financial instrument and is affected by a wide variety of factors including, the type of financial instrument, whether the financial instrument is new and not yet established in the marketplace, and other characteristics particular to the transaction. To the extent that valuation is based on models or inputs that are less observable or unobservable in the market, the determination of fair value requires more judgment. Those estimated values do not necessarily represent the amounts that may be ultimately realized due to the occurrence of future circumstances that cannot be reasonably determined. Because of the inherent uncertainty of valuation, those estimated values may be materially higher or lower than the values that would have been used had a ready market for the financial instruments existed. Accordingly, the degree of judgment exercised by the Fund in determining fair value is greatest for financial instruments categorized in Level 3. In certain cases, the inputs used to measure fair value may fall into different levels of the fair value hierarchy. In such cases, for disclosure purposes, the level in the fair value hierarchy, within which the fair value measurement in its entirety falls, is determined based on the lowest level input that is significant to the fair value measurement.
Fair value is a market-based measure considered from the perspective of a market participant rather than an entity-specific measure. Therefore, even when market assumptions are not readily available, the Trust’s own assumptions are set to reflect those that market participants would use in pricing the asset or liability at the measurement date. The Trust uses prices and inputs that are current as of the measurement date, including periods of market dislocation. In periods of market dislocation, the observability of prices and inputs may be reduced for many financial instruments. This condition could cause a financial instrument to be reclassified to a lower level within the fair value hierarchy. For instance, when Corn Futures Contracts on the Chicago Board of Trade (“CBOT”) are not actively trading due to a “limit-up” or ‘limit-down” condition, meaning that the daily change in the Corn Futures Contracts has exceeded the limits established, the Trust and the Fund will revert to alternative verifiable sources of valuation of its assets. When such a situation exists on a quarter close, the Sponsor will calculate the NAV on a particular day using the Level 1 valuation but will later recalculate the NAV for the impacted Fund based upon the valuation inputs from these alternative verifiable sources (Level 2 or Level 3) and will report such NAV in its applicable financial statements and reports.
| F-15 |
| Table of Contents |
On September 30, 2022 and December 31, 2021, in the opinion of the Trust, the reported value at the close of the market for each commodity and cryptocurrency contract fairly reflected the value of the futures and no alternative valuations were required.
For the quarter ended March 31, 2021, Corn Futures Contracts for the JUL21 CBOT corn futures, SEP21 CBOT corn futures, DEC21 CBOT corn futures, JUL21 CBOT soybean futures, and the NOV21 CBOT soybean futures, settled in a “limit up” condition. Accordingly, the Trust, CORN, and SOYB classified these as Level 2 assets. The financial statements of these Funds including TAGS, due to the NAV adjustment for each of these Underlying Funds, were adjusted accordingly. The adjustment resulted in an increase in the unrealized change in commodity futures contracts in excess of reported CBOT values of $
For the quarter ended June 30, 2021, Corn Futures Contracts for the SEP21 CBOT corn futures and the DEC21 CBOT corn futures, settled in a “limit up” condition. Accordingly, the Trust, CORN and TAGS classified these as level 2 assets. The financial statements of CORN including TAGS, due to the NAV adjustment for the Underlying CORN holdings, were adjusted accordingly. The adjustment resulted in an increase in the unrealized change in commodity futures contracts in excess of reported CBOT values of $
The Funds and the Trust record their derivative activities at fair value. Gains and losses from derivative contracts are included in the statements of operations. Derivative contracts include futures contracts related to commodity prices. Futures, which are listed on a national securities exchange, such as the CBOT and the ICE, or reported on another national market, are generally categorized in Level 1 of the fair value hierarchy. OTC derivatives contracts (such as forward and swap contracts), which may be valued using models, depending on whether significant inputs are observable or unobservable, are categorized in Levels 2 or 3 of the fair value hierarchy.
Investments in the securities of the Underlying Funds are freely traded and listed on the NYSE Arca. These investments are valued at the NAV of the Underlying Fund as of the valuation date as calculated by the administrator based on the exchange-quoted prices of the commodity futures contracts held by the Underlying Fund.
Expenses
Expenses are recorded using the accrual method of accounting.
New Accounting Pronouncements
The Financial Accounting Standards Board (“FASB”) issued Accounting Standards Update (“ASU”) 2022-03, related to fair value measurement (Topic 820) of equity securities subject to contractual sale restrictions. Under the clarified guidance, contractual restrictions on the sale of an equity security are not considered part of the unit of account of the equity security and, therefore, are not considered in measuring fair value, however they do require disclosures. The amendment was early adopted for the quarter ended June 30, 2022; the early adoption did not have a material impact on the financial statements and disclosures of the Trust or the Funds.
The FASB issued ASU 2021-05: “Leases (Topic 842).” Under the amended guidance, a lessor should classify and account for a lease with variable lease payments that don’t depend on an index or a rate as an operating lease if the lease would’ve been classified as a sales-type lease or a direct financing lease in accordance with the lease classification guidance in Topic 842 and the lessor would’ve otherwise recognized a day-one loss. The amendment was adopted early for the quarter ended September 30, 2021; the adoption did not have a material impact on the financial statements and disclosures of the Trust or the Funds.
| F-16 |
| Table of Contents |
The FASB issued ASU 2020-10: “Codification Improvements.” The amendment improves the disclosure guidance in appropriate Disclosure Sections, without resulting in changes to current GAAP. The amendment was adopted for the quarter ended March 31, 2021; the adoption did not have a material impact on the financial statements and disclosures of the Trust or the Funds.
The FASB issued ASU 2020-02: “Financial Instruments Credit Losses (Topic 326) and Leases (Topic 842): Amendments to SEC Paragraphs Pursuant to SEC Staff Accounting Bulletin No. 119 and Update to SEC Section on Effective Date Related to Accounting Standards Update No. 2016-02, Leases (Topic 842). The amendment updates and adds language to ASU 2016-02. The amendments were adopted for the quarter ended March 31, 2020; the adoption did not have a material impact on the financial statements and disclosures of the Trust or the Funds.
The FASB issued ASU 2020-01: Investments Equity Securities (Topic 321), Investments Equity Method and Joint Ventures (Topic 323), and Derivatives and Hedging (Topic 815) Clarifying the Interactions between Topic 321, Topic 323, and Topic 815. The amendments clarify the treatment of transactions that require a company to apply or discontinue the equity method of accounting. The amendments were adopted early for the quarter ended March 31, 2020; the adoption did not have a material impact on the financial statements and disclosures of the Trust or the Funds.
The FASB issued ASU 2019-01: "Leases (Topic 842): Codification Improvements. These amendments align the guidance for fair value of underlying assets by lessors that are not manufacturers or dealers in Topic 842 with that of existing guidance. The amendments were adopted for the quarter ended September 30, 2020; the adoption did not have a material impact on the financial statements and disclosures of the Trust or the Funds.
The FASB issued ASU 2018-13: “Fair Value Measurement (Topic 820): Disclosure Framework Changes to the Disclosure Requirements for Fair Value Measurement. These amendments modify public and private company fair value disclosure requirements. While some disclosures were removed or modified, others were added. The guidance is a result of the FASB’s test of the principals developed to improve the effectiveness of disclosures in the notes to the financial statements. The amendments were adopted for the quarter ended March 31, 2020; the adoption did not have a material impact on the financial statements and disclosures of the Trust or the Funds.
The FASB issued ASU 2017-13, “Revenue Recognition (Topic 605), Leases (Topic 840), and Leases (Topic 842): Amendments to SEC Paragraphs Pursuant to the Staff Announcement at the July 20, 2017 EITF Meeting and Rescission of Prior SEC Staff Announcements and Observer Comments”. The amendment amends the early adoption date option for certain companies related to adoption of ASU No. 2014-09 and ASU No. 2016-02. The SEC staff stated the SEC would not object to a public business entity that otherwise would not meet the definition of a public business entity except for a requirement to include or the inclusion of its financial statements or financial information in another entity’s filing with the SEC adopting ASC Topic 842 for fiscal years beginning after December 15, 2019, and interim periods within fiscal years beginning after December 15, 2020. The amendments were adopted for the quarter ended September 30, 2020; the adoption did not have a material impact on the financial statements and disclosures of the Trust or the Funds.
| F-17 |
| Table of Contents |
Note 4 – Fair Value Measurements
The Trust’s assets and liabilities recorded at fair value have been categorized based upon a fair value hierarchy as described in the Trust’s significant accounting policies in Note 3. The following table presents information about the Trust’s assets and liabilities measured at fair value as of September 30, 2022 and December 31, 2021:
Assets: |
| Level 1 |
|
| Level 2 |
|
| Level 3 |
|
| Balance as of September 30, 2022 |
| ||||
Cash Equivalents |
| $ |
|
| $ |
|
| $ |
|
| $ |
| ||||
Commodity and Cryptocurrency Futures Contracts |
|
|
|
|
|
|
|
|
|
|
|
|
|
|
|
|
Corn futures contracts |
|
|
|
|
|
|
|
|
|
|
|
| ||||
Wheat futures contracts |
|
|
|
|
| |
|
|
| |
|
|
|
| ||
Total |
| $ |
|
| $ |
|
| $ |
|
| $ |
| ||||
|
|
|
|
|
|
|
|
|
|
|
|
|
|
|
|
|
Liabilities |
| Level 1 |
|
| Level 2 |
|
| Level 3 |
|
| Balance as of September 30, 2022 |
| ||||
Commodity and Cryptocurrency Futures Contracts |
|
|
|
|
|
|
|
|
|
|
|
|
|
|
|
|
Corn futures contracts |
| $ |
|
| $ |
|
| $ |
|
| $ |
| ||||
Soybean futures contracts |
|
|
|
|
|
|
|
|
|
|
|
| ||||
Sugar futures contracts |
|
|
|
|
|
|
|
|
|
|
|
| ||||
Wheat futures contracts |
|
|
|
|
|
|
|
|
|
|
|
| ||||
Bitcoin futures contracts |
|
|
|
|
|
|
|
|
|
|
|
|
|
| ||
Total |
| $ |
|
| $ |
|
| $ |
|
| $ |
| ||||
|
|
|
|
|
|
|
|
|
|
|
|
|
|
|
|
|
Assets: |
| Level 1 |
|
| Level 2 |
|
| Level 3 |
|
| Balance as of December 31, 2021 |
| ||||
Cash Equivalents |
| $ |
|
| $ |
|
| $ |
|
| $ |
| ||||
Commodity and Cryptocurrency Futures Contracts |
|
|
|
|
|
|
|
|
|
|
|
|
|
|
|
|
Corn futures contracts |
|
|
|
|
|
|
|
|
|
|
|
| ||||
Soybean futures contracts |
|
|
|
|
|
|
|
|
|
|
|
| ||||
Sugar futures contracts |
|
|
|
|
|
|
|
|
|
|
|
| ||||
Wheat futures contracts |
|
|
|
|
|
|
|
|
|
|
|
| ||||
Total |
| $ |
|
| $ |
|
| $ |
|
| $ |
| ||||
|
|
|
|
|
|
|
|
|
|
|
|
|
|
|
|
|
Liabilities |
| Level 1 |
|
| Level 2 |
|
| Level 3 |
|
| Balance as of December 31, 2021 |
| ||||
Commodity and Cryptocurrency Futures Contracts |
|
|
|
|
|
|
|
|
|
|
|
|
|
|
|
|
Sugar futures contracts |
|
|
|
|
|
|
|
|
|
| $ |
| ||||
Wheat futures contracts |
|
|
|
|
|
|
|
|
|
|
|
| ||||
Total |
| $ |
|
| $ |
|
| $ |
|
| $ |
| ||||
For the three and nine months ended September 30, 2022 and year ended December 31, 2021, the Funds did not have any significant transfers between any of the levels of the fair value hierarchy. The determination is made as of the settlement of the futures contracts on the last day of trading for the reporting period. In making the determination of a Level 1 or Level 2 transfer, the Fund considers the average volume of the specific underlying futures contracts traded on the relevant exchange for the periods being reported.
See the Fair Value - Definition and Hierarchy section in Note 3 above for an explanation of the transfers into and out of each level of the fair value hierarchy.
Note 5 – Derivative Instruments and Hedging Activities
In the normal course of business, the Funds utilize derivative contracts in connection with its proprietary trading activities. Investments in derivative contracts are subject to additional risks that can result in a loss of all or part of an investment. The Funds’ derivative activities and exposure to derivative contracts are classified by the following primary underlying risks: interest rate, credit, commodity price, and equity price risks. In addition to its primary underlying risks, the Funds are also subject to additional counterparty risk due to inability of its counterparties to meet the terms of their contracts. For the three and nine months ended September 30, 2022 and year ended December 31, 2021, the Funds invested only in commodity and cryptocurrency futures contracts specifically related to each Fund.
| F-18 |
| Table of Contents |
Futures Contracts
The Funds are subject to commodity and cryptocurrency price risk in the normal course of pursuing their investment objectives. A futures contract represents a commitment for the future purchase or sale of an asset at a specified price on a specified date.
The purchase and sale of futures contracts requires margin deposits with an FCM. Subsequent payments (variation margin) are made or received by each Fund each day, depending on the daily fluctuations in the value of the contract, and are recorded as unrealized gains or losses by each Fund. Futures contracts may reduce the Funds’ exposure to counterparty risk since futures contracts are exchange-traded; and the exchange’s clearinghouse, as the counterparty to all exchange-traded futures, guarantees the futures against default.
The Commodity Exchange Act requires an FCM to segregate all customer transactions and assets from the FCM’s proprietary activities. A customer’s cash and other equity deposited with an FCM are considered commingled with all other customer funds subject to the FCM’s segregation requirements. In the event of an FCM’s insolvency, recovery may be limited to each Fund’s pro rata share of segregated customer funds available. It is possible that the recovery amount could be less than the total of cash and other equity deposited.
The following table discloses information about offsetting assets and liabilities presented in the combined statements of assets and liabilities to enable users of these financial statements to evaluate the effect or potential effect of netting arrangements for recognized assets and liabilities. These recognized assets and liabilities are presented as defined in the Financial Accounting Standards Board’s (“FASB”) Accounting Standards Update (“ASU”) No. 2011-11 “Balance Sheet (Topic 210): Disclosures about Offsetting Assets and Liabilities” and subsequently clarified in FASB ASU 2013-01 “Balance Sheet (Topic 210): Clarifying the Scope of Disclosures about Offsetting Assets and Liabilities.”
The following table also identifies the fair value amounts of derivative instruments included in the combined statements of assets and liabilities as derivative contracts, categorized by primary underlying risk, and held by the FCMs, E D & F Man, and StoneX as of September 30, 2022, and December 31, 2021. The DEFI Fund has an account open at Phillip Capital with no contracts held as of September 30, 2022.
*The amount of collateral presented in Collateral, Due from Broker, is limited to the liability for the futures contracts and accordingly does not include the excess collateral pledged.
Offsetting of Financial Assets and Derivative Assets as of September 30, 2022
|
| (i) |
|
| (ii) |
|
| (iii) = (i)-(ii) |
|
| (iv) |
|
| (v)=(iii)-(iv) |
| |||||||||
|
|
|
|
|
|
|
| Gross Amount Not Offset in the Combined Statement of Assets and Liabilities |
|
|
| |||||||||||||
Description |
| Gross Amount of Recognized Assets |
|
| Gross Amount Offset in the Combined Statement of Assets and Liabilities |
|
| Net Amount Presented in the Combined Statement of Assets and Liabilities |
|
| Futures Contracts Available for Offset |
|
| Collateral, Due to Broker |
|
| Net Amount |
| ||||||
Commodity and Cryptocurrency Price |
|
|
|
|
|
|
|
|
|
|
|
|
|
|
|
|
|
| ||||||
Corn futures contracts |
| $ |
|
| $ |
|
| $ |
|
| $ |
|
| $ |
|
| $ |
| ||||||
Wheat futures contracts |
| $ |
|
| $ |
|
| $ |
|
| $ |
|
| $ |
|
| $ |
| ||||||
| F-19 |
| Table of Contents |
Offsetting of Financial Liabilities and Derivative Liabilities as of September 30, 2022
|
| (i) |
|
| (ii) |
|
| (iii) = (i)-(ii) |
|
| (iv) |
|
| (v)=(iii)-(iv) |
| |||||||||
|
|
|
|
|
|
|
| Gross Amount Not Offset in the Combined Statement of Assets and Liabilities |
|
|
| |||||||||||||
Description |
| Gross Amount of Recognized Liabilities |
|
| Gross Amount Offset in the Combined Statement of Assets and Liabilities |
|
| Net Amount Presented in the Combined Statement of Assets and Liabilities |
|
| Futures Contracts Available for Offset |
|
| Collateral, Due from Broker* |
|
| Net Amount |
| ||||||
Commodity and Cryptocurrency Price |
|
|
|
|
|
|
|
|
|
|
|
|
|
|
|
|
|
| ||||||
Corn futures contracts |
| $ |
|
| $ |
|
| $ |
|
| $ |
|
| $ |
|
| $ |
| ||||||
Soybean futures contracts |
| $ |
|
| $ |
|
| $ |
|
| $ |
|
| $ |
|
| $ |
| ||||||
Sugar futures contracts |
| $ |
|
| $ |
|
| $ |
|
| $ |
|
| $ |
|
| $ |
| ||||||
Wheat futures contracts |
| $ |
|
| $ |
|
| $ |
|
| $ |
|
| $ |
|
| $ |
| ||||||
Bitcoin futures contracts |
| $ |
|
| $ |
|
| $ |
|
| $ |
|
| $ |
|
| $ |
| ||||||
Offsetting of Financial Assets and Derivative Assets as of December 31, 2021
|
| (i) |
|
| (ii) |
|
| (iii) = (i)-(ii) |
|
| (iv) |
|
| (v)=(iii)-(iv) |
| |||||||||
|
|
|
|
|
|
|
|
|
|
| Gross Amount Not Offset in the Combined Statement of Assets and Liabilities |
|
|
|
| |||||||||
Description |
| Gross Amount of Recognized Assets |
|
| Gross Amount Offset in the Combined Statement of Assets and Liabilities |
|
| Net Amount Presented in the Combined Statement of Assets and Liabilities |
|
| Futures Contracts Available for Offset |
|
| Collateral, Due to Broker |
|
| Net Amount |
| ||||||
Commodity Price |
|
|
|
|
|
|
|
|
|
|
|
|
|
|
|
|
|
| ||||||
Corn futures contracts |
| $ |
|
| $ |
|
| $ |
|
| $ |
|
| $ |
|
| $ |
| ||||||
Soybean futures contracts |
| $ |
|
| $ |
|
| $ |
|
| $ |
|
| $ |
|
| $ |
| ||||||
Sugar futures contracts |
| $ |
|
| $ |
|
| $ |
|
| $ |
|
| $ |
|
| $ |
| ||||||
Wheat futures contracts |
| $ |
|
| $ |
|
| $ |
|
| $ |
|
| $ |
|
| $ |
| ||||||
Offsetting of Financial Liabilities and Derivative Liabilities as of December 31, 2021
|
| (i) |
|
| (ii) |
|
| (iii) = (i)-(ii) |
|
| (iv) |
|
| (v)=(iii)-(iv) |
| |||||||||
|
|
|
|
|
|
|
|
|
|
| Gross Amount Not Offset in the Combined Statement of Assets and Liabilities |
|
|
|
| |||||||||
Description |
| Gross Amount of Recognized Liabilities |
|
| Gross Amount Offset in the Combined Statement of Assets and Liabilities |
|
| Net Amount Presented in the Combined Statement of Assets and Liabilities |
|
| Futures Contracts Available for Offset |
|
| Collateral, Due from Broker* |
|
| Net Amount |
| ||||||
Commodity Price |
|
|
|
|
|
|
|
|
|
|
|
|
|
|
|
|
|
| ||||||
Sugar futures contracts |
| $ |
|
| $ |
|
| $ |
|
| $ |
|
| $ |
|
| $ |
| ||||||
Wheat futures contracts |
| $ |
|
| $ |
|
| $ |
|
| $ |
|
| $ |
|
| $ |
| ||||||
The following is a summary of realized and unrealized gains (losses) of the derivative instruments utilized by the Trust:
Three months ended September 30, 2022 (1)
|
| Realized (Loss) Gain on Commodity and Cryptocurrency Futures Contracts |
|
| Net Change in Unrealized Appreciation (Depreciation) on Commodity and Cryptocurrency Futures Contracts |
| ||
Commodity Price |
|
|
|
|
|
| ||
Corn futures contracts |
| $ | ( | ) |
| $ |
| |
Soybean futures contracts |
|
|
|
|
| ( | ) | |
Sugar futures contracts |
|
| ( | ) |
|
| ( | ) |
Wheat futures contracts |
|
| ( | ) |
|
|
| |
Bitcoin futures Contracts |
|
| ( | ) |
|
| ( | ) |
Total commodity and cryptocurrency futures contracts |
| $ | ( | ) |
| $ |
| |
| F-20 |
| Table of Contents |
Three months ended September 30, 2021
|
| Realized Gain on Commodity Futures Contracts |
|
| Net Change in Unrealized (Depreciation) Appreciation on Commodity Futures Contracts |
| ||
Commodity Price |
|
|
|
|
|
| ||
Corn futures contracts |
| $ |
|
| $ | ( | ) | |
Soybean futures contracts |
|
|
|
|
| ( | ) | |
Sugar futures contracts |
|
|
|
|
|
| ||
Wheat futures contracts |
|
|
|
|
|
| ||
Total commodity and cryptocurrency futures contracts |
| $ |
|
| $ | ( | ) | |
Nine months ended September 30, 2022 (1)
|
| Realized Gain (Loss) on Commodity and Cryptocurrency Futures Contracts |
|
| Net Change in Unrealized Depreciation on Commodity and Cryptocurrency Futures Contracts |
| ||
Commodity Price |
|
|
|
|
|
| ||
Corn futures contracts |
| $ |
|
| $ | ( | ) | |
Soybean futures contracts |
|
|
|
|
| ( | ) | |
Sugar futures contracts |
|
| ( | ) |
|
| ( | ) |
Wheat futures contracts |
|
| ( | ) |
|
| ( | ) |
Bitcoin futures Contracts |
|
| ( | ) |
|
| ( | ) |
Total commodity and cryptocurrency futures contracts |
| $ | ( | ) |
| $ | ( | ) |
Nine months ended September 30, 2021
|
| Realized Gain on Commodity Futures Contracts |
|
| Net Change in Unrealized (Depreciation) Appreciation on Commodity Futures Contracts |
| ||
Commodity Price |
|
|
|
|
|
| ||
Corn futures contracts |
| $ |
|
| $ | ( | ) | |
Soybean futures contracts |
|
|
|
|
| ( | ) | |
Sugar futures contracts |
|
|
|
|
|
| ||
Wheat futures contracts |
|
|
|
|
| ( | ) | |
Total commodity and cryptocurrency futures contracts |
| $ |
|
| $ | ( | ) | |
(1) The Hashdex Bitcoin Futures ETF commenced operations on September 15, 2022.
| F-21 |
| Table of Contents |
Volume of Derivative Activities
The average notional market value categorized by primary underlying risk for the futures contracts held was $
Note 6 - Organizational and Offering Costs
Expenses incurred in organizing of the Trust and the initial offering of the shares of the Funds, including applicable SEC registration fees, were borne directly by the Sponsor for the Funds, and will be borne directly by the Sponsor for any series of the Trust which is not yet operating or will be issued in the future. The Trust will not be obligated to reimburse the Sponsor.
Note 7 – Detail of the net assets and shares outstanding of the Funds that are a series of the Trust
The following are the net assets and shares outstanding of each Fund that is a series of the Trust and, thus, in total, comprise the combined net assets of the Trust:
September 30, 2022
|
| Outstanding Shares |
|
| Net Assets |
| ||
Teucrium Corn Fund |
|
|
|
| $ |
| ||
Teucrium Soybean Fund |
|
|
|
|
|
| ||
Teucrium Sugar Fund |
|
|
|
|
|
| ||
Teucrium Wheat Fund |
|
|
|
|
|
| ||
Hashdex Bitcoin Futures ETF |
|
|
|
|
|
| ||
Teucrium Agricultural Fund: |
|
|
|
|
|
|
|
|
Net assets including the investment in the Underlying Funds |
|
|
|
|
|
| ||
Less: Investment in the Underlying Funds |
|
|
|
|
|
| ( | ) |
Net for the Fund in the combined net assets of the Trust |
|
|
|
|
|
|
| |
Total |
|
|
|
|
| $ |
| |
| F-22 |
| Table of Contents |
December 31, 2021
|
| Outstanding Shares |
|
| Net Assets |
| ||
Teucrium Corn Fund |
|
|
|
| $ |
| ||
Teucrium Soybean Fund |
|
|
|
|
|
| ||
Teucrium Sugar Fund |
|
|
|
|
|
| ||
Teucrium Wheat Fund |
|
|
|
|
|
| ||
Teucrium Agricultural Fund: |
|
|
|
|
|
|
|
|
Net assets including the investment in the Underlying Funds |
|
|
|
|
|
| ||
Less: Investment in the Underlying Funds |
|
|
|
|
|
| ( | ) |
Net for the Fund in the combined net assets of the Trust |
|
|
|
|
|
|
| |
Total |
|
|
|
|
| $ |
| |
The detailed information for the subscriptions and redemptions, and other financial information for each Fund that is a series of the Trust are included in the accompanying financial statements of each Fund.
Note 8 – Subsequent Events
Management has evaluated the financial statements for the quarter-ended September 30, 2022 for subsequent events through the date of this filing and noted no material events requiring either recognition through the date of the filing or disclosure herein for the Trust and Funds other than those noted below:
Trust:
Nothing to report.
CORN:
Nothing to report.
SOYB:
Nothing to report.
CANE:
Nothing to report.
WEAT:
Nothing to report.
TAGS:
Nothing to report.
DEFI:
The total net assets of the Fund increased by $
| F-23 |
| Table of Contents |
TEUCRIUM CORN FUND
STATEMENTS OF ASSETS AND LIABILITIES
|
| September 30, 2022 |
|
| December 31, 2021 |
| ||
|
| (Unaudited) |
|
|
| |||
Assets |
|
|
|
|
|
| ||
Cash and cash equivalents |
| $ |
|
| $ |
| ||
Interest receivable |
|
|
|
|
|
| ||
Equity in trading accounts: |
|
|
|
|
|
|
|
|
Commodity futures contracts |
|
|
|
|
|
| ||
Due from broker |
|
|
|
|
|
| ||
Total equity in trading accounts |
|
|
|
|
|
| ||
Total assets |
|
|
|
|
|
| ||
|
|
|
|
|
|
|
|
|
Liabilities |
|
|
|
|
|
|
|
|
Management fee payable to Sponsor |
|
|
|
|
|
| ||
Other liabilities |
|
|
|
|
|
| ||
Equity in trading accounts: |
|
|
|
|
|
|
|
|
Commodity futures contracts |
|
|
|
|
|
| ||
Total liabilities |
|
|
|
|
|
| ||
|
|
|
|
|
|
|
|
|
Net assets |
| $ |
|
| $ |
| ||
|
|
|
|
|
|
|
|
|
Shares outstanding |
|
|
|
|
|
| ||
|
|
|
|
|
|
|
|
|
Shares Authorized |
| * |
|
|
|
| ||
|
|
|
|
|
|
|
|
|
Net asset value per share |
| $ |
|
| $ |
| ||
|
|
|
|
|
|
|
|
|
Market value per share |
| $ |
|
| $ |
| ||
* On April 7, 2022, the Teucrium Corn Fund registered an indeterminate number of shares of the Fund pursuant to Rule 456(d) under the Securities Act of 1933.
The accompanying notes are an integral part of these financial statements.
| F-24 |
| Table of Contents |
TEUCRIUM CORN FUND
SCHEDULE OF INVESTMENTS
September 30, 2022
(Unaudited)
|
|
|
|
| Percentage of |
|
|
|
| |||
Description: Assets |
| Fair Value |
|
| Net Assets |
|
| Shares |
| |||
|
|
|
|
|
|
|
|
|
| |||
Cash equivalents |
|
|
|
|
|
|
|
|
| |||
Money market funds |
|
|
|
|
|
|
|
|
| |||
First American Governemnt Obligations Fund - Class X (cost $32,434,029) |
| $ |
|
|
| % |
|
|
| |||
Goldman Sachs Financial Square Government Fund - Institutional Class (cost: $41,373,165) |
|
|
|
|
|
|
|
|
| |||
Total money market funds (cost: $73,807,194) |
| $ |
|
|
| % |
|
|
|
| ||
|
|
|
|
|
|
|
|
|
|
|
|
|
Commercial Paper |
|
|
|
|
|
|
|
|
|
|
|
|
American Electric Power Company, Inc. 3.465% (cost: $4,983,327 due 11/03/2022) |
| $ |
|
|
| % |
|
|
| |||
AT&T Inc. 3.277% (cost: $7,453,425 due 11/28/2022) |
|
|
|
|
|
|
|
|
| |||
Brookfield Infrastructure Holdings (Canada) Inc. 3.540% (cost: $7,460,625 due 11/15/2022) |
|
|
|
|
|
|
|
|
| |||
Crown Castle Inc. 3.234% (cost: $2,487,556 due 11/10/2022) |
|
|
|
|
|
|
|
|
| |||
Crown Castle Inc. 3.806% (cost: $2,485,900 due 11/23/2022) |
|
|
|
|
|
|
|
|
| |||
E. I. du Pont de Nemours and Company 3.336% (cost: $2,487,167 due 11/21/2022) |
|
|
|
|
|
|
|
|
| |||
Entergy Corporation 3.030% (cost: $2,487,500 due 11/14/2022) |
|
|
|
|
|
|
|
|
| |||
Entergy Corporation 3.163% (cost: $2,480,678 due 11/28/2022) |
|
|
|
|
|
|
|
|
| |||
Fortune Brands Home & Security, Inc. 3.040% (cost: $2,488,922 due 10/21/2022) |
|
|
|
|
|
|
|
|
| |||
General Motors Financial Company, Inc. 2.878% (cost: $2,487,531 due 10/17/2022) |
|
|
|
|
|
|
|
|
| |||
General Motors Financial Company, Inc. 3.042% (cost: $2,485,577 due 11/08/2022) |
|
|
|
|
|
|
|
|
| |||
Glencore Funding LLC 2.898% (cost: $9,949,775 due 10/18/2022) |
|
|
|
|
|
|
|
|
| |||
Harley-Davidson Financial Services, Inc. 2.824% (cost: $996,733 due 10/18/2022) |
|
|
|
|
|
|
|
|
| |||
Harley-Davidson Financial Services, Inc. 3.487% (cost: $2,489,698 due 11/03/2022) |
|
|
|
|
|
|
|
|
| |||
Humana Inc. 2.518% (cost: $2,494,618 due 10/03/2022) |
|
|
|
|
|
|
|
|
| |||
ITT Inc. 2.795% (cost: $4,978,456 due 10/11/2022) |
|
|
|
|
|
|
|
|
| |||
ITT Inc. 2.683% (cost: $2,491,133 due 10/24/2022) |
|
|
|
|
|
|
|
|
| |||
Jabil Inc. 3.129% (cost: $2,492,250 due 10/21/2022) |
|
|
|
|
|
|
|
|
| |||
ONEOK, Inc. 3.159% (cost: $2,493,697 due 10/14/2022) |
|
|
|
|
|
|
|
|
| |||
ONEOK, Inc. 3.158% (cost: $4,987,828 due 10/14/2022) |
|
|
|
|
|
|
|
|
| |||
PVH Corp. 3.434% (cost: $7,479,458 due 10/21/2022) |
|
|
|
|
|
|
|
|
| |||
V.F. Corporation 2.539% (cost: $2,493,175 due 10/11/2022) |
|
|
|
|
|
|
|
|
| |||
V.F. Corporation 3.282% (cost: $7,473,595 due 11/01/2022) |
|
|
|
|
|
|
|
|
| |||
V.F. Corporation 3.759% (cost: $2,480,935 due 12/09/2022) |
|
|
|
|
|
|
|
|
| |||
Viatris Inc. 3.473% (cost: $4,991,400 due 10/14/2022) |
|
|
|
|
|
|
|
|
| |||
Total Commercial Paper (cost: $98,080,959) |
| $ |
|
|
| % |
|
|
|
| ||
Total Cash Equivalents |
| $ |
|
|
| % |
|
|
|
| ||
|
|
|
|
|
|
|
|
|
|
|
|
|
|
|
|
|
|
|
|
|
|
| Notional Amount |
| |
|
|
|
|
|
|
|
|
|
| (Long Exposure) |
| |
Commodity futures contracts |
|
|
|
|
|
|
|
|
|
|
|
|
United States corn futures contracts |
|
|
|
|
|
|
|
|
|
|
|
|
CBOT corn futures MAR23 (2,207 contracts) |
| $ |
|
|
| % |
| $ |
| |||
|
|
|
|
|
|
|
|
|
|
|
|
|
|
|
|
|
|
| Percentage of |
|
| Notional Amount |
| ||
Description: Liabilities |
| Fair Value |
|
| Net Assets |
|
| (Long Exposure) |
| |||
|
|
|
|
|
|
|
|
|
|
|
|
|
Commodity futures contracts |
|
|
|
|
|
|
|
|
|
|
|
|
United States corn futures contracts |
|
|
|
|
|
|
|
|
|
|
|
|
CBOT corn futures MAY23 (1,889 contracts) |
| $ |
|
|
| % |
| $ |
| |||
CBOT corn futures DEC23 (2,426 contracts) |
|
|
|
|
|
|
|
|
| |||
Total commodity futures contracts |
| $ |
|
|
| % |
| $ |
| |||
The accompanying notes are an integral part of these financial statements.
| F-25 |
| Table of Contents |
TEUCRIUM CORN FUND
SCHEDULE OF INVESTMENTS
December 31, 2021
|
|
|
| Percentage of |
|
|
| |||||
Description: Assets |
| Fair Value |
|
| Net Assets |
|
| Shares |
| |||
|
|
|
|
|
|
|
|
|
| |||
Cash equivalents |
|
|
|
|
|
|
|
|
| |||
Money market funds |
|
|
|
|
|
|
|
|
| |||
First American Government Obligations Fund - Class X 0.026% (cost $11,397,154) |
| $ |
|
|
| % |
|
|
| |||
Goldman Sachs Financial Square Government Fund - Institutional Class 0.030% (cost $2,508) |
|
|
|
|
|
|
|
|
| |||
Total money market funds (cost: $11,399,662) |
| $ |
|
|
| % |
|
|
|
| ||
|
|
|
|
|
|
|
|
|
|
|
|
|
|
|
|
|
|
|
|
|
|
| Principal Amount |
| |
Commercial Paper |
|
|
|
|
|
|
|
|
|
|
|
|
Albemarle Corporation 0.181% (cost: $7,497,243 due 01/31/2022) |
| $ |
|
|
| % |
|
|
| |||
Conagra Brands, Inc. 0.160% (cost: $2,499,000 due 01/05/2022) |
|
|
|
|
|
|
|
|
| |||
Conagra Brands, Inc. 0.150% (cost: $2,499,355 due 01/18/2022) |
|
|
|
|
|
|
|
|
| |||
General Motors Financial Company, Inc. 0.160% (cost: $2,499,000 due 01/06/2022) |
|
|
|
|
|
|
|
|
| |||
General Motors Financial Company, Inc. 0.200% (cost: $3,498,289 due 01/31/2022) |
|
|
|
|
|
|
|
|
| |||
General Motors Financial Company, Inc. 0.160% (cost: $2,499,400 due 01/03/2022) |
|
|
|
|
|
|
|
|
| |||
Harley-Davidson Financial Services, Inc. 0.167% (cost: $7,497,046 due 01/13/2022) |
|
|
|
|
|
|
|
|
| |||
Harley-Davidson Financial Services, Inc. 0.250% (cost: $2,498,664 due 03/02/2022) |
|
|
|
|
|
|
|
|
| |||
Humana Inc. 0.140% (cost: $4,998,425 due 01/07/2022) |
|
|
|
|
|
|
|
|
| |||
Jabil Inc. 0.300% (cost: $4,997,375 due 02/08/2022) |
|
|
|
|
|
|
|
|
| |||
Jabil Inc. 0.310% (cost: $2,498,450 due 02/25/2022) |
|
|
|
|
|
|
|
|
| |||
Viatris Inc. 0.250% (cost: $4,997,466 due 02/11/2022) |
|
|
|
|
|
|
|
|
| |||
Viatris Inc. 0.310% (cost: $2,498,493 due 03/01/2022) |
|
|
|
|
|
|
|
|
| |||
WGL Holdings, Inc. 0.220% (cost: $2,499,343 due 01/12/2022) |
|
|
|
|
|
|
|
|
| |||
Total Commercial Paper (cost: $53,477,549) |
| $ |
|
|
| % |
|
|
|
| ||
Total Cash Equivalents |
| $ |
|
|
| % |
|
|
|
| ||
|
|
|
|
|
|
|
|
|
|
|
|
|
|
|
|
|
|
|
|
|
|
| Notional Amount |
| |
|
|
|
|
|
|
|
|
|
| (Long Exposure) |
| |
Commodity futures contracts |
|
|
|
|
|
|
|
|
|
|
|
|
United States corn futures contracts |
|
|
|
|
|
|
|
|
|
|
|
|
CBOT corn futures MAY22 (1,418 contracts) |
| $ |
|
|
| % |
| $ |
| |||
CBOT corn futures JUL22 (1,218 contracts) |
|
|
|
|
|
|
|
|
| |||
CBOT corn futures DEC22 (1,558 contracts) |
|
|
|
|
|
|
|
|
| |||
Total commodity futures contracts |
| $ |
|
|
| % |
| $ |
| |||
The accompanying notes are an integral part of these financial statements.
| F-26 |
| Table of Contents |
TEUCRIUM CORN FUND
STATEMENTS OF OPERATIONS
(Unaudited)
|
| Three months ended |
|
| Three months ended |
|
| Nine months ended |
|
| Nine months ended |
| ||||
|
| September 30, 2022 |
|
| September 30, 2021 |
|
| September 30, 2022 |
|
| September 30, 2021 |
| ||||
Income |
|
|
|
|
|
|
|
|
|
|
|
| ||||
Realized and unrealized gain (loss) on trading of commodity futures contracts: |
|
|
|
|
|
|
|
|
|
|
|
| ||||
Realized (loss) gain on commodity futures contracts |
| $ | ( | ) |
| $ |
|
| $ |
|
| $ |
| |||
Net change in unrealized appreciation/(depreciation) on commodity futures contracts |
|
|
|
|
| ( | ) |
|
| ( | ) |
|
| ( | ) | |
Interest income |
|
|
|
|
|
|
|
|
|
|
|
| ||||
Total income (loss) |
|
|
|
|
| ( | ) |
|
|
|
|
|
| |||
|
|
|
|
|
|
|
|
|
|
|
|
|
|
|
|
|
Expenses |
|
|
|
|
|
|
|
|
|
|
|
|
|
|
|
|
Management fees |
|
|
|
|
|
|
|
|
|
|
|
| ||||
Professional fees |
|
|
|
|
|
|
|
|
|
|
|
| ||||
Distribution and marketing fees |
|
|
|
|
|
|
|
|
|
|
|
| ||||
Custodian fees and expenses |
|
|
|
|
|
|
|
|
|
|
|
| ||||
Business permits and licenses fees |
|
|
|
|
|
|
|
|
|
|
|
| ||||
General and administrative expenses |
|
|
|
|
|
|
|
|
|
|
|
| ||||
Total expenses |
|
|
|
|
|
|
|
|
|
|
|
| ||||
|
|
|
|
|
|
|
|
|
|
|
|
|
|
|
|
|
Expenses waived by the Sponsor |
|
|
|
|
| ( | ) |
|
| ( | ) |
|
| ( | ) | |
|
|
|
|
|
|
|
|
|
|
|
|
|
|
|
|
|
Total expenses, net |
|
|
|
|
|
|
|
|
|
|
|
| ||||
|
|
|
|
|
|
|
|
|
|
|
|
|
|
|
|
|
Net income (loss) |
| $ |
|
| $ | ( | ) |
| $ |
|
| $ |
| |||
|
|
|
|
|
|
|
|
|
|
|
|
|
|
|
|
|
Net gain (loss) per share |
| $ |
|
| $ | ( | ) |
| $ |
|
| $ |
| |||
Net income (loss) per weighted average share |
| $ |
|
| $ | ( | ) |
| $ |
|
| $ |
| |||
Weighted average shares outstanding |
|
|
|
|
|
|
|
|
|
|
|
| ||||
The accompanying notes are an integral part of these financial statements.
| F-27 |
| Table of Contents |
TEUCRIUM CORN FUND
STATEMENTS OF CHANGES IN NET ASSETS
(Unaudited)
|
| Nine months ended |
|
| Nine months ended |
| ||
|
| September 30, 2022 |
|
| September 30, 2021 |
| ||
Operations |
|
|
|
|
|
| ||
Net income |
| $ |
|
| $ |
| ||
Capital transactions |
|
|
|
|
|
|
|
|
Issuance of Shares |
|
|
|
|
|
| ||
Redemption of Shares |
|
| ( | ) |
|
| ( | ) |
Total capital transactions |
|
|
|
|
| ( | ) | |
Net change in net assets |
|
|
|
|
| ( | ) | |
|
|
|
|
|
|
|
|
|
Net assets, beginning of period |
| $ |
|
| $ |
| ||
|
|
|
|
|
|
|
|
|
Net assets, end of period |
| $ |
|
| $ |
| ||
|
|
|
|
|
|
|
|
|
Net asset value per share at beginning of period |
| $ |
|
| $ |
| ||
|
|
|
|
|
|
|
|
|
Net asset value per share at end of period |
| $ |
|
| $ |
| ||
|
|
|
|
|
|
|
|
|
Creation of Shares |
|
|
|
|
|
| ||
Redemption of Shares |
|
|
|
|
|
| ||
The accompanying notes are an integral part of these financial statements.
| F-28 |
| Table of Contents |
TEUCRIUM CORN FUND
STATEMENTS OF CASH FLOWS
(Unaudited)
|
| Nine months ended |
|
| Nine months ended |
| ||
|
| September 30, 2022 |
|
| September 30, 2021 |
| ||
Cash flows from operating activities: |
|
|
|
|
|
| ||
Net income |
| $ |
|
| $ |
| ||
Adjustments to reconcile net income to net cash provided by operating activities: |
|
|
|
|
|
|
|
|
Net change in unrealized depreciation on commodity futures contracts |
|
|
|
|
|
| ||
Changes in operating assets and liabilities: |
|
|
|
|
|
|
|
|
Due from broker |
|
| ( | ) |
|
| ( | ) |
Interest receivable |
|
| ( | ) |
|
| ( | ) |
Due to broker |
|
|
|
|
| ( | ) | |
Management fee payable to Sponsor |
|
|
|
|
| ( | ) | |
Payable for purchases of commercial paper |
|
|
|
|
| ( | ) | |
Other liabilities |
|
| ( | ) |
|
|
| |
Net cash provided by operating activities |
|
|
|
|
|
| ||
|
|
|
|
|
|
|
|
|
Cash flows from financing activities: |
|
|
|
|
|
|
|
|
Proceeds from sale of Shares |
|
|
|
|
|
| ||
Redemption of Shares |
|
| ( | ) |
|
| ( | ) |
Net cash provided by (used in) financing activities |
|
|
|
|
| ( | ) | |
|
|
|
|
|
|
|
|
|
Net change in cash and cash equivalents |
|
|
|
|
| ( | ) | |
Cash and cash equivalents, beginning of period |
|
|
|
|
|
| ||
Cash and cash equivalents, end of period |
| $ |
|
| $ |
| ||
The accompanying notes are an integral part of these financial statements.
| F-29 |
| Table of Contents |
NOTES TO FINANCIAL STATEMENTS
September 30, 2022
(Unaudited)
Note 1 – Organization and Operation
Teucrium Corn Fund (referred to herein as “CORN,” or the “Fund”) is a commodity pool that is a series of Teucrium Commodity Trust (“Trust”), a Delaware statutory trust formed on September 11, 2009. The Fund issues common units, called the “Shares,” representing fractional undivided beneficial interests in the Fund. The Fund continuously offers Creation Baskets consisting of
The investment objective of CORN is to have the daily changes in the NAV of the Fund’s Shares reflect the daily changes in the corn market for future delivery as measured by the Benchmark. The Benchmark is a weighted average of the closing settlement prices for three futures contracts for corn (“Corn Futures Contracts”) that are traded on the Chicago Board of Trade (“CBOT”):
CORN Benchmark
CBOT Corn Futures Contract |
| Weighting |
| |
Second to expire |
|
| % | |
Third to expire |
|
| % | |
December following the third to expire |
|
| % | |
The Fund commenced investment operations on June 9, 2010 and has a fiscal year ending on December 31. The Fund’s sponsor is Teucrium Trading, LLC (the “Sponsor”). The Sponsor is responsible for the management of the Fund. The Sponsor is registered as a commodity pool operator (“CPO”) and a commodity trading adviser (“CTA”) with the Commodity Futures Trading Commission (“CFTC”) and is a member of the National Futures Association (“NFA”).
On June 7, 2010, the initial Form S-1 for CORN was declared effective by the U.S. Securities and Exchange Commission (“SEC”). On June 8, 2010, four Creation Baskets for CORN were issued representing
The accompanying unaudited financial statements have been prepared in accordance with Rule 10-01 of Regulation S-X promulgated by the SEC and, therefore, do not include all information and footnote disclosures required under accounting principles generally accepted in the United States of America (“GAAP”). The financial information included herein is unaudited; however, such financial information reflects all adjustments which are, in the opinion of management, necessary for the fair presentation of the Fund’s financial statements for the interim period. It is suggested that these interim financial statements be read in conjunction with the financial statements and related notes included in the Trust’s Annual Report on Form 10-K, as well as the most recent Form S-1 filing, as applicable. The operating results for the three and nine months ended September 30, 2022 are not necessarily indicative of the results to be expected for the full year ending December 31, 2022.
| F-30 |
| Table of Contents |
Subject to the terms of the Trust Agreement, Teucrium Trading, LLC, in its capacity as the Sponsor (“Sponsor”), may terminate a Fund at any time, regardless of whether the Fund has incurred losses, including, for instance, if it determines that the Fund’s aggregate net assets in relation to its operating expenses make the continued operation of the Fund unreasonable or imprudent. However, no level of losses will require the Sponsor to terminate a Fund.
Note 2 – Principal Contracts and Agreements
The Sponsor employs U.S. Bancorp Fund Services, LLC, doing business as U.S. Bank Global Fund Services (“Global Fund Services”), for Transfer Agency, Fund Accounting and Fund Administration services. The principal address for Global Fund Services is 615 E. Michigan Street, Milwaukee, WI 53202.
The Sponsor employs Foreside Fund Services, LLC (“Foreside” or the “Distributor”) as the Distributor for the Funds. The Distribution Services Agreement among the Distributor and the Sponsor calls for the Distributor to work with the Custodian in connection with the receipt and processing of orders for Creation Baskets and Redemption Baskets and the review and approval of all Fund sales literature and advertising materials. The Distributor and the Sponsor have also entered into a Securities Activities and Service Agreement (the “SASA”) under which certain employees and officers of the Sponsor are licensed as registered representatives or registered principals of the Distributor, under Financial Industry Regulatory Authority (“FINRA”) rules.
E D & F Man Capital Markets, Inc. (“E D & F Man”) and StoneX Financial Inc (“StoneX”) serve as the Funds’ clearing brokers to execute and clear futures contracts and provide other brokerage-related services. E D & F Man and StoneX are each registered as futures commission merchants (“FCM”) with the U.S. CFTC and are members of the NFA. The clearing brokers are registered as broker-dealers with the SEC and are each a member of FINRA. ED & F Man and StoneX are each clearing members of ICE Futures U.S., Inc., Chicago Board of Trade, Chicago Mercantile Exchange, New York Mercantile Exchange, and all other major United States commodity exchanges. For Corn, Soybean, Sugar and Wheat Futures Contracts, E D & F Man is paid
| F-31 |
| Table of Contents |
The sole Trustee of the Trust is Wilmington Trust Company, a Delaware banking corporation. The Trustee will accept service of legal process on the Trust in the State of Delaware and will make certain filings under the Delaware Statutory Trust Act. For its services, the Trustee receives an annual fee of $3,300 from the Trust. These services are recorded in business permits and licenses fees on the statements of operations. A summary of these expenses is included below.
The Sponsor employs Thales Capital Partners LLC (“Thales”) for distribution and solicitation-related services.
|
| Three months ended September 30, 2022 |
|
| Three months ended September 30, 2021 |
|
| Nine months ended September 30, 2022 |
|
| Nine months ended September 30, 2021 |
| ||||
Amount Recognized for Custody Services |
| $ |
|
| $ |
|
| $ |
|
| $ |
| ||||
Amount of Custody Services Waived |
| $ |
|
| $ |
|
| $ |
|
| $ |
| ||||
|
|
|
|
|
|
|
|
|
|
|
|
|
|
|
|
|
Amount Recognized for Distribution Services |
| $ |
|
| $ |
|
| $ |
|
| $ |
| ||||
Amount of Distribution Services Waived |
| $ |
|
| $ |
|
| $ |
|
| $ |
| ||||
|
|
|
|
|
|
|
|
|
|
|
|
|
|
|
|
|
Amount Recognized for Wilmington Trust |
| $ |
|
| $ |
|
| $ |
|
| $ |
| ||||
Amount of Wilmington Trust Waived |
| $ |
|
| $ |
|
| $ |
|
| $ |
| ||||
|
|
|
|
|
|
|
|
|
|
|
|
|
|
|
|
|
Amount Recognized for Thales |
| $ |
|
| $ |
|
| $ |
|
| $ |
| ||||
Amount of Thales Waived |
| $ |
|
| $ |
|
| $ |
|
| $ |
| ||||
Note 3 – Summary of Significant Accounting Policies
Basis of Presentation
The accompanying financial statements have been prepared in accordance with accounting principles generally accepted in the United States of America (“U.S. GAAP”) as detailed in the Financial Accounting Standards Board’s Accounting Standards Codification.
Revenue Recognition
Commodity futures contracts are recorded on the trade date. All such transactions are recorded on the identified cost basis and marked to market daily. Unrealized appreciation or depreciation on commodity futures contracts are reflected in the statements of operations as the difference between the original contract amount and the fair market value as of the last business day of the year or as of the last date of the financial statements. Changes in the appreciation or depreciation between periods are reflected in the statements of operations. The Fund seeks to earn interest on its assets denominated in U.S. dollars on deposits with the Futures Commission Merchant. In addition, the Fund earns interest on funds held at the custodian and at other financial institutions at prevailing market rates for such investments.
The Sponsor invests a portion of cash in commercial paper, which is deemed a cash equivalent based on the rating and duration of contracts as described in the notes to the financial statements and reflected in cash and cash equivalents on the statements of assets and liabilities and statements of cash flows. Accretion on these investments is recognized using the effective interest method in U.S. dollars and included in interest income on the statements of operations.
The Sponsor invests a portion of the cash held by the broker in short term Treasury Bills as collateral for open futures contracts. Accretion on these investments is recognized using the effective interest method in U.S. dollars and included in interest income on the statements of operations.
| F-32 |
| Table of Contents |
Brokerage Commissions
The Sponsor recognizes the expense for brokerage commissions for futures contract trades on a per-trade basis. The below table shows the amounts included on the statements of operations as total brokerage commissions paid inclusive of unrealized loss for the three and nine months ended September 30, 2022.
|
| CORN |
| |
Three Months Ended September 30, 2022 |
| $ | 54,746 |
|
Three Months Ended September 30, 2021 |
| $ | 43,677 |
|
Nine Months Ended September 30, 2022 |
| $ | 188,321 |
|
Nine Months Ended September 30, 2021 |
| $ | 118,868 |
|
Income Taxes
For federal income tax purposes, the Fund will be treated as a publicly traded partnership. A publicly traded partnership is generally treated as a corporation for federal income tax purposes unless 90% or more of the publicly traded partnership’s gross income for each taxable year of its existence consists of qualifying income as defined in section 7704(d) of the Internal Revenue Code of 1986, as amended. Qualifying income is defined as generally including, in pertinent part, interest (other than from a financial business), dividends, and gains from the sale or disposition of capital assets held for the production of interest or dividends. In the case of a partnership of which a principal activity is the buying and selling of commodities, other than as inventory, or of futures, forwards and options with respect to commodities, qualifying income also includes income and gains from commodities and from futures, forwards, options with respect to commodities and, provided the partnership is a trader or investor with respect to such assets, swaps and other notional principal contracts with respect to commodities. The Fund expects that at least 90% of the Fund’s gross income for each taxable year will consist of qualifying income and that the Fund will be taxed as a partnership for federal income tax purposes. The Fund does not record a provision for income taxes because the shareholders report their share of the Fund’s income or loss on their income tax returns. The financial statements reflect the Fund’s transactions without adjustment, if any, required for income tax purposes.
The Fund is required to determine whether a tax position is more likely than not to be sustained upon examination by the applicable taxing authority, including resolution of any related appeals or litigation processes, based on the technical merits of the position. The Fund files an income tax return in the U.S. federal jurisdiction and may file income tax returns in various U.S. states and foreign jurisdictions. For all tax years 2019 to 2021, the Fund remains subject to income tax examinations by major taxing authorities. The tax benefit recognized is measured as the largest amount of benefit that has a greater than fifty percent likelihood of being realized upon ultimate settlement. De-recognition of a tax benefit previously recognized results in the Fund recording a tax liability that reduces net assets. Based on its analysis, the Fund has determined that it has not incurred any liability for unrecognized tax benefits as of September 30, 2022 and for the years ended December 31, 2021, 2020, and 2019. However, the Fund’s conclusions regarding this policy may be subject to review and adjustment at a later date based on factors including, but not limited to, ongoing analysis of and changes to tax laws, regulations, and interpretations thereof.
| F-33 |
| Table of Contents |
The Fund recognizes interest accrued related to unrecognized tax benefits and penalties related to unrecognized tax benefits in income tax fees payable, if assessed. No interest expense or penalties have been recognized as of and for the three and nine months ended September 30, 2022 and 2021.
The Fund may be subject to potential examination by U.S. federal, U.S. state, or foreign jurisdictional authorities in the area of income taxes. These potential examinations may include questioning the timing and amount of deductions, the nexus of income among various tax jurisdictions, and compliance with U.S. federal, U.S. state and foreign tax laws.
Creations and Redemptions
Authorized Purchasers may purchase Creation Baskets consisting of 25,000 shares from CORN. The amount of the proceeds required to purchase a Creation Basket will be equal to the NAV of the shares in the Creation Basket determined as of 4:00 p.m. (ET) on the day the order to create the basket is received in good order.
Authorized Purchasers may redeem shares from the Fund only in blocks of 25,000 shares called “Redemption Baskets.” The amount of the redemption proceeds for a Redemption Basket will be equal to the NAV of the shares in the Redemption Basket determined as of 4:00 p.m. (ET) on the day the order to redeem the basket is received in good order.
The Fund receives or pays the proceeds from shares sold or redeemed within three business days after the trade date of the purchase or redemption. The amounts due from Authorized Purchasers are reflected in the Fund’s statements of assets and liabilities as capital shares receivable. Amounts payable to Authorized Purchasers upon redemption are reflected in the Fund’s statements of assets and liabilities as payable for shares redeemed.
As outlined in the most recent Form S-1 filing, 50,000 shares represent two Redemption Baskets for the Fund and a minimum level of shares. If the Fund experienced redemptions that caused the number of Shares outstanding to decrease to the minimum level of Shares required to be outstanding, until the minimum number of Shares is again exceeded through the purchase of a new Creation Basket, there can be no more redemptions by an Authorized Purchaser.
Allocation of Shareholder Income and Losses
Profit or loss is allocated among the shareholders of the Fund in proportion to the number of shares each shareholder holds as of the close of each month.
Cash and Cash Equivalents
Cash equivalents are highly liquid investments with maturity dates of 90 days or less when acquired. The Fund reported its cash equivalents in the statements of assets and liabilities at market value, or at carrying amounts that approximate fair value, because of their highly liquid nature and short-term maturities. Each Fund that is a series of the Trust has the balance of its cash equivalents on deposit with financial institutions. The Fund holds a balance in money market funds that is included in cash and cash equivalents on the statements of assets and liabilities. The Sponsor invests a portion of the available cash for the Funds in alternative demand deposit savings accounts, which is classified as cash and not as cash equivalents. Assets deposited with the bank may, at times, exceed federally insured limits. The Sponsor invests a portion of the available cash for the Funds in investment grade commercial paper with durations of 90 days or less, which is classified as a cash equivalent and is not FDIC insured. The Sponsor may invest a portion of the cash held by the broker in short term Treasury Bills as collateral for open futures contracts, which is classified as a cash equivalent and is not FDIC insured.
| F-34 |
| Table of Contents |
|
| September 30, 2022 |
|
| December 31, 2021 |
| ||
Money Market Funds |
| $ |
|
| $ |
| ||
Demand Deposit Savings Accounts |
|
|
|
|
|
| ||
Commercial Paper |
|
|
|
|
|
| ||
Total cash and cash equivalents as presented on the Statement of Assets and Liabilities |
| $ |
|
| $ |
| ||
Payable for Purchases of Commercial Paper
The amount recorded by the Fund for commercial paper transactions awaiting settlement, represents the amount payable for contracts purchased but not yet settled as of the reporting date. The value of the contract is included in cash and cash equivalents, and the payable amount is included as a liability.
Due from/to Broker
The amount recorded by the Fund for the amount due from and to the clearing broker includes, but is not limited to, cash held by the broker, amounts payable to the clearing broker related to open transactions, payables for commodities futures accounts liquidating to an equity balance on the clearing broker’s records and amounts of brokerage commissions paid and recognized as unrealized losses.
Margin is the minimum amount of funds that must be deposited by a commodity interest trader with the trader’s broker to initiate and maintain an open position in futures contracts. A margin deposit acts to assure the trader’s performance of the futures contracts purchased or sold. Futures contracts are customarily bought and sold on initial margin that represents a very small percentage of the aggregate purchase or sales price of the contract. Because of such low margin requirements, price fluctuations occurring in the futures markets may create profits and losses that, in relation to the amount invested, are greater than customary in other forms of investment or speculation. As discussed below, adverse price changes in the futures contract may result in margin requirements that greatly exceed the initial margin. In addition, the amount of margin required in connection with a particular futures contract is set from time to time by the exchange on which the contract is traded and may be modified from time to time by the exchange during the term of the contract. Brokerage firms, such as the Fund’s clearing brokers, carrying accounts for traders in commodity interest contracts generally require higher amounts of margin as a matter of policy to further protect themselves. Over the counter trading generally involves the extension of credit between counterparties, so the counterparties may agree to require the posting of collateral by one or both parties to address credit exposure.
When a trader purchases an option, there is no margin requirement; however, the option premium must be paid in full. When a trader sells an option, on the other hand, he or she is required to deposit margin in an amount determined by the margin requirements established for the underlying interest and, in addition, an amount substantially equal to the current premium for the option. The margin requirements imposed on the selling of options, although adjusted to reflect the probability that out-of-the-money options will not be exercised, can in fact be higher than those imposed in dealing in the futures markets directly. Complicated margin requirements apply to spreads and conversions, which are complex trading strategies in which a trader acquires a mixture of options positions and positions in the underlying interest.
Ongoing or “maintenance” margin requirements are computed each day by a trader’s clearing broker. When the market value of a particular open futures contract changes to a point where the margin on deposit does not satisfy maintenance margin requirements, a margin call is made by the broker. If the margin call is not met within a reasonable time, the broker may close out the trader’s position. With respect to the Fund’s trading, the Fund (and not its shareholders personally) is subject to margin calls. Finally, many major U.S. exchanges have passed certain cross margining arrangements involving procedures pursuant to which the futures and options positions held in an account would, in the case of some accounts, be aggregated and margin requirements would be assessed on a portfolio basis, measuring the total risk of the combined positions.
| F-35 |
| Table of Contents |
Calculation of Net Asset Value
The Fund’s NAV is calculated by:
| · | Taking the current market value of its total assets and |
| · | Subtracting any liabilities. |
The administrator, Global Fund Services, calculates the NAV of the Fund once each trading day. It calculates the NAV as of the earlier of the close of the NYSE or 4:00 p.m. (ET). The NAV for a particular trading day is released after 4:15 p.m. (ET).
In determining the value of Corn Futures Contracts, the administrator uses the CBOT closing price. The administrator determines the value of all other Fund investments as of the earlier of the close of the NYSE or 4:00 p.m. (ET). The value of over-the-counter corn interests is determined based on the value of the commodity or futures contract underlying such corn interest, except that a fair value may be determined if the Sponsor believes that the Fund is subject to significant credit risk relating to the counterparty to such corn interest. For purposes of financial statements and reports, the Sponsor will recalculate the NAV where necessary to reflect the “fair value” of a Futures Contract when the Futures Contract closes at its price fluctuation limit for the day. Short term Treasury securities held by the Fund are valued by the administrator using values received from recognized third-party vendors and dealer quotes. NAV includes any unrealized profit or loss on open corn interests and any other income or expense accruing to the Fund but unpaid or not received by the Fund.
Sponsor Fee, Allocation of Expenses and Related Party Transactions
The Sponsor is responsible for investing the assets of the Fund in accordance with the objectives and policies of the Fund. In addition, the Sponsor arranges for one or more third parties to provide administrative, custodial, accounting, transfer agency and other necessary services to the Trust and the Funds. In addition, the Sponsor has elected not to outsource services directly attributable to the Trust and the Funds such as accounting, financial reporting, regulatory compliance, and trading activities, which the Sponsor performs itself. In addition, the Fund is contractually obligated to pay a monthly management fee to the Sponsor, based on average daily net assets, at a rate equal to 1.00% per annum.
The Fund generally pays for all brokerage fees, taxes, and other expenses, including licensing fees for the use of intellectual property, registration or other fees paid to the SEC, FINRA, or any other regulatory agency in connection with the offer and sale of subsequent Shares after its initial registration and all legal, accounting, printing and other expenses associated therewith. The Fund also pays its portion of the fees and expenses associated with the Trust’s tax accounting and reporting requirements. Certain aggregate expenses common to all Funds within the Trust are allocated by the Sponsor to the respective Fund based on activity drivers deemed most appropriate by the Sponsor for such expenses, including but not limited to relative assets under management and creation order activity. These aggregate common expenses include, but are not limited to, legal, auditing, accounting and financial reporting, tax-preparation, regulatory compliance, trading activities, and insurance costs, as well as fees paid to the Distributor, which are included in the related line item in the statements of operations. A portion of these aggregate common expenses are related to the Sponsor or related parties of principals of the Sponsor; these are necessary services to the Funds, which are primarily the cost of performing accounting and financial reporting, regulatory compliance, and trading activities that are directly attributable to the Fund. Such expenses are primarily recorded as distribution and marketing fees in the financial statements of each Fund.
| F-36 |
| Table of Contents |
|
| Three months ended September 30, 2022 |
|
| Three months ended September 30, 2021 |
|
| Nine months ended September 30, 2022 |
|
| Nine months ended September 30, 2021 |
| ||||
Recognized Related Party Transactions |
| $ |
|
| $ |
|
| $ |
|
| $ |
| ||||
Waived Related Party Transactions |
| $ |
|
| $ |
|
| $ |
|
| $ |
| ||||
The Sponsor has the ability to elect to pay certain expenses on behalf of the Funds or waive the management fee. This election is subject to change by the Sponsor, at its discretion. Expenses paid by the Sponsor and Management fees waived by the Sponsor are, if applicable, presented as waived expenses in the statements of operations for each Fund. The Sponsor has determined that there will be no recovery sought for the amounts below in any future period:
|
| CORN |
| |
Three months ended September 30, 2022 |
| $ |
| |
Three months ended September 30, 2021 |
| $ |
| |
Nine months ended September 30, 2022 |
| $ |
| |
Nine months ended September 30, 2021 |
| $ |
| |
Use of Estimates
The preparation of financial statements in conformity with U.S. GAAP requires management to make estimates and assumptions that affect the reported amount of assets and liabilities and disclosure of contingent assets and liabilities at the date of the financial statements, and the reported amounts of the revenue and expenses during the reporting period. Actual results could differ from those estimates.
Fair Value - Definition and Hierarchy
In accordance with U.S. GAAP, fair value is defined as the price that would be received to sell an asset or paid to transfer a liability (i.e., the “exit price”) in an orderly transaction between market participants at the measurement date.
In determining fair value, the Fund uses various valuation approaches. In accordance with GAAP, a fair value hierarchy for inputs is used in measuring fair value that maximizes the use of observable inputs and minimizes the use of unobservable inputs by requiring that the most observable inputs be used when available. Observable inputs are those that market participants would use in pricing the asset or liability based on market data obtained from sources independent of the Fund. Unobservable inputs reflect the Fund’s assumptions about the inputs market participants would use in pricing the asset or liability developed based on the best information available in the circumstances. The fair value hierarchy is categorized into three levels based on the inputs as follows:
Level 1 - Valuations based on unadjusted quoted prices in active markets for identical assets or liabilities that the Fund has the ability to access. Valuation adjustments and block discounts are not applied to Level 1 financial instruments. Since valuations are based on quoted prices that are readily and regularly available in an active market, valuation of these financial instruments does not entail a significant degree of judgment.
Level 2 - Valuations based on quoted prices in markets that are not active or for which all significant inputs are observable, either directly or indirectly.
Level 3 - Valuations based on inputs that are unobservable and significant to the overall fair value measurement.
| F-37 |
| Table of Contents |
The availability of valuation techniques and observable inputs can vary from financial instrument to financial instrument and is affected by a wide variety of factors including, the type of financial instrument, whether the financial instrument is new and not yet established in the marketplace, and other characteristics particular to the transaction. To the extent that valuation is based on models or inputs that are less observable or unobservable in the market, the determination of fair value requires more judgment. Those estimated values do not necessarily represent the amounts that may be ultimately realized due to the occurrence of future circumstances that cannot be reasonably determined. Because of the inherent uncertainty of valuation, those estimated values may be materially higher or lower than the values that would have been used had a ready market for the financial instruments existed. Accordingly, the degree of judgment exercised by the Fund in determining fair value is greatest for financial instruments categorized in Level 3. In certain cases, the inputs used to measure fair value may fall into different levels of the fair value hierarchy. In such cases, for disclosure purposes, the level in the fair value hierarchy, within which the fair value measurement in its entirety falls, is determined based on the lowest level input that is significant to the fair value measurement.
Fair value is a market-based measure considered from the perspective of a market participant rather than an entity-specific measure. Therefore, even when market assumptions are not readily available, the Fund’s own assumptions are set to reflect those that market participants would use in pricing the asset or liability at the measurement date. The Fund uses prices and inputs that are current as of the measurement date, including during periods of market dislocation. In periods of market dislocation, the observability of prices and inputs may be reduced for many securities. This condition could cause a financial instrument to be reclassified to a lower level within the fair value hierarchy. For instance, when Corn Futures Contracts on the CBOT are not actively trading due to a “limit-up” or limit-down” condition, meaning that the daily change in the Corn Futures Contracts has exceeded the limits established, the Trust and the Fund will revert to alternative verifiable sources of valuation of its assets. When such a situation exists on a quarter close, the Sponsor will calculate the Net Asset Value (“NAV”) on a particular day using the Level 1 valuation but will later recalculate the NAV for the impacted Fund based upon the valuation inputs from these alternative verifiable sources (Level 2 or Level 3) and will report such NAV in its applicable financial statements and reports.
On September 30, 2022 and December 31, 2021, in the opinion of the Trust and the Fund, the reported value at the close of the market for each commodity contract fairly reflected the value of the futures and no alternative valuations were required. The determination is made as of the settlement of the futures contracts on the last day of trading for the reporting period. In making the determination of a Level 1 or Level 2 transfer, the Fund considers the average volume of the specific underlying futures contracts traded on the relevant exchange for the periods being reported.
For the quarter ended March 31, 2021, Corn Futures Contracts for the JUL21 CBOT corn futures, SEP21 CBOT corn futures, and DEC21 CBOT corn futures settled in a “limit up” condition. Accordingly, the Trust and CORN classified these as Level 2 assets. The financial statements of CORN were adjusted accordingly. The adjustment resulted in an increase in the unrealized change in commodity futures contracts in excess of reported CBOT values of $
For the quarter ended June 30, 2021, Corn Futures Contracts for the SEP21 CBOT corn futures and the DEC21 CBOT corn futures, settled in a “limit up” condition. Accordingly, the Trust and CORN classified these as level 2 assets. The financial statements of CORN were adjusted accordingly. The adjustment resulted in an increase in the unrealized change in commodity futures contracts in excess of reported CBOT values of $
The Fund records its derivative activities at fair value. Gains and losses from derivative contracts are included in the statements of operations. Derivative contracts include futures contracts related to commodity prices. Futures, which are listed on a national securities exchange, such as the CBOT and the ICE, or reported on another national market, are generally categorized in Level 1 of the fair value hierarchy. OTC derivatives contracts (such as forward and swap contracts) which may be valued using models, depending on whether significant inputs are observable or unobservable, are categorized in Levels 2 or 3 of the fair value hierarchy.
| F-38 |
| Table of Contents |
Expenses
Expenses are recorded using the accrual method of accounting.
Net Income (Loss) per Share
Net income (loss) per share is the difference between the NAV per unit at the beginning of each period and at the end of each period. The weighted average number of units outstanding was computed for purposes of disclosing net income (loss) per weighted average unit. The weighted average units are equal to the number of units outstanding at the end of the period, adjusted proportionately for units created or redeemed based on the amount of time the units were outstanding during such period.
New Accounting Pronouncements
The Financial Accounting Standards Board (“FASB”) issued Accounting Standards Update (“ASU”) 2022-03, related to fair value measurement (Topic 820) of equity securities subject to contractual sale restrictions. Under the clarified guidance, contractual restrictions on the sale of an equity security are not considered part of the unit of account of the equity security and, therefore, are not considered in measuring fair value, however they do require disclosures. The amendment was early adopted for the quarter ended June 30, 2022; the early adoption did not have a material impact on the financial statements and disclosures of the Trust or the Fund.
The FASB issued ASU 2021-05: “Leases (Topic 842).” Under the amended guidance, a lessor should classify and account for a lease with variable lease payments that don’t depend on an index or a rate as an operating lease if the lease would’ve been classified as a sales-type lease or a direct financing lease in accordance with the lease classification guidance in Topic 842 and the lessor would’ve otherwise recognized a day-one loss. The amendment was adopted early for the quarter ended September 30, 2021; the adoption did not have a material impact on the financial statements and disclosures of the Trust or the Fund.
The FASB issued ASU 2020-10: “Codification Improvements.” The amendment improves the disclosure guidance in appropriate Disclosure Sections, without resulting in changes to current GAAP. The amendment is effective for annual periods beginning after December 15, 2020. The amendment was adopted for the quarter ended March 31, 2021; the adoption did not have a material impact on the financial statements and disclosures of the Trust or the Fund.
The FASB issued 2020-02: “Financial Instruments Credit Losses (Topic 326) and Leases (Topic 842): Amendments to SEC Paragraphs Pursuant to SEC Staff Accounting Bulletin No. 119 and Update to SEC Section on Effective Date Related to Accounting Standards Update No. 2016-02, Leases (Topic 842). The amendment updates and adds language to ASU 2016-02. The amendments were adopted for the quarter ended March 31, 2020; the adoption did not have a material impact on the financial statements and disclosures of the Trust or the Fund.
The FASB issued ASU 2020-01: Investments Equity Securities (Topic 321), Investments Equity Method and Joint Ventures (Topic 323), and Derivatives and Hedging (Topic 815) Clarifying the Interactions between Topic 321, Topic 323, and Topic 815. The amendments clarify the treatment of transactions that require a company to apply or discontinue the equity method of accounting. The amendments were adopted early for the quarter ended March 31, 2020; the adoption did not have a material impact on the financial statements and disclosures of the Trust or the Fund.
The FASB issued ASU 2019-04: “Codification Improvements to Topic 326, Financial Instruments Credit Losses, Topic 815, Derivatives and hedging, and Topic 825, Financial Instruments.” The amendments clarify and improve areas of guidance related to the recently issued standards on credit losses, hedging, and recognition and measurement, specifically relating to ASU 201712. The amendments were early adopted for the quarter ended June 30, 2019; the adoption did not have a material impact on the financial statements and disclosures of the Trust or the Fund.
| F-39 |
| Table of Contents |
The FASB issued ASU 2019-01: "Leases (Topic 842): Codification Improvements. These amendments align the guidance for fair value of underlying assets by lessors that are not manufacturers or dealers in Topic 842 with that of existing guidance. The amendments were adopted for the quarter ended September 30, 2020; the adoption did not have a material impact on the financial statements and disclosures of the Trust or the Fund.
The FASB issued ASU 2018-13: “Fair Value Measurement (Topic 820): Disclosure Framework Changes to the Disclosure Requirements for Fair Value Measurement. These amendments modify public and private company fair value disclosure requirements. While some disclosures were removed or modified, others were added. The guidance is a result of the FASB’s test of the principals developed to improve the effectiveness of disclosures in the notes to the financial statements. The amendments were adopted for the quarter ended March 31, 2020; the adoption did not have a material impact on the financial statements and disclosures of the Trust or the Fund.
The FASB issued ASU 2017-13, “Revenue Recognition (Topic 605), Leases (Topic 840), and Leases (Topic 842): Amendments to SEC Paragraphs Pursuant to the Staff Announcement at the July 20, 2017 EITF Meeting and Rescission of Prior SEC Staff Announcements and Observer Comments”. The amendment amends the early adoption date option for certain companies related to adoption of ASU No. 2014-09 and ASU No. 2016-02. The SEC staff stated the SEC would not object to a public business entity that otherwise would not meet the definition of a public business entity except for a requirement to include or the inclusion of its financial statements or financial information in another entity’s filing with the SEC adopting ASC Topic 842 for fiscal years beginning after December 15, 2019, and interim periods within fiscal years beginning after December 15, 2020. The amendments were adopted for the quarter ended September 30, 2020; the adoption did not have a material impact on the financial statements and disclosures of the Trust or the Fund.
Note 4 – Fair Value Measurements
The Fund’s assets and liabilities recorded at fair value have been categorized based upon a fair value hierarchy as described in the Fund’s significant accounting policies in Note 3. The following table presents information about the Fund’s assets and liabilities measured at fair value as of September 30, 2022 and December 31, 2021:
September 30, 2022
Assets: |
| Level 1 |
|
| Level 2 |
|
| Level 3 |
|
| Balance as of September 30, 2022 |
| ||||
Cash Equivalents |
| $ |
|
| $ |
|
| $ |
|
| $ |
| ||||
Commodity Futures Contracts |
|
|
|
|
|
|
|
|
|
|
|
|
|
|
|
|
Corn futures contracts |
|
|
|
|
|
|
|
|
|
| $ |
| ||||
Total |
| $ |
|
| $ |
|
| $ |
|
| $ |
| ||||
|
|
|
|
|
|
|
|
|
|
|
|
|
|
|
|
|
Liabilities |
| Level 1 |
|
| Level 2 |
|
| Level 3 |
|
| Balance as of September 30, 2020 |
| ||||
Commodity Futures Contracts |
|
|
|
|
|
|
|
|
|
|
|
|
|
|
|
|
Corn futures contracts |
| $ |
|
| $ |
|
| $ |
|
| $ |
| ||||
| F-40 |
| Table of Contents |
December 31, 2021
Assets: |
| Level 1 |
|
| Level 2 |
|
| Level 3 |
|
| Balance as of December 31, 2021 |
| ||||
Cash Equivalents |
| $ |
|
| $ |
|
| $ |
|
| $ |
| ||||
Commodity Futures Contracts |
|
|
|
|
|
|
|
|
|
|
|
|
|
|
|
|
Corn futures contracts |
|
|
|
|
|
|
|
|
|
| $ |
| ||||
Total |
| $ |
|
| $ |
|
| $ |
|
| $ |
| ||||
For the three and nine months ended September 30, 2022 and year ended December 31, 2021, the Fund did not have any significant transfers between any of the levels of the fair value hierarchy.
See the Fair Value - Definition and Hierarchy section in Note 3 above for an explanation of the transfers into and out of each level of the fair value hierarchy.
Note 5 – Derivative Instruments and Hedging Activities
In the normal course of business, the Fund utilizes derivative contracts in connection with its proprietary trading activities. Investments in derivative contracts are subject to additional risks that can result in a loss of all or part of an investment. The Fund’s derivative activities and exposure to derivative contracts are classified by the following primary underlying risks: interest rate, credit, commodity price, and equity price risks. In addition to its primary underlying risks, the Fund is also subject to additional counterparty risk due to inability of its counterparties to meet the terms of their contracts. For the three and nine months ended September 30, 2022 and year ended December 31, 2021, the Fund invested only in commodity futures contracts.
Futures Contracts
The Fund is subject to commodity price risk in the normal course of pursuing its investment objectives. A futures contract represents a commitment for the future purchase or sale of an asset at a specified price on a specified date.
The purchase and sale of futures contracts requires margin deposits with an FCM. Subsequent payments (variation margin) are made or received by the Fund each day, depending on the daily fluctuations in the value of the contract, and are recorded as unrealized gains or losses by the Fund. Futures contracts may reduce the Fund’s exposure to counterparty risk since futures contracts are exchange-traded; and the exchange’s clearinghouse, as the counterparty to all exchange-traded futures, guarantees the futures against default.
The Commodity Exchange Act requires an FCM to segregate all customer transactions and assets from the FCM’s proprietary activities. A customer’s cash and other equity deposited with an FCM are considered commingled with all other customer funds subject to the FCM’s segregation requirements. In the event of an FCM’s insolvency, recovery may be limited to the Fund’s pro rata share of segregated customer funds available. It is possible that the recovery amount could be less than the total of cash and other equity deposited.
The following table discloses information about offsetting assets and liabilities presented in the statements of assets and liabilities to enable users of these financial statements to evaluate the effect or potential effect of netting arrangements for recognized assets and liabilities. These recognized assets and liabilities are presented as defined in FASB ASU No. 2011-11 “Balance Sheet (Topic 210): Disclosures about Offsetting Assets and Liabilities” and subsequently clarified in FASB ASU 2013-01 “Balance Sheet (Topic 210): Clarifying the Scope of Disclosures about Offsetting Assets and Liabilities.”
The following table also identifies the fair value amounts of derivative instruments included in the statements of assets and liabilities as derivative contracts, categorized by primary underlying risk, and held by the FCMs, E D & F Man and StoneX as of September 30, 2022, and December 31, 2021.
*The amount of collateral presented in Collateral, Due from Broker, is limited to the liability for the futures contracts and accordingly does not include the excess collateral pledged.
| F-41 |
| Table of Contents |
Offsetting of Financial Assets and Derivative Assets as of September 30, 2022
|
| (i) |
|
| (ii) |
|
| (iii) = (i)-(ii) |
|
| (iv) |
|
| (v)=(iii)-(iv) |
| |||||||||
|
|
|
|
|
|
|
|
|
|
| Gross Amount Not Offset in the Statement of Assets and Liabilities |
|
|
|
| |||||||||
Description |
| Gross Amount of Recognized Assets |
|
| Gross Amount Offset in the Statement of Assets and Liabilities |
|
| Net Amount Presented in the Statement of Assets and Liabilities |
|
| Futures Contracts Available for Offset |
|
| Collateral, Due to Broker |
|
| Net Amount |
| ||||||
Commodity Price |
|
|
|
|
|
|
|
|
|
|
|
|
|
|
|
|
|
| ||||||
Corn futures contracts |
| $ |
|
| $ |
|
| $ |
|
| $ |
|
| $ |
|
| $ |
| ||||||
Offsetting of Financial Liabilities and Derivative Liabilities as of September 30, 2022
|
| (i) |
|
| (ii) |
|
| (iii) = (i)-(ii) |
|
| (iv) |
|
| (v)=(iii)-(iv) |
| |||||||||
|
|
|
|
|
|
|
|
|
|
| Gross Amount Not Offset in the Statement of Assets and Liabilities |
|
|
|
| |||||||||
Description |
| Gross Amount of Recognized Liabilities |
|
| Gross Amount Offset in the Statement of Assets and Liabilities |
|
| Net Amount Presented in the Statement of Assets and Liabilities |
|
| Futures Contracts Available for Offset |
|
| Collateral, Due from Broker* |
|
| Net Amount |
| ||||||
Commodity Price |
|
|
|
|
|
|
|
|
|
|
|
|
|
|
|
|
|
| ||||||
Corn futures contracts |
| $ |
|
| $ |
|
| $ |
|
| $ |
|
| $ |
|
| $ |
| ||||||
Offsetting of Financial Assets and Derivative Assets as of December 31, 2021
|
| (i) |
|
| (ii) |
|
| (iii) = (i)-(ii) |
|
| (iv) |
|
| (v)=(iii)-(iv) |
| |||||||||
|
|
|
|
|
|
|
|
|
|
| Gross Amount Not Offset in the Statement of Assets and Liabilities |
|
|
|
| |||||||||
Description |
| Gross Amount of Recognized Assets |
|
| Gross Amount Offset in the Statement of Assets and Liabilities |
|
| Net Amount Presented in the Statement of Assets and Liabilities |
|
| Futures Contracts Available for Offset |
|
| Collateral, Due to Broker |
|
| Net Amount |
| ||||||
Commodity Price |
|
|
|
|
|
|
|
|
|
|
|
|
|
|
|
|
|
| ||||||
Corn futures contracts |
| $ |
|
| $ |
|
| $ |
|
| $ |
|
| $ |
|
| $ |
| ||||||
The following tables identify the net gain and loss amounts included in the statements of operations as realized and unrealized gains and losses on trading of commodity futures contracts categorized by primary underlying risk:
Three months ended September 30, 2022
|
| Realized Loss on Commodity Futures Contracts |
|
| Net Change in Unrealized Appreciation on Commodity Futures Contracts |
| ||
Commodity Price |
|
|
|
|
|
| ||
Corn futures contracts |
| $ | ( | ) |
| $ |
| |
Three months ended September 30, 2021
|
| Realized Gain on Commodity Futures Contracts |
|
| Net Change in Unrealized Depreciation on Commodity Futures Contracts |
| ||
Commodity Price |
|
|
|
|
|
| ||
Corn futures contracts |
| $ |
|
| $ | ( | ) | |
| F-42 |
| Table of Contents |
Nine months ended September 30, 2022
|
| Realized Gain on Commodity Futures Contracts |
|
| Net Change in Unrealized Depreciation on Commodity Futures Contracts |
| ||
Commodity Price |
|
|
|
|
|
| ||
Corn futures contracts |
| $ |
|
| $ | ( | ) | |
Nine months ended September 30, 2021
|
| Realized Gain on Commodity Futures Contracts |
|
| Net Change in Unrealized Depreciation on Commodity Futures Contracts |
| ||
Commodity Price |
|
|
|
|
|
| ||
Corn futures contracts |
| $ |
|
| $ | ( | ) | |
Volume of Derivative Activities
The average notional market value categorized by primary underlying risk for the futures contracts held was $
Note 6 – Financial Highlights
The following tables present per unit performance data and other supplemental financial data for the three and nine months ended September 30, 2022 and 2021. This information has been derived from information presented in the financial statements and is presented with total expenses gross of expenses waived by the Sponsor and with total expenses net of expenses waived by the Sponsor, as appropriate.
|
| Three months ended | Three months ended |
|
| Nine months ended | Nine months ended |
| ||||||||
|
| September 30, 2022 |
|
| September 30, 2021 |
|
| September 30, 2022 |
|
| September 30, 2021 |
| ||||
Per Share Operation Performance |
|
|
|
|
|
|
|
|
|
|
|
| ||||
Net asset value at beginning of period |
| $ |
|
| $ |
|
| $ |
|
| $ |
| ||||
Income from investment operations: |
|
|
|
|
|
|
|
|
|
|
|
|
|
|
|
|
Investment income |
|
|
|
|
|
|
|
|
|
|
|
| ||||
Net realized and unrealized gain on commodity futures contracts |
|
|
|
|
|
|
|
|
|
|
|
| ||||
Total expenses, net |
|
| ( | ) |
|
| ( | ) |
|
| ( | ) |
|
| ( | ) |
Net increase (decrease) in net asset value |
|
|
|
|
| ( | ) |
|
|
|
|
|
| |||
Net asset value at end of period |
| $ |
|
| $ |
|
| $ |
|
| $ |
| ||||
Total Return |
|
| % |
|
| ( | )% |
|
| % |
|
| % | |||
Ratios to Average Net Assets (Annualized) |
|
|
|
|
|
|
|
|
|
|
|
|
|
|
|
|
Total expenses |
|
| % |
|
| % |
|
| % |
|
| % | ||||
Total expenses, net |
|
| % |
|
| % |
|
| % |
|
| % | ||||
Net investment income (loss) |
|
| % |
|
| ( | )% |
|
| ( | )% |
|
| ( | )% | |
The financial highlights per share data are calculated consistent with the methodology used to calculate asset-based fees and expenses.
Note 7 – Organizational and Offering Costs
Expenses incurred in organizing of the Trust and the initial offering of the Shares of the Fund, including applicable SEC registration fees were borne directly by the Sponsor. The Fund will not be obligated to reimburse the Sponsor.
Note 8 – Subsequent Events
Management has evaluated the financial statements for the quarter-ended September 30, 2022 for subsequent events through the date of this filing and noted no material events requiring either recognition through the date of the filing or disclosure herein for the Fund.
| F-43 |
| Table of Contents |
TEUCRIUM SOYBEAN FUND
STATEMENTS OF ASSETS AND LIABILITIES
|
| September 30, 2022 |
|
| December 31, 2021 |
| ||
|
| (Unaudited) |
|
|
| |||
Assets |
|
|
|
|
|
| ||
Cash and cash equivalents |
| $ |
|
| $ |
| ||
Interest receivable |
|
|
|
|
|
| ||
Equity in trading accounts: |
|
|
|
|
|
|
|
|
Commodity futures contracts |
|
|
|
|
|
| ||
Due from broker |
|
|
|
|
|
| ||
Total equity in trading accounts |
|
|
|
|
|
| ||
Total assets |
|
|
|
|
|
| ||
|
|
|
|
|
|
|
|
|
Liabilities |
|
|
|
|
|
|
|
|
Management fee payable to Sponsor |
|
|
|
|
|
| ||
Other liabilities |
|
|
|
|
|
| ||
Equity in trading accounts: |
|
|
|
|
|
|
|
|
Commodity futures contracts |
|
|
|
|
|
| ||
Due to broker |
|
|
|
|
|
| ||
Total equity in trading accounts |
|
|
|
|
|
| ||
Total liabilities |
|
|
|
|
|
| ||
|
|
|
|
|
|
|
|
|
Net assets |
| $ |
|
| $ |
| ||
|
|
|
|
|
|
|
|
|
Shares outstanding |
|
|
|
|
|
| ||
|
|
|
|
|
|
|
|
|
Shares authorized |
| * |
|
|
|
| ||
|
|
|
|
|
|
|
|
|
Net asset value per share |
| $ |
|
| $ |
| ||
|
|
|
|
|
|
|
|
|
Market value per share |
| $ |
|
| $ |
| ||
* On April 7, 2022, the Teucrium Soybean Fund registered an indeterminate number of shares of the Fund pursuant to Rule 456(d) under the Securities Act of 1933.
The accompanying notes are an integral part of these financial statements.
| F-44 |
| Table of Contents |
TEUCRIUM SOYBEAN FUND
SCHEDULE OF INVESTMENTS
September 30, 2022
(Unaudited)
|
|
|
| Percentage of |
| |||||||
Description: Assets |
| Fair Value |
|
| Net Assets |
|
| Shares |
| |||
|
|
|
|
|
|
|
|
|
| |||
Cash equivalents |
|
|
|
|
|
|
|
|
| |||
Money market funds |
|
|
|
|
|
|
|
|
| |||
First American Funds - Government Obligations Fund - Class X (cost $17,432,839) |
| $ |
|
|
| % |
|
|
| |||
Goldman Sachs Financial Square Government Fund - Institutional Class (cost: $10,736,820) |
|
|
|
|
|
|
|
|
| |||
Total money market funds (cost: $28,169,659) |
| $ |
|
|
| % |
|
|
|
| ||
|
|
|
|
|
|
|
|
|
|
|
|
|
|
|
|
|
|
|
|
|
|
| Principal Amount |
| |
Commercial Paper |
|
|
|
|
|
|
|
|
|
|
|
|
American Electric Power Company, Inc. 3.465% (cost: $2,491,663 due 11/03/2022) |
| $ |
|
|
| % |
|
|
| |||
Brookfield Infrastructure Holdings (Canada) Inc. 3.540% (cost: $4,973,750 due 11/15/2022) |
|
|
|
|
|
|
|
|
| |||
Crown Castle Inc. 3.234% (cost: $2,487,555 due 11/10/2022) |
|
|
|
|
|
|
|
|
| |||
Entergy Corporation 3.030% (cost: $2,487,500 due 11/14/2022) |
|
|
|
|
|
|
|
|
| |||
General Motors Financial Company, Inc. 2.929% (cost: $2,485,903 due 10/14/2022) |
|
|
|
|
|
|
|
|
| |||
Glencore Funding LLC 2.898% (cost: $2,487,444 due 10/18/2022) |
|
|
|
|
|
|
|
|
| |||
Harley-Davidson Financial Services, Inc. 3.029% (cost: $6,671,525 due 10/05/2022) |
|
|
|
|
|
|
|
|
| |||
Harley-Davidson Financial Services, Inc. 3.487% (cost: $2,489,698 due 11/03/2022) |
|
|
|
|
|
|
|
|
| |||
ONEOK, Inc. 3.158% (cost: $2,493,914 due 10/14/2022) |
|
|
|
|
|
|
|
|
| |||
PVH Corp. 3.535% (cost: $2,493,681 due 10/19/2022) |
|
|
|
|
|
|
|
|
| |||
Total Commercial Paper (cost: $31,562,633) |
| $ |
|
|
| % |
|
|
|
| ||
Total Cash Equivalents |
| $ |
|
|
| % |
|
|
|
| ||
|
|
|
|
|
|
|
|
|
|
|
|
|
|
|
|
|
|
| Percentage of |
|
| Notional Amount |
| ||
Description: Liabilities |
| Fair Value |
|
| Net Assets |
|
| (Long Exposure) |
| |||
|
|
|
|
|
|
|
|
|
|
|
|
|
Commodity futures contracts |
|
|
|
|
|
|
|
|
|
|
|
|
United States soybean futures contracts |
|
|
|
|
|
|
|
|
|
|
|
|
CBOT soybean futures JAN23 (339 contracts) |
| $ |
|
|
| % |
| $ |
| |||
CBOT soybean futures MAR23 (290 contracts) |
|
|
|
|
|
|
|
|
| |||
CBOT soybean futures NOV23 (356 contracts) |
|
|
|
|
|
|
|
|
| |||
Total commodity futures contracts |
| $ |
|
|
| % |
| $ |
| |||
The accompanying notes are an integral part of these financial statements.
| F-45 |
| Table of Contents |
TEUCRIUM SOYBEAN FUND
SCHEDULE OF INVESTMENTS
December 31, 2021
|
|
|
|
| Percentage of |
|
|
|
| |||
Description: Assets |
| Fair Value |
|
| Net Assets |
|
| Shares |
| |||
|
|
|
|
|
|
|
|
|
| |||
Cash equivalents |
|
|
|
|
|
|
|
|
| |||
Money market funds |
|
|
|
|
|
|
|
|
| |||
First American Government Obligations Fund - Class X 0.026% (cost $8,951,314) |
| $ |
|
|
| % |
|
|
| |||
Goldman Sachs Financial Square Government Fund - Institutional Class 0.030% (cost $2,511,180) |
|
|
|
|
|
|
|
|
| |||
Total money market funds (cost: $11,462,494) |
|
|
|
|
|
|
|
|
|
| ||
|
|
|
|
|
|
|
|
|
|
|
|
|
|
|
|
|
|
|
|
|
|
| Principal Amount |
| |
Commercial Paper |
|
|
|
|
|
|
|
|
|
|
|
|
Albemarle Corporation 0.200% (cost: $2,499,417 due 01/11/2022) |
| $ |
|
|
| % |
|
|
| |||
Conagra Brands, Inc. 0.160% (cost: $2,499,000 due 01/05/2022) |
|
|
|
|
|
|
|
|
| |||
Conagra Brands, Inc. 0.150% (cost: $2,499,355 due 01/18/2022) |
|
|
|
|
|
|
|
|
| |||
General Motors Financial Company, Inc. 0.200% (cost: $3,998,044 due 01/31/2022) |
|
|
|
|
|
|
|
|
| |||
General Motors Financial Company, Inc. 0.160% (cost: $2,499,400 due 01/03/2022) |
|
|
|
|
|
|
|
|
| |||
Harley-Davidson Financial Services, Inc. 0.170% (cost: $2,498,938 due 02/01/2022) |
|
|
|
|
|
|
|
|
| |||
Viatris Inc. 0.300% (cost: $2,498,312 due 02/11/2022) |
|
|
|
|
|
|
|
|
| |||
Viatris Inc. 0.200% (cost: $2,499,292 due 01/21/2022) |
|
|
|
|
|
|
|
|
| |||
Total Commercial Paper (cost: $21,491,758) |
| $ |
|
|
| % |
|
|
|
| ||
Total Cash Equivalents |
| $ |
|
|
| % |
|
|
|
| ||
|
|
|
|
|
|
|
|
|
|
|
|
|
|
|
|
|
|
|
|
|
|
| Notional Amount |
| |
|
|
|
|
|
|
|
|
|
| (Long Exposure) |
| |
Commodity futures contracts |
|
|
|
|
|
|
|
|
|
|
|
|
United States soybean futures contracts |
|
|
|
|
|
|
|
|
|
|
|
|
CBOT soybean futures MAR22 (234 contracts) |
| $ |
|
|
| % |
| $ |
| |||
CBOT soybean futures MAY22 (199 contracts) |
|
|
|
|
|
|
|
|
| |||
CBOT soybean futures NOV22 (250 contracts) |
|
|
|
|
|
|
|
|
| |||
Total commodity futures contracts |
| $ |
|
|
| % |
| $ |
| |||
The accompanying notes are an integral part of these financial statements.
| F-46 |
| Table of Contents |
TEUCRIUM SOYBEAN FUND
STATEMENTS OF OPERATIONS
(Unaudited)
|
| Three months ended |
|
| Three months ended |
|
| Nine months ended |
|
| Nine months ended |
| ||||
|
| September 30, 2022 |
|
| September 30, 2021 |
|
| September 30, 2022 |
|
| September 30, 2021 |
| ||||
Income |
|
|
|
|
|
|
|
|
|
|
|
| ||||
Realized and unrealized gain (loss) on trading of commodity futures contracts: |
|
|
|
|
|
|
|
|
|
|
|
| ||||
Realized gain on commodity futures contracts |
| $ |
|
| $ |
|
| $ |
|
| $ |
| ||||
Net change in unrealized depreciation on commodity futures contracts |
|
| ( | ) |
|
| ( | ) |
|
| ( | ) |
|
| ( | ) |
Interest income |
|
|
|
|
|
|
|
|
|
|
|
| ||||
Total (loss) income |
|
| ( | ) |
|
| ( | ) |
|
|
|
|
|
| ||
|
|
|
|
|
|
|
|
|
|
|
|
|
|
|
|
|
Expenses |
|
|
|
|
|
|
|
|
|
|
|
|
|
|
|
|
Management fees |
|
|
|
|
|
|
|
|
|
|
|
| ||||
Professional fees |
|
|
|
|
|
|
|
|
|
|
|
| ||||
Distribution and marketing fees |
|
|
|
|
|
|
|
|
|
|
|
| ||||
Custodian fees and expenses |
|
|
|
|
|
|
|
|
|
|
|
| ||||
Business permits and licenses fees |
|
|
|
|
|
|
|
|
|
|
|
| ||||
General and administrative expenses |
|
|
|
|
|
|
|
|
|
|
|
| ||||
Total expenses |
|
|
|
|
|
|
|
|
|
|
|
| ||||
|
|
|
|
|
|
|
|
|
|
|
|
|
|
|
|
|
Expenses waived by the Sponsor |
|
|
|
|
| ( | ) |
|
| ( | ) |
|
| ( | ) | |
|
|
|
|
|
|
|
|
|
|
|
|
|
|
|
|
|
Total expenses, net |
|
|
|
|
|
|
|
|
|
|
|
| ||||
|
|
|
|
|
|
|
|
|
|
|
|
|
|
|
|
|
Net (loss) income |
| $ | ( | ) |
| $ | ( | ) |
| $ |
|
| $ |
| ||
|
|
|
|
|
|
|
|
|
|
|
|
|
|
|
|
|
Net (loss) gain per share |
| $ | ( | ) |
| $ | ( | ) |
| $ |
|
| $ |
| ||
Net (loss) income per weighted average share |
| $ | ( | ) |
| $ | ( | ) |
| $ |
|
| $ |
| ||
Weighted average shares outstanding |
|
|
|
|
|
|
|
|
|
|
|
| ||||
The accompanying notes are an integral part of these financial statements.
| F-47 |
| Table of Contents |
TEUCRIUM SOYBEAN FUND
STATEMENTS OF CHANGES IN NET ASSETS
(Unaudited)
|
| Nine months ended |
|
| Nine months ended |
| ||
|
| September 30, 2022 |
|
| September 30, 2021 |
| ||
Operations |
|
|
|
|
|
| ||
Net income |
| $ |
|
| $ |
| ||
Capital transactions |
|
|
|
|
|
|
|
|
Issuance of Shares |
|
|
|
|
|
| ||
Redemption of Shares |
|
| ( | ) |
|
| ( | ) |
Total capital transactions |
|
|
|
|
| ( | ) | |
Net change in net assets |
|
|
|
|
| ( | ) | |
|
|
|
|
|
|
|
|
|
Net assets, beginning of period |
| $ |
|
| $ |
| ||
|
|
|
|
|
|
|
|
|
Net assets, end of period |
| $ |
|
| $ |
| ||
|
|
|
|
|
|
|
|
|
Net asset value per share at beginning of period |
| $ |
|
| $ |
| ||
|
|
|
|
|
|
|
|
|
Net asset value per share at end of period |
| $ |
|
| $ |
| ||
|
|
|
|
|
|
|
|
|
Creation of Shares |
|
|
|
|
|
| ||
Redemption of Shares |
|
|
|
|
|
| ||
The accompanying notes are an integral part of these financial statements.
| F-48 |
| Table of Contents |
TEUCRIUM SOYBEAN FUND
STATEMENTS OF CASH FLOWS
(Unaudited)
|
| Nine months ended |
|
| Nine months ended |
| ||
|
| September 30, 2022 |
|
| September 30, 2021 |
| ||
Cash flows from operating activities: |
|
|
|
|
|
| ||
Net income |
| $ |
|
| $ |
| ||
Adjustments to reconcile net income to net cash provided by operating activities: |
|
|
|
|
|
|
|
|
Net change in unrealized depreciation on commodity futures contracts |
|
|
|
|
|
| ||
Changes in operating assets and liabilities: |
|
|
|
|
|
|
|
|
Due from broker |
|
| ( | ) |
|
| ( | ) |
Interest receivable |
|
| ( | ) |
|
|
| |
Other assets |
|
|
|
|
|
| ||
Payable for purchases of commercial paper |
|
|
|
|
| ( | ) | |
Due to broker |
|
| ( | ) |
|
| ( | ) |
Management fee payable to Sponsor |
|
|
|
|
| ( | ) | |
Other liabilities |
|
| ( | ) |
|
|
| |
Net cash provided by operating activities |
|
|
|
|
|
| ||
|
|
|
|
|
|
|
|
|
Cash flows from financing activities: |
|
|
|
|
|
|
|
|
Proceeds from sale of Shares |
|
|
|
|
|
| ||
Redemption of Shares |
|
| ( | ) |
|
| ( | ) |
Net cash provided by (used in) financing activities |
|
|
|
|
| ( | ) | |
|
|
|
|
|
|
|
|
|
Net change in cash and cash equivalents |
|
|
|
|
| ( | ) | |
Cash and cash equivalents beginning of period |
|
|
|
|
|
| ||
Cash and cash equivalents end of period |
| $ |
|
| $ |
| ||
The accompanying notes are an integral part of these financial statements.
| F-49 |
| Table of Contents |
NOTES TO FINANCIAL STATEMENTS
September 30, 2022
(Unaudited)
Note 1 – Organization and Operation
Teucrium Soybean Fund (referred to herein as “SOYB” or the “Fund”) is a commodity pool that is a series of Teucrium Commodity Trust (“Trust”), a Delaware statutory trust formed on September 11, 2009. The Fund issues common units, called the “Shares,” representing fractional undivided beneficial interests in the Fund. The Fund continuously offers Creation Baskets consisting of
The investment objective of SOYB is to have the daily changes in the NAV of the Fund’s Shares reflect the daily changes in the soybean market for future delivery as measured by the Benchmark. The Benchmark is a weighted average of the closing settlement prices for three futures contracts for soybeans (“Soybean Futures Contracts”) that are traded on the Chicago Board of Trade (“CBOT”):
SOYB Benchmark
CBOT Soybean Futures Contract |
| Weighting |
| |
Second to expire (excluding August & September) |
|
| % | |
Third to expire (excluding August & September) |
|
| % | |
Expiring in the November following the expiration of the third to expire contract |
|
| % | |
The Fund commenced investment operations on September 19, 2011 and has a fiscal year ending December 31. The Fund’s sponsor is Teucrium Trading, LLC (the “Sponsor”). The Sponsor is responsible for the management of the Fund. The Sponsor is registered as a commodity pool operator (“CPO”) and a commodity trading adviser (“CTA”) with the Commodity Futures Trading Commission (“CFTC”) and is a member of the National Futures Association (“NFA”).
On June 13, 2011, the initial Form S-1 for SOYB was declared effective by the SEC. On September 16, 2011, two Creation Baskets were issued representing
The accompanying unaudited financial statements have been prepared in accordance with Rule 10-01 of Regulation S-X promulgated by the SEC and, therefore, do not include all information and footnote disclosures required under accounting principles generally accepted in the United States of America (“GAAP”). The financial information included herein is unaudited; however, such financial information reflects all adjustments which are, in the opinion of management, necessary for the fair presentation of the Fund’s financial statements for the interim period. It is suggested that these interim financial statements be read in conjunction with the financial statements and related notes included in the Trust’s Annual Report on Form 10-K, as well as the most recent Form S-1 filing, as applicable. The operating results for the three and nine months ended September 30, 2022 are not necessarily indicative of the results to be expected for the full year ending December 31, 2022.
| F-50 |
| Table of Contents |
Subject to the terms of the Trust Agreement, Teucrium Trading, LLC, in its capacity as the Sponsor (“Sponsor”), may terminate a Fund at any time, regardless of whether the Fund has incurred losses, including, for instance, if it determines that the Fund’s aggregate net assets in relation to its operating expenses make the continued operation of the Fund unreasonable or imprudent. However, no level of losses will require the Sponsor to terminate a Fund.
Note 2 – Principal Contracts and Agreements
The Sponsor employs U.S. Bancorp Fund Services, LLC, doing business as U.S. Bank Global Fund Services (“Global Fund Services”), for Transfer Agency, Fund Accounting and Fund Administration services. The principal address for Global Fund Services is 615 E. Michigan Street, Milwaukee, WI 53202.
The Sponsor employs Foreside Fund Services, LLC (“Foreside” or the “Distributor”) as the Distributor for the Funds. The Distribution Services Agreement among the Distributor and the Sponsor calls for the Distributor to work with the Custodian in connection with the receipt and processing of orders for Creation Baskets and Redemption Baskets and the review and approval of all Fund sales literature and advertising materials. The Distributor and the Sponsor have also entered into a Securities Activities and Service Agreement (the “SASA”) under which certain employees and officers of the Sponsor are licensed as registered representatives or registered principals of the Distributor, under Financial Industry Regulatory Authority (“FINRA”) rules.
E D & F Man Capital Markets, Inc. (“E D & F Man”) and StoneX Financial Inc. (“StoneX”) serve as the Funds’ clearing brokers to execute and clear futures contracts and provide other brokerage-related services. E D & F Man and StoneX are each registered as futures commission merchants (“FCM”) with the U.S. CFTC and are members of the NFA. The clearing brokers are registered as broker-dealers with the SEC and are each a member of FINRA. ED & F Man and StoneX are each clearing members of ICE Futures U.S., Inc., Chicago Board of Trade, Chicago Mercantile Exchange, New York Mercantile Exchange, and all other major United States commodity exchanges. For Corn, Soybean, Sugar, and Wheat Futures Contracts E D & F Man is paid
The sole Trustee of the Trust is Wilmington Trust Company, a Delaware banking corporation. The Trustee will accept service of legal process on the Trust in the State of Delaware and will make certain filings under the Delaware Statutory Trust Act. For its services, the Trustee receives an annual fee of $3,300 from the Trust. These services are recorded in business permits and licenses fees on the statements of operations. A summary of these expenses is included below.
| F-51 |
| Table of Contents |
The Sponsor employs Thales Capital Partners LLC (“Thales”) for distribution and solicitation-related services.
|
| Three months ended September 30, 2022 |
|
| Three months ended September 30, 2021 |
|
| Nine months ended September 30, 2022 |
|
| Nine months ended September 30, 2021 |
| ||||
Amount Recognized for Custody Services |
| $ |
|
| $ |
|
| $ |
|
| $ |
| ||||
Amount of Custody Services Waived |
| $ |
|
| $ |
|
| $ |
|
| $ |
| ||||
|
|
|
|
|
|
|
|
|
|
|
|
|
|
|
|
|
Amount Recognized for Distribution Services |
| $ |
|
| $ |
|
| $ |
|
| $ |
| ||||
Amount of Distribution Services Waived |
| $ |
|
| $ |
|
| $ |
|
| $ |
| ||||
|
|
|
|
|
|
|
|
|
|
|
|
|
|
|
|
|
Amount Recognized for Wilmington Trust |
| $ |
|
| $ |
|
| $ |
|
| $ |
| ||||
Amount of Wilmington Trust Waived |
| $ |
|
| $ |
|
| $ |
|
| $ |
| ||||
|
|
|
|
|
|
|
|
|
|
|
|
|
|
|
|
|
Amount Recognized for Thales |
| $ |
|
| $ |
|
| $ |
|
| $ |
| ||||
Amount of Thales Waived |
| $ |
|
| $ |
|
| $ |
|
| $ |
| ||||
Note 3 – Summary of Significant Accounting Policies
Basis of Presentation
The accompanying financial statements have been prepared in accordance with accounting principles generally accepted in the United States of America (“U.S. GAAP”) as detailed in the Financial Accounting Standards Board’s Accounting Standards Codification.
Revenue Recognition
Commodity futures contracts are recorded on the trade date. All such transactions are recorded on the identified cost basis and marked to market daily. Unrealized appreciation or depreciation on commodity futures contracts are reflected in the statements of operations as the difference between the original contract amount and the fair market value as of the last business day of the year or as of the last date of the financial statements. Changes in the appreciation or depreciation between periods are reflected in the statements of operations. The Fund seeks to earn interest on its assets denominated in U.S. dollars on deposits with the Futures Commission Merchant. In addition, the Fund seeks to earn interest on funds held at the custodian and other financial institutions at prevailing market rates for such investments.
The Sponsor invests a portion of cash in commercial paper, which is deemed a cash equivalent based on the rating and duration of contracts as described in the notes to the financial statements and reflected in cash and cash equivalents on the statements of assets and liabilities and on the statements of cash flows. Accretion on these investments is recognized using the effective interest method in U.S. dollars and included in interest income on the statements of operations.
The Sponsor invests a portion of the cash held by the broker in short term Treasury Bills as collateral for open futures contracts. Accretion on these investments is recognized using the effective interest method in U.S. dollars and included in interest income on the statements of operations.
| F-52 |
| Table of Contents |
Brokerage Commissions
the Sponsor recognizes the expense for brokerage commissions for futures contract trades on a per-trade basis. The below table shows the amounts included on the statements of operations as total brokerage commissions paid inclusive of unrealized loss for the three and nine months ended September 30, 2022.
|
| SOYB |
| |
Three Months Ended September 30, 2022 |
| $ | 6,432 |
|
Three Months Ended September 30, 2021 |
| $ | 4,833 |
|
Nine Months Ended September 30, 2022 |
| $ | 21,638 |
|
Nine Months Ended September 30, 2021 |
| $ | 26,568 |
|
Income Taxes
For federal income tax purposes, each Fund will be treated as a publicly traded partnership. A publicly traded partnership is generally treated as a corporation for federal income tax purposes unless 90% or more of the publicly traded partnership’s gross income for each taxable year of its existence consists of qualifying income as defined in section 7704(d) of the Internal Revenue Code of 1986, as amended. Qualifying income is defined as generally including, in pertinent part, interest (other than from a financial business), dividends, and gains from the sale or disposition of capital assets held for the production of interest or dividends. In the case of a partnership of which a principal activity is the buying and selling of commodities, other than as inventory, or of futures, forwards and options with respect to commodities, qualifying income also includes income and gains from commodities and from futures, forwards, options with respect to commodities and, provided the partnership is a trader or investor with respect to such assets, swaps and other notional principal contracts with respect to commodities. The Fund expects that at least 90% of the Fund’s gross income for each taxable year will consist of qualifying income and that the Fund will be taxed as a partnership for federal income tax purposes. The Fund does not record a provision for income taxes because the shareholders report their share of the Fund’s income or loss on their income tax returns. The financial statements reflect the Fund’s transactions without adjustment, if any, required for income tax purposes.
The Fund is required to determine whether a tax position is more likely than not to be sustained upon examination by the applicable taxing authority, including resolution of any related appeals or litigation processes, based on the technical merits of the position. The Fund files an income tax return in the U.S. federal jurisdiction and may file income tax returns in various U.S. states and foreign jurisdictions. For all tax years 2019 to 2021, the Fund remains subject to income tax examinations by major taxing authorities. The tax benefit recognized is measured as the largest amount of benefit that has a greater than fifty percent likelihood of being realized upon ultimate settlement. De-recognition of a tax benefit previously recognized results in the Fund recording a tax liability that reduces net assets. Based on its analysis, the Fund has determined that it has not incurred any liability for unrecognized tax benefits as of September 30, 2022 and for the years ended December 31, 2021, 2020, and 2019. However, the Fund’s conclusions regarding this policy may be subject to review and adjustment at a later date based on factors including, but not limited to, ongoing analysis of and changes to tax laws, regulations, and interpretations thereof.
The Fund recognizes interest accrued related to unrecognized tax benefits and penalties related to unrecognized tax benefits in income tax fees payable, if assessed. No interest expense or penalties have been recognized as of and for the three and nine months ended September 30, 2022 and 2021.
The Fund may be subject to potential examination by U.S. federal, U.S. state, or foreign jurisdictional authorities in the area of income taxes. These potential examinations may include questioning the timing and amount of deductions, the nexus of income among various tax jurisdictions, and compliance with U.S. federal, U.S. state and foreign tax laws.
| F-53 |
| Table of Contents |
Creations and Redemptions
Authorized Purchasers may purchase Creation Baskets consisting of 25,000 shares from the Fund. The amount of the proceeds required to purchase a Creation Basket will be equal to the NAV of the shares in the Creation Basket determined as of 4:00 p.m. (ET) on the day the order to create the basket is received in good order.
Authorized Purchasers may redeem shares from the Fund only in blocks of 25,000 shares called “Redemption Baskets.” The amount of the redemption proceeds for a Redemption Basket will be equal to the NAV of the shares in the Redemption Basket determined as of 4:00 p.m. (ET) on the day the order to redeem the basket is received in good order.
The Fund receives or pays the proceeds from shares sold or redeemed within three business days after the trade date of the purchase or redemption. The amounts due from Authorized Purchasers are reflected in the Fund’s statements of assets and liabilities as capital shares receivable. Amounts payable to Authorized Purchasers upon redemption are reflected in the Fund’s statements of assets and liabilities as payable for shares redeemed.
As outlined in the most recent Form S-1 filing, 50,000 shares represent two Redemption Baskets for the Fund and a minimum level of shares. If the Fund experienced redemptions that caused the number of Shares outstanding to decrease to the minimum level of Shares required to be outstanding, until the minimum number of Shares is again exceeded through the purchase of a new Creation Basket, there can be no more redemptions by an Authorized Purchaser.
Allocation of Shareholder Income and Losses
Profit or loss is allocated among the shareholders of the Fund in proportion to the number of shares each shareholder holds as of the close of each month.
Cash and Cash Equivalents
Cash equivalents are highly liquid investments with maturity dates of 90 days or less when acquired. The Trust reported its cash equivalents in the statements of assets and liabilities at market value, or at carrying amounts that approximate fair value, because of their highly liquid nature and short-term maturities. Each Fund that is a series of the Trust has the balance of its cash equivalents on deposit with financial institutions. The Fund holds a balance in money market funds that is included in cash and cash equivalents on the statements of assets and liabilities. The Sponsor invests a portion of the available cash for the Funds in alternative demand deposit savings accounts, which is classified as cash and not as cash equivalents. Assets deposited with the bank may, at times, exceed federally insured limits. The Sponsor invests a portion of the available cash for the Funds in investment grade commercial paper with durations of 90 days or less, which is classified as a cash equivalent and is not FDIC insured. The Sponsor may invest a portion of the cash held by the FCM in short term Treasury Bills as collateral for open futures contracts, which is classified as a cash equivalent and is not FDIC insured.
|
| September 30, 2022 |
|
| December 31, 2021 |
| ||
| Money Market Funds |
| $ |
|
| $ |
| ||
| Demand Deposit Savings Accounts |
|
|
|
|
|
| ||
| Commercial Paper |
|
|
|
|
|
| ||
| Total cash and cash equivalents as presented on the Statement of Assets and Liabilities |
| $ |
|
| $ |
| ||
| F-54 |
| Table of Contents |
Payable for Purchases of Commercial Paper
The amount recorded by the Fund for commercial paper transactions awaiting settlement, represents the amount payable for contracts purchased but not yet settled as of the reporting date. The value of the contract is included in cash and cash equivalents, and the payable amount is included as a liability.
Due from/to Broker
The amount recorded by the Fund for the amount due from and to the clearing broker includes, but is not limited to, cash held by the broker, amounts payable to the clearing broker related to open transactions, payables for commodities futures accounts liquidating to an equity balance on the clearing broker’s records and amounts of brokerage commissions paid and recognized as unrealized losses.
Margin is the minimum amount of funds that must be deposited by a commodity interest trader with the trader’s broker to initiate and maintain an open position in futures contracts. A margin deposit acts to assure the trader’s performance of the futures contracts purchased or sold. Futures contracts are customarily bought and sold on initial margin that represents a very small percentage of the aggregate purchase or sales price of the contract. Because of such low margin requirements, price fluctuations occurring in the futures markets may create profits and losses that, in relation to the amount invested, are greater than customary in other forms of investment or speculation. As discussed below, adverse price changes in the futures contract may result in margin requirements that greatly exceed the initial margin. In addition, the amount of margin required in connection with a particular futures contract is set from time to time by the exchange on which the contract is traded and may be modified from time to time by the exchange during the term of the contract. Brokerage firms, such as the Fund’s clearing brokers, carrying accounts for traders in commodity interest contracts generally require higher amounts of margin as a matter of policy to further protect themselves. Over the counter trading generally involves the extension of credit between counterparties, so the counterparties may agree to require the posting of collateral by one or both parties to address credit exposure.
When a trader purchases an option, there is no margin requirement; however, the option premium must be paid in full. When a trader sells an option, on the other hand, he or she is required to deposit margin in an amount determined by the margin requirements established for the underlying interest and, in addition, an amount substantially equal to the current premium for the option. The margin requirements imposed on the selling of options, although adjusted to reflect the probability that out-of-the-money options will not be exercised, can in fact be higher than those imposed in dealing in the futures markets directly. Complicated margin requirements apply to spreads and conversions, which are complex trading strategies in which a trader acquires a mixture of options positions and positions in the underlying interest.
Ongoing or “maintenance” margin requirements are computed each day by a trader’s clearing broker. When the market value of a particular open futures contract changes to a point where the margin on deposit does not satisfy maintenance margin requirements, a margin call is made by the broker. If the margin call is not met within a reasonable time, the broker may close out the trader’s position. With respect to the Fund’s trading, the Fund (and not its shareholders personally) is subject to margin calls.
Finally, many major U.S. exchanges have passed certain cross margining arrangements involving procedures pursuant to which the futures and options positions held in an account would, in the case of some accounts, be aggregated and margin requirements would be assessed on a portfolio basis, measuring the total risk of the combined positions.
Calculation of Net Asset Value
The Fund’s NAV is calculated by:
| • | Taking the current market value of its total assets and |
| • | Subtracting any liabilities. |
| F-55 |
| Table of Contents |
The administrator, Global Fund Services, calculates the NAV of the Fund once each trading day. It calculates the NAV as of the earlier of the close of the NYSE or 4:00 p.m. (ET). The NAV for a particular trading day is released after 4:15 p.m. (ET).
In determining the value of Soybean Futures Contracts, the administrator uses the CBOT closing price. The administrator determines the value of all other Fund investments as of the earlier of the close of the NYSE or 4:00 p.m. (ET). The value of over-the-counter soybean interests is determined based on the value of the commodity or futures contract underlying such soybean interest, except that a fair value may be determined if the Sponsor believes that the Fund is subject to significant credit risk relating to the counterparty to such soybean interest. For purposes of financial statements and reports, the Sponsor will recalculate the NAV where necessary to reflect the “fair value” of a Futures Contract when the Futures Contract closes at its price fluctuation limit for the day. Short term Treasury securities held by the Fund are valued by the administrator using values received from recognized third-party vendors and dealer quotes. NAV includes any unrealized profit or loss on open soybean interests and any other income or expense accruing to the Fund but unpaid or not received by the Fund.
Sponsor Fee, Allocation of Expenses and Related Party Transactions
The Sponsor is responsible for investing the assets of the Fund in accordance with the objectives and policies of the Fund. In addition, the Sponsor arranges for one or more third parties to provide administrative, custodial, accounting, transfer agency and other necessary services to the Trust and the Funds. In addition, the Sponsor has elected not to outsource services directly attributable to the Trust and the Funds such as accounting, financial reporting, regulatory compliance, and trading activities, which the Sponsor performs itself. In addition, the Fund is contractually obligated to pay a monthly management fee to the Sponsor, based on average daily net assets, at a rate equal to 1.00% per annum.
The Fund pays for all brokerage fees, taxes, and other expenses, including licensing fees for the use of intellectual property, registration or other fees paid to the SEC, FINRA, or any other regulatory agency in connection with the offer and sale of subsequent Shares after its initial registration and all legal, accounting, printing and other expenses associated therewith. The Fund also pays its portion of the fees and expenses associated with the Trust’s tax accounting and reporting requirements. Certain aggregate expenses common to all Funds within the Trust are allocated by the Sponsor to the respective Fund based on activity drivers deemed most appropriate by the Sponsor for such expenses, including but not limited to relative assets under management and creation order activity. These aggregate common expenses include, but are not limited to, legal, auditing, accounting and financial reporting, tax-preparation, regulatory compliance, trading activities, and insurance costs, as well as fees paid to the Distributor, which are included in the related line item in the statements of operations. A portion of these aggregate common expenses are related to the Sponsor or related parties of principals of the Sponsor; these are necessary services to the Funds, which are primarily the cost of performing accounting and financial reporting, regulatory compliance, and trading activities that are directly attributable to the Fund. Such expenses are primarily recorded as distribution and marketing fees in the financial statements of each Fund.
|
| Three months ended September 30, 2022 |
|
| Three months ended September 30, 2021 |
|
| Nine months ended September 30, 2022 |
|
| Nine months ended September 30, 2021 |
| ||||
Recognized Related Party Transactions |
| $ |
|
| $ |
|
| $ |
|
| $ |
| ||||
Waived Related Party Transactions |
| $ |
|
| $ |
|
| $ |
|
| $ |
| ||||
| F-56 |
| Table of Contents |
The Sponsor has the ability to elect to pay certain expenses on behalf of the Funds or waive the management fee. This election is subject to change by the Sponsor, at its discretion. Expenses paid by the Sponsor and Management fees waived by the Sponsor are, if applicable, presented as waived expenses in the statements of operations for each Fund. The Sponsor has determined that there will be no recovery sought for the amounts below in any future period:
|
| SOYB |
| |
Three months ended September 30, 2022 |
| $ |
| |
Three months ended September 30, 2021 |
| $ |
| |
Nine months ended September 30, 2022 |
| $ |
| |
Nine months ended September 30, 2021 |
| $ |
| |
Use of Estimates
The preparation of financial statements in conformity with U.S. GAAP requires management to make estimates and assumptions that affect the reported amount of assets and liabilities and disclosure of contingent assets and liabilities at the date of the financial statements, and the reported amounts of the revenue and expenses during the reporting period. Actual results could differ from those estimates.
Fair Value - Definition and Hierarchy
In accordance with U.S. GAAP, fair value is defined as the price that would be received to sell an asset or paid to transfer a liability (i.e., the “exit price”) in an orderly transaction between market participants at the measurement date.
In determining fair value, the Fund uses various valuation approaches. In accordance with U.S. GAAP, a fair value hierarchy for inputs is used in measuring fair value that maximizes the use of observable inputs and minimizes the use of unobservable inputs by requiring that the most observable inputs be used when available. Observable inputs are those that market participants would use in pricing the asset or liability based on market data obtained from sources independent of the Fund. Unobservable inputs reflect the Fund’s assumptions about the inputs market participants would use in pricing the asset or liability developed based on the best information available in the circumstances. The fair value hierarchy is categorized into three levels based on the inputs as follows:
Level 1 - Valuations based on unadjusted quoted prices in active markets for identical assets or liabilities that the Fund has the ability to access. Valuation adjustments and block discounts are not applied to Level 1 financial instruments. Since valuations are based on quoted prices that are readily and regularly available in an active market, valuation of these financial instruments does not entail a significant degree of judgment.
Level 2 - Valuations based on quoted prices in markets that are not active or for which all significant inputs are observable, either directly or indirectly.
Level 3 - Valuations based on inputs that are unobservable and significant to the overall fair value measurement.
The availability of valuation techniques and observable inputs can vary from financial instrument to financial instrument and is affected by a wide variety of factors including, the type of financial instrument, whether the financial instrument is new and not yet established in the marketplace, and other characteristics particular to the transaction. To the extent that valuation is based on models or inputs that are less observable or unobservable in the market, the determination of fair value requires more judgment. Those estimated values do not necessarily represent the amounts that may be ultimately realized due to the occurrence of future circumstances that cannot be reasonably determined. Because of the inherent uncertainty of valuation, those estimated values may be materially higher or lower than the values that would have been used had a ready market for the financial instruments existed. Accordingly, the degree of judgment exercised by the Fund in determining fair value is greatest for financial instruments categorized in Level 3. In certain cases, the inputs used to measure fair value may fall into different levels of the fair value hierarchy. In such cases, for disclosure purposes, the level in the fair value hierarchy, within which the fair value measurement in its entirety falls, is determined based on the lowest level input that is significant to the fair value measurement.
| F-57 |
| Table of Contents |
Fair value is a market-based measure considered from the perspective of a market participant rather than an entity-specific measure. Therefore, even when market assumptions are not readily available, the Fund’s own assumptions are set to reflect those that market participants would use in pricing the asset or liability at the measurement date. The Fund uses prices and inputs that are current as of the measurement date, including periods of market dislocation. In periods of market dislocation, the observability of prices and inputs may be reduced for many financial instruments. This condition could cause a financial instrument to be reclassified to a lower level within the fair value hierarchy. When such a situation exists on a quarter close, the Sponsor will calculate the NAV on a particular day using the Level 1 valuation but will later recalculate the NAV for the impacted Fund based upon the valuation inputs from these alternative verifiable sources (Level 2 or Level 3) and will report such NAV in its applicable financial statements and reports.
On September 30, 2022 and December 31, 2021, in the opinion of the Trust and the Fund, the reported value at the close of the market for each commodity contract fairly reflected the value of the futures and no alternative valuations were required. The determination is made as of the settlement of the futures contracts on the last day of trading for the reporting period. In making the determination of a Level 1 or Level 2 transfer, the Fund considers the average volume of the specific underlying futures contracts traded on the relevant exchange for the periods being reported.
For the quarter ended March 31, 2021, Soybean Futures Contracts for JUL21 CBOT soybean futures, and the Nov21 CBOT soybean futures settled in a “limit up” condition. Accordingly, the Trust and SOYB classified these as Level 2 assets. The adjustment in SOYB resulted in a $
The Fund records its derivative activities at fair value. Gains and losses from derivative contracts are included in the statements of operations. Derivative contracts include futures contracts related to commodity prices. Futures, which are listed on a national securities exchange, such as the CBOT and the ICE, or reported on another national market, are generally categorized in Level 1 of the fair value hierarchy. OTC derivatives contracts (such as forward and swap contracts) which may be valued using models, depending on whether significant inputs are observable or unobservable, are categorized in Levels 2 or 3 of the fair value hierarchy.
Expenses
Expenses are recorded using the accrual method of accounting.
Net Income (Loss) per Share
Net income (loss) per Share is the difference between the NAV per unit at the beginning of each period and at the end of each period. The weighted average number of Shares outstanding was computed for purposes of disclosing net income (loss) per weighted average Share. The weighted average Shares are equal to the number of Shares outstanding at the end of the period, adjusted proportionately for Shares created or redeemed based on the amount of time the Shares were outstanding during such period.
New Accounting Pronouncements
The Financial Accounting Standards Board (“FASB”) issued Accounting Standards Update (“ASU”) 2022-03, related to fair value measurement (Topic 820) of equity securities subject to contractual sale restrictions. Under the clarified guidance, contractual restrictions on the sale of an equity security are not considered part of the unit of account of the equity security and, therefore, are not considered in measuring fair value, however they do require disclosures. The amendment was early adopted for the quarter ended June 30, 2022; the early adoption did not have a material impact on the financial statements and disclosures of the Trust or the Fund.
| F-58 |
| Table of Contents |
The FASB issued ASU 2021-05: “Leases (Topic 842).” Under the amended guidance, a lessor should classify and account for a lease with variable lease payments that don’t depend on an index or a rate as an operating lease if the lease would’ve been classified as a sales-type lease or a direct financing lease in accordance with the lease classification guidance in Topic 842 and the lessor would’ve otherwise recognized a day-one loss. The amendment was adopted early for the quarter ended September 30, 2021; the adoption did not have a material impact on the financial statements and disclosures of the Trust or the Fund.
The FASB issued ASU 2020-10: “Codification Improvements.” The amendment improves the disclosure guidance in appropriate Disclosure Sections, without resulting in changes to current GAAP. The amendment is effective for annual periods beginning after December 15, 2020. The amendment was adopted for the quarter ended March 31, 2021; the adoption did not have a material impact on the financial statements and disclosures of the Trust or the Fund.
The FASB issued 2020-02: “Financial Instruments Credit Losses (Topic 326) and Leases (Topic 842): Amendments to SEC Paragraphs Pursuant to SEC Staff Accounting Bulletin No. 119 and Update to SEC Section on Effective Date Related to Accounting Standards Update No. 2016-02, Leases (Topic 842). The amendment updates and adds language to ASU 2016-02. The amendments were adopted for the quarter ended March 31, 2020; the adoption did not have a material impact on the financial statements and disclosures of the Trust or the Fund.
The FASB issued ASU 2020-01: Investments Equity Securities (Topic 321), Investments Equity Method and Joint Ventures (Topic 323), and Derivatives and Hedging (Topic 815) Clarifying the Interactions between Topic 321, Topic 323, and Topic 815. The amendments clarify the treatment of transactions that require a company to apply or discontinue the equity method of accounting. The amendments were adopted early for the quarter ended March 31, 2020; the adoption did not have a material impact on the financial statements and disclosures of the Trust or the Fund.
The FASB issued ASU 2019-04: “Codification Improvements to Topic 326, Financial Instruments Credit Losses, Topic 815, Derivatives and hedging, and Topic 825, Financial Instruments.” The amendments clarify and improve areas of guidance related to the recently issued standards on credit losses, hedging, and recognition and measurement, specifically relating to ASU 201712. The amendments were early adopted for the quarter ended June 30, 2019; the adoption did not have a material impact on the financial statements and disclosures of the Trust or the Fund.
The FASB issued ASU 2019-01: "Leases (Topic 842): Codification Improvements. These amendments align the guidance for fair value of underlying assets by lessors that are not manufacturers or dealers in Topic 842 with that of existing guidance. The amendments were adopted for the quarter ended September 30, 2020; the adoption did not have a material impact on the financial statements and disclosures of the Trust or the Fund.
The FASB issued ASU 2018-13: “Fair Value Measurement (Topic 820): Disclosure Framework Changes to the Disclosure Requirements for Fair Value Measurement. These amendments modify public and private company fair value disclosure requirements. While some disclosures were removed or modified, others were added. The guidance is a result of the FASB’s test of the principals developed to improve the effectiveness of disclosures in the notes to the financial statements. The amendments were adopted for the quarter ended March 31, 2020; the adoption did not have a material impact on the financial statements and disclosures of the Trust or the Fund.
The FASB issued ASU 2017-13, “Revenue Recognition (Topic 605), Leases (Topic 840), and Leases (Topic 842): Amendments to SEC Paragraphs Pursuant to the Staff Announcement at the July 20, 2017 EITF Meeting and Rescission of Prior SEC Staff Announcements and Observer Comments”. The amendment amends the early adoption date option for certain companies related to adoption of ASU No. 2014-09 and ASU No. 2016-02. The SEC staff stated the SEC would not object to a public business entity that otherwise would not meet the definition of a public business entity except for a requirement to include or the inclusion of its financial statements or financial information in another entity’s filing with the SEC adopting ASC Topic 842 for fiscal years beginning after December 15, 2019, and interim periods within fiscal years beginning after December 15, 2020. The amendments were adopted for the quarter ended September 30, 2020; the adoption did not have a material impact on the financial statements and disclosures of the Trust or the Fund.
| F-59 |
| Table of Contents |
Note 4 – Fair Value Measurements
The Fund’s assets and liabilities recorded at fair value have been categorized based upon a fair value hierarchy as described in the Fund’s significant accounting policies in Note 3. The following table presents information about the Fund’s assets and liabilities measured at fair value as of September 30, 2022 and December 31, 2021:
September 30, 2022
Assets: |
| Level 1 |
|
| Level 2 |
|
| Level 3 |
|
| Balance as of September 30, 2022 |
| ||||
Cash Equivalents |
| $ |
|
| $ |
|
| $ |
|
| $ |
| ||||
|
|
|
|
|
|
|
|
|
|
|
|
|
|
|
|
|
Liabilities |
| Level 1 |
|
| Level 2 |
|
| Level 3 |
|
| Balance as of September 30, 2022 |
| ||||
Commodity Futures Contracts |
|
|
|
|
|
|
|
|
|
|
|
|
|
|
|
|
Soybean futures contracts |
| $ |
|
| $ |
|
| $ |
|
| $ |
| ||||
December 31, 2021
Assets: |
| Level 1 |
|
| Level 2 |
|
| Level 3 |
|
| Balance as of December 31, 2021 |
| ||||
Cash Equivalents |
| $ |
|
| $ |
|
| $ |
|
| $ |
| ||||
Commodity Futures Contracts |
|
|
|
|
|
|
|
|
|
|
|
|
|
|
|
|
Soybean futures contracts |
|
|
|
|
|
|
|
|
|
|
|
| ||||
Total |
| $ |
|
| $ |
|
| $ |
|
| $ |
| ||||
For the three and nine months ended September 30, 2022 and year ended December 31, 2021, the Fund did not have any significant transfers between any of the levels of the fair value hierarchy, except for the JUL21 CBOT soybean futures, and the Nov21 CBOT soybean futures, were reflected as a Level 2 asset for the period ended March 31, 2021 due to a “limit up” condition. These Soybean contracts transferred back to a Level 1 asset for the period ended June 30, 2021.
See the Fair Value - Definition and Hierarchy section in Note 3 above for an explanation of the transfers into and out of each level of the fair value hierarchy.
Note 5 – Derivative Instruments and Hedging Activities
In the normal course of business, the Fund utilizes derivative contracts in connection with its proprietary trading activities. Investments in derivative contracts are subject to additional risks that can result in a loss of all or part of an investment. The Fund’s derivative activities and exposure to derivative contracts are classified by the following primary underlying risks: interest rate, credit, commodity price, and equity price risks. In addition to its primary underlying risks, the Fund is also subject to additional counterparty risk due to inability of its counterparties to meet the terms of their contracts. For the three and nine months ended September 30, 2022 and year ended December 31, 2021, the Fund invested only in commodity futures contracts.
| F-60 |
| Table of Contents |
Futures Contracts
The Fund is subject to commodity price risk in the normal course of pursuing its investment objectives. A futures contract represents a commitment for the future purchase or sale of an asset at a specified price on a specified date.
The purchase and sale of futures contracts requires margin deposits with an FCM. Subsequent payments (variation margin) are made or received by the Fund each day, depending on the daily fluctuations in the value of the contract, and are recorded as unrealized gains or losses by the Fund. Futures contracts may reduce the Fund’s exposure to counterparty risk since futures contracts are exchange-traded; and the exchange’s clearinghouse, as the counterparty to all exchange-traded futures, guarantees the futures against default.
The Commodity Exchange Act requires an FCM to segregate all customer transactions and assets from the FCM’s proprietary activities. A customer’s cash and other equity deposited with an FCM are considered commingled with all other customer funds subject to the FCM’s segregation requirements. In the event of an FCM’s insolvency, recovery may be limited to the Fund’s pro rata share of segregated customer funds available. It is possible that the recovery amount could be less than the total of cash and other equity deposited.
The following table discloses information about offsetting assets and liabilities presented in the statements of assets and liabilities to enable users of these financial statements to evaluate the effect or potential effect of netting arrangements for recognized assets and liabilities. These recognized assets and liabilities are presented as defined in FASB ASU No. 2011-11 “Balance Sheet (Topic 210): Disclosures about Offsetting Assets and Liabilities” and subsequently clarified in FASB ASU 2013-01 “Balance Sheet (Topic 210): Clarifying the Scope of Disclosures about Offsetting Assets and Liabilities.”
The following table also identifies the fair value amounts of derivative instruments included in the statements of assets and liabilities as derivative contracts, categorized by primary underlying risk, and held by the FCMs, E D & F Man and StoneX as of September 30, 2022, and December 31, 2021.
*The amount of collateral presented in Collateral, Due from Broker, is limited to the liability for the futures contracts and accordingly does not include the excess collateral pledged.
Offsetting of Financial Liabilities and Derivative Liabilities as of September 30, 2022
|
| (i) |
|
| (ii) |
|
| (iii) = (i)-(ii) |
|
| (iv) |
|
| (v)=(iii)-(iv) |
| |||||||||
|
|
|
|
|
|
|
| Gross Amount Not Offset in the Statement of Assets and Liabilities |
|
|
| |||||||||||||
Description |
| Gross Amount of Recognized Liabilities |
|
| Gross Amount Offset in the Statement of Assets and Liabilities |
|
| Net Amount Presented in the Statement of Assets and Liabilities |
|
| Futures Contracts Available for Offset |
|
| Collateral, Due from Broker* |
|
| Net Amount |
| ||||||
Commodity Price |
|
|
|
|
|
|
|
|
|
|
|
|
|
|
|
|
|
| ||||||
Soybean futures contracts |
| $ |
|
| $ |
|
| $ |
|
| $ |
|
| $ |
|
| $ |
| ||||||
Offsetting of Financial Assets and Derivative Assets as of December 31, 2021
|
| (i) |
|
| (ii) |
|
| (iii) = (i)-(ii) |
|
| (iv) |
|
| (v)=(iii)-(iv) |
| |||||||||
|
|
|
|
|
|
|
|
|
|
| Gross Amount Not Offset in the Statement of Assets and Liabilities |
|
|
|
| |||||||||
Description |
| Gross Amount of Recognized Assets |
|
| Gross Amount Offset in the Statement of Assets and Liabilities |
|
| Net Amount Presented in the Statement of Assets and Liabilities |
|
| Futures Contracts Available for Offset |
|
| Collateral, Due to Broker |
|
| Net Amount |
| ||||||
Commodity Price |
|
|
|
|
|
|
|
|
|
|
|
|
|
|
|
|
|
| ||||||
Soybean futures contracts |
| $ |
|
| $ |
|
| $ |
|
| $ |
|
| $ |
|
| $ |
| ||||||
| F-61 |
| Table of Contents |
The following is a summary of realized and unrealized gains and losses of the derivative instruments utilized by the Fund:
Three months ended September 30, 2022
|
| Realized Gain on Commodity Futures Contracts |
|
| Net Change in Unrealized Depreciation on Commodity Futures Contracts |
| ||
Commodity Price |
|
|
|
|
|
| ||
Soybean futures contracts |
| $ |
|
| $ | ( | ) | |
Three months ended September 30, 2021
|
| Realized Gain on Commodity Futures Contracts |
|
| Net Change in Unrealized Depreciation on Commodity Futures Contracts |
| ||
| Commodity Price |
|
|
|
|
|
| ||
| Soybean futures contracts |
| $ |
|
| $ | ( | ) | |
Nine months ended September 30, 2022
|
| Realized Gain on Commodity Futures Contracts |
|
| Net Change in Unrealized Depreciation on Commodity Futures Contracts |
| ||
Commodity Price |
|
|
|
|
|
| ||
Soybean futures contracts |
| $ |
|
| $ | ( | ) | |
Nine months ended September 30, 2021
|
| Realized Gain on Commodity Futures Contracts |
|
| Net Change in Unrealized Depreciation on Commodity Futures Contracts |
| ||
Commodity Price |
|
|
|
|
|
| ||
Soybean futures contracts |
| $ |
|
| $ | ( | ) | |
Volume of Derivative Activities
The average notional market value categorized by primary underlying risk for all futures contracts held was $
| F-62 |
| Table of Contents |
Note 6 – Financial Highlights
The following tables present per unit performance data and other supplemental financial data for the three and nine months ended September 30, 2022 and 2021. This information has been derived from information presented in the financial statements and is presented with total expenses gross of expenses waived by the Sponsor and with total expenses net of expenses waived by the Sponsor, as appropriate.
|
| Three months ended |
|
| Three months ended |
|
| Nine months ended |
|
| Nine months ended |
| ||||
|
| September 30, 2022 |
|
| September 30, 2021 |
|
| September 30, 2022 |
|
| September 30, 2021 |
| ||||
Per Share Operation Performance |
|
|
|
|
|
|
|
|
|
|
|
| ||||
Net asset value at beginning of period |
| $ |
|
| $ |
|
| $ |
|
| $ |
| ||||
Income from investment operations: |
|
|
|
|
|
|
|
|
|
|
|
|
|
|
|
|
Investment income |
|
|
|
|
|
|
|
|
|
|
|
| ||||
Net realized and unrealized (loss) gain on commodity futures contracts |
|
| - |
|
|
| - |
|
|
|
|
|
|
| ||
Total expenses, net |
|
| - |
|
|
| - |
|
|
| - |
|
|
| - |
|
Net (decrease) increase in net asset value |
|
| ( | ) |
|
| ( | ) |
|
|
|
|
|
| ||
Net asset value at end of period |
| $ |
|
| $ |
|
| $ |
|
| $ |
| ||||
Total Return |
|
| - | % |
|
| - | % |
|
| % |
|
| % | ||
Ratios to Average Net Assets (Annualized) |
|
|
|
|
|
|
|
|
|
|
|
|
|
|
|
|
Total expenses |
|
| % |
|
| % |
|
| % |
|
| % | ||||
Total expenses, net |
|
| % |
|
| % |
|
| % |
|
| % | ||||
Net investment income (loss) |
|
| % |
|
| ( | )% |
|
| ( | )% |
|
| ( | )% | |
The financial highlights per share data are calculated consistent with the methodology used to calculate asset-based fees and expenses.
Note 7 – Organizational and Offering Costs
Expenses incurred in organizing of the Trust and the initial offering of the Shares of the Fund, including applicable SEC registration fees were borne directly by the Sponsor. The Fund will not be obligated to reimburse the Sponsor.
Note 8 – Subsequent Events
Management has evaluated the financial statements for the quarter-ended September 30, 2022 for subsequent events through the date of this filing and noted no material events requiring either recognition through the date of the filing or disclosure herein for the Fund.
| F-63 |
| Table of Contents |
TEUCRIUM SUGAR FUND
STATEMENTS OF ASSETS AND LIABILITIES
|
| September 30, 2022 |
|
| December 31, 2021 |
| ||
|
| (Unaudited) |
|
|
| |||
Assets |
|
|
|
|
|
| ||
Cash and cash equivalents |
| $ |
|
| $ |
| ||
Interest receivable |
|
|
|
|
|
| ||
Other assets |
|
|
|
|
|
| ||
Equity in trading accounts: |
|
|
|
|
|
|
|
|
Commodity futures contracts |
|
|
|
|
|
| ||
Due from broker |
|
|
|
|
|
| ||
Total equity in trading accounts |
|
|
|
|
|
| ||
Total assets |
|
|
|
|
|
| ||
|
|
|
|
|
|
|
|
|
Liabilities |
|
|
|
|
|
|
|
|
Management fee payable to Sponsor |
|
|
|
|
|
| ||
Other liabilities |
|
|
|
|
|
| ||
Equity in trading accounts: |
|
|
|
|
|
|
|
|
Commodity futures contracts |
|
|
|
|
|
| ||
Total liabilities |
|
|
|
|
|
| ||
|
|
|
|
|
|
|
|
|
Net assets |
| $ |
|
| $ |
| ||
|
|
|
|
|
|
|
|
|
Shares outstanding |
|
|
|
|
|
| ||
|
|
|
|
|
|
|
|
|
Shares authorized |
| * |
|
|
|
| ||
|
|
|
|
|
|
|
|
|
Net asset value per share |
| $ |
|
| $ |
| ||
|
|
|
|
|
|
|
|
|
Market value per share |
| $ |
|
| $ |
| ||
* On April 7, 2022, the Teucrium Sugar Fund registered an indeterminate number of shares of the Fund pursuant to Rule 456(d) under the Securities Act of 1933.
The accompanying notes are an integral part of these financial statements.
| F-64 |
| Table of Contents |
TEUCRIUM SUGAR FUND
SCHEDULE OF INVESTMENTS
September 30, 2022
(Unaudited)
|
|
|
| Percentage of |
|
|
| |||||
Description: Assets |
| Fair Value |
|
| Net Assets |
|
| Shares |
| |||
|
|
|
|
|
|
|
|
|
| |||
Cash equivalents |
|
|
|
|
|
|
|
|
| |||
Money market funds |
|
|
|
|
|
|
|
|
| |||
First American Government Obligations Fund - Class X (cost $6,907,992) |
| $ |
|
|
| % |
|
|
| |||
Goldman Sachs Financial Square Government Fund - Institutional Class (cost $1,857,906) |
|
|
|
|
|
|
|
|
| |||
Total money market funds (cost: $8,765,989) |
| $ |
|
|
| % |
|
|
|
| ||
|
|
|
|
|
|
|
|
|
|
|
|
|
|
|
|
|
|
|
|
|
|
| Principal Amount |
| |
Commercial Paper |
|
|
|
|
|
|
|
|
|
|
|
|
Harley-Davidson Financial Services, Inc. 3.487% (cost: $2,290,522 due 11/03/2022) |
| $ |
|
|
| % |
|
|
| |||
Jabil Inc. 3.079% (cost: $2,491,740 due 10/17/2022) |
|
|
|
|
|
|
|
|
| |||
Jabil Inc. 3.129% (cost: $2,492,250 due 10/21/2022) |
|
|
|
|
|
|
|
|
| |||
PVH Corp. 3.535% (cost: $2,493,681 due 10/19/2022) |
|
|
|
|
|
|
|
|
| |||
V.F. Corporation 3.282% (cost: $2,491,198 due 11/01/2022) |
|
|
|
|
|
|
|
|
| |||
Total Commercial Paper (cost: $12,259,391) |
| $ |
|
|
| % |
|
|
|
| ||
Total Cash Equivalents |
| $ |
|
|
| % |
|
|
|
| ||
|
|
|
|
|
|
|
|
|
|
|
|
|
|
|
|
|
|
| Percentage of |
|
| Notional Amount |
| ||
Description: Liabilities |
| Fair Value |
|
| Net Assets |
|
| (Long Exposure) |
| |||
|
|
|
|
|
|
|
|
|
|
|
|
|
Commodity futures contracts |
|
|
|
|
|
|
|
|
|
|
|
|
United States sugar futures contracts |
|
|
|
|
|
|
|
|
|
|
|
|
ICE sugar futures MAY23 (471 contracts) |
| $ |
|
|
| % |
| $ |
| |||
ICE sugar futures JUL23 (414 contracts) |
|
|
|
|
|
|
|
|
| |||
ICE sugar futures MAR24 (475 contracts) |
|
|
|
|
|
|
|
|
| |||
Total commodity futures contracts |
| $ |
|
|
| % |
| $ |
| |||
The accompanying notes are an integral part of these financial statements.
| F-65 |
| Table of Contents |
TEUCRIUM SUGAR FUND
SCHEDULE OF INVESTMENTS
December 31, 2021
|
|
|
|
| Percentage of |
|
|
|
| |||
Description: Assets |
| Fair Value |
|
| Net Assets |
|
| Shares |
| |||
|
|
|
|
|
|
|
|
|
| |||
Cash equivalents |
|
|
|
|
|
|
|
|
| |||
Money market funds |
|
|
|
|
|
|
|
|
| |||
First American Government Obligations Fund - Class X 0.026% (cost $4,808,415) |
| $ |
|
|
| % |
|
|
| |||
Goldman Sachs Financial Square Government Fund - Institutional Class 0.030% (cost: $8,468) |
|
|
|
|
|
|
|
|
| |||
Total Money Market Funds (cost: $4,816,883) |
|
|
|
|
|
|
|
|
|
| ||
|
|
|
|
|
|
|
|
|
|
|
|
|
|
|
|
|
|
|
|
|
|
| Principal Amount |
| |
Commercial Paper |
|
|
|
|
|
|
|
|
|
|
|
|
Jabil Inc. 0.250% (cost: $2,499,219 due 01/20/2022) |
| $ |
|
|
| % |
|
|
| |||
WGL Holdings, Inc. 0.187% (cost: $4,998,700 due 01/06/2022) |
|
|
|
|
|
|
|
|
| |||
Total Commercial Paper (cost: $7,497,919) |
| $ |
|
|
| % |
|
|
|
| ||
Total Cash Equivalents |
| $ |
|
|
| % |
|
|
|
| ||
|
|
|
|
|
|
|
|
|
|
|
|
|
|
|
|
|
|
|
|
|
|
| Notional Amount |
| |
|
|
|
|
|
|
|
|
|
| (Long Exposure) |
| |
Commodity futures contracts |
|
|
|
|
|
|
|
|
|
|
|
|
United States sugar futures contracts |
|
|
|
|
|
|
|
|
|
|
|
|
ICE sugar futures MAY22 (381 contracts) |
| $ |
|
|
| % |
| $ |
| |||
ICE sugar futures MAR23 (392 contracts) |
|
|
|
|
|
|
|
|
| |||
Total commodity futures contracts |
| $ |
|
|
| % |
| $ |
| |||
|
|
|
|
|
|
|
|
|
|
|
|
|
|
|
|
|
|
| Percentage of |
|
| Notional Amount |
| ||
Description: Liabilities |
| Fair Value |
|
| Net Assets |
|
| (Long Exposure) |
| |||
|
|
|
|
|
|
|
|
|
|
|
|
|
Commodity futures contracts |
|
|
|
|
|
|
|
|
|
|
|
|
United States sugar futures contracts |
|
|
|
|
|
|
|
|
|
|
|
|
ICE sugar futures JUL22 (331 contracts) |
| $ |
|
|
| % |
| $ |
| |||
The accompanying notes are an integral part of these financial statements.
| F-66 |
| Table of Contents |
TEUCRIUM SUGAR FUND
STATEMENTS OF OPERATIONS
(Unaudited)
|
| Three months ended |
|
| Three months ended |
|
| Nine months ended |
|
| Nine months ended |
| ||||
|
| September 30, 2022 |
|
| September 30, 2021 |
|
| September 30, 2022 |
|
| September 30, 2021 |
| ||||
Income |
|
|
|
|
|
|
|
|
|
|
|
| ||||
Realized and unrealized gain (loss) on trading of commodity futures contracts: |
|
|
|
|
|
|
|
|
|
|
|
| ||||
Realized (loss) gain on commodity futures contracts |
| $ | ( | ) |
| $ |
|
| $ | ( | ) |
| $ |
| ||
Net change in unrealized (depreciation) appreciation on commodity futures contracts |
|
| ( | ) |
|
|
|
|
| ( | ) |
|
|
| ||
Interest income |
|
|
|
|
|
|
|
|
|
|
|
| ||||
Total income (loss) |
|
| ( | ) |
|
|
|
|
| ( | ) |
|
|
| ||
|
|
|
|
|
|
|
|
|
|
|
|
|
|
|
|
|
Expenses |
|
|
|
|
|
|
|
|
|
|
|
|
|
|
|
|
Management fees |
|
|
|
|
|
|
|
|
|
|
|
| ||||
Professional fees |
|
|
|
|
|
|
|
|
|
|
|
| ||||
Distribution and marketing fees |
|
|
|
|
|
|
|
|
|
|
|
| ||||
Custodian fees and expenses |
|
|
|
|
|
|
|
|
|
|
|
| ||||
Business permits and licenses fees |
|
|
|
|
|
|
|
|
|
|
|
| ||||
General and administrative expenses |
|
|
|
|
|
|
|
|
|
|
|
| ||||
Other expenses |
|
|
|
|
|
|
|
|
|
|
|
| ||||
Total expenses |
|
|
|
|
|
|
|
|
|
|
|
| ||||
|
|
|
|
|
|
|
|
|
|
|
|
|
|
|
|
|
Expenses waived by the Sponsor |
|
|
|
|
| ( | ) |
|
| ( | ) |
|
| ( | ) | |
|
|
|
|
|
|
|
|
|
|
|
|
|
|
|
|
|
Total expenses, net |
|
|
|
|
|
|
|
|
|
|
|
| ||||
|
|
|
|
|
|
|
|
|
|
|
|
|
|
|
|
|
Net (loss) income |
| $ | ( | ) |
| $ |
|
| $ | ( | ) |
| $ |
| ||
|
|
|
|
|
|
|
|
|
|
|
|
|
|
|
|
|
Net (loss) gain per share |
| $ | ( | ) |
| $ |
|
| $ | ( | ) |
| $ |
| ||
Net (loss) income per weighted average share |
| $ | ( | ) |
| $ |
|
| $ | ( | ) |
| $ |
| ||
Weighted average shares outstanding |
|
|
|
|
|
|
|
|
|
|
|
| ||||
The accompanying notes are an integral part of these financial statements.
| F-67 |
| Table of Contents |
TEUCRIUM SUGAR FUND
STATEMENTS OF CHANGES IN NET ASSETS
(Unaudited)
|
| Nine months ended |
|
| Nine months ended |
| ||
|
| September 30, 2022 |
|
| September 30, 2021 |
| ||
Operations |
|
|
|
|
|
| ||
Net (loss) income |
| $ | ( | ) |
| $ |
| |
Capital transactions |
|
|
|
|
|
|
|
|
Issuance of Shares |
|
|
|
|
|
| ||
Redemption of Shares |
|
| ( | ) |
|
| ( | ) |
Total capital transactions |
|
|
|
|
|
| ||
Net change in net assets |
|
|
|
|
|
| ||
|
|
|
|
|
|
|
|
|
Net assets, beginning of period |
| $ |
|
| $ |
| ||
|
|
|
|
|
|
|
|
|
Net assets, end of period |
| $ |
|
| $ |
| ||
|
|
|
|
|
|
|
|
|
Net asset value per share at beginning of period |
| $ |
|
| $ |
| ||
|
|
|
|
|
|
|
|
|
Net asset value per share at end of period |
| $ |
|
| $ |
| ||
|
|
|
|
|
|
|
|
|
Creation of Shares |
|
|
|
|
|
| ||
Redemption of Shares |
|
|
|
|
|
| ||
The accompanying notes are an integral part of these financial statements.
| F-68 |
| Table of Contents |
TEUCRIUM SUGAR FUND
STATEMENTS OF CASH FLOWS
(Unaudited)
|
| Nine months ended |
|
| Nine months ended |
| ||
|
| September 30, 2022 |
|
| September 30, 2021 |
| ||
Cash flows from operating activities: |
|
|
|
|
|
| ||
Net (loss) income |
| $ | ( | ) |
| $ |
| |
Adjustments to reconcile net (loss) income to net cash (used in) provided by operating activities: |
|
|
|
|
|
|
|
|
Net change in unrealized depreciation (appreciation) on commodity futures contracts |
|
|
|
|
| ( | ) | |
Changes in operating assets and liabilities: |
|
|
|
|
|
|
|
|
Due from broker |
|
| ( | ) |
|
|
| |
Interest receivable |
|
| ( | ) |
|
| ( | ) |
Other assets |
|
| ( | ) |
|
| ( | ) |
Due to broker |
|
|
|
|
| ( | ) | |
Management fee payable to Sponsor |
|
|
|
|
|
| ||
Other liabilities |
|
| ( | ) |
|
|
| |
Net cash (used in) provided by operating activities |
|
| ( | ) |
|
|
| |
|
|
|
|
|
|
|
|
|
Cash flows from financing activities: |
|
|
|
|
|
|
|
|
Proceeds from sale of Shares |
|
|
|
|
|
| ||
Redemption of Shares |
|
| ( | ) |
|
| ( | ) |
Net cash provided by financing activities |
|
|
|
|
|
| ||
|
|
|
|
|
|
|
|
|
Net change in cash and cash equivalents |
|
|
|
|
|
| ||
Cash and cash equivalents beginning of period |
|
|
|
|
|
| ||
Cash and cash equivalents end of period |
| $ |
|
| $ |
| ||
The accompanying notes are an integral part of these financial statements.
| F-69 |
| Table of Contents |
NOTES TO FINANCIAL STATEMENTS
September 30, 2022
(Unaudited)
Note 1 – Organization and Operation
Teucrium Sugar Fund (referred to herein as “CANE” or the “Fund”) is a commodity pool that is a series of Teucrium Commodity Trust (“Trust”), a Delaware statutory trust formed on September 11, 2009. The Fund issues common units, called the “Shares,” representing fractional undivided beneficial interests in the Fund. The Fund continuously offers Creation Baskets consisting of
The investment objective of CANE is to have the daily changes in the NAV of the Fund’s Shares reflect the daily changes in the sugar market for future delivery as measured by the Benchmark. The Benchmark is a weighted average of the closing settlement prices for three futures contracts for No. 11 sugar (“Sugar Futures Contracts”) that are traded on the ICE Futures US (“ICE”):
CANE Benchmark
ICE Sugar Futures Contract |
| Weighting |
| |
Second to expire |
|
| % | |
Third to expire |
|
| % | |
Expiring in the March following the expiration of the third to expire contract |
|
| % | |
The Fund commenced investment operations on September 19, 2011 and has a fiscal year ending December 31. The Fund’s sponsor is Teucrium Trading, LLC (the “Sponsor”). The Sponsor is responsible for the management of the Fund. The Sponsor is registered as a commodity pool operator (“CPO”) and a commodity trading adviser (“CTA”) with the Commodity Futures Trading Commission (“CFTC”) and is a member of the National Futures Association (“NFA”).
On June 13, 2011, the initial Form S-1 for CANE was declared effective by the SEC. On September 16, 2011, two Creation Baskets were issued representing
The accompanying unaudited financial statements have been prepared in accordance with Rule 10-01 of Regulation S-X promulgated by the SEC and, therefore, do not include all information and footnote disclosures required under accounting principles generally accepted in the United States of America (“GAAP”). The financial information included herein is unaudited; however, such financial information reflects all adjustments which are, in the opinion of management, necessary for the fair presentation of the Fund’s financial statements for the interim period. It is suggested that these interim financial statements be read in conjunction with the financial statements and related notes included in the Trust’s Annual Report on Form 10-K, as well as the most recent Form S-1 filing, as applicable. The operating results for the three and nine months ended September 30, 2022 are not necessarily indicative of the results to be expected for the full year ending December 31, 2022.
| F-70 |
| Table of Contents |
Subject to the terms of the Trust Agreement, Teucrium Trading, LLC, in its capacity as the Sponsor (“Sponsor”), may terminate a Fund at any time, regardless of whether the Fund has incurred losses, including, for instance, if it determines that the Fund’s aggregate net assets in relation to its operating expenses make the continued operation of the Fund unreasonable or imprudent. However, no level of losses will require the Sponsor to terminate a Fund.
Note 2 – Principal Contracts and Agreements
The Sponsor employs U.S. Bancorp Fund Services, LLC, doing business as U.S. Bank Global Fund Services (“Global Fund Services”), for Transfer Agency, Fund Accounting and Fund Administration services. The principal address for Global Fund Services is 615 E. Michigan Street, Milwaukee, WI 53202.
The Sponsor employs Foreside Fund Services, LLC (“Foreside” or the “Distributor”) as the Distributor for the Funds. The Distribution Services Agreement among the Distributor and the Sponsor calls for the Distributor to work with the Custodian in connection with the receipt and processing of orders for Creation Baskets and Redemption Baskets and the review and approval of all Fund sales literature and advertising materials. The Distributor and the Sponsor have also entered into a Securities Activities and Service Agreement (the “SASA”) under which certain employees and officers of the Sponsor are licensed as registered representatives or registered principals of the Distributor, under Financial Industry Regulatory Authority (“FINRA”) rules.
E D & F Man Capital Markets, Inc. (“E D & F Man”) and StoneX Financial Inc. (“StoneX”) serve as the Funds’ clearing brokers to execute and clear the futures contracts and provide other brokerage-related services. E D & F Man and StoneX are each registered as futures commission merchants (“FCM”) with the U.S. CFTC and are members of the NFA. The clearing brokers are registered as broker-dealers with the SEC and are each a member of FINRA. ED & F Man and StoneX are each clearing members of ICE Futures U.S., Inc., Chicago Board of Trade, Chicago Mercantile Exchange, New York Mercantile Exchange, and all other major United States commodity exchanges. For Corn, Soybean, Sugar, and Wheat Futures Contracts E D & F Man is paid
The sole Trustee of the Trust is Wilmington Trust Company, a Delaware banking corporation. The Trustee will accept service of legal process on the Trust in the State of Delaware and will make certain filings under the Delaware Statutory Trust Act. For its services, the Trustee receives an annual fee of $3,300 from the Trust. These services are recorded in business permits and licenses fees on the statements of operations. A summary of these expenses is included below.
| F-71 |
| Table of Contents |
The Sponsor employs Thales Capital Partners LLC (“Thales”) for distribution and solicitation-related services.
|
| Three months ended September 30, 2022 |
|
| Three months ended September 30, 2021 |
|
| Nine months ended September 30, 2022 |
|
| Nine months ended September 30, 2021 |
| ||||
Amount Recognized for Custody Services |
| $ |
|
| $ |
|
| $ |
|
| $ |
| ||||
Amount of Custody Services Waived |
| $ |
|
| $ |
|
| $ |
|
| $ |
| ||||
|
|
|
|
|
|
|
|
|
|
|
|
|
|
|
|
|
Amount Recognized for Distribution Services |
| $ |
|
| $ |
|
| $ |
|
| $ |
| ||||
Amount of Distribution Services Waived |
| $ |
|
| $ |
|
| $ |
|
| $ |
| ||||
|
|
|
|
|
|
|
|
|
|
|
|
|
|
|
|
|
Amount Recognized for Wilmington Trust |
| $ |
|
| $ |
|
| $ |
|
| $ |
| ||||
Amount of Wilmington Trust Waived |
| $ |
|
| $ |
|
| $ |
|
| $ |
| ||||
|
|
|
|
|
|
|
|
|
|
|
|
|
|
|
|
|
Amount Recognized for Thales |
| $ |
|
| $ |
|
| $ |
|
| $ |
| ||||
Amount of Thales Waived |
| $ |
|
| $ |
|
| $ |
|
| $ |
| ||||
Note 3 – Summary of Significant Accounting Policies
Basis of Presentation
The accompanying financial statements have been prepared in accordance with accounting principles generally accepted in the United States of America (“U.S. GAAP”) as detailed in the Financial Accounting Standards Board’s Accounting Standards Codification.
Revenue Recognition
Commodity futures contracts are recorded on the trade date. All such transactions are recorded on the identified cost basis and marked to market daily. Unrealized appreciation or depreciation on commodity futures contracts are reflected in the statements of operations as the difference between the original contract amount and the fair market value as of the last business day of the year or as of the last date of the financial statements. Changes in the appreciation or depreciation between periods are reflected in the statements of operations. Interest on cash equivalents with financial institutions are recognized on the accrual basis. The Fund seeks to earn interest on funds held at the custodian and other financial institutions at prevailing market rates for such investments.
The Sponsor invests a portion of cash in commercial paper, which is deemed a cash equivalent based on the rating and duration of contracts as described in the notes to the financial statements and reflected in cash and cash equivalents on the statements of assets and liabilities and on the statements of cash flows. Accretion on these investments is recognized using the effective interest method in U.S. dollars and included in interest income on the statements of operations.
The Sponsor invests a portion of the cash held by the broker in short term Treasury Bills as collateral for open futures contracts. Accretion on these investments is recognized using the effective interest method in U.S. dollars and included in interest income on the statements of operations.
| F-72 |
| Table of Contents |
Brokerage Commissions
The Sponsor recognizes the expense for brokerage commissions for futures contract trades on a per-trade basis. The below table shows the amounts included on the statements of operations as total brokerage commissions paid inclusive of unrealized loss for the three and nine months ended September 30, 2022.
|
| CANE |
| |
Three Months Ended September 30, 2022 |
| $ | 5,436 |
|
Three Months Ended September 30, 2021 |
| $ | 6,613 |
|
Nine Months Ended September 30, 2022 |
| $ | 31,972 |
|
Nine Months Ended September 30, 2021 |
| $ | 19,047 |
|
Income Taxes
For federal income tax purposes, the Fund will be treated as a publicly traded partnership. A publicly traded partnership is generally treated as a corporation for federal income tax purposes unless 90% or more of the publicly traded partnership’s gross income for each taxable year of its existence consists of qualifying income as defined in section 7704(d) of the Internal Revenue Code of 1986, as amended. Qualifying income is defined as generally including, in pertinent part, interest (other than from a financial business), dividends, and gains from the sale or disposition of capital assets held for the production of interest or dividends. In the case of a partnership of which a principal activity is the buying and selling of commodities, other than as inventory, or of futures, forwards and options with respect to commodities, qualifying income also includes income and gains from commodities and from futures, forwards, options with respect to commodities and, provided the partnership is a trader or investor with respect to such assets, swaps and other notional principal contracts with respect to commodities. The Fund expects that at least 90% of the Fund’s gross income for each taxable year will consist of qualifying income and that the Fund will be taxed as a partnership for federal income tax purposes. The Fund does not record a provision for income taxes because the shareholders report their share of the Fund’s income or loss on their income tax returns. The financial statements reflect the Fund’s transactions without adjustment, if any, required for income tax purposes.
The Fund is required to determine whether a tax position is more likely than not to be sustained upon examination by the applicable taxing authority, including resolution of any related appeals or litigation processes, based on the technical merits of the position. The Fund files an income tax return in the U.S. federal jurisdiction and may file income tax returns in various U.S. states and foreign jurisdictions. For all tax years 2019 to 2021, the Fund remains subject to income tax examinations by major taxing authorities. The tax benefit recognized is measured as the largest amount of benefit that has a greater than fifty percent likelihood of being realized upon ultimate settlement. De-recognition of a tax benefit previously recognized results in the Fund recording a tax liability that reduces net assets. Based on its analysis, the Fund has determined that it has not incurred any liability for unrecognized tax benefits as of September 30, 2022 and for the years ended December 31, 2021, 2020, and 2019. However, the Fund’s conclusions regarding this policy may be subject to review and adjustment at a later date based on factors including, but not limited to, ongoing analysis of and changes to tax laws, regulations, and interpretations thereof.
The Fund recognizes interest accrued related to unrecognized tax benefits and penalties related to unrecognized tax benefits in income tax fees payable, if assessed. No interest expense or penalties have been recognized as of and for the three and nine months ended September 30, 2022 and 2021.
The Fund may be subject to potential examination by U.S. federal, U.S. state, or foreign jurisdictional authorities in the area of income taxes. These potential examinations may include questioning the timing and amount of deductions, the nexus of income among various tax jurisdictions, and compliance with U.S. federal, U.S. state and foreign tax laws.
| F-73 |
| Table of Contents |
Creations and Redemptions
Authorized Purchasers may purchase Creation Baskets consisting of 25,000 shares from the Fund. The amount of the proceeds required to purchase a Creation Basket will be equal to the NAV of the shares in the Creation Basket determined as of 4:00 p.m. (ET) on the day the order to create the basket is received in good order.
Authorized Purchasers may redeem shares from the Fund only in blocks of 25,000 shares called “Redemption Baskets.” The amount of the redemption proceeds for a Redemption Basket will be equal to the NAV of the shares in the Redemption Basket determined as of 4:00 p.m. (ET) on the day the order to redeem the basket is received in good order.
The Fund receives or pays the proceeds from shares sold or redeemed within three business days after the trade date of the purchase or redemption. The amounts due from Authorized Purchasers are reflected in the Fund’s statements of assets and liabilities as capital shares receivable. Amounts payable to Authorized Purchasers upon redemption are reflected in the Fund’s statements of assets and liabilities as payable for shares redeemed.
As outlined in the most recent Form S-1 filing, 50,000 shares represents two Redemption Baskets for the Fund and a minimum level of shares. If the Fund experienced redemptions that caused the number of Shares outstanding to decrease to the minimum level of Shares required to be outstanding, until the minimum number of Shares is again exceeded through the purchase of a new Creation Basket, there can be no more redemptions by an Authorized Purchaser.
Allocation of Shareholder Income and Losses
Profit or loss is allocated among the shareholders of the Fund in proportion to the number of shares each shareholder holds as of the close of each month.
Cash and Cash Equivalents
Cash equivalents are highly liquid investments with maturity dates of 90 days or less when acquired. The Trust reported its cash equivalents in the statements of assets and liabilities at market value, or at carrying amounts that approximate fair value, because of their highly liquid nature and short-term maturities. Each Fund that is a series of the Trust has the balance of its cash equivalents on deposit with financial institutions. The Fund holds a balance in money market funds that is included in cash and cash equivalents on the statements of assets and liabilities. The Sponsor invests a portion of the available cash for the Funds in alternative demand deposit savings accounts, which is classified as cash and not as cash equivalents. Assets deposited with the bank may, at times, exceed federally insured limits. The Sponsor invests a portion of the available cash for the Funds in investment grade commercial paper with durations of 90 days or less, which is classified as a cash equivalent and is not FDIC insured. The Sponsor may invest a portion of the cash held by the broker in short term Treasury Bills as collateral for open futures contracts, which is classified as a cash equivalent and is not FDIC insured.
|
| September 30, 2022 |
|
| December 31, 2021 |
| ||
Money Market Funds |
| $ |
|
| $ |
| ||
Demand Deposit Savings Accounts |
|
|
|
|
|
| ||
Commercial Paper |
|
|
|
|
|
| ||
Total cash and cash equivalents as presented on the Statement of Assets and Liabilities |
| $ |
|
| $ |
| ||
| F-74 |
| Table of Contents |
Due from/to Broker
The amount recorded by the Fund for the amount due from and to the clearing broker includes, but is not limited to, cash held by the broker, amounts payable to the clearing broker related to open transactions, payables for commodities futures accounts liquidating to an equity balance on the clearing broker’s records, and amounts of brokerage commissions paid and recognized as unrealized losses.
Margin is the minimum amount of funds that must be deposited by a commodity interest trader with the trader’s broker to initiate and maintain an open position in futures contracts. A margin deposit acts to assure the trader’s performance of the futures contracts purchased or sold. Futures contracts are customarily bought and sold on initial margin that represents a very small percentage of the aggregate purchase or sales price of the contract. Because of such low margin requirements, price fluctuations occurring in the futures markets may create profits and losses that, in relation to the amount invested, are greater than customary in other forms of investment or speculation. As discussed below, adverse price changes in the futures contract may result in margin requirements that greatly exceed the initial margin. In addition, the amount of margin required in connection with a particular futures contract is set from time to time by the exchange on which the contract is traded and may be modified from time to time by the exchange during the term of the contract. Brokerage firms, such as the Fund’s clearing brokers, carrying accounts for traders in commodity interest contracts generally require higher amounts of margin as a matter of policy to further protect themselves. Over the counter trading generally involves the extension of credit between counterparties, so the counterparties may agree to require the posting of collateral by one or both parties to address credit exposure.
When a trader purchases an option, there is no margin requirement; however, the option premium must be paid in full. When a trader sells an option, on the other hand, he or she is required to deposit margin in an amount determined by the margin requirements established for the underlying interest and, in addition, an amount substantially equal to the current premium for the option. The margin requirements imposed on the selling of options, although adjusted to reflect the probability that out-of-the-money options will not be exercised, can in fact be higher than those imposed in dealing in the futures markets directly. Complicated margin requirements apply to spreads and conversions, which are complex trading strategies in which a trader acquires a mixture of options positions and positions in the underlying interest.
Ongoing or “maintenance” margin requirements are computed each day by a trader’s clearing broker. When the market value of a particular open futures contract changes to a point where the margin on deposit does not satisfy maintenance margin requirements, a margin call is made by the broker. If the margin call is not met within a reasonable time, the broker may close out the trader’s position. With respect to the Fund’s trading, the Fund (and not its shareholders personally) is subject to margin calls.
Finally, many major U.S. exchanges have passed certain cross margining arrangements involving procedures pursuant to which the futures and options positions held in an account would, in the case of some accounts, be aggregated and margin requirements would be assessed on a portfolio basis, measuring the total risk of the combined positions.
Calculation of Net Asset Value
The Fund’s NAV is calculated by:
| • | Taking the current market value of its total assets and |
| • | Subtracting any liabilities. |
The administrator, Global Fund Services, calculates the NAV of the Fund once each trading day. It calculates the NAV as of the earlier of the close of the NYSE or 4:00 p.m. (ET). The NAV for a particular trading day is released after 4:15 p.m. (ET).
In determining the value of Sugar Futures Contracts, the administrator uses the ICE closing price. The administrator determines the value of all other Fund investments as of the earlier of the close of the NYSE or 4:00 p.m. (ET). The value of over-the-counter sugar interests is determined based on the value of the commodity or futures contract underlying such sugar interest, except that a fair value may be determined if the Sponsor believes that the Fund is subject to significant credit risk relating to the counterparty to such sugar interest. For purposes of financial statements and reports, the Sponsor will recalculate the NAV where necessary to reflect the “fair value” of a Futures Contract when the Futures Contract closes at its price fluctuation limit for the day. Short term Treasury securities held by the Fund are valued by the administrator using values received from recognized third-party vendors and dealer quotes. NAV includes any unrealized profit or loss on open sugar interests and any other income or expense accruing to the Fund but unpaid or not received by the Fund.
| F-75 |
| Table of Contents |
Sponsor Fee, Allocation of Expenses and Related Party Transactions
The Sponsor is responsible for investing the assets of the Fund in accordance with the objectives and policies of the Fund. In addition, the Sponsor arranges for one or more third parties to provide administrative, custodial, accounting, transfer agency and other necessary services to the Trust and the Funds. In addition, the Sponsor has elected not to outsource services directly attributable to the Trust and the Funds such as accounting, financial reporting, regulatory compliance, and trading activities, which the Sponsor performs itself. In addition, the Fund is contractually obligated to pay a monthly management fee to the Sponsor, based on average daily net assets, at a rate equal to 1.00% per annum.
The Fund generally pays for all brokerage fees, taxes, and other expenses, including licensing fees for the use of intellectual property, registration or other fees paid to the SEC, FINRA, or any other regulatory agency in connection with the offer and sale of subsequent Shares after its initial registration and all legal, accounting, printing and other expenses associated therewith. The Fund also pays its portion of the fees and expenses associated with the Trust’s tax accounting and reporting requirements. Certain aggregate expenses common to all Funds within the Trust are allocated by the Sponsor to the respective Fund based on activity drivers deemed most appropriate by the Sponsor for such expenses, including but not limited to relative assets under management and creation order activity. These aggregate common expenses include, but are not limited to, legal, auditing, accounting and financial reporting, tax-preparation, regulatory compliance, trading activities, and insurance costs, as well as fees paid to the Distributor, which are included in the related line item in the statements of operations. A portion of these aggregate common expenses are related to the Sponsor or related parties of principals of the Sponsor; these are necessary services to the Funds, which are primarily the cost of performing accounting and financial reporting, regulatory compliance, and trading activities that are directly attributable to the Fund. Such expenses are primarily recorded as distribution and marketing fees in the financial statements of each Fund.
|
| Three months ended September 30, 2022 |
|
| Three months ended September 30, 2021 |
|
| Nine months ended September 30, 2022 |
|
| Nine months ended September 30, 2021 |
| ||||
Recognized Related Party Transactions |
| $ |
|
| $ |
|
| $ |
|
| $ |
| ||||
Waived Related Party Transactions |
| $ |
|
| $ |
|
| $ |
|
| $ |
| ||||
The Sponsor has the ability to elect to pay certain expenses on behalf of the Funds or waive the management fee. This election is subject to change by the Sponsor, at its discretion. Expenses paid by the Sponsor and Management fees waived by the Sponsor are, if applicable, presented as waived expenses in the statements of operations for each Fund. The Sponsor has determined that there will be no recovery sought for the amounts below in any future period:
|
| CANE |
| |
Three months ended September 30, 2022 |
| $ |
| |
Three months ended September 30, 2021 |
| $ |
| |
Nine months ended September 30, 2022 |
| $ |
| |
Nine months ended September 30, 2021 |
| $ |
| |
| F-76 |
| Table of Contents |
Use of Estimates
The preparation of financial statements in conformity with U.S. GAAP requires management to make estimates and assumptions that affect the reported amount of assets and liabilities and disclosure of contingent assets and liabilities at the date of the financial statements, and the reported amounts of the revenue and expenses during the reporting period. Actual results could differ from those estimates.
Fair Value – Definition and Hierarchy
In accordance with U.S. GAAP, fair value is defined as the price that would be received to sell an asset or paid to transfer a liability (i.e., the “exit price”) in an orderly transaction between market participants at the measurement date.
In determining fair value, the Fund uses various valuation approaches. In accordance with U.S. GAAP, a fair value hierarchy for inputs is used in measuring fair value that maximizes the use of observable inputs and minimizes the use of unobservable inputs by requiring that the most observable inputs be used when available. Observable inputs are those that market participants would use in pricing the asset or liability based on market data obtained from sources independent of the Fund. Unobservable inputs reflect the Fund’s assumptions about the inputs market participants would use in pricing the asset or liability developed based on the best information available in the circumstances. The fair value hierarchy is categorized into three levels based on the inputs as follows:
Level 1 – Valuations based on unadjusted quoted prices in active markets for identical assets or liabilities that the Fund has the ability to access. Valuation adjustments and block discounts are not applied to Level 1 financial instruments. Since valuations are based on quoted prices that are readily and regularly available in an active market, valuation of these financial instruments does not entail a significant degree of judgment.
Level 2 – Valuations based on quoted prices in markets that are not active or for which all significant inputs are observable, either directly or indirectly.
Level 3 – Valuations based on inputs that are unobservable and significant to the overall fair value measurement.
The availability of valuation techniques and observable inputs can vary from financial instrument to financial instrument and is affected by a wide variety of factors including, the type of financial instrument, whether the financial instrument is new and not yet established in the marketplace, and other characteristics particular to the transaction. To the extent that valuation is based on models or inputs that are less observable or unobservable in the market, the determination of fair value requires more judgment. Those estimated values do not necessarily represent the amounts that may be ultimately realized due to the occurrence of future circumstances that cannot be reasonably determined. Because of the inherent uncertainty of valuation, those estimated values may be materially higher or lower than the values that would have been used had a ready market for the financial instruments existed. Accordingly, the degree of judgment exercised by the Fund in determining fair value is greatest for financial instruments categorized in Level 3. In certain cases, the inputs used to measure fair value may fall into different levels of the fair value hierarchy. In such cases, for disclosure purposes, the level in the fair value hierarchy, within which the fair value measurement in its entirety falls, is determined based on the lowest level input that is significant to the fair value measurement.
Fair value is a market-based measure considered from the perspective of a market participant rather than an entity-specific measure. Therefore, even when market assumptions are not readily available, the Fund’s own assumptions are set to reflect those that market participants would use in pricing the asset or liability at the measurement date. The Fund uses prices and inputs that are current as of the measurement date, including periods of market dislocation. In periods of market dislocation, the observability of prices and inputs may be reduced for many financial instruments. This condition could cause a financial instrument to be reclassified to a lower level within the fair value hierarchy. When such a situation exists on a quarter close, the Sponsor will calculate the NAV on a particular day using the Level 1 valuation but will later recalculate the NAV for the impacted Fund based upon the valuation inputs from these alternative verifiable sources (Level 2 or Level 3) and will report such NAV in its applicable financial statements and reports.
| F-77 |
| Table of Contents |
On September 30, 2022 and December 31, 2021, in the opinion of the Trust and the Fund, the reported value of the Sugar Futures Contracts traded on the ICE fairly reflected the value of the Sugar Futures Contracts held by the Fund, and no adjustments were necessary. The determination is made as of the settlement of the futures contracts on the last day of trading for the reporting period. In making the determination of a Level 1 or Level 2 transfer, the Fund considers the average volume of the specific underlying futures contracts traded on the relevant exchange for the periods being reported.
For the three and nine months ended September 30, 2022 and year ended December 31, 2021, the Fund did not have any significant transfers between any of the levels of the fair value hierarchy.
The Fund records its derivative activities at fair value. Gains and losses from derivative contracts are included in the statements of operations. Derivative contracts include futures contracts related to commodity prices. Futures, which are listed on a national securities exchange, such as the CBOT and the ICE, or reported on another national market, are generally categorized in Level 1 of the fair value hierarchy. OTC derivatives contracts (such as forward and swap contracts) which may be valued using models, depending on whether significant inputs are observable or unobservable, are categorized in Levels 2 or 3 of the fair value hierarchy.
Expenses
Expenses are recorded using the accrual method of accounting.
Net Income (Loss) per Share
Net income (loss) per share is the difference between the NAV per unit at the beginning of each period and at the end of each period. The weighted average number of units outstanding was computed for purposes of disclosing net income (loss) per weighted average unit. The weighted average units are equal to the number of units outstanding at the end of the period, adjusted proportionately for units created or redeemed based on the amount of time the units were outstanding during such period.
New Accounting Pronouncements
The Financial Accounting Standards Board (“FASB”) issued Accounting Standards Update (“ASU”) 2022-03, related to fair value measurement (Topic 820) of equity securities subject to contractual sale restrictions. Under the clarified guidance, contractual restrictions on the sale of an equity security are not considered part of the unit of account of the equity security and, therefore, are not considered in measuring fair value, however they do require disclosures. The amendment was early adopted for the quarter ended June 30, 2022; the early adoption did not have a material impact on the financial statements and disclosures of the Trust or the Fund.
The FASB issued ASU 2021-05: “Leases (Topic 842).” Under the amended guidance, a lessor should classify and account for a lease with variable lease payments that don’t depend on an index or a rate as an operating lease if the lease would’ve been classified as a sales-type lease or a direct financing lease in accordance with the lease classification guidance in Topic 842 and the lessor would’ve otherwise recognized a day-one loss. The amendment was adopted early for the quarter ended September 30, 2021; the adoption did not have a material impact on the financial statements and disclosures of the Trust or the Fund.
| F-78 |
| Table of Contents |
The FASB issued ASU 2020-10: “Codification Improvements.” The amendment improves the disclosure guidance in appropriate Disclosure Sections, without resulting in changes to current GAAP. The amendment is effective for annual periods beginning after December 15, 2020. The amendment was adopted for the quarter ended March 31, 2021; the adoption did not have a material impact on the financial statements and disclosures of the Trust or the Fund.
The FASB issued 2020-02: “Financial Instruments Credit Losses (Topic 326) and Leases (Topic 842): Amendments to SEC Paragraphs Pursuant to SEC Staff Accounting Bulletin No. 119 and Update to SEC Section on Effective Date Related to Accounting Standards Update No. 2016-02, Leases (Topic 842). The amendment updates and adds language to ASU 2016-02. The amendments were adopted for the quarter ended March 31, 2020; the adoption did not have a material impact on the financial statements and disclosures of the Trust or the Fund.
The FASB issued ASU 2020-01: Investments Equity Securities (Topic 321), Investments Equity Method and Joint Ventures (Topic 323), and Derivatives and Hedging (Topic 815) Clarifying the Interactions between Topic 321, Topic 323, and Topic 815. The amendments clarify the treatment of transactions that require a company to apply or discontinue the equity method of accounting. The amendments were adopted early for the quarter ended March 31, 2020; the adoption did not have a material impact on the financial statements and disclosures of the Trust or the Fund.
The FASB issued ASU 2019-04: “Codification Improvements to Topic 326, Financial Instruments Credit Losses, Topic 815, Derivatives and hedging, and Topic 825, Financial Instruments.” The amendments clarify and improve areas of guidance related to the recently issued standards on credit losses, hedging, and recognition and measurement, specifically relating to ASU 201712. The amendments were early adopted for the quarter ended June 30, 2019; the adoption did not have a material impact on the financial statements and disclosures of the Trust or the Fund.
The FASB issued ASU 2019-01: "Leases (Topic 842): Codification Improvements. These amendments align the guidance for fair value of underlying assets by lessors that are not manufacturers or dealers in Topic 842 with that of existing guidance. The amendments were adopted for the quarter ended September 30, 2020; the adoption did not have a material impact on the financial statements and disclosures of the Trust or the Fund.
The FASB issued ASU 2018-13: “Fair Value Measurement (Topic 820): Disclosure Framework Changes to the Disclosure Requirements for Fair Value Measurement. These amendments modify public and private company fair value disclosure requirements. While some disclosures were removed or modified, others were added. The guidance is a result of the FASB’s test of the principals developed to improve the effectiveness of disclosures in the notes to the financial statements. The amendments were adopted for the quarter ended March 31, 2020; the adoption did not have a material impact on the financial statements and disclosures of the Trust or the Fund.
The FASB issued ASU 2017-13, “Revenue Recognition (Topic 605), Leases (Topic 840), and Leases (Topic 842): Amendments to SEC Paragraphs Pursuant to the Staff Announcement at the July 20, 2017 EITF Meeting and Rescission of Prior SEC Staff Announcements and Observer Comments”. The amendment amends the early adoption date option for certain companies related to adoption of ASU No. 2014-09 and ASU No. 2016-02. The SEC staff stated the SEC would not object to a public business entity that otherwise would not meet the definition of a public business entity except for a requirement to include or the inclusion of its financial statements or financial information in another entity’s filing with the SEC adopting ASC Topic 842 for fiscal years beginning after December 15, 2019, and interim periods within fiscal years beginning after December 15, 2020. The amendments were adopted for the quarter ended September 30, 2020; the adoption did not have a material impact on the financial statements and disclosures of the Trust or the Fund.
| F-79 |
| Table of Contents |
Note 4 – Fair Value Measurements
The Fund’s assets and liabilities recorded at fair value have been categorized based upon a fair value hierarchy as described in the Fund’s significant accounting policies in Note 3. The following table presents information about the Fund’s assets and liabilities measured at fair value as of September 30, 2022 and December 31, 2021:
September 30, 2022
Assets: |
| Level 1 |
|
| Level 2 |
|
| Level 3 |
|
| Balance as of September 30, 2022 |
| ||||
Cash Equivalents |
| $ |
|
| $ |
|
| $ |
|
| $ |
| ||||
|
|
|
|
|
|
|
|
|
|
|
|
|
|
|
|
|
Liabilities |
| Level 1 |
|
| Level 2 |
|
| Level 3 |
|
| Balance as of September 30, 2022 |
| ||||
Commodity Futures Contracts |
|
|
|
|
|
|
|
|
|
|
|
|
|
|
|
|
Sugar futures contracts |
| $ |
|
| $ |
|
| $ |
|
| $ |
| ||||
December 31, 2021
Assets: |
| Level 1 |
|
| Level 2 |
|
| Level 3 |
|
| Balance as of December 31, 2021 |
| ||||
Cash Equivalents |
| $ |
|
| $ |
|
| $ |
|
| $ |
| ||||
Commodity Futures Contracts |
|
|
|
|
|
|
|
|
|
|
|
|
|
|
|
|
Sugar futures contracts |
|
|
|
|
|
|
|
|
|
|
|
| ||||
Total |
| $ |
|
| $ |
|
| $ |
|
| $ |
| ||||
|
|
|
|
|
|
|
|
|
|
|
|
|
|
|
|
|
Liabilities |
| Level 1 |
|
| Level 2 |
|
| Level 3 |
|
| Balance as of December 31, 2021 |
| ||||
Sugar futures contracts |
| $ |
|
| $ |
|
| $ |
|
| $ |
| ||||
For the three and nine months ended September 30, 2022 and year ended December 31, 2021, the Fund did not have any significant transfers between any of the levels of the fair value hierarchy.
See the Fair Value – Definition and Hierarchy section in Note 3 above for an explanation of the transfers into and out of each level of the fair value hierarchy.
Note 5 – Derivative Instruments and Hedging Activities
In the normal course of business, the Fund utilizes derivative contracts in connection with its proprietary trading activities. Investments in derivative contracts are subject to additional risks that can result in a loss of all or part of an investment. The Fund’s derivative activities and exposure to derivative contracts are classified by the following primary underlying risks: interest rate, credit, commodity price, and equity price risks. In addition to its primary underlying risks, the Fund is also subject to additional counterparty risk due to inability of its counterparties to meet the terms of their contracts. For the three and nine months ended September 30, 2022 and year ended December 31, 2021, the Fund invested only in commodity futures contracts.
Futures Contracts
The Fund is subject to commodity price risk in the normal course of pursuing its investment objectives. A futures contract represents a commitment for the future purchase or sale of an asset at a specified price on a specified date.
The purchase and sale of futures contracts requires margin deposits with an FCM. Subsequent payments (variation margin) are made or received by the Fund each day, depending on the daily fluctuations in the value of the contract, and are recorded as unrealized gains or losses by the Fund. Futures contracts may reduce the Fund’s exposure to counterparty risk since futures contracts are exchange-traded; and the exchange’s clearinghouse, as the counterparty to all exchange-traded futures, guarantees the futures against default.
| F-80 |
| Table of Contents |
The Commodity Exchange Act requires an FCM to segregate all customer transactions and assets from the FCM’s proprietary activities. A customer’s cash and other equity deposited with an FCM are considered commingled with all other customer funds subject to the FCM’s segregation requirements. In the event of an FCM’s insolvency, recovery may be limited to the Fund’s pro rata share of segregated customer funds available. It is possible that the recovery amount could be less than the total of cash and other equity deposited.
The following table discloses information about offsetting assets and liabilities presented in the statements of assets and liabilities to enable users of these financial statements to evaluate the effect or potential effect of netting arrangements for recognized assets and liabilities. These recognized assets and liabilities are presented as defined in FASB ASU No. 2011-11 “Balance Sheet (Topic 210): Disclosures about Offsetting Assets and Liabilities” and subsequently clarified in FASB ASU 2013-01 “Balance Sheet (Topic 210): Clarifying the Scope of Disclosures about Offsetting Assets and Liabilities.”
The following table also identifies the fair value amounts of derivative instruments included in the statements of assets and liabilities as derivative contracts, categorized by primary underlying risk, and held by the FCMs, E D & F Man and StoneX as of September 30, 2022, and December 31, 2021.
*The amount of collateral presented in Collateral, Due from Broker, is limited to the liability for the futures contracts and accordingly does not include the excess collateral pledged.
Offsetting of Financial Liabilities and Derivative Liabilities as of September 30, 2022
|
| (i) |
|
| (ii) |
|
| (iii) = (i)-(ii) |
|
| (iv) |
|
| (v)=(iii)-(iv) |
| |||||||||
|
|
|
|
|
|
|
|
|
|
| Gross Amount Not Offset in the Statement of Assets and Liabilities |
|
|
|
| |||||||||
Description |
| Gross Amount of Recognized Liabilities |
|
| Gross Amount Offset in the Statement of Assets and Liabilities |
|
| Net Amount Presented in the Statement of Assets and Liabilities |
|
| Futures Contracts Available for Offset |
|
| Collateral, Due from Broker* |
|
| Net Amount |
| ||||||
Commodity Price |
|
|
|
|
|
|
|
|
|
|
|
|
|
|
|
|
|
| ||||||
Sugar futures contracts |
| $ |
|
| $ |
|
| $ |
|
| $ |
|
| $ |
|
| $ |
| ||||||
Offsetting of Financial Assets and Derivative Assets as of December 31, 2021
|
| (i) |
|
| (ii) |
|
| (iii) = (i)-(ii) |
|
| (iv) |
|
| (v)=(iii)-(iv) |
| |||||||||
|
|
|
|
|
|
|
|
|
|
| Gross Amount Not Offset in the Statement of Assets and Liabilities |
|
|
|
| |||||||||
Description |
| Gross Amount of Recognized Assets |
|
| Gross Amount Offset in the Statement of Assets and Liabilities |
|
| Net Amount Presented in the Statement of Assets and Liabilities |
|
| Futures Contracts Available for Offset |
|
| Collateral, Due to Broker |
|
| Net Amount |
| ||||||
Commodity Price |
|
|
|
|
|
|
|
|
|
|
|
|
|
|
|
|
|
| ||||||
Sugar futures contracts |
| $ |
|
| $ |
|
| $ |
|
| $ |
|
| $ |
|
| $ |
| ||||||
Offsetting of Financial Liabilities and Derivative Liabilities as of December 31, 2021
|
| (i) |
|
| (ii) |
|
| (iii) = (i)-(ii) |
|
| (iv) |
|
| (v)=(iii)-(iv) |
| |||||||||
|
|
|
|
|
|
|
|
|
|
| Gross Amount Not Offset in the Statement of Assets and Liabilities |
|
|
|
| |||||||||
Description |
| Gross Amount of Recognized Liabilities |
|
| Gross Amount Offset in the Statement of Assets and Liabilities |
|
| Net Amount Presented in the Statement of Assets and Liabilities |
|
| Futures Contracts Available for Offset |
|
| Collateral, Due from Broker* |
|
| Net Amount |
| ||||||
Commodity Price |
|
|
|
|
|
|
|
|
|
|
|
|
|
|
|
|
|
| ||||||
Sugar futures contracts |
| $ |
|
| $ |
|
| $ |
|
| $ |
|
| $ |
|
| $ |
| ||||||
The following tables identify the net gain and loss amounts included in the statements of operations as realized and unrealized gains and losses on trading of commodity futures contracts categorized by primary underlying risk:
| F-81 |
| Table of Contents |
Three months ended September 30, 2022
|
| Realized Loss on Commodity Futures Contracts |
|
| Net Change in Unrealized Depreciation on Commodity Futures Contracts |
| ||
Commodity Price |
|
|
|
|
|
| ||
Sugar futures contracts |
| $ | ( | ) |
| $ | ( | ) |
Three months ended September 30, 2021
|
| Realized Gain on Commodity Futures Contracts |
|
| Net Change in Unrealized Appreciation on Commodity Futures Contracts |
| ||
Commodity Price |
|
|
|
|
|
| ||
Sugar futures contracts |
| $ |
|
| $ |
| ||
Nine months ended September 30, 2022
|
| Realized Loss on Commodity Futures Contracts |
|
| Net Change in Unrealized Depreciation on Commodity Futures Contracts |
| ||
Commodity Price |
|
|
|
|
|
| ||
Sugar futures contracts |
| $ | ( | ) |
| $ | ( | ) |
Nine months ended September 30, 2021
|
| Realized Gain on Commodity Futures Contracts |
|
| Net Change in Unrealized Appreciation on Commodity Futures Contracts |
| ||
Commodity Price |
|
|
|
|
|
| ||
Sugar futures contracts |
| $ |
|
| $ |
| ||
Volume of Derivative Activities
The average notional market value categorized by primary underlying risk for all futures contracts held were $
| F-82 |
| Table of Contents |
Note 6 – Financial Highlights
The following table presents per unit performance data and other supplemental financial data for the three and nine months ended September 30, 2022 and 2021. This information has been derived from information presented in the financial statements and is presented with total expenses gross of expenses waived by the Sponsor and with total expenses net of expenses waived by the Sponsor, as appropriate.
|
| Three months ended |
|
| Three months ended |
|
| Nine months ended |
|
| Nine months ended |
| ||||
|
| September 30, 2022 |
|
| September 30, 2021 |
|
| September 30, 2022 |
|
| September 30, 2021 |
| ||||
Per Share Operation Performance |
|
|
|
|
|
|
|
|
|
|
|
| ||||
Net asset value at beginning of period |
| $ |
|
| $ |
|
| $ |
|
| $ |
| ||||
Income (loss) from investment operations: |
|
|
|
|
|
|
|
|
|
|
|
|
|
|
|
|
Investment income |
|
|
|
|
|
|
|
|
|
|
|
| ||||
Net realized and unrealized (loss) gain on commodity futures contracts |
|
| ( | ) |
|
|
|
|
| ( | ) |
|
|
| ||
Total expenses, net |
|
| ( | ) |
|
| ( | ) |
|
| ( | ) |
|
| ( | ) |
Net (decrease) increase in net asset value |
|
| ( | ) |
|
|
|
|
| ( | ) |
|
|
| ||
Net asset value at end of period |
| $ |
|
| $ |
|
| $ |
|
| $ |
| ||||
Total Return |
|
| ( | )% |
|
| % |
|
| ( | )% |
|
| % | ||
Ratios to Average Net Assets (Annualized) |
|
|
|
|
|
|
|
|
|
|
|
|
|
|
|
|
Total expenses |
|
| % |
|
| % |
|
| % |
|
| % | ||||
Total expenses, net |
|
| % |
|
| % |
|
| % |
|
| % | ||||
Net investment income (loss) |
|
| % |
|
| ( | )% |
|
| ( | )% |
|
| ( | )% | |
The financial highlights per share data are calculated consistent with the methodology used to calculate asset-based fees and expenses.
Note 7 – Organizational and Offering Costs
Expenses incurred in organizing of the Trust and the initial offering of the Shares of the Fund, including applicable SEC registration fees, were borne directly by the Sponsor. The Fund will not be obligated to reimburse the Sponsor.
Note 8 – Subsequent Events
Management has evaluated the financial statements for the quarter-ended September 30, 2022 for subsequent events through the date of this filing and noted no material events requiring either recognition through the date of the filing or disclosure herein for the Fund.
| F-83 |
| Table of Contents |
TEUCRIUM WHEAT FUND
STATEMENTS OF ASSETS AND LIABILITIES
|
| September 30, 2022 |
|
| December 31, 2021 |
| ||
|
| (Unaudited) |
|
|
|
| ||
Assets |
|
|
|
|
|
| ||
Cash and cash equivalents |
| $ |
|
| $ |
| ||
Interest receivable |
|
|
|
|
|
| ||
Other assets |
|
|
|
|
|
| ||
Equity in trading accounts: |
|
|
|
|
|
|
|
|
Commodity futures contracts |
|
|
|
|
|
| ||
Due from broker |
|
|
|
|
|
| ||
Total equity in trading accounts |
|
|
|
|
|
| ||
Total assets |
|
|
|
|
|
| ||
|
|
|
|
|
|
|
|
|
Liabilities |
|
|
|
|
|
|
|
|
Management fee payable to Sponsor |
|
|
|
|
|
| ||
Other liabilities |
|
|
|
|
|
| ||
Equity in trading accounts: |
|
|
|
|
|
|
|
|
Commodity futures contracts |
|
|
|
|
|
| ||
Due to broker |
|
|
|
|
|
| ||
Total equity in trading accounts |
|
|
|
|
|
| ||
Total liabilities |
|
|
|
|
|
| ||
|
|
|
|
|
|
|
|
|
Net assets |
| $ |
|
| $ |
| ||
|
|
|
|
|
|
|
|
|
Shares outstanding |
|
|
|
|
|
| ||
|
|
|
|
|
|
|
|
|
Shares authorized |
| * |
|
|
|
| ||
|
|
|
|
|
|
|
|
|
Net asset value per share |
| $ |
|
| $ |
| ||
|
|
|
|
|
|
|
|
|
Market value per share |
| $ |
|
| $ |
| ||
* On March 9, 2022, the Teucrium Wheat Fund registered an indeterminate number of shares of the Fund pursuant to Rule 456(d) under the Securities Act of 1933.
The accompanying notes are an integral part of these financial statements.
| F-84 |
| Table of Contents |
TEUCRIUM WHEAT FUND
SCHEDULE OF INVESTMENTS
September 30, 2022
(Unaudited)
|
|
|
|
| Percentage of |
|
|
|
| |||
Description: Assets |
| Fair Value |
|
| Net Assets |
|
| Shares |
| |||
|
|
|
|
|
|
|
|
|
| |||
Cash equivalents |
|
|
|
|
|
|
|
|
| |||
Money market funds |
|
|
|
|
|
|
|
|
| |||
First American Government Obligations Fund - Class X (cost $90,511,696) |
| $ |
|
|
| % |
|
|
| |||
Goldman Sachs Financial Square Government Fund - Institutional Class (cost: $99,844,266) |
|
|
|
|
|
|
|
|
| |||
Total money market funds (cost: $191,355,962) |
| $ |
|
|
| % |
|
|
|
| ||
|
|
|
|
|
|
|
|
|
|
|
|
|
|
|
|
|
|
|
|
|
|
| Principal Amount |
| |
Commercial Paper |
|
|
|
|
|
|
|
|
|
|
|
|
American Electric Power Company, Inc. 3.465% (cost: $4,983,327 due 11/03/2022) |
| $ |
|
|
| % |
|
|
| |||
AT&T Inc. 3.277% (cost: $7,453,425 due 11/28/2022) |
|
|
|
|
|
|
|
|
| |||
Brookfield Infrastructure Holdings (Canada) Inc. 3.540% (cost: $7,460,625 due 11/15/2022) |
|
|
|
|
|
|
|
|
| |||
Crown Castle Inc. 3.234% (cost: $2,487,556 due 11/10/2022) |
|
|
|
|
|
|
|
|
| |||
Crown Castle Inc. 3.806% (cost: $2,018,551 due 11/23/2022) |
|
|
|
|
|
|
|
|
| |||
E. I. du Pont de Nemours and Company 3.336% (cost: $12,435,835 due 11/21/2022) |
|
|
|
|
|
|
|
|
| |||
Entergy Corporation 3.030% (cost: $2,487,500 due 11/14/2022) |
|
|
|
|
|
|
|
|
| |||
Entergy Corporation 3.163% (cost: $9,922,713 due 11/28/2022) |
|
|
|
|
|
|
|
|
| |||
Fortune Brands Home & Security, Inc. 3.040% (cost: $2,488,922 due 10/21/2022) |
|
|
|
|
|
|
|
|
| |||
Fortune Brands Home & Security, Inc. 3.754% (cost: $2,984,851 due 11/18/2022) |
|
|
|
|
|
|
|
|
| |||
General Motors Financial Company, Inc. 2.929% (cost: $4,971,806 due 10/14/2022) |
|
|
|
|
|
|
|
|
| |||
General Motors Financial Company, Inc. 2.878% (cost: $2,487,531 due 10/17/2022) |
|
|
|
|
|
|
|
|
| |||
General Motors Financial Company, Inc. 3.042% (cost: $4,971,154 due 11/08/2022) |
|
|
|
|
|
|
|
|
| |||
Glencore Funding LLC 2.856% (cost: $4,978,775 due 10/03/2022) |
|
|
|
|
|
|
|
|
| |||
Glencore Funding LLC 2.898% (cost: $2,487,444 due 10/18/2022) |
|
|
|
|
|
|
|
|
| |||
Harley-Davidson Financial Services, Inc. 2.824% (cost: $2,491,833 due 10/18/2022) |
|
|
|
|
|
|
|
|
| |||
Harley-Davidson Financial Services, Inc. 3.487% (cost: $2,489,698 due 11/03/2022) |
|
|
|
|
|
|
|
|
| |||
Humana Inc. 2.518% (cost: $4,989,236 due 10/03/2022) |
|
|
|
|
|
|
|
|
| |||
ITT Inc. 2.795% (cost: $9,956,911 due 10/11/2022) |
|
|
|
|
|
|
|
|
| |||
ITT Inc. 2.683% (cost: $2,491,133 due 10/24/2022) |
|
|
|
|
|
|
|
|
| |||
Jabil Inc. 3.079% (cost: $4,983,479 due 10/17/2022) |
|
|
|
|
|
|
|
|
| |||
Jabil Inc. 3.129% (cost: $7,476,750 due 10/21/2022) |
|
|
|
|
|
|
|
|
| |||
ONEOK, Inc. 3.158% (cost: $4,987,828 due 10/14/2022) |
|
|
|
|
|
|
|
|
| |||
ONEOK, Inc. 3.159% (cost: $4,987,393 due 10/14/2022) |
|
|
|
|
|
|
|
|
| |||
PVH Corp. 3.535% (cost: $2,493,681 due 10/19/2022) |
|
|
|
|
|
|
|
|
| |||
PVH Corp. 3.434% (cost: $4,986,306 due 10/21/2022) |
|
|
|
|
|
|
|
|
| |||
V.F. Corporation 2.539% (cost: $4,986,350 due 10/11/2022) |
|
|
|
|
|
|
|
|
| |||
Viatris Inc. 3.473% (cost: $7,487,100 due 10/14/2022) |
|
|
|
|
|
|
|
|
| |||
Total Commercial Paper (cost: $139,427,713) |
| $ |
|
|
| % |
|
|
|
| ||
Total Cash Equivalents |
| $ |
|
|
| % |
|
|
|
| ||
|
|
|
|
|
|
|
|
|
|
|
|
|
|
|
|
|
|
|
|
|
|
| Notional Amount |
| |
|
|
|
|
|
|
|
|
|
| (Long Exposure) |
| |
Commodity futures contracts |
|
|
|
|
|
|
|
|
|
|
|
|
United States wheat futures contracts |
|
|
|
|
|
|
|
|
|
|
|
|
CBOT wheat futures MAR23 (2,854 contracts) |
| $ |
|
|
| % |
| $ |
| |||
CBOT wheat futures MAY23 (2,430 contracts) |
|
|
|
|
|
|
|
|
| |||
Total commodity futures contracts |
| $ |
|
|
| % |
| $ |
| |||
|
|
|
|
|
|
|
|
|
|
|
|
|
|
|
|
|
|
| Percentage of |
|
| Notional Amount |
| ||
Description: Liabilities |
| Fair Value |
|
| Net Assets |
|
| (Long Exposure) |
| |||
|
|
|
|
|
|
|
|
|
|
|
|
|
Commodity futures contracts |
|
|
|
|
|
|
|
|
|
|
|
|
United States wheat futures contracts |
|
|
|
|
|
|
|
|
|
|
|
|
CBOT wheat futures DEC23 (2,899 contracts) |
| $ |
|
|
| % |
| $ |
| |||
The accompanying notes are an integral part of these financial statements.
| F-85 |
| Table of Contents |
TEUCRIUM WHEAT FUND
SCHEDULE OF INVESTMENTS
December 31, 2021
|
|
|
|
| Percentage of |
|
|
|
| |||
Description: Assets |
| Fair Value |
|
| Net Assets |
|
| Shares |
| |||
|
|
|
|
|
|
|
|
|
| |||
Cash equivalents |
|
|
|
|
|
|
|
|
| |||
Money market funds |
|
|
|
|
|
|
|
|
| |||
First American Government Obligations Fund - Class X 0.026% (cost $5,281,765) |
| $ |
|
|
| % |
|
|
| |||
Goldman Sachs Financial Square Government Fund - Institutional Class 0.030% (cost $3,228) |
|
|
|
|
|
|
|
|
| |||
Total money market funds (cost: $5,284,993) |
| $ |
|
|
| % |
|
|
|
| ||
|
|
|
|
|
|
|
|
|
|
|
|
|
|
|
|
|
|
|
|
|
|
| Principal Amount |
| |
Commercial Paper |
|
|
|
|
|
|
|
|
|
|
|
|
Albemarle Corporation 0.181% (cost: $2,499,081 due 01/31/2022) |
| $ |
|
|
| % |
|
|
| |||
Albemarle Corporation 0.200% (cost: $2,499,417 due 01/11/2022) |
|
|
|
|
|
|
|
|
| |||
Brookfield Infrastructure Holdings (Canada) Inc. 0.170% (cost: $2,499,021 due 01/25/2022) |
|
|
|
|
|
|
|
|
| |||
Conagra Brands, Inc. 0.160% (cost: $2,499,300 due 01/05/2022) |
|
|
|
|
|
|
|
|
| |||
General Motors Financial Company, Inc. 0.160% (cost: $2,499,000 due 01/06/2022) |
|
|
|
|
|
|
|
|
| |||
General Motors Financial Company, Inc. 0.200% (cost: $2,498,778 due 01/31/2022) |
|
|
|
|
|
|
|
|
| |||
Harley-Davidson Financial Services, Inc. 0.167% (cost: $2,499,015 due 01/13/2022) |
|
|
|
|
|
|
|
|
| |||
Harley-Davidson Financial Services, Inc. 0.170% (cost: $2,498,938 due 02/01/2022) |
|
|
|
|
|
|
|
|
| |||
Harley-Davidson Financial Services, Inc. 0.250% (cost: $2,498,664 due 03/02/2022) |
|
|
|
|
|
|
|
|
| |||
Jabil Inc. 0.300% (cost: $2,498,688 due 02/08/2022) |
|
|
|
|
|
|
|
|
| |||
Jabil Inc. 0.310% (cost: $2,498,450 due 02/25/2022) |
|
|
|
|
|
|
|
|
| |||
Viatris Inc. 0.300% (cost: $2,498,313 due 02/11/2022) |
|
|
|
|
|
|
|
|
| |||
Viatris Inc. 0.200% (cost: $2,499,292 due 01/21/2022) |
|
|
|
|
|
|
|
|
| |||
Viatris Inc. 0.310% (cost: $2,498,493 due 03/01/2022) |
|
|
|
|
|
|
|
|
| |||
WGL Holdings, Inc. 0.220% (cost: $2,499,343 due 01/12/2022) |
|
|
|
|
|
|
|
|
| |||
Total Commercial Paper (cost: $37,483,793) |
| $ |
|
|
| % |
|
|
|
| ||
Total Cash Equivalents |
| $ |
|
|
| % |
|
|
|
| ||
|
|
|
|
|
|
|
|
|
|
|
|
|
|
|
|
|
|
|
|
|
|
| Notional Amount |
| |
|
|
|
|
|
|
|
|
|
| (Long Exposure) |
| |
Commodity futures contracts |
|
|
|
|
|
|
|
|
|
|
|
|
United States wheat futures contracts |
|
|
|
|
|
|
|
|
|
|
|
|
CBOT wheat futures MAY22 (687 contracts) |
| $ |
|
|
| % |
| $ |
| |||
CBOT wheat futures DEC22 (686 contracts) |
|
|
|
|
|
|
|
|
| |||
Total commodity futures contracts |
| $ |
|
|
| % |
| $ |
| |||
|
|
|
|
|
|
|
|
|
|
|
|
|
|
|
|
|
|
| Percentage of |
|
| Notional Amount |
| ||
Description: Liabilities |
| Fair Value |
|
| Net Assets |
|
| (Long Exposure) |
| |||
|
|
|
|
|
|
|
|
|
|
|
|
|
Commodity futures contracts |
|
|
|
|
|
|
|
|
|
|
|
|
United States wheat futures contracts |
|
|
|
|
|
|
|
|
|
|
|
|
CBOT wheat futures JUL22 (593 contracts) |
| $ |
|
|
| % |
| $ |
| |||
The accompanying notes are an integral part of these financial statements.
| F-86 |
| Table of Contents |
TEUCRIUM WHEAT FUND
STATEMENTS OF OPERATIONS
(Unaudited)
|
| Three months ended |
|
| Three months ended |
|
| Nine months ended |
|
| Nine months ended |
| ||||
|
| September 30, 2022 |
|
| September 30, 2021 |
|
| September 30, 2022 |
|
| September 30, 2021 |
| ||||
Income |
|
|
|
|
|
|
|
|
|
|
|
| ||||
Realized and unrealized gain (loss) on trading of commodity futures contracts: |
|
|
|
|
|
|
|
|
|
|
|
| ||||
Realized (loss) gain on commodity futures contracts |
| $ | ( | ) |
| $ |
|
| $ | ( | ) |
| $ |
| ||
Net change in unrealized appreciation/(depreciation) on commodity futures contracts |
|
|
|
|
|
|
|
| ( | ) |
|
| ( | ) | ||
Interest income |
|
|
|
|
|
|
|
|
|
|
|
| ||||
Total income (loss) |
|
|
|
|
|
|
|
| ( | ) |
|
|
| |||
|
|
|
|
|
|
|
|
|
|
|
|
|
|
|
|
|
Expenses |
|
|
|
|
|
|
|
|
|
|
|
|
|
|
|
|
Management fees |
|
|
|
|
|
|
|
|
|
|
|
| ||||
Professional fees |
|
|
|
|
|
|
|
|
|
|
|
| ||||
Distribution and marketing fees |
|
|
|
|
|
|
|
|
|
|
|
| ||||
Custodian fees and expenses |
|
|
|
|
|
|
|
|
|
|
|
| ||||
Business permits and licenses fees |
|
|
|
|
|
|
|
|
|
|
|
| ||||
General and administrative expenses |
|
|
|
|
|
|
|
|
|
|
|
| ||||
Total expenses |
|
|
|
|
|
|
|
|
|
|
|
| ||||
|
|
|
|
|
|
|
|
|
|
|
|
|
|
|
|
|
Expenses waived by the Sponsor |
|
|
|
|
| ( | ) |
|
| ( | ) |
|
| ( | ) | |
|
|
|
|
|
|
|
|
|
|
|
|
|
|
|
|
|
Total expenses, net |
|
|
|
|
|
|
|
|
|
|
|
| ||||
|
|
|
|
|
|
|
|
|
|
|
|
|
|
|
|
|
Net income (loss) |
| $ |
|
| $ |
|
| $ | ( | ) |
| $ |
| |||
|
|
|
|
|
|
|
|
|
|
|
|
|
|
|
|
|
Net gain per share |
| $ |
|
| $ |
|
| $ |
|
| $ |
| ||||
Net income (loss) per weighted average share |
| $ |
|
| $ |
|
| $ | ( | ) |
| $ |
| |||
Weighted average shares outstanding |
|
|
|
|
|
|
|
|
|
|
|
| ||||
The accompanying notes are an integral part of these financial statements.
| F-87 |
| Table of Contents |
TEUCRIUM WHEAT FUND
STATEMENTS OF CHANGES IN NET ASSETS
(Unaudited)
|
| Nine months ended |
|
| Nine months ended |
| ||
|
| September 30, 2022 |
|
| September 30, 2021 |
| ||
Operations |
|
|
|
|
|
| ||
Net (loss) income |
| $ | ( | ) |
| $ |
| |
Capital transactions |
|
|
|
|
|
|
|
|
Issuance of Shares |
|
|
|
|
|
| ||
Redemption of Shares |
|
| ( | ) |
|
| ( | ) |
Total capital transactions |
|
|
|
|
| ( | ) | |
Net change in net assets |
|
|
|
|
|
| ||
|
|
|
|
|
|
|
|
|
Net assets, beginning of period |
| $ |
|
| $ |
| ||
|
|
|
|
|
|
|
|
|
Net assets, end of period |
| $ |
|
| $ |
| ||
|
|
|
|
|
|
|
|
|
Net asset value per share at beginning of period |
| $ |
|
| $ |
| ||
|
|
|
|
|
|
|
|
|
Net asset value per share at end of period |
| $ |
|
| $ |
| ||
|
|
|
|
|
|
|
|
|
Creation of Shares |
|
|
|
|
|
| ||
Redemption of Shares |
|
|
|
|
|
| ||
The accompanying notes are an integral part of these financial statements.
| F-88 |
| Table of Contents |
TEUCRIUM WHEAT FUND
STATEMENTS OF CASH FLOWS
(Unaudited)
|
| Nine months ended |
|
| Nine months ended |
| ||
|
| September 30, 2022 |
|
| September 30, 2021 |
| ||
Cash flows from operating activities: |
|
|
|
|
|
| ||
Net (loss) income |
| $ | ( | ) |
| $ |
| |
Adjustments to reconcile net (loss) income to net cash (used in) provided by operating activities: |
|
|
|
|
|
|
|
|
Net change in unrealized depreciation on commodity futures contracts |
|
|
|
|
|
| ||
Changes in operating assets and liabilities: |
|
|
|
|
|
|
|
|
Due from broker |
|
| ( | ) |
|
| ( | ) |
Interest receivable |
|
| ( | ) |
|
| ( | ) |
Other assets |
|
| ( | ) |
|
|
| |
Due to broker |
|
| ( | ) |
|
| ( | ) |
Payable for purchases of commercial paper |
|
|
|
|
|
| ||
Management fee payable to Sponsor |
|
|
|
|
| ( | ) | |
Other liabilities |
|
|
|
|
|
| ||
Net cash (used in) provided by operating activities |
|
| ( | ) |
|
|
| |
|
|
|
|
|
|
|
|
|
Cash flows from financing activities: |
|
|
|
|
|
|
|
|
Proceeds from sale of Shares |
|
|
|
|
|
| ||
Redemption of Shares |
|
| ( | ) |
|
| ( | ) |
Net cash provided by (used in) financing activities |
|
|
|
|
| ( | ) | |
|
|
|
|
|
|
|
|
|
Net change in cash and cash equivalents |
|
|
|
|
|
| ||
Cash and cash equivalents, beginning of period |
|
|
|
|
|
| ||
Cash and cash equivalents, end of period |
| $ |
|
| $ |
| ||
The accompanying notes are an integral part of these financial statements.
| F-89 |
| Table of Contents |
NOTES TO FINANCIAL STATEMENTS
September 30, 2022
(Unaudited)
Note 1 – Organization and Operation
Teucrium Wheat Fund (referred to herein as “WEAT” or the “Fund”) is a commodity pool that is a series of Teucrium Commodity Trust (“Trust”), a Delaware statutory trust formed on September 11, 2009. The Fund issues common units, called the “Shares,” representing fractional undivided beneficial interests in the Fund. The Fund continuously offers Creation Baskets consisting of
The investment objective of WEAT is to have the daily changes in the NAV of the Fund’s Shares reflect the daily changes in the wheat market for future delivery as measured by the Benchmark. The Benchmark is a weighted average of the closing settlement prices for three futures contracts for wheat (“Wheat Futures Contracts”) that are traded on the Chicago Board of Trade (“CBOT”):
WEAT Benchmark
CBOT Wheat Futures Contract |
| Weighting |
| |
Second to expire |
|
| % | |
Third to expire |
|
| % | |
December following the third to expire |
|
| % | |
The Fund commenced investment operations on September 19, 2011 and has a fiscal year ending December 31. The Fund’s sponsor is Teucrium Trading, LLC (the “Sponsor”). The Sponsor is responsible for the management of the Fund. The Sponsor is registered as a commodity pool operator (“CPO”) and a commodity trading adviser (“CTA”) with the Commodity Futures Trading Commission (“CFTC”) and is a member of the National Futures Association (“NFA”).
On June 13, 2011, the Fund’s initial registration of
The accompanying unaudited financial statements have been prepared in accordance with Rule 10-01 of Regulation S-X promulgated by the SEC and, therefore, do not include all information and footnote disclosures required under accounting principles generally accepted in the United States of America (“GAAP”). The financial information included herein is unaudited; however, such financial information reflects all adjustments which are, in the opinion of management, necessary for the fair presentation of the Fund’s financial statements for the interim period. It is suggested that these interim financial statements be read in conjunction with the financial statements and related notes included in the Trust’s Annual Report on Form 10-K, as well as the most recent Form S-1 filing, as applicable. The operating results for the three and nine months ended September 30, 2022 are not necessarily indicative of the results to be expected for the full year ending December 31, 2022.
Subject to the terms of the Trust Agreement, Teucrium Trading, LLC, in its capacity as the Sponsor (“Sponsor”), may terminate a Fund at any time, regardless of whether the Fund has incurred losses, including, for instance, if it determines that the Fund’s aggregate net assets in relation to its operating expenses make the continued operation of the Fund unreasonable or imprudent. However, no level of losses will require the Sponsor to terminate a Fund.
Note 2 – Principal Contracts and Agreements
The Sponsor employs U.S. Bancorp Fund Services, LLC, doing business as U.S. Bank Global Fund Services (“Global Fund Services”), for Transfer Agency, Fund Accounting and Fund Administration services. The principal address for Global Fund Services is 615 E. Michigan Street, Milwaukee, WI 53202.
| F-90 |
| Table of Contents |
The Sponsor employs Foreside Fund Services, LLC (“Foreside” or the “Distributor”) as the Distributor for the Funds. The Distribution Services Agreement among the Distributor and the Sponsor calls for the Distributor to work with the Custodian in connection with the receipt and processing of orders for Creation Baskets and Redemption Baskets and the review and approval of all Fund sales literature and advertising materials. The Distributor and the Sponsor have also entered into a Securities Activities and Service Agreement (the “SASA”) under which certain employees and officers of the Sponsor are licensed as registered representatives or registered principals of the Distributor, under Financial Industry Regulatory Authority (“FINRA”) rules.
E D & F Man Capital Markets, Inc. (“E D & F Man”) and StoneX Financial Inc. (“StoneX”) serve as the Funds’ clearing brokers to execute and clear futures contracts and provide other brokerage-related services. E D & F Man and StoneX are each registered as futures commission merchants (“FCM”) with the U.S. CFTC and are members of the NFA. The clearing brokers are registered as broker-dealers with the SEC and are each a member of FINRA. ED & F Man and StoneX are each clearing members of ICE Futures U.S., Inc., Chicago Board of Trade, Chicago Mercantile Exchange, New York Mercantile Exchange, and all other major United States commodity exchanges. For Corn, Soybean, Sugar, and Wheat Futures Contracts E D & F Man is paid
The sole Trustee of the Trust is Wilmington Trust Company, a Delaware banking corporation. The Trustee will accept service of legal process on the Trust in the State of Delaware and will make certain filings under the Delaware Statutory Trust Act. For its services, the Trustee receives an annual fee of $3,300 from the Trust. These services are recorded in business permits and licenses fees on the statements of operations. A summary of these expenses is included below.
The Sponsor employs Thales Capital Partners LLC (“Thales”) for distribution and solicitation-related services.
|
| Three months ended September 30, 2022 |
|
| Three months ended September 30, 2021 |
|
| Nine months ended September 30, 2022 |
|
| Nine months ended September 30, 2021 |
| ||||
Amount Recognized for Custody Services |
| $ |
|
| $ |
|
| $ |
|
| $ |
| ||||
Amount of Custody Services Waived |
| $ |
|
| $ |
|
| $ |
|
| $ |
| ||||
|
|
|
|
|
|
|
|
|
|
|
|
|
|
|
|
|
Amount Recognized for Distribution Services |
| $ |
|
| $ |
|
| $ |
|
| $ |
| ||||
Amount of Distribution Services Waived |
| $ |
|
| $ |
|
| $ |
|
| $ |
| ||||
|
|
|
|
|
|
|
|
|
|
|
|
|
|
|
|
|
Amount Recognized for Wilmington Trust |
| $ |
|
| $ |
|
| $ |
|
| $ |
| ||||
Amount of Wilmington Trust Waived |
| $ |
|
| $ |
|
| $ |
|
| $ |
| ||||
|
|
|
|
|
|
|
|
|
|
|
|
|
|
|
|
|
Amount Recognized for Thales |
| $ |
|
| $ |
|
| $ |
|
| $ |
| ||||
Amount of Thales Waived |
| $ |
|
| $ |
|
| $ |
|
| $ |
| ||||
| F-91 |
| Table of Contents |
Note 3 – Summary of Significant Accounting Policies
Basis of Presentation
The accompanying financial statements have been prepared in accordance with accounting principles generally accepted in the United States of America (“U.S. GAAP”) as detailed in the Financial Accounting Standards Board’s Accounting Standards Codification.
Revenue Recognition
Commodity futures contracts are recorded on the trade date. All such transactions are recorded on the identified cost basis and marked to market daily. Unrealized appreciation or depreciation on commodity futures contracts are reflected in the statements of operations as the difference between the original contract amount and the fair market value as of the last business day of the year or as of the last date of the financial statements. Changes in the appreciation or depreciation between periods are reflected in the statements of operations. Interest on cash equivalents with financial institutions are recognized on the accrual basis. The Fund seeks to earn interest on funds held at the custodian and other financial institutions at prevailing market rates for such investments.
The Sponsor invests a portion of cash in commercial paper, which is deemed a cash equivalent based on the rating and duration of contracts as described in the notes to the financial statements and reflected in cash and cash equivalents on the statements of assets and liabilities and on the statements of cash flows. Accretion on these investments is recognized using the effective interest method in U.S. dollars and included in interest income on the statements of operations.
The Sponsor invests a portion of the cash held by the broker in short term Treasury Bills as collateral for open futures contracts. Accretion on these investments is recognized using the effective interest method in U.S. dollars and included in interest income on the statements of operations.
Brokerage Commissions
The Sponsor recognizes the expense for brokerage commissions for futures contract trades on a per-trade basis. The below table shows the amounts included on the statements of operations as total brokerage commissions paid inclusive of unrealized loss for the three and nine months ended September 30, 2022.
|
| WEAT |
| |
Three Months Ended September 30, 2022 |
| $ | 75,136 |
|
Three Months Ended September 30, 2021 |
| $ | 17,330 |
|
Nine Months Ended September 30, 2022 |
| $ | 354,679 |
|
Nine Months Ended September 30, 2021 |
| $ | 39,852 |
|
| F-92 |
| Table of Contents |
Income Taxes
For federal income tax purposes, the Fund will be treated as a publicly traded partnership. A publicly traded partnership is generally treated as a corporation for federal income tax purposes unless 90% or more of the publicly traded partnership’s gross income for each taxable year of its existence consists of qualifying income as defined in section 7704(d) of the Internal Revenue Code of 1986, as amended. Qualifying income is defined as generally including, in pertinent part, interest (other than from a financial business), dividends, and gains from the sale or disposition of capital assets held for the production of interest or dividends. In the case of a partnership of which a principal activity is the buying and selling of commodities, other than as inventory, or of futures, forwards and options with respect to commodities, qualifying income also includes income and gains from commodities and from futures, forwards, options with respect to commodities and, provided the partnership is a trader or investor with respect to such assets, swaps and other notional principal contracts with respect to commodities. The Fund expects that at least 90% of the Fund’s gross income for each taxable year will consist of qualifying income and that the Fund will be taxed as a partnership for federal income tax purposes. The Fund does not record a provision for income taxes because the shareholders report their share of the Fund’s income or loss on their income tax returns. The financial statements reflect the Fund’s transactions without adjustment, if any, required for income tax purposes.
The Fund is required to determine whether a tax position is more likely than not to be sustained upon examination by the applicable taxing authority, including resolution of any related appeals or litigation processes, based on the technical merits of the position. The Fund files an income tax return in the U.S. federal jurisdiction and may file income tax returns in various U.S. states and foreign jurisdictions. For all tax years 2019 to 2021, the Fund remains subject to income tax examinations by major taxing authorities. The tax benefit recognized is measured as the largest amount of benefit that has a greater than fifty percent likelihood of being realized upon ultimate settlement. De-recognition of a tax benefit previously recognized results in the Fund recording a tax liability that reduces net assets. Based on its analysis, the Fund has determined that it has not incurred any liability for unrecognized tax benefits as of September 30, 2022 and for the years ended December 31, 2021, 2020 and 2019. However, the Fund’s conclusions regarding this policy may be subject to review and adjustment at a later date based on factors including, but not limited to, ongoing analysis of and changes to tax laws, regulations, and interpretations thereof.
The Fund recognizes interest accrued related to unrecognized tax benefits and penalties related to unrecognized tax benefits in income tax fees payable, if assessed. No interest expense or penalties have been recognized as of and for the three and nine months ended September 30, 2022 and 2021.
The Fund may be subject to potential examination by U.S. federal, U.S. state, or foreign jurisdictional authorities in the area of income taxes. These potential examinations may include questioning the timing and amount of deductions, the nexus of income among various tax jurisdictions, and compliance with U.S. federal, U.S. state and foreign tax laws.
| F-93 |
| Table of Contents |
Creations and Redemptions
Authorized Purchasers may purchase Creation Baskets consisting of 25,000 shares from the Fund. The amount of the proceeds required to purchase a Creation Basket will be equal to the NAV of the shares in the Creation Basket determined as of 4:00 p.m.(ET) on the day the order to create the basket is properly received.
Authorized Purchasers may redeem shares from the Fund only in blocks of 25,000 shares called “Redemption Baskets.” The amount of the redemption proceeds for a Redemption Basket will be equal to the NAV of the shares in the Redemption Basket determined as of 4:00 p.m. (ET) on the day the order to redeem the basket is properly received.
The Fund receives or pays the proceeds from shares sold or redeemed within three business days after the trade date of the purchase or redemption. The amounts due from Authorized Purchasers are reflected in the Fund’s statements of assets and liabilities as capital shares receivable. Amounts payable to Authorized Purchasers upon redemption are reflected in the Fund’s statements of assets and liabilities as payable for shares redeemed.
As outlined in the most recent Form S-1 filing, 50,000 shares represent two Redemption Baskets for the Fund and a minimum level of shares. If the Fund experienced redemptions that caused the number of Shares outstanding to decrease to the minimum level of Shares required to be outstanding, until the minimum number of Shares is again exceeded through the purchase of a new Creation Basket, there can be no more redemptions by an Authorized Purchaser.
Allocation of Shareholder Income and Losses
Profit or loss is allocated among the shareholders of the Fund in proportion to the number of shares each shareholder holds as of the close of each month.
Cash and Cash Equivalents
Cash equivalents are highly liquid investments with maturity dates of 90 days or less when acquired. The Trust reported its cash equivalents in the statements of assets and liabilities at market value, or at carrying amounts that approximate fair value, because of their highly liquid nature and short-term maturities. Each Fund that is a series of the Trust has the balance of its cash equivalents on deposit with financial institutions. The Fund holds a balance in money market funds that is included in cash and cash equivalents on the statements of assets and liabilities. The Sponsor invests a portion of the available cash for the Funds in alternative demand deposit savings accounts, which is classified as cash and not as cash equivalents. Assets deposited with the bank may, at times, exceed federally insured limits. The Sponsor invests a portion of the available cash for the Funds in investment grade commercial paper with durations of 90 days or less, which is classified as a cash equivalent and is not FDIC insured. The Sponsor may invest a portion of the cash held by the broker in short term Treasury Bills as collateral for open futures contracts, which is classified as a cash equivalent and is not FDIC insured.
|
| September 30, 2022 |
|
| December 31, 2021 |
| ||
Money Market Funds |
| $ |
|
| $ |
| ||
Demand Deposit Savings Accounts |
|
|
|
|
|
| ||
Commercial Paper |
|
|
|
|
|
| ||
Total cash and cash equivalents as presented on the Statement of Assets and Liabilities |
| $ |
|
| $ |
| ||
| F-94 |
| Table of Contents |
Payable for Purchases of Commercial Paper
The amount recorded by the Fund for commercial paper transactions awaiting settlement, represents the amount payable for contracts purchased but not yet settled as of the reporting date. The value of the contract is included in cash and cash equivalents, and the payable amount is included as a liability.
Due from/to Broker
The amount recorded by the Fund for the amount due from and to the clearing broker includes, but is not limited to, cash held by the broker, amounts payable to the clearing broker related to open transactions, payables for commodities futures accounts liquidating to an equity balance on the clearing broker’s records and amounts of brokerage commissions paid and recognized as unrealized losses.
Margin is the minimum amount of funds that must be deposited by a commodity interest trader with the trader’s broker to initiate and maintain an open position in futures contracts. A margin deposit acts to assure the trader’s performance of the futures contracts purchased or sold. Futures contracts are customarily bought and sold on initial margin that represents a very small percentage of the aggregate purchase or sales price of the contract. Because of such low margin requirements, price fluctuations occurring in the futures markets may create profits and losses that, in relation to the amount invested, are greater than customary in other forms of investment or speculation. As discussed below, adverse price changes in the futures contract may result in margin requirements that greatly exceed the initial margin. In addition, the amount of margin required in connection with a particular futures contract is set from time to time by the exchange on which the contract is traded and may be modified from time to time by the exchange during the term of the contract. Brokerage firms, such as the Fund’s clearing brokers, carrying accounts for traders in commodity interest contracts generally require higher amounts of margin as a matter of policy to further protect themselves. Over the counter trading generally involves the extension of credit between counterparties, so the counterparties may agree to require the posting of collateral by one or both parties to address credit exposure.
When a trader purchases an option, there is no margin requirement; however, the option premium must be paid in full. When a trader sells an option, on the other hand, he or she is required to deposit margin in an amount determined by the margin requirements established for the underlying interest and, in addition, an amount substantially equal to the current premium for the option. The margin requirements imposed on the selling of options, although adjusted to reflect the probability that out-of-the-money options will not be exercised, can in fact be higher than those imposed in dealing in the futures markets directly. Complicated margin requirements apply to spreads and conversions, which are complex trading strategies in which a trader acquires a mixture of options positions and positions in the underlying interest.
Ongoing or “maintenance” margin requirements are computed each day by a trader’s clearing broker. When the market value of a particular open futures contract changes to a point where the margin on deposit does not satisfy maintenance margin requirements, a margin call is made by the broker. If the margin call is not met within a reasonable time, the broker may close out the trader’s position. With respect to the Fund’s trading, the Fund (and not its shareholders personally) is subject to margin calls.
Finally, many major U.S. exchanges have passed certain cross margining arrangements involving procedures pursuant to which the futures and options positions held in an account would, in the case of some accounts, be aggregated and margin requirements would be assessed on a portfolio basis, measuring the total risk of the combined positions.
Calculation of Net Asset Value
The Fund’s NAV is calculated by:
| • | Taking the current market value of its total assets and |
| • | Subtracting any liabilities. |
| F-95 |
| Table of Contents |
The administrator, Global Fund Services, calculates the NAV of the Fund once each trading day. It calculates the NAV as of the earlier of the close of the NYSE or 4:00 p.m. (ET). The NAV for a particular trading day is released after 4:15 p.m. (ET).
In determining the value of Wheat Futures Contracts, the administrator uses the CBOT closing price. The administrator determines the value of all other Fund investments as of the earlier of the close of the NYSE or 4:00 p.m. (ET). The value of over-the-counter wheat interests is determined based on the value of the commodity or futures contract underlying such wheat interest, except that a fair value may be determined if the Sponsor believes that the Fund is subject to significant credit risk relating to the counterparty to such wheat interest. For purposes of financial statements and reports, the Sponsor will recalculate the NAV where necessary to reflect the “fair value” of a Futures Contract when the Futures Contract closes at its price fluctuation limit for the day. Short term Treasury securities held by the Fund are valued by the administrator using values received from recognized third-party vendors and dealer quotes. NAV includes any unrealized profit or loss on open wheat interests and any other income or expense accruing to the Fund but unpaid or not received by the Fund.
Sponsor Fee, Allocation of Expenses and Related Party Transactions
The Sponsor is responsible for investing the assets of the Fund in accordance with the objectives and policies of the Fund. In addition, the Sponsor arranges for one or more third parties to provide administrative, custodial, accounting, transfer agency and other necessary services to the Trust and the Funds. In addition, the Sponsor elected not to outsource services directly attributable to the Trust and the Funds such as accounting, financial reporting, regulatory compliance, and trading activities, which the Sponsor performs itself. In addition, the Fund is contractually obligated to pay a monthly management fee to the Sponsor, based on average daily net assets, at a rate equal to 1.00% per annum.
The Fund generally pays for all brokerage fees, taxes, and other expenses, including licensing fees for the use of intellectual property, registration or other fees paid to the SEC, FINRA, or any other regulatory agency in connection with the offer and sale of subsequent Shares after its initial registration and all legal, accounting, printing and other expenses associated therewith. The Fund also pays its portion of the fees and expenses associated with the Trust’s tax accounting and reporting requirements. Certain aggregate expenses common to all Funds within the Trust are allocated by the Sponsor to the respective Fund based on activity drivers deemed most appropriate by the Sponsor for such expenses, including but not limited to relative assets under management and creation order activity. These aggregate common expenses include, but are not limited to, legal, auditing, accounting and financial reporting, tax-preparation, regulatory compliance, trading activities, and insurance costs, as well as fees paid to the Distributor, which are included in the related line item in the statements of operations. A portion of these aggregate common expenses are related to the Sponsor or related parties of principals of the Sponsor; these are necessary services to the Funds, which are primarily the cost of performing accounting and financial reporting, regulatory compliance, and trading activities that are directly attributable to the Fund. Such expenses are primarily recorded as distribution and marketing fees in the financial statements of each Fund.
|
| Three months ended September 30, 2022 |
|
| Three months ended September 30, 2021 |
|
| Nine months ended September 30, 2022 |
|
| Nine months ended September 30, 2021 |
| ||||
Recognized Related Party Transactions |
| $ |
|
| $ |
|
| $ |
|
| $ |
| ||||
Waived Related Party Transactions |
| $ |
|
| $ |
|
| $ |
|
| $ |
| ||||
The Sponsor has the ability to elect to pay certain expenses on behalf of the Funds or waive the management fee. This election is subject to change by the Sponsor, at its discretion. Expenses paid by the Sponsor and Management fees waived by the Sponsor are, if applicable, presented as waived expenses in the statements of operations for each Fund. The Sponsor has determined that there will be no recovery sought for the amounts below in any future period:
|
| WEAT |
| |
Three months ended September 30, 2022 |
| $ |
| |
Three months ended September 30, 2021 |
| $ |
| |
Nine months ended September 30, 2022 |
| $ |
| |
Nine months ended September 30, 2021 |
| $ |
| |
| F-96 |
| Table of Contents |
Use of Estimates
The preparation of financial statements in conformity with U.S. GAAP requires management to make estimates and assumptions that affect the reported amount of assets and liabilities and disclosure of contingent assets and liabilities at the date of the financial statements, and the reported amounts of the revenue and expenses during the reporting period. Actual results could differ from those estimates.
Fair Value - Definition and Hierarchy
In accordance with U.S. GAAP, fair value is defined as the price that would be received to sell an asset or paid to transfer a liability (i.e., the “exit price”) in an orderly transaction between market participants at the measurement date.
In determining fair value, the Fund uses various valuation approaches. In accordance with U.S. GAAP, a fair value hierarchy for inputs is used in measuring fair value that maximizes the use of observable inputs and minimizes the use of unobservable inputs by requiring that the most observable inputs be used when available. Observable inputs are those that market participants would use in pricing the asset or liability based on market data obtained from sources independent of the Fund. Unobservable inputs reflect the Fund’s assumptions about the inputs market participants would use in pricing the asset or liability developed based on the best information available in the circumstances. The fair value hierarchy is categorized into three levels based on the inputs as follows:
Level 1 - Valuations based on unadjusted quoted prices in active markets for identical assets or liabilities that the Fund has the ability to access. Valuation adjustments and block discounts are not applied to Level 1 financial instruments. Since valuations are based on quoted prices that are readily and regularly available in an active market, valuation of these financial instruments does not entail a significant degree of judgment.
Level 2 - Valuations based on quoted prices in markets that are not active or for which all significant inputs are observable, either directly or indirectly.
Level 3 - Valuations based on inputs that are unobservable and significant to the overall fair value measurement.
The availability of valuation techniques and observable inputs can vary from financial instrument to financial instrument and is affected by a wide variety of factors including, the type of financial instrument, whether the financial instrument is new and not yet established in the marketplace, and other characteristics particular to the transaction. To the extent that valuation is based on models or inputs that are less observable or unobservable in the market, the determination of fair value requires more judgment. Those estimated values do not necessarily represent the amounts that may be ultimately realized due to the occurrence of future circumstances that cannot be reasonably determined. Because of the inherent uncertainty of valuation, those estimated values may be materially higher or lower than the values that would have been used had a ready market for the financial instruments existed. Accordingly, the degree of judgment exercised by the Fund in determining fair value is greatest for financial instruments categorized in Level 3. In certain cases, the inputs used to measure fair value may fall into different levels of the fair value hierarchy. In such cases, for disclosure purposes, the level in the fair value hierarchy, within which the fair value measurement in its entirety falls, is determined based on the lowest level input that is significant to the fair value measurement.
| F-97 |
| Table of Contents |
Fair value is a market-based measure considered from the perspective of a market participant rather than an entity-specific measure. Therefore, even when market assumptions are not readily available, the Fund’s own assumptions are set to reflect those that market participants would use in pricing the asset or liability at the measurement date. The Fund uses prices and inputs that are current as of the measurement date, including periods of market dislocation. In periods of market dislocation, the observability of prices and inputs may be reduced for many financial instruments. This condition could cause a financial instrument to be reclassified to a lower level within the fair value hierarchy. When such a situation exists on a quarter close, the Sponsor will calculate the NAV on a particular day using the Level 1 valuation but will later recalculate the NAV for the impacted Fund based upon the valuation inputs from these alternative verifiable sources (Level 2 or Level 3) and will report such NAV in its applicable financial statements and reports.
On September 30, 2022 and December 31, 2021, in the opinion of the Trust and the Fund, the reported value of the Wheat Futures Contracts traded on the CBOT fairly reflected the value of the Wheat Futures Contracts held by the Fund, and no adjustments were necessary. The determination is made as of the settlement of the futures contracts on the last day of trading for the reporting period. In making the determination of a Level 1 or Level 2 transfer, the Fund considers the average volume of the specific underlying futures contracts traded on the relevant exchange for the periods being reported.
The Fund records its derivative activities at fair value. Gains and losses from derivative contracts are included in the statements of operations. Derivative contracts include futures contracts related to commodity prices. Futures, which are listed on a national securities exchange, such as the CBOT and the ICE, or reported on another national market, are generally categorized in Level 1 of the fair value hierarchy. OTC derivatives contracts (such as forward and swap contracts) which may be valued using models, depending on whether significant inputs are observable or unobservable, are categorized in Levels 2 or 3 of the fair value hierarchy.
Expenses
Expenses are recorded using the accrual method of accounting.
Net Income (Loss) per Share
Net income (loss) per share is the difference between the NAV per unit at the beginning of each period and at the end of each period. The weighted average number of units outstanding was computed for purposes of disclosing net income (loss) per weighted average unit. The weighted average units are equal to the number of units outstanding at the end of the period, adjusted proportionately for units created or redeemed based on the amount of time the units were outstanding during such period.
New Accounting Pronouncements
The Financial Accounting Standards Board (“FASB”) issued Accounting Standards Update (“ASU”) 2022-03, related to fair value measurement (Topic 820) of equity securities subject to contractual sale restrictions. Under the clarified guidance, contractual restrictions on the sale of an equity security are not considered part of the unit of account of the equity security and, therefore, are not considered in measuring fair value, however they do require disclosures. The amendment was early adopted for the quarter ended June 30, 2022; the early adoption did not have a material impact on the financial statements and disclosures of the Trust or the Fund.
The FASB issued ASU 2021-05: “Leases (Topic 842).” Under the amended guidance, a lessor should classify and account for a lease with variable lease payments that don’t depend on an index or a rate as an operating lease if the lease would’ve been classified as a sales-type lease or a direct financing lease in accordance with the lease classification guidance in Topic 842 and the lessor would’ve otherwise recognized a day-one loss. The amendment was adopted early for the quarter ended September 30, 2021; the adoption did not have a material impact on the financial statements and disclosures of the Trust or the Fund.
| F-98 |
| Table of Contents |
The FASB issued ASU 2020-10: “Codification Improvements.” The amendment improves the disclosure guidance in appropriate Disclosure Sections, without resulting in changes to current GAAP. The amendment is effective for annual periods beginning after December 15, 2020. The amendment was adopted for the quarter ended March 31, 2021; the adoption did not have a material impact on the financial statements and disclosures of the Trust or the Fund.
The FASB issued 2020-02: “Financial Instruments Credit Losses (Topic 326) and Leases (Topic 842): Amendments to SEC Paragraphs Pursuant to SEC Staff Accounting Bulletin No. 119 and Update to SEC Section on Effective Date Related to Accounting Standards Update No. 2016-02, Leases (Topic 842). The amendment updates and adds language to ASU 2016-02. The amendments were adopted for the quarter ended March 31, 2020; the adoption did not have a material impact on the financial statements and disclosures of the Trust or the Fund.
The FASB issued ASU 2020-01: Investments Equity Securities (Topic 321), Investments Equity Method and Joint Ventures (Topic 323), and Derivatives and Hedging (Topic 815) Clarifying the Interactions between Topic 321, Topic 323, and Topic 815. The amendments clarify the treatment of transactions that require a company to apply or discontinue the equity method of accounting. The amendments were adopted early for the quarter ended March 31, 2020; the adoption did not have a material impact on the financial statements and disclosures of the Trust or the Fund.
The FASB issued ASU 2019-04: “Codification Improvements to Topic 326, Financial Instruments Credit Losses, Topic 815, Derivatives and hedging, and Topic 825, Financial Instruments.” The amendments clarify and improve areas of guidance related to the recently issued standards on credit losses, hedging, and recognition and measurement, specifically relating to ASU 201712. The amendments were early adopted for the quarter ended June 30, 2019; the adoption did not have a material impact on the financial statements and disclosures of the Trust or the Fund.
The FASB issued ASU 2019-01: "Leases (Topic 842): Codification Improvements. These amendments align the guidance for fair value of underlying assets by lessors that are not manufacturers or dealers in Topic 842 with that of existing guidance. The amendments were adopted for the quarter ended September 30, 2020; the adoption did not have a material impact on the financial statements and disclosures of the Trust or the Fund.
The FASB issued ASU 2018-13: “Fair Value Measurement (Topic 820): Disclosure Framework Changes to the Disclosure Requirements for Fair Value Measurement. These amendments modify public and private company fair value disclosure requirements. While some disclosures were removed or modified, others were added. The guidance is a result of the FASB’s test of the principals developed to improve the effectiveness of disclosures in the notes to the financial statements. The amendments were adopted for the quarter ended March 31, 2020; the adoption did not have a material impact on the financial statements and disclosures of the Trust or the Fund.
The FASB issued ASU 2017-13, “Revenue Recognition (Topic 605), Leases (Topic 840), and Leases (Topic 842): Amendments to SEC Paragraphs Pursuant to the Staff Announcement at the July 20, 2017 EITF Meeting and Rescission of Prior SEC Staff Announcements and Observer Comments”. The amendment amends the early adoption date option for certain companies related to adoption of ASU No. 2014-09 and ASU No. 2016-02. The SEC staff stated the SEC would not object to a public business entity that otherwise would not meet the definition of a public business entity except for a requirement to include or the inclusion of its financial statements or financial information in another entity’s filing with the SEC adopting ASC Topic 842 for fiscal years beginning after December 15, 2019, and interim periods within fiscal years beginning after December 15, 2020. The amendments were adopted for the quarter ended September 30, 2020; the adoption did not have a material impact on the financial statements and disclosures of the Trust or the Fund.
| F-99 |
| Table of Contents |
Note 4 – Fair Value Measurements
The Fund’s assets and liabilities recorded at fair value have been categorized based upon a fair value hierarchy as described in the Fund’s significant accounting policies in Note 3. The following table presents information about the Fund’s assets and liabilities measured at fair value as of September 30, 2022 and December 31, 2021:
September 30, 2022
Assets: |
| Level 1 |
|
| Level 2 |
|
| Level 3 |
|
| Balance as of September 30, 2022 |
| ||||
Cash Equivalents |
| $ |
|
| $ |
|
| $ |
|
| $ |
| ||||
Commodity Futures Contracts |
|
|
|
|
|
|
|
|
|
|
|
|
|
|
|
|
Wheat futures contracts |
|
|
|
|
|
|
|
|
|
|
|
| ||||
Total |
| $ |
|
| $ |
|
| $ |
|
| $ |
| ||||
|
|
|
|
|
|
|
|
|
|
|
|
|
|
|
|
|
Liabilities |
| Level 1 |
|
| Level 2 |
|
| Level 3 |
|
| Balance as of September 30, 2022 |
| ||||
Commodity Futures Contracts |
|
|
|
|
|
|
|
|
|
|
|
|
|
|
|
|
Wheat futures contracts |
| $ |
|
| $ |
|
| $ |
|
| $ |
| ||||
December 31, 2021
Assets: |
| Level 1 |
|
| Level 2 |
|
| Level 3 |
|
| Balance as of December 31, 2021 |
| ||||
Cash Equivalents |
| $ |
|
| $ |
|
| $ |
|
| $ |
| ||||
Commodity Futures Contracts |
|
|
|
|
|
|
|
|
|
|
|
|
|
|
|
|
Wheat futures contracts |
|
|
|
|
|
|
|
|
|
|
|
| ||||
Total |
| $ |
|
| $ |
|
| $ |
|
| $ |
| ||||
|
|
|
|
|
|
|
|
|
|
|
|
|
|
|
|
|
Liabilities |
| Level 1 |
|
| Level 2 |
|
| Level 3 |
|
| Balance as of December 31, 2021 |
| ||||
Wheat futures contracts |
| $ |
|
| $ |
|
| $ |
|
| $ |
| ||||
For the three and nine months ended September 30, 2022 and year ended December 31, 2021, the Fund did not have any significant transfers between any of the levels of the fair value hierarchy.
See the Fair Value - Definition and Hierarchy section in Note 3 above for an explanation of the transfers into and out of each level of the fair value hierarchy.
Note 5 – Derivative Instruments and Hedging Activities
In the normal course of business, the Fund utilizes derivative contracts in connection with its proprietary trading activities. Investments in derivative contracts are subject to additional risks that can result in a loss of all or part of an investment. The Fund’s derivative activities and exposure to derivative contracts are classified by the following primary underlying risks: interest rate, credit, commodity price, and equity price risks. In addition to its primary underlying risks, the Fund is also subject to additional counterparty risk due to inability of its counterparties to meet the terms of their contracts. For the three and nine months ended September 30, 2022 and for the year ended December 31, 2021, the Fund invested only in commodity futures contracts.
Futures Contracts
The Fund is subject to commodity price risk in the normal course of pursuing its investment objectives. A futures contract represents a commitment for the future purchase or sale of an asset at a specified price on a specified date.
| F-100 |
| Table of Contents |
The purchase and sale of futures contracts requires margin deposits with a Futures Commission Merchant (“FCM”). Subsequent payments (variation margin) are made or received by the Fund each day, depending on the daily fluctuations in the value of the contract, and are recorded as unrealized gains or losses by the Fund. Futures contracts may reduce the Fund’s exposure to counterparty risk since futures contracts are exchange-traded; and the exchange’s clearinghouse, as the counterparty to all exchange-traded futures, guarantees the futures against default.
The Commodity Exchange Act requires an FCM to segregate all customer transactions and assets from the FCM’s proprietary activities. A customer’s cash and other equity deposited with an FCM are considered commingled with all other customer funds subject to the FCM’s segregation requirements. In the event of an FCM’s insolvency, recovery may be limited to the Fund’s pro rata share of segregated customer funds available. It is possible that the recovery amount could be less than the total of cash and other equity deposited.
The following table discloses information about offsetting assets and liabilities presented in the statements of assets and liabilities to enable users of these financial statements to evaluate the effect or potential effect of netting arrangements for recognized assets and liabilities. These recognized assets and liabilities are presented as defined in the Financial Accounting Standards Board’s (“FASB”) Accounting Standards Update (“ASU”) No. 2011-11 “Balance Sheet (Topic 210): Disclosures about Offsetting Assets and Liabilities” and subsequently clarified in FASB ASU 2013-01 “Balance Sheet (Topic 210): Clarifying the Scope of Disclosures about Offsetting Assets and Liabilities.”
The following table also identifies the fair value amounts of derivative instruments included in the statements of assets and liabilities as derivative contracts, categorized by primary underlying risk, and held by the FCMs, E D & F Man and StoneX as of September 30, 2022 and December 31, 2021.
*The amount of collateral presented in Collateral, Due from Broker, is limited to the liability for the futures contracts and accordingly does not include the excess collateral pledged.
Offsetting of Financial Assets and Derivative Assets as of September 30, 2022
|
| (i) |
|
| (ii) |
|
| (iii) = (i)-(ii) |
|
| (iv) |
|
| (v)=(iii)-(iv) |
| |||||||||
|
|
|
|
|
|
|
|
|
|
| Gross Amount Not Offset in the Statement of Assets and Liabilities |
|
|
|
| |||||||||
Description |
| Gross Amount of Recognized Assets |
|
| Gross Amount Offset in the Statement of Assets and Liabilities |
|
| Net Amount Presented in the Statement of Assets and Liabilities |
|
| Futures Contracts Available for Offset |
|
| Collateral, Due to Broker |
|
| Net Amount |
| ||||||
Commodity Price |
|
|
|
|
|
|
|
|
|
|
|
|
|
|
|
|
|
| ||||||
Wheat futures contracts |
| $ |
|
| $ |
|
| $ |
|
| $ |
|
| $ |
|
| $ |
| ||||||
Offsetting of Financial Liabilities and Derivative Liabilities as of September 30, 2022
|
| (i) |
|
| (ii) |
|
| (iii) = (i)-(ii) |
|
| (iv) |
|
| (v)=(iii)-(iv) |
| |||||||||
|
|
|
|
|
|
|
|
|
|
| Gross Amount Not Offset in the Statement of Assets and Liabilities |
|
|
|
| |||||||||
Description |
| Gross Amount of Recognized Liabilities |
|
| Gross Amount Offset in the Statement of Assets and Liabilities |
|
| Net Amount Presented in the Statement of Assets and Liabilities |
|
| Futures Contracts Available for Offset |
|
| Collateral, Due from Broker* |
|
| Net Amount |
| ||||||
Commodity Price |
|
|
|
|
|
|
|
|
|
|
|
|
|
|
|
|
|
| ||||||
Wheat futures contracts |
| $ |
|
| $ |
|
| $ |
|
| $ |
|
| $ |
|
| $ |
| ||||||
| F-101 |
| Table of Contents |
Offsetting of Financial Assets and Derivative Assets as of December 31, 2021
|
| (i) |
|
| (ii) |
|
| (iii) = (i)-(ii) |
|
| (iv) |
|
| (v)=(iii)-(iv) |
| |||||||||
|
|
|
|
|
|
|
|
|
|
| Gross Amount Not Offset in the Statement of Assets and Liabilities |
|
|
|
| |||||||||
Description |
| Gross Amount of Recognized Assets |
|
| Gross Amount Offset in the Statement of Assets and Liabilities |
|
| Net Amount Presented in the Statement of Assets and Liabilities |
|
| Futures Contracts Available for Offset |
|
| Collateral, Due to Broker |
|
| Net Amount |
| ||||||
Commodity Price |
|
|
|
|
|
|
|
|
|
|
|
|
|
|
|
|
|
| ||||||
Wheat futures contracts |
| $ |
|
| $ |
|
| $ |
|
| $ |
|
| $ |
|
| $ |
| ||||||
Offsetting of Financial Liabilities and Derivative Liabilities as of December 31, 2021
|
| (i) |
|
| (ii) |
|
| (iii) = (i)-(ii) |
|
| (iv) |
|
| (v)=(iii)-(iv) |
| |||||||||
|
|
|
|
|
|
|
|
|
|
| Gross Amount Not Offset in the Statement of Assets and Liabilities |
|
|
|
| |||||||||
Description |
| Gross Amount of Recognized Liabilities |
|
| Gross Amount Offset in the Statement of Assets and Liabilities |
|
| Net Amount Presented in the Statement of Assets and Liabilities |
|
| Futures Contracts Available for Offset |
|
| Collateral, Due from Broker* |
|
| Net Amount |
| ||||||
Commodity Price |
|
|
|
|
|
|
|
|
|
|
|
|
|
|
|
|
|
| ||||||
Wheat futures contracts |
| $ |
|
| $ |
|
| $ |
|
| $ |
|
| $ |
|
| $ |
| ||||||
The following tables identify the net gain and loss amounts included in the statements of operations as realized and unrealized gains and losses on trading of commodity futures contracts categorized by primary underlying risk:
Three months ended September 30, 2022
|
| Realized Loss on Commodity Futures Contracts |
|
| Net Change in Unrealized Appreciation on Commodity Futures Contracts |
| ||
Commodity Price |
|
|
|
|
|
| ||
Wheat futures contracts |
| $ | ( | ) |
| $ |
| |
Three months ended September 30, 2021
|
| Realized Gain on Commodity Futures Contracts |
|
| Net Change in Unrealized Appreciation on Commodity Futures Contracts |
| ||
Commodity Price |
|
|
|
|
|
| ||
Wheat futures contracts |
| $ |
|
| $ |
| ||
Nine months ended September 30, 2022
|
| Realized Loss on Commodity Futures Contracts |
|
| Net Change in Unrealized Depreciation on Commodity Futures Contracts |
| ||
Commodity Price |
|
|
|
|
|
| ||
Wheat futures contracts |
| $ | ( | ) |
| $ | ( | ) |
| F-102 |
| Table of Contents |
Nine months ended September 30, 2021
|
| Realized Gain on Commodity Futures Contracts |
|
| Net Change in Unrealized Depreciation on Commodity Futures Contracts |
| ||
Commodity Price |
|
|
|
|
|
| ||
Wheat futures contracts |
| $ |
|
| $ | ( | ) | |
Volume of Derivative Activities
The average notional market value categorized by primary underlying risk for all futures contracts held was $
Note 6 – Financial Highlights
The following tables present per unit performance data and other supplemental financial data for the three and nine months ended September 30, 2022 and 2021. This information has been derived from information presented in the financial statements and is presented with total expenses gross of expenses waived by the Sponsor and with total expenses net of expenses waived by the Sponsor, as appropriate.
|
| Three months ended |
|
| Three months ended |
|
| Nine months ended |
|
| Nine months ended |
| ||||
|
| September 30, 2022 |
|
| September 30, 2021 |
|
| September 30, 2022 |
|
| September 30, 2021 |
| ||||
Per Share Operation Performance |
|
|
|
|
|
|
|
|
|
|
|
| ||||
Net asset value at beginning of period |
| $ |
|
| $ |
|
| $ |
|
| $ |
| ||||
Income (loss) from investment operations: |
|
|
|
|
|
|
|
|
|
|
|
|
|
|
|
|
Investment income |
|
|
|
|
|
|
|
|
|
|
|
| ||||
Net realized and unrealized gain on commodity futures contracts |
|
|
|
|
|
|
|
|
|
|
|
| ||||
Total expenses, net |
|
| ( | ) |
|
| ( | ) |
|
| ( | ) |
|
| ( | ) |
Net increase in net asset value |
|
|
|
|
|
|
|
|
|
|
|
| ||||
Net asset value at end of period |
| $ |
|
| $ |
|
| $ |
|
| $ |
| ||||
Total Return |
|
| % |
|
| % |
|
| % |
|
| % | ||||
Ratios to Average Net Assets (Annualized) |
|
|
|
|
|
|
|
|
|
|
|
|
|
|
|
|
Total expenses |
|
| % |
|
| % |
|
| % |
|
| % | ||||
Total expenses, net |
|
| % |
|
| % |
|
| % |
|
| % | ||||
Net investment income (loss) |
|
| % |
|
| ( | )% |
|
| ( | )% |
|
| ( | )% | |
The financial highlights per share data are calculated consistent with the methodology used to calculate asset-based fees and expenses.
Note 7 – Organizational and Offering Costs
Expenses incurred in organizing of the Trust and the initial offering of the Shares of the Fund, including applicable SEC registration fees, were borne directly by the Sponsor. The Fund will not be obligated to reimburse the Sponsor.
Note 8 – Subsequent Events
Management has evaluated the financial statements for the quarter-ended September 30, 2022 for subsequent events through the date of this filing and noted no material events requiring either recognition through the date of the filing or disclosure herein for the Fund
| F-103 |
| Table of Contents |
TEUCRIUM AGRICULTURAL FUND
STATEMENTS OF ASSETS AND LIABILITIES
|
| September 30, 2022 |
|
| December 31, 2021 |
| ||
|
| (Unaudited) |
|
|
|
| ||
Assets |
|
|
|
|
|
| ||
Cash equivalents |
| $ |
|
| $ |
| ||
Interest receivable |
|
|
|
|
|
| ||
Other assets |
|
|
|
|
|
| ||
Equity in trading accounts: |
|
|
|
|
|
|
|
|
Investments in securities, at fair value (cost $ |
|
|
|
|
|
| ||
Total assets |
|
|
|
|
|
| ||
|
|
|
|
|
|
|
|
|
Liabilities |
|
|
|
|
|
|
|
|
Other liabilities |
|
|
|
|
|
| ||
|
|
|
|
|
|
|
|
|
Net assets |
| $ |
|
| $ |
| ||
|
|
|
|
|
|
|
|
|
Shares outstanding |
|
|
|
|
|
| ||
|
|
|
|
|
|
|
|
|
Shares authorized |
| * |
|
|
|
| ||
|
|
|
|
|
|
|
|
|
Net asset value per share |
| $ |
|
| $ |
| ||
|
|
|
|
|
|
|
|
|
Market value per share |
| $ |
|
| $ |
| ||
* On April 7, 2022, the Teucrium Agricultural Fund registered an indeterminate number of shares of the Fund pursuant to Rule 456(d) under the Securities Act of 1933.
The accompanying notes are an integral part of these financial statements.
| F-104 |
| Table of Contents |
TEUCRIUM AGRICULTURAL FUND
SCHEDULE OF INVESTMENTS
September 30, 2022
(Unaudited)
|
|
|
|
| Percentage of |
|
|
|
| |||
Description: Assets |
| Fair Value |
|
| Net Assets |
|
| Shares |
| |||
|
|
|
|
|
|
|
|
|
| |||
Exchange-traded funds |
|
|
|
|
|
|
|
|
| |||
Teucrium Corn Fund |
| $ |
|
|
| % |
|
|
| |||
Teucrium Soybean Fund |
|
|
|
|
|
|
|
|
| |||
Teucrium Sugar Fund |
|
|
|
|
|
|
|
|
| |||
Teucrium Wheat Fund |
|
|
|
|
|
|
|
|
| |||
Total exchange-traded funds (cost $46,624,323) |
| $ |
|
|
| % |
|
|
|
| ||
|
|
|
|
|
|
|
|
|
|
|
|
|
Cash equivalents |
|
|
|
|
|
|
|
|
|
|
|
|
Money market funds |
|
|
|
|
|
|
|
|
|
|
|
|
First American Government Obligations Fund - Class X (cost $6,417) |
| $ |
|
|
| % |
|
|
| |||
The accompanying notes are an integral part of these financial statements.
| F-105 |
| Table of Contents |
TEUCRIUM AGRICULTURAL FUND
SCHEDULE OF INVESTMENTS
December 31, 2021
|
|
|
|
| Percentage of |
|
|
|
| |||
Description: Assets |
| Fair Value |
|
| Net Assets |
|
| Shares |
| |||
|
|
|
|
|
|
|
|
|
| |||
Exchange-traded funds |
|
|
|
|
|
|
|
|
| |||
Teucrium Corn Fund |
| $ |
|
|
| % |
|
|
| |||
Teucrium Soybean Fund |
|
|
|
|
|
|
|
|
| |||
Teucrium Sugar Fund |
|
|
|
|
|
|
|
|
| |||
Teucrium Wheat Fund |
|
|
|
|
|
|
|
|
| |||
Total exchange-traded funds (cost: $12,799,498) |
| $ |
|
|
| % |
|
|
|
| ||
|
|
|
|
|
|
|
|
|
|
|
|
|
Cash equivalents |
|
|
|
|
|
|
|
|
|
|
|
|
Money market funds |
|
|
|
|
|
|
|
|
|
|
|
|
First American Government Obligations Fund - Class X 0.026% (cost: $4,801) |
| $ |
|
|
| % |
|
|
| |||
The accompanying notes are an integral part of these financial statements.
| F-106 |
| Table of Contents |
TEUCRIUM AGRICULTURAL FUND
STATEMENTS OF OPERATIONS
(Unaudited)
|
| Three months ended |
|
| Three months ended |
|
| Nine months ended |
|
| Nine months ended |
| ||||
|
| September 30, 2022 |
|
| September 30, 2021 |
|
| September 30, 2022 |
|
| September 30, 2021 |
| ||||
Income |
|
|
|
|
|
|
|
|
|
|
|
| ||||
Realized and unrealized gain (loss) on trading of securities: |
|
|
|
|
|
|
|
|
|
|
|
| ||||
Realized (loss) gain on securities |
| $ | ( | ) |
| $ |
|
| $ |
|
| $ |
| |||
Net change in unrealized appreciation on securities |
|
|
|
|
|
|
|
| ( | ) |
|
|
| |||
Interest income |
|
|
|
|
|
|
|
|
|
|
|
| ||||
Total income (loss) |
|
|
|
|
|
|
|
| ( | ) |
|
|
| |||
|
|
|
|
|
|
|
|
|
|
|
|
|
|
|
|
|
Expenses |
|
|
|
|
|
|
|
|
|
|
|
|
|
|
|
|
Professional fees |
|
|
|
|
|
|
|
|
|
|
|
| ||||
Distribution and marketing fees |
|
|
|
|
|
|
|
|
|
|
|
| ||||
Custodian fees and expenses |
|
|
|
|
|
|
|
|
|
|
|
| ||||
Business permits and licenses fees |
|
|
|
|
|
|
|
|
|
|
|
| ||||
General and administrative expenses |
|
|
|
|
|
|
|
|
|
|
|
| ||||
Other expenses |
|
|
|
|
|
|
|
|
|
|
|
| ||||
Total expenses |
|
|
|
|
|
|
|
|
|
|
|
| ||||
|
|
|
|
|
|
|
|
|
|
|
|
|
|
|
|
|
Expenses waived by the Sponsor |
|
| ( | ) |
|
| ( | ) |
|
| ( | ) |
|
| ( | ) |
|
|
|
|
|
|
|
|
|
|
|
|
|
|
|
|
|
Total expenses, net |
|
|
|
|
|
|
|
|
|
|
|
| ||||
|
|
|
|
|
|
|
|
|
|
|
|
|
|
|
|
|
Net (loss) income |
| $ | ( | ) |
| $ |
|
| $ | ( | ) |
| $ |
| ||
|
|
|
|
|
|
|
|
|
|
|
|
|
|
|
|
|
Net (loss) gain per share |
| $ | ( | ) |
| $ |
|
| $ |
|
| $ |
| |||
Net (loss) income per weighted average share |
| $ | ( | ) |
| $ |
|
| $ | ( | ) |
| $ |
| ||
Weighted average shares outstanding |
|
|
|
|
|
|
|
|
|
|
|
| ||||
The accompanying notes are an integral part of these financial statements.
| F-107 |
| Table of Contents |
TEUCRIUM AGRICULTURAL FUND
STATEMENTS OF CHANGES IN NET ASSETS
(Unaudited)
|
| Nine months ended |
|
| Nine months ended |
| ||
|
| September 30, 2022 |
|
| September 30, 2021 |
| ||
Operations |
|
|
|
|
|
| ||
Net (loss) income |
| $ | ( | ) |
| $ |
| |
Capital transactions |
|
|
|
|
|
|
|
|
Issuance of Shares |
|
|
|
|
|
| ||
Redemption of Shares |
|
| ( | ) |
|
| ( | ) |
Total capital transactions |
|
|
|
|
|
| ||
Net change in net assets |
|
|
|
|
|
| ||
|
|
|
|
|
|
|
|
|
Net assets, beginning of period |
| $ |
|
| $ |
| ||
|
|
|
|
|
|
|
|
|
Net assets, end of period |
| $ |
|
| $ |
| ||
|
|
|
|
|
|
|
|
|
Net asset value per share at beginning of period |
| $ |
|
| $ |
| ||
|
|
|
|
|
|
|
|
|
Net asset value per share at end of period |
| $ |
|
| $ |
| ||
|
|
|
|
|
|
|
|
|
Creation of Shares |
|
|
|
|
|
| ||
Redemption of Shares |
|
|
|
|
|
| ||
The accompanying notes are an integral part of these financial statements.
| F-108 |
| Table of Contents |
TEUCRIUM AGRICULTURAL FUND
STATEMENTS OF CASH FLOWS
(Unaudited)
|
| Nine months ended |
|
| Nine months ended |
| ||
|
| September 30, 2022 |
|
| September 30, 2021 |
| ||
Cash flows from operating activities: |
|
|
|
|
|
| ||
Net (loss) income |
| $ | ( | ) |
| $ |
| |
Adjustments to reconcile net (loss) income to net cash used in operating activities: |
|
|
|
|
|
|
|
|
Net change in unrealized depreciation (appreciation) on securities |
|
|
|
|
| ( | ) | |
Changes in operating assets and liabilities: |
|
|
|
|
|
|
|
|
Net (purchase) sale of investments in securities |
|
| ( | ) |
|
| ( | ) |
Interest receivable |
|
| ( | ) |
|
|
| |
Other assets |
|
| ( | ) |
|
|
| |
Other liabilities |
|
|
|
|
|
| ||
Net cash used in operating activities |
|
| ( | ) |
|
| ( | ) |
|
|
|
|
|
|
|
|
|
Cash flows from financing activities: |
|
|
|
|
|
|
|
|
Proceeds from sale of Shares |
|
|
|
|
|
| ||
Redemption of Shares |
|
| ( | ) |
|
| ( | ) |
Net cash provided by financing activities |
|
|
|
|
|
| ||
|
|
|
|
|
|
|
|
|
Net change in cash equivalents |
|
|
|
|
|
| ||
Cash equivalents, beginning of period |
|
|
|
|
|
| ||
Cash equivalents, end of period |
| $ |
|
| $ |
| ||
The accompanying notes are an integral part of these financial statements.
| F-109 |
| Table of Contents |
NOTES TO FINANCIAL STATEMENTS
September 30, 2022
(Unaudited)
Note 1 – Organization and Operation
Teucrium Agricultural Fund (referred to herein as “TAGS” or the “Fund”) is a series of Teucrium Commodity Trust (“Trust”), a Delaware statutory trust organized on September 11, 2009. The Fund operates pursuant to the Trust’s Fifth Amended and Restated Declaration of Trust and Trust Agreement (the “Trust Agreement”). The Fund was formed on March 29, 2011 and is managed and controlled by Teucrium Trading, LLC (the “Sponsor”). The Sponsor is a limited liability company formed in Delaware on July 28, 2009. The Sponsor is registered as a commodity pool operator (“CPO”) and a commodity trading adviser (“CTA”) with the Commodity Futures Trading Commission (“CFTC”) and is a member of the National Futures Association (“NFA”).
On April 22, 2011, a registration statement was filed with the Securities and Exchange Commission (“SEC”). On February 10, 2012, the Fund’s initial registration of
The investment objective of the TAGS is to have the daily changes in percentage terms of the NAV of its Shares reflect the daily changes in percentage terms of a weighted average (the “Underlying Fund Average”) of the NAVs per share of four other commodity pools that are series of the Trust and are sponsored by the Sponsor: the Teucrium Corn Fund, the Teucrium Wheat Fund, the Teucrium Soybean Fund and the Teucrium Sugar Fund (collectively, the “Underlying Funds”). The Underlying Fund Average will have a weighting of 25% to each Underlying Fund, and the Fund’s assets will be rebalanced, generally on a daily basis, to maintain the approximate 25% allocation to each Underlying Fund:
TAGS Benchmark
Underlying Fund |
| Weighting |
| |
CORN |
|
| % | |
SOYB |
|
| % | |
CANE |
|
| % | |
WEAT |
|
| % | |
The Fund seeks to provide daily investment results that reflect the combined daily performance of the Underlying Funds. Under normal market conditions, the Fund seeks to achieve its investment objective generally by investing equally in shares of each Underlying Fund and, to a lesser extent, cash equivalents. The Fund’s investments in shares of the Underlying Funds is rebalanced, generally on a daily basis, in order to maintain approximately a 25% allocation of the Fund’s assets to each Underlying Fund. (This weighted average is referred to herein as the Underlying Fund’s “Benchmark,” the Futures Contracts that at any given time make up an Underlying Fund’s Benchmark are referred to herein as the Underlying Fund’s “Benchmark Component Futures Contracts,” and the commodity specified in the Underlying Fund’s name is referred to herein as its “Specified Commodity.”) Specifically,
| F-110 |
| Table of Contents |
While the Fund expects to maintain substantially all of its assets in shares of the Underlying Funds at all times, the Fund may hold some residual amount of assets in obligations of the United States government (“Treasury Securities”) or cash equivalents, and/or merely hold such assets in cash (generally in interest-bearing accounts). The Underlying Funds invest in Commodity Interests to the fullest extent possible without being leveraged or unable to satisfy their expected current or potential margin or collateral obligations with respect to their investments in Commodity Interests. After fulfilling such margin and collateral requirements, the Underlying Funds will invest the remainder of the proceeds from the sale of baskets in short term Treasury Securities or cash equivalents, and/or merely hold such assets in cash. Therefore, the focus of the Sponsor in managing the Underlying Funds is investing in Commodity Interests and in cash and/or cash equivalents. The Fund and Underlying Funds will seek to earn interest income from the short-term Treasury Securities and/or cash equivalents that it purchases, and, on the cash, it holds through the Fund’s custodian.
The accompanying unaudited financial statements have been prepared in accordance with Rule 10-01 of Regulation S-X promulgated by the SEC and, therefore, do not include all information and footnote disclosures required under accounting principles generally accepted in the United States of America (“GAAP”). The financial information included herein is unaudited; however, such financial information reflects all adjustments which are, in the opinion of management, necessary for the fair presentation of the Fund’s financial statements for the interim period. It is suggested that these interim financial statements be read in conjunction with the financial statements and related notes included in the Trust’s Annual Report on Form 10-K, as well as the most recent Form S-1 filing, as applicable. The operating results for the three and nine months ended September 30, 2022 are not necessarily indicative of the results to be expected for the full year ending December 31, 2022.
Subject to the terms of the Trust Agreement, Teucrium Trading, LLC, in its capacity as the Sponsor (“Sponsor”), may terminate a Fund at any time, regardless of whether the Fund has incurred losses, including, for instance, if it determines that the Fund’s aggregate net assets in relation to its operating expenses make the continued operation of the Fund unreasonable or imprudent. However, no level of losses will require the Sponsor to terminate a Fund.
Note 2 – Principal Contracts and Agreements
The Sponsor employs U.S. Bancorp Fund Services, LLC, doing business as U.S. Bank Global Fund Services (“Global Fund Services”), for Transfer Agency, Fund Accounting and Fund Administration services. The principal address for Global Fund Services is 615 E. Michigan Street, Milwaukee, WI 53202.
| F-111 |
| Table of Contents |
The Sponsor employs Foreside Fund Services, LLC (“Foreside” or the “Distributor”) as the Distributor for the Funds. The Distribution Services Agreement among the Distributor and the Sponsor calls for the Distributor to work with the Custodian in connection with the receipt and processing of orders for Creation Baskets and Redemption Baskets and the review and approval of all Fund sales literature and advertising materials. The Distributor and the Sponsor have also entered into a Securities Activities and Service Agreement (the “SASA”) under which certain employees and officers of the Sponsor are licensed as registered representatives or registered principals of the Distributor, under Financial Industry Regulatory Authority (“FINRA”) rules.
E D & F Man Capital Markets, Inc. (“E D & F Man”) and StoneX Financial Inc. (“StoneX”) serve as the Underlying Funds’ clearing brokers to execute and clear the Underlying Funds’ futures and provide other brokerage-related services. E D & F Man and StoneX are each registered as futures commission merchants (“FCM”) with the U.S. CFTC and are members of the NFA. The clearing brokers are registered as broker-dealers with the SEC and are each a member of FINRA. ED & F Man and StoneX are each clearing members of ICE Futures U.S., Inc., Chicago Board of Trade, Chicago Mercantile Exchange, New York Mercantile Exchange, and all other major United States commodity exchanges. For Corn, Soybean, Sugar, and Wheat Futures Contracts E D & F Man is paid
The sole Trustee of the Trust is Wilmington Trust Company, a Delaware banking corporation. The Trustee will accept service of legal process on the Trust in the State of Delaware and will make certain filings under the Delaware Statutory Trust Act. For its services, the Trustee receives an annual fee of $3,300 from the Trust. These services are recorded in business permits and licenses fees on the statements of operations. A summary of these expenses is included below.
The Sponsor employs Thales Capital Partners LLC (“Thales”) for distribution and solicitation-related services.
|
| Three months ended September 30, 2022 |
|
| Three months ended September 30, 2021 |
|
| Nine months ended September 30, 2022 |
|
| Nine months ended September 30, 2021 |
| ||||
Amount Recognized for Custody Services |
| $ |
|
| $ |
|
| $ |
|
| $ |
| ||||
Amount of Custody Services Waived |
| $ |
|
| $ |
|
| $ |
|
| $ |
| ||||
|
|
|
|
|
|
|
|
|
|
|
|
|
|
|
|
|
Amount Recognized for Distribution Services |
| $ |
|
| $ |
|
| $ |
|
| $ |
| ||||
Amount of Distribution Services Waived |
| $ |
|
| $ |
|
| $ |
|
| $ |
| ||||
|
|
|
|
|
|
|
|
|
|
|
|
|
|
|
|
|
Amount Recognized for Wilmington Trust |
| $ |
|
| $ |
|
| $ |
|
| $ |
| ||||
Amount of Wilmington Trust Waived |
| $ |
|
| $ |
|
| $ |
|
| $ |
| ||||
|
|
|
|
|
|
|
|
|
|
|
|
|
|
|
|
|
Amount Recognized for Thales |
| $ |
|
| $ |
|
| $ |
|
| $ |
| ||||
Amount of Thales Waived |
| $ |
|
| $ |
|
| $ |
|
| $ |
| ||||
| F-112 |
| Table of Contents |
Note 3 – Summary of Significant Accounting Policies
Basis of Presentation
The accompanying financial statements have been prepared in accordance with accounting principles generally accepted in the United States of America (“U.S. GAAP”) as detailed in the Financial Accounting Standards Board’s Accounting Standards Codification.
Revenue Recognition
Investment transactions are accounted for on a trade-date basis. All such transactions are recorded on the identified cost basis and marked to market daily. Unrealized appreciation or depreciation on investments are reflected in the statements of operations as the difference between the original amount and the fair market value as of the last business day of the year or as of the last date of the financial statements. Changes in the appreciation or depreciation between periods are reflected in the statements of operations.
Brokerage Commissions
The Sponsor recognizes the expense for brokerage commissions for futures contract trades on a per-trade basis.
Income Taxes
For federal income tax purposes, the Fund will be treated as a publicly traded partnership. A publicly traded partnership is generally treated as a corporation for federal income tax purposes unless 90% or more of the publicly traded partnership’s gross income for each taxable year of its existence consists of qualifying income as defined in section 7704(d) of the Internal Revenue Code of 1986, as amended. Qualifying income is defined as generally including, in pertinent part, interest (other than from a financial business), dividends, and gains from the sale or disposition of capital assets held for the production of interest or dividends. In the case of a partnership of which a principal activity is the buying and selling of commodities, other than as inventory, or of futures, forwards and options with respect to commodities, qualifying income also includes income and gains from commodities and from futures, forwards, options with respect to commodities and, provided the partnership is a trader or investor with respect to such assets, swaps and other notional principal contracts with respect to commodities. The Fund expects that at least 90% of the Fund’s gross income for each taxable year will consist of qualifying income and that the Fund will be taxed as a partnership for federal income tax purposes. The Fund does not record a provision for income taxes because the shareholders report their share of the Fund’s income or loss on their income tax returns. The financial statements reflect the Fund’s transactions without adjustment, if any, required for income tax purposes.
The Fund is required to determine whether a tax position is more likely than not to be sustained upon examination by the applicable taxing authority, including resolution of any related appeals or litigation processes, based on the technical merits of the position. The Fund files an income tax return in the U.S. federal jurisdiction and may file income tax returns in various U.S. states and foreign jurisdictions. For all tax years 2019 to 2021, the Fund remains subject to income tax examinations by major taxing authorities. The tax benefit recognized is measured as the largest amount of benefit that has a greater than fifty percent likelihood of being realized upon ultimate settlement. De-recognition of a tax benefit previously recognized results in the Fund recording a tax liability that reduces net assets. This policy has been applied to all existing tax positions upon the Fund’s initial adoption. Based on its analysis, the Fund has determined that it has not incurred any liability for unrecognized tax benefits as of September 30, 2022 and for the years ended December 31, 2021, 2020 and 2019. However, the Fund’s conclusions regarding this policy may be subject to review and adjustment at a later date based on factors including, but not limited to, ongoing analysis of and changes to tax laws, regulations, and interpretations thereof.
| F-113 |
| Table of Contents |
The Fund recognizes interest accrued related to unrecognized tax benefits and penalties related to unrecognized tax benefits in income tax fees payable, if assessed. No interest expense or penalties have been recognized as of and for the three and nine months ended September 30, 2022 and 2021.
The Fund may be subject to potential examination by U.S. federal, U.S. state, or foreign jurisdictional authorities in the area of income taxes. These potential examinations may include questioning the timing and amount of deductions, the nexus of income among various tax jurisdictions, and compliance with U.S. federal, U.S. state and foreign tax laws.
Creations and Redemptions
Effective August 28, 2018, the Sponsor filed a prospectus supplement updating the Creation and Redemption Basket size to 12,500 shares. Prior to this prospectus supplement, the basket size for Creations and Redemptions was 25,000 shares.
Authorized Purchasers may purchase Creation Baskets consisting of 12,500 shares from the Fund. The amount of the proceeds required to purchase a Creation Basket will be equal to the NAV of the shares in the Creation Basket determined as of 4:00 p.m. (ET) on the day the order to create the basket is received in good order.
Authorized Purchasers may redeem shares from the Fund only in blocks of 12,500 shares called “Redemption Baskets.” The amount of the redemption proceeds for a Redemption Basket will be equal to the NAV of the shares in the Redemption Basket determined as of 4:00 p.m. (ET) on the day the order to redeem the basket is received in good order.
The Fund will receive the proceeds from shares sold or will pay for redeemed shares within three business days after the trade date of the purchase or redemption, respectively. The amounts due from Authorized Purchasers will be reflected in the Fund’s statements of assets and liabilities as capital shares receivable. Amounts payable to Authorized Purchasers upon redemption will be reflected in the Fund’s statements of assets and liabilities as payable for shares redeemed.
As outlined in the most recent Form S-1 filing, 50,000 shares represent four Redemption Baskets for the Fund and a minimum level of shares. If the Fund experienced redemptions that caused the number of Shares outstanding to decrease to the minimum level of Shares required to be outstanding, until the minimum number of Shares is again exceeded through the purchase of a new Creation Basket, there can be no more redemptions by an Authorized Purchaser.
Allocation of Shareholder Income and Losses
Profit or loss is allocated among the shareholders of the Fund in proportion to the number of shares each shareholder holds as of the close of each month.
| F-114 |
| Table of Contents |
Cash Equivalents
Cash equivalents are highly liquid investments with maturity dates of 90 days or less when acquired. The Fund reported its cash equivalents in the statements of assets and liabilities at market value, or at carrying amounts that approximate fair value, because of their highly liquid nature and short term maturities. The Fund has these balances of its assets on deposit with banks. Assets deposited with a financial institution may, at times, exceed federally insured limits. TAGS had a balance of $6,417 and $4,801 in money market funds at September 30, 2022 and December 31, 2021, respectively; these balances are included in cash equivalents on the statements of assets and liabilities.
Payable/Receivable for Securities Purchased/Sold
Due from/to broker for investments in securities are securities transactions pending settlement. The Fund is subject to credit risk to the extent any broker with whom it conducts business is unable to fulfill contractual obligations on its behalf. The management of the Fund monitors the financial condition of such brokers and does not anticipate any losses from these counterparties.
Calculation of Net Asset Value
The Fund’s NAV is calculated by:
| • | Taking the current market value of its total assets and |
| • | Subtracting any liabilities. |
The administrator, Global Fund Services, will calculate the NAV of the Fund once each trading day. It will calculate the NAV as of the earlier of the close of the New York Stock Exchange or 4:00 p.m. (ET). The NAV for a particular trading day will be released after 4:15 p.m. (ET).
For purposes of determining the Fund’s NAV, the Fund’s investments in the Underlying Funds will be valued based on the Underlying Funds’ NAVs. In turn, in determining the value of the Futures Contracts held by the Underlying Funds, the Administrator will use the closing price on the exchange on which they are traded. The Administrator will determine the value of all other Funds and Underlying Fund investments as of the earlier of the close of the New York Stock Exchange or 4:00 p.m. (ET), in accordance with the current Services Agreement between the Administrator and the Trust. The value of over-the-counter Commodity Interests will be determined based on the value of the commodity or Futures Contract underlying such Commodity Interest, except that a fair value may be determined if the Sponsor believes that the Underlying Fund is subject to significant credit risk relating to the counterparty to such Commodity Interest. For purposes of financial statements and reports, the Sponsor will recalculate the NAV of an Underlying Fund where necessary to reflect the “fair value” of a Futures Contract held by an Underlying Fund when a Futures Contract held by the Underlying Fund closes at its price fluctuation limit for the day. Short term Treasury Securities held by the Fund or Underlying Funds will be valued by the Administrator using values received from recognized third-party vendors (such as Reuters) and dealer quotes. NAV will include any unrealized profit or loss on open Commodity Interests and any other credit or debit accruing to the Fund but unpaid or not received by the Fund.
Sponsor Fee Allocation of Expenses and Related Party Transactions
The Sponsor is responsible for investing the assets of the Fund in accordance with the objectives and policies of the Fund. In addition, the Sponsor arranges for one or more third parties to provide administrative, custodial, accounting, transfer agency and other necessary services to the Trust and the Funds. In addition, the Sponsor elected not to outsource services directly attributable to the Trust and the Funds such as accounting, financial reporting, regulatory compliance, and trading activities. The Sponsor does not receive a management fee from the Fund. The Sponsor receives a management fee from each Underlying Fund at the annual rate of 1.00% of such Underlying Fund’s average daily net assets, payable monthly. The Sponsor can elect to waive the payment of this fee for any Underlying Fund in any amount at its sole discretion, at any time and from time to time, in order to reduce the Fund’s expenses or for any other purpose.
| F-115 |
| Table of Contents |
The Fund generally pays for all brokerage fees, taxes, and other expenses, including licensing fees for the use of intellectual property, registration or other fees paid to the SEC, FINRA, or any other regulatory agency in connection with the offer and sale of subsequent Shares after its initial registration and all legal, accounting, printing and other expenses associated therewith. The Fund also pays its portion of the fees and expenses associated with the Trust’s tax accounting and reporting requirements. Certain aggregate expenses common to all Funds within the Trust are allocated by the Sponsor to the respective Funds based on activity drivers deemed most appropriate by the Sponsor for such expenses, including but not limited to relative assets under management and creation order activity.
These aggregate common expenses include, but are not limited to, legal, auditing, accounting and financial reporting, tax-preparation, regulatory compliance, trading activities, and insurance costs, as well as fees paid to the Distributor, which are included in the related line item in the statements of operations. A portion of these aggregate common expenses are related to the Sponsor or related parties of principals of the Sponsor; these are necessary services to the Funds, which are primarily the cost of performing accounting and financial reporting, regulatory compliance, and trading activities that are directly attributable to the Fund. Such expenses are primarily recorded as distribution and marketing fees on the statement of operations. All asset-based fees and expenses for the Funds are calculated on the prior day’s net assets.
|
| Three months ended September 30, 2022 |
|
| Three months ended September 30, 2021 |
|
| Nine months ended September 30, 2022 |
|
| Nine months ended September 30, 2021 |
| ||||
Recognized Related Party Transactions |
| $ |
|
| $ |
|
| $ |
|
| $ |
| ||||
Waived Related Party Transactions |
| $ |
|
| $ |
|
| $ |
|
| $ |
| ||||
The Sponsor has the ability to elect to pay certain expenses on behalf of the Funds or waive the management fee. This election is subject to change by the Sponsor, at its discretion. Expenses paid by the Sponsor and Management fees waived by the Sponsor are, if applicable, presented as waived expenses in the statements of operations for each Fund. The Sponsor has determined that there will be no recovery sought for the amounts below in any future period:
|
| TAGS |
| |
Three months ended September 30, 2022 |
| $ |
| |
Three months ended September 30, 2021 |
| $ |
| |
Nine months ended September 30, 2022 |
| $ |
| |
Nine months ended September 30, 2021 |
| $ |
| |
Expenses
Expenses are recorded using the accrual method of accounting.
Use of Estimates
The preparation of financial statements in conformity with accounting principles generally accepted in the United States of America requires management to make estimates and assumptions that affect the reported amount of assets and liabilities and disclosure of contingent assets and liabilities at the date of the financial statements, and the reported amounts of the revenue and expenses during the reporting period. Actual results could differ from those estimates.
| F-116 |
| Table of Contents |
New Accounting Pronouncements
The Financial Accounting Standards Board (“FASB”) issued Accounting Standards Update (“ASU”) 2022-03, related to fair value measurement (Topic 820) of equity securities subject to contractual sale restrictions. Under the clarified guidance, contractual restrictions on the sale of an equity security are not considered part of the unit of account of the equity security and, therefore, are not considered in measuring fair value, however they do require disclosures. The amendment was early adopted for the quarter ended June 30, 2022; the early adoption did not have a material impact on the financial statements and disclosures of the Trust or the Fund.
The FASB issued ASU 2021-05: “Leases (Topic 842).” Under the amended guidance, a lessor should classify and account for a lease with variable lease payments that don’t depend on an index or a rate as an operating lease if the lease would’ve been classified as a sales-type lease or a direct financing lease in accordance with the lease classification guidance in Topic 842 and the lessor would’ve otherwise recognized a day-one loss. The amendment was adopted early for the quarter ended September 30, 2021; the adoption did not have a material impact on the financial statements and disclosures of the Trust or the Fund.
The FASB issued ASU 2020-10: “Codification Improvements.” The amendment improves the disclosure guidance in appropriate Disclosure Sections, without resulting in changes to current GAAP. The amendment is effective for annual periods beginning after December 15, 2020. The amendment was adopted for the quarter ended March 31, 2021; the adoption did not have a material impact on the financial statements and disclosures of the Trust or the Fund.
The FASB issued 2020-02: “Financial Instruments Credit Losses (Topic 326) and Leases (Topic 842): Amendments to SEC Paragraphs Pursuant to SEC Staff Accounting Bulletin No. 119 and Update to SEC Section on Effective Date Related to Accounting Standards Update No. 2016-02, Leases (Topic 842). The amendment updates and adds language to ASU 2016-02. The amendments were adopted for the quarter ended March 31, 2020; the adoption did not have a material impact on the financial statements and disclosures of the Trust or the Fund.
The FASB issued ASU 2020-01: Investments Equity Securities (Topic 321), Investments Equity Method and Joint Ventures (Topic 323), and Derivatives and Hedging (Topic 815) Clarifying the Interactions between Topic 321, Topic 323, and Topic 815. The amendments clarify the treatment of transactions that require a company to apply or discontinue the equity method of accounting. The amendments were adopted early for the quarter ended March 31, 2020; the adoption did not have a material impact on the financial statements and disclosures of the Trust or the Fund.
The FASB issued ASU 2019-04: “Codification Improvements to Topic 326, Financial Instruments Credit Losses, Topic 815, Derivatives and hedging, and Topic 825, Financial Instruments.” The amendments clarify and improve areas of guidance related to the recently issued standards on credit losses, hedging, and recognition and measurement, specifically relating to ASU 201712. The amendments were early adopted for the quarter ended June 30, 2019; the adoption did not have a material impact on the financial statements and disclosures of the Trust or the Fund.
The FASB issued ASU 2019-01: "Leases (Topic 842): Codification Improvements. These amendments align the guidance for fair value of underlying assets by lessors that are not manufacturers or dealers in Topic 842 with that of existing guidance. The amendments were adopted for the quarter ended September 30, 2020; the adoption did not have a material impact on the financial statements and disclosures of the Trust or the Fund.
The FASB issued ASU 2018-13: “Fair Value Measurement (Topic 820): Disclosure Framework Changes to the Disclosure Requirements for Fair Value Measurement. These amendments modify public and private company fair value disclosure requirements. While some disclosures were removed or modified, others were added. The guidance is a result of the FASB’s test of the principals developed to improve the effectiveness of disclosures in the notes to the financial statements. The amendments were adopted for the quarter ended March 31, 2020; the adoption did not have a material impact on the financial statements and disclosures of the Trust or the Fund.
| F-117 |
| Table of Contents |
The FASB issued ASU 2017-13, “Revenue Recognition (Topic 605), Leases (Topic 840), and Leases (Topic 842): Amendments to SEC Paragraphs Pursuant to the Staff Announcement at the July 20, 2017 EITF Meeting and Rescission of Prior SEC Staff Announcements and Observer Comments”. The amendment amends the early adoption date option for certain companies related to adoption of ASU No. 2014-09 and ASU No. 2016-02. The SEC staff stated the SEC would not object to a public business entity that otherwise would not meet the definition of a public business entity except for a requirement to include or the inclusion of its financial statements or financial information in another entity’s filing with the SEC adopting ASC Topic 842 for fiscal years beginning after December 15, 2019, and interim periods within fiscal years beginning after December 15, 2020. The amendments were adopted for the quarter ended September 30, 2020; the adoption did not have a material impact on the financial statements and disclosures of the Trust or the Fund.
Fair Value - Definition and Hierarchy
In accordance with GAAP, fair value is defined as the price that would be received to sell an asset or paid to transfer a liability (i.e., the “exit price”) in an orderly transaction between market participants at the measurement date.
In determining fair value, the Fund uses various valuation approaches. In accordance with GAAP, a fair value hierarchy for inputs is used in measuring fair value that maximizes the use of observable inputs and minimizes the use of unobservable inputs by requiring that the most observable inputs be used when available. Observable inputs are those that market participants would use in pricing the asset or liability based on market data obtained from sources independent of the Fund. Unobservable inputs reflect the Fund’s assumptions about the inputs market participants would use in pricing the asset or liability developed based on the best information available in the circumstances. The fair value hierarchy is categorized into three levels based on the inputs as follows:
Level 1 - Valuations based on unadjusted quoted prices in active markets for identical assets or liabilities that the Fund has the ability to access. Valuation adjustments and block discounts are not applied to Level 1 financial instruments of the Underlying Funds and securities of the Fund, together the “financial instruments”. Since valuations are based on quoted prices that are readily and regularly available in an active market, valuation of these financial instruments does not entail a significant degree of judgment.
Level 2 - Valuations based on quoted prices in markets that are not active or for which all significant inputs are observable, either directly or indirectly.
Level 3 - Valuations based on inputs that are unobservable and significant to the overall fair value measurement.
The availability of valuation techniques and observable inputs can vary from financial instrument to financial instrument and is affected by a wide variety of factors including, the type of financial instrument, whether the financial instrument is new and not yet established in the marketplace, and other characteristics particular to the transaction. To the extent that valuation is based on models or inputs that are less observable or unobservable in the market, the determination of fair value requires more judgment. Those estimated values do not necessarily represent the amounts that may be ultimately realized due to the occurrence of future circumstances that cannot be reasonably determined. Because of the inherent uncertainty of valuation, those estimated values may be materially higher or lower than the values that would have been used had a ready market for the financial instruments existed. Accordingly, the degree of judgment exercised by the Fund in determining fair value is greatest for financial instruments categorized in Level 3. In certain cases, the inputs used to measure fair value may fall into different levels of the fair value hierarchy. In such cases, for disclosure purposes, the level in the fair value hierarchy, within which the fair value measurement in its entirety falls, is determined based on the lowest level input that is significant to the fair value measurement.
| F-118 |
| Table of Contents |
On September 30, 2022 and December 31, 2021, the reported value at the close of the market for each commodity futures contract of the Underlying Funds fairly reflected the value of the futures and no alternative valuations were required.
For the quarter ended March 31, 2021 Corn Futures Contracts for JUL21 CBOT corn futures, SEP21 CBOT corn futures, DEC21 CBOT corn futures, and Soybean Futures Contracts for JUL21 CBOT soybean futures, and the NOV21 CBOT soybean futures, settled in a “limit up” condition. Accordingly, the Trust, CORN, and SOYB classified these as Level 2 assets. The financial statements of these Funds including TAGS, due to the NAV adjustment for each of these Underlying Funds, were adjusted accordingly. The adjustment in CORN and SOYB resulted in a $
For the quarter ended June 30, 2021, Corn Futures Contracts for the SEP21 and DEC21 CBOT corn futures contracts, settled in a “limit up” condition on June 30, 2021. Therefore, the Trust and CORN have used alternative verifiable sources to value these contracts on June 30, 2021, and the financial statements of these Funds including TAGS, due to the NAV adjustments for the Underlying Fund, were adjusted accordingly. The adjustment in CORN resulted in a $
Net Income (Loss) per Share
Net income (loss) per share is the difference between the NAV per unit at the beginning of each period and at the end of each period. The weighted average number of units outstanding was computed for purposes of disclosing net income (loss) per weighted average unit. The weighted average units are equal to the number of units outstanding at the end of the period, adjusted proportionately for units created or redeemed based on the amount of time the units were outstanding during such period.
Note 4 – Fair Value Measurements
The Fund’s assets and liabilities recorded at fair value have been categorized based upon a fair value hierarchy as described in the Fund’s significant accounting policies in Note 3. The following table presents information about the Fund’s assets and liabilities measured at fair value as of September 30, 2022 and December 31, 2021:
September 30, 2022
Assets: |
| Level 1 |
|
| Level 2 |
|
| Level 3 |
|
| Balance as of September 30, 2022 |
| ||||
Exchange Traded Funds |
| $ |
|
| $ |
|
| $ |
|
| $ |
| ||||
Cash Equivalents |
|
|
|
|
|
|
|
|
|
|
|
| ||||
Total |
| $ |
|
| $ |
|
| $ |
|
| $ |
| ||||
December 31, 2021
Assets: |
| Level 1 |
|
| Level 2 |
|
| Level 3 |
|
| Balance as of December 31, 2021 |
| ||||
Exchange Traded Funds |
| $ |
|
| $ |
|
| $ |
|
| $ |
| ||||
Cash Equivalents |
|
|
|
|
|
|
|
|
|
|
|
| ||||
Total |
| $ |
|
| $ |
|
| $ |
|
| $ |
| ||||
For the three and nine months ended September 30, 2022 and year ended December 31, 2021, the Fund did not have any significant transfers between any of the levels of the fair value hierarchy.
See the Fair Value - Definition and Hierarchy section in Note 3 above for an explanation of the transfers into and out of each level of the fair value hierarchy.
| F-119 |
| Table of Contents |
Note 5 – Financial Highlights
The following table presents per unit performance data and other supplemental financial data for the three and nine months ended September 30, 2022 and 2021. This information has been derived from information presented in the financial statements and is presented with total expenses gross of expenses waived by the Sponsor and with total expenses net of expenses waived by the Sponsor, as appropriate.
|
| Three months ended |
|
| Three months ended |
|
| Nine months ended |
|
| Nine months ended |
| ||||
|
| September 30, 2022 |
|
| September 30, 2021 |
|
| September 30, 2022 |
|
| September 30, 2021 |
| ||||
Per Share Operation Performance |
|
|
|
|
|
|
|
|
|
|
|
| ||||
Net asset value at beginning of period |
| $ |
|
| $ |
|
| $ |
|
| $ |
| ||||
Income (loss) from investment operations: |
|
|
|
|
|
|
|
|
|
|
|
|
|
|
|
|
Net realized and unrealized (loss) gain on investment transactions |
|
| ( | ) |
|
|
|
|
|
|
|
|
| |||
Total expenses, net |
|
| ( | ) |
|
| ( | ) |
|
| ( | ) |
|
| ( | ) |
Net (decrease) increase in net asset value |
|
| ( | ) |
|
|
|
|
|
|
|
|
| |||
Net asset value at end of period |
| $ |
|
| $ |
|
| $ |
|
| $ |
| ||||
Total Return |
|
| ( | )% |
|
| % |
|
| % |
|
| % | |||
Ratios to Average Net Assets (Annualized) |
|
|
|
|
|
|
|
|
|
|
|
|
|
|
|
|
Total expenses |
|
| % |
|
| % |
|
| % |
|
| % | ||||
Total expenses, net |
|
| % |
|
| % |
|
| % |
|
| % | ||||
Net investment loss |
|
| ( | )% |
|
| ( | )% |
|
| ( | )% |
|
| ( | )% |
The financial highlights per share data are calculated consistent with the methodology used to calculate asset-based fees and expenses.
Note 6 – Organizational and Offering Costs
Expenses incurred in organizing of the Trust and the initial offering of the Shares of the Fund, including applicable SEC registration fees, were borne directly by the Sponsor. The Fund will not be obligated to reimburse the Sponsor.
Note 7 – Subsequent Events
Management has evaluated the financial statements for the quarter-ended September 30, 2022 for subsequent events through the date of this filing and noted no material events requiring either recognition through the date of the filing or disclosure herein for the Fund.
| F-120 |
| Table of Contents |
HASHDEX BITCOIN FUTURES ETF
STATEMENTS OF ASSETS AND LIABILITIES
|
| September 30, 2022 |
| |
|
| (Unaudited) |
| |
Assets |
|
|
| |
Cash and cash equivalents |
| $ |
| |
Interest receivable |
|
|
| |
Equity in trading accounts: |
|
|
|
|
Due from broker |
|
|
| |
Total assets |
|
|
| |
|
|
|
|
|
Liabilities |
|
|
|
|
Management fee payable to Sponsor |
|
|
| |
Equity in trading accounts: |
|
|
|
|
Cryptocurrency futures contracts |
|
|
| |
Total liabilities |
|
|
| |
|
|
|
|
|
Net assets |
| $ |
| |
|
|
|
|
|
Shares outstanding |
|
|
| |
|
|
|
|
|
Shares authorized |
| * |
| |
|
|
|
|
|
Net asset value per share |
| $ |
| |
|
|
|
|
|
Market value per share |
| $ |
| |
* On September 14, 2022, the Hashdex Bitcoin Futures ETF registered an indeterminate number of shares of the Fund pursuant to Rule 456(d) under the Securities Act of 1933.
The accompanying notes are an integral part of these financial statements.
| F-121 |
| Table of Contents |
HASHDEX BITCOIN FUTURES ETF
SCHEDULE OF INVESTMENTS
September 30, 2022
(Unaudited)
|
|
|
| Percentage of |
|
|
| |||||
Description: Assets |
| Fair Value |
|
| Net Assets |
|
| Shares |
| |||
|
|
|
|
|
|
|
|
|
| |||
Cash equivalents |
|
|
|
|
|
|
|
|
| |||
Money market funds |
|
|
|
|
|
|
|
|
| |||
First American Government Obligations Fund - Class X (cost $894,998) |
| $ |
|
|
| % |
|
|
| |||
|
|
|
|
|
|
|
|
|
|
|
|
|
|
|
|
|
|
| Percentage of |
|
| Notional Amount |
| ||
Description: Liabilities |
| Fair Value |
|
| Net Assets |
|
| (Long Exposure) |
| |||
|
|
|
|
|
|
|
|
|
|
|
|
|
Cryptocurrency futures contracts |
|
|
|
|
|
|
|
|
|
|
|
|
United States CME Bitcoin futures contracts |
|
|
|
|
|
|
|
|
|
|
|
|
CME Bitcoin futures Oct22 (6 contracts) |
| $ |
|
|
| % |
| $ |
| |||
CME Bitcoin futures Nov22 (6 contracts) |
|
|
|
|
|
|
|
|
| |||
Total cryptocurrency futures contracts |
| $ |
|
|
| % |
| $ |
| |||
The accompanying notes are an integral part of these financial statements.
| F-122 |
| Table of Contents |
HASHDEX BITCOIN FUTURES ETF
STATEMENTS OF OPERATIONS
(Unaudited)
|
| From the commencement |
| |
|
| of operations (September 15, 2022) |
| |
|
| through September 30, 2022 |
| |
Income |
|
|
| |
Realized and unrealized gain (loss) on trading of cryptocurrency futures contracts: |
|
|
| |
Realized loss on cryptocurrency futures contracts |
| $ | ( | ) |
Net change in unrealized depreciation on cryptocurrency futures contracts |
|
| ( | ) |
Interest income |
|
|
| |
Total loss |
|
| ( | ) |
|
|
|
|
|
Expenses |
|
|
|
|
Management fees |
|
|
| |
Business permits and licenses fees |
|
|
| |
Total expenses |
|
|
| |
|
|
|
|
|
Expenses waived by the Sponsor |
|
| ( | ) |
|
|
|
|
|
Total expenses, net |
|
|
| |
|
|
|
|
|
Net loss |
| $ | ( | ) |
|
|
|
|
|
Net loss per share |
| $ | ( | ) |
Net loss per weighted average share |
| $ | ( | ) |
Weighted average shares outstanding |
|
|
| |
The accompanying notes are an integral part of these financial statements.
| F-123 |
| Table of Contents |
HASHDEX BITCOIN FUTURES ETF
STATEMENTS OF CHANGES IN NET ASSETS
(Unaudited)
|
| From the commencement |
| |
|
| of operations (September 15, 2022) |
| |
|
| through September 30, 2022 |
| |
Operations |
|
|
| |
Net loss |
| $ | ( | ) |
Capital transactions |
|
|
|
|
Issuance of Shares |
|
|
| |
Redemption of Shares |
|
|
| |
Total capital transactions |
|
|
| |
Net change in net assets |
|
|
| |
|
|
|
|
|
Net assets, beginning of period |
| $ |
| |
|
|
|
|
|
Net assets, end of period |
| $ |
| |
|
|
|
|
|
Net asset value per share at beginning of period |
| $ |
| |
|
|
|
|
|
Net asset value per share at end of period |
| $ |
| |
|
|
|
|
|
Creation of Shares |
|
|
| |
Redemption of Shares |
|
| - |
|
The accompanying notes are an integral part of these financial statements.
| F-124 |
| Table of Contents |
HASHDEX BITCOIN FUTURES ETF
STATEMENTS OF CASH FLOWS
(Unaudited)
|
| From the commencement |
| |
|
| of operations (September 15, 2022) |
| |
|
| through September 30, 2022 |
| |
Cash flows from operating activities: |
|
|
| |
Net loss |
| $ | ( | ) |
Adjustments to reconcile net loss to net cash used in operating activities: |
|
|
|
|
Net change in unrealized depreciation on cryptocurrency futures contracts |
|
|
| |
Changes in operating assets and liabilities: |
|
|
|
|
Due from broker |
|
| ( | ) |
Interest receivable |
|
| ( | ) |
Management fee payable to Sponsor |
|
|
| |
Net cash used in operating activities |
|
| ( | ) |
|
|
|
|
|
Cash flows from financing activities: |
|
|
|
|
Proceeds from sale of Shares |
|
|
| |
Net cash provided by financing activities |
|
|
| |
|
|
|
|
|
Net change in cash and cash equivalents |
|
|
| |
Cash and cash equivalents beginning of period |
|
|
| |
Cash and cash equivalents end of period |
| $ |
| |
The accompanying notes are an integral part of these financial statements.
| F-125 |
| Table of Contents |
NOTES TO FINANCIAL STATEMENTS
September 30, 2022
(Unaudited)
Note 1 – Organization and Operation
Hashdex Bitcoin Futures ETF (the “Fund”) is a series of Teucrium Commodity Trust (“Trust”), a Delaware statutory trust organized on September 11, 2009. The Fund operates pursuant to the Fifth Amended and Restated Declaration of Trust and Trust Agreement ("Trust Agreement"), dated April 26, 2019. The Trust Agreement may be found on the SEC’s EDGAR filing database at https://www.sec.gov/Archives/edgar/data/1471824/000165495419004865/ex31.htm. The Fund was formed and is managed and controlled by the Sponsor, a limited liability company formed in Delaware on July 28, 2009. The Sponsor is registered as a commodity pool operator (“CPO”) and a commodity trading adviser (“CTA”) with the Commodity Futures Trading Commission (“CFTC”) and is a member of the National Futures Association (“NFA”). The Fund intends to be treated as a partnership for U.S. federal income tax purposes.
On September 14, 2022, the Fund’s initial registration of an indeterminate number of shares on Form S-1 was declared effective by the SEC. On September 16, 2022, the Fund listed it’s shares on the NYSE Arca under the ticker symbol “DEFI”. On the business day prior to that, the Fund issued
The Fund’s investment objective is for changes in the Shares’ NAV to reflect the daily changes of the price of a specified benchmark (the “Benchmark”), less expenses from the Fund’s operations. The Benchmark currently is the average of the closing settlement prices for the first to expire and second to expire bitcoin futures contracts (“Bitcoin Futures Contracts”) listed on the CME. These futures contracts are the Benchmark Component Futures Contracts. The CME currently offers two Bitcoin Futures Contracts, one contract representing 5 bitcoin (“BTC Contracts”) and another contract representing 0.10 bitcoin (“MBT Contracts”). The Fund will invest in BTC Contracts and MBT Contracts to the extent necessary to achieve maximum exposure to the bitcoin futures market.
DEFI Benchmark
CME Bitcoin Futures Contracts |
| Weighting |
| |
First to expire |
|
| % | |
Second to expire |
|
| % | |
| F-126 |
| Table of Contents |
The accompanying unaudited financial statements have been prepared in accordance with Rule 10-01 of Regulation S-X promulgated by the SEC and, therefore, do not include all information and footnote disclosures required under accounting principles generally accepted in the United States of America (“GAAP”). The financial information included herein is unaudited; however, such financial information reflects all adjustments which are, in the opinion of management, necessary for the fair presentation of the Fund’s financial statements for the interim period. It is suggested that these interim financial statements be read in conjunction with the financial statements and related notes included in the Trust’s Annual Report on Form 10-K, as well as the most recent Form S-1 filing, as applicable. The operating results from commencement of operations (September 15, 2022) through September 30, 2022 are not necessarily indicative of the results to be expected from the commencement of operations (September 15, 2022) through December 31, 2022.
Subject to the terms of the Trust Agreement, Teucrium Trading, LLC, in its capacity as the Sponsor (“Sponsor”), may terminate a Fund at any time, regardless of whether the Fund has incurred losses, including, for instance, if it determines that the Fund’s aggregate net assets in relation to its operating expenses make the continued operation of the Fund unreasonable or imprudent. However, no level of losses will require the Sponsor to terminate a Fund.
Note 2 – Principal Contracts and Agreements
The Sponsor employs U.S. Bancorp Fund Services, LLC, doing business as U.S. Bank Global Fund Services (“Global Fund Services”), for Transfer Agency, Fund Accounting and Fund Administration services. The principal address for Global Fund Services is 615 E. Michigan Street, Milwaukee, WI 53202.
The Sponsor employs Foreside Fund Services, LLC (“Foreside” or the “Distributor”) as the Distributor for the Funds. The Distribution Services Agreement among the Distributor and the Sponsor calls for the Distributor to work with the Custodian in connection with the receipt and processing of orders for Creation Baskets and Redemption Baskets and the review and approval of all Fund sales literature and advertising materials.
| F-127 |
| Table of Contents |
StoneX Financial Inc. (“StoneX”) and Phillip Capital Inc. (“Phillip Capital”) serve as the Fund’s clearing brokers to execute futures contracts and provide other brokerage-related services. StoneX and Phillip Capital are each registered as futures commission merchants (“FCM”) with the U.S. CFTC and are members of the NFA. The clearing brokers are registered as broker-dealers with the SEC and are each a member of FINRA. StoneX and Phillip Capital are each clearing members of ICE Futures U.S., Inc., Chicago Board of Trade, Chicago Mercantile Exchange, New York Mercantile Exchange, and all other major United States commodity exchanges. StoneX is paid 10.00 -$25.00 per half-turn exclusive of pass through fees for the exchange, and the NFA. Phillip Capital is paid $35.00 - $45.00 per half-turn exclusive of pass through fees for the exchange, the NFA, execution fees and platform and exchange data fees. A summary of these expenses is included below.
The sole Trustee of the Trust is Wilmington Trust Company, a Delaware banking corporation. The Trustee will accept service of legal process on the Trust in the State of Delaware and will make certain filings under the Delaware Statutory Trust Act. For its services, the Trustee receives an annual fee of $3,300 from the Trust. These services are recorded in business permits and licenses fees on the statements of operations. A summary of these expenses is included below.
|
| From the commencement of operations (September 15, 2022) through September 30, 2022 |
| |
Amount Recognized for Wilmington Trust |
| $ |
| |
Amount of Wilmington Trust Waived |
| $ |
| |
Note 3 – Summary of Significant Accounting Policies
Basis of Presentation
The accompanying financial statements have been prepared in accordance with accounting principles generally accepted in the United States of America (“U.S. GAAP”) as detailed in the Financial Accounting Standards Board’s Accounting Standards Codification.
Revenue Recognition
Investment transactions are accounted for on a trade-date basis. All such transactions are recorded on the identified cost basis and marked to market daily. Unrealized appreciation or depreciation on investments are reflected in the statements of operations as the difference between the original amount and the fair market value as of the last business day of the year or as of the last date of the financial statements. Changes in the appreciation or depreciation between periods are reflected in the statements of operations.
Brokerage Commissions
The Sponsor recognizes the expense for brokerage commissions for futures contract trades on a per-trade basis. The below table shows the amounts included on the statements of operations as total brokerage commissions paid inclusive of unrealized loss from the commencement of operations (September 15, 2022) through September 30, 2022.
|
| DEFI |
| |
From the commencement of operations (September 15, 2022) through September 30, 2022 |
| $ |
| |
| F-128 |
| Table of Contents |
Income Taxes
For federal income tax purposes, the Fund will be treated as a publicly traded partnership. A publicly traded partnership is generally treated as a corporation for federal income tax purposes unless 90% or more of the publicly traded partnership’s gross income for each taxable year of its existence consists of qualifying income as defined in section 7704(d) of the Internal Revenue Code of 1986, as amended. Qualifying income is defined as generally including, in pertinent part, interest (other than from a financial business), dividends, and gains from the sale or disposition of capital assets held for the production of interest or dividends. In the case of a partnership of which a principal activity is the buying and selling of commodities, other than as inventory, or of futures, forwards and options with respect to commodities, qualifying income also includes income and gains from commodities and from futures, forwards, options with respect to commodities and, provided the partnership is a trader or investor with respect to such assets, swaps and other notional principal contracts with respect to commodities. The Fund expects that at least 90% of the Fund’s gross income for each taxable year will consist of qualifying income and that the Fund will be taxed as a partnership for federal income tax purposes. The Fund does not record a provision for income taxes because the shareholders report their share of the Fund’s income or loss on their income tax returns. The financial statements reflect the Fund’s transactions without adjustment, if any, required for income tax purposes.
There is very limited authority on the U.S. federal income tax treatment of bitcoin and no direct authority on bitcoin derivatives, such as Bitcoin Futures Contracts. Bitcoin Futures Contracts more likely than not will be considered futures with respect to commodities for purposes of the qualifying income exception under section 7704 of the Code. Based on a CFTC determination that treats bitcoin as a commodity under the CEA, the Fund intends to take the position that Bitcoin Futures Contracts consist of futures on commodities for purposes of the qualifying income exception under section 7704 of the Code. Shareholders should be aware that the Fund’s position is not binding on the IRS, and no assurance can be given that the IRS will not challenge the Fund’s position, or that the IRS or a court will not ultimately reach a contrary conclusion, which would result in the material adverse consequences to Shareholders and the Fund.
The Fund recognizes interest accrued related to unrecognized tax benefits and penalties related to unrecognized tax benefits in income tax fees payable, if assessed. No interest expense or penalties have been recognized as of and from the commencement of operations (September 15, 2022) through September 30, 2022.
The Fund may be subject to potential examination by U.S. federal, U.S. state, or foreign jurisdictional authorities in the area of income taxes. These potential examinations may include questioning the timing and amount of deductions, the nexus of income among various tax jurisdictions, and compliance with U.S. federal, U.S. state and foreign tax laws.
Creations and Redemptions
Authorized Purchasers may purchase Creation Baskets consisting of 10,000 shares from the Fund. The amount of the proceeds required to purchase a Creation Basket will be equal to the NAV of the shares in the Creation Basket determined as of 4:00 p.m. (ET) on the day the order to create the basket is received in good order.
Authorized Purchasers may redeem shares from the Fund only in blocks of 10,000 shares called “Redemption Baskets.” The amount of the redemption proceeds for a Redemption Basket will be equal to the NAV of the shares in the Redemption Basket determined as of 4:00 p.m. (ET) on the day the order to redeem the basket is received in good order.
The Fund will receive the proceeds from shares sold or will pay for redeemed shares within three business days after the trade date of the purchase or redemption, respectively. The amounts due from Authorized Purchasers will be reflected in the Fund’s statements of assets and liabilities as capital shares receivable. Amounts payable to Authorized Purchasers upon redemption will be reflected in the Fund’s statements of assets and liabilities as payable for shares redeemed.
As outlined in the most recent Form S-1 filing, 50,000 shares represent five Redemption Baskets for the Fund and a minimum level of shares. If the Fund experienced redemptions that caused the number of Shares outstanding to decrease to the minimum level of Shares required to be outstanding, until the minimum number of Shares is again exceeded through the purchase of a new Creation Basket, there can be no more redemptions by an Authorized Purchaser.
| F-129 |
| Table of Contents |
Allocation of Shareholder Income and Losses
Profit or loss is allocated among the shareholders of the Fund in proportion to the number of shares each shareholder holds as of the close of each month.
Cash Equivalents
Cash equivalents are highly liquid investments with maturity dates of 90 days or less when acquired. The Fund reported its cash equivalents in the statements of assets and liabilities at market value, or at carrying amounts that approximate fair value, because of their highly liquid nature and short-term maturities. The Fund has these balances of its assets on deposit with banks. Assets deposited with a financial institution may, at times, exceed federally insured limits. DEFI had a balance of $894,998 in money market funds at September 30, 2022; these balances are included in cash equivalents on the statements of assets and liabilities.
Due from/to Broker
The amount recorded by the Fund for the amount due from and to the clearing broker includes, but is not limited to, cash held by the broker, amounts payable to the clearing broker related to open transactions, payables for cryptocurrency futures accounts liquidating to an equity balance on the clearing broker’s records and amounts of brokerage commissions paid and recognized as unrealized losses.
Margin is the minimum amount of funds that must be deposited by a cryptocurrency interest trader with the trader’s broker to initiate and maintain an open position in futures contracts. A margin deposit acts to assure the trader’s performance of the futures contracts purchased or sold. Futures contracts are customarily bought and sold on initial margin that represents a very small percentage of the aggregate purchase or sales price of the contract. Because of such low margin requirements, price fluctuations occurring in the futures markets may create profits and losses that, in relation to the amount invested, are greater than customary in other forms of investment or speculation. As discussed below, adverse price changes in the futures contract may result in margin requirements that greatly exceed the initial margin. In addition, the amount of margin required in connection with a particular futures contract is set from time to time by the exchange on which the contract is traded and may be modified from time to time by the exchange during the term of the contract. Brokerage firms, such as the Fund’s clearing brokers, carrying accounts for traders in commodity interest contracts generally require higher amounts of margin as a matter of policy to further protect themselves. Over the counter trading generally involves the extension of credit between counterparties, so the counterparties may agree to require the posting of collateral by one or both parties to address credit exposure.
When a trader purchases an option, there is no margin requirement; however, the option premium must be paid in full. When a trader sells an option, on the other hand, he or she is required to deposit margin in an amount determined by the margin requirements established for the underlying interest and, in addition, an amount substantially equal to the current premium for the option. The margin requirements imposed on the selling of options, although adjusted to reflect the probability that out-of-the-money options will not be exercised, can in fact be higher than those imposed in dealing in the futures markets directly. Complicated margin requirements apply to spreads and conversions, which are complex trading strategies in which a trader acquires a mixture of options positions and positions in the underlying interest.
Ongoing or “maintenance” margin requirements are computed each day by a trader’s clearing broker. When the market value of a particular open futures contract changes to a point where the margin on deposit does not satisfy maintenance margin requirements, a margin call is made by the broker. If the margin call is not met within a reasonable time, the broker may close out the trader’s position. With respect to the Fund’s trading, the Fund (and not its shareholders personally) is subject to margin calls. Finally, many major U.S. exchanges have passed certain cross margining arrangements involving procedures pursuant to which the futures and options positions held in an account would, in the case of some accounts, be aggregated and margin requirements would be assessed on a portfolio basis, measuring the total risk of the combined positions.
| F-130 |
| Table of Contents |
Calculation of Net Asset Value
The Fund’s NAV is calculated by:
| • | Taking the current market value of its total assets and |
| • | Subtracting any liabilities. |
The administrator, Global Fund Services, will calculate the NAV of the Fund once each trading day. It will calculate the NAV as of the earlier of the close of the New York Stock Exchange or 4:00 p.m. (ET). The NAV for a particular trading day will be released after 4:15 p.m. (ET).
In determining the value of Bitcoin Futures Contracts, the Administrator uses the settlement price for the Benchmark Component Futures Contracts, as reported on the CME. CME Group staff determines the daily settlements for the Benchmark Component Futures Contracts based on trading activity on CME Globex exchange between 14:59:00 and 15:00:00 Central Time (CT), the settlement period, except that the “fair value” of Bitcoin Futures Contracts (as described in more detail below) may be used when Bitcoin Futures Contracts close at their price fluctuation limit for the day. The Administrator determines the value of all investments as of the earlier of the close of the New York Stock Exchange or 4:00 p.m. (ET), in accordance with the current Services Agreement between the Administrator and the Trust. NAV includes any unrealized profit or loss on open bitcoin interests and any other credit or debit accruing to the Fund but unpaid or not received by the Fund.
Sponsor Fee Allocation of Expenses and Related Party Transactions
The Sponsor is responsible for investing the assets of the Fund in accordance with the objectives and policies of the Fund. DEFI is contractually obligated to pay a monthly management fee to the Sponsor, based on average daily net assets, at a rate equal to 0.94% per annum. From the Management Fee, the Sponsor pays all of the routine operational, administrative and other ordinary expenses of the Fund, generally as determined by the Sponsor, including but not limited to, fees and expenses of the Administrator, Custodian, Distributor, Transfer Agent, licensors, accounting and audit fees expenses, tax preparation expenses, legal fees, ongoing SEC registration fees, individual Schedule K-1 preparation and mailing fees, and report preparation and mailing expenses. These fees and expenses are not included in the breakeven table because they are paid for by the Sponsor through the proceeds from the Management Fee. The Fund pays all of its non-recurring and unusual fees and expenses, if any, as determined by the Sponsor. Non-recurring and unusual fees and expenses are unexpected or unusual in nature, such as legal claims and liabilities and litigation costs or indemnification or other unanticipated expenses. Extraordinary fees and expenses also include material expenses which are not currently anticipated obligations of the Fund. Routine operational, administrative, and other ordinary expenses are not deemed extraordinary expenses.
| F-131 |
| Table of Contents |
The Sponsor has the ability to elect to pay certain expenses on behalf of the Funds or waive the management fee. This election is subject to change by the Sponsor, at its discretion. Expenses paid by the Sponsor and Management fees waived by the Sponsor are, if applicable, presented as waived expenses in the statements of operations for each Fund. The Sponsor has determined that there will be no recovery sought for the amounts below in any future period:
|
| DEFI |
| |
From the commencement of operations (September 15, 2022) through September 30, 2022 |
| $ |
| |
Expenses
Expenses are recorded using the accrual method of accounting.
Use of Estimates
The preparation of financial statements in conformity with accounting principles generally accepted in the United States of America requires management to make estimates and assumptions that affect the reported amount of assets and liabilities and disclosure of contingent assets and liabilities at the date of the financial statements, and the reported amounts of the revenue and expenses during the reporting period. Actual results could differ from those estimates.
New Accounting Pronouncements
The Financial Accounting Standards Board (“FASB”) issued Accounting Standards Update (“ASU”) 2022-03, related to fair value measurement (Topic 820) of equity securities subject to contractual sale restrictions. Under the clarified guidance, contractual restrictions on the sale of an equity security are not considered part of the unit of account of the equity security and, therefore, are not considered in measuring fair value, however they do require disclosures. The amendment was early adopted for the quarter ended September 30, 2022; the early adoption did not have a material impact on the financial statements and disclosures of the Trust or the Fund.
Fair Value - Definition and Hierarchy
In accordance with GAAP, fair value is defined as the price that would be received to sell an asset or paid to transfer a liability (i.e., the “exit price”) in an orderly transaction between market participants at the measurement date.
In determining fair value, the Fund uses various valuation approaches. In accordance with GAAP, a fair value hierarchy for inputs is used in measuring fair value that maximizes the use of observable inputs and minimizes the use of unobservable inputs by requiring that the most observable inputs be used when available. Observable inputs are those that market participants would use in pricing the asset or liability based on market data obtained from sources independent of the Fund. Unobservable inputs reflect the Fund’s assumptions about the inputs market participants would use in pricing the asset or liability developed based on the best information available in the circumstances. The fair value hierarchy is categorized into three levels based on the inputs as follows:
Level 1 - Valuations based on unadjusted quoted prices in active markets for identical assets or liabilities that the Fund has the ability to access. Valuation adjustments and block discounts are not applied to Level 1 financial instruments of the Underlying Funds and securities of the Fund, together the “financial instruments”. Since valuations are based on quoted prices that are readily and regularly available in an active market, valuation of these financial instruments does not entail a significant degree of judgment.
Level 2 - Valuations based on quoted prices in markets that are not active or for which all significant inputs are observable, either directly or indirectly.
Level 3 - Valuations based on inputs that are unobservable and significant to the overall fair value measurement.
| F-132 |
| Table of Contents |
The availability of valuation techniques and observable inputs can vary from financial instrument to financial instrument and is affected by a wide variety of factors including, the type of financial instrument, whether the financial instrument is new and not yet established in the marketplace, and other characteristics particular to the transaction. To the extent that valuation is based on models or inputs that are less observable or unobservable in the market, the determination of fair value requires more judgment. Those estimated values do not necessarily represent the amounts that may be ultimately realized due to the occurrence of future circumstances that cannot be reasonably determined. Because of the inherent uncertainty of valuation, those estimated values may be materially higher or lower than the values that would have been used had a ready market for the financial instruments existed. Accordingly, the degree of judgment exercised by the Fund in determining fair value is greatest for financial instruments categorized in Level 3. In certain cases, the inputs used to measure fair value may fall into different levels of the fair value hierarchy. In such cases, for disclosure purposes, the level in the fair value hierarchy, within which the fair value measurement in its entirety falls, is determined based on the lowest level input that is significant to the fair value measurement.
On September 30, 2022 and December 31, 2021, the reported value at the close of the market for each cryptocurrency contract fairly reflected the value of the futures and no alternative valuations were required.
Net Income (Loss) per Share
Net income (loss) per share is the difference between the NAV per unit at the beginning of each period and at the end of each period. The weighted average number of units outstanding was computed for purposes of disclosing net income (loss) per weighted average unit. The weighted average units are equal to the number of units outstanding at the end of the period, adjusted proportionately for units created or redeemed based on the amount of time the units were outstanding during such period.
Note 4 – Fair Value Measurements
The Fund’s assets and liabilities recorded at fair value have been categorized based upon a fair value hierarchy as described in the Fund’s significant accounting policies in Note 3. The following table presents information about the Fund’s assets and liabilities measured at fair value as of September 30, 2022 and December 31, 2021:
September 30, 2022
Assets: |
| Level 1 |
|
| Level 2 |
|
| Level 3 |
|
| Balance as of September 30, 2022 |
| ||||
Cash Equivalents |
| $ |
|
| $ |
|
| $ |
|
| $ |
| ||||
|
|
|
|
|
|
|
|
|
|
|
|
|
|
|
|
|
Liabilities |
| Level 1 |
|
| Level 2 |
|
| Level 3 |
|
| Balance as of September 30, 2022 |
| ||||
Cryptocurrency Futures Contracts |
|
|
|
|
|
|
|
|
|
|
|
|
|
|
|
|
Bitcoin futures contracts |
| $ |
|
| $ |
|
| $ |
|
| $ |
| ||||
From the commencement of operations (September 15, 2022) through September 30, 2022, the Fund did not have any significant transfers between any of the levels of the fair value hierarchy.
See the Fair Value - Definition and Hierarchy section in Note 3 above for an explanation of the transfers into and out of each level of the fair value hierarchy.
| F-133 |
| Table of Contents |
Note 5 – Derivative Instruments and Hedging Activities
In the normal course of business, the Fund utilizes derivative contracts in connection with its proprietary trading activities. Investments in derivative contracts are subject to additional risks that can result in a loss of all or part of an investment. The Fund’s derivative activities and exposure to derivative contracts are classified by the following primary underlying risks: interest rate, credit, commodity price, and equity price risks. In addition to its primary underlying risks, the Fund is also subject to additional counterparty risk due to inability of its counterparties to meet the terms of their contracts. For the commencement of operations (September 15, 2022) through September 30, 2022, the Fund invested only in cryptocurrency futures contracts.
Futures Contracts
The Fund is subject to cryptocurrency price risk in the normal course of pursuing its investment objectives. A futures contract represents a commitment for the future purchase or sale of an asset at a specified price on a specified date.
The purchase and sale of futures contracts requires margin deposits with a Futures Commission Merchant (“FCM”). Subsequent payments (variation margin) are made or received by the Fund each day, depending on the daily fluctuations in the value of the contract, and are recorded as unrealized gains or losses by the Fund. Futures contracts may reduce the Fund’s exposure to counterparty risk since futures contracts are exchange-traded; and the exchange’s clearinghouse, as the counterparty to all exchange-traded futures, guarantees the futures against default.
The Commodity Exchange Act requires an FCM to segregate all customer transactions and assets from the FCM’s proprietary activities. A customer’s cash and other equity deposited with an FCM are considered commingled with all other customer funds subject to the FCM’s segregation requirements. In the event of an FCM’s insolvency, recovery may be limited to the Fund’s pro rata share of segregated customer funds available. It is possible that the recovery amount could be less than the total of cash and other equity deposited.
The following table discloses information about offsetting assets and liabilities presented in the statements of assets and liabilities to enable users of these financial statements to evaluate the effect or potential effect of netting arrangements for recognized assets and liabilities. These recognized assets and liabilities are presented as defined in the Financial Accounting Standards Board’s (“FASB”) Accounting Standards Update (“ASU”) No. 2011-11 “Balance Sheet (Topic 210): Disclosures about Offsetting Assets and Liabilities” and subsequently clarified in FASB ASU 2013-01 “Balance Sheet (Topic 210): Clarifying the Scope of Disclosures about Offsetting Assets and Liabilities.”
The following table also identifies the fair value amounts of derivative instruments included in the statements of assets and liabilities as derivative contracts, categorized by primary underlying risk, and held by the FCMs, StoneX as of September 30, 2022.
*The amount of collateral presented in Collateral, Due from Broker, is limited to the liability for the futures contracts and accordingly does not include the excess collateral pledged.
Offsetting of Financial Liabilities and Derivative Liabilities as of September 30, 2022
|
| (i) |
|
| (ii) |
|
| (iii) = (i)-(ii) |
|
| (iv) |
|
| (v)=(iii)-(iv) |
| |||||||||
|
|
|
|
|
|
|
|
|
|
| Gross Amount Not Offset in the Statement of Assets and Liabilities |
|
|
|
| |||||||||
Description |
| Gross Amount of Recognized Liabilities |
|
| Gross Amount Offset in the Statement of Assets and Liabilities |
|
| Net Amount Presented in the Statement of Assets and Liabilities |
|
| Futures Contracts Available for Offset |
|
| Collateral, Due from Broker* |
|
| Net Amount |
| ||||||
Cryptocurrency Price |
|
|
|
|
|
|
|
|
|
|
|
|
|
|
|
|
|
| ||||||
Bitcoin futures contracts |
| $ |
|
| $ |
|
| $ |
|
| $ |
|
| $ |
|
| $ |
| ||||||
The following tables identify the net gain and loss amounts included in the statements of operations as realized and unrealized gains and losses on trading of cryptocurrency futures contracts categorized by primary underlying risk:
| F-134 |
| Table of Contents |
From the commencement of operations (September 15, 2022) through September 30, 2022
|
| Realized Loss on Cryptocurrency Futures Contracts |
|
| Net Change in Unrealized Depreciation on Cryptocurrency Futures Contracts |
| ||
Cryptocurrency Price |
|
|
|
|
|
| ||
Bitcoin futures Contracts |
| $ | ( | ) |
| $ | ( | ) |
Volume of Derivative Activities
The average notional market value categorized by primary underlying risk for all futures contracts held was $
Note 6 – Financial Highlights
The following table presents per unit performance data and other supplemental financial data from the commencement of operations (September 15, 2022) through September 30, 2022. This information has been derived from information presented in the financial statements and is presented with total expenses gross of expenses waived by the Sponsor and with total expenses net of expenses waived by the Sponsor, as appropriate.
|
| From the commencement |
| |
|
| of operations (September 15, 2022) |
| |
|
| through September 30, 2022 |
| |
Per Share Operation Performance |
|
|
| |
Net asset value at beginning of period |
| $ |
| |
Income (loss) from investment operations: |
|
|
|
|
Investment income |
|
|
| |
Net realized and unrealized (loss) gain on cryptocurrency futures contracts |
|
| ( | ) |
Total expenses, net |
|
| ( | ) |
Net decrease in net asset value |
|
| ( | ) |
Net asset value at end of period |
| $ |
| |
Total Return |
|
| ( | )% |
Ratios to Average Net Assets (Annualized) |
|
|
|
|
Total expenses |
|
| % | |
Total expenses, net |
|
| % | |
Net investment income |
|
| % | |
The financial highlights per share data are calculated consistent with the methodology used to calculate asset-based fees and expenses.
Note 7 – Organizational and Offering Costs
Expenses incurred in organizing of the Trust and the initial offering of the Shares of the Fund, including applicable SEC registration fees, were borne directly by the Sponsor. The Fund will not be obligated to reimburse the Sponsor.
Note 8 – Subsequent Events
Management has evaluated the financial statements for the quarter-ended September 30, 2022 for subsequent events through the date of this filing and noted no material events requiring either recognition through the date of the filing or disclosure herein for the Fund other than those noted below:
The total net assets of the Fund increased by $
.
| F-135 |
| Table of Contents |
Item 2. Management’s Discussion and Analysis of Financial Condition and Results of Operations.
This information should be read in conjunction with the financial statements and notes included in Item 1 of Part I of this Quarterly Report (the “Report”). The discussion and analysis which follows may contain trend analysis and other forward-looking statements within the meaning of Section 21E of the Securities Exchange Act of 1934 which reflect our current views with respect to future events and financial results. Words such as “anticipate,” “expect,” “intend,” “plan,” “believe,” “seek,” “outlook” and “estimate,” as well as similar words and phrases, signify forward-looking statements. Teucrium Commodity Trust’s (the “Trust’s”) forward-looking statements are not a guarantee of future results and conditions, and important factors, risks and uncertainties may cause our actual results to differ materially from those expressed in our forward-looking statements.
You should not place undue reliance on any forward-looking statements. Except as expressly required by the Federal securities laws, Teucrium Trading, LLC (the “Sponsor”) undertakes no obligation to publicly update or revise any forward-looking statements or the risks, uncertainties or other factors described in this Report, as a result of new information, future events or changed circumstances or for any other reason after the date of this Report.
Overview/Introduction
Teucrium Commodity Trust (“Trust”), a Delaware statutory trust organized on September 11, 2009, is a series trust consisting of six series: Teucrium Corn Fund (“CORN”), Teucrium Sugar Fund (“CANE”), Teucrium Soybean Fund (“SOYB”), Teucrium Wheat Fund (“WEAT”), Teucrium Agricultural Fund (collectively, “the Agricultural Funds”) and Hashdex Bitcoin Futures ETF (“DEFI”). All of the series of the Trust are collectively referred to as the “Funds” and singularly as the “Fund.” Each Fund is a commodity pool that is a series of the Trust. The Funds issue common units, called the “Shares,” representing fractional undivided beneficial interests in a Fund. Effective as of April 26, 2019, the Trust and the Funds operate pursuant to the Trust’s Fifth Amended and Restated Declaration of Trust and Trust Agreement (the “Trust Agreement”).
On June 7, 2010, the initial Form S-1 for CORN was declared effective by the U.S. Securities and Exchange Commission (“SEC”). On June 8, 2010, four Creation Baskets for CORN were issued representing 200,000 shares and $5,000,000. CORN began trading on the New York Stock Exchange (“NYSE”) Arca on June 9, 2010. The current registration statement for CORN was declared effective by the SEC on April 7, 2022. This registration statement for CORN registered an indeterminate number of shares.
On June 13, 2011, the initial Forms S-1 for CANE, SOYB, and WEAT were declared effective by the SEC. On September 16, 2011, two Creation Baskets were issued for each Fund, representing 100,000 shares and $2,500,000, for CANE, SOYB, and WEAT. On September 19, 2011, CANE, SOYB, and WEAT started trading on the NYSE Arca. The current registration statements for SOYB and CANE were declared effective by the SEC on April 7, 2022. The registration statements for SOYB and CANE registered an indeterminate number of shares each. The current registration statement for WEAT was declared effective on March 9, 2022. This registration statement for WEAT registered an indeterminate number of shares.
On February 10, 2012, the Form S-1 for TAGS was declared effective by the SEC. On March 27, 2012, six Creation Baskets for TAGS were issued representing 300,000 shares and $15,000,000. TAGS began trading on the NYSE Arca on March 28, 2012. The current registration statement for TAGS was declared effective by the SEC on April 7, 2022. This registration statement for TAGS registered an indeterminate number of shares.
On September 14, 2022, the Form S-1 for DEFI was declared effective by the SEC. On September 15, 2022, five Creation Baskets for DEFI were issued representing 50,000 shares and $1,250,000. DEFI began trading on the NYSE Arca on September 16, 2022. This registration statement for DEFI registered an indeterminate number of shares.
| 4 |
| Table of Contents |
The occurrence of a severe weather event, natural disaster, terrorist attack, geopolitical events, outbreak, or public health emergency as declared by the World Health Organization, the continuation or expansion of war or other hostilities, or a prolonged government shutdown may have significant adverse effects on an Agricultural Fund and its investments and alter current assumptions and expectations. For example, in late February 2022, Russia invaded Ukraine, significantly amplifying already existing geopolitical tensions among Russia and other countries in the region and in the west. The responses of countries and political bodies to Russia’s actions, the larger overarching tensions, and Ukraine’s military response and the potential for wider conflict may increase financial market volatility generally, have severe adverse effects on regional and global economic markets, and cause volatility in the price of agricultural commodities, agricultural futures and the share price of an Agricultural Funds.
A climate of uncertainty and panic, including the contagion of the COVID-19 virus and other infectious viruses or diseases, may adversely affect global, regional, and local economies and reduce the availability of potential investment opportunities, and increases the difficulty of performing due diligence and modeling market conditions, potentially reducing the accuracy of financial projections. Under these circumstances, the Funds may have difficulty achieving their investment objectives which may adversely impact performance. Further, such events can be highly disruptive to economies and markets, significantly disrupt the operations of individual companies (including, but not limited to, the Funds’ Sponsor and third-party service providers), sectors, industries, markets, securities and commodity exchanges, currencies, interest and inflation rates, credit ratings, investor sentiment, and other factors affecting the value of the Funds’ investments. These factors could cause substantial market volatility, exchange trading suspensions and closures that could impact the ability of the Funds to complete redemptions and otherwise affect Fund performance and Fund trading in the secondary market. A widespread crisis may also affect the global economy in ways that cannot necessarily be foreseen at the current time. How long such events will last and whether they will continue or recur cannot be predicted. Impacts from these events could have significant impact on a Fund’s performance, resulting in losses to your investment. The global economic shocks being experienced as of the date hereof may cause the underlying assumptions and expectations of the Funds to become outdated quickly or inaccurate, resulting in significant losses.
In addition, DEFI is subject to the risks associated with bitcoin. Bitcoin is a digital asset or cryptocurrency that is a unit of account on the “Bitcoin Network,” an open source, decentralized peer-to-peer computer network. The ownership and operation of bitcoin is determined by purchasers in the Bitcoin Network. The Bitcoin Network connects computers that run publicly accessible, or open source, software that follows the rules and procedures governing the Bitcoin Network. This is commonly referred to as the Bitcoin Protocol. Bitcoin may be held, may be used to purchase goods and services or may be exchanged for fiat currency. No single entity owns or operates the Bitcoin Network, and the value of bitcoin is not backed by any government, corporation, or other entity. Instead, the value of bitcoin is determined in part by the supply and demand in markets created to facilitate the trading of bitcoin. Public key cryptography protects the ownership and transaction records for bitcoin. Because the source code for the Bitcoin Network is open source, anyone can contribute to its development. At this time, the ultimate supply of bitcoin is finite and limited to 21 million “coins” with the number of bitcoin available increasing gradually as new bitcoin supplies are mined until the 21 million current protocol cap is reached. The following factors, among others, may affect the price and market for bitcoin: DEFI does not invest directly in bitcoin.
● | How widely bitcoin is adopted, including the use of bitcoin as a payment. |
● | The regulatory environment for cryptocurrencies, which continues to evolve in the U.S., and which may delay, impede, or restrict the adoption or use of bitcoin. |
● | Speculative activity in the market for bitcoin, including by holders of large amounts of bitcoin, which may increase volatility. |
● | Cyberattacks, including the risk that malicious actors will exploit flaws in the code or structure of bitcoin, control the blockchain, steal information or cause disruptions to the internet. |
● | Rewards for mining bitcoin are designed to decline over time, which may lessen the incentive for miners to process and confirm transactions on the Bitcoin Network. |
● | The open-source nature of the Bitcoin Network may result in forks, or changes to the underlying code of bitcoin that result in the creation of new, separate digital assets. |
● | Fraud, manipulation, security failure or operational problems at bitcoin exchanges that result in a decline in adoption or acceptance of bitcoin. |
● | Scalability as the use of bitcoin expands to a greater number of users. |
| 5 |
| Table of Contents |
The Investment Objective of the Funds
The investment objective of CORN is to have the daily changes in the NAV of the Fund’s Shares reflect the daily changes in the corn market for future delivery as measured by the Benchmark. The Benchmark is a weighted average of the closing settlement prices for three futures contracts for corn (“Corn Futures Contracts”) that are traded on the Chicago Board of Trade (“CBOT”):
CORN Benchmark
CBOT Corn Futures Contract |
| Weighting |
| |
Second to expire |
|
| 35 | % |
Third to expire |
|
| 30 | % |
December following the third to expire |
|
| 35 | % |
The investment objective of SOYB is to have the daily changes in the NAV of the Fund’s Shares reflect the daily changes in the soybean market for future delivery as measured by the Benchmark. The Benchmark is a weighted average of the closing settlement prices for three futures contracts for soybeans (“Soybean Futures Contracts”) that are traded on the Chicago Board of Trade (“CBOT”):
SOYB Benchmark
CBOT Soybean Futures Contract |
| Weighting |
| |
Second to expire (excluding August & September) |
|
| 35 | % |
Third to expire (excluding August & September) |
|
| 30 | % |
Expiring in the November following the expiration of the third to expire contract |
|
| 35 | % |
The investment objective of CANE is to have the daily changes in the NAV of the Fund’s Shares reflect the daily changes in the sugar market for future delivery as measured by the Benchmark. The Benchmark is a weighted average of the closing settlement prices for three futures contracts for No. 11 sugar (“Sugar Futures Contracts”) that are traded on the ICE Futures US (“ICE”):
CANE Benchmark
ICE Sugar Futures Contract |
| Weighting |
| |
Second to expire |
|
| 35 | % |
Third to expire |
|
| 30 | % |
Expiring in the March following the expiration of the third to expire contract |
|
| 35 | % |
The investment objective of WEAT is to have the daily changes in the NAV of the Fund’s Shares reflect the daily changes in the wheat market for future delivery as measured by the Benchmark. The Benchmark is a weighted average of the closing settlement prices for three futures contracts for wheat (“Wheat Futures Contracts”) that are traded on the Chicago Board of Trade (“CBOT”):
WEAT Benchmark
CBOT Wheat Futures Contract |
| Weighting |
| |
Second to expire |
|
| 35 | % |
Third to expire |
|
| 30 | % |
December following the third to expire |
|
| 35 | % |
The investment objective of TAGS is to provide daily investment results that reflect the combined daily performance of four other commodity pools, specifically CORN, SOYB, CANE and WEAT (the “Underlying Funds”). Under normal market conditions, the Fund seeks to achieve its investment objective generally by investing equally in shares of each Underlying Fund and, to a lesser extent, cash equivalents. The Fund’s investments in shares of Underlying Funds are rebalanced, generally on a daily basis, in order to maintain approximately a 25% allocation of the Fund’s assets to each Underlying Fund:
TAGS Benchmark
Underlying Fund |
| Weighting |
| |
CORN |
|
| 25 | % |
SOYB |
|
| 25 | % |
CANE |
|
| 25 | % |
WEAT |
|
| 25 | % |
| 6 |
| Table of Contents |
The investment objective of DEFI is to have the daily changes in the NAV of the Fund’s Shares reflect the daily changes of the price of the Hashdex U.S. Bitcoin Futures Fund Benchmark (the “Benchmark”), less expenses from the Fund’s operations. The Benchmark is currently the average of the closing settlement prices for the first to expire and second to expire bitcoin futures contracts (“Bitcoin Futures Contracts”) listed on the Chicago Mercantile Exchange Inc. (“CME”).
DEFI Benchmark
CME Bitcoin Futures Contract |
| Weighting |
| |
First to expire |
|
| 50 | % |
Second to expire |
|
| 50 | % |
The notional amount of each Benchmark Component Futures Contract included in each Benchmark is intended to reflect the changes in market value of each such Benchmark Component Futures Contract within the Benchmark. The closing level of each Benchmark is calculated on each business day by U.S. Bank Global Fund Services (“Global Fund Services”) based on the closing price of the futures contracts for each of the underlying Benchmark Component Futures Contracts and the notional amounts of such Benchmark Component Futures Contracts.
Each Benchmark is rebalanced periodically to ensure that each of the Benchmark Component Futures Contracts is weighted in the same proportion as in the investment objective for each Fund. The following tables reflect the September 30, 2022, Benchmark Component Futures Contracts weights for each of the Funds, the contract held is identified by the generally accepted nomenclature of contract month and year, which may differ from the month in which the contract expires:
CORN Benchmark Component Futures Contracts |
| Notional Value |
|
| Weight (%) |
| ||
CBOT Corn Futures (2,207 contracts, MAR23) |
| $ | 75,479,400 |
|
|
| 35 | % |
CBOT Corn Futures (1,889 contracts, MAY23) |
|
| 64,651,025 |
|
|
| 30 |
|
CBOT Corn Futures (2,426 contracts, DEC23) |
|
| 74,811,775 |
|
|
| 35 |
|
|
|
|
|
|
|
|
|
|
Total at September 30, 2022 |
| $ | 214,942,200 |
|
|
| 100 | % |
SOYB Benchmark Component Futures Contracts |
| Notional Value |
|
| Weight (%) |
| ||
|
|
|
|
|
|
| ||
CBOT Soybean Futures (339 contracts, JAN23) |
| $ | 23,314,725 |
|
|
| 35 | % |
CBOT Soybean Futures (290 contracts, MAR23) |
|
| 20,057,125 |
|
|
| 30 |
|
CBOT Soybean Futures (356 contracts, NOV23) |
|
| 23,869,800 |
|
|
| 35 |
|
|
|
|
|
|
|
|
|
|
Total at September 30, 2022 |
| $ | 67,241,650 |
|
|
| 100 | % |
CANE Benchmark Component Futures Contracts |
| Notional Value |
|
| Weight (%) |
| ||
|
|
|
|
|
|
| ||
ICE Sugar Futures (471 contracts, MAY23) |
| $ | 8,936,189 |
|
|
| 35 | % |
ICE Sugar Futures (414 contracts, JUL23) |
|
| 7,669,267 |
|
|
| 30 |
|
ICE Sugar Futures (475 contracts, MAR24) |
|
| 8,942,920 |
|
|
| 35 |
|
|
|
|
|
|
|
|
|
|
Total at September 30, 2022 |
| $ | 25,548,376 |
|
|
| 100 | % |
WEAT Benchmark Component Futures Contracts |
| Notional Value |
|
| Weight (%) |
| ||
|
|
|
|
|
|
| ||
CBOT Wheat Futures (2,854 contracts, MAR23) |
| $ | 132,996,400 |
|
|
| 35 | % |
CBOT Wheat Futures (2,430 contracts, MAY23) |
|
| 113,815,125 |
|
|
| 30 |
|
CBOT Wheat Futures (2,899 contracts, DEC23) |
|
| 131,179,750 |
|
|
| 35 |
|
|
|
|
|
|
|
|
|
|
Total at September 30, 2022 |
| $ | 377,991,275 |
|
|
| 100 | % |
| 7 |
| Table of Contents |
TAGS Benchmark Component Futures Contracts |
| Fair Value |
|
| Weight (%) |
| ||
Shares of Teucrium Corn Fund (429,192 shares) |
| $ | 11,605,566 |
|
|
| 25 | % |
Shares of Teucrium Soybean Fund (427,314 shares) |
|
| 11,158,920 |
|
|
| 24 |
|
Shares of Teucrium Wheat Fund (1,294,496 shares) |
|
| 11,861,985 |
|
|
| 26 |
|
Shares of Teucrium Sugar Fund (1,327,598 shares) |
|
| 11,589,798 |
|
|
| 25 |
|
|
|
|
|
|
|
|
|
|
Total at September 30, 2022 |
| $ | 46,216,269 |
|
|
| 100 | % |
|
|
|
|
|
|
|
|
|
DEFI Benchmark Component Futures Contracts |
| Notional Value |
|
| Weight (%) |
| ||
CME Bitcoin Futures (6 contracts, OCT22) |
| $ | 582,750 |
|
|
| 50 | % |
CME Bitcoin Futures (6 contracts, NOV22) |
|
| 583,050 |
|
|
| 50 |
|
|
|
|
|
|
|
|
|
|
Total at September 30, 2022 |
| $ | 1,165,800 |
|
|
| 100 | % |
The price relationship between the near month Futures Contract to expire and the Benchmark Component Futures Contracts will vary and may impact both the total return of each Fund over time and the degree to which such total return tracks the total return of the price indices related to the commodity of each Fund. In cases in which the near month contract’s price is lower than later expiring contracts’ prices (a situation known as “contango” in the futures markets), then absent the impact of the overall movement in commodity prices the value of the Benchmark Component Futures Contracts would tend to decline as they approach expiration. In cases in which the near month contract’s price is higher than later expiring contracts’ prices (a situation known as “backwardation” in the futures markets), then absent the impact of the overall movement in a Fund’s prices the value of the Benchmark Component Futures Contracts would tend to rise as they approach expiration, all other things being equal.
The total portfolio composition for each Fund is disclosed each business day that the NYSE Arca is open for trading on the Sponsor’s website. The website for the Agricultural Funds and the Sponsor is www.teucrium.com. The website for the Hashdex Bitcoin Futures ETF is www.hashdex-etfs.com. The website(s) are accessible at no charge. The website disclosure of portfolio holdings is made daily and includes, as applicable, the name and value of each Futures Contract, other commodity or cryptocurrency interests and the amount of cash and cash equivalents held in the Fund’s portfolio. The specific types of other commodity interests held (if any, which may include options on futures contracts and derivative contracts such as swaps) collectively, “Other Commodity Interests,” and together with Futures Contracts, “Commodity Interests” or “Interests” in addition to futures contracts, options on futures contracts and derivative contracts that are tied to various commodities are entered into outside of public exchanges. These “over the counter” contracts are entered into between two parties in private contracts, or on a recently formed swap execution facility (“SEF”) for standardized swaps. For example, unlike Futures Contracts, which are guaranteed by a clearing organization, each party to an over the counter derivative contract bears the credit risk of the other party (unless such over the counter swap is cleared through a derivatives clearing organization (“DCO”), i.e., the risk that the other party will not be able to perform its obligations under its contract, and characteristics of such Other Commodity Interests.
Consistent with achieving a Fund’s investment objective of closely tracking the Benchmark, the Sponsor may for certain reasons cause a Fund to enter into or hold Futures Contracts other than the Benchmark Component Futures Contracts and/or Other Commodity or Cryptocurrency Interests. Other Commodity or Cryptocurrency Interests that do not have standardized terms and are not exchange traded, referred to as “over the counter” Commodity or Cryptocurrency Interests, can generally be structured as the parties to the Commodity or Cryptocurrency Interest contract desire. Therefore, each Fund might enter into multiple and/or over the counter Interests intended to replicate the performance of each of the Benchmark Component Futures Contracts for a Fund, or a single over the counter Interest designed to replicate the performance of the Benchmark as a whole. Assuming that there is no default by a counterparty to an over the counter Interest, the performance of the Interest will necessarily correlate with the performance of the Benchmark or the applicable Benchmark Component Futures Contract. Each Fund might also enter into or hold Interests other than Benchmark Component Futures Contracts to facilitate effective trading, consistent with the discussion of the Fund’s “roll” strategy. In addition, each Fund might enter into or hold Interests that would be expected to alleviate overall deviation between the Fund’s performance and that of the Benchmark that may result from certain market and trading inefficiencies or other reasons. By utilizing certain or all of the investments described above, the Sponsor will endeavor to cause the Fund’s performance to closely track that of the Benchmark of each Fund.
| 8 |
| Table of Contents |
An “exchange for related position” (“EFRP”) can be used by each Agricultural Fund as a technique to facilitate the exchanging of a futures hedge position against a creation or redemption order, and thus each Fund may use an EFRP transaction in connection with the creation and redemption of shares. The market specialist/market maker that is the ultimate purchaser or seller of shares in connection with the creation or redemption basket, respectively, agrees to sell or purchase a corresponding offsetting futures position which is then settled on the same business day as a cleared futures transaction by the FCMs. The Fund will become subject to the credit risk of the market specialist/market maker until the EFRP is settled within the business day, which is typically 7 hours or less. Each Fund reports all activity related to EFRP transactions under the procedures and guidelines of the CFTC and the exchanges on which the futures are traded.
The Funds seek to earn interest and other income (“interest income”) from cash equivalents that it purchases and, on the cash it holds through the Custodian or other financial institutions. The Sponsor anticipates that the interest income will increase the NAV of each Fund. The Funds apply the interest income to the acquisition of additional investments or use it to pay its expenses. If the Fund reinvests the earned interest income, it makes investments that are consistent with its investment objectives as disclosed. Any cash equivalent invested by a Fund will have original maturity dates of three and nine months or less at inception. Any cash equivalent invested by a Fund will be deemed by the Sponsor to be of investment grade quality. As of September 30, 2022, available cash balances in each of the Funds were invested in the First American Government Obligations Fund – Class X, Goldman Sachs Financial Square Government Fund, in demand deposits at Capital One, and in commercial paper with maturities of ninety days or less. Additionally, the CORN, SOYB, CANE, WEAT and DEFI Funds may invest a portion of the amount of funds required to be deposited with the FCM as initial margin in U.S. Treasury obligations with time to maturity of 90 days or less. The obligations are purchased and held in the respective Fund accounts through the FCM.
In managing the assets of the Funds, the Sponsor does not use a technical trading system that automatically issues buy and sell orders. Instead, the Sponsor will purchase or sell the specific underlying Commodity or Cryptocurrency Interests with an aggregate market value that approximates the amount of cash received or paid upon the purchase or redemption of Shares.
The Sponsor anticipates managing each Fund in a way that tracks the stated benchmark. The Agricultural Funds’ benchmarks do not hold spot futures and therefore do not anticipate letting the commodity Futures Contracts of any Fund expire, thus avoiding delivery of the underlying commodity. instead, the Sponsor will close out existing positions, for instance, in response to ordinary scheduled changes in the Benchmark or, if at the Sponsor’s sole discretion, it otherwise determines it would be appropriate to do so, will reinvest the proceeds in new Commodity or Cryptocurrency Interests. Positions may also be closed out to meet redemption orders, in which case the proceeds from closing the positions are not reinvested. DEFI does hold spot month futures, but the Fund will trade or roll these contracts on the exchange before delivery or receipt of the underlying cryptocurrency is required.
The Sponsor employs a “neutral” investment strategy intended to track the changes in the Benchmark of each Fund regardless of whether the Benchmark goes up or goes down. The Fund’s “neutral” investment strategy is designed to permit investors generally to purchase and sell the Fund’s Shares for the purpose of investing indirectly in the commodity specific market in a cost-effective manner. Such investors may include participants in the specific industry and other industries seeking to hedge the risk of losses in their commodity specific related transactions, as well as investors seeking exposure to that commodity market. Accordingly, depending on the investment objective of an individual investor, the risks generally associated with investing in the commodity or cryptocurrency specific market and/or the risks involved in hedging may exist. In addition, an investment in a Fund involves the risk that the changes in the price of the Fund’s Shares will not accurately track the changes in the Benchmark, and that changes in the Benchmark will not closely correlate with changes in the price of the commodity or cryptocurrency on the spot market. The Sponsor does not intend to operate each Fund in a fashion such that its per share NAV equals, in dollar terms, the spot price of the commodity or the price of any particular commodity or cryptocurrency specific Futures Contract.
The Sponsor
Teucrium Trading, LLC is the sponsor of the Trust and each of the series of the Trust. The Sponsor is a Delaware limited liability company, formed on July 28, 2009. The principal office is located at Three Main Street, Suite 215, Burlington, Vermont 05401. The Sponsor is registered as a commodity pool operator (“CPO”) and a commodity trading adviser (“CTA”) with the Commodity Futures Trading Commission (“CFTC”) and is a member of the National Futures Association (“NFA”). Teucrium Investment Advisors, LLC, a wholly owned subsidiary of Teucrium Trading, LLC, is a Delaware limited liability company, which was formed on January 4, 2022. Teucrium Investment Advisors, LLC is a U.S. SEC registered investment advisor. Teucrium Investment Advisors, LLC was registered with the CFTC as a CPO on May 2, 2022, a CTA on May 2, 2022, and a Swap Firm on May 9, 2022. Teucrium Investment Advisors, LLC became a member of the NFA on May 9, 2022.
| 9 |
| Table of Contents |
The Trust and the Funds operate pursuant to the Trust Agreement. Under the Trust Agreement, the Sponsor is solely responsible for management and conducts or directs the conduct of the business of the Trust, the Fund, and any series of the Trust that may from time to time be established and designated by the Sponsor. The Sponsor is required to oversee the purchase and sale of Shares by Authorized Purchasers and to manage the Fund’s investments, including to evaluate the credit risk of FCMs and swap counterparties and to review daily positions and margin/collateral requirements. The Sponsor has the power to enter into agreements as may be necessary or appropriate for the offer and sale of the Fund’s Shares and the oversight of the Trust’s activities. Accordingly, the Sponsor is responsible for selecting the Trustee, Administrator, Distributor, the independent registered public accounting firm of the Trust, and any legal counsel employed by the Trust. The Sponsor is also responsible for preparing and filing periodic reports on behalf of the Trust with the SEC and will provide any required certification for such reports. No person other than the Sponsor and its principals was involved in the organization of the Trust or the Fund.
Teucrium Trading, LLC designs the Funds to offer liquidity, transparency, and capacity in single-commodity investing for a variety of investors, including institutions and individuals, in an exchange-traded product format. The Funds have also been designed to mitigate the impacts of contango and backwardation, situations that can occur in the course of commodity trading which can affect the potential returns to investors. Backwardation is defined as a market condition in which a futures price of a commodity is lower in the distant delivery months than in the near delivery months, while contango, the opposite of backwardation, is defined as a condition in which distant delivery prices for futures exceed spot prices, often due to the costs of storing and insuring the underlying commodity.
The Sponsor has a patent on certain business methods and procedures used with respect to the Funds.
Performance Summary
This report covers the periods from January 1 to September 30, 2022 for CORN, SOYB, CANE, WEAT and TAGS. DEFI’s summary covers from the commencement of operations (September 15, 2022) through September 30, 2022. Total expenses are presented both gross and net of any expenses waived or paid by the Sponsor that would have been incurred by the Funds (“expenses waived by the Sponsor”).
CORN Per Share Operation Performance |
|
|
| |
Net asset value at beginning of period |
| $ | 21.58 |
|
Income from investment operations: |
|
|
|
|
Investment income |
|
| 0.21 |
|
Net realized and unrealized gain on commodity futures contracts |
|
| 5.58 |
|
Total expenses |
|
| (0.33 | ) |
Net increase in net asset value |
|
| 5.46 |
|
Net asset value end of period |
| $ | 27.04 |
|
Total Return |
|
| 25.30 | % |
Ratios to Average Net Assets (Annualized) |
|
|
|
|
Total expenses |
|
| 1.90 | % |
Total expenses, net |
|
| 1.69 | % |
Net investment loss |
|
| (0.64 | )% |
|
|
|
|
|
SOYB Per Share Operation Performance |
|
|
|
|
Net asset value at beginning of period |
| $ | 22.77 |
|
Income from investment operations: |
|
|
|
|
Investment income |
|
| 0.21 |
|
Net realized and unrealized gain on commodity futures contracts |
|
| 3.48 |
|
Total expenses |
|
| (0.35 | ) |
Net increase in net asset value |
|
| 3.34 |
|
Net asset value at end of period |
| $ | 26.11 |
|
Total Return |
|
| 14.68 | % |
Ratios to Average Net Assets (Annualized) |
|
|
|
|
Total expenses |
|
| 1.92 | % |
Total expenses, net |
|
| 1.75 | % |
Net investment loss |
|
| (0.68 | )% |
| 10 |
| Table of Contents |
CANE Per Share Operation Performance |
|
|
| |
Net asset value at beginning of period |
| $ | 9.23 |
|
Income from investment operations: |
|
|
|
|
Investment income |
|
| 0.07 |
|
Net realized and unrealized loss on commodity futures contracts |
|
| (0.45 | ) |
Total expenses |
|
| (0.12 | ) |
Net decrease in net asset value |
|
| (0.50 | ) |
Net asset value at end of period |
| $ | 8.73 |
|
Total Return |
|
| (5.38 | )% |
Ratios to Average Net Assets (Annualized) |
|
|
|
|
Total expenses |
|
| 2.12 | % |
Total expenses, net |
|
| 1.75 | % |
Net investment loss |
|
| (0.71 | )% |
|
|
|
|
|
WEAT Per Share Operation Performance |
|
|
|
|
Net asset value at beginning of period |
| $ | 7.38 |
|
Income from investment operations: |
|
|
|
|
Investment income |
|
| 0.07 |
|
Net realized and unrealized gain on commodity futures contracts |
|
| 1.83 |
|
Total expenses |
|
| (0.12 | ) |
Net increase in net asset value |
|
| 1.78 |
|
Net asset value at end of period |
| $ | 9.16 |
|
Total Return |
|
| 24.20 | % |
Ratios to Average Net Assets (Annualized) |
|
|
|
|
Total expenses |
|
| 1.84 | % |
Total expenses, net |
|
| 1.69 | % |
Net investment loss |
|
| (0.63 | )% |
TAGS Per Share Operation Performance |
|
|
| |
Net asset value at beginning of period |
| $ | 27.01 |
|
Income from investment operations: |
|
|
|
|
Net realized and unrealized gain on investment transactions |
|
| 4.09 |
|
Total expenses |
|
| (0.03 | ) |
Net increase in net asset value |
|
| 4.06 |
|
Net asset value at end of period |
| $ | 31.07 |
|
Total Return |
|
| 15.04 | % |
Ratios to Average Net Assets (Annualized) |
|
|
|
|
Total expenses |
|
| 0.80 | % |
Total expenses, net |
|
| 0.14 | % |
Net investment loss |
|
| (0.14 | )% |
DEFI Per Share Operation Performance |
|
|
| |
Net asset value at beginning of period |
| $ | 25.00 |
|
Income from investment operations: |
|
|
|
|
Investment income |
|
| 0.03 |
|
Net realized and unrealized loss on cryptocurrency futures contracts |
|
| (0.41 | ) |
Total expenses |
|
| (0.01 | ) |
Net decrease in net asset value |
|
| (0.39 | ) |
Net asset value at end of period |
| $ | 24.61 |
|
Total Return |
|
| (1.57 | )% |
Ratios to Average Net Assets (Annualized) |
|
|
|
|
Total expenses |
|
| 2.31 | % |
Total expenses, net |
|
| 0.94 | % |
Net investment income |
|
| 1.74 | % |
Past performance of a Fund is not necessarily indicative of future performance.
| 11 |
| Table of Contents |
Results of Operations
The following includes a section for each Fund of the Trust.
The discussion below addresses the material changes in the results of operations for the three and nine months ended September 30, 2022 compared to the same period in 2021. The following includes a section for each Fund of the Trust for the periods in which each Fund was in operation. CORN, SOYB, WEAT, CANE and TAGS each operated for the entirety of all periods. For DEFI, the results will represent from commencement of operations (September 15, 2022) through September 30, 2022.
Total expenses for the current and comparative periods are presented both gross and net of any expenses waived or paid by the Sponsor that would have been incurred by the Funds (“expenses waived by the Sponsor”). For all expenses waived in 2021 and 2022, the Sponsor has determined that no reimbursement will be sought in future periods. “Total expenses, net” is after the impact of any expenses waived by the Sponsor, are presented in the same manner as previously reported. There is, therefore, no impact to or change in the Net gain or Net loss in any period for the Trust and each Fund as a result of this change in presentation.
The Sponsor is responsible for investing the assets of the Funds in accordance with the objectives and policies of each Fund. In addition, the Sponsor arranges for one or more third parties to provide administrative, custodial, accounting, transfer agency, compliance, and other necessary services to the Fund, including services directly attributable to the Funds such as accounting, financial reporting, regulatory compliance, and trading activities. In some cases, at its discretion, the Sponsor may elect not to outsource certain of these expenses.
In addition, the Agricultural Funds, except for TAGS, which has no such fee are contractually obligated to pay a monthly management fee to the Sponsor, based on average daily net assets, at a rate equal to 1.00% per annum.
The Agricultural Funds generally pay for all brokerage fees, taxes, and other expenses, including licensing fees for the use of intellectual property, registration or other fees paid to the SEC, the Financial Industry Regulatory Authority (“FINRA”), or any other regulatory agency in connection with the offer and sale of subsequent Shares after its initial registration and all legal, accounting, printing and other expenses associated therewith. Each Fund also pays its portion of the fees and expenses associated with the Trust’s tax accounting and reporting requirements. Certain aggregate expenses common to all Funds within the Trust are allocated by the Sponsor to the respective funds based on activity drivers deemed most appropriate by the Sponsor for such expenses, including but not limited to relative assets under management and creation order activity. These aggregate common expenses include, but are not limited to, legal, auditing, accounting and financial reporting, tax-preparation, regulatory compliance, trading activities, and insurance costs, as well as fees paid to the Distributor, which are included in the related line item in the statements of operations. A portion of these aggregate common expenses are related to services provided by the Sponsor or related parties of principals of the Sponsor; these are necessary services to the Funds, which are primarily the cost of performing accounting and financial reporting, regulatory compliance, and trading activities that are directly attributable to the Funds and are, primarily, included as distribution and marketing fees on the statements of operations. These amounts, for the Trust and for each Fund, are detailed in the notes to the financial statements included in Part I of this filing.
DEFI is contractually obligated to pay a monthly management fee to the Sponsor, based on average daily net assets, at a rate equal to 0.94% per annum. From the Management Fee, the Sponsor pays all of the routine operational, administrative and other ordinary expenses of the Fund, generally as determined by the Sponsor, including but not limited to, fees and expenses of the Administrator, Custodian, Distributor, Transfer Agent, licensors, accounting and audit fees expenses, tax preparation expenses, legal fees, ongoing SEC registration fees, individual Schedule K-1 preparation and mailing fees, and report preparation and mailing expenses. These fees and expenses are not included in the breakeven table because they are paid for by the Sponsor through the proceeds from the Management Fee. The Fund pays all of its non-recurring and unusual fees and expenses, if any, as determined by the Sponsor. Non-recurring and unusual fees and expenses are unexpected or unusual in nature, such as legal claims and liabilities and litigation costs or indemnification or other unanticipated expenses. Extraordinary fees and expenses also include material expenses which are not currently anticipated obligations of the Fund. Routine operational, administrative, and other ordinary expenses are not deemed extraordinary expenses.
The Sponsor has the ability to elect to pay certain expenses on behalf of the Funds or waive the management fee. This election is subject to change by the Sponsor, at its discretion. Expenses paid by the Sponsor and management fees waived by the Sponsor are, if applicable, presented as waived expenses in the statements of operations for each Fund.
| 12 |
| Table of Contents |
Teucrium Corn Fund
The Teucrium Corn Fund commenced investment operations on June 9, 2010. The investment objective of the Corn Fund is to have the daily changes in percentage terms of the Shares’ NAV reflect the daily changes in percentage terms of a weighted average of the closing settlement prices for three futures contracts for corn (“Corn Futures Contracts”) that are traded on the Chicago Board of Trade (“CBOT”), specifically (1) the second to expire CBOT Corn Futures Contract, weighted 35%, (2) the third to expire CBOT Corn Futures Contract, weighted 30%, and (3) the CBOT Corn Futures Contract expiring in the December following the expiration month of the third to expire contract, weighted 35%. The Fund does not track the spot price of corn.
On September 30, 2022, the Corn Fund held a total of CBOT Corn Futures contracts with a notional value of $214,942,200. The contracts had an asset fair value of $6,573,943 and a liability fair value of $4,335,823. The weighting of the notional value of the contracts is as follows: (1) 35% to the MAR23 contracts, the second to expire CBOT Corn Futures Contract, (2) 30% to MAY23 CBOT contracts, the third to expire CBOT Corn Futures Contract, and (3) 35% to DEC23 CBOT contracts, the CBOT Corn Futures Contract expiring in the December following the expiration month of the third to expire contract.
|
| Quarter Ending |
|
| Quarter Ending |
|
| Quarter Ending |
| |||
|
| September 30, 2022 |
|
| September 30, 2021 |
|
| June 30, 2022 |
| |||
Total Net Assets |
| $ | 214,972,436 |
|
| $ | 120,396,395 |
|
| $ | 238,731,929 |
|
Shares Outstanding |
|
| 7,950,004 |
|
|
| 5,950,004 |
|
|
| 9,525,004 |
|
Net Asset Value per share |
| $ | 27.04 |
|
| $ | 20.23 |
|
| $ | 25.06 |
|
Closing Price |
| $ | 27.04 |
|
| $ | 20.17 |
|
| $ | 25.16 |
|
Total net assets for the Fund increased year over year by 79%, driven by a combination of an increase in total shares outstanding of 2,000,000 shares or 34% and an increase in the NAV per share of $6.81 or 34%. The net assets for the Fund decreased by 10% when comparing September 30, 2022, to June 30, 2022. The change in total net assets year over year, in the opinion of management, was generally due to a combination of appreciation of commodity prices and investor in-flows which was driven by the war in Ukraine, supply disruptions and rising crop input costs.
For the Three Months Ended September 30, 2022, compared to the Three Months Ended September 30, 2021
|
| Three Months Ended |
|
| Three Months Ended |
| ||
|
| September 30, 2022 |
|
| September 30, 2021 |
| ||
Average daily total net assets |
| $ | 208,642,546 |
|
| $ | 135,767,092 |
|
Net realized and unrealized gain (loss) on futures contracts |
| $ | 13,511,991 |
|
| $ | (10,603,502 | ) |
Interest income earned on cash equivalents |
| $ | 1,087,852 |
|
| $ | 55,229 |
|
Annualized interest yield based on average daily total net assets |
|
| 0.52 | % |
|
| 0.04 | % |
Net Income (Loss) |
| $ | 13,656,545 |
|
| $ | (11,185,315 | ) |
Weighted average share outstanding |
|
| 8,188,863 |
|
|
| 6,704,352 |
|
Management Fees |
| $ | 525,893 |
|
| $ | 342,207 |
|
Total gross fees and other expenses excluding management fees |
| $ | 417,405 |
|
| $ | 642,358 |
|
Brokerage Commissions |
| $ | 54,746 |
|
| $ | 43,677 |
|
Expenses waived by the Sponsor |
| $ | - |
|
| $ | 347,523 |
|
Total gross expense ratio |
|
| (1.79 | )% |
|
| (2.88 | )% |
Total expense ratio net of expenses waived by the Sponsor |
|
| (1.79 | )% |
|
| (1.86 | )% |
Net investment gain (loss) |
|
| 0.27 | % |
|
| (1.70 | )% |
Creation of Shares |
|
| 950,000 |
|
|
| 375,000 |
|
Redemption of Shares |
|
| 2,525,000 |
|
|
| 2,700,000 |
|
| 13 |
| Table of Contents |
For the Nine Months Ended September 30, 2022, compared to the Nine Months Ended September 30, 2021
|
| Nine Months Ended |
|
| Nine Months Ended |
| ||
|
| September 30, 2022 |
|
| September 30, 2021 |
| ||
Average daily total net assets |
| $ | 217,755,962 |
|
| $ | 158,799,521 |
|
Net realized and unrealized gain on futures contracts |
| $ | 24,980,348 |
|
| $ | 43,021,695 |
|
Interest income earned on cash and cash equivalents |
| $ | 1,706,156 |
|
| $ | 206,168 |
|
Annualized interest yield based on average daily total net assets |
|
| 0.78 | % |
|
| 0.13 | % |
Net Income |
| $ | 23,935,440 |
|
| $ | 40,911,620 |
|
Weighted average share outstanding |
|
| 8,240,663 |
|
|
| 8,402,293 |
|
Management Fees |
| $ | 1,628,695 |
|
| $ | 1,187,734 |
|
Total gross fees and other expenses excluding management fees |
| $ | 1,468,224 |
|
| $ | 1,917,813 |
|
Brokerage Commissions |
| $ | 118,321 |
|
| $ | 118,868 |
|
Expenses waived by the Sponsor |
| $ | 345,855 |
|
| $ | 789,304 |
|
Total gross expense ratio |
|
| (1.90 | )% |
|
| (2.61 | )% |
Total expense ratio net of expenses waived by the Sponsor |
|
| (1.69 | )% |
|
| (1.95 | )% |
Net investment loss |
|
| (0.64 | )% |
|
| (1.78 | )% |
Creation of Shares |
|
| 7,500,000 |
|
|
| 3,775,000 |
|
Redemption of Shares |
|
| 5,150,000 |
|
|
| 6,725,000 |
|
Realized gain or loss on trading of commodity futures contracts is a function of: 1) the change in the price of the particular contracts sold as part of a “roll” in contracts as the nearest to expire contracts are exchanged for the appropriate contract given the investment objective of the fund, 2) the change in the price of particular contracts sold in relation to redemption of shares, 3) the gain or loss associated with rebalancing trades which are made to ensure conformance to the benchmark, 4) the number of contracts held and then sold for either circumstance aforementioned. The Fund recognizes the expense for brokerage commissions for futures contract trades on a per trade basis. Unrealized gain or loss on trading of commodity futures contracts is a function of the change in the price of contracts held on the final date of the period versus the purchase price for each contract and the number of contracts held in each contract month. The Sponsor has a static benchmark as described above and trades futures contracts to adhere to that benchmark and to adjust for the creation or redemption of shares.
The increase in interest and other income year over year was due to an increase in net assets and an increase in Federal Fund Rates. As a result, the amount of interest income earned as a percentage of average daily total net assets was higher in the three and nine months ended September 30, 2022, compared to the three and nine months ended September 30, 2021. The Fund seeks to earn interest and other income in investment grade, short-duration instruments or deposits associated with the pool’s cash management strategy that may be used to offset expenses. These investments may include, but are not limited to, short-term Treasury Securities, demand deposits, money market funds and investments in commercial paper. These interest rate levels may be lower or higher than the projected interest rates stated in the prospectuses and thus will impact your breakeven point.
The increase/decrease in management fee paid to the Sponsor is a result of higher/lower average net assets. The management fee is calculated at an annual rate of 1% of the Fund’s daily average net assets. Other than the management fee to the Sponsor and the brokerage commissions, most of the expenses incurred by the Fund are associated with the day-to-day operation of the Fund and the necessary functions related to regulatory compliance. These are generally based on contracts, which extend for some period of time and up to one year, or commitments regardless of the level of assets under management. The structure of the Fund and the nature of the expenses are such that as total net assets grow, there is a scalability of expenses that may allow the total expense ratio to be reduced. However, if total net assets for the Fund fall, the total expense ratio of the Fund will increase unless additional reductions are made by the Sponsor to the daily expense accruals. The Sponsor can elect to adjust the daily expense accruals at its discretion based on market conditions and other Fund considerations.
The decrease in total gross fees and other expenses excluding management fees for the three and nine months ended September 30, 2022 compared to the three and nine months ended September 30, 2021 was generally due to the decrease in average net assets relative to the other Funds. The Sponsor has the ability to elect to pay certain expenses on behalf of the Fund or waive the management fee. This election is subject to change by the Sponsor, at its discretion. The Sponsor has determined that no reimbursement will be sought in future periods for those expenses which have been waived for the period.
The increase/decrease in total brokerage commissions for the three and nine months ended September 30, 2022 compared to the three and nine months ended September 30, 2021, was primarily due to an increase/decrease in contracts purchased, liquidated, and rolled. The total brokerage commissions for the nine months ended September 30, 2022 compared to the same period in 2021 were generally stable.
| 14 |
| Table of Contents |
The graph below shows the actual shares outstanding, total net assets (or AUM) and net asset value per share (NAV per share) for the Fund from inception to September 30, 2022 and serves to illustrate the relative changes of these components.
Other than the management fee to the Sponsor and the brokerage commissions, most of the expenses incurred by the Fund are associated with the day-to-day operation of the Fund and the necessary functions related to regulatory compliance. These are generally based on contracts, which extend for some period of time and up to one year, or commitments regardless of the level of assets under management. The structure of the Fund and the nature of the expenses are such that as total net assets grow, there is a scalability of expenses that may allow the total expense ratio to be reduced. However, if total net assets for the Fund fall, the total expense ratio of the Fund will increase unless additional reductions are made by the Sponsor to the daily expense accruals. The Sponsor can elect to adjust the daily expense accruals at its discretion based on market conditions and other Fund considerations.
The seasonality patterns for corn futures prices are impacted by a variety of factors. These include, but are not limited to, the harvest in the fall, the planting conditions in the spring, and the weather throughout the critical germination and growing periods. Prices for corn futures are affected by the availability and demand for substitute agricultural commodities, including soybeans and wheat, and the demand for corn as an additive for fuel, through the production of ethanol. The price of corn futures contracts is also influenced by global economic conditions, including the demand for exports to other countries. Such factors will impact the performance of the Fund and the results of operations on an ongoing basis. The Sponsor cannot predict the impact of such factors.
Teucrium Soybean Fund
The Teucrium Soybean Fund commenced investment operations on September 19, 2011. The investment objective of the Fund is to have the daily changes in percentage terms of the Shares’ Net Asset Value (“NAV”) reflect the daily changes in percentage terms of a weighted average of the closing settlement prices for three futures contracts for soybeans (“Soybean Futures Contracts”) that are traded on the Chicago Board of Trade (“CBOT”). The three Soybean Futures Contracts, excluding August and September, will be: (1) second to expire CBOT Soybean Futures Contract, weighted 35%, (2) the third to expire CBOT Soybean Futures Contract, weighted 30%, and (3) the CBOT Soybean Futures Contract expiring in the November following the expiration month of the third to expire contract, weighted 35%.
On September 30, 2022, the Fund held a total of CBOT soybean futures contracts with a notional value of $67,241,650. The contracts had an asset fair value of $3,083,849. The weighting of the notional value of the contracts is as follows: (1) 35% to JAN23 CBOT contracts, (2) 30% to MAR23 CBOT contracts, and (3) 35% to NOV23 CBOT contracts.
|
| Quarter Ending |
|
| Quarter Ending |
|
| Quarter Ending |
| |||
|
| September 30, 2022 |
|
| September 30, 2021 |
|
| June 30, 2022 |
| |||
Total Net Assets |
| $ | 67,243,978 |
|
| $ | 47,284,707 |
|
| $ | 75,109,727 |
|
Shares Outstanding |
|
| 2,575,004 |
|
|
| 2,150,004 |
|
|
| 2,775,004 |
|
Net Asset Value per share |
| $ | 26.11 |
|
| $ | 21.99 |
|
| $ | 27.07 |
|
Closing Price |
| $ | 26.11 |
|
| $ | 22.02 |
|
| $ | 27.06 |
|
| 15 |
| Table of Contents |
Total net assets for the Fund increased year over year by 42%, driven by a combination of an increase in total shares outstanding of 425,000 shares or 20% and by an increase in the NAV per share of $4.12 or 19%. The net assets for the Fund decreased by 10% when comparing September 30, 2022, to June 30, 2022. The change in total net assets year over year, in the opinion of management, was generally due to a combination of appreciation of commodity prices and investor in-flows which was driven by the war in Ukraine, supply disruptions and rising crop input costs.
For the Three Months Ended September 30, 2022, compared to the Three Months Ended September 30, 2021
|
| Three Months Ended |
|
| Three Months Ended |
| ||
|
| September 30, 2022 |
|
| September 30, 2021 |
| ||
Average daily total net assets |
| $ | 69,925,211 |
|
| $ | 59,298,060 |
|
Net realized and unrealized loss on futures contracts |
| $ | (2,877,782 | ) |
| $ | (4,333,370 | ) |
Interest income earned on cash and cash equivalents |
| $ | 365,454 |
|
| $ | 20,624 |
|
Annualized interest yield based on average daily total net assets |
|
| 0.52 | % |
|
| 0.03 | % |
Net Loss |
| $ | (2,816,428 | ) |
| $ | (4,573,209 | ) |
Weighted average share outstanding |
|
| 2,646,471 |
|
|
| 2,590,221 |
|
Management Fees |
| $ | 176,250 |
|
| $ | 149,464 |
|
Total gross fees and other expenses excluding management fees |
| $ | 127,850 |
|
| $ | 284,634 |
|
Brokerage Commissions |
| $ | 6,432 |
|
| $ | 4,833 |
|
Expenses waived by the Sponsor |
| $ | - |
|
| $ | 173,635 |
|
Total gross expense ratio |
|
| (1.73 | )% |
|
| (2.90 | )% |
Total expense ratio net of expenses waived by the Sponsor |
|
| (1.73 | )% |
|
| (1.74 | )% |
Net investment gain (loss) |
|
| 0.34 | % |
|
| (1.60 | )% |
Creation of Shares |
|
| 600,000 |
|
|
| 150,000 |
|
Redemption of Shares |
|
| 800,000 |
|
|
| 975,000 |
|
For the Nine Months Ended September 30, 2022, compared to the Nine Months Ended September 30, 2021
|
| Nine Months Ended |
|
| Nine Months Ended |
| ||
|
| September 30, 2022 |
|
| September 30, 2021 |
| ||
Average daily total net assets |
| $ | 68,710,342 |
|
| $ | 81,652,410 |
|
Net realized and unrealized gain on futures contracts |
| $ | 4,906,805 |
|
| $ | 13,444,407 |
|
Interest income earned on cash and cash equivalents |
| $ | 549,818 |
|
| $ | 105,253 |
|
Annualized interest yield based on average daily total net assets |
|
| 0.80 | % |
|
| 0.13 | % |
Net Income |
| $ | 4,557,808 |
|
| $ | 12,334,380 |
|
Weighted average share outstanding |
|
| 2,553,850 |
|
|
| 3,724,546 |
|
Management Fees |
| $ | 513,916 |
|
| $ | 610,715 |
|
Total gross fees and other expenses excluding management fees |
| $ | 474,461 |
|
| $ | 1,084,196 |
|
Brokerage Commissions |
| $ | 21,638 |
|
| $ | 26,568 |
|
Expenses waived by the Sponsor |
| $ | 89,562 |
|
| $ | 479,631 |
|
Total gross expense ratio |
|
| (1.92 | )% |
|
| (2.78 | )% |
Total expense ratio net of expenses waived by the Sponsor |
|
| (1.75 | )% |
|
| (1.99 | )% |
Net investment loss |
|
| (0.68 | )% |
|
| (1.82 | )% |
Creation of Shares |
|
| 1,950,000 |
|
|
| 1,050,000 |
|
Redemption of Shares |
|
| 1,350,000 |
|
|
| 3,475,000 |
|
Realized gain or loss on trading of commodity futures contracts is a function of: 1) the change in the price of the particular contracts sold as part of a “roll” in contracts as the nearest to expire contracts are exchanged for the appropriate contract given the investment objective of the fund, 2) the change in the price of particular contracts sold in relation to redemption of shares, 3) the gain or loss associated with rebalancing trades which are made to ensure conformance to the benchmark, 4) the number of contracts held and then sold for either circumstance aforementioned. The Fund recognized the expense for brokerage commissions for futures contract trades on a per trade basis. Unrealized gain or loss on trading of commodity futures contracts is a function of the change in the price of contracts held on the final date of the period versus the purchase price for each contract and the number of contracts held in each contract month. The Sponsor has a static benchmark as described above and trades futures contracts to adhere to that benchmark and to adjust for the creation or redemption of shares.
| 16 |
| Table of Contents |
The increase in interest and other income year over year was due to an increase in net assets and an increase in Federal Fund Rates. As a result, the amount of interest income earned as a percentage of average daily total net assets was higher in the three and nine months ended September 30, 2022, compared to the three and nine months ended September 30, 2021. The Fund seeks to earn interest and other income in investment grade, short-duration instruments or deposits associated with the pool’s cash management strategy that may be used to offset expenses. These investments may include, but are not limited to, short-term Treasury Securities, demand deposits, money market funds and investments in commercial paper. These interest rate levels may be lower or higher than the projected interest rates stated in the prospectuses and thus will impact your breakeven point.
The increase/decrease in management fee paid to the Sponsor is a result of lower/higher average net assets. The management fee is calculated at an annual rate of 1% of the Fund’s daily average net assets. Other than the management fee to the Sponsor and the brokerage commissions, most of the expenses incurred by the Fund are associated with the day-to-day operation of the Fund and the necessary functions related to regulatory compliance. These are generally based on contracts, which extend for some period of time and up to one year, or commitments regardless of the level of assets under management. The structure of the Fund and the nature of the expenses are such that as total net assets grow, there is a scalability of expenses that may allow the total expense ratio to be reduced. However, if total net assets for the Fund fall, the total expense ratio of the Fund will increase unless additional reductions are made by the Sponsor to the daily expense accruals. The Sponsor can elect to adjust the daily expense accruals at its discretion based on market conditions and other Fund considerations.
The decrease in total gross fees and other expenses excluding management fees for the three and nine months ended September 30, 2022 compared to the three and nine months ended September 30, 2021 was generally due to the decrease in average net assets year over year and average net assets relative to the other Funds. The Sponsor has the ability to elect to pay certain expenses on behalf of the Fund or waive the management fee. This election is subject to change by the Sponsor, at its discretion. The Sponsor has determined that no reimbursement will be sought in future periods for those expenses which have been waived for the period.
The increase/decrease in total brokerage commissions for the three and nine months ended September 30, 2022 compared to the three and nine months ended September 30, 2021, was primarily due to an increase/decrease in contracts purchased, liquidated, and rolled.
The graph below shows the actual shares outstanding, total net assets (or AUM) and net asset value per share (NAV per share) for the Fund from inception to September 30, 2022 and serves to illustrate the relative changes of these components.
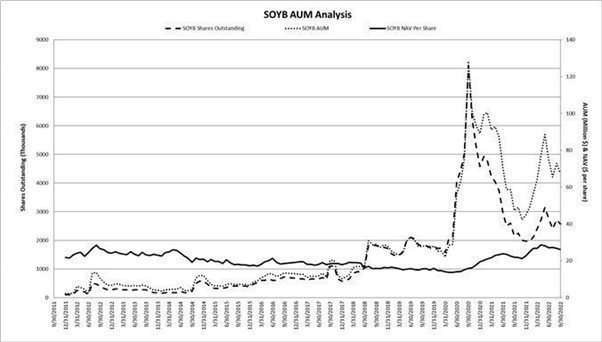
Other than the management fee to the Sponsor and the brokerage commissions, most of the expenses incurred by the Fund are associated with the day-to-day operation of the Fund and the necessary functions related to regulatory compliance. These are generally based on contracts, which extend for some period of time and up to one year, or commitments regardless of the level of assets under management. The structure of the Fund and the nature of the expenses are such that as total net assets grow, there is a scalability of expenses that may allow the total expense ratio to be reduced. However, if total net assets for the Fund fall, the total expense ratio of the Fund will increase unless additional reductions are made by the Sponsor to the daily expense accruals. The Sponsor can elect to adjust the daily expense accruals at its discretion based on market conditions and other Fund considerations.
| 17 |
| Table of Contents |
The seasonality patterns for soybean futures prices are impacted by a variety of factors. These include, but are not limited to, the harvest in the fall, the planting conditions in the spring, and the weather throughout the critical germination and growing periods. Prices for soybean futures are affected by the availability and demand for substitute agricultural commodities, including corn and wheat. The price of soybean futures contracts is also influenced by global economic conditions, including the demand for exports to other countries. Such factors will impact the performance of the Fund and the results of operations on an ongoing basis. The Sponsor cannot predict the impact of such factors.
Teucrium Sugar Fund
The Teucrium Sugar Fund commenced investment operations on September 19, 2011. The investment objective of the Fund is to have the daily changes in percentage terms of the Shares’ Net Asset Value (“NAV”) reflect the daily changes in percentage terms of a weighted average of the closing settlement prices for three futures contracts for sugar (“Sugar Futures Contracts”) that are traded on ICE Futures US (“ICE Futures”), specifically: (1) the second to expire Sugar No. 11 Futures Contract (a “Sugar No. 11 Futures Contract”), weighted 35%, (2) the third to expire Sugar No. 11 Futures Contract, weighted 30%, and (3) the Sugar No. 11 Futures Contract expiring in the March following the expiration month of the third to expire contract, weighted 35%.
On September 30, 2022, the Fund held a total of ICE sugar futures contracts with a notional value of $25,548,376. The contracts had a liability fair value of $1,282,651. The weighting of the notional value of the contracts is as follows: (1) 35% to the MAY23 ICE No 11 contracts, (2) 30% to the JUL23 ICE No 11 contracts, and (3) 35% to the MAR24 ICE No 11 contracts.
|
| Quarter Ending |
|
| Quarter Ending |
|
| Quarter Ending |
| |||
|
| September 30, 2022 |
|
| September 30, 2021 |
|
| June 30, 2022 |
| |||
Total Net Assets |
| $ | 25,534,967 |
|
| $ | 26,068,010 |
|
| $ | 32,383,073 |
|
Shares Outstanding |
|
| 2,925,004 |
|
|
| 2,725,004 |
|
|
| 3,475,004 |
|
Net Asset Value per share |
| $ | 8.73 |
|
| $ | 9.57 |
|
| $ | 9.32 |
|
Closing Price |
| $ | 8.68 |
|
| $ | 9.55 |
|
| $ | 9.32 |
|
Total net assets for the Fund decreased year over year by 2%, driven by a combination of an increase in total shares outstanding of 200,000 or 7% and a decrease in the NAV per share of $(0.84) or 9%. The net assets for the Fund decreased by 21% when comparing September 30, 2022, to June 30, 2022. This change was, in the opinion of management, due to the stabilization of prices worldwide, strong demand and with modestly higher production which accelerated investor interest.
For the Three Months Ended September 30, 2022, compared to the Three Months Ended September 30, 2021
|
| Three Months Ended |
|
| Three Months Ended |
| ||
|
| September 30, 2022 |
|
| September 30, 2021 |
| ||
Average daily total net assets |
| $ | 28,395,088 |
|
| $ | 23,754,678 |
|
Net realized and unrealized (loss) gain on futures contracts |
| $ | (1,962,758 | ) |
| $ | 2,826,293 |
|
Interest income earned on cash and cash equivalents |
| $ | 149,944 |
|
| $ | 7,425 |
|
Annualized interest yield based on average daily total net assets |
|
| 0.53 | % |
|
| 0.03 | % |
Net (Loss) Income |
| $ | (1,942,684 | ) |
| $ | 2,726,924 |
|
Weighted average share outstanding |
|
| 3,159,243 |
|
|
| 2,618,482 |
|
Management Fees |
| $ | 71,572 |
|
| $ | 59,875 |
|
Total gross fees and other expenses excluding management fees |
| $ | 58,298 |
|
| $ | 76,618 |
|
Brokerage Commissions |
| $ | 5,436 |
|
| $ | 6,613 |
|
Expenses waived by the Sponsor |
| $ | - |
|
| $ | 29,699 |
|
Total gross expense ratio |
|
| (1.81 | )% |
|
| (2.28 | )% |
Total expense ratio net of expenses waived by the Sponsor |
|
| (1.81 | )% |
|
| (1.78 | )% |
Net investment gain (loss) |
|
| 0.28 | % |
|
| (1.66 | )% |
Creation of Shares |
|
| 75,000 |
|
|
| 525,000 |
|
Redemption of Shares |
|
| 625,000 |
|
|
| 450,000 |
|
| 18 |
| Table of Contents |
For the Nine Months Ended September 30, 2022, compared to the Nine Months Ended September 30, 2021
|
| Nine Months Ended |
|
| Nine Months Ended |
| ||
|
| September 30, 2022 |
|
| September 30, 2021 |
| ||
Average daily total net assets |
| $ | 28,612,071 |
|
| $ | 19,050,472 |
|
Net realized and unrealized (loss) gain on futures contracts |
| $ | (2,758,277 | ) |
| $ | 6,649,041 |
|
Interest income earned on cash and cash equivalents |
| $ | 222,434 |
|
| $ | 19,515 |
|
Annualized interest yield based on average daily total net assets |
|
| 0.78 | % |
|
| 0.10 | % |
Net (Loss) Income |
| $ | (2,910,520 | ) |
| $ | 6,397,079 |
|
Weighted average share outstanding |
|
| 3,077,751 |
|
|
| 2,329,583 |
|
Management Fees |
| $ | 214,003 |
|
| $ | 142,487 |
|
Total gross fees and other expenses excluding management fees |
| $ | 238,911 |
|
| $ | 216,728 |
|
Brokerage Commissions |
| $ | 31,972 |
|
| $ | 19,047 |
|
Expenses waived by the Sponsor |
| $ | 78,237 |
|
| $ | 87,738 |
|
Total gross expense ratio |
|
| (2.12 | )% |
|
| (2.52 | )% |
Total expense ratio net of expenses waived by the Sponsor |
|
| (1.75 | )% |
|
| (1.91 | )% |
Net investment loss |
|
| (0.71 | )% |
|
| (1.77 | )% |
Creation of Shares |
|
| 2,675,000 |
|
|
| 1,450,000 |
|
Redemption of Shares |
|
| 2,225,000 |
|
|
| 625,000 |
|
Realized gain or loss on trading of commodity futures contracts is a function of: 1) the change in the price of the particular contracts sold as part of a “roll” in contracts as the nearest to expire contracts are exchanged for the appropriate contract given the investment objective of the fund, 2) the change in the price of particular contracts sold in relation to redemption of shares, 3) the gain or loss associated with rebalancing trades which are made to ensure conformance to the benchmark, 4) the number of contracts held and then sold for either circumstance aforementioned. The Fund recognizes the expense for brokerage commissions for futures contract trades on a per trade basis. Unrealized gain or loss on trading of commodity futures contracts is a function of the change in the price of contracts held on the final date of the period versus the purchase price for each contract and the number of contracts held in each contract month. The Sponsor has a static benchmark as described above and trades futures contracts to adhere to that benchmark and to adjust for the creation or redemption of shares.
The increase in interest and other income year over year was due to an increase in net assets and an increase in Federal Fund Rates. As a result, the amount of interest income earned as a percentage of average daily total net assets was higher in the three and nine months ended September 30, 2022, compared to the three and nine months ended September 30, 2021. The Fund seeks to earn interest and other income in investment grade, short-duration instruments or deposits associated with the pool’s cash management strategy that may be used to offset expenses. These investments may include, but are not limited to, short-term Treasury Securities, demand deposits, money market funds and investments in commercial paper. These interest rate levels may be lower or higher than the projected interest rates stated in the prospectuses and thus will impact your breakeven point.
The increase/decrease in management fee paid to the Sponsor is a result of lower/higher average net assets. The management fee is calculated at an annual rate of 1% of the Fund’s daily average net assets. Other than the management fee to the Sponsor and the brokerage commissions, most of the expenses incurred by the Fund are associated with the day-to-day operation of the Fund and the necessary functions related to regulatory compliance. These are generally based on contracts, which extend for some period of time and up to one year, or commitments regardless of the level of assets under management. The structure of the Fund and the nature of the expenses are such that as total net assets grow, there is a scalability of expenses that may allow the total expense ratio to be reduced. However, if total net assets for the Fund fall, the total expense ratio of the Fund will increase unless additional reductions are made by the Sponsor to the daily expense accruals. The Sponsor can elect to adjust the daily expense accruals at its discretion based on market conditions and other Fund considerations.
The increase/decrease in total gross fees and other expenses excluding management fees for the three and nine months ended September 30, 2022 compared to the three and nine months ended September 30, 2021 was generally due to the increase/decrease in average net assets in the period. The Sponsor has the ability to elect to pay certain expenses on behalf of the Fund or waive the management fee. This election is subject to change by the Sponsor, at its discretion. The Sponsor has determined that no reimbursement will be sought in future periods for those expenses which have been waived for the period.
The increase/decrease in total brokerage commissions for the three and nine months ended September 30, 2022 compared to the three and nine months ended September 30, 2021, was primarily due to an increase/decrease in contracts purchased, liquidated, and rolled.
| 19 |
| Table of Contents |
The graph below shows the actual shares outstanding, total net assets (or AUM) and net asset value per share (NAV per share) for the Fund from inception to September 30, 2022 and serves to illustrate the relative changes of these components.
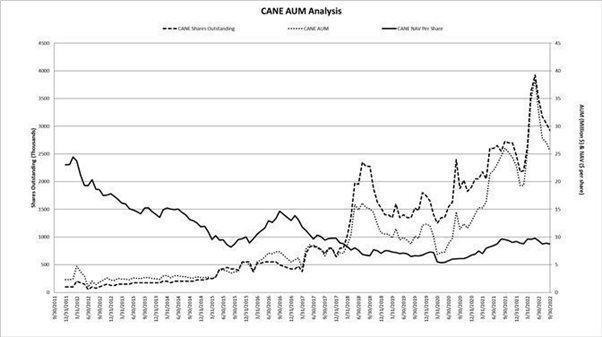
Other than the management fee to the Sponsor and the brokerage commissions, most of the expenses incurred by the Fund are associated with the day-to-day operation of the Fund and the necessary functions related to regulatory compliance. These are generally based on contracts, which extend for some period of time and up to one year, or commitments regardless of the level of assets under management. The structure of the Fund and the nature of the expenses are such that as total net assets grow, there is a scalability of expenses that may allow the total expense ratio to be reduced. However, if total net assets for the Fund fall, the total expense ratio of the Fund will increase unless additional reductions are made by the Sponsor to the daily expense accruals. The Sponsor can elect to adjust the daily expense accruals at its discretion based on market conditions and other Fund considerations.
The seasonality patterns for sugar cane futures prices are impacted by a variety of factors. In the futures market, contracts expiring during the harvest season are typically priced lower than contracts expiring in the winter and spring. While the sugar harvest seasons varies from country to country, prices of Sugar Futures Contracts tend to be lowest in the late spring and early summer, reflecting the harvest season in Brazil, the world’s leading producer of sugarcane. Thus, seasonal fluctuations could result in an investor incurring losses upon the sale of Fund Shares, particularly if the investor needs to sell Shares when the Benchmark Component Futures Contracts are, in whole or part, Sugar Futures Contracts expiring in the late spring or early summer. The price of sugar futures contracts is also influenced by global economic conditions, including the demand for imports and exports to other countries. Such factors will impact the performance of the Fund and the results of operations on an ongoing basis. The Sponsor cannot predict the impact of such factors.
Teucrium Wheat Fund
The Teucrium Wheat Fund commenced investment operations on September 19, 2011. The investment objective of the Fund is to have the daily changes in percentage terms of the Shares’ Net Asset Value reflect the daily changes in percentage terms of a weighted average of the closing settlement prices for three futures contracts for wheat (“Wheat Futures Contracts”) that are traded on the Chicago Board of Trade (“CBOT”), specifically: (1) the second to expire CBOT Wheat Futures Contract, weighted 35%, (2) the third to expire CBOT Wheat Futures Contract, weighted 30%, and (3) the CBOT Wheat Futures Contract expiring in the December following the expiration month of the third to expire contract, weighted 35%.
| 20 |
| Table of Contents |
On September 30, 2022, the Fund held a total of CBOT wheat futures contracts with a notional value of $377,991,275. The contracts had an asset fair value of $18,217,550 and a liability fair value of $18,948,559. The weighting of the notional value contracts is as follows: (1) 35% to MAR23 CBOT contracts, (2) 30% to MAY23 CBOT contracts, and (3) 35% to DEC23 CBOT contracts.
|
| Quarter Ending |
|
| Quarter Ending |
|
| Quarter Ending |
| |||
|
| September 30, 2022 |
|
| September 30, 2021 |
|
| June 30, 2022 |
| |||
Total Net Assets |
| $ | 377,988,971 |
|
| $ | 73,296,079 |
|
| $ | 450,519,572 |
|
Shares Outstanding |
|
| 41,250,004 |
|
|
| 10,375,004 |
|
|
| 49,875,004 |
|
Net Asset Value per share |
| $ | 9.16 |
|
| $ | 7.06 |
|
| $ | 9.03 |
|
Closing Price |
| $ | 9.15 |
|
| $ | 7.08 |
|
| $ | 9.04 |
|
Total net assets for the Fund increased year over year by 416%, driven by a combination of an increase in total shares outstanding of 30,875,000 or 298% and an increase in the NAV per share of $2.10 or 30%. The net assets for the Fund decreased by -16% when comparing September 30, 2022 to June 30 2022. The change in total net assets year over year, in the opinion of management, was generally due to a combination of appreciation of commodity prices and investor in-flows which was driven by the war in Ukraine, supply disruptions and rising crop input costs.
For the Three Months Ended September 30, 2022, compared to the Three Months Ended September 30, 2021
|
| Three Months Ended |
|
| Three Months Ended |
| ||
|
| September 30, 2022 |
|
| September 30, 2021 |
| ||
Average daily total net assets |
| $ | 354,167,506 |
|
| $ | 78,428,508 |
|
Net realized and unrealized gain on futures contracts |
| $ | 312,397 |
|
| $ | 4,027,770 |
|
Interest income earned on cash and cash equivalents |
| $ | 1,807,040 |
|
| $ | 29,826 |
|
Annualized interest yield based on average daily total net assets |
|
| 0.51 | % |
|
| 0.04 | % |
Net Income |
| $ | 319,191 |
|
| $ | 3,692,181 |
|
Weighted average share outstanding |
|
| 41,945,384 |
|
|
| 11,380,982 |
|
Management Fees |
| $ | 892,696 |
|
| $ | 197,683 |
|
Total gross fees and other expenses excluding management fees |
| $ | 907,550 |
|
| $ | 272,721 |
|
Brokerage Commissions |
| $ | 75,136 |
|
| $ | 17,330 |
|
Expenses waived by the Sponsor |
| $ | - |
|
| $ | 104,989 |
|
Total gross expense ratio |
|
| (2.02 | )% |
|
| (2.38 | )% |
Total expense ratio net of expenses waived by the Sponsor |
|
| (2.02 | )% |
|
| (1.85 | )% |
Net investment gain (loss) |
|
| 0.01 | % |
|
| (1.70 | )% |
Creation of Shares |
|
| 4,575,000 |
|
|
| 200,000 |
|
Redemption of Shares |
|
| 13,200,000 |
|
|
| 2,575,000 |
|
For the Nine Months Ended September 30, 2022, compared to the Nine Months Ended September 30, 2021
|
| Nine Months Ended |
|
| Nine Months Ended |
| ||
|
| September 30, 2022 |
|
| September 30, 2021 |
| ||
Average daily total net assets |
| $ | 369,580,476 |
|
| $ | 81,424,624 |
|
Net realized and unrealized (loss) gain on futures contracts |
| $ | (57,328,622 | ) |
| $ | 12,302,836 |
|
Interest income earned on cash and cash equivalents |
| $ | 2,931,373 |
|
| $ | 99,342 |
|
Annualized interest yield based on average daily total net assets |
|
| 0.79 | % |
|
| 0.12 | % |
Net (Loss) Income |
| $ | (59,064,706 | ) |
| $ | 11,227,466 |
|
Weighted average share outstanding |
|
| 38,111,726 |
|
|
| 12,387,275 |
|
Management Fees |
| $ | 2,764,259 |
|
| $ | 609,012 |
|
Total gross fees and other expenses excluding management fees |
| $ | 2,328,362 |
|
| $ | 795,340 |
|
Brokerage Commissions |
| $ | 354,679 |
|
| $ | 39,852 |
|
Expenses waived by the Sponsor |
| $ | 425,164 |
|
| $ | 229,640 |
|
Total gross expense ratio |
|
| (1.84 | )% |
|
| (2.31 | )% |
Total expense ratio net of expenses waived by the Sponsor |
|
| (1.69 | )% |
|
| (1.93 | )% |
Net investment loss |
|
| (0.63 | )% |
|
| (1.77 | )% |
Creation of Shares |
|
| 84,050,000 |
|
|
| 3,500,000 |
|
Redemption of Shares |
|
| 53,050,000 |
|
|
| 4,475,000 |
|
Realized gain or loss on trading of commodity futures contracts is a function of: 1) the change in the price of the particular contracts sold as part of a “roll” in contracts as the nearest to expire contracts are exchanged for the appropriate contract given the investment objective of the fund, 2) the change in the price of particular contracts sold in relation to redemption of shares, 3) the gain or loss associated with rebalancing trades which are made to ensure conformance to the benchmark, 4) the number of contracts held and then sold for either circumstance aforementioned. The Fund recognized the expense for brokerage commissions for futures contract trades on a per trade basis. Unrealized gain or loss on trading of commodity futures contracts is a function of the change in the price of contracts held on the final date of the period versus the purchase price for each contract and the number of contracts held in each contract month. The Sponsor has a static benchmark as described above and trades futures contracts to adhere to that benchmark and to adjust for the creation or redemption of shares.
| 21 |
| Table of Contents |
The increase in interest and other income year over year was due to an increase in net assets and an increase in Federal Fund Rates. As a result, the amount of interest income earned as a percentage of average daily total net assets was higher in the three and nine months ended September 30, 2022, compared to the three and nine months ended September 30, 2021. The Fund seeks to earn interest and other income in investment grade, short-duration instruments or deposits associated with the pool’s cash management strategy that may be used to offset expenses. These investments may include, but are not limited to, short-term Treasury Securities, demand deposits, money market funds and investments in commercial paper. These interest rate levels may be lower or higher than the projected interest rates stated in the prospectuses and thus will impact your breakeven point.
The increase/decrease in management fee paid to the Sponsor is a result of lower/higher average net assets. The management fee is calculated at an annual rate of 1% of the Fund’s daily average net assets. Other than the management fee to the Sponsor and the brokerage commissions, most of the expenses incurred by the Fund are associated with the day-to-day operation of the Fund and the necessary functions related to regulatory compliance. These are generally based on contracts, which extend for some period of time and up to one year, or commitments regardless of the level of assets under management. The structure of the Fund and the nature of the expenses are such that as total net assets grow, there is a scalability of expenses that may allow the total expense ratio to be reduced. However, if total net assets for the Fund fall, the total expense ratio of the Fund will increase unless additional reductions are made by the Sponsor to the daily expense accruals. The Sponsor can elect to adjust the daily expense accruals at its discretion based on market conditions and other Fund considerations.
The increase in total gross fees and other expenses excluding management fees for the three and nine months ended September 30, 2022 compared to the three and nine months ended September 30, 2021 was generally due to an increase in average net assets relative to the other Funds. The Sponsor has the ability to elect to pay certain expenses on behalf of the Fund or waive the management fee. This election is subject to change by the Sponsor, at its discretion. The Sponsor has determined that no reimbursement will be sought in future periods for those expenses which have been waived for the period.
The increase/decrease in total brokerage commissions for the three and nine months ended September 30, 2022 compared to the three and nine months ended September 30, 2021, was primarily due to an increase/decrease in contracts purchased, liquidated, and rolled.
The graph below shows the actual shares outstanding, total net assets (or AUM) and net asset value per share (NAV per share) for the Fund from inception to September 30, 2022 and serves to illustrate the relative changes of these components.
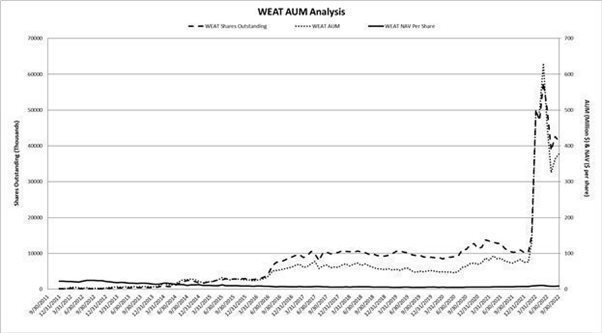
| 22 |
| Table of Contents |
Other than the management fee to the Sponsor and the brokerage commissions, most of the expenses incurred by the Fund are associated with the day-to-day operation of the Fund and the necessary functions related to regulatory compliance. These are generally based on contracts, which extend for some period of time and up to one year, or commitments regardless of the level of assets under management. The structure of the Fund and the nature of the expenses are such that as total net assets grow, there is a scalability of expenses that may allow the total expense ratio to be reduced. However, if total net assets for the Fund fall, the total expense ratio of the Fund will increase unless additional reductions are made by the Sponsor to the daily expense accruals. The Sponsor can elect to adjust the daily expense accruals at its discretion based on market conditions and other Fund considerations.
The seasonality patterns for wheat futures prices are impacted by a variety of factors. These include, but are not limited to, the harvest in summer and fall, the planting conditions, and the weather throughout the critical germination and growing periods. Prices for wheat futures are affected by the availability and demand for substitute agricultural commodities, including corn and other feed grains. The price of wheat futures contracts is also influenced by global economic conditions, including the demand for exports to other countries. Such factors will impact the performance of the Fund and the results of operations on an ongoing basis. The Sponsor cannot predict the impact of such factors.
Teucrium Agricultural Fund
The Teucrium Agricultural Fund commenced operation on March 28, 2012. The investment objective of the Fund is to have the daily changes in percentage terms of the Net Asset Value (“NAV”) of its common units (“Shares”) reflect the daily changes in percentage terms of a weighted average (the “Underlying Fund Average”) of the NAVs per share of four other commodity pools that are series of the Trust and are sponsored by the Sponsor: the Teucrium Corn Fund (“CORN”), the Teucrium Wheat Fund (“WEAT”), the Teucrium Soybean Fund (“SOYB”) and the Teucrium Sugar Fund (“CANE”) (collectively, the “Underlying Funds”). The Underlying Fund Average will have a weighting of 25% to each Underlying Fund, and the Fund’s assets will be rebalanced, generally on a daily basis, to maintain the approximate 25% allocation to each Underlying Fund. The Fund does not intend to invest directly in futures contracts (“Futures Contracts”), although it reserves the right to do so in the future, including if an Underlying Fund ceases operation.
The investment objective of each Underlying Fund is to have the daily changes in percentage terms of its shares’ NAV reflect the daily changes in percentage terms of a weighted average of the closing settlement prices for certain Futures Contracts for the commodity specified in the Underlying Fund’s name. (This weighted average is referred to herein as the Underlying Fund’s “Benchmark,” the Futures Contracts that at any given time make up an Underlying Fund’s Benchmark are referred to herein as the Underlying Fund’s “Benchmark Component Futures Contracts,” and the commodity specified in the Underlying Fund’s name is referred to herein as its “Specified Commodity.”) Specifically, the Teucrium Corn Fund’s Benchmark is: (1) the second to expire Futures Contract for corn traded on the Chicago Board of Trade (“CBOT”), weighted 35%, (2) the third to expire CBOT corn Futures Contract, weighted 30%, and (3) the CBOT corn Futures Contract expiring in the December following the expiration month of the third to expire contract, weighted 35%. The Teucrium Wheat Fund’s Benchmark is: (1) the second to expire CBOT wheat Futures Contract, weighted 35%, (2) the third to expire CBOT wheat Futures Contract, weighted 30%, and (3) the CBOT wheat Futures Contract expiring in the December following the expiration month of the third to expire contract, weighted 35%. The Teucrium Soybean Fund’s Benchmark is: (1) the second to expire CBOT soybean Futures Contract, weighted 35%, (2) the third to expire CBOT soybean Futures Contract, weighted 30%, and (3) the CBOT soybean Futures Contract expiring in the November following the expiration month of the third to expire contract, weighted 35%, except that CBOT soybean Futures Contracts expiring in August and September will not be part of the Teucrium Soybean Fund’s Benchmark because of the less liquid market for these Futures Contracts. The Teucrium Sugar Fund’s Benchmark is: (1) the second to expire Sugar No. 11 Futures Contract traded on ICE Futures US (“ICE Futures”), weighted 35%, (2) the third to expire ICE Futures Sugar No. 11 Futures Contract, weighted 30%, and (3) the ICE Futures Sugar No. 11 Futures Contract expiring in the March following the expiration month of the third to expire contract, weighted 35%.
On September 30, 2022, the Fund held: 1) 429,192 shares of CORN with a fair value of $11,605,566; 2) 1,294,496 shares of WEAT with a fair value of $11,861,985; 3) 427,314 shares of SOYB with a fair value of $11,158,920; and 4) 1,327,598 shares of CANE with a fair value of $11,589,798. The weighting on September 30, 2022 was 25% to CORN, 26% to WEAT, 24% to SOYB and 25% to CANE.
|
| Quarter Ending |
|
| Quarter Ending |
|
| Quarter Ending |
| |||
|
| September 30, 2022 |
|
| September 30, 2021 |
|
| June 30, 2022 |
| |||
Total Net Assets |
| $ | 46,219,717 |
|
| $ | 8,540,663 |
|
| $ | 47,407,824 |
|
Shares Outstanding |
|
| 1,487,502 |
|
|
| 325,002 |
|
|
| 1,525,002 |
|
Net Asset Value per share |
| $ | 31.07 |
|
| $ | 26.28 |
|
| $ | 31.09 |
|
Closing Price |
| $ | 31.09 |
|
| $ | 26.32 |
|
| $ | 31.07 |
|
Total net assets for the Fund increased year over year by 441%, driven by a combination of an increase in shares outstanding of 1,162,500 shares or 358% and an increase in the NAV per share of $4.79 or 18%. The net assets for the Fund decreased by 3% when comparing September 30, 2022 to June 30 2022. The change in total net assets year over year, in the opinion of management, was generally due to a combination of appreciation of commodity prices and investor in-flows which was driven by the war in Ukraine, supply disruptions and rising crop input costs. Effective August 2, 2012 through April 9, 2018, the Fund was at 50,002 shares outstanding which represents a minimum number of shares and there could be no further redemptions until additional shares were created.
| 23 |
| Table of Contents |
For the Three Months Ended September 30, 2022, compared to the Three Months Ended September 30, 2021
|
| Three Months Ended |
|
| Three Months Ended |
| ||
|
| September 30, 2022 |
|
| September 30, 2021 |
| ||
Average daily total net assets |
| $ | 46,480,463 |
|
| $ | 9,279,111 |
|
Net realized and unrealized gain on securities |
| $ | 7,231 |
|
| $ | 146,125 |
|
Interest income earned on cash equivalents |
| $ | 302 |
|
| $ | - |
|
Annualized interest yield based on average daily total net assets |
|
| 0.00 | % |
|
| 0.00 | % |
Net (Loss) Income |
| $ | (7,697 | ) |
| $ | 141,915 |
|
Weighted average share outstanding |
|
| 1,537,230 |
|
|
| 356,931 |
|
Total gross fees and other expenses |
| $ | 77,289 |
|
| $ | 33,156 |
|
Expenses waived by the Sponsor |
| $ | 62,059 |
|
| $ | 28,946 |
|
Total gross expense ratio |
|
| (0.66 | )% |
|
| (1.42 | )% |
Total expense ratio net of expenses waived by the Sponsor |
|
| (0.13 | )% |
|
| (0.18 | )% |
Net investment loss |
|
| (0.13 | )% |
|
| (0.18 | )% |
Creation of Shares |
|
| 75,000 |
|
|
| - |
|
Redemption of Shares |
|
| 112,500 |
|
|
| 62,500 |
|
For the Nine Months Ended September 30, 2022, compared to the Nine Months Ended September 30, 2021
|
| Nine Months Ended |
|
| Nine Months Ended |
| ||
|
| September 30, 2022 |
|
| September 30, 2021 |
| ||
Average daily total net assets |
| $ | 35,475,983 |
|
| $ | 7,187,844 |
|
Net realized and unrealized (loss) gain on securities |
| $ | (1,296,832 | ) |
| $ | 1,226,469 |
|
Interest income earned on cash equivalents |
| $ | 352 |
|
| $ | 5 |
|
Annualized interest yield based on average daily total net assets |
|
| 0.00 | % |
|
| 0.00 | % |
Net (Loss) Income |
| $ | (1,333,145 | ) |
| $ | 1,216,367 |
|
Weighted average share outstanding |
|
| 1,120,973 |
|
|
| 288,326 |
|
Total gross fees and other expenses |
| $ | 212,887 |
|
| $ | 74,648 |
|
Expenses waived by the Sponsor |
| $ | 176,222 |
|
| $ | 64,541 |
|
Total gross expense ratio |
|
| (0.80 | )% |
|
| (1.39 | )% |
Total expense ratio net of expenses waived by the Sponsor |
|
| (0.14 | )% |
|
| (0.19 | )% |
Net investment loss |
|
| (0.14 | )% |
|
| (0.19 | )% |
Creation of Shares |
|
| 1,362,500 |
|
|
| 337,500 |
|
Redemption of Shares |
|
| 400,000 |
|
|
| 87,500 |
|
Realized gain or loss on the securities of the Underlying Funds is a function of 1) the change in the price of particular contracts sold in relation to redemption of shares, 2) the gain or loss associated with rebalancing trades which are made to ensure conformance to the benchmark and 3) the full-turn brokerage commission fee recognized on a per trade basis. Unrealized gain or loss on the securities of the Underlying Funds is a function of the change in the price of shares held on the final date of the period versus the purchase price for each and the number held. The Sponsor has a static benchmark as described above and trades futures contracts to adhere to that benchmark and to adjust for the creation or redemption of shares.
Other than the brokerage commissions, most of the expenses incurred by the Fund are associated with the day-to-day operation of the Fund and the necessary functions related to regulatory compliance. These are generally based on contracts, which extend for some period of time and up to one year, or commitments regardless of the level of assets under management. The structure of the Fund and the nature of the expenses are such that as total net assets grow, there is a scalability of expenses that may allow the total expense ratio to be reduced. However, if total net assets for the Fund fall, the total expense ratio of the Fund will increase unless additional reductions are made by the Sponsor to the daily expense accruals. The Sponsor can elect to adjust the daily expense accruals at its discretion based on market conditions and other Fund considerations.
The increase in total gross fees and other expenses for the three and nine months ended September 30, 2022 compared to the three and nine months ended September 30, 2021 was generally due to the increase in average net assets in the period. The Sponsor has the ability to elect to pay certain expenses on behalf of the Fund or waive the management fee. This election is subject to change by the Sponsor, at its discretion. The Sponsor has determined that no reimbursement will be sought in future periods for those expenses which have been waived for the period.
| 24 |
| Table of Contents |
The graph below shows the actual shares outstanding, total net assets (or AUM) and net asset value per share (NAV per share) for the Fund from inception to September 30, 2022 and serves to illustrate the relative changes of these components.
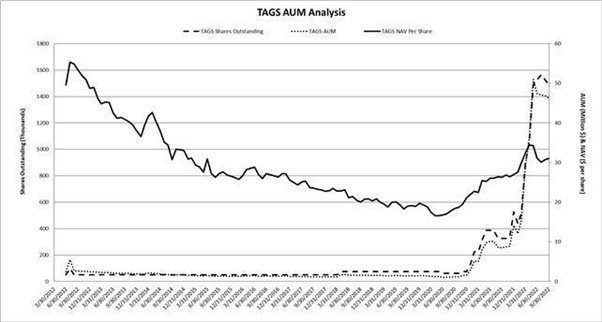
Hashdex Bitcoin Futures ETF
The Hashdex Bitcoin Futures ETF Fund commenced investment operations on September 15, 2022. The investment objective of the Fund is to have the daily changes in percentage terms of the Shares’ Net Asset Value reflect the daily changes in percentage terms of a weighted average of the closing settlement prices for two futures contracts for Bitcoin (“Bitcoin Futures Contracts”) that are traded on the Chicago Mercantile Exchange (“CME”), specifically: (1) the first to expire CME Bitcoin Futures Contract, weighted 50%, (2) the second to expire CME Bitcoin Futures Contract, weighted 50%.
On September 30, 2022, the Fund held a total of 12 CME bitcoin futures contracts with a notional value of $1,165,800. The contracts had a liability fair value of $14,372. The weighting of the notional value contracts is as follows: (1) 50% to OCT22 CME Bitcoin Futures contracts, (2) 50% to NOV22 CME Bitcoin Futures contracts.
|
| From the commencement |
| |
|
| of operations (September 15, 2022) |
| |
|
| through September 30, 2022 |
| |
Total Net Assets |
| $ | 1,230,482 |
|
Shares Outstanding |
|
| 50,004 |
|
Net Asset Value per share |
| $ | 24.61 |
|
Closing Price |
| $ | 24.68 |
|
| 25 |
| Table of Contents |
From the commencement of operations (September 15, 2022) through September 30, 2022
|
| From the commencement |
| |
|
| of operations (September 15, 2022) |
| |
|
| through September 30, 2022 |
| |
Average daily total net assets |
| $ | 975,029 |
|
Net realized and unrealized loss on futures contracts |
| $ | (20,314 | ) |
Interest income earned on cash equivalents |
| $ | 1,073 |
|
Annualized interest yield based on average daily total net assets |
|
| 0.11 | % |
Net Loss |
| $ | (19,618 | ) |
Weighted average share outstanding |
|
| 40,003 |
|
Management Fees |
| $ | 377 |
|
Total gross fees and other expenses excluding management fees |
| $ | 550 |
|
Brokerage Commissions |
| $ | 949 |
|
Expenses waived by the Sponsor |
| $ | 550 |
|
Total gross expense ratio |
|
| (2.31 | )% |
Total expense ratio net of expenses waived by the Sponsor |
|
| (0.94 | )% |
Net investment gain |
|
| 1.74 | % |
Creation of Shares |
|
| 50,004 |
|
Redemption of Shares |
|
| - |
|
Realized gain or loss on trading of cryptocurrency futures contracts is a function of: 1) the change in the price of the particular contracts sold as part of a “roll” in contracts as the nearest to expire contracts are exchanged for the appropriate contract given the investment objective of the fund, 2) the change in the price of particular contracts sold in relation to redemption of shares, 3) the gain or loss associated with rebalancing trades which are made to ensure conformance to the benchmark, 4) the number of contracts held and then sold for either circumstance aforementioned. The Fund recognizes the expense for brokerage commissions for futures contract trades on a per trade basis. Unrealized gain or loss on trading of cryptocurrency futures contracts is a function of the change in the price of contracts held on the final date of the period versus the purchase price for each contract and the number of contracts held in each contract month. The Sponsor has a static benchmark as described above and trades futures contracts to adhere to that benchmark and to adjust for the creation or redemption of shares.
The Fund seeks to earn interest and other income in investment grade, short-duration instruments or deposits associated with the pool’s cash management strategy that may be used to offset expenses. These investments may include, but are not limited to, short-term Treasury Securities, demand deposits, money market funds and investments in commercial paper. These interest rate levels may be lower or higher than the projected interest rates stated in the prospectuses and thus will impact your breakeven point.
DEFI is contractually obligated to pay a monthly management fee to the Sponsor, based on average daily net assets, at a rate equal to 0.94% per annum. From the Management Fee, the Sponsor pays all of the routine operational, administrative and other ordinary expenses of the Fund, generally as determined by the Sponsor, including but not limited to, fees and expenses of the Administrator, Custodian, Distributor, Transfer Agent, licensors, accounting and audit fees expenses, tax preparation expenses, legal fees, ongoing SEC registration fees, individual Schedule K-1 preparation and mailing fees, and report preparation and mailing expenses. These fees and expenses are not included in the breakeven table because they are paid for by the Sponsor through the proceeds from the Management Fee. The Fund pays all of its non-recurring and unusual fees and expenses, if any, as determined by the Sponsor. Non-recurring and unusual fees and expenses are unexpected or unusual in nature, such as legal claims and liabilities and litigation costs or indemnification or other unanticipated expenses. Extraordinary fees and expenses also include material expenses which are not currently anticipated obligations of the Fund. Routine operational, administrative, and other ordinary expenses are not deemed extraordinary expenses.
| 26 |
| Table of Contents |
The graph below shows the actual shares outstanding, total net assets (or AUM) and net asset value per share (NAV per share) for the Fund from inception to September 30, 2022 and serves to illustrate the relative changes of these components.
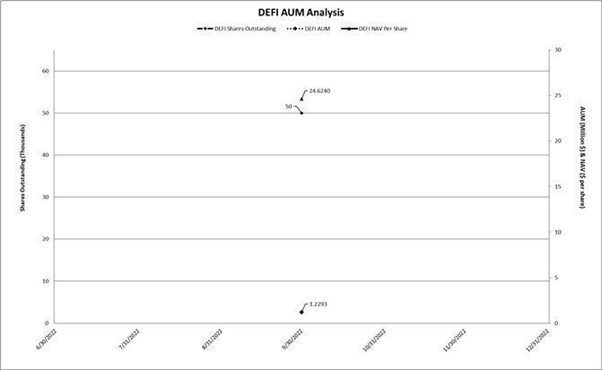
Other than the management fee to the Sponsor and the brokerage commissions, most of the expenses incurred by the Fund are associated with the day-to-day operation of the Fund and the necessary functions related to regulatory compliance. These are generally based on contracts, which extend for some period of time and up to one year, or commitments regardless of the level of assets under management. The structure of the Fund and the nature of the expenses are such that as total net assets grow, there is a scalability of expenses that may allow the total expense ratio to be reduced. However, if total net assets for the Fund fall, the total expense ratio of the Fund will increase unless additional reductions are made by the Sponsor to the daily expense accruals. The Sponsor can elect to adjust the daily expense accruals at its discretion based on market conditions and other Fund considerations.
Market Outlook
The Corn Market
Corn is currently the most widely produced livestock feed grain in the United States. The two largest demands of the United States’ corn crop are used in livestock feed and ethanol production. Corn is also processed into food and industrial products, including starch, sweeteners, corn oil, beverages, and industrial alcohol. The United States Department of Agriculture (“USDA”) publishes weekly, monthly, quarterly, and annual updates for U.S. domestic and worldwide corn production and consumption, and for other grains such as soybeans and wheat which can be used in some cases as a substitute for corn. These reports are available on the USDA’s website, www.usda.gov, at no charge. The outlook provided below is from the October 12, 2022 USDA report.
As a general matter, the occurrence of a severe weather event, natural disaster, terrorist attack, geopolitical events, outbreak, or public health emergency as declared by the World Health Organization, the continuation or expansion of war or other hostilities, or a prolonged government shutdown may have significant adverse effects on the Fund and its investments and alter current assumptions and expectations. For example, in late February 2022, Russia invaded Ukraine, significantly amplifying existing geopolitical tensions among Russia and other countries in the region and in the west. The responses of countries and political bodies to Russia’s actions, Ukraine’s military response and the potential for wider conflict may increase financial market volatility. Generally, these adverse effects may cause continued volatility in the price of corn, corn futures, and the share price of the Fund.
The price per bushel of corn in the United States is primarily a function of both U.S. and global production and demand. Long term impacts from sanctions, shipping disruptions, collateral war damage, and a potential expansion of the conflict between Russia and Ukraine could further disrupt the availability of corn supplies. These impacts remain important to track as both countries have played important roles in supplying grain to other parts of the world. As such, volatility, trading volumes, and prices in global corn markets have risen dramatically and are expected to continue indefinitely at extreme elevated levels. Given all of the above factors, the Sponsor has no ability to discern when current high levels of volatility will subside.
| 27 |
| Table of Contents |
Recent geopolitical events have at times impacted the level of “backwardation” experienced by the Fund. As a result, near to expire contracts can trade at a higher price than longer to expire contracts, a situation referred to as “backwardation.” Putting aside the impact of the overall movement in prices of corn and corn futures, the Benchmark Component Futures Contracts (the corn futures contracts that the Fund invests in to achieve its investment objective) would tend to rise as they approach expiration. This backwardation may benefit the Fund because it will sell more expensive contracts and buy less expensive contracts on an ongoing basis.
Conversely, in the event of a corn futures market where near to expire contracts trade at a lower price than longer to expire contracts, a situation referred to as “contango,” then absent the impact of the overall movement in corn prices the value of the Benchmark Component Futures Contracts would tend to decline as they approach expiration. If the price of corn and corn futures were to decline, for example, because of a resolution of the Russia-Ukraine conflict, the Fund would experience the negative impact of contango.
The United States is the world’s leading producer and exporter of corn. For the Crop Year 2022-23, the United States Department of Agriculture (“USDA”) estimates that the U.S. will produce approximately 30% of all the corn globally, of which about 15% will be exported. For 2022-2023, based on the October 12, 2022, USDA reports, global consumption of 1,175 Million Metric Tons (MMT) is expected to be slightly higher than global production of 1,169 MMT. If the global demand for corn is not equal to global supply, this may have an impact on the price of corn. Besides the United States, other principal world corn exporters include Argentina, Brazil, Russia, South Africa, and Ukraine. Major import nations include Mexico, Japan, the European Union (EU), South Korea, Egypt, and parts of Southeast Asia. China’s production at 274 MMT is approximately 8% less than its domestic usage.
According to the USDA, global corn consumption has increased just over 602% from crop year 1960/1961 to 2022/2023 as demonstrated by the graph below and is projected to continue to grow in coming years. Consumption growth is the result of a combination of many factors including: 1) global population growth, which, according to the U.S. Census Department, is estimated to reach 9.7 billion by 2050; 2) a growing global middle class which is increasing the demand for protein and meat-based products globally and most significantly in developing countries; and 3) increased use of biofuels, including ethanol in the United States.
Global corn consumption may fluctuate year over year due to any number of reasons which may include, but is not limited to, economic conditions, global health concerns, international trade policy. Corn is a staple commodity used pervasively across the globe so that any contractions in consumption may only be temporary as has historically been the case.
| 28 |
| Table of Contents |
While global consumption of corn has increased over the 1960/1961-2022/2023 period, so has production, driven by increases in acres planted and yield per acre. However, according to the USDA and United Nations, future growth in planted acres and yield may be inhibited by lower productive land, and lack of infrastructure and transportation. In addition, agricultural crops such as corn are highly weather dependent for yield and therefore susceptible to changing weather patterns. In addition, given the current production/consumption patterns, nearly 100% of all corn produced globally is consumed which leaves minimal excess inventory if production issues arise.
The price per bushel of corn in the United States is primarily a function of both U.S. and global production, as well as U.S. and global demand. The graph below shows the USDA published price per bushel by month for the period January 2007 to August 2022.
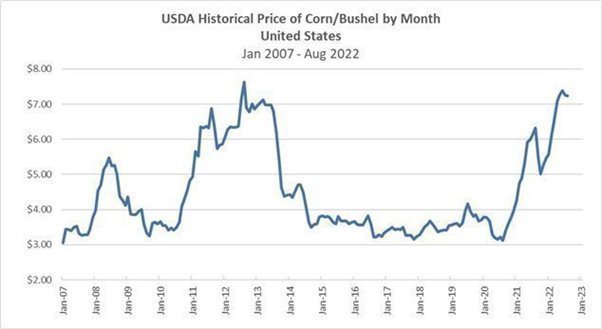
On October 12, 2022, the USDA released its monthly World Agricultural Supply and Demand Estimates (WASDE) for the Crop Year 2022-23. The exhibit below provides a summary of historical and current information for United States corn production.
| 29 |
| Table of Contents |
U.S. Corn Supply/Demand Balance | ||||||||||||||
Marketing Year September - August | ||||||||||||||
Million Bushels | ||||||||||||||
Oct 12 Est. | 21-22 to | Oct 12 Est. | 22-23 to | |||||||||||
USDA | 20-21 | USDA | 21-22 | |||||||||||
Crop Year | 11-12 | 12-13 | 13-14 | 14-15 | 15-16 | 16-17 | 17-18 | 18-19 | 19-20 | 20-21 | 21-22 | % Change | 22-23 | % Change |
Planted Acres | 91.9 | 97.3 | 95.4 | 90.6 | 88.0 | 94.0 | 90.2 | 88.9 | 89.7 | 90.7 | 93.3 | 3% | 88.6 | -5% |
Harvested Acres | 84.0 | 87.4 | 87.5 | 83.1 | 80.8 | 86.7 | 82.7 | 81.3 | 81.3 | 82.3 | 85.3 | 4% | 80.8 | -5% |
Difference | 7.9 | 9.9 | 7.9 | 7.5 | 7.2 | 7.3 | 7.5 | 7.6 | 8.4 | 8.4 | 8.0 | -5% | 7.8 | -3% |
Yield | 147.2 | 123.1 | 158.1 | 171.0 | 168.4 | 174.6 | 176.6 | 176.4 | 167.5 | 171.4 | 176.7 | 3% | 171.9 | -3% |
Beginning Stocks | 1,128 | 989 | 821 | 1,232 | 1,731 | 1,737 | 2,293 | 2,140 | 2,221 | 1,919 | 1,235 | -36% | 1,377 | 11% |
Production | 12,360 | 10,755 | 13,829 | 14,216 | 13,602 | 15,148 | 14,609 | 14,340 | 13,620 | 14,111 | 15,074 | 7% | 13,895 | -8% |
Imports | 29 | 160 | 36 | 32 | 68 | 57 | 36 | 28 | 42 | 24 | 24 | 0% | 50 | 108% |
Total Supply | 13,516 | 11,904 | 14,686 | 15,479 | 15,401 | 16,942 | 16,939 | 16,509 | 15,883 | 16,055 | 16,333 | 2% | 15,322 | -6% |
Feed | 4,545 | 4,315 | 5,040 | 5,280 | 5,114 | 5,470 | 5,304 | 5,429 | 5,900 | 5,602 | 5,715 | 2% | 5,275 | -8% |
Food/Seed/Industrial | 6,439 | 6,038 | 6,493 | 6,601 | 6,648 | 6,885 | 7,057 | 6,793 | 6,286 | 6,472 | 6,769 | 5% | 6,725 | -1% |
Ethanol for Fuel(incld above) | 5,011 | 4,641 | 5,124 | 5,200 | 5,224 | 5,432 | 5,605 | 5,378 | 4,857 | 5,033 | 5,328 | 6% | 5,275 | -1% |
Exports | 1,543 | 730 | 1,920 | 1,867 | 1,901 | 2,294 | 2,438 | 2,066 | 1,777 | 2,747 | 2,471 | -10% | 2,150 | -13% |
Total Usage | 12,527 | 11,083 | 13,454 | 13,748 | 13,664 | 14,650 | 14,798 | 14,288 | 13,963 | 14,821 | 14,956 | 1% | 14,150 | -5% |
Ending Stocks (Inventory) | 989 | 821 | 1,232 | 1,731 | 1,737 | 2,293 | 2,140 | 2,221 | 1,919 | 1,235 | 1,377 | 11% | 1,172 | -15% |
Stocks/Use Ratio | 8% | 7% | 9% | 13% | 13% | 16% | 14% | 16% | 14% | 8% | 9% | 10% | 8% | -10% |
farm Price ($/bushel) | $ 6.22 | $ 6.89 | $ 4.46 | $ 3.70 | $ 3.61 | $ 3.36 | $3.36 | $3.61 | $3.56 | $4.53 | $6.00 | $6.80 | ||
Calculations: | ||||||||||||||
Demand per day (incld expt)¹ | 34.3 | 30.4 | 36.9 | 37.7 | 37.4 | 40.1 | 40.5 | 39.1 | 38.3 | 40.6 | 41.0 | 1% | 38.8 | -5% |
Carry-out days supply | 28.8 | 27.0 | 33.4 | 46.0 | 46.4 | 57.1 | 52.8 | 56.7 | 50.2 | 30.4 | 33.6 | 10% | 30.2 | -10% |
¹ in millions of bushels per day | ||||||||||||||
Standard Corn Futures Contracts trade on the CBOT in units of 5,000 bushels. Three grades of corn are deliverable under CBOT Corn Futures Contracts: Number 1 yellow, which may be delivered at 1.5 cents over the contract price; Number 2 yellow, which may be delivered at the contract price; and Number 3 yellow, between a 2 and 4 cents per bushel under contract price depending on broken corn and foreign material and damage grade factors. There are five months each year in which CBOT Corn Futures Contracts expire: March, May, July, September, and December.
If the futures market is in a state of backwardation (i.e., when the price of corn in the future is expected to be less than the current price), the Fund will buy later to expire contracts for a lower price than the sooner to expire contracts that it sells. Hypothetically, and assuming no changes to either prevailing corn prices or the price relationship between immediate delivery, soon to expire contracts and later to expire contracts, the value of a contract will rise as it approaches expiration. Over time, if backwardation remained constant, the differences would continue to increase. If the futures market is in contango, the Fund will buy later to expire contracts for a higher price than the sooner to expire contracts that it sells. Hypothetically, and assuming no other changes to either prevailing corn prices or the price relationship between the spot price, soon to expire contracts and later to expire contracts, the value of a contract will fall as it approaches expiration. Over time, if contango remained constant, the difference would continue to increase. Historically, the corn futures markets have experienced periods of both contango and backwardation. Frequently, whether contango or backwardation exists is a function, among other factors, of the seasonality of the corn market and the corn harvest cycle. All other things being equal, a situation involving prolonged periods of contango may adversely impact the returns of the Fund; conversely a situation involving prolonged periods of backwardation may positively impact the returns of the Fund.
Futures contracts may be either bought or sold, long or short. The U.S Commodity Futures Trading Commission weekly releases the “Commitment of Traders” (COT) report, which depicts the open interest as well as long and short positions in the market. Market participants may use this report to gauge market sentiment.
The Soybean Market
Global soybean production is concentrated in the U.S., Brazil, Argentina, and China. The United States Department of Agriculture (“USDA”) has estimated that, for the Crop Year 2022-23, the United States will produce approximately 117 MMT of soybeans or approximately 30% of estimated world production, with Brazil production at 152 MMT. Argentina is projected to produce about 51 MMT. For 2022-23, based on the October 12, 2022 USDA report, global consumption of 380 MMT is estimated slightly lower than global production of 391 MMT. If the global demand for soybeans is not equal to global supply, this may have an impact on the price of soybeans. Global soybean consumption may fluctuate year over year due to any number of reasons which may include, but is not limited to, economic conditions, global health concerns, international trade policy. Soybeans are a staple commodity used pervasively across the globe so that any contractions in consumption may only be temporary as has historically been the case. The USDA publishes weekly, monthly, quarterly, and annual updates for U.S. domestic and worldwide soybean production and consumption. These reports are available on the USDA’s website, www.usda.gov, at no charge. The outlook provided below is from the October 12, 2022 USDA report.
| 30 |
| Table of Contents |
As a general matter, the occurrence of a severe weather event, natural disaster, terrorist attack, geopolitical events, outbreak, or public health emergency as declared by the World Health Organization, the continuation or expansion of war or other hostilities, or a prolonged government shutdown may have significant adverse effects on the Fund and its investments and alter current assumptions and expectations. For example, in late February 2022, Russia invaded Ukraine, significantly amplifying existing geopolitical tensions among Russia and other countries in the region and in the west. Global response to Russia’s actions, the larger overarching tensions, and Ukraine’s military response may increase financial market volatility generally, have severe adverse effects on global economic markets, and cause volatility in the price of agricultural products, including agricultural futures, and the share price of the Fund.
The price per bushel of soybeans in the United States is primarily a function of both U.S. and global production and demand. The price per bushel of soybeans can be affected by the price of corn; because corn and soybeans are planted on the same acres, farmers must choose which crop to plant each year. If corn prices rise enough to incentivize the planting of corn over soybeans, the supply and price of soybeans could be affected. Long term impacts from sanctions, shipping disruptions, collateral war damage, and a potential expansion of the conflict between Russia and Ukraine could further disrupt the availability of agricultural products and supplies. China remains the largest importer of soybeans in the world. Volatility, trading volumes, and prices in global corn and soybean markets have risen dramatically and are expected to continue indefinitely at elevated levels. Given all of the above factors, the Sponsor has no ability to discern when current high levels of volatility will subside.
Recent geopolitical events may have impacted the level of “backwardation” experienced by the Fund. The Russian invasion and related developments have indirectly placed upward pressure on the price of soybean and soybean futures contracts. As a result, near to expire contracts trade at a higher price than longer to expire contracts, a situation referred to as “backwardation.” Putting aside the impact of the overall movement in prices of soybean and soybean futures, the Benchmark Component Futures Contracts (the soybean futures contracts that the Fund invests in to achieve its investment objective) would tend to rise as they approach expiration. This backwardation may benefit the Fund because it will sell more expensive contracts and buy less expensive contracts on an ongoing basis. The degree of backwardation is also shown in the following table.
Conversely, in the event of a soybean futures market where near to expire contracts trade at a lower price than longer to expire contracts, a situation referred to as “contango,” then absent the impact of the overall movement in soybean prices the value of the Benchmark Component Futures Contracts would tend to decline as they approach expiration. If the prices of soybean and soybean futures were to decline, for example the Fund would experience the negative impact of contango.
The soybean processing industry converts soybeans into soybean meal, soybean hulls, and soybean oil. Soybean meal and soybean hulls are processed into soy flour or soy protein, which are used, along with other commodities, by livestock producers and the fish farming industry as feed. Soybean oil is sold in multiple grades and is used by the food, petroleum, and chemical industries. The food industry uses soybean oil in cooking and salad dressings, baking and frying fats, and butter substitutes, among other uses. In addition, the soybean industry continues to introduce soy-based products as substitutes to various petroleum-based products including lubricants, plastics, inks, crayons, and candles. Soybean oil is also converted to biodiesel and renewable diesel for use as fuel.
Standard Soybean Futures Contracts trade on the CBOT in units of 5,000 bushels, although 1,000 bushel “mini-sized” Soybean Futures Contracts also trade. Three grades of soybeans are deliverable under CBOT Soybean Futures Contracts: Number 1 yellow, which may be delivered at 6 cents per bushel over the contract price; Number 2 yellow, which may be delivered at the contract price; and Number 3 yellow, which may be delivered at 6 cents per bushel under the contract price. There are seven months each year in which CBOT Soybean Futures Contracts expire: January, March, May, July, August, September, and November.
If the futures market is in a state of backwardation (i.e., when the price of soybeans in the future is expected to be less than the current price), the Fund will buy later to expire contracts for a lower price than the sooner to expire contracts that it sells. Hypothetically, and assuming no changes to either prevailing soybean prices or the price relationship between immediate delivery, soon to expire contracts and later to expire contracts, the value of a contract will rise as it approaches expiration. If the futures market is in contango, the Fund will buy later to expire contracts for a higher price than the sooner to expire contracts that it sells. Hypothetically, and assuming no other changes to either prevailing soybean prices or the price relationship between the spot price, soon to expire contracts and later to expire contracts, the value of a contract will fall as it approaches expiration. Historically, the soybeans futures markets have experienced periods of both contango and backwardation. Frequently, whether contango or backwardation exists is a function, among other factors, of the seasonality of the soybean market and the soybean harvest cycle. All other things being equal, a situation involving prolonged periods of contango may adversely impact the returns of the Fund; conversely a situation involving prolonged periods of backwardation may positively impact the returns of the Fund.
| 31 |
| Table of Contents |
The price per bushel of soybeans in the United States is primarily a function of both U.S. and global production, as well as U.S. and global demand. The graph below shows the USDA published price per bushel by month for the period January 2007 to August 2022.
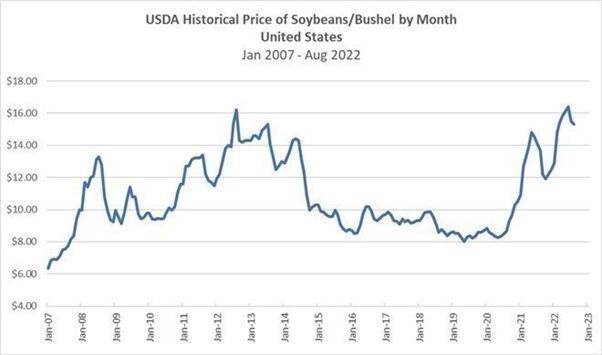
On October 12, 2022, the USDA released its monthly World Agricultural Supply and Demand Estimates (WASDE) for the Crop Year 2022-23. The exhibit below provides a summary of historical and current information for United States soybean production.
U.S. Soybean Supply/Demand Balance | ||||||||||||||
Marketing Year September - August | ||||||||||||||
Million Bushels | ||||||||||||||
Oct 12 Est. | 21-22 to | Oct 12 Est. | 22-23 to | |||||||||||
USDA | 20-21 | USDA | 21-22 | |||||||||||
Crop Year | 11-12 | 12-13 | 13-14 | 14-15 | 15-16 | 16-17 | 17-18 | 18-19 | 19-20 | 20-21 | 21-22 | % Change | 22-23 | % Change |
Planted Acres | 75.0 | 77.2 | 76.8 | 83.3 | 82.7 | 83.5 | 90.2 | 89.2 | 76.1 | 83.4 | 87.2 | 5% | 87.5 | 0% |
Harvested Acres | 73.8 | 76.1 | 76.3 | 82.6 | 81.7 | 82.7 | 89.5 | 87.6 | 74.9 | 82.6 | 86.3 | 4% | 86.6 | 0% |
Difference | 1.2 | 1.0 | 0.5 | 0.7 | 1.0 | 0.8 | 0.7 | 1.6 | 1.2 | 0.8 | 0.9 | 12% | 0.9 | 0% |
Yield | 41.9 | 40.0 | 44.0 | 47.5 | 48.0 | 51.9 | 49.3 | 50.6 | 47.4 | 51.0 | 51.7 | 1% | 49.8 | -4% |
Beginning Stocks | 215 | 169 | 141 | 92 | 191 | 197 | 302 | 438 | 909 | 525 | 257 | -51% | 274 | 7% |
Production | 3,094 | 3,042 | 3,358 | 3,927 | 3,926 | 4,296 | 4,412 | 4,428 | 3,552 | 4,216 | 4,465 | 6% | 4,313 | -3% |
Imports | 16 | 41 | 72 | 33 | 24 | 22 | 22 | 14 | 15 | 20 | 16 | -20% | 15 | -6% |
Total Supply | 3,325 | 3,252 | 3,570 | 4,052 | 4,140 | 4,516 | 4,735 | 4,880 | 4,476 | 4,761 | 4,738 | 0% | 4,602 | -3% |
Crushings | 1,703 | 1,689 | 1,734 | 1,873 | 1,886 | 1,901 | 2,055 | 2,092 | 2,165 | 2,141 | 2,204 | 3% | 2,235 | 1% |
Seed, Feed and Residual | 89 | 105 | 107 | 146 | 115 | 147 | 109 | 127 | 108 | 97 | 104 | 7% | 122 | 17% |
Exports | 1,365 | 1,317 | 1,638 | 1,842 | 1,942 | 2,166 | 2,134 | 1,752 | 1,679 | 2,266 | 2,158 | -5% | 2,045 | -5% |
Total Usage | 3,155 | 3,111 | 3,478 | 3,862 | 3,944 | 4,214 | 4,297 | 3,971 | 3,952 | 4,504 | 4,465 | -1% | 4,402 | -1% |
Ending Stocks (Inventory) | 169 | 141 | 92 | 191 | 197 | 302 | 438 | 909 | 525 | 257 | 274 | 7% | 200 | -27% |
Stocks/Use Ratio | 5.4% | 4.5% | 2.6% | 4.9% | 5.0% | 7.2% | 10.2% | 22.9% | 13.3% | 5.7% | 6% | 8% | 4.5% | -26% |
farm Price ($/bushel) | $ 12.50 | $ 14.40 | $ 13.00 | $ 10.10 | $ 8.95 | $ 9.47 | $9.33 | $8.48 | $8.57 | $10.80 | $13.30 | $14.00 | ||
Calculations: | ||||||||||||||
Demand per day (incld expt)¹ | 8.6 | 8.5 | 9.5 | 10.6 | 10.8 | 11.5 | 11.8 | 10.9 | 10.8 | 12.3 | 12.2 | -1% | 12.1 | -1% |
Carry-out days supply | 19.6 | 16.6 | 9.7 | 18.1 | 18.2 | 26.2 | 37.2 | 83.6 | 48.5 | 20.8 | 22.4 | 8% | 16.6 | -26% |
¹ in millions of bushels per day | ||||||||||||||
| 32 |
| Table of Contents |
The Sugar Market
Sugarcane accounts for nearly 80% of the world’s sugar production, while sugar beets account for the remainder of the world’s sugar production. Sugar manufacturers use sugar beets and sugarcane as the raw material from which refined sugar (sucrose) for industrial and consumer use is produced. Sugar is produced in various forms, including granulated, powdered, liquid, brown, and molasses. The food industry (in particular, producers of baked goods, beverages, cereal, confections, and dairy products) uses sugar and sugarcane molasses to make sugar-containing food products. Sugar beet pulp and molasses products are used as animal feed ingredients. Ethanol is an important by-product of sugarcane processing. Additionally, the material that is left over after sugarcane is processed is used to manufacture paper, cardboard, and “environmentally friendly” eating utensils.
As a general matter, the occurrence of a severe weather event, natural disaster, terrorist attack, geopolitical events, outbreak, or public health emergency as declared by the World Health Organization, the continuation or expansion of war or other hostilities, or a prolonged government shutdown may have significant adverse effects on the Fund and its investments and alter current assumptions and expectations. For example, in late February 2022, Russia invaded Ukraine, significantly amplifying existing geopolitical tensions among Russia and other countries in the region and in the west. The responses of countries and political bodies to Russia’s actions, the larger overarching tensions, and Ukraine’s military response and the potential for wider conflict may increase financial market volatility generally, have severe adverse effects on global economic markets, and cause volatility in the price of agricultural products, including agricultural futures, and the share price of the Fund.
The price per pound of sugar in the United States is primarily a function of both U.S. and global production and demand as well as expansive protectionist policies implemented by the US Government. Long term impacts from sanctions, shipping disruptions, collateral war damage, and a potential expansion of the conflict between Russia and Ukraine could further disrupt the availability of agricultural products and supplies. Russian production of sugar comes primarily from sugar beets. Ukraine’s sugar production is small and relatively inconsequential to global sugar markets. Now at question is the ability of farmers in both countries to plant this season’s sugar beet crop. Volatility, trading volumes, and prices in global sugar markets have risen dramatically and are expected to continue indefinitely at extreme elevated levels. Given all of the above factors, the Sponsor has no ability to discern when current high levels of volatility will subside.
Recent geopolitical events may have also impacted the level of “backwardation” experienced by the Fund. The Russian invasion and related developments may have placed upward pressure on the price of sugar and sugar futures contracts. As a result, near to expire contracts trade at a higher price than longer to expire contracts, a situation referred to as “backwardation.” Putting aside the impact of the overall movement in prices of sugar and sugar futures, the Benchmark Component Futures Contracts (the sugar futures contracts that the Fund invests in to achieve its investment objective) would tend to rise as they approach expiration. This backwardation may benefit the Fund because it will sell more expensive contracts and buy less expensive contracts on an ongoing basis. The degree of backwardation is also shown in the following table.
Conversely, in the event of a sugar futures market where near to expire contracts trade at a lower price than longer to expire contracts, a situation referred to as “contango,” then absent the impact of the overall movement in sugar prices the value of the Benchmark Component Futures Contracts would tend to decline as they approach expiration. If the prices of sugar and sugar futures were to decline, for example, because of a resolution of the Russia-Ukraine conflict, the Fund would experience the negative impact of contango.
The Sugar No. 11 Futures Contract is the world benchmark contract for raw sugar trading. This contract prices the physical delivery of raw cane sugar, delivered to the receiver’s vessel at a specified port within the country of origin of the sugar. Sugar No. 11 Futures Contracts trade on ICE Futures US and the NYMEX in units of 112,000 pounds.
The United States Department of Agriculture (“USDA”) publishes two major reports annually on U.S. domestic and worldwide sugar production and consumption. These are usually released in November and May. In addition, the USDA publishes periodic, but not as comprehensive, reports on sugar monthly. These reports are available on the USDA’s website, www.usda.gov, at no charge. The USDA’s May 2022 report for the 2022-23 Marketing year estimated global production of 182.9 MMT as higher production in Brazil, China, and Russia is expected to more than offset declines in India and Ukraine. Consumption is expected to rise due to growth in markets including China, India, and Russia. Stocks are forecast lower as the drop in India more than offsets higher exports from Brazil and Thailand. Exports are projected down as the drop in India more than offsets higher exports from Brazil and Thailand. Global sugar consumption may fluctuate year over year due to any number of reasons which may include, but is not limited to, economic conditions, global health concerns, international trade policy. Sugar is a staple commodity used pervasively across the globe so that any contractions in consumption may only be temporary as has historically been the case.
| 33 |
| Table of Contents |
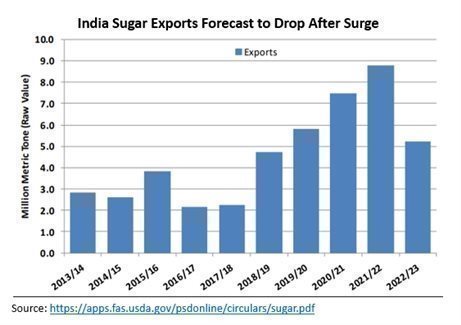
If the futures market is in a state of backwardation (i.e., when the price of sugar in the future is expected to be less than the current price), the Fund will buy later to expire contracts for a lower price than the sooner to expire contracts that it sells. Hypothetically, and assuming no changes to either prevailing sugar prices or the price relationship between immediate delivery, soon to expire contracts and later to expire contracts, the value of a contract will rise as it approaches expiration. If the futures market is in contango, the Fund will buy later to expire contracts for a higher price than the sooner to expire contracts that it sells. Hypothetically, and assuming no other changes to either prevailing sugar prices or the price relationship between the spot price, soon to expire contracts and later to expire contracts, the value of a contract will fall as it approaches expiration. Historically, the sugar futures markets have experienced periods of both contango and backwardation. Frequently, whether contango or backwardation exists is a function, among other factors, of the seasonality of the sugar market and the sugar harvest cycle. All other things being equal, a situation involving prolonged periods of contango may adversely impact the returns of the Funds; conversely a situation involving prolonged periods of backwardation may positively impact the returns of the Funds.
Futures contracts may be either bought or sold long or short. The U.S Commodity Futures Trading Commission weekly releases the “Commitment of Traders” (COT) report, which depicts the open interest as well as long and short positions in the market. Market participants may use this report to gauge market sentiment.
The Wheat Market
Wheat is used to produce flour, the key ingredient for breads, pasta, crackers, and many other food products, as well as several industrial products such as starches and adhesives. Wheat by-products are used in livestock feeds. Wheat is the principal food grain produced in the United States, and the United States’ output of wheat is typically exceeded only by that of China, the European Union, Russia, and India. The United States Department of Agriculture (“USDA”) estimates that for 2022-23, the principal global producers of wheat will be the EU, Russia, Ukraine, China, India, the United States, Australia, and Canada. The U.S. generates approximately 6% of global production, with approximately 6% of that being exported. For 2022-23, based on the October 12, 2022 USDA report, global consumption of 790 MMT is estimated to be slightly higher than production of 782 MMT. If the global demand of wheat is not equal to global supply, this may have an impact on the price of wheat. Global wheat consumption may fluctuate year over year due to any number of reasons which may include, but is not limited to, economic conditions, global health concerns, international trade policy. Wheat is a staple commodity used pervasively across the globe so that any contractions in consumption may only be temporary as has historically been the case. The USDA publishes weekly, monthly, quarterly, and annual updates for U.S. domestic and worldwide wheat production and consumption. These reports are available on the USDA’s website, www.usda.gov, at no charge. The outlook provided herein is from the October 12, 2022 USDA report.
As a general matter, the occurrence of a severe weather event, natural disaster, terrorist attack, geopolitical events, outbreak, or public health emergency as declared by the World Health Organization, the continuation or expansion of war or other hostilities, or a prolonged government shutdown may have significant adverse effects on the Fund and its investments and alter current assumptions and expectations. For example, in late February 2022, Russia invaded Ukraine, significantly amplifying already existing geopolitical tensions among Russia and other countries in the region and in the west. The responses of countries and political bodies to Russia’s actions, the larger overarching tensions, Ukraine’s military response may increase financial market volatility. The results can have severe adverse effects on global economic markets, and cause volatility in the price of wheat, wheat futures and the share price of the Fund.
| 34 |
| Table of Contents |
The price per bushel of wheat in the United States is primarily a function of both U.S. and global wheat production and demand. Russia and Ukraine, historically, have constituted the top export supply of wheat by volume (approximately 30 percent of total global wheat exports) to the world. The escalating conflict between the two countries, including but not limited to, sanctions, shipping disruptions, and collateral war damage could further disrupt the availability of wheat supplies. The conflict has greatly impacted exports of the wheat crop that was harvested last season and is currently in storage. In addition, the ability of farmers in both countries to plant fall crops could be greatly impacted. As such, volatility, trading volumes, and prices in global wheat markets have risen dramatically and are expected to continue indefinitely at extreme elevated levels. Given all of the above factors, the Sponsor has no ability to discern when current high levels of volatility will subside.
Recent geopolitical events have also impacted the level of “backwardation” experienced by the Fund. The Russian invasion and related developments have placed upward pressure on the price of wheat and wheat futures contracts. As a result, near to expire contracts trade at a higher price than longer to expire contracts, a situation referred to as “backwardation.” Putting aside the impact of the overall movement in prices of wheat and wheat futures, the Benchmark Component Futures Contracts (the wheat futures contracts that the Fund invests in to achieve its investment objective) would tend to rise as they approach expiration. This backwardation may benefit the Fund because it will sell more expensive contracts and buy less expensive contracts on an ongoing basis. The degree of backwardation is also shown in the following table.
Conversely, in the event of a wheat futures market where near to expire contracts trade at a lower price than longer to expire contracts, a situation referred to as “contango,” then absent the impact of the overall movement in wheat prices the value of the Benchmark Component Futures Contracts would tend to decline as they approach expiration. If the prices of wheat and wheat futures were to decline, for example, because of a resolution of the Russia-Ukraine conflict, the Fund would experience the negative impact of contango.
There are several types of wheat grown in the U.S., which are classified in terms of color, hardness, and growing season. CBOT Wheat Futures Contracts call for delivery of #2 soft red winter wheat, which is generally grown in the eastern third of the United States, but other types and grades of wheat may also be delivered (Grade #1 soft red winter wheat, Hard Red Winter, Dark Northern Spring and Northern Spring wheat may be delivered at 3 cents premium per bushel over the contract price and #2 soft red winter wheat, Hard Red Winter, Dark Northern Spring and Northern Spring wheat may be delivered at the contract price.) Winter wheat is planted in the fall and is harvested in the late spring or early summer of the following year, while spring wheat is planted in the spring and harvested in late summer or fall of the same year. Standard Wheat Futures Contracts trade on the CBOT in units of 5,000 bushels. There are five months each year in which CBOT Wheat Futures Contracts expire: March, May, July, September, and December.
If the futures market is in a state of backwardation (i.e., when the price of wheat in the future is expected to be less than the current price), the Fund will buy later to expire contracts for a lower price than the sooner to expire contracts that it sells. Hypothetically, and assuming no changes to either prevailing wheat prices or the price relationship between immediate delivery, soon to expire contracts and later to expire contracts, the value of a contract will rise as it approaches expiration. If the futures market is in contango, the Fund will buy later to expire contracts for a higher price than the sooner to expire contracts that it sells. Hypothetically, and assuming no other changes to either prevailing wheat prices or the price relationship between the spot price, soon to expire contracts and later to expire contracts, the value of a contract will fall as it approaches expiration. Historically, the wheat futures markets have experienced periods of both contango and backwardation. Frequently, whether contango or backwardation exists is a function, among other factors, of the seasonality of the wheat market and the wheat harvest cycle. All other things being equal, a situation involving prolonged periods of contango may adversely impact the returns of the Fund; conversely a situation involving prolonged periods of backwardation may positively impact the returns of the Fund.
Futures contracts may be either bought or sold, long or short. The U.S Commodity Futures Trading Commission weekly releases the “Commitment of Traders” (COT) report, which depicts the open interest as well as long and short positions in the market. Market participants may use this report to gauge market sentiment.
| 35 |
| Table of Contents |
The price per bushel of wheat in the United States is primarily a function of both U.S. and global production, as well as U.S. and global demand. The graph below shows the USDA published price per bushel by month for the period January 2007 to August 2022.
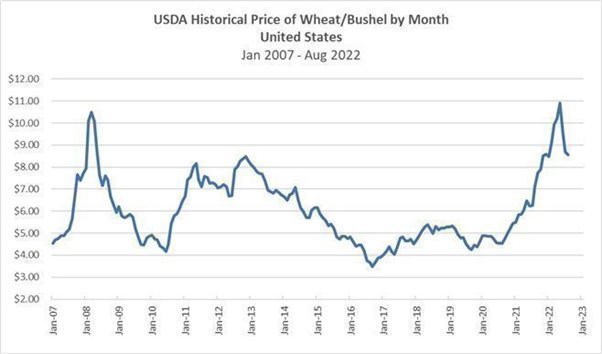
On October 12, 2022, the USDA released its monthly World Agricultural Supply and Demand Estimates (WASDE) for the Crop Year 2022-23. The exhibit below provides a summary of historical and current information for United States wheat production.
U.S. Wheat Supply/Demand Balance | ||||||||||||||
Marketing Year June - May | ||||||||||||||
Million Bushels | ||||||||||||||
|
|
|
|
|
|
|
|
|
|
| Oct 12 Est. | 21-22 to | Oct 12 Est. | 22-23 to |
|
|
|
|
|
|
|
|
|
|
| USDA | 20-21 | USDA | 21-22 |
Crop Year | 11-12 | 12-13 | 13-14 | 14-15 | 15-16 | 16-17 | 17-18 | 18-19 | 19-20 | 20-21 | 21-22 | % Change | 22-23 | % Change |
Planted Acres | 54.4 | 55.3 | 56.2 | 56.8 | 55.0 | 50.1 | 46.1 | 47.8 | 45.5 | 44.5 | 46.7 | 5% | 45.7 | -2% |
Harvested Acres | 45.7 | 48.8 | 45.3 | 46.4 | 47.3 | 43.8 | 37.6 | 39.6 | 37.4 | 36.8 | 37.1 | 1% | 35.5 | -4% |
Difference | 8.7 | 6.5 | 10.9 | 10.4 | 7.7 | 6.3 | 8.5 | 8.2 | 8.1 | 7.7 | 9.6 | 25% | 10.2 | 6% |
Yield | 43.7 | 46.2 | 47.1 | 43.7 | 43.6 | 52.7 | 46.4 | 47.6 | 51.7 | 49.7 | 44.3 | -11% | 46.5 | 5% |
|
|
|
|
|
|
|
|
|
|
|
|
|
|
|
Beginning Stocks | 862 | 743 | 718 | 590 | 752 | 976 | 1,181 | 1,099 | 1,080 | 1,028 | 845 | -18% | 669 | -21% |
Production | 1,999 | 2,252 | 2,135 | 2,026 | 2,062 | 2,309 | 1,741 | 1,885 | 1,932 | 1,828 | 1,646 | -10% | 1,650 | 0% |
Imports | 112 | 123 | 173 | 151 | 113 | 118 | 158 | 135 | 104 | 100 | 95 | -5% | 120 | 26% |
Total Supply | 2,974 | 3,118 | 3,026 | 2,768 | 2,927 | 3,402 | 3,080 | 3,119 | 3,116 | 2,956 | 2,587 | -12% | 2,439 | -6% |
|
|
|
|
|
|
|
|
|
|
|
|
|
|
|
Food | 941 | 951 | 955 | 958 | 957 | 949 | 964 | 954 | 962 | 961 | 972 | 1% | 970 | 0% |
Seed | 76 | 73 | 77 | 79 | 67 | 61 | 63 | 59 | 62 | 64 | 60 | -6% | 68 | 13% |
Feed and residual | 164 | 364 | 228 | 114 | 149 | 160 | 47 | 88 | 95 | 93 | 86 | -8% | 50 | -42% |
Exports | 1,050 | 1,012 | 1,176 | 864 | 778 | 1,051 | 906 | 937 | 969 | 994 | 800 | -20% | 775 | -3% |
Total Usage | 2,231 | 2,400 | 2,436 | 2,015 | 1,951 | 2,222 | 1,981 | 2,039 | 2,087 | 2,111 | 1,917 | -9% | 1,863 | -3% |
|
|
|
|
|
|
|
|
|
|
|
|
|
|
|
Ending Stocks (Inventory) | 743 | 718 | 590 | 752 | 976 | 1,181 | 1,099 | 1,080 | 1,028 | 845 | 669 | -21% | 576 | -14% |
|
|
|
|
|
|
|
|
|
|
|
|
|
|
|
Stocks/Use Ratio | 33.3% | 29.7% | 24.2% | 37.3% | 50.0% | 53.2% | 55.5% | 53.0% | 49.3% | 40.0% | 34.9% | -13% | 30.9% | -11% |
farm Price ($/bushel) | $ 7.24 | $ 7.77 | $ 6.87 | $ 5.99 | $ 4.89 | $ 3.89 | $4.72 | $5.16 | $4.58 | $5.05 | $7.63 |
| $9.20 |
|
|
|
|
|
|
|
|
|
|
|
|
|
|
|
|
Calculations: |
|
|
|
|
|
|
|
|
|
|
|
|
|
|
Demand per day (incld expt)¹ | 6.1 | 6.6 | 6.7 | 5.5 | 5.3 | 6.1 | 5.4 | 5.6 | 5.7 | 5.8 | 5.3 | -9% | 5.1 | -3% |
Carry-out days supply | 121.6 | 108.6 | 88.4 | 136.2 | 182.6 | 194.0 | 202.5 | 193.3 | 179.8 | 146.1 | 127.4 | -13% | 112.9 | -11% |
¹ in millions of bushels per day |
|
|
|
|
|
|
|
|
|
|
|
|
|
|
The Bitcoin Industry
Bitcoin
Bitcoin is a digital asset that serves as the unit of account on an open-source, decentralized, peer-to-peer computer network. Bitcoin may be used to pay for goods and services, stored for future use, or converted to a fiat currency. As of the date of this update, the adoption of bitcoin for these purposes has been limited. The value of bitcoin is not backed by any government, corporation, or other identified body.
| 36 |
| Table of Contents |
The value of bitcoin is determined in part by the supply of (which is limited), and demand for, bitcoin in the markets for exchange that have been organized to facilitate the trading of bitcoin. By design, the supply of bitcoin is limited to 21 million bitcoins. As of the date of this update, there are approximately 19 million bitcoins in circulation.
Bitcoin is maintained on the decentralized, open source, peer-to-peer computer network (the “Bitcoin Network”). No single entity owns or operates the Bitcoin Network. The Bitcoin Network is accessed through software and governs bitcoin’s creation and movement. The source code for the Bitcoin Network, often referred to as the Bitcoin Protocol, is open-source, and anyone can contribute to its development.
Price movements for bitcoin are influenced by, among other things, the environment, natural or man-made disasters, governmental oversight and regulation, demographics, economic conditions, infrastructure limitations, existing and future technological developments, and a variety of other factors now known and unknown, any and all of which can have an impact on the supply, demand, and price fluctuations in the bitcoin markets. More generally, cryptocurrency prices may be influenced by economic and monetary events such as changes in interest rates, changes in balances of payments and trade, U.S. and international inflation rates, currency valuations and devaluations, U.S. and international economic events, and changes in the philosophies and emotions of market purchasers. Because the Fund invests in futures contracts in a single cryptocurrency, it is not a diversified investment vehicle, and therefore may be subject to greater volatility than a diversified portfolio of stocks or bonds or a more diversified commodity or cryptocurrency pool.
The Bitcoin Network
The infrastructure of the Bitcoin Network is collectively maintained by participants in the Bitcoin Network, which include miners, developers, and users. Miners validate transactions and are currently compensated for that service in bitcoin. Developers maintain and contribute updates to the Bitcoin Network’s source code, often referred to as the Bitcoin Protocol. Users access the Bitcoin Network using open-source software. Anyone can be a user, developer, or miner.
Bitcoin is “stored” on a digital transaction ledger commonly known as a “blockchain.” A blockchain is a type of shared and continually reconciled database, stored in a decentralized manner on the computers of certain users of the digital asset and is protected by cryptography. The Bitcoin Blockchain contains a record and history for each bitcoin transaction.
New bitcoin is created by “mining.” Miners use specialized computer software and hardware to solve a highly complex mathematical problem presented by the Bitcoin Protocol. The first miner to successfully solve the problem is permitted to add a block of transactions to the Bitcoin Blockchain. The new block is then confirmed through acceptance by a majority of users who maintain versions of the blockchain on their individual computers. Miners that successfully add a block to the Bitcoin Blockchain are automatically rewarded with a fixed amount of bitcoin for their effort plus any transaction fees paid by transferors whose transactions are recorded in the block. This reward system is the means by which new bitcoin enter circulation and is the mechanism by which versions of the blockchain held by users on a decentralized network are kept in consensus.
The Bitcoin Protocol
The Bitcoin Protocol is an open source project with no official company or group in control. Anyone can review the underlying code and suggest changes. There are, however, a number of individual developers that regularly contribute to a specific distribution of bitcoin software known as the “Bitcoin Core.” Developers of the Bitcoin Core loosely oversee the development of the source code. There are many other compatible versions of the bitcoin software, but Bitcoin Core is the most widely adopted and currently provides the de facto standard for the Bitcoin Protocol. The core developers are able to access, and can alter, the Bitcoin Network source code and, as a result, they are responsible for quasi-official releases of updates and other changes to the Bitcoin Network’s source code.
However, because bitcoin has no central authority, the release of updates to the Bitcoin Network’s source code by the core developers does not guarantee that the updates will be automatically adopted by the other purchasers. Users and miners must accept any changes made to the source code by downloading the proposed modification and that modification is effective only with respect to those bitcoin users and miners who choose to download it. As a practical matter, a modification to the source code becomes part of the Bitcoin Network only if it is accepted by participants that collectively have a majority of the processing power on the Bitcoin Network. If a modification is accepted by only a percentage of users and miners, a division will occur such that one network will run the pre-modification source code and the other network will run the modified source code. Such a division is known as a “fork.”
Calculating the Net Asset Value
The NAV of each Fund is calculated by:
| • | taking the current market value of its total assets, and |
| • | subtracting any liabilities. |
The Administrator calculates the NAV of the Fund once each trading day. It calculates NAV as of the earlier of the close of the New York Stock Exchange or 4:00 p.m. (ET). The NAV for a particular trading day is released after 4:15 p.m. (ET).
| 37 |
| Table of Contents |
In determining the value of the Futures Contracts for each Fund, the Administrator uses the closing price on the exchange on which the commodity or cryptocurrency is traded, commonly referred to as the settlement price. The time of settlement for each exchange is determined by that exchange and may change from time to time. The current settlement time for each exchange can be found at the respective website for the CBOT, CME, or ICE, as the case may be, as follows:
1) for the CBOT (CORN, SOYB and WEAT) http://www.cmegroup.com/trading_hours/commodities-hours.html;
2) for ICE (CANE) http://www.theice.com/productguide/Search.shtml?tradingHours=.
3) for the CME (DEFI) https://www.cmegroup.com/trading-hours.html
The Administrator determines the value of all other investments for each Fund as of the earlier of the close of the New York Stock Exchange or 4:00 p.m., (ET), in accordance with the current Services Agreement between the Administrator and the Trust.
The value of over-the-counter Commodity Interests will be determined based on the value of the commodity or Futures Contract underlying such Commodity Interest, except that a fair value may be determined if the Sponsor believes that a Fund is subject to significant credit risk relating to the counterparty to such Commodity Interest. For purposes of financial statements and reports, the Sponsor will recalculate the NAV of a specific Fund where necessary to reflect the “fair value” of a Futures Contract when the Futures Contract of such Fund closes at its price fluctuation limit for the day. Treasury Securities held by the Fund are valued by the Administrator using values received from recognized third-party vendors (such as Reuters) and dealer quotes. The NAV includes any unrealized profit or loss on open Commodity Interests and any other credit or debit accruing to each Fund but unpaid or not received by the Fund.
In addition, in order to provide updated information relating to the Funds for use by investors and market professionals, ICE Data Indices, LLC calculates and disseminates throughout the trading day an updated indicative fund value for each Fund. The indicative fund value is calculated by using the prior day’s closing NAV per share of the Fund as a base and updating that value throughout the trading day to reflect changes in the value of the Fund’s Commodity or Cryptocurrency Interests during the trading day. Changes in the value of short-term Treasury Securities and cash equivalents will not be included in the calculation of indicative value throughout the day. For this and other reasons, the indicative fund value disseminated during NYSE Arca trading hours should not be viewed as an actual real time update of the NAV for each Fund. The NAV is calculated only once at the end of each trading day.
The indicative fund value is disseminated on a per Share basis every 15 seconds during regular NYSE Arca trading hours of 9:30 a.m., (ET), to 4:00 p.m., (ET). The CBOT, CME, and ICE are generally open for trading only during specified hours which vary by exchange and may be adjusted by the exchange. However, the futures markets on these exchanges do not currently operate twenty-four hours per day. In addition, there may be some trading hours which may be limited to electronic trading only. This means that there is a gap in time at the beginning and the end of each day during which the Fund’s Shares are traded on the NYSE Arca, when, for example, real-time CBOT trading prices for Corn Futures Contracts traded on such Exchange are not available. As a result, during those gaps there will be no update to the indicative fund values. The most current trading hours for each exchange may be found on the website of that exchange as listed above.
ICE Data Indices, LLC disseminates the intraday indicative value (also referred to in this report as "approximate net asset value") of the Fund's Shares through the facilities of Consolidated Tape Association's Consolidated Quotation High Speed Lines (also known as the "CTA/QC High Speed Lines"). ICE Data Indices, LLC will make the Benchmark information available through online information services, such as Yahoo Finance, Bloomberg and Reuters.
Dissemination of the indicative fund value provides additional information that is not otherwise available to the public and is useful to investors and market professionals in connection with the trading of Fund Shares on the NYSE Arca. Investors and market professionals are able throughout the trading day to compare the market price of the Fund and the indicative fund value. If the market price of Fund Shares diverges significantly from the indicative fund value, market professionals may have an incentive to execute arbitrage trades. For example, if the Fund appears to be trading at a discount compared to the indicative fund value, a market professional could buy Fund Shares on the NYSE Arca, aggregate them into Redemption Baskets, and receive the NAV of such Shares by redeeming them to the Trust, provided that there is not a minimum number of shares outstanding for the Fund. Such arbitrage trades can tighten the tracking between the market price of the Fund and the indicative fund value.
| 38 |
| Table of Contents |
Critical Accounting Policies
The Trust’s critical accounting policies for all the Funds are as follows:
1. | Preparation of the financial statements and related disclosures in conformity with U.S. generally accepted accounting principles (“GAAP”) requires the application of appropriate accounting rules and guidance, as well as the use of estimates, and requires management to make estimates and assumptions that affect the reported amounts of assets and liabilities, revenue and expense and related disclosure of contingent assets and liabilities during the reporting period of the combined financial statements and accompanying notes. The Trust’s application of these policies involves judgments and actual results may differ from the estimates used. |
|
|
2. | The Sponsor has determined that the valuation of commodity or cryptocurrency interests that are not traded on a U.S. or internationally recognized futures exchange (such as swaps and other over the counter contracts) involves a critical accounting policy. The values which are used by the Funds for futures contracts will be provided by the broker who will use market prices when available, while over the counter contracts will be valued based on the present value of estimated future cash flows that would be received from or paid to a third party in settlement of these derivative contracts prior to their delivery date. Values will be determined on a daily basis. |
|
|
3. | Commodity or cryptocurrency futures contracts held by the Funds are recorded on the trade date. All such transactions are recorded on the identified cost basis and marked to market daily. Unrealized appreciation or depreciation on commodity or cryptocurrency futures contracts are reflected in the statement of operations as the difference between the original contract amount and the fair market value as of the last business day of the year or as of the last date of the financial statements. Changes in the appreciation or depreciation between periods are reflected in the statement of operations. Interest on cash equivalents and deposits are recognized on the accrual basis. The Funds earn interest on funds held at the custodian or other financial institutions at prevailing market rates for such investments. |
4. | Cash and cash equivalents are cash held at financial institutions in demand-deposit accounts or highly liquid investments with original maturity dates of three months or less at inception. The Funds report cash equivalents in the statements of assets and liabilities at market value, or at carrying amounts that approximate fair value, because of their highly liquid nature and short-term maturities. The Funds have a substantial portion of assets on deposit with banks. Assets deposited with financial institutions may, at times, exceed federally insured limits. |
5. | The use of fair value to measure financial instruments, with related unrealized gains or losses recognized in earnings in each period is fundamental to the Trust’s financial statements. In accordance with GAAP, fair value is defined as the price that would be received to sell an asset or paid to transfer a liability (i.e., the “exit price”) in an orderly transaction between market participants at the measurement date.
In determining fair value, the Trust uses various valuation approaches. In accordance with GAAP, a fair value hierarchy for inputs is used in measuring fair value that maximizes the use of observable inputs and minimizes the use of unobservable inputs by requiring that the most observable inputs be used when available. Observable inputs are those that market participants would use in pricing the asset or liability based on market data obtained from sources independent of the Trust. Unobservable inputs reflect the Trust’s assumptions about the inputs market participants would use in pricing the asset or liability developed based on the best information available in the circumstances. The fair value hierarchy is categorized into three levels: a) Level 1 - Valuations based on unadjusted quoted prices in active markets for identical assets or liabilities that the Trust has the ability to access. Valuation adjustments and block discounts are not applied to Level 1 securities and financial instruments. Since valuations are based on quoted prices that are readily and regularly available in an active market, valuation of these securities and financial instruments does not entail a significant degree of judgment, b) Level 2 - Valuations based on quoted prices in markets that are not active or for which all significant inputs are observable, either directly or indirectly, and c) Level 3 - Valuations based on inputs that are unobservable and significant to the overall fair value measurement. See the notes within the financial statements for further information.
The Funds and the Trust record their derivative activities at fair value. Gains and losses from derivative contracts are included in the statement of operations. Derivative contracts include futures contracts related to commodity or cryptocurrency prices. Futures, which are listed on a national securities exchange, such as the CBOT, ICE, or CME, or reported on another national market, are generally categorized in Level 1 of the fair value hierarchy. OTC derivatives contracts (such as forward and swap contracts) which may be valued using models, depending on whether significant inputs are observable or unobservable, are categorized in Levels 2 or 3 of the fair value hierarchy. |
6. | The Funds recognize brokerage commissions on a full trade basis. |
| 39 |
| Table of Contents |
7. | Margin is the minimum amount of funds that must be deposited by a commodity or cryptocurrency interest trader with the trader’s broker to initiate and maintain an open position in futures contracts. A margin deposit acts to assure the trader’s performance of the futures contracts purchased or sold. Futures contracts are customarily bought and sold on initial margin that represents a very small percentage of the aggregate purchase or sales price of the contract. Because of such low margin requirements, price fluctuations occurring in the futures markets may create profits and losses that, in relation to the amount invested, are greater than customary in other forms of investment or speculation. As discussed below, adverse price changes in the futures contract may result in margin requirements that greatly exceed the initial margin. In addition, the amount of margin required in connection with a particular futures contract may be modified from time to time by the exchange during the term of the contract. Brokerage firms, such as the Funds’ clearing brokers, carrying accounts for traders in commodity or cryptocurrency interest contracts generally require higher amounts of margin as a matter of policy to further protect themselves. Over the counter trading generally involves the extension of credit between counterparties, so the counterparties may agree to require the posting of collateral by one or both parties to address credit exposure.
When a trader purchases an option, there is no margin requirement; however, the option premium must be paid in full. When a trader sells an option, on the other hand, he or she is required to deposit margin in an amount determined by the margin requirements established for the underlying interest and, in addition, an amount substantially equal to the current premium for the option. The margin requirements imposed on the selling of options, although adjusted to reflect the probability that out of the money options will not be exercised, can in fact be higher than those imposed in dealing in the futures markets directly. Complicated margin requirements apply to spreads and conversions, which are complex trading strategies in which a trader acquires a mixture of options positions and positions in the underlying interest.
Ongoing or “maintenance” margin requirements are computed each day by a trader’s clearing broker. When the market value of a particular open futures contract changes to a point where the margin on deposit does not satisfy maintenance margin requirements, a margin call is made by the broker. If the margin call is not met within a reasonable time, the broker may close out the trader’s position. With respect to the Funds’ trading, the Funds (and not its shareholders personally) are subject to margin calls.
Finally, many major U.S. exchanges have passed certain cross margining arrangements involving procedures pursuant to which the futures and options positions held in an account would, in the case of some accounts, be aggregated, and margin requirements would be assessed on a portfolio basis, measuring the total risk of the combined positions. |
8. | Due from/to broker for investments in financial instruments are securities transactions pending settlement. The Trust and TAGS are subject to credit risk to the extent any broker with whom it conducts business is unable to fulfill contractual obligations on its behalf. The management of the Trust and the Funds monitors the financial condition of such brokers and does not anticipate any losses from these counterparties. The principal broker through which the Trust and TAGS has the ability to clear securities transactions for TAGS is U.S. Bank N.A.
|
9. | The Sponsor is responsible for investing the assets of the Funds in accordance with the objectives and policies of each Fund.
CORN, SOYB, CANE, WEAT, and TAGS pays for all brokerage fees, taxes, and other expenses, including licensing fees for the use of intellectual property, registration or other fees paid to the SEC, FINRA, formally the National Association of Securities Dealers, or any other regulatory agency in connection with the offer and sale of subsequent Shares after its initial registration and all legal, accounting, printing and other expenses associated therewith. The Fund also pays its portion of the fees and expenses for services directly attributable to the Fund such as accounting, financial reporting, regulatory compliance, and trading activities, which the Sponsor elected not to outsource. Certain aggregate expenses common to all Teucrium Funds within the Trust are allocated by the Sponsor to the respective Funds based on activity drivers deemed most appropriate by the Sponsor for such expenses, including but not limited to relative assets under management and creation order activity. These aggregate common expenses include, but are not limited to, legal, auditing, accounting and financial reporting, tax-preparation, regulatory compliance, trading activities, and insurance costs, as well as fees paid to the Distributor. A portion of these aggregate common expenses are related to the Sponsor or related parties of principals of the Sponsor; these are necessary services to the Teucrium Funds, which are primarily the cost of performing certain accounting and financial reporting, regulatory compliance, and trading activities that are directly attributable to the Fund and are included, primarily, in distribution and marketing fees. In addition, the Agricultural Funds, except for TAGS which has no such fee, are contractually obligated to pay a monthly management fee to the Sponsor, based on average daily net assets, at a rate equal to 1.00% per annum.
DEFI is contractually obligated to pay a monthly management fee to the Sponsor, based on average daily net assets, at a rate equal to 0.94% per annum. From the Management Fee, the Sponsor pays all of the routine operational, administrative and other ordinary expenses of each Fund, generally as determined by the Sponsor, including but not limited to, fees and expenses of the Administrator, Custodian, Distributor, Transfer Agent, licensors, accounting and audit fees and expenses, tax preparation expenses, legal fees, ongoing SEC registration fees, individual Schedule K-1 preparation and mailing fees, and report preparation and mailing expenses. These fees and expenses are not included in the breakeven table because they are paid for by the Sponsor through the proceeds from the Management Fee. The Fund pays all of its non-recurring and unusual fees and expenses, if any, as determined by the Sponsor. Non-recurring and unusual fees and expenses are unexpected or unusual in nature, such as legal claims and liabilities and litigation costs or indemnification or other unanticipated expenses. Extraordinary fees and expenses also include material expenses which are not currently anticipated obligations of the Fund. Routine operational, administrative and other ordinary expenses are not deemed extraordinary expenses. |
| 40 |
| Table of Contents |
10. | The investment objective of TAGS is to have the daily changes in percentage terms of the Net Asset Value (“NAV”) of its common units (“Shares”) reflect the daily changes in percentage terms of a weighted average (the “Underlying Fund Average”) of the NAVs per share of four other commodity pools that are series of the Trust and are sponsored by the Sponsor: the Teucrium Corn Fund, the Teucrium Wheat Fund, the Teucrium Soybean Fund and the Teucrium Sugar Fund (collectively, the “Underlying Funds”). The Underlying Fund Average will have a weighting of 25% to each Underlying Fund, and the Fund’s assets will be rebalanced, generally on a daily basis, to maintain the approximate 25% allocation to each Underlying Fund. As such, TAGS will buy, sell, and hold as part of its normal operations shares of the four Underlying Funds. The Trust excludes the shares of the other series of the Trust owned by the Teucrium Agricultural Fund from its statements of assets and liabilities. The Trust excludes the net change in unrealized appreciation or depreciation on securities owned by the Teucrium Agricultural Fund from its statements of operations. Upon the sale of the Underlying Funds by the Teucrium Agricultural Fund, the Trust includes any realized gain or loss in its statements of operations. |
11. | For U.S. federal income tax purposes, the Funds will be treated as partnerships. Therefore, the Funds do not record a provision for income taxes because the partners report their share of a Fund’s income or loss on their income tax returns. The financial statements reflect the Funds’ transactions without adjustment, if any, required for income tax purposes. |
12. | For commercial paper, the Agricultural Commodity Funds use the effective interest method for calculating the actual interest rate in a period based on the amount of a financial instrument’s book value at the beginning of the accounting period. Accretion on these investments is recognized using the effective interest method in U.S. dollars and recognized in cash equivalents. All discounts on purchase prices of debt securities are accreted over the life of the respective security. |
Credit Risk
When any of the Funds enter into Commodity or Cryptocurrency Interests, it will be exposed to the credit risk that the counterparty will not be able to meet its obligations. For purposes of credit risk, the counterparty for the Futures Contracts traded on the CBOT, ICE, and CME is the clearinghouse associated with those exchanges. In general, clearinghouses are backed by their members who may be required to share in the financial burden resulting from the nonperformance of one of their members, which should significantly reduce credit risk. Some foreign exchanges are not backed by their clearinghouse members but may be backed by a consortium of banks or other financial institutions. Unlike in the case of exchange traded futures contracts, the counterparty to an over-the-counter Commodity Interest contract is generally a single bank or other financial institution. As a result, there will be greater counterparty credit risk in over-the-counter transactions. There can be no assurance that any counterparty, clearinghouse, or their financial backers will satisfy their obligations to any of the Funds.
The Commodity Funds may engage in off exchange transactions broadly called an “exchange for risk” transaction, also referred to as an “exchange for swap.” For purposes of the Dodd-Frank Act and related CFTC rules, an “exchange for risk” transaction is treated as a “swap.” An “exchange for risk” transaction, sometimes referred to as an “exchange for swap” or “exchange of futures for risk,” is a privately negotiated and simultaneous exchange of a futures contract position for a swap or other over the counter instrument on the corresponding commodity. An exchange for risk transaction can be used by the Commodity Funds as a technique to avoid taking physical delivery of a commodity futures contract, corn for example, in that a counterparty will take the Fund’s position in a Corn Futures Contract into its own account in exchange for a swap that does not by its terms call for physical delivery. The Funds will become subject to the credit risk of a counterparty when it acquires an over-the-counter position in an exchange for risk transaction. The Fund may use an “exchange for risk” transaction in connection with the creation and redemption of shares. These transactions must be carried out only in accordance with the rules of the applicable exchange where the futures contracts trade.
The Sponsor will attempt to manage the credit risk of each Fund by following certain trading limitations and policies. In particular, each Fund intends to post margin and collateral and/or hold liquid assets that will be equal to approximately the face amount of the Interests it holds. The Sponsor will implement procedures that will include, but will not be limited to, executing, and clearing trades and entering into over-the-counter transactions only with parties it deems creditworthy and/or requiring the posting of collateral by such parties for the benefit of each Fund to limit its credit exposure.
| 41 |
| Table of Contents |
The CEA requires all FCMs, such as the Teucrium Funds’ clearing brokers, to meet and maintain specified fitness and financial requirements, to segregate customer funds from proprietary funds and account separately for all customers’ funds and positions, and to maintain specified books and records open to inspection by the staff of the CFTC. The CFTC has similar authority over introducing brokers, or persons who solicit or accept orders for commodity interest trades but who do not accept margin deposits for the execution of trades. The CEA authorizes the CFTC to regulate trading by FCMs and by their officers and directors, permits the CFTC to require action by exchanges in the event of market emergencies, and establishes an administrative procedure under which customers may institute complaints for damages arising from alleged violations of the CEA. The CEA also gives the states powers to enforce its provisions and the regulations of the CFTC.
On November 14, 2013, the CFTC published final regulations that require enhanced customer protections, risk management programs, internal monitoring and controls, capital and liquidity standards, customer disclosures and auditing and examination programs for FCMs. The rules are intended to afford greater assurances to market participants that customer segregated funds and secured amounts are protected, customers are provided with appropriate notice of the risks of futures trading and of the FCMs with which they may choose to do business, FCMs are monitoring and managing risks in a robust manner, the capital and liquidity of FCMs are strengthened to safeguard the continued operations and the auditing and examination programs of the CFTC and the SROs are monitoring the activities of FCMs in a thorough manner.
E D & F Man Capital Markets Inc. (“E D & F Man”), StoneX Financial Inc. - FCM Division of INTL FCStone Financial Inc. (‘StoneX”) and Phillip Capital Inc. (“Phillip Capital”) are the Funds’ FCMs and the clearing brokers to execute and clear the Funds’ futures and provide other brokerage-related services. There are accounts for CORN, SOYB, CANE, and WEAT at E D & F Man; there are accounts for CORN, SOYB, CANE, WEAT, TILL, and DEFI at StoneX; and there is an account for DEFI at Phillip Capital.
The Commodity Funds, other than TAGS, will generally retain cash positions of approximately 95% of total net assets and DEFI will retain approximately 70%; this balance represents the total net assets less the initial margin requirements held by the FCM. These cash assets are either: 1) deposited by the Sponsor in demand deposit accounts of financial institutions which are deemed by the Sponsor to be of investment level quality, 2) held in a money-market fund which is deemed to be a cash equivalent under the most recent SEC definition, or 3) held in a cash equivalent with a maturity of 90 days or less that is deemed by the Sponsor to be of investment level quality.
Liquidity and Capital Resources
The Funds do not anticipate making use of borrowings or other lines of credit to meet their obligations. The Funds meet their liquidity needs in the normal course of business from the proceeds of the sale of their investments from the cash and cash equivalents that they intend to hold, and/or from the fee waivers provided by the Sponsor. The Funds’ liquidity needs include redeeming their shares, providing margin deposits for existing Futures Contracts or the purchase of additional Futures Contracts, posting collateral for over-the-counter Commodity Interests, and paying expenses.
The Funds generate cash primarily from (i) the sale of Creation Baskets and (ii) interest earned on cash and cash equivalents. Generally, all of the net assets of the Funds are allocated to trading in Commodity or Cryptocurrency Interests. Most of the assets of the Funds are held in cash and/or cash equivalents. The percentage that such assets bear to the total net assets will vary from period to period as the market values of the Commodity or Cryptocurrency Interests change. Interest earned on interest-bearing assets of a Fund are paid to that Fund. During times of extreme market volatility and economic uncertainty, the Funds may experience a significant change in interest rates, and as such the Funds may experience a change in the breakeven point.
The investments of a Fund in Commodity or Cryptocurrency Interests are subject to periods of illiquidity because of market conditions, regulatory considerations, and other reasons. For example, U.S. futures exchanges limit the fluctuations in the prices of certain Futures Contracts during a single day by regulations referred to as “daily limits.” During a single day, no trades may be executed at prices beyond the daily limit. Once the price of such a Futures Contract has increased or decreased by an amount equal to the daily limit, positions in the contracts can neither be taken nor liquidated unless the traders are willing to effect trades at or within the limit. Such market conditions could prevent the Fund from promptly liquidating a position in Futures Contracts.
War and other geopolitical events in eastern Europe, including but not limited to Russia and Ukraine, may cause volatility in commodity prices including energy and grain prices, due to the region’s importance to these markets, potential impacts to global transportation and shipping, and other supply chain disruptions. These events are unpredictable and may lead to extended periods of price volatility.
| 42 |
| Table of Contents |
More generally, a climate of uncertainty and panic, including the contagion of the COVID-19 virus and other infectious viruses or diseases, may adversely affect global, regional, and local economies and reduce the availability of potential investment opportunities, and increases the difficulty of performing due diligence and modeling market conditions, potentially reducing the accuracy of financial projections. Under these circumstances, the Funds may have difficulty achieving their investment objectives which may adversely impact performance. Further, such events can be highly disruptive to economies and markets, significantly disrupt the operations of individual companies (including, but not limited to, the Funds’ Sponsor and third-party service providers), sectors, industries, markets, securities and commodity exchanges, currencies, interest and inflation rates, credit ratings, investor sentiment, and other factors affecting the value of the Funds’ investments. These factors could cause substantial market volatility, exchange trading suspensions and closures that could impact the ability of the Funds to complete redemptions and otherwise affect Fund performance and Fund trading in the secondary market. A widespread crisis may also affect the global economy in ways that cannot necessarily be foreseen at the current time. How long such events will last and whether they will continue or recur cannot be predicted. Impacts from these events could have significant impact on a Fund’s performance, resulting in losses to your investment. The global economic shocks being experienced as of the date hereof may cause the underlying assumptions and expectations of the Funds to become outdated quickly or inaccurate, resulting in significant losses.
Market Risk
Trading in Commodity or Cryptocurrency Interests such as Futures Contracts will involve the Funds entering into contractual commitments to purchase or sell specific amounts of commodities or cryptocurrencies at a specified date in the future. The gross or face amount of the contracts is expected to significantly exceed the future cash requirements of each Fund as each Fund intends to close out any open positions prior to the contractual expiration date. As a result, each Fund’s market risk is the risk of loss arising from the decline in value of the contracts, not from the need to make delivery under the contracts. The Funds consider the “fair value” of derivative instruments to be the unrealized gain or loss on the contracts. The market risk associated with the commitment by the Funds to purchase a specific commodity or cryptocurrency will be limited to the aggregate face amount of the contacts held.
The exposure of the Funds to market risk will depend on a number of factors including the markets for the specific commodity or cryptocurrency, the volatility of interest rates and foreign exchange rates, the liquidity of the Commodity or Cryptocurrency Specific Interests markets and the relationships among the contracts held by each Fund.
Regulatory Considerations
The regulation of futures markets, futures contracts, and futures exchanges has historically been comprehensive. The CFTC and the exchanges are authorized to take extraordinary actions in the event of a market emergency including, for example, the retroactive implementation of speculative position limits, increased margin requirements, the establishment of daily price limits and the suspension of trading on an exchange or trading facility.
Pursuant to authority in the CEA, the NFA has been formed and registered with the CFTC as a registered futures association. At the present time, the NFA is the only SRO for commodity interest professionals, other than futures exchanges. The CFTC has delegated to the NFA responsibility for the registration of CPOs and FCMs and their respective associated persons. The Sponsor and the Fund’s clearing broker are members of the NFA. As such, they will be subject to NFA standards relating to fair trade practices, financial condition, and consumer protection. The NFA also arbitrates disputes between members and their customers and conducts registration and fitness screening of applicants for membership and audits of its existing members. Neither the Trust nor the Teucrium Funds are required to become a member of the NFA. The regulation of commodity interest transactions in the United States is a rapidly changing area of law and is subject to ongoing modification by governmental and judicial action. Considerable regulatory attention has been focused on non-traditional investment pools that are publicly distributed in the United States. There is a possibility of future regulatory changes within the United States altering, perhaps to a material extent, the nature of an investment in the Fund, or the ability of a Fund to continue to implement its investment strategy. In addition, various national governments outside of the United States have expressed concern regarding the disruptive effects of speculative trading in the commodities markets and the need to regulate the derivatives markets in general. The effect of any future regulatory change on the Teucrium Funds is impossible to predict but could be substantial and adverse.
The CFTC possesses exclusive jurisdiction to regulate the activities of commodity pool operators and commodity trading advisors with respect to “commodity interests,” such as futures, swaps, and options, and has adopted regulations with respect to the activities of those persons and/or entities. Under the Commodity Exchange Act (“CEA”), a registered commodity pool operator, such as the Sponsor, is required to make annual filings with the CFTC and the NFA describing its organization, capital structure, management and controlling persons. In addition, the CEA authorizes the CFTC to require and review books and records of, and documents prepared by, registered commodity pool operators. Pursuant to this authority, the CFTC requires commodity pool operators to keep accurate, current, and orderly records for each pool that they operate. The CFTC may suspend the registration of a commodity pool operator (1) if the CFTC finds that the operator’s trading practices tend to disrupt orderly market conditions, (2) if any controlling person of the operator is subject to an order of the CFTC denying such person trading privileges on any exchange, and (3) in certain other circumstances. Suspension, restriction, or termination of the Sponsor’s registration as a commodity pool operator would prevent it, until that registration was to be reinstated, from managing the Fund, and might result in the termination of the Fund if a successor sponsor is not elected pursuant to the Trust Agreement. Neither the Trust nor the Fund is required to be registered with the CFTC in any capacity.
| 43 |
| Table of Contents |
The Fund’s investors are afforded prescribed rights for reparations under the CEA. Investors may also be able to maintain a private right of action for violations of the CEA. The CFTC has adopted rules implementing the reparation provisions of the CEA, which provide that any person may file a complaint for a reparations award with the CFTC for violation of the CEA against a floor broker or an FCM, introducing broker, commodity trading advisor, CPO, and their respective associated persons.
The regulations of the CFTC and the NFA prohibit any representation by a person registered with the CFTC or by any member of the NFA, that registration with the CFTC, or membership in the NFA, in any respect indicates that the CFTC or the NFA has approved or endorsed that person or that person’s trading program or objectives. The registrations and memberships of the parties described in this summary must not be considered as constituting any such approval or endorsement. Likewise, no futures exchange has given or will give any similar approval or endorsement.
Trading venues in the United States are subject to varying degrees of regulation under the CEA depending on whether such exchange is a designated contract market (i.e., a futures exchange) or a swap execution facility. Clearing organizations are also subject to the CEA and the rules and regulations adopted thereunder as administered by the CFTC. The CFTC’s function is to implement the CEA’s objectives of preventing price manipulation and excessive speculation and promoting orderly and efficient commodity interest markets. In addition, the various exchanges and clearing organizations themselves as SROs exercise regulatory and supervisory authority over their member firms.
The Dodd-Frank Wall Street Reform and Consumer Protection Act (the “Dodd-Frank Act”) was enacted in response to the economic crisis of 2008 and 2009 and it significantly altered the regulatory regime to which the securities and commodities markets are subject. To date, the CFTC has issued proposed or final versions of almost all of the rules it is required to promulgate under the Dodd-Frank Act, and it continues to issue proposed versions of additional rules that it has authority to promulgate. Provisions of the new law include the requirement that position limits be established on a wide range of commodity interests, including agricultural, energy, and metal-based commodity futures contracts, options on such futures contracts and uncleared swaps that are economically equivalent to such futures contracts and options (“Reference Contracts”); new registration and recordkeeping requirements for swap market participants; capital and margin requirements for “swap dealers” and “major swap participants,” as determined by the new law and applicable regulations; reporting of all swap transactions to swap data repositories; and the mandatory use of clearinghouse mechanisms for sufficiently standardized swap transactions that were historically entered into in the over the counter market, but are now designated as subject to the clearing requirement; and margin requirements for over the counter swaps that are not subject to the clearing requirements.
In addition, considerable regulatory attention has recently been focused on non-traditional publicly distributed investment pools such as the Fund. Furthermore, various national governments have expressed concern regarding the disruptive effects of speculative trading in certain commodity markets and the need to regulate the derivatives markets in general. The effect of any future regulatory change on the Teucrium Funds is impossible to predict but could be substantial and adverse.
The Dodd-Frank Act was intended to reduce systemic risks that may have contributed to the 2008/2009 financial crisis. Since the first draft of what became the Dodd-Frank Act, supporters and opponents have debated the scope of the legislation. As the Administrations of the U.S. change, the interpretation and implementation will change along with them. Nevertheless, regulatory reform of any kind may have a significant impact on U.S. regulated entities.
Position Limits, Aggregation Limits, Accountability Levels, Price Fluctuation Limits
The CFTC and US futures exchanges impose limits on the maximum net long or net short speculative positions that any person may hold or control in any particular futures or options contracts traded on US futures exchanges. For example, the CFTC currently imposes speculative position limits on a number of commodities (e.g., corn, oats, wheat, soybeans, and cotton) and US futures exchanges currently impose speculative position limits on many other commodities. A Fund could be required to liquidate positions it holds in order to comply with position limits or may not be able to fully implement trading instructions generated by its trading models, in order to comply with position limits. Any such liquidation or limited implementation could result in substantial costs to a Fund. Limits are generally applied on an aggregate basis to positions held in accounts that are subject to 10% or greater common ownership or control. In December 2016, the CFTC adopted rule amendments that provide exemptions from the general requirement to aggregate all positions that are held pursuant to 10% or greater common ownership or control.
The Dodd-Frank Act significantly expanded the CFTC’s authority to impose position limits with respect to futures contracts and options on futures contracts, swaps that are economically equivalent to futures or options on futures, and swaps that are traded on a regulated exchange and certain swaps that perform a significant price discovery function.
| 44 |
| Table of Contents |
In October 2020, the CFTC adopted new speculative position limits with respect to futures and options on futures on many physical commodities, including energy, metals and agricultural commodities (the “core referenced futures contracts“), and on economically equivalent swaps. The CFTC’s new position limits rules include an exemption from limits for bona fide hedging transactions or positions. A bona fide hedging transaction or position may exceed the applicable federal position limits if the transaction or position: (1) represents a substitute for transactions or positions made or to be made at a later time in a physical marketing channel; (2) is economically appropriate to the reduction of price risks in the conduct and management of a commercial enterprise; and (3) arises from the potential change in value of (A) assets which a person owns, produces, manufactures, processes or merchandises, or anticipates owning, producing, manufacturing, processing or merchandising; (B) liabilities which a person owes or anticipates incurring; or (C) services that a person provides or purchases, or anticipates providing or purchasing. The CFTC’s new position rules set forth a list of enumerated bona fide hedges for which a market participant is not required to request prior approval from the CFTC in order to hold a bona fide hedge position above the federal position limit. However, a market participant holding an enumerated bona fide hedge position still would need to request an exemption from the relevant exchange for exchange-set limits. For non-enumerated bona fide hedge positions, a market participant may request CFTC approval which must be granted prior to exceeding the applicable federal position limit, except where there is a demonstrated sudden or unforeseen increase in bona fide hedging needs (in which case the application must be submitted within five business days after the market participant exceeds the applicable limit). The compliance dates for the CFTC’s new federal speculative position limits are January 1, 2022 for the core referenced futures contracts and January 1, 2023 for economically equivalent swaps.
Position Aggregation. In general, a market participant is required by CFTC or exchange rules, as applicable, to aggregate all positions in accounts as to which the market participant has 10% or greater ownership or control. CFTC and exchange rules, as applicable, provide exemptions from this requirement. For example, a market participant is not required to aggregate positions in multiple accounts that it owns or controls if that market participant is able to satisfy the requirements of an exemption from aggregation of those accounts, including, where available, the independent account controller exemption. Failure to comply with the independent account controller exemption or another exemption from the aggregation requirement could obligate the Sponsor to aggregate positions in multiple accounts under its control, which could include the Fund and other commodity pools or accounts under the Sponsor’s control. In such a scenario, a Fund may not be able to obtain exposure to one or more contracts necessary to pursue its investment objective, or it may be required to liquidate existing contract positions in order to comply with a limit. Such an outcome could adversely affect a Fund’s ability to pursue its investment objective or achieve favorable performance. The CFTC amended its position aggregation rules in December 2016. The CFTC staff subsequently issued time-limited no-action relief from compliance with certain requirements under the amended aggregation rules, including the general requirement to aggregate positions in the same commodity futures contracts traded pursuant to substantially identical trading strategies. This no-action relief expires on August 12, 2025.
Accountability Levels. Exchanges may establish accountability levels applicable to a futures contract instead of position limits, provided that the futures contract is not subject to federal position limits. An exchange may order a person who holds or controls a position in excess of a position accountability level not to further increase its position, to comply with any prospective limit that exceeds the size of the position owned or controlled, or to reduce any open position that exceeds the position accountability level if the exchange determines that such action is necessary to maintain an orderly market. Position accountability levels could adversely affect a Fund’s ability to establish and maintain positions in commodity futures contracts to which such levels apply, if a Fund were to trade in such contracts. Such an outcome could adversely affect a Fund’s ability to pursue its investment objective.
Daily Limits. U.S. futures exchanges and some foreign exchanges have regulations that limit the amount of fluctuation in futures contract prices that may occur during a single business day. These limits are generally referred to as “daily price fluctuation limits” or “daily limits,” and the maximum or minimum price of a contract on any given day as a result of these limits is referred to as a “limit price.” Once a limit price has been reached in a particular contract, it is usually the case that no trades may be made at a different price than specified in the limit. The duration of limit prices generally varies. Limit prices may have the effect of precluding a Fund from trading in a particular contract or requiring the Fund to liquidate contracts at disadvantageous times or prices. Either of those outcomes could adversely affect a Fund’s ability to pursue its investment objective.
Potential Effects of Positions Limits, Aggregation Limits, Accountability Levels, and Price Fluctuation Limits. The Funds are currently subject to position limits and may be subject to new and more restrictive position limits in the future. If a Fund reached a position limit or accountability level or became subject to a daily limit, its ability to issue new creation units or reinvest income in additional commodity futures contracts may be limited to the extent these restrictions limit its ability to establish new futures positions, add to existing positions, or otherwise transact in futures. Limiting the size of a Fund, or restricting a Fund’s futures trading, under these requirements could adversely affect a Fund’s ability to pursue its investment objective.
| 45 |
| Table of Contents |
Off Balance Sheet Financing
As of September 30, 2022, neither the Trust nor any of the Funds has any loan guarantees, credit support or other off-balance sheet arrangements of any kind other than agreements entered into in the normal course of business, which may include indemnification provisions relating to certain risks service providers undertake in performing services which are in the best interests of the Funds. While the exposure of each Fund under these indemnification provisions cannot be estimated, they are not expected to have a material impact on the financial positions of each Fund.
Redemption Basket Obligation
Other than as necessary to meet the investment objective of the Funds and pay the contractual obligations described below, the Funds will require liquidity to redeem Redemption Baskets. Each Fund intends to satisfy this obligation through the transfer of cash of the Fund (generated, if necessary, through the sale of short-term Treasury Securities or other cash equivalents) in an amount proportionate to the number of units being redeemed.
Contractual Obligations
The primary contractual obligations of each Fund will be with the Sponsor and certain other service providers. Except for TAGS, which has no management fee, the Sponsor, in return for its services, will be entitled to a management fee calculated as a fixed percentage of each Agricultural Fund’s NAV, currently 1.00% of its average net assets. DEFI is contractually obligated to pay a monthly management fee to the Sponsor, based on average daily net assets, at a rate equal to 0.94% per annum.
CORN, CANE, SOYB, WEAT and TAGS will also be responsible for all ongoing fees, costs and expenses of its operation, including (i) brokerage and other fees and commissions incurred in connection with the trading activities of the Fund; (ii) expenses incurred in connection with registering additional Shares of the Fund or offering Shares of the Fund; (iii) the routine expenses associated with the preparation and, if required, the printing and mailing of monthly, quarterly, annual and other reports required by applicable U.S. federal and state regulatory authorities, Trust meetings and preparing, printing and mailing proxy statements to Shareholders; (iv) the payment of any distributions related to redemption of Shares; (v) payment for routine services of the Trustee, legal counsel and independent accountants; (vi) payment for routine accounting, bookkeeping, compliance, distribution and solicitation-related services, custodial and transfer agency services, whether performed by an outside service provider or by affiliates of the Sponsor; (vii) postage and insurance; (viii) costs and expenses associated with client relations and services; (ix) costs of preparation of all federal, state, local and foreign tax returns and any taxes payable on the income, assets or operations of the Fund; and (xi) extraordinary expenses (including, but not limited to, legal claims and liabilities and litigation costs and any indemnification related thereto).
The Management Fee for DEFI is paid in consideration of the Sponsor’s services related to the management of the Fund’s business and affairs, including the provision of commodity futures trading advisory services. DEFI pays all of its respective brokerage commissions, including applicable exchange fees, NFA fees and give-up fees, and other transaction related fees and expenses charged in connection with trading activities for the Fund’s investments in CFTC regulated investments. DEFI bears other transaction costs related to the FCM capital requirements on a monthly basis. The Sponsor pays all of the routine operational, administrative and other ordinary expenses of the Fund, generally as determined by the Sponsor, including but not limited to, fees and expenses of the Administrator, Custodian, Distributor, Transfer Agent, licensors, accounting and audit fees and expenses, tax preparation expenses, legal fees, ongoing SEC registration fees, individual Schedule K-1 preparation and mailing fees, and report preparation and mailing expenses. DEFI pays all of its non-recurring and unusual fees and expenses, if any, as determined by the Sponsor. Non-recurring and unusual fees and expenses are unexpected or unusual in nature, such as legal claims and liabilities and litigation costs or indemnification or other unanticipated expenses. Extraordinary fees and expenses also include material expenses which are not currently anticipated obligations of the Fund. Routine operational, administrative and other ordinary expenses are not deemed extraordinary expenses.
Toroso Investments, LLC (“Toroso”), Tidal ETF Services LLC (“Tidal”) and Victory Capital Management Inc. (“Victory Capital”), Hashdex Asset Management Ltd. (“Hashdex”) and the Sponsor (the “Parties”) have entered into an agreement (the “Support Agreement”) that sets forth certain terms and conditions applicable to the launch, marketing, promotion, development, and ongoing operation of DEFI, as well the respective rights in profits and obligations for expenses.
The primary responsibilities and rights of each Party with respect to the Fund are described below:
· | The Support Agreement provides that Hashdex will provide to the other Parties research and analysis regarding bitcoin and bitcoin markets for use in the operation and marketing of the Fund. Subject to mutual agreement of the Parties, Victory Capital will provide sub-advisory and sales support services for the Fund. |
|
|
· | The Sponsor, Toroso, Hashdex and Victory Capital are responsible for paying for all listing, legal, and regulatory costs and expenses incurred in connection with the regulatory process related to the launch of the Fund, including drafting the Fund’s registration statement, exchange listing fees, and other regulatory or service provider fees, as determined in the Support Agreement (“Start-Up Costs”). The Fund will not be responsible for the Start-Up Costs. Each Party is responsible for its own internal expenses. |
|
|
· | The Sponsor will receive a sponsor fee, administrative fee and trading fee, which are paid out of the proceeds from the Management Fee of the Fund (if sufficient) and/or from Toroso and Hashdex/Victory Capital (if insufficient). After an additional deduction of operational costs from the Management Fee, the resulting profits or losses will be shared equally among Toroso, on the one hand, and Hashdex and Victory Capital, on the other. |
While the Sponsor paid the initial registration fees to the SEC, FINRA and any other regulatory agency in connection with the offer and sale of the Shares offered through each Agricultural Fund prospectus, the legal, printing, accounting and other expenses associated with such registrations, and the initial fee of approximately $5,000 for listing the Shares on the NYSE Arca, each Fund will be responsible for any registration fees and related expenses incurred in connection with any future offer and sale of Shares of the Fund.
Any general expenses of the Trust will be allocated among the Funds and any other series of the Trust as determined by the Sponsor or in the Support Agreement described in the DEFI prospectus, in its sole and absolute discretion. The Trust is also responsible for extraordinary expenses, including, but not limited to, legal claims and liabilities and litigation costs and any indemnification related thereto. The Trust and/or the Sponsor may be required to indemnify the Trustee, Distributor or Administrator under certain circumstances.
| 46 |
| Table of Contents |
The parties cannot anticipate the amount of payments that will be required under these arrangements for future periods as the NAV and trading levels to meet investment objectives for each Fund will not be known until a future date. These agreements are effective for a specific term agreed upon by the parties with an option to renew, or, in some cases, are in effect for the duration of each Fund’s existence. The parties may terminate these agreements earlier for certain reasons listed in the agreements.
Benchmark Performance
Investing in Commodity or Cryptocurrency Interests subjects the Funds to the risks of the underlying commodity or cryptocurrency market, and this could result in substantial fluctuations in the price of each Fund’s Shares. Unlike mutual funds, the Funds currently are not expected to distribute dividends to Shareholders. Although this could change if interest rates continue to rise, and the assets of the Funds increase. Investors may choose to use the Funds as a means of investing indirectly in the underlying commodity or cryptocurrency, and there are risks involved in such investments. Investors may choose to use the Funds as vehicles to hedge against the risk of loss, and there are risks involved in hedging activities.
During the period from January 1, 2022 through September 30, 2022 the average daily change in the NAV of each Fund was within plus/minus 10 percent of the average daily change in the Benchmark of each Fund, as stated in the applicable prospectus for each Fund.
Frequency Distribution of Premiums and Discounts: NAV versus the 4pm Bid/Ask Midpoint on the NYSE Arca.
CORN Bid / Ask Midpoint in Relation to NAV | ||||||||||||||||||
Premium / Discount Range |
|
| Number of Trading Days in the Quarter |
| ||||||||||||||
(Basis Points) |
|
| 10/01 to 12/31/2021 |
|
| 1/01 to 3/31/2022 |
|
| 4/01 to 6/30/2022 |
| 7/01 to 9/30/2022 |
| ||||||
| -200 |
|
|
| 0 |
|
|
| 0 |
|
|
| 0 |
|
|
| 0 |
|
-100 to -199 |
|
|
| 0 |
|
|
| 0 |
|
|
| 0 |
|
|
| 0 |
| |
-50 to -99 |
|
|
| 0 |
|
|
| 1 |
|
|
| 0 |
|
|
| 0 |
| |
-1 to -49 |
|
|
| 43 |
|
|
| 28 |
|
|
| 37 |
|
|
| 40 |
| |
| 0 |
|
|
| 1 |
|
|
| 2 |
|
|
| 2 |
|
|
| 2 |
|
1 to 49 |
|
|
| 20 |
|
|
| 29 |
|
|
| 23 |
|
|
| 22 |
| |
50 to 99 |
|
|
| 0 |
|
|
| 2 |
|
|
| 0 |
|
|
| 0 |
| |
100 to 199 |
|
|
| 0 |
|
|
| 0 |
|
|
| 0 |
|
|
| 0 |
| |
>200 |
|
|
| 0 |
|
|
| 0 |
|
|
| 0 |
|
|
| 0 |
| |
Total |
|
|
| 64 |
|
|
| 62 |
|
|
| 62 |
|
|
| 64 |
| |
The performance data above for the Teucrium Corn Fund represents past performance. Past performance is not a guarantee of future results. Investment return and value of the Fund’s Shares will fluctuate so that an investor’s Shares, when sold, may be worth more or less than their original cost. Performance may be lower or higher than performance data quoted.
SOYB Bid / Ask Midpoint in Relation to NAV | ||||||||||||||||||
Premium / Discount Range |
|
| Number of Trading Days in the Quarter |
| ||||||||||||||
(Basis Points) |
|
| 10/01 to 12/31/2021 |
|
| 1/01 to 3/31/2022 |
|
| 4/01 to 6/30/2022 |
| 7/01 to 9/30/2022 |
| ||||||
| -200 |
|
|
| 0 |
|
|
| 0 |
|
|
| 0 |
|
|
| 0 |
|
-100 to -199 |
|
|
| 0 |
|
|
| 0 |
|
|
| 0 |
|
|
| 0 |
| |
-50 to -99 |
|
|
| 0 |
|
|
| 0 |
|
|
| 0 |
|
|
| 0 |
| |
-1 to -49 |
|
|
| 27 |
|
|
| 26 |
|
|
| 27 |
|
|
| 31 |
| |
| 0 |
|
|
| 9 |
|
|
| 5 |
|
|
| 12 |
|
|
| 8 |
|
1 to 49 |
|
|
| 28 |
|
|
| 27 |
|
|
| 23 |
|
|
| 25 |
| |
50 to 99 |
|
|
| 0 |
|
|
| 3 |
|
|
| 0 |
|
|
| 0 |
| |
100 to 199 |
|
|
| 0 |
|
|
| 1 |
|
|
| 0 |
|
|
| 0 |
| |
>200 |
|
|
| 0 |
|
|
| 0 |
|
|
| 0 |
|
|
| 0 |
| |
Total |
|
|
| 64 |
|
|
| 62 |
|
|
| 62 |
|
|
| 64 |
| |
| 47 |
| Table of Contents |
The performance data above for the Teucrium Soybean Fund represents past performance. Past performance is not a guarantee of future results. Investment return and value of the Fund’s Shares will fluctuate so that an investor’s Shares, when sold, may be worth more or less than their original cost. Performance may be lower or higher than performance data quoted.
CANE Bid / Ask Midpoint in Relation to NAV | ||||||||||||||||||
Premium / Discount Range |
|
| Number of Trading Days in the Quarter |
| ||||||||||||||
(Basis Points) |
|
| 10/01 to 12/31/2021 |
|
| 1/01 to 3/31/2022 |
|
| 4/01 to 6/30/2022 |
|
| 7/01 to 9/30/2022 |
| |||||
| -200 |
|
|
| 0 |
|
|
| 0 |
|
|
| 0 |
|
|
| 0 |
|
-100 to -199 |
|
|
| 0 |
|
|
| 0 |
|
|
| 0 |
|
|
| 0 |
| |
-50 to -99 |
|
|
| 3 |
|
|
| 2 |
|
|
| 2 |
|
|
| 1 |
| |
-1 to -49 |
|
|
| 31 |
|
|
| 41 |
|
|
| 23 |
|
|
| 33 |
| |
| 0 |
|
|
| 0 |
|
|
| 1 |
|
|
| 1 |
|
|
| 3 |
|
1 to 49 |
|
|
| 29 |
|
|
| 18 |
|
|
| 29 |
|
|
| 24 |
| |
50 to 99 |
|
|
| 1 |
|
|
| 2 |
|
|
| 7 |
|
|
| 1 |
| |
100 to 199 |
|
|
| 0 |
|
|
| 0 |
|
|
| 0 |
|
|
| 0 |
| |
>200 |
|
|
| 0 |
|
|
| 0 |
|
|
| 0 |
|
|
| 0 |
| |
Total |
|
|
| 64 |
|
|
| 64 |
|
|
| 62 |
|
|
| 62 |
| |
The performance data above for the Teucrium Sugar Fund represents past performance. Past performance is not a guarantee of future results. Investment return and value of the Fund’s Shares will fluctuate so that an investor’s Shares, when sold, may be worth more or less than their original cost. Performance may be lower or higher than performance data quoted.
WEAT Bid / Ask Midpoint in Relation to NAV | ||||||||||||||||||
Premium / Discount Range |
|
| Number of Trading Days in the Quarter |
| ||||||||||||||
(Basis Points) |
|
| 10/01 to 12/31/2021 |
|
| 1/01 to 3/31/2022 |
|
| 4/01 to 6/30/2022 |
|
| 7/01 to 9/30/2022 |
| |||||
| -200 |
|
|
| 0 |
|
|
| 0 |
|
|
| 0 |
|
|
| 0 |
|
-100 to -199 |
|
|
| 0 |
|
|
| 0 |
|
|
| 0 |
|
|
| 1 |
| |
-50 to -99 |
|
|
| 2 |
|
|
| 0 |
|
|
| 4 |
|
|
| 6 |
| |
-1 to -49 |
|
|
| 43 |
|
|
| 30 |
|
|
| 28 |
|
|
| 21 |
| |
| 0 |
|
|
| 1 |
|
|
| 1 |
|
|
| 0 |
|
|
| 1 |
|
1 to 49 |
|
|
| 18 |
|
|
| 32 |
|
|
| 21 |
|
|
| 29 |
| |
50 to 99 |
|
|
| 0 |
|
|
| 1 |
|
|
| 4 |
|
|
| 3 |
| |
100 to 199 |
|
|
| 0 |
|
|
| 0 |
|
|
| 2 |
|
|
| 0 |
| |
>200 |
|
|
| 0 |
|
|
| 0 |
|
|
| 3 |
|
|
| 1 |
| |
Total |
|
|
| 64 |
|
|
| 64 |
|
|
| 62 |
|
|
| 62 |
| |
The performance data above for the Teucrium Wheat Fund represents past performance. Past performance is not a guarantee of future results. Investment return and value of the Fund’s Shares will fluctuate so that an investor’s Shares, when sold, may be worth more or less than their original cost. Performance may be lower or higher than performance data quoted.
TAGS Bid / Ask Midpoint in Relation to NAV | ||||||||||||||||||
Premium / Discount Range |
|
| Number of Trading Days in the Quarter |
| ||||||||||||||
(Basis Points) |
|
| 10/01 to 12/31/2021 |
|
| 1/01 to 3/31/2022 |
|
| 4/01 to 6/30/2022 |
|
| 7/01 to 9/30/2022 |
| |||||
| -200 |
|
|
| 0 |
|
|
| 0 |
|
|
| 0 |
|
|
| 0 |
|
-100 to -199 |
|
|
| 0 |
|
|
| 0 |
|
|
| 0 |
|
|
| 0 |
| |
-50 to -99 |
|
|
| 3 |
|
|
| 0 |
|
|
| 0 |
|
|
| 0 |
| |
-1 to -49 |
|
|
| 39 |
|
|
| 25 |
|
|
| 18 |
|
|
| 22 |
| |
| 0 |
|
|
| 3 |
|
|
| 2 |
|
|
| 4 |
|
|
| 1 |
|
1 to 49 |
|
|
| 19 |
|
|
| 33 |
|
|
| 33 |
|
|
| 39 |
| |
50 to 99 |
|
|
| 0 |
|
|
| 3 |
|
|
| 3 |
|
|
| 0 |
| |
100 to 199 |
|
|
| 0 |
|
|
| 1 |
|
|
| 2 |
|
|
| 0 |
| |
>200 |
|
|
| 0 |
|
|
| 0 |
|
|
| 2 |
|
|
| 0 |
| |
Total |
|
|
| 64 |
|
|
| 64 |
|
|
| 62 |
|
|
| 62 |
| |
| 48 |
| Table of Contents |
The performance data above for the Teucrium Agricultural Fund represents past performance. Past performance is not a guarantee of future results. Investment return and value of the Fund’s Shares will fluctuate so that an investor’s Shares, when sold, may be worth more or less than their original cost. Performance may be lower or higher than performance data quoted.
For the period from August 2, 2012 through April 10, 2018, TAGS had 50,002 shares outstanding; this represents the minimum number of shares and, thus, no shares could be redeemed until additional shares have been created. This has generated a situation, at times, in which the spread between the bid/ask midpoint at 4pm and the NAV falls outside of the “1 to 49” or “-1 to -49” range. The situation does not affect the actual NAV of the Fund.
DEFI Bid / Ask Midpoint in Relation to NAV | ||||||||||||||||||
Premium / Discount Range |
|
| Number of Trading Days in the Quarter |
| ||||||||||||||
(Basis Points) |
|
|
| N/A |
|
|
| N/A |
|
|
| N/A |
|
| 9/16 to 9/30/2022 |
| ||
| -200 |
|
|
|
|
|
|
|
|
|
|
|
|
|
|
| 0 |
|
-100 to -199 |
|
|
|
|
|
|
|
|
|
|
|
|
|
|
| 0 |
| |
-50 to -99 |
|
|
|
|
|
|
|
|
|
|
|
|
|
|
| 0 |
| |
-1 to -49 |
|
|
|
|
|
|
|
|
|
|
|
|
|
|
| 3 |
| |
| 0 |
|
|
|
|
|
|
|
|
|
|
|
|
|
|
| 3 |
|
1 to 49 |
|
|
|
|
|
|
|
|
|
|
|
|
|
|
| 5 |
| |
50 to 99 |
|
|
|
|
|
|
|
|
|
|
|
|
|
|
| 0 |
| |
100 to 199 |
|
|
|
|
|
|
|
|
|
|
|
|
|
|
| 0 |
| |
>200 |
|
|
|
|
|
|
|
|
|
|
|
|
|
|
| 0 |
| |
Total |
|
|
| 0 |
|
|
| 0 |
|
|
| 0 |
|
|
| 11 |
| |
The performance data above for the Hashdex Bitcoin Futures ETF represents past performance. Past performance is not a guarantee of future results. Investment return and value of the Fund’s Shares will fluctuate so that an investor’s Shares, when sold, may be worth more or less than their original cost. Performance may be lower or higher than performance data quoted.
Description
The above frequency distribution charts present information about the difference between the daily market price for Shares of each Fund and the Fund’s reported Net Asset Value per share. The amount that a Fund’s market price is above the reported NAV is called the premium. The amount that a Fund’s market price is below the reported NAV is called the discount. The market price is determined using the midpoint between the highest bid and the lowest offer on the listing exchange, as of the time that a Fund’s NAV is calculated (usually 4:00 p.m., (ET)). Each value in the tables represents the number of trading days in which a Fund traded within the premium/discount range indicated. The premium or discount is expressed in basis points.
*A unit that is equal to 1/100th of 1% and is used to denote the change in a financial instrument.
NEITHER THE PAST PERFORMANCE OF A FUND NOR THE PRIOR INDEX LEVELS AND CHANGES, POSITIVE OR NEGATIVE, SHOULD BE TAKEN AS AN INDICATION OF THE FUND’S FUTURE PERFORMANCE.
| 49 |
| Table of Contents |
Item 3. Quantitative and Qualitative Disclosures About Market Risk
Market Risk
The discussion and analysis which follows may contain trend analysis and other forward-looking statements within the meaning of Section 21E of the Securities Exchange Act of 1934 which reflect our current views with respect to future events and financial results. Words such as “anticipate,” “expect,” “intend,” “plan,” “believe,” “seek,” “outlook” and “estimate,” as well as similar words and phrases, signify forward-looking statements. The Trust’s forward-looking statements are not guarantees of future results and conditions, and important factors, risks and uncertainties may cause our actual results to differ materially from those expressed in our forward-looking statements.
You should not place undue reliance on any forward-looking statements. Except as expressly required by the Federal securities laws, the Sponsor undertakes no obligation to publicly update or revise any forward-looking statements or the risks, uncertainties or other factors described in this Report, as a result of new information, future events or changed circumstances or for any other reason after the date of this Report.
Trading in Commodity and Cryptocurrency Interests such as Futures Contracts will involve the Funds entering into contractual commitments to purchase or sell specific amounts of commodities or cryptocurrencies at a specified date in the future. The gross or face amount of the contracts is expected to significantly exceed the future cash requirements of each Fund as each Fund intends to close out any open positions prior to the contractual expiration date. As a result, each Fund’s market risk is the risk of loss arising from the decline in value of the contracts, not from the need to make delivery under the contracts. The Funds consider the “fair value” of derivative instruments to be the unrealized gain or loss on the contracts. The market risk associated with the commitment by the Funds to purchase a specific commodity or cryptocurrency will be limited to the aggregate face amount of the contacts held.
The exposure of the Funds to market risk will depend primarily on the market price of the specific commodities or cryptocurrency held by the Fund. The market price of the commodities or cryptocurrency depends in part on the volatility of interest rates and foreign exchange rates and the liquidity of the commodity or cryptocurrency specific markets. TAGS is subject to the risks of the commodity specific futures contracts of the Underlying Funds as the fair value of its holdings is based on the NAV of each of the Underlying Funds, each of which is directly impacted by the factors discussed above.
The tables below present a quantitative analysis of hypothetical impact of price decreases and increases in each of the commodity or cryptocurrency futures contracts held by each of the Funds, or the Underlying Funds in the case of TAGS, on the actual holdings and NAV per share as of September 30, 2022. For purposes of this analysis, all futures contracts held by the Funds and the Underlying Funds are assumed to change by the same percentage. In addition, the cash held by the Funds and any management fees paid to the Sponsor are assumed to remain constant and not impact the NAV per share. There may be very slight and immaterial differences, due to rounding, in the tables presented below.
CORN:
|
| September 30, 2022 as Reported |
|
| 10% Decrease |
|
| 15% Decrease |
|
| 20% Decrease |
|
| 10% Increase |
|
| 15% Increase |
|
| 20% Increase |
| |||||||||||||||
Holdings as of September 30, 2022 |
| Number of Contracts Held |
|
| Closing Price |
|
| Notional Amount |
|
| Notional Amount |
|
| Notional Amount |
|
| Notional Amount |
|
| Notional Amount |
|
| Notional Amount |
|
| Notional Amount |
| |||||||||
CBOT Corn Futures MAR23 |
|
| 2,207 |
|
| $ | 6.8400 |
|
| $ | 7,54,79,400 |
|
| $ | 6,79,31,460 |
|
| $ | 6,41,57,490 |
|
| $ | 6,03,83,520 |
|
| $ | 8,30,27,340 |
|
| $ | 8,68,01,310 |
|
| $ | 9,05,75,280 |
|
CBOT Corn Futures MAY23 |
|
| 1,889 |
|
| $ | 6.8450 |
|
| $ | 6,46,51,025 |
|
| $ | 5,81,85,923 |
|
| $ | 5,49,53,371 |
|
| $ | 5,17,20,820 |
|
| $ | 7,11,16,128 |
|
| $ | 7,43,48,679 |
|
| $ | 7,75,81,230 |
|
CBOT Corn Futures DEC23 |
|
| 2,426 |
|
| $ | 6.1675 |
|
| $ | 7,48,11,775 |
|
| $ | 6,73,30,598 |
|
| $ | 6,35,90,009 |
|
| $ | 5,98,49,420 |
|
| $ | 8,22,92,953 |
|
| $ | 8,60,33,541 |
|
| $ | 8,97,74,130 |
|
Total CBOT Corn Futures |
|
|
|
|
|
|
|
|
| $ | 21,49,42,200 |
|
| $ | 19,34,47,981 |
|
| $ | 18,27,00,870 |
|
| $ | 17,19,53,760 |
|
| $ | 23,64,36,421 |
|
| $ | 24,71,83,530 |
|
| $ | 25,79,30,640 |
|
|
|
|
|
|
|
|
|
|
|
|
|
|
|
|
|
|
|
|
|
|
|
|
|
|
|
|
|
|
|
|
|
|
|
|
|
|
Shares outstanding |
|
|
|
|
|
|
|
|
|
| 79,50,004 |
|
|
| 79,50,004 |
|
|
| 79,50,004 |
|
|
| 79,50,004 |
|
|
| 79,50,004 |
|
|
| 79,50,004 |
|
|
| 79,50,004 |
|
|
|
|
|
|
|
|
|
|
|
|
|
|
|
|
|
|
|
|
|
|
|
|
|
|
|
|
|
|
|
|
|
|
|
|
|
|
Net Asset Value per Share attributable directly to CBOT Corn Futures |
|
|
|
|
|
|
|
|
| $ | 27.04 |
|
| $ | 24.33 |
|
| $ | 22.98 |
|
| $ | 21.63 |
|
| $ | 29.74 |
|
| $ | 31.09 |
|
| $ | 32.44 |
|
Total Net Asset Value per Share as reported |
|
|
|
|
|
|
|
|
| $ | 27.04 |
|
|
|
|
|
|
|
|
|
|
|
|
|
|
|
|
|
|
|
|
|
|
|
|
|
Change in the Net Asset Value per Share |
|
|
|
|
|
|
|
|
|
|
|
|
| $ | (2.70 | ) |
| $ | (4.06 | ) |
| $ | (5.41 | ) |
| $ | 2.70 |
|
| $ | 4.06 |
|
| $ | 5.41 |
|
|
|
|
|
|
|
|
|
|
|
|
|
|
|
|
|
|
|
|
|
|
|
|
|
|
|
|
|
|
|
|
|
|
|
|
|
|
Percent Change in the Net Asset Value per Share |
|
|
|
|
|
|
|
|
|
|
|
|
|
| -10.00 | % |
|
| -15.00 | % |
|
| -20.00 | % |
|
| 10.00 | % |
|
| 15.00 | % |
|
| 20.00 | % |
| 50 |
| Table of Contents |
SOYB:
|
| September 30, 2022 as Reported |
|
| 10% Decrease |
|
| 15% Decrease |
|
| 20% Decrease |
|
| 10% Increase |
|
| 15% Increase |
|
| 20% Increase |
| |||||||||||||||
Holdings as of September 30, 2022 |
| Number of Contracts Held |
|
| Closing Price |
|
| Notional Amount |
|
| Notional Amount |
|
| Notional Amount |
|
| Notional Amount |
|
| Notional Amount |
|
| Notional Amount |
|
| Notional Amount |
| |||||||||
CBOT Soybean Futures JAN23 |
|
| 339 |
|
| $ | 13.7550 |
|
| $ | 2,33,14,725 |
|
| $ | 2,09,83,253 |
|
| $ | 1,98,17,516 |
|
| $ | 1,86,51,780 |
|
| $ | 2,56,46,198 |
|
| $ | 2,68,11,934 |
|
| $ | 2,79,77,670 |
|
CBOT Soybean Futures MAR23 |
|
| 290 |
|
| $ | 13.8325 |
|
| $ | 2,00,57,125 |
|
| $ | 1,80,51,413 |
|
| $ | 1,70,48,556 |
|
| $ | 1,60,45,700 |
|
| $ | 2,20,62,838 |
|
| $ | 2,30,65,694 |
|
| $ | 2,40,68,550 |
|
CBOT Soybean Futures NOV23 |
|
| 356 |
|
| $ | 13.4100 |
|
| $ | 2,38,69,800 |
|
| $ | 2,14,82,820 |
|
| $ | 2,02,89,330 |
|
| $ | 1,90,95,840 |
|
| $ | 2,62,56,780 |
|
| $ | 2,74,50,270 |
|
| $ | 2,86,43,760 |
|
Total CBOT Soybean Futures |
|
|
|
|
|
|
|
|
| $ | 6,72,41,650 |
|
| $ | 6,05,17,486 |
|
| $ | 5,71,55,402 |
|
| $ | 5,37,93,320 |
|
| $ | 7,39,65,816 |
|
| $ | 7,73,27,898 |
|
| $ | 8,06,89,980 |
|
|
|
|
|
|
|
|
|
|
|
|
|
|
|
|
|
|
|
|
|
|
|
|
|
|
|
|
|
|
|
|
|
|
|
|
|
|
Shares outstanding |
|
|
|
|
|
|
|
|
|
| 25,75,004 |
|
|
| 25,75,004 |
|
|
| 25,75,004 |
|
|
| 25,75,004 |
|
|
| 25,75,004 |
|
|
| 25,75,004 |
|
|
| 25,75,004 |
|
|
|
|
|
|
|
|
|
|
|
|
|
|
|
|
|
|
|
|
|
|
|
|
|
|
|
|
|
|
|
|
|
|
|
|
|
|
Net Asset Value per Share attributable directly to CBOT Soybean Futures |
|
|
|
|
|
|
|
|
| $ | 26.11 |
|
| $ | 23.50 |
|
| $ | 22.20 |
|
| $ | 20.89 |
|
| $ | 28.72 |
|
| $ | 30.03 |
|
| $ | 31.34 |
|
Total Net Asset Value per Share as reported |
|
|
|
|
|
|
|
|
| $ | 26.11 |
|
|
|
|
|
|
|
|
|
|
|
|
|
|
|
|
|
|
|
|
|
|
|
|
|
Change in the Net Asset Value per Share |
|
|
|
|
|
|
|
|
|
|
|
|
| $ | (2.61 | ) |
| $ | (3.92 | ) |
| $ | (5.22 | ) |
| $ | 2.61 |
|
| $ | 3.92 |
|
| $ | 5.22 |
|
|
|
|
|
|
|
|
|
|
|
|
|
|
|
|
|
|
|
|
|
|
|
|
|
|
|
|
|
|
|
|
|
|
|
|
|
|
Percent Change in the Net Asset Value per Share |
|
|
|
|
|
|
|
|
|
|
|
|
|
| -10.00 | % |
|
| -15.00 | % |
|
| -20.00 | % |
|
| 10.00 | % |
|
| 15.00 | % |
|
| 20.00 | % |
| 51 |
| Table of Contents |
CANE:
|
| September 30, 2022 as Reported |
|
| 10% Decrease |
|
| 15% Decrease |
|
| 20% Decrease |
|
| 10% Increase |
|
| 15% Increase |
|
| 20% Increase |
| |||||||||||||||
Holdings as of September 30, 2022 |
| Number of Contracts Held |
|
| Closing Price |
|
| Notional Amount |
|
| Notional Amount |
|
| Notional Amount |
|
| Notional Amount |
|
| Notional Amount |
|
| Notional Amount |
|
| Notional Amount |
| |||||||||
ICE #11 Sugar Futures MAY23 |
|
| 471 |
|
| $ | 0.1694 |
|
| $ | 89,36,189 |
|
| $ | 80,42,570 |
|
| $ | 75,95,760 |
|
| $ | 71,48,951 |
|
| $ | 98,29,808 |
|
| $ | 1,02,76,617 |
|
| $ | 1,07,23,427 |
|
ICE #11 Sugar Futures JUL23 |
|
| 414 |
|
| $ | 0.1654 |
|
| $ | 76,69,267 |
|
| $ | 69,02,340 |
|
| $ | 65,18,877 |
|
| $ | 61,35,414 |
|
| $ | 84,36,194 |
|
| $ | 88,19,657 |
|
| $ | 92,03,121 |
|
ICE #11 Sugar Futures MAR24 |
|
| 475 |
|
| $ | 0.1681 |
|
| $ | 89,42,920 |
|
| $ | 80,48,628 |
|
| $ | 76,01,482 |
|
| $ | 71,54,336 |
|
| $ | 98,37,212 |
|
| $ | 1,02,84,358 |
|
| $ | 1,07,31,504 |
|
Total ICE #11 Sugar Futures |
|
|
|
|
|
|
|
|
| $ | 2,55,48,376 |
|
| $ | 2,29,93,538 |
|
| $ | 2,17,16,119 |
|
| $ | 2,04,38,701 |
|
| $ | 2,81,03,214 |
|
| $ | 2,93,80,632 |
|
| $ | 3,06,58,052 |
|
|
|
|
|
|
|
|
|
|
|
|
|
|
|
|
|
|
|
|
|
|
|
|
|
|
|
|
|
|
|
|
|
|
|
|
|
|
Shares outstanding |
|
|
|
|
|
|
|
|
|
| 29,25,004 |
|
|
| 29,25,004 |
|
|
| 29,25,004 |
|
|
| 29,25,004 |
|
|
| 29,25,004 |
|
|
| 29,25,004 |
|
|
| 29,25,004 |
|
|
|
|
|
|
|
|
|
|
|
|
|
|
|
|
|
|
|
|
|
|
|
|
|
|
|
|
|
|
|
|
|
|
|
|
|
|
Net Asset Value per Share attributable directly to ICE #11 Sugar Futures |
|
|
|
|
|
|
|
|
| $ | 8.73 |
|
| $ | 7.86 |
|
| $ | 7.42 |
|
| $ | 6.99 |
|
| $ | 9.61 |
|
| $ | 10.04 |
|
| $ | 10.48 |
|
Total Net Asset Value per Share as reported |
|
|
|
|
|
|
|
|
| $ | 8.73 |
|
|
|
|
|
|
|
|
|
|
|
|
|
|
|
|
|
|
|
|
|
|
|
|
|
Change in the Net Asset Value per Share |
|
|
|
|
|
|
|
|
|
|
|
|
| $ | (0.87 | ) |
| $ | (1.31 | ) |
| $ | (1.75 | ) |
| $ | 0.87 |
|
| $ | 1.31 |
|
| $ | 1.75 |
|
|
|
|
|
|
|
|
|
|
|
|
|
|
|
|
|
|
|
|
|
|
|
|
|
|
|
|
|
|
|
|
|
|
|
|
|
|
Percent Change in the Net Asset Value per Share |
|
|
|
|
|
|
|
|
|
|
|
|
|
| -10.01 | % |
|
| -15.01 | % |
|
| -20.01 | % |
|
| 10.01 | % |
|
| 15.01 | % |
|
| 20.01 | % |
WEAT:
|
| September 30, 2022 as Reported |
|
| 10% Decrease |
|
| 15% Decrease |
|
| 20% Decrease |
|
| 10% Increase |
|
| 15% Increase |
|
| 20% Increase |
| |||||||||||||||
Holdings as of September 30, 2022 |
| Number of Contracts Held |
|
| Closing Price |
|
| Notional Amount |
|
| Notional Amount |
|
| Notional Amount |
|
| Notional Amount |
|
| Notional Amount |
|
| Notional Amount |
|
| Notional Amount |
| |||||||||
CBOT Wheat Futures MAR23 |
|
| 2,854 |
|
| $ | 9.3200 |
|
| $ | 13,29,96,400 |
|
| $ | 11,96,96,760 |
|
| $ | 11,30,46,940 |
|
| $ | 10,63,97,120 |
|
| $ | 14,62,96,040 |
|
| $ | 15,29,45,860 |
|
| $ | 15,95,95,680 |
|
CBOT Wheat Futures MAY23 |
|
| 2,430 |
|
| $ | 9.3675 |
|
| $ | 11,38,15,125 |
|
| $ | 10,24,33,613 |
|
| $ | 9,67,42,856 |
|
| $ | 9,10,52,100 |
|
| $ | 12,51,96,638 |
|
| $ | 13,08,87,394 |
|
| $ | 13,65,78,150 |
|
CBOT Wheat Futures DEC23 |
|
| 2,899 |
|
| $ | 9.0500 |
|
| $ | 13,11,79,750 |
|
| $ | 11,80,61,775 |
|
| $ | 11,15,02,788 |
|
| $ | 10,49,43,800 |
|
| $ | 14,42,97,725 |
|
| $ | 15,08,56,713 |
|
| $ | 15,74,15,700 |
|
Total CBOT Wheat Futures |
|
|
|
|
|
|
|
|
| $ | 37,79,91,275 |
|
| $ | 34,01,92,148 |
|
| $ | 32,12,92,584 |
|
| $ | 30,23,93,020 |
|
| $ | 41,57,90,403 |
|
| $ | 43,46,89,967 |
|
| $ | 45,35,89,530 |
|
|
|
|
|
|
|
|
|
|
|
|
|
|
|
|
|
|
|
|
|
|
|
|
|
|
|
|
|
|
|
|
|
|
|
|
|
|
Shares outstanding |
|
|
|
|
|
|
|
|
|
| 4,12,50,004 |
|
|
| 4,12,50,004 |
|
|
| 4,12,50,004 |
|
|
| 4,12,50,004 |
|
|
| 4,12,50,004 |
|
|
| 4,12,50,004 |
|
|
| 4,12,50,004 |
|
|
|
|
|
|
|
|
|
|
|
|
|
|
|
|
|
|
|
|
|
|
|
|
|
|
|
|
|
|
|
|
|
|
|
|
|
|
Net Asset Value per Share attributable directly to CBOT Wheat Futures |
|
|
|
|
|
|
|
|
| $ | 9.16 |
|
| $ | 8.25 |
|
| $ | 7.79 |
|
| $ | 7.33 |
|
| $ | 10.08 |
|
| $ | 10.54 |
|
| $ | 11.00 |
|
Total Net Asset Value per Share as reported |
|
|
|
|
|
|
|
|
| $ | 9.16 |
|
|
|
|
|
|
|
|
|
|
|
|
|
|
|
|
|
|
|
|
|
|
|
|
|
Change in the Net Asset Value per Share |
|
|
|
|
|
|
|
|
|
|
|
|
| $ | (0.92 | ) |
| $ | (1.37 | ) |
| $ | (1.83 | ) |
| $ | 0.92 |
|
| $ | 1.37 |
|
| $ | 1.83 |
|
|
|
|
|
|
|
|
|
|
|
|
|
|
|
|
|
|
|
|
|
|
|
|
|
|
|
|
|
|
|
|
|
|
|
|
|
|
Percent Change in the Net Asset Value per Share |
|
|
|
|
|
|
|
|
|
|
|
|
|
| -10.00 | % |
|
| -15.00 | % |
|
| -20.00 | % |
|
| 10.00 | % |
|
| 15.00 | % |
|
| 20.00 | % |
TAGS:
|
| September 30, 2022 as Reported |
|
| 10% Decrease |
|
| 15% Decrease |
|
| 20% Decrease |
|
| 10% Increase |
|
| 15% Increase |
|
| 20% Increase |
| |||||||||||||||
Holdings as of September 30, 2022 |
| Number of Shares Held |
|
| Closing NAV |
|
| Fair Value |
|
| Fair Value |
|
| Fair Value |
|
| Fair Value |
|
| Fair Value |
|
| Fair Value |
|
| Fair Value |
| |||||||||
Teucrium Corn Fund |
|
| 4,29,192 |
|
| $ | 27.0405 |
|
| $ | 1,16,05,566 |
|
| $ | 1,04,45,009 |
|
| $ | 98,64,731 |
|
| $ | 92,84,453 |
|
| $ | 1,27,66,123 |
|
| $ | 1,33,46,401 |
|
| $ | 1,39,26,679 |
|
Teucrium Soybean Fund |
|
| 4,27,314 |
|
| $ | 26.1141 |
|
| $ | 1,11,58,920 |
|
| $ | 1,00,43,028 |
|
| $ | 94,85,082 |
|
| $ | 89,27,136 |
|
| $ | 1,22,74,812 |
|
| $ | 1,28,32,758 |
|
| $ | 1,33,90,704 |
|
Teucrium Sugar Fund |
|
| 13,27,598 |
|
| $ | 8.7299 |
|
| $ | 1,15,89,798 |
|
| $ | 1,04,30,818 |
|
| $ | 98,51,328 |
|
| $ | 92,71,838 |
|
| $ | 1,27,48,778 |
|
| $ | 1,33,28,268 |
|
| $ | 1,39,07,758 |
|
Teucrium Wheat Fund |
|
| 12,94,496 |
|
| $ | 9.1634 |
|
| $ | 1,18,61,985 |
|
| $ | 1,06,75,787 |
|
| $ | 1,00,82,687 |
|
| $ | 94,89,588 |
|
| $ | 1,30,48,184 |
|
| $ | 1,36,41,283 |
|
| $ | 1,42,34,382 |
|
Total value of shares of the Underlying Funds |
|
|
|
|
|
|
|
|
| $ | 4,62,16,269 |
|
| $ | 4,15,94,642 |
|
| $ | 3,92,83,828 |
|
| $ | 3,69,73,015 |
|
| $ | 5,08,37,897 |
|
| $ | 5,31,48,710 |
|
| $ | 5,54,59,523 |
|
|
|
|
|
|
|
|
|
|
|
|
|
|
|
|
|
|
|
|
|
|
|
|
|
|
|
|
|
|
|
|
|
|
|
|
|
|
Shares outstanding |
|
|
|
|
|
|
|
|
|
| 14,87,502 |
|
|
| 14,87,502 |
|
|
| 14,87,502 |
|
|
| 14,87,502 |
|
|
| 14,87,502 |
|
|
| 14,87,502 |
|
|
| 14,87,502 |
|
|
|
|
|
|
|
|
|
|
|
|
|
|
|
|
|
|
|
|
|
|
|
|
|
|
|
|
|
|
|
|
|
|
|
|
|
|
Net Asset Value per Share attributable directly to shares of the Underlying Funds |
|
|
|
|
|
|
|
|
| $ | 31.07 |
|
| $ | 27.96 |
|
| $ | 26.41 |
|
| $ | 24.86 |
|
| $ | 34.18 |
|
| $ | 35.73 |
|
| $ | 37.28 |
|
Total Net Asset Value per Share as reported |
|
|
|
|
|
|
|
|
| $ | 31.07 |
|
|
|
|
|
|
|
|
|
|
|
|
|
|
|
|
|
|
|
|
|
|
|
|
|
Change in the Net Asset Value per Share |
|
|
|
|
|
|
|
|
|
|
|
|
| $ | (3.11 | ) |
| $ | (4.66 | ) |
| $ | (6.21 | ) |
| $ | 3.11 |
|
| $ | 4.66 |
|
| $ | 6.21 |
|
|
|
|
|
|
|
|
|
|
|
|
|
|
|
|
|
|
|
|
|
|
|
|
|
|
|
|
|
|
|
|
|
|
|
|
|
|
Percent Change in the Net Asset Value per Share |
|
|
|
|
|
|
|
|
|
|
|
|
|
| -10.00 | % |
|
| -15.00 | % |
|
| -20.00 | % |
|
| 10.00 | % |
|
| 15.00 | % |
|
| 20.00 | % |
| 52 |
| Table of Contents |
DEFI:
|
| September 30, 2022 as Reported |
|
| 10% Decrease |
|
| 15% Decrease |
|
| 20% Decrease |
|
| 10% Increase |
|
| 15% Increase |
|
| 20% Increase |
| |||||||||||||||
Holdings as of September 30, 2022 |
| Number of Contracts Held |
|
| Closing Price |
|
| Notional Amount |
|
| Notional Amount |
|
| Notional Amount |
|
| Notional Amount |
|
| Notional Amount |
|
| Notional Amount |
|
| Notional Amount |
| |||||||||
CME Bitcoin Futures Oct22 |
|
| 6 |
|
| $ | 194.2500 |
|
| $ | 5,82,750 |
|
| $ | 5,24,475 |
|
| $ | 4,95,338 |
|
| $ | 4,66,200 |
|
| $ | 6,41,025 |
|
| $ | 6,70,163 |
|
| $ | 6,99,300 |
|
CME Bitcoin Futures Nov22 |
|
| 6 |
|
| $ | 194.3500 |
|
| $ | 5,83,050 |
|
| $ | 5,24,745 |
|
| $ | 4,95,593 |
|
| $ | 4,66,440 |
|
| $ | 6,41,355 |
|
| $ | 6,70,508 |
|
| $ | 6,99,660 |
|
Total CME Bitcoin Futures |
|
|
|
|
|
|
|
|
| $ | 11,65,800 |
|
| $ | 10,49,220 |
|
| $ | 9,90,931 |
|
| $ | 9,32,640 |
|
| $ | 12,82,380 |
|
| $ | 13,40,671 |
|
| $ | 13,98,960 |
|
|
|
|
|
|
|
|
|
|
|
|
|
|
|
|
|
|
|
|
|
|
|
|
|
|
|
|
|
|
|
|
|
|
|
|
|
|
Shares outstanding |
|
|
|
|
|
|
|
|
|
| 50,004 |
|
|
| 50,004 |
|
|
| 50,004 |
|
|
| 50,004 |
|
|
| 50,004 |
|
|
| 50,004 |
|
|
| 50,004 |
|
|
|
|
|
|
|
|
|
|
|
|
|
|
|
|
|
|
|
|
|
|
|
|
|
|
|
|
|
|
|
|
|
|
|
|
|
|
Net Asset Value per Share attributable directly to CME Bitcoin Futures |
|
|
|
|
|
|
|
|
| $ | 23.31 |
|
| $ | 20.98 |
|
| $ | 19.82 |
|
| $ | 18.65 |
|
| $ | 25.65 |
|
| $ | 26.81 |
|
| $ | 27.98 |
|
Total Net Asset Value per Share as reported |
|
|
|
|
|
|
|
|
| $ | 24.61 |
|
|
|
|
|
|
|
|
|
|
|
|
|
|
|
|
|
|
|
|
|
|
|
|
|
Change in the Net Asset Value per Share |
|
|
|
|
|
|
|
|
|
|
|
|
| $ | (2.33 | ) |
| $ | (3.50 | ) |
| $ | (4.66 | ) |
| $ | 2.33 |
|
| $ | 3.50 |
|
| $ | 4.66 |
|
|
|
|
|
|
|
|
|
|
|
|
|
|
|
|
|
|
|
|
|
|
|
|
|
|
|
|
|
|
|
|
|
|
|
|
|
|
Percent Change in the Net Asset Value per Share |
|
|
|
|
|
|
|
|
|
|
|
|
|
| -9.47 | % |
|
| -14.21 | % |
|
| -18.95 | % |
|
| 9.47 | % |
|
| 14.21 | % |
|
| 18.95 | % |
Margin is the minimum amount of funds that must be deposited by a commodity or cryptocurrency interest trader with the trader’s broker to initiate and maintain an open position in futures contracts. A margin deposit acts to assure the trader’s performance of the futures contracts purchased or sold. Futures contracts are customarily bought and sold on initial margin that represents a very small percentage of the aggregate purchase or sales price of the contract. Because of such low margin requirements, price fluctuations occurring in the futures markets may create profits and losses that, in relation to the amount invested, are greater than customary in other forms of investment or speculation. As discussed below, adverse price changes in the futures contract may result in margin requirements that greatly exceed the initial margin. In addition, the amount of margin required in connection with a particular futures contract is set from time to time by the exchange on which the contract is traded and may be modified from time to time by the exchange during the term of the contract. Brokerage firms, such as the Funds’ clearing brokers, carrying accounts for traders in commodity or cryptocurrency interest contracts generally require higher amounts of margin as a matter of policy to further protect themselves. An FCM may impose a financial ceiling on initial margin that could change and become more or less restrictive on a Fund’s activities depending upon a variety of conditions beyond the Sponsor’s control. Over the counter trading generally involves the extension of credit between counterparties, so the counterparties may agree to require the posting of collateral by one or both parties to address credit exposure.
When a trader purchases an option, there is no margin requirement; however, the option premium must be paid in full. When a trader sells an option, on the other hand, he or she is required to deposit margin in an amount determined by the margin requirements established for the underlying interest and, in addition, an amount substantially equal to the current premium for the option. The margin requirements imposed on the selling of options, although adjusted to reflect the probability that out-of-the-money options will not be exercised, can in fact be higher than those imposed in dealing in the futures markets directly. Complicated margin requirements apply to spreads and conversions, which are complex trading strategies in which a trader acquires a mixture of options positions and positions in the underlying interest.
Ongoing or “maintenance” margin requirements are computed each day by a trader’s clearing broker. When the market value of a particular open futures contract changes to a point where the margin on deposit does not satisfy maintenance margin requirements, a margin call is made by the broker. If the margin call is not met within a reasonable time, the broker may close out the trader’s position. With respect to the Funds’ trading, the Funds (and not their shareholders personally) are subject to margin calls.
Finally, many major U.S. exchanges have passed certain cross margining arrangements involving procedures pursuant to which the futures and options positions held in an account would, in the case of some accounts, be aggregated, and margin requirements would be assessed on a portfolio basis, measuring the total risk of the combined positions.
The Dodd-Frank Act requires the CFTC, the SEC and the Office of the Comptroller of the Currency, the Board of Governors of the Federal Reserve System, the Federal Deposit Insurance Corporation, the Farm Credit System and the Federal Housing Finance Agency (collectively, the “Prudential Regulators”) to establish “both initial and variation margin requirements on all swaps that are not cleared by a registered clearing organization” (i.e., uncleared or over the counter swaps). The proposed rules would require swap dealers and major swap participants to collect both variation and initial margin from counterparties known as “financial end-users” such as the Funds or Underlying Funds and in certain circumstances require these swap dealers or major swap participants to post variation margin or initial margin to the Funds or Underlying Funds. The CFTC and the Prudential Regulators finalized these rules in 2016 and compliance became necessary in September 2016.
An “exchange for related position” (“EFRP”) can be used by the Fund as a technique to facilitate the exchanging of a futures hedge position against a creation or redemption order, and thus the Fund may use an EFRP transaction in connection with the creation and redemption of shares. The market specialist/market maker that is the ultimate purchaser or seller of shares in connection with the creation or redemption basket, respectively, agrees to sell or purchase a corresponding offsetting futures position which is then settled on the same business day as a cleared futures transaction by the FCMs. The Fund will become subject to the credit risk of the market specialist/market maker until the EFRP is settled within the business day, which is typically 7 hours or less. The Fund reports all activity related to EFRP transactions under the procedures and guidelines of the CFTC and the exchanges on which the futures are traded.
The Funds, other than TAGS and DEFI, will generally retain cash positions of approximately 95% of total net assets; this balance represents the total net assets less the initial margin requirements held by the FCM. DEFI will generally retain cash positions of approximately 70% of total net assets. These cash assets are either: 1) deposited by the Sponsor in demand deposit accounts of financial institutions which are deemed by the Sponsor to be of investment level quality, 2) held in a money-market fund which is deemed to be a cash equivalent under the most recent SEC definition, or 3) held in a cash equivalent with a maturity of 90 days or less that is deemed by the Sponsor to be of investment level quality.
| 53 |
| Table of Contents |
Item 4. Controls and Procedures
Disclosure Controls and Procedures
The Trust and each Fund maintains disclosure controls and procedures that are designed to ensure that information required to be disclosed in the Trust’s periodic reports filed or submitted under the Securities Exchange Act of 1934, as amended (the “Exchange Act”) is recorded, processed, summarized, and reported within the time period specified in the SEC’s rules and forms for the Trust and each Fund thereof.
Management of the Sponsor of the Funds (“Management”), including Sal Gilbertie, the Sponsor’s Principal Executive Officer and Cory Mullen-Rusin, the Sponsor’s Principal Financial Officer, who perform functions equivalent to those of a principal executive officer and principal financial officer of the Trust if the Trust had any officers, have evaluated the effectiveness of the design and operation of the Trust’s and each Fund’s disclosure controls and procedures (as defined in Rule 13a-15(e) or 15d-15(e) of the Securities Exchange Act of 1934, as amended (the “Exchange Act”)) as of the end of the period covered by this report, and, based upon that evaluation, concluded that the Trust’s and each Fund’s disclosure controls and procedures were effective as of the end of such period, to ensure that information the Trust is required to disclose in the reports that it files or submits with the SEC under the Exchange Act is recorded, processed, summarized and reported, within the time periods specified in the SEC’s rules and forms, and to ensure that information required to be disclosed by the Trust in the reports that it files or submits under the Exchange Act is accumulated and communicated to management of the Sponsor, as appropriate, to allow timely decisions regarding required disclosure. The scope of the evaluation of the effectiveness of the design and operation of its disclosure controls and procedures covers the Trust, as well as separately for each Fund that is a series of the Trust.
The certifications of the Chief Executive Officer and Chief Financial Officer are applicable to each Fund individually as well as the Trust as a whole.
Changes in Internal Control over Financial Reporting
There has been no change in the Trust’s or the Funds’ internal controls over the financial reporting (as defined in the Rules 13a-15(f) and 15d-15(f) of the Exchange Act) that occurred during the Trust’s last fiscal quarter that has materially affected, or is reasonably likely to materially affect, the Trust’s or the Funds’ internal control over financial reporting.
| 54 |
| Table of Contents |
PART II. OTHER INFORMATION
Item 1. Legal Proceedings.
Litigation and Claims
On November 30, 2020, certain officers and members of Teucrium Trading, LLC (the “Sponsor”), along with the Sponsor, filed a Verified Complaint (as amended through the Amended Verified Complaint filed on February 18, 2021) (the “Gilbertie complaint”) in the Delaware Court of Chancery, C.A. No. 2020-1018-AGB. The Gilbertie complaint asserts various claims against Dale Riker, the Sponsor’s former Chief Executive Officer and Barbara Riker, the Sponsor’s former Chief Financial Officer and Chief Compliance Officer. Sal Gilbertie v. Dale Riker, et al., C.A. No. 2020-1018-AGB (Del. Ch.) (the “Gilbertie case”).
Among other things, the Gilbertie complaint responded to and addressed certain allegations that Mr. Riker had made in a draft complaint that he threatened to file (and subsequently did file) in New York Supreme Court. See Dale Riker v. Sal Gilbertie, et al., No. 656794-2020 (N.Y. Sup. Ct.). On April 22, 2021, the Supreme Court of the State of New York, New York County dismissed Mr. Riker’s case without prejudice to the case being refiled after the conclusion of the Gilbertie case in Delaware Chancery Court. See Dale Riker, et al. v. Teucrium Trading, LLC et al, Decision + Order on Motions, No. 6567943-2020 (N.Y. Sup. Ct) (Apr. 22, 2021).
The Gilbertie complaint asserts claims for a declaration concerning the effects of the final order and judgment in an earlier books and records action; for a declaration concerning Mr. Riker’s allegation that Mr. Gilbertie had entered into an agreement to purchase Mr. Riker’s equity in the Sponsor; for an order compelling the return of property from Mr. Riker; for a declaration concerning Mr. Riker’s allegations that the Sponsor and certain of the plaintiffs had improperly removed him as an officer and caused purportedly false financial information to be published; for breach of Ms. Riker’s separation agreement with the Sponsor; for tortious interference by Mr. Riker with Ms. Riker’s separation agreement; for a declaration concerning the releases that had been provided to Ms. Riker through her separation agreement; for breach of the Sponsor’s Operating Agreement by Mr. Riker; and for breach of fiduciary duty by Mr. Riker. The claims for declaratory relief and for return of property have since been dismissed.
On June 28, 2021, Dale Riker, individually and derivatively on behalf of the Sponsor, filed a new suit in the Court of Chancery of the State of Delaware against the Sponsor’s officers and certain of the Sponsor’s Class A Members. See Dale Riker v. Salvatore Gilbertie et al., C.A. No. 2021-0561-LWW. (the “Riker case”). The Court ordered Mr. Riker’s newly filed Delaware action consolidated with the Gilbertie case. As a result, on September 7, 2021, Dale Riker and Barbara Riker filed their answers to the Gilbertie complaint, and the claims in the Riker case were re-filed as counterclaims in the Gilbertie case, along with claims by Barbara Riker, which accompanied the Rikers’ answers. The now-consolidated Gilbertie case and the Riker case is captioned Sal Gilbertie, Cory Mullen-Rusin, Steve Kahler, Carl Miller III, and Teucrium Trading LLC v. Dale Riker and Barbara Riker, C.A. No. 2020-1018-LWW.
Through their counterclaims, the Rikers asserted direct and derivative claims for breach of fiduciary duty, breach of contract, declaratory relief, specific performance, unjust enrichment, fraud, and conspiracy to commit fraud. The Sponsor and the individual plaintiffs/counterclaim-defendants moved to dismiss the Rikers’ claims.
On April 6, 2022, the Court announced its decision on the motion to dismiss in an oral ruling, which was subsequently implemented in a written order dated April 18, 2022. The Court dismissed all of the Rikers’ counterclaims, except for a portion of one count alleging breach of contract against Messrs. Gilbertie and Miller. All of the dismissals were with prejudice, with the exception of the dismissal of Mr. Riker’s claim against Mr. Gilbertie that sought specific performance of an alleged agreement for Mr. Gilbertie to purchase Mr. Riker’s equity in the Company. The Court dismissed that claim without prejudice. On April 25, 2022, Mr. Riker filed a motion for reconsideration of the Court’s dismissal of his derivative claims for breach of contract against Mr. Gilbertie and for unjust enrichment against Mr. Gilbertie, Mr. Miller, Mr. Kahler, and Ms. Mullen-Rusin, both of which concern the Company’s advancement of legal fees on behalf of those individuals. The Sponsor intends to pursue its claims and defend vigorously against the Rikers’ counterclaims in Delaware.
Item 1A. Risk Factors applicable to Funds
As previously disclosed in the prospectus for each Fund, the Sponsor has enhanced specific risk disclosure describing specific risks of current geopolitical events for the commodities markets, each Fund and their investments, position limit constraints, and the FCM placing position constraints due to market volatility. Other than these update, there are no other material changes to those previously disclosed in the Trust’s Annual Report on Form 10-K for the fiscal year ended December 31, 2021, filed on March 16, 2022.
In late February 2022, Russia invaded Ukraine, significantly amplifying already existing geopolitical tensions among Russia and other countries in the region and in the west. The responses of countries and political bodies to Russia’s actions, the larger overarching tensions, and Ukraine’s military response and the potential for wider conflict may increase financial market volatility generally, have severe adverse effects on regional and global economic markets, and cause volatility in the price of agricultural products, including agricultural futures, and the share price of the Funds.
Presented below are the risk factors for the Agricultural Funds, followed by a separate section including risk disclosure for the Hashdex Bitcoin Futures ETF.
| 55 |
| Table of Contents |
RISK FACTORS SPECIFIC TO THE AGRICULTURAL FUNDS.
The Performance of Each Fund May Not Correlate with the Applicable Benchmark
There is no way to predict if or when investor demand might cause the Funds to approach position and/or accountability limits. The Underlying Funds have no intention of purchasing commodity interests on foreign exchanges. The Wheat Fund has not approached existing position limit levels of its Benchmark Component Futures Contracts which are traded on the CME with a 19,300 contract limit. Instead, the fund would file an 8-K and prospectus supplement to include the ability to purchase Kansas City Hard Red Winter Wheat futures or MGEX Hard Red Spring Wheat futures in the same contract size and in the same contract months as its existing Benchmark Component Futures Contract holdings. Position limits are 12,000 contracts on each of the exchanges in the aforementioned futures contracts. The Soybean Fund has not approached existing position limit levels of its Benchmark Component Futures Contracts which are traded on the CME with a 27,300 contract limit. The Sugar Fund has not approached existing position accountability levels of its Benchmark Component Futures Contracts which are traded on the Intercontinental Exchange (ICE) with a 15,000 contract limit. Instead, the fund would file an 8-K and prospectus supplement to include the ability to purchase NYSE Sugar futures in the same contract size and in the same contract months as its existing Benchmark Component Futures Contract holdings. Accountability levels are 9,000 contracts on the NYMEX. The Corn Fund has not approached existing position limit levels of its Benchmark Component Futures Contracts which are traded on the CME with a 57,800 contract limit.
The Funds currently have two futures commission merchants through which they buy and sell futures contracts. The recent volatility in the commodity futures markets may lead one or all of the Funds' FCMs to impose risk mitigation procedures that could limit the Funds' investments in futures contracts beyond the accountability and position limits imposed by futures contract exchanges as discussed herein. One of the FCMs has imposed a financial ceiling on initial margin that could change and become more or less restrictive on the Funds' activities depending upon a variety of conditions beyond the Sponsor’s control. If the Funds' other current FCM were to impose position limits, or if any other FCM with which the Funds establish a relationship in the future were to impose position limits, the Funds' ability to meet its investment objective could be negatively impacted. The Funds continue to monitor and manage its existing relationships with each FCM and will continue to seek additional relationships with FCMs as needed.
There are Risks Related to Fund Structure and Operations of the Funds
Consistent with its authority under the Trust Agreement and Delaware law, each Fund, in its sole discretion and without shareholder approval or advance notice, may change its investment objective, Benchmark or investment strategies, subject to applicable regulatory requirements, including, but not limited to, any requirement to amend applicable listing rules of the NYSE. The reasons for and circumstances that may trigger any such changes may vary widely and cannot be predicted. By way of example, the Funds may change the term structure or underlying components of the Benchmark in furtherance of the Fund’s investment objective of tracking the price of the specified commodity for future delivery (or, for TAGS, the investment objective of tracking the combined daily performance of the Underlying Funds) if, due to market conditions, a potential or actual imposition of position limits by the CFTC or futures exchange rules, or the imposition of risk mitigation measures by a futures commission merchant restricts the ability of the Fund (or, for TAGS, an Underlying Fund) to invest in the current Benchmark Futures Contracts. Shareholders may experience losses on their investments in the Fund as a result of such changes.
The Sponsor has consulted with legal counsel, accountants and other advisers regarding the formation and operation of the Trust and the Funds. No counsel has been appointed to represent you in connection with the offering of Shares. Accordingly, you should consult with your own legal, tax and financial advisers regarding the desirability of an investment in the Shares.
The Sponsor intends to re-invest any income and realized gains of a Fund in additional Benchmark Component Futures Contracts (or Shares of the Underlying Funds in the case of TAGS) or cash and cash equivalents rather than distributing cash to Shareholders. Therefore, unlike mutual funds, commodity pools or other investment pools that generally distribute income and gains to their investors, the Funds generally will not distribute cash to Shareholders. You should not invest in the Funds if you will need cash distributions from the Funds to pay taxes on your share of income and gains of the Funds, if any, or for any other reason. Although the Funds do not intend to make cash distributions, they reserve the right to do so in the Sponsor’s sole discretion, in certain situations, including for example, if the income earned from its investments held directly or posted as margin may reach levels that merit distribution, e.g., at levels where such income is not necessary to support its underlying investments in Benchmark Component Futures Contracts and investors adversely react to being taxed on such income without receiving distributions that could be used to pay such tax. Cash distributions may be made in these and similar instances.
A Fund must pay for all brokerage fees, taxes, and other expenses, including licensing fees for the use of intellectual property, registration or other fees paid to the SEC, the Financial Industry Regulatory Authority (“FINRA”), or any other regulatory agency in connection with the offer and sale of subsequent Shares, after its initial registration, and all legal, accounting, printing and other expenses associated therewith. Each Fund also pays the fees and expenses associated with the Trust’s tax accounting and reporting requirements. Each Fund, excluding TAGS, is also contractually obligated to pay a management fee to the Sponsor. Such fees may be waived by the Sponsor at its discretion.
| 56 |
| Table of Contents |
The Funds may terminate at any time, regardless of whether the Funds have incurred losses, subject to the terms of the Trust Agreement. For example, the dissolution or resignation of the Sponsor would cause the Trust to terminate unless shareholders holding a majority of the outstanding shares of the Trust, voting together as a single class, elect within 90 days of the event to continue the Trust and appoint a successor Sponsor. In addition, the Sponsor may terminate a Fund if it determines that the Fund’s aggregate net assets in relation to its operating expenses make the continued operation of the Fund unreasonable or imprudent. As of the date of this prospectus, each Fund pays the fees, costs, and expenses of its operations. If the Sponsor and the Funds are unable to raise sufficient funds so that each Fund’s expenses are reasonable in relation to its NAV, the Funds may be forced to terminate, and investors may lose all or part of their investment. Any expenses related to the operation of the Funds would need to be paid by the Fund at the time of termination.
To the extent that investors use a Fund as a means of investing indirectly in a specific Commodity Interest, there is the risk that the changes in the price of the Fund’s Shares on the NYSE Arca will not closely track with the changes in spot price of that Commodity Interest. This could happen if the price of Shares traded on the NYSE Arca does not correlate with the Fund’s NAV, if the changes in the Fund’s NAV do not correlate with changes in the Benchmark, or if the changes in the Benchmark do not correlate with changes in the cash or spot price of the specific Commodity Interest. This is a risk because if these correlations are not sufficiently close, then investors may not be able to use the Fund as a cost effective way to invest indirectly in the specific Commodity Interest, or the underlying specific Commodity Interest in the case of TAGS, or as a hedge against the risk of loss in commodity related transactions.
Only an Authorized Purchaser may engage in creation or redemption transactions directly with the Funds. The Funds have a limited number of institutions that act as Authorized Purchasers. To the extent that these institutions exit the business or are unable to proceed with creation and/or redemption orders with respect to the Funds and no other Authorized Purchaser is able to step forward to create or redeem Creation Units, a Fund’s shares may trade at a discount to NAV and possibly face trading halts and/or delisting. In addition, a decision by a market maker, lead market maker, or other large investor, to cease activities for the Funds or a decision by a secondary market participant to sell a significant number of the Fund’s Shares could adversely affect liquidity, the spread between the bid and ask quotes, and potentially the price of the Shares. The Sponsor can make no guarantees that participation by Authorized Purchasers or market makers will continue.
An investment in the Funds faces numerous risks from its shares being traded in the secondary market, any of which may lead to the Fund’s shares trading at a premium or discount to NAV. Although Fund shares are listed for trading on the NYSE Arca, there can be no assurance that an active trading market for such shares will develop or be maintained. Trading in Fund shares may be halted due to market conditions or for reasons that, in the view of the NYSE Arca, make trading in shares inadvisable. There can be no assurance that the requirements of the NYSE Arca necessary to maintain the listing of any Fund will continue to be met or will remain unchanged or that the shares will trade with any volume, or at all. The NAV of the Fund’s shares will generally fluctuate with changes in the market value of the Fund’s portfolio holdings. The market prices of shares will generally fluctuate in accordance with changes in the Fund’s NAV and supply and demand of shares on the NYSE Arca. It cannot be predicted whether the Fund’s shares will trade below at or above their NAV. Investors buying or selling Fund shares in the secondary market will pay brokerage commissions or other charges imposed by brokers as determined by that broker. Brokerage commissions are often a fixed amount and may be a significant proportional cost for investors seeking to buy or sell relatively small amounts of shares. Trading volume of the shares of each Fund could be affected by investors who trade significant quantities of shares on any given business day. Such investors may or may not file all required SEC filings reporting ownership of such shares. In addition, if interest rates realized on cash balances were to continue to decline, there is a risk that the net investment ratio of the Funds may increase from the current level.
Neither the Trust, nor any of the Funds, is an investment company subject to the Investment Company Act of 1940. Accordingly, you do not have the protections afforded by that statute, which, for example, requires investment companies to have a board of directors with a majority of disinterested directors and regulates the relationship between the investment company and its investment manager.
The arrangements between clearing brokers and counterparties on the one hand, and the Funds on the other, generally are terminable by the clearing brokers or counterparty upon notice to the Funds. In addition, the agreements between the Funds and their third-party service providers, such as the Distributor and the Custodian, are generally terminable at specified intervals. Upon termination, the Sponsor may be required to renegotiate or make other arrangements for obtaining similar services if the Funds intend to continue to operate. Comparable services from another party may not be available or may not be available on the terms as favorable as those of the expired or terminated arrangements.
| 57 |
| Table of Contents |
The Sponsor does not employ trading advisors for the Funds; however, it reserves the right to employ them in the future. The only advisor to the Funds is the Sponsor. A lack of independent trading advisors may be disadvantageous to the Funds because they will not receive the benefit of their independent expertise.
The Sponsor’s trading strategy is quantitative in nature, and it is possible that the Sponsor will make errors in its implementation. The execution of the quantitative strategy is subject to human error, such as incorrect inputs into the Sponsor’s computer systems and incorrect information provided to the Funds’ clearing brokers. In addition, it is possible that a computer or software program may malfunction and cause an error in computation. Any failure, inaccuracy, or delay in executing the Funds’ transactions could affect its ability to achieve its investment objective. It could also result in decisions to undertake transactions based on inaccurate or incomplete information. This could cause substantial losses on transactions. The Sponsor is not required to reimburse the Funds for any costs associated with an error in the placement or execution of a trade in commodity futures interests or shares of the Underlying Funds.
The Funds’ trading activities depend on the integrity and performance of the computer and communications systems supporting them. Extraordinary transaction volume, hardware or software failure, power or telecommunications failure, a natural disaster or other catastrophe could cause the computer systems to operate at an unacceptably slow speed or even fail. Any significant degradation or failure of the systems that the Sponsor uses to gather and analyze information, enter orders, process data, monitor risk levels and otherwise engage in trading activities may result in substantial losses on transactions, liability to other parties, lost profit opportunities, damages to the Sponsor’s and Funds’ reputations, increased operational expenses and diversion of technical resources.
The development of complex computer and communications systems and new technologies may render the existing computer and communications systems supporting the Funds’ trading activities obsolete. In addition, these computer and communications systems must be compatible with those of third parties, such as the systems of exchanges, clearing brokers and the executing brokers. As a result, if these third parties upgrade their systems, the Sponsor will need to make corresponding upgrades to effectively continue its trading activities. The Funds’ future success may depend on the Funds’ ability to respond to changing technologies on a timely and cost-effective basis.
The Funds depend on the proper and timely function of complex computer and communications systems maintained and operated by the futures exchanges, brokers, and other data providers that the Sponsor uses to conduct trading activities. Failure or inadequate performance of any of these systems could adversely affect the Sponsor’s ability to complete transactions, including its ability to close out positions, and result in lost profit opportunities and significant losses on commodity interest transactions. This could have a material adverse effect on revenues and materially reduce the Funds’ available capital. For example, unavailability of price quotations from third parties may make it difficult or impossible for the Sponsor to conduct trading activities so that each Fund will closely track its Benchmark. Unavailability of records from brokerage firms may make it difficult or impossible for the Sponsor to accurately determine which transactions have been executed or the details, including price and time, of any transaction executed. This unavailability of information also may make it difficult or impossible for the Sponsor to reconcile its records of transactions with those of another party or to accomplish settlement of executed transactions.
The operations of the Funds, the exchanges, brokers, and counterparties with which the Funds do business, and the markets in which the Funds do business could be severely disrupted in the event of a major terrorist attack, natural disaster, cyber-attack, outbreak, or public health emergency as declared by the World Health Organization, continuation or expansion of war or other hostilities. Global terrorist attacks, anti-terrorism initiatives, and political unrest continue to fuel this concern. In addition, a prolonged U.S. government shutdown could weaken the U.S. economy, interfere with the commodities markets that rely upon data published by U.S. federal government agencies, and prevent the Funds from receiving necessary regulatory review or approvals.
A climate of uncertainty and panic, including the contagion of the COVID-19 virus and other infectious viruses or diseases, may adversely affect global, regional, and local economies and reduce the availability of potential investment opportunities, and increases the difficulty of performing due diligence and modeling market conditions, potentially reducing the accuracy of financial projections. Under these circumstances, the Funds may have difficulty achieving their investment objectives which may adversely impact performance. Further, such events can be highly disruptive to economies and markets, significantly disrupt the operations of individual companies (including, but not limited to, the Funds’ Sponsor and third party service providers), sectors, industries, markets, securities and commodity exchanges, currencies, interest and inflation rates, credit ratings, investor sentiment, and other factors affecting the value of the Funds’ investments. These factors could cause substantial market volatility, exchange trading suspensions and closures that could impact the ability of the Funds to complete redemptions and otherwise affect Fund performance and Fund trading in the secondary market. A widespread crisis may also affect the global economy in ways that cannot necessarily be foreseen at the current time. How long such events will last and whether they will continue or recur cannot be predicted. Impacts from these events could have significant impact on a Fund’s performance, resulting in losses to your investment. The future global economic impact may cause the underlying assumptions and expectations of the Funds to become outdated quickly or inaccurate, resulting in significant losses.
| 58 |
| Table of Contents |
In late February 2022, Russia invaded Ukraine, significantly amplifying already existing geopolitical tensions among Russia and other countries in the region and in the west. The responses of countries and political bodies to Russia’s actions, the larger overarching tensions, and Ukraine’s military response and the potential for wider conflict may increase financial market volatility generally, have severe adverse effects on regional and global economic markets, and cause volatility in the price of agricultural products, including agricultural futures, and the share price of the Funds.
Failures or breaches of the electronic systems of the Funds, the Sponsor, the Custodian or mutual funds or other financial institutions in which the Funds invest, or the Funds’ other service providers, market makers, Authorized Purchasers, NYSE Arca, exchanges on which Futures Contracts or Other Commodity Interests are traded or cleared, or counterparties have the ability to cause disruptions and negatively impact the Funds’ business operations, potentially resulting in financial losses to the Funds and their shareholders. Such failures or breaches may include intentional cyber-attacks that may result in an unauthorized party gaining access to electronic systems in order to misappropriate a Fund’s assets or sensitive information. While the Funds have established business continuity plans and risk management systems seeking to address system breaches or failures, there are inherent limitations in such plans and systems. Furthermore, the Funds cannot control the cyber security plans and systems of the Custodian or mutual funds or other financial institutions in which the Funds invest, or the Funds’ other service providers, market makers, Authorized Purchasers, NYSE Arca, exchanges on which Futures Contracts or Other Commodity Interests are traded or cleared, or counterparties
The Trust may, in its discretion, suspend the right to redeem Shares of the Funds or postpone the redemption settlement date: (1) for any period during which an applicable exchange is closed other than customary weekend or holiday closing, or trading is suspended or restricted; (2) for any period during which an emergency exists as a result of which delivery, disposal or evaluation of a Fund’s assets is not reasonably practicable; (3) for such other period as the Sponsor determines to be necessary for the protection of Shareholders; (4) if there is a possibility that any or all of the Benchmark Component Futures Contracts of a Fund on the specific exchange where the Fund is traded and from which the NAV of the Fund is calculated will be priced at a daily price limit restriction; or (5) if, in the sole discretion of the Sponsor, the execution of such an order would not be in the best interest of the Funds or their Shareholders. In addition, the Trust will reject a redemption order if the order is not in proper form as described in the agreement with the Authorized Purchaser or if the fulfillment of the order, in the opinion of its counsel, might be unlawful. Any such postponement, suspension or rejection could adversely affect a redeeming Shareholder. For example, the resulting delay may adversely affect the value of the Shareholder’s redemption proceeds if the NAV of a Fund declines during the period of delay. The Trust Agreement provides that the Sponsor and its designees will not be liable for any loss or damage that may result from any such suspension or postponement. A minimum number of baskets and associated Shares are specified for each Fund in its prospectus and in Part I, Item 1 of this document. Once that minimum number of Shares outstanding is reached, there can be no further redemptions until there has been a Creation Basket.
The ability of Authorized Participants to create or redeem shares may be suspended for several reasons, including but not limited to the Fund voluntarily imposing such restrictions. A suspension in the ability of Authorized Participants would have no impact on the Fund’s investment objective – the Fund would continue to seek to track its benchmark. However, with respect to the impact of a suspension on the price of Fund shares in the secondary market, investors may have to pay a higher price to buy shares and receive a lower price when they sell their shares. This “spread” may continue to widen the longer the suspension lasts.
The Intraday Indicative Value (“IIV”) and the Benchmark for each Fund are calculated and disseminated by ICE Data Indices, LLC under an agreement with the Sponsor. Additionally, information may be calculated and disseminated under similar agreements between the Sponsor and other third-party entities. Although reasonable efforts are taken to ensure the accuracy of the information disseminated under this agreement, there may, from time to time, be recalculations of previously released information.
Third parties may assert that the Sponsor has infringed or otherwise violated their intellectual property rights. Third parties may independently develop business methods, trademarks or proprietary software and other technology similar to that of the Sponsor and claim that the Sponsor has violated their intellectual property rights, including their copyrights, trademark rights, trade names, trade secrets and patent rights. As a result, the Sponsor may have to litigate in the future to determine the validity and scope of other parties’ proprietary rights or defend itself against claims that it has infringed or otherwise violated other parties’ rights. Any litigation of this type, even if the Sponsor is successful and regardless of the merits, may result in significant costs, may divert resources from the Funds, or may require the Sponsor to change its proprietary software and other technology or enter into royalty or licensing agreements. The Sponsor has a patent on certain business methods and procedures used with respect to the Funds. The Sponsor utilizes certain proprietary software. Any unauthorized use of such proprietary software, business methods and/or procedures could adversely affect the competitive advantage of the Sponsor or the Funds and/or cause the Sponsor to take legal action to protect its rights.
| 59 |
| Table of Contents |
In managing and directing the day to day activities and affairs of the Funds, the Sponsor relies almost entirely on a small number of individuals, including Mr. Sal Gilbertie, Mr. Steve Kahler and Ms. Cory Mullen-Rusin. If Mr. Gilbertie, Mr. Kahler or Ms. Mullen-Rusin were to leave or be unable to carry out their present responsibilities, it may have an adverse effect on the management of the Funds. To the extent that the Sponsor establishes additional commodity pools, even greater demands will be placed on these individuals.
The Sponsor manages the Trust, each Teucrium Fund, any other series of the Trust that may be formed in the future, and any advisory services provided under the Sponsors registration agreements. You cannot be assured that the Sponsor will be willing or able to continue to service each Fund for any length of time. If the Sponsor operates at a loss for an extended period, its capital will be depleted, and it may be unable to obtain additional financing necessary to continue its operations. If the Sponsor were unable to continue to provide services to these Funds, the Funds would be terminated if a replacement Sponsor could not be found. Any expenses related to the operation of the Funds would need to be paid by the Funds at the time of termination. If the Sponsor discontinues its activities on behalf of a Fund, the Fund may be adversely affected. If the Sponsor’s registrations with the CFTC or memberships in the NFA were revoked or suspended, the Sponsor would no longer be able to provide services to the Funds.
The Funds seek to earn interest on cash balances available for investment. If actual interest rates were to continue to fall, the net investment loss of the Funds could be adversely impacted if the Sponsor were not able to waive expenses sufficient to cover any deficit.
When constructing a diversified portfolio, investors often look for asset classes and individual securities that will enhance the risk adjusted returns of their portfolios. During the security selection process investors typically consider the security’s risk profile as well as its correlation to other portfolio holdings. Commodities are often included in a diversified portfolio due to their low correlation to traditional asset classes such as stocks and bonds. However, it must be noted that portfolio diversification does not eliminate the risk of loss associated with investing. Historical returns and correlations are not guaranteed in the future. It is important to note that past performance is not indicative of future results and that investments cannot be made directly into indexes which are often used to display correlation results.
The Sponsor May Have Conflicts of Interest
The structure and operation of the Funds may involve conflicts of interest. For example, a conflict may arise because the Sponsor and its principals and affiliates may trade for themselves. In addition, the Sponsor has sole current authority to manage the investments and operations, and the interests of the Sponsor may conflict with the Shareholders’ best interests, including the authority of the Sponsor to allocate expenses to and between the Funds.
The Performance of Each Fund May Not Correlate with the Applicable Benchmark
If a Fund is required to sell short-term Treasury Securities or cash equivalents at a price lower than the price at which they were acquired, the Funds will experience a loss. This loss may adversely impact the price of the Shares and may decrease the correlation between the price of the Shares, the Benchmark, and the spot price of the specific commodity interest or the commodity interests of the Underlying Funds in the case of TAGS. The value of short-term Treasury Securities and other debt securities generally moves inversely with movements in interest rates. The prices of longer maturity securities are subject to greater market fluctuations as a result of changes in interest rates. While the short-term nature of a Fund’s investments in short-term Treasury Securities and cash equivalents should minimize the interest rate risk to which the Fund is subject, it is possible that the short-term Treasury Securities and cash equivalents held by the Funds will decline in value.
The Sponsor’s trading system is quantitative in nature, and it is possible that the Sponsor may make errors. In addition, it is possible that a computer or software program may malfunction and cause an error in computation.
Increases in assets under management may affect trading decisions. While all of the Funds’ assets are currently at manageable levels, the Sponsor does not intend to limit the amount of any Fund’s assets. The more assets the Sponsor manages, the more difficult it may be for it to trade profitably because of the difficulty of trading larger positions without adversely affecting prices and performance and of managing risk associated with larger positions.
| 60 |
| Table of Contents |
Each Fund seeks to have the changes in its Shares’ NAV in percentage terms track changes in the Benchmark Component Futures Contracts, rather than profit from speculative trading of the specific Commodity Interests, or the commodity interests of the Underlying Funds in the case of TAGS.
The Sponsor therefore endeavors to manage each Fund so that the Fund’s assets are, unlike those of many other commodity pools, not leveraged (i.e., so that the aggregate amount of the Fund’s exposure to losses from its investments in specific Commodity Interests at any time will not exceed the value of the Fund’s assets). There is no assurance that the Sponsor will successfully implement this investment strategy. If the Sponsor permits a Fund to become leveraged, you could lose all or substantially all of your investment if the Fund’s trading positions suddenly turns unprofitable. These movements in price may be the result of factors outside of the Sponsor’s control and may not be anticipated by the Sponsor.
The Sponsor cannot predict to what extent the performance of the commodity interest will or will not correlate to the performance of other broader asset classes such as stocks and bonds. If the performance of a specific Fund were to move more directly with the financial markets, an investment in the Funds may provide you little or no diversification benefits. Thus, in a declining market, the Funds may have no gains to offset your losses from other investments, and you may suffer losses on your investment in the Funds at the same time you may incur losses with respect to other asset classes. Variables such as drought, floods, weather, embargoes, tariffs, and other political events may have a larger impact on commodity and Commodity Interests prices than on traditional securities and broader financial markets. These additional variables may create additional investment risks that subject a Fund’s investments to greater volatility than investments in traditional securities. Lower correlation should not be confused with negative correlation, where the performance of two asset classes would be opposite of each other. There is no historic evidence that the spot price of a specific commodity, corn, for example, and prices of other financial assets, such as stocks and bonds, are negatively correlated. In the absence of negative correlation, a Fund cannot be expected to be automatically profitable during unfavorable periods for the stock market, or vice versa.
Under the Trust Agreement, the Trustee and the Sponsor are not liable, and have the right to be indemnified, for any liability or expense incurred absent gross negligence or willful misconduct on the part of the Trustee or Sponsor, as the case may be. That means the Sponsor may require the assets of a Fund to be sold in order to cover losses or liability suffered by the Sponsor or by the Trustee. Any sale of that kind would reduce the NAV of the Funds and the value of their Shares.
The Shares of a Fund are limited liability investments; Shareholders may not lose more than the amount that they invest plus any profits recognized on their investment. However, Shareholders could be required, as a matter of bankruptcy law, to return to the estate of the Fund any distribution they received at a time when the Fund was in fact insolvent or that was made in violation of its Trust Agreement.
The price relationship between the near month Commodity Futures Contract to expire and the Benchmark Component Futures Contracts for each Fund, or the Underlying Funds in the case of TAGS, will vary and may impact both a Fund’s total return over time and the degree to which such total return tracks the total return of the specific commodity price indices. In cases in which the near month contract’s price is lower than later expiring contracts’ prices (a situation known as “contango” in the futures markets), then absent the impact of the overall movement in the commodity specific prices the value of the Benchmark Component Futures Contracts would tend to decline as they approach expiration which could cause the Benchmark Component Futures Contracts, and therefore the Fund’s total return, to track lower. In cases in which the near month contract’s price is higher than later expiring contracts’ prices (a situation known as “backwardation” in the futures markets), then absent the impact of the overall movement in commodity specific prices, the value of the Benchmark Component Futures Contracts would tend to rise as they approach expiration.
While it is expected that the trading prices of the Shares will fluctuate in accordance with the changes in a Fund’s NAV, the prices of Shares may also be influenced by various market factors, including but not limited to, the number of shares of the Funds outstanding and the liquidity of the underlying Commodity Interests. There is no guarantee that the Shares will not trade at appreciable discounts from, and/or premiums to, the Fund’s NAV. This could cause the changes in the price of the Shares to substantially vary from the changes in the spot price of the underlying commodity, even if a Fund’s NAV were closely tracking movements in the spot price of that commodity. If this occurs, you may incur a partial or complete loss of your investment.
In addition to certain fees paid to each Fund’s service providers, each Fund pays the Sponsor a fee of 1.00% of assets under management per annum, regardless of Fund Performance. Over time, a Fund’s assets could be depleted if investment performance does not exceed such fees.
| 61 |
| Table of Contents |
Investors, including those who directly participate in the specific commodity market, may choose to use a Fund as a vehicle to hedge against the risk of loss, and there are risks involved in hedging activities. While hedging can provide protection against an adverse movement in market prices, it can also preclude a hedger’s opportunity to benefit from a favorable market movement.
While it is not the current intention of the Funds to take physical delivery of any Commodity under its Commodity Interests, Commodity Futures Contracts are traditionally physically deliverable contracts, and, unless a position was traded out of, it is possible to take or make delivery under these and some Other Commodity Interests. Storage costs associated with purchasing the specific commodity could result in costs and other liabilities that could impact the value of the Commodity Futures Contracts or certain Other Commodity Interests. Storage costs include the time value of money invested in the physical commodity plus the actual costs of storing the commodity less any benefits from ownership that are not obtained by the holder of a futures contract. In general, Commodity Futures Contracts have a one-month delay for contract delivery and the pricing of back month contracts (the back month is any future delivery month other than the spot month) include storage costs. To the extent that these storage costs change for the commodity while a Fund holds the Commodity Interests, the value of the Commodity Interests, and therefore the Fund’s NAV, may change as well.
The Funds are not actively managed and are designed to track a benchmark, regardless of whether the price of the Benchmark Component Futures Contracts is flat, declining, or rising.
The design of each Fund’s Benchmark is such that the Benchmark Component Futures Contracts change throughout the year, and the Fund’s investments must be rolled periodically to reflect the changing composition of the Benchmark. For example, when the second to expire Commodity Futures Contract becomes the first to expire contract, such contract will no longer be a Benchmark Component Futures Contract and the Fund’s position in it will no longer be consistent with tracking the Benchmark. In the event of a commodity futures market where near to expire contracts trade at a higher price than longer to expire contracts, a situation referred to as “backwardation,” then absent the impact of the overall movement in the specific commodity prices of the Funds, the value of the Benchmark Component Futures Contracts would tend to rise as they approach expiration. As a result, a Fund may benefit because it would be selling more expensive contracts and buying less expensive ones on an ongoing basis. Conversely, using corn as an example, in the event of a corn futures market where near to expire contracts trade at a lower price than longer to expire contracts, a situation referred to as “contango,” then absent the impact of the overall movement in corn prices the value of the Benchmark Component Futures Contracts would tend to decline as they approach expiration. As a result, the Fund’s total return may be lower than might otherwise be the case because it would be selling less expensive contracts and buying more expensive ones. The impact of backwardation and contango may lead the total return of a Fund to vary significantly from the total return of other price references, such as the spot price of the specific commodity. In the event of a prolonged period of contango, and absent the impact of rising or falling specific commodity prices, this could have a significant negative impact on a Fund’s NAV and total return.
Position limits and daily price fluctuation limits set by the CFTC and the exchanges have the potential to cause tracking error, which could cause the price of Shares of the Funds to substantially vary from the Benchmark and prevent you from being able to effectively use the Funds as a way to hedge against underlying commodity related losses or as a way to indirectly invest in the underlying commodity.
There is no way to predict if or when investor demand might cause the Funds to approach position and/or accountability limits. The Underlying Funds have no intention of purchasing commodity interests on foreign exchanges. The Wheat Fund has not approached existing position limit levels of its Benchmark Component Futures Contracts which are traded on the CME with a 19,300 contract limit. Instead, the fund would file an 8-K and prospectus supplement to include the ability to purchase Kansas City Hard Red Winter Wheat futures or MGEX Hard Red Spring Wheat futures in the same contract size and in the same contract months as its existing Benchmark Component Futures Contract holdings. Position limits are 12,000 contracts on each of the exchanges in the aforementioned futures contracts. The Soybean Fund has not approached existing position limit levels of its Benchmark Component Futures Contracts which are traded on the CME with a 27,300 contract limit. The Sugar Fund has not approached existing position accountability levels of its Benchmark Component Futures Contracts which are traded on the Intercontinental Exchange (ICE) with a 15,000 contract limit. Instead, the fund would file an 8-K and prospectus supplement to include the ability to purchase NYSE Sugar futures in the same contract size and in the same contract months as its existing Benchmark Component Futures Contract holdings. Accountability levels are 9000 contracts on the NYMEX. The Corn Fund has not approached existing position limit levels of its Benchmark Component Futures Contracts which are traded on the CME with a 57,800 contract limit.
The Funds currently have three futures commission merchants through which they buy and sell futures contracts. The recent volatility in the commodity futures markets may lead one or both of the Funds’ FCMs to impose risk mitigation procedures that could limit the Funds’ investments in futures contracts beyond the accountability and position limits imposed by futures contract exchanges as discussed herein. One of the FCMs has imposed a financial ceiling on initial margin that could change and become more or less restrictive on the Funds’ activities depending upon a variety of conditions beyond the Sponsor’s control. If the Funds’ other current FCM were to impose position limits, or if any other FCM with which the Funds establish a relationship in the future were to impose position limits, the Funds’ ability to meet its investment objective could be negatively impacted. The Funds continue to monitor and manage its existing relationships with each FCM and will continue to seek additional relationships with FCMs as needed.
| 62 |
| Table of Contents |
The Trust Structure and the Trust Agreement Provide Limited Shareholder Rights
You will have no rights to participate in the management of any of the Funds and will have to rely on the duties and judgment of the Sponsor to manage the Funds.
As interests in separate series of a Delaware statutory trust, the Shares do not involve the rights normally associated with the ownership of shares of a corporation (including, for example, the right to bring shareholder oppression and derivative actions). In addition, the Shares have limited voting and distribution rights (for example, Shareholders do not have the right to elect directors, as the Trust does not have a board of directors, and generally will not receive regular distributions of the net income and capital gains earned by the Funds). The Funds are also not subject to certain investor protection provisions of the Sarbanes Oxley Act of 2002 and the NYSE Arca governance rules (for example, audit committee requirements).
Each Fund is a series of a Delaware statutory trust and not itself a legal entity separate from the other Funds. The Delaware Statutory Trust Act provides that if certain provisions are included in the formation and governing documents of a statutory trust organized in series and if separate and distinct records are maintained for any series and the assets associated with that series are held in separate and distinct records and are accounted for in such separate and distinct records separately from the other assets of the statutory trust, or any series thereof, then the debts, liabilities, obligations and expenses incurred by a particular series are enforceable against the assets of such series only, and not against the assets of the statutory trust generally or any other series thereof. Conversely, none of the debts, liabilities, obligations, and expenses incurred with respect to any other series thereof is enforceable against the assets of such series. The Sponsor is not aware of any court case that has interpreted this inter-series limitation on liability or provided any guidance as to what is required for compliance. The Sponsor intends to maintain separate and distinct records for each Fund and account for each Fund separately from any other Trust series, but it is possible a court could conclude that the methods used do not satisfy the Delaware Statutory Trust Act, which would potentially expose assets in any Fund to the liabilities of one or more of the Funds and/or any other Trust series created in the future.
Neither the Sponsor nor the Trustee is obligated to, although each may, in its respective discretion, prosecute any action, suit or other proceeding in respect of any Fund property. The Trust Agreement does not confer upon Shareholders the right to prosecute any such action, suit, or other proceeding.
Rapidly Changing Regulation May Adversely Affect the Ability of the Funds to Meet Their Investment Objectives
The regulation of futures markets, futures contracts and futures exchanges has historically been comprehensive. The CFTC and the exchanges are authorized to take extraordinary actions in the event of a market emergency including, for example, the retroactive implementation of speculative position limits, increased margin requirements, the establishment of daily price limits and the suspension of trading on an exchange or trading facility.
The regulation of commodity interest transactions in the United States is a rapidly changing area of law and is subject to ongoing modification by governmental and judicial action. Congress enacted the Dodd-Frank Wall Street Reform and Consumer Protection Act (the “Dodd-Frank Act”) in 2010. As the Dodd-Frank Act continues to be implemented by the CFTC and the SEC, there is a possibility of future regulatory changes within the United States altering, perhaps to a material extent, the nature of an investment in the Funds, or the ability for the Funds to continue to implement its investment strategy. In addition, various national governments outside of the United States have expressed concern regarding the disruptive effects of speculative trading in the commodities markets and the need to regulate the derivatives markets in general. The effect of any future regulatory change on the Funds is impossible to predict but could be substantial and adverse.
There Is No Assurance that There Will Be a Liquid Market for the Shares of the Funds or the Funds’ Underlying Investments, which May Mean that Shareholders May Not be Able to Sell Their Shares at a Market Price Relatively Close to the NAV
If a substantial number of requests for redemption of Redemption Baskets are received by the Funds during a relatively short period of time, the Funds may not be able to satisfy the requests from the Fund’s assets not committed to trading. As a consequence, it could be necessary to liquidate the Fund’s trading positions before the time that its trading strategies would otherwise call for liquidation, which may result in losses.
| 63 |
| Table of Contents |
The ability of Authorized Participants to create or redeem shares may be suspended for several reasons, including but not limited to the Fund voluntarily imposing such restrictions. A suspension in the ability of Authorized Participants would have no impact on the Fund’s investment objective – the Fund would continue to seek to track its benchmark. However, with respect to the impact of a suspension on the price of Fund shares in the secondary market, investors may have to pay a higher price to buy shares and receive a lower price when they sell their shares. This “spread” may continue to widen the longer the suspension lasts.
A portion of a Fund’s investments could be illiquid, which could cause large losses to investors at any time or from time to time.
A Fund may not always be able to liquidate its positions in its investments at the desired price. As to futures contracts, it may be difficult to execute a trade at a specific price when there is a relatively small volume of buy and sell orders in a market. Limits imposed by futures exchanges or other regulatory organizations, such as accountability levels, position limits and price fluctuation limits, may contribute to a lack of liquidity with respect to some exchange traded commodity Interests. In addition, over the counter contracts may be illiquid because they are contracts between two parties and generally may not be transferred by one party to a third party without the counterparty’s consent. Conversely, a counterparty may give its consent, but the Funds still may not be able to transfer an over the counter Commodity Interest to a third party due to concerns regarding the counterparty’s credit risk.
The exchanges set daily price fluctuation limits on futures contracts. The daily price fluctuation limit establishes the maximum amount that the price of futures contracts may vary either up or down from the previous day’s settlement price. Once the daily price fluctuation limit has been reached in a particular futures contract, no trades may be made at a price beyond that limit.
On December 16, 2016, as mandated by the Dodd-Frank Act, the CFTC adopted a final rule that aggregate all positions, for purposes of position limits; such positions include futures contracts, futures-equivalent positions, over the counter swaps and options (i.e., contracts that are not traded on exchanges). These aggregation requirements became effective on February 14, 2017 and could limit the Fund’s ability to establish positions in commodity over the counter instruments if the assets of the Funds were to grow substantially.
Effective March 15, 2021, the CFTC adopted amendments in the Final Rule to confirm regulations concerning speculative position limits to the relevant Wall Street Transparency and Accountability Act of 2010 (‘‘Dodd-Frank Act’’) amendments to the Commodity Exchange Act (‘‘CEA’’). Among other regulatory amendments, the Commission is adopting: New and amended Federal spot-month limits for 25 physical commodity derivatives; amended single month and all-months combined limits for most of the agricultural contracts currently subject to Federal position limits; new and amended definitions for use throughout the position limits regulations, including a revised definition of ‘‘bona fide hedging transaction or position’’ and a new definition of ‘‘economically equivalent swaps’’; amended rules governing exchange-set limit levels and grants of exemptions therefrom; a new streamlined process for bona fide hedging recognitions for purposes of Federal position limits; new enumerated bona fide hedges; and amendments to certain regulatory provisions that would eliminate Form 204 while also enabling the Commission to leverage and receive cash-market reporting submitted directly to the exchanges by market participants. If the total net assets of the Funds were to increase significantly from current levels, the Position Limit Rules as proposed could negatively impact the ability of the Funds to meet its respective investment objectives through limits that may inhibit the Sponsor’s ability to sell additional Creation Baskets of the Funds. However, it is not expected that the Funds will reach asset levels that would cause these position limits to be reached in the near future.
A Fund may invest in other commodity interests. To the extent that these other commodity interests are contracts individually negotiated between their parties, they may not be as liquid as Benchmark Component Commodity Futures Contracts and will expose the Funds to credit risk that its counterparty may not be able to satisfy its obligations to the Funds.
The changing nature of the participants in the commodity specific market will influence whether futures prices are above or below the expected future spot price. Producers of the specific commodity will typically seek to hedge against falling commodity prices by selling Commodity Futures Contracts. Therefore, if commodity producers become the predominant hedgers in the futures market, prices of Commodity Futures Contracts will typically be below expected future spot prices. Conversely, if the predominant hedgers in the futures market are the purchasers of the commodity, who purchase Commodity Futures Contracts to hedge against a rise in prices, prices of the Commodity Futures Contracts will likely be higher than expected future spot prices. This can have significant implications for a Fund when it is time to sell a Commodity Futures Contract that is no longer a Benchmark Component Futures Contract and purchase a new Commodity Futures Contract or to sell a Commodity Futures Contract to meet redemption requests. A Fund may invest in Other Commodity Interests. To the extent that these Other Commodity Interests are contracts individually negotiated between their parties, they may not be as liquid as Commodity Futures Contracts and will expose the Fund to credit risk that its counterparty may not be able to satisfy its obligations to the Fund.
| 64 |
| Table of Contents |
A Fund’s NAV includes, in part, any unrealized profits or losses on open swap agreements, futures or forward contracts. Under normal circumstances, the NAV reflects the quoted exchange settlement price of open futures contracts on the date when the NAV is being calculated. In instances when the quoted settlement price of a futures contract traded on an exchange may not be reflective of fair value based on market condition, generally due to the operation of daily limits or other rules of the exchange or otherwise, the NAV may not reflect the fair value of open future contracts on such date. For purposes of financial statements and reports, the Sponsor will recalculate the NAV where necessary to reflect the “fair value” of a Futures Contract when the Futures Contract closes at its price fluctuation limit for the day.
In the event that one or more Authorized Purchasers that are actively involved in purchasing and selling Shares cease to be so involved, the liquidity of the Shares will likely decrease, which could adversely affect the market price of the Shares and result in your incurring a loss on your investment. In addition, a decision by a market maker or lead market maker to cease activities for the Funds could adversely affect liquidity, the spread between the bid and ask quotes, and potentially the price of the Shares. The Sponsor can make no guarantees that participation by Authorized Purchasers or market makers will continue.
If a minimum number of Shares is outstanding for a Fund, market makers may be less willing to purchase Shares of that Fund in the secondary market which may limit your ability to sell Shares. There are a minimum number of baskets and associated Shares specified for each Fund. Once the minimum number of baskets is reached, there can be no more redemptions by an Authorized Purchaser of that Fund until there has been a Creation Basket. In such case, market makers may be less willing to purchase Shares of that Fund from investors in the secondary market, which may in turn limit the ability of Shareholders of that Fund to sell their Shares in the secondary market.
Trading in Shares of a Fund may be halted due to market conditions or, in light of NYSE Arca rules and procedures, for reasons that, in the view of the NYSE Arca, make trading in Shares inadvisable. In addition, trading is subject to trading halts caused by extraordinary market volatility pursuant to “circuit breaker” rules that require trading to be halted for a specified period based on a specified market decline. There can be no assurance that the requirements necessary to maintain the listing of the Shares will continue to be met or will remain unchanged. A Fund will be terminated if its Shares are delisted.
The ability of Authorized Participants to create or redeem shares may be suspended for several reasons, including but not limited to the Fund voluntarily imposing such restrictions. A suspension in the ability of Authorized Participants would have no impact on the Fund’s investment objective – the Fund would continue to seek to track its benchmark. However, with respect to the impact of a suspension on the price of Fund shares in the secondary market, investors may have to pay a higher price to buy shares and receive a lower price when they sell their shares. This “spread” may continue to widen the longer the suspension lasts.
There is Credit Risk Associated with the Operation of the Funds, Service Providers and Counterparties Which May Cause an Investment Loss
For all of the Funds except for TAGS, the majority of each Fund’s assets are held in cash and short-term cash equivalents with the Custodian or with one or more alternate financial institutions unrelated to the Custodian (each, a “Financial Institution”). Any cash or cash equivalents invested by a Fund will be placed by the Sponsor in a Financial Institution deemed by the Sponsor to be of investment-grade credit quality. There is a risk that the proceeds from the sale of the cash equivalents could be less than the purchase price.
The insolvency of the Custodian, any Financial Institution in which funds are deposited, or Commercial Paper Issuer could result in a complete loss of a Fund’s assets held by the Custodian or the Financial Institution, which, at any given time, would likely comprise a substantial portion of a Fund’s total assets. Assets deposited with the Custodian, or a Financial Institution will generally exceed federally insured limits. For TAGS, the vast majority of the Fund’s assets are held in Shares of the Underlying Funds. The failure or insolvency of the Custodian or the Financial Institution could impact the ability to access in a timely manner TAGS’ assets held by the Custodian.
Under CFTC regulations, a clearing broker with respect to a Fund’s exchange traded Commodity Interests must maintain customers’ assets in a bulk segregated account. If a clearing broker fails to do so or is unable to satisfy a substantial deficit in a customer account, its other customers may be subject to risk of a substantial loss of their funds in the event of that clearing broker’s bankruptcy. In that event, the clearing broker’s customers, such as a Fund, are entitled to recover, even in respect of property specifically traceable to them, only a proportional share of all property available for distribution to all of that clearing broker’s customers. A Fund also may be subject to the risk of the failure of, or delay in performance by, any exchanges and markets and their clearing organizations, if any, on which Commodity Interests are traded. From time to time, the clearing brokers may be subject to legal or regulatory proceedings in the ordinary course of their business. A clearing broker’s involvement in costly or time-consuming legal proceedings may divert financial resources or personnel away from the clearing broker’s trading operations, which could impair the clearing broker’s ability to successfully execute and clear a Fund’s trades. For additional information regarding recent regulatory developments that may impact the Funds or the Trust, refer to the section entitled “Regulatory Considerations” section of this document.
| 65 |
| Table of Contents |
Commodity pools’ trading positions in futures contracts or other commodity interests are typically required to be secured by the deposit of margin funds that represent only a small percentage of a futures contract’s (or other commodity interest’s) entire market value. This feature permits commodity pools to “leverage” their assets by purchasing or selling futures contracts (or other commodity interests) with an aggregate notional amount in excess of the commodity pool’s assets. While this leverage can increase a pool’s profits, relatively small adverse movements in the price of a pool’s commodity interests can cause significant losses to the pool. While the Sponsor does not intend to leverage the Funds’ assets, it is not prohibited from doing so under the Trust Agreement. If the Sponsor were to cause or permit a Fund to become leveraged, you could lose all or substantially all of your investment if the Fund’s trading positions suddenly turns unprofitable.
An “exchange for related position” (“EFRP”) can be used by the Funds as a technique to facilitate the exchanging of a futures hedge position against a creation or redemption order, and thus the Funds may use an EFRP transaction in connection with the creation and redemption of shares. The market specialist/market maker that is the ultimate purchaser or seller of shares in connection with the creation or redemption basket, respectively, agrees to sell or purchase a corresponding offsetting futures position which is then settled on the same business day as a cleared futures transaction by the FCMs. The Funds will become subject to the credit risk of the market specialist/market maker until the EFRP is settled or terminated. The Funds report all activity related to EFRP transactions under the procedures and guidelines of the CFTC and the exchanges on which the futures are traded. EFRPs are subject to specific rules of the CME and CFTC guidance. It is likely that EFRP mechanisms will be subject to changes in the future which may make it uneconomical or impossible from the regulatory perspective to utilize this mechanism by the Funds.
A portion of the Fund’s assets may be used to trade over the counter Commodity Interests, such as forward contracts or swaps. Over the counter contracts are typically traded on a principal-to-principal cleared and non-cleared basis through dealer markets that are dominated by major money center and investment banks and other institutions and that prior to the passage of the Dodd-Frank Act had been essentially unregulated by the CFTC, although this is an area of pending, substantial regulatory change. The markets for over the counter contracts will continue to rely upon the integrity of market participants in lieu of the additional regulation imposed by the CFTC on participants in the futures markets. The forward markets have been largely unregulated, except for anti-manipulation and anti-fraud prohibitions, forward contracts have been executed bi-laterally and, in general historically, forward contracts were not cleared or guaranteed by a third party. On November 16, 2012, the Secretary of the Treasury issued a final determination that exempts both foreign exchange swaps and foreign exchange forwards from the definition of “swap” and, by extension, additional regulatory requirements (such as clearing and margin). The final determination does not extend to other FX derivatives, such as FX options, certain currency swaps, and non-deliverable forwards. While the Dodd-Frank Act and certain regulations adopted thereunder are intended to provide additional protections to participants in the over the counter market, the lack of regulation in these markets could expose the Funds in certain circumstances to significant losses in the event of trading abuses or financial failure by participants. While increased regulation of over the counter Commodity Interests is likely to result from changes that are required to be effectuated by the Dodd-Frank Act, there is no guarantee that such increased regulation will be effective to reduce these risks.
Each Fund faces the risk of non-performance by the counterparties to the over the counter contracts. Unlike in futures contracts, the counterparty to these contracts is generally a single bank or other financial institution, rather than a clearing organization backed by a group of financial institutions. As a result, there will be greater counterparty credit risk in these transactions. A counterparty may not be able to meet its obligations to a Fund, in which case the Fund could suffer significant losses on these contracts. If a counterparty becomes bankrupt or otherwise fails to perform its obligations due to financial difficulties, a Fund may experience significant delays in obtaining any recovery in a bankruptcy or other reorganization proceeding. During any such period, a Fund may have difficulty in determining the value of its contracts with the counterparty, which in turn could result in the overstatement or understatement of the Fund’s NAV. A Fund may eventually obtain only limited recovery or no recovery in such circumstances.
Over the counter contracts may have terms that make them less marketable than Futures Contracts. Over the counter contracts are less marketable because they are not traded on an exchange, do not have uniform terms and conditions, and are entered into based upon the creditworthiness of the parties and the availability of credit support, such as collateral, and in general, they are not transferable without the consent of the counterparty. These conditions make such contracts less liquid than standardized futures contracts traded on a commodities exchange and diminish the ability to realize the full value of such contracts. In addition, even if collateral is used to reduce counterparty credit risk, sudden changes in the value of over the counter transactions may leave a party open to financial risk due to a counterparty default since the collateral held may not cover a party’s exposure on the transaction in such situations. In general, valuing OTC derivatives is less certain than valuing actively traded financial instruments such as exchange traded futures contracts and securities because the price and terms on which such OTC derivatives are entered into or can be terminated are individually negotiated, and those prices and terms may not reflect the best price or terms available from other sources. In addition, while market makers and dealers generally quote indicative prices or terms for entering into or terminating OTC contracts, they typically are not contractually obligated to do so, particularly if they are not a party to the transaction. As a result, it may be difficult to obtain an independent value for an outstanding OTC derivatives transaction.
| 66 |
| Table of Contents |
In addition, regulations adopted by global prudential regulators that are now in effect require certain prudentially regulated entities and certain of their affiliates and subsidiaries (including swap dealers) to include in their derivatives contracts and certain other financial contracts, terms that delay or restrict the rights of counterparties (such as the Funds) to terminate such contracts, foreclose upon collateral, exercise other default rights or restrict transfers of credit support in the event that the prudentially regulated entity and/or its affiliates are subject to certain types of resolution or insolvency proceedings. Similar regulations and laws have been adopted in non-US jurisdictions that may apply to a Fund’s counterparties located in those jurisdictions. It is possible that these new requirements, as well as potential additional related government regulation, could adversely affect a Fund’s ability to terminate existing derivatives contracts, exercise default rights or satisfy obligations owed to it with collateral received under such contracts.
There are Risks Associated with Trading in International Markets
A significant portion of the Futures Contracts entered into by the Funds are traded on United States exchanges including the CBOT. However, a portion of the Fund’s trades may take place on markets or exchanges outside the United States. Some non-U.S. markets present risks because they are not subject to the same degree of regulation as their U.S. counterparts. None of the CFTC, NFA, or any domestic exchange regulates activities of any foreign boards of trade or exchanges, including the execution, delivery and clearing of transactions, has the power to compel enforcement of the rules of a foreign board of trade or exchange or of any applicable non-U.S. laws. Similarly, the rights of market participants, such as the Funds, in the event of the insolvency or bankruptcy of a non-U.S. market or broker are also likely to be more limited than in the case of U.S. markets or brokers. As a result, in these markets, the Funds have less legal and regulatory protection than they do when trading domestically. Currently the Funds do not place trades on any markets or exchanges outside of the United States and do not anticipate doing so in the near future.
In some of these non-U.S. markets, the performance on a futures contract is the responsibility of the counterparty and is not backed by an exchange or clearing corporation and therefore exposes the Funds to credit risk. Additionally, trading on non-U.S. exchanges is subject to the risks presented by exchange controls, expropriation, increased tax burdens and exposure to local economic declines and political instability. An adverse development with respect to any of these variables could reduce the profit or increase the loss earned on trades in the affected international markets.
The price of any non-U.S. Commodity Interest and, therefore, the potential profit and loss on such investment, may be affected by any variance in the foreign exchange rate between the time the order is placed and the time it is liquidated, offset, or exercised. However, a portion of the trades for a Fund may take place in markets and on exchanges outside the U. S. Some non-U.S. markets present risks because they are not subject to the same degree of regulation as their U.S. counterparts. Some non-U.S. markets present risks because they are not subject to the same degree of regulation as their U. S. counterparts. As a result, changes in the value of the local currency relative to the U. S. dollar may cause losses to the Funds even if a contract is profitable.
The CFTC’s implementation of its regulations under the Dodd-Frank Act may further affect the Fund’s ability to enter into foreign exchange contracts and to hedge its exposure to foreign exchange losses.
Some non-U.S. exchanges also may be in a more developmental stage so that prior price histories may not be indicative of current price dynamics. In addition, the Funds may not have the same access to certain positions on foreign trading exchanges as do local traders, and the historical market data on which the Sponsor bases its strategies may not be as reliable or accessible as it is for U.S. exchanges.
The Funds are Treated as Partnerships for U.S. Federal Income Tax Purposes which Means that There May be a Lack of Certainty as to Tax Treatment for an Investor’s Gains and Losses
Cash or property will be distributed by the Funds at the sole discretion of the Sponsor, and the Sponsor currently does not intend to make cash or other distributions with respect to Shares. You will be required to pay U.S. federal income tax and, in some cases, state, local, or foreign income tax, on your allocable share of the Fund’s taxable income, without regard to whether you receive distributions or the amount of any distributions. Therefore, the tax liability resulting from your ownership of Shares may exceed the amount of cash or value of property (if any) distributed.
| 67 |
| Table of Contents |
Due to the application of the assumptions and conventions applied by a Fund in making allocations for U.S. federal income tax purposes and other factors, your allocable share of the Fund’s income, gain, deduction, or loss may be different than your economic profit or loss from your Shares for a taxable year. This difference could be temporary or permanent and, if permanent, could result in your being taxed on amounts in excess of your economic income.
The Funds are treated as a partnership for U.S. federal income tax purposes. The U.S. tax rules pertaining to entities taxed as partnerships are complex and their application to publicly traded partnerships, such as the Funds, is in many respects uncertain. The Funds apply certain assumptions and conventions in an attempt to comply with the intent of the applicable rules and to report taxable income, gains, deductions, losses, and credits in a manner that properly reflects Shareholders’ economic gains and losses. These assumptions and conventions may not fully comply with all aspects of the Internal Revenue Code of 1986, as amended (the “Code”), and applicable Treasury Regulations, however, and it is possible that the U.S. Internal Revenue Service (the “IRS”) will successfully challenge our allocation methods and require us to reallocate items of income, gain, deduction, loss, or credit in a manner that adversely affects you. If this occurs, you may be required to file an amended tax return and to pay additional taxes plus deficiency interest.
In addition, for taxable years beginning after December 31, 2017, the Funds may be liable for U.S. federal income tax on any “imputed underpayment” of tax resulting from an adjustment as a result of an IRS audit. The amount of the imputed underpayment generally includes increases in allocations of items of income or gains to any investor and decreases in allocations of items of deduction, loss, or credit to any investor without any offset for any corresponding reductions in allocations of items of income or gain to any investor or increases in allocations of items of deduction, loss, or credit to any investor. If a Fund is required to pay any U.S. federal income tax on any imputed underpayment, the resulting tax liability would reduce the net assets of the Fund and would likely have an adverse impact on the value of the Fund’s Shares. In such a case, the tax liability would in effect be borne by Shareholders that own Shares at the time of such assessment, which may be different persons, or persons with different ownership percentages, than persons owning Shares for the tax year under audit. Under certain circumstances, the Funds may be eligible to make an election to cause Shareholders to take into account the amount of any imputed underpayment, including any interest and penalties. The ability of a publicly traded partnership such as the Funds to make this election is uncertain. If the election is made, the Funds would be required to provide Shareholders who owned beneficial interests in the Shares in the year to which the adjusted allocations relate with a statement setting forth their proportionate shares of the adjustment (“Adjusted K-1s”). The investors would be required to take the adjustment into account in the taxable year in which the Adjusted K-1s are issued.
Under certain circumstances, the Funds may be required to pay withholding tax with respect to allocations to non-U.S. Shareholders. Although the Trust Agreement provides that any such withholding will be treated as being distributed to the non-U.S. Shareholder, the Funds may not be able to cause the economic cost of such withholding to be borne by the non-U.S. Shareholder on whose behalf such amounts were withheld since the Funds do not intend to make any distributions. Under such circumstances, the economic cost of the withholding may be borne by all Shareholders, not just the Shareholders on whose behalf such amounts were withheld. This could have a material impact on the value of your Shares.
The Trust has received an opinion of counsel that, under current U.S. federal income tax laws, each Fund, except TAGS, will be treated, and it is more likely than not that TAGS will be treated as a partnership that is not taxable as a corporation for U.S. federal income tax purposes, provided that (i) at least 90 percent of the Fund’s annual gross income satisfies certain requirements regarding “qualifying income” as defined in the Code, (ii) the Fund is organized and operated in accordance with its governing agreements and applicable law, and (iii) the Fund does not elect to be taxed as a corporation for U.S. federal income tax purposes. Although the Sponsor anticipates that each Fund has satisfied and will continue to satisfy the “qualifying income” requirement for all of its taxable years, that result cannot be assured. The Funds have not requested and will not request any ruling from the IRS with respect to its classification as a partnership not taxable as a corporation for U.S. federal income tax purposes. If the IRS were to successfully assert that the Funds are taxable as a corporation for U.S. federal income tax purposes in any taxable year, rather than passing through its income, gains, losses, and deductions proportionately to Shareholders, the Funds would be subject to tax on its net income for the year at corporate tax rates. In addition, although the Sponsor does not currently intend to make distributions with respect to Shares, any distributions would be taxable to Shareholders as dividend income to the extent of the Fund’s current and accumulated earnings and profits, then treated as a tax-free return of capital to the extent of the Shareholder’s basis in the Shares (and will reduce the basis), and, to the extent it exceeds a Shareholder’s basis in such Shares, as capital gain for Shareholders who hold their Shares as capital assets. Taxation of the Funds as a corporation could materially reduce the after-tax return on an investment in Shares and could substantially reduce the value of your Shares.
There is very limited authority on the U.S. federal income tax treatment of bitcoin and no direct authority on bitcoin derivatives, such as Bitcoin Futures Contracts. Bitcoin Futures Contracts more likely than not will be considered futures with respect to commodities for purposes of the qualifying income exception under section 7704 of the Code. Based on a CFTC determination that treats bitcoin as a commodity under the CEA, the Fund intends to take the position that Bitcoin Futures Contracts consist of futures on commodities for purposes of the qualifying income exception under section 7704 of the Code. Shareholders should be aware that the Fund’s position is not binding on the IRS, and no assurance can be given that the IRS will not challenge the Fund’s position, or that the IRS or a court will not ultimately reach a contrary conclusion, which would result in the material adverse consequences to Shareholders and the Fund.
| 68 |
| Table of Contents |
Legislative, regulatory, or administrative changes could be enacted or promulgated at any time, either prospectively or with retroactive effect, and may adversely affect the Funds and their Shareholders. Please consult a tax advisor regarding the implications of an investment in Shares of the Teucrium Funds, including without limitation the federal, state, local and foreign tax consequences.
Risks Specific to the Teucrium Corn Fund
Investors may choose to use the Fund as a means of investing indirectly in corn, and there are risks involved in such investments. The risks and hazards that are inherent in corn production may cause the price of corn to fluctuate widely. Price movements for corn are influenced by, among other things: weather conditions, crop failure, production decisions, governmental policies, changing demand, the corn harvest cycle, and various economic and monetary events. Corn production is also subject to U.S. federal, state and local regulations that could materially affect operations.
The price movements for corn are influenced by, among other things, weather conditions, crop disease, transportation difficulties, various planting, growing, and harvesting problems, governmental policies, changing demand, and seasonal fluctuations in supply. More generally, commodity prices may be influenced by economic and monetary events such as changes in interest rates, changes in balances of payments and trade, U.S. and international inflation rates, currency valuations and devaluations, U.S. and international economic events, and changes in the philosophies and emotions of market participants. Because the Fund invests primarily in interests in a single commodity, it is not a diversified investment vehicle, and therefore may be subject to greater volatility than a diversified portfolio of stocks or bonds or a more diversified commodity pool. Historically, price changes in corn have a low correlation with the S&P 500. Historical performance is not indicative of future results and correlations may change.
The Fund is subject to the risks and hazards of the corn market because it invests in Corn Interests. The risks and hazards that are inherent in the corn market may cause the price of corn to fluctuate widely. If the changes in percentage terms of the Fund’s Shares accurately track the percentage changes in the Benchmark or the spot price of corn, then the price of its Shares will fluctuate accordingly.
The price and availability of corn is influenced by economic and industry conditions, including but not limited to supply and demand factors such as: crop disease and infestation (including, but not limited to, Leaf Blight, Ear Rot and Root Rot); transportation difficulties; various planting, growing, or harvesting problems; and severe weather conditions (particularly during the spring planting season and the fall harvest) such as drought, floods, or frost that are difficult to anticipate and which cannot be controlled. Demand for corn in the United States to produce ethanol has also been a significant factor affecting the price of corn. In turn, demand for ethanol has tended to increase when the price of gasoline has increased and has been significantly affected by United States governmental policies designed to encourage the production of ethanol. Additionally, demand for corn is affected by changes in consumer tastes, national, regional, and local economic conditions, and demographic trends. Finally, because corn is often used as an ingredient in livestock feed, demand for corn is subject to risks associated with the outbreak of livestock disease.
Corn production is subject to United States federal, state, and local policies and regulations that materially affect operations. Governmental policies affecting the agricultural industry, such as taxes, tariffs, duties, subsidies, incentives, acreage control, and import and export restrictions on agricultural commodities and commodity products, can influence the planting of certain crops, the location and size of crop production, the volume and types of imports and exports, the availability and competitiveness of feedstocks as raw materials, and industry profitability. Additionally, corn production is affected by laws and regulations relating to, but not limited to, the sourcing, transporting, storing, and processing of agricultural raw materials as well as the transporting, storing, and distributing of related agricultural products. U.S. corn producers also must comply with various environmental laws and regulations, such as those regulating the use of certain pesticides, and local laws that regulate the production of genetically modified crops. In addition, international trade disputes can adversely affect agricultural commodity trade flows by limiting or disrupting trade between countries or regions.
Seasonal fluctuations in the price of corn may cause risk to an investor because of the possibility that Share prices will be depressed because of the corn harvest cycle. In the United States, the corn market is normally at its weakest point, and corn prices are lowest, shortly before and during the harvest (between September and November), due to the high supply of corn in the market. Conversely, corn prices are generally highest during the winter and spring (between December and May), when farmer-owned corn has largely been sold and used. Seasonal corn market peaks generally occur around February or March. These normal market conditions are, however, often influenced by weather patterns, and domestic and global economic conditions, among other factors, and any specific year may not necessarily follow the traditional seasonal fluctuations described above. In the futures market, these seasonal fluctuations are typically reflected in contracts expiring in the relevant season (e.g., contracts expiring during the harvest season are typically priced lower than contracts expiring in the winter and spring). Thus, seasonal fluctuations could result in an investor incurring losses upon the sale of Fund Shares, particularly if the investor needs to sell Shares when the Benchmark Component Futures Contracts are, in whole or part, Corn Futures Contracts expiring in the fall.
| 69 |
| Table of Contents |
Demand for corn in the United States to produce ethanol has also been a significant factor affecting the price of corn. In turn, demand for ethanol has tended to increase when the price of gasoline has increased and has been significantly affected by United States governmental policies designed to encourage the production of ethanol. Additionally, demand for corn is affected by changes in consumer tastes, national, regional, and local economic conditions, and demographic trends. Finally, because corn is often used as an ingredient in livestock feed, demand for corn is subject to risks associated with the outbreak of livestock disease.
The CFTC and U.S. designated contract markets, such as the CBOT, may establish position limits on the maximum net long or net short futures contracts in commodity interests that any person or group of persons under common trading control (other than as a hedge, which an investment by the Fund is not) may hold, own or control. For example, the current position limit for investments at any one time in the Corn Futures Contracts are 1,200 spot month contracts, 57,800 contracts expiring in any other single month, and 57,800 total for all months. These position limits are fixed ceilings that the Fund would not be able to exceed without specific CFTC authorization.
All of these limits may potentially cause a tracking error between the price of the Shares and the Benchmark. This may in turn prevent you from being able to effectively use the Fund as a way to hedge against correlated losses or as a way to indirectly invest in corn.
The Fund does not intend to limit the size of the offering and will attempt to expose substantially all of its proceeds to the corn market utilizing Corn Interests. If the Fund encounters position limits, accountability levels, or price fluctuation limits for Corn Futures Contracts on the CBOT, it may then, if permitted under applicable regulatory requirements, purchase Other Corn Interests and/or Corn Futures Contracts listed on foreign exchanges. However, the Corn Futures Contracts available on such foreign exchanges may have different underlying sizes, deliveries, and prices. In addition, the Corn Futures Contracts available on these exchanges may be subject to their own position limits and accountability levels. In any case, notwithstanding the potential availability of these instruments in certain circumstances, position limits could force the Fund to limit the number of Creation Baskets that it sells.
Risks Specific to the Teucrium Soybean Fund
Investors may choose to use the Fund as a means of investing indirectly in soybeans, and there are risks involved in such investments. The risks and hazards that are inherent in soybean production may cause the price of soybeans to fluctuate widely. Global price movements for soybeans are influenced by, among other things: weather conditions, crop failure, production decisions, governmental policies, changing demand, the soybean harvest cycle, and various economic and monetary events. Soybean production is also subject to domestic and foreign regulations that could materially affect operations.
As discussed in more detail below, price movements for soybeans are influenced by, among other things, weather conditions, crop disease, transportation difficulties, various planting, growing, and harvesting problems, governmental policies, changing demand, and seasonal fluctuations in supply. More generally, commodity prices may be influenced by economic and monetary events such as changes in interest rates, changes in balances of payments and trade, U.S. and international inflation rates, currency valuations and devaluations, U.S. and international economic events, and changes in the philosophies and emotions of market participants. Because the Fund invests primarily in interests in a single commodity, it is not a diversified investment vehicle, and therefore may be subject to greater volatility than a diversified portfolio of stocks or bonds or a more diversified commodity pool.
The Fund is subject to the risks and hazards of the soybean market because it invests in Soybean Interests. The risks and hazards that are inherent in the soybean market may cause the price of soybeans to fluctuate widely. If the changes in percentage terms of the Fund’s Shares accurately track the percentage changes in the Benchmark or the spot price of soybeans, then the price of its Shares will fluctuate accordingly.
The price and availability of soybeans is influenced by economic and industry conditions, including but not limited to supply and demand factors such as: crop disease; weed control; water availability; various planting, growing, or harvesting problems; severe weather conditions such as drought, floods, heavy rains, frost, or natural disasters that are difficult to anticipate and which cannot be controlled; uncontrolled fires, including arson; challenges in doing business with foreign companies; legal and regulatory restrictions; transportation costs; interruptions in energy supply; currency exchange rate fluctuations; global trade disruption due to outbreaks; and political and economic instability. Additionally, demand for soybeans is affected by changes in international, national, regional, and local economic conditions, and demographic trends. The increased production of soybean crops in South America and the rising demand for soybeans in emerging nations such as China and India have increased competition in the soybean market.
| 70 |
| Table of Contents |
Soybean production is subject to United States and foreign policies and regulations that materially affect operations. Governmental policies affecting the agricultural industry, such as taxes, tariffs, duties, subsidies, incentives, acreage control, and import and export restrictions on agricultural commodities and commodity products, can influence the planting of certain crops, the location and size of crop production, the volume and types of imports and exports, and industry profitability. Additionally, soybean production is affected by laws and regulations relating to, but not limited to, the sourcing, transporting, storing, and processing of agricultural raw materials as well as the transporting, storing, and distributing of related agricultural products. Soybean producers also may need to comply with various environmental laws and regulations, such as those regulating the use of certain pesticides. In addition, international trade disputes can adversely affect agricultural commodity trade flows by limiting or disrupting trade between countries or regions.
Because processing soybean oil can create trans-fats, the demand for soybean oil may decrease due to heightened governmental regulation of trans-fats or trans-fatty acids. The U.S. Food and Drug Administration currently requires food manufacturers to disclose levels of trans-fats contained in their products, and various local governments have enacted or are considering restrictions on the use of trans-fats in restaurants. Several food processors have either switched or indicated an intention to switch to oil products with lower levels of trans-fats or trans-fatty acids.
In recent years, there has been increased global interest in the production of biofuels as alternatives to traditional fossil fuels and as a means of promoting energy independence. Soybeans can be converted into biofuels such as biodiesel. Accordingly, the soybean market has become increasingly affected by demand for biofuels and related legislation.
The costs related to soybean production could increase and soybean supply could decrease as a result of restrictions on the use of genetically modified soybeans, including requirements to segregate genetically modified soybeans and the products generated from them from other soybean products.
Seasonal fluctuations in the price of soybeans may cause risk to an investor because of the possibility that Share prices will be depressed because of the soybean harvest cycle. In the futures market, fluctuations are typically reflected in contracts expiring in the harvest season (i.e., contracts expiring during the fall are typically priced lower than contracts expiring in the winter and spring). Thus, seasonal fluctuations could result in an investor incurring losses upon the sale of Fund Shares, particularly if the investor needs to sell Shares when the Benchmark Component Futures Contracts are, in whole or part, Soybean Futures Contracts expiring in the fall.
The increased production of soybean crops in South America and the rising demand for soybeans in emerging nations such as China and India have increased competition in the soybean market. Like the conversion of corn into ethanol, soybeans can be converted into biofuels such as biodiesel. Accordingly, the soybean market has become increasingly affected by demand for biofuels and related legislation. The supply of soybeans could be reduced by the spread of soybean rust, a wind-borne fungal disease. Although soybean rust can be killed with chemicals, chemical treatment increases production costs for farmers. Finally, because processing soybean oil can create trans-fats, the demand for soybean oil may decrease due to heightened governmental regulation of trans-fats or trans-fatty acids. The U.S. Food and Drug Administration currently requires food manufacturers to disclose levels of trans-fats contained in their products, and various local governments have enacted or are considering restrictions on the use of trans-fats in restaurants. Several food processors have either switched or indicated an intention to switch to oil products with lower levels of trans-fats or trans-fatty acids.
The CFTC and U.S. designated contract markets, such as the CBOT, may establish position limits on the maximum net long or net short futures contracts in commodity interests that any person or group of persons under common trading control (other than as a hedge, which an investment by the Fund is not) may hold, own or control. For example, the current position limit for investments at any one time in the Soybean Futures Contracts are 1,200 spot month contracts, 27,300 contracts expiring in any other single month, and 27,300 total for all months. Soybean Swaps are subject to position limits that are similar to, but currently measured separately from, the limits on Soybean Futures Contracts. These position limits are fixed ceilings that the Fund would not be able to exceed without specific CFTC authorization.
All of these limits may potentially cause a tracking error between the price of the Shares and the Benchmark. This may in turn prevent you from being able to effectively use the Fund as a way to hedge against soybean-related losses or as a way to indirectly invest in soybeans.
| 71 |
| Table of Contents |
If the Fund encounters position limits or price fluctuation limits for Soybean Futures Contracts on the CBOT, it may then, if permitted under applicable regulatory requirements, purchase Other Soybean Interests and/or Soybean Futures Contracts listed on foreign exchanges. However, the Soybean Futures Contracts available on such foreign exchanges may have different underlying sizes, deliveries, and prices. In addition, the Soybean Futures Contracts available on these exchanges may be subject to their own position limits or similar restrictions. In any case, notwithstanding the potential availability of these instruments in certain circumstances, position limits could force the Fund to limit the number of Creation Baskets that it sells.
Risks Specific to the Teucrium Sugar Fund
Investors may choose to use the Fund as a means of investing indirectly in sugar, and there are risks involved in such investments. The risks and hazards that are inherent in sugar production may cause the price of sugar to fluctuate widely. Global price movements for sugar are influenced by, among other things: weather conditions, crop failure, production decisions, governmental policies, changing demand, the sugar harvest cycle, and various economic and monetary events. Sugar production is also subject to domestic and foreign regulations that could materially affect operations.
As discussed in more detail below price movements for sugar are influenced by, among other things, weather conditions, crop disease, transportation difficulties, various planting, growing, and harvesting problems, governmental policies, changing demand, and seasonal fluctuations in supply. More generally, commodity prices may be influenced by economic and monetary events such as changes in interest rates, changes in balances of payments and trade, U.S. and international inflation rates, currency valuations and devaluations, U.S. and international economic events, and changes in the philosophies and emotions of market participants. Because the Fund invests primarily in interests in a single commodity, it is not a diversified investment vehicle, and therefore may be subject to greater volatility than a diversified portfolio of stocks or bonds or a more diversified commodity pool.
The Fund is subject to the risks and hazards of the world sugar market because it invests in Sugar Interests. The two primary sources for the production of sugar are sugarcane and sugar beets, both of which are grown in various countries around the world. The risks and hazards that are inherent in the world sugar market may cause the price of sugar to fluctuate widely. If the changes in percentage terms of the Fund’s Shares accurately track the percentage changes in the Benchmark or the spot price of sugar, then the price of its Shares will fluctuate accordingly.
The global price and availability of sugar is influenced by economic and industry conditions, including but not limited to supply and demand factors such as: crop disease; weed control; water availability; various planting, growing, or harvesting problems; severe weather conditions such as drought, floods, or frost that are difficult to anticipate and which cannot be controlled; uncontrolled fires, including arson; challenges in doing business with foreign companies; legal and regulatory restrictions; fluctuation of shipping rates; currency exchange rate fluctuations; and political and economic instability. Global demand for sugar to produce ethanol has also been a significant factor affecting the price of sugar. Additionally, demand for sugar is affected by changes in consumer tastes, national, regional, and local economic conditions, and demographic trends. The spread of consumerism and the rising affluence of emerging nations such as China and India have created demand for sugar. An influx of people in developing countries moving from rural to urban areas may create more disposable income to be spent on sugar products and might also reduce sugar production in rural areas on account of worker shortages, all of which would result in upward pressure on sugar prices. On the other hand, public health concerns regarding obesity, heart disease and diabetes, particularly in developed countries, may reduce demand for sugar. In light of the time it takes to grow sugarcane and sugar beets and the cost of new facilities for processing these crops, it may not be possible to increase supply quickly or in a cost-effective manner in response to an increase in demand for sugar.
Sugar production is subject to United States and foreign policies and regulations that materially affect operations. Governmental policies affecting the agricultural industry, such as taxes, tariffs, duties, subsidies, incentives, acreage control, and import and export restrictions on agricultural commodities and commodity products, can influence the planting of certain crops, the location and size of crop production, the volume and types of imports and exports, and industry profitability. Many foreign countries subsidize sugar production, resulting in lower prices, but this has led other countries, including the United States, to impose tariffs and import restrictions on sugar imports. Sugar producers also may need to comply with various environmental laws and regulations, such as those regulating the use of certain pesticides.
Seasonal fluctuations in the price of sugar may cause risk to an investor because of the possibility that Share prices will be depressed because of the sugar harvest cycle. In the futures market, contracts expiring during the harvest season are typically priced lower than contracts expiring in the winter and spring. While the sugar harvest seasons varies from country to country, prices of Sugar Futures Contracts tend to be lowest in the late spring and early summer, reflecting the harvest season in Brazil, the world’s leading producer of sugarcane. Thus, seasonal fluctuations could result in an investor incurring losses upon the sale of Fund Shares, particularly if the investor needs to sell Shares when the Benchmark Component Futures Contracts are, in whole or part, Sugar Futures Contracts expiring in the late spring or early summer.
| 72 |
| Table of Contents |
The spread of consumerism and the rising affluence of emerging nations such as China and India have created demand for sugar. An influx of people in developing countries moving from rural to urban areas may create more disposable income to be spent on sugar products and might also reduce sugar production in rural areas on account of worker shortages, all of which could result in upward pressure on sugar prices. On the other hand, public health concerns regarding obesity, heart disease and diabetes, particularly in developed countries, may reduce demand for sugar. In light of the time it takes to grow sugarcane and sugar beets and the cost of new facilities for processing these crops, it may not be possible to increase supply quickly or in a cost-effective manner in response to an increase in demand.
The CFTC and U.S. designated contract markets, such as the ICE Futures have established position limits and accountability levels on the maximum net long or net short Sugar Futures Contracts that any person or group of persons under common trading control may hold, own or control. For example, the current ICE Futures established position limit level for investments in Sugar No. 11 Futures Contracts for the spot month, which is defined as on and after the second business day following the expiration of the regular option contract traded on the expiring futures contract, is 5,000, the accountability level for investments in ICE Sugar No. 11 Futures Contracts for any one month is 10,000, and the accountability level for all combined months is 15,000. While accountability levels are not fixed ceilings, they are thresholds above which the exchange may exercise greater scrutiny and control over an investor, including limiting an investor to holding no more Sugar No. 11 Futures Contracts than the amount established by the accountability level. The Fund does not intend to invest in Sugar Futures Contracts in excess of any applicable accountability levels.
All of these limits may potentially cause a tracking error between the price of the Shares and the Benchmark. This may in turn prevent you from being able to effectively use the Fund as a way to hedge against sugar-related losses or as a way to indirectly invest in sugar.
If the Fund encounters accountability levels, position limits, or price fluctuation limits for Sugar Futures Contracts on ICE Futures, it may then, if permitted under applicable regulatory requirements, purchase Other Sugar Interests and/or Sugar Futures Contracts listed on the NYMEX or foreign exchanges. However, the Sugar Futures Contracts available on such foreign exchanges may have different underlying sizes, deliveries, and prices. In addition, the Sugar Futures Contracts available on these exchanges may be subject to their own position limits and accountability levels. In any case, notwithstanding the potential availability of these instruments in certain circumstances, position limits could force the Fund to limit the number of Creation Baskets that it sells.
Risks Specific to the Teucrium Wheat Fund
Investors may choose to use the Fund as a means of investing indirectly in wheat, and there are risks involved in such investments. The risks and hazards that are inherent in wheat production may cause the price of wheat to fluctuate widely. Price movements for wheat are influenced by, among other things: weather conditions, crop failure, production decisions, governmental policies, changing demand, the wheat harvest cycle, and various economic and monetary events. Wheat production is also subject to U.S. federal, state and local regulations that could materially affect operations.
As discussed in more detail below, price movements for wheat are influenced by, among other things, weather conditions, crop disease, transportation difficulties, various planting, growing, and harvesting problems, governmental policies, changing demand, and seasonal fluctuations in supply. More generally, commodity prices may be influenced by economic and monetary events such as changes in interest rates, changes in balances of payments and trade, U.S. and international inflation rates, currency valuations and devaluations, U.S. and international economic events, and changes in the philosophies and emotions of market participants. Because the Fund invests primarily in interests in a single commodity, it is not a diversified investment vehicle, and therefore may be subject to greater volatility than a diversified portfolio of stocks or bonds or a more diversified commodity pool.
The Fund is subject to the risks and hazards of the wheat market because it invests in Wheat Interests. The risks and hazards that are inherent in the wheat market may cause the price of wheat to fluctuate widely. If the changes in percentage terms of the Fund’s Shares accurately track the percentage changes in the Benchmark or the spot price of wheat, then the price of its Shares will fluctuate accordingly.
The price and availability of wheat is influenced by economic and industry conditions, including but not limited to supply and demand factors such as: crop disease, weed control, water availability, various planting, growing, or harvesting problems, severe weather conditions such as drought, floods, or frost that are difficult to anticipate and which cannot be controlled. Demand for food products made from wheat flour is affected by changes in consumer tastes, national, regional, and local economic conditions, and demographic trends. More specifically, demand for such food products in the United States is relatively unaffected by changes in wheat prices or disposable income but is closely tied to tastes and preferences. Export demand for wheat fluctuates yearly, based largely on crop yields in the importing countries.
| 73 |
| Table of Contents |
Wheat production is subject to United States federal, state, and local policies and regulations that materially affect operations. Governmental policies affecting the agricultural industry, such as taxes, tariffs, duties, subsidies, incentives, acreage control, and import and export restrictions on agricultural commodities and commodity products, can influence the planting of certain crops, the location and size of crop production, the volume and types of imports and exports, the availability and competitiveness of feedstocks as raw materials, and industry profitability. Additionally, wheat production is affected by laws and regulations relating to, but not limited to, the sourcing, transporting, storing, and processing of agricultural raw materials as well as the transporting, storing, and distributing of related agricultural products. U.S. wheat producers also must comply with various environmental laws and regulations, such as those regulating the use of certain pesticides, and local laws that regulate the production of genetically modified crops. In addition, international trade disputes can adversely affect agricultural commodity trade flows by limiting or disrupting trade between countries or regions.
Seasonal fluctuations in the price of wheat may cause risk to an investor because of the possibility that Share prices will be depressed because of the wheat harvest cycle. In the United States, the market for winter wheat, the type of wheat upon which CBOT Wheat Futures Contracts are based, is generally at its lowest point, and wheat prices are generally lowest, shortly before and during the harvest (in the spring or early summer), due to the high supply of wheat in the market. Conversely, winter wheat prices are generally highest in the fall or early winter when the wheat harvested that year has largely been sold and used. In the futures market, these seasonal fluctuations are typically reflected in contracts expiring in the relevant season (e.g., contracts expiring during the harvest season are typically priced lower than contracts expiring in the fall and early winter). Thus, seasonal fluctuations could result in an investor incurring losses upon the sale of Fund Shares, particularly if the investor needs to sell Shares when the Benchmark Component Futures Contracts are in whole or part, Wheat Futures Contracts expiring in the spring.
Demand for food products made from wheat flour is affected by changes in consumer tastes, national, regional, and local economic conditions, and demographic trends. More specifically, demand for such food products in the United States is relatively unaffected by changes in wheat prices or disposable income but is closely tied to tastes and preferences. For example, in recent years the increase in the popularity of low-carbohydrate diets caused the consumption of wheat flour to decrease rapidly before rebounding somewhat after 2005. Export demand for wheat fluctuates yearly, based largely on crop yields in the importing countries.
Position limits and daily price fluctuation limits set by the CFTC and the exchanges have the potential to cause tracking error, which could cause the price of Shares to substantially vary from the Benchmark and prevent you from being able to effectively use the Fund as a way to hedge against wheat-related losses or as a way to indirectly invest in wheat.
The CFTC and U.S. designated contract markets, such as the CBOT, may establish position limits on the maximum net long or net short futures contracts in commodity interests that any person or group of persons under common trading control (other than as a hedge, which an investment by the Fund is not) may hold, own or control. For example, the current position limit for investments at any one time in the Wheat Futures Contracts are 1,200 spot month contracts, 19,300 contracts expiring in any other single month, and 19,300 total for all months. Wheat Swaps are subject to position limits that are similar to, but currently measured separately from, the limits on Wheat Futures Contracts. These position limits are fixed ceilings that the Fund would not be able to exceed without specific CFTC authorization.
If the Fund encounters position limits, accountability levels, or price fluctuation limits for Wheat Futures Contracts on the CBOT, it may then, if permitted under applicable regulatory requirements, purchase Other Wheat Interests and/or Wheat Futures Contracts listed on other U.S. exchanges or on foreign exchanges. However, the Wheat Futures Contracts available on such foreign exchanges may have different underlying sizes, deliveries, and prices. In addition, the Wheat Futures Contracts available on these exchanges may be subject to their own position limits and accountability levels. In any case, notwithstanding the potential availability of these instruments in certain circumstances, position limits could force the Fund to limit the number of Creation Baskets that it sells.
Risks Specific to the Hashdex BITCOIN FUTURES ETF
Risks Associated with Investing in Bitcoin
Further Development and Acceptance of Bitcoin and the Bitcoin Network Is Uncertain.
The further development and acceptance of the Bitcoin Network, which is part of a new and rapidly changing industry, is subject to a variety of factors that are difficult to evaluate. The slowing, stopping or reversing of the development or acceptance of the Bitcoin Network may adversely affect the price of bitcoin and therefore cause the Fund to suffer losses. Regulatory changes or actions may alter the nature of an investment in bitcoin or restrict the use of bitcoin or the operations of the Bitcoin Network or venues on which bitcoin trades in a manner that adversely affects the price of bitcoin and, therefore, the Fund’s Bitcoin Futures Contracts. Bitcoin generally operates without central authority (such as a bank) and is not backed by any government. Bitcoin is not legal tender and federal, state and/or foreign governments may restrict the use and exchange of bitcoin, and regulation in the United States is still developing. For example, it may become difficult or illegal to acquire, hold, sell or use bitcoin in one or more countries, which could adversely impact the price of bitcoin, and therefore the value of the Fund’s Bitcoin Futures Contracts.
| 74 |
| Table of Contents |
“Forks” in Bitcoin Network Could Have Adverse Effects.
From time to time, developers of the bitcoin network suggest changes to the bitcoin software. If a sufficient number of users and miners elect not to adopt the changes, a new digital asset, operating on the earlier version of the bitcoin software, may be created. This is often referred to as a “fork.”
In August 2017, bitcoin “forked” into bitcoin and a new digital asset, bitcoin cash, as a result of a several-year dispute over how to increase the rate of transactions that the Bitcoin network can process. Since then, bitcoin has been forked numerous times to launch new digital assets, such as bitcoin gold, bitcoin silver and bitcoin diamond. Additional hard forks of the Bitcoin blockchain could adversely affect the market for Bitcoin Futures in which the Fund invests and, therefore, an investment in the Fund. A substantial giveaway of bitcoin (sometimes referred to as an “air drop”) may also result in significant and unexpected declines in the value of bitcoin, Bitcoin Futures Contracts, and the Fund.
Rewards for mining bitcoin are designed to decline over time, which may lessen the incentive for miners to process and confirm transactions on the Bitcoin Network.
Transactions in bitcoin are processed by miners who are primarily compensated by receiving newly issued bitcoin as a reward for successfully solving cryptological puzzles according to a payment schedule that declines over time (in some instances, miners are also compensated through voluntary fees paid by Bitcoin Network participants). If this compensation is not sufficient to incentivize miners to process transactions, the confirmation process for transactions, which acts as security for the Bitcoin Network, may become slower and the Bitcoin Network may become more vulnerable. These and similar events may have a significant adverse effect on the price and liquidity of bitcoin and the value of an investment in the Fund.
The Bitcoin Network may face scalability challenges as it expands to a greater number of users.
As with other digital asset networks, the Bitcoin Network faces significant scaling challenges because public blockchains generally face a tradeoff between security and scalability. A decentralized network is less susceptible to manipulation or capture if more participants, or “nodes,” are involved in the processing and maintenance of such network. However, a greater number of nodes decreases the network’s efficiency in processing transactions and may result in increased settlement times. Increased settlement times could discourage certain uses for bitcoin (for example, micropayments), and could reduce demand for and price of bitcoin, which could adversely impact the value of an investment in the Fund.
Bitcoin Markets Are Susceptible To Extreme Price Fluctuations, Theft, Loss and Destruction.
The market price of bitcoin has been subject to extreme fluctuations. If bitcoin markets continue to be subject to sharp fluctuations, the Fund’s Shareholders may experience losses. Similar to fiat currencies (i.e., a currency that is backed by a central bank or a national, supra-national or quasi-national organization), bitcoin is susceptible to theft, loss and destruction. Accordingly, the Fund’s Bitcoin Futures are also susceptible to these risks. Cybersecurity risks of the Bitcoin Protocol and of entities that custody or facilitate the transfers or trading of bitcoin could result in a loss of public confidence in bitcoin, a decline in the value of bitcoin and, as a result, adversely impact the Fund’s Bitcoin Futures Contracts.
Bitcoin Ownership is Concentrated in a Small Number of Holders Referred to as ‘Whales.’
A significant portion of bitcoin is held by a small number of holders who have the ability to affect the price of bitcoin and who are sometimes referred to as “whales.” Because bitcoin is lightly regulated, bitcoin whales have the ability, alone or in coordination, to manipulate the price of bitcoin by restricting or expanding the supply of bitcoin. Activities of bitcoin whales that reduce user confidence in bitcoin, the Bitcoin Network or the fairness of bitcoin trading venues, or that affect the price of bitcoin, could have a negative impact on the value of an investment in the Fund.
| 75 |
| Table of Contents |
Bitcoin Exchanges Are Unregulated and May Be More Exposed to Fraud and Failure.
Bitcoin exchanges and other trading venues on which bitcoin trades are relatively new and, in most cases, largely unregulated and may therefore be more exposed to fraud and failure than established, regulated exchanges for securities, derivatives and other currencies. The Fund’s indirect investment in bitcoin remains subject to volatility experienced by the bitcoin exchanges and other bitcoin trading venues. Such volatility can adversely affect an investment in the Fund. Bitcoin exchanges have in the past stopped and may in the future stop operating or permanently shut down due to fraud, cybersecurity issues, manipulation, technical glitches, hackers or malware, which may also affect the price of bitcoin and thus the Fund’s indirect investment in bitcoin. Fraud and failure related to such bitcoin exchanges could result in a loss of public confidence in bitcoin and a decline in the value of bitcoin, which could adversely impact the adoption of bitcoin or acceptance of bitcoin and cause a decline in value of the Fund’s Bitcoin Futures Contracts.
Networked Systems Are Vulnerable to Attacks.
All networked systems are vulnerable to various kinds of attacks. As with any computer network, the Bitcoin network contains certain flaws. For example, the Bitcoin network is currently vulnerable to a “51% attack” where, if a mining pool were to gain control of more than 50% of the “hash” rate, or the amount of computing and process power being contributed to the network through mining, a malicious actor would be able to gain full control of the network and the ability to manipulate the blockchain. A significant portion of bitcoin is held by a small number of holders sometimes referred to as “whales.” These holders have the ability to manipulate the price of bitcoin.
Cybersecurity Risk.
As a digital asset, bitcoin is subject to cybersecurity risks, including the risk that malicious actors will exploit flaws in its code or structure that will allow them to, among other things, steal bitcoin held by others, control the blockchain, steal personally identifying information, or issue significant amounts of bitcoin in contravention of the Bitcoin Protocols. The occurrence of any of these events is likely to have a significant adverse impact on the price and liquidity of bitcoin and Bitcoin Futures Contracts and therefore the value of an investment in the Fund. Additionally, the Bitcoin network’s functionality relies on the Internet. A significant disruption of Internet connectivity affecting large numbers of users or geographic areas could impede the functionality of the Bitcoin network. Any technical disruptions or regulatory limitations that affect Internet access may have an adverse effect on the Bitcoin network, the price of bitcoin and Bitcoin Futures Contracts, and the value of an investment in the Fund.
Limited Adoption and Ability to Use Bitcoin to Purchase Goods.
Currently, there is relatively limited use of bitcoin in the retail and commercial marketplace in comparison to relatively extensive use as a store of value, thus contributing to price volatility that could adversely affect the Fund’s Bitcoin Futures Contracts. Bitcoin is not currently a form of legal tender in the United States and has only recently become selectively accepted as a means of payment for goods and services by some retail and commercial outlets, and the use of bitcoin by consumers to pay such retail and commercial outlets remains limited. Banks and other established financial institutions may refuse to process funds for bitcoin transactions; process wire transfers to or from bitcoin trading venues, bitcoin-related companies or service providers; or maintain accounts for persons or entities transacting in bitcoin or providing bitcoin-related services. In addition, some taxing jurisdictions, including the U.S., treat the use of bitcoin as a medium of exchange for goods and services to be a taxable sale of bitcoin, which could discourage the use of bitcoin as a medium of exchange, especially for a holder of bitcoin that has appreciated in value.
Risks to Bitcoin from Other parts of the Cryptocurrency Market.
The price of bitcoin and the bitcoin market generally may be adversely impacted by developments in other parts of the cryptocurrency market. The acceptance of bitcoin and cryptocurrency generally depends on a number of factors, including adverse developments in the cryptocurrency market that could impact investor confidence. For example, “stablecoins” have been developed to enhance the value of cryptocurrency to be used like fiat currency in transactions in goods and services. Adverse developments such as the recent “depegging”: of the TerraUSD stablecoin may undermine confidence in the cryptocurrency markets generally and cause decreases in the price of cryptocurrencies such as bitcoin.
Hacking Risk of Theft of Private Keys.
Due to the nature of private keys, bitcoin transactions are irrevocable and stolen or incorrectly transferred bitcoin may be irretrievable, and as a result, any incorrectly executed bitcoin transactions could adversely affect the price and liquidity of bitcoin, which may indirectly affect the price and liquidity of the Bitcoin Futures Contracts.
| 76 |
| Table of Contents |
Environmental risks from bitcoin mining.
Bitcoin mining currently requires computing hardware that consumes large amounts of electricity. By way of electrical power generation, many bitcoin miners rely on fossil fuels to power their operations. Public perception of the impact of bitcoin mining on climate change may reduce demand for bitcoin and increase the likelihood of regulation that limits bitcoin mining or restricts energy usage by bitcoin miners. Such events could have an impact on the price of bitcoin, bitcoin futures, and the performance of the Fund
Risks Associated with Investing in Bitcoin Futures Contracts
Investing in Bitcoin Futures Contracts subjects the Fund to the Risks of the Bitcoin Market.
The Fund is subject to the risks and hazards of the bitcoin market because it invests in Bitcoin Futures Contracts listed on the CME. The risks and hazards that are inherent in the bitcoin market may cause the price of bitcoin and the Fund’s Shares to fluctuate widely and you could incur a partial or total loss of your investment in the Fund. The prices of bitcoin and bitcoin futures contracts have historically been highly volatile. The value of the Fund’s investments in bitcoin futures – and therefore the value of an investment in the Fund – could decline significantly and without warning, including to zero. If you are not prepared to accept significant and unexpected changes in the value of the Fund and the possibility that you could lose your entire investment in the Fund you should not invest in the Fund.
The Bitcoin Futures Contracts listed on the CME are a relatively new type of futures contract that may be less developed than other, more established futures markets.
The Bitcoin Futures Contracts listed on the CME are a relatively new type of futures contract that may be less developed than more established futures markets (such as the futures markets for corn or wheat). Accordingly, although BTC Contracts have traded on the CME since December 2017 and MBT Contracts have traded on the CME since May 2021 and the market for exchange listed Bitcoin Futures Contracts has grown since inception, the market for Bitcoin Futures Contracts may be riskier, less liquid, more volatile and more vulnerable to economic, market, industry, regulatory and other changes than more established futures contracts. The liquidity of the market for BTC Contracts and MBT Contracts will depend on, among other things, the supply and demand for Bitcoin Futures Contracts, speculative interest in the market for Bitcoin Futures Contracts and the potential ability to hedge against the price of bitcoin with Bitcoin Futures Contracts.
An investment in the Fund is subject to the risks of an investment in futures contracts.
An investment in the Fund is subject to the risks of an investment in futures contracts, which are complex instruments that are often subject to a high degree of price variability. Because the price of Bitcoin Futures Contracts is linked to the price of bitcoin, an investment in the Fund may be riskier than other exchange-traded products that do not hold financial instruments related to bitcoin and may not be suitable for all investors.
Futures contracts are subject to inherent leverage risk because they are typically secured by margin deposits representing a small percentage of a futures contract’s entire market value.
Commodity pools’ trading positions in futures contracts are typically required to be secured by the deposit of margin funds that represent only a small percentage of a futures contract’s entire market value. This feature creates the potential for commodity pools to “leverage” their assets by purchasing or selling futures contracts with an aggregate notional amount in excess of the commodity pool’s assets. While futures contracts are generally subject to leverage risk, the NYSE Arca rule under which the Fund’s Shares will be listed and traded prevents the Fund from utilizing leverage.
Pricing anomalies in the bitcoin futures market could cause losses.
Market fraud and/or manipulation and other fraudulent trading practices such as the intentional dissemination of false or misleading information (e.g., false rumors) can, among other things, lead to a disruption of the orderly functioning of markets, significant market volatility, and cause the value of bitcoin futures to fluctuate quickly and without warning. Depending on the timing of an investor’s purchases and sales of the Fund’s Shares, these pricing anomalies could case the investor to incur losses.
| 77 |
| Table of Contents |
Risks of Government Regulation.
The Financial Industry Regulatory Authority (“FINRA”) issued a notice on March 8, 2022 seeking comment on measures that could prevent or restrict investors from buying a broad range of public securities and products designated as “complex products” – which could include each Exchange Traded Product offered by the Sponsor. The ultimate impact, if any, of these measures remain unclear. However, if regulations are adopted, they could, among other things, prevent or restrict investors’ ability to buy the Fund.
Correlation Risk
The Benchmark is not designed to correlate with the spot price of bitcoin, and this could cause the changes in the price of the Shares to substantially vary from the changes in the spot price of bitcoin. Therefore, you may not be able to effectively use the Fund to hedge against bitcoin related losses or to indirectly invest in bitcoin.
The correlation between changes in such Bitcoin Futures Contracts and the spot price of bitcoin will be only approximate. Weak correlation between the Benchmark and the spot price of bitcoin may result from the factors discussed above. Imperfect correlation may also result from speculation in Benchmark Component Futures Contracts, and/or technical or other factors that may influence the trading of Benchmark Component Futures Contracts. If there is a weak correlation between the Benchmark and the spot price of bitcoin, then the price of Shares may not accurately track the spot price of bitcoin and you may not be able to effectively use the Fund as a way to hedge the risk of losses in your bitcoin related transactions or as a way to indirectly invest in bitcoin.
Moreover, while there is a spot bitcoin index calculated by the CME that is based on price feeds from certain designated bitcoin spot market exchanges, the Fund will generally not directly price off of this index. This is because the Fund will roll its futures holdings prior to settlement of the expiring contract and intends to never carry futures positions all the way to cash settlement (the only date that the BTC Contracts and MBT Contracts settle to the CME spot price index). The Fund will only price off of Bitcoin Futures Contracts volume-weighted average price (VWAP) daily settlement price, which might cause the Fund’s NAV to differ from spot bitcoin prices.
Changes in the Fund’s NAV may not correlate well with changes in the price of the Benchmark. If this were to occur, you may not be able to effectively use the Fund as a way to hedge against bitcoin related losses or as a way to indirectly invest in bitcoin.
The Sponsor endeavors to invest the Fund’s assets as fully as possible in Benchmark Component Futures Contracts so that the changes in the NAV closely correlate with the changes in the Benchmark. However, changes in the Fund’s NAV may not correlate with the changes in the Benchmark for various reasons, including those set forth below.
The Fund incurs certain expenses in connection with its operations and holds most of its assets in income producing, short-term financial instruments for margin and other liquidity purposes and to meet redemptions that may be necessary on an ongoing basis. To the extent these expenses are not covered by the Management Fee, and income from short-term financial instruments may cause imperfect correlation between changes in the Fund’s NAV and changes in the Benchmark. Differences between returns based on the price of bitcoin and an investment in the Fund may also be attributable to additional costs related to futures investing and other fund expenses.
The Sponsor may not be able to invest the Fund’s assets in Benchmark Component Futures Contracts having an aggregate notional amount exactly equal to the Fund’s NAV. As a standardized contract, a single BTC Contract is for a specified amount of bitcoin, and the Fund’s NAV and the proceeds from the sale of a Creation Basket is unlikely to be an exact multiple of that amount. In such case, the Fund might not invest the entire proceeds from the purchase of the Creation Basket in such futures contracts. (As an example, assume that a Creation Basket is sold by the Fund, and that the Fund’s closing NAV per Share is $25.00. In that case, the Fund would receive $250,000 in proceeds from the sale of the Creation Basket ($25.00 NAV per Share multiplied by 10,000 Shares and ignoring the Creation Basket fee of $300). If one were to assume further that the Sponsor wants to invest the entire proceeds from the Creation Basket in the Benchmark Component Futures Contracts and that the market value of each such Benchmark Component Futures Contracts is $188,175 (or otherwise not a round number), the Fund would be unable to buy an exact number of BTC Contracts with an aggregate market value equal to $250,000. In this case, the Fund would be able to purchase1BTC Contract with an aggregate market value of approximately $188,175 and 16 MBT Contracts at $3,750 with an aggregate market value of approximately $60,000, bringing the aggregate value of proceeds to $248,175.) Any amounts not invested in Benchmark Component Futures Contracts are held in cash and cash equivalents.
| 78 |
| Table of Contents |
The Benchmark Component Futures Contracts reflect the price of bitcoin for future delivery, not the current spot price of bitcoin, so at best the correlation between changes in such Bitcoin Futures Contracts and the spot price of bitcoin will be only approximate. Weak correlation between the Benchmark and the spot price of bitcoin may result from fluctuations in bitcoin prices discussed above. Imperfect correlation may also result from speculation in Benchmark Component Futures Contracts, technical factors in the trading of Benchmark Component Futures Contracts, and expected inflation in the economy as a whole. If there is a weak correlation between the Benchmark and the spot price of bitcoin, then the price of Shares may not accurately track the spot price of bitcoin and you may not be able to effectively use the Fund as a way to hedge the risk of losses in your bitcoin related transactions or as a way to indirectly invest in bitcoin.
As Fund assets increase, there may be more or less correlation. On the one hand, as the Fund grows it should be able to invest in Benchmark Component Futures Contracts with a notional amount that is closer on a percentage basis to the Fund’s NAV. For example, if the Fund’s NAV is equal to 4.9 times the value of a single futures contract, it can purchase only four futures contracts, which would cause only 81.6% of the Fund’s assets to be exposed to the bitcoin market. On the other hand, if the Fund’s NAV is equal to 100.9 times the value of a single Bitcoin Futures Contract, it can purchase 100 such contracts, resulting in 99.1% exposure.
There may be significant volatility in the market for Bitcoin Futures Contracts. This volatility, in turn, may make it more difficult for Authorized Purchasers and other market purchasers to be able to identify a reliable price for Bitcoin Futures Contracts. Without reliable prices, Authorized Purchasers and other market purchasers may reduce their role in the market arbitrage process or “step away” from these activities. This, in turn, might inhibit the effectiveness of the arbitrage process in maintaining the relationship between the underlying value of the Fund’s Bitcoin Futures Contracts and the Fund’s market price. This reduced effectiveness could result in Fund Shares trading at a price which differs materially from NAV and also in greater than normal intraday bid/ask spreads for Fund Shares.
Position limits, accountability levels and dynamic price fluctuation limits set by the CFTC and the exchanges have the potential to cause tracking error, which could cause the price of Shares to substantially vary from the Benchmark and prevent you from being able to effectively use the Fund as a way to hedge against bitcoin related losses or as a way to indirectly invest in bitcoin.
The CFTC and U.S. designated contract markets, such as the CME, have established position limits and accountability levels on the maximum net long or net short BTC Contracts that the Fund may hold, own or control. Spot position limits are set at 4,000 contracts. A position accountability level of 5,000 contracts will be applied to positions in single months outside the spot month and in all months combined. The MBT Contracts have a spot month limit of 200,000 contracts and a position accountability level of 250,000 contracts. Accountability levels are not fixed ceilings but rather thresholds above which the exchange may exercise greater scrutiny and control over an investor, including limiting the Fund to holding no more Bitcoin Futures Contracts than the amount established by the accountability level. The potential for the Fund to reach position or accountability limits will depend on if and how quickly the Fund’s net assets increase.
In addition to position limits and accountability limits, the CME places daily price fluctuation limits on Bitcoin Futures Contracts that represent the maximum daily price range permitted for a contract. Once a price fluctuation limit has been reached, no trades may be made at a price beyond that limit. Under the price fluctuation mechanism that was initially put into place when Bitcoin Futures Contracts were launched on the CME in December 2017, price fluctuation limits were triggered 116 times. In March 2019, the CME adopted a dynamic price fluctuation mechanism. This mechanism assigns an initial opening price fluctuation limit equal to a percentage of the prior trading day’s settlement price (or a different price if deemed more appropriate), which then moves with the market throughout the day. Since dynamic price fluctuation limits were introduced, price limits have been triggered 89 times and there has been one "hard limit move." A hard limit move is when the price of Bitcoin Futures Contracts exceeds a price limit that defines the minimum/maximum price to which such Bitcoin Futures Contracts can move for the given trade date. If the hard limit is reached, trade matching will not occur at prices above the maximum price or below the minimum price.
Position limits, accountability limits and dynamic price fluctuation limits may limit the Fund’s ability to invest the proceeds of Creation Baskets in Bitcoin Futures Contracts. As result, when the Fund sells Creation Baskets it may be limited in its ability to invest in Bitcoin Futures Contracts, including the Benchmark Component Futures Contracts. In such case, the Fund may hold larger amounts of cash and cash equivalents, which will impair the Fund’s ability to meet its investment objective of tracking the Benchmark.
Price fluctuation limits may contribute to a lack of liquidity and have a negative impact on Fund performance. During periods of market illiquidity, including periods of market disruption and volatility, it may be difficult or impossible for the Fund to buy or sell futures at desired prices or at all.
| 79 |
| Table of Contents |
An investment in the Fund may provide you little or no diversification benefits. Thus, in a declining market, the Fund may have no gains to offset your losses from other investments, and you may suffer losses on your investment in the Fund at the same time you incur losses with respect to other asset classes.
It cannot be predicted to what extent the performance of Benchmark Component Futures Contracts will or will not correlate to the performance of other broader asset classes such as stocks and bonds. If the Fund’s performance were to move more directly with the financial markets, you will obtain little or no diversification benefits from an investment in the Shares. In such a case, the Fund may have no gains to offset your losses from other investments, and you may suffer losses on your investment in the Fund at the same time you incur losses with respect to other investments.
Variables such as cost of electricity, regulation, market disruptions, cyber-attacks and political events may have a larger impact on bitcoin and bitcoin interest prices than on traditional securities and broader financial markets. These additional variables may create additional investment risks that subject the Fund’s investments to greater volatility than investments in traditional securities.
Lower correlation should not be confused with negative correlation, where the performance of two asset classes would be opposite of each other. There is no historic evidence that the spot price of bitcoin and prices of other financial assets, such as stocks and bonds, are negatively correlated. In the absence of negative correlation, the Fund cannot be expected to be automatically profitable during unfavorable periods for the stock market, or vice versa.
If changes in the Fund’s NAV do not correlate with changes in the Benchmark, then investing in the Fund may not be an effective way to hedge against bitcoin related losses or indirectly invest in bitcoin.
Futures Commission Merchant Risks
The Fund Has Two Futures Commission Merchants.
The Fund currently has two futures commission merchants (“FCMs”) through which it buys and sells futures contracts. Volatility in the bitcoin futures market may lead one or both of the Fund’s FCMs to impose risk mitigation procedures that could limit the Fund’s investment in Bitcoin Futures Contracts beyond the accountability and position limits imposed by the CME futures contract exchange as discussed herein. An FCM could impose a financial ceiling on initial margin that could change and become more or less restrictive on the Fund’s activities depending upon a variety of conditions beyond the Sponsor’s control. If the Fund’s FCMs were to impose position limits, or if any other FCM with which the Fund establishes a relationship in the future were to impose position limits, the Fund’s ability to meet its investment objective could be negatively impacted. The Fund continues to monitor and manage its existing relationships with its FCMs and will continue to seek additional relationships with FCMs as needed.
Risks Associated With the Fund’s Investment In Cash and Cash Equivalents
The Fund may experience a loss if it is required to sell cash equivalents at a price lower than the price at which they were acquired.
If the Fund is required to sell its cash equivalents at a price lower than the price at which they were acquired, the Fund will experience a loss. This loss may adversely impact the price of the Shares and may decrease the correlation between the price of the Shares, the Benchmark, and the spot price of bitcoin. The value of cash equivalents held by the Fund generally moves inversely with movements in interest rates. The prices of longer maturity securities are subject to greater market fluctuations as a result of changes in interest rates. While the short-term nature of the Fund’s investments in cash equivalents should minimize the interest rate risk to which the Fund is subject, it is possible that the cash equivalents held by the Fund will decline in value.
Risk Related to Lack of Liquidity
Certain of the Fund’s Investments Could Be Illiquid, Which Could Cause Large Losses to Investors at any Time or from Time to Time.
If the Fund’s ability to obtain exposure to Bitcoin Futures Contracts in accordance with its investment objective is disrupted for any reason including, because of limited liquidity in the bitcoin futures market, a disruption to the bitcoin futures market, or as a result of margin requirements or position limits imposed by the Fund’s futures commission merchants, the CME, or the CFTC, the Fund may not be able to achieve its investment objective and may experience significant losses. Any disruption in the Fund’s ability to obtain exposure to Bitcoin Futures Contracts will cause the Fund’s performance to deviate from the performance of Bitcoin Futures Contracts. In addition, the Fund might grow to a size where a lack of liquidity in the futures market meant that the Fund could not sell enough futures contracts to honor redemption requests. For further information regarding the impact if suspending redemptions, see “Suspension or Rejection of Redemption” on page 47.
| 80 |
| Table of Contents |
A market disruption, such as a government taking regulatory or other actions that disrupt the market in bitcoin, can also make it difficult to liquidate a position. Unexpected market illiquidity may cause major losses to investors at any time or from time to time. In addition, the Fund does not intend at this time to establish a credit facility, which would provide an additional source of liquidity, but instead will rely only on the cash and cash equivalents that it holds to meet its liquidity needs. The anticipated value of the positions in Benchmark Component Futures Contracts that the Sponsor will acquire or enter into for the Fund increases the risk of illiquidity. Because Benchmark Component Futures Contracts may be illiquid, the Fund’s holdings may be more difficult to liquidate at favorable prices in periods of illiquid markets and losses may be incurred during the period in which positions are being liquidated.
The Fund and Other Funds with Similar Investment Strategies May Try To Exit Positions at the Same Time.
If the Fund and other funds with similar investment strategies try to exit their Bitcoin Futures Contract positions at the same time, such a mass exit could have detrimental effect on price and liquidity, and you could incur losses in your investment in Shares of the Fund.
Hedging Risk
If the nature of the purchasers in the futures market shifts such that bitcoin purchasers are the predominant hedgers in the market, the Fund might have to reinvest at higher futures prices or choose other bitcoin interests.
The changing nature of the purchasers in the bitcoin market will influence whether bitcoin futures prices are above or below the expected future spot price. Holders of bitcoin will typically seek to hedge against falling bitcoin prices by selling Bitcoin Futures Contracts. Therefore, if holders of bitcoin become the predominant hedgers in the futures market, prices of Bitcoin Futures Contracts will typically be below expected future spot prices. Conversely, if the predominant hedgers in the futures market are the holders of bitcoin who purchase Bitcoin Futures Contracts to hedge against a rise in prices, prices of Bitcoin Futures Contracts will likely be higher than expected future spot prices. This can have significant implications for the Fund when it is time to sell a Bitcoin Futures Contract that is no longer a Benchmark Component Futures Contract and purchase a new Bitcoin Futures Contract or to sell a Bitcoin Futures Contract to meet redemption requests.
The price relationship between the Benchmark Component Futures Contracts at any point in time and the Bitcoin Futures Contracts that will become Benchmark Component Futures Contracts on the next roll date will vary and may impact both the Fund’s total return and the degree to which its total return tracks that of bitcoin price indices.
The design of the Fund’s Benchmark is such that the Benchmark Component Futures Contracts will change on a monthly basis, and the Fund’s investments may be rolled periodically to reflect the changing composition of the Benchmark. In the event of a bitcoin futures market where near to expire contracts trade at a higher price than longer to expire contracts, a situation referred to as “backwardation,” then absent the impact of the overall movement in bitcoin prices the value of the Benchmark Component Futures Contracts would tend to rise as they approach expiration. As a result, the Fund may benefit because it may be selling more expensive contracts and buying less expensive ones on an ongoing basis. Conversely, in the event of a bitcoin futures market where near to expire contracts trade at a lower price than longer to expire contracts, a situation referred to as “contango,” then absent the impact of the overall movement in bitcoin prices the value of the Benchmark Component Futures Contracts would tend to decline as they approach expiration. As a result, the Fund’s total return may be lower than might otherwise be the case because it may be selling less expensive contracts and buying more expensive ones. The impact of backwardation and contango may lead the total return of the Fund to vary significantly from the total return of other price references, such as the spot price of bitcoin. In the event of a prolonged period of contango, and absent the impact of rising or falling bitcoin prices, this could have a significant negative impact on the Fund’s NAV and total return, and you could incur a partial or total loss of your investment in the Fund.
The design of the Fund’s Benchmark is such that the Benchmark Component Futures Contracts will change on a monthly basis, with the contracts with the shortest maturity being replaced with contracts with a longer maturity. Sometimes the Fund will have to pay more for longer maturity contracts to replace existing shorter maturity contracts about to expire. This situation is known as “contango” in the futures markets. In the event of a prolonged period of contango, and absent the impact of rising or falling bitcoin prices, this could have a negative impact on the Fund’s NAV and total return, which in turn may have a negative impact on your investment in the Fund. By way of example, during the period from 1/1/2019 to 6/30/2022, the market for Bitcoin Component Futures Contracts were in contango approximately 90% of the time, which resulted in an average annual negative roll yield of approximately 7%.
If the futures market is in contango (i.e., when the price of bitcoin in the future is to be more than the current price), the Fund will buy later to expire contracts for a higher price than the soon to expire contracts that it sells. All other things being equal, a situation involving prolonged periods of contango may adversely impact the returns of the Fund.
| 81 |
| Table of Contents |
Regulatory Risk
Lack of Regulation of the Bitcoin Market.
Bitcoin, the Bitcoin Network and the bitcoin trading venues are relatively new and, in most cases, largely unregulated. As a result of this lack of regulation, individuals, or groups may engage in insider trading, fraud or market manipulation with respect to bitcoin. Such manipulation could cause investors in bitcoin to lose money, possibly the entire value of their investments. Over the past several years, a number of bitcoin trading venues have been closed due to fraud, failure or security breaches. The nature of the assets held at bitcoin trading venues make them appealing targets for hackers and a number of bitcoin trading venues have been victims of cybercrimes and other fraudulent activity. These activities have caused significant, in some cases total, losses for bitcoin investors. Investors in bitcoin may have little or no recourse should such theft, fraud or manipulation occur. There is no central registry showing which individuals or entities own bitcoin or the quantity of bitcoin that is owned by any particular person or entity. There are no regulations in place that would prevent a large holder of bitcoin or a group of holders from selling their bitcoins, which could depress the price of bitcoin, or otherwise attempting to manipulate the price of bitcoin or the Bitcoin Network. Events that reduce user confidence in bitcoin, the Bitcoin Network and the fairness of bitcoin trading venues could have a negative impact on the price of bitcoin and the value of an investment in the Fund.
Risk of Illicit Activities.
As bitcoins have grown in both popularity and market size, the U.S. Congress and a number of U.S. federal and state agencies (including the Financial Crimes Enforcement Network of the U.S. Department of the Treasury (“FinCEN”), SEC, CFTC, the Financial Industry Regulatory Authority, Inc. (“FINRA”), the Consumer Financial Protection Bureau (“CFPB”), the Department of Justice, the Department of Homeland Security, the Federal Bureau of Investigation, the IRS, and state financial institution regulators) have been examining the Bitcoin Network, bitcoin users and the Bitcoin Exchange Market, with particular focus on the extent to which bitcoins can be used to launder the proceeds of illegal activities or fund criminal or terrorist enterprises and the safety and soundness of exchanges or other service providers that hold bitcoins for users. The imposition of stricter governmental regulation of the bitcoin market may adversely impact the activities of the Fund, for example, by reducing the liquidity of the bitcoin markets.
Regulation of futures markets, futures contracts and futures exchanges is extensive and constantly changing; future regulatory developments are impossible to predict but may significantly and adversely affect the Fund. This risk is especially heightened for cryptocurrency derivatives and cryptocurrencies.
The regulation of futures markets, futures contracts and futures exchanges has historically been comprehensive. The CFTC and the exchanges are authorized to take extraordinary actions in the event of a market emergency including, for example, the retroactive implementation of speculative position limits, increased margin requirements, the establishment of dynamic price limits and the suspension of trading on an exchange or trading facility.
The regulation of bitcoin interest and crypto derivatives transactions in the United States is a rapidly changing area of law and is subject to ongoing modification by governmental and judicial action. Congress enacted the Dodd-Frank Wall Street Reform and Consumer Protection Act (the “Dodd-Frank Act”) in 2010. As the Dodd-Frank Act continues to be implemented by the CFTC and the SEC, there is a possibility of future regulatory changes within the United States altering, perhaps to a material extent, the nature of an investment in the Fund, or the ability for the Fund to continue to implement its investment strategy. In addition, various national governments outside of the United States have expressed concern regarding the disruptive effects of speculative trading in the commodities and crypto derivatives markets and the need to regulate the derivatives markets in general. The effect of any future regulatory change on the Fund is impossible to predict but could be substantial and adverse.
The regulation of cryptocurrency derivatives and cryptocurrencies continues to evolve. Inconsistent, changing and sometimes conflicting regulations may make it more difficult for Bitcoin businesses to provide services, which may slow the adoption of the Bitcoin economy and may impede consumer adoption of Bitcoin. Future regulatory changes may materially alter the ability to buy and sell Bitcoin and Bitcoin futures or could impact the ability of the Fund to achieve its investment objective. This may alter the nature of an investment in the Fund or the ability of the Fund to continue to operate as planned.
| 82 |
| Table of Contents |
The Fund’s Operating Risks
The Fund may change its investment objective, Benchmark or investment strategies at any time without Shareholder approval or advance notice.
Consistent with applicable provisions of the Trust Agreement and Delaware law, the Fund has broad authority to make changes to the Fund’s operations. The Fund may change its investment objective, Benchmark, or investment strategies and Shareholders of the Fund will not have any rights with respect to these changes. Changes are subject to applicable regulatory requirements, including, but not limited to, any requirement to amend applicable listing rules of the NYSE. The reasons for and circumstances that may trigger any such changes may vary widely and cannot be predicted. By way of example, the Fund may change the term structure or underlying components of the Benchmark in furtherance of the Fund’s investment objective if, due to market conditions, a potential or actual imposition of position limits by the CFTC or futures exchange rules, or the imposition of risk mitigation measures by a futures commission merchant restricts the ability of the Fund to invest in the current Benchmark Futures Contracts. Shareholders may experience losses on their investments in the Fund as a result of such changes.
The Fund is not a registered investment company, so you do not have the protections of the Investment Company Act of 1940.
The Fund is not an investment company subject to the Investment Company Act of 1940. Accordingly, you do not have the protections expressly provided by that statute, including provisions preventing Fund insiders from managing the Fund to their benefit and to the detriment of Fund Shareholders; provisions preventing the Fund from issuing securities having inequitable or discriminatory provisions; provisions preventing Fund management by irresponsible persons; provisions preventing the use of unsound or misleading methods of computing Fund earnings and asset value; provisions prohibiting suspension of redemptions (except under limited circumstances); provisions limiting fund leverage; provisions imposing a fiduciary duty on fund managers with respect to receipt of compensation for services; and provisions preventing changes in the Fund's character without the consent of Fund Shareholders.
The Sponsor is leanly staffed and relies heavily on key personnel to manage trading activities.
In managing and directing the day to day activities and affairs of the Fund, the Sponsor relies almost entirely on a small number of individuals, including Mr. Sal Gilbertie, Mr. Steve Kahler and Ms. Cory Mullen-Rusin. If Mr. Gilbertie, Mr. Kahler or Ms. Mullen-Rusin were to leave or be unable to carry out their present responsibilities, it may have an adverse effect on the management of the Fund. To the extent that the Sponsor establishes additional commodity pools, even greater demands will be placed on these individuals.
The Sponsor has limited capital and may be unable to continue to manage the Fund if it sustains continued losses.
The Sponsor was formed for the purpose of managing the Trust, including the Fund, the other Teucrium Funds, and any other series of the Trust that may be formed in the future, and has been provided with capital primarily by its principals and a small number of outside investors. If the Sponsor operates at a loss for an extended period, its capital will be depleted, and it may be unable to obtain additional financing necessary to continue its operations. If the Sponsor were unable to continue to provide services to the Fund, the Fund would be terminated if a replacement sponsor could not be found. Any expenses related to the operation of the Fund would need to be paid by the Fund at the time of termination.
There are technical and fundamental risks inherent in the trading system the Sponsor intends to employ.
The Sponsor’s trading system is quantitative in nature, and it is possible that the Sponsor may make errors. Any errors or imperfections in the Sponsor’s trading system’s quantitative models, or in the data on which they are based, could adversely affect the Sponsor’s effective use of such trading systems. It is not possible or practicable for the Sponsor’s trading system to factor all relevant, available data into quantitative systems and/or trading decision. There is no guarantee that the Sponsor will use any specific data or type of data in making trading decisions on behalf of the Fund, nor is there any guarantee that the data actually utilized in making trading decisions on behalf of the Fund will be the most accurate data or free from errors. In addition, it is possible that a computer or software program may malfunction and cause an error in computation.
You cannot be assured of the Sponsor’s continued services, and discontinuance may be detrimental to the Fund.
You cannot be assured that the Sponsor will be willing or able to continue to service the Fund for any length of time. The Sponsor was formed for the purpose of sponsoring the Fund and other commodity pools and has limited financial resources and no significant source of income apart from its management fees from such commodity pools to support its continued service for the Fund. If the Sponsor discontinues its activities on behalf of the Fund or another series of the Trust, the Fund may be adversely affected. If the Sponsor’s registrations with the CFTC or memberships in the NFA were revoked or suspended, the Sponsor would no longer be able to provide services to the Fund.
| 83 |
| Table of Contents |
The Fund could terminate at any time and cause the liquidation and potential loss of your investment and could upset the overall maturity and timing of your investment portfolio.
The Fund may terminate at any time, regardless of whether the Fund has incurred losses, subject to the terms of the Trust Agreement. For example, the dissolution or resignation of the Sponsor would cause the Trust to terminate unless Shareholders holding a majority of the outstanding Shares of the Trust, voting together as a single class, elect within 90 days of the event to continue the Trust and appoint a successor Sponsor. In addition, the Sponsor may terminate the Fund if it determines that the Fund’s aggregate net assets in relation to its operating expenses make the continued operation of the Fund unreasonable or imprudent. As of the date of this prospectus, the Sponsor pays the fees, costs, and expenses of the Fund. If the Sponsor and the Fund are unable to raise sufficient funds so that the expenses are reasonable in relation to the Fund’s NAV, the Fund may be forced to terminate, and investors may lose all or part of their investment. Any expenses related to the operation of the Fund would need to be paid by the Sponsor at the time of termination.
However, no level of losses will require the Sponsor to terminate the Fund. The Fund’s termination would result in the liquidation of its investments and the distribution of its remaining assets to the Shareholders on a pro rata basis in accordance with their Shares, and the Fund could incur losses in liquidating its investments in connection with a termination. Termination could also negatively affect the overall maturity and timing of your investment portfolio.
The Sponsor may manage a large amount of assets, and this could affect the Fund’s ability to trade profitably.
Increases in assets under management may affect trading decisions. While the Fund’s assets are currently at manageable levels, the Sponsor does not intend to limit the amount of Fund assets. The more assets the Sponsor manages, the more difficult it may be for it to trade profitably because of the difficulty of trading larger positions without adversely affecting prices and performance and of managing risk associated with larger positions.
The liability of the Sponsor and the Trustee are limited, and the value of the Shares will be adversely affected if the Fund is required to indemnify the Trustee or the Sponsor.
Under the Trust Agreement, the Trustee and the Sponsor are not liable, and have the right to be indemnified, for any liability or expense incurred absent gross negligence or willful misconduct on the part of the Trustee or Sponsor, as the case may be. That means the Sponsor may require the assets of the Fund to be sold in order to cover losses or liability suffered by the Sponsor or by the Trustee. Any sale of that kind would reduce the NAV of the Fund and the value of its Shares.
The Fund may incur higher fees and expenses upon renewing existing or entering into new contractual relationships.
The arrangements between clearing brokers and counterparties on the one hand and the Fund on the other generally are terminable by the clearing brokers or counterparty upon notice to the Fund. In addition, the agreements between the Fund and its third-party service providers, such as the Distributor and the Custodian, are generally terminable at specified intervals. Upon termination, the Sponsor may be required to renegotiate or make other arrangements for obtaining similar services if the Fund intends to continue to operate. Comparable services from another party may not be available, or even if available, these services may not be available on the terms as favorable as those of the expired or terminated arrangements.
The Fund may experience a higher breakeven if interest rates decline.
The Fund seeks to earn interest on cash balances available for investment. If actual interest rates earned were lower than the current rate estimated and if the Sponsor were not able to waive expenses sufficient to cover the deficit, the breakeven estimated by the Fund in the prospectus could be higher.
The Fund is not actively managed.
The Fund is not actively managed and is designed to track a benchmark, regardless of whether the price of the Benchmark Component Futures Contracts is flat, declining or rising. As a result, the Fund may sustain losses that may have been avoidable if the Fund was actively managed.
| 84 |
| Table of Contents |
The Net Asset Value calculation of the Fund may be overstated or understated due to the valuation method employed when a settlement price is not available on the date of net asset value calculation.
The Fund’s NAV includes, in part, any unrealized profits or losses on open positions. Under normal circumstances, the NAV reflects the quoted CME settlement price of open futures contracts on the date when the NAV is being calculated. In instances when the quoted settlement price of futures contracts traded on an exchange may not be reflective of fair value based on market condition, generally due to the operation of daily limits or other rules of the exchange or otherwise, the NAV may not reflect the fair value of open futures contracts on such date. For purposes of financial statements and reports, when a bitcoin futures contract has closed at its price fluctuation limit the Fund will use the daily CME settlement price for the determination of NAV.
Purchases or redemptions of creation units in cash may cause the Fund to incur certain costs or recognize gains or losses.
Purchases and redemptions of creation units will be transacted in cash rather than ‘in-kind’ where creation units are purchased and redeemed in exchange for underlying constituent securities. Purchases of creation baskets with cash may cause the Fund to incur certain costs including brokerage commissions and redemptions of creation baskets with cash may result in the recognition of gains or losses that the Fund might not have incurred if it had made redemptions in-kind.
An unanticipated number of redemption requests during a short period of time could have an adverse effect on the NAV of the Fund.
If a substantial number of requests for redemption of Redemption Baskets are received by the Fund during a relatively short period of time, the Fund may not be able to satisfy the requests from the Fund’s assets not committed to trading. As a consequence, it could be necessary to liquidate the Fund’s trading positions before the time that its trading strategies would otherwise call for liquidation, which may result in losses.
Fund assets may be depleted if investment performance does not exceed fees.
In addition to certain fees paid to the Fund’s service providers, the Fund pays the Sponsor a fee of 0.94% of asset under management per annum, regardless of Fund performance. Over time, the Fund’s assets could be depleted if investment performance does not exceed such fees.
The liquidity of the Shares may be affected by the withdrawal from participation of Authorized Purchasers, market makers, or other significant secondary-market purchasers which could adversely affect the market price of the Shares.
Only an Authorized Purchaser may engage in creation or redemption transactions directly with the Fund. The Fund has a limited number of institutions that act as Authorized Purchasers. To the extent that these institutions exit the business or are unable to proceed with creation and/or redemption orders with respect to the Fund and no other Authorized Purchaser is able to step forward to create or redeem creation units, Fund Shares may trade at a discount to NAV and possibly face trading halts and/or delisting. In addition, a decision by a market maker, lead market maker, or other large investor to cease activities for the Fund or a decision by a secondary market purchaser to sell a significant number of the Fund’s Shares could adversely affect liquidity, the spread between the bid and ask quotes, and potentially the price of the Shares. The Sponsor can make no guarantees that participation by Authorized Purchasers or market makers will continue.
If a minimum number of Shares is outstanding, market makers may be less willing to purchase Shares in the secondary market which may limit your ability to sell Shares.
There is a minimum number of baskets and associated Shares specified for the Fund. If the Fund experienced redemptions that caused the number of Shares outstanding to decrease to the minimum level of Shares required to be outstanding, until the minimum number of Shares is again exceeded through the purchase of a new Creation Basket, there can be no more redemptions by an Authorized Purchaser. In such case, market makers may be less willing to purchase Shares from investors in the secondary market, which may in turn limit the ability of Shareholders of the Fund to sell their Shares in the secondary market. These minimum levels for the Fund are 50,000 Shares representing five baskets. The minimum level of Shares specified for the Fund is subject to change. (The current number of Shares outstanding will be posted daily on our website, http://hashdex-etfs.com/.)
The postponement, suspension or rejection of purchase or redemption orders could adversely affect a Shareholder redeeming their Shares in the Fund.
The postponement, suspension or rejection of creation or redemption orders may adversely affect an investment in the Shares of the Fund. To the extent orders are suspended or rejected, the arbitrage mechanism resulting from the process through which Authorized Purchasers create and redeem Shares directly with the Fund may fail to closely link the price of the Shares to the value of the underlying Bitcoin Futures Contracts, as measured using the Benchmark. If this is the case, the liquidity of the Shares may decline, and the price of the Shares may fluctuate independently of the Benchmark and may fall.
| 85 |
| Table of Contents |
There are no limitations on the Sponsor’s discretion to postpone, suspend or reject purchase or redemption orders under the Securities Act, NYSE Arca rules, or SEC listing orders permitting the listing and trading of the fund’s Shares on NYSE Arca. In addition, Shareholders of the Fund will not have the protections provided in this regard that are applicable to funds regulated under the Investment Company Act of 1940.
Investors may not be able to buy or sell Shares of the Fund through their current brokerages.
Because of volatility and other risks associated with bitcoin-related investments, brokerage firms may limit or not permit trading in such investments. Because of current or future brokerage policies regarding bitcoin-linked securities, investors could have difficulty selling Shares through their brokerage and potentially face restrictions when or how they could trade their Shares.
The failure or bankruptcy of a clearing broker could result in substantial losses for the Fund; the clearing broker could be subject to proceedings that impair its ability to execute the Fund’s trades.
Under CFTC regulations, a clearing broker with respect to the Fund’s exchange-traded bitcoin interests must maintain customers’ assets in a bulk segregated account. If a clearing broker fails to do so or is unable to satisfy a substantial deficit in a customer account, its other customers may be subject to risk of a substantial loss of their funds in the event of that clearing broker’s bankruptcy. In that event, the clearing broker’s customers, such as the Fund, are entitled to recover, even in respect of property specifically traceable to them, only a proportional share of all property available for distribution to all of that clearing broker’s customers. The Fund also may be subject to the risk of the failure of, or delay in performance by, any exchanges and markets and their clearing organizations, if any, on which bitcoin interests are traded.
From time to time, the clearing brokers may be subject to legal or regulatory proceedings in the ordinary course of their business. A clearing broker’s involvement in costly or time-consuming legal proceedings may divert financial resources or personnel away from the clearing broker’s trading operations, which could impair the clearing broker’s ability to successfully execute and clear the Fund’s trades.
The failure or insolvency of the Fund’s Custodian or other financial institution in which the Fund has deposits could result in a substantial loss of the Fund’s assets.
As noted above, the vast majority of the Fund’s assets are held in cash and cash equivalents with the Custodian and other financial institutions, if applicable. The insolvency of the Custodian and any financial institution in which the Fund holds cash and cash equivalents could result in a complete loss of the Fund’s assets.
Third parties may infringe upon or otherwise violate intellectual property rights or assert that the Sponsor has infringed or otherwise violated their intellectual property rights, which may result in significant costs, litigation, and diverted attention of Sponsor’s management.
Third parties may assert that the Sponsor has infringed or otherwise violated their intellectual property rights. Third parties may independently develop business methods, trademarks or proprietary software and other technology similar to that of the Sponsor and claim that the Sponsor has violated their intellectual property rights, including their copyrights, trademark rights, trade names, trade secrets and patent rights. As a result, the Sponsor may have to litigate in the future to determine the validity and scope of other parties’ proprietary rights or defend itself against claims that it has infringed or otherwise violated other parties’ rights. Any litigation of this type, even if the Sponsor is successful and regardless of the merits, may result in significant costs, divert resources from the Fund, or require the Sponsor to change its proprietary software and other technology or enter into royalty or licensing agreements.
The Fund may experience substantial losses on transactions if the computer or communications system fails.
The Fund’s trading activities depend on the integrity and performance of the computer and communications systems supporting them. Extraordinary transaction volume, hardware or software failure, power or telecommunications failure, a natural disaster, cyber-attack or other catastrophe could cause the computer systems to operate at an unacceptably slow speed or even fail. Any significant degradation or failure of the systems that the Sponsor uses to gather and analyze information, enter orders, process data, monitor risk levels and otherwise engage in trading activities may result in substantial losses on transactions, liability to other parties, lost profit opportunities, damages to the Sponsor’s and Fund’s reputations, increased operational expenses and diversion of technical resources.
| 86 |
| Table of Contents |
If the computer and communications systems are not upgraded, when necessary, the Fund’s financial condition could be harmed.
The development of complex computer and communications systems and new technologies may render the existing computer and communications systems supporting the Fund’s trading activities obsolete. In addition, these computer and communications systems must be compatible with those of third parties, such as the systems of exchanges, clearing brokers and the executing brokers. As a result, if these third parties upgrade their systems, the Sponsor will need to make corresponding upgrades to effectively continue its trading activities. The Sponsor may have limited financial resources for these upgrades or other technological changes. The Fund’s future success may depend on the Sponsor’s ability to respond to changing technologies on a timely and cost-effective basis.
The Fund depends on the reliable performance of the computer and communications systems of third parties, such as brokers and futures exchanges, and may experience substantial losses on transactions if they fail.
The Fund depends on the proper and timely function of complex computer and communications systems maintained and operated by the futures exchanges, brokers and other data providers that the Sponsor uses to conduct trading activities. Failure or inadequate performance of any of these systems could adversely affect the Sponsor’s ability to complete transactions, including its ability to close out positions, and result in lost profit opportunities and significant losses on cryptocurrency derivative transactions. This could have a material adverse effect on revenues and materially reduce the Fund’s available capital. For example, unavailability of price quotations from third parties may make it difficult or impossible for the Sponsor to conduct trading activities so that the Fund will closely track the Benchmark. Unavailability of records from brokerage firms may make it difficult or impossible for the Sponsor to accurately determine which transactions have been executed or the details, including price and time, of any transaction executed. This unavailability of information also may make it difficult or impossible for the Sponsor to reconcile its records of transactions with those of another party or to accomplish settlement of executed transactions.
An investment in a Fund faces numerous risks from its Shares being traded in the secondary market, any of which may lead to the Fund’s Shares trading at a premium or discount to NAV.
Although the Fund’s Shares are listed for trading on the NYSE Arca, there can be no assurance that an active trading market for such Shares will develop or be maintained. Trading in the Fund’s Shares may be halted due to market conditions or for reasons that, in the view of the NYSE Arca, make trading in Shares inadvisable. There can be no assurance that the requirements of the NYSE Arca necessary to maintain the listing of the Fund will continue to be met or will remain unchanged or that the Shares will trade with any volume, or at all. The NAV of the Fund’s Shares will generally fluctuate with changes in the market value of the Fund’s portfolio holdings. The market prices of Shares will generally fluctuate in accordance with changes in the Fund’s NAV and supply and demand of Shares on the NYSE Arca. It cannot be predicted whether the Fund’s Shares will trade below at or above their NAV. Investors who buy the Fund’s Shares at a market price that is a premium to NAV face a risk of loss if the market price of their Shares subsequently converges with NAV per Share. Investors buying or selling Fund Shares in the secondary market will pay brokerage commissions or other charges imposed by brokers as determined by that broker. Brokerage commissions are often a fixed amount and may be a significant proportional cost for investors seeking to buy or sell relatively small amounts of Shares.
The NYSE Arca may halt trading in the Shares which would adversely impact your ability to sell Shares.
Trading in Shares of the Fund may be halted by the NYSE Arca due to market conditions or, in light of NYSE Arca rules and procedures, for reasons that, in view of the NYSE Arca, make trading in Shares inadvisable. Such market conditions or other reasons may include when there is significant news directly related to the Fund that, in NYSE Arca’s view or per existing NYSE Arca rules, requires a trading halt, such as when the Sponsor announces news relating to changes/disruptions in the Fund’s create/redeem process during market trading hours. In addition, market conditions that would result in trading halts may also include extraordinary market volatility that trigger rules requiring trading to be halted for a specified period based on a specified market decline. NYSE Arca might also halt trading if there is insufficient trading in BTC or MBT Contracts. There can be no assurance that the requirements necessary to maintain the listing of the Shares will continue to be met or will remain unchanged. The Fund will be terminated if its Shares are delisted.
| 87 |
| Table of Contents |
A Pause in Bitcoin Futures Contracts May lead To Gaps Between Prices in Spot and Futures Markets.
On May 19, 2021, the CME Group temporarily paused trading of bitcoin futures after the bitcoin futures market opened to a large price gap between the derivatives and the underlying crypto asset that triggered CME circuit breakers. Due to the misaligned trading periods between spot and futures markets, such gaps, which can be positive or negative, have the potential to frequently exist and, when CME circuit breakers limit the trading in bitcoin futures markets, bid/ask spreads in Shares of the Fund trading on the NYSE ARCA may be significantly wider than when bitcoin futures markets are trading without restrictions, which may adversely impact your ability to buy or sell Shares in the Fund at a particular price.
The lack of active trading markets for the Shares of the Fund may result in losses on your investment in the Fund at the time of disposition of your Shares.
Although the Shares of the Fund will be listed and traded on the NYSE Arca, there can be no guarantee that an active trading market for the Shares of the Fund will be maintained. If you need to sell your Shares at a time when no active market for them exists, the price you receive for your Shares, assuming that you are able to sell them, likely will be lower than what you would receive if an active market did exist.
The Fund is newly formed and may not be successful in implementing its investment objective or attracting sufficient assets.
The Fund is a new fund, with a limited or no operating history and a small asset base. There can be no assurance that the Fund will grow to or maintain a viable size. Due to the Fund’s small asset base, the Fund’s portfolio transaction costs and any costs that are not paid by the Sponsor pursuant to the Management Fee, may be relatively higher than those of a fund with a larger asset base. To the extent that the Fund does not grow to or maintain a viable size, it may be liquidated, and the expenses, timing and tax consequences of such liquidation may not be favorable to some Shareholders. In this regard, as of the date of this report there are three bitcoin futures-based ETFs. The first fund launched has obtained significantly more assets than the other two. To the extent that this "first mover" advantage continues to favor the first fund launched, this might constrain the Fund's growth.
Sponsoring the Fund will be the Sponsor’s first experience in the crypto asset markets.
There are risks related to the Sponsor’s lack of experience in the crypto asset markets, particularly with respect to marketing the Fund. To address this risk, the Sponsor has entered into the Support Agreement discussed above, under which Hashdex and Victory Capital will provide crypto asset related marketing services. To the extent that the Fund does not grow to or maintain a viable size, it may be liquidated, and the expenses, timing and tax consequences of such liquidation may not be favorable to some Shareholders.
Existing or future bitcoin futures-based ETFs may have significantly lower management fees, which may impede the growth of the Fund.
Existing and future bitcoin futures-based ETFs may have fees that are significantly lower than the Fund's. To the extent that the Fund has relatively higher fees than other such funds, this could impede growth of the Fund, possibly result in a lower NAV per Share, and otherwise pose a material risk to investors.
There are risks related to the Support Agreement and the planned transfer of operations to new management.
There are risks related to the Support Agreement and the planned transfer of operations to new management. Among other things, following the transfer of operations to Toroso, Toroso may not manage the Fund as effectively as the Sponsor. In addition, because a timeline for the transfer has not yet been determined, it is not known when the transfer of management will occur.
The Market for Bitcoin Futures-Based ETFs May Reach Saturation
The market for bitcoin futures-based ETFs like the Fund may reach a point where there is little or no additional investor demand. If this happens, there can be no assurance that the Fund will grow to or maintain a viable size. Due to the Fund’s small asset base, certain of the Fund’s expenses and its portfolio transaction costs may be higher than those of a fund with a larger asset base. To the extent that the Fund does not grow to or maintain a viable size, it may be liquidated, and the expenses, timing and tax consequences of such liquidation may not be favorable to some Shareholders.
| 88 |
| Table of Contents |
Potential Conflicts of Interest
The Fund and the Sponsor may have conflicts of interest, which may cause them to favor their own interests to your detriment.
The Fund and the Sponsor may have inherent conflicts to the extent the Sponsor attempts to maintain the Fund’s asset size in order to preserve its fee income and this may not always be consistent with the Fund’s objective of having the value of its Shares’ NAV track changes in the Benchmark. The Sponsor’s officers and employees do not devote their time exclusively to the Fund. These persons may be directors, officers or employees of other entities. They could have a conflict between their responsibilities to the Fund and to those other entities.
The Sponsor’s principals, officers or employees may trade securities and futures and related contracts for their own accounts.
In addition, the Sponsor’s principals, officers or employees may trade securities and futures and related contracts for their own accounts. A conflict of interest may exist if their trades are in the same markets and occur at the same time as the Fund trades using the clearing broker to be used by the Fund. A potential conflict also may occur if the Sponsor’s principals, officers or employees trade their accounts more aggressively or take positions in their accounts that are opposite, or ahead of, the positions taken by the Fund.
The Sponsor has sole current authority to manage the investments and operations of the Fund, and this may allow it to act in a way that furthers its own interests and in conflict with your best interests, including the authority of the Sponsor to allocate expenses to and between the Funds. Shareholders have very limited voting rights, which will limit the ability to influence matters such as amendment of the Trust Agreement, changes in the Fund’s basic investment policies, dissolution of the Fund, or the sale or distribution of the Fund’s assets.
Shareholder Voting Rights and Liability
Shareholders have only very limited voting rights and generally will not have the power to replace the Sponsor. Shareholders will not participate in the management of the Fund and do not control the Sponsor so they will not have influence over basic matters that affect the Fund.
Shareholders will have very limited voting rights with respect to the Fund’s affairs. Shareholders may elect a replacement sponsor only if the current Sponsor resigns voluntarily or loses its corporate charter. Shareholders will not be permitted to participate in the management or control of the Fund or the conduct of its business. Shareholders must therefore rely upon the duties and judgment of the Sponsor to manage the Fund’s affairs.
Although the Shares of the Fund are limited liability investments, certain circumstances such as bankruptcy could increase a Shareholder’s liability.
The Shares of the Fund are limited liability investments; Shareholders may not lose more than the amount that they invest plus any profits recognized on their investment. However, Shareholders could be required, as a matter of bankruptcy law, to return to the estate of the Fund any distribution they received at a time when the Fund was in fact insolvent or that was made in violation of its Trust Agreement.
As a Shareholder, you will not have the rights enjoyed by investors in certain other types of entities.
As interests in separate series of a Delaware statutory trust, the Shares do not involve the rights normally associated with the ownership of shares of a corporation (including, for example, the right to bring Shareholder oppression and derivative actions). In addition, the Shares have limited voting and distribution rights (for example, Shareholders do not have the right to elect directors, as the Trust does not have a board of directors, and generally will not receive regular distributions of the net income and capital gains earned by the Fund). The Fund is also not subject to certain investor protection provisions of the Sarbanes Oxley Act of 2002 and the NYSE Arca governance rules (for example, audit committee requirements).
A court could potentially conclude that the assets and liabilities of the Fund are not segregated from those of another series of the Trust, thereby potentially exposing assets in the Fund to the liabilities of another series.
The Fund is a series of a Delaware statutory trust and not itself a legal entity separate from the other Teucrium Funds. The Delaware Statutory Trust Act provides that if certain provisions are included in the formation and governing documents of a statutory trust organized in series and if separate and distinct records are maintained for any series and the assets associated with that series are held in separate and distinct records and are accounted for in such separate and distinct records separately from the other assets of the statutory trust, or any series thereof, then the debts, liabilities, obligations and expenses incurred by a particular series are enforceable against the assets of such series only, and not against the assets of the statutory trust generally or any other series thereof. Conversely, none of the debts, liabilities, obligations and expenses incurred with respect to any other series thereof is enforceable against the assets of such series. The Sponsor is not aware of any court case that has interpreted this inter-series limitation on liability or provided any guidance as to what is required for compliance. The Sponsor intends to maintain separate and distinct records for the Fund and account for the Fund separately from any other Trust series, but it is possible a court could conclude that the methods used do not satisfy the Delaware Statutory Trust Act, which would potentially expose assets in the Fund to the liabilities of one or more of the Teucrium Funds and/or any other Trust series created in the future.
| 89 |
| Table of Contents |
The Fund does not expect to make cash distributions.
The Sponsor intends to re-invest any income and realized gains of the Fund in additional Benchmark Component Futures Contracts or cash and cash equivalents rather than distributing cash to Shareholders. Therefore, unlike mutual funds, commodity pools or other investment pools that generally distribute income and gains to their investors, the Fund generally will not distribute cash to Shareholders. You should not invest in the Fund if you will need cash distributions from the Fund to pay taxes on your Share of income and gains of the Fund, if any, or for any other reason. Although the Fund does not intend to make cash distributions, it reserves the right to do so in the Sponsor’s sole discretion, in certain situations, including for example, if the income earned from its investments held directly or posted as margin may reach levels that merit distribution, e.g., at levels where such income is not necessary to support its underlying investments in Benchmark Component Futures Contracts and investors adversely react to being taxed on such income without receiving distributions that could be used to pay such tax. Cash distributions may be made in these and similar instances.
Event Risk
The occurrence of a severe weather event, natural disaster, terrorist attack, outbreak or public health emergency as declared by the World Health Organization, the continuation or expansion of war or other hostilities, or a prolonged government shutdown may have significant adverse effects on the Fund and its investments and alter current assumptions and expectations.
The operations of the Fund, the exchanges, brokers and counterparties with which the Fund does business, and the markets in which the Fund does business could be severely disrupted in the event of a severe weather event, natural disaster, major terrorist attack, cyber-attack, data breach, outbreak or public health emergency as declared by the World Health Organization (such as the recent pandemic spread of the novel coronavirus known as COVID-19), or the continuation or expansion of war or other hostilities. Global terrorist attacks, anti-terrorism initiatives, and political unrest, as well as the adverse impact the COVID-19 pandemic will have on the global and U.S. markets and economy, continue to fuel this concern. For example, the COVID-19 pandemic may adversely impact the level of services currently provided by the U.S. government, could weaken the U.S. economy, interfere with the commodities markets that rely upon data published by U.S. federal government agencies, and prevent the Fund from receiving necessary regulatory review or approvals. The types of events discussed above, including the COVID-19 pandemic, are highly disruptive to economies and markets and have recently led, and may continue to lead, to increased market volatility and significant market losses.
More generally, a climate of uncertainty and panic, including the contagion of the COVID-19 virus and other infectious viruses or diseases, may adversely affect global, regional, and local economies and reduce the availability of potential investment opportunities, and increases the difficulty of performing due diligence and modeling market conditions, potentially reducing the accuracy of financial projections. Under these circumstances, the Fund may have difficulty achieving its investment objective which may adversely impact performance. Further, such events can be highly disruptive to economies and markets, significantly disrupt the operations of individual companies (including, but not limited to, the Fund’s Sponsor and third party service providers), sectors, industries, markets, securities and commodity exchanges, currencies, interest and inflation rates, credit ratings, investor sentiment, and other factors affecting the value of the Fund’s investments. These factors could cause substantial market volatility, exchange trading suspensions and closures that could impact the ability of the Fund to complete redemptions and otherwise affect Fund performance and Fund trading in the secondary market. A widespread crisis may also affect the global economy in ways that cannot necessarily be foreseen at the current time. How long such events will last and whether they will continue or recur cannot be predicted. Impacts from these events could have significant impact on the Fund’s performance, resulting in losses to your investment. The past, current and future global economic impact may cause the underlying assumptions and expectations of the Fund to become outdated quickly or inaccurate, resulting in significant losses.
| 90 |
| Table of Contents |
Failures or breaches of electronic systems could disrupt the Fund’s trading activity and materially affect the Fund’s profitability.
Failures or breaches of the electronic systems of the Fund, the Sponsor, the Custodian or other financial institutions in which the Fund invests, or the Fund’s other service providers, market makers, Authorized Purchasers, NYSE Arca, exchanges on which Bitcoin Futures Contracts or other bitcoin interests are traded or cleared, or counterparties have the ability to cause disruptions and negatively impact the Fund’s business operations, potentially resulting in financial losses to the Fund and its Shareholders. Such failures or breaches may include intentional cyber-attacks that may result in an unauthorized party gaining access to electronic systems in order to misappropriate the Fund’s assets or sensitive information. While the Fund has established business continuity plans and risk management systems seeking to address system breaches or failures, there are inherent limitations in such plans and systems. Furthermore, the Fund cannot control the cyber security plans and systems of the Custodian or other financial institutions in which the Fund invests, or the Fund’s other service providers, market makers, Authorized Purchasers, NYSE Arca, exchanges on which bitcoin Futures Contracts or other bitcoin interests are traded or cleared, or counterparties.
Risk of Volatility
The price of bitcoin can be volatile which could cause large fluctuations in the price of Shares.
As discussed in more detail above, price movements for bitcoin are influenced by, among other things, the environment, natural or man-made disasters, governmental oversight and regulation, demographics, economic conditions, infrastructure limitations, existing and future technological developments, and a variety of other factors now known and unknown, any and all of which can have an impact on the supply, demand, and price fluctuations in the bitcoin markets. More generally, cryptocurrency prices may be influenced by economic and monetary events such as changes in interest rates, changes in balances of payments and trade, U.S. and international inflation rates, currency valuations and devaluations, U.S. and international economic events, and changes in the philosophies and emotions of market purchasers. Because the Fund invests in futures contracts in a single cryptocurrency, it is not a diversified investment vehicle, and therefore may be subject to greater volatility than a diversified portfolio of stocks or bonds or a more diversified commodity or cryptocurrency pool.
Volatility is a statistical measure of the dispersion of returns for a given security or market index. Volatility represents how large an asset’s prices swing around the mean price—it is a statistical measure of its dispersion of returns.
According to Bloomberg from 1/1/2019 to 5/27/2022 front month Bitcoin Futures Contracts exhibited an average implied 30-Day volatility of 67.71. The highest volatility during that period was 134.07 on 7/25/19 and the lowest was 25.62 on 4/1/2019
Bitcoin can be highly volatile, for example after a 774% price increase from 1/1/2020 prices peaked in May 2021 and front month Bitcoin Futures Contracts began to decline with a peak to trough retracement of 47.06% by 7/20/2021. Prices then rose from that low until 11/9/2021 resulting in a price increase of 127.58%. Front month Bitcoin Futures Contracts prices peaked on 11/9/2021 and have since seen a retracement of 57.05% as of 5/27/2022. Front month bitcoin futures prices have declined 54.51% since May 2021.
| 91 |
| Table of Contents |
The table below includes significant single day price declines since inception of the Bitcoin Futures Contracts in December 2017 for both bitcoin (as measured by the BRR) and for Bitcoin Futures Contracts (as measured by the front month Bitcoin Futures Contract), including the single day price decline that occurred on September 7, 2021, followed by a brief narrative disclosure describing the significant declines:
Date | BTC1 Daily % Change | BRR Daily % Change | Notes |
3/12/2020 | -23.49% | -21.89% | The selloff in Bitcoin futures coincided with broader financial market duress at the onset of the COVID pandemic. |
6/27/2019 | -21.82% | -9.31% | Potentially signals near term profit taking as the front month contract gained, after gaining approximately 22% in the prior session. |
6/13/2022 | -20.09% | -15.45% | Selling picked up after failing to hold the $30,000 level, filling the gap created on the way up during December 2020. |
1/16/2018 | -19.97% | -13.50% | Bitcoin futures were relatively new and there was significant selling interest early on that carried through December 2018. |
2/5/2018 | -15.43% | -14.16% | Bitcoin futures were relatively new and there was significant selling interest early on that carried through December 2018. |
5/9/2022 | -13.90% | -4.85% | After failing to close back above $40,000 on May 4th, selling accelerated as market participants zeroed in on $30,000 as the next potential area of price support. |
1/21/2022 | -10.53% | -10.75% | The downtrend that began in November of 2021 showed signs of accelerating as prices traded at their lowest levels since July of 2021. |
5/5/2022 | -9.10% | -0.65% | After failing to close back above $40,000 on May 4th, selling accelerated as market participants appear to be testing ~$35,000 for potential support. |
8/19/2022 | -9.02% | -8.70% | Bitcoin futures had been trending higher for much of the summer as market participants assumed a "risk on" posture that was reflected in stock market during the same period. However, sentiment changed to "Risk off" as market participants began to re-think the Fed's tightening cycle, and potential for prolonged/deeper economic slowdown. |
12/6/2021 | -8.56% | 0.56% | The previous session saw front-month Bitcoin futures get rejected after testing the 50-day moving average and reversing lower. Prices gapped lower on 12/06. |
9/20/2021 | -7.81% | -7.61% | After advancing nearly 70% since July 20th prices began to retrace on September 7th. Yet it wasn't until 09/20 that prices tested both the 50- and 100-day moving averages at the technical point where the 50-day was about to cross back above the 100-day. Suggests that this selling was technical in nature. |
9/7/2021 | -7.75% | -3.35% | The selling may have been the result of profit taking as Bitcoin futures closed over $50,000 for the first time in the prior session. |
9/13/2022 | -9.86% | -5.63% | Bitcoin rose to its highest level in the preceding three weeks during Asia trading hours, but the sell-off was swift after the U.S. consumer price index (US Inflation) for August came in higher than expected. |
Item 2. Unregistered Sales of Equity Securities and Use of Proceeds
(a) | None. |
|
|
(b) | On July 31, 2010, for all Funds listed below except the Teucrium Agricultural Fund for which the contribution was made on April 1, 2011 and the Hashdex Bitcoin Futures ETF for which the contribution was made on May 25, 2022, the Sponsor made the following capital contributions and received the following shares for that contribution prior to each Fund’s commencement of operations; such shares were sold in private offerings exempt from registration under Section 4(2) of the Securities Act of 1933, as amended: |
1. | a $100 capital contribution to the Teucrium Corn Fund, another series of the Trust, in exchange for four shares of such fund; |
2. | a $100 capital contribution to the Teucrium Soybean Fund, another series of the Trust, in exchange for four shares of such fund; |
3. | a $100 capital contribution to the Teucrium Sugar Fund, another series of the Trust, in exchange for four shares of such fund; |
4. | a $100 capital contribution to the Teucrium Wheat Fund, another series of the Trust, in exchange for four shares of such fund; |
5. | a $100 capital contribution to the Teucrium Agricultural Fund, another series of the Trust, in exchange for two shares of such fund; and |
6. | a $100 capital contribution to the Hashdex Bitcoin Futures ETF, another series of the Trust, in exchange for four shares of such fund. |
Teucrium Corn Fund
Registration Statement on Form S-1 |
|
| File Number |
| Registered Common Units |
|
| Effective Date |
| ||
| 1 |
|
| 333-162033 |
|
| 30,000,000 |
|
| June 7, 2010 |
|
| 2 |
|
| 333-187463 |
|
| - |
|
| April 30, 2013 |
|
| 3 |
|
| 333-210010 |
|
| - |
|
| April 29, 2016 |
|
| 4 |
|
| 333-230626 |
|
| - |
|
| April 29, 2019 |
|
| 5 |
|
| 333-237234 |
|
| 10,000,000 |
|
| May 1, 2020 |
|
| 6 |
|
| 333-248546 |
|
| 20,000,000 |
|
| October 2, 2020 |
|
| 7 |
|
| 333-263434 |
|
| Indeterminate Number of Shares |
|
| April 7, 2022 |
|
From June 9, 2010 (the commencement of operations) through September 30, 2022, 45,075,000 Shares of the Fund were sold at an aggregate offering price of $1,006,339,032. The Fund paid fees to Foreside Fund Services, LLC for its services to the Fund from June 9, 2010 (the commencement of operations) through September 30, 2022 in an amount equal to $1,178,405, resulting in net offering proceeds of $1,005,174,973. The offering proceeds were invested in corn futures contracts and cash and cash equivalents in accordance with the Fund’s investment objective stated in the prospectus.
| 92 |
| Table of Contents |
Teucrium Soybean Fund
Registration Statement on Form S-1 |
|
| File Number |
| Registered Common Units |
|
| Effective Date |
| ||
| 1 |
|
| 333-167590 |
|
| 10,000,000 |
|
| June 13, 2011 |
|
| 2 |
|
| 333-196210 |
|
| - |
|
| June 30, 2014 |
|
| 3 |
|
| 333-217247 |
|
| - |
|
| May 1, 2017 |
|
| 4 |
|
| 333-223940 |
|
| 5,000,000 |
|
| April 30, 2018 |
|
| 5 |
|
| 333-241569 |
|
| 15,000,000 |
|
| August 24, 2020 |
|
| 6 |
|
| 333-263448 |
|
| Indeterminate Number of Shares |
|
| April 7, 2022 |
|
From September 19, 2011 (the commencement of the offering) through September 30, 2022, 16,075,000 Shares of the Fund were sold at an aggregate offering price of $291,042,004. The Fund paid fees to Foreside Fund Services, LLC for its services to the Fund through September 30, 2022 in an amount equal to $247,265, resulting in net offering proceeds of $290,799,216. The offering proceeds were invested in soybean futures contracts and cash and cash equivalents in accordance with the Fund’s investment objective stated in the prospectus.
Teucrium Sugar Fund
Registration Statement on Form S-1 |
|
| File Number |
| Registered Common Units |
|
| Effective Date |
| ||
| 1 |
|
| 333-167585 |
|
| 10,000,000 |
|
| June 13, 2011 |
|
| 2 |
|
| 333-196211 |
|
| - |
|
| June 30, 2014 |
|
| 3 |
|
| 333-217248 |
|
| - |
|
| May 1, 2017 |
|
| 4 |
|
| 333-223941 |
|
| 5,000,000 |
|
| April 30, 2018 |
|
| 5 |
|
| 333-248545 |
|
| 15,000,000 |
|
| October 2, 2020 |
|
| 6 |
|
| 333-263438 |
|
| Indeterminate Number of Shares |
|
| April 7, 2022 |
|
From September 19, 2011 (the commencement of the offering) through September 30, 2022, 11,225,000 Shares of the Fund were sold at an aggregate offering price of $100,467,907. The Fund paid fees to Foreside Fund Services, LLC for its services to the Fund through September 30, 2022 in an amount equal to $99,365, resulting in net offering proceeds of $100,370,640. The offering proceeds were invested in sugar futures contracts and cash and cash equivalents in accordance with the Fund’s investment objective stated in the prospectus.
Teucrium Wheat Fund
Registration Statement on Form S-1 |
|
| File Number |
| Registered Common Units |
|
| Effective Date |
| ||
| 1 |
|
| 333-167591 |
|
| 10,000,000 |
|
| June 13, 2011 |
|
| 2 |
|
| 333-196209 |
|
| - |
|
| June 30, 2014 |
|
| 3 |
|
| 333-212481 |
|
| 25,050,000 |
|
| July 15, 2016 |
|
| 4 |
|
| 333-230623 |
|
| 30,000,000 |
|
| April 29, 2019 |
|
| 5 |
|
| 333-263293 |
|
| Indeterminate Number of Shares |
|
| March 9, 2022 |
|
From September 19, 2011 (the commencement of the offering) through September 30, 2022, 114,500,000 Shares of the Fund were sold at an aggregate offering price of $1,121,566,547. The Fund paid fees to Foreside Fund Services, LLC for its services to the Fund through September 30, 2022 in an amount equal to $472,279, resulting in net offering proceeds of $1,121,124,446. The offering proceeds were invested in wheat futures contracts and cash and cash equivalents in accordance with the Fund’s investment objective stated in the prospectus.
| 93 |
| Table of Contents |
Teucrium Agricultural Fund
Registration Statement on Form S-1 |
|
| File Number |
| Registered Common Units |
|
| Effective Date |
| ||
| 1 |
|
| 333-173691 |
|
| 5,000,000 |
|
| February 10, 2012 |
|
| 2 |
|
| 333-201953 |
|
| - |
|
| April 30, 2015 |
|
| 3 |
|
| 333-223943 |
|
| - |
|
| April 30, 2018 |
|
| 4 |
|
| 333-254650 |
|
| - |
|
| April 30, 2021 |
|
| 5 |
|
| 333-263450 |
|
| Indeterminate Number of Shares |
|
| April 7, 2022 |
|
From March 28, 2012 (the commencement of the offering) through September 30, 2022, 2,287,500 Shares of the Fund were sold at an aggregate offering price of $77,555,646. The Fund paid fees to Foreside Fund Services, LLC for its services to the Fund through September 30, 2022 in an amount equal to $22,305, resulting in net offering proceeds of $77,536,080. The offering proceeds were invested in Shares of the Underlying Funds and cash and cash equivalents in accordance with the Fund’s investment objective stated in the prospectus.
Hashdex Bitcoin Futures ETF
Registration Statement on Form S-1 |
|
| File Number |
| Registered Common Units |
|
| Effective Date |
| ||
| 1 |
|
| 333-256339 |
|
| Indeterminate Number of Shares |
|
| September 14, 2022 |
|
From September 15, 2022 (the commencement of the offering) through September 30, 2022, 50,004 Shares of the Fund were sold at an aggregate offering price of $1,250,100. The offering proceeds were invested in bitcoin futures contracts and cash and cash equivalents in accordance with the Fund’s investment objective stated in the prospectus.
Issuer Purchases of CORN Shares:
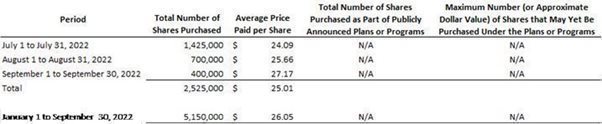
Issuer Purchases of CANE Shares:
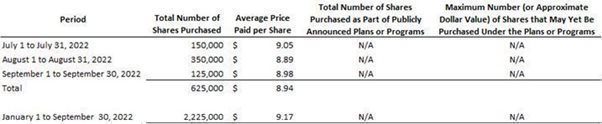
Issuer Purchases of WEAT Shares:
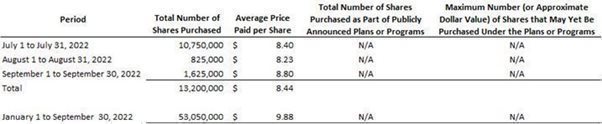
| 94 |
| Table of Contents |
Issuer Purchases of SOYB Shares:
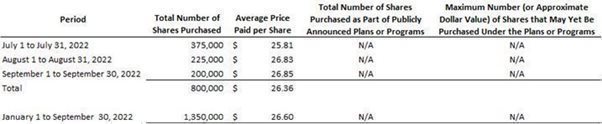
Issuer Purchases of TAGS Shares:
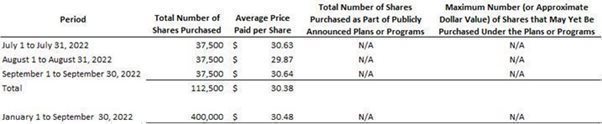
Issuer Purchases of DEFI Shares: Nothing to report.
Item 3. Defaults Upon Senior Securities
None.
Item 4. Mine Safety Disclosures
None.
Item 5. Other Information
(a) None.
(b) Not Applicable.
| 95 |
| Table of Contents |
Item 6. Exhibits
The following exhibits are filed as part of this report as required under Item 601 of Regulation S-K:
31.1 |
| Certification by the Principal Executive Officer of the Registrant pursuant to Rules 13a-14 and 15d-14 of the Exchange Act. (1) |
31.2 |
| Certification by the Principal Financial Officer of the Registrant pursuant to Rules 13a-14 and 15d-14 of the Exchange Act. (1) |
32.1 |
| Certification by the Principal Executive Officer of the Registrant pursuant to 18 U.S.C. Section 1350, as adopted pursuant to Section 906 of the Sarbanes-Oxley Act of 2002. (1) |
32.2 |
| Certification by the Principal Financial Officer of the Registrant pursuant to 18 U.S.C. Section 1350, as adopted pursuant to Section 906 of the Sarbanes-Oxley Act of 2002. (1) |
|
|
|
101.INS |
| XBRL Instance Document |
101.SCH |
| XBRL Taxonomy Extension Schema |
101.CAL |
| XBRL Taxonomy Extension Calculation Linkbase |
101.DEF |
| XBRL Taxonomy Definition Linkbase |
101.LAB |
| XBRL Taxonomy Extension Label Linkbase |
101.PRE |
| XBRL Taxonomy Extension Presentation Linkbase |
(1) Filed herewith.
| 96 |
| Table of Contents |
SIGNATURES
Pursuant to the requirements of the Securities Exchange Act of 1934, the Registrant has duly caused this report to be signed on its behalf by the undersigned, thereunto duly authorized.
Teucrium Commodity Trust (Registrant)
By: | Teucrium Trading, LLC |
|
| its Sponsor |
|
|
|
|
By: | /s/ Cory Mullen-Rusin |
|
Name: | Cory Mullen-Rusin |
|
| Chief Financial Officer |
|
|
|
|
| Date: November 9, 2022 |
|
Teucrium Commodity Trust (Registrant)
By: | Teucrium Trading, LLC |
|
| its Sponsor |
|
|
|
|
By: | /s/ Sal Gilbertie |
|
Name: | Sal Gilbertie |
|
| Chief Executive Officer |
|
|
|
|
| Date: November 9, 2022 |
|
| 97 |