UNITED STATES
SECURITIES AND EXCHANGE COMMISSION
Washington, D.C. 20549
FORM
| | Quarterly report pursuant to Section 13 or 15(d) of the Securities Exchange Act of 1934 |
| for the quarterly period ended |
OR
| | Transition report pursuant to Section 13 or 15(d) of the Securities Exchange Act of 1934 |
| for the transition period from _________ to _________ . |
Commission File Number:
| Teucrium Commodity Trust |
| (Exact name of registrant as specified in its charter) |
| | | |
| (State or other jurisdiction of | (I.R.S. Employer | |
| incorporation or organization) | Identification No.) |
(Address of principal executive offices) (Zip code)
(
(Registrant’s telephone number, including area code)
Indicate by check mark whether the registrant (1) has filed all reports required to be filed by Section 13 or 15(d) of the Securities Exchange Act of 1934 during the preceding 12 months (or for such shorter period that the registrant was required to file such reports), and (2) has been subject to such filing requirements for the past 90 days. ☒
Indicate by check mark whether the registrant has submitted electronically every Interactive Data File required to be submitted pursuant to Rule 405 of Regulation S-T (§232.405 of this chapter) during the preceding 12 months (or for such shorter period that the registrant was required to submit such files). ☒
Indicate by check mark whether the registrant is a large accelerated filer, an accelerated filer, a non-accelerated filer, smaller reporting company or an emerging growth company. See the definitions of “large accelerated filer,” “accelerated filer,” “smaller reporting company,” and “emerging growth company” in Rule 12b-2 of the Exchange Act.
| | ☒ | Accelerated filer | ☐ |
| Non-accelerated Filer | ☐ | Smaller reporting company | |
| Emerging growth company | |
If an emerging growth company, indicate by a check mark if the registrant has elected not to use the extended transition period for complying with any new or revised financial accounting standards provided pursuant to Section 13(a) of the Exchange Act. ☐
Indicate by check mark whether the registrant is a shell company (as defined in Rule 12b-2 of the Exchange Act).
Indicate the number of shares outstanding of each of the issuer’s classes of common stock, as of the last practicable date.
| Total Number of Outstanding Shares as of November 7, 2023 | |||
| Teucrium Corn Fund | |||
| Teucrium Sugar Fund | |||
| Teucrium Soybean Fund | |||
| Teucrium Wheat Fund | |||
| Teucrium Agricultural Fund | |||
| Hashdex Bitcoin Futures ETF |
Table of Contents
| Page |
||||
| Management’s Discussion and Analysis of Financial Condition and Results of Operations |
||||
Index to Financial Statements
COMBINED STATEMENTS OF ASSETS AND LIABILITIES
| September 30, 2023 | December 31, 2022 | |||||||
| (Unaudited) | ||||||||
| Assets | ||||||||
| Cash and cash equivalents | $ | $ | ||||||
| Interest receivable | ||||||||
| Other assets | ||||||||
| Capital shares receivable | ||||||||
| Equity in trading accounts: | ||||||||
| Commodity and cryptocurrency futures contracts | ||||||||
| Due from broker | ||||||||
| Total equity in trading accounts | ||||||||
| Total assets | $ | $ | ||||||
| Liabilities | ||||||||
| Management fee payable to Sponsor | $ | $ | ||||||
| Other liabilities | ||||||||
| Payable for shares redeemed | ||||||||
| Equity in trading accounts: | ||||||||
| Commodity and cryptocurrency futures contracts | ||||||||
| Due to broker | ||||||||
| Total equity in trading accounts | ||||||||
| Total liabilities | $ | $ | ||||||
| Net Assets | $ | $ | ||||||
The accompanying notes are an integral part of these financial statements.
COMBINED SCHEDULE OF INVESTMENTS
September 30, 2023
(Unaudited)
| Percentage of | ||||||||||||||||||||
| Description: Assets | Yield | Cost | Fair Value | Net Assets | Shares | |||||||||||||||
| Cash equivalents | ||||||||||||||||||||
| Money market funds | ||||||||||||||||||||
| U.S. Bank Deposit Account | % | $ | $ | % | ||||||||||||||||
| Goldman Sachs Financial Square Government Fund - Institutional Class | % | |||||||||||||||||||
| Total money market funds | $ | $ | % | |||||||||||||||||
| Maturity | Percentage of | Principal | |||||||||||||||||||
| Date | Yield | Cost | Fair Value | Net Assets | Amount | ||||||||||||||||
| Commercial Paper | |||||||||||||||||||||
| Brookfield Infrastructure Holdings (Canada) Inc. | | % | $ | $ | % | ||||||||||||||||
| Brookfield Infrastructure Holdings (Canada) Inc. | | % | |||||||||||||||||||
| Brookfield Infrastructure Holdings (Canada) Inc. | | % | |||||||||||||||||||
| Brookfield Infrastructure Holdings (Canada) Inc. | | % | |||||||||||||||||||
| General Motors Financial Company, Inc. | | % | |||||||||||||||||||
| General Motors Financial Company, Inc. | | % | |||||||||||||||||||
| General Motors Financial Company, Inc. | | % | |||||||||||||||||||
| Glencore Funding LLC | | % | |||||||||||||||||||
| Harley-Davidson Financial Services, Inc. | | % | |||||||||||||||||||
| Harley-Davidson Financial Services, Inc. | | % | |||||||||||||||||||
| Harley-Davidson Financial Services, Inc. | | % | |||||||||||||||||||
| Harley-Davidson Financial Services, Inc. | | % | |||||||||||||||||||
| Hyundai Capital America | | % | |||||||||||||||||||
| Jabil Inc. | | % | |||||||||||||||||||
| Jabil Inc. | | % | |||||||||||||||||||
| Marriott International, Inc. | | % | |||||||||||||||||||
| National Fuel Gas Company | | % | |||||||||||||||||||
| National Fuel Gas Company | | % | |||||||||||||||||||
| V.F. Corporation | | % | |||||||||||||||||||
| V.F. Corporation | | % | |||||||||||||||||||
| Walgreens Boots Alliance, Inc. | | % | |||||||||||||||||||
| Walgreens Boots Alliance, Inc. | | % | |||||||||||||||||||
| Total Commercial Paper | $ | $ | % | ||||||||||||||||||
| Total Cash Equivalents | $ | % | |||||||||||||||||||
| Number of | Percentage of | Notional Amount | ||||||||||||||
| Contracts | Fair Value | Net Assets | (Long Exposure) | |||||||||||||
| Commodity and Cryptocurrency futures contracts | ||||||||||||||||
| United States soybean futures contracts | ||||||||||||||||
| CBOT soybean futures JAN24 | $ | % | $ | |||||||||||||
| United States sugar futures contracts | ||||||||||||||||
| ICE sugar futures MAY24 | ||||||||||||||||
| ICE sugar futures MAR25 | ||||||||||||||||
| United States CME Bitcoin futures contracts | ||||||||||||||||
| CME Bitcoin futures OCT23 | ||||||||||||||||
| CME Bitcoin futures NOV23 | ||||||||||||||||
| Total commodity and cryptocurrency futures contracts | $ | % | $ | |||||||||||||
| Number of | Percentage of | Notional Amount | ||||||||||||||
| Description: Liabilities | Contracts | Fair Value | Net Assets | (Long Exposure) | ||||||||||||
| Commodity and Cryptocurrency futures contracts | ||||||||||||||||
| United States corn futures contracts | ||||||||||||||||
| CBOT corn futures MAR 24 | $ | % | $ | |||||||||||||
| CBOT corn futures MAY24 | ||||||||||||||||
| CBOT corn futures DEC24 | ||||||||||||||||
| United States soybean futures contracts | ||||||||||||||||
| CBOT soybean futures MAR24 | ||||||||||||||||
| CBOT soybean futures NOV24 | ||||||||||||||||
| United States sugar futures contracts | ||||||||||||||||
| ICE sugar futures JUL24 | ||||||||||||||||
| United States wheat futures contracts | ||||||||||||||||
| CBOT wheat futures MAR24 | ||||||||||||||||
| CBOT wheat futures MAY24 | ||||||||||||||||
| CBOT wheat futures DEC24 | ||||||||||||||||
| Total commodity and cryptocurrency futures contracts | $ | % | $ | |||||||||||||
| Percentage of | ||||||||||||||||
| Exchange-traded funds* | Cost | Fair Value | Net Assets | Shares | ||||||||||||
| Teucrium Corn Fund | $ | % | ||||||||||||||
| Teucrium Soybean Fund | ||||||||||||||||
| Teucrium Sugar Fund | ||||||||||||||||
| Teucrium Wheat Fund | ||||||||||||||||
| Total exchange-traded funds | $ | $ | % | |||||||||||||
*The Trust eliminates the shares owned by the Teucrium Agricultural Fund from its combined statements of assets and liabilities due to the fact that these represent holdings of the other four Funds (“Underlying Funds”) owned by the Teucrium Agricultural Fund, which are included as shares outstanding of the Underlying Funds.
The accompanying notes are an integral part of these financial statements.
TEUCRIUM COMMODITY TRUST
COMBINED SCHEDULE OF INVESTMENTS
December 31, 2022
| Percentage of | ||||||||||||||||||||
| Description: Assets | Yield | Cost | Fair Value | Net Assets | Shares | |||||||||||||||
| Cash equivalents | ||||||||||||||||||||
| Money market funds | ||||||||||||||||||||
| First American Government Obligations Fund - Class X | % | $ | $ | % | ||||||||||||||||
| Goldman Sachs Financial Square Government Fund - Institutional Class | % | |||||||||||||||||||
| Total money market funds | $ | $ | % | |||||||||||||||||
| Maturity | Percentage of | Principal | |||||||||||||||||||
| Date | Yield | Cost | Fair Value | Net Assets | Amount | ||||||||||||||||
| Commercial Paper | |||||||||||||||||||||
| American Electric Power Company, Inc. | | % | $ | $ | % | ||||||||||||||||
| Brookfield Infrastructure Holdings (Canada) Inc. | | % | |||||||||||||||||||
| Brookfield Infrastructure Holdings (Canada) Inc. | | % | |||||||||||||||||||
| CNH Industrial Capital LLC | | % | |||||||||||||||||||
| CNH Industrial Capital LLC | | % | |||||||||||||||||||
| Crown Castle Inc. | | % | |||||||||||||||||||
| Crown Castle Inc. | | % | |||||||||||||||||||
| Entergy Corporation | | % | |||||||||||||||||||
| General Motors Financial Company, Inc. | | % | |||||||||||||||||||
| General Motors Financial Company, Inc. | | % | |||||||||||||||||||
| Glencore Funding LLC | | % | |||||||||||||||||||
| Glencore Funding LLC | | % | |||||||||||||||||||
| Harley-Davidson Financial Services, Inc. | | % | |||||||||||||||||||
| Harley-Davidson Financial Services, Inc. | | % | |||||||||||||||||||
| Harley-Davidson Financial Services, Inc. | | % | |||||||||||||||||||
| Humana Inc. | | % | |||||||||||||||||||
| Hyundai Capital America | | % | |||||||||||||||||||
| ITT Inc. | | % | |||||||||||||||||||
| Jabil Inc. | | % | |||||||||||||||||||
| Oracle Corporation | | % | |||||||||||||||||||
| Oracle Corporation | | % | |||||||||||||||||||
| V.F. Corporation | | % | |||||||||||||||||||
| V.F. Corporation | | % | |||||||||||||||||||
| VW Credit, Inc. | | % | |||||||||||||||||||
| Walgreens Boots Alliance, Inc. | | % | |||||||||||||||||||
| Walgreens Boots Alliance, Inc. | | % | |||||||||||||||||||
| Total Commercial Paper | $ | $ | % | ||||||||||||||||||
| Total Cash Equivalents | $ | % | |||||||||||||||||||
| Number of | Percentage of | Notional Amount | ||||||||||||||
| Contracts | Fair Value | Net Assets | (Long Exposure) | |||||||||||||
| Commodity and Cryptocurrency futures contracts | ||||||||||||||||
| United States corn futures contracts | ||||||||||||||||
| CBOT corn futures JUL23 | $ | % | $ | |||||||||||||
| United States soybean futures contracts | ||||||||||||||||
| CBOT soybean futures MAR23 | ||||||||||||||||
| CBOT soybean futures MAY23 | ||||||||||||||||
| CBOT soybean futures NOV23 | ||||||||||||||||
| United States sugar futures contracts | ||||||||||||||||
| ICE sugar futures MAY23 | ||||||||||||||||
| ICE sugar futures JUL23 | ||||||||||||||||
| United States wheat futures contracts | ||||||||||||||||
| CBOT wheat futures JUL23 | ||||||||||||||||
| United States CME Bitcoin futures contracts | ||||||||||||||||
| CME Bitcoin futures JAN23 | ||||||||||||||||
| CME Bitcoin futures FEB23 | ||||||||||||||||
| Total commodity and cryptocurrency futures contracts | $ | % | $ | |||||||||||||
| Number of | Percentage of | Notional Amount | ||||||||||||||
| Description: Liabilities | Contracts | Fair Value | Net Assets | (Long Exposure) | ||||||||||||
| Commodity and Cryptocurrency futures contracts | ||||||||||||||||
| United States corn futures contracts | ||||||||||||||||
| CBOT corn futures MAY23 | $ | % | $ | |||||||||||||
| CBOT corn futures DEC23 | ||||||||||||||||
| United States sugar futures contracts | ||||||||||||||||
| ICE sugar futures MAR24 | ||||||||||||||||
| United States wheat futures contracts | ||||||||||||||||
| CBOT wheat futures MAY23 | ||||||||||||||||
| CBOT wheat futures DEC23 | ||||||||||||||||
| Total commodity and cryptocurrency futures contracts | $ | % | $ | |||||||||||||
| Percentage of | ||||||||||||||||
| Exchange-traded funds* | Cost | Fair Value | Net Assets | Shares | ||||||||||||
| Teucrium Corn Fund | $ | % | ||||||||||||||
| Teucrium Soybean Fund | ||||||||||||||||
| Teucrium Sugar Fund | ||||||||||||||||
| Teucrium Wheat Fund | ||||||||||||||||
| Total exchange-traded funds | $ | $ | % | |||||||||||||
*The Trust eliminates the shares owned by the Teucrium Agricultural Fund from its combined statements of assets and liabilities due to the fact that these represent holdings of the Underlying Funds owned by the Teucrium Agricultural Fund, which are included as shares outstanding of the Underlying Funds.
The accompanying notes are an integral part of these financial statements.
COMBINED STATEMENTS OF OPERATIONS
(Unaudited)
| Three months ended | Three months ended | Nine months ended | Nine months ended | |||||||||||||
| September 30, 2023 | September 30, 2022 (1) | September 30, 2023 | September 30, 2022 (1) | |||||||||||||
| Income | ||||||||||||||||
| Realized and unrealized gain (loss) on trading of commodity futures contracts: | ||||||||||||||||
| Realized loss on commodity and cryptocurrency futures contracts | $ | ( | ) | $ | ( | ) | $ | ( | ) | $ | ( | ) | ||||
| Net change in unrealized appreciation (depreciation) on commodity and cryptocurrency futures contracts | ( | ) | ( | ) | ||||||||||||
| Interest income | ||||||||||||||||
| Total (loss) income | ( | ) | ( | ) | ( | ) | ||||||||||
| Expenses | ||||||||||||||||
| Management fees | ||||||||||||||||
| Professional fees | ||||||||||||||||
| Distribution and marketing fees | ||||||||||||||||
| Custodian fees and expenses | ||||||||||||||||
| Business permits and licenses fees | ||||||||||||||||
| General and administrative expenses | ||||||||||||||||
| Other expenses | ||||||||||||||||
| Total expenses | ||||||||||||||||
| Expenses waived by the Sponsor | ( | ) | ( | ) | ( | ) | ( | ) | ||||||||
| Total expenses, net | ||||||||||||||||
| Net (loss) income | $ | ( | ) | $ | $ | ( | ) | $ | ( | ) | ||||||
(1) The Hashdex Bitcoin Futures ETF commenced operations on September 15, 2022.
The accompanying notes are an integral part of these financial statements.
COMBINED STATEMENTS OF CHANGES IN NET ASSETS
(Unaudited)
| Nine months ended | Nine months ended | |||||||
| September 30, 2023 | September 30, 2022 (1) | |||||||
| Operations | ||||||||
| Net loss | $ | ( | ) | $ | ( | ) | ||
| Capital transactions | ||||||||
| Issuance of Shares | ||||||||
| Redemption of Shares | ( | ) | ( | ) | ||||
| Net change in the cost of the Underlying Funds | ( | ) | ||||||
| Total capital transactions | ( | ) | ||||||
| Net change in net assets | $ | ( | ) | |||||
| Net assets, beginning of period | $ | |||||||
| Net assets, end of period | $ | $ | ||||||
(1) The Hashdex Bitcoin Futures ETF commenced operations on September 15, 2022.
The accompanying notes are an integral part of these financial statements.
COMBINED STATEMENTS OF CASH FLOWS
(Unaudited)
| Nine months ended | Nine months ended | |||||||
| September 30, 2023 | September 30, 2022 (1) | |||||||
| Cash flows from operating activities: | ||||||||
| Net loss | $ | ( | ) | $ | ( | ) | ||
| Adjustments to reconcile net loss to net cash used in operating activities: | ||||||||
| Net change in unrealized appreciation on commodity and cryptocurrency futures contracts | ||||||||
| Changes in operating assets and liabilities: | ||||||||
| Due from broker | ( | ) | ||||||
| Interest receivable | ( | ) | ( | ) | ||||
| Other assets | ( | ) | ( | ) | ||||
| Due to broker | ( | ) | ||||||
| Management fee payable to Sponsor | ( | ) | ||||||
| Other liabilities | ( | ) | ||||||
| Net cash used in operating activities | ( | ) | ( | ) | ||||
| Cash flows from financing activities: | ||||||||
| Proceeds from sale of Shares | ||||||||
| Redemption of Shares | ( | ) | ( | ) | ||||
| Net change in cost of the Underlying Funds | ( | ) | ||||||
| Net cash (used in) provided by financing activities | ( | ) | ||||||
| Net change in cash and cash equivalents | ( | ) | ||||||
| Cash and cash equivalents beginning of period | ||||||||
| Cash and cash equivalents end of period | $ | $ | ||||||
(1) The Hashdex Bitcoin Futures ETF commenced operations on September 15, 2022.
The accompanying notes are an integral part of these financial statements.
NOTES TO COMBINED FINANCIAL STATEMENTS
September 30, 2023
(Unaudited)
Note 1 – Organization and Operation
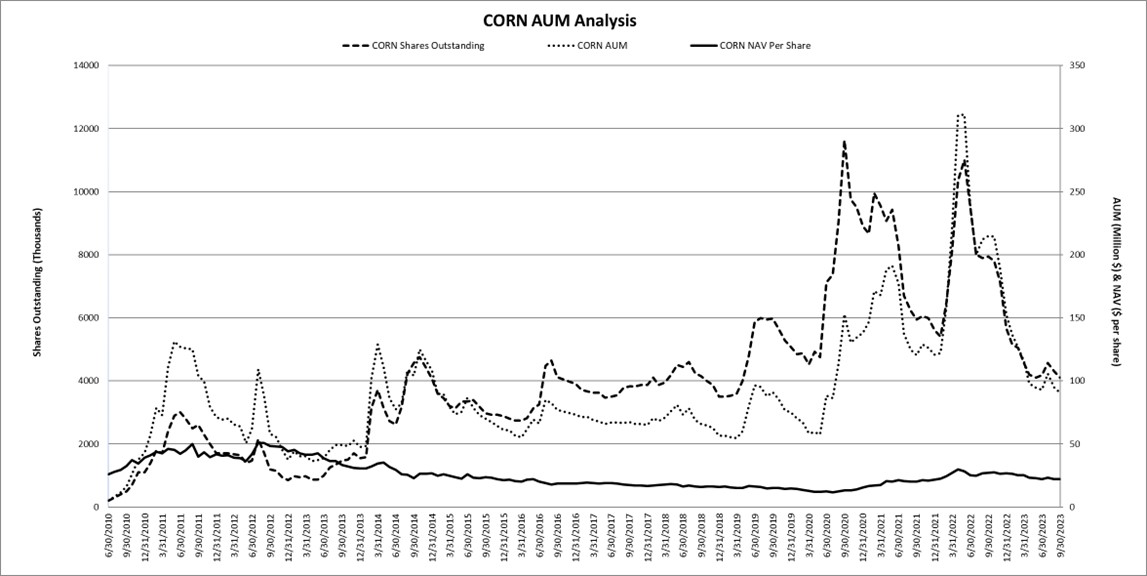
Teucrium Commodity Trust (“Trust”), a Delaware statutory trust organized on September 11, 2009, is a series trust consisting of series: Teucrium Corn Fund (“CORN”), Teucrium Sugar Fund (“CANE”), Teucrium Soybean Fund (“SOYB”), Teucrium Wheat Fund (“WEAT”), Teucrium Agricultural Fund (“TAGS”) and Hashdex Bitcoin Futures ETF (“DEFI”). All of these series of the Trust are collectively referred to as the “Funds” and singularly as the “Fund.” Collectively, CORN, CANE, SOYB, and WEAT are referred to as the “Agricultural Funds”. Each Fund is a commodity pool that is a series of the Trust. The Funds issue common units, called the “Shares,” representing fractional undivided beneficial interests in a Fund. Effective as of April 29, 2019, the Trust and the Funds operate pursuant to the Trust’s Fifth Amended and Restated Declaration of Trust and Trust Agreement (the “Trust Agreement”).
On June 7, 2010, the initial Form S-1 for CORN was declared effective by the U.S. Securities and Exchange Commission (“SEC”). On June 8, 2010, Creation Baskets for CORN were issued representing
On June 13, 2011, the initial Forms S-1 for CANE, SOYB, and WEAT were declared effective by the SEC. On September 16, 2011, Creation Baskets were issued for each Fund, representing
On February 10, 2012, the Form S-1 for TAGS was declared effective by the SEC. On March 27, 2012,
On September 14, 2022, the Form S-1 for DEFI was declared effective by the SEC. This registration statement for DEFI registered an indeterminate number of shares. On September 15, 2022,
Teucrium Trading, LLC is the sponsor (“Sponsor”) of the Trust. The Sponsor is a member of the National Futures Association (the “NFA”) and became a commodity pool operator (“CPO”) registered with the Commodity Futures Trading Commission (the “CFTC”) effective November 10, 2009. The Sponsor registered as a Commodity Trading Advisor (“CTA”) with the CFTC effective September 8, 2017.
The accompanying unaudited financial statements have been prepared in accordance with Rule 10-01 of Regulation S-X promulgated by the SEC and, therefore, do not include all information and footnote disclosures required under accounting principles generally accepted in the United States of America (“GAAP”). The financial information included herein is unaudited; however, such financial information reflects all adjustments which are, in the opinion of management, necessary for the fair presentation of the Trust’s financial statements for the interim period. It is suggested that these interim financial statements be read in conjunction with the audited financial statements and related notes included in the Trust’s Annual Report on Form 10-K, as well as the most recent Form S-1 filing, as applicable. The operating results for the three and nine months ended September 30, 2023, are not necessarily indicative of the results to be expected for the full year ending December 31, 2023.
Subject to the terms of the Trust Agreement, Teucrium Trading, LLC in its capacity as the Sponsor of the Trust may terminate a Fund at any time, regardless of whether the Fund has incurred losses, including, for instance, if it determines that the Fund’s aggregate net assets in relation to its operating expenses make the continued operation of the Fund unreasonable or imprudent. However, no level of losses will require the Sponsor to terminate a Fund.
Note 2 – Principal Contracts and Agreements
The Sponsor employs U.S. Bancorp Fund Services, LLC, doing business as U.S. Bank Global Fund Services (“Global Fund Services”), for Transfer Agency, Fund Accounting and Fund Administration services. The principal address for Global Fund Services is 615 E. Michigan Street, Milwaukee, WI 53202.
For custody services, the Funds will pay to U.S. Bank N.A.
The Sponsor employs Foreside Fund Services, LLC (“Foreside” or the “Distributor”) as the Distributor for the Funds. The Distribution Services Agreement among the Distributor and the Sponsor calls for the Distributor to work with the Custodian in connection with the receipt and processing of orders for Creation Baskets and Redemption Baskets and the review and approval of all Fund sales literature and advertising materials. The Distributor and the Sponsor have also entered into a Securities Activities and Service Agreement (the “SASA”) under which certain employees and officers of the Sponsor are licensed as registered representatives or registered principals of the Distributor, under Financial Industry Regulatory Authority (“FINRA”) rules. For its services as the Distributor, Foreside receives a fee of
Marex Capital Markets, Inc. (“Marex”), StoneX Financial Inc. (“StoneX”) and Phillip Capital Inc. (“Phillip Capital”) serve as the Funds’ clearing brokers to execute and clear futures contracts and provide other brokerage-related services. Marex, StoneX and Phillip Capital are each registered as futures commission merchants (“FCM”) with the U.S. CFTC and are members of the NFA. The clearing brokers are registered as broker-dealers with the SEC and are each a member of FINRA. Marex, StoneX and Phillip Capital are each clearing members of ICE Futures U.S., Inc., Chicago Board of Trade, Chicago Mercantile Exchange, New York Mercantile Exchange, and all other major United States commodity exchanges. For Corn, Soybean, Sugar and Wheat Futures Contracts, Marex is paid $
The sole Trustee of the Trust is Wilmington Trust Company, a Delaware banking corporation. The Trustee will accept service of legal process on the Trust in the State of Delaware and will make certain filings under the Delaware Statutory Trust Act. For its services, the Trustee receives an annual fee of $
The Sponsor employs Thales Capital Partners LLC (“Thales”) for distribution and solicitation-related services. Thales is registered as a broker-dealer with the SEC and a member of FINRA and the Securities Investor Protection Corporation (“SIPC”). Thales receives a quarterly fee of the higher of $
| Three months ended September 30, 2023 | Three months ended September 30, 2022 (1) | Nine months ended September 30, 2023 | Nine months ended September 30, 2022 (1) | |||||||||||||
| Amount Recognized for Custody Services | $ | $ | $ | $ | ||||||||||||
| Amount of Custody Services Waived | $ | $ | $ | $ | ||||||||||||
| Amount Recognized for Distribution Services | $ | $ | $ | $ | ||||||||||||
| Amount of Distribution Services Waived | $ | $ | $ | $ | ||||||||||||
| Amount Recognized for Wilmington Trust | $ | $ | $ | $ | ||||||||||||
| Amount of Wilmington Trust Waived | $ | $ | $ | $ | ||||||||||||
| Amount Recognized for Thales | $ | $ | $ | $ | ||||||||||||
| Amount of Thales Waived | $ | $ | $ | $ | ||||||||||||
(1) The Hashdex Bitcoin Futures ETF commenced operations on September 15, 2022.
Note 3 – Summary of Significant Accounting Policies
Basis of Presentation
The accompanying financial statements have been prepared on a combined basis in conformity with accounting principles generally accepted in the United States of America (“U.S. GAAP”) as detailed in the Financial Accounting Standards Board’s Accounting Standards Codification and include the accounts of the Trust, CORN, CANE, SOYB, WEAT, TAGS and DEFI. Refer to the accompanying separate financial statements for each Fund for more detailed information. The periods represented by the financial statements herein contain the results of CORN, SOYB, CANE, WEAT, TAGS and DEFI for the months during which each Fund was in operation, except for eliminations for TAGS as explained below.
Given the investment objective of TAGS as described in Note 1 above, TAGS will buy, sell, and hold, as part of its normal operations, shares of the Underlying Agricultural Funds. The Trust eliminates the shares of the other series of the Trust owned by TAGS from its combined statements of assets and liabilities. The Trust eliminates the net change in unrealized appreciation or depreciation on securities owned by TAGS from its combined statements of operations. The combined statements of changes in net assets and cash flows present a net presentation of the purchases and sales of the Underlying Funds by TAGS.
Revenue Recognition
Commodity and cryptocurrency futures contracts are recorded on the trade date. All such transactions are recorded on the identified cost basis and marked to market daily. Unrealized appreciation or depreciation on commodity and cryptocurrency futures contracts are reflected in the combined statements of operations as the difference between the original contract amount and the fair market value as of the last business day of the year or as of the last date of the financial statements. Changes in the appreciation or depreciation between periods are reflected in the combined statements of operations. Interest on cash equivalents with financial institutions are recognized on an accrual basis. The Funds earn interest on funds held at the custodian and other financial institutions at prevailing market rates for such investments.
The Sponsor invests a portion of cash in commercial paper, which is deemed a cash equivalent based on the rating and duration of contracts as described in the notes to the combined financial statements and reflected in cash and cash equivalents on the combined statements of assets and liabilities and on the combined statements of cash flows. Accretion on these investments is recognized using the effective interest method in U.S. dollars and included in interest income on the combined statements of operations.
The Sponsor invests a portion of the cash held by the broker in short term Treasury Bills as collateral for open futures contracts. Accretion on these investments is recognized using the effective interest method in U.S. dollars and included in interest income on the combined statements of operations.
Brokerage Commissions
The Sponsor recognizes the expense for brokerage commissions for futures contract trades on a per-trade basis. The below table shows the amounts included on the combined statements of operations as total brokerage commissions paid inclusive of unrealized loss for the three and nine months ended September 30, 2023 and 2022.
| CORN | SOYB | CANE | WEAT | TAGS | DEFI | TRUST | ||||||||||||||||||||||
| Three months ended September 30, 2023 | $ | $ | $ | $ | $ | $ | $ | |||||||||||||||||||||
| Three months ended September 30, 2022 (1) | $ | $ | $ | $ | $ | $ | $ | |||||||||||||||||||||
| Nine months ended September 30, 2023 | $ | $ | $ | $ | $ | $ | $ | |||||||||||||||||||||
| Nine months ended September 30, 2022 (1) | $ | $ | $ | $ | $ | $ | $ | |||||||||||||||||||||
(1) The Hashdex Bitcoin Futures ETF commenced operations on September 15, 2022.
Income Taxes
The Trust is organized and will be operated as a Delaware statutory trust. For federal income tax purposes, each Fund will be treated as a publicly traded partnership. A publicly traded partnership is generally treated as a corporation for federal income tax purposes unless 90% or more of the publicly traded partnership’s gross income for each taxable year of its existence consists of qualifying income as defined in section 7704(d) of the Internal Revenue Code of 1986, as amended. Qualifying income is defined as generally including, in pertinent part, interest (other than from a financial business), dividends, and gains from the sale or disposition of capital assets held for the production of interest or dividends. In the case of a partnership of which a principal activity is the buying and selling of commodities, other than as inventory, or of futures, forwards and options with respect to commodities, qualifying income also includes income and gains from commodities and from futures, forwards, options with respect to commodities and, provided the partnership is a trader or investor with respect to such assets, swaps and other notional principal contracts with respect to commodities. Each Fund expects that at least 90% of the Fund’s gross income for each taxable year will consist of qualifying income and that the Fund will be taxed as a partnership for federal income tax purposes. Therefore, the Funds do not record a provision for income taxes because the shareholders report their share of a Fund’s income or loss on their income tax returns. The financial statements reflect the Funds’ transactions without adjustment, if any, required for income tax purposes.
The Funds are required to determine whether a tax position is more likely than not to be sustained upon examination by the applicable taxing authority, including resolution of any related appeals or litigation processes, based on the technical merits of the position. The Funds file income tax returns in the U.S. federal jurisdiction and may file income tax returns in various U.S. states and foreign jurisdictions. For all tax years to 2022, the Funds remain subject to income tax examinations by major taxing authorities. The tax benefit recognized is measured as the largest amount of benefit that has a greater than fifty percent likelihood of being realized upon ultimate settlement. De-recognition of a tax benefit previously recognized results in the Funds recording a tax liability that reduces net assets. Based on their analysis, the Funds have determined that they have incurred any liability for unrecognized tax benefits as of September 30, 2023, and for the years ended December 31, 2022, 2021 and 2020. However, the Funds’ conclusions regarding this policy may be subject to review and adjustment at a later date based on factors including, but not limited to, ongoing analysis of and changes to tax laws, regulations, and interpretations thereof.
There is very limited authority on the U.S. federal income tax treatment of bitcoin and no direct authority on bitcoin derivatives, such as Bitcoin Futures Contracts. Bitcoin Futures Contracts more likely than not will be considered futures with respect to commodities for purposes of the qualifying income exception under section 7704 of the Code. Based on a CFTC determination that treats bitcoin as a commodity under the CEA, the Fund intends to take the position that Bitcoin Futures Contracts consist of futures on commodities for purposes of the qualifying income exception under section 7704 of the Code. Shareholders should be aware that the Fund’s position is not binding on the IRS, and no assurance can be given that the IRS will not challenge the Fund’s position, or that the IRS or a court will not ultimately reach a contrary conclusion, which would result in the material adverse consequences to Shareholders and the Fund.
The Funds recognize interest accrued related to unrecognized tax benefits and penalties related to unrecognized tax benefits in income tax fees payable, if assessed.
The Funds may be subject to potential examination by U.S. federal, U.S. state, or foreign jurisdictional authorities in the area of income taxes. These potential examinations may include questioning the timing and amount of deductions, the nexus of income among various tax jurisdictions, and compliance with U.S. federal, U.S. state and foreign tax laws.
Creations and Redemptions
Authorized Purchasers may purchase Creation Baskets from each Fund. The amount of the proceeds required to purchase a Creation Basket will be equal to the NAV of the shares in the Creation Basket determined as of 4:00 p.m. (ET) time on the day the order to create the basket is received in good order.
Authorized Purchasers may redeem shares from each Fund only in blocks of shares called “Redemption Baskets.” The amount of the redemption proceeds for a Redemption Basket will be equal to the NAV of the shares in the Redemption Basket determined as of 4:00 p.m. (ET) on the day the order to redeem the basket is received in good order.
Each Fund receives or pays the proceeds from shares sold or redeemed within three business days after the trade date of the purchase or redemption. The amounts due from Authorized Purchasers are reflected in the statements of assets and liabilities as capital shares receivable. Amounts payable to Authorized Purchasers upon redemption are reflected in the statements of assets and liabilities as payable for shares redeemed.
There are a minimum number of baskets and associated Shares specified for each Fund in the Fund’s respective prospectus, as amended from time to time. If a Fund experienced redemptions that caused the number of Shares outstanding to decrease to the minimum level of Shares required to be outstanding, until the minimum number of Shares is again exceeded through the purchase of a new Creation Basket, there can be no more redemptions by an Authorized Purchaser. These minimum levels are as follows:
CORN:
SOYB:
CANE:
WEAT:
TAGS:
DEFI:
Cash and Cash Equivalents
Cash equivalents are highly liquid investments with original maturity dates of 90 days or less when acquired. The Trust reported its cash equivalents in the combined statements of assets and liabilities at market value, or at carrying amounts that approximate fair value, because of their highly liquid nature and short-term maturities. Each Fund that is a series of the Trust has the balance of its cash equivalents on deposit with financial institutions. The Trust holds a balance in money market funds that is included in cash and cash equivalents on the combined statements of assets and liabilities. The Sponsor invests a portion of the available cash for the Funds in alternative demand deposit savings accounts, which are classified as cash and not as cash equivalents. Assets deposited with the bank may, at times, exceed federally insured limits. The Sponsor invests a portion of the available cash for the Funds in investment grade commercial paper with durations of 90 days or less, which is classified as a cash equivalent and is not FDIC insured. The Sponsor may invest a portion of the cash held by the broker in short term Treasury Bills as collateral for open futures contracts, which is classified as a cash equivalent and is not FDIC insured.
| September 30, 2023 | December 31, 2022 | |||||||
| Money Market Funds | $ | $ | ||||||
| Demand Deposit Savings Accounts | ||||||||
| Commercial Paper | ||||||||
| Total cash and cash equivalents as presented on the combined Statement of Assets and Liabilities | $ | $ | ||||||
Payable for Purchases of Commercial Paper
The amount recorded by the Trust for commercial paper transactions awaiting settlement represents the amount payable for contracts purchased but not yet settled as of the reporting date. The value of the contract is included in cash and cash equivalents, and the payable amount is included as a liability.
Due from/to Broker
The amount recorded by the Trust for the amount due from and to the clearing broker includes, but is not limited to, cash held by the broker, amounts payable to the clearing broker related to open transactions, payables for commodities futures accounts liquidating to an equity balance on the clearing broker’s records, and amounts of brokerage commissions paid and recognized as unrealized losses.
Margin is the minimum amount of funds that must be deposited by a commodity interest trader with the trader’s broker to initiate and maintain an open position in futures contracts. A margin deposit acts to assure the trader’s performance of the futures contracts purchased or sold. Futures contracts are customarily bought and sold on initial margin that represents a small percentage of the aggregate purchase or sales price of the contract. Because of such low margin requirements, price fluctuations occurring in the futures markets may create profits and losses that, in relation to the amount invested, are greater than customary in other forms of investment or speculation. As discussed below, adverse price changes in the futures contract may result in margin requirements that greatly exceed the initial margin. In addition, the amount of margin required in connection with a particular futures contract is set from time to time by the exchange on which the contract is traded and may be modified from time to time by the exchange during the term of the contract. Brokerage firms, such as the Funds’ clearing brokers, carrying accounts for traders in commodity interest contracts generally require higher amounts of margin as a matter of policy to further protect themselves. Over the counter trading generally involves the extension of credit between counterparties, so the counterparties may agree to require the posting of collateral by one or both parties to address credit exposure.
When a trader purchases an option, there is no margin requirement; however, the option premium must be paid in full. When a trader sells an option, on the other hand, he or she is required to deposit margin in an amount determined by the margin requirements established for the underlying interest and, in addition, an amount substantially equal to the current premium for the option. The margin requirements imposed on the selling of options, although adjusted to reflect the probability that out-of-the-money options will not be exercised, can in fact be higher than those imposed in dealing in the futures markets directly. Complicated margin requirements apply to spreads and conversions, which are complex trading strategies in which a trader acquires a mixture of options positions and positions in the underlying interest.
Ongoing or “maintenance” margin requirements are computed each day by a trader’s clearing broker. When the market value of a particular open futures contract changes to a point where the margin on deposit does not satisfy maintenance margin requirements, a margin call is made by the broker. If the margin call is not met within a reasonable time, the broker may close out the trader’s position. With respect to the Funds’ trading, the Funds (and not their shareholders personally) are subject to margin calls.
Finally, many major U.S. exchanges have passed certain cross margining arrangements involving procedures pursuant to which the futures and options positions held in an account would, in the case of some accounts, be aggregated, and margin requirements would be assessed on a portfolio basis, measuring the total risk of the combined positions.
Payable/Receivable for Securities Purchased/Sold
Due from/to broker for investments in securities are securities transactions pending settlement. The Trust and the Funds are subject to credit risk to the extent any broker with whom it conducts business is unable to fulfill contractual obligations on its behalf. The management of the Trust and the Funds monitors the financial condition of such brokers and does not anticipate any losses from these counterparties. The principal broker through which the Trust and TAGS can execute securities transactions for TAGS is U.S. Bank N.A.
Sponsor Fee, Allocation of Expenses and Related Party Transactions
The Sponsor is responsible for investing the assets of the Fund in accordance with the objectives and policies of the Fund. In addition, the Sponsor arranges for one or more third parties to provide administrative, custodial, accounting, transfer agency, compliance, and other necessary services to the Fund, including services directly attributable to the Fund such as accounting, financial reporting, regulatory compliance, and trading activities. In some cases, at its discretion, the Sponsor may elect not to outsource certain of these expenses.
In addition, the Agricultural Funds, except for TAGS, which has no such fee are contractually obligated to pay a monthly management fee to the Sponsor, based on average daily net assets, at a rate equal to
The Agricultural Funds generally pay for all brokerage fees, taxes, and other expenses, including licensing fees for the use of intellectual property, registration or other fees paid to the SEC, the Financial Industry Regulatory Authority (“FINRA”), or any other regulatory agency in connection with the offer and sale of subsequent Shares after its initial registration and all legal, accounting, printing and other expenses associated therewith. Each Fund also pays its portion of the fees and expenses associated with the Trust’s tax accounting and reporting requirements. Certain aggregate expenses common to all Funds within the Trust are allocated by the Sponsor to the respective Funds based on activity drivers deemed most appropriate by the Sponsor for such expenses, including but not limited to relative assets under management and creation order activity. These aggregate common expenses include, but are not limited to, legal, auditing, accounting and financial reporting, tax-preparation, regulatory compliance, trading activities, and insurance costs, as well as fees paid to the Distributor, which are included in the related line item in the statements of operations. A portion of these aggregate common expenses are related to services provided by the Sponsor or related parties of principals of the Sponsor; these are necessary services to the Funds, which are primarily the cost of performing accounting and financial reporting, regulatory compliance, and trading activities that are directly attributable to the Funds and are, primarily, included as distribution and marketing fees on the statements of operations. These amounts, for the Trust and for each Fund, are detailed in the notes to the financial statements included in Part I of this filing.
DEFI is contractually obligated to pay a monthly management fee to the Sponsor, based on average daily net assets, at a rate equal to
| Three months ended September 30, 2023 | Three months ended September 30, 2022 (1) | Nine months ended September 30, 2023 | Nine months ended September 30, 2022 (1) | |||||||||||||
| Recognized Related Party Transactions | $ | $ | $ | $ | ||||||||||||
| Waived Related Party Transactions | $ | $ | $ | $ | ||||||||||||
(1) The Hashdex Bitcoin Futures ETF commenced operations on September 15, 2022.
The Sponsor has the ability to elect to pay certain expenses on behalf of the Funds or waive the management fee. This election is subject to change by the Sponsor, at its discretion. Expenses paid by the Sponsor and Management fees waived by the Sponsor are, if applicable, presented as waived expenses in the statements of operations for each Fund. The Sponsor has determined that there will be no recovery sought for the amounts below in any future period.
| CORN | SOYB | CANE | WEAT | TAGS | DEFI | TRUST | ||||||||||||||||||||||
| Three months ended September 30, 2023 | $ | $ | $ | $ | $ | $ | $ | |||||||||||||||||||||
| Three months ended September 30, 2022 (1) | $ | $ | $ | $ | $ | $ | $ | |||||||||||||||||||||
| Nine months ended September 30, 2023 | $ | $ | $ | $ | $ | $ | $ | |||||||||||||||||||||
| Nine months ended September 30, 2022 (1) | $ | $ | $ | $ | $ | $ | $ | |||||||||||||||||||||
(1) The Hashdex Bitcoin Futures ETF commenced operations on September 15, 2022.
Use of Estimates
The preparation of financial statements in conformity with U.S. GAAP requires management to make estimates and assumptions that affect the reported amounts of assets and liabilities and disclosure of contingent assets and liabilities at the date of the financial statements, and the reported amounts of the revenue and expenses during the reporting period. Actual results could differ from those estimates.
Fair Value - Definition and Hierarchy
In accordance with U.S. GAAP, fair value is defined as the price that would be received to sell an asset or paid to transfer a liability (i.e., the “exit price”) in an orderly transaction between market participants at the measurement date.
In determining fair value, the Trust uses various valuation approaches. In accordance with U.S. GAAP, a fair value hierarchy for inputs is used in measuring fair value that maximizes the use of observable inputs and minimizes the use of unobservable inputs by requiring that the most observable inputs be used when available. Observable inputs are those that market participants would use in pricing the asset or liability based on market data obtained from sources independent of the Trust. Unobservable inputs reflect the Trust’s assumptions about the inputs market participants would use in pricing the asset or liability developed based on the best information available in the circumstances. The fair value hierarchy is categorized into three levels based on the inputs as follows:
Level 1 - Valuations based on unadjusted quoted prices in active markets for identical assets or liabilities that the Trust has the ability to access. Valuation adjustments and block discounts are not applied to Level 1 futures contracts held by CORN, SOYB, CANE, WEAT and DEFI, the securities of the Underlying Funds held by TAGS, and any other securities held by any Fund, together referenced throughout this filing as “financial instruments.” Since valuations are based on quoted prices that are readily and regularly available in an active market, valuation of these securities does not entail a significant degree of judgment.
Level 2 - Valuations based on quoted prices in markets that are not active or for which all significant inputs are observable, either directly or indirectly.
Level 3 - Valuations based on inputs that are unobservable and significant to the overall fair value measurement.
The availability of valuation techniques and observable inputs can vary from financial instrument to financial instrument and is affected by a wide variety of factors including, the type of financial instrument, whether the financial instrument is new and not yet established in the marketplace, and other characteristics particular to the transaction. To the extent that valuation is based on models or inputs that are less observable or unobservable in the market, the determination of fair value requires more judgment. Those estimated values do not necessarily represent the amounts that may be ultimately realized due to the occurrence of future circumstances that cannot be reasonably determined. Because of the inherent uncertainty of valuation, those estimated values may be materially higher or lower than the values that would have been used had a ready market for the financial instruments existed. Accordingly, the degree of judgment exercised by the Fund in determining fair value is greatest for financial instruments categorized in Level 3. In certain cases, the inputs used to measure fair value may fall into different levels of the fair value hierarchy. In such cases, for disclosure purposes, the level in the fair value hierarchy, within which the fair value measurement in its entirety falls, is determined based on the lowest level input that is significant to the fair value measurement.
Fair value is a market-based measure considered from the perspective of a market participant rather than an entity-specific measure. Therefore, even when market assumptions are not readily available, the Trust’s own assumptions are set to reflect those that market participants would use in pricing the asset or liability at the measurement date. The Trust uses prices and inputs that are current as of the measurement date, including periods of market dislocation. In periods of market dislocation, the observability of prices and inputs may be reduced for many financial instruments. This condition could cause a financial instrument to be reclassified to a lower level within the fair value hierarchy. For instance, when Corn Futures Contracts on the Chicago Board of Trade (“CBOT”) are not actively trading due to a “limit-up” or ‘limit-down” condition, meaning that the daily change in the Corn Futures Contracts has exceeded the limits established, the Trust and the Fund will revert to alternative verifiable sources of valuation of its assets. When such a situation exists on a quarter close, the Sponsor will calculate the NAV on a particular day using the Level 1 valuation but will later recalculate the NAV for the impacted Fund based upon the valuation inputs from these alternative verifiable sources (Level 2 or Level 3) and will report such NAV in its applicable financial statements and reports.
On September 30, 2023 and December 31, 2022, in the opinion of the Trust, the reported value at the close of the market for each commodity and cryptocurrency contract fairly reflected the value of the futures and no alternative valuations were required.
For the three and nine months ended September 30, 2023 and year ended December 31, 2022, the Funds did not have any significant transfers between any of the levels of the fair value hierarchy.
The Funds and the Trust record their derivative activities at fair value. Gains and losses from derivative contracts are included in the statements of operations. Derivative contracts include futures contracts related to commodity prices. Futures, which are listed on a national securities exchange, such as the CBOT and the ICE, or reported on another national market, are generally categorized in Level 1 of the fair value hierarchy. OTC derivatives contracts (such as forward and swap contracts), which may be valued using models, depending on whether significant inputs are observable or unobservable, are categorized in Levels 2 or 3 of the fair value hierarchy.
Investments in the securities of the Underlying Funds are freely traded and listed on the NYSE Arca. These investments are valued at the NAV of the Underlying Fund as of the valuation date as calculated by the administrator based on the exchange-quoted prices of the commodity futures contracts held by the Underlying Fund.
Expenses
Expenses are recorded using the accrual method of accounting.
New Accounting Pronouncements
The Financial Accounting Standards Board (“FASB”) issued Accounting Standards Update (“ASU”) issued ASU 2023-01, related to Leases – (Topic 842). The response to concerns about applying Topic 842 to related party arrangements between entities under common control. The update was adopted early for the quarter ended March 31, 2023; the adoption did not have a material impact on the financial statements and disclosures of the Trust or the Funds.
The FASB issued ASU 2022-03, related to fair value measurement (Topic 820) of equity securities subject to contractual sale restrictions. Under the clarified guidance, contractual restrictions on the sale of an equity security are not considered part of the unit of account of the equity security and, therefore, are not considered in measuring fair value, however they do require disclosures. The amendment was adopted for the quarter ended June 30, 2022; the adoption did not have a material impact on the financial statements and disclosures of the Trust or the Funds.
Note 4 – Fair Value Measurements
The Trust’s assets and liabilities recorded at fair value have been categorized based upon a fair value hierarchy as described in the Trust’s significant accounting policies in Note 3. The following table presents information about the Trust’s assets and liabilities measured at fair value as of September 30, 2023 and December 31, 2022:
| Assets: | Level 1 | Level 2 | Level 3 | Balance as of September 30, 2023 | ||||||||||||
| Cash Equivalents | $ | $ | $ | $ | ||||||||||||
| Commodity and Cryptocurrency Futures Contracts | ||||||||||||||||
| Soybean futures contracts | ||||||||||||||||
| Sugar futures contracts | ||||||||||||||||
| Bitcoin futures contracts | ||||||||||||||||
| Total | $ | $ | $ | $ | ||||||||||||
| Liabilities | Level 1 | Level 2 | Level 3 | Balance as of September 30, 2023 | ||||||||||||
| Commodity and Cryptocurrency Futures Contracts | ||||||||||||||||
| Corn futures contracts | $ | $ | $ | $ | ||||||||||||
| Soybean futures contracts | ||||||||||||||||
| Sugar futures contracts | ||||||||||||||||
| Wheat futures contracts | ||||||||||||||||
| Total | $ | $ | $ | $ | ||||||||||||
| Assets: | Level 1 | Level 2 | Level 3 | Balance as of December 31, 2022 | ||||||||||||
| Cash Equivalents | $ | $ | $ | $ | ||||||||||||
| Commodity and Cryptocurrency Futures Contracts | ||||||||||||||||
| Corn futures contracts | ||||||||||||||||
| Soybean futures contracts | ||||||||||||||||
| Sugar futures contracts | ||||||||||||||||
| Wheat futures contracts | ||||||||||||||||
| Bitcoin futures contracts | ||||||||||||||||
| Total | $ | $ | $ | $ | ||||||||||||
| Liabilities | Level 1 | Level 2 | Level 3 | Balance as of December 31, 2022 | ||||||||||||
| Cash Equivalents | ||||||||||||||||
| Commodity and Cryptocurrency Futures Contracts | ||||||||||||||||
| Corn futures contracts | $ | $ | $ | $ | ||||||||||||
| Sugar futures contracts | ||||||||||||||||
| Wheat futures contracts | ||||||||||||||||
| Total | $ | $ | $ | $ | ||||||||||||
For the three and nine months ended September 30, 2023 and year ended December 31, 2022, the Funds did not have any significant transfers between any of the levels of the fair value hierarchy. The determination is made as of the settlement of the futures contracts on the last day of trading for the reporting period. In making the determination of a Level 1 or Level 2 transfer, the Fund considers the average volume of the specific underlying futures contracts traded on the relevant exchange for the periods being reported.
See the Fair Value - Definition and Hierarchy section in Note 3 above for an explanation of the transfers into and out of each level of the fair value hierarchy.
Note 5 – Derivative Instruments and Hedging Activities
In the normal course of business, the Funds utilize derivative contracts in connection with its proprietary trading activities. Investments in derivative contracts are subject to additional risks that can result in a loss of all or part of an investment. The Funds’ derivative activities and exposure to derivative contracts are classified by the following primary underlying risks: interest rate, credit, commodity price, and equity price risks. In addition to its primary underlying risks, the Funds are also subject to additional counterparty risk due to the inability of its counterparties to meet the terms of their contracts. For the three and nine months ended September 30, 2023 and year ended December 31, 2022, the Funds invested only in commodity and cryptocurrency futures contracts specifically related to each Fund.
Futures Contracts
The Funds are subject to commodity and cryptocurrency price risk in the normal course of pursuing their investment objectives. A futures contract represents a commitment for the future purchase or sale of an asset at a specified price on a specified date.
The purchase and sale of futures contracts requires margin deposits with an FCM. Subsequent payments (variation margin) are made or received by each Fund each day, depending on the daily fluctuations in the value of the contract, and are recorded as unrealized gains or losses by each Fund. Futures contracts may reduce the Funds’ exposure to counterparty risk since futures contracts are exchange-traded; and the exchange’s clearinghouse, as the counterparty to all exchange-traded futures, guarantees the futures against default.
The Commodity Exchange Act requires an FCM to segregate all customer transactions and assets from the FCM’s proprietary activities. A customer’s cash and other equity deposited with an FCM are considered commingled with all other customer funds subject to the FCM’s segregation requirements. In the event of an FCM’s insolvency, recovery may be limited to each Fund’s pro rata share of segregated customer funds available. It is possible that the recovery amount could be less than the total of cash and other equity deposited.
The following table discloses information about offsetting assets and liabilities presented in the combined statements of assets and liabilities to enable users of these financial statements to evaluate the effect or potential effect of netting arrangements for recognized assets and liabilities. These recognized assets and liabilities are presented as defined in the Financial Accounting Standards Board’s (“FASB”) Accounting Standards Update (“ASU”) No. 2011-11 “Balance Sheet (Topic 210): Disclosures about Offsetting Assets and Liabilities” and subsequently clarified in FASB ASU 2013-01 “Balance Sheet (Topic 210): Clarifying the Scope of Disclosures about Offsetting Assets and Liabilities.”
The following table also identifies the fair value amounts of derivative instruments included in the combined statements of assets and liabilities as derivative contracts, categorized by primary underlying risk, and held by the FCMs, Marex, and StoneX as of September 30, 2023, and December 31, 2022. The DEFI Fund has an account open at Phillip Capital with no contracts held as of September 30, 2023.
*The amount of collateral presented in Collateral, Due from Broker, is limited to the liability for the futures contracts and accordingly does not include the excess collateral pledged.
| Offsetting of Financial Assets and Derivative Assets as of September 30, 2023 | ||||||||||||||||||||||||
| (i) | (ii) | (iii) = (i-ii) | (iv) | (v) = (iii)-(iv) | ||||||||||||||||||||
| Gross Amount Not Offset in the Statement of Assets and Liabilities | ||||||||||||||||||||||||
| Description | Gross Amount of Recognized Assets | Gross Amount Offset in the Statement of Assets and Liabilities | Net Amount Presented in the Statement of Assets and Liabilities | Futures Contracts Available for Offset | Collateral, Due to Broker | Net Amount | ||||||||||||||||||
| Commodity and Cryptocurrency Price | ||||||||||||||||||||||||
| Soybean futures contracts | $ | $ | $ | $ | $ | $ | ||||||||||||||||||
| Sugar futures contracts | $ | $ | $ | $ | $ | $ | ||||||||||||||||||
| Bitcoin futures contracts | $ | $ | $ | $ | $ | $ | ||||||||||||||||||
| Offsetting of Financial Liabilities and Derivative Liabilities as of September 30, 2023 | ||||||||||||||||||||||||
| (i) | (ii) | (iii) = (i-ii) | (iv) | (v) = (iii)-(iv) | ||||||||||||||||||||
| Gross Amount Not Offset in the Statement of Assets and Liabilities | ||||||||||||||||||||||||
| Description | Gross Amount of Recognized Liabilities | Gross Amount Offset in the Statement of Assets and Liabilities | Net Amount Presented in the Statement of Assets and Liabilities | Futures Contracts Available for Offset | Collateral, Due from Broker* | Net Amount | ||||||||||||||||||
| Commodity and Cryptocurrency Price | ||||||||||||||||||||||||
| Corn futures contracts | $ | $ | $ | $ | $ | $ | ||||||||||||||||||
| Soybean futures contracts | $ | $ | $ | $ | $ | $ | ||||||||||||||||||
| Sugar futures contracts | $ | $ | $ | $ | $ | $ | ||||||||||||||||||
| Wheat futures contracts | $ | $ | $ | $ | $ | $ | ||||||||||||||||||
| Offsetting of Financial Assets and Derivative Assets as of December 31, 2022 | ||||||||||||||||||||||||
| (i) | (ii) | (iii) = (i-ii) | (iv) | (v) = (iii)-(iv) | ||||||||||||||||||||
| Gross Amount Not Offset in the Statement of Assets and Liabilities | ||||||||||||||||||||||||
| Description | Gross Amount of Recognized Assets | Gross Amount Offset in the Statement of Assets and Liabilities | Net Amount Presented in the Statement of Assets and Liabilities | Futures Contracts Available for Offset | Collateral, Due to Broker | Net Amount | ||||||||||||||||||
| Commodity and Cryptocurrency Price | ||||||||||||||||||||||||
| Corn futures contracts | $ | $ | $ | $ | $ | $ | ||||||||||||||||||
| Soybean futures contracts | $ | $ | $ | $ | $ | $ | ||||||||||||||||||
| Sugar futures contracts | $ | $ | $ | $ | $ | $ | ||||||||||||||||||
| Wheat futures contracts | $ | $ | $ | $ | $ | $ | ||||||||||||||||||
| Bitcoin futures contracts | $ | $ | $ | $ | $ | $ | ||||||||||||||||||
| Offsetting of Financial Liabilities and Derivative Liabilities as of December 31, 2022 | ||||||||||||||||||||||||
| (i) | (ii) | (iii) = (i-ii) | (iv) | (v) = (iii)-(iv) | ||||||||||||||||||||
| Gross Amount Not Offset in the Statement of Assets and Liabilities | ||||||||||||||||||||||||
| Description | Gross Amount of Recognized Liabilities | Gross Amount Offset in the Statement of Assets and Liabilities | Net Amount Presented in the Statement of Assets and Liabilities | Futures Contracts Available for Offset | Collateral, Due from Broker* | Net Amount | ||||||||||||||||||
| Commodity and Cryptocurrency Price | ||||||||||||||||||||||||
| Corn futures contracts | $ | $ | $ | $ | $ | $ | ||||||||||||||||||
| Sugar futures contracts | $ | $ | $ | $ | $ | $ | ||||||||||||||||||
| Wheat futures contracts | $ | $ | $ | $ | $ | $ | ||||||||||||||||||
The following is a summary of realized and unrealized gains (losses) of the derivative instruments utilized by the Trust:
Three months ended September 30, 2023
| Realized (Loss) Gain on Commodity Futures Contracts | Net Change in Unrealized Appreciation (Depreciation) on Commodity Futures Contracts | |||||||
| Commodity Price | ||||||||
| Corn futures contracts | $ | ( | ) | $ | ||||
| Soybeans futures contracts | ( | ) | ||||||
| Sugar futures contracts | ||||||||
| Wheat futures contracts | ( | ) | ||||||
| Bitcoin futures Contracts | ( | ) | ( | ) | ||||
| Total commodity and cryptocurrency futures contracts | $ | ( | ) | $ | ||||
Three months ended September 30, 2022 (1)
| Realized (Loss) Gain on Commodity Futures Contracts | Net Change in Unrealized Appreciation (Depreciation) on Commodity Futures Contracts | |||||||
| Commodity Price | ||||||||
| Corn futures contracts | $ | ( | ) | $ | ||||
| Soybeans futures contracts | ( | ) | ||||||
| Sugar futures contracts | ( | ) | ( | ) | ||||
| Wheat futures contracts | ( | ) | ||||||
| Bitcoin futures Contracts | ( | ) | ( | ) | ||||
| Total commodity and cryptocurrency futures contracts | $ | ( | ) | $ | ||||
(1) The Fund commenced operations on September 15, 2022.
Nine months ended September 30, 2023
| Realized (Loss) Gain on Commodity Futures Contracts | Net Change in Unrealized (Depreciation) Appreciation on Commodity Futures Contracts | |||||||
| Commodity Price | ||||||||
| Corn futures contracts | $ | ( | ) | $ | ( | ) | ||
| Soybeans futures contracts | ( | ) | ||||||
| Sugar futures contracts | ||||||||
| Wheat futures contracts | ( | ) | ||||||
| Bitcoin futures Contracts | ( | ) | ||||||
| Total commodity and cryptocurrency futures contracts | $ | ( | ) | $ | ( | ) | ||
Nine months ended September 30, 2022 (1)
| Realized Gain (Loss) on Commodity Futures Contracts | Net Change in Unrealized Depreciation on Commodity Futures Contracts | |||||||
| Commodity Price | ||||||||
| Corn futures contracts | $ | $ | ( | ) | ||||
| Soybeans futures contracts | ( | ) | ||||||
| Sugar futures contracts | ( | ) | ( | ) | ||||
| Wheat futures contracts | ( | ) | ( | ) | ||||
| Bitcoin futures Contracts | ( | ) | ( | ) | ||||
| Total commodity and cryptocurrency futures contracts | $ | ( | ) | $ | ( | ) | ||
(1) The Fund commenced operations on September 15, 2022.
Volume of Derivative Activities
The average notional market value categorized by primary underlying risk for the futures contracts held was $
Note 6 - Organizational and Offering Costs
Expenses incurred in organizing of the Trust and the initial offering of the shares of the Funds, including applicable SEC registration fees, were borne directly by the Sponsor for the Funds, and will be borne directly by the Sponsor for any series of the Trust which is not yet operating or will be issued in the future. The Trust will not be obligated to reimburse the Sponsor.
Note 7 – Detail of the net assets and shares outstanding of the Funds that are a series of the Trust
The following are the net assets and shares outstanding of each Fund that is a series of the Trust and, thus, in total, comprise the combined net assets of the Trust:
September 30, 2023
| Outstanding | ||||||||
| Shares | Net Assets | |||||||
| Teucrium Corn Fund | $ | |||||||
| Teucrium Soybean Fund | ||||||||
| Teucrium Sugar Fund | ||||||||
| Teucrium Wheat Fund | ||||||||
| Hashdex Bitcoin Futures ETF | ||||||||
| Teucrium Agricultural Fund: | ||||||||
| Net assets including the investment in the Underlying Funds | ||||||||
| Less: Investment in the Underlying Funds | ( | ) | ||||||
| Net for the Fund in the combined net assets of the Trust | ||||||||
| Total | $ | |||||||
December 31, 2022
| Outstanding | ||||||||
| Shares | Net Assets | |||||||
| Teucrium Corn Fund | $ | |||||||
| Teucrium Soybean Fund | ||||||||
| Teucrium Sugar Fund | ||||||||
| Teucrium Wheat Fund | ||||||||
| Hashdex Bitcoin Futures ETF | ||||||||
| Teucrium Agricultural Fund: | ||||||||
| Net assets including the investment in the Underlying Funds | ||||||||
| Less: Investment in the Underlying Funds | ( | ) | ||||||
| Net for the Fund in the combined net assets of the Trust | ||||||||
| Total | $ | |||||||
The detailed information for the subscriptions and redemptions, and other financial information for each Fund that is a series of the Trust are included in the accompanying financial statements of each Fund.
Note 8 – Subsequent Events
Management has evaluated the financial statements for the quarter-ended September 30, 2023 for subsequent events through the date of this filing and noted no material events requiring either recognition through the date of the filing or disclosure herein for the Trust and Funds other than those noted below:
Trust:
Nothing to report.
CORN:
Nothing to report.
SOYB:
Nothing to report.
CANE:
Nothing to report.
WEAT:
Nothing to report.
TAGS:
Nothing to report.
DEFI:
The total net assets of the Fund increased by $
Teucrium Commodity Trust (“Target Trust’), on behalf of its series, Hashdex Bitcoin Futures ETF (“Target Fund”), and Tidal Commodities Trust I (“Acquiring Trust”), on behalf of its series, Hashdex Bitcoin Futures ETF (“Acquiring Fund”), entered into an Agreement and Plan of Partnership Merger and Liquidation dated as of October 30, 2023 (the “Plan of Merger”). The Merger is scheduled to close on or about January 3, 2024 (the “Closing Date”).
Pursuant to the Plan of Merger, each Acquired Fund shareholder will receive one share of the Acquiring Fund for every one share of the Acquired Fund held on the Closing Date based on the net asset value per share of the Acquiring Fund being equal to the net asset value per share of the Acquired Fund determined immediately prior to the Merger closing. Further, the Acquiring Fund will acquire all the assets of the Acquired Fund and assume all the liabilities of the Acquired Fund. Upon the Merger closing, the Plan of Merger will cause all of the Acquired Fund’s shares to be cancelled and the Acquired Fund to be liquidated.
The Merger will not materially modify the rights of Acquired Fund shareholders with respect to their investment. The Acquiring Fund has the same investment objective, investment strategies and investment restrictions, and substantially identical investment risks, as the Acquired Fund. Following the Merger, the Acquiring Fund will be sponsored by Toroso Investments LLC (“Toroso”) and the Acquiring Fund will be managed by portfolio managers employed by Toroso. Toroso is not affiliated with the current sponsor of the Target Trust, Teucrium Trading LLC (“Teucrium”). The Acquiring Fund will pay the same management fee rate to Toroso, under the same terms, as currently paid by the Acquired Fund to Teucrium. The management fee for the Acquiring Fund is
In connection with the Merger, the Acquiring Trust filed a Registration Statement on Form S-4 and Pre-Effective Amendment No. 1 to a Registration Statement on Form S-1 with the U.S. Securities and Exchange Commission, on October 31, 2023 and November 2, 2023, respectively.
STATEMENTS OF ASSETS AND LIABILITIES
| September 30, 2023 | December 31, 2022 | |||||||
| (Unaudited) | ||||||||
| Assets | ||||||||
| Cash and cash equivalents | $ | $ | ||||||
| Interest receivable | ||||||||
| Other assets | ||||||||
| Capital shares receivable | ||||||||
| Equity in trading accounts: | ||||||||
| Commodity futures contracts | ||||||||
| Due from broker | ||||||||
| Total equity in trading accounts | ||||||||
| Total assets | ||||||||
| Liabilities | ||||||||
| Management fee payable to Sponsor | ||||||||
| Other liabilities | ||||||||
| Payable for shares redeemed | ||||||||
| Equity in trading accounts: | ||||||||
| Commodity futures contracts | ||||||||
| Total liabilities | ||||||||
| Net assets | $ | $ | ||||||
| Shares outstanding | ||||||||
| Shares Authorized | * | * | ||||||
| Net asset value per share | $ | $ | ||||||
| Market value per share | $ | $ | ||||||
* On April 7, 2022, the Teucrium Corn Fund registered an indeterminate number of shares of the Fund pursuant to Rule 456(d) under the Securities Act of 1933.
The accompanying notes are an integral part of these financial statements.
SCHEDULE OF INVESTMENTS
September 30, 2023
(Unaudited)
| Percentage of | ||||||||||||||||||||
| Description: Assets | Yield | Cost | Fair Value | Net Assets | Shares | |||||||||||||||
| Cash equivalents | ||||||||||||||||||||
| Money market funds | ||||||||||||||||||||
| U.S. Bank Deposit Account | % | $ | $ | % | ||||||||||||||||
| Goldman Sachs Financial Square Government Fund - Institutional Class | % | |||||||||||||||||||
| Total money market funds | $ | $ | % | |||||||||||||||||
| Maturity | Percentage of | Principal | |||||||||||||||||||
| Date | Yield | Cost | Fair Value | Net Assets | Amount | ||||||||||||||||
| Commercial Paper | |||||||||||||||||||||
| Brookfield Infrastructure Holdings (Canada) Inc. | | % | $ | % | |||||||||||||||||
| Brookfield Infrastructure Holdings (Canada) Inc. | | % | |||||||||||||||||||
| Brookfield Infrastructure Holdings (Canada) Inc. | | % | |||||||||||||||||||
| General Motors Financial Company, Inc. | | % | |||||||||||||||||||
| General Motors Financial Company, Inc. | | % | |||||||||||||||||||
| Harley-Davidson Financial Services, Inc. | | % | |||||||||||||||||||
| Harley-Davidson Financial Services, Inc. | | % | |||||||||||||||||||
| Harley-Davidson Financial Services, Inc. | | % | |||||||||||||||||||
| Hyundai Capital America | | % | |||||||||||||||||||
| Jabil Inc. | | % | |||||||||||||||||||
| Marriott International, Inc. | | % | |||||||||||||||||||
| National Fuel Gas Company | | % | |||||||||||||||||||
| National Fuel Gas Company | | % | |||||||||||||||||||
| Walgreens Boots Alliance, Inc. | | % | |||||||||||||||||||
| Walgreens Boots Alliance, Inc. | | % | |||||||||||||||||||
| Total Commercial Paper | $ | $ | % | ||||||||||||||||||
| Total Cash Equivalents | $ | % | |||||||||||||||||||
| Number of | Percentage of | Notional Amount | ||||||||||||||
| Description: Liabilities | Contracts | Fair Value | Net Assets | (Long Exposure) | ||||||||||||
| Commodity futures contracts | ||||||||||||||||
| United States corn futures contracts | ||||||||||||||||
| CBOT corn futures MAR 24 | $ | % | $ | |||||||||||||
| CBOT corn futures MAY24 | ||||||||||||||||
| CBOT corn futures DEC24 | ||||||||||||||||
| Total commodity futures contracts | $ | % | $ | |||||||||||||
The accompanying notes are an integral part of these financial statements.
TEUCRIUM CORN FUND
SCHEDULE OF INVESTMENTS
December 31, 2022
| Percentage of | ||||||||||||||||||||
| Description: Assets | Yield | Cost | Fair Value | Net Assets | Shares | |||||||||||||||
| Cash equivalents | ||||||||||||||||||||
| Money market funds | ||||||||||||||||||||
| First American Government Obligations Fund - Class X | % | $ | $ | % | ||||||||||||||||
| Goldman Sachs Financial Square Government Fund - Institutional Class | % | |||||||||||||||||||
| Total money market funds | $ | $ | % | |||||||||||||||||
| Maturity | Percentage of | Principal | |||||||||||||||||||
| Date | Yield | Cost | Fair Value | Net Assets | Amount | ||||||||||||||||
| Commercial Paper | |||||||||||||||||||||
| Brookfield Infrastructure Holdings (Canada) Inc. | | % | $ | $ | % | ||||||||||||||||
| CNH Industrial Capital LLC | | % | |||||||||||||||||||
| CNH Industrial Capital LLC | | % | |||||||||||||||||||
| Crown Castle Inc. | | % | |||||||||||||||||||
| Crown Castle Inc. | | % | |||||||||||||||||||
| Entergy Corporation | | % | |||||||||||||||||||
| General Motors Financial Company, Inc. | | % | |||||||||||||||||||
| General Motors Financial Company, Inc. | | % | |||||||||||||||||||
| Harley-Davidson Financial Services, Inc. | | % | |||||||||||||||||||
| Harley-Davidson Financial Services, Inc. | | % | |||||||||||||||||||
| Harley-Davidson Financial Services, Inc. | | % | |||||||||||||||||||
| Hyundai Capital America | | % | |||||||||||||||||||
| ITT Inc. | | % | |||||||||||||||||||
| Jabil Inc. | | % | |||||||||||||||||||
| Oracle Corporation | | % | |||||||||||||||||||
| V.F. Corporation | | % | |||||||||||||||||||
| Walgreens Boots Alliance, Inc. | | % | |||||||||||||||||||
| Total Commercial Paper | $ | $ | % | ||||||||||||||||||
| Total Cash Equivalents | $ | % | |||||||||||||||||||
| Number of | Percentage of | Notional Amount | ||||||||||||||
| Contracts | Fair Value | Net Assets | (Long Exposure) | |||||||||||||
| Commodity futures contracts | ||||||||||||||||
| United States corn futures contracts | ||||||||||||||||
| CBOT corn futures JUL23 | $ | % | $ | |||||||||||||
| Number of | Percentage of | Notional Amount | ||||||||||||||
| Description: Liabilities | Contracts | Fair Value | Net Assets | (Long Exposure) | ||||||||||||
| Commodity futures contracts | ||||||||||||||||
| United States corn futures contracts | ||||||||||||||||
| CBOT corn futures MAY23 | $ | % | $ | |||||||||||||
| CBOT corn futures DEC23 | ||||||||||||||||
| Total commodity futures contracts | $ | % | $ | |||||||||||||
The accompanying notes are an integral part of these financial statements.
STATEMENTS OF OPERATIONS
(Unaudited)
| Three months ended | Three months ended | Nine months ended | Nine months ended | |||||||||||||
| September 30, 2023 | September 30, 2022 | September 30, 2023 | September 30, 2022 | |||||||||||||
| Income | ||||||||||||||||
| Realized and unrealized gain (loss) on trading of commodity futures contracts: | ||||||||||||||||
| Realized (loss) gain on commodity futures contracts | $ | ( | ) | $ | ( | ) | $ | ( | ) | $ | ||||||
| Net change in unrealized appreciation (depreciation) on commodity futures contracts | ( | ) | ( | ) | ||||||||||||
| Interest income | ||||||||||||||||
| Total (loss) income | ( | ) | ( | ) | ||||||||||||
| Expenses | ||||||||||||||||
| Management fees | ||||||||||||||||
| Professional fees | ||||||||||||||||
| Distribution and marketing fees | ||||||||||||||||
| Custodian fees and expenses | ||||||||||||||||
| Business permits and licenses fees | ||||||||||||||||
| General and administrative expenses | ||||||||||||||||
| Total expenses | ||||||||||||||||
| Expenses waived by the Sponsor | ( | ) | ||||||||||||||
| Total expenses, net | ||||||||||||||||
| Net (loss) income | $ | ( | ) | $ | $ | ( | ) | $ | ||||||||
| Net (loss) gain per share | $ | ( | ) | $ | $ | ( | ) | $ | ||||||||
| Net (loss) gain per weighted average share | $ | ( | ) | $ | $ | ( | ) | $ | ||||||||
| Weighted average shares outstanding | ||||||||||||||||
The accompanying notes are an integral part of these financial statements.
STATEMENTS OF CHANGES IN NET ASSETS
(Unaudited)
| Nine months ended | Nine months ended | |||||||
| September 30, 2023 | September 30, 2022 | |||||||
| Operations | ||||||||
| Net (loss) income | $ | ( | ) | $ | ||||
| Capital transactions | ||||||||
| Issuance of Shares | ||||||||
| Redemption of Shares | ( | ) | ( | ) | ||||
| Total capital transactions | ( | ) | ||||||
| Net change in net assets | ( | ) | ||||||
| Net assets, beginning of period | $ | $ | ||||||
| Net assets, end of period | $ | $ | ||||||
| Net asset value per share at beginning of period | $ | $ | ||||||
| Net asset value per share at end of period | $ | $ | ||||||
| Creation of Shares | ||||||||
| Redemption of Shares | ||||||||
The accompanying notes are an integral part of these financial statements.
STATEMENTS OF CASH FLOWS
(Unaudited)
| Nine months ended | Nine months ended | |||||||
| September 30, 2023 | September 30, 2022 | |||||||
| Cash flows from operating activities: | ||||||||
| Net (loss) income | $ | ( | ) | $ | ||||
| Adjustments to reconcile net (loss) income to net cash (used in) provided by operating activities: | ||||||||
| Net change in unrealized depreciation on commodity futures contracts | ||||||||
| Changes in operating assets and liabilities: | ||||||||
| Due from broker | ( | ) | ||||||
| Interest receivable | ( | ) | ( | ) | ||||
| Other assets | ( | ) | ||||||
| Management fee payable to Sponsor | ( | ) | ||||||
| Other liabilities | ( | ) | ||||||
| Net cash (used in) provided by operating activities | ( | ) | ||||||
| Cash flows from financing activities: | ||||||||
| Proceeds from sale of Shares | ||||||||
| Redemption of Shares | ( | ) | ( | ) | ||||
| Net cash (used in) provided by financing activities | ( | ) | ||||||
| Net change in cash and cash equivalents | ( | ) | ||||||
| Cash and cash equivalents, beginning of period | ||||||||
| Cash and cash equivalents, end of period | $ | $ | ||||||
The accompanying notes are an integral part of these financial statements.
September 30, 2023
(Unaudited)
Note 1 – Organization and Operation
Teucrium Corn Fund (referred to herein as “CORN,” or the “Fund”) is a commodity pool that is a series of Teucrium Commodity Trust (“Trust”), a Delaware statutory trust formed on September 11, 2009. The Fund issues common units, called the “Shares,” representing fractional undivided beneficial interests in the Fund. The Fund continuously offers Creation Baskets consisting of
The investment objective of CORN is to have the daily changes in the NAV of the Fund’s Shares reflect the daily changes in the corn market for future delivery as measured by the Benchmark. The Benchmark is a weighted average of the closing settlement prices for futures contracts for corn (“Corn Futures Contracts”) that are traded on the Chicago Board of Trade (“CBOT”):
CORN Benchmark
| CBOT Corn Futures Contract | Weighting | |||
| Second to expire | % | |||
| Third to expire | % | |||
| December following the third to expire | % | |||
The Fund commenced investment operations on June 9, 2010 and has a fiscal year ending on December 31. The Fund’s sponsor is Teucrium Trading, LLC (the “Sponsor”). The Sponsor is responsible for the management of the Fund. The Sponsor is registered as a commodity pool operator (“CPO”) and a commodity trading adviser (“CTA”) with the Commodity Futures Trading Commission (“CFTC”) and is a member of the National Futures Association (“NFA”).
On June 7, 2010, the initial Form S-1 for CORN was declared effective by the U.S. Securities and Exchange Commission (“SEC”). On June 8, 2010, Creation Baskets for CORN were issued representing
The accompanying unaudited financial statements have been prepared in accordance with Rule 10-01 of Regulation S-X promulgated by the SEC and, therefore, do not include all information and footnote disclosures required under accounting principles generally accepted in the United States of America (“GAAP”). The financial information included herein is unaudited; however, such financial information reflects all adjustments which are, in the opinion of management, necessary for the fair presentation of the Fund’s financial statements for the interim period. It is suggested that these interim financial statements be read in conjunction with the financial statements and related notes included in the Trust’s Annual Report on Form 10-K, as well as the most recent Form S-1 filing, as applicable. The operating results for the three and nine months ended September 30, 2023 are not necessarily indicative of the results to be expected for the full year ending December 31, 2023.
Subject to the terms of the Trust Agreement, Teucrium Trading, LLC, in its capacity as the Sponsor (“Sponsor”), may terminate a Fund at any time, regardless of whether the Fund has incurred losses, including, for instance, if it determines that the Fund’s aggregate net assets in relation to its operating expenses make the continued operation of the Fund unreasonable or imprudent. However, no level of losses will require the Sponsor to terminate a Fund.
Note 2 – Principal Contracts and Agreements
The Sponsor employs U.S. Bancorp Fund Services, LLC, doing business as U.S. Bank Global Fund Services (“Global Fund Services”), for Transfer Agency, Fund Accounting and Fund Administration services. The principal address for Global Fund Services is 615 E. Michigan Street, Milwaukee, WI 53202.
For custody services, the Funds will pay to U.S. Bank N.A.
The Sponsor employs Foreside Fund Services, LLC (“Foreside” or the “Distributor”) as the Distributor for the Funds. The Distribution Services Agreement among the Distributor and the Sponsor calls for the Distributor to work with the Custodian in connection with the receipt and processing of orders for Creation Baskets and Redemption Baskets and the review and approval of all Fund sales literature and advertising materials. The Distributor and the Sponsor have also entered into a Securities Activities and Service Agreement (the “SASA”) under which certain employees and officers of the Sponsor are licensed as registered representatives or registered principals of the Distributor, under Financial Industry Regulatory Authority (“FINRA”) rules. For its services as the Distributor, Foreside receives a fee of
Marex Capital Markets, Inc. (“Marex”) and StoneX Financial Inc (“StoneX”) serve as the Funds’ clearing brokers to execute and clear futures contracts and provide other brokerage-related services. Marex and StoneX are each registered as futures commission merchants (“FCM”) with the U.S. CFTC and are members of the NFA. The clearing brokers are registered as broker-dealers with the SEC and are each a member of FINRA. Marex and StoneX are each clearing members of ICE Futures U.S., Inc., Chicago Board of Trade, Chicago Mercantile Exchange, New York Mercantile Exchange, and all other major United States commodity exchanges. For Corn, Soybean, Sugar and Wheat Futures Contracts, Marex is paid $
The sole Trustee of the Trust is Wilmington Trust Company, a Delaware banking corporation. The Trustee will accept service of legal process on the Trust in the State of Delaware and will make certain filings under the Delaware Statutory Trust Act. For its services, the Trustee receives an annual fee of $
The Sponsor employs Thales Capital Partners LLC (“Thales”) for distribution and solicitation-related services. Thales is registered as a broker-dealer with the SEC and a member of FINRA and the Securities Investor Protection Corporation (“SIPC”). Thales receives a quarterly fee of the higher of $
| Three months ended September 30, 2023 | Three months ended September 30, 2022 | Nine months ended September 30, 2023 | Nine months ended September 30, 2022 | |||||||||||||
| Amount Recognized for Custody Services | $ | $ | $ | $ | ||||||||||||
| Amount of Custody Services Waived | $ | $ | $ | $ | ||||||||||||
| Amount Recognized for Distribution Services | $ | $ | $ | $ | ||||||||||||
| Amount of Distribution Services Waived | $ | $ | $ | $ | ||||||||||||
| Amount Recognized for Wilmington Trust | $ | $ | $ | $ | ||||||||||||
| Amount of Wilmington Trust Waived | $ | $ | $ | $ | ||||||||||||
| Amount Recognized for Thales | $ | $ | $ | $ | ||||||||||||
| Amount of Thales Waived | $ | $ | $ | $ | ||||||||||||
Note 3 – Summary of Significant Accounting Policies
Basis of Presentation
The accompanying financial statements have been prepared in accordance with accounting principles generally accepted in the United States of America (“U.S. GAAP”) as detailed in the Financial Accounting Standards Board’s Accounting Standards Codification.
Revenue Recognition
Commodity futures contracts are recorded on the trade date. All such transactions are recorded on the identified cost basis and marked to market daily. Unrealized appreciation or depreciation on commodity futures contracts are reflected in the statements of operations as the difference between the original contract amount and the fair market value as of the last business day of the year or as of the last date of the financial statements. Changes in the appreciation or depreciation between periods are reflected in the statements of operations. The Fund seeks to earn interest on its assets denominated in U.S. dollars on deposits with the Futures Commission Merchant. In addition, the Fund earns interest on funds held at the custodian and at other financial institutions at prevailing market rates for such investments.
The Sponsor invests a portion of cash in commercial paper, which is deemed a cash equivalent based on the rating and duration of contracts as described in the notes to the financial statements and reflected in cash and cash equivalents on the statements of assets and liabilities and statements of cash flows. Accretion on these investments is recognized using the effective interest method in U.S. dollars and included in interest income on the statements of operations.
The Sponsor invests a portion of the cash held by the broker in short term Treasury Bills as collateral for open futures contracts. Accretion on these investments is recognized using the effective interest method in U.S. dollars and included in interest income on the statements of operations.
Brokerage Commissions
The Sponsor recognizes the expense for brokerage commissions for futures contract trades on a per-trade basis. The below table shows the amounts included on the statements of operations as total brokerage commissions paid inclusive of unrealized loss for the three and nine months ended September 30, 2023 and 2022.
| CORN | ||||
| Three months ended September 30, 2023 | $ | |||
| Three months ended September 30, 2022 | $ | |||
| Nine months ended September 30, 2023 | $ | |||
| Nine months ended September 30, 2022 | $ | |||
Income Taxes
For federal income tax purposes, the Fund will be treated as a publicly traded partnership. A publicly traded partnership is generally treated as a corporation for federal income tax purposes unless 90% or more of the publicly traded partnership’s gross income for each taxable year of its existence consists of qualifying income as defined in section 7704(d) of the Internal Revenue Code of 1986, as amended. Qualifying income is defined as generally including, in pertinent part, interest (other than from a financial business), dividends, and gains from the sale or disposition of capital assets held for the production of interest or dividends. In the case of a partnership of which a principal activity is the buying and selling of commodities, other than as inventory, or of futures, forwards and options with respect to commodities, qualifying income also includes income and gains from commodities and from futures, forwards, options with respect to commodities and, provided the partnership is a trader or investor with respect to such assets, swaps and other notional principal contracts with respect to commodities. The Fund expects that at least 90% of the Fund’s gross income for each taxable year will consist of qualifying income and that the Fund will be taxed as a partnership for federal income tax purposes. The Fund does not record a provision for income taxes because the shareholders report their share of the Fund’s income or loss on their income tax returns. The financial statements reflect the Fund’s transactions without adjustment, if any, required for income tax purposes.
The Fund is required to determine whether a tax position is more likely than not to be sustained upon examination by the applicable taxing authority, including resolution of any related appeals or litigation processes, based on the technical merits of the position. The Fund files an income tax return in the U.S. federal jurisdiction and may file income tax returns in various U.S. states and foreign jurisdictions. For all tax years to 2022, the Fund remains subject to income tax examinations by major taxing authorities. The tax benefit recognized is measured as the largest amount of benefit that has a greater than fifty percent likelihood of being realized upon ultimate settlement. De-recognition of a tax benefit previously recognized results in the Fund recording a tax liability that reduces net assets. Based on its analysis, the Fund has determined that it has incurred any liability for unrecognized tax benefits as of September 30, 2023 and for the years ended December 31, 2022, 2021, and 2020. However, the Fund’s conclusions regarding this policy may be subject to review and adjustment at a later date based on factors including, but not limited to, ongoing analysis of and changes to tax laws, regulations, and interpretations thereof.
The Fund recognizes interest accrued related to unrecognized tax benefits and penalties related to unrecognized tax benefits in income tax fees payable, if assessed.
The Fund may be subject to potential examination by U.S. federal, U.S. state, or foreign jurisdictional authorities in the area of income taxes. These potential examinations may include questioning the timing and amount of deductions, the nexus of income among various tax jurisdictions, and compliance with U.S. federal, U.S. state and foreign tax laws.
Creations and Redemptions
Authorized Purchasers may purchase Creation Baskets consisting of
Authorized Purchasers may redeem shares from the Fund only in blocks of
The Fund receives or pays the proceeds from shares sold or redeemed within three business days after the trade date of the purchase or redemption. The amounts due from Authorized Purchasers are reflected in the Fund’s statements of assets and liabilities as capital shares receivable. Amounts payable to Authorized Purchasers upon redemption are reflected in the Fund’s statements of assets and liabilities as payable for shares redeemed.
As outlined in the most recent Form S-1 filing,
Allocation of Shareholder Income and Losses
Profit or loss is allocated among the shareholders of the Fund in proportion to the number of shares each shareholder holds as of the close of each month.
Cash and Cash Equivalents
Cash equivalents are highly liquid investments with maturity dates of 90 days or less when acquired. The Fund reported its cash equivalents in the statements of assets and liabilities at market value, or at carrying amounts that approximate fair value, because of their highly liquid nature and short-term maturities. Each Fund that is a series of the Trust has the balance of its cash equivalents on deposit with financial institutions. The Fund holds a balance in money market funds that is included in cash and cash equivalents on the statements of assets and liabilities. The Sponsor invests a portion of the available cash for the Funds in alternative demand deposit savings accounts, which is classified as cash and not as cash equivalents. Assets deposited with the bank may, at times, exceed federally insured limits. The Sponsor invests a portion of the available cash for the Funds in investment grade commercial paper with durations of 90 days or less, which is classified as a cash equivalent and is not FDIC insured. The Sponsor may invest a portion of the cash held by the broker in short term Treasury Bills as collateral for open futures contracts, which is classified as a cash equivalent and is not FDIC insured.
| September 30, 2023 | December 31, 2022 | |||||||
| Money Market Funds | $ | $ | ||||||
| Demand Deposit Savings Accounts | ||||||||
| Commercial Paper | ||||||||
| Total cash and cash equivalents as presented on the Statement of Assets and Liabilities | $ | $ | ||||||
Payable for Purchases of Commercial Paper
The amount recorded by the Fund for commercial paper transactions awaiting settlement, represents the amount payable for contracts purchased but not yet settled as of the reporting date. The value of the contract is included in cash and cash equivalents, and the payable amount is included as a liability.
Due from/to Broker
The amount recorded by the Fund for the amount due from and to the clearing broker includes, but is not limited to, cash held by the broker, amounts payable to the clearing broker related to open transactions, payables for commodities futures accounts liquidating to an equity balance on the clearing broker’s records and amounts of brokerage commissions paid and recognized as unrealized losses.
Margin is the minimum amount of funds that must be deposited by a commodity interest trader with the trader’s broker to initiate and maintain an open position in futures contracts. A margin deposit acts to assure the trader’s performance of the futures contracts purchased or sold. Futures contracts are customarily bought and sold on initial margin that represents a small percentage of the aggregate purchase or sales price of the contract. Because of such low margin requirements, price fluctuations occurring in the futures markets may create profits and losses that, in relation to the amount invested, are greater than customary in other forms of investment or speculation. As discussed below, adverse price changes in the futures contract may result in margin requirements that greatly exceed the initial margin. In addition, the amount of margin required in connection with a particular futures contract is set from time to time by the exchange on which the contract is traded and may be modified from time to time by the exchange during the term of the contract. Brokerage firms, such as the Fund’s clearing brokers, carrying accounts for traders in commodity interest contracts generally require higher amounts of margin as a matter of policy to further protect themselves. Over the counter trading generally involves the extension of credit between counterparties, so the counterparties may agree to require the posting of collateral by one or both parties to address credit exposure.
When a trader purchases an option, there is no margin requirement; however, the option premium must be paid in full. When a trader sells an option, on the other hand, he or she is required to deposit margin in an amount determined by the margin requirements established for the underlying interest and, in addition, an amount substantially equal to the current premium for the option. The margin requirements imposed on the selling of options, although adjusted to reflect the probability that out-of-the-money options will not be exercised, can in fact be higher than those imposed in dealing in the futures markets directly. Complicated margin requirements apply to spreads and conversions, which are complex trading strategies in which a trader acquires a mixture of options positions and positions in the underlying interest.
Ongoing or “maintenance” margin requirements are computed each day by a trader’s clearing broker. When the market value of a particular open futures contract changes to a point where the margin on deposit does not satisfy maintenance margin requirements, a margin call is made by the broker. If the margin call is not met within a reasonable time, the broker may close out the trader’s position. With respect to the Fund’s trading, the Fund (and not its shareholders personally) is subject to margin calls. Finally, many major U.S. exchanges have passed certain cross margining arrangements involving procedures pursuant to which the futures and options positions held in an account would, in the case of some accounts, be aggregated and margin requirements would be assessed on a portfolio basis, measuring the total risk of the combined positions.
Calculation of Net Asset Value
The Fund’s NAV is calculated by:
| ● | Taking the current market value of its total assets and | |
| ● | Subtracting any liabilities. |
The administrator, Global Fund Services, calculates the NAV of the Fund once each trading day. It calculates the NAV as of the earlier of the close of the NYSE or 4:00 p.m. (ET). The NAV for a particular trading day is released after 4:15 p.m. (ET).
In determining the value of Corn Futures Contracts, the administrator uses the CBOT closing price. The administrator determines the value of all other Fund investments as of the earlier of the close of the NYSE or 4:00 p.m. (ET). The value of over-the-counter corn interests is determined based on the value of the commodity or futures contract underlying such corn interest, except that a fair value may be determined if the Sponsor believes that the Fund is subject to significant credit risk relating to the counterparty to such corn interest. For purposes of financial statements and reports, the Sponsor will recalculate the NAV where necessary to reflect the “fair value” of a Futures Contract when the Futures Contract closes at its price fluctuation limit for the day. Short term Treasury securities held by the Fund are valued by the administrator using values received from recognized third-party vendors and dealer quotes. NAV includes any unrealized profit or loss on open corn interests and any other income or expense accruing to the Fund but unpaid or not received by the Fund.
Sponsor Fee, Allocation of Expenses and Related Party Transactions
The Sponsor is responsible for investing the assets of the Fund in accordance with the objectives and policies of the Fund. In addition, the Sponsor arranges for one or more third parties to provide administrative, custodial, accounting, transfer agency and other necessary services to the Trust and the Funds. In addition, the Sponsor has elected not to outsource services directly attributable to the Trust and the Funds such as accounting, financial reporting, regulatory compliance, and trading activities, which the Sponsor performs itself. In addition, the Fund is contractually obligated to pay a monthly management fee to the Sponsor, based on average daily net assets, at a rate equal to
The Fund generally pays for all brokerage fees, taxes, and other expenses, including licensing fees for the use of intellectual property, registration or other fees paid to the SEC, FINRA, or any other regulatory agency in connection with the offer and sale of subsequent Shares after its initial registration and all legal, accounting, printing and other expenses associated therewith. The Fund also pays its portion of the fees and expenses associated with the Trust’s tax accounting and reporting requirements. Certain aggregate expenses common to all Funds within the Trust are allocated by the Sponsor to the respective Fund based on activity drivers deemed most appropriate by the Sponsor for such expenses, including but not limited to relative assets under management and creation order activity. These aggregate common expenses include, but are not limited to, legal, auditing, accounting and financial reporting, tax-preparation, regulatory compliance, trading activities, and insurance costs, as well as fees paid to the Distributor, which are included in the related line item in the statements of operations. A portion of these aggregate common expenses are related to the Sponsor or related parties of principals of the Sponsor; these are necessary services to the Funds, which are primarily the cost of performing accounting and financial reporting, regulatory compliance, and trading activities that are directly attributable to the Fund. Such expenses are primarily recorded as distribution and marketing fees in the financial statements of each Fund.
| Three months ended September 30, 2023 | Three months ended September 30, 2022 | Nine months ended September 30, 2023 | Nine months ended September 30, 2022 | |||||||||||||
| Recognized Related Party Transactions | $ | $ | $ | $ | ||||||||||||
| Waived Related Party Transactions | $ | $ | $ | $ | ||||||||||||
The Sponsor has the ability to elect to pay certain expenses on behalf of the Funds or waive the management fee. This election is subject to change by the Sponsor, at its discretion. Expenses paid by the Sponsor and Management fees waived by the Sponsor are, if applicable, presented as waived expenses in the statements of operations for each Fund. The Sponsor has determined that there will be no recovery sought for the amounts below in any future period:
| CORN | ||||
| Three months ended September 30, 2023 | $ | |||
| Three months ended September 30, 2022 | $ | |||
| Nine months ended September 30, 2023 | $ | |||
| Nine months ended September 30, 2022 | $ | |||
Use of Estimates
The preparation of financial statements in conformity with U.S. GAAP requires management to make estimates and assumptions that affect the reported amount of assets and liabilities and disclosure of contingent assets and liabilities at the date of the financial statements, and the reported amounts of the revenue and expenses during the reporting period. Actual results could differ from those estimates.
Fair Value - Definition and Hierarchy
In accordance with U.S. GAAP, fair value is defined as the price that would be received to sell an asset or paid to transfer a liability (i.e., the “exit price”) in an orderly transaction between market participants at the measurement date.
In determining fair value, the Fund uses various valuation approaches. In accordance with GAAP, a fair value hierarchy for inputs is used in measuring fair value that maximizes the use of observable inputs and minimizes the use of unobservable inputs by requiring that the most observable inputs be used when available. Observable inputs are those that market participants would use in pricing the asset or liability based on market data obtained from sources independent of the Fund. Unobservable inputs reflect the Fund’s assumptions about the inputs market participants would use in pricing the asset or liability developed based on the best information available in the circumstances. The fair value hierarchy is categorized into three levels based on the inputs as follows:
Level 1 - Valuations based on unadjusted quoted prices in active markets for identical assets or liabilities that the Fund has the ability to access. Valuation adjustments and block discounts are not applied to Level 1 financial instruments. Since valuations are based on quoted prices that are readily and regularly available in an active market, valuation of these financial instruments does not entail a significant degree of judgment.
Level 2 - Valuations based on quoted prices in markets that are not active or for which all significant inputs are observable, either directly or indirectly.
Level 3 - Valuations based on inputs that are unobservable and significant to the overall fair value measurement.
The availability of valuation techniques and observable inputs can vary from financial instrument to financial instrument and is affected by a wide variety of factors including, the type of financial instrument, whether the financial instrument is new and not yet established in the marketplace, and other characteristics particular to the transaction. To the extent that valuation is based on models or inputs that are less observable or unobservable in the market, the determination of fair value requires more judgment. Those estimated values do not necessarily represent the amounts that may be ultimately realized due to the occurrence of future circumstances that cannot be reasonably determined. Because of the inherent uncertainty of valuation, those estimated values may be materially higher or lower than the values that would have been used had a ready market for the financial instruments existed. Accordingly, the degree of judgment exercised by the Fund in determining fair value is greatest for financial instruments categorized in Level 3. In certain cases, the inputs used to measure fair value may fall into different levels of the fair value hierarchy. In such cases, for disclosure purposes, the level in the fair value hierarchy, within which the fair value measurement in its entirety falls, is determined based on the lowest level input that is significant to the fair value measurement.
Fair value is a market-based measure considered from the perspective of a market participant rather than an entity-specific measure. Therefore, even when market assumptions are not readily available, the Fund’s own assumptions are set to reflect those that market participants would use in pricing the asset or liability at the measurement date. The Fund uses prices and inputs that are current as of the measurement date, including during periods of market dislocation. In periods of market dislocation, the observability of prices and inputs may be reduced for many securities. This condition could cause a financial instrument to be reclassified to a lower level within the fair value hierarchy. For instance, when Corn Futures Contracts on the CBOT are not actively trading due to a “limit-up” or limit-down” condition, meaning that the daily change in the Corn Futures Contracts has exceeded the limits established, the Trust and the Fund will revert to alternative verifiable sources of valuation of its assets. When such a situation exists on a quarter close, the Sponsor will calculate the Net Asset Value (“NAV”) on a particular day using the Level 1 valuation but will later recalculate the NAV for the impacted Fund based upon the valuation inputs from these alternative verifiable sources (Level 2 or Level 3) and will report such NAV in its applicable financial statements and reports.
On September 30, 2023 and December 31, 2022, in the opinion of the Trust and the Fund, the reported value at the close of the market for each commodity contract fairly reflected the value of the futures and no alternative valuations were required. The determination is made as of the settlement of the futures contracts on the last day of trading for the reporting period. In making the determination of a Level 1 or Level 2 transfer, the Fund considers the average volume of the specific underlying futures contracts traded on the relevant exchange for the periods being reported.
For the three and nine months ended September 30, 2023 and year ended December 31, 2022, the Fund did not have any significant transfers between any of the levels of the fair value hierarchy.
The Fund records its derivative activities at fair value. Gains and losses from derivative contracts are included in the statements of operations. Derivative contracts include futures contracts related to commodity prices. Futures, which are listed on a national securities exchange, such as the CBOT and the ICE, or reported on another national market, are generally categorized in Level 1 of the fair value hierarchy. OTC derivatives contracts (such as forward and swap contracts) which may be valued using models, depending on whether significant inputs are observable or unobservable, are categorized in Levels 2 or 3 of the fair value hierarchy.
Expenses
Expenses are recorded using the accrual method of accounting.
Net Income (Loss) per Share
Net income (loss) per share is the difference between the NAV per unit at the beginning of each period and at the end of each period. The weighted average number of units outstanding was computed for purposes of disclosing net income (loss) per weighted average unit. The weighted average units are equal to the number of units outstanding at the end of the period, adjusted proportionately for units created or redeemed based on the amount of time the units were outstanding during such period.
New Accounting Pronouncements
The Financial Accounting Standards Board (“FASB”) issued Accounting Standards Update (“ASU”) issued ASU 2023-01, related to Leases – (Topic 842). The response to concerns about applying Topic 842 to related party arrangements between entities under common control. The update was adopted early for the quarter ended March 31, 2023; the adoption did not have a material impact on the financial statements and disclosures of the Trust or the Fund.
The FASB issued ASU 2022-03, related to fair value measurement (Topic 820) of equity securities subject to contractual sale restrictions. Under the clarified guidance, contractual restrictions on the sale of an equity security are not considered part of the unit of account of the equity security and, therefore, are not considered in measuring fair value, however they do require disclosures. The amendment was adopted for the quarter ended June 30, 2022; the adoption did not have a material impact on the financial statements and disclosures of the Trust or the Fund.
Note 4 – Fair Value Measurements
The Fund’s assets and liabilities recorded at fair value have been categorized based upon a fair value hierarchy as described in the Fund’s significant accounting policies in Note 3. The following table presents information about the Fund’s assets and liabilities measured at fair value as of September 30, 2023 and December 31, 2022:
September 30, 2023
| Balance as of | ||||||||||||||||
| Assets: | Level 1 | Level 2 | Level 3 | September 30, 2023 | ||||||||||||
| Cash Equivalents | $ | $ | $ | $ | ||||||||||||
| Balance as of | ||||||||||||||||
| Liabilities | Level 1 | Level 2 | Level 3 | September 30, 2023 | ||||||||||||
| Commodity Futures Contracts | ||||||||||||||||
| Corn futures contracts | $ | $ | $ | $ | ||||||||||||
December 31, 2022
| Balance as of | ||||||||||||||||
| Assets: | Level 1 | Level 2 | Level 3 | December 31, 2022 | ||||||||||||
| Cash Equivalents | $ | $ | $ | $ | ||||||||||||
| Commodity Futures Contracts | ||||||||||||||||
| Corn futures contracts | ||||||||||||||||
| Total | $ | $ | $ | $ | ||||||||||||
| Balance as of | ||||||||||||||||
| Liabilities | Level 1 | Level 2 | Level 3 | December 31, 2022 | ||||||||||||
| Corn futures contracts | $ | $ | $ | $ | ||||||||||||
For the three and nine months ended September 30, 2023 and year ended December 31, 2022, the Fund did not have any significant transfers between any of the levels of the fair value hierarchy.
See the Fair Value - Definition and Hierarchy section in Note 3 above for an explanation of the transfers into and out of each level of the fair value hierarchy.
Note 5 – Derivative Instruments and Hedging Activities
In the normal course of business, the Fund utilizes derivative contracts in connection with its proprietary trading activities. Investments in derivative contracts are subject to additional risks that can result in a loss of all or part of an investment. The Fund’s derivative activities and exposure to derivative contracts are classified by the following primary underlying risks: interest rate, credit, commodity price, and equity price risks. In addition to its primary underlying risks, the Fund is also subject to additional counterparty risk due to inability of its counterparties to meet the terms of their contracts. For the three and nine months ended September 30, 2023 and year ended December 31, 2022, the Fund invested only in commodity futures contracts.
Futures Contracts
The Fund is subject to commodity price risk in the normal course of pursuing its investment objectives. A futures contract represents a commitment for the future purchase or sale of an asset at a specified price on a specified date.
The purchase and sale of futures contracts requires margin deposits with an FCM. Subsequent payments (variation margin) are made or received by the Fund each day, depending on the daily fluctuations in the value of the contract, and are recorded as unrealized gains or losses by the Fund. Futures contracts may reduce the Fund’s exposure to counterparty risk since futures contracts are exchange-traded; and the exchange’s clearinghouse, as the counterparty to all exchange-traded futures, guarantees the futures against default.
The Commodity Exchange Act requires an FCM to segregate all customer transactions and assets from the FCM’s proprietary activities. A customer’s cash and other equity deposited with an FCM are considered commingled with all other customer funds subject to the FCM’s segregation requirements. In the event of an FCM’s insolvency, recovery may be limited to the Fund’s pro rata share of segregated customer funds available. It is possible that the recovery amount could be less than the total of cash and other equity deposited.
The following table discloses information about offsetting assets and liabilities presented in the statements of assets and liabilities to enable users of these financial statements to evaluate the effect or potential effect of netting arrangements for recognized assets and liabilities. These recognized assets and liabilities are presented as defined in FASB ASU No. 2011-11 “Balance Sheet (Topic 210): Disclosures about Offsetting Assets and Liabilities” and subsequently clarified in FASB ASU 2013-01 “Balance Sheet (Topic 210): Clarifying the Scope of Disclosures about Offsetting Assets and Liabilities.”
The following table also identifies the fair value amounts of derivative instruments included in the statements of assets and liabilities as derivative contracts, categorized by primary underlying risk, and held by the FCMs, Marex and StoneX as of September 30, 2023, and December 31, 2022.
*The amount of collateral presented in Collateral, Due from Broker, is limited to the liability for the futures contracts and accordingly does not include the excess collateral pledged.
Offsetting of Financial Liabilities and Derivative Liabilities as of September 30, 2023
| (i) | (ii) | (iii) = (i)-(ii) | (iv) | (v)=(iii)-(iv) | ||||||||||||||||||||
| Gross Amount Not Offset in the Statement of Assets and Liabilities | ||||||||||||||||||||||||
| Description | Gross Amount of Recognized Liabilities | Gross Amount Offset in the Statement of Assets and Liabilities | Net Amount Presented in the Statement of Assets and Liabilities | Futures Contracts Available for Offset | Collateral, Due from Broker* | Net Amount | ||||||||||||||||||
| Commodity Price | ||||||||||||||||||||||||
| Corn futures contracts | $ | $ | $ | $ | $ | $ | ||||||||||||||||||
Offsetting of Financial Assets and Derivative Assets as of December 31, 2022
| (i) | (ii) | (iii) = (i)-(ii) | (iv) | (v)=(iii)-(iv) | ||||||||||||||||||||
| Gross Amount Not Offset in the Statement of Assets and Liabilities | ||||||||||||||||||||||||
| Description | Gross Amount of Recognized Assets | Gross Amount Offset in the Statement of Assets and Liabilities | Net Amount Presented in the Statement of Assets and Liabilities | Futures Contracts Available for Offset | Collateral, Due to Broker | Net Amount | ||||||||||||||||||
| Commodity Price | ||||||||||||||||||||||||
| Corn futures contracts | $ | $ | $ | $ | $ | $ | ||||||||||||||||||
Offsetting of Financial Liabilities and Derivative Liabilities as of December 31, 2022
| (i) | (ii) | (iii) = (i)-(ii) | (iv) | (v)=(iii)-(iv) | ||||||||||||||||||||
| Gross Amount Not Offset in the Statement of Assets and Liabilities | ||||||||||||||||||||||||
| Description | Gross Amount of Recognized Liabilities | Gross Amount Offset in the Statement of Assets and Liabilities | Net Amount Presented in the Statement of Assets and Liabilities | Futures Contracts Available for Offset | Collateral, Due from Broker* | Net Amount | ||||||||||||||||||
| Commodity Price | ||||||||||||||||||||||||
| Corn futures contracts | $ | $ | $ | $ | $ | $ | ||||||||||||||||||
The following tables identify the net gain and loss amounts included in the statements of operations as realized and unrealized gains and losses on trading of commodity futures contracts categorized by primary underlying risk:
Three months ended September 30, 2023
| Realized Loss on Commodity Futures Contracts | Net Change in Unrealized Appreciation on Commodity Futures Contracts | |||||||
| Commodity Price | ||||||||
| Corn futures contracts | $ | ( | ) | $ | ||||
Three months ended September 30, 2022
| Realized Loss on Commodity Futures Contracts | Net Change in Unrealized Appreciation on Commodity Futures Contracts | |||||||
| Commodity Price | ||||||||
| Corn futures contracts | $ | ( | ) | $ | ||||
Nine months ended September 30, 2023
| Realized Loss on Commodity Futures Contracts | Net Change in Unrealized Depreciation on Commodity Futures Contracts | |||||||
| Commodity Price | ||||||||
| Corn futures contracts | $ | ( | ) | $ | ( | ) | ||
Nine months ended September 30, 2022
| Realized Gain on Commodity Futures Contracts | Net Change in Unrealized Depreciation on Commodity Futures Contracts | |||||||
| Commodity Price | ||||||||
| Corn futures contracts | $ | $ | ( | ) | ||||
Volume of Derivative Activities
The average notional market value categorized by primary underlying risk for the futures contracts held was $
Note 6 – Financial Highlights
The following tables present per unit performance data and other supplemental financial data for the three and nine months ended September 30, 2023 and 2022. This information has been derived from information presented in the financial statements and is presented with total expenses gross of expenses waived by the Sponsor and with total expenses net of expenses waived by the Sponsor, as appropriate.
| Three months ended | Three months ended | Nine months ended | Nine months ended | |||||||||||||
| September 30, 2023 | September 30, 2022 | September 30, 2023 | September 30, 2022 | |||||||||||||
| Per Share Operation Performance | ||||||||||||||||
| Net asset value at beginning of period | $ | $ | $ | $ | ||||||||||||
| Income from investment operations: | ||||||||||||||||
| Investment income | ||||||||||||||||
| Net realized and unrealized (loss) gain on commodity futures contracts | ( | ) | ( | ) | ||||||||||||
| Total expenses, net | ( | ) | ( | ) | ( | ) | ( | ) | ||||||||
| Net (decrease) increase in net asset value | ( | ) | ( | ) | ||||||||||||
| Net asset value at end of period | $ | $ | $ | $ | ||||||||||||
| Total Return | - | % | % | - | % | % | ||||||||||
| Ratios to Average Net Assets (Annualized) | ||||||||||||||||
| Total expenses | % | % | % | % | ||||||||||||
| Total expenses, net | % | % | % | % | ||||||||||||
| Net investment income (loss) | % | % | % | - | % | |||||||||||
The financial highlights per share data are calculated consistent with the methodology used to calculate asset-based fees and expenses.
Note 7 – Organizational and Offering Costs
Expenses incurred in organizing of the Trust and the initial offering of the Shares of the Fund, including applicable SEC registration fees were borne directly by the Sponsor. The Fund will not be obligated to reimburse the Sponsor.
Note 8 – Subsequent Events
Management has evaluated the financial statements for the quarter-ended September 30, 2023 for subsequent events through the date of this filing and noted no material events requiring either recognition through the date of the filing or disclosure herein for the Fund.
STATEMENTS OF ASSETS AND LIABILITIES
| September 30, 2023 | December 31, 2022 | |||||||
| (Unaudited) | ||||||||
| Assets | ||||||||
| Cash and cash equivalents | $ | $ | ||||||
| Interest receivable | ||||||||
| Other assets | ||||||||
| Equity in trading accounts: | ||||||||
| Commodity futures contracts | ||||||||
| Due from broker | ||||||||
| Total equity in trading accounts | ||||||||
| Total assets | ||||||||
| Liabilities | ||||||||
| Payable for shares redeemed | ||||||||
| Management fee payable to Sponsor | ||||||||
| Other liabilities | ||||||||
| Equity in trading accounts: | ||||||||
| Commodity futures contracts | ||||||||
| Total liabilities | ||||||||
| Net assets | $ | $ | ||||||
| Shares outstanding | ||||||||
| Shares authorized | * | * | ||||||
| Net asset value per share | $ | $ | ||||||
| Market value per share | $ | $ | ||||||
* On April 7, 2022, the Teucrium Soybean Fund registered an indeterminate number of shares of the Fund pursuant to Rule 456(d) under the Securities Act of 1933.
The accompanying notes are an integral part of these financial statements.
SCHEDULE OF INVESTMENTS
September 30, 2023
(Unaudited)
| Percentage of | ||||||||||||||||||||
| Description: Assets | Yield | Cost | Fair Value | Net Assets | Shares | |||||||||||||||
| Cash equivalents | ||||||||||||||||||||
| Money market funds | ||||||||||||||||||||
| U.S. Bank Deposit Account | % | $ | $ | % | ||||||||||||||||
| Goldman Sachs Financial Square Government Fund - Institutional Class | % | |||||||||||||||||||
| Total money market funds | $ | $ | % | |||||||||||||||||
| Maturity | Percentage of | Principal | ||||||||||||||||||||
| Date | Yield | Cost | Fair Value | Net Assets | Amount | |||||||||||||||||
| Commercial Paper | ||||||||||||||||||||||
| Brookfield Infrastructure Holdings (Canada) Inc. | | % | $ | $ | % | |||||||||||||||||
| General Motors Financial Company, Inc. | | % | ||||||||||||||||||||
| Harley-Davidson Financial Services, Inc. | | % | ||||||||||||||||||||
| Jabil Inc. | | % | ||||||||||||||||||||
| Marriott International, Inc. | | % | ||||||||||||||||||||
| National Fuel Gas Company | | % | ||||||||||||||||||||
| Walgreens Boots Alliance, Inc. | | % | ||||||||||||||||||||
| Total Commercial Paper | $ | $ | % | |||||||||||||||||||
| Total Cash Equivalents | $ | % | ||||||||||||||||||||
| Number of | Percentage of | Notional Amount | ||||||||||||||
| Contracts | Fair Value | Net Assets | (Long Exposure) | |||||||||||||
| Commodity futures contracts | ||||||||||||||||
| United States soybean futures contracts | ||||||||||||||||
| CBOT soybean futures JAN24 | $ | % | $ | |||||||||||||
| Number of | Percentage of | Notional Amount | ||||||||||||||
| Description: Liabilities | Contracts | Fair Value | Net Assets | (Long Exposure) | ||||||||||||
| Commodity futures contracts | ||||||||||||||||
| United States soybean futures contracts | ||||||||||||||||
| CBOT soybean futures MAR24 | $ | % | $ | |||||||||||||
| CBOT soybean futures NOV24 | ||||||||||||||||
| Total commodity futures contracts | $ | % | $ | |||||||||||||
The accompanying notes are an integral part of these financial statements.
TEUCRIUM SOYBEAN FUND
SCHEDULE OF INVESTMENTS
December 31, 2022
| Percentage of | ||||||||||||||||||||
| Description: Assets | Yield | Cost | Fair Value | Net Assets | Shares | |||||||||||||||
| Cash equivalents | ||||||||||||||||||||
| Money market funds | ||||||||||||||||||||
| First American Government Obligations Fund - Class X | % | $ | $ | % | ||||||||||||||||
| Goldman Sachs Financial Square Government Fund - Institutional Class | % | |||||||||||||||||||
| Total money market funds | $ | $ | % | |||||||||||||||||
| Maturity | Percentage of | Principal | |||||||||||||||||||
| Date | Yield | Cost | Fair Value | Net Assets | Amount | ||||||||||||||||
| Commercial Paper | |||||||||||||||||||||
| Brookfield Infrastructure Holdings (Canada) Inc. | | % | $ | $ | % | ||||||||||||||||
| CNH Industrial Capital LLC | | % | |||||||||||||||||||
| Crown Castle Inc. | | % | |||||||||||||||||||
| Crown Castle Inc. | | % | |||||||||||||||||||
| Entergy Corporation | | % | |||||||||||||||||||
| Humana Inc. | | % | |||||||||||||||||||
| V.F. Corporation | | % | |||||||||||||||||||
| V.F. Corporation | | % | |||||||||||||||||||
| VW Credit, Inc. | | % | |||||||||||||||||||
| Walgreens Boots Alliance, Inc. | | % | |||||||||||||||||||
| Total Commercial Paper | $ | $ | % | ||||||||||||||||||
| Total Cash Equivalents | $ | % | |||||||||||||||||||
| Number of | Percentage of | Notional Amount | ||||||||||||||
| Contracts | Fair Value | Net Assets | (Long Exposure) | |||||||||||||
| Commodity futures contracts | ||||||||||||||||
| United States soybean futures contracts | ||||||||||||||||
| CBOT soybean futures MAR23 | $ | % | $ | |||||||||||||
| CBOT soybean futures MAY23 | ||||||||||||||||
| CBOT soybean futures NOV23 | ||||||||||||||||
| Total commodity futures contracts | $ | % | $ | |||||||||||||
The accompanying notes are an integral part of these financial statements.
STATEMENTS OF OPERATIONS
(Unaudited)
| Three months ended | Three months ended | Nine months ended | Nine months ended | |||||||||||||
| September 30, 2023 | September 30, 2022 | September 30, 2023 | September 30, 2022 | |||||||||||||
| Income | ||||||||||||||||
| Realized and unrealized gain (loss) on trading of commodity futures contracts: | ||||||||||||||||
| Realized gain on commodity futures contracts | $ | $ | $ | $ | ||||||||||||
| Net change in unrealized depreciation on commodity futures contracts | ( | ) | ( | ) | ( | ) | ( | ) | ||||||||
| Interest income | ||||||||||||||||
| Total income (loss) | ( | ) | ( | ) | ||||||||||||
| Expenses | ||||||||||||||||
| Management fees | ||||||||||||||||
| Professional fees | ||||||||||||||||
| Distribution and marketing fees | ||||||||||||||||
| Custodian fees and expenses | ||||||||||||||||
| Business permits and licenses fees | ||||||||||||||||
| General and administrative expenses | ||||||||||||||||
| Total expenses | ||||||||||||||||
| Expenses waived by the Sponsor | ( | ) | ||||||||||||||
| Total expenses, net | ||||||||||||||||
| Net (loss) income | $ | ( | ) | $ | ( | ) | $ | ( | ) | $ | ||||||
| Net (loss) gain per share | $ | ( | ) | $ | ( | ) | $ | ( | ) | $ | ||||||
| Net (loss) gain per weighted average share | $ | ( | ) | $ | ( | ) | $ | ( | ) | $ | ||||||
| Weighted average shares outstanding | ||||||||||||||||
The accompanying notes are an integral part of these financial statements.
STATEMENTS OF CHANGES IN NET ASSETS
(Unaudited)
| Nine months ended | Nine months ended | |||||||
| September 30, 2023 | September 30, 2022 | |||||||
| Operations | ||||||||
| Net (loss) income | $ | ( | ) | $ | ||||
| Capital transactions | ||||||||
| Issuance of Shares | ||||||||
| Redemption of Shares | ( | ) | ( | ) | ||||
| Total capital transactions | ( | ) | ||||||
| Net change in net assets | ( | ) | ||||||
| Net assets, beginning of period | $ | $ | ||||||
| Net assets, end of period | $ | $ | ||||||
| Net asset value per share at beginning of period | $ | $ | ||||||
| Net asset value per share at end of period | $ | $ | ||||||
| Creation of Shares | ||||||||
| Redemption of Shares | ||||||||
The accompanying notes are an integral part of these financial statements.
STATEMENTS OF CASH FLOWS
(Unaudited)
| Nine months ended | Nine months ended | |||||||
| September 30, 2023 | September 30, 2022 | |||||||
| Cash flows from operating activities: | ||||||||
| Net (loss) income | $ | ( | ) | $ | ||||
| Adjustments to reconcile net (loss) income to net cash (used in) provided by operating activities: | ||||||||
| Net change in unrealized appreciation on commodity futures contracts | ||||||||
| Changes in operating assets and liabilities: | ||||||||
| Due from broker | ( | ) | ( | ) | ||||
| Interest receivable | ( | ) | ||||||
| Other assets | ||||||||
| Due to broker | ( | ) | ||||||
| Management fee payable to Sponsor | ( | ) | ||||||
| Other liabilities | ( | ) | ||||||
| Net cash (used in) provided by operating activities | ( | ) | ||||||
| Cash flows from financing activities: | ||||||||
| Proceeds from sale of Shares | ||||||||
| Redemption of Shares | ( | ) | ( | ) | ||||
| Net cash (used in) provided by financing activities | ( | ) | ||||||
| Net change in cash and cash equivalents | ( | ) | ||||||
| Cash and cash equivalents beginning of period | ||||||||
| Cash and cash equivalents end of period | $ | $ | ||||||
The accompanying notes are an integral part of these financial statements.
September 30, 2023
(Unaudited)
Note 1 – Organization and Operation
Teucrium Soybean Fund (referred to herein as “SOYB” or the “Fund”) is a commodity pool that is a series of Teucrium Commodity Trust (“Trust”), a Delaware statutory trust formed on September 11, 2009. The Fund issues common units, called the “Shares,” representing fractional undivided beneficial interests in the Fund. The Fund continuously offers Creation Baskets consisting of
The investment objective of SOYB is to have the daily changes in the NAV of the Fund’s Shares reflect the daily changes in the soybean market for future delivery as measured by the Benchmark. The Benchmark is a weighted average of the closing settlement prices for futures contracts for soybeans (“Soybean Futures Contracts”) that are traded on the Chicago Board of Trade (“CBOT”):
SOYB Benchmark
| CBOT Soybean Futures Contract | Weighting | |||
| Second to expire (excluding August & September) | % | |||
| Third to expire (excluding August & September) | % | |||
| Expiring in the November following the expiration of the third to expire contract | % | |||
The Fund commenced investment operations on September 19, 2011 and has a fiscal year ending December 31. The Fund’s sponsor is Teucrium Trading, LLC (the “Sponsor”). The Sponsor is responsible for the management of the Fund. The Sponsor is registered as a commodity pool operator (“CPO”) and a commodity trading adviser (“CTA”) with the Commodity Futures Trading Commission (“CFTC”) and is a member of the National Futures Association (“NFA”).
On June 13, 2011, the initial Form S-1 for SOYB was declared effective by the SEC. On September 16, 2011, Creation Baskets were issued representing
The accompanying unaudited financial statements have been prepared in accordance with Rule 10-01 of Regulation S-X promulgated by the SEC and, therefore, do not include all information and footnote disclosures required under accounting principles generally accepted in the United States of America (“GAAP”). The financial information included herein is unaudited; however, such financial information reflects all adjustments which are, in the opinion of management, necessary for the fair presentation of the Fund’s financial statements for the interim period. It is suggested that these interim financial statements be read in conjunction with the financial statements and related notes included in the Trust’s Annual Report on Form 10-K, as well as the most recent Form S-1 filing, as applicable. The operating results for the three and nine months ended September 30, 2023 are not necessarily indicative of the results to be expected for the full year ending December 31, 2023.
Subject to the terms of the Trust Agreement, Teucrium Trading, LLC, in its capacity as the Sponsor (“Sponsor”), may terminate a Fund at any time, regardless of whether the Fund has incurred losses, including, for instance, if it determines that the Fund’s aggregate net assets in relation to its operating expenses make the continued operation of the Fund unreasonable or imprudent. However, no level of losses will require the Sponsor to terminate a Fund.
Note 2 – Principal Contracts and Agreements
The Sponsor employs U.S. Bancorp Fund Services, LLC, doing business as U.S. Bank Global Fund Services (“Global Fund Services”), for Transfer Agency, Fund Accounting and Fund Administration services. The principal address for Global Fund Services is 615 E. Michigan Street, Milwaukee, WI 53202.
For custody services, the Funds will pay to U.S. Bank N.A.
The Sponsor employs Foreside Fund Services, LLC (“Foreside” or the “Distributor”) as the Distributor for the Funds. The Distribution Services Agreement among the Distributor and the Sponsor calls for the Distributor to work with the Custodian in connection with the receipt and processing of orders for Creation Baskets and Redemption Baskets and the review and approval of all Fund sales literature and advertising materials. The Distributor and the Sponsor have also entered into a Securities Activities and Service Agreement (the “SASA”) under which certain employees and officers of the Sponsor are licensed as registered representatives or registered principals of the Distributor, under Financial Industry Regulatory Authority (“FINRA”) rules. For its services as the Distributor, Foreside receives a fee of
Marex Capital Markets, Inc. (“Marex”) and StoneX Financial Inc. (“StoneX”) serve as the Funds’ clearing brokers to execute and clear futures contracts and provide other brokerage-related services. Marex and StoneX are each registered as futures commission merchants (“FCM”) with the U.S. CFTC and are members of the NFA. The clearing brokers are registered as broker-dealers with the SEC and are each a member of FINRA. Marex and StoneX are each clearing members of ICE Futures U.S., Inc., Chicago Board of Trade, Chicago Mercantile Exchange, New York Mercantile Exchange, and all other major United States commodity exchanges. For Corn, Soybean, Sugar, and Wheat Futures Contracts E D & F Man is paid $
The sole Trustee of the Trust is Wilmington Trust Company, a Delaware banking corporation. The Trustee will accept service of legal process on the Trust in the State of Delaware and will make certain filings under the Delaware Statutory Trust Act. For its services, the Trustee receives an annual fee of $
The Sponsor employs Thales Capital Partners LLC (“Thales”) for distribution and solicitation-related services. Thales is registered as a broker-dealer with the SEC and a member of FINRA and the Securities Investor Protection Corporation (“SIPC”). Thales receives a quarterly fee of the higher of $
| Three months ended September 30, 2023 | Three months ended September 30, 2022 | Nine months ended September 30, 2023 | Nine months ended September 30, 2022 | |||||||||||||
| Amount Recognized for Custody Services | $ | $ | $ | $ | ||||||||||||
| Amount of Custody Services Waived | $ | $ | $ | $ | ||||||||||||
| Amount Recognized for Distribution Services | $ | $ | $ | $ | ||||||||||||
| Amount of Distribution Services Waived | $ | $ | $ | $ | ||||||||||||
| Amount Recognized for Wilmington Trust | $ | $ | $ | $ | ||||||||||||
| Amount of Wilmington Trust Waived | $ | $ | $ | $ | ||||||||||||
| Amount Recognized for Thales | $ | $ | $ | $ | ||||||||||||
| Amount of Thales Waived | $ | $ | $ | $ | ||||||||||||
Note 3 – Summary of Significant Accounting Policies
Basis of Presentation
The accompanying financial statements have been prepared in accordance with accounting principles generally accepted in the United States of America (“U.S. GAAP”) as detailed in the Financial Accounting Standards Board’s Accounting Standards Codification.
Revenue Recognition
Commodity futures contracts are recorded on the trade date. All such transactions are recorded on the identified cost basis and marked to market daily. Unrealized appreciation or depreciation on commodity futures contracts are reflected in the statements of operations as the difference between the original contract amount and the fair market value as of the last business day of the year or as of the last date of the financial statements. Changes in the appreciation or depreciation between periods are reflected in the statements of operations. The Fund seeks to earn interest on its assets denominated in U.S. dollars on deposits with the Futures Commission Merchant. In addition, the Fund seeks to earn interest on funds held at the custodian and other financial institutions at prevailing market rates for such investments.
The Sponsor invests a portion of cash in commercial paper, which is deemed a cash equivalent based on the rating and duration of contracts as described in the notes to the financial statements and reflected in cash and cash equivalents on the statements of assets and liabilities and on the statements of cash flows. Accretion on these investments is recognized using the effective interest method in U.S. dollars and included in interest income on the statements of operations.
The Sponsor invests a portion of the cash held by the broker in short term Treasury Bills as collateral for open futures contracts. Accretion on these investments is recognized using the effective interest method in U.S. dollars and included in interest income on the statements of operations.
Brokerage Commissions
the Sponsor recognizes the expense for brokerage commissions for futures contract trades on a per-trade basis. The below table shows the amounts included on the statements of operations as total brokerage commissions paid inclusive of unrealized loss for the three and nine months ended September 30, 2023 and 2022.
| SOYB | ||||
| Three months ended September 30, 2023 | $ | |||
| Three months ended September 30, 2022 | $ | |||
| Nine months ended September 30, 2023 | $ | |||
| Nine months ended September 30, 2022 | $ | |||
Income Taxes
For federal income tax purposes, each Fund will be treated as a publicly traded partnership. A publicly traded partnership is generally treated as a corporation for federal income tax purposes unless 90% or more of the publicly traded partnership’s gross income for each taxable year of its existence consists of qualifying income as defined in section 7704(d) of the Internal Revenue Code of 1986, as amended. Qualifying income is defined as generally including, in pertinent part, interest (other than from a financial business), dividends, and gains from the sale or disposition of capital assets held for the production of interest or dividends. In the case of a partnership of which a principal activity is the buying and selling of commodities, other than as inventory, or of futures, forwards and options with respect to commodities, qualifying income also includes income and gains from commodities and from futures, forwards, options with respect to commodities and, provided the partnership is a trader or investor with respect to such assets, swaps and other notional principal contracts with respect to commodities. The Fund expects that at least 90% of the Fund’s gross income for each taxable year will consist of qualifying income and that the Fund will be taxed as a partnership for federal income tax purposes. The Fund does not record a provision for income taxes because the shareholders report their share of the Fund’s income or loss on their income tax returns. The financial statements reflect the Fund’s transactions without adjustment, if any, required for income tax purposes.
The Fund is required to determine whether a tax position is more likely than not to be sustained upon examination by the applicable taxing authority, including resolution of any related appeals or litigation processes, based on the technical merits of the position. The Fund files an income tax return in the U.S. federal jurisdiction and may file income tax returns in various U.S. states and foreign jurisdictions. For all tax years to 2022, the Fund remains subject to income tax examinations by major taxing authorities. The tax benefit recognized is measured as the largest amount of benefit that has a greater than fifty percent likelihood of being realized upon ultimate settlement. De-recognition of a tax benefit previously recognized results in the Fund recording a tax liability that reduces net assets. Based on its analysis, the Fund has determined that it has incurred any liability for unrecognized tax benefits as of September 30, 2023 and for the years ended December 31, 2022, 2021, and 2020. However, the Fund’s conclusions regarding this policy may be subject to review and adjustment at a later date based on factors including, but not limited to, ongoing analysis of and changes to tax laws, regulations, and interpretations thereof.
The Fund recognizes interest accrued related to unrecognized tax benefits and penalties related to unrecognized tax benefits in income tax fees payable, if assessed.
The Fund may be subject to potential examination by U.S. federal, U.S. state, or foreign jurisdictional authorities in the area of income taxes. These potential examinations may include questioning the timing and amount of deductions, the nexus of income among various tax jurisdictions, and compliance with U.S. federal, U.S. state and foreign tax laws.
Creations and Redemptions
Authorized Purchasers may purchase Creation Baskets consisting of
Authorized Purchasers may redeem shares from the Fund only in blocks of
The Fund receives or pays the proceeds from shares sold or redeemed within three business days after the trade date of the purchase or redemption. The amounts due from Authorized Purchasers are reflected in the Fund’s statements of assets and liabilities as capital shares receivable. Amounts payable to Authorized Purchasers upon redemption are reflected in the Fund’s statements of assets and liabilities as payable for shares redeemed.
As outlined in the most recent Form S-1 filing,
Allocation of Shareholder Income and Losses
Profit or loss is allocated among the shareholders of the Fund in proportion to the number of shares each shareholder holds as of the close of each month.
Cash and Cash Equivalents
Cash equivalents are highly liquid investments with maturity dates of 90 days or less when acquired. The Trust reported its cash equivalents in the statements of assets and liabilities at market value, or at carrying amounts that approximate fair value, because of their highly liquid nature and short-term maturities. Each Fund that is a series of the Trust has the balance of its cash equivalents on deposit with financial institutions. The Fund holds a balance in money market funds that is included in cash and cash equivalents on the statements of assets and liabilities. The Sponsor invests a portion of the available cash for the Funds in alternative demand deposit savings accounts, which is classified as cash and not as cash equivalents. Assets deposited with the bank may, at times, exceed federally insured limits. The Sponsor invests a portion of the available cash for the Funds in investment grade commercial paper with durations of 90 days or less, which is classified as a cash equivalent and is not FDIC insured. The Sponsor may invest a portion of the cash held by the FCM in short term Treasury Bills as collateral for open futures contracts, which is classified as a cash equivalent and is not FDIC insured.
| September 30, 2023 | December 31, 2022 | |||||||
| Money Market Funds | $ | $ | ||||||
| Demand Deposit Savings Accounts | ||||||||
| Commercial Paper | ||||||||
| Total cash and cash equivalents as presented on the Statement of Assets and Liabilities | $ | $ | ||||||
Payable for Purchases of Commercial Paper
The amount recorded by the Fund for commercial paper transactions awaiting settlement, represents the amount payable for contracts purchased but not yet settled as of the reporting date. The value of the contract is included in cash and cash equivalents, and the payable amount is included as a liability.
Due from/to Broker
The amount recorded by the Fund for the amount due from and to the clearing broker includes, but is not limited to, cash held by the broker, amounts payable to the clearing broker related to open transactions, payables for commodities futures accounts liquidating to an equity balance on the clearing broker’s records and amounts of brokerage commissions paid and recognized as unrealized losses.
Margin is the minimum amount of funds that must be deposited by a commodity interest trader with the trader’s broker to initiate and maintain an open position in futures contracts. A margin deposit acts to assure the trader’s performance of the futures contracts purchased or sold. Futures contracts are customarily bought and sold on initial margin that represents a small percentage of the aggregate purchase or sales price of the contract. Because of such low margin requirements, price fluctuations occurring in the futures markets may create profits and losses that, in relation to the amount invested, are greater than customary in other forms of investment or speculation. As discussed below, adverse price changes in the futures contract may result in margin requirements that greatly exceed the initial margin. In addition, the amount of margin required in connection with a particular futures contract is set from time to time by the exchange on which the contract is traded and may be modified from time to time by the exchange during the term of the contract. Brokerage firms, such as the Fund’s clearing brokers, carrying accounts for traders in commodity interest contracts generally require higher amounts of margin as a matter of policy to further protect themselves. Over the counter trading generally involves the extension of credit between counterparties, so the counterparties may agree to require the posting of collateral by one or both parties to address credit exposure.
When a trader purchases an option, there is no margin requirement; however, the option premium must be paid in full. When a trader sells an option, on the other hand, he or she is required to deposit margin in an amount determined by the margin requirements established for the underlying interest and, in addition, an amount substantially equal to the current premium for the option. The margin requirements imposed on the selling of options, although adjusted to reflect the probability that out-of-the-money options will not be exercised, can in fact be higher than those imposed in dealing in the futures markets directly. Complicated margin requirements apply to spreads and conversions, which are complex trading strategies in which a trader acquires a mixture of options positions and positions in the underlying interest.
Ongoing or “maintenance” margin requirements are computed each day by a trader’s clearing broker. When the market value of a particular open futures contract changes to a point where the margin on deposit does not satisfy maintenance margin requirements, a margin call is made by the broker. If the margin call is not met within a reasonable time, the broker may close out the trader’s position. With respect to the Fund’s trading, the Fund (and not its shareholders personally) is subject to margin calls.
Finally, many major U.S. exchanges have passed certain cross margining arrangements involving procedures pursuant to which the futures and options positions held in an account would, in the case of some accounts, be aggregated and margin requirements would be assessed on a portfolio basis, measuring the total risk of the combined positions.
Calculation of Net Asset Value
The Fund’s NAV is calculated by:
| • | Taking the current market value of its total assets and | |
| • | Subtracting any liabilities. |
The administrator, Global Fund Services, calculates the NAV of the Fund once each trading day. It calculates the NAV as of the earlier of the close of the NYSE or 4:00 p.m. (ET). The NAV for a particular trading day is released after 4:15 p.m. (ET).
In determining the value of Soybean Futures Contracts, the administrator uses the CBOT closing price. The administrator determines the value of all other Fund investments as of the earlier of the close of the NYSE or 4:00 p.m. (ET). The value of over-the-counter soybean interests is determined based on the value of the commodity or futures contract underlying such soybean interest, except that a fair value may be determined if the Sponsor believes that the Fund is subject to significant credit risk relating to the counterparty to such soybean interest. For purposes of financial statements and reports, the Sponsor will recalculate the NAV where necessary to reflect the “fair value” of a Futures Contract when the Futures Contract closes at its price fluctuation limit for the day. Short term Treasury securities held by the Fund are valued by the administrator using values received from recognized third-party vendors and dealer quotes. NAV includes any unrealized profit or loss on open soybean interests and any other income or expense accruing to the Fund but unpaid or not received by the Fund.
Sponsor Fee, Allocation of Expenses and Related Party Transactions
The Sponsor is responsible for investing the assets of the Fund in accordance with the objectives and policies of the Fund. In addition, the Sponsor arranges for one or more third parties to provide administrative, custodial, accounting, transfer agency and other necessary services to the Trust and the Funds. In addition, the Sponsor has elected not to outsource services directly attributable to the Trust and the Funds such as accounting, financial reporting, regulatory compliance, and trading activities, which the Sponsor performs itself. In addition, the Fund is contractually obligated to pay a monthly management fee to the Sponsor, based on average daily net assets, at a rate equal to
The Fund pays for all brokerage fees, taxes, and other expenses, including licensing fees for the use of intellectual property, registration or other fees paid to the SEC, FINRA, or any other regulatory agency in connection with the offer and sale of subsequent Shares after its initial registration and all legal, accounting, printing and other expenses associated therewith. The Fund also pays its portion of the fees and expenses associated with the Trust’s tax accounting and reporting requirements. Certain aggregate expenses common to all Funds within the Trust are allocated by the Sponsor to the respective Fund based on activity drivers deemed most appropriate by the Sponsor for such expenses, including but not limited to relative assets under management and creation order activity. These aggregate common expenses include, but are not limited to, legal, auditing, accounting and financial reporting, tax-preparation, regulatory compliance, trading activities, and insurance costs, as well as fees paid to the Distributor, which are included in the related line item in the statements of operations. A portion of these aggregate common expenses are related to the Sponsor or related parties of principals of the Sponsor; these are necessary services to the Funds, which are primarily the cost of performing accounting and financial reporting, regulatory compliance, and trading activities that are directly attributable to the Fund. Such expenses are primarily recorded as distribution and marketing fees in the financial statements of each Fund.
| Three months ended September 30, 2023 | Three months ended September 30, 2022 | Nine months ended September 30, 2023 | Nine months ended September 30, 2022 | |||||||||||||
| Recognized Related Party Transactions | $ | $ | $ | $ | ||||||||||||
| Waived Related Party Transactions | $ | $ | $ | $ | ||||||||||||
The Sponsor has the ability to elect to pay certain expenses on behalf of the Funds or waive the management fee. This election is subject to change by the Sponsor, at its discretion. Expenses paid by the Sponsor and Management fees waived by the Sponsor are, if applicable, presented as waived expenses in the statements of operations for each Fund. The Sponsor has determined that there will be no recovery sought for the amounts below in any future period:
| SOYB | ||||
| Three months ended September 30, 2023 | $ | |||
| Three months ended September 30, 2022 | $ | |||
| Nine months ended September 30, 2023 | $ | |||
| Nine months ended September 30, 2022 | $ | |||
Use of Estimates
The preparation of financial statements in conformity with U.S. GAAP requires management to make estimates and assumptions that affect the reported amount of assets and liabilities and disclosure of contingent assets and liabilities at the date of the financial statements, and the reported amounts of the revenue and expenses during the reporting period. Actual results could differ from those estimates.
Fair Value - Definition and Hierarchy
In accordance with U.S. GAAP, fair value is defined as the price that would be received to sell an asset or paid to transfer a liability (i.e., the “exit price”) in an orderly transaction between market participants at the measurement date.
In determining fair value, the Fund uses various valuation approaches. In accordance with U.S. GAAP, a fair value hierarchy for inputs is used in measuring fair value that maximizes the use of observable inputs and minimizes the use of unobservable inputs by requiring that the most observable inputs be used when available. Observable inputs are those that market participants would use in pricing the asset or liability based on market data obtained from sources independent of the Fund. Unobservable inputs reflect the Fund’s assumptions about the inputs market participants would use in pricing the asset or liability developed based on the best information available in the circumstances. The fair value hierarchy is categorized into three levels based on the inputs as follows:
Level 1 - Valuations based on unadjusted quoted prices in active markets for identical assets or liabilities that the Fund has the ability to access. Valuation adjustments and block discounts are not applied to Level 1 financial instruments. Since valuations are based on quoted prices that are readily and regularly available in an active market, valuation of these financial instruments does not entail a significant degree of judgment.
Level 2 - Valuations based on quoted prices in markets that are not active or for which all significant inputs are observable, either directly or indirectly.
Level 3 - Valuations based on inputs that are unobservable and significant to the overall fair value measurement.
The availability of valuation techniques and observable inputs can vary from financial instrument to financial instrument and is affected by a wide variety of factors including, the type of financial instrument, whether the financial instrument is new and not yet established in the marketplace, and other characteristics particular to the transaction. To the extent that valuation is based on models or inputs that are less observable or unobservable in the market, the determination of fair value requires more judgment. Those estimated values do not necessarily represent the amounts that may be ultimately realized due to the occurrence of future circumstances that cannot be reasonably determined. Because of the inherent uncertainty of valuation, those estimated values may be materially higher or lower than the values that would have been used had a ready market for the financial instruments existed. Accordingly, the degree of judgment exercised by the Fund in determining fair value is greatest for financial instruments categorized in Level 3. In certain cases, the inputs used to measure fair value may fall into different levels of the fair value hierarchy. In such cases, for disclosure purposes, the level in the fair value hierarchy, within which the fair value measurement in its entirety falls, is determined based on the lowest level input that is significant to the fair value measurement.
Fair value is a market-based measure considered from the perspective of a market participant rather than an entity-specific measure. Therefore, even when market assumptions are not readily available, the Fund’s own assumptions are set to reflect those that market participants would use in pricing the asset or liability at the measurement date. The Fund uses prices and inputs that are current as of the measurement date, including periods of market dislocation. In periods of market dislocation, the observability of prices and inputs may be reduced for many financial instruments. This condition could cause a financial instrument to be reclassified to a lower level within the fair value hierarchy. When such a situation exists on a quarter close, the Sponsor will calculate the NAV on a particular day using the Level 1 valuation but will later recalculate the NAV for the impacted Fund based upon the valuation inputs from these alternative verifiable sources (Level 2 or Level 3) and will report such NAV in its applicable financial statements and reports.
On September 30, 2023 and December 31, 2022, in the opinion of the Trust and the Fund, the reported value at the close of the market for each commodity contract fairly reflected the value of the futures and no alternative valuations were required. The determination is made as of the settlement of the futures contracts on the last day of trading for the reporting period. In making the determination of a Level 1 or Level 2 transfer, the Fund considers the average volume of the specific underlying futures contracts traded on the relevant exchange for the periods being reported.
For the three and nine months ended September 30, 2023 and year ended December 31, 2022, the Fund did not have any significant transfers between any of the levels of the fair value hierarchy.
The Fund records its derivative activities at fair value. Gains and losses from derivative contracts are included in the statements of operations. Derivative contracts include futures contracts related to commodity prices. Futures, which are listed on a national securities exchange, such as the CBOT and the ICE, or reported on another national market, are generally categorized in Level 1 of the fair value hierarchy. OTC derivatives contracts (such as forward and swap contracts) which may be valued using models, depending on whether significant inputs are observable or unobservable, are categorized in Levels 2 or 3 of the fair value hierarchy.
Expenses
Expenses are recorded using the accrual method of accounting.
Net Income (Loss) per Share
Net income (loss) per Share is the difference between the NAV per unit at the beginning of each period and at the end of each period. The weighted average number of Shares outstanding was computed for purposes of disclosing net income (loss) per weighted average Share. The weighted average Shares are equal to the number of Shares outstanding at the end of the period, adjusted proportionately for Shares created or redeemed based on the amount of time the Shares were outstanding during such period.
New Accounting Pronouncements
The Financial Accounting Standards Board (“FASB”) issued Accounting Standards Update (“ASU”) issued ASU 2023-01, related to Leases – (Topic 842). The response to concerns about applying Topic 842 to related party arrangements between entities under common control. The update was adopted early for the quarter ended March 31, 2023; the adoption did not have a material impact on the financial statements and disclosures of the Trust or the Fund.
The FASB issued ASU 2022-03, related to fair value measurement (Topic 820) of equity securities subject to contractual sale restrictions. Under the clarified guidance, contractual restrictions on the sale of an equity security are not considered part of the unit of account of the equity security and, therefore, are not considered in measuring fair value, however they do require disclosures. The amendment was adopted for the quarter ended June 30, 2022; the adoption did not have a material impact on the financial statements and disclosures of the Trust or the Fund.
Note 4 – Fair Value Measurements
The Fund’s assets and liabilities recorded at fair value have been categorized based upon a fair value hierarchy as described in the Fund’s significant accounting policies in Note 3. The following table presents information about the Fund’s assets and liabilities measured at fair value as of September 30, 2023 and December 31, 2022:
September 30, 2023
| Balance as of | ||||||||||||||||
| Assets: | Level 1 | Level 2 | Level 3 | September 30, 2023 | ||||||||||||
| Cash Equivalents | $ | $ | $ | $ | ||||||||||||
| Commodity Futures Contracts | ||||||||||||||||
| Soybean futures contracts | ||||||||||||||||
| Total | $ | $ | $ | $ | ||||||||||||
| Balance as of | ||||||||||||||||
| Liabilities | Level 1 | Level 2 | Level 3 | September 30, 2023 | ||||||||||||
| Commodity Futures Contracts | ||||||||||||||||
| Soybean futures contracts | $ | $ | $ | $ | ||||||||||||
December 31, 2022
| Balance as of | ||||||||||||||||
| Assets: | Level 1 | Level 2 | Level 3 | December 31, 2022 | ||||||||||||
| Cash Equivalents | $ | $ | $ | $ | ||||||||||||
| Commodity Futures Contracts | ||||||||||||||||
| Soybean futures contracts | ||||||||||||||||
| Total | $ | $ | $ | $ | ||||||||||||
For the three and nine months ended September 30, 2023 and year ended December 31, 2022, the Fund did not have any significant transfers between any of the levels of the fair value hierarchy.
See the Fair Value - Definition and Hierarchy section in Note 3 above for an explanation of the transfers into and out of each level of the fair value hierarchy.
Note 5 – Derivative Instruments and Hedging Activities
In the normal course of business, the Fund utilizes derivative contracts in connection with its proprietary trading activities. Investments in derivative contracts are subject to additional risks that can result in a loss of all or part of an investment. The Fund’s derivative activities and exposure to derivative contracts are classified by the following primary underlying risks: interest rate, credit, commodity price, and equity price risks. In addition to its primary underlying risks, the Fund is also subject to additional counterparty risk due to inability of its counterparties to meet the terms of their contracts. For the three and nine months ended September 30, 2023 and year ended December 31, 2022, the Fund invested only in commodity futures contracts.
Futures Contracts
The Fund is subject to commodity price risk in the normal course of pursuing its investment objectives. A futures contract represents a commitment for the future purchase or sale of an asset at a specified price on a specified date.
The purchase and sale of futures contracts requires margin deposits with an FCM. Subsequent payments (variation margin) are made or received by the Fund each day, depending on the daily fluctuations in the value of the contract, and are recorded as unrealized gains or losses by the Fund. Futures contracts may reduce the Fund’s exposure to counterparty risk since futures contracts are exchange-traded; and the exchange’s clearinghouse, as the counterparty to all exchange-traded futures, guarantees the futures against default.
The Commodity Exchange Act requires an FCM to segregate all customer transactions and assets from the FCM’s proprietary activities. A customer’s cash and other equity deposited with an FCM are considered commingled with all other customer funds subject to the FCM’s segregation requirements. In the event of an FCM’s insolvency, recovery may be limited to the Fund’s pro rata share of segregated customer funds available. It is possible that the recovery amount could be less than the total of cash and other equity deposited.
The following table discloses information about offsetting assets and liabilities presented in the statements of assets and liabilities to enable users of these financial statements to evaluate the effect or potential effect of netting arrangements for recognized assets and liabilities. These recognized assets and liabilities are presented as defined in FASB ASU No. 2011-11 “Balance Sheet (Topic 210): Disclosures about Offsetting Assets and Liabilities” and subsequently clarified in FASB ASU 2013-01 “Balance Sheet (Topic 210): Clarifying the Scope of Disclosures about Offsetting Assets and Liabilities.”
The following table also identifies the fair value amounts of derivative instruments included in the statements of assets and liabilities as derivative contracts, categorized by primary underlying risk, and held by the FCMs, Marex and StoneX as of September 30, 2023, and December 31, 2022.
*The amount of collateral presented in Collateral, Due from Broker, is limited to the liability for the futures contracts and accordingly does not include the excess collateral pledged.
Offsetting of Financial Assets and Derivative Assets as of September 30, 2023
| (i) | (ii) | (iii) = (i)-(ii) | (iv) | (v)=(iii)-(iv) | ||||||||||||||||||||
| Gross Amount Not Offset in the Statement of Assets and Liabilities | ||||||||||||||||||||||||
| Description | Gross Amount of Recognized Assets | Gross Amount Offset in the Statement of Assets and Liabilities | Net Amount Presented in the Statement of Assets and Liabilities | Futures Contracts Available for Offset | Collateral, Due to Broker | Net Amount | ||||||||||||||||||
| Commodity Price | ||||||||||||||||||||||||
| Soybean futures contracts | $ | $ | $ | $ | $ | $ | ||||||||||||||||||
Offsetting of Financial Liabilities and Derivative Liabilities as of September 30, 2023
| (i) | (ii) | (iii) = (i)-(ii) | (iv) | (v)=(iii)-(iv) | ||||||||||||||||||||
| Gross Amount Not Offset in the Statement of Assets and Liabilities | ||||||||||||||||||||||||
| Description | Gross Amount of Recognized Liabilities | Gross Amount Offset in the Statement of Assets and Liabilities | Net Amount Presented in the Statement of Assets and Liabilities | Futures Contracts Available for Offset | Collateral, Due from Broker* | Net Amount | ||||||||||||||||||
| Commodity Price | ||||||||||||||||||||||||
| Soybean futures contracts | $ | $ | $ | $ | $ | $ | ||||||||||||||||||
Offsetting of Financial Assets and Derivative Assets as of December 31, 2022
| (i) | (ii) | (iii) = (i)-(ii) | (iv) | (v)=(iii)-(iv) | ||||||||||||||||||||
| Gross Amount Not Offset in the Statement of Assets and Liabilities | ||||||||||||||||||||||||
| Description | Gross Amount of Recognized Assets | Gross Amount Offset in the Statement of Assets and Liabilities | Net Amount Presented in the Statement of Assets and Liabilities | Futures Contracts Available for Offset | Collateral, Due to Broker | Net Amount | ||||||||||||||||||
| Commodity Price | ||||||||||||||||||||||||
| Soybean futures contracts | $ | $ | $ | $ | $ | $ | ||||||||||||||||||
The following is a summary of realized and unrealized gains and losses of the derivative instruments utilized by the Fund:
Three months ended September 30, 2023
| Realized Gain on Commodity Futures Contracts | Net Change in Unrealized Depreciation on Commodity Futures Contracts | |||||||
| Commodity Price | ||||||||
| Soybean futures contracts | $ | $ | ( | ) | ||||
Three months ended September 30, 2022
| Realized Gain on Commodity Futures Contracts | Net Change in Unrealized Depreciation on Commodity Futures Contracts | |||||||
| Commodity Price | ||||||||
| Soybean futures contracts | $ | $ | ( | ) | ||||
Nine months ended September 30, 2023
| Realized Gain on Commodity Futures Contracts | Net Change in Unrealized Depreciation on Commodity Futures Contracts | |||||||
| Commodity Price | ||||||||
| Soybean futures contracts | $ | $ | ( | ) | ||||
Nine months ended September 30, 2022
| Realized Gain on Commodity Futures Contracts | Net Change in Unrealized Depreciation on Commodity Futures Contracts | |||||||
| Commodity Price | ||||||||
| Soybean futures contracts | $ | $ | ( | ) | ||||
Volume of Derivative Activities
The average notional market value categorized by primary underlying risk for all futures contracts held was $
Note 6 – Financial Highlights
The following tables present per unit performance data and other supplemental financial data for the three and nine months ended September 30, 2023 and 2022. This information has been derived from information presented in the financial statements and is presented with total expenses gross of expenses waived by the Sponsor and with total expenses net of expenses waived by the Sponsor, as appropriate.
| Three months ended | Three months ended | Nine months ended | Nine months ended | |||||||||||||
| September 30, 2023 | September 30, 2022 | September 30, 2023 | September 30, 2022 | |||||||||||||
| Per Share Operation Performance | ||||||||||||||||
| Net asset value at beginning of period | $ | $ | $ | $ | ||||||||||||
| Income from investment operations: | ||||||||||||||||
| Investment income | ||||||||||||||||
| Net realized and unrealized (loss) gain on commodity futures contracts | ( | ) | ( | ) | ( | ) | ||||||||||
| Total expenses, net | ( | ) | ( | ) | ( | ) | ( | ) | ||||||||
| Net (decrease) increase in net asset value | ( | ) | ( | ) | ( | ) | ||||||||||
| Net asset value at end of period | $ | $ | $ | $ | ||||||||||||
| Total Return | - | % | - | % | - | % | % | |||||||||
| Ratios to Average Net Assets (Annualized) | ||||||||||||||||
| Total expenses | % | % | % | % | ||||||||||||
| Total expenses, net | % | % | % | % | ||||||||||||
| Net investment income (loss) | % | % | % | - | % | |||||||||||
The financial highlights per share data are calculated consistent with the methodology used to calculate asset-based fees and expenses.
Note 7 – Organizational and Offering Costs
Expenses incurred in organizing of the Trust and the initial offering of the Shares of the Fund, including applicable SEC registration fees were borne directly by the Sponsor. The Fund will not be obligated to reimburse the Sponsor.
Note 8 – Subsequent Events
Management has evaluated the financial statements for the quarter-ended September 30, 2023 for subsequent events through the date of this filing and noted no material events requiring either recognition through the date of the filing or disclosure herein for the Fund.
STATEMENTS OF ASSETS AND LIABILITIES
| September 30, 2023 | December 31, 2022 | |||||||
| (Unaudited) | ||||||||
| Assets | ||||||||
| Cash and cash equivalents | $ | $ | ||||||
| Interest receivable | ||||||||
| Other assets | ||||||||
| Equity in trading accounts: | ||||||||
| Commodity futures contracts | ||||||||
| Due from broker | ||||||||
| Total equity in trading accounts | ||||||||
| Total assets | ||||||||
| Liabilities | ||||||||
| Management fee payable to Sponsor | ||||||||
| Other liabilities | ||||||||
| Equity in trading accounts: | ||||||||
| Commodity futures contracts | ||||||||
| Due to broker | ||||||||
| Total equity in trading accounts | ||||||||
| Total liabilities | ||||||||
| Net assets | $ | $ | ||||||
| Shares outstanding | ||||||||
| Shares authorized | * | * | ||||||
| Net asset value per share | $ | $ | ||||||
| Market value per share | $ | $ | ||||||
* On April 7, 2022, the Teucrium Sugar Fund registered an indeterminate number of shares of the Fund pursuant to Rule 456(d) under the Securities Act of 1933.
The accompanying notes are an integral part of these financial statements.
SCHEDULE OF INVESTMENTS
September 30, 2023
(Unaudited)
| Percentage of | ||||||||||||||||||||
| Description: Assets | Yield | Cost | Fair Value | Net Assets | Shares | |||||||||||||||
| Cash equivalents | ||||||||||||||||||||
| Money market funds | ||||||||||||||||||||
| U.S. Bank Deposit Account | % | $ | $ | % | ||||||||||||||||
| Goldman Sachs Financial Square Government Fund - Institutional Class | % | |||||||||||||||||||
| Total Money Market Funds | $ | $ | % | |||||||||||||||||
| Maturity | Percentage of | Principal | |||||||||||||||||||
| Date | Yield | Cost | Fair Value | Net Assets | Amount | ||||||||||||||||
| Commercial Paper | |||||||||||||||||||||
| Brookfield Infrastructure Holdings (Canada) Inc. | | % | $ | $ | % | ||||||||||||||||
| Marriott International, Inc. | | % | |||||||||||||||||||
| V.F. Corporation | | % | |||||||||||||||||||
| Walgreens Boots Alliance, Inc. | | % | |||||||||||||||||||
| Total Commercial Paper | $ | $ | % | ||||||||||||||||||
| Total Cash Equivalents | $ | % | |||||||||||||||||||
| Number of | Percentage of | Notional Amount | ||||||||||||||
| Contracts | Fair Value | Net Assets | (Long Exposure) | |||||||||||||
| Commodity futures contracts | ||||||||||||||||
| United States sugar futures contracts | ||||||||||||||||
| ICE sugar futures MAY24 | $ | % | $ | |||||||||||||
| ICE sugar futures MAR25 | ||||||||||||||||
| Total commodity futures contracts | $ | % | $ | |||||||||||||
| Number of | Percentage of | Notional Amount | ||||||||||||||
| Description: Liabilities | Contracts | Fair Value | Net Assets | (Long Exposure) | ||||||||||||
| Commodity futures contracts | ||||||||||||||||
| United States sugar futures contracts | ||||||||||||||||
| ICE sugar futures JUL24 | $ | % | $ | |||||||||||||
The accompanying notes are an integral part of these financial statements.
TEUCRIUM SUGAR FUND
SCHEDULE OF INVESTMENTS
December 31, 2022
| Percentage of | ||||||||||||||||||||
| Description: Assets | Yield | Cost | Fair Value | Net Assets | Shares | |||||||||||||||
| Cash equivalents | ||||||||||||||||||||
| Money market funds | ||||||||||||||||||||
| First American Government Obligations Fund - Class X | % | $ | $ | % | ||||||||||||||||
| Goldman Sachs Financial Square Government Fund - Institutional Class | % | |||||||||||||||||||
| Total Money Market Funds | $ | $ | % | |||||||||||||||||
| Maturity | Percentage of | Principal | |||||||||||||||||||
| Date | Yield | Cost | Fair Value | Net Assets | Amount | ||||||||||||||||
| Commercial Paper | |||||||||||||||||||||
| Entergy Corporation | | % | $ | $ | % | ||||||||||||||||
| General Motors Financial Company, Inc. | | % | |||||||||||||||||||
| Glencore Funding LLC | | % | |||||||||||||||||||
| VW Credit, Inc. | | % | |||||||||||||||||||
| Total Commercial Paper | $ | $ | % | ||||||||||||||||||
| Total Cash Equivalents | $ | % | |||||||||||||||||||
| Number of | Percentage of | Notional Amount | ||||||||||||||
| Contracts | Fair Value | Net Assets | (Long Exposure) | |||||||||||||
| Commodity futures contracts | ||||||||||||||||
| United States sugar futures contracts | ||||||||||||||||
| ICE sugar futures MAY23 | $ | % | $ | |||||||||||||
| ICE sugar futures JUL23 | ||||||||||||||||
| Total commodity futures contracts | $ | % | $ | |||||||||||||
| Number of | Percentage of | Notional Amount | ||||||||||||||
| Description: Liabilities | Contracts | Fair Value | Net Assets | (Long Exposure) | ||||||||||||
| Commodity futures contracts | ||||||||||||||||
| United States sugar futures contracts | ||||||||||||||||
| ICE sugar futures MAR24 | $ | % | $ | |||||||||||||
The accompanying notes are an integral part of these financial statements.
STATEMENTS OF OPERATIONS
(Unaudited)
| Three months ended | Three months ended | Nine months ended | Nine months ended | |||||||||||||
| September 30, 2023 | September 30, 2022 | September 30, 2023 | September 30, 2022 | |||||||||||||
| Income | ||||||||||||||||
| Realized and unrealized gain (loss) on trading of commodity futures contracts: | ||||||||||||||||
| Realized gain (loss) on commodity futures contracts | $ | $ | ( | ) | $ | $ | ( | ) | ||||||||
| Net change in unrealized appreciation (depreciation) on commodity futures contracts | ( | ) | ( | ) | ||||||||||||
| Interest income | ||||||||||||||||
| Total income (loss) | ( | ) | ( | ) | ||||||||||||
| Expenses | ||||||||||||||||
| Management fees | ||||||||||||||||
| Professional fees | ||||||||||||||||
| Distribution and marketing fees | ||||||||||||||||
| Custodian fees and expenses | ||||||||||||||||
| Business permits and licenses fees | ||||||||||||||||
| General and administrative expenses | ||||||||||||||||
| Total expenses | ||||||||||||||||
| Expenses waived by the Sponsor | ( | ) | ||||||||||||||
| Total expenses, net | ||||||||||||||||
| Net income (loss) | $ | $ | ( | ) | $ | $ | ( | ) | ||||||||
| Net gain (loss) per share | $ | $ | ( | ) | $ | $ | ( | ) | ||||||||
| Net gain (loss) per weighted average share | $ | $ | ( | ) | $ | $ | ( | ) | ||||||||
| Weighted average shares outstanding | ||||||||||||||||
The accompanying notes are an integral part of these financial statements.
STATEMENTS OF CHANGES IN NET ASSETS
(Unaudited)
| Nine months ended | Nine months ended | |||||||
| September 30, 2023 | September 30, 2022 | |||||||
| Operations | ||||||||
| Net income (loss) | $ | $ | ( | ) | ||||
| Capital transactions | ||||||||
| Issuance of Shares | ||||||||
| Redemption of Shares | ( | ) | ( | ) | ||||
| Total capital transactions | ( | ) | ||||||
| Net change in net assets | ||||||||
| Net assets, beginning of period | $ | $ | ||||||
| Net assets, end of period | $ | $ | ||||||
| Net asset value per share at beginning of period | $ | $ | ||||||
| Net asset value per share at end of period | $ | $ | ||||||
| Creation of Shares | ||||||||
| Redemption of Shares | ||||||||
The accompanying notes are an integral part of these financial statements.
STATEMENTS OF CASH FLOWS
(Unaudited)
| Nine months ended | Nine months ended | |||||||
| September 30, 2023 | September 30, 2022 | |||||||
| Cash flows from operating activities: | ||||||||
| Net income (loss) | $ | $ | ( | ) | ||||
| Adjustments to reconcile net income (loss) to net cash provided by (used in) operating activities: | ||||||||
| Net change in unrealized (appreciation) depreciation on commodity futures contracts | ( | ) | ||||||
| Changes in operating assets and liabilities: | ||||||||
| Due from broker | ( | ) | ||||||
| Interest receivable | ( | ) | ( | ) | ||||
| Other assets | ( | ) | ( | ) | ||||
| Due to broker | ||||||||
| Management fee payable to Sponsor | ( | ) | ||||||
| Other liabilities | ( | ) | ||||||
| Net cash provided by (used in) operating activities | ( | ) | ||||||
| Cash flows from financing activities: | ||||||||
| Proceeds from sale of Shares | ||||||||
| Redemption of Shares | ( | ) | ( | ) | ||||
| Net cash (used in) provided by financing activities | ( | ) | ||||||
| Net change in cash and cash equivalents | ||||||||
| Cash and cash equivalents beginning of period | ||||||||
| Cash and cash equivalents end of period | $ | $ | ||||||
The accompanying notes are an integral part of these financial statements.
September 30, 2023
(Unaudited)
Note 1 – Organization and Operation
Teucrium Sugar Fund (referred to herein as “CANE” or the “Fund”) is a commodity pool that is a series of Teucrium Commodity Trust (“Trust”), a Delaware statutory trust formed on September 11, 2009. The Fund issues common units, called the “Shares,” representing fractional undivided beneficial interests in the Fund. The Fund continuously offers Creation Baskets consisting of
The investment objective of CANE is to have the daily changes in the NAV of the Fund’s Shares reflect the daily changes in the sugar market for future delivery as measured by the Benchmark. The Benchmark is a weighted average of the closing settlement prices for futures contracts for No. 11 sugar (“Sugar Futures Contracts”) that are traded on the ICE Futures US (“ICE”):
CANE Benchmark
| ICE Sugar Futures Contract | Weighting | |||
| Second to expire | % | |||
| Third to expire | % | |||
| Expiring in the March following the expiration of the third to expire contract | % | |||
The Fund commenced investment operations on September 19, 2011 and has a fiscal year ending December 31. The Fund’s sponsor is Teucrium Trading, LLC (the “Sponsor”). The Sponsor is responsible for the management of the Fund. The Sponsor is registered as a commodity pool operator (“CPO”) and a commodity trading adviser (“CTA”) with the Commodity Futures Trading Commission (“CFTC”) and is a member of the National Futures Association (“NFA”).
On June 13, 2011, the initial Form S-1 for CANE was declared effective by the SEC. On September 16, 2011, Creation Baskets were issued representing
The accompanying unaudited financial statements have been prepared in accordance with Rule 10-01 of Regulation S-X promulgated by the SEC and, therefore, do not include all information and footnote disclosures required under accounting principles generally accepted in the United States of America (“GAAP”). The financial information included herein is unaudited; however, such financial information reflects all adjustments which are, in the opinion of management, necessary for the fair presentation of the Fund’s financial statements for the interim period. It is suggested that these interim financial statements be read in conjunction with the financial statements and related notes included in the Trust’s Annual Report on Form 10-K, as well as the most recent Form S-1 filing, as applicable. The operating results for the three and nine months ended September 30, 2023 are not necessarily indicative of the results to be expected for the full year ending December 31, 2023.
Subject to the terms of the Trust Agreement, Teucrium Trading, LLC, in its capacity as the Sponsor (“Sponsor”), may terminate a Fund at any time, regardless of whether the Fund has incurred losses, including, for instance, if it determines that the Fund’s aggregate net assets in relation to its operating expenses make the continued operation of the Fund unreasonable or imprudent. However, no level of losses will require the Sponsor to terminate a Fund.
Note 2 – Principal Contracts and Agreements
The Sponsor employs U.S. Bancorp Fund Services, LLC, doing business as U.S. Bank Global Fund Services (“Global Fund Services”), for Transfer Agency, Fund Accounting and Fund Administration services. The principal address for Global Fund Services is 615 E. Michigan Street, Milwaukee, WI 53202.
For custody services, the Funds will pay to U.S. Bank N.A.
The Sponsor employs Foreside Fund Services, LLC (“Foreside” or the “Distributor”) as the Distributor for the Funds. The Distribution Services Agreement among the Distributor and the Sponsor calls for the Distributor to work with the Custodian in connection with the receipt and processing of orders for Creation Baskets and Redemption Baskets and the review and approval of all Fund sales literature and advertising materials. The Distributor and the Sponsor have also entered into a Securities Activities and Service Agreement (the “SASA”) under which certain employees and officers of the Sponsor are licensed as registered representatives or registered principals of the Distributor, under Financial Industry Regulatory Authority (“FINRA”) rules. For its services as the Distributor, Foreside receives a fee of
Marex Capital Markets, Inc. (“Marex”) and StoneX Financial Inc. (“StoneX”) serve as the Funds’ clearing brokers to execute and clear the futures contracts and provide other brokerage-related services. Marex and StoneX are each registered as futures commission merchants (“FCM”) with the U.S. CFTC and are members of the NFA. The clearing brokers are registered as broker-dealers with the SEC and are each a member of FINRA. Marex and StoneX are each clearing members of ICE Futures U.S., Inc., Chicago Board of Trade, Chicago Mercantile Exchange, New York Mercantile Exchange, and all other major United States commodity exchanges. For Corn, Soybean, Sugar, and Wheat Futures Contracts Marex is paid $
The sole Trustee of the Trust is Wilmington Trust Company, a Delaware banking corporation. The Trustee will accept service of legal process on the Trust in the State of Delaware and will make certain filings under the Delaware Statutory Trust Act. For its services, the Trustee receives an annual fee of $
The Sponsor employs Thales Capital Partners LLC (“Thales”) for distribution and solicitation-related services. Thales is registered as a broker-dealer with the SEC and a member of FINRA and the Securities Investor Protection Corporation (“SIPC”). Thales receives a quarterly fee of the higher of $
| Three months ended September 30, 2023 | Three months ended September 30, 2022 | Nine months ended September 30, 2023 | Nine months ended September 30, 2022 | |||||||||||||
| Amount Recognized for Custody Services | $ | $ | $ | $ | ||||||||||||
| Amount of Custody Services Waived | $ | $ | $ | $ | ||||||||||||
| Amount Recognized for Distribution Services | $ | $ | $ | $ | ||||||||||||
| Amount of Distribution Services Waived | $ | $ | $ | $ | ||||||||||||
| Amount Recognized for Wilmington Trust | $ | $ | $ | $ | ||||||||||||
| Amount of Wilmington Trust Waived | $ | $ | $ | $ | ||||||||||||
| Amount Recognized for Thales | $ | $ | $ | $ | ||||||||||||
| Amount of Thales Waived | $ | $ | $ | $ | ||||||||||||
Note 3 – Summary of Significant Accounting Policies
Basis of Presentation
The accompanying financial statements have been prepared in accordance with accounting principles generally accepted in the United States of America (“U.S. GAAP”) as detailed in the Financial Accounting Standards Board’s Accounting Standards Codification.
Revenue Recognition
Commodity futures contracts are recorded on the trade date. All such transactions are recorded on the identified cost basis and marked to market daily. Unrealized appreciation or depreciation on commodity futures contracts are reflected in the statements of operations as the difference between the original contract amount and the fair market value as of the last business day of the year or as of the last date of the financial statements. Changes in the appreciation or depreciation between periods are reflected in the statements of operations. Interest on cash equivalents with financial institutions are recognized on the accrual basis. The Fund seeks to earn interest on funds held at the custodian and other financial institutions at prevailing market rates for such investments.
The Sponsor invests a portion of cash in commercial paper, which is deemed a cash equivalent based on the rating and duration of contracts as described in the notes to the financial statements and reflected in cash and cash equivalents on the statements of assets and liabilities and on the statements of cash flows. Accretion on these investments is recognized using the effective interest method in U.S. dollars and included in interest income on the statements of operations.
The Sponsor invests a portion of the cash held by the broker in short term Treasury Bills as collateral for open futures contracts. Accretion on these investments is recognized using the effective interest method in U.S. dollars and included in interest income on the statements of operations.
Brokerage Commissions
The Sponsor recognizes the expense for brokerage commissions for futures contract trades on a per-trade basis. The below table shows the amounts included on the statements of operations as total brokerage commissions paid inclusive of unrealized loss for the three and nine months ended September 30, 2023 and 2022.
| CANE | ||||
| Three months ended September 30, 2023 | $ | |||
| Three months ended September 30, 2022 | $ | |||
| Nine months ended September 30, 2023 | $ | |||
| Nine months ended September 30, 2022 | $ | |||
Income Taxes
For federal income tax purposes, the Fund will be treated as a publicly traded partnership. A publicly traded partnership is generally treated as a corporation for federal income tax purposes unless 90% or more of the publicly traded partnership’s gross income for each taxable year of its existence consists of qualifying income as defined in section 7704(d) of the Internal Revenue Code of 1986, as amended. Qualifying income is defined as generally including, in pertinent part, interest (other than from a financial business), dividends, and gains from the sale or disposition of capital assets held for the production of interest or dividends. In the case of a partnership of which a principal activity is the buying and selling of commodities, other than as inventory, or of futures, forwards and options with respect to commodities, qualifying income also includes income and gains from commodities and from futures, forwards, options with respect to commodities and, provided the partnership is a trader or investor with respect to such assets, swaps and other notional principal contracts with respect to commodities. The Fund expects that at least 90% of the Fund’s gross income for each taxable year will consist of qualifying income and that the Fund will be taxed as a partnership for federal income tax purposes. The Fund does not record a provision for income taxes because the shareholders report their share of the Fund’s income or loss on their income tax returns. The financial statements reflect the Fund’s transactions without adjustment, if any, required for income tax purposes.
The Fund is required to determine whether a tax position is more likely than not to be sustained upon examination by the applicable taxing authority, including resolution of any related appeals or litigation processes, based on the technical merits of the position. The Fund files an income tax return in the U.S. federal jurisdiction and may file income tax returns in various U.S. states and foreign jurisdictions. For all tax years to 2022, the Fund remains subject to income tax examinations by major taxing authorities. The tax benefit recognized is measured as the largest amount of benefit that has a greater than fifty percent likelihood of being realized upon ultimate settlement. De-recognition of a tax benefit previously recognized results in the Fund recording a tax liability that reduces net assets. Based on its analysis, the Fund has determined that it has incurred any liability for unrecognized tax benefits as of September 30, 2023 and for the years ended December 31, 2022, 2021, and 2020. However, the Fund’s conclusions regarding this policy may be subject to review and adjustment at a later date based on factors including, but not limited to, ongoing analysis of and changes to tax laws, regulations, and interpretations thereof.
The Fund recognizes interest accrued related to unrecognized tax benefits and penalties related to unrecognized tax benefits in income tax fees payable, if assessed.
The Fund may be subject to potential examination by U.S. federal, U.S. state, or foreign jurisdictional authorities in the area of income taxes. These potential examinations may include questioning the timing and amount of deductions, the nexus of income among various tax jurisdictions, and compliance with U.S. federal, U.S. state and foreign tax laws.
Creations and Redemptions
Authorized Purchasers may purchase Creation Baskets consisting of
Authorized Purchasers may redeem shares from the Fund only in blocks of
The Fund receives or pays the proceeds from shares sold or redeemed within three business days after the trade date of the purchase or redemption. The amounts due from Authorized Purchasers are reflected in the Fund’s statements of assets and liabilities as capital shares receivable. Amounts payable to Authorized Purchasers upon redemption are reflected in the Fund’s statements of assets and liabilities as payable for shares redeemed.
As outlined in the most recent Form S-1 filing,
Allocation of Shareholder Income and Losses
Profit or loss is allocated among the shareholders of the Fund in proportion to the number of shares each shareholder holds as of the close of each month.
Cash and Cash Equivalents
Cash equivalents are highly liquid investments with maturity dates of 90 days or less when acquired. The Trust reported its cash equivalents in the statements of assets and liabilities at market value, or at carrying amounts that approximate fair value, because of their highly liquid nature and short-term maturities. Each Fund that is a series of the Trust has the balance of its cash equivalents on deposit with financial institutions. The Fund holds a balance in money market funds that is included in cash and cash equivalents on the statements of assets and liabilities. The Sponsor invests a portion of the available cash for the Funds in alternative demand deposit savings accounts, which is classified as cash and not as cash equivalents. Assets deposited with the bank may, at times, exceed federally insured limits. The Sponsor invests a portion of the available cash for the Funds in investment grade commercial paper with durations of 90 days or less, which is classified as a cash equivalent and is not FDIC insured. The Sponsor may invest a portion of the cash held by the broker in short term Treasury Bills as collateral for open futures contracts, which is classified as a cash equivalent and is not FDIC insured.
| September 30, 2023 | December 31, 2022 | |||||||
| Money Market Funds | $ | $ | ||||||
| Demand Deposit Savings Accounts | ||||||||
| Commercial Paper | ||||||||
| Total cash and cash equivalents as presented on the Statement of Assets and Liabilities | $ | $ | ||||||
Due from/to Broker
The amount recorded by the Fund for the amount due from and to the clearing broker includes, but is not limited to, cash held by the broker, amounts payable to the clearing broker related to open transactions, payables for commodities futures accounts liquidating to an equity balance on the clearing broker’s records, and amounts of brokerage commissions paid and recognized as unrealized losses.
Margin is the minimum amount of funds that must be deposited by a commodity interest trader with the trader’s broker to initiate and maintain an open position in futures contracts. A margin deposit acts to assure the trader’s performance of the futures contracts purchased or sold. Futures contracts are customarily bought and sold on initial margin that represents a small percentage of the aggregate purchase or sales price of the contract. Because of such low margin requirements, price fluctuations occurring in the futures markets may create profits and losses that, in relation to the amount invested, are greater than customary in other forms of investment or speculation. As discussed below, adverse price changes in the futures contract may result in margin requirements that greatly exceed the initial margin. In addition, the amount of margin required in connection with a particular futures contract is set from time to time by the exchange on which the contract is traded and may be modified from time to time by the exchange during the term of the contract. Brokerage firms, such as the Fund’s clearing brokers, carrying accounts for traders in commodity interest contracts generally require higher amounts of margin as a matter of policy to further protect themselves. Over the counter trading generally involves the extension of credit between counterparties, so the counterparties may agree to require the posting of collateral by one or both parties to address credit exposure.
When a trader purchases an option, there is no margin requirement; however, the option premium must be paid in full. When a trader sells an option, on the other hand, he or she is required to deposit margin in an amount determined by the margin requirements established for the underlying interest and, in addition, an amount substantially equal to the current premium for the option. The margin requirements imposed on the selling of options, although adjusted to reflect the probability that out-of-the-money options will not be exercised, can in fact be higher than those imposed in dealing in the futures markets directly. Complicated margin requirements apply to spreads and conversions, which are complex trading strategies in which a trader acquires a mixture of options positions and positions in the underlying interest.
Ongoing or “maintenance” margin requirements are computed each day by a trader’s clearing broker. When the market value of a particular open futures contract changes to a point where the margin on deposit does not satisfy maintenance margin requirements, a margin call is made by the broker. If the margin call is not met within a reasonable time, the broker may close out the trader’s position. With respect to the Fund’s trading, the Fund (and not its shareholders personally) is subject to margin calls.
Finally, many major U.S. exchanges have passed certain cross margining arrangements involving procedures pursuant to which the futures and options positions held in an account would, in the case of some accounts, be aggregated and margin requirements would be assessed on a portfolio basis, measuring the total risk of the combined positions.
Calculation of Net Asset Value
The Fund’s NAV is calculated by:
| • | Taking the current market value of its total assets and | |
| • | Subtracting any liabilities. |
The administrator, Global Fund Services, calculates the NAV of the Fund once each trading day. It calculates the NAV as of the earlier of the close of the NYSE or 4:00 p.m. (ET). The NAV for a particular trading day is released after 4:15 p.m. (ET).
In determining the value of Sugar Futures Contracts, the administrator uses the ICE closing price. The administrator determines the value of all other Fund investments as of the earlier of the close of the NYSE or 4:00 p.m. (ET). The value of over-the-counter sugar interests is determined based on the value of the commodity or futures contract underlying such sugar interest, except that a fair value may be determined if the Sponsor believes that the Fund is subject to significant credit risk relating to the counterparty to such sugar interest. For purposes of financial statements and reports, the Sponsor will recalculate the NAV where necessary to reflect the “fair value” of a Futures Contract when the Futures Contract closes at its price fluctuation limit for the day. Short term Treasury securities held by the Fund are valued by the administrator using values received from recognized third-party vendors and dealer quotes. NAV includes any unrealized profit or loss on open sugar interests and any other income or expense accruing to the Fund but unpaid or not received by the Fund.
Sponsor Fee, Allocation of Expenses and Related Party Transactions
The Sponsor is responsible for investing the assets of the Fund in accordance with the objectives and policies of the Fund. In addition, the Sponsor arranges for one or more third parties to provide administrative, custodial, accounting, transfer agency and other necessary services to the Trust and the Funds. In addition, the Sponsor has elected not to outsource services directly attributable to the Trust and the Funds such as accounting, financial reporting, regulatory compliance, and trading activities, which the Sponsor performs itself. In addition, the Fund is contractually obligated to pay a monthly management fee to the Sponsor, based on average daily net assets, at a rate equal to
The Fund generally pays for all brokerage fees, taxes, and other expenses, including licensing fees for the use of intellectual property, registration or other fees paid to the SEC, FINRA, or any other regulatory agency in connection with the offer and sale of subsequent Shares after its initial registration and all legal, accounting, printing and other expenses associated therewith. The Fund also pays its portion of the fees and expenses associated with the Trust’s tax accounting and reporting requirements. Certain aggregate expenses common to all Funds within the Trust are allocated by the Sponsor to the respective Fund based on activity drivers deemed most appropriate by the Sponsor for such expenses, including but not limited to relative assets under management and creation order activity. These aggregate common expenses include, but are not limited to, legal, auditing, accounting and financial reporting, tax-preparation, regulatory compliance, trading activities, and insurance costs, as well as fees paid to the Distributor, which are included in the related line item in the statements of operations. A portion of these aggregate common expenses are related to the Sponsor or related parties of principals of the Sponsor; these are necessary services to the Funds, which are primarily the cost of performing accounting and financial reporting, regulatory compliance, and trading activities that are directly attributable to the Fund. Such expenses are primarily recorded as distribution and marketing fees in the financial statements of each Fund.
| Three months ended September 30, 2023 | Three months ended September 30, 2022 | Nine months ended September 30, 2023 | Nine months ended September 30, 2022 | |||||||||||||
| Recognized Related Party Transactions | $ | $ | $ | $ | ||||||||||||
| Waived Related Party Transactions | $ | $ | $ | $ | ||||||||||||
The Sponsor has the ability to elect to pay certain expenses on behalf of the Funds or waive the management fee. This election is subject to change by the Sponsor, at its discretion. Expenses paid by the Sponsor and Management fees waived by the Sponsor are, if applicable, presented as waived expenses in the statements of operations for each Fund. The Sponsor has determined that there will be no recovery sought for the amounts below in any future period:
| CANE | ||||
| Three months ended September 30, 2023 | $ | |||
| Three months ended September 30, 2022 | $ | |||
| Nine months ended September 30, 2023 | $ | |||
| Nine months ended September 30, 2022 | $ | |||
Use of Estimates
The preparation of financial statements in conformity with U.S. GAAP requires management to make estimates and assumptions that affect the reported amount of assets and liabilities and disclosure of contingent assets and liabilities at the date of the financial statements, and the reported amounts of the revenue and expenses during the reporting period. Actual results could differ from those estimates.
Fair Value – Definition and Hierarchy
In accordance with U.S. GAAP, fair value is defined as the price that would be received to sell an asset or paid to transfer a liability (i.e., the “exit price”) in an orderly transaction between market participants at the measurement date.
In determining fair value, the Fund uses various valuation approaches. In accordance with U.S. GAAP, a fair value hierarchy for inputs is used in measuring fair value that maximizes the use of observable inputs and minimizes the use of unobservable inputs by requiring that the most observable inputs be used when available. Observable inputs are those that market participants would use in pricing the asset or liability based on market data obtained from sources independent of the Fund. Unobservable inputs reflect the Fund’s assumptions about the inputs market participants would use in pricing the asset or liability developed based on the best information available in the circumstances. The fair value hierarchy is categorized into three levels based on the inputs as follows:
Level 1 – Valuations based on unadjusted quoted prices in active markets for identical assets or liabilities that the Fund has the ability to access. Valuation adjustments and block discounts are not applied to Level 1 financial instruments. Since valuations are based on quoted prices that are readily and regularly available in an active market, valuation of these financial instruments does not entail a significant degree of judgment.
Level 2 – Valuations based on quoted prices in markets that are not active or for which all significant inputs are observable, either directly or indirectly.
Level 3 – Valuations based on inputs that are unobservable and significant to the overall fair value measurement.
The availability of valuation techniques and observable inputs can vary from financial instrument to financial instrument and is affected by a wide variety of factors including, the type of financial instrument, whether the financial instrument is new and not yet established in the marketplace, and other characteristics particular to the transaction. To the extent that valuation is based on models or inputs that are less observable or unobservable in the market, the determination of fair value requires more judgment. Those estimated values do not necessarily represent the amounts that may be ultimately realized due to the occurrence of future circumstances that cannot be reasonably determined. Because of the inherent uncertainty of valuation, those estimated values may be materially higher or lower than the values that would have been used had a ready market for the financial instruments existed. Accordingly, the degree of judgment exercised by the Fund in determining fair value is greatest for financial instruments categorized in Level 3. In certain cases, the inputs used to measure fair value may fall into different levels of the fair value hierarchy. In such cases, for disclosure purposes, the level in the fair value hierarchy, within which the fair value measurement in its entirety falls, is determined based on the lowest level input that is significant to the fair value measurement.
Fair value is a market-based measure considered from the perspective of a market participant rather than an entity-specific measure. Therefore, even when market assumptions are not readily available, the Fund’s own assumptions are set to reflect those that market participants would use in pricing the asset or liability at the measurement date. The Fund uses prices and inputs that are current as of the measurement date, including periods of market dislocation. In periods of market dislocation, the observability of prices and inputs may be reduced for many financial instruments. This condition could cause a financial instrument to be reclassified to a lower level within the fair value hierarchy. When such a situation exists on a quarter close, the Sponsor will calculate the NAV on a particular day using the Level 1 valuation but will later recalculate the NAV for the impacted Fund based upon the valuation inputs from these alternative verifiable sources (Level 2 or Level 3) and will report such NAV in its applicable financial statements and reports.
On September 30, 2023 and December 31, 2022, in the opinion of the Trust and the Fund, the reported value of the Sugar Futures Contracts traded on the ICE fairly reflected the value of the Sugar Futures Contracts held by the Fund, and no adjustments were necessary. The determination is made as of the settlement of the futures contracts on the last day of trading for the reporting period. In making the determination of a Level 1 or Level 2 transfer, the Fund considers the average volume of the specific underlying futures contracts traded on the relevant exchange for the periods being reported.
For the three and nine months ended September 30, 2023 and year ended December 31, 2022, the Fund did not have any significant transfers between any of the levels of the fair value hierarchy.
The Fund records its derivative activities at fair value. Gains and losses from derivative contracts are included in the statements of operations. Derivative contracts include futures contracts related to commodity prices. Futures, which are listed on a national securities exchange, such as the CBOT and the ICE, or reported on another national market, are generally categorized in Level 1 of the fair value hierarchy. OTC derivatives contracts (such as forward and swap contracts) which may be valued using models, depending on whether significant inputs are observable or unobservable, are categorized in Levels 2 or 3 of the fair value hierarchy.
Expenses
Expenses are recorded using the accrual method of accounting.
Net Income (Loss) per Share
Net income (loss) per share is the difference between the NAV per unit at the beginning of each period and at the end of each period. The weighted average number of units outstanding was computed for purposes of disclosing net income (loss) per weighted average unit. The weighted average units are equal to the number of units outstanding at the end of the period, adjusted proportionately for units created or redeemed based on the amount of time the units were outstanding during such period.
New Accounting Pronouncements
The Financial Accounting Standards Board (“FASB”) issued Accounting Standards Update (“ASU”) issued ASU 2023-01, related to Leases – (Topic 842). The response to concerns about applying Topic 842 to related party arrangements between entities under common control. The update was adopted early for the quarter ended March 31, 2023; the adoption did not have a material impact on the financial statements and disclosures of the Trust or the Fund.
The FASB issued ASU 2022-03, related to fair value measurement (Topic 820) of equity securities subject to contractual sale restrictions. Under the clarified guidance, contractual restrictions on the sale of an equity security are not considered part of the unit of account of the equity security and, therefore, are not considered in measuring fair value, however they do require disclosures. The amendment was adopted for the quarter ended June 30, 2022; the adoption did not have a material impact on the financial statements and disclosures of the Trust or the Fund.
Note 4 – Fair Value Measurements
The Fund’s assets and liabilities recorded at fair value have been categorized based upon a fair value hierarchy as described in the Fund’s significant accounting policies in Note 3. The following table presents information about the Fund’s assets and liabilities measured at fair value as of September 30, 2023 and December 31, 2022:
September 30, 2023
| Balance as of | ||||||||||||||||
| Assets: | Level 1 | Level 2 | Level 3 | September 30, 2023 | ||||||||||||
| Cash Equivalents | $ | $ | $ | $ | ||||||||||||
| Commodity Futures Contracts | ||||||||||||||||
| Sugar futures contracts | ||||||||||||||||
| Total | $ | $ | $ | $ | ||||||||||||
| Balance as of | ||||||||||||||||
| Liabilities | Level 1 | Level 2 | Level 3 | September 30, 2023 | ||||||||||||
| Commodity Futures Contracts | ||||||||||||||||
| Sugar futures contracts | $ | $ | $ | $ | ||||||||||||
December 31, 2022
| Balance as of | ||||||||||||||||
| Assets: | Level 1 | Level 2 | Level 3 | December 31, 2022 | ||||||||||||
| Cash Equivalents | $ | $ | $ | $ | ||||||||||||
| Sugar futures contracts | ||||||||||||||||
| Total | $ | $ | $ | $ | ||||||||||||
| Balance as of | ||||||||||||||||
| Liabilities | Level 1 | Level 2 | Level 3 | December 31, 2022 | ||||||||||||
| Sugar futures contracts | $ | $ | $ | $ | ||||||||||||
For the three and nine months ended September 30, 2023 and year ended December 31, 2022, the Fund did not have any significant transfers between any of the levels of the fair value hierarchy.
See the Fair Value – Definition and Hierarchy section in Note 3 above for an explanation of the transfers into and out of each level of the fair value hierarchy.
Note 5 – Derivative Instruments and Hedging Activities
In the normal course of business, the Fund utilizes derivative contracts in connection with its proprietary trading activities. Investments in derivative contracts are subject to additional risks that can result in a loss of all or part of an investment. The Fund’s derivative activities and exposure to derivative contracts are classified by the following primary underlying risks: interest rate, credit, commodity price, and equity price risks. In addition to its primary underlying risks, the Fund is also subject to additional counterparty risk due to inability of its counterparties to meet the terms of their contracts. For the three and nine months ended September 30, 2023 and year ended December 31, 2022, the Fund invested only in commodity futures contracts.
Futures Contracts
The Fund is subject to commodity price risk in the normal course of pursuing its investment objectives. A futures contract represents a commitment for the future purchase or sale of an asset at a specified price on a specified date.
The purchase and sale of futures contracts requires margin deposits with an FCM. Subsequent payments (variation margin) are made or received by the Fund each day, depending on the daily fluctuations in the value of the contract, and are recorded as unrealized gains or losses by the Fund. Futures contracts may reduce the Fund’s exposure to counterparty risk since futures contracts are exchange-traded; and the exchange’s clearinghouse, as the counterparty to all exchange-traded futures, guarantees the futures against default.
The Commodity Exchange Act requires an FCM to segregate all customer transactions and assets from the FCM’s proprietary activities. A customer’s cash and other equity deposited with an FCM are considered commingled with all other customer funds subject to the FCM’s segregation requirements. In the event of an FCM’s insolvency, recovery may be limited to the Fund’s pro rata share of segregated customer funds available. It is possible that the recovery amount could be less than the total of cash and other equity deposited.
The following table discloses information about offsetting assets and liabilities presented in the statements of assets and liabilities to enable users of these financial statements to evaluate the effect or potential effect of netting arrangements for recognized assets and liabilities. These recognized assets and liabilities are presented as defined in FASB ASU No. 2011-11 “Balance Sheet (Topic 210): Disclosures about Offsetting Assets and Liabilities” and subsequently clarified in FASB ASU 2013-01 “Balance Sheet (Topic 210): Clarifying the Scope of Disclosures about Offsetting Assets and Liabilities.”
The following table also identifies the fair value amounts of derivative instruments included in the statements of assets and liabilities as derivative contracts, categorized by primary underlying risk, and held by the FCMs, Marex and StoneX as of September 30, 2023, and December 31, 2022.
*The amount of collateral presented in Collateral, Due from Broker, is limited to the liability for the futures contracts and accordingly does not include the excess collateral pledged.
Offsetting of Financial Assets and Derivative Assets as of September 30, 2023
| (i) | (ii) | (iii) = (i)-(ii) | (iv) | (v)=(iii)-(iv) | ||||||||||||||||||||
| Gross Amount Not Offset in the Statement of Assets and Liabilities | ||||||||||||||||||||||||
| Description | Gross Amount of Recognized Assets | Gross Amount Offset in the Statement of Assets and Liabilities | Net Amount Presented in the Statement of Assets and Liabilities | Futures Contracts Available for Offset | Collateral, Due to Broker | Net Amount | ||||||||||||||||||
| Commodity Price | ||||||||||||||||||||||||
| Sugar futures contracts | $ | $ | $ | $ | $ | $ | ||||||||||||||||||
Offsetting of Financial Liabilities and Derivative Liabilities as of September 30, 2023
| (i) | (ii) | (iii) = (i)-(ii) | (iv) | (v)=(iii)-(iv) | ||||||||||||||||||||
| Gross Amount Not Offset in the Statement of Assets and Liabilities | ||||||||||||||||||||||||
| Description | Gross Amount of Recognized Liabilities | Gross Amount Offset in the Statement of Assets and Liabilities | Net Amount Presented in the Statement of Assets and Liabilities | Futures Contracts Available for Offset | Collateral, Due from Broker* | Net Amount | ||||||||||||||||||
| Commodity Price | ||||||||||||||||||||||||
| Sugar futures contracts | $ | $ | $ | $ | $ | $ | ||||||||||||||||||
Offsetting of Financial Assets and Derivative Assets as of December 31, 2022
| (i) | (ii) | (iii) = (i)-(ii) | (iv) | (v)=(iii)-(iv) | ||||||||||||||||||||
| Gross Amount Not Offset in the Statement of Assets and Liabilities | ||||||||||||||||||||||||
| Description | Gross Amount of Recognized Assets | Gross Amount Offset in the Statement of Assets and Liabilities | Net Amount Presented in the Statement of Assets and Liabilities | Futures Contracts Available for Offset | Collateral, Due to Broker | Net Amount | ||||||||||||||||||
| Commodity Price | ||||||||||||||||||||||||
| Sugar futures contracts | $ | $ | $ | $ | $ | $ | ||||||||||||||||||
Offsetting of Financial Liabilities and Derivative Liabilities as of December 31, 2022
| (i) | (ii) | (iii) = (i)-(ii) | (iv) | (v)=(iii)-(iv) | ||||||||||||||||||||
| Gross Amount Not Offset in the Statement of Assets and Liabilities | ||||||||||||||||||||||||
| Description | Gross Amount of Recognized Liabilities | Gross Amount Offset in the Statement of Assets and Liabilities | Net Amount Presented in the Statement of Assets and Liabilities | Futures Contracts Available for Offset | Collateral, Due from Broker* | Net Amount | ||||||||||||||||||
| Commodity Price | ||||||||||||||||||||||||
| Sugar futures contracts | $ | $ | $ | $ | $ | $ | ||||||||||||||||||
The following tables identify the net gain and loss amounts included in the statements of operations as realized and unrealized gains and losses on trading of commodity futures contracts categorized by primary underlying risk:
Three months ended September 30, 2023
| Realized Gain on Commodity Futures Contracts | Net Change in Unrealized Appreciation on Commodity Futures Contracts | |||||||
| Commodity Price | ||||||||
| Sugar futures contracts | $ | $ | ||||||
Three months ended September 30, 2022
| Realized Loss on Commodity Futures Contracts | Net Change in Unrealized Depreciation on Commodity Futures Contracts | |||||||
| Commodity Price | ||||||||
| Sugar futures contracts | $ | ( | ) | $ | ( | ) | ||
Nine months ended September 30, 2023
| Realized Gain on Commodity Futures Contracts | Net Change in Unrealized Appreciation on Commodity Futures Contracts | |||||||
| Commodity Price | ||||||||
| Sugar futures contracts | $ | $ | ||||||
Nine months ended September 30, 2022
| Realized Loss on Commodity Futures Contracts | Net Change in Unrealized Depreciation on Commodity Futures Contracts | |||||||
| Commodity Price | ||||||||
| Sugar futures contracts | $ | ( | ) | $ | ( | ) | ||
Volume of Derivative Activities
The average notional market value categorized by primary underlying risk for all futures contracts held were $
Note 6 – Financial Highlights
The following table presents per unit performance data and other supplemental financial data for the three and nine months ended September 30, 2023 and 2022. This information has been derived from information presented in the financial statements and is presented with total expenses gross of expenses waived by the Sponsor and with total expenses net of expenses waived by the Sponsor, as appropriate.
| Three months ended | Three months ended | Nine months ended | Nine months ended | |||||||||||||
| September 30, 2023 | September 30, 2022 | September 30, 2023 | September 30, 2022 | |||||||||||||
| Per Share Operation Performance | ||||||||||||||||
| Net asset value at beginning of period | $ | $ | $ | $ | ||||||||||||
| Income (loss) from investment operations: | ||||||||||||||||
| Investment income | ||||||||||||||||
| Net realized and unrealized gain (loss) on commodity futures contracts | ( | ) | ( | ) | ||||||||||||
| Total expenses, net | ( | ) | ( | ) | ( | ) | ( | ) | ||||||||
| Net increase (decrease) in net asset value | ( | ) | ( | ) | ||||||||||||
| Net asset value at end of period | $ | $ | $ | $ | ||||||||||||
| Total Return | % | - | % | % | - | % | ||||||||||
| Ratios to Average Net Assets (Annualized) | ||||||||||||||||
| Total expenses | % | % | % | % | ||||||||||||
| Total expenses, net | % | % | % | % | ||||||||||||
| Net investment income (loss) | % | % | % | - | % | |||||||||||
The financial highlights per share data are calculated consistent with the methodology used to calculate asset-based fees and expenses.
Note 7 – Organizational and Offering Costs
Expenses incurred in organizing of the Trust and the initial offering of the Shares of the Fund, including applicable SEC registration fees, were borne directly by the Sponsor. The Fund will not be obligated to reimburse the Sponsor.
Note 8 – Subsequent Events
Management has evaluated the financial statements for the quarter-ended September 30, 2023 for subsequent events through the date of this filing and noted no material events requiring either recognition through the date of the filing or disclosure herein for the Fund.
STATEMENTS OF ASSETS AND LIABILITIES
| September 30, 2023 | December 31, 2022 | |||||||
| (Unaudited) | ||||||||
| Assets | ||||||||
| Cash and cash equivalents | $ | $ | ||||||
| Interest receivable | ||||||||
| Other assets | ||||||||
| Equity in trading accounts: | ||||||||
| Commodity futures contracts | ||||||||
| Due from broker | ||||||||
| Total equity in trading accounts | ||||||||
| Total assets | ||||||||
| Liabilities | ||||||||
| Payable for shares redeemed | ||||||||
| Management fee payable to Sponsor | ||||||||
| Other liabilities | ||||||||
| Equity in trading accounts: | ||||||||
| Commodity futures contracts | ||||||||
| Total liabilities | ||||||||
| Net assets | $ | $ | ||||||
| Shares outstanding | ||||||||
| Shares authorized | * | * | ||||||
| Net asset value per share | $ | $ | ||||||
| Market value per share | $ | $ | ||||||
* On March 9, 2022, the Teucrium Wheat Fund registered an indeterminate number of shares of the Fund pursuant to Rule 456(d) under the Securities Act of 1933.
The accompanying notes are an integral part of these financial statements.
SCHEDULE OF INVESTMENTS
September 30, 2023
(Unaudited)
| Percentage of | ||||||||||||||||||||
| Description: Assets | Yield | Cost | Fair Value | Net Assets | Shares | |||||||||||||||
| Cash equivalents | ||||||||||||||||||||
| Money market funds | ||||||||||||||||||||
| U.S. Bank Deposit Account | % | $ | $ | % | ||||||||||||||||
| Goldman Sachs Financial Square Government Fund - Institutional Class | % | |||||||||||||||||||
| Total money market funds | $ | $ | % | |||||||||||||||||
| Maturity | Percentage of | Principal | |||||||||||||||||||
| Date | Yield | Cost | Fair Value | Net Assets | Amount | ||||||||||||||||
| Commercial Paper | |||||||||||||||||||||
| Brookfield Infrastructure Holdings (Canada) Inc. | | % | $ | $ | % | ||||||||||||||||
| Brookfield Infrastructure Holdings (Canada) Inc. | | % | |||||||||||||||||||
| Brookfield Infrastructure Holdings (Canada) Inc. | | % | |||||||||||||||||||
| General Motors Financial Company, Inc. | | % | |||||||||||||||||||
| General Motors Financial Company, Inc. | | % | |||||||||||||||||||
| General Motors Financial Company, Inc. | | % | |||||||||||||||||||
| Glencore Funding LLC | | % | |||||||||||||||||||
| Harley-Davidson Financial Services, Inc. | | % | |||||||||||||||||||
| Harley-Davidson Financial Services, Inc. | | % | |||||||||||||||||||
| Harley-Davidson Financial Services, Inc. | | % | |||||||||||||||||||
| Hyundai Capital America | | % | |||||||||||||||||||
| Jabil Inc. | | % | |||||||||||||||||||
| Jabil Inc. | | % | |||||||||||||||||||
| Marriott International, Inc. | | % | |||||||||||||||||||
| National Fuel Gas Company | | % | |||||||||||||||||||
| National Fuel Gas Company | | % | |||||||||||||||||||
| V.F. Corporation | | % | |||||||||||||||||||
| V.F. Corporation | | % | |||||||||||||||||||
| Walgreens Boots Alliance, Inc. | | % | |||||||||||||||||||
| Total Commercial Paper | $ | $ | % | ||||||||||||||||||
| Total Cash Equivalents | $ | % | |||||||||||||||||||
| Number of | Percentage of | Notional Amount | ||||||||||||||
| Description: Liabilities | Contracts | Fair Value | Net Assets | (Long Exposure) | ||||||||||||
| Commodity futures contracts | ||||||||||||||||
| United States wheat futures contracts | ||||||||||||||||
| CBOT wheat futures MAR24 | $ | % | $ | |||||||||||||
| CBOT wheat futures MAY24 | ||||||||||||||||
| CBOT wheat futures DEC24 | ||||||||||||||||
| Total commodity futures contracts | $ | % | $ | |||||||||||||
The accompanying notes are an integral part of these financial statements.
TEUCRIUM WHEAT FUND
SCHEDULE OF INVESTMENTS
December 31, 2022
| Percentage of | ||||||||||||||||||||
| Description: Assets | Yield | Cost | Fair Value | Net Assets | Shares | |||||||||||||||
| Cash equivalents | ||||||||||||||||||||
| Money market funds | ||||||||||||||||||||
| First American Government Obligations Fund - Class X | % | $ | $ | % | ||||||||||||||||
| Goldman Sachs Financial Square Government Fund - Institutional Class | % | |||||||||||||||||||
| Total money market funds | $ | $ | % | |||||||||||||||||
| Maturity | Percentage of | Principal | |||||||||||||||||||
| Date | Yield | Cost | Fair Value | Net Assets | Amount | ||||||||||||||||
| Commercial Paper | |||||||||||||||||||||
| American Electric Power Company, Inc. | | % | $ | $ | % | ||||||||||||||||
| Brookfield Infrastructure Holdings (Canada) Inc. | | % | |||||||||||||||||||
| CNH Industrial Capital LLC | | % | |||||||||||||||||||
| CNH Industrial Capital LLC | | % | |||||||||||||||||||
| Crown Castle Inc. | | % | |||||||||||||||||||
| Crown Castle Inc. | | % | |||||||||||||||||||
| Entergy Corporation | | % | |||||||||||||||||||
| General Motors Financial Company, Inc. | | % | |||||||||||||||||||
| General Motors Financial Company, Inc. | | % | |||||||||||||||||||
| Glencore Funding LLC | | % | |||||||||||||||||||
| Glencore Funding LLC | | % | |||||||||||||||||||
| Harley-Davidson Financial Services, Inc. | | % | |||||||||||||||||||
| Harley-Davidson Financial Services, Inc. | | % | |||||||||||||||||||
| Humana Inc. | | % | |||||||||||||||||||
| Hyundai Capital America | | % | |||||||||||||||||||
| ITT Inc. | | % | |||||||||||||||||||
| Oracle Corporation | | % | |||||||||||||||||||
| Oracle Corporation | | % | |||||||||||||||||||
| V.F. Corporation | | % | |||||||||||||||||||
| V.F. Corporation | | % | |||||||||||||||||||
| VW Credit, Inc. | | % | |||||||||||||||||||
| Walgreens Boots Alliance, Inc. | | % | |||||||||||||||||||
| Walgreens Boots Alliance, Inc. | | % | |||||||||||||||||||
| Total Commercial Paper | $ | $ | % | ||||||||||||||||||
| Total Cash Equivalents | $ | % | |||||||||||||||||||
| Number of | Percentage of | Notional Amount | ||||||||||||||
| Contracts | Fair Value | Net Assets | (Long Exposure) | |||||||||||||
| Commodity futures contracts | ||||||||||||||||
| United States wheat futures contracts | ||||||||||||||||
| CBOT wheat futures JUL23 | $ | % | $ | |||||||||||||
| Number of | Percentage of | Notional Amount | ||||||||||||||
| Description: Liabilities | Contracts | Fair Value | Net Assets | (Long Exposure) | ||||||||||||
| Commodity futures contracts | ||||||||||||||||
| United States wheat futures contracts | ||||||||||||||||
| CBOT wheat futures MAY23 | $ | % | $ | |||||||||||||
| CBOT wheat futures DEC23 | ||||||||||||||||
| Total commodity futures contracts | $ | % | $ | |||||||||||||
The accompanying notes are an integral part of these financial statements.
STATEMENTS OF OPERATIONS
(Unaudited)
| Three months ended | Three months ended | Nine months ended | Nine months ended | |||||||||||||
| September 30, 2023 | September 30, 2022 | September 30, 2023 | September 30, 2022 | |||||||||||||
| Income | ||||||||||||||||
| Realized and unrealized gain (loss) on trading of commodity futures contracts: | ||||||||||||||||
| Realized loss on commodity futures contracts | $ | ( | ) | $ | ( | ) | $ | ( | ) | $ | ( | ) | ||||
| Net change in unrealized appreciation (depreciation) on commodity futures contracts | ( | ) | ||||||||||||||
| Interest income | ||||||||||||||||
| Total (loss) gain | ( | ) | ( | ) | ( | ) | ||||||||||
| Expenses | ||||||||||||||||
| Management fees | ||||||||||||||||
| Professional fees | ||||||||||||||||
| Distribution and marketing fees | ||||||||||||||||
| Custodian fees and expenses | ||||||||||||||||
| Business permits and licenses fees | ||||||||||||||||
| General and administrative expenses | ||||||||||||||||
| Total expenses | ||||||||||||||||
| Expenses waived by the Sponsor | ( | ) | ||||||||||||||
| Total expenses, net | ||||||||||||||||
| Net (loss) income | $ | ( | ) | $ | $ | ( | ) | $ | ( | ) | ||||||
| Net (loss) gain per share | $ | ( | ) | $ | $ | ( | ) | $ | ||||||||
| Net (loss) gain per weighted average share | $ | ( | ) | $ | $ | ( | ) | $ | ( | ) | ||||||
| Weighted average shares outstanding | ||||||||||||||||
The accompanying notes are an integral part of these financial statements.
STATEMENTS OF CHANGES IN NET ASSETS
(Unaudited)
| Nine months ended | Nine months ended | |||||||
| September 30, 2023 | September 30, 2022 | |||||||
| Operations | ||||||||
| Net loss | $ | ( | ) | $ | ( | ) | ||
| Capital transactions | ||||||||
| Issuance of Shares | ||||||||
| Redemption of Shares | ( | ) | ( | ) | ||||
| Total capital transactions | ||||||||
| Net change in net assets | ( | ) | ||||||
| Net assets, beginning of period | $ | $ | ||||||
| Net assets, end of period | $ | $ | ||||||
| Net asset value per share at beginning of period | $ | $ | ||||||
| Net asset value per share at end of period | $ | $ | ||||||
| Creation of Shares | ||||||||
| Redemption of Shares | ||||||||
The accompanying notes are an integral part of these financial statements.
STATEMENTS OF CASH FLOWS
(Unaudited)
| Nine months ended | Nine months ended | |||||||
| September 30, 2023 | September 30, 2022 | |||||||
| Cash flows from operating activities: | ||||||||
| Net loss | $ | ( | ) | $ | ( | ) | ||
| Adjustments to reconcile net loss to net cash used in operating activities: | ||||||||
| Net change in unrealized (appreciation) depreciation on commodity futures contracts | ( | ) | ||||||
| Changes in operating assets and liabilities: | ||||||||
| Due from broker | ( | ) | ||||||
| Interest receivable | ( | ) | ( | ) | ||||
| Other assets | ( | ) | ||||||
| Due to broker | ( | ) | ||||||
| Management fee payable to Sponsor | ( | ) | ||||||
| Other liabilities | ||||||||
| Net cash used in operating activities | ( | ) | ( | ) | ||||
| Cash flows from financing activities: | ||||||||
| Proceeds from sale of Shares | ||||||||
| Redemption of Shares | ( | ) | ( | ) | ||||
| Net cash provided by financing activities | ||||||||
| Net change in cash and cash equivalents | ( | ) | ||||||
| Cash and cash equivalents, beginning of period | ||||||||
| Cash and cash equivalents, end of period | $ | $ | ||||||
The accompanying notes are an integral part of these financial statements.
September 30, 2023
(Unaudited)
Note 1 – Organization and Operation
Teucrium Wheat Fund (referred to herein as “WEAT” or the “Fund”) is a commodity pool that is a series of Teucrium Commodity Trust (“Trust”), a Delaware statutory trust formed on September 11, 2009. The Fund issues common units, called the “Shares,” representing fractional undivided beneficial interests in the Fund. The Fund continuously offers Creation Baskets consisting of
The investment objective of WEAT is to have the daily changes in the NAV of the Fund’s Shares reflect the daily changes in the wheat market for future delivery as measured by the Benchmark. The Benchmark is a weighted average of the closing settlement prices for futures contracts for wheat (“Wheat Futures Contracts”) that are traded on the Chicago Board of Trade (“CBOT”):
WEAT Benchmark
| CBOT Wheat Futures Contract | Weighting | |||
| Second to expire | % | |||
| Third to expire | % | |||
| December following the third to expire | % | |||
The Fund commenced investment operations on September 19, 2011 and has a fiscal year ending December 31. The Fund’s sponsor is Teucrium Trading, LLC (the “Sponsor”). The Sponsor is responsible for the management of the Fund. The Sponsor is registered as a commodity pool operator (“CPO”) and a commodity trading adviser (“CTA”) with the Commodity Futures Trading Commission (“CFTC”) and is a member of the National Futures Association (“NFA”).
On June 13, 2011, the Fund’s initial registration of
The accompanying unaudited financial statements have been prepared in accordance with Rule 10-01 of Regulation S-X promulgated by the SEC and, therefore, do not include all information and footnote disclosures required under accounting principles generally accepted in the United States of America (“GAAP”). The financial information included herein is unaudited; however, such financial information reflects all adjustments which are, in the opinion of management, necessary for the fair presentation of the Fund’s financial statements for the interim period. It is suggested that these interim financial statements be read in conjunction with the financial statements and related notes included in the Trust’s Annual Report on Form 10-K, as well as the most recent Form S-1 filing, as applicable. The operating results for the three and nine months ended September 30, 2023 are not necessarily indicative of the results to be expected for the full year ending December 31, 2023.
Subject to the terms of the Trust Agreement, Teucrium Trading, LLC, in its capacity as the Sponsor (“Sponsor”), may terminate a Fund at any time, regardless of whether the Fund has incurred losses, including, for instance, if it determines that the Fund’s aggregate net assets in relation to its operating expenses make the continued operation of the Fund unreasonable or imprudent. However, no level of losses will require the Sponsor to terminate a Fund.
Note 2 – Principal Contracts and Agreements
The Sponsor employs U.S. Bancorp Fund Services, LLC, doing business as U.S. Bank Global Fund Services (“Global Fund Services”), for Transfer Agency, Fund Accounting and Fund Administration services. The principal address for Global Fund Services is 615 E. Michigan Street, Milwaukee, WI 53202.
For custody services, the Funds will pay to U.S. Bank N.A.
The Sponsor employs Foreside Fund Services, LLC (“Foreside” or the “Distributor”) as the Distributor for the Funds. The Distribution Services Agreement among the Distributor and the Sponsor calls for the Distributor to work with the Custodian in connection with the receipt and processing of orders for Creation Baskets and Redemption Baskets and the review and approval of all Fund sales literature and advertising materials. The Distributor and the Sponsor have also entered into a Securities Activities and Service Agreement (the “SASA”) under which certain employees and officers of the Sponsor are licensed as registered representatives or registered principals of the Distributor, under Financial Industry Regulatory Authority (“FINRA”) rules. For its services as the Distributor, Foreside receives a fee of
Marex Capital Markets, Inc. (“Marex”) and StoneX Financial Inc. (“StoneX”) serve as the Funds’ clearing brokers to execute and clear futures contracts and provide other brokerage-related services. Marex and StoneX are each registered as futures commission merchants (“FCM”) with the U.S. CFTC and are members of the NFA. The clearing brokers are registered as broker-dealers with the SEC and are each a member of FINRA. Marex and StoneX are each clearing members of ICE Futures U.S., Inc., Chicago Board of Trade, Chicago Mercantile Exchange, New York Mercantile Exchange, and all other major United States commodity exchanges. For Corn, Soybean, Sugar, and Wheat Futures Contracts Marex is paid $
The sole Trustee of the Trust is Wilmington Trust Company, a Delaware banking corporation. The Trustee will accept service of legal process on the Trust in the State of Delaware and will make certain filings under the Delaware Statutory Trust Act. For its services, the Trustee receives an annual fee of $
The Sponsor employs Thales Capital Partners LLC (“Thales”) for distribution and solicitation-related services. Thales is registered as a broker-dealer with the SEC and a member of FINRA and the Securities Investor Protection Corporation (“SIPC”). Thales receives a quarterly fee of the higher of $
| Three months ended September 30, 2023 | Three months ended September 30, 2022 | Nine months ended September 30, 2023 | Nine months ended September 30, 2022 | |||||||||||||
| Amount Recognized for Custody Services | $ | $ | $ | $ | ||||||||||||
| Amount of Custody Services Waived | $ | $ | $ | $ | ||||||||||||
| Amount Recognized for Distribution Services | $ | $ | $ | $ | ||||||||||||
| Amount of Distribution Services Waived | $ | $ | $ | $ | ||||||||||||
| Amount Recognized for Wilmington Trust | $ | $ | $ | $ | ||||||||||||
| Amount of Wilmington Trust Waived | $ | $ | $ | $ | ||||||||||||
| Amount Recognized for Thales | $ | $ | $ | $ | ||||||||||||
| Amount of Thales Waived | $ | $ | $ | $ | ||||||||||||
Note 3 – Summary of Significant Accounting Policies
Basis of Presentation
The accompanying financial statements have been prepared in accordance with accounting principles generally accepted in the United States of America (“U.S. GAAP”) as detailed in the Financial Accounting Standards Board’s Accounting Standards Codification.
Revenue Recognition
Commodity futures contracts are recorded on the trade date. All such transactions are recorded on the identified cost basis and marked to market daily. Unrealized appreciation or depreciation on commodity futures contracts are reflected in the statements of operations as the difference between the original contract amount and the fair market value as of the last business day of the year or as of the last date of the financial statements. Changes in the appreciation or depreciation between periods are reflected in the statements of operations. Interest on cash equivalents with financial institutions are recognized on an accrual basis. The Fund seeks to earn interest on funds held at the custodian and other financial institutions at prevailing market rates for such investments.
The Sponsor invests a portion of cash in commercial paper, which is deemed a cash equivalent based on the rating and duration of contracts as described in the notes to the financial statements and reflected in cash and cash equivalents on the statements of assets and liabilities and on the statements of cash flows. Accretion on these investments is recognized using the effective interest method in U.S. dollars and included in interest income on the statements of operations.
The Sponsor invests a portion of the cash held by the broker in short term Treasury Bills as collateral for open futures contracts. Accretion on these investments is recognized using the effective interest method in U.S. dollars and included in interest income on the statements of operations.
Brokerage Commissions
The Sponsor recognizes the expense for brokerage commissions for futures contract trades on a per-trade basis. The below table shows the amounts included on the statements of operations as total brokerage commissions paid inclusive of unrealized loss for the three and nine months ended September 30, 2023 and 2022.
| WEAT | ||||
| Three months ended September 30, 2023 | $ | |||
| Three months ended September 30, 2022 | $ | |||
| Nine months ended September 30, 2023 | $ | |||
| Nine months ended September 30, 2022 | $ | |||
Income Taxes
For federal income tax purposes, the Fund will be treated as a publicly traded partnership. A publicly traded partnership is generally treated as a corporation for federal income tax purposes unless 90% or more of the publicly traded partnership’s gross income for each taxable year of its existence consists of qualifying income as defined in section 7704(d) of the Internal Revenue Code of 1986, as amended. Qualifying income is defined as generally including, in pertinent part, interest (other than from a financial business), dividends, and gains from the sale or disposition of capital assets held for the production of interest or dividends. In the case of a partnership of which a principal activity is the buying and selling of commodities, other than as inventory, or of futures, forwards and options with respect to commodities, qualifying income also includes income and gains from commodities and from futures, forwards, options with respect to commodities and, provided the partnership is a trader or investor with respect to such assets, swaps and other notional principal contracts with respect to commodities. The Fund expects that at least 90% of the Fund’s gross income for each taxable year will consist of qualifying income and that the Fund will be taxed as a partnership for federal income tax purposes. The Fund does not record a provision for income taxes because the shareholders report their share of the Fund’s income or loss on their income tax returns. The financial statements reflect the Fund’s transactions without adjustment, if any, required for income tax purposes.
The Fund is required to determine whether a tax position is more likely than not to be sustained upon examination by the applicable taxing authority, including resolution of any related appeals or litigation processes, based on the technical merits of the position. The Fund files an income tax return in the U.S. federal jurisdiction and may file income tax returns in various U.S. states and foreign jurisdictions. For all tax years to 2022, the Fund remains subject to income tax examinations by major taxing authorities. The tax benefit recognized is measured as the largest amount of benefit that has a greater than fifty percent likelihood of being realized upon ultimate settlement. De-recognition of a tax benefit previously recognized results in the Fund recording a tax liability that reduces net assets. Based on its analysis, the Fund has determined that it has incurred any liability for unrecognized tax benefits as of September 30, 2023 and for the years ended December 31, 2022, 2021 and 2020. However, the Fund’s conclusions regarding this policy may be subject to review and adjustment at a later date based on factors including, but not limited to, ongoing analysis of and changes to tax laws, regulations, and interpretations thereof.
The Fund recognizes interest accrued related to unrecognized tax benefits and penalties related to unrecognized tax benefits in income tax fees payable, if assessed.
The Fund may be subject to potential examination by U.S. federal, U.S. state, or foreign jurisdictional authorities in the area of income taxes. These potential examinations may include questioning the timing and amount of deductions, the nexus of income among various tax jurisdictions, and compliance with U.S. federal, U.S. state and foreign tax laws.
Creations and Redemptions
Authorized Purchasers may purchase Creation Baskets consisting of
Authorized Purchasers may redeem shares from the Fund only in blocks of
The Fund receives or pays the proceeds from shares sold or redeemed within three business days after the trade date of the purchase or redemption. The amounts due from Authorized Purchasers are reflected in the Fund’s statements of assets and liabilities as capital shares receivable. Amounts payable to Authorized Purchasers upon redemption are reflected in the Fund’s statements of assets and liabilities as payable for shares redeemed.
As outlined in the most recent Form S-1 filing,
Allocation of Shareholder Income and Losses
Profit or loss is allocated among the shareholders of the Fund in proportion to the number of shares each shareholder holds as of the close of each month.
Cash and Cash Equivalents
Cash equivalents are highly liquid investments with maturity dates of 90 days or less when acquired. The Trust reported its cash equivalents in the statements of assets and liabilities at market value, or at carrying amounts that approximate fair value, because of their highly liquid nature and short-term maturities. Each Fund that is a series of the Trust has the balance of its cash equivalents on deposit with financial institutions. The Fund holds a balance in money market funds that is included in cash and cash equivalents on the statements of assets and liabilities. The Sponsor invests a portion of the available cash for the Funds in alternative demand deposit savings accounts, which is classified as cash and not as cash equivalents. Assets deposited with the bank may, at times, exceed federally insured limits. The Sponsor invests a portion of the available cash for the Funds in investment grade commercial paper with durations of 90 days or less, which is classified as a cash equivalent and is not FDIC insured. The Sponsor may invest a portion of the cash held by the broker in short term Treasury Bills as collateral for open futures contracts, which is classified as a cash equivalent and is not FDIC insured.
| September 30, 2023 | December 31, 2022 | |||||||
| Money Market Funds | $ | $ | ||||||
| Demand Deposit Savings Accounts | ||||||||
| Commercial Paper | ||||||||
| Total cash and cash equivalents as presented on the Statement of Assets and Liabilities | $ | $ | ||||||
Payable for Purchases of Commercial Paper
The amount recorded by the Fund for commercial paper transactions awaiting settlement, represents the amount payable for contracts purchased but not yet settled as of the reporting date. The value of the contract is included in cash and cash equivalents, and the payable amount is included as a liability.
Due from/to Broker
The amount recorded by the Fund for the amount due from and to the clearing broker includes, but is not limited to, cash held by the broker, amounts payable to the clearing broker related to open transactions, payables for commodities futures accounts liquidating to an equity balance on the clearing broker’s records and amounts of brokerage commissions paid and recognized as unrealized losses.
Margin is the minimum amount of funds that must be deposited by a commodity interest trader with the trader’s broker to initiate and maintain an open position in futures contracts. A margin deposit acts to assure the trader’s performance of the futures contracts purchased or sold. Futures contracts are customarily bought and sold on initial margin that represents a small percentage of the aggregate purchase or sales price of the contract. Because of such low margin requirements, price fluctuations occurring in the futures markets may create profits and losses that, in relation to the amount invested, are greater than customary in other forms of investment or speculation. As discussed below, adverse price changes in the futures contract may result in margin requirements that greatly exceed the initial margin. In addition, the amount of margin required in connection with a particular futures contract is set from time to time by the exchange on which the contract is traded and may be modified from time to time by the exchange during the term of the contract. Brokerage firms, such as the Fund’s clearing brokers, carrying accounts for traders in commodity interest contracts generally require higher amounts of margin as a matter of policy to further protect themselves. Over the counter trading generally involves the extension of credit between counterparties, so the counterparties may agree to require the posting of collateral by one or both parties to address credit exposure.
When a trader purchases an option, there is no margin requirement; however, the option premium must be paid in full. When a trader sells an option, on the other hand, he or she is required to deposit margin in an amount determined by the margin requirements established for the underlying interest and, in addition, an amount substantially equal to the current premium for the option. The margin requirements imposed on the selling of options, although adjusted to reflect the probability that out-of-the-money options will not be exercised, can in fact be higher than those imposed in dealing in the futures markets directly. Complicated margin requirements apply to spreads and conversions, which are complex trading strategies in which a trader acquires a mixture of options positions and positions in the underlying interest.
Ongoing or “maintenance” margin requirements are computed each day by a trader’s clearing broker. When the market value of a particular open futures contract changes to a point where the margin on deposit does not satisfy maintenance margin requirements, a margin call is made by the broker. If the margin call is not met within a reasonable time, the broker may close out the trader’s position. With respect to the Fund’s trading, the Fund (and not its shareholders personally) is subject to margin calls.
Finally, many major U.S. exchanges have passed certain cross margining arrangements involving procedures pursuant to which the futures and options positions held in an account would, in the case of some accounts, be aggregated and margin requirements would be assessed on a portfolio basis, measuring the total risk of the combined positions.
Calculation of Net Asset Value
The Fund’s NAV is calculated by:
| • | Taking the current market value of its total assets and | |
| • | Subtracting any liabilities. |
The administrator, Global Fund Services, calculates the NAV of the Fund once each trading day. It calculates the NAV as of the earlier of the close of the NYSE or 4:00 p.m. (ET). The NAV for a particular trading day is released after 4:15 p.m. (ET).
In determining the value of Wheat Futures Contracts, the administrator uses the CBOT closing price. The administrator determines the value of all other Fund investments as of the earlier of the close of the NYSE or 4:00 p.m. (ET). The value of over-the-counter wheat interests is determined based on the value of the commodity or futures contract underlying such wheat interest, except that a fair value may be determined if the Sponsor believes that the Fund is subject to significant credit risk relating to the counterparty to such wheat interest. For purposes of financial statements and reports, the Sponsor will recalculate the NAV where necessary to reflect the “fair value” of a Futures Contract when the Futures Contract closes at its price fluctuation limit for the day. Short term Treasury securities held by the Fund are valued by the administrator using values received from recognized third-party vendors and dealer quotes. NAV includes any unrealized profit or loss on open wheat interests and any other income or expense accruing to the Fund but unpaid or not received by the Fund.
Sponsor Fee, Allocation of Expenses and Related Party Transactions
The Sponsor is responsible for investing the assets of the Fund in accordance with the objectives and policies of the Fund. In addition, the Sponsor arranges for one or more third parties to provide administrative, custodial, accounting, transfer agency and other necessary services to the Trust and the Funds. In addition, the Sponsor elected not to outsource services directly attributable to the Trust and the Funds such as accounting, financial reporting, regulatory compliance, and trading activities, which the Sponsor performs itself. In addition, the Fund is contractually obligated to pay a monthly management fee to the Sponsor, based on average daily net assets, at a rate equal to
The Fund generally pays for all brokerage fees, taxes, and other expenses, including licensing fees for the use of intellectual property, registration or other fees paid to the SEC, FINRA, or any other regulatory agency in connection with the offer and sale of subsequent Shares after its initial registration and all legal, accounting, printing and other expenses associated therewith. The Fund also pays its portion of the fees and expenses associated with the Trust’s tax accounting and reporting requirements. Certain aggregate expenses common to all Funds within the Trust are allocated by the Sponsor to the respective Fund based on activity drivers deemed most appropriate by the Sponsor for such expenses, including but not limited to relative assets under management and creation order activity. These aggregate common expenses include, but are not limited to, legal, auditing, accounting and financial reporting, tax-preparation, regulatory compliance, trading activities, and insurance costs, as well as fees paid to the Distributor, which are included in the related line item in the statements of operations. A portion of these aggregate common expenses are related to the Sponsor or related parties of principals of the Sponsor; these are necessary services to the Funds, which are primarily the cost of performing accounting and financial reporting, regulatory compliance, and trading activities that are directly attributable to the Fund. Such expenses are primarily recorded as distribution and marketing fees in the financial statements of each Fund.
| Three months ended September 30, 2023 | Three months ended September 30, 2022 | Nine months ended September 30, 2023 | Nine months ended September 30, 2022 | |||||||||||||
| Recognized Related Party Transactions | $ | $ | $ | $ | ||||||||||||
| Waived Related Party Transactions | $ | $ | $ | $ | ||||||||||||
The Sponsor has the ability to elect to pay certain expenses on behalf of the Funds or waive the management fee. This election is subject to change by the Sponsor, at its discretion. Expenses paid by the Sponsor and Management fees waived by the Sponsor are, if applicable, presented as waived expenses in the statements of operations for each Fund. The Sponsor has determined that there will be no recovery sought for the amounts below in any future period:
| WEAT | ||||
| Three months ended September 30, 2023 | $ | |||
| Three months ended September 30, 2022 | $ | |||
| Nine months ended September 30, 2023 | $ | |||
| Nine months ended September 30, 2022 | $ | |||
Use of Estimates
The preparation of financial statements in conformity with U.S. GAAP requires management to make estimates and assumptions that affect the reported amount of assets and liabilities and disclosure of contingent assets and liabilities at the date of the financial statements, and the reported amounts of the revenue and expenses during the reporting period. Actual results could differ from those estimates.
Fair Value - Definition and Hierarchy
In accordance with U.S. GAAP, fair value is defined as the price that would be received to sell an asset or paid to transfer a liability (i.e., the “exit price”) in an orderly transaction between market participants at the measurement date.
In determining fair value, the Fund uses various valuation approaches. In accordance with U.S. GAAP, a fair value hierarchy for inputs is used in measuring fair value that maximizes the use of observable inputs and minimizes the use of unobservable inputs by requiring that the most observable inputs be used when available. Observable inputs are those that market participants would use in pricing the asset or liability based on market data obtained from sources independent of the Fund. Unobservable inputs reflect the Fund’s assumptions about the inputs market participants would use in pricing the asset or liability developed based on the best information available in the circumstances. The fair value hierarchy is categorized into three levels based on the inputs as follows:
Level 1 - Valuations based on unadjusted quoted prices in active markets for identical assets or liabilities that the Fund has the ability to access. Valuation adjustments and block discounts are not applied to Level 1 financial instruments. Since valuations are based on quoted prices that are readily and regularly available in an active market, valuation of these financial instruments does not entail a significant degree of judgment.
Level 2 - Valuations based on quoted prices in markets that are not active or for which all significant inputs are observable, either directly or indirectly.
Level 3 - Valuations based on inputs that are unobservable and significant to the overall fair value measurement.
The availability of valuation techniques and observable inputs can vary from financial instrument to financial instrument and is affected by a wide variety of factors including, the type of financial instrument, whether the financial instrument is new and not yet established in the marketplace, and other characteristics particular to the transaction. To the extent that valuation is based on models or inputs that are less observable or unobservable in the market, the determination of fair value requires more judgment. Those estimated values do not necessarily represent the amounts that may be ultimately realized due to the occurrence of future circumstances that cannot be reasonably determined. Because of the inherent uncertainty of valuation, those estimated values may be materially higher or lower than the values that would have been used had a ready market for the financial instruments existed. Accordingly, the degree of judgment exercised by the Fund in determining fair value is greatest for financial instruments categorized in Level 3. In certain cases, the inputs used to measure fair value may fall into different levels of the fair value hierarchy. In such cases, for disclosure purposes, the level in the fair value hierarchy, within which the fair value measurement in its entirety falls, is determined based on the lowest level input that is significant to the fair value measurement.
Fair value is a market-based measure considered from the perspective of a market participant rather than an entity-specific measure. Therefore, even when market assumptions are not readily available, the Fund’s own assumptions are set to reflect those that market participants would use in pricing the asset or liability at the measurement date. The Fund uses prices and inputs that are current as of the measurement date, including periods of market dislocation. In periods of market dislocation, the observability of prices and inputs may be reduced for many financial instruments. This condition could cause a financial instrument to be reclassified to a lower level within the fair value hierarchy. When such a situation exists on a quarter close, the Sponsor will calculate the NAV on a particular day using the Level 1 valuation but will later recalculate the NAV for the impacted Fund based upon the valuation inputs from these alternative verifiable sources (Level 2 or Level 3) and will report such NAV in its applicable financial statements and reports.
On September 30, 2023 and December 31, 2022, in the opinion of the Trust and the Fund, the reported value of the Wheat Futures Contracts traded on the CBOT fairly reflected the value of the Wheat Futures Contracts held by the Fund, and no adjustments were necessary. The determination is made as of the settlement of the futures contracts on the last day of trading for the reporting period. In making the determination of a Level 1 or Level 2 transfer, the Fund considers the average volume of the specific underlying futures contracts traded on the relevant exchange for the periods being reported.
For the three and nine months ended September 30, 2023 and year ended December 31, 2022, the Fund did not have any significant transfers between any of the levels of the fair value hierarchy.
The Fund records its derivative activities at fair value. Gains and losses from derivative contracts are included in the statements of operations. Derivative contracts include futures contracts related to commodity prices. Futures, which are listed on a national securities exchange, such as the CBOT and the ICE, or reported on another national market, are generally categorized in Level 1 of the fair value hierarchy. OTC derivatives contracts (such as forward and swap contracts) which may be valued using models, depending on whether significant inputs are observable or unobservable, are categorized in Levels 2 or 3 of the fair value hierarchy.
Expenses
Expenses are recorded using the accrual method of accounting.
Net Income (Loss) per Share
Net income (loss) per share is the difference between the NAV per unit at the beginning of each period and at the end of each period. The weighted average number of units outstanding was computed for purposes of disclosing net income (loss) per weighted average unit. The weighted average units are equal to the number of units outstanding at the end of the period, adjusted proportionately for units created or redeemed based on the amount of time the units were outstanding during such period.
New Accounting Pronouncements
The Financial Accounting Standards Board (“FASB”) issued Accounting Standards Update (“ASU”) issued ASU 2023-01, related to Leases – (Topic 842). The response to concerns about applying Topic 842 to related party arrangements between entities under common control. The update was adopted early for the quarter ended March 31, 2023; the adoption did not have a material impact on the financial statements and disclosures of the Trust or the Fund.
The FASB issued ASU 2022-03, related to fair value measurement (Topic 820) of equity securities subject to contractual sale restrictions. Under the clarified guidance, contractual restrictions on the sale of an equity security are not considered part of the unit of account of the equity security and, therefore, are not considered in measuring fair value, however they do require disclosures. The amendment was adopted for the quarter ended June 30, 2022; the adoption did not have a material impact on the financial statements and disclosures of the Trust or the Fund.
Note 4 – Fair Value Measurements
The Fund’s assets and liabilities recorded at fair value have been categorized based upon a fair value hierarchy as described in the Fund’s significant accounting policies in Note 3. The following table presents information about the Fund’s assets and liabilities measured at fair value as of September 30, 2023 and December 31, 2022:
September 30, 2023
| Balance as of | ||||||||||||||||
| Assets: | Level 1 | Level 2 | Level 3 | September 30, 2023 | ||||||||||||
| Cash Equivalents | $ | $ | $ | $ | ||||||||||||
| Balance as of | ||||||||||||||||
| Liabilities | Level 1 | Level 2 | Level 3 | September 30, 2023 | ||||||||||||
| Commodity Futures Contracts | ||||||||||||||||
| Wheat futures contracts | $ | $ | $ | $ | ||||||||||||
December 31, 2022
| Balance as of | ||||||||||||||||
| Assets: | Level 1 | Level 2 | Level 3 | December 31, 2022 | ||||||||||||
| Cash Equivalents | $ | $ | $ | $ | ||||||||||||
| Commodity Futures Contracts | ||||||||||||||||
| Wheat futures contracts | ||||||||||||||||
| Total | $ | $ | $ | $ | ||||||||||||
| Balance as of | ||||||||||||||||
| Liabilities | Level 1 | Level 2 | Level 3 | December 31, 2022 | ||||||||||||
| Wheat futures contracts | $ | $ | $ | $ | ||||||||||||
For the three and nine months ended September 30, 2023 and year ended December 31, 2022, the Fund did not have any significant transfers between any of the levels of the fair value hierarchy.
See the Fair Value - Definition and Hierarchy section in Note 3 above for an explanation of the transfers into and out of each level of the fair value hierarchy.
Note 5 – Derivative Instruments and Hedging Activities
In the normal course of business, the Fund utilizes derivative contracts in connection with its proprietary trading activities. Investments in derivative contracts are subject to additional risks that can result in a loss of all or part of an investment. The Fund’s derivative activities and exposure to derivative contracts are classified by the following primary underlying risks: interest rate, credit, commodity price, and equity price risks. In addition to its primary underlying risks, the Fund is also subject to additional counterparty risk due to inability of its counterparties to meet the terms of their contracts. For the three and nine months ended September 30, 2023 and for the year ended December 31, 2022, the Fund invested only in commodity futures contracts.
Futures Contracts
The Fund is subject to commodity price risk in the normal course of pursuing its investment objectives. A futures contract represents a commitment for the future purchase or sale of an asset at a specified price on a specified date.
The purchase and sale of futures contracts requires margin deposits with a Futures Commission Merchant (“FCM”). Subsequent payments (variation margin) are made or received by the Fund each day, depending on the daily fluctuations in the value of the contract, and are recorded as unrealized gains or losses by the Fund. Futures contracts may reduce the Fund’s exposure to counterparty risk since futures contracts are exchange-traded; and the exchange’s clearinghouse, as the counterparty to all exchange-traded futures, guarantees the futures against default.
The Commodity Exchange Act requires an FCM to segregate all customer transactions and assets from the FCM’s proprietary activities. A customer’s cash and other equity deposited with an FCM are considered commingled with all other customer funds subject to the FCM’s segregation requirements. In the event of an FCM’s insolvency, recovery may be limited to the Fund’s pro rata share of segregated customer funds available. It is possible that the recovery amount could be less than the total of cash and other equity deposited.
The following table discloses information about offsetting assets and liabilities presented in the statements of assets and liabilities to enable users of these financial statements to evaluate the effect or potential effect of netting arrangements for recognized assets and liabilities. These recognized assets and liabilities are presented as defined in the Financial Accounting Standards Board’s (“FASB”) Accounting Standards Update (“ASU”) No. 2011-11 “Balance Sheet (Topic 210): Disclosures about Offsetting Assets and Liabilities” and subsequently clarified in FASB ASU 2013-01 “Balance Sheet (Topic 210): Clarifying the Scope of Disclosures about Offsetting Assets and Liabilities.”
The following table also identifies the fair value amounts of derivative instruments included in the statements of assets and liabilities as derivative contracts, categorized by primary underlying risk, and held by the FCMs, Marex and StoneX as of September 30, 2023 and December 31, 2022.
*The amount of collateral presented in Collateral, Due from Broker, is limited to the liability for the futures contracts and accordingly does not include the excess collateral pledged.
Offsetting of Financial Liabilities and Derivative Liabilities as of September 30, 2023
| (i) | (ii) | (iii) = (i)-(ii) | (iv) | (v)=(iii)-(iv) | ||||||||||||||||||||
| Gross Amount Not Offset in the Statement of Assets and Liabilities | ||||||||||||||||||||||||
| Description | Gross Amount of Recognized Liabilities | Gross Amount Offset in the Statement of Assets and Liabilities | Net Amount Presented in the Statement of Assets and Liabilities | Futures Contracts Available for Offset | Collateral, Due from Broker* | Net Amount | ||||||||||||||||||
| Commodity Price | ||||||||||||||||||||||||
| Wheat futures contracts | $ | $ | $ | $ | $ | $ | ||||||||||||||||||
Offsetting of Financial Assets and Derivative Assets as of December 31, 2022
| (i) | (ii) | (iii) = (i)-(ii) | (iv) | (v)=(iii)-(iv) | ||||||||||||||||||||
| Gross Amount Not Offset in the Statement of Assets and Liabilities | ||||||||||||||||||||||||
| Description | Gross Amount of Recognized Assets | Gross Amount Offset in the Statement of Assets and Liabilities | Net Amount Presented in the Statement of Assets and Liabilities | Futures Contracts Available for Offset | Collateral, Due to Broker | Net Amount | ||||||||||||||||||
| Commodity Price | ||||||||||||||||||||||||
| Wheat futures contracts | $ | $ | $ | $ | $ | $ | ||||||||||||||||||
Offsetting of Financial Liabilities and Derivative Liabilities as of December 31, 2022
| (i) | (ii) | (iii) = (i)-(ii) | (iv) | (v)=(iii)-(iv) | ||||||||||||||||||||
| Gross Amount Not Offset in the Statement of Assets and Liabilities | ||||||||||||||||||||||||
| Description | Gross Amount of Recognized Liabilities | Gross Amount Offset in the Statement of Assets and Liabilities | Net Amount Presented in the Statement of Assets and Liabilities | Futures Contracts Available for Offset | Collateral, Due from Broker* | Net Amount | ||||||||||||||||||
| Commodity Price | ||||||||||||||||||||||||
| Wheat futures contracts | $ | $ | $ | $ | $ | $ | ||||||||||||||||||
The following tables identify the net gain and loss amounts included in the statements of operations as realized and unrealized gains and losses on trading of commodity futures contracts categorized by primary underlying risk:
Three months ended September 30, 2023
| Realized Loss on Commodity Futures Contracts | Net Change in Unrealized Appreciation on Commodity Futures Contracts | |||||||
| Commodity Price | ||||||||
| Wheat futures contracts | $ | ( | ) | $ | ||||
Three months ended September 30, 2022
| Realized Loss on Commodity Futures Contracts | Net Change in Unrealized Appreciation on Commodity Futures Contracts | |||||||
| Commodity Price | ||||||||
| Wheat futures contracts | $ | ( | ) | $ | ||||
Nine months ended September 30, 2023
| Realized Loss on Commodity Futures Contracts | Net Change in Unrealized Appreciation on Commodity Futures Contracts | |||||||
| Commodity Price | ||||||||
| Wheat futures contracts | $ | ( | ) | $ | ||||
Nine months ended September 30, 2022
| Realized Loss on Commodity Futures Contracts | Net Change in Unrealized Depreciation on Commodity Futures Contracts | |||||||
| Commodity Price | ||||||||
| Wheat futures contracts | $ | ( | ) | $ | ( | ) | ||
Volume of Derivative Activities
The average notional market value categorized by primary underlying risk for all futures contracts held was $
Note 6 – Financial Highlights
The following tables present per unit performance data and other supplemental financial data for the three and nine months ended September 30, 2023 and 2022. This information has been derived from information presented in the financial statements and is presented with total expenses gross of expenses waived by the Sponsor and with total expenses net of expenses waived by the Sponsor, as appropriate.
| Three months ended | Three months ended | Nine months ended | Nine months ended | |||||||||||||
| September 30, 2023 | September 30, 2022 | September 30, 2023 | September 30, 2022 | |||||||||||||
| Per Share Operation Performance | ||||||||||||||||
| Net asset value at beginning of period | $ | $ | $ | $ | ||||||||||||
| Income (loss) from investment operations: | ||||||||||||||||
| Investment income | ||||||||||||||||
| Net realized and unrealized (loss) gain on commodity futures contracts | ( | ) | ( | ) | ||||||||||||
| Total expenses, net | ( | ) | ( | ) | ( | ) | ( | ) | ||||||||
| Net (decrease) increase in net asset value | ( | ) | ( | ) | ||||||||||||
| Net asset value at end of period | $ | $ | $ | $ | ||||||||||||
| Total Return | - | % | % | - | % | % | ||||||||||
| Ratios to Average Net Assets (Annualized) | ||||||||||||||||
| Total expenses | % | % | % | % | ||||||||||||
| Total expenses, net | % | % | % | % | ||||||||||||
| Net investment income (loss) | % | % | % | - | % | |||||||||||
The financial highlights per share data are calculated consistent with the methodology used to calculate asset-based fees and expenses.
Note 7 – Organizational and Offering Costs
Expenses incurred in organizing of the Trust and the initial offering of the Shares of the Fund, including applicable SEC registration fees, were borne directly by the Sponsor. The Fund will not be obligated to reimburse the Sponsor.
Note 8 – Subsequent Events
Management has evaluated the financial statements for the quarter-ended September 30, 2023 for subsequent events through the date of this filing and noted no material events requiring either recognition through the date of the filing or disclosure herein for the Fund.
STATEMENTS OF ASSETS AND LIABILITIES
| September 30, 2023 | December 31, 2022 | |||||||
| (Unaudited) | ||||||||
| Assets | ||||||||
| Cash equivalents | $ | $ | ||||||
| Interest receivable | ||||||||
| Other assets | ||||||||
| Equity in trading accounts: | ||||||||
| Investments in securities, at fair value (cost $ and $ as of September 30, 2023 and December 31, 2022, respectively) | ||||||||
| Total assets | ||||||||
| Liabilities | ||||||||
| Other liabilities | ||||||||
| Net assets | $ | $ | ||||||
| Shares outstanding | ||||||||
| Shares authorized | * | * | ||||||
| Net asset value per share | $ | $ | ||||||
| Market value per share | $ | $ | ||||||
* On April 7, 2022, the Teucrium Agricultural Fund registered an indeterminate number of shares of the Fund pursuant to Rule 456(d) under the Securities Act of 1933.
The accompanying notes are an integral part of these financial statements.
SCHEDULE OF INVESTMENTS
September 30, 2023
(Unaudited)
| Percentage of | ||||||||||||||||||||
| Description: Assets | Yield | Cost | Fair Value | Net Assets | Shares | |||||||||||||||
| Exchange-traded funds | ||||||||||||||||||||
| Teucrium Corn Fund | $ | % | ||||||||||||||||||
| Teucrium Soybean Fund | ||||||||||||||||||||
| Teucrium Sugar Fund | ||||||||||||||||||||
| Teucrium Wheat Fund | ||||||||||||||||||||
| Total exchange-traded funds | $ | $ | % | |||||||||||||||||
| Cash equivalents | ||||||||||||||||||||
| Money market funds | ||||||||||||||||||||
| U.S. Bank Deposit Account | % | $ | $ | % | ||||||||||||||||
The accompanying notes are an integral part of these financial statements.
TEUCRIUM AGRICULTURAL FUND
SCHEDULE OF INVESTMENTS
December 31, 2022
| Percentage of | ||||||||||||||||||||
| Description: Assets | Yield | Cost | Fair Value | Net Assets | Shares | |||||||||||||||
| Exchange-traded funds | ||||||||||||||||||||
| Teucrium Corn Fund | $ | % | ||||||||||||||||||
| Teucrium Soybean Fund | ||||||||||||||||||||
| Teucrium Sugar Fund | ||||||||||||||||||||
| Teucrium Wheat Fund | ||||||||||||||||||||
| Total exchange-traded funds | $ | $ | % | |||||||||||||||||
| Cash equivalents | ||||||||||||||||||||
| Money market funds | ||||||||||||||||||||
| First American Government Obligations Fund - Class X | % | $ | $ | % | ||||||||||||||||
The accompanying notes are an integral part of these financial statements.
STATEMENTS OF OPERATIONS
(Unaudited)
| Three months ended | Three months ended | Nine months ended | Nine months ended | |||||||||||||
| September 30, 2023 | September 30, 2022 | September 30, 2023 | September 30, 2022 | |||||||||||||
| Income | ||||||||||||||||
| Realized and unrealized gain (loss) on trading of securities: | ||||||||||||||||
| Realized gain (loss) on securities | $ | $ | ( | ) | $ | $ | ||||||||||
| Net change in unrealized appreciation (depreciation) on securities | ( | ) | ( | ) | ||||||||||||
| Interest income | ||||||||||||||||
| Total income (loss) | ( | ) | ( | ) | ||||||||||||
| Expenses | ||||||||||||||||
| Professional fees | ||||||||||||||||
| Distribution and marketing fees | ||||||||||||||||
| Custodian fees and expenses | ||||||||||||||||
| Business permits and licenses fees | ||||||||||||||||
| General and administrative expenses | ||||||||||||||||
| Other expenses | ||||||||||||||||
| Total expenses | ||||||||||||||||
| Expenses waived by the Sponsor | ( | ) | ( | ) | ( | ) | ( | ) | ||||||||
| Total expenses, net | ||||||||||||||||
| Net income (loss) | $ | $ | ( | ) | $ | ( | ) | $ | ( | ) | ||||||
| Net gain (loss) per share | $ | $ | ( | ) | $ | ( | ) | $ | ||||||||
| Net gain (loss) per weighted average share | $ | $ | ( | ) | $ | ( | ) | $ | ( | ) | ||||||
| Weighted average shares outstanding | ||||||||||||||||
The accompanying notes are an integral part of these financial statements.
STATEMENTS OF CHANGES IN NET ASSETS
(Unaudited)
| Nine months ended | Nine months ended | |||||||
| September 30, 2023 | September 30, 2022 | |||||||
| Operations | ||||||||
| Net loss | $ | ( | ) | $ | ( | ) | ||
| Capital transactions | ||||||||
| Issuance of Shares | ||||||||
| Redemption of Shares | ( | ) | ( | ) | ||||
| Total capital transactions | ( | ) | ||||||
| Net change in net assets | ( | ) | ||||||
| Net assets, beginning of period | $ | $ | ||||||
| Net assets, end of period | $ | $ | ||||||
| Net asset value per share at beginning of period | $ | $ | ||||||
| Net asset value per share at end of period | $ | $ | ||||||
| Creation of Shares | ||||||||
| Redemption of Shares | ||||||||
The accompanying notes are an integral part of these financial statements.
STATEMENTS OF CASH FLOWS
(Unaudited)
| Nine months ended | Nine months ended | |||||||
| September 30, 2023 | September 30, 2022 | |||||||
| Cash flows from operating activities: | ||||||||
| Net loss | $ | ( | ) | $ | ( | ) | ||
| Adjustments to reconcile net loss to net cash provided by (used in) operating activities: | ||||||||
| Net change in unrealized depreciation on securities | ||||||||
| Changes in operating assets and liabilities: | ||||||||
| Net sale (purchase) of investments in securities | ( | ) | ||||||
| Interest receivable | ( | ) | ( | ) | ||||
| Other assets | ( | ) | ( | ) | ||||
| Other liabilities | ( | ) | ||||||
| Net cash provided by (used in) operating activities | ( | ) | ||||||
| Cash flows from financing activities: | ||||||||
| Proceeds from sale of Shares | ||||||||
| Redemption of Shares | ( | ) | ( | ) | ||||
| Net cash used in financing activities | ( | ) | ||||||
| Net change in cash equivalents | ||||||||
| Cash equivalents, beginning of period | ||||||||
| Cash equivalents, end of period | $ | $ | ||||||
The accompanying notes are an integral part of these financial statements.
September 30, 2023
(Unaudited)
Note 1 – Organization and Operation
Teucrium Agricultural Fund (referred to herein as “TAGS” or the “Fund”) is a series of Teucrium Commodity Trust (“Trust”), a Delaware statutory trust organized on September 11, 2009. The Fund operates pursuant to the Trust’s Fifth Amended and Restated Declaration of Trust and Trust Agreement (the “Trust Agreement”). The Fund was formed on March 29, 2011 and is managed and controlled by Teucrium Trading, LLC (the “Sponsor”). The Sponsor is a limited liability company formed in Delaware on July 28, 2009. The Sponsor is registered as a commodity pool operator (“CPO”) and a commodity trading adviser (“CTA”) with the Commodity Futures Trading Commission (“CFTC”) and is a member of the National Futures Association (“NFA”).
On April 22, 2011, a registration statement was filed with the Securities and Exchange Commission (“SEC”). On February 10, 2012, the Fund’s initial registration of
The investment objective of the TAGS is to have the daily changes in percentage terms of the NAV of its Shares reflect the daily changes in percentage terms of a weighted average (the “Underlying Fund Average”) of the NAVs per share of other commodity pools that are series of the Trust and are sponsored by the Sponsor: the Teucrium Corn Fund, the Teucrium Wheat Fund, the Teucrium Soybean Fund and the Teucrium Sugar Fund (collectively, the “Underlying Funds”). The Underlying Fund Average will have a weighting of
TAGS Benchmark
| Underlying Fund | Weighting | |||
| CORN | % | |||
| SOYB | % | |||
| CANE | % | |||
| WEAT | % | |||
The Fund seeks to provide daily investment results that reflect the combined daily performance of the Underlying Funds. Under normal market conditions, the Fund seeks to achieve its investment objective generally by investing equally in shares of each Underlying Fund and, to a lesser extent, cash equivalents. The Fund’s investments in shares of the Underlying Funds is rebalanced, generally on a daily basis, in order to maintain approximately a
While the Fund expects to maintain substantially all of its assets in shares of the Underlying Funds at all times, the Fund may hold some residual amount of assets in obligations of the United States government (“Treasury Securities”) or cash equivalents, and/or merely hold such assets in cash (generally in interest-bearing accounts). The Underlying Funds invest in Commodity Interests to the fullest extent possible without being leveraged or unable to satisfy their expected current or potential margin or collateral obligations with respect to their investments in Commodity Interests. After fulfilling such margin and collateral requirements, the Underlying Funds will invest the remainder of the proceeds from the sale of baskets in short term Treasury Securities or cash equivalents, and/or merely hold such assets in cash. Therefore, the focus of the Sponsor in managing the Underlying Funds is investing in Commodity Interests and in cash and/or cash equivalents. The Fund and Underlying Funds will seek to earn interest income from the short-term Treasury Securities and/or cash equivalents that it purchases, and, on the cash, it holds through the Fund’s custodian.
The accompanying unaudited financial statements have been prepared in accordance with Rule 10-01 of Regulation S-X promulgated by the SEC and, therefore, do not include all information and footnote disclosures required under accounting principles generally accepted in the United States of America (“GAAP”). The financial information included herein is unaudited; however, such financial information reflects all adjustments which are, in the opinion of management, necessary for the fair presentation of the Fund’s financial statements for the interim period. It is suggested that these interim financial statements be read in conjunction with the financial statements and related notes included in the Trust’s Annual Report on Form 10-K, as well as the most recent Form S-1 filing, as applicable. The operating results for the three and nine months ended September 30, 2023 are not necessarily indicative of the results to be expected for the full year ending December 31, 2023.
Subject to the terms of the Trust Agreement, Teucrium Trading, LLC, in its capacity as the Sponsor (“Sponsor”), may terminate a Fund at any time, regardless of whether the Fund has incurred losses, including, for instance, if it determines that the Fund’s aggregate net assets in relation to its operating expenses make the continued operation of the Fund unreasonable or imprudent. However, no level of losses will require the Sponsor to terminate a Fund.
Note 2 – Principal Contracts and Agreements
The Sponsor employs U.S. Bancorp Fund Services, LLC, doing business as U.S. Bank Global Fund Services (“Global Fund Services”), for Transfer Agency, Fund Accounting and Fund Administration services. The principal address for Global Fund Services is 615 E. Michigan Street, Milwaukee, WI 53202.
For custody services, the Funds will pay to U.S. Bank N.A.
The Sponsor employs Foreside Fund Services, LLC (“Foreside” or the “Distributor”) as the Distributor for the Funds. The Distribution Services Agreement among the Distributor and the Sponsor calls for the Distributor to work with the Custodian in connection with the receipt and processing of orders for Creation Baskets and Redemption Baskets and the review and approval of all Fund sales literature and advertising materials. The Distributor and the Sponsor have also entered into a Securities Activities and Service Agreement (the “SASA”) under which certain employees and officers of the Sponsor are licensed as registered representatives or registered principals of the Distributor, under Financial Industry Regulatory Authority (“FINRA”) rules. For its services as the Distributor, Foreside receives a fee of
Marex Capital Markets, Inc. (“Marex”) and StoneX Financial Inc. (“StoneX”) serve as the Underlying Funds’ clearing brokers to execute and clear the Underlying Funds’ futures and provide other brokerage-related services. Marex and StoneX are each registered as futures commission merchants (“FCM”) with the U.S. CFTC and are members of the NFA. The clearing brokers are registered as broker-dealers with the SEC and are each a member of FINRA. Marex and StoneX are each clearing members of ICE Futures U.S., Inc., Chicago Board of Trade, Chicago Mercantile Exchange, New York Mercantile Exchange, and all other major United States commodity exchanges. For Corn, Soybean, Sugar, and Wheat Futures Contracts Marex is paid $
The sole Trustee of the Trust is Wilmington Trust Company, a Delaware banking corporation. The Trustee will accept service of legal process on the Trust in the State of Delaware and will make certain filings under the Delaware Statutory Trust Act. For its services, the Trustee receives an annual fee of $
The Sponsor employs Thales Capital Partners LLC (“Thales”) for distribution and solicitation-related services. Thales is registered as a broker-dealer with the SEC and a member of FINRA and the Securities Investor Protection Corporation (“SIPC”). Thales receives a quarterly fee of the higher of $
| Three months ended September 30, 2023 | Three months ended September 30, 2022 | Nine months ended September 30, 2023 | Nine months ended September 30, 2022 | |||||||||||||
| Amount Recognized for Custody Services | $ | $ | $ | $ | ||||||||||||
| Amount of Custody Services Waived | $ | $ | $ | $ | ||||||||||||
| Amount Recognized for Distribution Services | $ | $ | $ | $ | ||||||||||||
| Amount of Distribution Services Waived | $ | $ | $ | $ | ||||||||||||
| Amount Recognized for Wilmington Trust | $ | $ | $ | $ | ||||||||||||
| Amount of Wilmington Trust Waived | $ | $ | $ | $ | ||||||||||||
| Amount Recognized for Thales | $ | $ | $ | $ | ||||||||||||
| Amount of Thales Waived | $ | $ | $ | $ | ||||||||||||
Note 3 – Summary of Significant Accounting Policies
Basis of Presentation
The accompanying financial statements have been prepared in accordance with accounting principles generally accepted in the United States of America (“U.S. GAAP”) as detailed in the Financial Accounting Standards Board’s Accounting Standards Codification.
Revenue Recognition
Investment transactions are accounted for on a trade-date basis. All such transactions are recorded on the identified cost basis and marked to market daily. Unrealized appreciation or depreciation on investments are reflected in the statements of operations as the difference between the original amount and the fair market value as of the last business day of the year or as of the last date of the financial statements. Changes in the appreciation or depreciation between periods are reflected in the statements of operations.
Brokerage Commissions
The Sponsor recognizes the expense for brokerage commissions for futures contract trades on a per-trade basis.
Income Taxes
For federal income tax purposes, the Fund will be treated as a publicly traded partnership. A publicly traded partnership is generally treated as a corporation for federal income tax purposes unless 90% or more of the publicly traded partnership’s gross income for each taxable year of its existence consists of qualifying income as defined in section 7704(d) of the Internal Revenue Code of 1986, as amended. Qualifying income is defined as generally including, in pertinent part, interest (other than from a financial business), dividends, and gains from the sale or disposition of capital assets held for the production of interest or dividends. In the case of a partnership of which a principal activity is the buying and selling of commodities, other than as inventory, or of futures, forwards and options with respect to commodities, qualifying income also includes income and gains from commodities and from futures, forwards, options with respect to commodities and, provided the partnership is a trader or investor with respect to such assets, swaps and other notional principal contracts with respect to commodities. The Fund expects that at least 90% of the Fund’s gross income for each taxable year will consist of qualifying income and that the Fund will be taxed as a partnership for federal income tax purposes. The Fund does not record a provision for income taxes because the shareholders report their share of the Fund’s income or loss on their income tax returns. The financial statements reflect the Fund’s transactions without adjustment, if any, required for income tax purposes.
The Fund is required to determine whether a tax position is more likely than not to be sustained upon examination by the applicable taxing authority, including resolution of any related appeals or litigation processes, based on the technical merits of the position. The Fund files an income tax return in the U.S. federal jurisdiction and may file income tax returns in various U.S. states and foreign jurisdictions. For all tax years to December 31, 2022, the Fund remains subject to income tax examinations by major taxing authorities. The tax benefit recognized is measured as the largest amount of benefit that has a greater than fifty percent likelihood of being realized upon ultimate settlement. De-recognition of a tax benefit previously recognized results in the Fund recording a tax liability that reduces net assets. This policy has been applied to all existing tax positions upon the Fund’s initial adoption. Based on its analysis, the Fund has determined that it has incurred any liability for unrecognized tax benefits as of September 30, 2023 and for the years ended December 31, 2022, 2021 and 2020. However, the Fund’s conclusions regarding this policy may be subject to review and adjustment at a later date based on factors including, but not limited to, ongoing analysis of and changes to tax laws, regulations, and interpretations thereof.
The Fund recognizes interest accrued related to unrecognized tax benefits and penalties related to unrecognized tax benefits in income tax fees payable, if assessed.
The Fund may be subject to potential examination by U.S. federal, U.S. state, or foreign jurisdictional authorities in the area of income taxes. These potential examinations may include questioning the timing and amount of deductions, the nexus of income among various tax jurisdictions, and compliance with U.S. federal, U.S. state and foreign tax laws.
Creations and Redemptions
Effective August 28, 2018, the Sponsor filed a prospectus supplement updating the Creation and Redemption Basket size to
Authorized Purchasers may purchase Creation Baskets consisting of
Authorized Purchasers may redeem shares from the Fund only in blocks of
The Fund will receive the proceeds from shares sold or will pay for redeemed shares within three business days after the trade date of the purchase or redemption, respectively. The amounts due from Authorized Purchasers will be reflected in the Fund’s statements of assets and liabilities as capital shares receivable. Amounts payable to Authorized Purchasers upon redemption will be reflected in the Fund’s statements of assets and liabilities as payable for shares redeemed.
As outlined in the most recent Form S-1 filing,
Allocation of Shareholder Income and Losses
Profit or loss is allocated among the shareholders of the Fund in proportion to the number of shares each shareholder holds as of the close of each month.
Cash Equivalents
Cash equivalents are highly liquid investments with maturity dates of 90 days or less when acquired. The Fund reported its cash equivalents in the statements of assets and liabilities at market value, or at carrying amounts that approximate fair value, because of their highly liquid nature and short term maturities. The Fund has these balances of its assets on deposit with banks. Assets deposited with a financial institution may, at times, exceed federally insured limits. TAGS had a balance of $
Payable/Receivable for Securities Purchased/Sold
Due from/to broker for investments in securities are securities transactions pending settlement. The Fund is subject to credit risk to the extent any broker with whom it conducts business is unable to fulfill contractual obligations on its behalf. The management of the Fund monitors the financial condition of such brokers and does not anticipate any losses from these counterparties.
Calculation of Net Asset Value
The Fund’s NAV is calculated by:
| • | Taking the current market value of its total assets and | |
| • | Subtracting any liabilities. |
The administrator, Global Fund Services, will calculate the NAV of the Fund once each trading day. It will calculate the NAV as of the earlier of the close of the New York Stock Exchange or 4:00 p.m. (ET). The NAV for a particular trading day will be released after 4:15 p.m. (ET).
For purposes of determining the Fund’s NAV, the Fund’s investments in the Underlying Funds will be valued based on the Underlying Funds’ NAVs. In turn, in determining the value of the Futures Contracts held by the Underlying Funds, the Administrator will use the closing price on the exchange on which they are traded. The Administrator will determine the value of all other Funds and Underlying Fund investments as of the earlier of the close of the New York Stock Exchange or 4:00 p.m. (ET), in accordance with the current Services Agreement between the Administrator and the Trust. The value of over-the-counter Commodity Interests will be determined based on the value of the commodity or Futures Contract underlying such Commodity Interest, except that a fair value may be determined if the Sponsor believes that the Underlying Fund is subject to significant credit risk relating to the counterparty to such Commodity Interest. For purposes of financial statements and reports, the Sponsor will recalculate the NAV of an Underlying Fund where necessary to reflect the “fair value” of a Futures Contract held by an Underlying Fund when a Futures Contract held by the Underlying Fund closes at its price fluctuation limit for the day. Short term Treasury Securities held by the Fund or Underlying Funds will be valued by the Administrator using values received from recognized third-party vendors (such as Reuters) and dealer quotes. NAV will include any unrealized profit or loss on open Commodity Interests and any other credit or debit accruing to the Fund but unpaid or not received by the Fund.
Sponsor Fee Allocation of Expenses and Related Party Transactions
The Sponsor is responsible for investing the assets of the Fund in accordance with the objectives and policies of the Fund. In addition, the Sponsor arranges for one or more third parties to provide administrative, custodial, accounting, transfer agency and other necessary services to the Trust and the Funds. In addition, the Sponsor elected not to outsource services directly attributable to the Trust and the Funds such as accounting, financial reporting, regulatory compliance, and trading activities. The Sponsor does not receive a management fee from the Fund. The Sponsor receives a management fee from each Underlying Fund at the annual rate of
The Fund generally pays for all brokerage fees, taxes, and other expenses, including licensing fees for the use of intellectual property, registration or other fees paid to the SEC, FINRA, or any other regulatory agency in connection with the offer and sale of subsequent Shares after its initial registration and all legal, accounting, printing and other expenses associated therewith. The Fund also pays its portion of the fees and expenses associated with the Trust’s tax accounting and reporting requirements. Certain aggregate expenses common to all Funds within the Trust are allocated by the Sponsor to the respective Funds based on activity drivers deemed most appropriate by the Sponsor for such expenses, including but not limited to relative assets under management and creation order activity.
These aggregate common expenses include, but are not limited to, legal, auditing, accounting and financial reporting, tax-preparation, regulatory compliance, trading activities, and insurance costs, as well as fees paid to the Distributor, which are included in the related line item in the statements of operations. A portion of these aggregate common expenses are related to the Sponsor or related parties of principals of the Sponsor; these are necessary services to the Funds, which are primarily the cost of performing accounting and financial reporting, regulatory compliance, and trading activities that are directly attributable to the Fund. Such expenses are primarily recorded as distribution and marketing fees on the statement of operations. All asset-based fees and expenses for the Funds are calculated on the prior day’s net assets.
| Three months ended September 30, 2023 | Three months ended September 30, 2022 | Nine months ended September 30, 2023 | Nine months ended September 30, 2022 | |||||||||||||
| Recognized Related Party Transactions | $ | $ | $ | $ | ||||||||||||
| Waived Related Party Transactions | $ | $ | $ | $ | ||||||||||||
The Sponsor has the ability to elect to pay certain expenses on behalf of the Funds or waive the management fee. This election is subject to change by the Sponsor, at its discretion. Expenses paid by the Sponsor and Management fees waived by the Sponsor are, if applicable, presented as waived expenses in the statements of operations for each Fund. The Sponsor has determined that there will be no recovery sought for the amounts below in any future period:
| TAGS | ||||
| Three months ended September 30, 2023 | $ | |||
| Three months ended September 30, 2022 | $ | |||
| Nine months ended September 30, 2023 | $ | |||
| Nine months ended September 30, 2022 | $ | |||
Expenses
Expenses are recorded using the accrual method of accounting.
Use of Estimates
The preparation of financial statements in conformity with accounting principles generally accepted in the United States of America requires management to make estimates and assumptions that affect the reported amount of assets and liabilities and disclosure of contingent assets and liabilities at the date of the financial statements, and the reported amounts of the revenue and expenses during the reporting period. Actual results could differ from those estimates.
New Accounting Pronouncements
The Financial Accounting Standards Board (“FASB”) issued Accounting Standards Update (“ASU”) issued ASU 2023-01, related to Leases – (Topic 842). The response to concerns about applying Topic 842 to related party arrangements between entities under common control. The update was adopted early for the quarter ended March 31, 2023; the adoption did not have a material impact on the financial statements and disclosures of the Trust or the Fund.
The FASB issued ASU 2022-03, related to fair value measurement (Topic 820) of equity securities subject to contractual sale restrictions. Under the clarified guidance, contractual restrictions on the sale of an equity security are not considered part of the unit of account of the equity security and, therefore, are not considered in measuring fair value, however they do require disclosures. The amendment was adopted for the quarter ended June 30, 2022; the adoption did not have a material impact on the financial statements and disclosures of the Trust or the Fund.
Fair Value - Definition and Hierarchy
In accordance with GAAP, fair value is defined as the price that would be received to sell an asset or paid to transfer a liability (i.e., the “exit price”) in an orderly transaction between market participants at the measurement date.
In determining fair value, the Fund uses various valuation approaches. In accordance with GAAP, a fair value hierarchy for inputs is used in measuring fair value that maximizes the use of observable inputs and minimizes the use of unobservable inputs by requiring that the most observable inputs be used when available. Observable inputs are those that market participants would use in pricing the asset or liability based on market data obtained from sources independent of the Fund. Unobservable inputs reflect the Fund’s assumptions about the inputs market participants would use in pricing the asset or liability developed based on the best information available in the circumstances. The fair value hierarchy is categorized into three levels based on the inputs as follows:
Level 1 - Valuations based on unadjusted quoted prices in active markets for identical assets or liabilities that the Fund has the ability to access. Valuation adjustments and block discounts are not applied to Level 1 financial instruments of the Underlying Funds and securities of the Fund, together the “financial instruments”. Since valuations are based on quoted prices that are readily and regularly available in an active market, valuation of these financial instruments does not entail a significant degree of judgment.
Level 2 - Valuations based on quoted prices in markets that are not active or for which all significant inputs are observable, either directly or indirectly.
Level 3 - Valuations based on inputs that are unobservable and significant to the overall fair value measurement.
The availability of valuation techniques and observable inputs can vary from financial instrument to financial instrument and is affected by a wide variety of factors including, the type of financial instrument, whether the financial instrument is new and not yet established in the marketplace, and other characteristics particular to the transaction. To the extent that valuation is based on models or inputs that are less observable or unobservable in the market, the determination of fair value requires more judgment. Those estimated values do not necessarily represent the amounts that may be ultimately realized due to the occurrence of future circumstances that cannot be reasonably determined. Because of the inherent uncertainty of valuation, those estimated values may be materially higher or lower than the values that would have been used had a ready market for the financial instruments existed. Accordingly, the degree of judgment exercised by the Fund in determining fair value is greatest for financial instruments categorized in Level 3. In certain cases, the inputs used to measure fair value may fall into different levels of the fair value hierarchy. In such cases, for disclosure purposes, the level in the fair value hierarchy, within which the fair value measurement in its entirety falls, is determined based on the lowest level input that is significant to the fair value measurement.
On September 30, 2023 and December 31, 2022, the reported value at the close of the market for each commodity futures contract of the Underlying Funds fairly reflected the value of the futures and no alternative valuations were required.
Net Income (Loss) per Share
Net income (loss) per share is the difference between the NAV per unit at the beginning of each period and at the end of each period. The weighted average number of units outstanding was computed for purposes of disclosing net income (loss) per weighted average unit. The weighted average units are equal to the number of units outstanding at the end of the period, adjusted proportionately for units created or redeemed based on the amount of time the units were outstanding during such period.
Note 4 – Fair Value Measurements
The Fund’s assets and liabilities recorded at fair value have been categorized based upon a fair value hierarchy as described in the Fund’s significant accounting policies in Note 3. The following table presents information about the Fund’s assets and liabilities measured at fair value as of September 30, 2023 and December 31, 2022:
September 30, 2023
| Balance as of | ||||||||||||||||
| Assets: | Level 1 | Level 2 | Level 3 | September 30, 2023 | ||||||||||||
| Exchange Traded Funds | $ | $ | $ | $ | ||||||||||||
| Cash Equivalents | ||||||||||||||||
| Total | $ | $ | $ | $ | ||||||||||||
December 31, 2022
| Balance as of | ||||||||||||||||
| Assets: | Level 1 | Level 2 | Level 3 | December 31, 2022 | ||||||||||||
| Exchange Traded Funds | $ | $ | $ | $ | ||||||||||||
| Cash Equivalents | ||||||||||||||||
| Total | $ | $ | $ | $ | ||||||||||||
For the three and nine months ended September 30, 2023 and year ended December 31, 2022, the Fund did not have any significant transfers between any of the levels of the fair value hierarchy.
See the Fair Value - Definition and Hierarchy section in Note 3 above for an explanation of the transfers into and out of each level of the fair value hierarchy.
Note 5 – Financial Highlights
The following table presents per unit performance data and other supplemental financial data for the three and nine months ended September 30, 2023 and 2022. This information has been derived from information presented in the financial statements and is presented with total expenses gross of expenses waived by the Sponsor and with total expenses net of expenses waived by the Sponsor, as appropriate.
| Three months ended | Three months ended | Nine months ended | Nine months ended | |||||||||||||
| September 30, 2023 | September 30, 2022 | September 30, 2023 | September 30, 2022 | |||||||||||||
| Per Share Operation Performance | ||||||||||||||||
| Net asset value at beginning of period | $ | $ | $ | $ | ||||||||||||
| Income (loss) from investment operations: | ||||||||||||||||
| Net realized and unrealized (loss) gain on investment transactions | ( | ) | ( | ) | ||||||||||||
| Total expenses, net | ( | ) | ( | ) | ( | ) | ||||||||||
| Net increase (decrease) in net asset value | ( | ) | ( | ) | ||||||||||||
| Net asset value at end of period | $ | $ | $ | $ | ||||||||||||
| Total Return | - | % | - | % | - | % | % | |||||||||
| Ratios to Average Net Assets (Annualized) | ||||||||||||||||
| Total expenses | % | % | % | % | ||||||||||||
| Total expenses, net | % | % | % | % | ||||||||||||
| Net investment loss | - | % | - | % | - | % | - | % | ||||||||
The financial highlights per share data are calculated consistent with the methodology used to calculate asset-based fees and expenses.
Note 6 – Organizational and Offering Costs
Expenses incurred in organizing of the Trust and the initial offering of the Shares of the Fund, including applicable SEC registration fees, were borne directly by the Sponsor. The Fund will not be obligated to reimburse the Sponsor.
Note 7 – Subsequent Events
Management has evaluated the financial statements for the quarter-ended September 30, 2023 for subsequent events through the date of this filing and noted no material events requiring either recognition through the date of the filing or disclosure herein for the Fund.
STATEMENTS OF ASSETS AND LIABILITIES
| September 30, 2023 | December 31, 2022 | |||||||
| (Unaudited) | ||||||||
| Assets | ||||||||
| Cash and cash equivalents | $ | $ | ||||||
| Interest receivable | ||||||||
| Equity in trading accounts: | ||||||||
| Cryptocurrency futures contracts | ||||||||
| Due from broker | ||||||||
| Total equity in trading accounts | ||||||||
| Total assets | ||||||||
| Liabilities | ||||||||
| Management fee payable to Sponsor | ||||||||
| Net assets | $ | $ | ||||||
| Shares outstanding | ||||||||
| Shares authorized | * | * | ||||||
| Net asset value per share | $ | $ | ||||||
| Market value per share | $ | $ | ||||||
* On September 14, 2022, the Hashdex Bitcoin Futures ETF registered an indeterminate number of shares of the Fund pursuant to Rule 456(d) under the Securities Act of 1933.
The accompanying notes are an integral part of these financial statements.
SCHEDULE OF INVESTMENTS
September 30, 2023
(Unaudited)
| Percentage of | ||||||||||||||||||||
| Description: Assets | Yield | Cost | Fair Value | Net Assets | Shares | |||||||||||||||
| Cash equivalents | ||||||||||||||||||||
| Money market funds | ||||||||||||||||||||
| U.S. Bank Deposit Account | % | $ | $ | % | ||||||||||||||||
| Number of | Percentage of | Notional Amount | ||||||||||||||
| Contracts | Fair Value | Net Assets | (Long Exposure) | |||||||||||||
| Cryptocurrency futures contracts | ||||||||||||||||
| United States CME Bitcoin futures contracts | ||||||||||||||||
| CME Bitcoin futures OCT23 | $ | % | $ | |||||||||||||
| CME Bitcoin futures NOV23 | ||||||||||||||||
| Total cryptocurrency futures contracts | $ | % | $ | |||||||||||||
The accompanying notes are an integral part of these financial statements.
HASHDEX BITCOIN FUTURES ETF
SCHEDULE OF INVESTMENTS
December 31, 2022
| Percentage of | ||||||||||||||||||||
| Description: Assets | Yield | Cost | Fair Value | Net Assets | Shares | |||||||||||||||
| Cash equivalents | ||||||||||||||||||||
| Money market funds | ||||||||||||||||||||
| First American Government Obligations Fund - Class X | % | $ | $ | % | ||||||||||||||||
| Number of | Percentage of | Notional Amount | ||||||||||||||
| Contracts | Fair Value | Net Assets | (Long Exposure) | |||||||||||||
| Cryptocurrency futures contracts | ||||||||||||||||
| United States CME Bitcoin futures contracts | ||||||||||||||||
| CME Bitcoin futures JAN23 | $ | % | $ | |||||||||||||
| CME Bitcoin futures FEB23 | ||||||||||||||||
| Total cryptocurrency futures contracts | $ | % | $ | |||||||||||||
STATEMENTS OF OPERATIONS
(Unaudited)
| Three months ended | Three months ended | Nine months ended | From the commencement of operations (September 15, 2022) | |||||||||||||
| September 30, 2023 | September 30, 2022 | September 30, 2023 | through September 30, 2022 | |||||||||||||
| Income | ||||||||||||||||
| Realized and unrealized gain (loss) on trading of cryptocurrency futures contracts: | ||||||||||||||||
| Realized (loss) gain on cryptocurrency futures contracts | $ | ( | ) | $ | ( | ) | $ | $ | ( | ) | ||||||
| Net change in unrealized depreciation on cryptocurrency futures contracts | ( | ) | ( | ) | ( | ) | ( | ) | ||||||||
| Interest income | ||||||||||||||||
| Total (Loss) Income | ( | ) | ( | ) | ( | ) | ||||||||||
| Expenses | ||||||||||||||||
| Management fees | ||||||||||||||||
| Professional fees | ||||||||||||||||
| Distribution and marketing fees | ||||||||||||||||
| Custodian fees and expenses | ||||||||||||||||
| Business permits and licenses fees | ||||||||||||||||
| General and administrative expenses | ||||||||||||||||
| Total expenses | ||||||||||||||||
| Expenses waived by the Sponsor | ( | ) | ( | ) | ( | ) | ( | ) | ||||||||
| Total expenses, net | ||||||||||||||||
| Net (loss) income | $ | ( | ) | $ | ( | ) | $ | $ | ( | ) | ||||||
| Net (loss) gain per share | $ | ( | ) | $ | ( | ) | $ | $ | ( | ) | ||||||
| Net (loss) gain per weighted average share | $ | ( | ) | $ | ( | ) | $ | $ | ( | ) | ||||||
| Weighted average shares outstanding | ||||||||||||||||
The accompanying notes are an integral part of these financial statements.
STATEMENTS OF CHANGES IN NET ASSETS
(Unaudited)
| Nine months ended | From the commencement of operations (September 15, 2022) | |||||||
| September 30, 2023 | through September 30, 2022 | |||||||
| Operations | ||||||||
| Net income (loss) | $ | $ | ( | ) | ||||
| Capital transactions | ||||||||
| Issuance of Shares | ||||||||
| Redemption of Shares | ( | ) | ||||||
| Total capital transactions | ||||||||
| Net change in net assets | ||||||||
| Net assets, beginning of period | $ | $ | ||||||
| Net assets, end of period | $ | $ | ||||||
| Net asset value per share at beginning of period | $ | $ | ||||||
| Net asset value per share at end of period | $ | $ | ||||||
| Creation of Shares | ||||||||
| Redemption of Shares | ||||||||
The accompanying notes are an integral part of these financial statements.
STATEMENTS OF CASH FLOWS
(Unaudited)
| Nine months ended | From the commencement of operations (September 15, 2022) | |||||||
| September 30, 2023 | through September 30, 2022 | |||||||
| Cash flows from operating activities: | ||||||||
| Net income (loss) | $ | $ | ( | ) | ||||
| Adjustments to reconcile net income (loss) to net cash provided by (used in) operating activities: | ||||||||
| Net change in unrealized appreciation on cryptocurrency futures contracts | ||||||||
| Changes in operating assets and liabilities: | ||||||||
| Due from broker | ( | ) | ( | ) | ||||
| Interest receivable | ( | ) | ( | ) | ||||
| Management fee payable to Sponsor | ||||||||
| Net cash provided by (used in) operating activities | ( | ) | ||||||
| Cash flows from financing activities: | ||||||||
| Proceeds from sale of Shares | ||||||||
| Redemption of Shares | ( | ) | ||||||
| Net cash provided by financing activities | ||||||||
| Net change in cash and cash equivalents | ||||||||
| Cash and cash equivalents beginning of period | ||||||||
| Cash and cash equivalents end of period | $ | $ | ||||||
The accompanying notes are an integral part of these financial statements.
September 30, 2023
(Unaudited)
Note 1 – Organization and Operation
Hashdex Bitcoin Futures ETF (the “Fund”) is a series of Teucrium Commodity Trust (“Trust”), a Delaware statutory trust organized on September 11, 2009. The Fund operates pursuant to the Fifth Amended and Restated Declaration of Trust and Trust Agreement ("Trust Agreement"), dated April 26, 2019. The Trust Agreement may be found on the SEC’s EDGAR filing database at https://www.sec.gov/Archives/edgar/data/1471824/000165495419004865/ex31.htm. The Fund was formed and is managed and controlled by the Sponsor, a limited liability company formed in Delaware on July 28, 2009. The Sponsor is registered as a commodity pool operator (“CPO”) and a commodity trading adviser (“CTA”) with the Commodity Futures Trading Commission (“CFTC”) and is a member of the National Futures Association (“NFA”). The Fund intends to be treated as a partnership for U.S. federal income tax purposes.
On September 14, 2022, the Fund’s initial registration of an indeterminate number of shares on Form S-1 was declared effective by the SEC. On September 16, 2022, the Fund listed it’s shares on the NYSE Arca under the ticker symbol “DEFI”. On the business day prior to that, the Fund issued
The Fund’s investment objective is for changes in the Shares’ NAV to reflect the daily changes of the price of a specified benchmark (the “Benchmark”), less expenses from the Fund’s operations. The Benchmark currently is the average of the closing settlement prices for the first to expire and second to expire bitcoin futures contracts (“Bitcoin Futures Contracts”) listed on the CME. These futures contracts are the Benchmark Component Futures Contracts. The CME currently offers Bitcoin Futures Contracts, one contract representing
DEFI Benchmark
| CME Bitcoin Futures Contracts | Weighting | |||
| First to expire | % | |||
| Second to expire | % | |||
The accompanying unaudited financial statements have been prepared in accordance with Rule 10-01 of Regulation S-X promulgated by the SEC and, therefore, do not include all information and footnote disclosures required under accounting principles generally accepted in the United States of America (“GAAP”). The financial information included herein is unaudited; however, such financial information reflects all adjustments which are, in the opinion of management, necessary for the fair presentation of the Fund’s financial statements for the interim period. It is suggested that these interim financial statements be read in conjunction with the financial statements and related notes included in the Trust’s Annual Report on Form 10-K, as well as the most recent Form S-1 filing, as applicable. The operating results for the three and nine months ended September 30, 2023 are not necessarily indicative of the results to be expected from the full year ended December 31, 2023.
Subject to the terms of the Trust Agreement, Teucrium Trading, LLC, in its capacity as the Sponsor (“Sponsor”), may terminate a Fund at any time, regardless of whether the Fund has incurred losses, including, for instance, if it determines that the Fund’s aggregate net assets in relation to its operating expenses make the continued operation of the Fund unreasonable or imprudent. However, no level of losses will require the Sponsor to terminate a Fund.
Note 2 – Principal Contracts and Agreements
The Sponsor employs U.S. Bancorp Fund Services, LLC, doing business as U.S. Bank Global Fund Services (“Global Fund Services”), for Transfer Agency, Fund Accounting and Fund Administration services. The principal address for Global Fund Services is 615 E. Michigan Street, Milwaukee, WI 53202.
For custody services, the Funds will pay to U.S. Bank N.A.
The Sponsor employs Foreside Fund Services, LLC (“Foreside” or the “Distributor”) as the Distributor for the Funds. The Distribution Services Agreement among the Distributor and the Sponsor calls for the Distributor to work with the Custodian in connection with the receipt and processing of orders for Creation Baskets and Redemption Baskets and the review and approval of all Fund sales literature and advertising materials. For its services as the Distributor, Foreside receives a fee of
StoneX Financial Inc. (“StoneX”) and Phillip Capital Inc. (“Phillip Capital”) serve as the Fund’s clearing brokers to execute futures contracts and provide other brokerage-related services. StoneX and Phillip Capital are each registered as futures commission merchants (“FCM”) with the U.S. CFTC and are members of the NFA. The clearing brokers are registered as broker-dealers with the SEC and are each a member of FINRA. StoneX and Phillip Capital are each clearing members of ICE Futures U.S., Inc., Chicago Board of Trade, Chicago Mercantile Exchange, New York Mercantile Exchange, and all other major United States commodity exchanges. StoneX is paid
The sole Trustee of the Trust is Wilmington Trust Company, a Delaware banking corporation. The Trustee will accept service of legal process on the Trust in the State of Delaware and will make certain filings under the Delaware Statutory Trust Act. For its services, the Trustee receives an annual fee of $
| Three months ended September 30, 2023 | Three months ended September 30, 2022 (1) | Nine months ended September 30, 2023 | Nine months ended September 30, 2022 (1) | |||||||||||||
| Amount Recognized for Custody Services | $ | $ | $ | $ | ||||||||||||
| Amount of Custody Services Waived | $ | $ | $ | $ | ||||||||||||
| Amount Recognized for Distribution Services | $ | $ | $ | $ | ||||||||||||
| Amount of Distribution Services Waived | $ | $ | $ | $ | ||||||||||||
| Amount Recognized for Wilmington Trust | $ | $ | $ | $ | ||||||||||||
| Amount of Wilmington Trust Waived | $ | $ | $ | $ | ||||||||||||
(1) The Fund commenced operations on September 15, 2022.
Note 3 – Summary of Significant Accounting Policies
Basis of Presentation
The accompanying financial statements have been prepared in accordance with accounting principles generally accepted in the United States of America (“U.S. GAAP”) as detailed in the Financial Accounting Standards Board’s Accounting Standards Codification.
Revenue Recognition
Investment transactions are accounted for on a trade-date basis. All such transactions are recorded on the identified cost basis and marked to market daily. Unrealized appreciation or depreciation on investments are reflected in the statements of operations as the difference between the original amount and the fair market value as of the last business day of the year or as of the last date of the financial statements. Changes in the appreciation or depreciation between periods are reflected in the statements of operations.
Brokerage Commissions
The Sponsor recognizes the expense for brokerage commissions for futures contract trades on a per-trade basis. The below table shows the amounts included on the statements of operations as total brokerage commissions paid inclusive of unrealized loss for the quarter ended September 30, 2023.
| DEFI | ||||
| Three months ended September 30, 2023 | $ | |||
| Three months ended September 30, 2022 (1) | $ | |||
| Nine months ended September 30, 2023 | $ | |||
| Nine months ended September 30, 2022 (1) | $ | |||
(1) The Fund commenced operations on September 15, 2022.
Income Taxes
For federal income tax purposes, the Fund will be treated as a publicly traded partnership. A publicly traded partnership is generally treated as a corporation for federal income tax purposes unless 90% or more of the publicly traded partnership’s gross income for each taxable year of its existence consists of qualifying income as defined in section 7704(d) of the Internal Revenue Code of 1986, as amended. Qualifying income is defined as generally including, in pertinent part, interest (other than from a financial business), dividends, and gains from the sale or disposition of capital assets held for the production of interest or dividends. In the case of a partnership of which a principal activity is the buying and selling of commodities, other than as inventory, or of futures, forwards and options with respect to commodities, qualifying income also includes income and gains from commodities and from futures, forwards, options with respect to commodities and, provided the partnership is a trader or investor with respect to such assets, swaps and other notional principal contracts with respect to commodities. The Fund expects that at least 90% of the Fund’s gross income for each taxable year will consist of qualifying income and that the Fund will be taxed as a partnership for federal income tax purposes. The Fund does not record a provision for income taxes because the shareholders report their share of the Fund’s income or loss on their income tax returns. The financial statements reflect the Fund’s transactions without adjustment, if any, required for income tax purposes.
There is very limited authority on the U.S. federal income tax treatment of bitcoin and no direct authority on bitcoin derivatives, such as Bitcoin Futures Contracts. Bitcoin Futures Contracts more likely than not will be considered futures with respect to commodities for purposes of the qualifying income exception under section 7704 of the Code. Based on a CFTC determination that treats bitcoin as a commodity under the CEA, the Fund intends to take the position that Bitcoin Futures Contracts consist of futures on commodities for purposes of the qualifying income exception under section 7704 of the Code. Shareholders should be aware that the Fund’s position is not binding on the IRS, and no assurance can be given that the IRS will not challenge the Fund’s position, or that the IRS or a court will not ultimately reach a contrary conclusion, which would result in the material adverse consequences to Shareholders and the Fund.
The Fund is required to determine whether a tax position is more likely than not to be sustained upon examination by the applicable taxing authority, including resolution of any related appeals or litigation processes, based on the technical merits of the position. The Fund files an income tax return in the U.S. federal jurisdiction and may file income tax returns in various U.S. states and foreign jurisdictions. For the tax year December 31, 2022, the Fund remains subject to income tax examinations by major taxing authorities. The tax benefit recognized is measured as the largest amount of benefit that has a greater than fifty percent likelihood of being realized upon ultimate settlement. De-recognition of a tax benefit previously recognized results in the Fund recording a tax liability that reduces net assets. This policy has been applied to all existing tax positions upon the Fund’s initial adoption. Based on its analysis, the Fund has determined that it has incurred any liability for unrecognized tax benefits as of September 30, 2023 and for the year ended December 31, 2022. However, the Fund’s conclusions regarding this policy may be subject to review and adjustment at a later date based on factors including, but not limited to, ongoing analysis of and changes to tax laws, regulations, and interpretations thereof.
The Fund recognizes interest accrued related to unrecognized tax benefits and penalties related to unrecognized tax benefits in income tax fees payable, if assessed.
The Fund may be subject to potential examination by U.S. federal, U.S. state, or foreign jurisdictional authorities in the area of income taxes. These potential examinations may include questioning the timing and amount of deductions, the nexus of income among various tax jurisdictions, and compliance with U.S. federal, U.S. state and foreign tax laws.
Creations and Redemptions
Authorized Purchasers may purchase Creation Baskets consisting of
Authorized Purchasers may redeem shares from the Fund only in blocks of
The Fund will receive the proceeds from shares sold or will pay for redeemed shares within three business days after the trade date of the purchase or redemption, respectively. The amounts due from Authorized Purchasers will be reflected in the Fund’s statements of assets and liabilities as capital shares receivable. Amounts payable to Authorized Purchasers upon redemption will be reflected in the Fund’s statements of assets and liabilities as payable for shares redeemed.
As outlined in the most recent Form S-1 filing,
Allocation of Shareholder Income and Losses
Profit or loss is allocated among the shareholders of the Fund in proportion to the number of shares each shareholder holds as of the close of each month.
Cash Equivalents
Cash equivalents are highly liquid investments with maturity dates of 90 days or less when acquired. The Fund reported its cash equivalents in the statements of assets and liabilities at market value, or at carrying amounts that approximate fair value, because of their highly liquid nature and short-term maturities. The Fund has these balances of its assets on deposit with banks. Assets deposited with a financial institution may, at times, exceed federally insured limits. DEFI had a balance of $
Due from/to Broker
The amount recorded by the Fund for the amount due from and to the clearing broker includes, but is not limited to, cash held by the broker, amounts payable to the clearing broker related to open transactions, payables for cryptocurrency futures accounts liquidating to an equity balance on the clearing broker’s records and amounts of brokerage commissions paid and recognized as unrealized losses.
Margin is the minimum amount of funds that must be deposited by a cryptocurrency interest trader with the trader’s broker to initiate and maintain an open position in futures contracts. A margin deposit acts to assure the trader’s performance of the futures contracts purchased or sold. Futures contracts are customarily bought and sold on initial margin that represents a small percentage of the aggregate purchase or sales price of the contract. Because of such low margin requirements, price fluctuations occurring in the futures markets may create profits and losses that, in relation to the amount invested, are greater than customary in other forms of investment or speculation. As discussed below, adverse price changes in the futures contract may result in margin requirements that greatly exceed the initial margin. In addition, the amount of margin required in connection with a particular futures contract is set from time to time by the exchange on which the contract is traded and may be modified from time to time by the exchange during the term of the contract. Brokerage firms, such as the Fund’s clearing brokers, carrying accounts for traders in commodity interest contracts generally require higher amounts of margin as a matter of policy to further protect themselves. Over the counter trading generally involves the extension of credit between counterparties, so the counterparties may agree to require the posting of collateral by one or both parties to address credit exposure.
When a trader purchases an option, there is no margin requirement; however, the option premium must be paid in full. When a trader sells an option, on the other hand, he or she is required to deposit margin in an amount determined by the margin requirements established for the underlying interest and, in addition, an amount substantially equal to the current premium for the option. The margin requirements imposed on the selling of options, although adjusted to reflect the probability that out-of-the-money options will not be exercised, can in fact be higher than those imposed in dealing in the futures markets directly. Complicated margin requirements apply to spreads and conversions, which are complex trading strategies in which a trader acquires a mixture of options positions and positions in the underlying interest.
Ongoing or “maintenance” margin requirements are computed each day by a trader’s clearing broker. When the market value of a particular open futures contract changes to a point where the margin on deposit does not satisfy maintenance margin requirements, a margin call is made by the broker. If the margin call is not met within a reasonable time, the broker may close out the trader’s position. With respect to the Fund’s trading, the Fund (and not its shareholders personally) is subject to margin calls. Finally, many major U.S. exchanges have passed certain cross margining arrangements involving procedures pursuant to which the futures and options positions held in an account would, in the case of some accounts, be aggregated and margin requirements would be assessed on a portfolio basis, measuring the total risk of the combined positions.
Calculation of Net Asset Value
The Fund’s NAV is calculated by:
| • | Taking the current market value of its total assets and | |
| • | Subtracting any liabilities. |
The administrator, Global Fund Services, will calculate the NAV of the Fund once each trading day. It will calculate the NAV as of the earlier of the close of the New York Stock Exchange or 4:00 p.m. (ET). The NAV for a particular trading day will be released after 4:15 p.m. (ET).
In determining the value of Bitcoin Futures Contracts, the Administrator uses the settlement price for the Benchmark Component Futures Contracts, as reported on the CME. CME Group staff determines the daily settlements for the Benchmark Component Futures Contracts based on trading activity on CME Globex exchange between 14:59:00 and 15:00:00 Central Time (CT), the settlement period, except that the “fair value” of Bitcoin Futures Contracts (as described in more detail below) may be used when Bitcoin Futures Contracts close at their price fluctuation limit for the day. The Administrator determines the value of all investments as of the earlier of the close of the New York Stock Exchange or 4:00 p.m. (ET), in accordance with the current Services Agreement between the Administrator and the Trust. NAV includes any unrealized profit or loss on open bitcoin interests and any other credit or debit accruing to the Fund but unpaid or not received by the Fund.
Sponsor Fee Allocation of Expenses and Related Party Transactions
The Sponsor is responsible for investing the assets of the Fund in accordance with the objectives and policies of the Fund. DEFI is contractually obligated to pay a monthly management fee to the Sponsor, based on average daily net assets, at a rate equal to
The Sponsor has the ability to elect to pay certain expenses on behalf of the Funds or waive the management fee. This election is subject to change by the Sponsor, at its discretion. Expenses paid by the Sponsor and Management fees waived by the Sponsor are, if applicable, presented as waived expenses in the statements of operations for each Fund. The Sponsor has determined that there will be no recovery sought for the amounts below in any future period:
| DEFI | ||||
| Three months ended September 30, 2023 | $ | |||
| Three months ended September 30, 2022 (1) | $ | |||
| Nine months ended September 30, 2023 | $ | |||
| Nine months ended September 30, 2022 (1) | $ | |||
(1) The Fund commenced operations on September 15, 2022.
Expenses
Expenses are recorded using the accrual method of accounting.
Use of Estimates
The preparation of financial statements in conformity with accounting principles generally accepted in the United States of America requires management to make estimates and assumptions that affect the reported amount of assets and liabilities and disclosure of contingent assets and liabilities at the date of the financial statements, and the reported amounts of the revenue and expenses during the reporting period. Actual results could differ from those estimates.
New Accounting Pronouncements
The Financial Accounting Standards Board (“FASB”) issued Accounting Standards Update (“ASU”) issued ASU 2023-01, related to Leases – (Topic 842). The response to concerns about applying Topic 842 to related party arrangements between entities under common control. The update was adopted early for the quarter ended March 31, 2023; the adoption did not have a material impact on the financial statements and disclosures of the Trust or the Fund.
Fair Value - Definition and Hierarchy
In accordance with GAAP, fair value is defined as the price that would be received to sell an asset or paid to transfer a liability (i.e., the “exit price”) in an orderly transaction between market participants at the measurement date.
In determining fair value, the Fund uses various valuation approaches. In accordance with GAAP, a fair value hierarchy for inputs is used in measuring fair value that maximizes the use of observable inputs and minimizes the use of unobservable inputs by requiring that the most observable inputs be used when available. Observable inputs are those that market participants would use in pricing the asset or liability based on market data obtained from sources independent of the Fund. Unobservable inputs reflect the Fund’s assumptions about the inputs market participants would use in pricing the asset or liability developed based on the best information available in the circumstances. The fair value hierarchy is categorized into three levels based on the inputs as follows:
Level 1 - Valuations based on unadjusted quoted prices in active markets for identical assets or liabilities that the Fund has the ability to access. Valuation adjustments and block discounts are not applied to Level 1 financial instruments of the Underlying Funds and securities of the Fund, together the “financial instruments”. Since valuations are based on quoted prices that are readily and regularly available in an active market, valuation of these financial instruments does not entail a significant degree of judgment.
Level 2 - Valuations based on quoted prices in markets that are not active or for which all significant inputs are observable, either directly or indirectly.
Level 3 - Valuations based on inputs that are unobservable and significant to the overall fair value measurement.
The availability of valuation techniques and observable inputs can vary from financial instrument to financial instrument and is affected by a wide variety of factors including, the type of financial instrument, whether the financial instrument is new and not yet established in the marketplace, and other characteristics particular to the transaction. To the extent that valuation is based on models or inputs that are less observable or unobservable in the market, the determination of fair value requires more judgment. Those estimated values do not necessarily represent the amounts that may be ultimately realized due to the occurrence of future circumstances that cannot be reasonably determined. Because of the inherent uncertainty of valuation, those estimated values may be materially higher or lower than the values that would have been used had a ready market for the financial instruments existed. Accordingly, the degree of judgment exercised by the Fund in determining fair value is greatest for financial instruments categorized in Level 3. In certain cases, the inputs used to measure fair value may fall into different levels of the fair value hierarchy. In such cases, for disclosure purposes, the level in the fair value hierarchy, within which the fair value measurement in its entirety falls, is determined based on the lowest level input that is significant to the fair value measurement.
On September 30, 2023 and December 31, 2022, the reported value at the close of the market for each cryptocurrency contract fairly reflected the value of the futures and no alternative valuations were required.
Net Income (Loss) per Share
Net income (loss) per share is the difference between the NAV per unit at the beginning of each period and at the end of each period. The weighted average number of units outstanding was computed for purposes of disclosing net income (loss) per weighted average unit. The weighted average units are equal to the number of units outstanding at the end of the period, adjusted proportionately for units created or redeemed based on the amount of time the units were outstanding during such period.
Note 4 – Fair Value Measurements
The Fund’s assets and liabilities recorded at fair value have been categorized based upon a fair value hierarchy as described in the Fund’s significant accounting policies in Note 3. The following table presents information about the Fund’s assets and liabilities measured at fair value as of September 30, 2023 and December 31, 2022:
September 30, 2023
| Balance as of | ||||||||||||||||
| Assets: | Level 1 | Level 2 | Level 3 | September 30, 2023 | ||||||||||||
| Cash Equivalents | $ | $ | $ | $ | ||||||||||||
| Cryptocurrency Futures Contracts | ||||||||||||||||
| Bitcoin futures contracts | ||||||||||||||||
| Total | $ | $ | $ | $ | ||||||||||||
December 31, 2022
| Balance as of | ||||||||||||||||
| Assets: | Level 1 | Level 2 | Level 3 | December 31, 2022 | ||||||||||||
| Cash Equivalents | $ | $ | $ | $ | ||||||||||||
| Bitcoin futures contracts | ||||||||||||||||
| Total | $ | $ | $ | $ | ||||||||||||
For the three and nine months ended September 30, 2023 and year ended December 31, 2022, the Fund did not have any significant transfers between any of the levels of the fair value hierarchy.
See the Fair Value - Definition and Hierarchy section in Note 3 above for an explanation of the transfers into and out of each level of the fair value hierarchy.
Note 5 – Derivative Instruments and Hedging Activities
In the normal course of business, the Fund utilizes derivative contracts in connection with its proprietary trading activities. Investments in derivative contracts are subject to additional risks that can result in a loss of all or part of an investment. The Fund’s derivative activities and exposure to derivative contracts are classified by the following primary underlying risks: interest rate, credit, commodity price, and equity price risks. In addition to its primary underlying risks, the Fund is also subject to additional counterparty risk due to inability of its counterparties to meet the terms of their contracts. For the quarter ended September 30, 2023, the Fund invested only in cryptocurrency futures contracts.
Futures Contracts
The Fund is subject to cryptocurrency price risk in the normal course of pursuing its investment objectives. A futures contract represents a commitment for the future purchase or sale of an asset at a specified price on a specified date.
The purchase and sale of futures contracts requires margin deposits with a Futures Commission Merchant (“FCM”). Subsequent payments (variation margin) are made or received by the Fund each day, depending on the daily fluctuations in the value of the contract, and are recorded as unrealized gains or losses by the Fund. Futures contracts may reduce the Fund’s exposure to counterparty risk since futures contracts are exchange-traded; and the exchange’s clearinghouse, as the counterparty to all exchange-traded futures, guarantees the futures against default.
The Commodity Exchange Act requires an FCM to segregate all customer transactions and assets from the FCM’s proprietary activities. A customer’s cash and other equity deposited with an FCM are considered commingled with all other customer funds subject to the FCM’s segregation requirements. In the event of an FCM’s insolvency, recovery may be limited to the Fund’s pro rata share of segregated customer funds available. It is possible that the recovery amount could be less than the total of cash and other equity deposited.
The following table discloses information about offsetting assets and liabilities presented in the statements of assets and liabilities to enable users of these financial statements to evaluate the effect or potential effect of netting arrangements for recognized assets and liabilities. These recognized assets and liabilities are presented as defined in the Financial Accounting Standards Board’s (“FASB”) Accounting Standards Update (“ASU”) No. 2011-11 “Balance Sheet (Topic 210): Disclosures about Offsetting Assets and Liabilities” and subsequently clarified in FASB ASU 2013-01 “Balance Sheet (Topic 210): Clarifying the Scope of Disclosures about Offsetting Assets and Liabilities.”
The following table also identifies the fair value amounts of derivative instruments included in the statements of assets and liabilities as derivative contracts, categorized by primary underlying risk, and held by the FCMs, StoneX as of September 30, 2023.
*The amount of collateral presented in Collateral, Due from Broker, is limited to the liability for the futures contracts and accordingly does not include the excess collateral pledged.
Offsetting of Financial Assets and Derivative Assets as of September 30, 2023
| (i) | (ii) | (iii) = (i)-(ii) | (iv) | (v)=(iii)-(iv) | ||||||||||||||||||||
| Gross Amount Not Offset in the Statement of Assets and Liabilities | ||||||||||||||||||||||||
| Description | Gross Amount of Recognized Assets | Gross Amount Offset in the Statement of Assets and Liabilities | Net Amount Presented in the Statement of Assets and Liabilities | Futures Contracts Available for Offset | Collateral, Due to Broker | Net Amount | ||||||||||||||||||
| Cryptocurrency Price | ||||||||||||||||||||||||
| Bitcoin futures contracts | $ | $ | $ | $ | $ | $ | ||||||||||||||||||
Offsetting of Financial Assets and Derivative Assets as of December 31, 2022
| (i) | (ii) | (iii) = (i)-(ii) | (iv) | (v)=(iii)-(iv) | ||||||||||||||||||||
| Gross Amount Not Offset in the Statement of Assets and Liabilities | ||||||||||||||||||||||||
| Description | Gross Amount of Recognized Assets | Gross Amount Offset in the Statement of Assets and Liabilities | Net Amount Presented in the Statement of Assets and Liabilities | Futures Contracts Available for Offset | Collateral, Due from Broker* | Net Amount | ||||||||||||||||||
| Cryptocurrency Price | ||||||||||||||||||||||||
| Bitcoin futures contracts | $ | $ | $ | $ | $ | $ | ||||||||||||||||||
The following tables identify the net gain and loss amounts included in the statements of operations as realized and unrealized gains and losses on trading of cryptocurrency futures contracts categorized by primary underlying risk:
Three months ended September 30, 2023
| Realized Loss on Cryptocurrency Futures Contracts | Net Change in Unrealized Depreciation on Cryptocurrency Futures Contracts | |||||||
| Cryptocurrency Price | ||||||||
| Bitcoin futures Contracts | $ | ( | ) | $ | ( | ) | ||
Nine months ended September 30, 2023
| Realized Loss on Cryptocurrency Futures Contracts | Net Change in Unrealized Depreciation on Cryptocurrency Futures Contracts | |||||||
| Cryptocurrency Price | ||||||||
| Bitcoin futures Contracts | $ | $ | ( | ) | ||||
From the commencement of operations ( September 15, 2022) through September 30, 2022
| Realized Loss on Cryptocurrency Futures Contracts | Net Change in Unrealized Depreciation on Cryptocurrency Futures Contracts | |||||||
| Cryptocurrency Price | ||||||||
| Bitcoin futures Contracts | $ | ( | ) | $ | ( | ) | ||
Volume of Derivative Activities
The average notional market value categorized by primary underlying risk for all futures contracts held was $
Note 6 – Financial Highlights
The following table presents per unit performance data and other supplemental financial data for the three and nine months ended September 30, 2023 and from the commencement of operations ( September 15, 2022) through September 30, 2022. This information has been derived from information presented in the financial statements and is presented with total expenses gross of expenses waived by the Sponsor and with total expenses net of expenses waived by the Sponsor, as appropriate.
| Three months ended | Nine months ended | From the commencement of operations (September 15, 2022) | ||||||||||
| September 30, 2023 | September 30, 2023 | through September 30, 2022 | ||||||||||
| Per Share Operation Performance | ||||||||||||
| Net asset value at beginning of period | $ | $ | $ | |||||||||
| Income (loss) from investment operations: | ||||||||||||
| Investment income | ||||||||||||
| Net realized and unrealized (loss) gain on cryptocurrency futures contracts | ( | ) | ( | ) | ||||||||
| Total expenses, net | ( | ) | ( | ) | ( | ) | ||||||
| Net (decrease) increase in net asset value | ( | ) | ( | ) | ||||||||
| Net asset value at end of period | $ | $ | $ | |||||||||
| Total Return | - | % | % | - | % | |||||||
| Ratios to Average Net Assets (Annualized) | ||||||||||||
| Total expenses | % | % | % | |||||||||
| Total expenses, net | % | % | % | |||||||||
| Net investment income | % | % | % | |||||||||
The financial highlights per share data are calculated consistent with the methodology used to calculate asset-based fees and expenses.
Note 7 – Organizational and Offering Costs
Expenses incurred in organizing of the Trust and the initial offering of the Shares of the Fund, including applicable SEC registration fees, were borne directly by the Sponsor. The Fund will not be obligated to reimburse the Sponsor.
Note 8 – Subsequent Events
Management has evaluated the financial statements for the quarter-ended September 30, 2023 for subsequent events through the date of this filing and noted no material events requiring either recognition through the date of the filing or disclosure herein for the Fund other than those noted below:
The total net assets of the Fund increased by $
Teucrium Commodity Trust (“Target Trust’), on behalf of its series, Hashdex Bitcoin Futures ETF (“Target Fund”), and Tidal Commodities Trust I (“Acquiring Trust”), on behalf of its series, Hashdex Bitcoin Futures ETF (“Acquiring Fund”), entered into an Agreement and Plan of Partnership Merger and Liquidation dated as of October 30, 2023 (the “Plan of Merger”). The Merger is scheduled to close on or about January 3, 2024 (the “Closing Date”).
Pursuant to the Plan of Merger, each Acquired Fund shareholder will receive one share of the Acquiring Fund for every one share of the Acquired Fund held on the Closing Date based on the net asset value per share of the Acquiring Fund being equal to the net asset value per share of the Acquired Fund determined immediately prior to the Merger closing. Further, the Acquiring Fund will acquire all the assets of the Acquired Fund and assume all the liabilities of the Acquired Fund. Upon the Merger closing, the Plan of Merger will cause all of the Acquired Fund’s shares to be cancelled and the Acquired Fund to be liquidated.
The Merger will not materially modify the rights of Acquired Fund shareholders with respect to their investment. The Acquiring Fund has the same investment objective, investment strategies and investment restrictions, and substantially identical investment risks, as the Acquired Fund. Following the Merger, the Acquiring Fund will be sponsored by Toroso Investments LLC (“Toroso”) and the Acquiring Fund will be managed by portfolio managers employed by Toroso. Toroso is not affiliated with the current sponsor of the Target Trust, Teucrium Trading LLC (“Teucrium”). The Acquiring Fund will pay the same management fee rate to Toroso, under the same terms, as currently paid by the Acquired Fund to Teucrium. The management fee for the Acquiring Fund is
In connection with the Merger, the Acquiring Trust filed a Registration Statement on Form S-4 and Pre-Effective Amendment No. 1 to a Registration Statement on Form S-1 with the U.S. Securities and Exchange Commission, on October 31, 2023 and November 2, 2023, respectively.
Item 2. Management’s Discussion and Analysis of Financial Condition and Results of Operations.
This information should be read in conjunction with the financial statements and notes included in Item 1 of Part I of this Quarterly Report (the “Report”). The discussion and analysis which follows may contain trend analysis and other forward-looking statements within the meaning of Section 21E of the Securities Exchange Act of 1934 which reflect our current views with respect to future events and financial results. Words such as “anticipate,” “expect,” “intend,” “plan,” “believe,” “seek,” “outlook” and “estimate,” as well as similar words and phrases, signify forward-looking statements. Teucrium Commodity Trust’s (the “Trust’s”) forward-looking statements are not a guarantee of future results and conditions, and important factors, risks and uncertainties may cause our actual results to differ materially from those expressed in our forward-looking statements.
You should not place undue reliance on any forward-looking statements. Except as expressly required by the Federal securities laws, Teucrium Trading, LLC (the “Sponsor”) undertakes no obligation to publicly update or revise any forward-looking statements or the risks, uncertainties or other factors described in this Report, as a result of new information, future events or changed circumstances or for any other reason after the date of this Report.
Overview/Introduction
Teucrium Commodity Trust (“Trust”), a Delaware statutory trust organized on September 11, 2009, is a series trust consisting of six series: Teucrium Corn Fund (“CORN”), Teucrium Sugar Fund (“CANE”), Teucrium Soybean Fund (“SOYB”), Teucrium Wheat Fund (“WEAT”), Teucrium Agricultural Fund (collectively, “the Agricultural Funds”) and Hashdex Bitcoin Futures ETF (“DEFI”). All of the series of the Trust are collectively referred to as the “Funds” and singularly as the “Fund.” Each Fund is a commodity pool that is a series of the Trust. The Funds issue common units, called the “Shares,” representing fractional undivided beneficial interests in a Fund. Effective as of April 26, 2019, the Trust and the Funds operate pursuant to the Trust’s Fifth Amended and Restated Declaration of Trust and Trust Agreement (the “Trust Agreement”).
On June 7, 2010, the initial Form S-1 for CORN was declared effective by the U.S. Securities and Exchange Commission (“SEC”). On June 8, 2010, four Creation Baskets for CORN were issued representing 200,000 shares and $5,000,000. CORN began trading on the New York Stock Exchange (“NYSE”) Arca on June 9, 2010. The current registration statement for CORN was declared effective by the SEC on April 7, 2022. This registration statement for CORN registered an indeterminate number of shares.
On June 13, 2011, the initial Forms S-1 for CANE, SOYB, and WEAT were declared effective by the SEC. On September 16, 2011, two Creation Baskets were issued for each Fund, representing 100,000 shares and $2,500,000, for CANE, SOYB, and WEAT. On September 19, 2011, CANE, SOYB, and WEAT started trading on the NYSE Arca. The current registration statements for SOYB and CANE were declared effective by the SEC on April 7, 2022. The registration statements for SOYB and CANE registered an indeterminate number of shares each. The current registration statement for WEAT was declared effective on March 9, 2022. This registration statement for WEAT registered an indeterminate number of shares.
On February 10, 2012, the Form S-1 for TAGS was declared effective by the SEC. On March 27, 2012, six Creation Baskets for TAGS were issued representing 300,000 shares and $15,000,000. TAGS began trading on the NYSE Arca on March 28, 2012. The current registration statement for TAGS was declared effective by the SEC on April 7, 2022. This registration statement for TAGS registered an indeterminate number of shares.
On September 14, 2022, the Form S-1 for DEFI was declared effective by the SEC. On September 15, 2022, five Creation Baskets for DEFI were issued representing 50,000 shares and $1,250,000. DEFI began trading on the NYSE Arca on September 16, 2022. This registration statement for DEFI registered an indeterminate number of shares.
The occurrence of a severe weather event, natural disaster, terrorist attack, geopolitical events, outbreak, or public health emergency as declared by the World Health Organization, the continuation or expansion of war or other hostilities, or a prolonged government shutdown may have significant adverse effects on an Agricultural Fund and its investments and alter current assumptions and expectations. For example, in late February 2022, Russia invaded Ukraine, significantly amplifying already existing geopolitical tensions among Russia and other countries in the region and in the west. The responses of countries and political bodies to Russia’s actions, the larger overarching tensions, and Ukraine’s military response and the potential for wider conflict may increase financial market volatility generally, have severe adverse effects on regional and global economic markets, and cause volatility in the price of agricultural commodities, agricultural futures and the share price of an Agricultural Funds.
A climate of uncertainty and panic, including the contagion of the COVID-19 virus and other infectious viruses or diseases, may adversely affect global, regional, and local economies and reduce the availability of potential investment opportunities, and increases the difficulty of performing due diligence and modeling market conditions, potentially reducing the accuracy of financial projections. Under these circumstances, the Funds may have difficulty achieving their investment objectives which may adversely impact performance. Further, such events can be highly disruptive to economies and markets, significantly disrupt the operations of individual companies (including, but not limited to, the Funds’ Sponsor and third-party service providers), sectors, industries, markets, securities and commodity exchanges, currencies, interest and inflation rates, credit ratings, investor sentiment, and other factors affecting the value of the Funds’ investments. These factors could cause substantial market volatility, exchange trading suspensions and closures that could impact the ability of the Funds to complete redemptions and otherwise affect Fund performance and Fund trading in the secondary market. A widespread crisis may also affect the global economy in ways that cannot necessarily be foreseen at the current time. How long such events will last and whether they will continue or recur cannot be predicted. Impacts from these events could have significant impact on a Fund’s performance, resulting in losses to your investment. The global economic shocks being experienced as of the date hereof may cause the underlying assumptions and expectations of the Funds to become outdated quickly or inaccurate, resulting in significant losses.
In addition, DEFI is subject to the risks associated with bitcoin. Bitcoin is a digital asset or cryptocurrency that is a unit of account on the “Bitcoin Network,” an open source, decentralized peer-to-peer computer network. The ownership and operation of bitcoin is determined by purchasers in the Bitcoin Network. The Bitcoin Network connects computers that run publicly accessible, or open source, software that follows the rules and procedures governing the Bitcoin Network. This is commonly referred to as the Bitcoin Protocol. Bitcoin may be held, may be used to purchase goods and services or may be exchanged for fiat currency. No single entity owns or operates the Bitcoin Network, and the value of bitcoin is not backed by any government, corporation, or other entity. Instead, the value of bitcoin is determined in part by the supply and demand in markets created to facilitate the trading of bitcoin. Public key cryptography protects the ownership and transaction records for bitcoin. Because the source code for the Bitcoin Network is open source, anyone can contribute to its development. At this time, the ultimate supply of bitcoin is finite and limited to 21 million “coins” with the number of bitcoin available increasing gradually as new bitcoin supplies are mined until the 21 million current protocol cap is reached. The following factors, among others, may affect the price and market for bitcoin: DEFI does not invest directly in bitcoin.
| ● |
How widely bitcoin is adopted, including the use of bitcoin as a payment. |
| ● |
The regulatory environment for cryptocurrencies, which continues to evolve in the U.S., and which may delay, impede, or restrict the adoption or use of bitcoin. |
| ● |
Speculative activity in the market for bitcoin, including by holders of large amounts of bitcoin, which may increase volatility. |
| ● |
Cyberattacks, including the risk that malicious actors will exploit flaws in the code or structure of bitcoin, control the blockchain, steal information or cause disruptions to the internet. |
| ● |
Rewards for mining bitcoin are designed to decline over time, which may lessen the incentive for miners to process and confirm transactions on the Bitcoin Network. |
| ● |
The open-source nature of the Bitcoin Network may result in forks, or changes to the underlying code of bitcoin that result in the creation of new, separate digital assets. |
| ● |
Fraud, manipulation, security failure or operational problems at bitcoin exchanges that result in a decline in adoption or acceptance of bitcoin. |
| ● |
Scalability as the use of bitcoin expands to a greater number of users. |
The Investment Objective of the Funds
The investment objective of CORN is to have the daily changes in the NAV of the Fund’s Shares reflect the daily changes in the corn market for future delivery as measured by the Benchmark. The Benchmark is a weighted average of the closing settlement prices for three futures contracts for corn (“Corn Futures Contracts”) that are traded on the Chicago Board of Trade (“CBOT”):
CORN Benchmark
| CBOT Corn Futures Contract |
Weighting |
|||
| Second to expire |
35 | % |
||
| Third to expire |
30 | % |
||
| December following the third to expire |
35 | % |
||
The investment objective of SOYB is to have the daily changes in the NAV of the Fund’s Shares reflect the daily changes in the soybean market for future delivery as measured by the Benchmark. The Benchmark is a weighted average of the closing settlement prices for three futures contracts for soybeans (“Soybean Futures Contracts”) that are traded on the Chicago Board of Trade (“CBOT”):
SOYB Benchmark
| CBOT Soybean Futures Contract |
Weighting |
|||
| Second to expire (excluding August & September) |
35 | % |
||
| Third to expire (excluding August & September) |
30 | % |
||
| Expiring in the November following the expiration of the third to expire contract |
35 | % |
||
The investment objective of CANE is to have the daily changes in the NAV of the Fund’s Shares reflect the daily changes in the sugar market for future delivery as measured by the Benchmark. The Benchmark is a weighted average of the closing settlement prices for three futures contracts for No. 11 sugar (“Sugar Futures Contracts”) that are traded on the ICE Futures US (“ICE”):
CANE Benchmark
| ICE Sugar Futures Contract |
Weighting |
|||
| Second to expire |
35 | % |
||
| Third to expire |
30 | % |
||
| Expiring in the March following the expiration of the third to expire contract |
35 | % |
||
The investment objective of WEAT is to have the daily changes in the NAV of the Fund’s Shares reflect the daily changes in the wheat market for future delivery as measured by the Benchmark. The Benchmark is a weighted average of the closing settlement prices for three futures contracts for wheat (“Wheat Futures Contracts”) that are traded on the Chicago Board of Trade (“CBOT”):
WEAT Benchmark
| CBOT Wheat Futures Contract |
Weighting |
|||
| Second to expire |
35 | % |
||
| Third to expire |
30 | % |
||
| December following the third to expire |
35 | % |
||
The investment objective of TAGS is to provide daily investment results that reflect the combined daily performance of four other commodity pools, specifically CORN, SOYB, CANE and WEAT (the “Underlying Funds”). Under normal market conditions, the Fund seeks to achieve its investment objective generally by investing equally in shares of each Underlying Fund and, to a lesser extent, cash equivalents. The Fund’s investments in shares of Underlying Funds are rebalanced, generally on a daily basis, in order to maintain approximately a 25% allocation of the Fund’s assets to each Underlying Fund:
TAGS Benchmark
| Underlying Fund |
Weighting |
|||
| CORN |
25 | % |
||
| SOYB |
25 | % |
||
| CANE |
25 | % |
||
| WEAT |
25 | % |
||
The investment objective of DEFI is to have the daily changes in the NAV of the Fund’s Shares reflect the daily changes of the price of the Hashdex U.S. Bitcoin Futures Fund Benchmark (the “Benchmark”), less expenses from the Fund’s operations. The Benchmark is currently the average of the closing settlement prices for the first to expire and second to expire bitcoin futures contracts (“Bitcoin Futures Contracts”) listed on the Chicago Mercantile Exchange Inc. (“CME”).
DEFI Benchmark
| CME Bitcoin Futures Contract |
Weighting |
|||
| First to expire |
50 | % |
||
| Second to expire |
50 | % |
||
The notional amount of each Benchmark Component Futures Contract included in each Benchmark is intended to reflect the changes in market value of each such Benchmark Component Futures Contract within the Benchmark. The closing level of each Benchmark is calculated on each business day by U.S. Bank Global Fund Services (“Global Fund Services”) based on the closing price of the futures contracts for each of the underlying Benchmark Component Futures Contracts and the notional amounts of such Benchmark Component Futures Contracts.
Each Benchmark is rebalanced periodically to ensure that each of the Benchmark Component Futures Contracts is weighted in the same proportion as in the investment objective for each Fund. The following tables reflect the September 30, 2023, Benchmark Component Futures Contracts weights for each of the Funds, the contract held is identified by the generally accepted nomenclature of contract month and year, which may differ from the month in which the contract expires:
| CORN Benchmark Component Futures Contracts |
Notional Value |
Weight (%) |
||||||
| CBOT Corn Futures (1,286 contracts, MAR24) |
$ | 31,619,525 | 35 | % |
||||
| CBOT Corn Futures (1,084 contracts, MAY24) |
27,127,100 | 30 | ||||||
| CBOT Corn Futures (1,248 contracts, DEC24) |
31,652,400 | 35 | ||||||
| Total at September 30, 2023 |
$ | 90,399,025 | 100 | % |
||||
| SOYB Benchmark Component Futures Contracts |
Notional Value |
Weight (%) |
||||||
| CBOT Soybean Futures (167 contracts, JAN24) |
$ | 10,809,075 | 35 | % | ||||
| CBOT Soybean Futures (142 contracts, JAN24) |
9,302,775 | 30 | ||||||
| CBOT Soybean Futures (176 contracts, NOV24) |
11,088,000 | 35 | ||||||
| Total at September 30, 2023 |
$ | 31,199,850 | 100 | % |
||||
| CANE Benchmark Component Futures Contracts |
Notional Value |
Weight (%) |
||||||
| ICE Sugar Futures (301 contracts, MAY24) |
$ | 8,515,651 | 35 | % |
||||
| ICE Sugar Futures (268 contracts, JUL24) |
7,293,888 | 30 | ||||||
| ICE Sugar Futures (321 contracts, MAR25) |
8,552,981 | 35 | ||||||
| Total at September 30, 2023 |
$ | 24,362,520 | 100 | % |
||||
| WEAT Benchmark Component Futures Contracts |
Notional Value |
Weight (%) |
||||||
| CBOT Wheat Futures (2,329 contracts, MAR24) |
$ | 66,784,075 | 34 | % |
||||
| CBOT Wheat Futures (1,943 contracts, MAY24) |
57,799,963 | 30 | ||||||
| CBOT Wheat Futures (2,140 contracts, DEC24) |
69,309,250 | 36 | ||||||
| Total at September 30, 2023 |
$ | 193,873,288 | 100 | % |
||||
| TAGS Benchmark Component Futures Contracts |
Fair Value |
Weight (%) |
||||||
| Shares of Teucrium Corn Fund (257,033 shares) |
$ | 5,670,302 | 26 | % |
||||
| Shares of Teucrium Soybean Fund (203,005 shares) |
5,503,425 | 25 | ||||||
| Shares of Teucrium Wheat Fund (955,742 shares) |
5,322,814 | 24 | ||||||
| Shares of Teucrium Sugar Fund (371,271 shares) |
5,479,366 | 25 | ||||||
| Total at September 30, 2023 |
$ | 21,975,907 | 100 | % |
||||
| DEFI Benchmark Component Futures Contracts |
Notional Value |
Weight (%) |
||||||
| CME Bitcoin Futures (6 contracts, OCT23) |
$ | 813,000 | 50 | % | ||||
| CME Bitcoin Futures (6 contracts, NOV23) |
818,250 | 50 | ||||||
| Total at September 30, 2023 |
$ | 1,631,250 | 100 | % |
||||
The price relationship between the near month Futures Contract to expire and the Benchmark Component Futures Contracts will vary and may impact both the total return of each Fund over time and the degree to which such total return tracks the total return of the price indices related to the commodity of each Fund. In cases in which the near month contract’s price is lower than later expiring contracts’ prices (a situation known as “contango” in the futures markets), then absent the impact of the overall movement in commodity prices the value of the Benchmark Component Futures Contracts would tend to decline as they approach expiration. In cases in which the near month contract’s price is higher than later expiring contracts’ prices (a situation known as “backwardation” in the futures markets), then absent the impact of the overall movement in a Fund’s prices the value of the Benchmark Component Futures Contracts would tend to rise as they approach expiration, all other things being equal.
The total portfolio composition for each Fund is disclosed each business day that the NYSE Arca is open for trading on the Sponsor’s website. The website for the Agricultural Funds and the Sponsor is www.teucrium.com. The website for the Hashdex Bitcoin Futures ETF is www.hashdex-etfs.com. The website(s) are accessible at no charge. The website disclosure of portfolio holdings is made daily and includes, as applicable, the name and value of each Futures Contract, other commodity or cryptocurrency interests and the amount of cash and cash equivalents held in the Fund’s portfolio. The specific types of other commodity interests held (if any, which may include options on futures contracts and derivative contracts such as swaps) collectively, “Other Commodity Interests,” and together with Futures Contracts, “Commodity Interests” or “Interests” in addition to futures contracts, options on futures contracts and derivative contracts that are tied to various commodities are entered into outside of public exchanges. These “over the counter” contracts are entered into between two parties in private contracts, or on a recently formed swap execution facility (“SEF”) for standardized swaps. For example, unlike Futures Contracts, which are guaranteed by a clearing organization, each party to an over the counter derivative contract bears the credit risk of the other party (unless such over the counter swap is cleared through a derivatives clearing organization (“DCO”), i.e., the risk that the other party will not be able to perform its obligations under its contract, and characteristics of such Other Commodity Interests.
Consistent with achieving a Fund’s investment objective of closely tracking the Benchmark, the Sponsor may for certain reasons cause a Fund to enter into or hold Futures Contracts other than the Benchmark Component Futures Contracts and/or Other Commodity or Cryptocurrency Interests. Other Commodity or Cryptocurrency Interests that do not have standardized terms and are not exchange traded, referred to as “over the counter” Commodity or Cryptocurrency Interests, can generally be structured as the parties to the Commodity or Cryptocurrency Interest contract desire. Therefore, each Fund might enter into multiple and/or over the counter Interests intended to replicate the performance of each of the Benchmark Component Futures Contracts for a Fund, or a single over the counter Interest designed to replicate the performance of the Benchmark as a whole. Assuming that there is no default by a counterparty to an over the counter Interest, the performance of the Interest will necessarily correlate with the performance of the Benchmark or the applicable Benchmark Component Futures Contract. Each Fund might also enter into or hold Interests other than Benchmark Component Futures Contracts to facilitate effective trading, consistent with the discussion of the Fund’s “roll” strategy. In addition, each Fund might enter into or hold Interests that would be expected to alleviate overall deviation between the Fund’s performance and that of the Benchmark that may result from certain market and trading inefficiencies or other reasons. By utilizing certain or all of the investments described above, the Sponsor will endeavor to cause the Fund’s performance to closely track that of the Benchmark of each Fund.
An “exchange for related position” (“EFRP”) can be used by each Agricultural Fund as a technique to facilitate the exchanging of a futures hedge position against a creation or redemption order, and thus each Fund may use an EFRP transaction in connection with the creation and redemption of shares. The market specialist/market maker that is the ultimate purchaser or seller of shares in connection with the creation or redemption basket, respectively, agrees to sell or purchase a corresponding offsetting futures position which is then settled on the same business day as a cleared futures transaction by the FCMs. The Fund will become subject to the credit risk of the market specialist/market maker until the EFRP is settled within the business day, which is typically 7 hours or less. Each Fund reports all activity related to EFRP transactions under the procedures and guidelines of the CFTC and the exchanges on which the futures are traded.
The Funds seek to earn interest and other income (“interest income”) from cash equivalents that it purchases and, on the cash it holds through the Custodian or other financial institutions. The Sponsor anticipates that the interest income will increase the NAV of each Fund. The Funds apply the interest income to the acquisition of additional investments or use it to pay its expenses. If the Fund reinvests the earned interest income, it makes investments that are consistent with its investment objectives as disclosed. Any cash equivalent invested by a Fund will have original maturity dates of three and nine months or less at inception. Any cash equivalent invested by a Fund will be deemed by the Sponsor to be of investment grade quality. As of September 30, 2023, available cash balances in each of the Funds were invested in the First American Government Obligations Fund – Class X, Goldman Sachs Financial Square Government Fund, in demand deposits at Capital One, and in commercial paper with maturities of ninety days or less. Additionally, the CORN, SOYB, CANE, WEAT and DEFI Funds may invest a portion of the amount of funds required to be deposited with the FCM as initial margin in U.S. Treasury obligations with time to maturity of 90 days or less. The obligations are purchased and held in the respective Fund accounts through the FCM.
In managing the assets of the Funds, the Sponsor does not use a technical trading system that automatically issues buy and sell orders. Instead, the Sponsor will purchase or sell the specific underlying Commodity or Cryptocurrency Interests with an aggregate market value that approximates the amount of cash received or paid upon the purchase or redemption of Shares.
The Sponsor anticipates managing each Fund in a way that tracks the stated benchmark. The Agricultural Funds’ benchmarks do not hold spot futures and therefore do not anticipate letting the commodity Futures Contracts of any Fund expire, thus avoiding delivery of the underlying commodity. instead, the Sponsor will close out existing positions, for instance, in response to ordinary scheduled changes in the Benchmark or, if at the Sponsor’s sole discretion, it otherwise determines it would be appropriate to do so, will reinvest the proceeds in new Commodity or Cryptocurrency Interests. Positions may also be closed out to meet redemption orders, in which case the proceeds from closing the positions are not reinvested. DEFI does hold spot month futures, but the Fund will trade or roll these contracts on the exchange before delivery or receipt of the underlying cryptocurrency is required.
The Sponsor employs a “neutral” investment strategy intended to track the changes in the Benchmark of each Fund regardless of whether the Benchmark goes up or goes down. The Fund’s “neutral” investment strategy is designed to permit investors generally to purchase and sell the Fund’s Shares for the purpose of investing indirectly in the commodity specific market in a cost-effective manner. Such investors may include participants in the specific industry and other industries seeking to hedge the risk of losses in their commodity specific related transactions, as well as investors seeking exposure to that commodity market. Accordingly, depending on the investment objective of an individual investor, the risks generally associated with investing in the commodity or cryptocurrency specific market and/or the risks involved in hedging may exist. In addition, an investment in a Fund involves the risk that the changes in the price of the Fund’s Shares will not accurately track the changes in the Benchmark, and that changes in the Benchmark will not closely correlate with changes in the price of the commodity or cryptocurrency on the spot market. The Sponsor does not intend to operate each Fund in a fashion such that its per share NAV equals, in dollar terms, the spot price of the commodity or the price of any particular commodity or cryptocurrency specific Futures Contract.
The Sponsor
Teucrium Trading, LLC is the sponsor of the Trust and each of the series of the Trust. The Sponsor is a Delaware limited liability company, formed on July 28, 2009. The principal office is located at Three Main Street, Suite 215, Burlington, Vermont 05401. The Sponsor is registered as a commodity pool operator (“CPO”) and a commodity trading adviser (“CTA”) with the Commodity Futures Trading Commission (“CFTC”) and is a member of the National Futures Association (“NFA”). Teucrium Investment Advisors, LLC, a wholly owned subsidiary of Teucrium Trading, LLC, is a Delaware limited liability company, which was formed on January 4, 2022. Teucrium Investment Advisors, LLC is a U.S. SEC registered investment advisor. Teucrium Investment Advisors, LLC was registered with the CFTC as a CPO on May 2, 2022, a CTA on May 2, 2022, and a Swap Firm on May 9, 2022. Teucrium Investment Advisors, LLC became a member of the NFA on May 9, 2022. Teucrium became a listed principal of Teucrium Investment Advisors, LLC on May 20, 2022.
Effective July 2, 2023, ConvexityShares LLC ("ConvexityShares") resigned from its position as sponsor of the ConvexityShares Trust (the “ConvexityShares Trust”) and Teucrium Trading, LLC was appointed concurrently as the new sponsor of the ConvexityShares Trust. The ConvexityShares Trust filed a current report on Form 8-K on July 3, 2023, describing the transactions pursuant to which Teucrium Trading, LLC, replaced ConvexityShares as sponsor of the ConvexityShares Trust. The Form 8-K can be found here: https://www.sec.gov/ix?doc=/Archives/edgar/data/1817218/000121390023053886/ea181271-8k_convexity.htm.
Additionally, Teucrium Trading LLC, as the sponsor of ConvexityShares Trust, announced in a press release dated November 1, 2023 that it will close the ConvexityShares Daily 1.5 SPIKES Futures ETF and ConvexityShares 1x SPIKES Futures ETF (together, the “ConvexityShares Funds”). Teucrium Trading, LLC, determined that the closure of the ConvexityShares Funds is advisable because of a recent announcement by the Minneapolis Grain Exchange, LLC (“MGEX”) that the SPIKES™ Volatility Index Futures (“SPIKES Futures”) in which the ConvexityShares Funds invest will cease trading at close of trading (4:00pm CT) on Friday, December 29, 2023. Therefore, MGEX has filed to suspend trading and clearing of certain previously listed SPIKES Futures contracts that expire in or after January 2024. Further detail may be obtained by accessing the Form 8-K filed by the Teucrium Commodities Trust on November 1, 2023, available here: https://www.sec.gov/ix?doc=/Archives/edgar/data/1817218/000121390023081930/ea187567-8k_convexity.htm.
The Trust and the Funds operate pursuant to the Trust Agreement. Under the Trust Agreement, the Sponsor is solely responsible for management and conducts or directs the conduct of the business of the Trust, the Fund, and any series of the Trust that may from time to time be established and designated by the Sponsor. The Sponsor is required to oversee the purchase and sale of Shares by Authorized Purchasers and to manage the Fund’s investments, including to evaluate the credit risk of FCMs and swap counterparties and to review daily positions and margin/collateral requirements. The Sponsor has the power to enter into agreements as may be necessary or appropriate for the offer and sale of the Fund’s Shares and the oversight of the Trust’s activities. Accordingly, the Sponsor is responsible for selecting the Trustee, Administrator, Distributor, the independent registered public accounting firm of the Trust, and any legal counsel employed by the Trust. The Sponsor is also responsible for preparing and filing periodic reports on behalf of the Trust with the SEC and will provide any required certification for such reports. No person other than the Sponsor and its principals was involved in the organization of the Trust or the Fund.
Teucrium Trading, LLC designs the Funds to offer liquidity, transparency, and capacity in single-commodity investing for a variety of investors, including institutions and individuals, in an exchange-traded product format. The Funds have also been designed to mitigate the impacts of contango and backwardation, situations that can occur in the course of commodity trading which can affect the potential returns to investors. Backwardation is defined as a market condition in which a futures price of a commodity is lower in the distant delivery months than in the near delivery months, while contango, the opposite of backwardation, is defined as a condition in which distant delivery prices for futures exceed spot prices, often due to the costs of storing and insuring the underlying commodity.
The Sponsor has a patent on certain business methods and procedures used with respect to the Funds.
Performance Summary
This report covers the periods from January 1 to September 30, 2023 for CORN, SOYB, CANE, WEAT, TAGS and DEFI. Total expenses are presented both gross and net of any expenses waived or paid by the Sponsor that would have been incurred by the Funds (“expenses waived by the Sponsor”).
| CORN Per Share Operation Performance |
||||
| Net asset value at beginning of period |
$ | 26.90 | ||
| Income from investment operations: |
||||
| Investment income |
0.88 | |||
| Net realized and unrealized loss on commodity futures contracts |
(5.26 | ) | ||
| Total expenses |
(0.46 | ) | ||
| Net decrease in net asset value |
(4.84 | ) | ||
| Net asset value end of period |
$ | 22.06 | ||
| Total Return |
-17.98 | % | ||
| Ratios to Average Net Assets (Annualized) |
||||
| Total expenses |
2.51 | % | ||
| Total expenses, net |
2.51 | % | ||
| Net investment income (loss) |
2.32 | % |
| SOYB Per Share Operation Performance |
||||
| Net asset value at beginning of period |
$ | 28.50 | ||
| Income from investment operations: |
||||
| Investment income |
1.00 | |||
| Net realized and unrealized loss on commodity futures contracts |
(1.76 | ) | ||
| Total expenses, net |
(0.63 | ) | ||
| Net decrease in net asset value |
(1.39 | ) | ||
| Net asset value at end of period |
$ | 27.11 | ||
| Total Return |
-4.89 | % | ||
| Ratios to Average Net Assets (Annualized) |
||||
| Total expenses |
3.05 | % | ||
| Total expenses, net |
3.05 | % | ||
| Net investment income (loss) |
1.81 | % |
| CANE Per Share Operation Performance |
||||
| Net asset value at beginning of period |
$ | 9.51 | ||
| Income (loss) from investment operations: |
||||
| Investment income |
0.45 | |||
| Net realized and unrealized gain on commodity futures contracts |
5.07 | |||
| Total expenses, net |
(0.28 | ) | ||
| Net increase in net asset value |
5.24 | |||
| Net asset value at end of period |
$ | 14.76 | ||
| Total Return |
55.11 | % | ||
| Ratios to Average Net Assets (Annualized) |
||||
| Total expenses |
3.04 | % | ||
| Total expenses, net |
3.04 | % | ||
| Net investment income (loss) |
1.86 | % |
| WEAT Per Share Operation Performance |
||||
| Net asset value at beginning of period |
$ | 7.99 | ||
| Income (loss) from investment operations: |
||||
| Investment income |
0.23 | |||
| Net realized and unrealized loss on commodity futures contracts |
(2.52 | ) | ||
| Total expenses, net |
(0.13 | ) | ||
| Net decrease in net asset value |
(2.42 | ) | ||
| Net asset value at end of period |
$ | 5.57 | ||
| Total Return |
-30.25 | % | ||
| Ratios to Average Net Assets (Annualized) |
||||
| Total expenses |
2.67 | % | ||
| Total expenses, net |
2.67 | % | ||
| Net investment income (loss) |
2.13 | % |
| TAGS Per Share Operation Performance |
||||
| Net asset value at beginning of period |
$ | 31.35 | ||
| Income from investment operations: |
||||
| Net realized and unrealized loss on investment transactions |
(1.00 | ) | ||
| Total expenses |
(0.02 | ) | ||
| Net decrease in net asset value |
(1.02 | ) | ||
| Net asset value at end of period |
30.33 | |||
| Total Return |
-3.25 | % | ||
| Ratios to Average Net Assets (Annualized) |
||||
| Total expenses |
1.67 | % | ||
| Total expenses, net |
0.09 | % | ||
| Net investment loss |
-0.09 | % |
| DEFI Per Share Operation Performance |
||||
| Net asset value at beginning of period |
$ | 21.40 | ||
| Income from investment operations: |
||||
| Investment income |
1.06 | |||
| Net realized and unrealized gain on cryptocurrency futures contracts |
11.21 | |||
| Total expenses |
(0.23 | ) | ||
| Net increase in net asset value |
12.04 | |||
| Net asset value at end of period |
$ | 33.44 | ||
| Total Return |
56.23 | % | ||
| Ratios to Average Net Assets (Annualized) |
||||
| Total expenses |
17.69 | % | ||
| Total expenses, net |
0.94 | % | ||
| Net investment income |
3.28 | % |
Past performance of a Fund is not necessarily indicative of future performance.
Results of Operations
The following includes a section for each Fund of the Trust.
The discussion below addresses the material changes in the results of operations for the three and nine months ended September 30, 2023 compared to the same period in 2022. The following includes a section for each Fund of the Trust for the periods in which each Fund was in operation. CORN, SOYB, WEAT, CANE and TAGS each operated for the entirety of all periods. For DEFI, the commencement of operations was September 15, 2022 and will not have a comparative third quarter in 2022.
Total expenses for the current and comparative periods are presented both gross and net of any expenses waived or paid by the Sponsor that would have been incurred by the Funds (“expenses waived by the Sponsor”). For all expenses waived in 2022 and 2023, the Sponsor has determined that no reimbursement will be sought in future periods. “Total expenses, net” is after the impact of any expenses waived by the Sponsor, are presented in the same manner as previously reported. There is, therefore, no impact to or change in the Net gain or Net loss in any period for the Trust and each Fund as a result of this change in presentation.
The Sponsor is responsible for investing the assets of the Funds in accordance with the objectives and policies of each Fund. In addition, the Sponsor arranges for one or more third parties to provide administrative, custodial, accounting, transfer agency, compliance, and other necessary services to the Fund, including services directly attributable to the Funds such as accounting, financial reporting, regulatory compliance, and trading activities. In some cases, at its discretion, the Sponsor may elect not to outsource certain of these expenses.
In addition, the Agricultural Funds, except for TAGS, which has no such fee are contractually obligated to pay a monthly management fee to the Sponsor, based on average daily net assets, at a rate equal to 1.00% per annum.
The Agricultural Funds generally pay for all brokerage fees, taxes, and other expenses, including licensing fees for the use of intellectual property, registration or other fees paid to the SEC, the Financial Industry Regulatory Authority (“FINRA”), or any other regulatory agency in connection with the offer and sale of subsequent Shares after its initial registration and all legal, accounting, printing and other expenses associated therewith. Each Fund also pays its portion of the fees and expenses associated with the Trust’s tax accounting and reporting requirements. Certain aggregate expenses common to all Funds within the Trust are allocated by the Sponsor to the respective funds based on activity drivers deemed most appropriate by the Sponsor for such expenses, including but not limited to relative assets under management and creation order activity. These aggregate common expenses include, but are not limited to, legal, auditing, accounting and financial reporting, tax-preparation, regulatory compliance, trading activities, and insurance costs, as well as fees paid to the Distributor, which are included in the related line item in the statements of operations. A portion of these aggregate common expenses are related to services provided by the Sponsor or related parties of principals of the Sponsor; these are necessary services to the Funds, which are primarily the cost of performing accounting and financial reporting, regulatory compliance, and trading activities that are directly attributable to the Funds and are, primarily, included as distribution and marketing fees on the statements of operations. These amounts, for the Trust and for each Fund, are detailed in the notes to the financial statements included in Part I of this filing.
DEFI is contractually obligated to pay a monthly management fee to the Sponsor, based on average daily net assets, at a rate equal to 0.94% per annum. From the Management Fee, the Sponsor pays all of the routine operational, administrative and other ordinary expenses of the Fund, generally as determined by the Sponsor, including but not limited to, fees and expenses of the Administrator, Custodian, Distributor, Transfer Agent, licensors, accounting and audit fees expenses, tax preparation expenses, legal fees, ongoing SEC registration fees, individual Schedule K-1 preparation and mailing fees, and report preparation and mailing expenses. These fees and expenses are not included in the breakeven table because they are paid for by the Sponsor through the proceeds from the Management Fee. The Fund pays all of its non-recurring and unusual fees and expenses, if any, as determined by the Sponsor. Non-recurring and unusual fees and expenses are unexpected or unusual in nature, such as legal claims and liabilities and litigation costs or indemnification or other unanticipated expenses. Extraordinary fees and expenses also include material expenses which are not currently anticipated obligations of the Fund. Routine operational, administrative, and other ordinary expenses are not deemed extraordinary expenses.
The Sponsor has the ability to elect to pay certain expenses on behalf of the Funds or waive the management fee. This election is subject to change by the Sponsor, at its discretion. Expenses paid by the Sponsor and management fees waived by the Sponsor are, if applicable, presented as waived expenses in the statements of operations for each Fund.
Teucrium Corn Fund
The Teucrium Corn Fund commenced investment operations on June 9, 2010. The investment objective of the Corn Fund is to have the daily changes in percentage terms of the Shares’ NAV reflect the daily changes in percentage terms of a weighted average of the closing settlement prices for three futures contracts for corn (“Corn Futures Contracts”) that are traded on the Chicago Board of Trade (“CBOT”), specifically (1) the second to expire CBOT Corn Futures Contract, weighted 35%, (2) the third to expire CBOT Corn Futures Contract, weighted 30%, and (3) the CBOT Corn Futures Contract expiring in the December following the expiration month of the third to expire contract, weighted 35%. The Fund does not track the spot price of corn.
On September 30, 2023, the Corn Fund held a total of 3,618 CBOT Corn Futures contracts with a notional value of $90,399,025. The contracts had a liability fair value of $2,120,882. The weighting of the notional value of the contracts is as follows: (1) 35% to the MAR24 contracts, the second to expire CBOT Corn Futures Contract, (2) 30% to MAY24 CBOT contracts, the third to expire CBOT Corn Futures Contract, and (3) 35% to DEC24 CBOT contracts, the CBOT Corn Futures Contract expiring in the December following the expiration month of the third to expire contract.
| Quarter Ending |
Quarter Ending |
Quarter Ending |
||||||||||
| September 30, 2023 |
September 30, 2022 |
June 30, 2023 |
||||||||||
| Total Net Assets |
$ | 90,448,376 | $ | 214,972,436 | $ | 92,776,876 | ||||||
| Shares Outstanding |
4,100,004 | 7,950,004 | 4,175,004 | |||||||||
| Net Asset Value per share |
$ | 22.06 | $ | 27.04 | $ | 22.22 | ||||||
| Closing Price |
$ | 22.02 | $ | 27.04 | $ | 22.19 | ||||||
Total net assets for the Fund decreased year over year by 58%, driven by a combination of a decrease in total shares outstanding of 3,850,000 shares or 48% and a decrease in the NAV per share of ($4.98) or 18%. The net assets for the Fund decreased by 3% when comparing September 30, 2023, to June 30, 2023. The change in total net assets year over year, in the opinion of management, was generally due to a combination of the depreciation of commodity prices and investor out-flows which was driven by the war in Ukraine, supply disruptions and rising crop input costs.
For the Three Months Ended September 30, 2023, compared to the Three Months Ended September 30, 2022
| Three Months Ended |
Three Months Ended |
|||||||
| September 30, 2023 |
September 30, 2022 |
|||||||
| Average daily total net assets |
$ | 97,865,799 | $ | 208,642,546 | ||||
| Net realized and unrealized (loss) gain on futures contracts |
$ | (1,711,635 | ) | $ | 13,511,991 | |||
| Interest income earned on cash equivalents |
$ | 1,291,003 | $ | 1,087,852 | ||||
| Annualized interest yield based on average daily total net assets |
1.32 | % | 0.52 | % | ||||
| Net (Loss) Income |
$ | (1,116,390 | ) | $ | 13,656,545 | |||
| Weighted average share outstanding |
4,325,276 | 8,188,863 | ||||||
| Management Fees |
$ | 246,675 | $ | 525,893 | ||||
| Total gross fees and other expenses excluding management fees |
$ | 449,083 | $ | 417,405 | ||||
| Brokerage Commissions |
$ | 23,697 | $ | 54,746 | ||||
| Total gross expense ratio |
2.82 | % | 1.79 | % | ||||
| Total expense ratio net of expenses waived by the Sponsor |
2.82 | % | 1.79 | % | ||||
| Net investment gain |
2.41 | % | 0.27 | % | ||||
| Creation of Shares |
550,000 | 950,000 | ||||||
| Redemption of Shares |
525,000 | 2,525,000 | ||||||
For the Nine Months Ended September 30, 2023, compared to the Nine Months Ended September 30, 2022
| Nine Months Ended |
Nine Months Ended |
|||||||
| September 30, 2023 |
September 30, 2022 |
|||||||
| Average daily total net assets |
$ | 111,120,328 | $ | 217,755,962 | ||||
| Net realized and unrealized (loss) gain on futures contracts |
$ | (25,219,303 | ) | $ | 24,980,348 | |||
| Interest income earned on cash equivalents |
$ | 4,013,603 | $ | 1,706,156 | ||||
| Annualized interest yield based on average daily total net assets |
3.61 | % | 0.78 | % | ||||
| Net (Loss) Income |
$ | (23,294,832 | ) | $ | 23,935,440 | |||
| Weighted average share outstanding |
4,571,341 | 8,240,663 | ||||||
| Management Fees |
$ | 831,119 | $ | 1,628,695 | ||||
| Total gross fees and other expenses excluding management fees |
$ | 1,258,013 | $ | 1,468,224 | ||||
| Brokerage Commissions |
$ | 54,865 | $ | 118,321 | ||||
| Expenses waived by the Sponsor |
$ | - | $ | 345,855 | ||||
| Total gross expense ratio |
2.51 | % | 1.90 | % | ||||
| Total expense ratio net of expenses waived by the Sponsor |
2.51 | % | 1.69 | % | ||||
| Net investment gain (loss) |
2.32 | % | (0.64 | )% | ||||
| Creation of Shares |
800,000 | 7,500,000 | ||||||
| Redemption of Shares |
2,375,000 | 5,150,000 | ||||||
Realized gain or loss on trading of commodity futures contracts is a function of: 1) the change in the price of the particular contracts sold as part of a “roll” in contracts as the nearest to expire contracts are exchanged for the appropriate contract given the investment objective of the fund, 2) the change in the price of particular contracts sold in relation to redemption of shares, 3) the gain or loss associated with rebalancing trades which are made to ensure conformance to the benchmark, 4) the number of contracts held and then sold for either circumstance aforementioned. The Fund recognizes the expense for brokerage commissions for futures contract trades on a per trade basis. Unrealized gain or loss on trading of commodity futures contracts is a function of the change in the price of contracts held on the final date of the period versus the purchase price for each contract and the number of contracts held in each contract month. The Sponsor has a static benchmark as described above and trades futures contracts to adhere to that benchmark and to adjust for the creation or redemption of shares.
The increase in interest and other income year over year was due to an increase in Federal Fund Rates. As a result, the amount of interest income earned was higher in the three and nine months ended September 30, 2023, compared to the three and nine months ended September 30, 2022. The Fund seeks to earn interest and other income in investment grade, short-duration instruments or deposits associated with the pool’s cash management strategy that may be used to offset expenses. These investments may include, but are not limited to, short-term Treasury Securities, demand deposits, money market funds and investments in commercial paper. These interest rate levels may be lower or higher than the projected interest rates stated in the prospectuses and thus will impact your breakeven point.
The increase/decrease in management fee paid to the Sponsor is a result of higher/lower average net assets. As a result of the decline in the amount of assets of the Fund, the amount of management fees was lower in the three and nine months ended September 30, 2023, compared to the three and nine months ended September 30, 2022. The management fee is calculated at an annual rate of 1% of the Fund’s daily average net assets.
Other than the management fee to the Sponsor and the brokerage commissions, most of the expenses incurred by the Fund are associated with the day-to-day operation of the Fund and the necessary functions related to regulatory compliance. These are generally based on contracts, which extend for some period of time and up to one year, or commitments regardless of the level of assets under management. The structure of the Fund and the nature of the expenses are such that as total net assets grow, there is a scalability of expenses that may allow the total expense ratio to be reduced. However, if total net assets for the Fund fall, the total expense ratio of the Fund will increase unless additional reductions are made by the Sponsor to the daily expense accruals. The Sponsor can elect to adjust the daily expense accruals at its discretion based on market conditions and other Fund considerations.
The increase/decrease in total gross fees and other expenses excluding management fees for the three and nine months ended September 30, 2023 compared to the three and nine months ended September 30, 2022 was generally due to the allocation of expenses and total net assets relative to the other Funds. The Sponsor has the ability to elect to pay certain expenses on behalf of the Fund or waive the management fee. This election is subject to change by the Sponsor, at its discretion. The Sponsor has determined that no reimbursement will be sought in future periods for those expenses which have been waived for the period.
The increase/decrease in total brokerage commissions for the three and nine months ended September 30, 2023 compared to the three and nine months ended September 30, 2022, was primarily due to an increase/decrease in contracts purchased, liquidated, and rolled.
The graph below shows the actual shares outstanding, total net assets (or AUM) and net asset value per share (NAV per share) for the Fund from inception to September 30, 2023 and serves to illustrate the relative changes of these components.
The seasonality patterns for corn futures prices are impacted by a variety of factors. These include, but are not limited to, the harvest in the fall, the planting conditions in the spring, and the weather throughout the critical germination and growing periods. Prices for corn futures are affected by the availability and demand for substitute agricultural commodities, including soybeans and wheat, and the demand for corn as an additive for fuel, through the production of ethanol. The price of corn futures contracts is also influenced by global economic conditions, including the demand for exports to other countries. Such factors will impact the performance of the Fund and the results of operations on an ongoing basis. The Sponsor cannot predict the impact of such factors.
Teucrium Soybean Fund
The Teucrium Soybean Fund commenced investment operations on September 19, 2011. The investment objective of the Fund is to have the daily changes in percentage terms of the Shares’ Net Asset Value (“NAV”) reflect the daily changes in percentage terms of a weighted average of the closing settlement prices for three futures contracts for soybeans (“Soybean Futures Contracts”) that are traded on the Chicago Board of Trade (“CBOT”). The three Soybean Futures Contracts, excluding August and September, will be: (1) second to expire CBOT Soybean Futures Contract, weighted 35%, (2) the third to expire CBOT Soybean Futures Contract, weighted 30%, and (3) the CBOT Soybean Futures Contract expiring in the November following the expiration month of the third to expire contract, weighted 35%.
On September 30, 2023, the Fund held a total of 485 CBOT soybean futures contracts with a notional value of $31,199,850. The contracts had an asset fair value of $134,775 and a liability fair value of $510,168. The weighting of the notional value of the contracts is as follows: (1) 35% to JAN24 CBOT contracts, (2) 30% to MAR24 CBOT contracts, and (3) 35% to NOV24 CBOT contracts.
| Quarter Ending |
Quarter Ending |
Quarter Ending |
||||||||||
| September 30, 2023 |
September 30, 2022 |
June 30, 2023 |
||||||||||
| Total Net Assets |
$ | 31,176,395 | $ | 67,243,978 | $ | 36,894,584 | ||||||
| Shares Outstanding |
1,150,004 | 2,757,004 | 1,350,004 | |||||||||
| Net Asset Value per share |
$ | 27.11 | $ | 26.11 | $ | 27.33 | ||||||
| Closing Price |
$ | 27.07 | $ | 26.11 | $ | 27.32 | ||||||
Total net assets for the Fund decreased year over year by -54%, driven by a combination of a decrease in total shares outstanding of 1,425,000 shares or -55% and by an increase in the NAV per share of $1.00 or 4%. The net assets for the Fund decreased by 15% when comparing September 30, 2023, to June 30, 2023. The change in total net assets year over year, in the opinion of management, was generally due to a combination of a depreciation of commodity prices and investor out-flows which was driven by the war in Ukraine, supply disruptions and rising crop input costs.
For the Three Months Ended September 30, 2023, compared to the Three Months Ended September 30, 2022
| Three Months Ended |
Three Months Ended |
|||||||
| September 30, 2023 |
September 30, 2022 |
|||||||
| Average daily total net assets |
$ | 36,382,730 | $ | 69,925,211 | ||||
| Net realized and unrealized loss on futures contracts |
$ | (196,495 | ) | $ | (2,877,782 | ) | ||
| Interest income earned on cash and cash equivalents |
$ | 481,521 | $ | 365,454 | ||||
| Annualized interest yield based on average daily total net assets |
1.32 | % | 0.52 | % | ||||
| Net Loss |
$ | (42,697 | ) | $ | (2,816,428 | ) | ||
| Weighted average share outstanding |
1,296,471 | 2,646,471 | ||||||
| Management Fees |
$ | 91,704 | $ | 176,250 | ||||
| Total gross fees and other expenses excluding management fees |
$ | 236,019 | $ | 127,850 | ||||
| Brokerage Commissions |
$ | 2,220 | $ | 6,432 | ||||
| Total gross expense ratio |
3.57 | % | 1.73 | % | ||||
| Total expense ratio net of expenses waived by the Sponsor |
3.57 | % | 1.73 | % | ||||
| Net investment gain |
1.68 | % | 0.34 | % | ||||
| Creation of Shares |
100,000 | 600,000 | ||||||
| Redemption of Shares |
300,000 | 800,000 | ||||||
For the Nine Months Ended September 30, 2023, compared to the Nine Months Ended September 30, 2022
| Nine Months Ended |
Nine Months Ended |
|||||||
| September 30, 2023 |
September 30, 2022 |
|||||||
| Average daily total net assets |
$ | 39,188,556 | $ | 68,710,342 | ||||
| Net realized and unrealized (loss) gain on futures contracts |
$ | (2,624,949 | ) | $ | 4,906,805 | |||
| Interest income earned on cash and cash equivalents |
$ | 1,426,307 | $ | 549,818 | ||||
| Annualized interest yield based on average daily total net assets |
3.64 | % | 0.80 | % | ||||
| Net (Loss) Income |
$ | (2,092,763 | ) | $ | 4,557,808 | |||
| Weighted average share outstanding |
1,429,674 | 2,553,850 | ||||||
| Management Fees |
$ | 293,109 | $ | 513,916 | ||||
| Total gross fees and other expenses excluding management fees |
$ | 601,012 | $ | 474,461 | ||||
| Brokerage Commissions |
$ | 10,999 | $ | 21,638 | ||||
| Expenses waived by the Sponsor |
$ | - | $ | 89,562 | ||||
| Total gross expense ratio |
3.05 | % | 1.92 | % | ||||
| Total expense ratio net of expenses waived by the Sponsor |
3.05 | % | 1.75 | % | ||||
| Net investment gain (loss) |
1.81 | % | (0.68 | )% | ||||
| Creation of Shares |
350,000 | 1,950,000 | ||||||
| Redemption of Shares |
1,250,000 | 1,350,000 | ||||||
Realized gain or loss on trading of commodity futures contracts is a function of: 1) the change in the price of the particular contracts sold as part of a “roll” in contracts as the nearest to expire contracts are exchanged for the appropriate contract given the investment objective of the fund, 2) the change in the price of particular contracts sold in relation to redemption of shares, 3) the gain or loss associated with rebalancing trades which are made to ensure conformance to the benchmark, 4) the number of contracts held and then sold for either circumstance aforementioned. The Fund recognized the expense for brokerage commissions for futures contract trades on a per trade basis. Unrealized gain or loss on trading of commodity futures contracts is a function of the change in the price of contracts held on the final date of the period versus the purchase price for each contract and the number of contracts held in each contract month. The Sponsor has a static benchmark as described above and trades futures contracts to adhere to that benchmark and to adjust for the creation or redemption of shares.
The increase in interest and other income year over year was due to an increase in Federal Fund Rates. As a result, the amount of interest income earned as a percentage of average daily total net assets was higher in the three and nine months ended September 30, 2023, compared to the three and nine months ended September 30, 2022. The Fund seeks to earn interest and other income in investment grade, short-duration instruments or deposits associated with the pool’s cash management strategy that may be used to offset expenses. These investments may include, but are not limited to, short-term Treasury Securities, demand deposits, money market funds and investments in commercial paper. These interest rate levels may be lower or higher than the projected interest rates stated in the prospectuses and thus will impact your breakeven point.
The increase/decrease in management fee paid to the Sponsor is a result of lower/higher average net assets. As a result of the decline in the amount of assets of the Fund, the amount of management fees was lower in the three and nine months ended September 30, 2023, compared to the three and nine months ended September 30, 2022. The management fee is calculated at an annual rate of 1% of the Fund’s daily average net assets.
Other than the management fee to the Sponsor and the brokerage commissions, most of the expenses incurred by the Fund are associated with the day-to-day operation of the Fund and the necessary functions related to regulatory compliance. These are generally based on contracts, which extend for some period of time and up to one year, or commitments regardless of the level of assets under management. The structure of the Fund and the nature of the expenses are such that as total net assets grow, there is a scalability of expenses that may allow the total expense ratio to be reduced. However, if total net assets for the Fund fall, the total expense ratio of the Fund will increase unless additional reductions are made by the Sponsor to the daily expense accruals. The Sponsor can elect to adjust the daily expense accruals at its discretion based on market conditions and other Fund considerations.
The increase in total gross fees and other expenses excluding management fees for the three and nine months ended September 30, 2023 compared to the three and nine months ended September 30, 2022 was generally due to the average net assets relative to the other Funds. The Sponsor has the ability to elect to pay certain expenses on behalf of the Fund or waive the management fee. This election is subject to change by the Sponsor, at its discretion. The Sponsor has determined that no reimbursement will be sought in future periods for those expenses which have been waived for the period.
The increase/decrease in total brokerage commissions for the three and nine months ended September 30, 2023 compared to the three and nine months ended September 30, 2022, was primarily due to an increase/decrease in contracts purchased, liquidated, and rolled.
The graph below shows the actual shares outstanding, total net assets (or AUM) and net asset value per share (NAV per share) for the Fund from inception to September 30, 2023 and serves to illustrate the relative changes of these components.
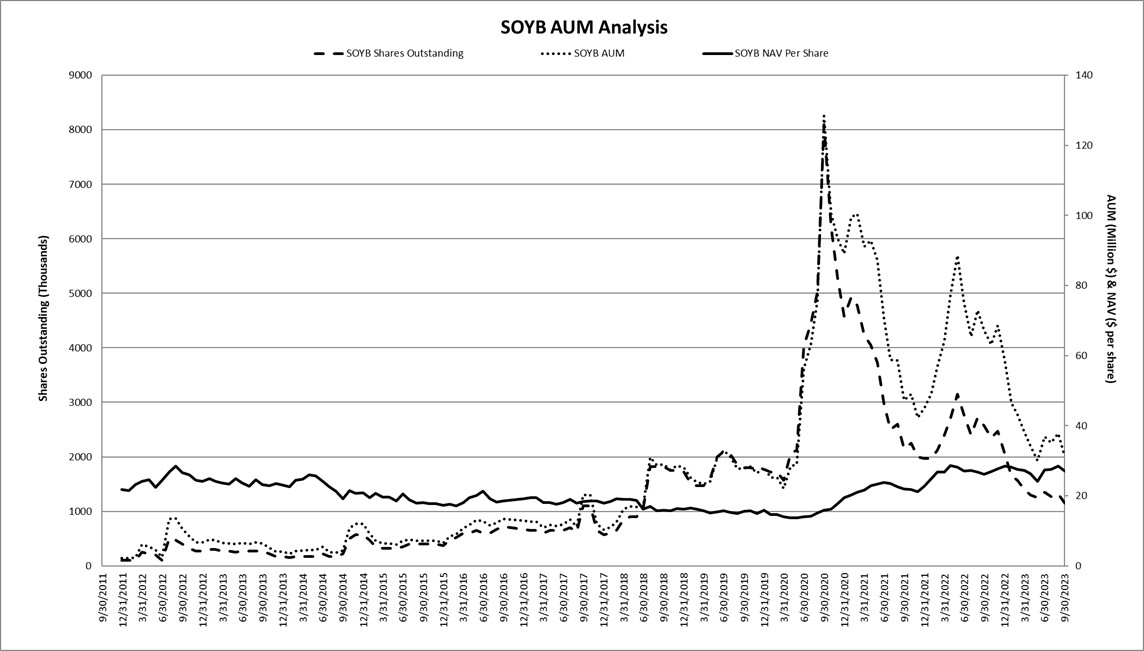
The seasonality patterns for soybean futures prices are impacted by a variety of factors. These include, but are not limited to, the harvest in the fall, the planting conditions in the spring, and the weather throughout the critical germination and growing periods. Prices for soybean futures are affected by the availability and demand for substitute agricultural commodities, including corn and wheat. The price of soybean futures contracts is also influenced by global economic conditions, including the demand for exports to other countries. Such factors will impact the performance of the Fund and the results of operations on an ongoing basis. The Sponsor cannot predict the impact of such factors.
Teucrium Sugar Fund
The Teucrium Sugar Fund commenced investment operations on September 19, 2011. The investment objective of the Fund is to have the daily changes in percentage terms of the Shares’ Net Asset Value (“NAV”) reflect the daily changes in percentage terms of a weighted average of the closing settlement prices for three futures contracts for sugar (“Sugar Futures Contracts”) that are traded on ICE Futures US (“ICE Futures”), specifically: (1) the second to expire Sugar No. 11 Futures Contract (a “Sugar No. 11 Futures Contract”), weighted 35%, (2) the third to expire Sugar No. 11 Futures Contract, weighted 30%, and (3) the Sugar No. 11 Futures Contract expiring in the March following the expiration month of the third to expire contract, weighted 35%.
On September 30, 2023, the Fund held a total of 890 ICE sugar futures contracts with a notional value of $24,362,520. The contracts had an asset fair value of $1,866,449 and a liability fair value of $107,186. The weighting of the notional value of the contracts is as follows: (1) 35% to the MAY24 ICE No 11 contracts, (2) 30% to the JUL24 ICE No 11 contracts, and (3) 35% to the MAR25 ICE No 11 contracts.
| Quarter Ending |
Quarter Ending |
Quarter Ending |
||||||||||
| September 30, 2023 |
September 30, 2022 |
June 30, 2023 |
||||||||||
| Total Net Assets |
$ | 24,351,498 | $ | 25,534,967 | $ | 23,179,570 | ||||||
| Shares Outstanding |
1,650,004 | 2,925,004 | 1,825,004 | |||||||||
| Net Asset Value per share |
$ | 14.76 | $ | 8.73 | $ | 12.70 | ||||||
| Closing Price |
$ | 14.78 | $ | 8.68 | $ | 12.76 | ||||||
Total net assets for the Fund decreased year over year by 5%, driven by a combination of a decrease in total shares outstanding of 1,275,000 or -44% and an increase in the NAV per share of $6.03 or 69%. The net assets for the Fund increased by 5% when comparing September 30, 2023, to June 30, 2023. This change was, in the opinion of management, due to the stabilization of prices worldwide, strong demand and with modestly higher production which accelerated investor interest.
For the Three Months Ended September 30, 2023, compared to the Three Months Ended September 30, 2022
| Three Months Ended |
Three Months Ended |
|||||||
| September 30, 2023 |
September 30, 2022 |
|||||||
| Average daily total net assets |
$ | 23,006,747 | $ | 28,395,088 | ||||
| Net realized and unrealized gain (loss) on futures contracts |
$ | 3,205,782 | $ | (1,962,758 | ) | |||
| Interest income earned on cash and cash equivalents |
$ | 304,744 | $ | 149,944 | ||||
| Annualized interest yield based on average daily total net assets |
1.32 | % | 0.53 | % | ||||
| Net Income (Loss) |
$ | 3,311,140 | $ | (1,942,684 | ) | |||
| Weighted average share outstanding |
1,672,558 | 3,159,243 | ||||||
| Management Fees |
$ | 57,990 | $ | 71,572 | ||||
| Total gross fees and other expenses excluding management fees |
$ | 141,396 | $ | 58,298 | ||||
| Brokerage Commissions |
$ | 3,707 | $ | 5,436 | ||||
| Total gross expense ratio |
3.44 | % | 1.81 | % | ||||
| Total expense ratio net of expenses waived by the Sponsor |
3.44 | % | 1.81 | % | ||||
| Net investment gain (loss) |
1.82 | % | 0.28 | % | ||||
| Creation of Shares |
325,000 | 75,000 | ||||||
| Redemption of Shares |
500,000 | 625,000 | ||||||
For the Nine Months Ended September 30, 2023, compared to the Nine Months Ended September 30, 2022
| Nine Months Ended |
Nine Months Ended |
|||||||
| September 30, 2023 |
September 30, 2022 |
|||||||
| Average daily total net assets |
$ | 27,491,693 | $ | 28,612,071 | ||||
| Net realized and unrealized gain (loss) on futures contracts |
$ | 11,951,716 | $ | (2,758,277 | ) | |||
| Interest income earned on cash and cash equivalents |
$ | 1,007,430 | $ | 222,434 | ||||
| Annualized interest yield based on average daily total net assets |
3.66 | % | 0.78 | % | ||||
| Net Income (Loss) |
$ | 12,333,619 | $ | (2,910,520 | ) | |||
| Weighted average share outstanding |
2,241,121 | 3,077,751 | ||||||
| Management Fees |
$ | 205,623 | $ | 214,003 | ||||
| Total gross fees and other expenses excluding management fees |
$ | 419,904 | $ | 238,911 | ||||
| Brokerage Commissions |
$ | 19,661 | $ | 31,972 | ||||
| Expenses waived by the Sponsor |
$ | - | $ | 78,237 | ||||
| Total gross expense ratio |
3.04 | % | 2.12 | % | ||||
| Total expense ratio net of expenses waived by the Sponsor |
3.04 | % | 1.75 | % | ||||
| Net investment gain (loss) |
1.86 | % | (0.71 | )% | ||||
| Creation of Shares |
1,525,000 | 2,675,000 | ||||||
| Redemption of Shares |
2,425,000 | 2,225,000 | ||||||
Realized gain or loss on trading of commodity futures contracts is a function of: 1) the change in the price of the particular contracts sold as part of a “roll” in contracts as the nearest to expire contracts are exchanged for the appropriate contract given the investment objective of the fund, 2) the change in the price of particular contracts sold in relation to redemption of shares, 3) the gain or loss associated with rebalancing trades which are made to ensure conformance to the benchmark, 4) the number of contracts held and then sold for either circumstance aforementioned. The Fund recognizes the expense for brokerage commissions for futures contract trades on a per trade basis. Unrealized gain or loss on trading of commodity futures contracts is a function of the change in the price of contracts held on the final date of the period versus the purchase price for each contract and the number of contracts held in each contract month. The Sponsor has a static benchmark as described above and trades futures contracts to adhere to that benchmark and to adjust for the creation or redemption of shares.
The increase in interest and other income year over year was due to an increase in Federal Fund Rates. As a result, the amount of interest income earned as a percentage of average daily total net assets was higher in the three and nine months ended September 30, 2023, compared to the three and nine months ended September 30, 2022. The Fund seeks to earn interest and other income in investment grade, short-duration instruments or deposits associated with the pool’s cash management strategy that may be used to offset expenses. These investments may include, but are not limited to, short-term Treasury Securities, demand deposits, money market funds and investments in commercial paper. These interest rate levels may be lower or higher than the projected interest rates stated in the prospectuses and thus will impact your breakeven point.
The increase/decrease in management fee paid to the Sponsor is a result of lower/higher average net assets. As a result of the decline in the amount of assets of the Fund, the amount of management fees was lower in the three and nine months ended September 30, 2023, compared to the three and nine months ended September 30, 2022. The management fee is calculated at an annual rate of 1% of the Fund’s daily average net assets.
Other than the management fee to the Sponsor and the brokerage commissions, most of the expenses incurred by the Fund are associated with the day-to-day operation of the Fund and the necessary functions related to regulatory compliance. These are generally based on contracts, which extend for some period of time and up to one year, or commitments regardless of the level of assets under management. The structure of the Fund and the nature of the expenses are such that as total net assets grow, there is a scalability of expenses that may allow the total expense ratio to be reduced. However, if total net assets for the Fund fall, the total expense ratio of the Fund will increase unless additional reductions are made by the Sponsor to the daily expense accruals. The Sponsor can elect to adjust the daily expense accruals at its discretion based on market conditions and other Fund considerations.
The increase in total gross fees and other expenses excluding management fees for the three and nine months ended September 30, 2023, respectively, compared to the three and nine months ended September 30, 2022 was generally due to the increase in average net assets in the three and nine month periods, respectively. The Sponsor has the ability to elect to pay certain expenses on behalf of the Fund or waive the management fee. This election is subject to change by the Sponsor, at its discretion. The Sponsor has determined that no reimbursement will be sought in future periods for those expenses which have been waived for the period.
The increase/decrease in total brokerage commissions for the three and nine months ended September 30, 2023 compared to the three and nine months ended September 30, 2022, was primarily due to an increase/decrease in contracts purchased, liquidated, and rolled.
The graph below shows the actual shares outstanding, total net assets (or AUM) and net asset value per share (NAV per share) for the Fund from inception to September 30, 2023 and serves to illustrate the relative changes of these components.
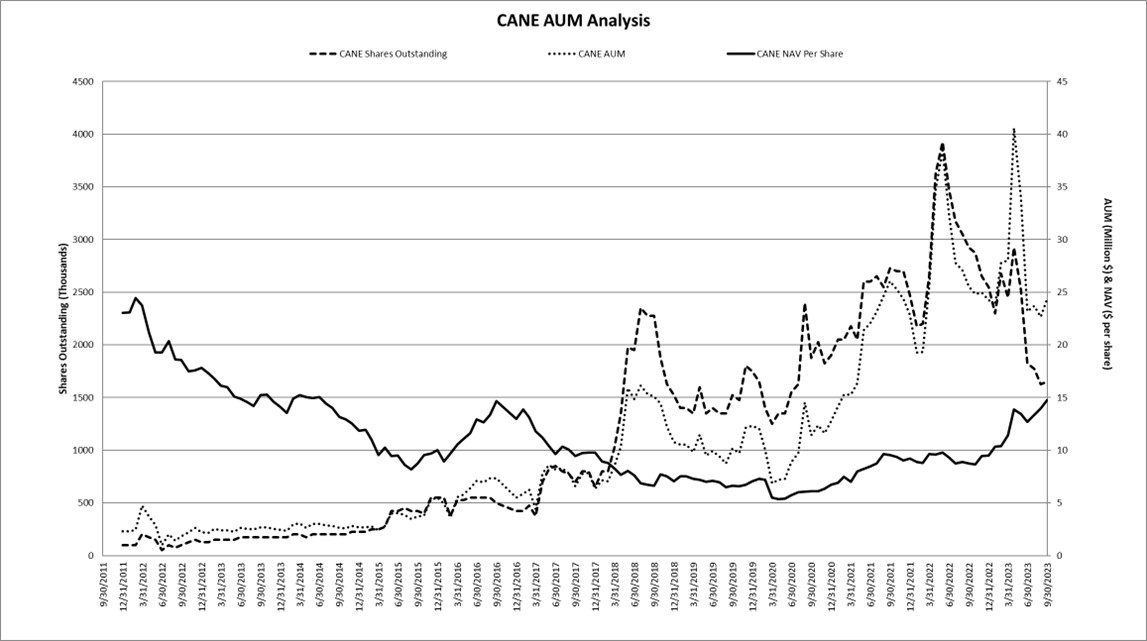
The seasonality patterns for sugar cane futures prices are impacted by a variety of factors. In the futures market, contracts expiring during the harvest season are typically priced lower than contracts expiring in the winter and spring. While the sugar harvest seasons varies from country to country, prices of Sugar Futures Contracts tend to be lowest in the late spring and early summer, reflecting the harvest season in Brazil, the world’s leading producer of sugarcane. Thus, seasonal fluctuations could result in an investor incurring losses upon the sale of Fund Shares, particularly if the investor needs to sell Shares when the Benchmark Component Futures Contracts are, in whole or part, Sugar Futures Contracts expiring in the late spring or early summer. The price of sugar futures contracts is also influenced by global economic conditions, including the demand for imports and exports to other countries. Such factors will impact the performance of the Fund and the results of operations on an ongoing basis. The Sponsor cannot predict the impact of such factors.
Teucrium Wheat Fund
The Teucrium Wheat Fund commenced investment operations on September 19, 2011. The investment objective of the Fund is to have the daily changes in percentage terms of the Shares’ Net Asset Value reflect the daily changes in percentage terms of a weighted average of the closing settlement prices for three futures contracts for wheat (“Wheat Futures Contracts”) that are traded on the Chicago Board of Trade (“CBOT”), specifically: (1) the second to expire CBOT Wheat Futures Contract, weighted 35%, (2) the third to expire CBOT Wheat Futures Contract, weighted 30%, and (3) the CBOT Wheat Futures Contract expiring in the December following the expiration month of the third to expire contract, weighted 35%.
On September 30, 2023, the Fund held a total of 6,412 CBOT wheat futures contracts with a notional value of $193,873,288. The contracts had an asset fair value of $23,185,502. The weighting of the notional value contracts is as follows: (1) 34% to MAR24 CBOT contracts, (2) 30% to MAY24 CBOT contracts, and (3) 36% to DEC24 CBOT contracts.
| Quarter Ending |
Quarter Ending |
Quarter Ending |
||||||||||
| September 30, 2023 |
September 30, 2022 |
June 30, 2023 |
||||||||||
| Total Net Assets |
$ | 193,949,700 | $ | 377,988,971 | $ | 164,450,547 | ||||||
| Shares Outstanding |
34,825,004 | 41,250,004 | 25,450,004 | |||||||||
| Net Asset Value per share |
$ | 5.57 | $ | 9.16 | $ | 6.46 | ||||||
| Closing Price |
$ | 5.57 | $ | 9.15 | $ | 6.44 | ||||||
Total net assets for the Fund decreased year over year by 49%, driven by a combination of a decrease in total shares outstanding of 6,425,000 or 16% and a decrease in the NAV per share of ($3.59) or 39%. The net assets for the Fund increased by 18% when comparing September 30, 2023 to June 30, 2023. The change in total net assets year over year, in the opinion of management, was generally due to a combination of the depreciation of commodity prices and investor out-flows which was driven by the war in Ukraine, supply disruptions and rising crop input costs.
For the Three Months Ended September 30, 2023, compared to the Three Months Ended September 30, 2022
| Three Months Ended |
Three Months Ended |
|||||||
| September 30, 2023 |
September 30, 2022 |
|||||||
| Average daily total net assets |
$ | 194,186,405 | $ | 354,167,506 | ||||
| Net realized and unrealized (loss) gain on futures contracts |
$ | (32,117,209 | ) | $ | 312,397 | |||
| Interest income earned on cash and cash equivalents |
$ | 2,538,278 | $ | 1,807,040 | ||||
| Annualized interest yield based on average daily total net assets |
1.31 | % | 0.51 | % | ||||
| Net (Loss) Income |
$ | (30,892,784 | ) | $ | 319,191 | |||
| Weighted average share outstanding |
30,905,167 | 41,945,384 | ||||||
| Management Fees |
$ | 489,455 | $ | 892,696 | ||||
| Total gross fees and other expenses excluding management fees |
$ | 824,398 | $ | 907,550 | ||||
| Brokerage Commissions |
$ | 40,896 | $ | 75,136 | ||||
| Total gross expense ratio |
2.68 | % | 2.02 | % | ||||
| Total expense ratio net of expenses waived by the Sponsor |
2.68 | % | 2.02 | % | ||||
| Net investment gain (loss) |
2.50 | % | 0.01 | % | ||||
| Creation of Shares |
10,225,000 | 4,575,000 | ||||||
| Redemption of Shares |
850,000 | 13,200,000 | ||||||
For the Nine Months Ended September 30, 2023, compared to the Nine Months Ended September 30, 2022
| Nine Months Ended |
Nine Months Ended |
|||||||
| September 30, 2023 |
September 30, 2022 |
|||||||
| Average daily total net assets |
$ | 185,503,552 | $ | 369,580,476 | ||||
| Net realized and unrealized loss on futures contracts |
$ | (72,736,726 | ) | $ | (57,328,622 | ) | ||
| Interest income earned on cash and cash equivalents |
$ | 6,660,873 | $ | 2,931,373 | ||||
| Annualized interest yield based on average daily total net assets |
3.59 | % | 0.79 | % | ||||
| Net Loss |
$ | (69,779,924 | ) | $ | (59,064,706 | ) | ||
| Weighted average share outstanding |
27,538,649 | 38,111,726 | ||||||
| Management Fees |
$ | 1,387,465 | $ | 2,764,259 | ||||
| Total gross fees and other expenses excluding management fees |
$ | 2,316,606 | $ | 2,328,362 | ||||
| Brokerage Commissions |
$ | 85,354 | $ | 354,679 | ||||
| Expenses waived by the Sponsor |
$ | - | $ | 425,164 | ||||
| Total gross expense ratio |
2.67 | % | 1.84 | % | ||||
| Total expense ratio net of expenses waived by the Sponsor |
2.67 | % | 1.69 | % | ||||
| Net investment gain (loss) |
2.13 | % | (0.63 | )% | ||||
| Creation of Shares |
14,200,000 | 84,050,000 | ||||||
| Redemption of Shares |
8,050,000 | 53,050,000 | ||||||
Realized gain or loss on trading of commodity futures contracts is a function of: 1) the change in the price of the particular contracts sold as part of a “roll” in contracts as the nearest to expire contracts are exchanged for the appropriate contract given the investment objective of the fund, 2) the change in the price of particular contracts sold in relation to redemption of shares, 3) the gain or loss associated with rebalancing trades which are made to ensure conformance to the benchmark, 4) the number of contracts held and then sold for either circumstance aforementioned. The Fund recognized the expense for brokerage commissions for futures contract trades on a per trade basis. Unrealized gain or loss on trading of commodity futures contracts is a function of the change in the price of contracts held on the final date of the period versus the purchase price for each contract and the number of contracts held in each contract month. The Sponsor has a static benchmark as described above and trades futures contracts to adhere to that benchmark and to adjust for the creation or redemption of shares.
The increase in interest and other income year over year was due to an increase in Federal Fund Rates. As a result, the amount of interest income earned as a percentage of average daily total net assets was higher in the three and nine months ended September 30, 2023, compared to the three and nine months ended September 30, 2022. The Fund seeks to earn interest and other income in investment grade, short-duration instruments or deposits associated with the pool’s cash management strategy that may be used to offset expenses. These investments may include, but are not limited to, short-term Treasury Securities, demand deposits, money market funds and investments in commercial paper. These interest rate levels may be lower or higher than the projected interest rates stated in the prospectuses and thus will impact your breakeven point.
The increase/decrease in management fee paid to the Sponsor is a result of lower/higher average net assets. As a result of the decline in the amount of assets of the Fund, the amount of management fees was lower in the three and nine months ended September 30, 2023, compared to the three and nine months ended September 30, 2022. The management fee is calculated at an annual rate of 1% of the Fund’s daily average net assets.
Other than the management fee to the Sponsor and the brokerage commissions, most of the expenses incurred by the Fund are associated with the day-to-day operation of the Fund and the necessary functions related to regulatory compliance. These are generally based on contracts, which extend for some period of time and up to one year, or commitments regardless of the level of assets under management. The structure of the Fund and the nature of the expenses are such that as total net assets grow, there is a scalability of expenses that may allow the total expense ratio to be reduced. However, if total net assets for the Fund fall, the total expense ratio of the Fund will increase unless additional reductions are made by the Sponsor to the daily expense accruals. The Sponsor can elect to adjust the daily expense accruals at its discretion based on market conditions and other Fund considerations.
The decrease in total gross fees and other expenses excluding management fees for the three and nine months ended September 30, 2023, respectively, compared to the three and nine months ended September 30, 2022 was generally due to a decrease in average net assets relative to the other Funds. The Sponsor has the ability to elect to pay certain expenses on behalf of the Fund or waive the management fee. This election is subject to change by the Sponsor, at its discretion. The Sponsor has determined that no reimbursement will be sought in future periods for those expenses which have been waived for the period.
The increase/decrease in total brokerage commissions for the three and nine months ended September 30, 2023 compared to the three and nine months ended September 30, 2022, was primarily due to an increase/decrease in contracts purchased, liquidated, and rolled.
The graph below shows the actual shares outstanding, total net assets (or AUM) and net asset value per share (NAV per share) for the Fund from inception to September 30, 2023 and serves to illustrate the relative changes of these components.
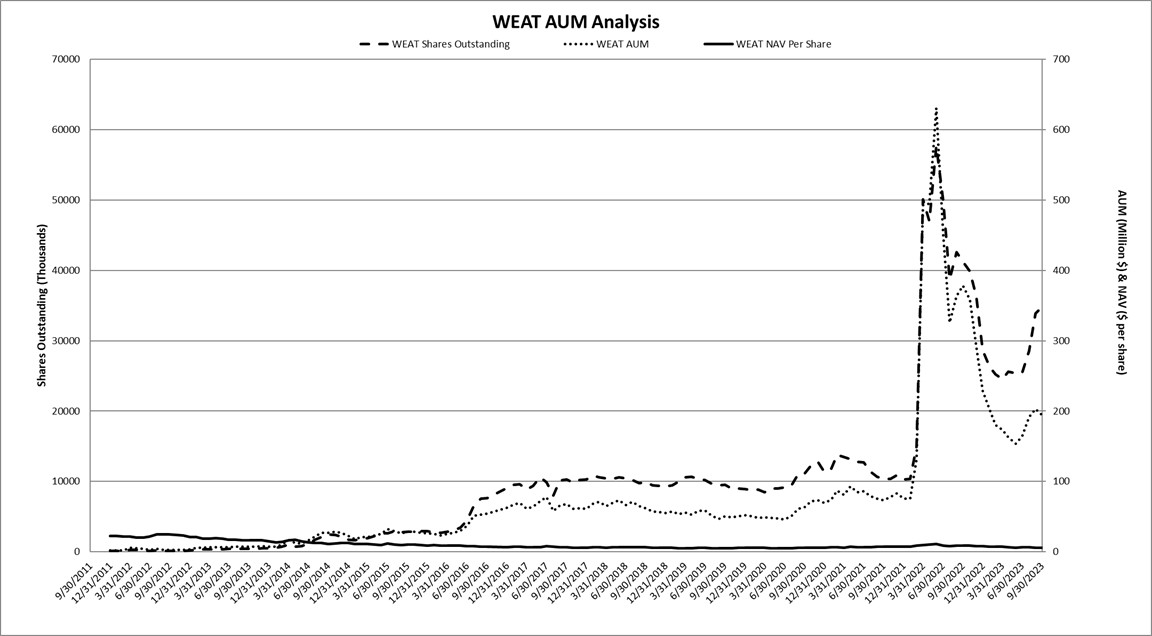
The seasonality patterns for wheat futures prices are impacted by a variety of factors. These include, but are not limited to, the harvest in summer and fall, the planting conditions, and the weather throughout the critical germination and growing periods. Prices for wheat futures are affected by the availability and demand for substitute agricultural commodities, including corn and other feed grains. The price of wheat futures contracts is also influenced by global economic conditions, including the demand for exports to other countries. Such factors will impact the performance of the Fund and the results of operations on an ongoing basis. The Sponsor cannot predict the impact of such factors.
Teucrium Agricultural Fund
The Teucrium Agricultural Fund commenced operation on March 28, 2012. The investment objective of the Fund is to have the daily changes in percentage terms of the Net Asset Value (“NAV”) of its common units (“Shares”) reflect the daily changes in percentage terms of a weighted average (the “Underlying Fund Average”) of the NAVs per share of four other commodity pools that are series of the Trust and are sponsored by the Sponsor: the Teucrium Corn Fund (“CORN”), the Teucrium Wheat Fund (“WEAT”), the Teucrium Soybean Fund (“SOYB”) and the Teucrium Sugar Fund (“CANE”) (collectively, the “Underlying Funds”). The Underlying Fund Average will have a weighting of 25% to each Underlying Fund, and the Fund’s assets will be rebalanced, generally on a daily basis, to maintain the approximate 25% allocation to each Underlying Fund. The Fund does not intend to invest directly in futures contracts (“Futures Contracts”), although it reserves the right to do so in the future, including if an Underlying Fund ceases operation.
The investment objective of each Underlying Fund is to have the daily changes in percentage terms of its shares’ NAV reflect the daily changes in percentage terms of a weighted average of the closing settlement prices for certain Futures Contracts for the commodity specified in the Underlying Fund’s name. (This weighted average is referred to herein as the Underlying Fund’s “Benchmark,” the Futures Contracts that at any given time make up an Underlying Fund’s Benchmark are referred to herein as the Underlying Fund’s “Benchmark Component Futures Contracts,” and the commodity specified in the Underlying Fund’s name is referred to herein as its “Specified Commodity.”) Specifically, the Teucrium Corn Fund’s Benchmark is: (1) the second to expire Futures Contract for corn traded on the Chicago Board of Trade (“CBOT”), weighted 35%, (2) the third to expire CBOT corn Futures Contract, weighted 30%, and (3) the CBOT corn Futures Contract expiring in the December following the expiration month of the third to expire contract, weighted 35%. The Teucrium Wheat Fund’s Benchmark is: (1) the second to expire CBOT wheat Futures Contract, weighted 35%, (2) the third to expire CBOT wheat Futures Contract, weighted 30%, and (3) the CBOT wheat Futures Contract expiring in the December following the expiration month of the third to expire contract, weighted 35%. The Teucrium Soybean Fund’s Benchmark is: (1) the second to expire CBOT soybean Futures Contract, weighted 35%, (2) the third to expire CBOT soybean Futures Contract, weighted 30%, and (3) the CBOT soybean Futures Contract expiring in the November following the expiration month of the third to expire contract, weighted 35%, except that CBOT soybean Futures Contracts expiring in August and September will not be part of the Teucrium Soybean Fund’s Benchmark because of the less liquid market for these Futures Contracts. The Teucrium Sugar Fund’s Benchmark is: (1) the second to expire Sugar No. 11 Futures Contract traded on ICE Futures US (“ICE Futures”), weighted 35%, (2) the third to expire ICE Futures Sugar No. 11 Futures Contract, weighted 30%, and (3) the ICE Futures Sugar No. 11 Futures Contract expiring in the March following the expiration month of the third to expire contract, weighted 35%.
On September 30, 2023, the Fund held: 1) 257,033 shares of CORN with a fair value of $5,670,302; 2) 955,742 shares of WEAT with a fair value of $5,322,814; 3) 203,005 shares of SOYB with a fair value of $5,503,425; and 4) 371,271 shares of CANE with a fair value of $5,479,366. The weighting on September 30, 2023 was 26% to CORN, 24% to WEAT, 25% to SOYB and 25% to CANE.
| Quarter Ending |
Quarter Ending |
Quarter Ending |
||||||||||
| September 30, 2023 |
September 30, 2022 |
June 30, 2023 |
||||||||||
| Total Net Assets |
$ | 21,986,775 | $ | 46,219,717 | $ | 23,886,716 | ||||||
| Shares Outstanding |
725,002 | 1,487,502 | 787,502 | |||||||||
| Net Asset Value per share |
$ | 30.33 | $ | 31.07 | $ | 30.33 | ||||||
| Closing Price |
$ | 30.33 | $ | 31.09 | $ | 30.30 | ||||||
Total net assets for the Fund decreased year over year by 52%, driven by a decrease in shares outstanding of 762,500 shares or 51%. The net assets for the Fund decreased by 8% when comparing September 30, 2023 to June 30, 2023. The change in total net assets year over year, in the opinion of management, was generally due to a combination of depreciation of commodity prices and investor out-flows which was driven by the war in Ukraine, supply disruptions and rising crop input costs.
For the Three Months Ended September 30, 2023, compared to the Three Months Ended September 30, 2022
| Three Months Ended |
Three Months Ended |
|||||||
| September 30, 2023 |
September 30, 2022 |
|||||||
| Average daily total net assets |
$ | 23,042,727 | $ | 46,480,463 | ||||
| Net realized and unrealized gain on securities |
$ | 32,532 | $ | 7,231 | ||||
| Interest income earned on cash equivalents |
$ | 149 | $ | 302 | ||||
| Annualized interest yield based on average daily total net assets |
0.00 | % | 0.00 | % | ||||
| Net (Loss) Income |
$ | 27,455 | $ | (7,697 | ) | |||
| Weighted average share outstanding |
739,540 | 1,537,230 | ||||||
| Total gross fees and other expenses |
$ | 82,708 | $ | 77,289 | ||||
| Expenses waived by the Sponsor |
$ | (77,482 | ) | $ | (62,059 | ) | ||
| Total gross expense ratio |
1.42 | % | 0.66 | % | ||||
| Total expense ratio net of expenses waived by the Sponsor |
0.09 | % | 0.13 | % | ||||
| Net investment loss |
(0.09 | )% | (0.13 | )% | ||||
| Creation of Shares |
- | 75,000 | ||||||
| Redemption of Shares |
62,500 | 112,500 | ||||||
For the Nine Months Ended September 30, 2023, compared to the Nine Months Ended September 30, 2022
| Nine Months Ended |
Nine Months Ended |
|||||||
| September 30, 2023 |
September 30, 2022 |
|||||||
| Average daily total net assets |
$ | 30,113,865 | $ | 35,475,983 | ||||
| Net realized and unrealized gain on securities |
$ | (828,651 | ) | $ | (1,296,832 | ) | ||
| Interest income earned on cash equivalents |
$ | 421 | $ | 352 | ||||
| Annualized interest yield based on average daily total net assets |
0.00 | % | 0.00 | % | ||||
| Net (Loss) Income |
$ | (848,500 | ) | $ | (1,333,145 | ) | ||
| Weighted average share outstanding |
972,896 | 1,120,973 | ||||||
| Total gross fees and other expenses |
$ | 376,001 | $ | 212,887 | ||||
| Expenses waived by the Sponsor |
$ | (355,731 | ) | $ | (176,222 | ) | ||
| Total gross expense ratio |
1.67 | % | 0.80 | % | ||||
| Total expense ratio net of expenses waived by the Sponsor |
0.09 | % | 0.14 | % | ||||
| Net investment loss |
(0.09 | )% | (0.14 | )% | ||||
| Creation of Shares |
- | 1,362,500 | ||||||
| Redemption of Shares |
537,500 | 400,000 | ||||||
Realized gain or loss on the securities of the Underlying Funds is a function of 1) the change in the price of particular contracts sold in relation to redemption of shares, 2) the gain or loss associated with rebalancing trades which are made to ensure conformance to the benchmark and 3) the full-turn brokerage commission fee recognized on a per trade basis. Unrealized gain or loss on the securities of the Underlying Funds is a function of the change in the price of shares held on the final date of the period versus the purchase price for each and the number held. The Sponsor has a static benchmark as described above and trades futures contracts to adhere to that benchmark and to adjust for the creation or redemption of shares.
Other than the brokerage commissions, most of the expenses incurred by the Fund are associated with the day-to-day operation of the Fund and the necessary functions related to regulatory compliance. These are generally based on contracts, which extend for some period of time and up to one year, or commitments regardless of the level of assets under management. The structure of the Fund and the nature of the expenses are such that as total net assets grow, there is a scalability of expenses that may allow the total expense ratio to be reduced. However, if total net assets for the Fund fall, the total expense ratio of the Fund will increase unless additional reductions are made by the Sponsor to the daily expense accruals. The Sponsor can elect to adjust the daily expense accruals at its discretion based on market conditions and other Fund considerations.
The increase in total gross fees and other expenses for the three and nine months ended September 30, 2023 compared to the three and nine months ended September 30, 2022 was generally due to the increase in average net assets and the net assets relative to the other Funds. The Sponsor has the ability to elect to pay certain expenses on behalf of the Fund or waive the management fee. This election is subject to change by the Sponsor, at its discretion. The Sponsor has determined that no reimbursement will be sought in future periods for those expenses which have been waived for the period.
The graph below shows the actual shares outstanding, total net assets (or AUM) and net asset value per share (NAV per share) for the Fund from inception to September 30, 2023 and serves to illustrate the relative changes of these components.
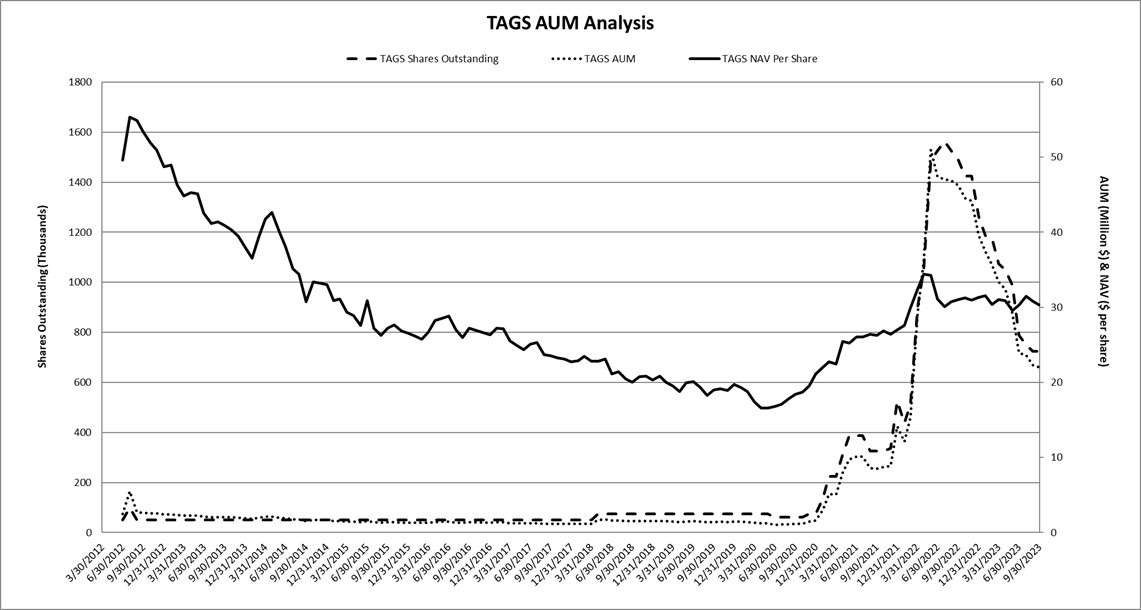
Hashdex Bitcoin Futures ETF
The Hashdex Bitcoin Futures ETF Fund commenced investment operations on September 15, 2022. The investment objective of the Fund is to have the daily changes in percentage terms of the Shares’ Net Asset Value reflect the daily changes in percentage terms of a weighted average of the closing settlement prices for two futures contracts for Bitcoin (“Bitcoin Futures Contracts”) that are traded on the Chicago Mercantile Exchange (“CME”), specifically: (1) the first to expire CME Bitcoin Futures Contract, weighted 50%, (2) the second to expire CME Bitcoin Futures Contract, weighted 50%.
On September 30, 2023, the Fund held a total of 12 CME bitcoin futures contracts with a notional value of 1,631,250. The contracts had an asset fair value of $19,483. The weighting of the notional value contracts is as follows: (1) 50% to OCT23 CME Bitcoin Futures contracts, (2) 50% to NOV23 CME Bitcoin Futures contracts.
| From the commencement |
||||||||||||
| Quarter Ending |
of operations (September 15, 2022) |
Quarter Ending |
||||||||||
| September 30, 2023 |
through September 30, 2022 |
June 30, 2023 |
||||||||||
| Total Net Assets |
$ | 1,672,130 | $ | 1,230,482 | $ | 1,938,929 | ||||||
| Shares Outstanding |
50,004 | 50,004 | 50,004 | |||||||||
| Net Asset Value per share |
$ | 33.44 | $ | 24.61 | $ | 38.78 | ||||||
| Closing Price |
$ | 33.49 | $ | 24.68 | $ | 38.85 | ||||||
For the three months ended September 30, 2023 compared to the commencement of operations (September 15, 2022) through September 30, 2022
| Quarter Ending |
From the commencement of operations (September 15, 2022) |
|||||||
| September 30, 2023 |
through September 30, 2022 |
|||||||
| Average daily total net assets |
$ | 1,774,450 | $ | 975,029 | ||||
| Net realized and unrealized loss on futures contracts |
$ | (283,797 | ) | $ | (20,314 | ) | ||
| Interest income earned on cash equivalents |
$ | 21,202 | $ | 1,073 | ||||
| Annualized interest yield based on average daily total net assets |
1.19 | % | 0.11 | % | ||||
| Net Loss |
$ | (266,799 | ) | $ | (19,618 | ) | ||
| Weighted average share outstanding |
50,004 | 40,003 | ||||||
| Management Fees |
$ | 4,204 | $ | 377 | ||||
| Total gross fees and other expenses excluding management fees |
$ | 91,023 | $ | 550 | ||||
| Brokerage Commissions |
$ | 593 | $ | 949 | ||||
| Expenses waived by the Sponsor |
$ | (91,023 | ) | $ | (550 | ) | ||
| Total gross expense ratio |
21.29 | % | 2.31 | % | ||||
| Total expense ratio net of expenses waived by the Sponsor |
0.94 | % | 0.94 | % | ||||
| Net investment gain |
3.80 | % | 1.74 | % | ||||
| Creation of Shares |
- | 50,004 | ||||||
| Redemption of Shares |
- | - | ||||||
For the nine months ended September 30, 2023 compared to the commencement of operations (September 15, 2022) through September 30, 2022
| Nine Months Ending |
From the commencement of operations (September 15, 2022) |
|||||||
| September 30, 2023 |
through September 30, 2022 |
|||||||
| Average daily total net assets |
$ | 1,776,779 | $ | 975,029 | ||||
| Net realized and unrealized gain (loss) on futures contracts |
$ | 514,510 | $ | (20,314 | ) | |||
| Interest income earned on cash equivalents |
$ | 56,099 | $ | 1,073 | ||||
| Annualized interest yield based on average daily total net assets |
3.16 | % | 0.11 | % | ||||
| Net Income (Loss) |
$ | 558,118 | $ | (19,618 | ) | |||
| Weighted average share outstanding |
52,825 | 40,003 | ||||||
| Management Fees |
$ | 12,491 | $ | 377 | ||||
| Total gross fees and other expenses excluding management fees |
$ | 222,642 | $ | 550 | ||||
| Brokerage Commissions |
$ | 1,970 | $ | 949 | ||||
| Expenses waived by the Sponsor |
$ | (222,642 | ) | $ | (550 | ) | ||
| Total gross expense ratio |
17.69 | % | 2.31 | % | ||||
| Total expense ratio net of expenses waived by the Sponsor |
0.94 | % | 0.94 | % | ||||
| Net investment gain |
3.28 | % | 1.74 | % | ||||
| Creation of Shares |
10,000 | 50,004 | ||||||
| Redemption of Shares |
10,000 | - | ||||||
Realized gain or loss on trading of cryptocurrency futures contracts is a function of: 1) the change in the price of the particular contracts sold as part of a “roll” in contracts as the nearest to expire contracts are exchanged for the appropriate contract given the investment objective of the fund, 2) the change in the price of particular contracts sold in relation to redemption of shares, 3) the gain or loss associated with rebalancing trades which are made to ensure conformance to the benchmark, 4) the number of contracts held and then sold for either circumstance aforementioned. The Fund recognizes the expense for brokerage commissions for futures contract trades on a per trade basis. Unrealized gain or loss on trading of cryptocurrency futures contracts is a function of the change in the price of contracts held on the final date of the period versus the purchase price for each contract and the number of contracts held in each contract month. The Sponsor has a static benchmark as described above and trades futures contracts to adhere to that benchmark and to adjust for the creation or redemption of shares.
The Fund seeks to earn interest and other income in investment grade, short-duration instruments or deposits associated with the pool’s cash management strategy that may be used to offset expenses. These investments may include, but are not limited to, short-term Treasury Securities, demand deposits, money market funds and investments in commercial paper. These interest rate levels may be lower or higher than the projected interest rates stated in the prospectuses and thus will impact your breakeven point.
DEFI is contractually obligated to pay a monthly management fee to the Sponsor, based on average daily net assets, at a rate equal to 0.94% per annum. From the Management Fee, the Sponsor pays all of the routine operational, administrative and other ordinary expenses of the Fund, generally as determined by the Sponsor, including but not limited to, fees and expenses of the Administrator, Custodian, Distributor, Transfer Agent, licensors, accounting and audit fees expenses, tax preparation expenses, legal fees, ongoing SEC registration fees, individual Schedule K-1 preparation and mailing fees, and report preparation and mailing expenses. These fees and expenses are not included in the breakeven table because they are paid for by the Sponsor through the proceeds from the Management Fee. The Fund pays all of its non-recurring and unusual fees and expenses, if any, as determined by the Sponsor. Non-recurring and unusual fees and expenses are unexpected or unusual in nature, such as legal claims and liabilities and litigation costs or indemnification or other unanticipated expenses. Extraordinary fees and expenses also include material expenses which are not currently anticipated obligations of the Fund. Routine operational, administrative, and other ordinary expenses are not deemed extraordinary expenses.
The graph below shows the actual shares outstanding, total net assets (or AUM) and net asset value per share (NAV per share) for the Fund from inception to September 30, 2023 and serves to illustrate the relative changes of these components.
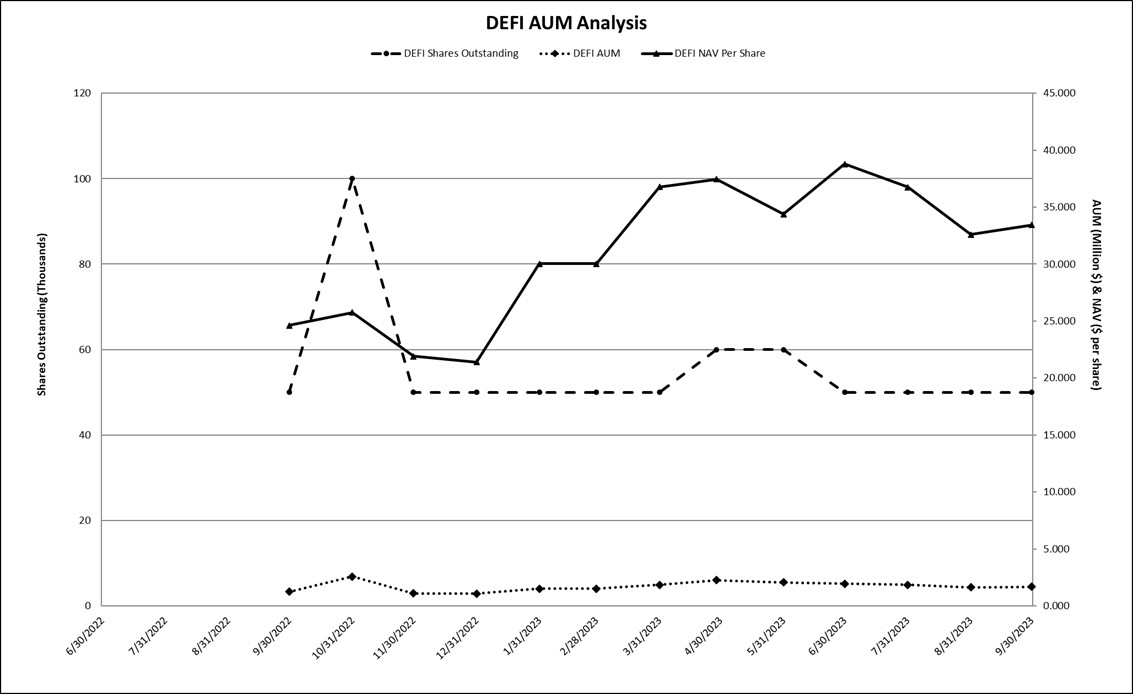
Other than the management fee to the Sponsor and the brokerage commissions, most of the expenses incurred by the Fund are associated with the day-to-day operation of the Fund and the necessary functions related to regulatory compliance. These are generally based on contracts, which extend for some period of time and up to one year, or commitments regardless of the level of assets under management. The structure of the Fund and the nature of the expenses are such that as total net assets grow, there is a scalability of expenses that may allow the total expense ratio to be reduced. However, if total net assets for the Fund fall, the total expense ratio of the Fund will increase unless additional reductions are made by the Sponsor to the daily expense accruals. The Sponsor can elect to adjust the daily expense accruals at its discretion based on market conditions and other Fund considerations.
Market Outlook
The Corn Market
Corn is currently the most widely produced livestock feed grain in the United States. The two largest demands of the United States’ corn crop are used in livestock feed and ethanol production. Corn is also processed into food and industrial products, including starch, sweeteners, corn oil, beverages, and industrial alcohol. The United States Department of Agriculture (“USDA”) publishes weekly, monthly, quarterly, and annual updates for U.S. domestic and worldwide corn production and consumption, and for other grains such as soybeans and wheat which can be used in some cases as a substitute for corn. These reports are available on the USDA’s website, www.usda.gov, at no charge. The outlook provided below is from the October 12, 2023 USDA report.
As a general matter, the occurrence of a severe weather event, natural disaster, terrorist attack, geopolitical events, outbreak, or public health emergency as declared by the World Health Organization, the continuation or expansion of war or other hostilities, or a prolonged government shutdown may have significant adverse effects on the Fund and its investments and alter current assumptions and expectations. For example, in late February 2022, Russia invaded Ukraine, significantly amplifying existing geopolitical tensions among Russia and other countries in the region and in the west. The responses of countries and political bodies to Russia’s actions, Ukraine’s military response and the potential for wider conflict may increase financial market volatility. Generally, these adverse effects may cause continued volatility in the price of corn, corn futures, and the share price of the Fund.
The price per bushel of corn in the United States is primarily a function of both U.S. and global production and demand. Long term impacts from sanctions, shipping disruptions, collateral war damage, and a potential expansion of the conflict between Russia and Ukraine could further disrupt the availability of corn supplies. These impacts remain important to track as both countries have played important roles in supplying grain to other parts of the world. As such, volatility, trading volumes, and prices in global corn markets have risen dramatically and are expected to continue indefinitely at extreme elevated levels. Given all of the above factors, the Sponsor has no ability to discern when current high levels of volatility will subside.
Recent geopolitical events have at times impacted the level of “backwardation” experienced by the Fund. As a result, near to expire contracts can trade at a higher price than longer to expire contracts, a situation referred to as “backwardation.” Putting aside the impact of the overall movement in prices of corn and corn futures, the Benchmark Component Futures Contracts (the corn futures contracts that the Fund invests in to achieve its investment objective) would tend to rise as they approach expiration. This backwardation may benefit the Fund because it will sell more expensive contracts and buy less expensive contracts on an ongoing basis.
Conversely, in the event of a corn futures market where near to expire contracts trade at a lower price than longer to expire contracts, a situation referred to as “contango,” then absent the impact of the overall movement in corn prices the value of the Benchmark Component Futures Contracts would tend to decline as they approach expiration. If the price of corn and corn futures were to decline, for example, because of a resolution of the Russia-Ukraine conflict, the Fund would experience the negative impact of contango.
The United States is the world’s leading producer and exporter of corn. For the Crop Year 2023-24, the United States Department of Agriculture (“USDA”) estimates that the U.S. will produce approximately 32% of all the corn globally, of which about 13% will be exported. For 2023-2024, based on the October 12, 2023, USDA reports, global consumption of 1,200 Million Metric Tons (MMT) is expected to be slightly lower than global production of 1,214 MMT. If the global demand for corn is not equal to global supply, this may have an impact on the price of corn. Besides the United States, other principal world corn exporters include Argentina, Brazil, Russia, South Africa, and Ukraine. Major import nations include Mexico, Japan, the European Union (EU), South Korea, Egypt, and parts of Southeast Asia. China’s production at 280 MMT is approximately 9% less than its domestic usage.
According to the USDA, global corn consumption has increased just over 595% from crop years 1960/1961 to 2023/2024 as demonstrated by the graph below and is projected to continue to grow in coming years. Consumption growth is the result of a combination of many factors including: 1) global population growth, which, according to the U.S. Census Department, is estimated to reach 9.7 billion by 2050; 2) a growing global middle class which is increasing the demand for protein and meat-based products globally and most significantly in developing countries; and 3) increased use of biofuels, including ethanol in the United States.
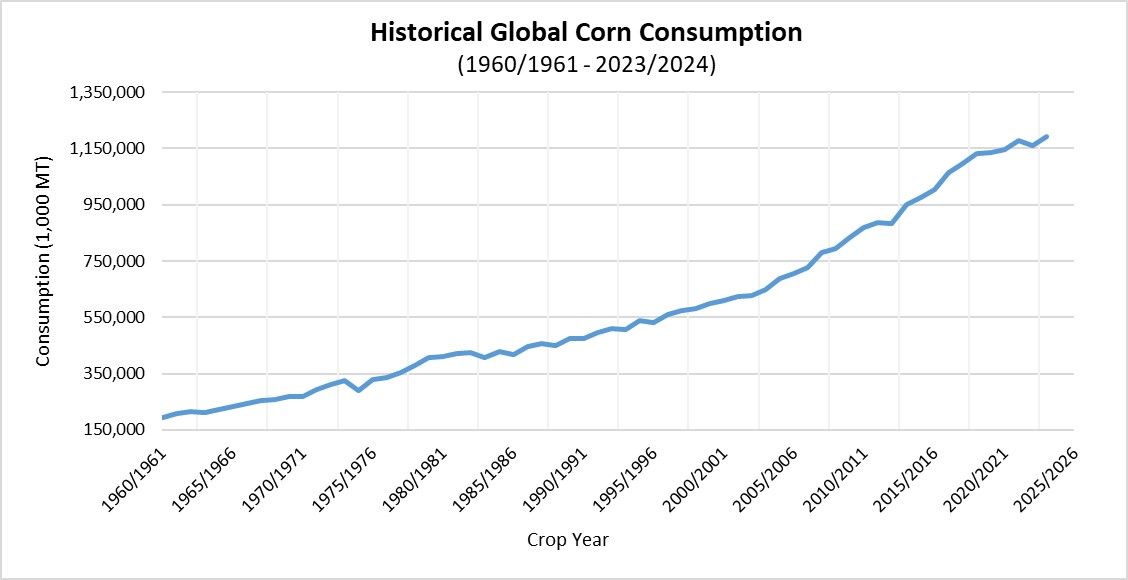
Global corn consumption may fluctuate year over year due to any number of reasons which may include, but is not limited to, economic conditions, global health concerns, international trade policy. Corn is a staple commodity used pervasively across the globe so that any contractions in consumption may only be temporary as has historically been the case.
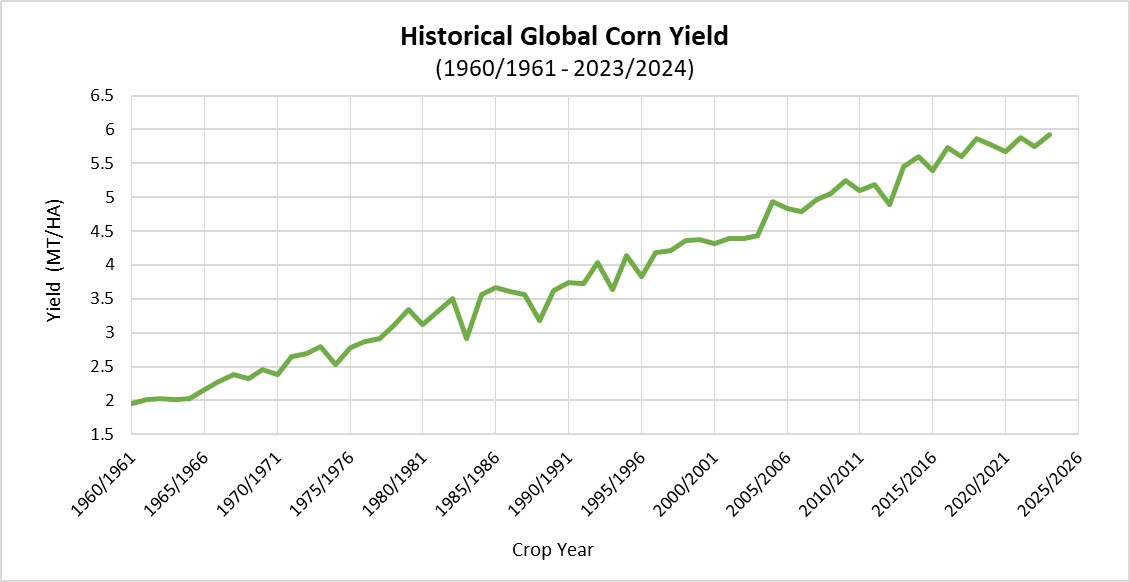
While global consumption of corn has increased over the 1960/1961-2023/2024 period, so has production, driven by increases in acres planted and yield per acre. However, according to the USDA and United Nations, future growth in planted acres and yield may be inhibited by lower productive land, and lack of infrastructure and transportation. In addition, agricultural crops such as corn are highly weather dependent for yield and therefore susceptible to changing weather patterns. In addition, given the current production/consumption patterns, nearly 100% of all corn produced globally is consumed which leaves minimal excess inventory if production issues arise.
The price per bushel of corn in the United States is primarily a function of both U.S. and global production, as well as U.S. and global demand. The graph below shows the USDA published price per bushel by month for the period January 2007 to August 2023.
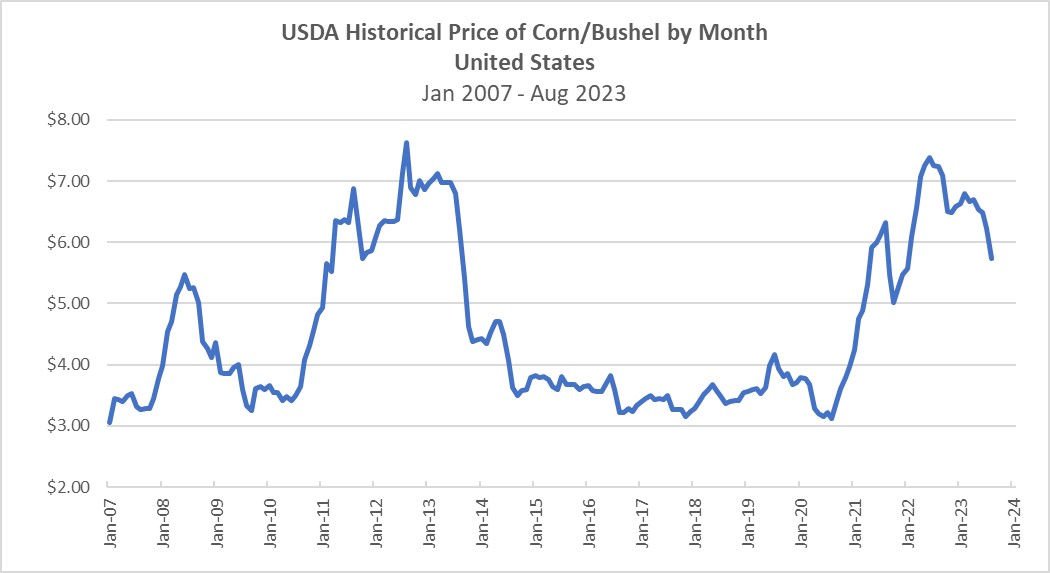
On October 12, 2023, the USDA released its monthly World Agricultural Supply and Demand Estimates (WASDE) for the Crop Year 2023-24. The exhibit below provides a summary of historical and current information for United States corn production.
| U.S. Corn Supply/Demand Balance |
||||||||||||||
| Marketing Year September - August |
||||||||||||||
| Million Bushels |
||||||||||||||
| Oct 12 Est. |
22-23 to |
Oct 12 Est. |
23-24 to |
|||||||||||
| USDA |
21-22 |
USDA |
22-23 |
|||||||||||
| Crop Year |
12-13 |
13-14 |
14-15 |
15-16 |
16-17 |
17-18 |
18-19 |
19-20 |
20-21 |
21-22 |
22-23 |
% Change |
23-24 |
% Change |
| Planted Acres |
97.3 |
95.4 |
90.6 |
88.0 |
94.0 |
90.2 |
88.9 |
89.7 |
90.7 |
93.3 |
88.6 |
-5% |
94.9 |
7% |
| Harvested Acres |
87.4 |
87.5 |
83.1 |
80.8 |
86.7 |
82.7 |
81.3 |
81.3 |
82.3 |
85.3 |
79.1 |
-7% |
87.1 |
10% |
| Difference |
9.9 |
7.9 |
7.5 |
7.2 |
7.3 |
7.5 |
7.6 |
8.4 |
8.4 |
8.0 |
9.5 |
19% |
7.8 |
-18% |
| Yield |
123.1 |
158.1 |
171.0 |
168.4 |
174.6 |
176.6 |
176.4 |
167.5 |
171.4 |
176.7 |
173.4 |
-2% |
173.0 |
0% |
| Beginning Stocks |
989 |
821 |
1,232 |
1,731 |
1,737 |
2,293 |
2,140 |
2,221 |
1,919 |
1,235 |
1,377 |
11% |
1,361 |
-1% |
| Production |
10,755 |
13,829 |
14,216 |
13,602 |
15,148 |
14,609 |
14,340 |
13,620 |
14,111 |
15,074 |
13,715 |
-9% |
15,064 |
10% |
| Imports |
160 |
36 |
32 |
68 |
57 |
36 |
28 |
42 |
24 |
24 |
39 |
63% |
25 |
-36% |
| Total Supply |
11,904 |
14,686 |
15,479 |
15,401 |
16,942 |
16,939 |
16,509 |
15,883 |
16,055 |
16,333 |
15,130 |
-7% |
16,451 |
9% |
| Feed |
4,315 |
5,040 |
5,280 |
5,114 |
5,470 |
5,304 |
5,429 |
5,900 |
5,607 |
5,726 |
5,549 |
-3% |
5,600 |
1% |
| Food/Seed/Industrial |
6,038 |
6,493 |
6,601 |
6,648 |
6,885 |
7,057 |
6,793 |
6,286 |
6,467 |
6,757 |
6,559 |
-3% |
6,715 |
2% |
| Ethanol for Fuel(incld above) |
4,641 |
5,124 |
5,200 |
5,224 |
5,432 |
5,605 |
5,378 |
4,857 |
5,028 |
5,320 |
5,177 |
-3% |
5,300 |
2% |
| Exports |
730 |
1,920 |
1,867 |
1,901 |
2,294 |
2,438 |
2,066 |
1,777 |
2,747 |
2,472 |
1,661 |
-33% |
2,025 |
22% |
| Total Usage |
11,083 |
13,454 |
13,748 |
13,664 |
14,650 |
14,798 |
14,288 |
13,963 |
14,821 |
14,956 |
13,769 |
-8% |
14,340 |
4% |
| Ending Stocks (Inventory) |
821 |
1,232 |
1,731 |
1,737 |
2,293 |
2,140 |
2,221 |
1,919 |
1,235 |
1,377 |
1,361 |
-1% |
2,111 |
55% |
| Stocks/Use Ratio |
7% |
9% |
13% |
13% |
16% |
14% |
16% |
14% |
8% |
9% |
10% |
7% |
15% |
49% |
| farm Price ($/bushel) |
$ 6.89 |
$ 4.46 |
$ 3.70 |
$ 3.61 |
$ 3.36 |
$3.36 |
$3.61 |
$3.56 |
$4.53 |
$6.00 |
$6.54 |
$4.95 |
||
| Calculations: |
||||||||||||||
| Demand per day (incld expt)¹ |
30.4 |
36.9 |
37.7 |
37.4 |
40.1 |
40.5 |
39.1 |
38.3 |
40.6 |
41.0 |
37.7 |
-8% |
39.3 |
4% |
| Carry-out days supply |
27.0 |
33.4 |
46.0 |
46.4 |
57.1 |
52.8 |
56.7 |
50.2 |
30.4 |
33.6 |
36.1 |
7% |
53.7 |
49% |
| ¹ in millions of bushels per day |
||||||||||||||
Standard Corn Futures Contracts trade on the CBOT in units of 5,000 bushels. Three grades of corn are deliverable under CBOT Corn Futures Contracts: Number 1 yellow, which may be delivered at 1.5 cents over the contract price; Number 2 yellow, which may be delivered at the contract price; and Number 3 yellow, between a 2 and 4 cents per bushel under contract price depending on broken corn and foreign material and damage grade factors. There are five months each year in which CBOT Corn Futures Contracts expire: March, May, July, September, and December.
If the futures market is in a state of backwardation (i.e., when the price of corn in the future is expected to be less than the current price), the Fund will buy later to expire contracts for a lower price than the sooner to expire contracts that it sells. Hypothetically, and assuming no changes to either prevailing corn prices or the price relationship between immediate delivery, soon to expire contracts and later to expire contracts, the value of a contract will rise as it approaches expiration. Over time, if backwardation remained constant, the differences would continue to increase. If the futures market is in contango, the Fund will buy later to expire contracts for a higher price than the sooner to expire contracts that it sells. Hypothetically, and assuming no other changes to either prevailing corn prices or the price relationship between the spot price, soon to expire contracts and later to expire contracts, the value of a contract will fall as it approaches expiration. Over time, if contango remained constant, the difference would continue to increase. Historically, the corn futures markets have experienced periods of both contango and backwardation. Frequently, whether contango or backwardation exists is a function, among other factors, of the seasonality of the corn market and the corn harvest cycle. All other things being equal, a situation involving prolonged periods of contango may adversely impact the returns of the Fund; conversely a situation involving prolonged periods of backwardation may positively impact the returns of the Fund.
Futures contracts may be either bought or sold, long or short. The U.S Commodity Futures Trading Commission weekly releases the “Commitment of Traders” (COT) report, which depicts the open interest as well as long and short positions in the market. Market participants may use this report to gauge market sentiment.
The Soybean Market
Global soybean production is concentrated in the U.S., Brazil, Argentina, and China. The United States Department of Agriculture (“USDA”) has estimated that, for the Crop Year 2023-24, the United States will produce approximately 112 MMT of soybeans or approximately 28% of estimated world production, with Brazil production at 163 MMT. Argentina is projected to produce about 48 MMT. For 2023-24, based on the October 12, 2023 USDA report, global consumption of 383 MMT is estimated slightly lower than global production of 400 MMT. If the global demand for soybeans is not equal to global supply, this may have an impact on the price of soybeans. Global soybean consumption may fluctuate year over year due to any number of reasons which may include, but is not limited to, economic conditions, global health concerns, and international trade policy. Soybeans are a staple commodity used pervasively across the globe so that any contractions in consumption may only be temporary as has historically been the case. The USDA publishes weekly, monthly, quarterly, and annual updates for U.S. domestic and worldwide soybean production and consumption. These reports are available on the USDA’s website, www.usda.gov, at no charge. The outlook provided below is from the October 12, 2023 USDA report.
As a general matter, the occurrence of a severe weather event, natural disaster, terrorist attack, geopolitical events, outbreak, or public health emergency as declared by the World Health Organization, the continuation or expansion of war or other hostilities, or a prolonged government shutdown may have significant adverse effects on the Fund and its investments and alter current assumptions and expectations. For example, in late February 2022, Russia invaded Ukraine, significantly amplifying existing geopolitical tensions among Russia and other countries in the region and in the west. Global response to Russia’s actions, the larger overarching tensions, and Ukraine’s military response may increase financial market volatility generally, have severe adverse effects on global economic markets, and cause volatility in the price of agricultural products, including agricultural futures, and the share price of the Fund.
The price per bushel of soybeans in the United States is primarily a function of both U.S. and global production and demand. The price per bushel of soybeans can be affected by the price of corn; because corn and soybeans are planted on the same acres, farmers must choose which crop to plant each year. If corn prices rise enough to incentivize the planting of corn over soybeans, the supply and price of soybeans could be affected. Long term impacts from sanctions, shipping disruptions, collateral war damage, and a potential expansion of the conflict between Russia and Ukraine could further disrupt the availability of agricultural products and supplies. China remains the largest importer of soybeans in the world. Volatility, trading volumes, and prices in global corn and soybean markets have risen dramatically and are expected to continue indefinitely at elevated levels. Given all of the above factors, the Sponsor has no ability to discern when current high levels of volatility will subside.
Recent geopolitical events may have impacted the level of “backwardation” experienced by the Fund. The Russian invasion and related developments have indirectly placed upward pressure on the price of soybean and soybean futures contracts. As a result, near to expire contracts trade at a higher price than longer to expire contracts, a situation referred to as “backwardation.” Putting aside the impact of the overall movement in prices of soybean and soybean futures, the Benchmark Component Futures Contracts (the soybean futures contracts that the Fund invests in to achieve its investment objective) would tend to rise as they approach expiration. This backwardation may benefit the Fund because it will sell more expensive contracts and buy less expensive contracts on an ongoing basis. The degree of backwardation is also shown in the following table.
Conversely, in the event of a soybean futures market where near to expire contracts trade at a lower price than longer to expire contracts, a situation referred to as “contango,” then absent the impact of the overall movement in soybean prices the value of the Benchmark Component Futures Contracts would tend to decline as they approach expiration. If the prices of soybeans and soybean futures were to decline, for example the Fund would experience the negative impact of contango.
The soybean processing industry converts soybeans into soybean meal, soybean hulls, and soybean oil. Soybean meal and soybean hulls are processed into soy flour or soy protein, which are used, along with other commodities, by livestock producers and the fish farming industry as feed. Soybean oil is sold in multiple grades and is used by the food, petroleum, and chemical industries. The food industry uses soybean oil in cooking and salad dressings, baking and frying fats, and butter substitutes, among other uses. In addition, the soybean industry continues to introduce soy-based products as substitutes to various petroleum-based products including lubricants, plastics, inks, crayons, and candles. Soybean oil is also converted to biodiesel and renewable diesel for use as fuel.
Standard Soybean Futures Contracts trade on the CBOT in units of 5,000 bushels, although 1,000 bushel “mini-sized” Soybean Futures Contracts also trade. Three grades of soybeans are deliverable under CBOT Soybean Futures Contracts: Number 1 yellow, which may be delivered at 6 cents per bushel over the contract price; Number 2 yellow, which may be delivered at the contract price; and Number 3 yellow, which may be delivered at 6 cents per bushel under the contract price. There are seven months each year in which CBOT Soybean Futures Contracts expire: January, March, May, July, August, September, and November.
If the futures market is in a state of backwardation (i.e., when the price of soybeans in the future is expected to be less than the current price), the Fund will buy later to expire contracts for a lower price than the sooner to expire contracts that it sells. Hypothetically, and assuming no changes to either prevailing soybean prices or the price relationship between immediate delivery, soon to expire contracts and later to expire contracts, the value of a contract will rise as it approaches expiration. If the futures market is in contango, the Fund will buy later to expire contracts for a higher price than the sooner to expire contracts that it sells. Hypothetically, and assuming no other changes to either prevailing soybean prices or the price relationship between the spot price, soon to expire contracts and later to expire contracts, the value of a contract will fall as it approaches expiration. Historically, the soybeans futures markets have experienced periods of both contango and backwardation. Frequently, whether contango or backwardation exists is a function, among other factors, of the seasonality of the soybean market and the soybean harvest cycle. All other things being equal, a situation involving prolonged periods of contango may adversely impact the returns of the Fund; conversely a situation involving prolonged periods of backwardation may positively impact the returns of the Fund.
The price per bushel of soybeans in the United States is primarily a function of both U.S. and global production, as well as U.S. and global demand. The graph below shows the USDA published price per bushel by month for the period January 2007 to August 2023.
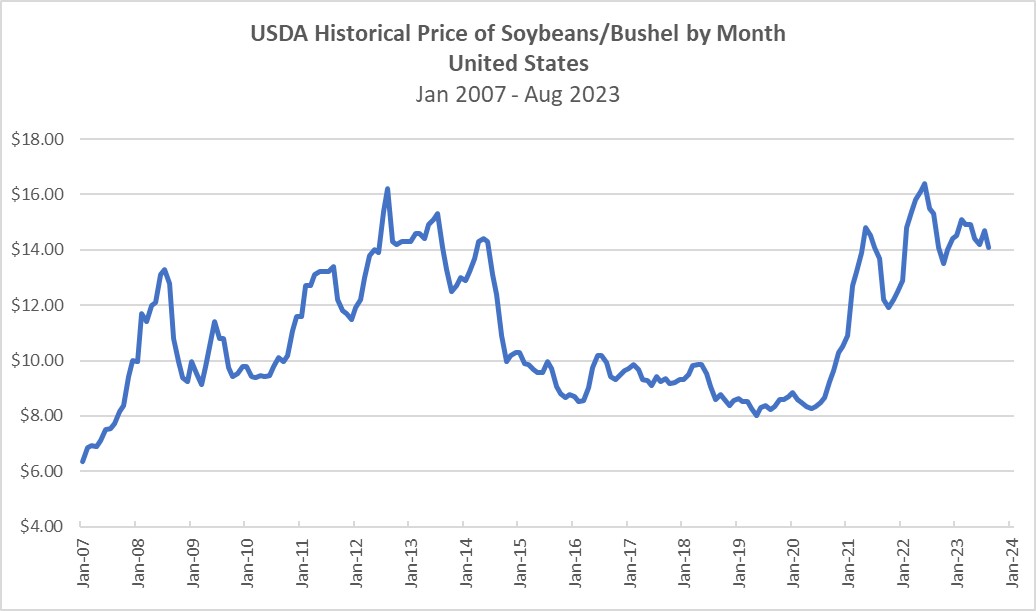
On October 12, 2023, the USDA released its monthly World Agricultural Supply and Demand Estimates (WASDE) for the Crop Year 2022-23. The exhibit below provides a summary of historical and current information for United States soybean production.
| U.S. Soybean Supply/Demand Balance |
||||||||||||||
| Marketing Year September - August |
||||||||||||||
| Million Bushels |
||||||||||||||
| Oct 12 Est. |
22-23 to |
Oct 12 Est. |
23-24 to |
|||||||||||
| USDA |
21-22 |
USDA |
22-23 |
|||||||||||
| Crop Year |
12-13 |
13-14 |
14-15 |
15-16 |
16-17 |
17-18 |
18-19 |
19-20 |
20-21 |
21-22 |
22-23 |
% Change |
23-24 |
% Change |
| Planted Acres |
77.2 |
76.8 |
83.3 |
82.7 |
83.5 |
90.2 |
89.2 |
76.1 |
83.4 |
87.2 |
87.5 |
0% |
83.6 |
-4% |
| Harvested Acres |
76.1 |
76.3 |
82.6 |
81.7 |
82.7 |
89.5 |
87.6 |
74.9 |
82.6 |
86.3 |
86.2 |
0% |
82.8 |
-4% |
| Difference |
1.0 |
0.5 |
0.7 |
1.0 |
0.8 |
0.7 |
1.6 |
1.2 |
0.8 |
0.9 |
1.3 |
44% |
0.8 |
-38% |
| Yield |
40.0 |
44.0 |
47.5 |
48.0 |
51.9 |
49.3 |
50.6 |
47.4 |
51.0 |
51.7 |
49.6 |
-4% |
49.6 |
0% |
| Beginning Stocks |
169 |
141 |
92 |
191 |
197 |
302 |
438 |
909 |
525 |
257 |
274 |
7% |
268 |
-2% |
| Production |
3,042 |
3,358 |
3,927 |
3,926 |
4,296 |
4,412 |
4,428 |
3,552 |
4,216 |
4,465 |
4,270 |
-4% |
4,104 |
-4% |
| Imports |
41 |
72 |
33 |
24 |
22 |
22 |
14 |
15 |
20 |
16 |
25 |
56% |
30 |
20% |
| Total Supply |
3,252 |
3,570 |
4,052 |
4,140 |
4,516 |
4,735 |
4,880 |
4,476 |
4,761 |
4,738 |
4,569 |
-4% |
4,403 |
-4% |
| Crushings |
1,689 |
1,734 |
1,873 |
1,886 |
1,901 |
2,055 |
2,092 |
2,165 |
2,141 |
2,204 |
2,212 |
0% |
2,300 |
4% |
| Seed, Feed and Residual |
105 |
107 |
146 |
115 |
147 |
109 |
127 |
108 |
97 |
108 |
97 |
-10% |
128 |
32% |
| Exports |
1,317 |
1,638 |
1,842 |
1,942 |
2,166 |
2,134 |
1,752 |
1,679 |
2,266 |
2,152 |
1,992 |
-7% |
1,755 |
-12% |
| Total Usage |
3,111 |
3,478 |
3,862 |
3,944 |
4,214 |
4,297 |
3,971 |
3,952 |
4,504 |
4,464 |
4,301 |
-4% |
4,183 |
-3% |
| Ending Stocks (Inventory) |
141 |
92 |
191 |
197 |
302 |
438 |
909 |
525 |
257 |
274 |
268 |
-2% |
220 |
-18% |
| Stocks/Use Ratio |
4.5% |
2.6% |
4.9% |
5.0% |
7.2% |
10.2% |
22.9% |
13.3% |
5.7% |
6.1% |
6% |
2% |
5.3% |
-16% |
| farm Price ($/bushel) |
$ 14.40 |
$ 13.00 |
$ 10.10 |
$ 8.95 |
$ 9.47 |
$9.33 |
$8.48 |
$8.57 |
$10.80 |
$13.30 |
$14.20 |
$12.90 |
||
| Calculations: |
||||||||||||||
| Demand per day (incld expt)¹ |
8.5 |
9.5 |
10.6 |
10.8 |
11.5 |
11.8 |
10.9 |
10.8 |
12.3 |
12.2 |
11.8 |
-4% |
11.5 |
-3% |
| Carry-out days supply |
16.6 |
9.7 |
18.1 |
18.2 |
26.2 |
37.2 |
83.6 |
48.5 |
20.8 |
22.4 |
22.7 |
2% |
19.2 |
-16% |
| ¹ in millions of bushels per day |
||||||||||||||
The Sugar Market
Sugarcane accounts for nearly 80% of the world’s sugar production, while sugar beets account for the remainder of the world’s sugar production. Sugar manufacturers use sugar beets and sugarcane as the raw material from which refined sugar (sucrose) for industrial and consumer use is produced. Sugar is produced in various forms, including granulated, powdered, liquid, brown, and molasses. The food industry (in particular, producers of baked goods, beverages, cereal, confections, and dairy products) uses sugar and sugarcane molasses to make sugar-containing food products. Sugar beet pulp and molasses products are used as animal feed ingredients. Ethanol is an important by-product of sugarcane processing. Additionally, the material that is left over after sugarcane is processed is used to manufacture paper, cardboard, and “environmentally friendly” eating utensils.
As a general matter, the occurrence of a severe weather event, natural disaster, terrorist attack, geopolitical events, outbreak, or public health emergency as declared by the World Health Organization, the continuation or expansion of war or other hostilities, or a prolonged government shutdown may have significant adverse effects on the Fund and its investments and alter current assumptions and expectations. For example, in late February 2022, Russia invaded Ukraine, significantly amplifying existing geopolitical tensions among Russia and other countries in the region and in the west. The responses of countries and political bodies to Russia’s actions, the larger overarching tensions, and Ukraine’s military response and the potential for wider conflict may increase financial market volatility generally, have severe adverse effects on global economic markets, and cause volatility in the price of agricultural products, including agricultural futures, and the share price of the Fund.
The price per pound of sugar in the United States is primarily a function of both U.S. and global production and demand as well as expansive protectionist policies implemented by the US Government. Long term impacts from sanctions, shipping disruptions, collateral war damage, and a potential expansion of the conflict between Russia and Ukraine could further disrupt the availability of agricultural products and supplies. Russian production of sugar comes primarily from sugar beets. Ukraine’s sugar production is small and relatively inconsequential to global sugar markets. Now at question is the ability of farmers in both countries to plant this season’s sugar beet crop. Volatility, trading volumes, and prices in global sugar markets have risen dramatically and are expected to continue indefinitely at extreme elevated levels. Given all of the above factors, the Sponsor has no ability to discern when current high levels of volatility will subside.
Recent geopolitical events may have also impacted the level of “backwardation” experienced by the Fund. The Russian invasion and related developments may have placed upward pressure on the price of sugar and sugar futures contracts. As a result, near to expire contracts trade at a higher price than longer to expire contracts, a situation referred to as “backwardation.” Putting aside the impact of the overall movement in prices of sugar and sugar futures, the Benchmark Component Futures Contracts (the sugar futures contracts that the Fund invests in to achieve its investment objective) would tend to rise as they approach expiration. This backwardation may benefit the Fund because it will sell more expensive contracts and buy less expensive contracts on an ongoing basis.
Conversely, in the event of a sugar futures market where near to expire contracts trade at a lower price than longer to expire contracts, a situation referred to as “contango,” then absent the impact of the overall movement in sugar prices the value of the Benchmark Component Futures Contracts would tend to decline as they approach expiration. If the prices of sugar and sugar futures were to decline, for example, because of a resolution of the Russia-Ukraine conflict, the Fund would experience the negative impact of contango.
The Sugar No. 11 Futures Contract is the world benchmark contract for raw sugar trading. This contract prices the physical delivery of raw cane sugar, delivered to the receiver’s vessel at a specified port within the country of origin of the sugar. Sugar No. 11 Futures Contracts trade on ICE Futures US and the NYMEX in units of 112,000 pounds.
The United States Department of Agriculture (“USDA”) publishes two major reports annually on U.S. domestic and worldwide sugar production and consumption. These are usually released in November and May. In addition, the USDA publishes periodic, but not as comprehensive, reports on sugar monthly. These reports are available on the USDA’s website, www.usda.gov, at no charge. The USDA’s November 2022 report for the 2022-23 Marketing year estimated global production of 183.2 MMT as higher production in Brazil, China, and Russia is expected to more than offset declines in the European Union, India and Ukraine. Consumption is expected to rise due to growth in markets including China, Indonesia, and Russia. Stocks are forecast lower as growth in global consumption exceeds the rise in production. Global sugar consumption may fluctuate year over year due to any number of reasons which may include, but is not limited to, economic conditions, global health concerns, international trade policy. Sugar is a staple commodity used pervasively across the globe so that any contractions in consumption may only be temporary as has historically been the case.
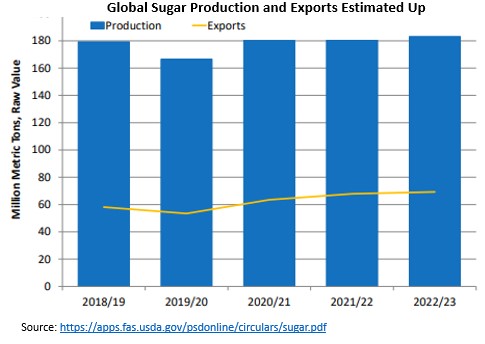
If the futures market is in a state of backwardation (i.e., when the price of sugar in the future is expected to be less than the current price), the Fund will buy later to expire contracts for a lower price than the sooner to expire contracts that it sells. Hypothetically, and assuming no changes to either prevailing sugar prices or the price relationship between immediate delivery, soon to expire contracts and later to expire contracts, the value of a contract will rise as it approaches expiration. If the futures market is in contango, the Fund will buy later to expire contracts for a higher price than the sooner to expire contracts that it sells. Hypothetically, and assuming no other changes to either prevailing sugar prices or the price relationship between the spot price, soon to expire contracts and later to expire contracts, the value of a contract will fall as it approaches expiration. Historically, the sugar futures markets have experienced periods of both contango and backwardation. Frequently, whether contango or backwardation exists is a function, among other factors, of the seasonality of the sugar market and the sugar harvest cycle. All other things being equal, a situation involving prolonged periods of contango may adversely impact the returns of the Funds; conversely a situation involving prolonged periods of backwardation may positively impact the returns of the Funds.
Futures contracts may be either bought or sold long or short. The U.S Commodity Futures Trading Commission weekly releases the “Commitment of Traders” (COT) report, which depicts the open interest as well as long and short positions in the market. Market participants may use this report to gauge market sentiment.
The Wheat Market
Wheat is used to produce flour, the key ingredient for breads, pasta, crackers, and many other food products, as well as several industrial products such as starches and adhesives. Wheat by-products are used in livestock feeds. Wheat is the principal food grain produced in the United States, and the United States’ output of wheat is typically exceeded only by that of China, the European Union, Russia, and India. The United States Department of Agriculture (“USDA”) estimates that for 2023-24, the principal global producers of wheat will be the EU, Russia, Ukraine, China, India, the United States, Australia, and Canada. The U.S. generates approximately 6% of global production, with approximately 39% of that being exported. For 2023-24, based on the October 12, 2023 USDA report, global consumption of 783 MMT is estimated to be slightly higher than production of 783 MMT. If the global demand of wheat is not equal to global supply, this may have an impact on the price of wheat. Global wheat consumption may fluctuate year over year due to any number of reasons which may include, but is not limited to, economic conditions, global health concerns, international trade policy. Wheat is a staple commodity used pervasively across the globe so that any contractions in consumption may only be temporary as has historically been the case. The USDA publishes weekly, monthly, quarterly, and annual updates for U.S. domestic and worldwide wheat production and consumption. These reports are available on the USDA’s website, www.usda.gov, at no charge. The outlook provided herein is from the October 12, 2023 USDA report.
As a general matter, the occurrence of a severe weather event, natural disaster, terrorist attack, geopolitical events, outbreak, or public health emergency as declared by the World Health Organization, the continuation or expansion of war or other hostilities, or a prolonged government shutdown may have significant adverse effects on the Fund and its investments and alter current assumptions and expectations. For example, in late February 2022, Russia invaded Ukraine, significantly amplifying already existing geopolitical tensions among Russia and other countries in the region and in the west. The responses of countries and political bodies to Russia’s actions, the larger overarching tensions, Ukraine’s military response may increase financial market volatility. The results can have severe adverse effects on global economic markets, and cause volatility in the price of wheat, wheat futures and the share price of the Fund.
The price per bushel of wheat in the United States is primarily a function of both U.S. and global wheat production and demand. Russia and Ukraine, historically, have constituted the top export supply of wheat by volume (approximately 30 percent of total global wheat exports) to the world. The escalating conflict between the two countries, including but not limited to, sanctions, shipping disruptions, and collateral war damage could further disrupt the availability of wheat supplies. The conflict has greatly impacted exports of the wheat crop that was harvested last season and is currently in storage. In addition, the ability of farmers in both countries to plant fall crops could be greatly impacted. As such, volatility, trading volumes, and prices in global wheat markets have risen dramatically and are expected to continue indefinitely at extreme elevated levels. Given all of the above factors, the Sponsor has no ability to discern when current high levels of volatility will subside.
Recent geopolitical events have also impacted the level of “backwardation” experienced by the Fund. The Russian invasion and related developments have placed upward pressure on the price of wheat and wheat futures contracts. As a result, near to expire contracts trade at a higher price than longer to expire contracts, a situation referred to as “backwardation.” Putting aside the impact of the overall movement in prices of wheat and wheat futures, the Benchmark Component Futures Contracts (the wheat futures contracts that the Fund invests in to achieve its investment objective) would tend to rise as they approach expiration. This backwardation may benefit the Fund because it will sell more expensive contracts and buy less expensive contracts on an ongoing basis. The degree of backwardation is also shown in the following table.
Conversely, in the event of a wheat futures market where near to expire contracts trade at a lower price than longer to expire contracts, a situation referred to as “contango,” then absent the impact of the overall movement in wheat prices the value of the Benchmark Component Futures Contracts would tend to decline as they approach expiration. If the prices of wheat and wheat futures were to decline, for example, because of a resolution of the Russia-Ukraine conflict, the Fund would experience the negative impact of contango.
There are several types of wheat grown in the U.S., which are classified in terms of color, hardness, and growing season. CBOT Wheat Futures Contracts call for delivery of #2 soft red winter wheat, which is generally grown in the eastern third of the United States, but other types and grades of wheat may also be delivered (Grade #1 soft red winter wheat, Hard Red Winter, Dark Northern Spring and Northern Spring wheat may be delivered at 3 cents premium per bushel over the contract price and #2 soft red winter wheat, Hard Red Winter, Dark Northern Spring and Northern Spring wheat may be delivered at the contract price.) Winter wheat is planted in the fall and is harvested in the late spring or early summer of the following year, while spring wheat is planted in the spring and harvested in late summer or fall of the same year. Standard Wheat Futures Contracts trade on the CBOT in units of 5,000 bushels. There are five months each year in which CBOT Wheat Futures Contracts expire: March, May, July, September, and December.
If the futures market is in a state of backwardation (i.e., when the price of wheat in the future is expected to be less than the current price), the Fund will buy later to expire contracts for a lower price than the sooner to expire contracts that it sells. Hypothetically, and assuming no changes to either prevailing wheat prices or the price relationship between immediate delivery, soon to expire contracts and later to expire contracts, the value of a contract will rise as it approaches expiration. If the futures market is in contango, the Fund will buy later to expire contracts for a higher price than the sooner to expire contracts that it sells. Hypothetically, and assuming no other changes to either prevailing wheat prices or the price relationship between the spot price, soon to expire contracts and later to expire contracts, the value of a contract will fall as it approaches expiration. Historically, the wheat futures markets have experienced periods of both contango and backwardation. Frequently, whether contango or backwardation exists is a function, among other factors, of the seasonality of the wheat market and the wheat harvest cycle. All other things being equal, a situation involving prolonged periods of contango may adversely impact the returns of the Fund; conversely a situation involving prolonged periods of backwardation may positively impact the returns of the Fund.
Futures contracts may be either bought or sold, long or short. The U.S Commodity Futures Trading Commission weekly releases the “Commitment of Traders” (COT) report, which depicts the open interest as well as long and short positions in the market. Market participants may use this report to gauge market sentiment.
The price per bushel of wheat in the United States is primarily a function of both U.S. and global production, as well as U.S. and global demand. The graph below shows the USDA published price per bushel by month for the period January 2007 to August 2023.
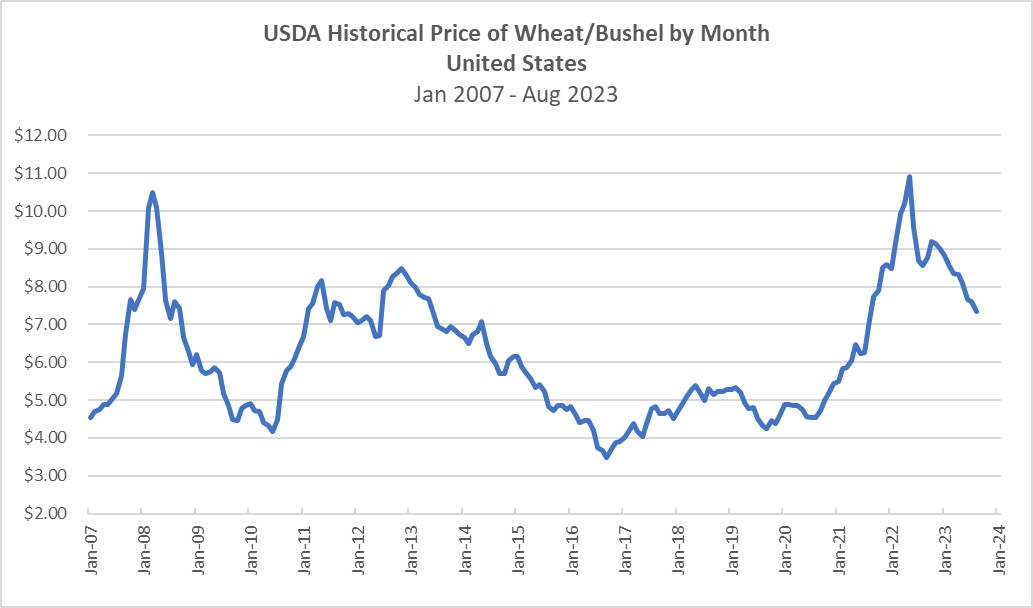
On October 12, 2023, the USDA released its monthly World Agricultural Supply and Demand Estimates (WASDE) for the Crop Year 2023-24. The exhibit below provides a summary of historical and current information for United States wheat production.
| U.S. Wheat Supply/Demand Balance |
||||||||||||||
| Marketing Year June - May |
||||||||||||||
| Million Bushels |
||||||||||||||
| Oct 12 Est. |
22-23 to |
Oct 12 Est. |
23-24 to |
|||||||||||
| USDA |
21-22 |
USDA |
22-23 |
|||||||||||
| Crop Year |
12-13 |
13-14 |
14-15 |
15-16 |
16-17 |
17-18 |
18-19 |
19-20 |
20-21 |
21-22 |
22-23 |
% Change |
23-24 |
% Change |
| Planted Acres |
55.3 |
56.2 |
56.8 |
55.0 |
50.1 |
46.1 |
47.8 |
45.5 |
44.5 |
46.7 |
45.7 |
-2% |
49.6 |
9% |
| Harvested Acres |
48.8 |
45.3 |
46.4 |
47.3 |
43.8 |
37.6 |
39.6 |
37.4 |
36.8 |
37.1 |
35.5 |
-4% |
37.3 |
5% |
| Difference |
6.5 |
10.9 |
10.4 |
7.7 |
6.3 |
8.5 |
8.2 |
8.1 |
7.7 |
9.6 |
10.2 |
6% |
12.3 |
21% |
| Yield |
46.2 |
47.1 |
43.7 |
43.6 |
52.7 |
46.4 |
47.6 |
51.7 |
49.7 |
44.3 |
46.5 |
5% |
48.6 |
5% |
| Beginning Stocks |
743 |
718 |
590 |
752 |
976 |
1,181 |
1,099 |
1,080 |
1,028 |
845 |
698 |
-17% |
582 |
-17% |
| Production |
2,252 |
2,135 |
2,026 |
2,062 |
2,309 |
1,741 |
1,885 |
1,932 |
1,828 |
1,646 |
1,650 |
0% |
1,812 |
10% |
| Imports |
123 |
173 |
151 |
113 |
118 |
158 |
135 |
104 |
100 |
96 |
122 |
27% |
135 |
11% |
| Total Supply |
3,118 |
3,026 |
2,768 |
2,927 |
3,402 |
3,080 |
3,119 |
3,116 |
2,956 |
2,588 |
2,470 |
-5% |
2,529 |
2% |
| Food |
951 |
955 |
958 |
957 |
949 |
964 |
954 |
962 |
961 |
971 |
973 |
0% |
974 |
0% |
| Seed |
73 |
77 |
79 |
67 |
61 |
63 |
59 |
62 |
64 |
58 |
68 |
17% |
65 |
-4% |
| Feed and residual |
364 |
228 |
114 |
149 |
160 |
47 |
88 |
95 |
93 |
64 |
89 |
39% |
120 |
35% |
| Exports |
1,012 |
1,176 |
864 |
778 |
1,051 |
906 |
937 |
969 |
994 |
796 |
759 |
-5% |
700 |
-8% |
| Total Usage |
2,400 |
2,436 |
2,015 |
1,951 |
2,222 |
1,981 |
2,039 |
2,087 |
2,111 |
1,889 |
1,888 |
0% |
1,859 |
-2% |
| Ending Stocks (Inventory) |
718 |
590 |
752 |
976 |
1,181 |
1,099 |
1,080 |
1,028 |
845 |
698 |
582 |
-17% |
670 |
15% |
| Stocks/Use Ratio |
29.7% |
24.2% |
37.3% |
50.0% |
53.2% |
55.5% |
53.0% |
49.3% |
40.0% |
37.0% |
30.8% |
-17% |
36.0% |
17% |
| farm Price ($/bushel) |
$ 7.77 |
$ 6.87 |
$ 5.99 |
$ 4.89 |
$ 3.89 |
$4.72 |
$5.16 |
$4.58 |
$5.05 |
$7.63 |
$8.83 |
$7.30 |
||
| Calculations: |
||||||||||||||
| Demand per day (incld expt)¹ |
6.6 |
6.7 |
5.5 |
5.3 |
6.1 |
5.4 |
5.6 |
5.7 |
5.8 |
5.2 |
5.2 |
0% |
5.1 |
-2% |
| Carry-out days supply |
108.6 |
88.4 |
136.2 |
182.6 |
194.0 |
202.5 |
193.3 |
179.8 |
146.1 |
134.9 |
112.5 |
-17% |
131.5 |
17% |
| ¹ in millions of bushels per day |
||||||||||||||
The Bitcoin Industry
Bitcoin
Bitcoin is a digital asset that serves as the unit of account on an open-source, decentralized, peer-to-peer computer network. Bitcoin may be used to pay for goods and services, stored for future use, or converted to a fiat currency. As of the date of this update, the adoption of bitcoin for these purposes has been limited. The value of bitcoin is not backed by any government, corporation, or other identified body.
The value of bitcoin is determined in part by the supply of (which is limited), and demand for, bitcoin in the markets for exchange that have been organized to facilitate the trading of bitcoin. By design, the supply of bitcoin is limited to 21 million bitcoins. As of the date of this update, there are approximately 19 million bitcoins in circulation.
Bitcoin is maintained on the decentralized, open source, peer-to-peer computer network (the “Bitcoin Network”). No single entity owns or operates the Bitcoin Network. The Bitcoin Network is accessed through software and governs bitcoin’s creation and movement. The source code for the Bitcoin Network, often referred to as the Bitcoin Protocol, is open-source, and anyone can contribute to its development.
Price movements for bitcoin are influenced by, among other things, the environment, natural or man-made disasters, governmental oversight and regulation, demographics, economic conditions, infrastructure limitations, existing and future technological developments, and a variety of other factors now known and unknown, any and all of which can have an impact on the supply, demand, and price fluctuations in the bitcoin markets. More generally, cryptocurrency prices may be influenced by economic and monetary events such as changes in interest rates, changes in balances of payments and trade, U.S. and international inflation rates, currency valuations and devaluations, U.S. and international economic events, and changes in the philosophies and emotions of market purchasers. Because the Fund invests in futures contracts in a single cryptocurrency, it is not a diversified investment vehicle, and therefore may be subject to greater volatility than a diversified portfolio of stocks or bonds or a more diversified commodity or cryptocurrency pool.
The Bitcoin Network
The infrastructure of the Bitcoin Network is collectively maintained by participants in the Bitcoin Network, which include miners, developers, and users. Miners validate transactions and are currently compensated for that service in bitcoin. Developers maintain and contribute updates to the Bitcoin Network’s source code, often referred to as the Bitcoin Protocol. Users access the Bitcoin Network using open-source software. Anyone can be a user, developer, or miner.
Bitcoin is “stored” on a digital transaction ledger commonly known as a “blockchain.” A blockchain is a type of shared and continually reconciled database, stored in a decentralized manner on the computers of certain users of the digital asset and is protected by cryptography. The Bitcoin Blockchain contains a record and history for each bitcoin transaction.
New bitcoin is created by “mining.” Miners use specialized computer software and hardware to solve a highly complex mathematical problem presented by the Bitcoin Protocol. The first miner to successfully solve the problem is permitted to add a block of transactions to the Bitcoin Blockchain. The new block is then confirmed through acceptance by a majority of users who maintain versions of the blockchain on their individual computers. Miners that successfully add a block to the Bitcoin Blockchain are automatically rewarded with a fixed amount of bitcoin for their effort plus any transaction fees paid by transferors whose transactions are recorded in the block. This reward system is the means by which new bitcoin enter circulation and is the mechanism by which versions of the blockchain held by users on a decentralized network are kept in consensus.
The Bitcoin Protocol
The Bitcoin Protocol is an open source project with no official company or group in control. Anyone can review the underlying code and suggest changes. There are, however, a number of individual developers that regularly contribute to a specific distribution of bitcoin software known as the “Bitcoin Core.” Developers of the Bitcoin Core loosely oversee the development of the source code. There are many other compatible versions of the bitcoin software, but Bitcoin Core is the most widely adopted and currently provides the de facto standard for the Bitcoin Protocol. The core developers are able to access, and can alter, the Bitcoin Network source code and, as a result, they are responsible for quasi-official releases of updates and other changes to the Bitcoin Network’s source code.
However, because bitcoin has no central authority, the release of updates to the Bitcoin Network’s source code by the core developers does not guarantee that the updates will be automatically adopted by the other purchasers. Users and miners must accept any changes made to the source code by downloading the proposed modification and that modification is effective only with respect to those bitcoin users and miners who choose to download it. As a practical matter, a modification to the source code becomes part of the Bitcoin Network only if it is accepted by participants that collectively have a majority of the processing power on the Bitcoin Network. If a modification is accepted by only a percentage of users and miners, a division will occur such that one network will run the pre-modification source code and the other network will run the modified source code. Such a division is known as a “fork.”
Calculating the Net Asset Value
The NAV of each Fund is calculated by:
| • |
taking the current market value of its total assets, and |
|
| • |
subtracting any liabilities. |
The Administrator calculates the NAV of the Fund once each trading day. It calculates NAV as of the earlier of the close of the New York Stock Exchange or 4:00 p.m. (ET). The NAV for a particular trading day is released after 4:15 p.m. (ET).
In determining the value of the Futures Contracts for each Fund, the Administrator uses the closing price on the exchange on which the commodity or cryptocurrency is traded, commonly referred to as the settlement price. The time of settlement for each exchange is determined by that exchange and may change from time to time. The current settlement time for each exchange can be found at the respective website for the CBOT, CME, or ICE, as the case may be, as follows:
1) for the CBOT (CORN, SOYB and WEAT) http://www.cmegroup.com/trading_hours/commodities-hours.html;
2) for ICE (CANE) http://www.theice.com/productguide/Search.shtml?tradingHours=.
3) for the CME (DEFI) https://www.cmegroup.com/trading-hours.html
The Administrator determines the value of all other investments for each Fund as of the earlier of the close of the New York Stock Exchange or 4:00 p.m., (ET), in accordance with the current Services Agreement between the Administrator and the Trust.
The value of over-the-counter Commodity Interests will be determined based on the value of the commodity or Futures Contract underlying such Commodity Interest, except that a fair value may be determined if the Sponsor believes that a Fund is subject to significant credit risk relating to the counterparty to such Commodity Interest. For purposes of financial statements and reports, the Sponsor will recalculate the NAV of a specific Fund where necessary to reflect the “fair value” of a Futures Contract when the Futures Contract of such Fund closes at its price fluctuation limit for the day. Treasury Securities held by the Fund are valued by the Administrator using values received from recognized third-party vendors (such as Reuters) and dealer quotes. The NAV includes any unrealized profit or loss on open Commodity Interests and any other credit or debit accruing to each Fund but unpaid or not received by the Fund.
In addition, in order to provide updated information relating to the Funds for use by investors and market professionals, ICE Data Indices, LLC calculates and disseminates throughout the trading day an updated indicative fund value for each Fund. The indicative fund value is calculated by using the prior day’s closing NAV per share of the Fund as a base and updating that value throughout the trading day to reflect changes in the value of the Fund’s Commodity or Cryptocurrency Interests during the trading day. Changes in the value of short-term Treasury Securities and cash equivalents will not be included in the calculation of indicative value throughout the day. For this and other reasons, the indicative fund value disseminated during NYSE Arca trading hours should not be viewed as an actual real time update of the NAV for each Fund. The NAV is calculated only once at the end of each trading day.
The indicative fund value is disseminated on a per Share basis every 15 seconds during regular NYSE Arca trading hours of 9:30 a.m., (ET), to 4:00 p.m., (ET). The CBOT, CME, and ICE are generally open for trading only during specified hours which vary by exchange and may be adjusted by the exchange. However, the futures markets on these exchanges do not currently operate twenty-four hours per day. In addition, there may be some trading hours which may be limited to electronic trading only. This means that there is a gap in time at the beginning and the end of each day during which the Fund’s Shares are traded on the NYSE Arca, when, for example, real-time CBOT trading prices for Corn Futures Contracts traded on such Exchange are not available. As a result, during those gaps there will be no update to the indicative fund values. The most current trading hours for each exchange may be found on the website of that exchange as listed above.
ICE Data Indices, LLC disseminates the intraday indicative value (also referred to in this report as "approximate net asset value") of the Fund's Shares through the facilities of Consolidated Tape Association's Consolidated Quotation High Speed Lines (also known as the "CTA/QC High Speed Lines"). ICE Data Indices, LLC will make the Benchmark information available through online information services, such as Yahoo Finance, Bloomberg and Reuters.
Dissemination of the indicative fund value provides additional information that is not otherwise available to the public and is useful to investors and market professionals in connection with the trading of Fund Shares on the NYSE Arca. Investors and market professionals are able throughout the trading day to compare the market price of the Fund and the indicative fund value. If the market price of Fund Shares diverges significantly from the indicative fund value, market professionals may have an incentive to execute arbitrage trades. For example, if the Fund appears to be trading at a discount compared to the indicative fund value, a market professional could buy Fund Shares on the NYSE Arca, aggregate them into Redemption Baskets, and receive the NAV of such Shares by redeeming them to the Trust, provided that there is not a minimum number of shares outstanding for the Fund. Such arbitrage trades can tighten the tracking between the market price of the Fund and the indicative fund value.
Critical Accounting Policies
The Trust’s critical accounting policies for all the Funds are as follows:
| 1. |
Preparation of the financial statements and related disclosures in conformity with U.S. generally accepted accounting principles (“GAAP”) requires the application of appropriate accounting rules and guidance, as well as the use of estimates, and requires management to make estimates and assumptions that affect the reported amounts of assets and liabilities, revenue and expense and related disclosure of contingent assets and liabilities during the reporting period of the combined financial statements and accompanying notes. The Trust’s application of these policies involves judgments and actual results may differ from the estimates used. |
| 2. |
The Sponsor has determined that the valuation of commodity or cryptocurrency interests that are not traded on a U.S. or internationally recognized futures exchange (such as swaps and other over the counter contracts) involves a critical accounting policy. The values which are used by the Funds for futures contracts will be provided by the broker who will use market prices when available, while over the counter contracts will be valued based on the present value of estimated future cash flows that would be received from or paid to a third party in settlement of these derivative contracts prior to their delivery date. Values will be determined on a daily basis. |
| 3. |
Commodity or cryptocurrency futures contracts held by the Funds are recorded on the trade date. All such transactions are recorded on the identified cost basis and marked to market daily. Unrealized appreciation or depreciation on commodity or cryptocurrency futures contracts are reflected in the statement of operations as the difference between the original contract amount and the fair market value as of the last business day of the year or as of the last date of the financial statements. Changes in the appreciation or depreciation between periods are reflected in the statement of operations. Interest on cash equivalents and deposits are recognized on an accrual basis. The Funds earn interest on funds held at the custodian or other financial institutions at prevailing market rates for such investments. |
| 4. |
Cash and cash equivalents are cash held at financial institutions in demand-deposit accounts or highly liquid investments with original maturity dates of three months or less at inception. The Funds report cash equivalents in the statements of assets and liabilities at market value, or at carrying amounts that approximate fair value, because of their highly liquid nature and short-term maturities. The Funds have a substantial portion of assets on deposit with banks. Assets deposited with financial institutions may, at times, exceed federally insured limits. |
| 5. |
The use of fair value to measure financial instruments, with related unrealized gains or losses recognized in earnings in each period is fundamental to the Trust’s financial statements. In accordance with GAAP, fair value is defined as the price that would be received to sell an asset or paid to transfer a liability (i.e., the “exit price”) in an orderly transaction between market participants at the measurement date. In determining fair value, the Trust uses various valuation approaches. In accordance with GAAP, a fair value hierarchy for inputs is used in measuring fair value that maximizes the use of observable inputs and minimizes the use of unobservable inputs by requiring that the most observable inputs be used when available. Observable inputs are those that market participants would use in pricing the asset or liability based on market data obtained from sources independent of the Trust. Unobservable inputs reflect the Trust’s assumptions about the inputs market participants would use in pricing the asset or liability developed based on the best information available in the circumstances. The fair value hierarchy is categorized into three levels: a) Level 1 - Valuations based on unadjusted quoted prices in active markets for identical assets or liabilities that the Trust has the ability to access. Valuation adjustments and block discounts are not applied to Level 1 securities and financial instruments. Since valuations are based on quoted prices that are readily and regularly available in an active market, valuation of these securities and financial instruments does not entail a significant degree of judgment, b) Level 2 - Valuations based on quoted prices in markets that are not active or for which all significant inputs are observable, either directly or indirectly, and c) Level 3 - Valuations based on inputs that are unobservable and significant to the overall fair value measurement. See the notes within the financial statements for further information. The Funds and the Trust record their derivative activities at fair value. Gains and losses from derivative contracts are included in the statement of operations. Derivative contracts include futures contracts related to commodity or cryptocurrency prices. Futures, which are listed on a national securities exchange, such as the CBOT, ICE, or CME, or reported on another national market, are generally categorized in Level 1 of the fair value hierarchy. OTC derivatives contracts (such as forward and swap contracts) which may be valued using models, depending on whether significant inputs are observable or unobservable, are categorized in Levels 2 or 3 of the fair value hierarchy. |
| 6. |
The Funds recognize brokerage commissions on a full trade basis. |
| 7. |
Margin is the minimum amount of funds that must be deposited by a commodity or cryptocurrency interest trader with the trader’s broker to initiate and maintain an open position in futures contracts. A margin deposit acts to assure the trader’s performance of the futures contracts purchased or sold. Futures contracts are customarily bought and sold on initial margin that represents a small percentage of the aggregate purchase or sales price of the contract. Because of such low margin requirements, price fluctuations occurring in the futures markets may create profits and losses that, in relation to the amount invested, are greater than customary in other forms of investment or speculation. As discussed below, adverse price changes in the futures contract may result in margin requirements that greatly exceed the initial margin. In addition, the amount of margin required in connection with a particular futures contract may be modified from time to time by the exchange during the term of the contract. Brokerage firms, such as the Funds’ clearing brokers, carrying accounts for traders in commodity or cryptocurrency interest contracts generally require higher amounts of margin as a matter of policy to further protect themselves. Over the counter trading generally involves the extension of credit between counterparties, so the counterparties may agree to require the posting of collateral by one or both parties to address credit exposure.
When a trader purchases an option, there is no margin requirement; however, the option premium must be paid in full. When a trader sells an option, on the other hand, he or she is required to deposit margin in an amount determined by the margin requirements established for the underlying interest and, in addition, an amount substantially equal to the current premium for the option. The margin requirements imposed on the selling of options, although adjusted to reflect the probability that out of the money options will not be exercised, can in fact be higher than those imposed in dealing in the futures markets directly. Complicated margin requirements apply to spreads and conversions, which are complex trading strategies in which a trader acquires a mixture of options positions and positions in the underlying interest.
Ongoing or “maintenance” margin requirements are computed each day by a trader’s clearing broker. When the market value of a particular open futures contract changes to a point where the margin on deposit does not satisfy maintenance margin requirements, a margin call is made by the broker. If the margin call is not met within a reasonable time, the broker may close out the trader’s position. With respect to the Funds’ trading, the Funds (and not its shareholders personally) are subject to margin calls.
Finally, many major U.S. exchanges have passed certain cross margining arrangements involving procedures pursuant to which the futures and options positions held in an account would, in the case of some accounts, be aggregated, and margin requirements would be assessed on a portfolio basis, measuring the total risk of the combined positions. |
| 8. |
Due from/to broker for investments in financial instruments are securities transactions pending settlement. The Trust and TAGS are subject to credit risk to the extent any broker with whom it conducts business is unable to fulfill contractual obligations on its behalf. The management of the Trust and the Funds monitors the financial condition of such brokers and does not anticipate any losses from these counterparties. The principal broker through which the Trust and TAGS has the ability to clear securities transactions for TAGS is U.S. Bank N.A.
|
| 9. |
The Sponsor is responsible for investing the assets of the Funds in accordance with the objectives and policies of each Fund.
CORN, SOYB, CANE, WEAT, and TAGS pays for all brokerage fees, taxes, and other expenses, including licensing fees for the use of intellectual property, registration or other fees paid to the SEC, FINRA, formally the National Association of Securities Dealers, or any other regulatory agency in connection with the offer and sale of subsequent Shares after its initial registration and all legal, accounting, printing and other expenses associated therewith. The Fund also pays its portion of the fees and expenses for services directly attributable to the Fund such as accounting, financial reporting, regulatory compliance, and trading activities, which the Sponsor elected not to outsource. Certain aggregate expenses common to all Teucrium Funds within the Trust are allocated by the Sponsor to the respective Funds based on activity drivers deemed most appropriate by the Sponsor for such expenses, including but not limited to relative assets under management and creation order activity. These aggregate common expenses include, but are not limited to, legal, auditing, accounting and financial reporting, tax-preparation, regulatory compliance, trading activities, and insurance costs, as well as fees paid to the Distributor. A portion of these aggregate common expenses are related to the Sponsor or related parties of principals of the Sponsor; these are necessary services to the Teucrium Funds, which are primarily the cost of performing certain accounting and financial reporting, regulatory compliance, and trading activities that are directly attributable to the Fund and are included, primarily, in distribution and marketing fees. In addition, the Agricultural Funds, except for TAGS which has no such fee, are contractually obligated to pay a monthly management fee to the Sponsor, based on average daily net assets, at a rate equal to 1.00% per annum.
DEFI is contractually obligated to pay a monthly management fee to the Sponsor, based on average daily net assets, at a rate equal to 0.94% per annum. From the Management Fee, the Sponsor pays all of the routine operational, administrative and other ordinary expenses of each Fund, generally as determined by the Sponsor, including but not limited to, fees and expenses of the Administrator, Custodian, Distributor, Transfer Agent, licensors, accounting and audit fees and expenses, tax preparation expenses, legal fees, ongoing SEC registration fees, individual Schedule K-1 preparation and mailing fees, and report preparation and mailing expenses. These fees and expenses are not included in the breakeven table because they are paid for by the Sponsor through the proceeds from the Management Fee. The Fund pays all of its non-recurring and unusual fees and expenses, if any, as determined by the Sponsor. Non-recurring and unusual fees and expenses are unexpected or unusual in nature, such as legal claims and liabilities and litigation costs or indemnification or other unanticipated expenses. Extraordinary fees and expenses also include material expenses which are not currently anticipated obligations of the Fund. Routine operational, administrative and other ordinary expenses are not deemed extraordinary expenses. |
| 10. |
The investment objective of TAGS is to have the daily changes in percentage terms of the Net Asset Value (“NAV”) of its common units (“Shares”) reflect the daily changes in percentage terms of a weighted average (the “Underlying Fund Average”) of the NAVs per share of four other commodity pools that are series of the Trust and are sponsored by the Sponsor: the Teucrium Corn Fund, the Teucrium Wheat Fund, the Teucrium Soybean Fund and the Teucrium Sugar Fund (collectively, the “Underlying Funds”). The Underlying Fund Average will have a weighting of 25% to each Underlying Fund, and the Fund’s assets will be rebalanced, generally on a daily basis, to maintain the approximate 25% allocation to each Underlying Fund. As such, TAGS will buy, sell, and hold as part of its normal operations shares of the four Underlying Funds. The Trust excludes the shares of the other series of the Trust owned by the Teucrium Agricultural Fund from its statements of assets and liabilities. The Trust excludes the net change in unrealized appreciation or depreciation on securities owned by the Teucrium Agricultural Fund from its statements of operations. Upon the sale of the Underlying Funds by the Teucrium Agricultural Fund, the Trust includes any realized gain or loss in its statements of operations. |
| 11. |
For U.S. federal income tax purposes, the Funds will be treated as partnerships. Therefore, the Funds do not record a provision for income taxes because the partners report their share of a Fund’s income or loss on their income tax returns. The financial statements reflect the Funds’ transactions without adjustment, if any, required for income tax purposes. |
| 12. |
For commercial paper, the Agricultural Commodity Funds use the effective interest method for calculating the actual interest rate in a period based on the amount of a financial instrument’s book value at the beginning of the accounting period. Accretion on these investments is recognized using the effective interest method in U.S. dollars and recognized in cash equivalents. All discounts on purchase prices of debt securities are accreted over the life of the respective security. |
Credit Risk
When any of the Funds enter into Commodity or Cryptocurrency Interests, it will be exposed to the credit risk that the counterparty will not be able to meet its obligations. For purposes of credit risk, the counterparty for the Futures Contracts traded on the CBOT, ICE, and CME is the clearinghouse associated with those exchanges. In general, clearinghouses are backed by their members who may be required to share in the financial burden resulting from the nonperformance of one of their members, which should significantly reduce credit risk. Some foreign exchanges are not backed by their clearinghouse members but may be backed by a consortium of banks or other financial institutions. Unlike in the case of exchange traded futures contracts, the counterparty to an over-the-counter Commodity Interest contract is generally a single bank or other financial institution. As a result, there will be greater counterparty credit risk in over-the-counter transactions. There can be no assurance that any counterparty, clearinghouse, or their financial backers will satisfy their obligations to any of the Funds.
The Commodity Funds may engage in off exchange transactions broadly called an “exchange for risk” transaction, also referred to as an “exchange for swap.” For purposes of the Dodd-Frank Act and related CFTC rules, an “exchange for risk” transaction is treated as a “swap.” An “exchange for risk” transaction, sometimes referred to as an “exchange for swap” or “exchange of futures for risk,” is a privately negotiated and simultaneous exchange of a futures contract position for a swap or other over the counter instrument on the corresponding commodity. An exchange for risk transaction can be used by the Commodity Funds as a technique to avoid taking physical delivery of a commodity futures contract, corn for example, in that a counterparty will take the Fund’s position in a Corn Futures Contract into its own account in exchange for a swap that does not by its terms call for physical delivery. The Funds will become subject to the credit risk of a counterparty when it acquires an over-the-counter position in an exchange for risk transaction. The Fund may use an “exchange for risk” transaction in connection with the creation and redemption of shares. These transactions must be carried out only in accordance with the rules of the applicable exchange where the futures contracts trade.
The Sponsor will attempt to manage the credit risk of each Fund by following certain trading limitations and policies. In particular, each Fund intends to post margin and collateral and/or hold liquid assets that will be equal to approximately the face amount of the Interests it holds. The Sponsor will implement procedures that will include, but will not be limited to, executing, and clearing trades and entering into over-the-counter transactions only with parties it deems creditworthy and/or requiring the posting of collateral by such parties for the benefit of each Fund to limit its credit exposure.
The CEA requires all FCMs, such as the Teucrium Funds’ clearing brokers, to meet and maintain specified fitness and financial requirements, to segregate customer funds from proprietary funds and account separately for all customers’ funds and positions, and to maintain specified books and records open to inspection by the staff of the CFTC. The CFTC has similar authority over introducing brokers, or persons who solicit or accept orders for commodity interest trades but who do not accept margin deposits for the execution of trades. The CEA authorizes the CFTC to regulate trading by FCMs and by their officers and directors, permits the CFTC to require action by exchanges in the event of market emergencies, and establishes an administrative procedure under which customers may institute complaints for damages arising from alleged violations of the CEA. The CEA also gives the states powers to enforce its provisions and the regulations of the CFTC.
On November 14, 2013, the CFTC published final regulations that require enhanced customer protections, risk management programs, internal monitoring and controls, capital and liquidity standards, customer disclosures and auditing and examination programs for FCMs. The rules are intended to afford greater assurances to market participants that customer segregated funds and secured amounts are protected, customers are provided with appropriate notice of the risks of futures trading and of the FCMs with which they may choose to do business, FCMs are monitoring and managing risks in a robust manner, the capital and liquidity of FCMs are strengthened to safeguard the continued operations and the auditing and examination programs of the CFTC and the SROs are monitoring the activities of FCMs in a thorough manner.
Marex , StoneX and Phillip Capital serve as the Fund’s clearing brokers to execute futures contracts and provide other brokerage-related services.
The Commodity Funds, other than TAGS, will generally retain cash positions of approximately 95% of total net assets and DEFI will retain approximately 70%; this balance represents the total net assets less the initial margin requirements held by the FCM. These cash assets are either: 1) deposited by the Sponsor in demand deposit accounts of financial institutions which are deemed by the Sponsor to be of investment level quality, 2) held in a money-market fund which is deemed to be a cash equivalent under the most recent SEC definition, or 3) held in a cash equivalent with a maturity of 90 days or less that is deemed by the Sponsor to be of investment level quality.
Liquidity and Capital Resources
The Funds do not anticipate making use of borrowings or other lines of credit to meet their obligations. The Funds meet their liquidity needs in the normal course of business from the proceeds of the sale of their investments from the cash and cash equivalents that they intend to hold, and/or from the fee waivers provided by the Sponsor. The Funds’ liquidity needs include redeeming their shares, providing margin deposits for existing Futures Contracts or the purchase of additional Futures Contracts, posting collateral for over-the-counter Commodity Interests, and paying expenses.
The Funds generate cash primarily from (i) the sale of Creation Baskets and (ii) interest earned on cash and cash equivalents. Generally, all of the net assets of the Funds are allocated to trading in Commodity or Cryptocurrency Interests. Most of the assets of the Funds are held in cash and/or cash equivalents. The percentage that such assets bear to the total net assets will vary from period to period as the market values of the Commodity or Cryptocurrency Interests change. Interest earned on interest-bearing assets of a Fund are paid to that Fund. During times of extreme market volatility and economic uncertainty, the Funds may experience a significant change in interest rates, and as such the Funds may experience a change in the breakeven point.
The investments of a Fund in Commodity or Cryptocurrency Interests are subject to periods of illiquidity because of market conditions, regulatory considerations, and other reasons. For example, U.S. futures exchanges limit the fluctuations in the prices of certain Futures Contracts during a single day by regulations referred to as “daily limits.” During a single day, no trades may be executed at prices beyond the daily limit. Once the price of such a Futures Contract has increased or decreased by an amount equal to the daily limit, positions in the contracts can neither be taken nor liquidated unless the traders are willing to effect trades at or within the limit. Such market conditions could prevent the Fund from promptly liquidating a position in Futures Contracts.
War and other geopolitical events in eastern Europe, including but not limited to Russia and Ukraine, may cause volatility in commodity prices including energy and grain prices, due to the region’s importance to these markets, potential impacts to global transportation and shipping, and other supply chain disruptions. These events are unpredictable and may lead to extended periods of price volatility.
More generally, a climate of uncertainty and panic, including the contagion of the COVID-19 virus and other infectious viruses or diseases, may adversely affect global, regional, and local economies and reduce the availability of potential investment opportunities, and increases the difficulty of performing due diligence and modeling market conditions, potentially reducing the accuracy of financial projections. Under these circumstances, the Funds may have difficulty achieving their investment objectives which may adversely impact performance. Further, such events can be highly disruptive to economies and markets, significantly disrupt the operations of individual companies (including, but not limited to, the Funds’ Sponsor and third-party service providers), sectors, industries, markets, securities and commodity exchanges, currencies, interest and inflation rates, credit ratings, investor sentiment, and other factors affecting the value of the Funds’ investments. These factors could cause substantial market volatility, exchange trading suspensions and closures that could impact the ability of the Funds to complete redemptions and otherwise affect Fund performance and Fund trading in the secondary market. A widespread crisis may also affect the global economy in ways that cannot necessarily be foreseen at the current time. How long such events will last and whether they will continue or recur cannot be predicted. Impacts from these events could have significant impact on a Fund’s performance, resulting in losses to your investment. The global economic shocks being experienced as of the date hereof may cause the underlying assumptions and expectations of the Funds to become outdated quickly or inaccurate, resulting in significant losses.
Market Risk
Trading in Commodity or Cryptocurrency Interests such as Futures Contracts will involve the Funds entering into contractual commitments to purchase or sell specific amounts of commodities or cryptocurrencies at a specified date in the future. The gross or face amount of the contracts is expected to significantly exceed the future cash requirements of each Fund as each Fund intends to close out any open positions prior to the contractual expiration date. As a result, each Fund’s market risk is the risk of loss arising from the decline in value of the contracts, not from the need to make delivery under the contracts. The Funds consider the “fair value” of derivative instruments to be the unrealized gain or loss on the contracts. The market risk associated with the commitment by the Funds to purchase a specific commodity or cryptocurrency will be limited to the aggregate face amount of the contacts held.
The exposure of the Funds to market risk will depend on a number of factors including the markets for the specific commodity or cryptocurrency, the volatility of interest rates and foreign exchange rates, the liquidity of the Commodity or Cryptocurrency Specific Interests markets and the relationships among the contracts held by each Fund.
Regulatory Considerations
The regulation of futures markets, futures contracts, and futures exchanges has historically been comprehensive. The CFTC and the exchanges are authorized to take extraordinary actions in the event of a market emergency including, for example, the retroactive implementation of speculative position limits, increased margin requirements, the establishment of daily price limits and the suspension of trading on an exchange or trading facility.
Pursuant to authority in the CEA, the NFA has been formed and registered with the CFTC as a registered futures association. At the present time, the NFA is the only SRO for commodity interest professionals, other than futures exchanges. The CFTC has delegated to the NFA responsibility for the registration of CPOs and FCMs and their respective associated persons. The Sponsor and the Fund’s clearing broker are members of the NFA. As such, they will be subject to NFA standards relating to fair trade practices, financial condition, and consumer protection. The NFA also arbitrates disputes between members and their customers and conducts registration and fitness screening of applicants for membership and audits of its existing members. Neither the Trust nor the Teucrium Funds are required to become a member of the NFA. The regulation of commodity interest transactions in the United States is a rapidly changing area of law and is subject to ongoing modification by governmental and judicial action. Considerable regulatory attention has been focused on non-traditional investment pools that are publicly distributed in the United States. There is a possibility of future regulatory changes within the United States altering, perhaps to a material extent, the nature of an investment in the Fund, or the ability of a Fund to continue to implement its investment strategy. In addition, various national governments outside of the United States have expressed concern regarding the disruptive effects of speculative trading in the commodities markets and the need to regulate the derivatives markets in general. The effect of any future regulatory change on the Teucrium Funds is impossible to predict but could be substantial and adverse.
The CFTC possesses exclusive jurisdiction to regulate the activities of commodity pool operators and commodity trading advisors with respect to “commodity interests,” such as futures, swaps, and options, and has adopted regulations with respect to the activities of those persons and/or entities. Under the Commodity Exchange Act (“CEA”), a registered commodity pool operator, such as the Sponsor, is required to make annual filings with the CFTC and the NFA describing its organization, capital structure, management and controlling persons. In addition, the CEA authorizes the CFTC to require and review books and records of, and documents prepared by, registered commodity pool operators. Pursuant to this authority, the CFTC requires commodity pool operators to keep accurate, current, and orderly records for each pool that they operate. The CFTC may suspend the registration of a commodity pool operator (1) if the CFTC finds that the operator’s trading practices tend to disrupt orderly market conditions, (2) if any controlling person of the operator is subject to an order of the CFTC denying such person trading privileges on any exchange, and (3) in certain other circumstances. Suspension, restriction, or termination of the Sponsor’s registration as a commodity pool operator would prevent it, until that registration was to be reinstated, from managing the Fund, and might result in the termination of the Fund if a successor sponsor is not elected pursuant to the Trust Agreement. Neither the Trust nor the Fund is required to be registered with the CFTC in any capacity.
The Fund’s investors are afforded prescribed rights for reparations under the CEA. Investors may also be able to maintain a private right of action for violations of the CEA. The CFTC has adopted rules implementing the reparation provisions of the CEA, which provide that any person may file a complaint for a reparations award with the CFTC for violation of the CEA against a floor broker or an FCM, introducing broker, commodity trading advisor, CPO, and their respective associated persons.
The regulations of the CFTC and the NFA prohibit any representation by a person registered with the CFTC or by any member of the NFA, that registration with the CFTC, or membership in the NFA, in any respect indicates that the CFTC or the NFA has approved or endorsed that person or that person’s trading program or objectives. The registrations and memberships of the parties described in this summary must not be considered as constituting any such approval or endorsement. Likewise, no futures exchange has given or will give any similar approval or endorsement.
Trading venues in the United States are subject to varying degrees of regulation under the CEA depending on whether such exchange is a designated contract market (i.e., a futures exchange) or a swap execution facility. Clearing organizations are also subject to the CEA and the rules and regulations adopted thereunder as administered by the CFTC. The CFTC’s function is to implement the CEA’s objectives of preventing price manipulation and excessive speculation and promoting orderly and efficient commodity interest markets. In addition, the various exchanges and clearing organizations themselves as SROs exercise regulatory and supervisory authority over their member firms.
The Dodd-Frank Wall Street Reform and Consumer Protection Act (the “Dodd-Frank Act”) was enacted in response to the economic crisis of 2008 and 2009 and it significantly altered the regulatory regime to which the securities and commodities markets are subject. To date, the CFTC has issued proposed or final versions of almost all of the rules it is required to promulgate under the Dodd-Frank Act, and it continues to issue proposed versions of additional rules that it has authority to promulgate. Provisions of the new law include the requirement that position limits be established on a wide range of commodity interests, including agricultural, energy, and metal-based commodity futures contracts, options on such futures contracts and uncleared swaps that are economically equivalent to such futures contracts and options (“Reference Contracts”); new registration and recordkeeping requirements for swap market participants; capital and margin requirements for “swap dealers” and “major swap participants,” as determined by the new law and applicable regulations; reporting of all swap transactions to swap data repositories; and the mandatory use of clearinghouse mechanisms for sufficiently standardized swap transactions that were historically entered into in the over the counter market, but are now designated as subject to the clearing requirement; and margin requirements for over the counter swaps that are not subject to the clearing requirements.
In addition, considerable regulatory attention has recently been focused on non-traditional publicly distributed investment pools such as the Fund. Furthermore, various national governments have expressed concern regarding the disruptive effects of speculative trading in certain commodity markets and the need to regulate the derivatives markets in general. The effect of any future regulatory change on the Teucrium Funds is impossible to predict but could be substantial and adverse.
The Dodd-Frank Act was intended to reduce systemic risks that may have contributed to the 2008/2009 financial crisis. Since the first draft of what became the Dodd-Frank Act, supporters and opponents have debated the scope of the legislation. As the Administrations of the U.S. change, the interpretation and implementation will change along with them. Nevertheless, regulatory reform of any kind may have a significant impact on U.S. regulated entities.
Position Limits, Aggregation Limits, Accountability Levels, Price Fluctuation Limits
The CFTC and US futures exchanges impose limits on the maximum net long or net short speculative positions that any person may hold or control in any particular futures or options contracts traded on US futures exchanges. For example, the CFTC currently imposes speculative position limits on a number of commodities (e.g., corn, oats, wheat, soybeans, and cotton) and US futures exchanges currently impose speculative position limits on many other commodities. A Fund could be required to liquidate positions it holds in order to comply with position limits or may not be able to fully implement trading instructions generated by its trading models, in order to comply with position limits. Any such liquidation or limited implementation could result in substantial costs to a Fund. Limits are generally applied on an aggregate basis to positions held in accounts that are subject to 10% or greater common ownership or control. In December 2016, the CFTC adopted rule amendments that provide exemptions from the general requirement to aggregate all positions that are held pursuant to 10% or greater common ownership or control.
The Dodd-Frank Act significantly expanded the CFTC’s authority to impose position limits with respect to futures contracts and options on futures contracts, swaps that are economically equivalent to futures or options on futures, and swaps that are traded on a regulated exchange and certain swaps that perform a significant price discovery function.
In October 2020, the CFTC adopted new speculative position limits with respect to futures and options on futures on many physical commodities, including energy, metals and agricultural commodities (the “core referenced futures contracts“), and on economically equivalent swaps. The CFTC’s new position limits rules include an exemption from limits for bona fide hedging transactions or positions. A bona fide hedging transaction or position may exceed the applicable federal position limits if the transaction or position: (1) represents a substitute for transactions or positions made or to be made at a later time in a physical marketing channel; (2) is economically appropriate to the reduction of price risks in the conduct and management of a commercial enterprise; and (3) arises from the potential change in value of (A) assets which a person owns, produces, manufactures, processes or merchandises, or anticipates owning, producing, manufacturing, processing or merchandising; (B) liabilities which a person owes or anticipates incurring; or (C) services that a person provides or purchases, or anticipates providing or purchasing. The CFTC’s new position rules set forth a list of enumerated bona fide hedges for which a market participant is not required to request prior approval from the CFTC in order to hold a bona fide hedge position above the federal position limit. However, a market participant holding an enumerated bona fide hedge position still would need to request an exemption from the relevant exchange for exchange-set limits. For non-enumerated bona fide hedge positions, a market participant may request CFTC approval which must be granted prior to exceeding the applicable federal position limit, except where there is a demonstrated sudden or unforeseen increase in bona fide hedging needs (in which case the application must be submitted within five business days after the market participant exceeds the applicable limit). The compliance dates for the CFTC’s new federal speculative position limits are January 1, 2022 for the core referenced futures contracts and January 1, 2023 for economically equivalent swaps.
Position Aggregation. In general, a market participant is required by CFTC or exchange rules, as applicable, to aggregate all positions in accounts as to which the market participant has 10% or greater ownership or control. CFTC and exchange rules, as applicable, provide exemptions from this requirement. For example, a market participant is not required to aggregate positions in multiple accounts that it owns or controls if that market participant is able to satisfy the requirements of an exemption from aggregation of those accounts, including, where available, the independent account controller exemption. Failure to comply with the independent account controller exemption or another exemption from the aggregation requirement could obligate the Sponsor to aggregate positions in multiple accounts under its control, which could include the Fund and other commodity pools or accounts under the Sponsor’s control. In such a scenario, a Fund may not be able to obtain exposure to one or more contracts necessary to pursue its investment objective, or it may be required to liquidate existing contract positions in order to comply with a limit. Such an outcome could adversely affect a Fund’s ability to pursue its investment objective or achieve favorable performance. The CFTC amended its position aggregation rules in December 2016. The CFTC staff subsequently issued time-limited no-action relief from compliance with certain requirements under the amended aggregation rules, including the general requirement to aggregate positions in the same commodity futures contracts traded pursuant to substantially identical trading strategies. This no-action relief expires on August 12, 2025.
Accountability Levels. Exchanges may establish accountability levels applicable to a futures contract instead of position limits, provided that the futures contract is not subject to federal position limits. An exchange may order a person who holds or controls a position in excess of a position accountability level not to further increase its position, to comply with any prospective limit that exceeds the size of the position owned or controlled, or to reduce any open position that exceeds the position accountability level if the exchange determines that such action is necessary to maintain an orderly market. Position accountability levels could adversely affect a Fund’s ability to establish and maintain positions in commodity futures contracts to which such levels apply if a Fund were to trade in such contracts. Such an outcome could adversely affect a Fund’s ability to pursue its investment objective.
Daily Limits. U.S. futures exchanges and some foreign exchanges have regulations that limit the amount of fluctuation in futures contract prices that may occur during a single business day. These limits are generally referred to as “daily price fluctuation limits” or “daily limits,” and the maximum or minimum price of a contract on any given day as a result of these limits is referred to as a “limit price.” Once a limit price has been reached in a particular contract, it is usually the case that no trades may be made at a different price than specified in the limit. The duration of limit prices generally varies. Limit prices may have the effect of precluding a Fund from trading in a particular contract or requiring the Fund to liquidate contracts at disadvantageous times or prices. Either of those outcomes could adversely affect a Fund’s ability to pursue its investment objective.
Potential Effects of Positions Limits, Aggregation Limits, Accountability Levels, and Price Fluctuation Limits. The Funds are currently subject to position limits and may be subject to new and more restrictive position limits in the future. If a Fund reached a position limit or accountability level or became subject to a daily limit, its ability to issue new creation units or reinvest income in additional commodity futures contracts may be limited to the extent these restrictions limit its ability to establish new futures positions, add to existing positions, or otherwise transact in futures. Limiting the size of a Fund, or restricting a Fund’s futures trading, under these requirements could adversely affect a Fund’s ability to pursue its investment objective.
Off Balance Sheet Financing
As of September 30, 2023, neither the Trust nor any of the Funds has any loan guarantees, credit support or other off-balance sheet arrangements of any kind other than agreements entered into in the normal course of business, which may include indemnification provisions relating to certain risks service providers undertake in performing services which are in the best interests of the Funds. While the exposure of each Fund under these indemnification provisions cannot be estimated, they are not expected to have a material impact on the financial positions of each Fund.
Redemption Basket Obligation
Other than as necessary to meet the investment objective of the Funds and pay the contractual obligations described below, the Funds will require liquidity to redeem Redemption Baskets. Each Fund intends to satisfy this obligation through the transfer of cash of the Fund (generated, if necessary, through the sale of short-term Treasury Securities or other cash equivalents) in an amount proportionate to the number of units being redeemed.
Contractual Obligations
The primary contractual obligations of each Fund will be with the Sponsor and certain other service providers. Except for TAGS, which has no management fee, the Sponsor, in return for its services, will be entitled to a management fee calculated as a fixed percentage of each Agricultural Fund’s NAV, currently 1.00% of its average net assets. DEFI is contractually obligated to pay a monthly management fee to the Sponsor, based on average daily net assets, at a rate equal to 0.94% per annum.
CORN, CANE, SOYB, WEAT and TAGS will also be responsible for all ongoing fees, costs and expenses of its operation, including (i) brokerage and other fees and commissions incurred in connection with the trading activities of the Fund; (ii) expenses incurred in connection with registering additional Shares of the Fund or offering Shares of the Fund; (iii) the routine expenses associated with the preparation and, if required, the printing and mailing of monthly, quarterly, annual and other reports required by applicable U.S. federal and state regulatory authorities, Trust meetings and preparing, printing and mailing proxy statements to Shareholders; (iv) the payment of any distributions related to redemption of Shares; (v) payment for routine services of the Trustee, legal counsel and independent accountants; (vi) payment for routine accounting, bookkeeping, compliance, distribution and solicitation-related services, custodial and transfer agency services, whether performed by an outside service provider or by affiliates of the Sponsor; (vii) postage and insurance; (viii) costs and expenses associated with client relations and services; (ix) costs of preparation of all federal, state, local and foreign tax returns and any taxes payable on the income, assets or operations of the Fund; and (xi) extraordinary expenses (including, but not limited to, legal claims and liabilities and litigation costs and any indemnification related thereto).
The Management Fee for DEFI is paid in consideration of the Sponsor’s services related to the management of the Fund’s business and affairs, including the provision of commodity futures trading advisory services. DEFI pays all of its respective brokerage commissions, including applicable exchange fees, NFA fees and give-up fees, and other transaction related fees and expenses charged in connection with trading activities for the Fund’s investments in CFTC regulated investments. DEFI bears other transaction costs related to the FCM capital requirements on a monthly basis. The Sponsor pays all of the routine operational, administrative and other ordinary expenses of the Fund, generally as determined by the Sponsor, including but not limited to, fees and expenses of the Administrator, Custodian, Distributor, Transfer Agent, licensors, accounting and audit fees and expenses, tax preparation expenses, legal fees, ongoing SEC registration fees, individual Schedule K-1 preparation and mailing fees, and report preparation and mailing expenses. DEFI pays all of its non-recurring and unusual fees and expenses, if any, as determined by the Sponsor. Non-recurring and unusual fees and expenses are unexpected or unusual in nature, such as legal claims and liabilities and litigation costs or indemnification or other unanticipated expenses. Extraordinary fees and expenses also include material expenses which are not currently anticipated obligations of the Fund. Routine operational, administrative and other ordinary expenses are not deemed extraordinary expenses.
Toroso Investments, LLC (“Toroso”), Tidal ETF Services LLC (“Tidal”) and Victory Capital Management Inc. (“Victory Capital”), Hashdex Asset Management Ltd. (“Hashdex”) and the Sponsor (the “Parties”) have entered into an agreement (the “Support Agreement”) that sets forth certain terms and conditions applicable to the launch, marketing, promotion, development, and ongoing operation of DEFI, as well the respective rights in profits and obligations for expenses.
The primary responsibilities and rights of each Party with respect to the Fund are described below:
| ● |
The Support Agreement provides that Hashdex will provide to the other Parties research and analysis regarding bitcoin and bitcoin markets for use in the operation and marketing of the Fund. Subject to mutual agreement of the Parties, Victory Capital will provide sub-advisory and sales support services for the Fund. |
| ● |
The Sponsor, Toroso, Hashdex and Victory Capital were responsible for paying for all listing, legal, and regulatory costs and expenses incurred in connection with the regulatory process related to the launch of the Fund, including drafting the Fund’s registration statement, exchange listing fees, and other regulatory or service provider fees, as determined in the Support Agreement (“Start-Up Costs”). The Fund will not be responsible for the Start-Up Costs. Each Party is responsible for its own internal expenses. |
| ● |
The Sponsor will receive a sponsor fee, administrative fee and trading fee, which are paid out of the proceeds from the Management Fee of the Fund (if sufficient) and/or from Toroso and Hashdex/Victory Capital (if insufficient). After an additional deduction of operational costs from the Management Fee, the resulting profits or losses will be shared equally among Toroso, on the one hand, and Hashdex and Victory Capital, on the other. |
While the Sponsor paid the initial registration fees to the SEC, FINRA and any other regulatory agency in connection with the offer and sale of the Shares offered through each Agricultural Fund prospectus, the legal, printing, accounting and other expenses associated with such registrations, and the initial fee of approximately $5,000 for listing the Shares on the NYSE Arca, each Fund will be responsible for any registration fees and related expenses incurred in connection with any future offer and sale of Shares of the Fund.
Any general expenses of the Trust will be allocated among the Funds and any other series of the Trust as determined by the Sponsor or in the Support Agreement described in the DEFI prospectus, in its sole and absolute discretion. The Trust is also responsible for extraordinary expenses, including, but not limited to, legal claims and liabilities and litigation costs and any indemnification related thereto. The Trust and/or the Sponsor may be required to indemnify the Trustee, Distributor or Administrator under certain circumstances.
The parties cannot anticipate the amount of payments that will be required under these arrangements for future periods as the NAV and trading levels to meet investment objectives for each Fund will not be known until a future date. These agreements are effective for a specific term agreed upon by the parties with an option to renew, or, in some cases, are in effect for the duration of each Fund’s existence. The parties may terminate these agreements earlier for certain reasons listed in the agreements.
Benchmark Performance
Investing in Commodity or Cryptocurrency Interests subjects the Funds to the risks of the underlying commodity or cryptocurrency market, and this could result in substantial fluctuations in the price of each Fund’s Shares. Unlike mutual funds, the Funds currently are not expected to distribute dividends to Shareholders. Although this could change if interest rates continue to rise, and the assets of the Funds increase. Investors may choose to use the Funds as a means of investing indirectly in the underlying commodity or cryptocurrency, and there are risks involved in such investments. Investors may choose to use the Funds as vehicles to hedge against the risk of loss, and there are risks involved in hedging activities.
During the period from January 1, 2023 through September 30, 2023 the average daily change in the NAV of each Fund was within plus/minus 10 percent of the average daily change in the Benchmark of each Fund, as stated in the applicable prospectus for each Fund.
Frequency Distribution of Premiums and Discounts: NAV versus the 4pm Bid/Ask Midpoint on the NYSE Arca.
| CORN |
Q4 2022 | Q1 2023 | Q2 2023 | Q3 2023 |
Total |
| Days at premium |
15 |
13 |
31 |
28 |
87 |
| Days at NAV |
4 |
4 |
3 |
6 |
17 |
| Days at discount |
44 |
45 |
28 |
29 |
146 |
The performance data above for the Teucrium Corn Fund represents past performance. Past performance is not a guarantee of future results. Investment return and value of the Fund’s Shares will fluctuate so that an investor’s Shares, when sold, may be worth more or less than their original cost. Performance may be lower or higher than performance data quoted.
| SOYB |
Q4 2022 | Q1 2023 | Q2 2023 | Q3 2023 | Total |
| Days at premium |
29 |
24 |
32 |
27 |
112 |
| Days at NAV |
9 |
2 |
6 |
5 |
22 |
| Days at discount |
25 |
36 |
24 |
31 |
116 |
The performance data above for the Teucrium Soybean Fund represents past performance. Past performance is not a guarantee of future results. Investment return and value of the Fund’s Shares will fluctuate so that an investor’s Shares, when sold, may be worth more or less than their original cost. Performance may be lower or higher than performance data quoted.
| CANE |
Q4 2022 | Q1 2023 | Q2 2023 | Q3 2023 | Total |
| Days at premium |
14 |
30 |
30 |
30 |
104 |
| Days at NAV |
8 |
10 |
7 |
10 |
35 |
| Days at discount |
41 |
22 |
25 |
23 |
111 |
The performance data above for the Teucrium Sugar Fund represents past performance. Past performance is not a guarantee of future results. Investment return and value of the Fund’s Shares will fluctuate so that an investor’s Shares, when sold, may be worth more or less than their original cost. Performance may be lower or higher than performance data quoted.
| WEAT |
Q4 2022 | Q1 2023 | Q2 2023 | Q3 2023 | Total |
| Days at premium |
12 |
17 |
27 |
23 |
79 |
| Days at NAV |
12 |
13 |
14 |
21 |
60 |
| Days at discount |
39 |
32 |
21 |
19 |
111 |
| TAGS |
Q4 2022 | Q1 2023 | Q2 2023 | Q3 2023 | Total |
| Days at premium |
14 |
15 |
13 |
14 |
56 |
| Days at NAV |
5 |
6 |
2 |
5 |
18 |
| Days at discount |
44 |
41 |
47 |
44 |
176 |
The performance data above for the Teucrium Agricultural Fund represents past performance. Past performance is not a guarantee of future results. Investment return and value of the Fund’s Shares will fluctuate so that an investor’s Shares, when sold, may be worth more or less than their original cost. Performance may be lower or higher than performance data quoted.
For the period from August 2, 2012 through April 10, 2018, TAGS had 50,002 shares outstanding; this represents the minimum number of shares and, thus, no shares could be redeemed until additional shares have been created. This has generated a situation, at times, in which the spread between the bid/ask midpoint at 4pm and the NAV falls outside of the “1 to 49” or “-1 to -49” range. The situation does not affect the actual NAV of the Fund.
| DEFI |
Q4 2022 | Q1 2023 | Q2 2023 | Q3 2023 | Total |
| Days at premium |
27 |
2 |
11 |
6 |
46 |
| Days at NAV |
5 |
32 |
32 |
37 |
106 |
| Days at discount |
31 |
28 |
19 |
20 |
98 |
The performance data above for the Hashdex Bitcoin Futures ETF represents past performance. Past performance is not a guarantee of future results. Investment return and value of the Fund’s Shares will fluctuate so that an investor’s Shares, when sold, may be worth more or less than their original cost. Performance may be lower or higher than performance data quoted.
Description
The above frequency distribution charts present information about the difference between the daily market price for Shares of each Fund and the Fund’s reported Net Asset Value per share. The amount that a Fund’s market price is above the reported NAV is called the premium. The amount that a Fund’s market price is below the reported NAV is called the discount. The market price is determined using the midpoint between the highest bid and the lowest offer on the listing exchange, as of the time that a Fund’s NAV is calculated (usually 4:00 p.m., (ET)). Each value in the tables represents the number of trading days in which a Fund traded within the premium/discount range indicated. The premium or discount is expressed in basis points.
*A unit that is equal to 1/100th of 1% and is used to denote the change in a financial instrument.
NEITHER THE PAST PERFORMANCE OF A FUND NOR THE PRIOR INDEX LEVELS AND CHANGES, POSITIVE OR NEGATIVE, SHOULD BE TAKEN AS AN INDICATION OF THE FUND’S FUTURE PERFORMANCE.
Item 3. Quantitative and Qualitative Disclosures About Market Risk
Market Risk
The discussion and analysis which follows may contain trend analysis and other forward-looking statements within the meaning of Section 21E of the Securities Exchange Act of 1934 which reflect our current views with respect to future events and financial results. Words such as “anticipate,” “expect,” “intend,” “plan,” “believe,” “seek,” “outlook” and “estimate,” as well as similar words and phrases, signify forward-looking statements. The Trust’s forward-looking statements are not guarantees of future results and conditions, and important factors, risks and uncertainties may cause our actual results to differ materially from those expressed in our forward-looking statements.
You should not place undue reliance on any forward-looking statements. Except as expressly required by the Federal securities laws, the Sponsor undertakes no obligation to publicly update or revise any forward-looking statements or the risks, uncertainties or other factors described in this Report, as a result of new information, future events or changed circumstances or for any other reason after the date of this Report.
Trading in Commodity and Cryptocurrency Interests such as Futures Contracts will involve the Funds entering into contractual commitments to purchase or sell specific amounts of commodities or cryptocurrencies at a specified date in the future. The gross or face amount of the contracts is expected to significantly exceed the future cash requirements of each Fund as each Fund intends to close out any open positions prior to the contractual expiration date. As a result, each Fund’s market risk is the risk of loss arising from the decline in value of the contracts, not from the need to make delivery under the contracts. The Funds consider the “fair value” of derivative instruments to be the unrealized gain or loss on the contracts. The market risk associated with the commitment by the Funds to purchase a specific commodity or cryptocurrency will be limited to the aggregate face amount of the contacts held.
The exposure of the Funds to market risk will depend primarily on the market price of the specific commodities or cryptocurrency held by the Fund. The market price of the commodities or cryptocurrency depends in part on the volatility of interest rates and foreign exchange rates and the liquidity of the commodity or cryptocurrency specific markets. TAGS is subject to the risks of the commodity specific futures contracts of the Underlying Funds as the fair value of its holdings is based on the NAV of each of the Underlying Funds, each of which is directly impacted by the factors discussed above.
The tables below present a quantitative analysis of hypothetical impact of price decreases and increases in each of the commodity or cryptocurrency futures contracts held by each of the Funds, or the Underlying Funds in the case of TAGS, on the actual holdings and NAV per share as of September 30, 2023. For purposes of this analysis, all futures contracts held by the Funds and the Underlying Funds are assumed to change by the same percentage. In addition, the cash held by the Funds and any management fees paid to the Sponsor are assumed to remain constant and not impact the NAV per share. There may be very slight and immaterial differences, due to rounding, in the tables presented below.
CORN:
| September 30, 2023 as Reported |
10% Decrease |
15% Decrease |
20% Decrease |
10% Increase |
15% Increase |
20% Increase |
||||||||||||||||||||||||||||||
| Holdings as of September 30, 2023 |
Number of Contracts Held |
Closing Price |
Notional Amount |
Notional Amount |
Notional Amount |
Notional Amount |
Notional Amount |
Notional Amount |
Notional Amount |
|||||||||||||||||||||||||||
| CBOT Corn Futures MAR24 |
1,286 | $ | 4.9175 | $ | 31,619,525 | $ | 28,457,573 | $ | 26,876,596 | $ | 25,295,620 | $ | 34,781,478 | $ | 36,362,454 | $ | 37,943,430 | |||||||||||||||||||
| CBOT Corn Futures MAY24 |
1,084 | $ | 5.0050 | $ | 27,127,100 | $ | 24,414,390 | $ | 23,058,035 | $ | 21,701,680 | $ | 29,839,810 | $ | 31,196,165 | $ | 32,552,520 | |||||||||||||||||||
| CBOT Corn Futures DEC24 |
1,248 | $ | 5.0725 | $ | 31,652,400 | $ | 28,487,160 | $ | 26,904,540 | $ | 25,321,920 | $ | 34,817,640 | $ | 36,400,260 | $ | 37,982,880 | |||||||||||||||||||
| Total CBOT Corn Futures |
$ | 90,399,025 | $ | 81,359,123 | $ | 76,839,171 | $ | 72,319,220 | $ | 99,438,928 | $ | 103,958,879 | $ | 108,478,830 | ||||||||||||||||||||||
| Shares outstanding |
4,100,004 | 4,100,004 | 4,100,004 | 4,100,004 | 4,100,004 | 4,100,004 | 4,100,004 | |||||||||||||||||||||||||||||
| Net Asset Value per Share attributable directly to CBOT Corn Futures |
$ | 22.05 | $ | 19.84 | $ | 18.74 | $ | 17.64 | $ | 24.25 | $ | 25.36 | $ | 26.46 | ||||||||||||||||||||||
| Total Net Asset Value per Share as reported |
$ | 22.02 | ||||||||||||||||||||||||||||||||||
| Change in the Net Asset Value per Share |
$ | (2.20 | ) | $ | (3.31 | ) | $ | (4.41 | ) | $ | 2.20 | $ | 3.31 | $ | 4.41 | |||||||||||||||||||||
| Percent Change in the Net Asset Value per Share |
-10.01 | % | -15.02 | % | -20.03 | % | 10.01 | % | 15.02 | % | 20.03 | % | ||||||||||||||||||||||||
SOYB:
| September 30, 2023 as Reported |
10% Decrease |
15% Decrease |
20% Decrease |
10% Increase |
15% Increase |
20% Increase |
||||||||||||||||||||||||||||||
| Holdings as of September 30, 2023 |
Number of Contracts Held |
Closing Price |
Notional Amount |
Notional Amount |
Notional Amount |
Notional Amount |
Notional Amount |
Notional Amount |
Notional Amount |
|||||||||||||||||||||||||||
| CBOT Soybean Futures JAN24 |
167 | $ | 12.9450 | $ | 10,809,075 | $ | 9,728,168 | $ | 9,187,714 | $ | 8,647,260 | $ | 11,889,983 | $ | 12,430,436 | $ | 12,970,890 | |||||||||||||||||||
| CBOT Soybean Futures MAR24 |
142 | $ | 13.1025 | $ | 9,302,775 | $ | 8,372,498 | $ | 7,907,359 | $ | 7,442,220 | $ | 10,233,053 | $ | 10,698,191 | $ | 11,163,330 | |||||||||||||||||||
| CBOT Soybean Futures NOV24 |
176 | $ | 12.6000 | $ | 11,088,000 | $ | 9,979,200 | $ | 9,424,800 | $ | 8,870,400 | $ | 12,196,800 | $ | 12,751,200 | $ | 13,305,600 | |||||||||||||||||||
| Total CBOT Soybean Futures |
$ | 31,199,850 | $ | 28,079,866 | $ | 26,519,873 | $ | 24,959,880 | $ | 34,319,836 | $ | 35,879,827 | $ | 37,439,820 | ||||||||||||||||||||||
| Shares outstanding |
1,150,004 | 1,150,004 | 1,150,004 | 1,150,004 | 1,150,004 | 1,150,004 | 1,150,004 | |||||||||||||||||||||||||||||
| Net Asset Value per Share attributable directly to CBOT Soybean Futures |
$ | 27.13 | $ | 24.42 | $ | 23.06 | $ | 21.70 | $ | 29.84 | $ | 31.20 | $ | 32.56 | ||||||||||||||||||||||
| Total Net Asset Value per Share as reported |
$ | 27.07 | ||||||||||||||||||||||||||||||||||
| Change in the Net Asset Value per Share |
$ | (2.71 | ) | $ | (4.07 | ) | $ | (5.43 | ) | $ | 2.71 | $ | 4.07 | $ | 5.43 | |||||||||||||||||||||
| Percent Change in the Net Asset Value per Share |
-10.02 | % | -15.03 | % | -20.04 | % | 10.02 | % | 15.03 | % | 20.04 | % | ||||||||||||||||||||||||
CANE:
| September 30, 2023 as Reported |
10% Decrease |
15% Decrease |
20% Decrease |
10% Increase |
15% Increase |
20% Increase |
||||||||||||||||||||||||||||||
| Holdings as of September 30, 2023 |
Number of Contracts Held |
Closing Price |
Notional Amount |
Notional Amount |
Notional Amount |
Notional Amount |
Notional Amount |
Notional Amount |
Notional Amount |
|||||||||||||||||||||||||||
| ICE #11 Sugar Futures MAY24 |
301 | $ | 0.2526 | $ | 8,515,651 | $ | 7,664,086 | $ | 7,238,303 | $ | 6,812,521 | $ | 9,367,216 | $ | 9,792,999 | $ | 10,218,781 | |||||||||||||||||||
| ICE #11 Sugar Futures JUL24 |
268 | $ | 0.2430 | $ | 7,293,888 | $ | 6,564,499 | $ | 6,199,805 | $ | 5,835,110 | $ | 8,023,277 | $ | 8,387,971 | $ | 8,752,666 | |||||||||||||||||||
| ICE #11 Sugar Futures MAR25 |
321 | $ | 0.2379 | $ | 8,552,981 | $ | 7,697,683 | $ | 7,270,034 | $ | 6,842,385 | $ | 9,408,279 | $ | 9,835,928 | $ | 10,263,577 | |||||||||||||||||||
| Total ICE #11 Sugar Futures |
$ | 24,362,520 | $ | 21,926,268 | $ | 20,708,142 | $ | 19,490,016 | $ | 26,798,772 | $ | 28,016,898 | $ | 29,235,024 | ||||||||||||||||||||||
| Shares outstanding |
1,650,004 | 1,650,004 | 1,650,004 | 1,650,004 | 1,650,004 | 1,650,004 | 1,650,004 | |||||||||||||||||||||||||||||
| Net Asset Value per Share attributable directly to ICE #11 Sugar Futures |
$ | 14.77 | $ | 13.29 | $ | 12.55 | $ | 11.81 | $ | 16.24 | $ | 16.98 | $ | 17.72 | ||||||||||||||||||||||
| Total Net Asset Value per Share as reported |
$ | 14.78 | ||||||||||||||||||||||||||||||||||
| Change in the Net Asset Value per Share |
$ | (1.48 | ) | $ | (2.21 | ) | $ | (2.95 | ) | $ | 1.48 | $ | 2.21 | $ | 2.95 | |||||||||||||||||||||
| Percent Change in the Net Asset Value per Share |
-9.99 | % | -14.98 | % | -19.98 | % | 9.99 | % | 14.98 | % | 19.98 | % | ||||||||||||||||||||||||
WEAT:
| September 30, 2023 as Reported |
10% Decrease |
15% Decrease |
20% Decrease |
10% Increase |
15% Increase |
20% Increase |
||||||||||||||||||||||||||||||
| Holdings as of September 30, 2023 |
Number of Contracts Held |
Closing Price |
Notional Amount |
Notional Amount |
Notional Amount |
Notional Amount |
Notional Amount |
Notional Amount |
Notional Amount |
|||||||||||||||||||||||||||
| CBOT Wheat Futures MAR24 |
2,329 | $ | 5.7350 | $ | 66,784,075 | $ | 60,105,668 | $ | 56,766,464 | $ | 53,427,260 | $ | 73,462,483 | $ | 76,801,686 | $ | 80,140,890 | |||||||||||||||||||
| CBOT Wheat Futures MAY24 |
1,943 | $ | 5.9475 | $ | 57,779,963 | $ | 52,001,967 | $ | 49,112,969 | $ | 46,223,970 | $ | 63,557,959 | $ | 66,446,957 | $ | 69,335,956 | |||||||||||||||||||
| CBOT Wheat Futures DEC24 |
2,140 | $ | 6.4775 | $ | 69,309,250 | $ | 62,378,325 | $ | 58,912,863 | $ | 55,447,400 | $ | 76,240,175 | $ | 79,705,638 | $ | 83,171,100 | |||||||||||||||||||
| Total CBOT Wheat Futures |
$ | 193,873,288 | $ | 174,485,960 | $ | 164,792,296 | $ | 155,098,630 | $ | 213,260,617 | $ | 222,954,281 | $ | 232,647,946 | ||||||||||||||||||||||
| Shares outstanding |
34,825,004 | 34,825,004 | 34,825,004 | 34,825,004 | 34,825,004 | 34,825,004 | 34,825,004 | |||||||||||||||||||||||||||||
| Net Asset Value per Share attributable directly to CBOT Wheat Futures |
$ | 5.57 | $ | 5.01 | $ | 4.73 | $ | 4.45 | $ | 6.12 | $ | 6.40 | $ | 6.68 | ||||||||||||||||||||||
| Total Net Asset Value per Share as reported |
$ | 5.57 | ||||||||||||||||||||||||||||||||||
| Change in the Net Asset Value per Share |
$ | (0.56 | ) | $ | (0.84 | ) | $ | (1.11 | ) | $ | 0.56 | $ | 0.84 | $ | 1.11 | |||||||||||||||||||||
| Percent Change in the Net Asset Value per Share |
-9.99 | % | -14.99 | % | -19.99 | % | 9.99 | % | 14.99 | % | 19.99 | % | ||||||||||||||||||||||||
TAGS:
| September 30, 2023 as Reported |
10% Decrease |
15% Decrease |
20% Decrease |
10% Increase |
15% Increase |
20% Increase |
||||||||||||||||||||||||||||||
| Holdings as of September 30, 2023 |
Number of Shares Held |
Closing NAV |
Fair Value |
Fair Value |
Fair Value |
Fair Value |
Fair Value |
Fair Value |
Fair Value |
|||||||||||||||||||||||||||
| Teucrium Corn Fund |
257,033 | $ | 22.0606 | $ | 5,670,302 | $ | 5,103,272 | $ | 4,819,757 | $ | 4,536,242 | $ | 6,237,332 | $ | 6,520,847 | $ | 6,804,362 | |||||||||||||||||||
| Teucrium Soybean Fund |
203,005 | $ | 27.1098 | $ | 5,503,425 | $ | 4,953,083 | $ | 4,677,911 | $ | 4,402,740 | $ | 6,053,768 | $ | 6,328,939 | $ | 6,604,110 | |||||||||||||||||||
| Teucrium Wheat Fund |
955,742 | $ | 5.5693 | $ | 5,322,814 | $ | 4,790,533 | $ | 4,524,392 | $ | 4,258,251 | $ | 5,855,095 | $ | 6,121,236 | $ | 6,387,377 | |||||||||||||||||||
| Teucrium Sugar Fund |
371,271 | $ | 14.7584 | $ | 5,479,366 | $ | 4,931,429 | $ | 4,657,461 | $ | 4,383,493 | $ | 6,027,303 | $ | 6,301,271 | $ | 6,575,239 | |||||||||||||||||||
| Total value of shares of the Underlying Funds |
$ | 21,975,907 | $ | 19,778,317 | $ | 18,679,521 | $ | 17,580,726 | $ | 24,173,498 | $ | 25,272,293 | $ | 26,371,088 | ||||||||||||||||||||||
| Shares outstanding |
725,002 | 725,002 | 725,002 | 725,002 | 725,002 | 725,002 | 725,002 | |||||||||||||||||||||||||||||
| Net Asset Value per Share attributable directly to shares of the Underlying Funds |
$ | 30.31 | $ | 27.28 | $ | 25.76 | $ | 24.25 | $ | 33.34 | $ | 34.86 | $ | 36.37 | ||||||||||||||||||||||
| Total Net Asset Value per Share as reported |
$ | 30.33 | ||||||||||||||||||||||||||||||||||
| Change in the Net Asset Value per Share |
$ | (3.03 | ) | $ | (4.55 | ) | $ | (6.06 | ) | $ | 3.03 | $ | 4.55 | $ | 6.06 | |||||||||||||||||||||
| Percent Change in the Net Asset Value per Share |
-9.99 | % | -14.99 | % | -19.99 | % | 9.99 | % | 14.99 | % | 19.99 | % | ||||||||||||||||||||||||
DEFI:
| September 30, 2023 as Reported |
10% Decrease |
15% Decrease |
20% Decrease |
10% Increase |
15% Increase |
20% Increase |
||||||||||||||||||||||||||||||
| Holdings as of September 30, 2023 |
Number of Contracts Held |
Closing Price |
Notional Amount |
Notional Amount |
Notional Amount |
Notional Amount |
Notional Amount |
Notional Amount |
Notional Amount |
|||||||||||||||||||||||||||
| CME Bitcoin Futures OCT23 |
6 | $ | 271.0000 | $ | 813,000 | $ | 731,700 | $ | 691,050 | $ | 650,400 | $ | 894,300 | $ | 934,950 | $ | 975,600 | |||||||||||||||||||
| CME Bitcoin Futures NOV23 |
6 | $ | 272.7500 | $ | 818,250 | $ | 736,425 | $ | 695,513 | $ | 654,600 | $ | 900,075 | $ | 940,988 | $ | 981,900 | |||||||||||||||||||
| Total CME Bitcoin Futures |
$ | 1,631,250 | $ | 1,468,125 | $ | 1,386,563 | $ | 1,305,000 | $ | 1,794,375 | $ | 1,875,938 | $ | 1,957,500 | ||||||||||||||||||||||
| Shares outstanding |
50,004 | 50,004 | 50,004 | 50,004 | 50,004 | 50,004 | 50,004 | |||||||||||||||||||||||||||||
| Net Asset Value per Share attributable directly to CME Bitcoin Futures |
$ | 32.62 | $ | 29.36 | $ | 27.73 | $ | 26.10 | $ | 35.88 | $ | 37.52 | $ | 39.15 | ||||||||||||||||||||||
| Total Net Asset Value per Share as reported |
$ | 33.49 | ||||||||||||||||||||||||||||||||||
| Change in the Net Asset Value per Share |
$ | (3.26 | ) | $ | (4.89 | ) | $ | (6.52 | ) | $ | 3.26 | $ | 4.89 | $ | 6.52 | |||||||||||||||||||||
| Percent Change in the Net Asset Value per Share |
-9.74 | % | -14.61 | % | -19.48 | % | 9.74 | % | 14.61 | % | 19.48 | % | ||||||||||||||||||||||||
Margin is the minimum amount of funds that must be deposited by a commodity or cryptocurrency interest trader with the trader’s broker to initiate and maintain an open position in futures contracts. A margin deposit acts to assure the trader’s performance of the futures contracts purchased or sold. Futures contracts are customarily bought and sold on initial margin that represents a small percentage of the aggregate purchase or sales price of the contract. Because of such low margin requirements, price fluctuations occurring in the futures markets may create profits and losses that, in relation to the amount invested, are greater than customary in other forms of investment or speculation. As discussed below, adverse price changes in the futures contract may result in margin requirements that greatly exceed the initial margin. In addition, the amount of margin required in connection with a particular futures contract is set from time to time by the exchange on which the contract is traded and may be modified from time to time by the exchange during the term of the contract. Brokerage firms, such as the Funds’ clearing brokers, carrying accounts for traders in commodity or cryptocurrency interest contracts generally require higher amounts of margin as a matter of policy to further protect themselves. An FCM may impose a financial ceiling on initial margin that could change and become more or less restrictive on a Fund’s activities depending upon a variety of conditions beyond the Sponsor’s control. Over the counter trading generally involves the extension of credit between counterparties, so the counterparties may agree to require the posting of collateral by one or both parties to address credit exposure.
When a trader purchases an option, there is no margin requirement; however, the option premium must be paid in full. When a trader sells an option, on the other hand, he or she is required to deposit margin in an amount determined by the margin requirements established for the underlying interest and, in addition, an amount substantially equal to the current premium for the option. The margin requirements imposed on the selling of options, although adjusted to reflect the probability that out-of-the-money options will not be exercised, can in fact be higher than those imposed in dealing in the futures markets directly. Complicated margin requirements apply to spreads and conversions, which are complex trading strategies in which a trader acquires a mixture of options positions and positions in the underlying interest.
Ongoing or “maintenance” margin requirements are computed each day by a trader’s clearing broker. When the market value of a particular open futures contract changes to a point where the margin on deposit does not satisfy maintenance margin requirements, a margin call is made by the broker. If the margin call is not met within a reasonable time, the broker may close out the trader’s position. With respect to the Funds’ trading, the Funds (and not their shareholders personally) are subject to margin calls.
Finally, many major U.S. exchanges have passed certain cross margining arrangements involving procedures pursuant to which the futures and options positions held in an account would, in the case of some accounts, be aggregated, and margin requirements would be assessed on a portfolio basis, measuring the total risk of the combined positions.
The Dodd-Frank Act requires the CFTC, the SEC and the Office of the Comptroller of the Currency, the Board of Governors of the Federal Reserve System, the Federal Deposit Insurance Corporation, the Farm Credit System and the Federal Housing Finance Agency (collectively, the “Prudential Regulators”) to establish “both initial and variation margin requirements on all swaps that are not cleared by a registered clearing organization” (i.e., uncleared or over the counter swaps). The proposed rules would require swap dealers and major swap participants to collect both variation and initial margin from counterparties known as “financial end-users” such as the Funds or Underlying Funds and in certain circumstances require these swap dealers or major swap participants to post variation margin or initial margin to the Funds or Underlying Funds. The CFTC and the Prudential Regulators finalized these rules in 2016 and compliance became necessary in September 2016.
An “exchange for related position” (“EFRP”) can be used by the Fund as a technique to facilitate the exchanging of a futures hedge position against a creation or redemption order, and thus the Fund may use an EFRP transaction in connection with the creation and redemption of shares. The market specialist/market maker that is the ultimate purchaser or seller of shares in connection with the creation or redemption basket, respectively, agrees to sell or purchase a corresponding offsetting futures position which is then settled on the same business day as a cleared futures transaction by the FCMs. The Fund will become subject to the credit risk of the market specialist/market maker until the EFRP is settled within the business day, which is typically 7 hours or less. The Fund reports all activity related to EFRP transactions under the procedures and guidelines of the CFTC and the exchanges on which the futures are traded.
The Funds, other than TAGS and DEFI, will generally retain cash positions of approximately 95% of total net assets; this balance represents the total net assets less the initial margin requirements held by the FCM. DEFI will generally retain cash positions of approximately 70% of total net assets. These cash assets are either: 1) deposited by the Sponsor in demand deposit accounts of financial institutions which are deemed by the Sponsor to be of investment level quality, 2) held in a money-market fund which is deemed to be a cash equivalent under the most recent SEC definition, or 3) held in a cash equivalent with a maturity of 90 days or less that is deemed by the Sponsor to be of investment level quality.
Item 4. Controls and Procedures
Disclosure Controls and Procedures
The Trust and each Fund maintains disclosure controls and procedures that are designed to ensure that information required to be disclosed in the Trust’s periodic reports filed or submitted under the Securities Exchange Act of 1934, as amended (the “Exchange Act”) is recorded, processed, summarized, and reported within the time period specified in the SEC’s rules and forms for the Trust and each Fund thereof.
Management of the Sponsor of the Funds (“Management”), including Sal Gilbertie, the Sponsor’s Principal Executive Officer and Cory Mullen-Rusin, the Sponsor’s Principal Financial Officer, who perform functions equivalent to those of a principal executive officer and principal financial officer of the Trust if the Trust had any officers, have evaluated the effectiveness of the design and operation of the Trust’s and each Fund’s disclosure controls and procedures (as defined in Rule 13a-15(e) or 15d-15(e) of the Securities Exchange Act of 1934, as amended (the “Exchange Act”)) as of the end of the period covered by this report, and, based upon that evaluation, concluded that the Trust’s and each Fund’s disclosure controls and procedures were effective as of the end of such period, to ensure that information the Trust is required to disclose in the reports that it files or submits with the SEC under the Exchange Act is recorded, processed, summarized and reported, within the time periods specified in the SEC’s rules and forms, and to ensure that information required to be disclosed by the Trust in the reports that it files or submits under the Exchange Act is accumulated and communicated to management of the Sponsor, as appropriate, to allow timely decisions regarding required disclosure. The scope of the evaluation of the effectiveness of the design and operation of its disclosure controls and procedures covers the Trust, as well as separately for each Fund that is a series of the Trust.
The certifications of the Chief Executive Officer and Chief Financial Officer are applicable to each Fund individually as well as the Trust as a whole.
Changes in Internal Control over Financial Reporting
There has been no change in the Trust’s or the Funds’ internal controls over the financial reporting (as defined in the Rules 13a-15(f) and 15d-15(f) of the Exchange Act) that occurred during the Trust’s last fiscal quarter that has materially affected, or is reasonably likely to materially affect, the Trust’s or the Funds’ internal control over financial reporting.
Litigation and Claims
On September 13, 2018, Barbara Riker, the then-current Chief Financial Officer, Chief Accounting Officer and Chief Compliance Officer of Teucrium Trading, LLC (“Teucrium,” the “Sponsor” or the “Company”), resigned from each of her positions. Ms. Riker was replaced by Cory Mullen-Rusin. On September 17, 2018, Dale Riker, the then-current Chief Executive Officer (“CEO”) of the Sponsor, was removed from his position. He was replaced by Sal Gilbertie. After Mr. Riker was removed as CEO, he pursued a books and records action against Teucrium in the Delaware Court of Chancery, which resulted in a final judgment on May 19, 2020, following a one-day trial.
Mr. Riker later decided to pursue litigation, and on November 24, 2020, he provided Teucrium with a draft complaint that he threatened to file (purportedly because of an order in the books and records action governing the disclosure), and subsequently did file, in New York Supreme Court. See Dale Riker v. Sal Gilbertie, et al., No. 656794-2020 (N.Y. Sup. Ct.). On November 30, 2020, certain officers and members of the Sponsor, along with the Sponsor, filed a Verified Complaint (as amended through the Amended Verified Complaint filed on February 18, 2021) (the “Gilbertie complaint”) in the Delaware Court of Chancery, C.A. No. 2020-1018-LWW (the “Gilbertie case”). The Gilbertie complaint responded to and addressed certain allegations that Mr. Riker had made in his draft complaint. The Gilbertie complaint asserted various claims against Mr. and Ms. Riker.
On December 7, 2020, Mr. Riker filed his New York complaint. On April 22, 2021, the Supreme Court of the State of New York, New York County dismissed Mr. Riker’s case without prejudice to the case being refiled after the conclusion of the Gilbertie case in Delaware Court of Chancery. See Dale Riker, et al. v. Teucrium Trading, LLC et al, Decision + Order on Motions, No. 6567943-2020 (N.Y. Sup. Ct.) (Apr. 22, 2021).
On June 29, 2021, Mr. Riker, individually and derivatively on behalf of the Sponsor and Ms. Riker, filed a new suit in the Delaware Court of Chancery against the Sponsor’s officers and certain of the Sponsor’s members. See Dale Riker v. Salvatore Gilbertie et al., C.A. No. 2021-0561-LWW (the “Riker case”). The Rikers’ complaint was similar, but not identical, to the complaint Mr. Riker had earlier filed in New York, and which had earlier been dismissed by the New York Court. The Court ordered Mr. Riker’s newly filed Delaware action consolidated with the Gilbertie case, and thus the Rikers eventually refiled their remaining claims as counterclaims in the Gilbertie case.
Following various motions, five counts from the Gilbertie complaint and two of Mr. Riker’s counterclaims remained in the Gilbertie case. The first remaining count from the Gilbertie case was a claim brought by Teucrium against Ms. Riker for an alleged breach of her separation agreement that she entered into after resigning from Teucrium. The second count was a claim brought against Mr. Riker for tortious interference with Ms. Riker’s separation agreement. The third count was a claim brought against Ms. Riker seeking a declaration that the releases in her separation agreement are null and void. The fourth count was a claim brought against Mr. Riker for breach of Teucrium’s amended and restated limited liability agreement (the “Operating Agreement”). The fifth count was a claim brought against Mr. Riker for breach of fiduciary duty. The first of Mr. Riker’s remaining counterclaims was a claim against Messrs. Gilbertie and Miller alleging that Mr. Riker’s removal breached the Operating Agreement. The second remaining counterclaim, which Mr. Riker brought against Mr. Gilbertie, sought specific performance of an alleged oral agreement for Mr. Gilbertie to purchase Mr. Riker’s equity in Teucrium.
In August of 2022, both Dale and Barbara Riker demanded advancement of their legal fees and costs related to the litigation, by virtue of their status as former officers of the Company and Dale Riker’s status as a member. The Company denied the demand as to Barbara Riker. As to Dale Riker, the Company informed his counsel that it was willing to advance some of the fees and costs, but not the full amount he had demanded to date. On November 15, 2022, Dale Riker and Barbara Riker filed a verified complaint captioned “Dale Riker and Barbara Riker v. Teucrium Trading, LLC,” C.A. No. 2022-1030-LWW, to obtain advancement of legal fees and costs in connection with the Gilbertie case.
Following briefing and a hearing, on June 13, 2023, the Court of Chancery ruled that the Rikers are entitled to advancement. As a result of that ruling, the Company has paid to the Rikers, as payment of their fees and costs for the advancement action and as advancement pursuant to the Court ruling, a total of $2,132,246, including interest.
On June 23, 2023, Teucrium asked the Court to permit an appeal of the advancement ruling to the Delaware Supreme Court. See Application for Certification of an Interlocutory Appeal, C.A. 2022-1030-LWW. On July 7, 2023, the Court denied Teucrium’s request for interlocutory appeal, finding that the costs of an interlocutory appeal, including the drain on judicial resources from adjudicating piecemeal appeals, would outweigh any benefits. See June 13, 2023 Transcript Ruling and June 13, 2023 Order of the Court of Chancery of the State of Delaware, C.A. No. 2022-1030-LWW. Teucrium subsequently petitioned the Delaware Supreme Court directly to accept an appeal from the ruling of the Court of Chancery, which that Court denied.
On June 22, 2023, Messrs. Gilbertie, Kahler and Miller, Ms. Mullen-Rusin and Teucrium, the plaintiffs in the Gilbertie case, filed a motion asking the Court of Chancery to allow them to voluntarily dismiss all of the plaintiffs’ remaining claims in the litigation. See Plaintiffs’ Motion To Grant Voluntary Dismissal of Claims with Prejudice, C.A. 2022-1030-LWW. On July 7, 2023, the Rikers filed a response, arguing that any dismissal should be subject to various conditions. On September 5, 2023, the Court ruled that it would grant the motion to voluntarily dismiss the plaintiffs’ claims, without any of the conditions that the Rikers had requested. Following the Court’s ruling, Teucrium filed a motion in the advancement action to terminate its advancement obligation in light of the dismissal of the claims against the Rikers. The Rikers opposed the motion. On October 20, 2023, at a hearing on the motion, the Court granted the motion terminating advancement obligations. On October 26, 2023, the Court issued a written implementing order, making clear that advancement obligations terminated on September 5, 2023, the day the Court granted the motion to dismiss claims voluntarily.
The two counterclaims by Mr. Riker discussed above remain.
Item 1A. Risk Factors applicable to Funds
There have been no material changes to the risk factors previously disclosed in the Trust’s Annual Report on Form 10-K for the fiscal year ended December 31, 2022, filed on March 1, 2023 other than those noted below:
Risks Arising from the Israel-Hamas War
A recent report by the World Bank's Commodity Markets Outlook raised concerns about the global commodity markets, indicating that an escalation of the ongoing conflict in the Middle East, coupled with disruptions caused by Russia's invasion of Ukraine, could lead to unforeseen challenges in the world's commodities, which could lead to additional volatility in commodity futures contracts.
Item 2. Unregistered Sales of Equity Securities and Use of Proceeds
| (a) |
None. |
| (b) |
On July 31, 2010, for all Funds listed below except the Teucrium Agricultural Fund for which the contribution was made on April 1, 2011 and the Hashdex Bitcoin Futures ETF for which the contribution was made on May 25, 2022, the Sponsor made the following capital contributions and received the following shares for that contribution prior to each Fund’s commencement of operations; such shares were sold in private offerings exempt from registration under Section 4(2) of the Securities Act of 1933, as amended: |
| 1. |
a $100 capital contribution to the Teucrium Corn Fund, another series of the Trust, in exchange for four shares of such fund; |
| 2. |
a $100 capital contribution to the Teucrium Soybean Fund, another series of the Trust, in exchange for four shares of such fund; |
| 3. |
a $100 capital contribution to the Teucrium Sugar Fund, another series of the Trust, in exchange for four shares of such fund; |
| 4. |
a $100 capital contribution to the Teucrium Wheat Fund, another series of the Trust, in exchange for four shares of such fund; |
| 5. |
a $100 capital contribution to the Teucrium Agricultural Fund, another series of the Trust, in exchange for two shares of such fund; and |
| 6. |
a $100 capital contribution to the Hashdex Bitcoin Futures ETF, another series of the Trust, in exchange for four shares of such fund. |
Teucrium Corn Fund
| Registration Statement on Form S-1 |
File Number |
Registered Common Units |
Effective Date |
|||||
| 1 | 333-162033 | 30,000,000 | June 7, 2010 |
|||||
| 2 | 333-187463 | - | April 30, 2013 |
|||||
| 3 | 333-210010 | - | April 29, 2016 |
|||||
| 4 | 333-230626 | - | April 29, 2019 |
|||||
| 5 | 333-237234 | 10,000,000 | May 1, 2020 |
|||||
| 6 | 333-248546 | 20,000,000 | October 2, 2020 |
|||||
| 7 | 333-263434 | Indeterminate Number of Shares |
April 7, 2022 |
From June 9, 2010 (the commencement of operations) through September 30, 2023, 46,425,000 Shares of the Fund were sold at an aggregate offering price of $1,040,347,790. The Fund paid fees to Foreside Fund Services, LLC for its services to the Fund from June 9, 2010 (the commencement of operations) through September 30, 2023 in an amount equal to $1,221,3390, resulting in net offering proceeds of $1,039,126,401. The offering proceeds were invested in corn futures contracts and cash and cash equivalents in accordance with the Fund’s investment objective stated in the prospectus.
Teucrium Soybean Fund
| Registration Statement on Form S-1 |
File Number |
Registered Common Units |
Effective Date |
||||
| 1 |
333-167590 | 10,000,000 | June 13, 2011 |
||||
| 2 |
333-196210 | - | June 30, 2014 |
||||
| 3 |
333-217247 | - | May 1, 2017 |
||||
| 4 |
333-223940 | 5,000,000 | April 30, 2018 |
||||
| 5 |
333-241569 | 15,000,000 | August 24, 2020 |
||||
| 6 |
333-263448 | Indeterminate Number of Shares |
April 7, 2022 |
From September 19, 2011 (the commencement of the offering) through September 30, 2023, 16,675,000 Shares of the Fund were sold at an aggregate offering price of $307,231,839. The Fund paid fees to Foreside Fund Services, LLC for its services to the Fund through September 30, 2023 in an amount equal to $262,397, resulting in net offering proceeds of $306,969,442. The offering proceeds were invested in soybean futures contracts and cash and cash equivalents in accordance with the Fund’s investment objective stated in the prospectus.
Teucrium Sugar Fund
| Registration Statement on Form S-1 |
File Number |
Registered Common Units |
Effective Date |
||||
| 1 |
333-167585 | 10,000,000 | June 13, 2011 |
||||
| 2 |
333-196211 | - | June 30, 2014 |
||||
| 3 |
333-217248 | - | May 1, 2017 |
||||
| 4 |
333-223941 | 5,000,000 | April 30, 2018 |
||||
| 5 |
333-248545 | 15,000,000 | October 2, 2020 |
||||
| 6 |
333-263438 | Indeterminate Number of Shares |
April 7, 2022 |
From September 19, 2011 (the commencement of the offering) through September 30, 2023, 12,875,000 Shares of the Fund were sold at an aggregate offering price of $120,202,444. The Fund paid fees to Foreside Fund Services, LLC for its services to the Fund through September 30, 2023 in an amount equal to $107,313, resulting in net offering proceeds of $120,095,131. The offering proceeds were invested in sugar futures contracts and cash and cash equivalents in accordance with the Fund’s investment objective stated in the prospectus.
Teucrium Wheat Fund
| Registration Statement on Form S-1 |
File Number |
Registered Common Units |
Effective Date |
||||
| 1 |
333-167591 | 10,000,000 | June 13, 2011 |
||||
| 2 |
333-196209 | - | June 30, 2014 |
||||
| 3 |
333-212481 | 25,050,000 | July 15, 2016 |
||||
| 4 |
333-230623 | 30,000,000 | April 29, 2019 |
||||
| 5 |
333-263293 | Indeterminate Number of Shares |
March 9, 2022 |
From September 19, 2011 (the commencement of the offering) through September 30, 2023, 130,000,000 Shares of the Fund were sold at an aggregate offering price of $1,225,123,346. The Fund paid fees to Foreside Fund Services, LLC for its services to the Fund through September 30, 2023 in an amount equal to $560,511, resulting in net offering proceeds of $1,224,562,835. The offering proceeds were invested in wheat futures contracts and cash and cash equivalents in accordance with the Fund’s investment objective stated in the prospectus.
Teucrium Agricultural Fund
| Registration Statement on Form S-1 |
File Number |
Registered Common Units |
Effective Date |
||||
| 1 |
333-173691 | 5,000,000 | February 10, 2012 |
||||
| 2 |
333-201953 | - | April 30, 2015 |
||||
| 3 |
333-223943 | - | April 30, 2018 |
||||
| 4 |
333-254650 | - | April 30, 2021 |
||||
| 5 |
333-263450 | Indeterminate Number of Shares |
April 7, 2022 |
From March 28, 2012 (the commencement of the offering) through September 30, 2023, 2,287,500 Shares of the Fund were sold at an aggregate offering price of $77,555,646. The Fund paid fees to Foreside Fund Services, LLC for its services to the Fund through September 30, 2023 in an amount equal to $31,340, resulting in net offering proceeds of $77,524,306. The offering proceeds were invested in Shares of the Underlying Funds and cash and cash equivalents in accordance with the Fund’s investment objective stated in the prospectus.
Hashdex Bitcoin Futures ETF
| Registration Statement on Form S-1 |
File Number |
Registered Common Units |
Effective Date |
||||
| 1 |
333-256339 | Indeterminate Number of Shares |
September 14, 2022 |
From September 15, 2022 (the commencement of the offering) through September 30, 2023, 110,000 Shares of the Fund were sold at an aggregate offering price of $2,829,029. The offering proceeds were invested in bitcoin futures contracts and cash and cash equivalents in accordance with the Fund’s investment objective stated in the prospectus.
Issuer Purchases of CORN Shares:
| Period |
Total Number of Shares Purchased |
Average Price Paid per Share |
Total Number of Shares Purchased as Part of Publicly Announced Plans or Programs |
Maximum Number (or Approximate Dollar Value) of Shares that May Yet Be Purchased Under the Plans or Programs |
| July 1 to July 31, 2023 |
150,000 |
$ 24.35 |
N/A |
N/A |
| August 1 to August 31, 2023 |
275,000 |
$ 22.51 |
N/A |
N/A |
| September 1 to September 30, 2023 |
200,000 |
$ 21.98 |
N/A |
N/A |
| Total |
625,000 |
$ 22.78 |
||
| January 1 to September 30, 2023 |
2,375,000 |
$ 24.55 |
N/A |
N/A |
Issuer Purchases of CANE Shares:
| Period |
Total Number of Shares Purchased |
Average Price Paid per Share |
Total Number of Shares Purchased as Part of Publicly Announced Plans or Programs |
Maximum Number (or Approximate Dollar Value) of Shares that May Yet Be Purchased Under the Plans or Programs |
| July 1 to July 31, 2023 |
150,000 |
$ 12.86 |
N/A |
N/A |
| August 1 to August 31, 2023 |
200,000 |
$ 13.17 |
N/A |
N/A |
| September 1 to September 30, 2023 |
150,000 |
$ 14.95 |
N/A |
N/A |
| Total |
500,000 |
$ 13.61 |
||
| January 1 to September 30, 2023 |
2,425,000 |
$ 12.72 |
N/A |
N/A |
Issuer Purchases of WEAT Shares:
| Period |
Total Number of Shares Purchased |
Average Price Paid per Share |
Total Number of Shares Purchased as Part of Publicly Announced Plans or Programs |
Maximum Number (or Approximate Dollar Value) of Shares that May Yet Be Purchased Under the Plans or Programs |
| July 1 to July 31, 2023 |
650,000 |
$ 6.56 |
N/A |
N/A |
| August 1 to August 31, 2023 |
- |
$ - |
N/A |
N/A |
| September 1 to September 30, 2023 |
200,000 |
$ 5.80 |
N/A |
N/A |
| Total |
850,000 |
$ 6.38 |
||
| January 1 to September 30, 2023 |
8,050,000 |
$ 7.15 |
N/A |
N/A |
Issuer Purchases of SOYB Shares:
| Period |
Total Number of Shares Purchased |
Average Price Paid per Share |
Total Number of Shares Purchased as Part of Publicly Announced Plans or Programs |
Maximum Number (or Approximate Dollar Value) of Shares that May Yet Be Purchased Under the Plans or Programs |
| July 1 to July 31, 2023 |
75,000 |
$ 29.29 |
N/A |
N/A |
| August 1 to August 31, 2023 |
50,000 |
$ 27.31 |
N/A |
N/A |
| September 1 to September 30, 2023 |
175,000 |
$ 27.68 |
N/A |
N/A |
| Total |
300,000 |
$ 28.02 |
||
| January 1 to September 30, 2023 |
1,250,000 |
$ 27.64 |
N/A |
N/A |
Issuer Purchases of TAGS Shares:
| Period |
Total Number of Shares Purchased |
Average Price Paid per Share |
Total Number of Shares Purchased as Part of Publicly Announced Plans or Programs |
Maximum Number (or Approximate Dollar Value) of Shares that May Yet Be Purchased Under the Plans or Programs |
| July 1 to July 31, 2023 |
37,500 |
$ 30.72 |
N/A |
N/A |
| August 1 to August 31, 2023 |
25,000 |
$ 31.02 |
N/A |
N/A |
| September 1 to September 30, 2023 |
- |
$ - |
N/A |
N/A |
| Total |
62,500 |
$ 30.84 |
||
| January 1 to September 30, 2023 |
537,500 |
$ 31.14 |
N/A |
N/A |
Issuer Purchases of DEFI Shares:
| Period |
Total Number of Shares Purchased |
Average Price Paid per Share |
Total Number of Shares Purchased as Part of Publicly Announced Plans or Programs |
Maximum Number (or Approximate Dollar Value) of Shares that May Yet Be Purchased Under the Plans or Programs |
| July 1 to July 31, 2023 |
- |
$ - |
N/A |
N/A |
| August 1 to August 31, 2023 |
- |
$ - |
N/A |
N/A |
| September 1 to September 30, 2023 |
- |
$ - |
N/A |
N/A |
| Total |
- |
$ - |
||
| January 1 to September 30, 2023 |
10,000 |
$ 32.39 |
N/A |
N/A |
Item 3. Defaults Upon Senior Securities
None.
Item 4. Mine Safety Disclosures
None.
(a) None.
(b) Not Applicable.
The following exhibits are filed as part of this report as required under Item 601 of Regulation S-K:
| 31.1 |
|
| 31.2 |
|
| 32.1 |
|
| 32.2 |
|
| 101.INS |
Inline XBRL Instance Document - the instance document does not appear in the Interactive Data File because its XBRL tags are embedded within the Inline XBRL document. |
| 101.SCH |
Inline XBRL Taxonomy Extension Schema Document |
| 101.CAL |
Inline XBRL Taxonomy Extension Calculation Linkbase Document |
| 101.DEF |
Inline XBRL Taxonomy Extension Definition Linkbase Document |
| 101.LAB |
Inline XBRL Taxonomy Extension Label Linkbase Document |
| 101.PRE |
Inline XBRL Taxonomy Extension Presentation Linkbase Document |
| 104 |
Cover Page Interactive Data File (formatted as Inline XBRL and contained in Exhibit 101) |
(1) Filed herewith.
Pursuant to the requirements of the Securities Exchange Act of 1934, the Registrant has duly caused this report to be signed on its behalf by the undersigned, thereunto duly authorized.
Teucrium Commodity Trust (Registrant)
| By: |
Teucrium Trading, LLC |
|
| its Sponsor |
||
| By: |
/s/ Cory Mullen-Rusin |
|
| Name: |
Cory Mullen-Rusin |
|
| Chief Financial Officer |
||
| Date: November 8, 2023 |
Teucrium Commodity Trust (Registrant)
| By: |
Teucrium Trading, LLC |
|
| its Sponsor |
||
| By: |
/s/ Sal Gilbertie |
|
| Name: |
Sal Gilbertie |
|
| Chief Executive Officer |
||
| Date: November 8, 2023 |