
|
Pampa Energía S.A. ('Pampa' or the 'Company'), the largest independent energy integrated company in Argentina, with active participation in the country's electricity and gas value chain, announces the results for the fiscal year and quarter ended on December 31, 2018. |
Buenos Aires, March 11, 2019
|
Stock Information | |||
 |
Buenos Aires Stock |
The financial information presented in this Earnings Release is reported in constant currency as of December 2018, based on financial statements (‘FS’) prepared in accordance with the International Accounting Standards (‘IAS’) 29 of the International Financial Reporting Standards (‘IFRS’). However, for the convenience of the reader, the quarterly financial information is disclosed and explained in nominal terms, while the annual figures are disclosed both in nominal and adjusted-by-inflation terms when explicitly indicated throughout this document1. Main Results for the Fiscal Year 2018,
| |
 |
New York Stock Exchange |
||
|
Share capital in diluted basis, net of repurchases: Market Capitalization: For further information, contact: Gustavo Mariani Chief Executive Officer – CEO Ricardo Torres Executive Vice-president Mariano Batistella Executive Director of Planning, Strategy, Downstream & Affiliates Lida Wang Investor Relations Officer The Pampa Energía Building Tel: +54 (11) 4344-6000
investor@pampaenergia.com
ri.pampaenergia.com/en |
|||
1 For further information, see section 1.9 of this Earnings Release.
2 Under the IFRS, Greenwind, OldelVal, Refinor, Transener and TGS are not consolidated in Pampa’s FS, being its equity income shown as ‘Results for participation in associates/joint businesses’.
3 Consolidated adjusted EBITDA represents the results before net financial results, income tax and minimum notional income tax, depreciations and amortizations, non-recurring and non-cash income and expense, equity income and other adjustments from the IFRS implementation, and includes affiliates’ EBITDA at ownership. For more information, see section 3 of this Earnings Release.
|
Pampa Energía ● Q4 18 Earning Release ● 1 |

Main Results for the Fourth Quarter of 2018 (‘Q4 18’), in Nominal Terms4
Consolidated net revenues of AR$24,284 million, 72% higher than the AR$14,131 million for the fourth quarter 2017 (‘Q4 17’), explained by increases of 191% in power generation, 59% in electricity distribution, 60% in oil and gas, 68% in petrochemicals and 270% in holding and others, partially offset by higher eliminations from to intersegment sales of AR$1,789 million.
ð Power Generation of 3,325 GWh from 12 power plants
ð Electricity sales of 4,652 GWh to 3 million end-users
ð Production of 42.5 thousand barrels per day of hydrocarbons
ð Sales of 88 thousand tons of petrochemical products
Consolidated adjusted EBITDA for continuing operations of AR$6,843 million, compared to AR$3,661 million for Q4 17, mainly due to increases of 178% in power generation, 39% in oil and gas, AR$177 million in petrochemicals, AR$888 million in holding and others, and lower intersegment eliminations of AR$23 million, partially offset by losses of AR$653 million in electricity distribution and decreases of AR$35 million in refining and distribution.
Consolidated gain attributable to the owners of the Company of AR$6,384 million, higher than the AR$1,512 million gain recorded in Q4 17, mainly explained by the accrual of AR$5,377 million gain due to 9% AR$ appreciation against US$, currency in which most of the Company’s financial liabilities are denominated, but as the quarterly analysis is in nominal AR$, the inflation effect is not reflected.
Information about the Conference Call
There will be a conference call to discuss Pampa’s Q4 18 results on Tuesday March 12, 2019 at 10:00 a.m. Eastern Standard Time / 11:00 a.m. Buenos Aires Time.
The host will be Lida Wang, Investor Relations Manager at Pampa. For those interested in participating, please dial +54 (11) 3984-5677 in Argentina, +1 (844) 717-6837 in the United States or +1 (412) 317-6394 from any other country. Participants of the conference call should use the identification password ‘Pampa Energía’ and dial in five minutes before the scheduled time. Please download the Q4 18 Conference Call Presentation from our IR website. There will also be a live audio webcast and presentation of the conference at http://bit.ly/PampaQ418Call.
You may find additional information on the Company at:
ü ri.pampaenergia.com/en
ü www.cnv.gov.ar
ü www.sec.gov
ü www.bolsar.com
4 The financial information presented in this document for the quarters ended on December 31, 2018 and of 2017 are based on figures in nominal terms corresponding to the fiscal years 2018 and 2017, and the reported FS for the nine-month periods ended on September 30, 2018 and 2017, respectively.
|
Pampa Energía ● Q4 18 Earning Release ● 2 |
Table of Contents
|
Main Results for the Fiscal Year 2018, in Constant Currency |
1 | ||
|
Main Results for the Q4 18, in Nominal Terms |
2 | ||
|
Information about the Conference Call |
2 | ||
|
1. |
Relevant Events |
4 | |
|
1.1 |
Oil & Gas Segment |
4 | |
|
1.2 |
Power Generation Segment |
6 | |
|
1.3 |
Transportadora de Gas del Sur ('TGS') |
7 | |
|
1.4 |
Empresa Distribuidora y Comercializadora Norte S.A. ('Edenor') |
8 | |
|
1.5 |
Compañía de Transporte de Energía Eléctrica en Alta Tensión Transener S.A. ('Transener') |
9 | |
|
1.6 |
Strategic Divestments |
10 | |
|
1.7 |
Repurchase of Own Financial Securities |
10 | |
|
1.8 |
Corporate Governance |
11 | |
|
1.9 |
IFRS: Restatement of Financial Information |
12 | |
|
2. |
Financial Highlights |
13 | |
|
2.1 |
Consolidated Balance Sheet |
13 | |
|
2.2 |
Consolidated Income Statement |
14 | |
|
2.3 |
Cash and Financial Borrowings |
15 | |
|
3. |
Analysis in Nominal Terms of the Q4 18 Results |
16 | |
|
3.1 |
Analysis of the Power Generation Segment |
18 | |
|
3.2 |
Analysis of the Electricity Distribution Segment |
20 | |
|
3.3 |
Analysis of the Oil and Gas Segment |
22 | |
|
3.4 |
Analysis of the Refining and Distribution Segment |
25 | |
|
3.5 |
Analysis of the Petrochemicals Segment |
26 | |
|
3.6 |
Analysis of the Holding and Others Segment |
28 | |
|
3.7 |
Analysis of the Fiscal Year, by Subsidiary |
29 | |
|
3.8 |
Analysis of the Quarter, by Subsidiary |
30 | |
|
Pampa Energía ● Q4 18 Earning Release ● 3 |
1. Relevant Events
Natural Gas Price for Power Generation
On December 27, 2018, through the ‘Gas Electronic Market’ (‘MEGSA’) platform, the Argentine Wholesale Electricity Market Clearing Company (‘CAMMESA’) tendered natural gas to be supplied to thermal power plants during the year 2019, and price indications were received for a total gas volume of 7.8 billion cubic feet per day on a interruptible basis, at seasonal Transportation System Entry Point (‘PIST’) prices capped at US$5.2/MBTU and floor of US$3.2/MBTU for the June – August 2019 period, and a maximum price of US$3.7/MBTU and a minimum price of US$2.2/MBTU for the rest of the year.
In this auction, maximum PIST seasonal reference prices were considered, based on the source basin, pursuant to Note No. 66680075/2018 of the Secretariat of Energy Government (‘SGE’), issued on December 19, 2018 and effective as from January 1, 2019. For the June – August 2019 period, prices were fixed at US$4.95/MBTU for the Neuquina Basin, US$5.15/MBTU for the Noroeste Basin, US$5.10/MBTU for the Golfo San Jorge Basin, US$4.90/MBTU for the Santa Cruz Sur Basin, and US$4.85/MBTU for the Tierra del Fuego Basin; whereas for the rest of the year prices were fixed at US$3.70/MBTU for the Neuquina Basin, US$3.60/MBTU for the Noroeste Basin, US$3.55/MBTU for the Golfo San Jorge Basin, US$3.35/MBTU for the Santa Cruz Sur Basin, and US$3.30/MBTU for the Tierra del Fuego Basin.
However, on February 8, 2019, the SGE issued Note No. 07973690, instructing CAMMESA to recognize within the Variable Production Costs (‘CVP’) declared by the power generation companies, a maximum gas price equivalent to the average weighted price by basin that would have resulted if the entire fuel had been acquired by CAMMESA5.
Changes to the Unconventional Gas Production Encouragement Program
One of the Company’s main strategies consists of focusing its investments on the Exploration & Production (‘E&P’) of natural gas, with special emphasis on the development and exploitation of unconventional gas reserves in our blocks. The extensions to the terms of exploitation licenses in Pampa’s blocks, achieved during 2018 for El Mangrullo and Sierra Chata, in addition to Río Neuquén in 2016 and Rincón del Mangrullo in 2017, were carried out in line with this strategy, as well as a requirement for joining the Encouragement Program for the Investment in Development of Natural Gas Production from Unconventional Reservoirs Program (the ‘Unconventional Plan Gas’), regulated by Res. No. 46/2017 and Res. No. 419/2017 of former Ministry of Energy and Mining (‘MEyM’).
In this since, Pampa had requested the SGE to include within the Unconventional Plan Gas the following exploitation projects, duly approved by the applicable Provincial authority:
i. Río Neuquén, filed on February 5, 2018, in which Pampa holds a 33.07% working interest;
ii. El Mangrullo, filed on July 26, 2018, in which Pampa stands as operator and holds a 100% working interest; and
iii. Sierra Chata, filed on July 30, 2018, in which Pampa stands as operator and holds a 45.55% working interest.
However, on January 30, 2019, in a meeting called by the SGE with the participation of gas producers affected by the Unconventional Plan Gas, including the Company, it was informed that no new projects will be approved and the SGE will evaluate a new encouragement scheme during the winter season.
5 For further information, see section1.2: ‘Fuel Self-Procurement for Thermal Power Plants’ of this Earnings Release.
|
Pampa Energía ● Q4 18 Earning Release ● 4 |
As of the issuance of this Earnings Release, there is no Resolution or administrative instruction issued by the SGE, nor Pampa has been formally notified that the inclusion within the Unconventional Plan Gas of the abovementioned projects were not approved. Notwithstanding, the Company is assessing the next steps and awaiting the guidelines for the new encouragement proposal during the winter season.
Public Tender for Gas Supply on a Firm Basis for Distribution Companies
On February 11, 2019, SGE Res. No. 32/19 was published in the Public Gazette (‘BO’), approving the mechanisms for the public tender of single price to supply natural gas on a firm basis to gas distribution companies.
The tender was held on-site at the Buenos Aires Stock Exchange (‘BCBA’) through the MEGSA platform under a single-round electronic auction mechanism, which comprised a 12-month period with seasonality, being winter volumes 2.5 times higher than summer volumes, corresponding to winter the April – September 2019 period, and summer the October 2019 – April 2020 period, with take or pay (‘ToP’) and deliver or pay (‘DoP’) commitments. Furthermore, gas volumes paid but not received may be recovered in the following summer period provided it is received by the purchaser.
All the basins but Noroeste participated on the February 14, 2019 auction, which awarded 510 million cubic feet day for summer and 1.3 billion cubic feet per day for winter, at a weighted average price by awarded bids of US$4.62/MBTU. Out of these volumes, 83% corresponded to the Neuquina Basin at a weighted average price of US$4.61/MBTU. Pampa tendered and was awarded this auction.
Furthermore, the February 15, 2019 auction awarded 133 million cubic feet per day for summer and 332 million cubic feet per day for winter, at a weighted average price of US$4.35/MBTU, being 100% of the volume corresponding to the Noroeste Basin. The state-owned company Integración Energética Argentina S.A. (‘IEASA’) participated in this auction as the domestic supply in this basin is insufficient.
Invoices will be in AR$ per m3 under the pass-through methodology of gas prices to tariffs, pursuant to Res. No. 72/20196 issued by the National Gas Regulatory Entity (‘ENARGAS’), invoicing within 5 days following the last day of delivery for each month, and payable 65 days after the end of the month of actual delivery. Furthermore, any payable in arrears will bear interest at a rate equivalent to 150% of the average time deposit’s 30-day period rate of Banco de la Nación Argentina (‘BNA’). The seller may request the purchaser to constitute a surety bond and, in case ENARGAS does not guarantee the pass-through of the agreed sales price to the tariff, either party may terminate the rights and obligations under the agreement.
Pass-Through Methodology of Gas Prices to Tariffs
As from the publication of ENARGAS Res. No. 72/19 in the BO, the pass-through methodology of gas prices to tariffs and the general procedure for calculating accumulated daily nominal foreign exchange differences entered into effect as from February 12, 2019. Among other aspects, this methodology considers the recognition of prices stipulated in the agreements entered into between gas distributors and producers under the auctions conducted pursuant to SGE Res. No. 32/20197 and provides that the exchange rate to be considered by producers and distributors should be BNA’s average currency exchange rate for the first 15 days of the month immediately preceding the beginning of each seasonal period or, if lower, the exchange rates stipulated in the agreements.
Furthermore, regarding the receivables accrued by gas producers on account of exchange differences between the price of the gas purchased by gas distributors and that recognized in their final tariffs for the April – October 2018 period, on November 15, 2018 Executive Order No. 1053/2018 of the National Executive Branch (‘PEN’) was issued, which established, on an exceptional basis, that the Federal Government would bear such exchange difference, considering the April 2018 – March 2019 period. The resulting net amount will be transferred to gas distributors, which will immediately transfer it to the involved gas suppliers in 30 monthly and consecutive installments as from October 1, 2019, using BNA’s 30-day period effective interest rate for AR$-denominated deposits.
6 For further information, see section 1.1: ‘Pass-Through Methodology of Gas Prices to Tariffs’ of this Earnings Release.
7 For further information, see section 1.1: ‘Public Tender for Gas Supply on a Firm Basis for Distribution Companies’ of this Earnings Release.
|
Pampa Energía ● Q4 18 Earning Release ● 5 |
Compensations Pending Settlement Under the Plan Gas
On February 21, 2019 SGE Res. No. 54/19 was published, which provided that obligations arising under MEyM Res. No. 97/18 should be settled through the issuance of national debt securities. Consequently, on February 26, 2019, Joint Res. No. 21/2019 of the Secretariat of Finance and the Secretariat of Treasury was published, which provided for the issuance on February 27, 2019 of US$-denominated Natural Gas Programs Bonds for a term of 2 years and 4 months, without interests and consisting of 29 monthly and consecutive installments, being the first one for 6.66% of the original face value, the following 18 installments for 3.33%, and the remaining 10 installments for 3.34%.
Pampa filed the application form before the SGE, stating its consent and acceptance to the terms and scopes of SGE Res. No. 54/19. As of December 31, 2018, the receivables balance pending collection amounts to AR$5.338 million. However, the compensation amount for the Plan Gas accrued during the fiscal year 2018 was settled in January 2019, collecting approximately AR$649 million.
Gas Export Authorization
On December 12, 2018, Pampa was authorized pursuant to SGE Res. No. 252/2018 to export natural gas to Chile, on a non-firm basis, from the Río Neuquén and Rincón del Mangrullo blocks to Colbún S.A., at a PIST price of US$4.2/MBTU, for a maximum volume of 71 million cubic feet per day until November 15, 2019, or until meeting the total maximum quantity, which equals the authorized daily export volume by the number of days this authorization is effective, whichever occurs first.
Furthermore, on January 22, 2019, the Company was authorized pursuant to SGE Res. No. 12/2019 to export natural gas to Uruguay, also on a non-firm basis, from the Río Neuquén and Rincón del Mangrullo blocks to Uruguay’s Power Plants and Transmissions state-owned company, at a PIST price of US$4.01/MBTU, for a maximum volume of 21 million cubic feet per day until May 1, 2019, or until meeting the total maximum quantity, which equals the authorized daily export volume by the number of days this authorization is effective.
Investment in Oleoductos de Crudos Pesados (‘OCP’)
On December 6, 2018, OCP executed an agreement with the Republic of Ecuador in order to terminate all the claims and legal actions initiated by the parties, in relation to the discrepancy amounts claimed by Ecuador’s tax authority. Consequently, Pampa recognized a gain at our indirect participation of 11.42% in OCP, for US$35 million.
Moreover, on December 5, 2018, an agreement was entered into between Agip Oleoducto de Crudos Pesados BV to acquire shares representing 4.49% capital stock of OCP and the subordinated debt issued by this company, subject to the approval of the Ecuador’s Federal Government, among other precedent conditions.
New Remuneration Scheme for Legacy Capacity
On March 1, 2019, Res. No. 1/19 by the Secretariat of Renewable Resources and Electricity Market (‘SRRYME’) was published in the BO, which abrogated the remuneration scheme established by Res. No. 19/17 of the former Secretariat of Electric Energy (‘SEE’). The new remuneration scheme is denominated in US$ and applicable as from March 1, 2019. The main changes are:
|
Pampa Energía ● Q4 18 Earning Release ● 6 |
• The capacity remuneration for thermal power plants with the Guaranteed Availability Commitments (‘DIGO’) declaration is reduced to US$5,500/MW-month for the periods of March – May (fall) and September – November (spring);
• For thermal power plants, a coefficient arisen from the unit’s average utilization factor during the last twelve months is applied: to collect 100% of the power capacity payment, a minimum 70% utilization factor is required; if the utilization factor ranges between 30% and 70%, a percentage linearly correlated with the factor is collected; and if the load factor is lower than 30%, the resulting coefficient will be 0.70; and
• The operation and maintenance remuneration is reduced to US$4/MWh for energy generated with gas and to US$7/MWh if generated with fuel oil or gas oil, and the remuneration for operated energy is reduced to US$1.4/MWh.
Fuel Self-Procurement for Thermal Power Plants
In December 2018, the fuel self-procurement capacity for thermal power plants, pursuant to SGE Res. No. 70/2018, was extended to power plants subject to a differential remuneration schemes. However, CAMMESA will remain in charge of the commercial management and fuel dispatch for power generators that cannot or do not make use of such capacity.
Since the seasonal programming conducted on November 12, 2018 the Company has opted to make use of this self-supply capacity, and has destined a significant part of its natural gas production to its thermal units’ dispatch.
In case the power generator opts to self-procure the fuel and at the moment of dispatching it does not have the fuel, the calculation of the power capacity availability will be reduced by 50% of the real availability. In a similar sense, it will lose the dispatch order and if the Entity in Charge of the Dispatch procures the fuel for power generation, it will only be remunerated for the Generated Energy, at 50% of the non-fuel variable costs approved.
Finally, on February 8, 2019, SGE Note No. 07973690 was issued, which instructed CAMMESA to apply as from February 18, 2019, for the definition of maximum CVP recognizable in each two-week period, the weighted average price of natural gas by basin that would have resulted if the total domestic natural gas production necessary to supply the electricity sector had been acquired under agreements entered into in CAMMESA’s last auction conducted through MEGSA8.
Midstream Project in Vaca Muerta
On November 26, 2018, another addenda was signed to the memorandum of understanding timely executed last April 3, 2018 with the Undersecretary of Energy, Mining and Hydrocarbons of the Province of Neuquén and Gas y Petróleo del Neuquén S.A. (‘GyP’), which establishes the commitment to grant TGS an extension in the Northern Tranche of the gathering gas pipeline, which will be extended from the Rincón La Ceniza block (the progressive stop Mile 57) to Los Toldos I Sur block (the progressive stop Mile 72), and will have a 16-mile extension and a 36-inches diameter, going through several fields, mainly in the Vaca Muerta formation, to capture the natural gas production before its entry into the main gas pipelines. This memorandum of understanding was later ratified by Executive Order No. 2381/2018 issued by the Neuquén Provincial Executive Branch.
8 For further information, see section 1.1: ‘Price of Natural Gas for Power Generation’ of this Earnings Release.
|
Pampa Energía ● Q4 18 Earning Release ● 7 |
The total investment for the 91-mile pipeline and the conditioning plant is estimated at US$250 million, with a total transportation capacity of 2.1 billion cubic feet per day. As of the issuance of this Earnings Release, the related works are in the execution stage and commissioning is estimated to be in stages as from the second quarter of 2019 concluding in the fourth quarter of the same year.
Public Hearing
Pursuant to Res. No. 1/19 issued on February 4, 2019, ENARGAS called TGS for a public hearing on February 26, 2019, with the purpose of disclosing the application of the semiannual tariff update corresponding to the August 2018 – February 2019 period.
Proposal of Dividends
On March 7, 2019, the Board of Directors of TGS decided to submit for the consideration of the next Ordinary General Meeting of Shareholders to be held on April 11, 2019, a cash dividend distribution for a total amount of AR$6.5 billion.
Wholesale Electricity Market (‘WEM’) Seasonal Programming
On December 27, 2018, SGE Res. No. 366/2018 was issued, which abrogated SEE Res. No. 1091/2017 and, consequently, the Federal Government’s social tariff and the discount scheme based on savings, and established a power capacity reference price of AR$80,000/MW-month effective as from February 2019, with 25% and 20% increases in the months of May and August 2019, respectively, effective until October 2019. The transportation stabilized price for extra high voltage system and the price for regional distribution based on the distribution company remained unchanged.
Regarding the energy reference price, it was set at AR$2,762/MWh for Large Users at Distribution Grid (‘GUDI’) for the February – October 2019 period, and at AR$1,852/MWh for the remaining users as from February 2019, with 5% increases in the months of May and August 2019, effective until October 2019.
Semiannual Remuneration Update
On February 1, 2019, Res. No. 25/2019 of the National Electricity Regulatory Entity (‘ENRE’) was published in the BO, which approved tariff scheme effective as from its publication date and reflected new seasonal prices described in SGE Res. No. 366/2018. On the same date, ENRE Res. No. 27/2019 was also published, but effective as from March 1, 2019, provided for a 25% retroactive adjustment as of February 1, 2019 to Own Distribution Cost (‘CPD’) corresponding to the August 2018 – January 2019 semester (including a -1.59% efficiency stimulus E factor) and an additional 6% CPD update, timely deferred in August 2018, with retroactive effects as of that date. The retroactive amounts will be collected in five installments.
Transfer of Edenor’s Concession Jurisdiction
Pursuant to Laws No. 27,469 (2018 Fiscal Consensus) and No. 27,467 (2019 General Expenses and Resources Budget for the National Administration), on February 28, 2019 the representatives of the Federal Government, the Province of Buenos Aires (‘PBA’) and the Autonomous City of Buenos Aires (‘CABA’) executed an agreement to transfer the electricity distribution utility service ―timely granted by the Federal Government to our subsidiary Edenor― to the jurisdictions of PBA and CABA. In this way, PBA and CABA will oversee Edenor’s utility service, replacing the Federal Government, the original grantor. The main aspects of the agreement worth highlighting are as follows:
|
Pampa Energía ● Q4 18 Earning Release ● 8 |
· The creation of a bipartite entity for the control and regulation of electricity distribution utility service, and to conduct all necessary actions to carry this out as soon as possible;
· As from January 2019, PBA and CABA cope with expenditures related to Social Tariff with own resources; and
· The Federal Government is committed to make the necessary management and administrative procedures to finally settle pending issues, among others, the claim related to the compliance of the Memorandum of Understanding executed between the Federal Government and Edenor in 2006, the payment of the consumption in shantytowns with community meters, and the resulting balance for applying limits to invoices of residential users under Social Tariff scheme.
Initially, this agreement does not imply a fundamental change in respect of the regulation, tariff definition, future increases, the service quality benchmarks, all already set in the last Comprehensive Tariff Review (‘RTI’). However, it shall need to await the confirmation of new regulatory entity replacing the ENRE, which will remain in charge temporarily until the new regulatory body is created. Moreover, it should be noted that Edenor has not been a party to this agreement, and Edenor is currently analyzing its scope and implications.
Claim Filed Against Ribera Desarrollos S.A. (‘RDSA’)
In regards the claim against RDSA’s breach of agreement, in November 2018 Edenor filed an arbitration proceeding before the BCBA’s Court of Arbitration requesting the recovery of the purchase price and its interests. Moreover, Edenor initiated the process to execute the surety bond guaranteeing RDSA’s compliance, and in accordance to the insurance policy terms, the claim amounts to US$50 million, covering more than 60% the amount claimed against RDSA.
According to our legal advisors, Edenor’s right to collect the receivable is highly solid and should be resulted in a favorable decision not only in the BCBA’s arbitration but also in the arbitration that would possibly start against the insurance company in case the payment of the above-mentioned surety bond is not settled.
However, taking into consideration that RDSA filed a bankruptcy petition on February 1, 2019, and that on February 28, 2019, the National Superintendence of Insurance published Res. No. 207/19 in the BO prohibiting the insurance company, issuer of the surety bond, from executing new agreements and keeping the general restraint on the alienation of property until the regularization of the deficit situation, Edenor has partially provisioned the receivable value weighting the possibility of recovery on account of RDSA’s and the insurance company’s situation. Consequently, the receivable balance disclosed as of December 31, 2018, net of provisions, amounts to AR$766 million.
Semiannual Remuneration Update
After filing repeated claims before the ENRE through the Association of Electric Power Transmission Companies of the Argentine Republic (‘ATEERA’), on November 16, 2018, the ENRE issued Res. No. 280/2018 and 281/2018, which adjusted Transener and Transba’s remunerations by 14.75% and 16%, respectively, for the December 2017 – June 2018 six-month period, retroactively as of August 1, 2018. Since CAMMESA did not assessed interests corresponding to the months of August and September 2018, Transener and Transba filed a claim before the ENRE and CAMMESA in order to settle the corresponding interests.
As of the publication of this Earnings Release, the ENRE has still not issued the resolutions corresponding to the semiannual remuneration update for Transener and Transba, which, according to the RTI, should have been applied since February 1, 2019. Based on actual data and estimates, the calculation of Transener and Transba’s updates would amount to 25.5% and 27%, respectively (both including a 0.14% X Factor adjustment stimulating efficiency), accumulated for the June 2018 – December 2018 period. Transener is currently conducting the applicable procedures to regularize this situation.
|
Pampa Energía ● Q4 18 Earning Release ● 9 |
Distribution of Cash Dividends
Pursuant to the delegation of powers granted by Transener’s Ordinary Meeting of Shareholders, held on April 12, 2018, Transener’s Board of Directors resolved on December 12, 2018 to release the amount of AR$1,489.4 million from the reserve account for future dividends and to distribute such amount as cash dividends for the fiscal year ended on December 31, 2017.
Declared dividends were paid on December 26, 2018.
On March 6, 2019, Pampa agreed to sell the Dock Sud storage facility to Raízen Argentina, a licensee of the Shell brand, for US$20 million plus US$1.4 million of inventory stock and adjustments.
Moreover, on November 27, 2018, after meeting of all precedent conditions, the closing of the sale of 21% of the capital stock of OldelVal took place. The transaction price amounted to US$36.4 million, and was fully paid by ExxonMobil on the transaction’s closing date.
1.7 Repurchase of Own Financial Securities
Pampa Energía
On November 28, 2018, the Argentine Public Registry of Organizations registered Pampa’s capital stock reduction, approving the cancellation of 182,820,250 Pampa’s ordinary shares in treasury, previously approved by Pampa’s General Meeting of Shareholders held on October 2, 2018. Regarding the remaining repurchased shares, the Company will submit for its shareholder’s approval for their cancellation in the next Ordinary and Extraordinary General Meeting of Shareholders.
As of today, Pampa’s total issued capital stock amounts to 1,899.9 million ordinary shares, of which 20.1 million are shares in treasury. Therefore, total outstanding shares amount to 1,879.8 million, equivalent to 75.2 million ADRs.
|
Pampa Energía ● Q4 18 Earning Release ● 10 |
Edenor
Since Edenor’s first share repurchase program ended on July 11, 2018, on December 4, 2018 Edenor’s Board of Directors approved a second program, under the following terms and conditions:
|
|
Edenor | |
|
|
Repurchase Program I |
Repurchase Program II |
|
Maximum amount for repurchase |
US$40 million |
AR$800 million |
|
Maximum price |
AR$60/ordinary share or US$55/ADR |
US$1,5/ordinary share or US$30/ADR |
|
Period in force |
120 days since May 11, 2018 |
120 days since Dec 6, 2018 |
|
Repurchases to date |
645,891 ADRs @ US$43.93/ADR |
412,176 ADRs @ US$26.99/ADR |
|
Progress |
100% - Complete |
53% - In process |
Note: Repurchases are deemed to be effected transactions.
As of the date hereof, Edenor repurchased a total of 21.2 million ordinary shares or 1.1 million ADRs, with a total disbursement of US$39.5 million.
Moreover, Edenor’s total issued capital stock amounts to 906.5 million ordinary shares, of which 29 million9 are shares in treasury. Therefore, total outstanding shares amount to 877.5 million, equivalent to 43.9 million ADRs.
TGS
On March 5, 2019, the term for TGS’s share repurchase program expired, being the last transaction made on December 26, 2018. As of the date hereof, TGS’ total issued capital stock amounts to 794.5 million ordinary shares, of which 13.6 million shares are in treasury, equivalent to 2.7 million ADRs. The total disbursement amounted to US$40 million.
Consequently, as of the date hereof, TGS’s total outstanding shares amounts to 780.9 million, equivalent to 156.2 million ADRs.
|
|
TGS | |
|
|
Repurchase Program I |
Repurchase Program II |
|
Maximum amount for repurchase |
AR$1.7 billion |
Increased to AR$1.8 billion |
|
Maximum price |
AR$95/ordinary share or US$20/ADR |
Increased to AR$130/ordinary share or US$17/ADR |
|
Period in force |
120 days since May 10, 2018 |
180 days since September 7, 2018 |
|
Repurchases to date |
2,103,082 ADRs @ US$15.19/ADR |
617,074 ADRs @ US$13.63/ADR |
|
Progress |
100% - Complete | |
Note: Repurchases are deemed to be effected transactions.
Appointment of CEO and CFO
In its meeting held on December 14, 2018, Pampa’s Board of Directors appointed Gustavo Mariani as the Chief Executive Officer (‘CEO’) and Gabriel Cohen as the Chief Financial Officer (‘CFO’). Marcelo Mindlin continues to serve as the Chairman of Pampa’s Board of Directors.
9 Including 7.8 million ordinary shares repurchased under a 2008 program, net of shares granted to Edenor’s key personnel under the Compensation Plan.
|
Pampa Energía ● Q4 18 Earning Release ● 11 |
Corporate Governance Plus Panel (‘+GC Panel’)
Pampa is one of the three founding companies of the special stock quote panel called +GC Panel, launched by the Buenos Aires Stock Exchange (‘ByMA’) on December 18, 2018. The +GC Panel has no precedents in Argentina, and includes companies with one vote per share already listed at ByMA, that complies with the best corporate governance and transparency practices even beyond the regulatory required level. These practices, whose compliance is periodically controlled, are aligned with the Corporate Governance principles of the Organization for Economic Co-operation and Development (‘OECD’) and adopted by the G20.
Moreover, the Company joined the first sustainability stock index (non-traded), which selected, based on methodology sponsored by the Inter-American Development Bank (‘IADB’), 15 listed companies with the best performance in terms of environmental, social and corporate governance aspects. Pampa also participates in the Bloomberg’s global gender-equality index (non-traded), in which Pampa is the only Argentine company and one of the 4 selected companies in the energy sector.
1.9 IFRS: Restatement of Financial Information
On December 4, 2018, Law No. 27,468 was published in the BO, repealing PEN Executive Order No. 664/2003, which prohibited the presentation of restated FS in constant currency before the Argentine National Securities and Exchange Commission (‘CNV’). On December 26, 2018, the CNV issued General Res. No. 777/2018, which establishes the standards applicable to the restatement of FS, compliance with which is mandatory for annual FS or FS for special or interim periods closing as from and including December 31, 2018.
Consequently, Pampa’s FS as of December 31, 2018 are disclosed in constant currency as of the closing of the fiscal year 2018, including the comparative figures of the previous fiscal year, in accordance with the IAS 29 regarding the financial information in hyperinflationary economy and the above-mentioned Resolution.
In respect of this Earnings Release, for the convenience of the reader, the quarterly financial information is disclosed and explained in nominal terms, while the annual figures are disclosed both in nominal and adjusted-by-inflation terms when explicitly indicated throughout this document.
|
Pampa Energía ● Q4 18 Earning Release ● 12 |
2. Financial Highlights
2.1 Consolidated Balance Sheet
|
In AR$ million, as reported under IFRS |
As of 12.31.18 |
As of 12.31.17 |
|
ASSETS |
||
|
Property, plant and equipment |
125,005 |
111,571 |
|
Intangible assets |
6,080 |
6,354 |
|
Deferred tax credits |
80 |
1,928 |
|
Participation in joint businesses and associates |
15,333 |
11,875 |
|
Financial assets at fair value with changing results |
422 |
286 |
|
Other assets |
33 |
9 |
|
Trade receivable and other credits |
9,521 |
7,444 |
|
Total non-current assets |
156,474 |
139,467 |
|
Inventories |
5,169 |
4,266 |
|
Investments at amortized cost |
1,330 |
37 |
|
Financial assets at fair value with changing results |
15,273 |
21,576 |
|
Financial derivatives |
3 |
6 |
|
Trade receivable and other credits |
26,489 |
28,267 |
|
Cash and cash equivalents |
9,097 |
1,179 |
|
Total current assets |
57,361 |
55,331 |
|
Assets classified as held for sale |
- |
18,457 |
|
Total assets |
213,835 |
213,255 |
|
EQUITY |
||
|
Share capital |
1,874 |
2,080 |
|
Adjustment to share capital |
9,826 |
10,906 |
|
Share premium |
18,499 |
18,496 |
|
Repurchased shares |
25 |
2 |
|
Cost of repurchased shares |
(1,490) |
(126) |
|
Adjustment to share capital in treasury |
134 |
13 |
|
Statutory reserve |
904 |
733 |
|
Voluntary reserve |
7,355 |
12,554 |
|
Other reserves |
(483) |
367 |
|
Retained earnings |
15,193 |
11,806 |
|
Other comprehensive result |
(314) |
(353) |
|
Equity attributable to owners of the parent |
51,523 |
56,478 |
|
Non-controlling interests |
16,160 |
17,792 |
|
Total equity |
67,683 |
74,270 |
|
LIABILITIES |
||
|
Investments in joint ventures and associates |
153 |
- |
|
Provisions |
5,499 |
6,549 |
|
Income tax and minimum expected profit tax liability |
1,034 |
1,274 |
|
Deferred revenues |
275 |
287 |
|
Tax payable |
542 |
540 |
|
Deferred tax liabilities |
15,354 |
16,686 |
|
Defined benefit plan obligations |
1,175 |
1,464 |
|
Salaries and social security payable |
163 |
177 |
|
Borrowings |
69,189 |
54,816 |
|
Accounts payable and other liabilities |
8,162 |
9,457 |
|
Total non-current liabilities |
101,546 |
91,250 |
|
Provisions |
871 |
1,179 |
|
Deferred income |
5 |
5 |
|
Income tax and minimum expected profit tax liability |
1,084 |
1,392 |
|
Tax payable |
2,052 |
2,901 |
|
Defined benefit plan obligations |
162 |
179 |
|
Salaries and social security payable |
2,726 |
3,180 |
|
Financial derivatives |
49 |
122 |
|
Borrowings |
12,901 |
8,623 |
|
Accounts payable and other liabilities |
24,756 |
26,655 |
|
Total current liabilities |
44,606 |
44,236 |
|
Liabilities associated to assets classified as held for sale |
- |
3,499 |
|
Total liabilities |
146,152 |
138,985 |
|
Total liabilities and equity |
213,835 |
213,255 |
|
Pampa Energía ● Q4 18 Earning Release ● 13 |
2.2 Consolidated Income Statement
|
|
Fiscal Year |
Fourth Quarter | ||||
|
|
As Reported Under IFRS |
In Nominal Terms |
In Nominal Terms | |||
|
In AR$ million |
2018 |
2017 |
2018 |
2017 |
2018 |
2017 |
|
Sales revenue |
110,080 |
82,008 |
90,312 |
50,347 |
24,284 |
14,131 |
|
Cost of sales |
(74,161) |
(59,339) |
(57,038) |
(34,427) |
(16,345) |
(9,771) |
|
Gross profit |
35,919 |
22,669 |
33,274 |
15,920 |
7,939 |
4,360 |
|
Selling expenses |
(6,451) |
(4,776) |
(5,353) |
(2,904) |
(1,907) |
(848) |
|
Administrative expenses |
(7,751) |
(7,481) |
(5,900) |
(4,555) |
(1,786) |
(1,338) |
|
Exploration expenses |
(45) |
(71) |
(41) |
(44) |
(31) |
(7) |
|
Other operating income |
6,842 |
5,608 |
5,206 |
3,388 |
826 |
787 |
|
Other operating expenses |
(7,526) |
(3,892) |
(5,927) |
(2,346) |
(1,631) |
(635) |
|
Property, plant and equipment impairment |
(1,195) |
- |
(640) |
- |
(640) |
- |
|
Reversal of property, plant, equipment impairment and intangible assets |
- |
- |
- |
543 |
- |
543 |
|
Results for participation in joint businesses and associates |
4,464 |
1,813 |
4,304 |
1,108 |
3,779 |
243 |
|
Results from sale of equity share in companies |
1,052 |
- |
1,132 |
- |
1,132 |
- |
|
Operating income |
25,309 |
13,870 |
26,055 |
11,110 |
7,681 |
3,105 |
|
RECPAM - Results from net monetary position |
23,696 |
11,478 |
- |
- |
- |
- |
|
Financial income |
3,751 |
2,333 |
3,215 |
1,432 |
1,380 |
417 |
|
Financial costs |
(11,944) |
(8,750) |
(9,309) |
(5,361) |
(3,492) |
(1,506) |
|
Other financial results |
(32,365) |
(3,774) |
(26,150) |
(2,435) |
2,157 |
(1,164) |
|
Financial results, net |
(16,862) |
1,287 |
(32,244) |
(6,364) |
45 |
(2,253) |
|
Profit before tax |
8,447 |
15,157 |
(6,189) |
4,746 |
7,726 |
852 |
|
Income tax |
(658) |
985 |
3,201 |
1,178 |
(2,320) |
1,390 |
|
Net income for continuing operations |
7,789 |
16,142 |
(2,988) |
5,924 |
5,406 |
2,242 |
|
Net income from discontinued operations |
3,019 |
(1,893) |
3,053 |
(254) |
7 |
(542) |
|
Net income for the period |
10,808 |
14,249 |
65 |
5,670 |
5,413 |
1,700 |
|
Attributable to: |
||||||
|
Owners of the Company |
8,435 |
10,799 |
(399) |
4,606 |
6,384 |
1,512 |
|
Continuing operations |
5,506 |
12,867 |
(3,389) |
4,971 |
6,377 |
2,147 |
|
Discontinued operations |
2,929 |
(2,068) |
2,990 |
(365) |
7 |
(635) |
|
Non-controlling interests |
2,373 |
3,450 |
464 |
1,064 |
(971) |
188 |
|
Net income per share attributable to the owners of the Company |
4.3058 |
5.5780 |
(0.2037) |
2.3792 |
3.4066 |
0.7800 |
|
Basic and diluted income per share of continuing operations |
2.8106 |
6.6462 |
(1.7300) |
2.5677 |
3.4029 |
1.1076 |
|
Basic and diluted income per share of discontinued operations |
1.4952 |
(1.0682) |
1.5263 |
(0.1885) |
0.0037 |
(0.3276) |
|
|
|
|
|
|
|
|
|
Pampa Energía ● Q4 18 Earning Release ● 14 |
2.3 Cash and Financial Borrowings
|
As of December 31, 2018, |
Cash(1) |
|
Financial Debt | ||
|
Consolidated |
Ownership Adjusted |
|
Consolidated |
Ownership Adjusted | |
|
Power generation(2) |
1,749 |
1,108 |
22,467 |
22,467 | |
|
Electricity distribution |
4,618 |
2,390 |
8,270 |
4,281 | |
|
Refining & distribution |
3 |
3 |
- |
- | |
|
Petrochemicals |
- |
- |
- |
- | |
|
Holding and others |
8,839 |
8,839 |
- |
- | |
|
Oil and gas |
10,491 |
10,486 |
46,707 |
46,707 | |
|
Total |
25,700 |
22,826 |
|
77,444 |
73,455 |
Note: (1) It includes cash and cash equivalents, financial assets at fair value with changing results and investments at amortized cost.
(2) It does not include regulatory liability held against CAMMESA for AR$4,646 million.
2.3.1 Summary of Listed Debt Securities
|
Company |
Security |
Maturity |
Amount Issued |
Amount Outstanding |
Coupon |
|
In US$ |
|
|
|
|
|
|
Transener1 |
ON Series 2 |
2021 |
101 |
99 |
9.75% |
|
Edenor |
ON par at fixed rate |
2022 |
300 |
176 |
9.75% |
|
TGS1 |
ON at discount at fixed rate |
2025 |
500 |
500 |
6.75% |
|
Pampa Energía |
ON Series 4 US$-Link2,3 |
2020 |
34 |
34 |
6.25% |
|
ON Series T at discount & fixed rate |
2023 |
500 |
500 |
7.375% | |
|
ON Series I at discount & fixed rate |
2027 |
750 |
741 |
7.5% | |
|
In AR$ |
|
|
|
|
|
|
Pampa Energía |
ON Series E3 |
2020 |
575 |
575 |
Badlar Privada |
Note: (1) Affiliates are not consolidated in Pampa’s FS, according to the IFRS standards. (2) CB dollar-link, with initial FX rate of AR$8.4917/US$. (3) Debt securities issued by CTLL, a power generation subsidiary merged by absorption to Pampa Energía.
During November and December 2018 pre-export financing facilities were redeemed for a total amount of US$38 million. Moreover, maturing in the short-term, pre-export facilities were renewed in bank loans for a total amount of US$20 million, and bank loans for another US$16 million were executed.
After the closing of the fiscal year 2018, Pampa redeemed at maturity for a total amount of US$24 million, net of refinancing, pre-cancelled before maturity a total amount of US$105 million, and refinanced a total of US$36 million with financial entities, under short-term maturities.
As of December 31, 2018, the consolidated average interest rate bearing US$ loans was 7%, currency in which 99% of gross debt is denominated and mostly at fixed rate. The average life of Pampa’s consolidated financial debt amounted to 5 years. The following chart shows the debt profile for the Pampa Corporate Group10 (in US$ million):
10 It does not include interests, it considers Pampa stand-alone and Edenor at 100%, and the affiliates TGS, Transener, Greenwind and Refinor at our equity participation.
|
Pampa Energía ● Q4 18 Earning Release ● 15 |
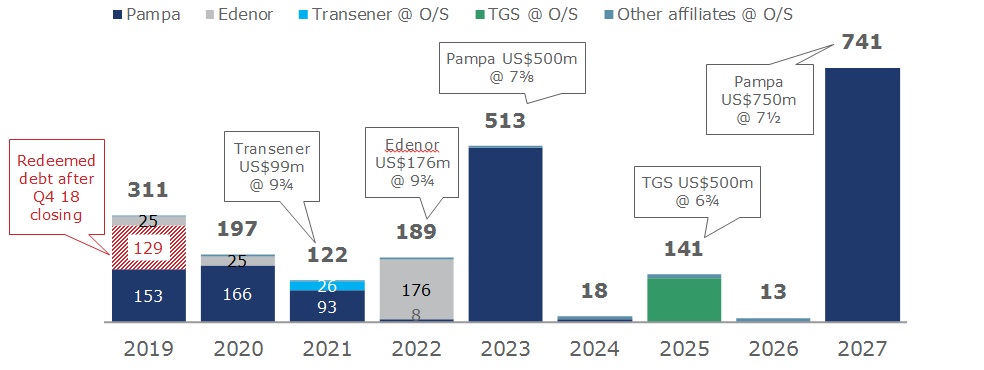
Moreover, as of the quarter’s closing Pampa held in treasury Series I Corporate Bond (‘CB’) maturing in 2027 for a face value of US$9 million, repurchased between August and September 2018 at an average clean price of US$79.2 per face value of US$100.
2.3.3 Pampa Corporate Group’s CBs Ratings
In November 2018, and as a result of the downgrade in the global rating of Argentina’s sovereign debt from ‘B+’ to ‘B’ and in its local rating from ‘raAA’ to ‘raAA-’, S&P also downgraded Pampa, TGS and Transener’s global rating from ‘B+’ to ‘B’ with a negative to stable outlook. S&P also discontinued local ratings for TGS and downgraded Transener’s local rating from ‘raAA’ to ‘raAA-’ with a negative to stable outlook. It should be highlighted that the credit rating agency Moody’s has kept Pampa, Edenor and TGS’ ratings unchanged since the end of December 2017.
The following table shows the Pampa Group’s CBs ratings:
|
Company |
Agency |
Ratings | |
|
Global |
Local | ||
|
Pampa |
S&P |
B |
na |
|
Moody's |
B2 |
na | |
|
FitchRatings |
B |
AA- | |
|
Edenor |
S&P |
B |
raA |
|
Moody's |
B1 |
Aa3.ar | |
|
TGS |
S&P |
B |
na |
|
Moody's |
B1 |
Aa2.ar | |
|
Transener |
S&P |
B |
raAA- |
|
Pampa Energía ● Q4 18 Earning Release ● 16 |
3. Analysis in Nominal Terms of the Q4 18 Results
Consolidated net revenues of AR$24,284 million, 72% higher than the AR$14,131 million for Q4 17, explained by increases of 191% in power generation, 59% in electricity distribution, 60% in oil and gas, 68% in petrochemicals and 270% in holding and others, partially offset by higher eliminations from to intersegment sales of AR$1,789 million.
ð Power Generation of 3,325 GWh from 12 power plants
ð Electricity sales of 4,652 GWh to 3 million end-users
ð Production of 42.5 thousand barrels per day of hydrocarbons
ð Sales of 88 thousand tons of petrochemical products
Consolidated adjusted EBITDA for continuing operations of AR$6,843 million, compared to AR$3,661 million for Q4 17, mainly due to increases of 178% in power generation, 39% in oil and gas, AR$177 million in petrochemicals, AR$888 million in holding and others, and lower intersegment eliminations of AR$23 million, partially offset by losses of AR$653 million in electricity distribution and decreases of AR$35 million in refining and distribution.
Consolidated gain attributable to the owners of the Company of AR$6,384 million, higher than the AR$1,512 million gain recorded in Q4 17, mainly explained by the accrual of AR$5,377 million gain due to 9% AR$ appreciation against US$, currency in which most of the Company’s financial liabilities are denominated, but as the quarterly analysis is in nominal AR$, the inflation effect is not reflected.
|
Consolidated Adjusted EBITDA Calculation, in AR$ million nominal terms |
FY18 |
FY17 |
Q4 18 |
Q4 17 |
|
Consolidated operating income |
26,055 |
11,110 |
7,681 |
3,105 |
|
Consolidated depreciations and amortizations |
3,604 |
3,421 |
934 |
867 |
|
Consolidated EBITDA under IFRS standards |
29,659 |
14,531 |
8,615 |
3,972 |
|
Adjustments from generation segment |
1,234 |
(131) |
140 |
44 |
|
Deletion of property, plant and equipment impairment |
42 |
- |
42 |
- |
|
Deletion of equity income from Greenwind |
789 |
50 |
(216) |
46 |
|
Greenwind's EBITDA adjusted by ownership |
237 |
(5) |
105 |
(2) |
|
Provision of PEPE IV surety bond |
473 |
- |
473 |
- |
|
Other adjustments |
(308) |
(176) |
(265) |
0 |
|
Adjustments from distribution segment |
1,019 |
(1,563) |
788 |
(770) |
|
Deletion of property, plant and equipment impairment |
- |
(543) |
- |
(543) |
|
Retroactive adjustments to extraordinary penalties from the RTI |
795 |
(1,127) |
723 |
(255) |
|
Late payment interests |
224 |
107 |
65 |
28 |
|
Adjustments from oil and gas segment |
(2,807) |
(4) |
(2,296) |
(65) |
|
Deletion of equity income from OldelVal and other affiliates |
(1,442) |
(44) |
(1,315) |
(16) |
|
Deletion of results from sale of OldelVal |
(1,132) |
- |
(1,132) |
- |
|
OldelVal's EBITDA adjusted by ownership |
252 |
103 |
86 |
32 |
|
Deletion of net gain from settlement agreement for subsidiary in Ecuador |
(806) |
- |
- |
- |
|
Other adjustments |
58 |
27 |
171 |
0 |
|
Adjustments from refining and distribution segment |
66 |
80 |
(67) |
62 |
|
Deletion of equity income from Refinor |
49 |
- |
(32) |
17 |
|
Refinor's EBITDA adjusted by ownership |
17 |
80 |
(35) |
45 |
|
Adjustments from petrochemicals segment |
591 |
(19) |
604 |
(19) |
|
Deletion of property, plant and equipment impairment |
598 |
- |
598 |
- |
|
Contingencies and deletion of gained penalties |
(7) |
(19) |
6 |
(19) |
|
Adjustments from holding and others segment |
1,205 |
1,049 |
(941) |
438 |
|
Deletion of equity income from Transener and TGS |
(3,700) |
(1,114) |
(2,216) |
(290) |
|
TGS's EBITDA adjusted by ownership |
3,600 |
1,294 |
925 |
401 |
|
Transener's EBITDA adjusted by ownership |
1,305 |
997 |
350 |
327 |
|
Other adjustments |
- |
(128) |
- |
(0) |
|
Consolidated adjusted EBITDA for continuing operations |
30,967 |
13,943 |
6,843 |
3,661 |
|
Consolidated adjusted EBITDA for continuing and discontinued operations |
32,224 |
17,000 |
6,850 |
4,662 |
|
Pampa Energía ● Q4 18 Earning Release ● 17 |
3.1 Analysis of the Power Generation Segment
|
Power Generation Segment, Consolidated |
Fiscal Year |
Fourth Quarter | |||||||
|
As Reported Under IFRS |
In Nominal Terms |
In Nominal Terms | |||||||
|
2018 |
2017 |
∆ % |
2018 |
2017 |
∆ % |
2018 |
2017 |
∆ % | |
|
Sales revenue |
22,825 |
13,311 |
+71% |
19,233 |
8,210 |
+134% |
7,067 |
2,428 |
+191% |
|
Cost of sales |
(10,274) |
(7,335) |
+40% |
(7,538) |
(3,971) |
+90% |
(3,346) |
(1,232) |
+172% |
|
Gross profit |
12,551 |
5,976 |
+110% |
11,695 |
4,239 |
+176% |
3,721 |
1,196 |
+211% |
|
Selling expenses |
(54) |
(161) |
-66% |
(37) |
(94) |
-61% |
(3) |
(31) |
-90% |
|
Administrative expenses |
(1,535) |
(1,189) |
+29% |
(1,213) |
(717) |
+69% |
(507) |
(195) |
+160% |
|
Other operating income |
405 |
725 |
-44% |
379 |
420 |
-10% |
269 |
46 |
NA |
|
Other operating expenses |
(640) |
(357) |
+79% |
(608) |
(210) |
+190% |
(496) |
(19) |
NA |
|
Property, plant and equipment impairment |
(7) |
- |
NA |
(42) |
- |
NA |
(42) |
- |
NA |
|
Results for participation in joint businesses |
(414) |
(73) |
NA |
(789) |
(50) |
NA |
216 |
(46) |
NA |
|
Operating income |
10,306 |
4,921 |
+109% |
9,385 |
3,588 |
+162% |
3,158 |
951 |
+232% |
|
RECPAM - Results from net monetary position |
8,789 |
654 |
NA |
- |
- |
NA |
- |
- |
NA |
|
Financial income |
1,949 |
1,453 |
+34% |
1,650 |
893 |
+85% |
645 |
268 |
+141% |
|
Financial costs |
(3,218) |
(2,618) |
+23% |
(2,710) |
(1,596) |
+70% |
(986) |
(425) |
+132% |
|
Other financial results |
(13,772) |
(1,265) |
NA |
(11,203) |
(817) |
NA |
684 |
(398) |
NA |
|
Profit before tax |
4,054 |
3,145 |
+29% |
(2,878) |
2,068 |
NA |
3,501 |
396 |
NA |
|
Income tax |
(107) |
(137) |
-22% |
498 |
(230) |
NA |
(1,029) |
(269) |
+283% |
|
Net income for the period |
3,947 |
3,008 |
+31% |
(2,380) |
1,838 |
NA |
2,472 |
127 |
NA |
|
Attributable to: |
|||||||||
|
Owners of the Company |
3,734 |
2,841 |
+31% |
(2,830) |
1,630 |
NA |
2,365 |
41 |
NA |
|
Non-controlling interests |
213 |
167 |
+28% |
450 |
208 |
+116% |
107 |
86 |
+24% |
|
Adjusted EBITDA |
13,617 |
6,703 |
+103% |
11,620 |
4,302 |
+170% |
3,546 |
1,274 |
+178% |
|
Increases in prop., plant, equipment and intangible assets |
8,911 |
10,380 |
-14% |
7,759 |
6,277 |
+24% |
3,237 |
1,549 |
+109% |
|
Depreciation and amortization |
2,488 |
2,029 |
+23% |
1,001 |
845 |
+18% |
248 |
279 |
-11% |
In Q4 18, gross margin at power generation recorded AR$3,721 million, 211% higher than the same period in 2017, mainly due to the 111% devaluation in the average nominal exchange rate, with impact on our US$-nominated sales, not only on our new energy’s PPAs (Energía Plus, SE Res. No. 220/2007, MEyM Res. No. 21/2017 and RenovAr) but also on our legacy energy’s remuneration pursuant to SEE Res. No. 19/2017. Moreover, the increase in gross margin is explained by new units in force, Ingeniero White thermal power plant (‘CTIW’), commissioned in December 2017, and Mario Cebreiro wind farm (‘PEMC’) in June 2018, and to a lesser extent, the update in legacy energy remuneration scheme, by which the remuneration is US$-nominated discriminated by technology and generation scale. Between May and October 2017 with DIGO, it was accrued base remuneration followed by an increase to full remuneration scheme as from November 2017. During the entire Q4 18 legacy capacity was billed under the full remuneration, where thermal units’ real availability was tested each month against its DIGO. Additionally, since the second week of November 2018, Pampa opted to make use of the fuel self-procurement capacity for its thermal generation units, and therefore, higher revenues were recorded due to the recognition of gas cost pass-through in the CVP, but also higher costs due to the purchase of such gas.
In operating terms, Pampa’s power generation during Q4 18 increased by 23% compared to Q4 17, mainly due to the technical problem in one of the combined cycle’s gas turbine by the end of September 2017 at Genelba thermal power plant (‘CTGEBA’), which was restored in January 2018 (+628 GWh), in addition to the major programmed maintenance service in the TV01 steam turbine at Loma de la Lata thermal power plant (‘CTLL’)’s combined cycle between October and November 2017, increasing the capacity for 15 additional MW as of January 2018 (+282 GWh). Additionally, the higher generation during the Q4 18 was due to the commissioning of CTIW and PEMC power plants (+149 GWh). These variations were partially offset by lower dispatch at Güemes thermal power plant (‘CTG’), Parque Pilar thermal power plant (‘CTPP’) and Piquirenda thermal power plant (‘CTP’) (-193 GWh), in addition to lower water input with impact on our hydroelectric units (-242 GWh).
|
Pampa Energía ● Q4 18 Earning Release ● 18 |
|
Summary of |
Hydroelectric |
Wind |
Thermal |
Total | |||||||||
|
HINISA |
HIDISA |
HPPL |
PEMC |
CTLL |
CTG |
CTP |
CPB |
CTPP |
CTIW |
CTGEBA |
Eco- | ||
|
Installed Capacity (MW) |
265 |
388 |
285 |
100 |
765 |
361 |
30 |
620 |
100 |
100 |
843 |
14 |
3,871 |
|
New Capacity (MW) |
- |
- |
- |
100 |
364 |
100 |
30 |
- |
100 |
100 |
169 |
14 |
977 |
|
Market Share |
0.7% |
1.0% |
0.7% |
0.3% |
2.0% |
0.9% |
0.1% |
1.6% |
0.3% |
0.3% |
2.2% |
0.04% |
10.0% |
|
Fiscal Year |
|
|
|
|
|
|
|
|
|
|
|
|
|
|
Net Generation 2018 (GWh) |
577 |
393 |
886 |
247 |
4,748 |
1,674 |
134 |
753 |
192 |
274 |
4,859 |
108 |
14,845 |
|
Market Share |
0.4% |
0.3% |
0.6% |
0.2% |
3.5% |
1.2% |
0.1% |
0.5% |
0.1% |
0.2% |
3.5% |
0.1% |
10.8% |
|
Sales 2018 (GWh) |
577 |
393 |
886 |
247 |
4,748 |
2,227 |
134 |
753 |
192 |
274 |
5,457 |
110 |
15,999 |
|
Net Generation 2017 (GWh) |
751 |
480 |
760 |
- |
3,864 |
1,772 |
156 |
1,453 |
142 |
23 |
4,685 |
100 |
14,186 |
|
Variation 2018 vs. 2017 |
-23% |
-18% |
+17% |
na |
+23% |
-6% |
-14% |
-48% |
+35% |
na |
+4% |
+8% |
+5% |
|
Sales 2017 (GWh) |
751 |
480 |
760 |
- |
3,864 |
2,358 |
156 |
1,453 |
142 |
23 |
5,424 |
103 |
15,514 |
|
Avg. Price 2018 (US$/MWh) |
31 |
46 |
22 |
80 |
43 |
35 |
59 |
88 |
195 |
107 |
36 |
57 |
44 |
|
Avg. Price 2017 (US$/MWh) |
24 |
33 |
22 |
na |
38 |
32 |
52 |
32 |
98 |
42 |
27 |
69 |
32 |
|
Avg. Gross Margin 2018 (US$/MWh) |
20 |
32 |
15 |
71 |
37 |
20 |
na |
46 |
164 |
85 |
18 |
15 |
29 |
|
Avg. Gross Margin 2018 (US$/MWh) |
11 |
16 |
12 |
na |
34 |
14 |
na |
12 |
82 |
33 |
15 |
21 |
20 |
|
Fourth Quarter |
|
|
|
|
|
|
|
|
|
|
|
|
|
|
Net Generation Q4 18 (GWh) |
182 |
131 |
186 |
99 |
900 |
243 |
14 |
161 |
23 |
72 |
1,290 |
25 |
3,325 |
|
Market Share |
0.6% |
0.4% |
0.6% |
0.3% |
2.8% |
0.8% |
0.0% |
0.5% |
0.1% |
0.2% |
4.1% |
0.1% |
10.5% |
|
Sales Q4 18 (GWh) |
182 |
131 |
186 |
99 |
900 |
348 |
14 |
161 |
23 |
72 |
1,403 |
25 |
3,543 |
|
Net Generation Q4 17 (GWh) |
275 |
148 |
317 |
- |
617 |
362 |
33 |
151 |
79 |
23 |
661 |
28 |
2,693 |
|
Variation Q4 18 vs. Q4 17 |
-34% |
-12% |
-41% |
na |
+46% |
-33% |
-57% |
+6% |
-71% |
+222% |
+95% |
-8% |
+23% |
|
Sales Q4 17 (GWh) |
275 |
148 |
317 |
- |
617 |
510 |
33 |
151 |
79 |
23 |
846 |
28 |
3,026 |
|
Avg. Price Q4 18 (US$/MWh) |
23 |
35 |
24 |
66 |
66 |
44 |
125 |
123 |
397 |
111 |
44 |
40 |
55 |
|
Avg. Price Q4 17 (US$/MWh) |
20 |
32 |
17 |
na |
62 |
39 |
60 |
80 |
123 |
40 |
44 |
68 |
45 |
|
Avg. Gross Margin Q4 18 (US$/MWh) |
14 |
23 |
16 |
57 |
45 |
23 |
na |
53 |
307 |
87 |
18 |
3 |
31 |
|
Avg. Gross Margin Q4 17 (US$/MWh) |
9 |
16 |
na |
na |
56 |
16 |
na |
30 |
104 |
31 |
na |
na |
28 |
|
|
|
|
|
|
|
|
|
|
|
|
|
|
|
Note: Gross margin before amortization and depreciation. FX rate of AR$/US$: 2018 – 28.13; 2017 – 16.57; Q4 18 – 37.11; Q4 17 – 17.56.
Net operating costs increased by 185% compared to Q4 17, mainly due to higher costs of energy and gas purchases and transportation to cover Plus contracts and to the fuel self-procurement, in addition to higher labor, operational and maintenance costs due to new capacity additions at CTIW and PEMC.
The Q4 18 registered a positive variation in financial results of AR$898 million, amounting to a net gain of AR$343 million, mainly due to the appreciation of the AR$ in relation to the US$ during the Q4 18, currency in which most of the financial liabilities allocated to the segment are denominated, while in Q4 17 there was a devaluation of the AR$ related to the US$; in addition to commercial interests charged to CAMMESA due to late payment. Those effects were partially offset by higher losses due to the impairment of CAMMESA credits and higher interests on loan agreements with CAMMESA and financial borrowings.
Adjusted EBITDA increased by 178% over Q4 17, to a gain of AR$3,546 million, mainly due to the AR$ devaluation on our sales denominated in US$, the new PPAs commissioning at CTIW and PEMC, the better remuneration for legacy energy in US$ and the recognition of the fuel self-procurement, partially offset by higher costs of energy and gas purchase and transportation, labor and operational and maintenance of the increasing number of units. The adjusted EBITDA considers the proportional EBITDA of PEMC (Greenwind), in which Pampa holds a direct participation of 50%, for a gain of AR$105 million in Q4 18. Moreover, the adjusted EBITDA in Q4 18 excludes the recovery of insurances and expenses at CTG and CTGEBA in relation to the technical problem occurred in 2017 (AR$218 million), the provision for the contingency at Pampa Energía Wind Farm (‘PEPE’) IV (AR$473 million), which was registered due to the economic volatility and changes in applicable legislation that negatively impacted in the project, among other non-recurrent and non-cash items.
|
Pampa Energía ● Q4 18 Earning Release ● 19 |
The following table shows a summary of the committed expansion projects:
|
Project |
MW |
Equipment Provider |
Marketing |
Awarded Price |
|
Estimated Capex in |
Date of | |||
|
Capacity |
Variable |
Total |
|
Budget |
% Executed | |||||
|
Thermal |
|
|
|
|
|
|
|
|
|
|
|
Loma de la Lata |
15 |
MAN |
Res. SEE No. 19/17 |
7,000 |
7 |
17 |
20 |
85% |
Q3 2019 | |
|
105 |
GE |
US$ PPA for 10 years |
23,000 |
7.5 |
39 |
|
90 |
100% |
August 5, 2017 | |
|
Parque Ind. Pilar |
100 |
Wärtsilä |
US$ PPA for 10 years |
26,900 |
15 - 16 |
52 |
|
103 |
100% |
August 29, 2017 |
|
Ing. White |
100 |
Wärtsilä |
US$ PPA for 10 years |
21,800 |
12 - 15 |
42 - 45 |
|
92 |
100% |
December 22, 2017 |
|
Closing Genelba Plus |
383 |
Siemens |
US$ PPA for 15 years |
20,500 |
6 |
34 |
350 |
51% |
GT: Q2 2019 / | |
|
Renewable |
|
|
|
|
|
|
|
|
|
|
|
Mario Cebreiro2 |
100 |
Vestas |
US$ PPA for 20 years |
na |
na |
58(3) |
|
139 |
96% |
June 8, 2018 |
|
Pampa Energía II |
53 |
Vestas |
MAT ER |
na |
na |
na |
|
64 |
74% |
Q2 2019 |
|
Pampa Energía III |
53 |
Vestas |
MAT ER |
na |
na |
na |
73 |
66% |
Q2 2019 | |
|
Total |
909 |
|
|
|
|
|
|
931 |
76% |
|
Note: (1) Amounts without VAT. (2) Pampa holds 50% of stake. (3) Awarded price does not consider incentive and adjustment factors.
3.2 Analysis of the Electricity Distribution Segment
|
Electricity Distribution Segment, Consolidated |
Fiscal Year |
Fourth Quarter | |||||||
|
As Reported Under IFRS |
In Nominal Terms |
In Nominal Terms | |||||||
|
2018 |
2017 |
∆ % |
2018 |
2017 |
∆ % |
2018 |
2017 |
∆ % | |
|
Sales revenue |
55,954 |
39,603 |
+41% |
45,454 |
24,339 |
+87% |
10,727 |
6,763 |
+59% |
|
Cost of sales |
(42,839) |
(30,117) |
+42% |
(33,899) |
(17,667) |
+92% |
(9,255) |
(4,947) |
+87% |
|
Gross profit |
13,115 |
9,486 |
+38% |
11,555 |
6,672 |
+73% |
1,472 |
1,816 |
-19% |
|
Selling expenses |
(5,033) |
(3,568) |
+41% |
(4,181) |
(2,079) |
+101% |
(1,572) |
(619) |
+154% |
|
Administrative expenses |
(2,872) |
(2,505) |
+15% |
(2,018) |
(1,444) |
+40% |
(615) |
(435) |
+41% |
|
Other operating income |
322 |
158 |
+104% |
247 |
97 |
+155% |
48 |
27 |
+78% |
|
Other operating expenses |
(1,648) |
(1,261) |
+31% |
(1,282) |
(758) |
+69% |
(411) |
(146) |
+182% |
|
Reversal of property, plant and equipment impairment |
- |
- |
NA |
- |
461 |
-100% |
- |
461 |
-100% |
|
Reversal of intangible assets |
- |
- |
NA |
- |
82 |
-100% |
- |
82 |
-100% |
|
Results for participation in joint businesses |
2 |
10 |
-80% |
- |
- |
NA |
- |
- |
NA |
|
Operating income |
3,886 |
2,320 |
+68% |
4,321 |
3,031 |
+43% |
(1,078) |
1,186 |
NA |
|
RECPAM - Results from net monetary position |
8,504 |
5,457 |
+56% |
- |
- |
NA |
- |
- |
NA |
|
Financial income |
672 |
441 |
+52% |
564 |
272 |
+107% |
206 |
90 |
+129% |
|
Financial costs |
(4,977) |
(2,607) |
+91% |
(3,454) |
(1,595) |
+117% |
(1,504) |
(443) |
+240% |
|
Other financial results |
(1,879) |
19 |
NA |
(1,536) |
(9) |
NA |
(819) |
(80) |
NA |
|
Profit before tax |
6,206 |
5,630 |
+10% |
(105) |
1,699 |
NA |
(3,195) |
753 |
NA |
|
Income tax |
(1,865) |
(449) |
NA |
20 |
(417) |
NA |
980 |
(161) |
NA |
|
Net income for the period |
4,341 |
5,181 |
-16% |
(85) |
1,282 |
NA |
(2,215) |
592 |
NA |
|
Attributable to: |
|||||||||
|
Owners of the Company |
2,273 |
2,719 |
-16% |
(35) |
951 |
NA |
(1,136) |
581 |
NA |
|
Non-controlling interests |
2,068 |
2,462 |
-16% |
(50) |
331 |
NA |
(1,079) |
11 |
NA |
|
Adjusted EBITDA |
7,619 |
2,809 |
+171% |
5,950 |
1,911 |
+211% |
(114) |
539 |
NA |
|
Increases in prop., plant, equipment and intangible assets |
8,550 |
8,483 |
+1% |
7,611 |
4,137 |
+84% |
3,219 |
1,264 |
+155% |
|
Depreciation and amortization |
2,611 |
2,198 |
+19% |
610 |
443 |
+38% |
176 |
123 |
+43% |
In Q4 18, net sales increased by AR$3,964 million compared to Q4 17, mainly due to the full implementation as from February 2018 of the accumulated 98% full tariff increase on Distribution Added Value (‘VAD’) calculated in the RTI, while in Q4 17 the first stage’s 42% tariff increase was implemented over VAD in October and the second stage’s additional 18% increase was implemented in November and December. The increase in net sales is also explained by the recognition of CPD variations, of which the first implementation of 11.6% over VAD was granted in December 2017 (retroactive to August 2017), and in Q4 18 an accumulated 35% increase in CPD was implemented since August 2017 (12% increase in February 2018 and a partial 8% increase in August 2018). Should the 6% increase in CPD had not been deferred in August 2018 to February 2019, the Q4 18 net sales would have been AR$410 million higher. Moreover, since February 2018, the 48 monthly installments are being invoiced due to the gradual implementation of the tariff increase during February 2017 and January 2018 (AR$353 million in Q4 18).
|
Pampa Energía ● Q4 18 Earning Release ● 20 |
The increase in net sales in Q4 18 was partially offset by 8% lower energy volume sales in comparison to Q4 17, mainly explained by lower consumption in the residential segment related to inferior temperatures in December 2018 compared to the same month in previous year and the impact of the tariff increase, in addition to lower demand from industries and SMEs in line with economic activity downturn. On the other hand, the number of Edenor’s clients increased by 3%, mainly due to regularization of residential clients as a result of the market disciplinary actions carried out, and regularization of clandestine connections, which included the installation of approximately 100 thousand energy integrated measuring units during the year 2018.
|
Edenor's Sales |
2018 |
2017 |
Variation | |||||
|
In GWh |
Part. % |
Clients |
In GWh |
Part. % |
Clients |
% GWh |
% Clients | |
|
Fiscal Year |
|
|
|
|
|
|
|
|
|
Residential1 |
8,948 |
42% |
2,677,554 |
9,143 |
42% |
2,579,705 |
-2% |
+4% |
|
Commercial |
3,478 |
16% |
354,799 |
3,595 |
17% |
362,607 |
-3% |
-2% |
|
Industrial |
3,646 |
17% |
6,857 |
3,687 |
17% |
6,866 |
-1% |
-0% |
|
Wheeling System |
3,823 |
18% |
699 |
3,966 |
18% |
704 |
-4% |
-1% |
|
Others |
||||||||
|
Public Lighting |
724 |
3% |
21 |
709 |
3% |
21 |
+2% |
- |
|
Shantytowns and Others |
553 |
3% |
456 |
483 |
2% |
426 |
+15% |
+7% |
|
|
|
|
|
|
|
|
|
|
|
Total |
21,172 |
100% |
3,040,386 |
21,582 |
100% |
2,950,329 |
-2% |
+3% |
|
Fourth Quarter |
|
|
|
|
|
|
|
|
|
Residential1 |
1,800 |
39% |
2,677,554 |
2,005 |
40% |
2,579,705 |
-10% |
+4% |
|
Commercial |
794 |
17% |
354,799 |
857 |
17% |
362,607 |
-7% |
-2% |
|
Industrial |
865 |
19% |
6,857 |
922 |
18% |
6,866 |
-6% |
-0% |
|
Wheeling System |
920 |
20% |
699 |
1,008 |
20% |
704 |
-9% |
-1% |
|
Others |
||||||||
|
Public Lighting |
159 |
3% |
21 |
158 |
3% |
21 |
+0% |
- |
|
Shantytowns and Others |
114 |
2% |
456 |
112 |
2% |
426 |
+3% |
+7% |
|
|
|
|
|
|
|
|
|
|
|
Total |
4,652 |
100% |
3,040,386 |
5,063 |
100% |
2,950,329 |
-8% |
+3% |
Note: (1) It includes 586,222 and 656,391 clients categorized under Social Tariff as of December 31, 2018 and 2017, respectively.
Energy purchases increased by 91% compared to Q4 17, due to increase in electricity prices charged to end-users as subsidies are being gradually removed, in addition to increase in electricity losses in terms of rate and cost (losses rate of 17.1% of demanded electricity in Q4 18 in comparison with 16.4% in Q4 17), mainly due to electricity theft, frauds incentivized by economic recession and tariff increase impact.
Net operating costs, excluding energy purchases, increased by 96% compared to Q4 17, mainly due to extraordinary penalties implemented by the ENRE but not stipulated in the RTI, which penalize the delays in measurements and billings according to Resolution ENRE N° 91/18 (AR$437 million), in addition to higher penalties due to a modification in the calculation methodology (AR$357 million), plus the update amounts in penalties accrued before the RTI by inflation and those fined as from the RTI adjusted by interest rate. Moreover, higher charges from contractors were accrued, primarily related to operating tasks aiming to reduce electricity losses and increase the maintenance and reliability; higher costs related to IT services in US$ for the development of new platforms for the management of human resources and technical crew, and higher salary costs from labor negotiations and higher number of average personnel.
During Q4 18 losses in net financial results increased by AR$1,684 million amounting to a loss of AR$2,117 million, mainly explained by higher commercial interests due to higher payables stock held against CAMMESA for electricity purchases and the impairment of the credit held against RDSA11, partially offset by the gain from net FX difference as a result of the appreciation of the AR$ against the US$ in 4Q 18, currency in which Edenor’s financial liabilities are denominated, while in Q4 17 the AR$ devaluated against US$.
11 For further information, see section 1.4 of this Earnings Release
|
Pampa Energía ● Q4 18 Earning Release ● 21 |
The adjusted EBITDA in Q4 18 for our electricity distribution segment posted a loss of AR$114 million, mainly because tariff increases under the RTI and CPD variation over VAD did not compensate the lower electricity demand, the increasing operational costs and energy losses. Moreover, the adjusted EBITDA in 4Q 18 does not consider extraordinary penalties and changes in calculation criteria in respect of what is stipulated in the RTI, because they correspond to other periods and were appealed before the ENRE. Those penalties and criteria changes negatively impacted the adjusted EBITDA in Q4 17, lowering by AR$169 million the amounts originally reported. Finally, the adjusted EBITDA in Q4 17 does not consider the reversal of the impairment of our investment in Edenor for AR$543 million.
3.3 Analysis of the Oil and Gas Segment12
|
Oil & Gas Segment, Consolidated |
Fiscal Year |
Fourth Quarter | |||||||
|
As Reported Under IFRS |
In Nominal Terms |
In Nominal Terms | |||||||
|
2018 |
2017 |
∆ % |
2018 |
2017 |
∆ % |
2018 |
2017 |
∆ % | |
|
Sales revenue |
19,638 |
17,402 |
+13% |
16,301 |
10,641 |
+53% |
4,749 |
2,966 |
+60% |
|
Cost of sales |
(10,822) |
(11,695) |
-7% |
(8,315) |
(6,581) |
+26% |
(2,453) |
(1,858) |
+32% |
|
Gross profit |
8,816 |
5,707 |
+54% |
7,986 |
4,060 |
+97% |
2,296 |
1,108 |
+107% |
|
Selling expenses |
(721) |
(600) |
+20% |
(604) |
(455) |
+33% |
(183) |
(111) |
+65% |
|
Administrative expenses |
(2,110) |
(2,053) |
+3% |
(1,654) |
(1,326) |
+25% |
(605) |
(362) |
+67% |
|
Exploration expenses |
(45) |
(71) |
-37% |
(41) |
(44) |
-7% |
(31) |
(7) |
NA |
|
Other operating income |
5,320 |
4,123 |
+29% |
3,887 |
2,522 |
+54% |
195 |
662 |
-71% |
|
Other operating expenses |
(4,304) |
(1,410) |
+205% |
(3,252) |
(857) |
+279% |
(502) |
(328) |
+53% |
|
Results for participation in joint businesses and associates |
1,421 |
41 |
NA |
1,442 |
44 |
NA |
1,315 |
16 |
NA |
|
Results for sale of companies' stakes |
1,052 |
- |
NA |
1,132 |
- |
NA |
1,132 |
- |
NA |
|
Operating income |
9,429 |
5,737 |
+64% |
8,896 |
3,944 |
+126% |
3,617 |
978 |
+270% |
|
RECPAM - Results from net monetary position |
4,037 |
(687) |
NA |
- |
- |
NA |
- |
- |
NA |
|
Financial income |
594 |
209 |
+184% |
549 |
124 |
NA |
378 |
15 |
NA |
|
Financial costs |
(2,978) |
(2,932) |
+2% |
(2,484) |
(1,793) |
+39% |
(791) |
(506) |
+56% |
|
Other financial results |
(19,288) |
(3,493) |
NA |
(15,344) |
(2,228) |
NA |
3,436 |
(915) |
NA |
|
Profit before tax |
(8,206) |
(1,166) |
NA |
(8,383) |
47 |
NA |
6,640 |
(428) |
NA |
|
Income tax |
2,124 |
893 |
+138% |
3,561 |
955 |
+273% |
(877) |
1,143 |
NA |
|
Net income for continuing operations |
(6,082) |
(273) |
NA |
(4,822) |
1,002 |
NA |
5,763 |
715 |
NA |
|
Net income from discontinued operations |
1,868 |
(1,328) |
NA |
2,149 |
121 |
NA |
1 |
(184) |
NA |
|
Net income for the period |
(4,214) |
(1,601) |
+163% |
(2,673) |
1,123 |
NA |
5,764 |
531 |
NA |
|
Attributable to: |
|||||||||
|
Owners of the Company |
(4,306) |
(2,373) |
+81% |
(2,737) |
598 |
NA |
5,763 |
440 |
NA |
|
Non-controlling interests |
92 |
772 |
-88% |
64 |
525 |
-88% |
1 |
91 |
-99% |
|
Adjusted EBITDA for continuing operations |
9,929 |
9,178 |
+8% |
7,942 |
5,896 |
+35% |
1,805 |
1,295 |
+39% |
|
Adjusted EBITDA for cont. and discontinued operations |
10,878 |
11,569 |
-6% |
8,582 |
8,660 |
-1% |
1,806 |
2,124 |
-15% |
|
Increases in prop., plant, equipment and intangible assets |
7,221 |
5,295 |
+36% |
6,468 |
4,195 |
+54% |
2,517 |
1,442 |
+75% |
|
Depreciation and amortization |
3,472 |
3,273 |
+6% |
1,853 |
1,956 |
-5% |
484 |
382 |
+27% |
In Q4 18 the gross margin for continuing operations from our oil and gas segment increased by AR$1,188 million compared to Q4 17, mainly due to the effect of the AR$ devaluation over oil and gas sale prices, which are denominated in US$ and expressed in AR$, in addition to a 12% higher oil price in US$ in comparison to Q4 17. These effects were partially offset by a drop of 27% in gas sales prices in US$ accrued to the final demand, in addition to the expiration of Plan Gas 2, higher royalties due to the FX variation, higher logistics and contractors’ costs and lower domestic hydrocarbon production.
12 The oil and gas segment only consolidates the continuing operations, because in January 2018 we agreed to divest certain assets that are mainly related to crude oil production, therefore because of reporting standards, this divestment is shown as discontinued operations as from the fourth quarter of 2017 not only the current but also the comparative period.
|
Pampa Energía ● Q4 18 Earning Release ● 22 |
In operating terms, the domestic production of our oil and gas segment for continuing operations in Q4 18 registered 42.5 kboe/day, 4.0 boe/day lower than Q4 17. Production of gas reached 222 mcf/day, 9% lower than Q4 17, mainly because of a lower demand of gas due to seasonal factors and to a lesser extent, to economic recession, in combination with an excess of domestic supply due to the disruption of shale gas, which is mainly sustained by projects approved under the Unconventional Plan Gas. These effects affected on Rincón del Mangrullo block (-28 mcf/day) due to a lower drilling rate and natural decline, and delays in drilling activity at Sierra Chata (-2 mcf/day). These negative variations were partially offset by the increase in production at El Mangrullo (+8 mcf/day), which was interconnected by a gas pipeline to Rincón del Mangrullo to take advantage of this block’s processing plant, rising December’s production by approximately 24 mcf/day, in line with the return of fuel self-procurement for power generation, in addition to a slight increase at Río Neuquén (+3 mcf/day). Additionally, oil production decreased from 5.9 kbbl/day in Q4 17 to 5.4 kbbl/day in Q4 18, mainly due to the service termination at Medanito La Pampa block (-0.9 kbbl/day), partially offset by a slight increase in crude oil production at El Tordillo (+0.3 kbbl/day) and Río Neuquén (+0.1 kbbl/day) blocks.
As of December 31, 2018, we accounted 892 productive wells in Argentina for continuing operations, in comparison to 904 as of December 31, 2017. Furthermore, Pampa’s proven reserves amounted to 130 million boe, 4% higher compared to December 31, 2017. Considering current production levels and concessions’ extensions in 2018, the reserve-replacement ratio posted 1.32, and average life to 8 years.
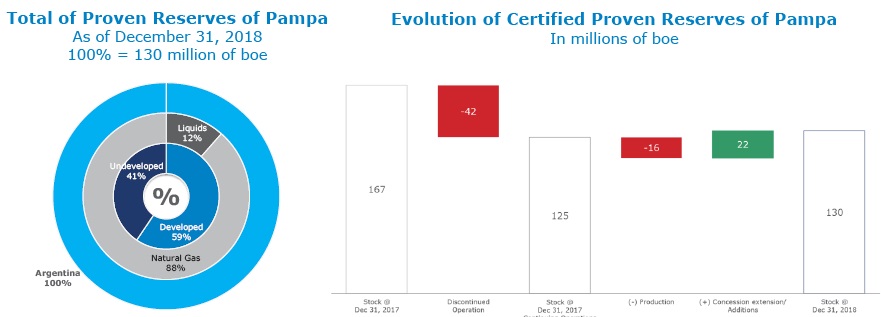
|
Pampa Energía ● Q4 18 Earning Release ● 23 |
|
Oil & Gas Production |
Continuing Operations |
Discontinued Operations |
Total | |||||||||
|
Oil |
Gas |
Subtotal |
Oil |
Gas |
LPG |
Subtotal | ||||||
|
PEPASA |
Pampa |
Subtotal |
PEPASA |
Pampa |
Subtotal | |||||||
|
Fiscal Year |
|
|
|
|
|
|
|
|
|
|
|
|
|
Volume 2018 |
|
|
|
|
|
|
|
|
|
|
|
|
|
In thousand m3/day |
- |
0.8 |
0.8 |
- |
6,753 |
6,753 |
2.0 |
1,112 |
0.1 |
|||
|
In thousand boe/day |
- |
5.1 |
5.1 |
- |
39.7 |
39.7 |
44.8 |
12.7 |
6.5 |
0.6 |
19.8 |
64.6 |
|
In million cubic feet/day |
- |
238 |
238 |
39 |
||||||||
|
Volume 2017 |
|
|
|
|
|
|
|
|
|
|
|
|
|
In thousand m3/day |
0.5 |
0.7 |
1.2 |
2,847 |
4,171 |
7,018 |
2.2 |
1,037 |
0.1 |
|||
|
In thousand boe/day |
2.9 |
4.6 |
7.6 |
16.8 |
24.6 |
41.3 |
48.9 |
14.0 |
6.1 |
0.7 |
20.8 |
69.7 |
|
In million cubic feet/day |
101 |
147 |
248 |
37 |
||||||||
|
Variation 2018 v. 2017 |
na |
+9% |
-33% |
na |
+62% |
-4% |
-8% |
-10% |
+7% |
-11% |
-5% |
-7% |
|
Avg. Price 2018 |
|
|
|
|
|
|
|
|
|
|
|
|
|
In US$/bbl |
na |
63.0 |
63.0 |
61.7 |
||||||||
|
In US$/MBTU |
na |
4.7 |
4.7 |
4.4 |
||||||||
|
In US$/ton |
415.3 |
|||||||||||
|
Avg. Price 2017 |
|
|
|
|
|
|
|
|
|
|
|
|
|
In US$/bbl |
49.9 |
49.8 |
49.8 |
55.0 |
||||||||
|
In US$/MBTU |
7.2 |
5.7 |
6.3 |
5.3 |
||||||||
|
In US$/ton |
341.4 |
|||||||||||
|
Variation 2018 v. 2017 |
na |
+27% |
+27% |
na |
-18% |
-25% |
+12% |
-18% |
+22% |
|||
|
Fourth Quarter |
|
|
|
|
|
|
|
|
|
|
|
|
|
Volume Q4 18 |
|
|
|
|
|
|
|
|
|
|
|
|
|
In thousand m3/day |
- |
0.9 |
0.9 |
- |
6,293 |
6,293 |
||||||
|
In thousand boe/day |
- |
5.4 |
5.4 |
- |
37.0 |
37.0 |
42.5 |
42.5 | ||||
|
In million cubic feet/day |
- |
222 |
222 |
|||||||||
|
Volume Q4 17 |
|
|
|
|
|
|
|
|
|
|
|
|
|
In thousand m3/day |
0.2 |
0.8 |
0.9 |
2,525 |
4,373 |
6,898 |
2.1 |
1,150 |
0.1 |
|||
|
In thousand boe/day |
1.1 |
4.8 |
5.9 |
14.9 |
25.7 |
40.6 |
46.5 |
13.5 |
6.8 |
0.6 |
20.9 |
67.4 |
|
In million cubic feet/day |
89 |
154 |
244 |
41 |
||||||||
|
Variation Q4 18 v. Q4 17 |
na |
+13% |
-8% |
na |
+44% |
-9% |
-9% |
-37% | ||||
|
Avg. Price Q4 18 |
|
|
|
|
|
|
|
|
|
|
|
|
|
In US$/bbl |
na |
60.3 |
60.3 |
|||||||||
|
In US$/MBTU |
na |
3.4 |
3.4 |
|||||||||
|
Avg. Price Q4 17 |
|
|
|
|
|
|
|
|
|
|
|
|
|
In US$/bbl |
58.4 |
53.7 |
53.9 |
55.5 |
||||||||
|
In US$/MBTU |
6.3 |
6.2 |
6.2 |
5.7 |
||||||||
|
In US$/ton |
409.5 |
|||||||||||
|
Variation Q4 18 v. Q4 17 |
na |
+12% |
+12% |
na |
-45% |
-45% |
||||||
|
|
|
|
|
|
|
|
|
|
|
|
|
|
Note: The production considers the 100% contribution of Medanito La Pampa, block in which services were provided until Q4 17, it does not consider foreign production of 0.3 kbbl/day in 2018; 1.3 kbbl/day in 2017; 0.3 kbbl/day in Q4 18 and 0.7 kbbl/day in Q4 17. During 2018, discontinued operations considers only Q1 18 volumes. Due to merger as from October 1, 2017, the production of Pampa includes the production of Petrolera Pampa. FX rate of AR$/US$: 2018 – 28.13; 2017 – 16.57; Q4 18 – 37.11; Q4 17 – 17.56.
In Q4 18, our accrued gas average sale price was US$3.4/MBTU, 45% lower than the US$6.2/MBTU registered in Q4 17, mainly due to a 27% decline in end-users’ sale price in comparison with Q4 17 and the expiration of Plan Gas 2 as from July 1, 2018. Lower sales prices to end-users mainly respond to the reduction of reference price for gas fired at power plants and the gas tenders on a non-firm basis conducted by CAMMESA, which reflected demand seasonality and excess in domestic supply, negatively impacting the commercialization of gas in the industrial segment. These effects were partially offset by higher price accrual to residential demand. In Q4 17, Plan Gas 2 contribution to accrued price was US$1.6/MBTU.
|
Pampa Energía ● Q4 18 Earning Release ● 24 |
Regarding net financial results, during Q4 18 a gain of AR$3,023 million was recorded, compared to a loss of AR$1,406 million in Q4 17, mainly due to the gain from appreciation of the AR$ against the US$ during the Q4 18, currency in which most of the financial liabilities allocated to the segment are denominated, while in Q4 17 the AR$ devaluated against US$; plus, to the lesser extent, the higher gain from holding of financial instruments, partially offset by the impairment of receivables held against gas distributors for US$11 million (original stock of approximately US$30 million).
The adjusted EBITDA of our oil and gas segment for continuing operations increased by AR$510 million, posting AR$1,805 million in Q4 18, mainly due to the effect of devaluation in US$-denominated sales and improvements in oil sale price in US$, partially offset by lower gas prices in US$, Plan Gas 2 expiration and lower hydrocarbon production. The adjusted EBITDA considers the proportional of our 23.1% ownership at OldelVal, an oil pipeline company, for a gain of AR$86 million in Q4 18 and AR$32 million in Q4 17. Furthermore, the adjusted EBITDA in Q4 18 excludes the restatement of OCP’s Ship or Pay contract in Ecuador (AR$106 million), adjustment of royalties accrued for Plan Gas 2 in fiscal year 2017 (AR$153 million) and impairment of wells (AR$17 million).
3.4 Analysis of the Refining and Distribution Segment
|
Refining and Marketing Segment, Consolidated |
Fiscal Year |
Fourth Quarter | |||||||
|
As Reported Under IFRS |
In Nominal Terms |
In Nominal Terms | |||||||
|
2018 |
2017 |
∆ % |
2018 |
2017 |
∆ % |
2018 |
2017 |
∆ % | |
|
Selling expenses |
(159) |
- |
NA |
(131) |
- |
NA |
(76) |
- |
NA |
|
Other operating income |
281 |
- |
NA |
254 |
- |
NA |
117 |
- |
NA |
|
Results for participation in associates |
(138) |
(113) |
+22% |
(49) |
- |
NA |
32 |
(17) |
NA |
|
Operating income |
(16) |
(113) |
-86% |
74 |
- |
NA |
73 |
(17) |
NA |
|
RECPAM - Results from net monetary position |
(15) |
(276) |
-95% |
- |
- |
NA |
- |
- |
NA |
|
Other financial results |
32 |
- |
NA |
29 |
- |
NA |
(2) |
- |
NA |
|
Profit before tax |
1 |
(389) |
NA |
103 |
- |
NA |
71 |
(17) |
NA |
|
Income tax and minimum expected profit tax |
(32) |
- |
NA |
(53) |
- |
NA |
(21) |
- |
NA |
|
Net income for continuing operations |
(31) |
(389) |
-92.0% |
50 |
- |
NA |
50 |
(17) |
NA |
|
Net income from discontinued operations |
1,167 |
(599) |
NA |
920 |
(391) |
NA |
6 |
(337) |
NA |
|
Net income for the period |
1,136 |
(988) |
NA |
970 |
(391) |
NA |
56 |
(354) |
NA |
|
Adjusted EBITDA for continuing operations |
198 |
80 |
+147% |
145 |
80 |
+81% |
9 |
45 |
-79% |
|
Adjusted EBITDA for cont. and discontinued operations |
930 |
544 |
+71% |
762 |
373 |
+104% |
15 |
217 |
-93% |
|
Increases in prop., plant, equipment and intangible assets |
50 |
255 |
-80% |
38 |
154 |
-75% |
1 |
31 |
-97% |
|
Depreciation and amortization |
20 |
- |
NA |
5 |
- |
NA |
3 |
- |
NA |
The adjusted EBITDA of our refining and distribution segment for continuing operations13 posted a gain of AR$9 million in Q4 18, mainly due to the activities at Dock Sud dispatch facility and the proportional EBITDA of Refinor, a company in which Pampa holds a direct participation of 28.5%, for a loss of AR$35 million in Q4 18, in comparison to a gain of AR$45 million in the same period in 2017.
13 In December 2017 we agreed to divest assets related to refining and distribution segment, so for reporting purposes this segment is shown as discontinued operations since Q4 17 for the current and comparative periods, only consolidating continuing operations, which are our stake at Refinor and Dock Sud’s dispatch facility.
|
Pampa Energía ● Q4 18 Earning Release ● 25 |
The amounts corresponding to Pampa’s discontinued operations are shown below:
|
Refining & Distribution |
Products | |||||
|
Crude Oil |
Diesel Oil |
Gasolines |
Fuel Oil, IFOs & Asphalts |
Others |
Total | |
|
Fiscal Year |
|
|
|
|
|
|
|
Volume 2018 (thousand m3) |
24 |
345 |
196 |
138 |
127 |
829 |
|
Volume 2017 (thousand m3) |
17 |
811 |
455 |
297 |
264 |
1,843 |
|
Volume Variation 2018 - 2017 |
+46% |
-58% |
-57% |
-54% |
-52% |
-55% |
|
Average Price 2018 (US$/m3) |
367 |
579 |
624 |
405 |
554 |
550 |
|
Average price 2017 (US$/m3) |
307 |
579 |
663 |
399 |
450 |
550 |
|
Price Variation 2018 - 2017 |
+19% |
-0% |
-6% |
+2% |
+23% |
+0% |
|
Fourth Quarter |
|
|
|
|
|
|
|
Volume Q4 18 (thousand m3) |
- |
- |
- |
- |
- |
- |
|
Volume Q4 17 (thousand m3) |
4 |
202 |
118 |
65 |
54 |
443 |
|
Average Price Q4 18 (US$/m3) |
- |
- |
- |
- |
- |
- |
|
Average Price Q4 17 (US$/m3) |
299 |
605 |
657 |
447 |
530 |
584 |
|
|
|
|
|
|
|
|
Note: In fiscal year 2018, it considers only the volumes until June 30, 2018. FX rate of AR$/US$: 6M18 – 21.63; 2017 – 16.57; Q4 17 – 17.56.
3.5 Analysis of the Petrochemicals Segment
|
Petrochemicals Segment, Consolidated |
Fiscal Year |
Fourth Quarter | |||||||
|
As Reported Under IFRS |
In Nominal Terms |
In Nominal Terms | |||||||
|
2018 |
2017 |
∆ % |
2018 |
2017 |
∆ % |
2018 |
2017 |
∆ % | |
|
Sales revenue |
12,748 |
11,825 |
+8% |
10,538 |
7,229 |
+46% |
3,125 |
1,855 |
+68% |
|
Cost of sales |
(12,602) |
(10,915) |
+15% |
(9,641) |
(6,655) |
+45% |
(3,089) |
(1,732) |
+78% |
|
Gross profit |
146 |
910 |
-84% |
897 |
574 |
+56% |
36 |
123 |
-71% |
|
Selling expenses |
(484) |
(471) |
+3% |
(399) |
(290) |
+38% |
(73) |
(82) |
-11% |
|
Administrative expenses |
(212) |
(622) |
-66% |
(172) |
(380) |
-55% |
235 |
(112) |
NA |
|
Other operating income |
205 |
103 |
+99% |
171 |
64 |
+167% |
30 |
29 |
+3% |
|
Other operating expenses |
(752) |
(363) |
+107% |
(648) |
(227) |
+185% |
(226) |
(105) |
+115% |
|
Property, plant and equipment impairment |
(1,188) |
- |
NA |
(598) |
- |
NA |
(598) |
- |
NA |
|
Operating income |
(2,285) |
(443) |
NA |
(749) |
(259) |
+189% |
(596) |
(147) |
NA |
|
RECPAM - Results from net monetary position |
1,850 |
58 |
NA |
- |
- |
NA |
- |
- |
NA |
|
Finance income |
50 |
16 |
+213% |
43 |
10 |
NA |
5 |
- |
NA |
|
Finance costs |
(566) |
(387) |
+46% |
(490) |
(238) |
+106% |
(153) |
(69) |
+122% |
|
Other financial results |
(1,481) |
(241) |
NA |
(1,139) |
(152) |
NA |
567 |
(49) |
NA |
|
Profit before tax |
(2,432) |
(997) |
+144% |
(2,335) |
(639) |
+265% |
(177) |
(265) |
-33% |
|
Income tax |
471 |
728 |
-35% |
788 |
529 |
+49% |
170 |
454 |
-63% |
|
Net income for the period |
(1,961) |
(269) |
NA |
(1,547) |
(110) |
NA |
(7) |
189 |
NA |
|
Adjusted EBITDA |
(890) |
(320) |
+178% |
(25) |
(161) |
-84% |
35 |
(142) |
NA |
|
Increases in prop., plant, equipment and intangible assets |
140 |
182 |
-23% |
132 |
110 |
+20% |
37 |
51 |
-27% |
|
Depreciation and amortization |
222 |
152 |
+46% |
133 |
117 |
+14% |
27 |
24 |
+13% |
The gross margin in this segment during Q4 18 posted AR$36 million, 71% lower than Q4 17, mainly driven by lower international pricing references, denominated in US$, thus lower sales prices, combined with lower sales volume due to lower demand in products and export duty pursuant to Executive Order No. 793 and 865/18, partially offset by the depreciation of the FX on sales prices and optimization of fixed costs by shutting down the BOPs plant in Zárate.
|
Pampa Energía ● Q4 18 Earning Release ● 26 |
The amounts corresponding to Pampa are shown below:
|
Petrochemicals |
Products | |||
|
Styrene & Polystyrene1 |
SBR |
Others |
Total | |
|
Fiscal Year |
|
|
|
|
|
Volume 2018 (thousand ton) |
113 |
26 |
215 |
355 |
|
Volume 2017 (thousand ton) |
134 |
33 |
291 |
458 |
|
Volume Variation 2018 - 2017 |
-15% |
-23% |
-26% |
-23% |
|
Average Price 2018 (US$/ton) |
1,515 |
1,821 |
722 |
1,056 |
|
Average Price 2017 (US$/ton) |
1,506 |
2,052 |
571 |
953 |
|
Price Variation 2018 - 2017 |
+1% |
-11% |
+26% |
+11% |
|
Fourth Quarter |
|
|
|
|
|
Volume Q4 18 (thousand ton) |
22 |
4 |
62 |
88 |
|
Volume Q4 17 (thousand ton) |
32 |
9 |
63 |
104 |
|
Volume Variation Q4 18 - Q4 17 |
-31% |
-53% |
-2% |
-15% |
|
Average Price Q4 18 (US$/ton) |
1,640 |
2,008 |
639 |
955 |
|
Average Price Q4 17 (US$/ton) |
1,614 |
1,826 |
606 |
1,021 |
|
Price Variation Q4 18 - Q4 17 |
+2% |
+10% |
+5% |
-6% |
|
|
|
|
|
|
Total sales volume of our petrochemicals segment decreased by 15% in Q4 18 vs. Q4 17, mainly due to lower local and international demand of styrene products and synthetic rubber, in addition to the closing of the BOPs plant in Zarate.
The Q4 18 registered a positive variation in net financial results of AR$537 million, amounting to a net gain of AR$419 million, mainly due to the appreciation of the AR$ in relation to the US$ during the Q4 18, currency in which interests from contingency with San Lorenzo Customs is denominated, while in Q4 17 the AR$ devaluated against US$.
The adjusted EBITDA of our petrochemicals segment reported a gain of AR$35 million in Q4 18, which excludes contingencies from former Petrobras Argentina and impairment in fair value of assets related to the segment for AR$543 million.
|
Pampa Energía ● Q4 18 Earning Release ● 27 |
3.6 Analysis of the Holding and Others Segment
|
Holding and Others Segment, Consolidated |
Fiscal Year |
Fourth Quarter | |||||||
|
As Reported Under IFRS |
In Nominal Terms |
In Nominal Terms | |||||||
|
2018 |
2017 |
∆ % |
2018 |
2017 |
∆ % |
2018 |
2017 |
∆ % | |
|
Sales revenue |
1,354 |
635 |
+113% |
1,132 |
388 |
+192% |
392 |
106 |
+270% |
|
Cost of sales |
(4) |
(27) |
-85% |
(2) |
(3) |
-33% |
- |
- |
NA |
|
Gross profit |
1,350 |
608 |
+122% |
1,130 |
385 |
+194% |
392 |
106 |
+270% |
|
Selling expenses |
(1) |
- |
NA |
(1) |
- |
NA |
- |
- |
NA |
|
Administrative expenses |
(1,022) |
(1,118) |
-9% |
(843) |
(692) |
+22% |
(294) |
(236) |
+25% |
|
Other operating income |
309 |
505 |
-39% |
280 |
289 |
-3% |
179 |
27 |
NA |
|
Other operating expenses |
(210) |
(501) |
-58% |
(173) |
(294) |
-41% |
(13) |
(37) |
-65% |
|
Results for participation in joint businesses |
3,593 |
1,948 |
+84% |
3,700 |
1,114 |
+232% |
2,216 |
290 |
NA |
|
Operating income |
4,019 |
1,442 |
+179% |
4,093 |
802 |
NA |
2,480 |
150 |
NA |
|
RECPAM - Results from net monetary position |
464 |
6,272 |
-93% |
- |
- |
NA |
- |
- |
NA |
|
Finance income |
519 |
286 |
+81% |
433 |
174 |
+149% |
162 |
47 |
+245% |
|
Finance costs |
(237) |
(278) |
-15% |
(195) |
(180) |
+8% |
(74) |
(66) |
+12% |
|
Other financial results |
4,023 |
1,206 |
+234% |
3,043 |
771 |
+295% |
(1,709) |
278 |
NA |
|
Profit before tax |
8,788 |
8,928 |
-2% |
7,374 |
1,567 |
NA |
859 |
409 |
+110% |
|
Income tax |
(1,249) |
(50) |
NA |
(1,613) |
341 |
NA |
(1,543) |
223 |
NA |
|
Net income for the period |
7,539 |
8,878 |
-15% |
5,761 |
1,908 |
+202% |
(684) |
632 |
NA |
|
Adjusted EBITDA |
6,415 |
2,934 |
+119% |
5,300 |
1,911 |
+177% |
1,535 |
647 |
+137% |
|
Increases in prop., plant, equipment and intangible assets |
199 |
192 |
+4% |
183 |
116 |
+58% |
45 |
66 |
-32% |
|
Depreciation and amortization |
3 |
87 |
-97% |
2 |
60 |
-97% |
(4) |
59 |
NA |
The operating income without considering the results from our participation in joint businesses (Transener and TGS), recorded a gain of AR$264 million in comparison to the loss of AR$140 million in Q4 17, mainly explained by higher fees accrual and a lower charge of the executives’ compensation due to share price decrease, partially offset by higher labor and third party costs.
Regarding net financial results, in Q4 18 a loss of AR$1,621 million was recorded, whereas in Q4 17 a gain of AR$259 million was recorded, mainly explained by FX loss generated by active financial position in US$, due to AR$ appreciation against US$ in Q4 18, meanwhile in Q4 17 the AR$ devaluated against US$.
The adjusted EBITDA of our holding and others segment increased by AR$888 million, reaching AR$1,535 million in Q4 18. The adjusted EBITDA excludes equity income from our participation in Transener and TGS, and in turn, considers a consolidation of EBITDAs adjusted by equity ownership in these businesses.
In Q4 18 the EBITDA adjusted by our indirect ownership of 25.5% over TGS was AR$925 million (implicit total of AR$3,621 million), a significantly higher amount compared to the AR$401 million registered in Q4 17 (implicit total of AR$1,574 million), mainly because Q4 18 considers the full implementation of the RTI plus cost variations for gas transportation (433% cumulative), while in Q4 17 in the months of October and November only considers the first installment, equivalent to 64% on average since April 2017, in addition to the application of the second installment of 81% as of December 2017. Moreover, the margin improvement in the liquids business contributed to the EBITDA performance in Q4 18, which increased in comparison to Q4 17 due to FX variation on sales in US$, partially offset by the drop in references prices denominated in US$ and lower volumes sold.
In Transener, the EBITDA adjusted by stake ownership of 26.3% was AR$350 million in Q4 18 (implicit total of AR$1,331 million), 7% higher than Q4 17, which was AR$327 million (implicit total of AR$1,241 million), mainly due to semiannual cost variation update in December 2017 (retroactive to August 2017), February 2018 and November 2018 (retroactive to August 2018), over Transener and Transba’s remuneration (43% cumulative).
|
Pampa Energía ● Q4 18 Earning Release ● 28 |
3.7 Analysis of the Fiscal Year, by Subsidiary14
|
|
Fiscal Year 2018 |
Fiscal Year 2017 | ||||||
|
Subsidiary |
% Pampa |
Adjusted EBITDA |
Net Debt4 |
Net Income5 |
% Pampa |
Adjusted EBITDA |
Net Debt4 |
Net Income5 |
|
Power Generation Segment |
|
|
|
|
|
|
|
|
|
Diamante |
61.0% |
305 |
(604) |
382 |
61.0% |
93 |
(202) |
116 |
|
Los Nihuiles |
52.0% |
307 |
(845) |
627 |
52.0% |
105 |
(190) |
264 |
|
CPB |
100.0% |
878 |
(294) |
192 |
100.0% |
226 |
534 |
(121) |
|
CTG1 |
100.0% |
- |
- |
- |
100.0% |
381 |
- |
262 |
|
CTLL1 |
100.0% |
- |
- |
- |
100.0% |
1,517 |
- |
1,218 |
|
Pampa Energía2 |
100.0% |
10,315 |
22,529 |
(2,756) |
100.0% |
1,999 |
9,692 |
64 |
|
Greenwind |
474 |
4,472 |
(1,593) |
(10) |
1,911 |
(104) | ||
|
Non-controlling stake adjustment |
(237) |
(2,236) |
796 |
5 |
(956) |
52 | ||
|
Subtotal Greenwind adjusted by ownership |
50.0% |
237 |
2,236 |
(796) |
50.0% |
(5) |
956 |
(52) |
|
Other companies, adjustments & deletions3 |
|
(422) |
(68) |
(479) |
|
(14) |
(2,386) |
(121) |
|
Subtotal Power Generation |
|
11,620 |
22,954 |
(2,830) |
|
4,302 |
8,404 |
1,630 |
|
Electricity Distribution Segment |
|
|
|
|
|
|
|
|
|
Edenor |
51.8% |
5,957 |
3,652 |
(128) |
51.0% |
1,904 |
1,271 |
682 |
|
Adjustments & deletions3 |
|
(7) |
(0) |
93 |
|
6 |
- |
269 |
|
Subtotal Electricity Distribution |
|
5,950 |
3,652 |
(35) |
|
1,911 |
1,271 |
951 |
|
Oil & Gas Segment |
|
|
|
|
|
|
|
|
|
Petrolera Pampa1 |
100.0% |
- |
- |
- |
100.0% |
2,381 |
- |
866 |
|
Pampa Energía2 |
100.0% |
7,293 |
36,575 |
(3,990) |
100.0% |
3,740 |
18,781 |
120 |
|
OldelVal |
1,091 |
(354) |
873 |
444 |
(148) |
216 | ||
|
Non-controlling stake adjustment |
(839) |
272 |
(671) |
(341) |
114 |
(166) | ||
|
Subtotal OldelVal adjusted by ownership |
23.1% |
252 |
(82) |
202 |
23.1% |
103 |
(34) |
50 |
|
Other companies, adjustments & deletions3 |
|
397 |
(359) |
1,051 |
|
(328) |
(338) |
(438) |
|
Subtotal Oil & Gas |
|
7,942 |
36,134 |
(2,737) |
|
5,896 |
18,408 |
598 |
|
Refining & Distribution Segment |
|
|
|
|
|
|
|
|
|
Pampa Energía2 |
100.0% |
127 |
(3) |
969 |
100.0% |
- |
(24) |
(391) |
|
Refinor |
61 |
(379) |
(415) |
282 |
(542) |
38 | ||
|
Non-controlling stake adjustment |
(43) |
271 |
296 |
(201) |
387 |
(27) | ||
|
Subtotal Refinor adjusted by ownership |
28.5% |
17 |
(108) |
(118) |
28.5% |
80 |
(154) |
11 |
|
Adjustments & deletions3 |
|
1 |
0 |
119 |
|
- |
24 |
(11) |
|
Subtotal Refining & Distribution |
|
145 |
(111) |
970 |
|
80 |
(154) |
(391) |
|
Petrochemicals Segment |
|
|
|
|
|
|
|
|
|
Pampa Energía2 |
100.0% |
(25) |
- |
(1,547) |
100.0% |
(161) |
- |
(110) |
|
Subtotal Petrochemicals |
|
(25) |
- |
(1,547) |
|
(161) |
- |
(110) |
|
Holding & Others Segment |
|
|
|
|
|
|
|
|
|
Pampa Energía2 |
100.0% |
461 |
6 |
7,033 |
100.0% |
(381) |
1,788 |
3,669 |
|
Transener |
4,957 |
(950) |
3,356 |
3,787 |
(1,181) |
2,260 | ||
|
Non-controlling stake adjustment |
(3,652) |
700 |
(2,472) |
(2,790) |
870 |
(1,665) | ||
|
Subtotal Transener adjusted by ownership |
26.3% |
1,305 |
(250) |
883 |
26.3% |
997 |
(311) |
595 |
|
TGS |
14,093 |
2,291 |
10,754 |
5,075 |
(711) |
2,793 | ||
|
Non-controlling stake adjustment |
(10,492) |
(1,706) |
(8,006) |
(3,781) |
530 |
(2,081) | ||
|
Subtotal TGS adjusted by ownership |
25.5% |
3,600 |
585 |
2,747 |
25.5% |
1,294 |
(181) |
712 |
|
Other companies & deletions3 |
|
(66) |
(8,844) |
(4,903) |
|
1 |
(4,819) |
(3,068) |
|
Subtotal Holding & Others |
|
5,300 |
(8,503) |
5,761 |
|
1,911 |
(3,523) |
1,908 |
|
Deletions |
|
35 |
(2,381) |
19 |
|
4 |
(275) |
20 |
|
Total Consolidated for Continuing Operations |
|
30,967 |
51,744 |
(399) |
|
13,943 |
24,132 |
4,606 |
|
Total Adjusted by Ownership |
|
27,832 |
53,010 |
(399) |
|
12,920 |
23,983 |
4,606 |
1 Due to the corporate reorganization, the 2018 results are merged into Pampa. 2 Non - consolidated amounts. 3 The deletions in net debt correspond to other companies or inter-companies and debt repurchases. 4 Net debt includes holding companies and excludes financing from CAMMESA in the power generation segment. 5 Attributable to the Owners of the Company and does not include results from subsidiaries, but includes discontinued operations.
|
Pampa Energía ● Q4 18 Earning Release ● 29 |
3.8 Analysis of the Quarter, by Subsidiary 15
|
|
Fourth Quarter 2018 |
Fourth Quarter 2017 | ||||||
|
Subsidiary |
% Pampa |
Adjusted EBITDA |
Net Debt4 |
Net Income5 |
% Pampa |
Adjusted EBITDA |
Net Debt4 |
Net Income5 |
|
Power Generation Segment |
|
|
|
|
|
|
|
|
|
Diamante |
61.0% |
93 |
(604) |
95 |
61.0% |
32 |
(202) |
55 |
|
Los Nihuiles |
52.0% |
102 |
(845) |
627 |
52.0% |
32 |
(190) |
135 |
|
CPB |
100.0% |
279 |
(294) |
(41) |
100.0% |
78 |
534 |
(63) |
|
Pampa Energía2 |
100.0% |
3,401 |
22,529 |
2,561 |
100.0% |
1,134 |
9,692 |
(5) |
|
Greenwind |
210 |
4,472 |
416 |
(5) |
1,911 |
(91) | ||
|
Non-controlling stake adjustment |
(105) |
(2,236) |
(208) |
2 |
(956) |
45 | ||
|
Subtotal Greenwind adjusted by ownership |
50.0% |
105 |
2,236 |
208 |
50.0% |
(2) |
956 |
(45) |
|
Other companies, adjustments & deletions3 |
|
(433) |
(68) |
(1,084) |
|
0 |
(2,386) |
(37) |
|
Subtotal Power Generation |
|
3,546 |
22,954 |
2,365 |
|
1,274 |
8,404 |
41 |
|
Electricity Distribution Segment |
|
|
|
|
|
|
|
|
|
Edenor |
51.8% |
(110) |
3,652 |
(2,229) |
51.0% |
539 |
1,271 |
22 |
|
Adjustments & deletions3 |
|
(4) |
(0) |
1,093 |
|
(0) |
- |
559 |
|
Subtotal Electricity Distribution |
|
(114) |
3,652 |
(1,136) |
|
539 |
1,271 |
581 |
|
Oil & Gas Segment |
|
|
|
|
|
|
|
|
|
Pampa Energía2 |
100.0% |
1,662 |
36,575 |
7,068 |
100.0% |
1,480 |
18,781 |
2,888 |
|
OldelVal |
373 |
(354) |
311 |
137 |
(148) |
81 | ||
|
Non-controlling stake adjustment |
(287) |
272 |
(239) |
(105) |
114 |
(63) | ||
|
Subtotal OldelVal adjusted by ownership |
23.1% |
86 |
(82) |
72 |
23.1% |
32 |
(34) |
19 |
|
Other companies, adjustments & deletions3 |
|
57 |
(359) |
(1,377) |
|
(217) |
(338) |
(2,467) |
|
Subtotal Oil & Gas |
|
1,805 |
36,134 |
5,763 |
|
1,295 |
18,408 |
440 |
|
Refining & Distribution Segment |
|
|
|
|
|
|
|
|
|
Pampa Energía2 |
100.0% |
43 |
(3) |
55 |
100.0% |
- |
(24) |
(354) |
|
Refinor |
(122) |
(379) |
(167) |
156 |
(542) |
53 | ||
|
Non-controlling stake adjustment |
87 |
271 |
119 |
(112) |
387 |
(38) | ||
|
Subtotal Refinor adjusted by ownership |
28.5% |
(35) |
(108) |
(48) |
28.5% |
45 |
(154) |
15 |
|
Adjustments & deletions3 |
|
1 |
- |
49 |
|
- |
24 |
(15) |
|
Subtotal Refining & Distribution |
|
9 |
(111) |
56 |
|
45 |
(154) |
(354) |
|
Petrochemicals Segment |
|
|
|
|
|
|
|
|
|
Pampa Energía2 |
100.0% |
35 |
- |
(7) |
100.0% |
(142) |
- |
189 |
|
Subtotal Petrochemicals |
|
35 |
- |
(7) |
|
(142) |
- |
189 |
|
Holding & Others Segment |
|
|
|
|
|
|
|
|
|
Pampa Energía2 |
100.0% |
253 |
6 |
(968) |
100.0% |
(134) |
1,788 |
1,214 |
|
Transener |
1,331 |
(950) |
958 |
1,241 |
(1,181) |
874 | ||
|
Non-controlling stake adjustment |
(980) |
700 |
(706) |
(914) |
870 |
(644) | ||
|
Subtotal Transener adjusted by ownership |
26.3% |
350 |
(250) |
252 |
26.3% |
327 |
(311) |
230 |
|
TGS |
3,621 |
2,291 |
7,134 |
1,574 |
(711) |
975 | ||
|
Non-controlling stake adjustment |
(2,696) |
(1,706) |
(5,312) |
(1,173) |
530 |
(726) | ||
|
Subtotal TGS adjusted by ownership |
25.5% |
925 |
585 |
1,823 |
25.5% |
401 |
(181) |
249 |
|
Other companies & deletions3 |
|
7 |
(8,844) |
(1,791) |
|
53 |
(4,819) |
(1,061) |
|
Subtotal Holding & Others |
|
1,535 |
(8,503) |
(684) |
|
647 |
(3,523) |
632 |
|
Deletions |
|
27 |
(2,381) |
27 |
|
4 |
(275) |
(17) |
|
Total Consolidated for Continuing Operations |
|
6,843 |
51,744 |
6,384 |
|
3,661 |
24,132 |
1,512 |
|
Total Adjusted by Ownership |
|
6,813 |
53,010 |
6,384 |
|
3,369 |
23,983 |
1,512 |
1 Due to the corporate reorganization, the Q4 18 results are merged into Pampa. 2 Non - consolidated amounts. 3 The deletions in net debt correspond to other companies or inter-companies and debt repurchases. 4 Net debt includes holding companies and excludes financing from CAMMESA in the power generation segment. 5 Attributable to the Owners of the Company and does not include results from subsidiaries, but includes discontinued operations.
|
Pampa Energía ● Q4 18 Earning Release ● 30 |