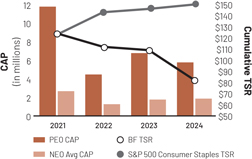
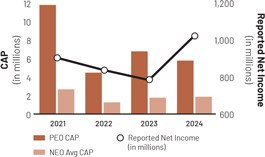
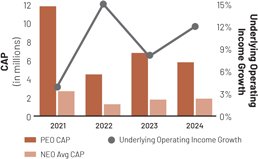
Table of Contents
DEF 14Afalse0000014693 0000014693 2023-05-01 2024-04-30 0000014693 2021-05-01 2022-04-30 0000014693 2020-05-01 2021-04-30 0000014693 2022-05-01 2023-04-30 0000014693 2 2023-05-01 2024-04-30 0000014693 bfa:ChangeInPensionValueMember ecd:PeoMember 2023-05-01 2024-04-30 0000014693 bfa:PensionServiceCostAdjustmentMember ecd:PeoMember 2023-05-01 2024-04-30 0000014693 bfa:PriorYearPensionServiceCostAdjustmentMember ecd:PeoMember 2023-05-01 2024-04-30 0000014693 bfa:SummaryCompensationTableStockOptionAwardsMember ecd:PeoMember 2023-05-01 2024-04-30 0000014693 bfa:PriorYearPensionServiceCostAdjustmentMember ecd:NonPeoNeoMember 2023-05-01 2024-04-30 0000014693 bfa:SummaryCompensationTableStockOptionAwardsMember ecd:NonPeoNeoMember 2023-05-01 2024-04-30 0000014693 bfa:YearendValueOfUnvestedEquityGrantedInCoveredFiscalYearMember ecd:NonPeoNeoMember 2023-05-01 2024-04-30 0000014693 bfa:ChangeInValueOfUnvestedEquityGrantedInPriorYearsMember ecd:NonPeoNeoMember 2023-05-01 2024-04-30 0000014693 bfa:ChangeInPensionValueMember ecd:NonPeoNeoMember 2023-05-01 2024-04-30 0000014693 bfa:PensionServiceCostAdjustmentMember ecd:NonPeoNeoMember 2023-05-01 2024-04-30 0000014693 bfa:YearendValueOfUnvestedEquityGrantedInCoveredFiscalYearMember ecd:PeoMember 2023-05-01 2024-04-30 0000014693 bfa:ChangeInValueOfUnvestedEquityGrantedInPriorYearsMember ecd:PeoMember 2023-05-01 2024-04-30 0000014693 3 2023-05-01 2024-04-30 0000014693 4 2023-05-01 2024-04-30 0000014693 1 2023-05-01 2024-04-30 0000014693 2 2020-05-01 2021-04-30 0000014693 bfa:PriorYearPensionServiceCostAdjustmentMember ecd:PeoMember 2020-05-01 2021-04-30 0000014693 bfa:SummaryCompensationTableStockOptionAwardsMember ecd:NonPeoNeoMember 2020-05-01 2021-04-30 0000014693 bfa:YearendValueOfUnvestedEquityGrantedInCoveredFiscalYearMember ecd:NonPeoNeoMember 2020-05-01 2021-04-30 0000014693 bfa:ChangeInValueOfUnvestedEquityGrantedInPriorYearsMember ecd:NonPeoNeoMember 2020-05-01 2021-04-30 0000014693 bfa:ChangeInPensionValueMember ecd:NonPeoNeoMember 2020-05-01 2021-04-30 0000014693 bfa:PensionServiceCostAdjustmentMember ecd:NonPeoNeoMember 2020-05-01 2021-04-30 0000014693 bfa:ChangeInValueOfUnvestedEquityGrantedInPriorYearsMember ecd:PeoMember 2020-05-01 2021-04-30 0000014693 bfa:ChangeInPensionValueMember ecd:PeoMember 2020-05-01 2021-04-30 0000014693 bfa:PensionServiceCostAdjustmentMember ecd:PeoMember 2020-05-01 2021-04-30 0000014693 bfa:SummaryCompensationTableStockOptionAwardsMember ecd:PeoMember 2020-05-01 2021-04-30 0000014693 bfa:YearendValueOfUnvestedEquityGrantedInCoveredFiscalYearMember ecd:PeoMember 2020-05-01 2021-04-30 0000014693 bfa:PriorYearPensionServiceCostAdjustmentMember ecd:NonPeoNeoMember 2020-05-01 2021-04-30 0000014693 2 2021-05-01 2022-04-30 0000014693 bfa:PriorYearPensionServiceCostAdjustmentMember ecd:NonPeoNeoMember 2021-05-01 2022-04-30 0000014693 bfa:PriorYearPensionServiceCostAdjustmentMember ecd:PeoMember 2021-05-01 2022-04-30 0000014693 bfa:ChangeInPensionValueMember ecd:NonPeoNeoMember 2021-05-01 2022-04-30 0000014693 bfa:PensionServiceCostAdjustmentMember ecd:NonPeoNeoMember 2021-05-01 2022-04-30 0000014693 bfa:SummaryCompensationTableStockOptionAwardsMember ecd:NonPeoNeoMember 2021-05-01 2022-04-30 0000014693 bfa:YearendValueOfUnvestedEquityGrantedInCoveredFiscalYearMember ecd:NonPeoNeoMember 2021-05-01 2022-04-30 0000014693 bfa:ChangeInValueOfUnvestedEquityGrantedInPriorYearsMember ecd:NonPeoNeoMember 2021-05-01 2022-04-30 0000014693 bfa:YearendValueOfUnvestedEquityGrantedInCoveredFiscalYearMember ecd:PeoMember 2021-05-01 2022-04-30 0000014693 bfa:ChangeInValueOfUnvestedEquityGrantedInPriorYearsMember ecd:PeoMember 2021-05-01 2022-04-30 0000014693 bfa:ChangeInPensionValueMember ecd:PeoMember 2021-05-01 2022-04-30 0000014693 bfa:PensionServiceCostAdjustmentMember ecd:PeoMember 2021-05-01 2022-04-30 0000014693 bfa:SummaryCompensationTableStockOptionAwardsMember ecd:PeoMember 2021-05-01 2022-04-30 0000014693 2 2022-05-01 2023-04-30 0000014693 bfa:PriorYearPensionServiceCostAdjustmentMember ecd:NonPeoNeoMember 2022-05-01 2023-04-30 0000014693 bfa:ChangeInPensionValueMember ecd:PeoMember 2022-05-01 2023-04-30 0000014693 bfa:PensionServiceCostAdjustmentMember ecd:PeoMember 2022-05-01 2023-04-30 0000014693 bfa:PriorYearPensionServiceCostAdjustmentMember ecd:PeoMember 2022-05-01 2023-04-30 0000014693 bfa:SummaryCompensationTableStockOptionAwardsMember ecd:PeoMember 2022-05-01 2023-04-30 0000014693 bfa:YearendValueOfUnvestedEquityGrantedInCoveredFiscalYearMember ecd:PeoMember 2022-05-01 2023-04-30 0000014693 bfa:ChangeInValueOfUnvestedEquityGrantedInPriorYearsMember ecd:PeoMember 2022-05-01 2023-04-30 0000014693 bfa:PensionServiceCostAdjustmentMember ecd:NonPeoNeoMember 2022-05-01 2023-04-30 0000014693 bfa:SummaryCompensationTableStockOptionAwardsMember ecd:NonPeoNeoMember 2022-05-01 2023-04-30 0000014693 bfa:YearendValueOfUnvestedEquityGrantedInCoveredFiscalYearMember ecd:NonPeoNeoMember 2022-05-01 2023-04-30 0000014693 bfa:ChangeInValueOfUnvestedEquityGrantedInPriorYearsMember ecd:NonPeoNeoMember 2022-05-01 2023-04-30 0000014693 bfa:ChangeInPensionValueMember ecd:NonPeoNeoMember 2022-05-01 2023-04-30 iso4217:USD xbrli:pure
UNITED STATES
SECURITIES AND EXCHANGE COMMISSION
Washington, D.C. 20549
SCHEDULE 14A
Proxy Statement Pursuant to Section 14(a) of the Securities
Exchange Act of 1934 (Amendment No. )
 
     
  Filed by the Registrant   
  Filed by a Party other than the Registrant   
 
 
Check the appropriate box:
   
  Preliminary Proxy Statement
   
 
CONFIDENTIAL, FOR USE OF THE COMMISSION ONLY (AS PERMITTED BY RULE
14a-6(e)(2))
   
  Definitive Proxy Statement
   
  Definitive Additional Materials
   
  Soliciting Material Pursuant to
§240.14a-12
 
LOGO
Brown-Forman Corporation
(Name of Registrant as Specified In Its Charter)
(Name of Person(s) Filing Proxy Statement, if other than the Registrant)
 
Payment of Filing Fee (Check the appropriate box):
 
No fee required.
 
Fee paid previously with preliminary materials.
 
Fee computed on table in exhibit required by Item 25(b) per Exchange Act Rules 14a-6(i)(1) and 0-11.


Table of Contents

LOGO

A World of OPPORTUNITY 2024 Proxy Statement and Notice of Annual Meeting of Stockholders


Table of Contents

LOGO

More than 150 years ago, Brown-Forman was founded by George Garvin Brown who sold one brand, Old Forester, in one market, the United States. Our employees now number 5,700, and our portfolio has grown to more than 40 brands sold in more than 170 countries. This extraordinary global growth has been driven by our unwavering desire to meet the preferences of our consumers and stay true to our founding promise that there is Nothing Better in the Market. As we deepen our resolve and further our investment in our brands, our people, and our environmental and social commitments, we see A World of OPPORTUNITY.


Table of Contents

LOGO

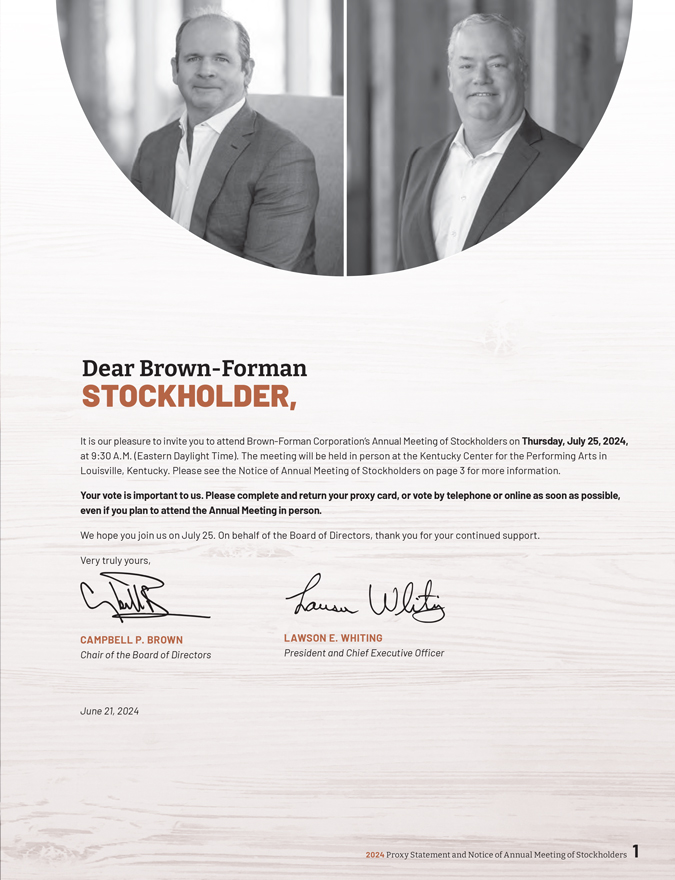
Dear Brown-Forman STOCKHOLDER, It is our pleasure to invite you to attend Brown-Forman Corporation’s Annual Meeting of Stockholders on Thursday, July 25, 2024, at 9:30 A.M. (Eastern Daylight Time). The meeting will be held in person at the Kentucky Center for the Performing Arts in Louisville, Kentucky. Please see the Notice of Annual Meeting of Stockholders on page 3 for more information. Your vote is important to us. Please complete and return your proxy card, or vote by telephone or online as soon as possible, even if you plan to attend the Annual Meeting in person. We hope you join us on July 25. On behalf of the Board of Directors, thank you for your continued support. Very truly yours, CAMPBELL P. BROWN LAWSON E. WHITING Chair of the Board of Directors President and Chief Executive Officer June 21, 2024


Table of Contents


2 Brown-Forman


Table of Contents

LOGO

Notice of ANNUAL MEETING OF STOCKHOLDERS DATE: Thursday, July 25, 2024 TIME: 9:30 A.M. (Eastern Daylight Time) LOCATION: The Annual Meeting will be held in person at: Kentucky Center for the Performing Arts 501 West Main Street Louisville, Kentucky 40202 Purpose: We are holding this meeting to: elect the eleven director nominees named in this Proxy Statement; ratify the selection of the independent registered public accounting firm for fiscal 2025; and transact any other business that may properly come before the Annual Meeting or any adjournment or postponement thereof. Record Date: Holders of record of Class A common stock at the close of business on June 10, 2024, are entitled to vote at the Annual Meeting or any adjournment or postponement thereof. Voting: Your vote is very important. Even if you plan to attend the Annual Meeting in person, we encourage you to complete, sign, and date the enclosed proxy card and return it in the enclosed envelope, or you may submit your proxy by telephone at (800) 690-6903 or online at www.proxyvote.com before the Annual Meeting so your shares are represented and voted at the meeting. Submitting your proxy in advance will not prevent you from voting your shares in person at the Annual Meeting if you wish, since your vote by proxy is revocable at your option. Instructions on telephone and online voting are on the proxy card enclosed with this Proxy Statement. Attending the Annual Meeting We are committed to providing a safe, secure environment for our stockholders, directors, employees, and guests. Please observe the following procedures if you plan to attend the Annual Meeting. Before the meeting: Please register by July 10, 2024, to attend the Annual Meeting in person. You may register online at ams.b-f.com or by contacting Chase Sanders, Senior Investor Relations Analyst, at (502) 774-6504 or by email at Investor_Relations@b-f.com. When you arrive: Parking details will be provided online at ams.b-f.com closer to the event. Check-in will begin at 8:30 A.M. (Eastern Daylight Time) in the main lobby of the Kentucky Center for the Performing Arts. What to bring: Please bring a photo ID. If your shares are registered in the name of a bank, broker, or other holder of record, please also bring documentation of your stock ownership (such as the voting instruction form that was sent to you or a brokerage statement) at the close of business on June 10, 2024, the record date for the Annual Meeting. Seating is limited. If you do not register in advance, you may still be admitted, if seats are available, by presenting a photo ID along with your proxy card, voting instruction form, brokerage statement, or other documentation of stock ownership at the close of business on the record date for the Annual Meeting. IMPORTANT NOTICE REGARDING AVAILABILITY OF PROXY MATERIALS FOR THE ANNUAL MEETING OF STOCKHOLDERS TO BE HELD ON JULY 25, 2024: The Notice of Annual Meeting, Proxy Statement, and Integrated Annual Report, which includes our Annual Report on Form 10-K for fiscal 2024, are available at investors.brown-forman.com and at www.proxyvote.com. Louisville, Kentucky June 21, 2024 By order of the Board of Directors Michael E. Carr, Jr., Secretary


Table of Contents

LOGO

A World of OPPORTUNITY “We remain confident in the talents of our people, the relevance of our portfolio, and our collective ability to deliver in a world of opportunity.” CAMPBELL P. BROWN Chair of the Board


Table of Contents

LOGO


1   LETTER TO STOCKHOLDERS
3   NOTICE OF ANNUAL MEETING OF STOCKHOLDERS
6   PROXY SUMMARY
8   ANNUAL MEETING INFORMATION
 11   CORPORATE GOVERNANCE
  11   Our Board of Directors
  11   Selection of Directors
  12   Board Composition
  14   Leadership Structure
  15   Board Guidelines and Procedures
  16   Board Committees
  18   Board’s Role in Risk Oversight
  18   Best Practices
  19   Our Controlling Family Stockholders
21   OUR INTEGRATED STRATEGY
22   PROPOSAL 1: ELECTION OF DIRECTORS
26   DIRECTOR COMPENSATION
29   PROPOSAL 2: RATIFICATION OF THE SELECTION OF THE INDEPENDENT REGISTERED PUBLIC ACCOUNTING FIRM FOR FISCAL 2025
30   COMPENSATION DISCUSSION AND ANALYSIS
  31   Executive Summary
  33   Overview of Our Compensation Program
  35   The Role of Our Compensation Committee
  37   Target Compensation
  39   Awards and Payouts in Fiscal 2024: Fixed and Short-Term Compensation
  41   Short-Term Compensation Payouts in Fiscal 2024
  42   Awards and Payouts in Fiscal 2024:
Long-Term Compensation
  46   Other Compensation Elements
  47   Compensation Policies and Practices
 49   COMPENSATION COMMITTEE REPORT
50   COMPENSATION TABLES
  50   Summary Compensation
  52   Grants of Plan-Based Awards
  53   Outstanding Equity Awards
  55   Option Exercises and Stock Vested
  55   Pension Benefits
  57   Non-Qualified Deferred Compensation
  57   Potential Payments Upon Termination or Change in Control
  58   Change in Control and Termination Upon Change in Control
60   STOCK OWNERSHIP
63   PAY RATIO DISCLOSURE
64   PAY VERSUS PERFORMANCE
66   AUDIT MATTERS
69   OTHER INFORMATION
70   APPENDIX A: NON-GAAP FINANCIAL MEASURES


Table of Contents

LOGO

Proxy SUMMARY This section highlights information that we discuss in more detail in this Proxy Statement. As it is only a summary, we encourage you to read the entire Proxy Statement before you vote. Annual Meeting of Stockholders DATE: Thursday, July 25, 2024 TIME: 9:30 A.M. (Eastern Daylight Time) LOCATION: The Annual Meeting will be held in person at: Kentucky Center for the Performing Arts 501 West Main Street Louisville, Kentucky 40202 DATE OF DISTRIBUTION: The Notice of Annual Meeting of Stockholders, Proxy Statement, and proxy card will first be made available or mailed on or about June 21, 2024. Proposals for Stockholder Voting Proposal Our Board's voting recommendation Election of eleven director FOR nominees all nominees WHERE TO FIND DETAILS: Pages 22-25 Ratification of the selection FOR of the independent ratification registered public accounting firm for fiscal 2025 WHERE TO FIND DETAILS: Page 29 In addition, stockholders may be asked to vote on any other business that may properly come before the Annual Meeting or any adjournment or postponement thereof.


Performance and Compensation Highlights

At Brown-Forman, we stand by our ambition: “Nothing Better in the Market.” To deliver that level of value for our stockholders, we need to attract, motivate, reward, and retain a talented and diverse team of executives prepared to lead those efforts. We believe that our executive compensation program, described in this Proxy Statement, allows us to do just that by linking executive pay to our company’s performance, both during the most recent fiscal year and over time.

The charts on page 31 compare basic trends in our company’s performance with trends in the compensation of our President and Chief Executive Officer, Lawson E. Whiting. We use a variety of financial measurements to show the long-term value that strong leadership generates for our stockholders.


6 Brown-Forman


Table of Contents


Our Director Nominees to the Board

Our Board of Directors is asking the holders of the company’s Class A common stock to vote on the election of the eleven director nominees named below. Each director nominee was recommended by the Corporate Governance and Nominating Committee and nominated by the Board of Directors. You can find more details about each director nominee’s experience, qualifications, attributes, and skills under “Proposal 1: Election of Directors” beginning on page 22. Stuart R. Brown, a member of the Board since 2015, is not standing for re-election to the Board.


BOARD NOMINEES    COMMITTEE MEMBERSHIP AS OF APRIL 30, 2024
 Nominee Name & Occupation    Director
Since
   Director
Category
   Audit    Comp    Corp Gov
& Nom
   Exec 

 Campbell P. Brown

 Chair of the Board, Brown-Forman

   2016    B                 C 

 Elizabeth M. Brown

 President, Dendrifund, Inc.

   2023    B                    

 Mark A. Clouse

 President and Chief Executive Officer, Campbell Soup Company

   2022    I                  

 Marshall B. Farrer

 Executive Vice President, Chief Strategic Growth Officer,

 Brown-Forman

   2016    B, M                    

 W. Austin Musselman, Jr.

 Managing Member, White Oak Investments LLC,

 and Owner and Manager, Ashbourne Farms

   Nominee    B                    

 Michael J. Roney

 Retired Chief Executive Officer, Bunzl plc

   2014    I         C        

 Jan E. Singer

 Former Chief Executive Officer, J.Crew

   2022    I                

 Tracy L. Skeans

 Chief Operating Officer & Chief People Officer, Yum! Brands, Inc.

   2018    I            C     

 Elizabeth A. Smith

 Executive Chair and Interim Chief Executive Officer,

 Revlon Group Holdings, LLC

   2023    I                  

 Michael A. Todman

 Retired Vice Chairman, Whirlpool Corporation

   2014    I    C           

 Lawson E. Whiting

 President and Chief Executive Officer, Brown-Forman

   2018    M                  

  B=Brown Family Director  M=Management Director  I=Independent Director  C=Committee Chair =Committee Member


LOGO


2024 Proxy Statement and Notice of Annual Meeting of Stockholders 7


Table of Contents

LOGO

About Your Proxy Materials

Our Board of Directors (the Board) is requesting, or “soliciting,” proxies for our Annual Meeting of Stockholders to be held on July 25, 2024 (the Annual Meeting). This means that you can vote your shares “by proxy” at the Annual Meeting by instructing us how you would like your shares voted, even if you cannot attend the Annual Meeting.

The information in this Proxy Statement and the accompanying materials will help you decide how to vote on the matters we will consider at the Annual Meeting. We began mailing this Proxy Statement and the accompanying materials, and also made them available online, on or about June 21, 2024, to holders of record of our Class A and Class B common stock at the close of business on June 10, 2024, which is the “record date” for the Annual Meeting.

The Notice of Annual Meeting, Proxy Statement, and Integrated Annual Report, which includes our Annual Report on Form 10-K for fiscal 2024, are available at investors.brown-forman.com and at proxyvote.com. You may request additional printed copies at any time using the contact information below.

Please let us know as soon as possible how you would like your shares voted. See “How to Vote” on the next page for details.

CONTACT INFORMATION

For information about your stock ownership or other stockholder services, please contact our Senior Investor Relations Analyst, Chase Sanders, by telephone at (502) 774-6504, by e-mail at Investor_Relations@b-f.com, or by mail at Brown-Forman Corporation, 850 Dixie Highway, Louisville, Kentucky 40210.

REDUCING DUPLICATE MAILINGS

The SEC permits us to deliver a single Proxy Statement and Integrated Annual Report to stockholders who share the same address and last name. This helps us reduce our printing costs, postage fees, and the environmental impact of our Annual Meeting. However, even if your household receives only one Proxy Statement and Integrated Annual Report, each holder of the company’s Class A common stock will receive an individual proxy card. If you would like to enroll in this “householding” process, or if your household is already enrolled but you prefer to opt out of householding for next year, please inform us using the contact information above and we will promptly fulfill your request.

Attending the Annual Meeting

Although only holders of the company’s Class A common stock may vote and submit questions at the Annual Meeting, holders of both the company’s Class A and Class B common stock who owned their shares as of the record date (or their legal proxies) are welcome to attend the Annual Meeting.

If you plan to attend the Annual Meeting, please register by July 10, 2024, online at ams.b-f.com or by contacting Chase Sanders using the contact information above. Please bring a photo ID and, if your shares are registered in the name of a bank, broker, or other holder of record, documentation (such as the voting instruction form that was sent to you or a brokerage statement) to show that you were a stockholder at the close of business on the record date for the Annual Meeting. The meeting facility will open at 8:30 A.M. (Eastern Daylight Time) on Thursday, July 25, 2024, for registration and check-in, and the Annual Meeting will start at 9:30 A.M. (Eastern Daylight Time).

If you cannot attend the Annual Meeting, a recording of the meeting will be posted to our Investor Relations website at investors.brown-forman.com within 24 hours following the end of the Annual Meeting.


8 Brown-Forman


Table of Contents


Voting

WHO MAY VOTE

If you held shares of Class A common stock at the close of business on the record date, you (or your legal proxy) may vote at the Annual Meeting. At the close of business on the record date, there were 169,123,305 shares of Class A common stock outstanding and entitled to vote at the Annual Meeting. Each share of Class A common stock is entitled to one vote.

If you purchased Class A common stock after the record date, you may vote those shares only if you receive a proxy to do so from the person who held the shares on the record date. If you receive more than one proxy card or voting instruction form, you should complete, sign, date, and return each one (or follow the telephone or online voting instructions) because each card represents different shares.

At the close of business on the record date, there were 305,536,661 shares of Class B common stock outstanding. Class B shares are not entitled to vote.

HOW TO VOTE

STOCKHOLDERS OF RECORD. If your shares are registered directly in your name with our stock transfer agent, Computershare, you are considered the “stockholder of record” of those shares. If you are a stockholder of record of Class A common stock, you can give a proxy to be voted at the Annual Meeting:


LOGO

Even if you plan to attend the Annual Meeting, we encourage you to submit a proxy in advance. If you are voting by telephone or online, we must receive your proxy by 11:59 P.M. (Eastern Daylight Time) on Wednesday, July 24, 2024, to ensure your vote is recorded. To override a proxy or change your voting instructions, see “Changing Your Vote” on the next page.

The telephone and online voting procedures are designed to authenticate your identity, enable you to give voting instructions, and confirm that your instructions are recorded properly. Your proxy will authorize the individuals named on the proxy card to vote your shares as you direct. These individuals can also vote your shares as they see fit on any other matter properly presented for a vote at the Annual Meeting. If for any reason a director nominee is not available to serve, the individuals named as proxy holders may vote your shares at the Annual Meeting for another nominee. The proxy holders for this year’s Annual Meeting are Campbell P. Brown, Lawson E. Whiting, and Michael E. Carr, Jr.

If you are a stockholder of record and you sign and return your proxy card (or give your proxy by telephone or online) without specifying how you want your shares voted, our proxy holders will vote your shares “FOR” the election of each of the director nominees to the Board and “FOR” the ratification of the selection of the independent registered public accounting firm for fiscal 2025. If any other matter properly comes before the Annual Meeting, the proxy holders will vote your shares as recommended by the Board or, if no recommendation is given, using their own discretion.

You may also vote in person at the Annual Meeting. For more information about how to attend the Annual Meeting, please see “Attending the Annual Meeting” on page 8.

“STREET NAME” STOCKHOLDERS. If your shares are held in a stock brokerage account or by a bank (known as holding shares in “street name”), you have the right to instruct your broker or bank how to vote your shares, and the broker or bank must vote as you direct. To provide those instructions by mail, please complete, sign, date, and return your voting instruction form in the accompanying postage-paid envelope. Or, if the broker or bank that holds your shares offers online or telephone voting, you will receive information about how to submit your voting instructions using those methods.


2024 Proxy Statement and Notice of Annual Meeting of Stockholders 9


Table of Contents

If you are a street name stockholder, and you do not instruct your broker how to vote your shares, your broker may vote your shares only under limited circumstances. Under the rules of the New York Stock Exchange (NYSE), brokers that hold your shares may generally use their discretion to vote on “routine” matters but not on “non-routine” matters. While the ratification of the selection of the independent registered public accounting firm for fiscal 2025 is considered a “routine” matter, the election of directors is considered a “non-routine” matter. If your broker does not receive voting instructions from you on how to vote your shares on “non-routine” matters and you do not vote on such matters at the Annual Meeting, your shares will not be voted on such matters. (This is known as a “broker non-vote.”)

CHANGING YOUR VOTE

If you are a stockholder of record, you may change your vote by submitting another proxy by telephone or online, by mailing another properly signed proxy card bearing a later date than your original one, or by attending the Annual Meeting and casting your vote during the Annual Meeting. You also may revoke a proxy that you previously provided by delivering timely written notice of revocation to our Secretary, at Brown-Forman Corporation, 850 Dixie Highway, Louisville, Kentucky 40210, or at Secretary@b-f.com.

If you hold your shares in street name and you wish to change or revoke your voting instructions, please refer to the materials your broker or bank provided to you for instructions.

QUORUM REQUIREMENTS

Your vote is important. We can conduct business at the Annual Meeting only if a quorum, meaning a majority of the outstanding shares of Class A common stock at the close of business on June 10, 2024, is present or represented by proxy. Holders of Class A common stock who attend the Annual Meeting in person or submit a valid proxy or voting instructions are counted as present for purposes of establishing a quorum. Broker non-votes are also counted as present for purposes of establishing a quorum.

VOTES NEEDED FOR APPROVAL


Proposal

   Votes required to pass   

Effect of abstentions and

broker non-votes

Election of directors

   Nominees who receive a majority of the Class A votes cast (the number of shares voted “FOR” the nominee exceeds the number of shares voted “AGAINST” that nominee) will be elected.    No effect.

Ratification of the selection of the independent registered public accounting firm for fiscal 2025

   A majority of the Class A shares present (in person or represented by proxy) and entitled to vote must vote “FOR” the ratification of the selection of the independent registered public accounting firm.   

Abstentions are equivalent to votes “AGAINST” the proposal.


Brokers may vote on this proposal without receiving instructions from the stockholder.

DIVIDEND REINVESTMENT AND EMPLOYEE STOCK PURCHASE PLAN SHARES

Shares of Class A common stock held in Brown-Forman’s dividend reinvestment and employee stock purchase plans are included in your holdings and are reflected on your proxy card. These shares will be voted as you direct.

Announcement of Voting Results

We intend to announce the preliminary voting results at the Annual Meeting and to issue a press release announcing the final voting results later that day. In addition, we will report the final voting results by filing a Form 8-K with the SEC within four business days following the Annual Meeting.

Proxy Solicitation Expenses

Brown-Forman pays the cost of soliciting proxies. Our directors, officers, and other employees may solicit proxies in person or by regular mail, email, phone, or online. These individuals will not receive additional compensation for soliciting proxies. We will, however, reimburse banks, brokers, nominees, and other fiduciaries for their reasonable charges and expenses incurred in forwarding our proxy materials.


10 Brown-Forman


Table of Contents

LOGO


Corporate GOVERNANCE Our Board of Directors Our Board is the policymaking body ultimately responsible for Brown-Forman's business success and ethical culture. The Board oversees the performance of our senior management team, which is responsible for leading and operating Brown-Forman's business. The Board's primary responsibilities include oversight of our corporate strategy, financial condition, executive compensation policies and practices, enterprise risk management, and the ret evaluation, and succession planning for the Chair of the Board and the Chief Executive Offic The Board may hire independent advisors to help it perform its duties. BROWN-FORMAN IS A "CONTROLLED COMPANY." As a publicly listed, family-controlled company, Brown-Forman enjoys a rare gov that members of our controlling stockholder family, the Brown family, participate believe this governance structure gives us a distinct competitive advantage because Brown family members bring a long-term ownership perspective to our Board. This advantage is sustained by a careful balancing of the roles of our Board, management, and our stockholders-including the Brown family.


Selection of Directors

In evaluating candidates for Board membership, the Corporate Governance and Nominating Committee seeks directors who will represent the best long-term interests of all stockholders. As stated in our Corporate Governance Guidelines, all Brown-Forman directors should possess the highest personal and professional ethics, integrity, and values. The Board believes the best directors also have good judgment, candor, civility, business courage, experience with similar businesses or other organizations of comparable or larger size, and a lack of conflicts of interest. We also believe that a significant number of our directors should be independent. See “Our Independent Directors” on the next page to learn more.

The Corporate Governance and Nominating Committee and the Board consider diversity in evaluating candidates for Board membership, though neither has adopted a formal diversity policy. The Board’s goal is to maintain a well-balanced composition that combines a variety of experiences, backgrounds, skills, and perspectives that enable the Board, as a whole, to guide Brown-Forman effectively in the pursuit of our strategic objectives. In evaluating potential Board candidates, the Corporate Governance and Nominating Committee considers an individual’s independence; business, professional, or public service experience; relevant industry knowledge, experience, and relationships; business judgment; financial expertise; international experience; leadership skills; diversity of age, gender, race, ethnicity, religion, nationality, disability, sexual orientation, and cultural background; time availability; and familial relation to our controlling family stockholders.

The Corporate Governance and Nominating Committee occasionally hires independent search firms to help identify potential Board candidates. The Board has not adopted a formal policy regarding candidates nominated by stockholders because the Corporate Governance and Nominating Committee believes the process it follows to identify and select Board members has been appropriate and effective. Stockholders wishing to suggest candidates to the Corporate Governance and Nominating Committee for consideration as directors must submit a written notice to our Corporate Secretary following the procedures set forth in this Proxy Statement under “Communication with our Board” on page 16. Any candidates submitted by stockholders will be evaluated in the same manner as all other director candidates.


2024 Proxy Statement and Notice of Annual Meeting of Stockholders 11


Table of Contents

Board Composition

HOW OUR CONTROLLED-COMPANY STATUS AFFECTS OUR BOARD

Our Board has determined that Brown-Forman is a “controlled company” under NYSE rules because more than 50% of our Class A voting stock is held by members of the Brown family or entities they control. As a controlled company, we are not required to have a majority of independent directors, a fully independent nominating/corporate governance committee, or a fully independent compensation committee. However, as a matter of good corporate governance, the Board has voluntarily chosen to have a majority of independent directors and a compensation committee that is composed entirely of directors who meet the NYSE’s heightened independence standards for compensation committee members. Our Board does not have a fully independent nominating/corporate governance committee. We comply in full with NYSE requirements regarding the independence and qualifications of our Audit Committee members.

OUR INDEPENDENT DIRECTORS

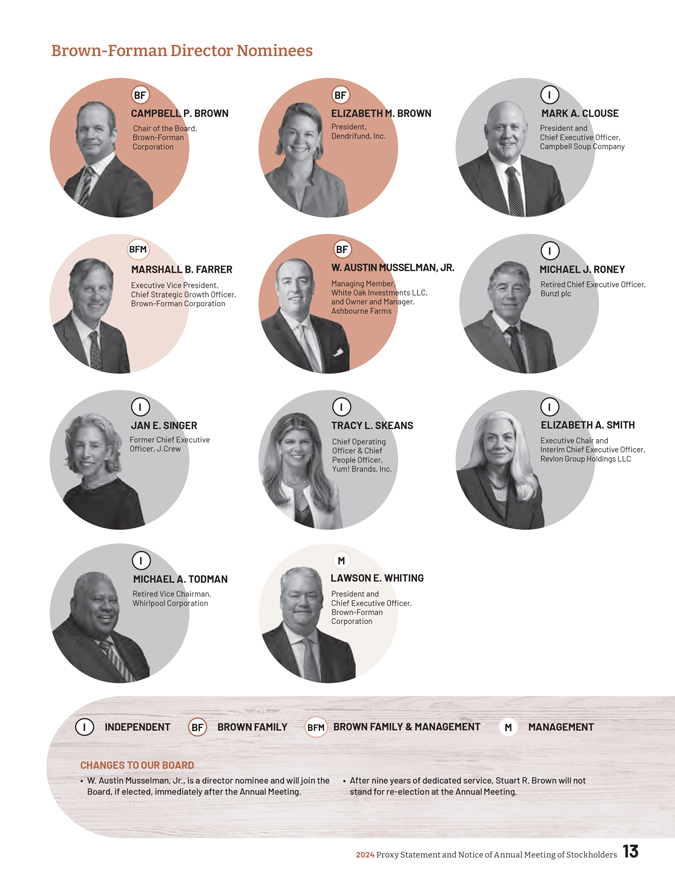
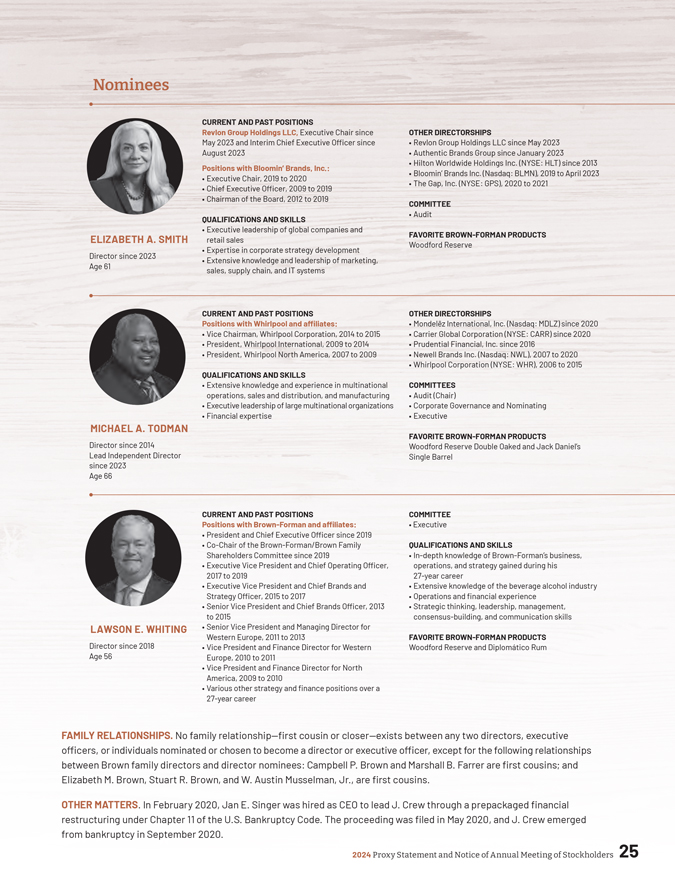
We recognize the value of having independent directors. Under NYSE listing rules, a director qualifies as “independent” if the board of directors determines the director has no “material relationship” with the company. Material relationships can include commercial, industrial, banking, consulting, legal, accounting, charitable, and familial relationships. While the focus is on independence from management, our Board considers all relevant facts and circumstances in making an independence determination. Our Board has determined that the following six of our eleven director nominees are independent under NYSE standards: Mark A. Clouse, Michael J. Roney, Jan E. Singer, Tracy L. Skeans, Elizabeth A. Smith, and Michael A. Todman.

The Board has determined that Campbell P. Brown, Marshall B. Farrer, and Lawson E. Whiting are not independent because they are, or recently have been, members of Brown-Forman management. The Board elected not to make a determination with respect to the independence of Elizabeth M. Brown, W. Austin Musselman, Jr., or Stuart R. Brown (who is not standing for re-election at the Annual Meeting).

OUR BROWN FAMILY DIRECTORS

The Board believes it is strategically important for Brown family members to be actively engaged in the oversight of Brown-Forman. Through participation on the Board, the Brown family can contribute their long-term perspective to every matter the Board considers. Brown family directors also serve as an effective link between the Board and the controlling family stockholders.

In addition, Board service allows the Brown family to actively oversee their investment in the company. Currently, the Brown family directors are Campbell P. Brown, Elizabeth M. Brown, Marshall B. Farrer, and Stuart R. Brown (who is not standing for re-election at the Annual Meeting). W. Austin Musselman, Jr., who is a director nominee, will be a Brown family director, if elected at the Annual Meeting.

OUR MANAGEMENT DIRECTORS

The Board believes it is important, from a corporate governance standpoint, for management to be represented on the Board. Currently, Marshall B. Farrer and Lawson E. Whiting serve in dual roles as Board members and Brown-Forman executives.

FOLLOWING THE ANNUAL MEETING: Diversity 1director is racially/ ethnically diverse 4directors are women 6directors are not diverse by race, ethnicity, or gender Tenure on Board 50-5 years 46-10 years 2 10+ years Age Mix 8directors are age 51-60 3directors are age 61 and older Composition 6-Independent 3-Brown Family 1-Brown Family & Management 1-Management

LOGO


12 Brown-Forman


Table of Contents


LOGO

BF CAMPBELL P. BROWN Chair of the Board, Brown-Forman Corporation BF ELIZABETH M. BROWN President, Dendrifund, Inc. I MARK A. CLOUSE President and Chief Executive Officer, Campbell Soup Company BFM BF I MARSHALL B. FARRER Executive Vice President, Chief Strategic Growth Officer, Brown-Forman Corporation W. AUSTIN MUSSELMAN, JR. Managing Member, White Oak Investments LLC, and Owner and Manager, Ashbourne Farms MICHAEL J. RONEY Retired Chief Executive Officer, Bunzl plc JAN E. SINGER Former Chief Executive Officer, J.Crew TRACY L. SKEANS Chief Operating Officer & Chief People Officer, Yum! Brands, Inc. ELIZABETH A. SMITH ecutive Chair and Interim Chief Executive Officer, evlon Group Holdings LLC I MICHAEL A. TODMAN Retired Vice Chairman, Whirlpool Corporation M LAWSON E. WHITING President and Chief Executive Officer, Brown-Forman Corporation I INDEPENDENT BF BROWN FAMILY BFM BROWN FAMILY & MANAGEMENT M MANAGEMENT CHANGES TO OUR BOARD " W. Austin Musselman, Jr., is a director nominee and will join the Board, if elected, immediately after the Annual Meeting. After nine years of dedicated service, Stuart R. Brown will not stand for re-election at the Annual Meeting.


Table of Contents

Leadership Structure


   BOARD LEADERSHIP STRUCTURE   
 Campbell P. Brown, a Brown    Lawson E. Whiting has served as    Michael A. Todman has served
 family member, has served as    President and Chief Executive Officer    as Lead Independent Director since
Chair of the Board since 2021.    since 2019.    July 2023.

CHAIR OF THE BOARD

Our Board believes that the decision to separate or combine the roles of Chair of the Board and Chief Executive Officer should depend largely upon the identity of the Chief Executive Officer and the composition of the Board at the time. For this reason, the Board does not have a policy on separation of these roles. We have had a separate Chair of the Board and Chief Executive Officer since 2007.

The strength of Brown-Forman’s governance structure is due, in part, to our unique relationship with our controlling family stockholders, the Brown family, who participate directly on our Board. We believe this governance structure gives us a distinct competitive advantage and aligns with long-term interests of stockholders, given the multigenerational ownership perspective that Brown family members bring to our Board. As part of this approach, the Chair of the Board historically has been a member of the Brown family and plays an important role in maintaining a long-term growth perspective.

The duties of the Chair of the Board include presiding over and managing the meetings of the Board and the annual meeting of stockholders; setting the agenda for each Board meeting and consulting with management and the Lead Independent Director regarding materials to be presented to the Board; setting the agenda and leading executive sessions of the full Board and of family directors; supporting a strong Board culture of open dialogue, information flow, and constructive feedback among the Board and management; facilitating communication among the Board, management, and stockholders, including the Brown family; and encouraging director participation. When the roles are separated, the Chair of the Board also acts as an advisor to the Chief Executive Officer on strategic aspects of Brown-Forman’s business and performs other duties as prescribed by the Board.

LEAD INDEPENDENT DIRECTOR

When a director who has not been determined to be independent is also the Chair of the Board, as is currently the case, the Board may select one independent director (after considering the recommendation of the Corporate Governance and Nominating Committee) to serve as Lead Independent Director. The Lead Independent Director, if any, is elected annually. Michael A. Todman has served in this role since July 2023.

The Lead Independent Director’s responsibilities include, in consultation with the Chair of the Board and the Chief Executive Officer, reviewing and approving Board agendas and meeting schedules to assure sufficient time is allotted for discussion; calling meetings of the independent or non-management directors; chairing executive sessions attended solely by independent directors; facilitating open communications among directors and with management between Board meetings and helping directors reach consensus on important matters; serving as liaison between the Chair of the Board and the independent and non-management directors; being available for consultation and direct communication upon the reasonable request of major or long-term stockholders; playing a leadership role in contingency and succession planning; and performing such other duties as the Board may delegate.

In fiscal 2024, there was one executive session attended only by our independent directors.

PRESIDENT AND CHIEF EXECUTIVE OFFICER

As President and Chief Executive Officer of Brown-Forman, Lawson E. Whiting is our highest-ranking executive officer and is responsible for Brown-Forman’s strategy, operations, and performance. Mr. Whiting also serves as a director on our Board.

WHY THE BOARD CHOSE THIS LEADERSHIP STRUCTURE

The Board determined that this leadership structure currently serves the best interests of Brown-Forman and all of its stockholders. Having a Brown family member serve as Chair of the Board promotes the Brown family’s active oversight of, and engagement and participation in, the company and its business, and reflects the fact that Brown-Forman is controlled by the Brown family. In addition, the division of responsibilities allows the Chair of the Board to focus on Board governance and leading the Board in its fundamental role of providing oversight and guidance regarding the business, strategy, and operations of the company, while the Chief Executive Officer can concentrate on managing the company and providing the Board comprehensive insight into Brown-Forman’s business. The Lead Independent Director provides leadership to, and fosters coordination among, our independent directors, encouraging them to bring their outside perspectives to the Board.


14 Brown-Forman


Table of Contents


Board Guidelines and Procedures

CORPORATE GOVERNANCE GUIDELINES

The Board believes transparency is a hallmark of good corporate governance. To that end, the Board has adopted Corporate Governance Guidelines that provide a framework for the Board to exercise its duties. Among other things, these guidelines contain policies and requirements regarding director qualifications; director tenure; director responsibilities; meetings and attendance; committee composition, tenure, and responsibilities; director compensation; and director access to management and independent advisors. The Corporate Governance Guidelines are published on our website at www.brown-forman.com/leadership-and-governance under the “Charters and Policies” heading.

BOARD AND COMMITTEE SELF-ASSESSMENT

The Corporate Governance Guidelines require the Board to conduct an annual self-assessment. Each Board committee (except the Executive Committee) also annually assesses how it performed during the preceding twelve-month period. These assessment procedures vary. Some years we require members to complete questionnaires that call for both quantitative responses and free-ranging comments, while other years we invite an independent consultant to interview each member and identify themes that emerge.

DIRECTOR SERVICE ON OTHER BOARDS

The Board recognizes that its members benefit from the experience of serving on the boards of other companies or nonprofit entities. The Board encourages that service, with the understanding that our directors must also have enough time for their work with Brown-Forman. The Corporate Governance Guidelines state that any director who is employed full-time should not serve on more than two public company boards in addition to the Brown-Forman Board, which includes the board of any public company at which a director is employed. Directors who are not employed full-time may serve on up to three public company boards in addition to the Brown-Forman Board. Directors must inform the Chair of the Board, the Lead Independent Director, the Chair or Secretary of the Corporate Governance and Nominating Committee, or the Secretary of the Board as soon as practicable that they will be, or have been, elected to serve on an additional public company board.

DIRECTOR SERVICE

The Board is authorized to fix the size of the Board at a number between three and seventeen members. Directors are elected each year at the Annual Meeting of Stockholders by a majority of the votes cast by holders of our Class A common stock. Once elected, a director holds office until the next Annual Meeting of Stockholders or until a successor is elected and qualified, unless the director first resigns, retires, or is removed. To enhance periodic Board refreshment, the Board recently elected to eliminate its prior age-based director retirement policy and instead implement various term limits as now reflected in the Corporate Governance Guidelines.

Under the new Guidelines, an independent director may not stand for re-election to the Board at the Annual Meeting of Stockholders following his or her 15th anniversary on the Board. The Lead Independent Director and each Committee Chair are limited to a term of five consecutive years in each such role. No director, except the Chair of the Board, may sit on any committee for longer than seven consecutive years. Members of the controlling Brown family elected to the Board may serve up to nine years on the Board. If recommended by the Corporate Governance and Nominating Committee, these directorship and Committee membership term limits may be waived by the affirmative vote of at least two-thirds of the full Board, excluding the affected director, upon a finding that such continued service would be of significant benefit to the company.

The Chief Executive Officer may serve on the Board for the duration of his or her tenure as Chief Executive Officer. The Chair of the Board, and Brown family directors who are employed by the company, may continue to serve on the Board as long as the Board considers such service to be in the best interests of all stockholders.

BOARD MEETINGS

The Board held six regular meetings and no special meetings during fiscal 2024. All directors are expected to attend the Annual

Meeting, all Board meetings, and all meetings of each committee on which they serve, unless they have an appropriate reason why they cannot attend. All current directors attended 90% or more of the aggregate meetings of the Board and committees on which they served during fiscal 2024. All current directors attended the 2023 Annual Meeting of Stockholders.


2024 Proxy Statement and Notice of Annual Meeting of Stockholders 15


Table of Contents

COMMUNICATION WITH OUR BOARD

Stockholders and other interested parties may communicate with our directors, including the non-management directors or the independent directors as a group, by writing to our Secretary, at 850 Dixie Highway, Louisville, Kentucky 40210, or at Secretary@b-f.com. The Secretary’s office will forward appropriate written communications to the individual director or group of directors to whom they are addressed, with copies to all other directors. We generally will not forward to directors a stockholder communication that the Secretary determines to be primarily commercial in nature, that relates to an improper or irrelevant topic, or that requests general information about Brown-Forman.

Board Committees

Our Board has four standing committees: the Audit Committee, the Compensation Committee, the Corporate Governance and Nominating Committee, and the Executive Committee. Each Board committee operates under a written charter that is posted on our website at www.brown-forman.com/leadership-and-governance under the “Charters and Policies” heading.


AUDIT COMMITTEE


The Audit Committee is responsible for overseeing Brown-Forman’s financial statements; audit process; system of internal accounting and financial controls; policies and processes for assessment and management of enterprise risks; compliance with legal and regulatory requirements; and the internal audit function. In addition, the Audit Committee is solely responsible for the appointment, replacement, and compensation of the independent registered public accounting firm and oversees the independent registered public accounting firm’s qualifications, independence, and performance. The Audit Committee’s responsibilities include preparing the Audit Committee Report that appears on page 66 in this Proxy Statement.


Audit Committee members must satisfy director independence standards prescribed by the NYSE and mandated by the applicable rules of the SEC. Each member of our Audit Committee satisfies all of these heightened independence standards. The Board has determined that each member of our Audit Committee is “financially literate” within the meaning of NYSE rules, and that Mr. Todman is an “audit committee financial expert” under SEC rules.


Committee Members


 Michael A. Todman (Chair)

•  Jan E. Singer

•  Tracy L. Skeans

•  Elizabeth A. Smith


MET ELEVEN TIMES IN FISCAL 2024


COMPENSATION COMMITTEE


The Compensation Committee is responsible for determining the compensation of the Chief Executive Officer and other executive officers; recommending market-competitive compensation for the Board; approving incentive compensation plans and changes to such plans for the Chief Executive Officer and other executive officers; assisting the Board in its oversight of risk related to compensation policies and practices; overseeing the preparation of the Compensation Discussion and Analysis section of this Proxy Statement; and preparing the Compensation Committee Report that appears on page 49 of this Proxy Statement.


The Compensation Committee has hired independent advisors to provide independent advice on executive and director compensation matters. For additional information on the services provided by these independent advisors, as well as the Compensation Committee’s processes and procedure for considering and determining executive compensation, please see the Compensation Discussion and Analysis, which begins on page 30.


Each member of the Compensation Committee qualifies as an independent director under NYSE listing standards (including the heightened independence standards for compensation committee members of non-controlled companies) and as a “non-employee director” under SEC rules. The Board specifically considered factors relevant to the ability of these directors to be independent from management in connection with Compensation Committee service.


Committee Members


 Michael J. Roney (Chair)

•  Mark A. Clouse

•  Jan E. Singer


MET SEVEN TIMES IN FISCAL 2024


16 Brown-Forman


Table of Contents


LOGO

CORPORATE GOVERNANCE AND NOMINATING COMMITTEE


The Corporate Governance and Nominating Committee’s responsibilities include helping the Board identify, recruit, and recommend appropriate candidates to serve as directors; reviewing and recommending qualifications, skills, qualities, and other criteria for new directors; reviewing our corporate governance principles periodically and informing the Board of developments in corporate governance and best practices, taking into account the long-term best interests of all stockholders and our controlled-company status; overseeing the risks related to succession planning and coordinating and overseeing Chief Executive Officer succession planning, and reviewing with the Chief Executive Officer succession planning for the other most senior executive officers; assisting the Board with the annual performance and processes evaluation of the Board, its committees, and management; reviewing and recommending to the Board policies for director retirement and service on multiple public company boards and committees; reviewing and overseeing the company’s political activities and contributions; reviewing the company’s corporate social responsibility actions, including environmental, social, and governance matters, workforce diversity and inclusion matters, and the work of the Brown-Forman Foundation; overseeing the risks related to environmental, social, and governance matters; and overseeing the evaluation process of the Board, its committees, and management. All of the Corporate Governance and Nominating Committee members are independent under NYSE listing standards, except Campbell P. Brown.


Committee Members


 Tracy L. Skeans (Chair)

•  Campbell P. Brown

•  Michael J. Roney

•  Michael A. Todman


MET SIX TIMES IN FISCAL 2024


EXECUTIVE COMMITTEE


The Executive Committee consists of the Chief Executive Officer, the Chair of the Board (if separate from the Chief Executive Officer), and one or more other directors as determined by the Board from time to time. During fiscal 2024, the Lead Independent Director also served on the Executive Committee. The Board can change the Executive Committee membership, fill vacancies, or dissolve the Committee at any time. The Executive Committee may exercise all of the powers of the Board, subject to certain exceptions specified in our By-laws or Delaware law. However, traditionally, the Executive Committee acts only when exercising a power the Board has specifically delegated, when there is an emergency, or when the issue does not warrant the full Board’s attention. In addition, the members of the Executive Committee have historically communicated and met informally, sometimes with Brown-Forman’s General Counsel or Secretary, to engage in strategic planning of Board activities and agenda topics, to stay ahead of various issues on behalf of the full Board, and to review recent Board meetings.


Committee Members


Campbell P. Brown (Chair)

• Michael A. Todman

• Lawson E. Whiting


MET ONCE IN FISCAL 2024


2024 Proxy Statement and Notice of Annual Meeting of Stockholders 17


Table of Contents

Board’s Role in Risk Oversight

The Board believes its current leadership structure best enables it to fulfill its risk oversight function. Our Corporate Governance Guidelines require the Board to implement appropriate processes for managing enterprise risk, as this is an integral part of the strategic planning process. The Board regularly and actively considers how strategic decisions affect Brown-Forman’s risk profile.

While the Board has ultimate oversight responsibility for the enterprise risk management process, certain committees also have specific roles. During fiscal 2024, the Board’s committees assisted with the responsibilities listed below:


Audit Committee. Overseeing the integrity of the company’s financial statements and financial reporting processes; overseeing our policies and processes on enterprise risk assessment, risk management, and compliance, including cybersecurity risk; overseeing our most significant financial reporting and accounting control risks and management’s monitoring and management of those risks; and, together with the Corporate Governance and Nominating Committee, overseeing environmental, social, and governance disclosures and related risks.

Compensation Committee. Overseeing risks related to compensation programs, policies, and practices.

Corporate Governance and Nominating Committee. Overseeing risks related to corporate governance, board composition, and succession planning for the Chief Executive Officer and the Chair of the Board; overseeing the company’s political contributions, activities, and related policies; and, together with the Audit Committee, overseeing risks related to environmental, social, and governance matters.

These committees meet periodically with members of management and outside advisors, as necessary, and report to the Board regularly on their risk oversight and mitigation activities. In addition, management’s Disclosure Controls Committee and Risk Committee both play an integral role in making sure that relevant risk-related information is reported to senior management and the Board as directly and quickly as possible.

Best Practices

We believe good corporate governance is essential to long-term success. As regulations for controlled companies change, we review our corporate governance practices and adopt those practices that we believe are in the best interests of Brown-Forman and all of our stockholders.

CODE OF CONDUCT AND CODE OF ETHICS FOR SENIOR FINANCIAL OFFICERS

The Brown-Forman Code of Conduct outlines the ethical behavior we expect of all our employees and directors. Our Code of Ethics for Senior Financial Officers makes clear that we expect that all our financial, accounting, reporting, and auditing activities will be conducted in strict compliance with all applicable rules and regulations and will conform to the highest ethical standards. We encourage our employees to speak up when aware of a potential Code of Conduct violation, and we provide multiple channels for doing so—including anonymously. For links to the Code of Conduct, including reporting channels, and the Code of Ethics for Senior Financial Officers, please visit the Leadership & Governance page of our website at www.brown-forman.com/leadership-and-governance.

DISCLOSURE CONTROLS COMMITTEE

The Disclosure Controls Committee is composed of members of management. This committee has established controls and procedures designed to ensure that any information we may be required to disclose is gathered and communicated to the committee, that all required disclosures are timely and accurate, and that we are fully compliant with SEC Regulation FD (Fair Disclosure).

RISK COMMITTEE

The Risk Committee is composed of members of management and is responsible for identifying, evaluating, and prioritizing potential risks that the company may face. Then it decides what actions to take and resources to use to minimize, monitor, and control the likelihood or effect of those risks to help ensure the best outcome. The Risk Committee creates and maintains the list of risks (risk register), facilitates risk prioritization, identifies the individuals and teams responsible for mitigating risks, and ensures that plans are in place to mitigate Brown-Forman’s most significant risks. The Chief Ethics, Compliance, and Risk Officer reports on behalf of the Risk Committee to the Audit Committee about procedures, risk ranking results, and risk mitigation. In addition, the Risk Committee reports to the Board at least annually on the top risks facing Brown-Forman and updates the Board periodically on the plans to mitigate those risks.


18 Brown-Forman


Table of Contents


GOVERNMENT RELATIONS ACTIVITIES

Policymakers’ decisions have a significant impact on our business, stockholders, employees, communities, customers, suppliers, and industry. As a result, we seek to engage with and educate elected and appointed officials about our business, operations, industry, company, products, and the communities we serve. We spend time and money on these efforts, and we believe that our stockholders want to stay informed about these activities. Disclosure is also critical to our compliance with the laws, regulations, reporting obligations, and company policies related to our participation in the political process. To improve our transparency about the principles that govern these matters, we adopted our Political Engagement and Contributions Policy, which includes disclosures about our political contributions. This policy can be found on the Leadership & Governance page of our website at www.brown-forman.com/leadership-and-governance.

We encourage you to read the policy to learn more about our political activity. Our disclosures include a list of the company’s memberships in certain trade associations, any Section 527 and 501(c)(4) contributions, political action committee contributions, and our governance of those contributions.

Our Controlling Family Stockholders

Brown-Forman has an engaged family stockholder base with a long-term ownership perspective. We view our status as a publicly traded, family-controlled company as a distinct competitive advantage, and we believe a strong relationship with the Brown family is essential to our growth, independence, and ability to create long-term value for all stockholders. Management interacts with Brown family members in a manner consistent with all applicable laws and regulations. We actively cultivate our relationship with the Brown family through a variety of channels, as detailed below.

BROWN-FORMAN/BROWN FAMILY SHAREHOLDERS COMMITTEE

The Brown-Forman/Brown Family Shareholders Committee was established in 2007 and is currently co-chaired by Campbell P. Brown and Lawson E. Whiting. The Brown-Forman/Brown Family Stockholders Committee provides a forum for frequent, open, and constructive dialogue between Brown-Forman and its controlling family stockholders in accordance with all applicable laws and regulations. In addition, the committee engages the Brown family on topics of mutual interest, such as the company and our industry, governance, ownership, environmental sustainability, philanthropy, and other related topics.


LOGO  

DIRECTOR OF FAMILY SHAREHOLDER RELATIONS

The Director of Family Shareholder Relations, who is a Brown-Forman employee, works with other employees and Brown family members to develop and implement policies and practices designed to further strengthen the relationship and communication between Brown-Forman and the Brown family.


BROWN FAMILY MEMBER EMPLOYEES

At the end of fiscal 2024, Brown-Forman employed ten Brown family members in full-time positions, some of whom participate on management teams that oversee strategic and operational matters. Participation in these roles enables our Brown family employees to contribute their perspectives on the important issues we confront. In addition to their management contributions, the Brown family employees play a critical role in upholding Brown-Forman’s corporate culture.


2024 Proxy Statement and Notice of Annual Meeting of Stockholders 19


Table of Contents

LOGO


Table of Contents


Our Integrated Strategy

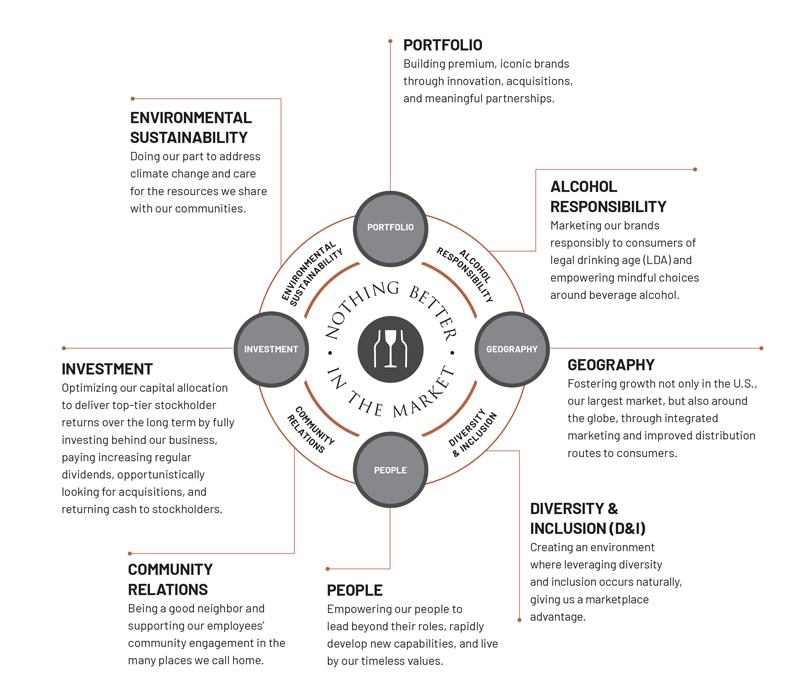
As we strive to achieve our highest ambition of “Nothing Better in the Market,” our integrated strategy focuses on four key pillars: our portfolio, our geographies, our people, and our investments.

In addition, we have long prioritized environmental, social, and governance topics like environmental sustainability, diversity and inclusion, community relations, and alcohol responsibility, and they are embedded into our corporate strategy to elevate their visibility and impacts. We call these efforts Living a Spirit of Commitment. To learn more about our commitments, progress, and performance, visit www.brown-forman.com/our-commitments.


LOGO

Please note that the information provided on our website (or any other website referred to in this Proxy Statement) is not part of this Proxy Statement and is not incorporated herein by reference.


2024 Proxy Statement and Notice of Annual Meeting of Stockholders 21


Table of Contents

LOGO


Table of Contents


LOGO


Table of Contents

LOGO


Table of Contents


LOGO


Table of Contents

Director

COMPENSATION

Overview

Our directors serve one-year terms that begin when they are elected at the Annual Meeting and end immediately upon the election of their successors at the next Annual Meeting of Stockholders. We refer to this period as a “Board Year” for director compensation purposes.

Our non-employee directors receive the following payments and fees for their services: an annual Board retainer, meeting fees, committee member retainers, committee chair retainers, a Lead Independent Director retainer, and a Chair of the Board retainer. Non-employee directors receive their Board retainers in a combination of cash and equity, and receive meeting fees only if they attend more than eight meetings (Board), ten meetings (Audit Committee), or six meetings (Compensation Committee and Corporate Governance and Nominating Committee). The Compensation Committee believes this compensation structure emphasizes the importance of directors’ active participation at Board and committee meetings.

Each year, the Compensation Committee, with the assistance of its independent consultant, reviews our non-employee director compensation to determine whether it is competitive with that of similar companies. From time to time, the Compensation Committee recommends changes to our compensation structure so that it remains competitive and includes an attractive mix of compensation types.

DIRECTOR COMPENSATION STRUCTURE


 Pay Element            Amount  

Board Retainer


The Board retainers are paid in cash and equity. Directors who have not satisfied our stock ownership guidelines are required to receive a minimum of 60% of the equity retainer in equity. Directors who have satisfied our stock ownership guidelines may elect to receive up to 100% of the equity retainer in cash rather than receiving equity. Directors may elect to receive 100% of their cash retainer in equity. The cash retainer is paid in six installments over the Board Year. Any awards of deferred stock units (DSU) are made in full on the Annual Meeting date. A director who joins the Board during a Board Year also receives a pro-rated DSU award for the portion of the prior Board Year served.


$ 235,000 total


  $80,000 cash


  $155,000 equity (DSU)


Meeting Fees


No fee is paid unless the director attends more than eight Board meetings.

     Board       


$5,000 per meeting


$2,500 per telephonic meeting 


No fee is paid unless the director attends more than ten meetings (Audit Committee) or six meetings (Compensation and Corporate Governance and Nominating Committees).


Audit, Compensation,
and Corporate
Governance and
Nominating Committees


$2,500 per meeting


$1,250 per telephonic meeting


Committee Member Retainers


Paid in six installments over the Board Year. A director receives a Committee Member Retainer for each committee on which he or she serves.

     Audit Committee        $25,000  
    
Compensation
Committee
 
 
     $20,000  


Corporate Governance
and Nominating
Committee


     $20,000  

Committee Chair Retainers


(excluding Executive Committee)


Paid in six installments over the Board Year. In addition to Committee Member Retainers, a director receives a Committee Chair Retainer for each committee he or she chairs.

              $20,000  

Lead Independent Director Retainer


Paid in six installments over the Board Year.

              $45,000  

Non-Employee Chair of the Board Retainer


Paid in six installments over the Board Year.

              $490,000  


26 Brown-Forman


Table of Contents


DEFERRED STOCK UNITS

Our DSU program for non-employee directors allows us to issue both Class A common DSUs and Class B common DSUs. Each DSU represents the right to receive one share of Brown-Forman’s Class A or Class B common stock, based on the closing price of the shares on the date the award is made. After a non-employee director’s Board service ends, his or her DSUs are paid out in shares of Class A or Class B common stock following a six-month waiting period. Directors may choose to receive this distribution either in a single lump sum or in ten equal annual installments.

Non-employee directors are credited with the cash dividends on the number of shares represented by the DSUs they held on the record date for that dividend. These dividend credits are converted to additional DSUs based on the market value of the Class A or Class B common stock as of the dividend payment date.

If a director’s Board service ends during a Board Year, the DSUs attributable to the remainder of that Board Year do not vest and are forfeited.

EMPLOYEE DIRECTORS

Lawson E. Whiting and Marshall B. Farrer were our employee directors during the 2024 Board Year. They did not receive any compensation for serving on our Board, any of its committees, or on the boards or equivalent bodies of any of our subsidiaries.


STOCK OWNERSHIP GUIDELINE  
We require non-employee directors to own stock that is equal in value to five times their annual Board retainer, which, for the 2024 Board Year, was $1,175,000. When considering whether a non-employee director has satisfied the stock ownership guideline, the Compensation
Committee includes Class A or Class B common stock held directly and all DSUs but excludes the value of any unexercised SSARs. Any non-employee director who has not yet met the stock ownership guideline will receive at least 60% of his or her annual Board equity retainer in DSUs until the guideline is reached.   LOGO


EXPENSE REIMBURSEMENT

We reimburse all directors for reasonable and necessary expenses they incur when they attend Brown-Forman Board and committee meetings. We provide an additional stipend of $3,000 per meeting to directors who must travel overseas for such Board and committee meetings.


CONTINUING EDUCATION ALLOWANCE

Brown-Forman covers the cost, up to $10,000 per director per Board Year, of continuing education programs to help them stay current on best practices in board governance, industry matters, or other business topics relevant to their Board service.


EVENTS

We occasionally invite our directors and their spouses to events, including strategy retreats, retirement celebrations, award dinners, and similar functions. We believe these occasions provide valuable opportunities for our directors to establish and develop relationships with our senior executives, long-term stockholders, employees, and each other, furthering our objective of having a strong, cohesive Board.


2024 Proxy Statement and Notice of Annual Meeting of Stockholders 27


Table of Contents

Fiscal 2024 Director Compensation

The following table shows the compensation of non-employee directors for their service in fiscal 2024.

FISCAL 2024 DIRECTOR COMPENSATION TABLE


 Name   

Fees Earned or 

Paid in Cash (1)

     DSU Awards (2) (3)     

All Other 

Compensation (4)

    Total  

Campbell P. Brown

     $336,250        $400,000        $3,000         $739,250  

Elizabeth M. Brown

     176,250               3,000       $179,250  

Stuart R. Brown

            235,000              $235,000  

Mark A. Clouse(5) (6)

     62,500        321,740        3,000       $387,240  

John D. Cook(7)

     46,250               217,000       $263,250  

Augusta Brown Holland(7)

     53,750                     $53,750  

Michael J. Roney

     125,000        175,000        12,000       $312,000  

Jan E. Singer

     117,500        155,000        3,000       $275,500  

Tracy L. Skeans

     121,000        155,000        3,000       $279,000  

Elizabeth A. Smith(5) (8)

     25,000        346,329        3,000       $374,329  

Michael A. Todman

     181,250        155,000        3,000       $339,250   


(1)

Amounts in this column reflect fees earned during fiscal 2024 and include annual Board retainer (if paid in cash), Lead Independent Director retainer, annual committee chair and committee member retainers, non-employee Chair of the Board retainer (if paid in cash), and any Board and committee meeting fees.

 
(2)

Determined by dividing the cash value of the compensation being paid in DSUs by the closing price of Class A common stock on the date of grant. DSU awards for the 2024 Board Year were granted on July 27, 2023. The closing price of our Class A common stock on that date was $71.23. On dividend payment dates, outstanding DSUs are credited with dividend-equivalent DSUs.

 
(3)

The aggregate number of Class A and Class B DSUs, and Class B SSARs outstanding for each of our non-employee directors as of April 30, 2024, is set forth below. Annual grants of DSUs vest over the course of the Board Year.


    Name    DSUs (Class A)       DSUs (Class B)       SSARs (Class B)  
  Campbell P. Brown      17,361               37,411  
  Stuart R. Brown      16,416                
  Mark A. Clouse(5)      4,569                

  John D. Cook      17,768        19,202         
  Michael J. Roney      35,129        4,333         
  Jan E. Singer      5,320                
  Tracy L. Skeans      21,283                
  Elizabeth A. Smith(5)      4,918                
  Michael A. Todman      25,597        2,934         


(4)

Reflects stipend amounts paid during fiscal 2024 to directors who traveled to an overseas location for Board and committee meetings. For John D. Cook, reflects payments under a consulting agreement with the Company during fiscal 2024.

 
(5)

The Board’s practice is to grant equity awards to new directors at the beginning of their first full Board year. Mark A. Clouse and Elizabeth A. Smith received equity awards on July 27, 2023 for the 2024 Board Year plus a pro-rated amount for their Board service during fiscal 2023.

 
(6)

Mark A. Clouse joined the Board as a non-employee director on November 17, 2022. The amounts set forth under “DSU Awards” represent awards earned for his service in fiscal 2023 and fiscal 2024.

 
(7)

John D. Cook and Augusta Brown Holland retired from the Board at the 2023 Annual Meeting of Stockholders. The amounts set forth under “Fees Earned or Paid in Cash” represent fees paid for their service in fiscal 2024.

 
(8)

Elizabeth A. Smith joined the Board as a non-employee director on January 24, 2023. The amount set forth under “DSU Awards” represents awards earned for her service in fiscal 2023 and fiscal 2024.


28 Brown-Forman


Table of Contents


Proposal 2:

RATIFICATION OF THE SELECTION OF

THE INDEPENDENT REGISTERED PUBLIC

ACCOUNTING FIRM FOR FISCAL 2025

The Audit Committee is solely responsible for the appointment, replacement, and compensation of the independent registered public accounting firm and oversees that firm’s qualifications, independence, and performance. The Audit Committee has selected Ernst & Young LLP (EY) as Brown-Forman’s independent registered public accounting firm for the fiscal year ending April 30, 2025, and has directed that management submit such selection to stockholders for ratification at the Annual Meeting.


Stockholder ratification of the selection of EY as Brown-Forman’s independent registered public accounting firm is not required by our By-Laws or otherwise. However, we are submitting the selection of EY to stockholders for ratification as a matter of good corporate governance. If stockholders fail to ratify the selection, the Audit Committee will reconsider whether to retain EY. Even if the selection is ratified, the Audit Committee in its discretion may appoint a different independent registered public accounting firm at any time during the fiscal year if it determines that such a change would be in the best interests of Brown-Forman and its stockholders.


EY has served as Brown-Forman’s independent registered public accounting firm since fiscal 2021. The members of the Audit Committee believe that retaining EY to serve as the independent registered public accounting firm is in the best interests of Brown-Forman and its stockholders. A representative of EY is expected to attend the Annual Meeting, will have an opportunity to make a statement, and will be available to respond to appropriate questions.


  LOGO
LOGO   The Board unanimously recommends that you vote “FOR” the ratification of Ernst & Young LLP as Brown-Forman’s independent registered public accounting firm for the fiscal year ending April 30, 2025.


2024 Proxy Statement and Notice of Annual Meeting of Stockholders 29


Table of Contents

COMPENSATION DISCUSSION

AND ANALYSIS

This section describes our executive compensation philosophy and objectives, and the decisions of the Compensation Committee (Committee) regarding the compensation of our named executive officers (NEOs). For fiscal 2024, our NEOs were:


LOGO


30 Brown-Forman


Table of Contents


Executive Summary

PAY FOR PERFORMANCE

Key components of our compensation program are our short- and long-term incentive plans. These programs are designed to drive performance. We establish key performance metrics under each program to measure our performance and to compare it to that of our peers. We believe the use of these metrics helps accomplish four key objectives:


LOGO

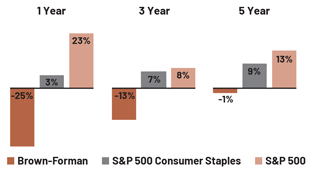
We use company-specific performance measures to assess our short-term performance. However, we believe one of the best measures of the long-term value our company and NEOs create is the return provided to our stockholders relative to the returns of other companies in our industry and the broader Standard and Poor’s (S&P) 500 Index.


LOGO

We show the trends in Brown-Forman’s underlying net sales growth and underlying operating income growth, and how our CEO’s total compensation compares with those trends, in the chart below:

BROWN-FORMAN UNDERLYING NET SALES(1) GROWTH VS. UNDERLYING OPERATING INCOME(2) GROWTH VS. CEO TOTAL COMPENSATION(3) GROWTH


LOGO

TSR: BROWN-FORMAN VS. S&P 500 CONSUMER STAPLES INDEX VS. S&P 500 INDEX(4)


LOGO


(1)

“Underlying net sales” is not derived in accordance with GAAP. Please refer to Appendix A of this Proxy Statement for information about our use of non-GAAP measures.

(2)

“Underlying operating income” is not derived in accordance with GAAP. Please refer to Appendix A of this Proxy Statement for information about our use of non-GAAP measures.

(3)

Compares growth trends of Brown-Forman’s underlying net sales and underlying operating income with the change in total compensation for our CEO (percent change from prior fiscal year). Compensation amounts include base salary, stock-settled stock appreciation rights, non-equity compensation, and compensation reported in the “All Other Compensation” column in the Fiscal 2024 Summary Compensation Table. Compensation shown also includes the performance-based restricted stock unit award values as reported at the end of the applicable three-year performance period. Total compensation differs from total compensation shown in the Fiscal 2024 Summary Compensation Table required by the SEC in that changes in pension values are excluded.

(4)

Represents the compound annual growth rate of the company’s TSR, the S&P 500 Consumer Staples TSR, and the S&P 500 TSR calculated over the specified period.


2024 Proxy Statement and Notice of Annual Meeting of Stockholders 31


Table of Contents

PERFORMANCE-BASED PAYOUTS FOR FISCAL 2024

Our compensation programs demonstrate alignment between pay and performance. They focus on strong and sustained growth in underlying net sales and underlying operating income, both on an absolute basis and relative to industry peers.


LOGO

Equity-Based Incentives

We use equity-based compensation to better align the long-term economic interests of our NEOs with those of our stockholders. We offer our NEOs two types of equity-based incentives: PBRSUs and SSARs.


  PBRSU awards for the fiscal 2022–2024 performance period were converted into shares shortly after the conclusion of fiscal 2024. The number of shares awarded was calculated based on the cumulative TSR of our Class B common stock as compared to the TSR of the companies constituting the S&P 500 Consumer Staples Index. Our relative performance against this group over the performance period was at the 11th percentile, resulting in a payout at 50% of target. The payout of PBRSU awards for the fiscal 2022–2024 performance period was calculated as follows:  


    The PBRSU payout rewards the level at which the TSR of Brown-Forman exceeds that of the S&P 500 Consumer Staples Index companies over the three-year performance period;  


    The number of shares granted is equal to one-third of an employee’s long-term incentive target divided by the strike price on the day shares are granted; and  


    Following the end of the three-year performance period, the award pays out relative to the index, with:  


30th percentile or below relative performance paying at 50% of target;


55th percentile performance paying at 100% of target; and


80th percentile and above performance paying at 150% of target.


Every 1% point growth between the 30th and 80th percentile (e.g., 30% to 31% TSR or 55% to 56% TSR) is equal to a 2% growth up to a maximum of 150% payout.

The number of shares received is the number of shares covered by the award multiplied by the payout percentage, plus dividends issued during the second and third years of performance.


  Payouts of our SSARs are determined by the increase of our Class B common stock price above the awards’ stated grant price.


(1)

“Underlying net sales” is not derived in accordance with GAAP. Please refer to Appendix A of this Proxy Statement for information about our use of non-GAAP measures.

(2)

“Underlying operating income” is not derived in accordance with GAAP. Please refer to Appendix A of this Proxy Statement for information about our use of non-GAAP measures.


32 Brown-Forman


Table of Contents


LOGO


For more than 150 years, Brown-Forman and the Brown family have been committed to driving sustainable growth and preserving Brown-Forman as a thriving, family-controlled, independent company. Guided by our values and core purpose of “enriching life,” success in achieving our ambition to be “Nothing Better in the Market” depends on strategic priorities which build our brands and create stockholder value, including:

  Keeping Jack Daniel’s Tennessee Whiskey strong, healthy, and relevant to consumers worldwide;


  Leading in premium American whiskey and increasing the focus on our super-premium portfolio;


  Delivering on balanced geographic growth and competitive routes to consumers;


  Delivering top-tier TSR through stockholder-friendly capital allocation and balanced investments to fuel growth; and


  Empowering our people to lead, develop new capabilities, and live by our timeless values.

When we look at our business in a larger sense, we recognize the many ways the priorities above contribute value to the world around us. We are inspired to create an environment where diversity and inclusion (D&I) occurs naturally. Our commitment to responsibility, sustainability, and the communities in which we live and work makes a meaningful difference in the way we build brands for our company and consumers over the long term.

ADVISORY VOTES ON EXECUTIVE COMPENSATION

We conduct an advisory vote on our executive compensation (“say-on-pay”) every three years. Our last “say-on-pay” vote occurred at our 2023 Annual Meeting of Stockholders, and our stockholders expressed overwhelming support for the compensation of our NEOs, with more than 99% of the votes cast approving the advisory “say-on-pay” resolution. The Committee considered these results as one of many factors in its executive compensation decisions for fiscal 2024.

Following the expressed preference of our stockholders, we expect to continue to conduct advisory votes on executive compensation every three years, but reserve the right to conduct votes more frequently in order to seek additional feedback from our stockholders. We expect to hold our next “say-on-pay” advisory vote at the 2026 Annual Meeting of Stockholders.

Overview of Our Compensation Program

COMPENSATION OBJECTIVES AND PRINCIPLES

Our executive compensation program is designed to attract, motivate, reward, and retain a diverse team of talented executives who will lead Brown-Forman to produce superior, sustainable, long-term value for our stockholders.

In order to remain competitive and to ensure our executive compensation program is aligned with the interests of our stockholders, our program focuses on creating long-term value, reinforcing financial accountability, demonstrating our values, and delivering outstanding operational outcomes to drive sustained performance of Brown-Forman stock.


LOGO


2024 Proxy Statement and Notice of Annual Meeting of Stockholders 33


Table of Contents

COMPENSATION ELEMENTS

Compensation for our NEOs includes:


LOGO

MEASURING PERFORMANCE

To measure financial performance under our short-term compensation plans, we use two metrics—underlying net sales and underlying operating income. These metrics are determined by adjusting GAAP operating income and net sales for the effects of acquisitions and divestitures, foreign currency changes, estimated net changes in distributor inventories, impairment charges, and other items. Please refer to Appendix A of this Proxy Statement for information about our use of non-GAAP measures.

The Committee believes the most relevant measures of our performance are:


  Strong and sustained growth in underlying net sales and underlying operating income;


  Progress toward our long-term strategic goals, including building a more diverse and inclusive environment;


  Our three-year TSR relative to the S&P 500 Consumer Staples Index; and


  Stock appreciation.

FISCAL 2024 PERFORMANCE METRICS FOR BROWN-FORMAN INCENTIVE PLANS


 Performance-Based Component       Performance Measures

Short-Term Cash Incentive

      70% Weighting: Equal consideration of absolute underlying net sales(1) growth and absolute underlying operating income(2) growth
      20% Weighting: Individual performance
          10% Weighting: D&I progress

PBRSUs

        TSR and company three-year compound annual adjusted operating income(3) growth relative to S&P 500 Consumer Staples Index

SSARs

        Stock price growth above grant price


(1)

“Underlying net sales” is not derived in accordance with GAAP. Please refer to Appendix A of this Proxy Statement for information about our use of non-GAAP measures.

(2)

“Underlying operating income” is not derived in accordance with GAAP. Please refer to Appendix A of this Proxy Statement for information about our use of non-GAAP measures.

(3)

The three-year compound annual growth rate (CAGR) of adjusted operating income is the compound annual growth rate, expressed as a percentage of the Company’s annual operating income determined according to GAAP and adjusted to an underlying basis, as defined in the Company’s non-GAAP measures in Appendix A of this Proxy Statement, except that adjusted operating income will not include any adjustment related to foreign exchange or the estimated net change in distributor inventories.


34 Brown-Forman


Table of Contents


COMPETITIVE COMPENSATION

We compete for senior executive talent with other companies, and we believe that strong, competitive pay linked with company performance attracts the right leadership to deliver the right results for our stockholders.

To help us ensure our compensation program stays competitive and attractive, the Committee compares Brown-Forman’s compensation practices with a 21-company group to benchmark compensation levels and set target compensation. The compensation comparator group companies are discussed on page 39.

The Role of Our Compensation Committee

The Committee serves a critical role in our compensation governance by providing independent oversight and thought leadership on executive compensation and establishing performance objectives that correlate pay and performance. The Committee, with the assistance of its independent compensation consultant, establishes compensation for our NEOs and other designated executive officers, and helps the Board fulfill its duties relating to the compensation of our directors, officers, and employees. The Committee also has the sole authority, on behalf of the Board, to determine the compensation of our CEO.

The Committee is currently composed of three independent directors–Michael J. Roney (Chair), Mark A. Clouse, and Jan E. Singer. Each member of the Committee qualifies as an independent director under the NYSE’s heightened independence standards for compensation committee members of non-controlled companies, and as a non-employee director under SEC rules. As a “controlled company,” Brown-Forman is not required to meet all of these standards, but we believe that doing so is in the best interests of our company and our stockholders.

In making decisions, the Committee members benefit from their own diverse experience, input from members of management, advice from independent compensation advisors, and access to functional experts at the company.


LOGO


2024 Proxy Statement and Notice of Annual Meeting of Stockholders 35


Table of Contents


THE COMPENSATION CONSULTANT


The Committee’s independent compensation advisor is engaged by and reports directly to the Committee and attends Committee meetings as requested. The advisor provides the Committee with information on external compensation trends and guidance on the compensation of our CEO and other NEOs, and also reviews this Compensation Discussion and Analysis. In addition, the advisor provides independent advice to the Board on non-employee director compensation, assists with the Board and Committee self-assessment process, and acts as the Committee’s advisor in working with management.


Willis Towers Watson (WTW) served as the Committee’s advisor during fiscal 2024. During fiscal 2024, WTW performed certain services for the company, in addition to its services to the Committee, including ad hoc compensation consulting (e.g., broad-based incentive plan design, executive titling), compensation survey services, and design work supporting the development of a portal outlining employee pay, benefits, and other rewards. They also provided consulting services related to enterprise risk management, and insurance placement. Fees paid to WTW in fiscal 2024 for compensation committee advisor services totaled $238,188 and all services totaled $407,324, representing less than 1% of WTW’s revenue.


In accordance with SEC and NYSE requirements, the Committee has reviewed the independence of WTW and determined that no conflict exists that would compromise the independence of the firm’s advice.

  LOGO


36 Brown-Forman


Table of Contents

Target Compensation

HOW WE SET TARGET COMPENSATION FOR OUR NEOS

The Committee determines target compensation for each NEO. The Committee considers each NEO’s role, the value of the role in the labor market, and factors specific to the NEO as an individual. Individual factors include internal pay equity, performance, mastery of current role, potential to move into expanded roles, career experience, tenure with Brown-Forman, fit within our culture, scarcity of skill sets, and retention risk. The Committee finds that this approach leads to a more effective pay program than one based solely on external labor market data.

To determine the pay elements that make up each NEO’s compensation package, the Committee begins by reviewing the pay mix offered by companies in our compensation comparator group as well as compensation surveys. The objective is to design a market-competitive pay mix, while supporting our goal of creating sustainable value for stockholders. The Committee, with the assistance of its independent compensation advisor, periodically reviews pay mix to ensure it maintains this alignment.

To ensure our pay is competitive, the Committee compares NEO compensation with that of executives in similar positions within our compensation comparator group as well as general industry companies of comparable size. The Committee’s advisor prepares a market analysis comparing the target compensation levels and mix for our NEOs to the compensation paid by our compensation comparator group and survey participants. This analysis produces a range of market-competitive levels of target compensation as one consideration in determining pay for our NEOs. While the Committee does not set target compensation to meet specific benchmarks, the Committee does consider market median as a factor in determining appropriate target pay ranges for our NEOs.


LOGO


2024 Proxy Statement and Notice of Annual Meeting of Stockholders 37


Table of Contents

FISCAL 2024 BROWN-FORMAN CEO AND NEO PAY MIX VS. COMPENSATION COMPARATOR GROUP

Compensation Comparator Group

Each year, with the assistance of its advisor, the Committee reviews the list of companies against which we compare our compensation packages. Our goal is to make sure that this compensation comparator group continues to share basic characteristics with Brown-Forman. The companies listed below constituted the compensation comparator group for decisions made in fiscal 2024.


Campbell Soup Company

   Energizer Holdings, Inc.    The Boston Beer Company, Inc.

Church & Dwight Co., Inc.

   Harley-Davidson, Inc.    The Clorox Company

Conagra Brands, Inc.

   McCormick & Company, Incorporated    The Hain Celestial Group, Inc.

Constellation Brands, Inc.

   Molson Coors Beverage Company    The Hershey Company

Davide Campari-Milano N.V.

   Monster Beverage Corporation    The J.M. Smucker Company

Diageo plc

   Pernod Ricard SA    Treasury Wine Estates Limited

Edgewell Personal Care Company

   Rémy Cointreau SA    YETI Holdings, Inc.

For fiscal 2024, Columbia Sportswear Company and lululemon athletica inc., were removed and Edgewell Personal Care Company, Energizer Holdings, Inc., and YETI Holdings, Inc. were added.

Target Total Direct Compensation for Fiscal 2024

The chart below shows the annualized target total direct compensation for each of our NEOs in fiscal 2024 versus fiscal 2023, and the percentage change of the compensation packages.

FISCAL 2024 VERSUS FISCAL 2023 NEO TARGET TOTAL DIRECT COMPENSATION


Name    Year     

Salary

and Holiday

Bonus (1)


 Short-Term

Incentive

Target


 Long-Term
Incentive

Target


Target Total

Direct Comp


Percent

Increase

    Pay Mix at Target

Lawson E.

Whiting


2024


$1,250,040


$1,600,000


$6,650,000


$9,500,040


   17%


LOGO


2023


1,250,040


1,500,000


5,360,000


8,110,040


Leanne D.

Cunningham


2024


661,480


575,000


1,500,000


2,736,480


   28%


LOGO


2023


625,020


510,000


     1,000,000        2,135,020            

Marshall B.

Farrer


2024


526,996


371,500


825,500


1,723,996


   31%


LOGO


2023


457,778


298,299


562,896


1,318,973


Matthew E.

Hamel


2024


618,561


356,600


732,900


1,708,061


   4%


LOGO


2023


595,332


342,900


704,700


1,642,932


Thomas W.

Hinrichs(2)


2024


535,341


444,502


558,415


1,538,258


   12%


LOGO


2023


475,618


395,652


497,093


1,368,363


(1)

For purposes of this table, salary and holiday bonuses are based on the one-year period beginning on July 1. Other compensation elements are based on our fiscal year beginning May 1. Any change to compensation during the year is pro-rated.

(2)

The amount shown for fiscal 2023 is the U.S.-dollar equivalent based on the Bloomberg average exchange rate from May 1, 2022 to April 30, 2023 of $1 to 1.04256.The amount shown for fiscal 2024 is the U.S.-dollar equivalent based on the Bloomberg average exchange rate from May 1, 2023 to April 30, 2024 of $1 to 1.08283.


38 Brown-Forman


Table of Contents


Awards and Payouts in Fiscal 2024: Fixed and Short-Term Compensation

FIXED COMPENSATION

Base salary. The Committee typically adjusts salaries each July after completing its annual performance review process, but the Committee may adjust a NEO’s salary at other times to reflect a change in role or responsibility.

Holiday bonus. One of our longstanding traditions is to offer all our salaried employees, including our NEOs, a lump-sum cash bonus during the holiday season. This bonus is intended to promote continued service and to show appreciation for our employees. The holiday bonus, which we consider to be part of base salary for the NEOs, is guaranteed and based solely on an employee’s tenure with Brown-Forman.

The table below shows the total amount of fixed compensation that each of our NEOs received in fiscal 2024.

FIXED COMPENSATION FOR FISCAL 2024(1)


 Name    Amount   

Lawson E. Whiting

   $ 1,250,040   

Leanne D. Cunningham

     655,646   

Marshall B. Farrer

     523,513   

Matthew E. Hamel

     614,845   

Thomas W. Hinrichs(2)

     528,725   


(1)

Reflects fiscal year fixed compensation paid from May 1, 2023, to April 30, 2024, which includes base salary and holiday bonus.

(2)

Mr. Hinrichs is based in Germany and is paid in euros. The amount shown is the U.S.-dollar equivalent based on the average treasury exchange rate from May 1, 2023 to April 30, 2024 of $1 to 1.08283.

SHORT-TERM INCENTIVE COMPENSATION

Our NEOs receive cash payouts each year, depending on the achievement of certain performance goals during the fiscal year. For more information, please see “Performance-Based Payouts for Fiscal 2024” on page 32.

For fiscal 2024, 70% of the target award was tied to company performance, 20% was tied to individual performance, and 10% was tied to the progress made with our D&I ambitions. The Committee believes that basing most of our NEOs’ short-term incentive cash awards on company performance appropriately reflects their accountability, as a group, for the company’s success. The Committee also believes that basing a lesser, but meaningful, portion of the short-term incentive cash awards on individual and D&I performance provides flexibility to recognize each NEO’s individual achievements during the fiscal year, as well as accountability for Brown-Forman’s D&I progress within our “Be Better, Do Better” commitments and our D&I progress within our Many Spirits, One Brown-Forman strategic plan.

The company, individual, and D&I portions of our short-term incentives are subject to a performance factor of 0% to 200%. After adjusting for performance, the three components are added together to determine the total short-term incentive payment. As a result, the total value of short-term incentive payouts may vary between 0% and 200% of target—a range we believe is sufficient for recognizing varying levels of performance without encouraging excessive risk-taking.


2024 Proxy Statement and Notice of Annual Meeting of Stockholders 39


Table of Contents

COMPANY PERFORMANCE (70% OF TARGET AWARD)

Company performance goals for short-term incentive compensation in fiscal 2024 were based on Brown-Forman’s underlying net sales growth, with a target of 5%, and underlying operating income growth, with a target of 7%. Brown-Forman delivered 4% growth in underlying net sales and 12% growth in underlying operating income in fiscal 2024.

Underlying net sales and underlying operating income were calculated by adjusting, as applicable, GAAP operating income and net sales for the following effects:


  Acquisitions and divestitures;


  Foreign exchange;


  Estimated net changes in distributor inventories;


  Impairment charges; and


  Other items

The fiscal 2024 short-term performance goals, our actual performance, and the resulting payout percentage of 134% of target are shown in the chart below:


LOGO


(1)

”Underlying net sales” is not derived in accordance with GAAP. Please refer to Appendix A of this Proxy Statement for information about our use of non-GAAP measures.

(2)

“Underlying operating income” is not derived in accordance with GAAP. Please refer to Appendix A of this Proxy Statement for information about our use of non-GAAP measures.


40 Brown-Forman


Table of Contents


INDIVIDUAL PERFORMANCE (20% OF TARGET AWARD)

Individual performance objectives for the NEOs consist of qualitative and quantitative goals that support the achievement of our strategic priorities, such as fulfilling individual job responsibilities, implementing talent development initiatives, developing profit-driving ideas, and making overall contributions to Brown-Forman as a senior leader. Payout levels for the individual portion of the short-term incentive are based on the following guidelines for aligning performance and compensation:


 Performance (B-F Nomenclature)    Payout as a Percentage of Target  

Superior (Excellent)

     200%  

Above Target (Very Strong)

     143%  

On Target (Strong)

     120%  

Below Target (Varied or Inconsistent)

     50%  

Immediate Improvement Required (Performance Needs Improvement)

     No incentive paid  

DIVERSITY AND INCLUSION PERFORMANCE (10% OF TARGET AWARD)

D&I objectives for the NEOs consist of qualitative ambitions that support the achievement of our D&I priorities, as outlined in our Many Spirits, One Brown-Forman strategic plan. These ambitions focus on how we further leverage diversity at Brown-Forman, from developing customized mentoring initiatives, to launching more robust leadership development programs focused specifically on inclusion, to establishing better quantitative data to analyze our talent pipelines and movement. The ambitions include initiatives focused specifically on representation of women in senior leadership roles globally, and in the U.S., representation of people of color and self-identified LGBTQ+ people at all levels of the organization.

Our key accomplishments in fiscal 2024 include:


  Brown-Forman achieved 45% for women in senior leadership positions globally, exceeding our 2030 ambition of 40%.
  Brown-Forman achieved people of color representation of 20% at all levels of the U.S. organization, placing us on track to achieve our 2030 ambition of 25%.
  Brown-Forman achieved representation of 3% for self-identified LGBTQ+ employees and is on track to achieve our 2030 ambition of 6%.

Payout for the D&I portion of the short-term incentive was 100% for fiscal 2024 based on the performance range noted below:


 Performance    Payout as a Percentage of Target  

Above Target

     126% -200%  

On Target

     76% - 125%  

Below Target

     Up to 75%  

Short-Term Compensation Payouts in Fiscal 2024

The amount paid to each NEO in short-term incentive compensation for fiscal 2024 is set forth in footnote 5 to the “Non-Equity Incentive Plan Compensation” column of the Fiscal 2024 Summary Compensation Table found on page 50.


2024 Proxy Statement and Notice of Annual Meeting of Stockholders 41


Table of Contents

Awards and Payouts in Fiscal 2024: Long-Term Compensation

Long-term incentives are the most important and largest portion of our NEOs’ compensation. These awards are intended to focus the efforts of our executives on long-range strategic goals, including sustainable growth and performance of our brands and superior returns to our stockholders. They also serve as a strong retention incentive and enhance the alignment of our executives’ interests with those of our stockholders by building equity ownership.

The Committee initially determines the target dollar value of the total long-term incentive award for each NEO. The target long-term incentives for the fiscal 2022-2024 performance period were divided into three components: one-third performance-based cash incentives, one-third performance-based restricted stock units, and one-third stock-settled stock appreciation rights. The target long-term incentives granted in fiscal 2024 for the fiscal 2024-2026 performance period are divided into two components:


LOGO

AWARDS EARNED IN FISCAL 2024 (FOR THE FISCAL 2022-2024 PERFORMANCE PERIOD)

Long-term cash awards for the three-year performance period beginning in fiscal 2022 were paid out shortly after fiscal 2024 ended. The goals for the fiscal 2022-2024 performance period are based 50% on underlying net sales performance and 50% on underlying operating income performance, in both cases, compared to our relative performance against our industry.


LOGO


  (1)

“Underlying net sales” is not derived in accordance with GAAP. Please refer to Appendix A of this Proxy Statement for information about our use of non-GAAP measures.

  (2)

“Underlying operating income” is not derived in accordance with GAAP. Please refer to Appendix A of this Proxy Statement for information about our use of non-GAAP measures.

AWARDS AND PAYOUTS IN FISCAL 2024: LONG-TERM COMPENSATION

The table below shows the long-term cash award that each NEO earned in fiscal 2024 based on the 99% payout for the fiscal 2022-2024 performance period.

Long-Term Cash Awards Paid for Fiscal 2022-2024 Performance Period


 Name    Amount  

Lawson E. Whiting

   $ 1,645,329  

Leanne D. Cunningham

     204,177  

Marshall B. Farrer

     141,499  

Matthew E. Hamel

     221,683  

Thomas W. Hinrichs(1)

     164,622  


  (1)

Mr. Hinrichs is based in Germany and is paid in euros. The amount shown is the U.S.-dollar equivalent based on the Bloomberg average exchange rate from May 1, 2023 to April 30, 2024 of $1 to 1.08283.


42 Brown-Forman


Table of Contents


LONG-TERM PERFORMANCE-BASED CASH AWARDS: FISCAL 2022-2024 PERFORMANCE PERIOD

Based on our performance, the payout was 99% of the target award, as shown in the graphic below:


LOGO


(1)

“Underlying net sales” is not derived in accordance with GAAP. Please refer to Appendix A of this Proxy Statement for information about our use of non-GAAP measures.

(2)

“Underlying operating income” is not derived in accordance with GAAP. Please refer to Appendix A of this Proxy Statement for information about our use of non-GAAP measures.

Performance-Based Restricted Stock Units

The Committee awards our NEOs and certain other executives shares of Class A common stock through our PBRSU awards. Unless otherwise determined by the Committee, PBRSU awards are granted on the date of the Annual Meeting of Stockholders.

AWARDS GRANTED IN FISCAL 2024 (FOR THE FISCAL 2024-2026 PERFORMANCE PERIOD)

PBRSU awards granted in fiscal 2024 have a three-year performance period. These awards are initially expressed as a dollar value and converted to a specific number of units. At the end of the three-year performance period, the number of units awarded, if any, will be adjusted for performance and dividends paid during the second and third years of the performance period and converted to shares.


2024 Proxy Statement and Notice of Annual Meeting of Stockholders 43


Table of Contents

TARGET PBRSU AWARDS FOR FISCAL 2024-2026 PERFORMANCE PERIOD


 Name    Amount  

Lawson E. Whiting

   $ 4,433,569  

Leanne D. Cunningham

     1,000,069  

Marshall B. Farrer

     550,394  

Matthew E. Hamel

     488,638  

Thomas W. Hinrichs (1)

     375,382  


(1)  Mr. Hinrichs is based in Germany and is paid in euros. The amount shown is the U.S.-dollar equivalent based on the 90-day period average exchange rate from April 29, 2023, through July 27, 2023, of $1 to 1.09176.


The Committee measures performance by comparing the three-year cumulative TSR of Brown-Forman’s Class B common stock with the three-year cumulative TSR of the companies in the S&P 500 Consumer Staples Index and the three-year compound annual growth rate (CAGR) of Brown-Forman’s adjusted operating income relative to the S&P 500 Consumer Staples Index. The range of payout, if any, is 50% to 150% of target. The company has a 50% payout floor for performance below 30th percentile because the company does not offer executives time-based restricted stock units. Instead, for the sake of simplicity, the payout floor mirrors the effect of time-based restricted stock units in the plan design without introducing an additional award element.

PBRSU AWARDS: PAYOUT SCALE AND POTENTIAL PAYOUTS FOR FISCAL 2024-2026 PERFORMANCE PERIOD


LOGO

Payouts for performance between threshold and target and between target and maximum will be determined by using a straight-line method. In calculating TSR, we look at the average closing stock prices over the 60 trading days preceding the commencement of the performance period and the final 60 trading days of the performance period. The companies used for the performance comparison will be those that constitute the S&P 500 Consumer Staples Index at the end of the performance period. In calculating relative operating income growth, we look at compound annual growth rate during the performance period using the same S&P 500 Consumer Staples Index.


(1)

The three-year compound annual growth rate (CAGR) of adjusted operating income is the compound annual growth rate, expressed as a percentage of the Company’s annual operating income determined according to GAAP and adjusted to an underlying basis, as defined in the Company’s non-GAAP measures in Appendix A of this Proxy Statement, except that adjusted operating income will not include any adjustment related to foreign exchange or the estimated net change in distributor inventories.


44 Brown-Forman


Table of Contents


AWARDS EARNED IN FISCAL 2024 (FOR THE FISCAL 2022-2024 PERFORMANCE PERIOD)

The Committee determined PBRSU awards for the fiscal 2022-2024 performance period by comparing the three-year cumulative TSR of Brown-Forman’s Class B common stock with the three-year cumulative TSR of the companies on the S&P 500 Consumer Staples Index when the performance period ended. The Committee chose a range of payouts (50% to 150% of target) to support our goals of pay for performance and increased NEO equity ownership, while at the same time discouraging unnecessary risk-taking. PBRSU awards were earned over the three-year performance period ended April 30, 2024.

The following companies were listed on the S&P 500 Consumer Staples Index at the end of the 2022-2024 performance period:


Altria Group, Inc.

   Hormel Foods Corporation    Target Corporation

Archer-Daniels-Midland Company

   Kellanova    The Clorox Company

Brown-Forman Corporation (Cl B)

   Kenvue    The Coca-Cola Company

Bunge Global

   Keurig Dr Pepper Inc.    The Estée Lauder Companies Inc. (Cl A)

Campbell Soup Company

   Kimberly-Clark Corporation    The Hershey Company

Church & Dwight Co., Inc.

   Lamb Weston Holdings, Inc.    The J.M. Smucker Company

Colgate-Palmolive Company

   McCormick & Company, Incorporated    The Kraft Heinz Company

ConAgra Brands, Inc.

   Molson Coors Beverage Company (Cl B)    The Kroger Co.

Constellation Brands, Inc. (Cl A)

   Mondelēz International, Inc. (Cl A)    The Procter & Gamble Company

Costco Wholesale Corporation

   Monster Beverage Corporation    Tyson Foods, Inc. (Cl A)

Dollar General Corporation

   PepsiCo, Inc.    Walgreens Boots Alliance, Inc.

Dollar Tree, Inc.

   Philip Morris International Inc.    Walmart Inc.

General Mills, Inc.

   Sysco Corporation   

Based on performance over the three-year period ended April 30, 2024, the awards paid out at 50% of target, as shown below.

PBRSU AWARDS:

PERFORMANCE FOR FISCAL 2022-2024 PERFORMANCE PERIOD


LOGO

Payouts for performance between threshold and target and between target and maximum are determined by using a straight-line method. In calculating TSR, we look at average closing stock prices over the 60 trading days preceding the commencement of the performance period and the final 60 trading days of the performance period.

The Committee determined the number of shares to issue by multiplying the target award by the three-year performance percentage and adjusting the resulting number upwards to account for dividends paid during the second and third years of the performance period. The Committee chose this calculation method so that our NEOs’ compensation remains exposed to changes in stock price, but also allows them to earn the dividends paid during the performance period, consistent with the goals of our long-term incentive plan.

The shares awarded for the 2022-2024 performance period were issued on June 3, 2024. For more information on the PBRSU awards granted during fiscal 2024, please see the Fiscal 2024 Grants of Plan-Based Awards Table on page 52 and the Outstanding Equity Awards at 2024 Fiscal Year-End Table on pages 53-54.


2024 Proxy Statement and Notice of Annual Meeting of Stockholders 45


Table of Contents

The table below shows the number of shares of PBRSUs issued for the fiscal 2022-2024 performance period.

SHARES ISSUED FOR FISCAL 2022-2024 PERFORMANCE PERIOD


 Name    Class A Shares   

Lawson E. Whiting

     12,887   

Leanne D. Cunningham

     1,600   

Marshall B. Farrer

     1,109   

Matthew E. Hamel

     1,737   

Thomas W. Hinrichs

     1,433   

Stock-Settled Stock Appreciation Rights

The Committee awards SSARs that allow our NEOs to receive the value of the appreciation of our Class B common stock from the grant date. Unless the Committee determines otherwise, SSARs are granted annually on the date of the Annual Meeting of Stockholders. The Committee determined the number of Class B common stock SSARs awarded to our NEOs for fiscal 2024 by dividing the total dollar value of each SSAR award by the value of one SSAR ($21.75 determined by the Black-Scholes method) at the close of trading on the grant date. SSARs become exercisable on the first day of the third fiscal year following the grant date, and generally are exercisable for seven fiscal years thereafter. The SSARs granted in July 2023 (for fiscal 2024) become exercisable on May 1, 2026, and expire on April 30, 2033. For more information on the SSARs awarded during fiscal 2024, please see Fiscal 2024 Grants of Plan-Based Awards Table on page 52 and the Outstanding Equity Awards at 2024 Fiscal Year-End Table on pages 53-54.

The table below shows the number of SSARs awarded to our NEOs in fiscal 2024.

SSAR GRANTS IN FISCAL 2024 (IN CLASS B COMMON STOCK)


 Name    SSARs Granted   

Lawson E. Whiting

     101,906   

Leanne D. Cunningham

     22,987   

Marshall B. Farrer

     12,651   

Matthew E. Hamel

     11,232   

Thomas W. Hinrichs

     8,628   

Other Compensation Elements

Post-Termination Compensation and Benefits

We do not have employment agreements with any of our NEOs, nor do we have a formal severance plan that provides for post-termination compensation or benefits. However, we occasionally enter into a consulting agreement with a retiring executive to facilitate the efficient transition of leadership.

Employee Benefits and Perquisites

We provide our NEOs with certain benefits that are available to nearly all of our salaried employees in the United States, including term life insurance (equal to two times target cash compensation), travel accident insurance, matching contributions to a 401(k) savings plan, medical and dental insurance, and a pension that grows with each additional year of service and pay increase, as more fully discussed in “Pension Benefits” on page 55. Mr. Hinrichs, a German citizen, is not eligible to participate in the 401(k) savings plan or the U.S.-based pension. NEOs and certain other executives receive additional benefits, including a leased automobile or automobile allowance, automobile insurance, residential security system, as required, and limited reimbursement of financial planning expenses. For more detail on these benefits, please see the “All Other Compensation” column of the Fiscal 2024 Summary Compensation Table found on page 50.

We purchase tickets to sporting and entertainment events for business outings with customers and suppliers. If the tickets are not used for business purposes, employees (including the NEOs) may use the tickets at no incremental cost to Brown-Forman. In addition, we occasionally invite the NEOs and their spouses to social events, including retirement celebrations, award dinners, and similar functions. We believe these events provide valuable opportunities for our senior executives to establish and develop relationships with our directors, long-term stockholders, employees, and each other. For more detail on these employee benefits, please see the “All Other Compensation” column of the Fiscal 2024 Summary Compensation Table on page 50.


46 Brown-Forman


Table of Contents


Brown-Forman Corporation Executive Savings Plan


Our NEOs and other senior executives can defer income on a pre-tax basis to help them plan for future financial needs. The Brown-Forman Corporation Executive Savings Plan (Savings Plan) enhances the perceived value of compensation for participants at very little cost to Brown-Forman. The Savings Plan allows our NEOs to make pre-tax deferrals of up to 50% of base salary (including holiday bonus) and up to 75% of short- and long-term cash incentives. Participants in the Savings Plan may notionally invest their plan balances in mutual funds within generally the same asset classes available to participants in our qualified 401(k) savings plan.


In the event a participant’s deferrals into the Savings Plan reduce the participant’s taxable compensation that would otherwise be considered 401(k)-eligible pay upon which a company matching contribution is calculated, Brown-Forman will contribute to the Savings Plan to make up for any lost match under the 401(k) plan. All deferrals to the Savings Plan, and Brown-Forman’s contributions to it, are 100% vested when made, as are any deemed earnings related to those contributions. The benefits owed under the Savings Plan are general unsecured obligations of Brown-Forman. Brown-Forman is not entitled to an income tax deduction on the benefits owed under the Savings Plan until the benefits become taxable to the participants, which generally will be when the benefits are actually paid. Benefits accumulated under the Savings Plan are payable at either a participant-selected date at least two years after a contribution is made or after a participant’s employment terminates. Amounts accumulated are payable in a lump sum six months after termination, except in the case of retirement, where the form of payment (lump sum or installments of up to ten years) and the time of payment (up to ten years after retirement) will be chosen by the participant. The Fiscal 2024 Non-Qualified Deferred Compensation Table on page 57 contains information about NEO activity in the Savings Plan during fiscal 2024, including employee contributions, gains and losses attributable to the change in market value of the notional investments, and any payments to our NEOs.


Compensation Policies and Practices


Incentive Compensation Recoupment Policy


The Committee oversees our Incentive Compensation Recoupment Policies. In 2013, the Board adopted a recoupment policy applicable to executive officers and other senior officers designated by the Compensation Committee. This long-standing policy provides that, if Brown-Forman has to restate its reported financial results due to material noncompliance with any financial reporting requirement under the U.S. federal securities laws within three years after the date the results are first publicly issued or filed, or if we discover a material error in the calculation of any incentive compensation that was awarded or paid within the preceding three years, then Brown-Forman will, at the direction of the Committee, seek to recover all or part of the incentive compensation that should not have been awarded or paid.

  LOGO


2024 Proxy Statement and Notice of Annual Meeting of Stockholders 47


Table of Contents

If the Committee determines that any executive officer engaged in fraud or intentional misconduct in connection with any such material noncompliance or error in incentive calculation, the Committee can direct Brown-Forman to seek to recover the incentive compensation that should not have been awarded or paid for a period of six years after the date that such financial results were first publicly issued or filed or six years before the date such fraud or misconduct was discovered. The Committee has sole discretion in making all determinations under the Incentive Compensation Recoupment Policy, including the amount, if any, the company will seek to recover, whether the conduct of an executive officer caused or contributed to the need for a financial restatement or correction in the calculation of an incentive payment, and whether an executive officer engaged in fraud or intentional misconduct. Any determination made by the Committee under this policy is final, conclusive, and binding on all interested parties.


In 2023, the Board adopted its new “Policy on Recoupment of Incentive Compensation” (the New Policy) applicable to current and former executive officers (Covered Officers) designated by the Board as “officers” pursuant to Rule 16a-1(f) of the Securities Exchange Act of 1934, as amended (Exchange Act). The New Policy complies with the final rules adopted by the SEC under Section 10D and Rule 10D of the Exchange Act, and the related new listing standards adopted by the NYSE (collectively, the Clawback Rules). The new policy applicable to Covered Officers provides for mandatory recovery of erroneously awarded “incentive-based compensation” as defined in the Clawback Rules. The recovery of such compensation applies regardless of whether a Covered Officer engaged in misconduct or otherwise caused or contributed to the requirement of an accounting restatement. Under the New Policy, the company is entitled to recoup from Covered Officers erroneously awarded “incentive-based compensation” received within a look-back period of the three completed fiscal years preceding the date on which the company is required to prepare an accounting restatement. The foregoing description of the New Policy is only a summary and is qualified in its entirety by reference to the full text of the “Policy on Recoupment of Incentive Compensation,” a copy of which was filed as Exhibit 97 to the Company’s Annual Report on Form 10-K for the year ended April 30, 2024.


Retirement Age Policy


Our NEOs and other executive officers with high-level policymaking positions are subject to a mandatory retirement age of 65. Such NEOs and executive officers are personally notified of the mandatory retirement policy at age 60 (or older if the individual attains such a position after age 60). An employee who does not become an NEO or executive officer until after attaining the age of 65 will have a two-year grace period once becoming subject to the policy.


Deductibility of Compensation


Under the Tax Cuts and Jobs Act of 2017, effective for our taxable years beginning on or after January 1, 2018, the exception under Section 162(m) for performance-based compensation is no longer available, subject to transition relief for certain grandfathered arrangements in effect as of November 2, 2017.


To maintain flexibility, Brown-Forman has never had a policy requiring that all NEO compensation be fully deductible.


Compensation Risk Assessment


To determine the level of risk arising from our compensation policies and practices, we conduct an annual risk assessment, with oversight by the Committee, its independent advisor, and our internal auditors. The assessment is based

  LOGO   


48 Brown-Forman


Table of Contents


on a framework provided by the Committee’s independent advisor and examines the risk associated with the compensation programs applicable to all of our employees. The assessment also considers the features of our compensation programs that are designed to mitigate risk. We believe our compensation programs encourage and reward an appropriate level of risk-taking. Management and the Committee concluded, based upon the results of the assessment for fiscal 2024, that our compensation policies and practices are not reasonably likely to have a material adverse effect on Brown-Forman.

Equity Award Grants

Under the 2022 Omnibus Compensation Plan, the grant date of any award must be the date of the Committee or Board meeting at which it was approved, and the grant price must be the closing price of the relevant class of our common stock on the grant date. We do not have a program, plan, or practice of timing equity award grants in conjunction with the release of material nonpublic information (or vice versa). We have never re-priced or back-dated options or SSARs granted under any of our equity compensation plans, and both our 2013 Omnibus Compensation Plan and our 2022 Omnibus Compensation Plan specifically prohibit such practices. Neither the Committee nor the Board granted options or SSARs to our NEOs in fiscal 2024 during a period beginning four business days before, or one business day after, (i) the filing of a periodic report on Form 10-Q or Form 10-K, or (ii) the filing or furnishing of a current report on Form 8-K that disclosed material non-public information.

Source of Plan Shares

We try to limit the source of shares delivered to participants under our equity compensation plans to those we purchase from time to time on the open market (in connection with our publicly announced share repurchase programs), in private transactions, or otherwise. We may use newly issued shares to cover exercises or redemptions of awards and then purchase an equal number of shares on the open market or otherwise as quickly as is reasonably practicable thereafter.

Insider Trading Policy; Hedging, Derivatives, and Short Sale Transactions Prohibited

Our Board has adopted an Insider Trading Policy to promote compliance with applicable securities laws that prohibit certain persons who are aware of material nonpublic information about a company from (i) trading in securities of that company or (ii) providing material non-public information to other persons who may trade on the basis of that information. Our Insider Trading Policy includes certain procedures governing the purchase, sale, and other disposition of Brown-Forman securities by employees, officers, directors, and their family members. Furthermore, our Insider Trading Policy prohibits employees, officers, directors, and their family members from selling Brown-Forman securities that they do not own (a short sale); from engaging in transactions involving exchange-traded options, puts, calls, or other derivative securities based on Brown-Forman securities; and from engaging in any hedging or monetization transactions accomplished through a number of possible mechanisms, including the use of financial instruments such as prepaid variable forwards, equity swaps, and collars.

Our Policy on Stock Ownership Guidelines

We do not have stock ownership guidelines for our employees. However, the Committee does review the stock ownership status of our NEOs before granting additional stock-based compensation each year to ensure that such grants are necessary and to assess potential retention risk. We list the stock beneficially owned by our NEOs on page 61.

CONCLUSION

We believe our executive compensation program continues to successfully attract, motivate, reward, and retain a team of talented and diverse executives and high-performing employees, both in the United States and around the world, who will lead us to achieve our corporate ambition so aptly described as “Nothing Better in the Market” and enable us to deliver sustainable and superior value to our stockholders over time.

COMPENSATION COMMITTEE REPORT

We, the Compensation Committee of the Board of Directors of Brown-Forman Corporation, have reviewed and discussed with management the foregoing Compensation Discussion and Analysis and, based on such review and discussion, have recommended to the Board of Directors that the Compensation Discussion and Analysis be included in this Proxy Statement.


COMPENSATION COMMITTEE


Michael J. Roney, Chair


Mark A. Clouse


Jan E. Singer


2024 Proxy Statement and Notice of Annual Meeting of Stockholders 49


Table of Contents

COMPENSATION TABLES

Summary Compensation

The following table sets forth the compensation of our NEOs for the fiscal years shown below, calculated under SEC rules.

FISCAL 2024 SUMMARY COMPENSATION TABLE


 Name and

 Principal Position

   Year      Salary(1)      Bonus(2)     

Stock

Awards(3)


SSAR/Option

Awards(4)


Non-Equity

Incentive Plan

Compensation(5)


Change in

Pension

Value and

Non-Qualified

Deferred

Compensation

Earnings(6)


All Other

Compensation(7)

     Total   


Lawson E. Whiting

President and Chief Executive Officer


2024


$1,250,040


$4,765,947


$2,216,456


$3,706,929


$1,145,802


$108,986


$13,194,160 


2023


1,250,040


2,075,901


1,786,508


3,387,283


1,095,610


55,920


9,651,262 


2022


1,250,040


1,681,355


1,690,184


2,731,438


811,189


200,730


8,364,936 


Leanne D.

Cunningham

Executive Vice President and Chief Financial Officer


2024


655,646


1,075,043


499,967


937,015


579,124


37,906


3,784,701 


2023


620,842


387,315


333,304


902,001


450,596


38,881


2,732,939 


2022


551,347


208,674


209,751


628,172


33,189


1,631,133 


Marshall B. Farrer(8)

Executive Vice President, Chief Strategic Growth Officer


2024


523,513


591,656


275,159


614,976


247,451


1,407,142


3,659,897 


Matthew E. Hamel

Executive Vice President and General Counsel


2024


614,845


525,270


244,296


676,170


160,325


45,012


2,265,918 


2023


591,131


272,955


234,894


636,720


124,578


36,442


1,896,720 


2022


566,488


226,545


227,740


496,180


33,297


1,550,250 


Thomas W. Hinrichs(9)

Executive Vice President, President, Emerging International


2024


528,725


403,524


187,659


731,140


22,130


1,873,178 


2023


473,252


193,113


166,145


688,477


468,187


1,989,174 


2022


507,537


186,930


187,892


526,788


441,107


1,850,254 


(1)

Salary includes holiday bonus and is based on the fiscal year beginning May 1, 2023. The holiday bonus, which is provided to all salaried employees, is based on the employee’s tenure as shown in the table below:

Length of Continuous Service

   Amount of Holiday Bonus 

3 months but less than 6 months

   1/8 of monthly salary 

6 months but less than 5 years

   1/4 of monthly salary 

5 years but less than 10 years

   3/8 of monthly salary 

10 years or more

   1/2 of monthly salary 


(2)

Our NEOs do not receive non-performance-based compensation that would be considered a “Bonus” under SEC rules.

(3)

Includes the aggregate grant date fair value of PBRSUs granted during the respective fiscal years, calculated in accordance with the Financial Accounting Standards Board (FASB) Accounting Standards Codification (ASC) Topic 718. The grant date fair value for the PBRSUs granted during fiscal 2024, assuming the maximum achievement of the performance goals would have been $7,148,920 for Mr. Whiting, $1,612,564 for Ms. Cunningham, $887,485 for Mr. Farrer, $787,905 for Mr. Hamel, and $605,286 for Mr. Hinrichs. Assumptions used in the calculation of these amounts are included in Note 11 to our audited financial statements for the fiscal year ended April 30, 2024, which appear in our Annual Report on Form 10-K for fiscal 2024.

(4)

Includes the aggregate grant date fair value of SSARs granted during the respective fiscal years, calculated in accordance with FASB ASC Topic 718. Assumptions used in the calculation of these amounts are included in Note 11 to our audited financial statements for the fiscal year ended April 30, 2024, which appear in our Annual Report on Form 10-K for fiscal 2024.


50 Brown-Forman


Table of Contents


(5)

Amounts listed for fiscal 2024 include short-term cash incentive compensation paid for the one-year performance period ended on April 30, 2024, and long-term cash incentive compensation paid for the three-year performance period ended on April 30, 2024, as approved by the Compensation Committee in May 2024 and paid on June 15, 2024. These amounts are shown below.


     Short-Term Cash      Long-Term Cash      Total   

Lawson E. Whiting

   $    2,061,600      $    1,645,329      $   3,706,929   

Leanne D. Cunningham

     732,838        204,177      $ 937,015   

Marshall B. Farrer

     473,477        141,499      $ 614,976   

Matthew E. Hamel

     454,487        221,683      $ 676,170   

Thomas W. Hinrichs

     566,518        164,622      $ 731,140   


(6)

Amounts represent changes between fiscal years in the actuarial present value of the accumulated pension benefits of each of the NEOs under the applicable pension or savings plan. Pension values may fluctuate significantly from year to year depending on a number of factors, including age, years of service, average annual earnings, and the assumptions used to determine the present value, such as the discount rate and mortality tables. Please see the Fiscal 2024 Pension Benefits Table on page 55 for the assumptions used in calculating the change in pension value. None of the NEOs received above-market or preferential earnings (as these terms are defined by the SEC) on their non-qualified deferred compensation accounts.


     Qualified      Non-Qualified      Total   

Lawson E. Whiting

   $    (7,876)       $    1,153,678       $   1,145,802   

Leanne D. Cunningham

     (21,807)         600,931       $ 579,124   

Marshall B. Farrer

     (19,011)         266,462       $ 247,451   

Matthew E. Hamel

     69,764          90,561       $ 160,325   

Thomas W. Hinrichs

     –          –       $ –   


(7)

The following table sets forth each component of the “All Other Compensation” column for fiscal 2024.


 Name


401(k) Matching

Contribution(a)


Cost of

Company-Provided

Life Insurance


Cost of

Company-Leased

Car(b)(c)

     Other(d)(e)(f)(g)      Total   

Lawson E. Whiting

   $   15,000       $   2,496       $   17,422       $    74,068       $ 108,986   

Leanne D. Cunningham

     17,010         2,496         14,400         4,000       $ 37,906   

Marshall B. Farrer

     16,848         1,926         –         1,388,368       $   1,407,142   

Matthew E. Hamel

     15,588         2,375         23,049         4,000       $ 45,012   

Thomas W. Hinrichs

     –         257         17,542         4,331       $ 22,130   


  (a)

For the period May 1, 2023, through April 30, 2024.

  (b)

Values based on the cost to Brown-Forman during the fiscal year, including lease payments, maintenance, registration, and insurance premiums.

  (c)

Amounts shown for Ms. Cunningham and Mr. Hinrichs include a car allowance in lieu of a company car.

  (d)

Reimbursement of financial planning expenses up to a limit of 4,000 in local currency for the fiscal year.

  (e)

Includes $50,827 for installation and monitoring services for a residential security system required to be installed for Mr. Whiting and a $21,391 gross-up of associated taxes.

  (f)

Includes $650,270 for cost of living allowance, rent, dependent education, transportation, utilities, language training, and storage of household goods for Mr. Farrer while on expatriate assignment in the Netherlands.

  (g)

Includes $734,098 in taxes paid by the company during Mr. Farrer’s expatriate assignment in the Netherlands.

(8)

Compensation for Mr. Farrer is provided for fiscal 2024. Mr. Farrer was not an NEO in fiscal 2023 or 2022.

(9)

Mr. Hinrichs is based in Germany and is paid in euros. The amount shown for Stock Awards and SSAR/Option Awards is the U.S.-dollar equivalent based on the Oanda 90-day period average exchange rate from April 29, 2023, through July 27, 2023, of $1 to 1.09176. The amount shown for Salary, Non-Equity Incentive Plan Compensation, and All Other Compensation is the U.S.-dollar equivalent based on the Bloomberg average exchange rate from May 1, 2023 through April 30, 2024 of $1 to 1.08283.


2024 Proxy Statement and Notice of Annual Meeting of Stockholders 51


Table of Contents

Grants of Plan-Based Awards

The following table contains information regarding the equity and non-equity awards granted to our NEOs during fiscal 2024 under our 2022 Omnibus Compensation Plan. For additional information on the fiscal 2024 awards, please see the Compensation Discussion and Analysis, which begins on page 30.

FISCAL 2024 GRANTS OF PLAN-BASED AWARDS TABLE


Estimated Possible Payouts

Under Non-Equity Incentive

Plan Awards(2)


Estimated Possible Payouts

Under Equity Incentive

Plan Awards(3)


All Other

Option Awards:

Number of

Securities

Underlying
Options
(4)


Exercise or
Base Price

of Option
Awards
(5)


Grant Date
Fair Value
of Stock and

Option
Awards
(6)


 Name


Grant Date


Award
Type
(1)


Threshold


Target


Maximum


Threshold


Target


Maximum


Lawson E. Whiting


STC


   $


   $


1,600,000


   $


3,200,000


7/27/2023


PBRSU


31,122


62,243


93,365


$


4,765,947


7/27/2023


SSAR


101,906


$


69.87


2,216,456


Leanne D. Cunningham


STC


575,000


1,150,000


7/27/2023


PBRSU


7,020


14,040


21,060


1,075,043


7/27/2023


SSAR


22,987


69.87


499,967


Marshall B. Farrer


STC


371,500


743,000


7/27/2023


PBRSU


3,864


7,727


11,591


591,656


7/27/2023


SSAR


12,651


69.87


275,159


Matthew E. Hamel


STC


356,600


713,200


7/27/2023


PBRSU


3,430


6,860


10,290


525,270


7/27/2023


SSAR


11,232


69.87


244,296


Thomas W. Hinrichs (7)


STC


444,502


889,004


7/27/2023


PBRSU


2,635


5,270


7,905


403,524


7/27/2023


SSAR


8,628


69.87


187,659


(1)

“STC” represents short-term (or annual) incentive compensation payable in cash.”PBRSU” represents Class A common performance-based restricted stock units. “SSAR” represents Class B common stock-settled stock appreciation rights.

(2)

Amounts represent potential value of the short-term incentive compensation opportunity for the fiscal 2024 performance period. No amounts are payable if threshold underlying operating income performance levels are not achieved. STC is capped at 200% of target. Please see the “Non-Equity Incentive Plan Compensation” column of the Fiscal 2024 Summary Compensation Table on page 50 for amounts actually paid. These amounts include the short-term cash incentive compensation paid for the one-year performance period ended on April 30, 2024, and the long-term cash incentive compensation paid for the three-year performance period ended on April 30, 2024.

(3)

Amounts represent the estimated payouts of the PBRSU awards granted in fiscal 2024. PBRSU awards are subject to a three-year performance period. The final number of shares earned will be determined by multiplying the number of units by the three-year performance percentage and adjusting the resulting number upwards to account for dividends paid during the second and third years of the performance period. PBRSU awards granted in fiscal 2024 will vest on June 1, 2026. The estimated possible payouts assume a 50% threshold and 150% maximum payout.

(4)

The number of SSARs awarded for fiscal 2024 was determined by dividing the total cash value of each SSAR award by the Black-Scholes value ($21.75) of our Class B common stock as of the close of trading on the date of grant, July 27, 2023. SSARs become exercisable on the first day of the third fiscal year following the fiscal year of grant, and generally are exercisable for seven fiscal years thereafter (barring certain events that may cause an award to become exercisable earlier). SSARs granted July 27, 2023, become exercisable on May 1, 2026, and expire April 30, 2033.

(5)

The exercise price for the SSARs represents the closing price of our Class B common stock on the grant date.

(6)

Calculated in accordance with FASB ASC Topic 718. Assumptions used in the calculation of these amounts appear in Note 11 to our audited financial statements for the fiscal year ended April 30, 2024, which are included in our Annual Report on Form 10-K for fiscal 2024.

(7)

Mr. Hinrichs is based in Germany and paid in euros. The PBRSUs and SSARs are the U.S.-dollar equivalent based on the 90-day midpoint exchange rate to equity grant date from April 29, 2023, through July 27, 2023, of $1 to 1.09176. The STC and LTC targets are the U.S.-dollar equivalent based on the average treasury exchange rate from May 1, 2023 to April 30, 2024 of $1 to 1.08283.


52 Brown-Forman


Table of Contents


Outstanding Equity Awards

The following table lists the outstanding equity awards held by our NEOs as of April 30, 2024. The year-end values shown in the table are based on the April 30, 2024, closing prices for our Class A common stock, $49.07 per share, and our Class B common stock, $47.85 per share.

OUTSTANDING EQUITY AWARDS AT 2024 FISCAL YEAR-END TABLE


                  SSAR Awards(1)            Stock Awards(2)  
 Name    Grant Date           

Number of

Securities

Underlying

Unexercised

SSARs

Exercisable


Number of

Securities

Underlying

Unexercised

SSARs

Unexercisable


SSAR

Exercise

Price


SSAR

Expiration

Date


Number

of Shares

or Units of

Stock That

Have Not

Vested(3)


Market Value

of Shares or

Units of Stock

That Have Not

Vested(3)(4)


Equity Incentive

Plan Awards:

Number of

Unearned Shares,

Units, or Other

Rights That Have

Not Vested(5)


Equity Incentive

Plan Awards: Market

or Payout Value of

Unearned Shares,

Units, or Other

Rights That Have

Not Vested(6)


Lawson E. Whiting


7/23/2015


20,330


$39.58


4/30/2025


7/28/2016


29,314


37.94


4/30/2026


     7/27/2017                34,619                 39.20        4/30/2027                                              
     7/26/2018                41,266                 53.24        4/30/2028                                              
     7/25/2019                111,626                 53.88        4/30/2029                                            
     7/30/2020                109,334                 68.24        4/30/2030                                              
     7/22/2021                         101,757        70.24        4/30/2031                                              
     7/28/2022                         86,430        73.61        4/30/2032                                              
     7/27/2023                         101,906        69.87        4/30/2033                                              
     7/22/2021                                                            12,887        $632,365                    
     7/28/2022                                                                              24,778        $1,215,856  
     7/27/2023                              62,243        3,054,264  


Leanne D. Cunningham


7/23/2015


2,094


$39.58


4/30/2025


7/28/2016


7,309


37.94


4/30/2026


     7/27/2017                6,213                 39.20        4/30/2027                                              
     7/26/2018                3,856                 53.24        4/30/2028                                              
     7/25/2019                3,948                 53.88        4/30/2029                                              
     7/30/2020                3,008                 68.24        4/30/2030                                              
     7/22/2021                         12,628        70.24        4/30/2031                                              
     7/28/2022                         16,125        73.61        4/30/2032                                              
     7/27/2023                         22,987        69.87        4/30/2033                                              
     7/22/2021                                                            1,600        78,512                    
     7/28/2022                                                                              4,623        $226,851  
     7/27/2023                              14,040        688,943  


Marshall B. Farrer


7/23/2015


4,883


$39.58


4/30/2025


7/28/2016


3,338


37.94


4/30/2026


     7/25/2019                2,683                 53.88        4/30/2029                                              
     7/30/2020                3,406                 68.24        4/30/2030                                              
     7/22/2021                         8,752        70.24        4/30/2031                                              
     7/28/2022                         7,253        73.61        4/30/2032                                              
     7/27/2023                         12,651        69.87        4/30/2033                                              
     7/22/2021                                                            1,109        54,419                    
     7/28/2022                                                                              2,080        $102,066  

     7/27/2023                                                                              7,727        379,164  


2024 Proxy Statement and Notice of Annual Meeting of Stockholders 53


Table of Contents

                  SSAR Awards(1)            Stock Awards(2)     
               
 Name    Grant Date           

Number of

Securities

Underlying

Unexercised

SSARs

Exercisable


Number of

Securities

Underlying

Unexercised

SSARs

Unexercisable


SSAR

Exercise

Price


SSAR

Expiration

Date


Number

of Shares

or Units of

Stock That

Have Not

Vested(3)


Market Value

of Shares or

Units of Stock

That Have Not

Vested(3)(4)


Equity Incentive

Plan Awards:

Number of

Unearned Shares,

Units, or Other

Rights That Have

Not Vested(5)


Equity Incentive 

Plan Awards: Market 

or Payout Value of 

Unearned Shares, 

Units, or Other 

Rights That Have 

Not Vested(6)


Matthew E. Hamel


7/23/2015


38,965


$39.58


4/30/2025


7/28/2016


57,274


37.94


4/30/2026


     7/27/2017                48,314                 39.20        4/30/2027                                              
     7/26/2018                29,989                 53.24        4/30/2028                                              
     7/25/2019                30,694                 53.88        4/30/2029                                              
     7/30/2020                23,384                 68.24        4/30/2030                                              
     7/22/2021                         13,711        70.24        4/30/2031                                              
     7/28/2022                         11,364        73.61        4/30/2032                                              
     7/27/2023                         11,232        69.87        4/30/2033                                              
     7/22/2021                                                            1,737        85,235                    
     7/28/2022                                                                              3,258        $159,870   
     7/27/2023                              6,860        336,620   


Thomas W. Hinrichs


7/28/2016


15,179


$37.94


4/30/2026


7/27/2017


12,827


39.20


4/30/2027


     7/26/2018                11,312                 53.24        4/30/2028                                              
     7/25/2019                23,651                 53.88        4/30/2029                                              
     7/30/2020                17,960                 68.24        4/30/2030                                              
     7/22/2021                         11,312        70.24        4/30/2031                                              
     7/28/2022                         8,038        73.61        4/30/2032                                              
     7/27/2023                         8,628        69.87        4/30/2033                                              
     7/22/2021                                                            1,433        70,317                    
     7/28/2022                                                                              2,305        $113,106   
       7/27/2023                                                                              5,270        258,599   


(1)

SSAR awards are exercisable for shares of Class B common stock. All SSARs vest and become fully exercisable on the first day of the third fiscal year following the fiscal year of grant, and generally are exercisable for seven fiscal years thereafter (barring certain events that may require an award to become exercisable earlier). The number of SSARs shown also reflects the special dividend on December 29, 2021.

(2)

Represents Class A and Class B common PBRSU awards with a three-year performance period. The PBRSU awards granted on July 22, 2021 vested on June 3, 2024. The PBRSU awards granted on July 28, 2022, and July 27, 2023 will vest on June 2, 2025, and June 1, 2026, respectively.

(3)

Reflects the number of shares of restricted Class A common stock that were issued on June 3, 2024, upon satisfaction of the performance measures prescribed for the performance-based restricted stock awards granted on July 22, 2021. The number of shares issued was determined by multiplying the target award by a three-year performance percentage (50%), and then adjusting the resulting number upwards to account for dividends paid during the second and third years of the performance period. The number of shares shown also reflects the special dividend on December 29, 2021.

(4)

Market value for the PBRSU awards was determined by multiplying the number of Class A shares by $49.07 (the closing price of our Class A common stock on April 30, 2024).

(5)

Amounts shown represent the estimated payout of PBRSUs based on a performance multiplier of 100% of target for the awards granted in fiscal 2023 and fiscal 2024. PBRSU awards are initially determined as a cash value, which is converted to units, and then subject to a three-year performance period. The number of shares of PBRSUs ultimately awarded will be determined by multiplying the initial number of units by a three-year performance adjustment factor and adjusting the resulting number to account for dividends paid during the second and third years of the performance period.

(6)

Market value for the PBRSU awards was determined by multiplying the number of Class A shares by $49.07 (the closing price of our Class A common stock on April 30, 2024).


54 Brown-Forman


Table of Contents


Option Exercises and Stock Vested

The following table shows all SSAR awards exercised by the NEOs during fiscal 2024 and the value realized upon exercise, as well as all stock awards in which our NEOs vested during fiscal 2024 and the value realized upon vesting.

FISCAL 2024 OPTION EXERCISES AND STOCK VESTED TABLE


     SSAR Awards(1)      Stock Awards(2)  


 Name   

Number

of Shares

Acquired

on Exercise


Value

Realized on

Exercise(3)


Number

of Class A

Shares

Acquired

on Vesting(4)


Number

of Class B

Shares

Acquired

on Vesting(4)


Value 

Realized on 

Vesting(5)


Lawson E. Whiting(6)

     2,984            $  305,109        14,832                     $  977,132   

Leanne D. Cunningham

                                                 –   

Marshall B. Farrer

                                        368        23,953   

Matthew E. Hamel(7)

     7,565                755,123        1,388                       91,441   

Thomas W. Hinrichs

                           1,066                       70,228   


(1)

All SSAR awards are settled in Class B common stock.

(2)

Stock awards are in the form of Class A or Class B common stock.

(3)

Equals the difference between the SSAR exercise price and the market price of the underlying shares at time of exercise, multiplied by the number of SSAR awards exercised.

(4)

The grant date for all awards of Class A and Class B common PBRSUs shown in the table was July 30, 2020. The vesting date was June 1, 2023, and the closing price of the relevant class of common stock on April 28, 2023, was used to determine value realized upon vesting.

(5)

Equals the sum of the closing price of each underlying security on the vesting date multiplied by the number of shares of the applicable class of common stock that vested. The closing price of our Class A common stock on April 28, 2023, was $65.88. The closing price of our Class B common stock on April 28, 2023 was $65.09.

(6)

Mr. Whiting exercised 15,601 SSAR awards on March 12, 2024.

(7)

Mr. Hamel exercised 8,538 SSAR awards on July 31, 2023, 8,538 SSAR awards on October 31, 2023, 8,538 SSAR awards on January 31, 2024, and 8,541 SSAR awards on April 30, 2024.

Pension Benefits

We maintain both tax-qualified and non-qualified supplemental excess retirement plans. The following table shows the present value of accumulated pension benefits payable to each of our NEOs under our tax-qualified plan (Brown-Forman Corporation Salaried Employees Retirement Plan) and under our non-qualified excess plan (Brown-Forman Supplemental Executive Retirement Plan), based on the pension earned as of our most recent FASB ASC Topic 715 measurement date, April 30, 2024. These plans are described below the table.

FISCAL 2024 PENSION BENEFITS TABLE


 Name  

Plan Name


Number of

Years

Credited

Service


Present Value

of Accumulated

Benefit(1)


Payments 

During Last 

Fiscal Year 


Lawson E. Whiting


Qualified


26.83


  $


880,013


 $


– 


Non-Qualified


26.83


7,544,101


– 


Leanne D. Cunningham


Qualified


28.83


880,394


– 


Non-Qualified


28.83


1,596,573


– 


Marshall B. Farrer


Qualified


25.83


741,832


– 


Non-Qualified


25.83


946,836


– 


Matthew E. Hamel


Qualified


16.50


883,402


– 


Non-Qualified


16.50


1,965,182


– 


Thomas W. Hinrichs(2)(3)


Germany


27.67


938,618


– 


(1)

Actuarial present value of each NEO’s accumulated pension benefit as of our FASB ASC Topic 715 measurement date, April 30, 2024, using a 5.7% discount rate, expected retirement age of 65, except for Mr. Hamel with a commencement date of June 1, 2024 following a May 1, 2024 retirement date and amount weighted rates from the PRI-2012 mortality study projected generationally from 2012 with scale MP-2021 for annuities and 2024 417 (e) mortality table for lump sums as of April 30, 2024.

(2)

Mr. Hinrichs is a German citizen. The German pension plan for Brown-Forman Corporation pays a guaranteed capital sum or monthly pension. Expected retirement is 65 years and guaranteed interest is 2.75%.

(3)

Mr. Hinrichs is based in Germany and is paid in euros. The amount shown is the U.S.-dollar equivalent based on the Bloomberg average exchange rate from May 1, 2023 to April 30, 2024 of $1 to 1.08283.


2024 Proxy Statement and Notice of Annual Meeting of Stockholders 55


Table of Contents

BROWN-FORMAN CORPORATION SALARIED EMPLOYEES RETIREMENT PLAN

Most U.S. salaried employees, and all of our NEOs (except Mr. Hinrichs), participate in the tax-qualified Brown-Forman Corporation Salaried Employees Retirement Plan. This is a funded, non-contributory, defined benefit pension plan that provides monthly retirement benefits based on the participant’s age at retirement, years of service, and “Final Average Pay” (described below). Retirement benefits are not offset by Social Security benefits and are assumed for actuarial purposes to be payable at age 65. Participants vest in the plan after five years of service.

BROWN-FORMAN CORPORATION SUPPLEMENTAL EXECUTIVE RETIREMENT PLAN

U.S. federal tax law limits the amount of compensation that may be used annually to accrue benefits under our tax-qualified Salaried Employees Retirement Plan (SERP). For employees whose compensation exceeds these limits, including our NEOs, we maintain a non-qualified SERP. The SERP restores the benefits that are lost due to U.S. federal tax law limitations. The SERP also provides faster vesting for certain key employees who join us mid-career. All NEOs are vested in the SERP.

PENSION FORMULA

The formula we use to calculate the combined total pension benefit under both plans includes the following factors:


  Final Average Pay (FAP) is the average compensation of the highest consecutive five calendar years in the last ten calendar years of employment. For this purpose, compensation is considered to be salary, holiday bonus, and short-term incentive compensation (not long-term cash or equity compensation).
  Social Security Covered Compensation (CC) is the average of the Social Security Taxable Wage Base in effect for each calendar year during the 35 years ending with the calendar year in which a participant reaches Social Security Retirement age.
  Credited Service (Service) is the number of years and whole months during which the participant is employed by Brown-Forman at a location or division that participates in the pension plan, up to a maximum of 30 years.

The table below shows the pension formula and gives a sample calculation.

MONTHLY PENSION FORMULA FOR A PARTICIPANT RETIRING AT THE REGULAR RETIREMENT AGE OF 65


 Generalized Formula   

Sample Calculation:

Assume FAP of

$400,000, CC of

$80,000, and Service

of 30 Years

              Amount   

1.3% multiplied by FAP up to CC

   0.013 × $80,000     =        $1,040   

1.75% multiplied by FAP above CC

   0.0175 × $320,000     =        5,600   
                    6,640   

The sum of the above multiplied by years of service

   × 30     =        199,200   

Divide by 12 to get the monthly pension (before reduction for early retirement or optional forms of payment)

   ÷ 12     =        $16,600   

Under the qualified plan, early retirement is available before age 55 if payment is elected within 120 days from separation. Under the non-qualified SERP, early retirement is available at age 55. Mr. Whiting is the only NEO currently eligible for early retirement under the SERP. Mr. Hamel retired on May 1, 2024.

Those who retire before age 65 under the FAP formula have their pension payments reduced by 3% for each year (1/4 of 1% for each month) that payments start prior to age 65. Retirees also can reduce their pension payment to purchase optional forms of payment that protect a spouse or domestic partner and ensure a minimum payment period. A lump sum payment option is also available under the qualified pension plan if it is elected within 120 days from separation regardless of the participant’s age when the benefit commenced.

Once the final pension is determined, the federal rules that govern the maximum pension paid under the qualified plan are applied to determine the portion to be paid under the qualified plan, and the remaining amount becomes payable under the non-qualified pension plan.


56 Brown-Forman


Table of Contents


Non-Qualified Deferred Compensation

The following table provides information on Savings Plan contributions and earnings for our NEOs for fiscal 2024.

FISCAL 2024 NON-QUALIFIED DEFERRED COMPENSATION TABLE


Executive Contributions

in Last FY(1)


Registrant Contributions

in Last FY


Aggregate Earnings

in Last FY(2)


Aggregate Withdrawals/

Distributions(3)


Aggregate Balance at 

Last FYE(4)


Lawson E. Whiting

    $ –         $ –                $          –         $ –                $ –   

Leanne D. Cunningham

     20,971          –                  40,717         (47,423)                 494,367   

Marshall B. Farrer

     –          –                  1,167         –                  21,072   

Matthew E. Hamel

     –          –                  –         –                –   

Thomas W. Hinrichs(5)

     –          –                –         –                  –   


(1)

Contributions shown in this column are included in each NEO’s compensation reported in the Fiscal 2024 Summary Compensation Table, under “Salary” for the current fiscal year or under “Non-Equity Incentive Plan Compensation” in the previous fiscal year.

(2)

NEOs participating in the Savings Plan may notionally invest their plan balances in mutual funds within generally the same asset classes available to participants in our qualified 401(k) savings plan. The Savings Plan does not guarantee a return on deferred amounts. Earnings in this column represent deemed investment earnings or losses attributable to the change in market value of the notional investments. These amounts are not reported in the Fiscal 2024 Summary Compensation Table because the Savings Plan does not provide for above-market or preferential earnings.

(3)

Ms. Cunningham made a withdrawal from the Savings Plan in fiscal 2024, as allowed under its terms and conditions.

(4)

Amounts include compensation previously earned and disclosed, as required, in the Summary Compensation Table of our proxy statements. Amounts also include deemed investment earnings and losses attributable to the change in market value of the notional investments, which were not disclosed in our prior proxy statements because the Savings Plan does not provide for above-market or preferential earnings.

(5)

Mr. Hinrichs is not eligible for the Savings Plan as an employee outside of the United States.

Potential Payments Upon Termination or Change in Control

We do not provide our NEOs with any separate contract, agreement, or arrangement that allows for payments or benefits upon termination or a change in control or that discriminates in favor of an NEO in scope or terms of operation. We offer certain benefits to executives whose employment terminates before incentive awards are paid, depending upon the circumstances surrounding their termination. These benefits, shown in the table below, are intended to continue to link an executive’s compensation to Brown-Forman’s performance after the executive’s employment has ended and to avoid penalizing executives in situations where the termination was outside of their control.

TREATMENT OF SHORT-TERM AND LONG-TERM INCENTIVE AWARDS UPON TERMINATION OF EMPLOYMENT


 Termination Event   

Short-Term

Cash Incentives


Long-Term Cash Incentives and

Performance-Based Restricted Stock

   SSARs


Retirement(1)


Awards granted in the fiscal year of termination are pro-rated based on the time worked during that fiscal year, adjusted for performance, and paid at the same time and in the same manner as for active employees.


Awards granted in the fiscal year of termination are pro-rated based on the time worked during that year, adjusted for performance, and paid soon after the end of the performance period. Outstanding unpaid awards are not reduced, but are adjusted for performance and paid soon after the end of the performance period.


Awards granted in the fiscal year of termination are pro-rated based on the time worked during that year. Other outstanding awards are not reduced. All awards become exercisable at the same time and in the same manner as for active employees. Retirees must exercise awards by the earlier of the original expiration date or the end of seven years following the date of retirement.


Involuntary Not for Cause


Awards granted in the fiscal year of termination are pro-rated based on the time worked during that year. Other outstanding awards are not reduced. All awards become exercisable at the same time and in the same manner as for active employees. Awards must be exercised by the earlier of the original expiration date or the later of twelve months following the date of termination or twelve months following the first exercise date.


Death/Permanent Disability

   Awards granted in the fiscal year of death or permanent disability are pro-rated based on the time worked during that year and are paid upon death or permanent disability at a target level of performance.    Awards granted in the fiscal year of death or permanent disability are pro-rated based on the time worked during that year and become payable shortly after death or permanent disability at a target level of performance. Outstanding unpaid awards are not reduced and become payable shortly after death or permanent disability at a target level of performance.    Awards granted in the fiscal year of termination are pro-rated based on the time worked during that year. Other outstanding awards are not reduced. All awards become exercisable on the date of death or permanent disability. Awards must be exercised by the earlier of the expiration date or the end of five years following the date of death or termination of employment due to disability.
       

Voluntary Termination or Involuntary for Poor Performance

   Awards granted in the fiscal year of termination are forfeited.    All unearned or nonvested awards are forfeited.    All nonvested awards are forfeited. Exercisable awards may be exercised for up to 30 days, or, if earlier, until the original expiration date.
   

Involuntary for Cause


All outstanding awards are forfeited.


(1)

Retirement applies to those executives who leave Brown-Forman at or after age 55 with at least five years of service or at or after age 65 with any service.


2024 Proxy Statement and Notice of Annual Meeting of Stockholders 57


Table of Contents

Change in Control and Termination Upon Change in Control

In the event of a change in control, as defined in the Brown-Forman 2022 Omnibus Plan or the Brown-Forman 2013 Omnibus Plan, as applicable, short-term and long-term incentive compensation cycles continue unaffected, and outstanding options and SSARs become immediately vested but remain exercisable according to their original vesting schedule. In the event an executive’s employment is terminated by Brown-Forman (or its successor) without cause or by the executive within 60 days after a constructive discharge, in either case within one year following a change in control, all outstanding awards become immediately vested and exercisable, restriction periods lapse, and cash awards are paid out based on target performance and pro-rated through the effective date of termination. In the event of a change in control that modifies the capital structure of Brown-Forman (or its successors), the realizable value on exercise of outstanding options and SSARs is subject to adjustment as described in the applicable Omnibus Plan.

The following table illustrates the value of compensation available to our NEOs as if their employment were terminated on April 30,

2024, the last day of fiscal 2024, under various scenarios. The compensation included is limited to amounts that would have been payable as a direct result of each specified event. This table excludes the value of pension benefits disclosed in the Fiscal 2024 Pension Benefits Table on page 55 and the amounts payable under deferred compensation plans that are disclosed in the Fiscal 2024 Non-Qualified Deferred Compensation Table on page 57.

FISCAL 2024 POTENTIAL PAYMENTS UPON TERMINATION OR CHANGE IN CONTROL TABLE(1)


 Name   

Death

Benefit(1)


Holiday

Bonus(2)

    STC(3)     LTC(4)     PBRSUs(5)     SSARs(6)     Total   

Lawson E. Whiting


Voluntary Termination

   $      $  20,850      $ 2,061,600      $ 3,432,353        $4,902,486             $ 10,417,289   

Involuntary Termination for Cause

                                          –   

Involuntary Termination Not for Cause

            20,850       2,061,600       3,432,353       4,902,486             10,417,289   

Retirement

            20,850       2,061,600       3,432,353       4,902,486             10,417,289   

Death

     3,000,000        20,850       1,600,000       3,454,024       5,484,309             13,559,183   

Change-in-Control

                                          –   

Termination Upon Change-in-Control

            20,850       1,600,000       3,454,024       5,484,309             10,559,183   

Leanne D. Cunningham


Voluntary Termination

                                          –   

Involuntary Termination for Cause

                                          –   

Involuntary Termination Not for Cause

            11,033       732,838       537,577       994,305             2,275,753   

Retirement

            11,033       732,838       537,577       994,305             2,275,753   

Death

     3,000,000        11,033       575,000       540,265       1,066,487             5,192,785   

Change-in-Control

                                          –   

Termination Upon Change-in-Control

            11,033       575,000       540,265       1,066,487             2,192,785   

Marshall B. Farrer


Voluntary Termination

                                          –   

Involuntary Termination for Cause

                                          –   

Involuntary Termination Not for Cause

            8,790       473,477       406,129       535,648             1,424,044   

Retirement

            8,790       473,477       406,129       535,648             1,424,044   

Death

     1,587,000        8,790       371,500       407,992       585,650             2,960,932   

Change-in-Control

                                          –   

Termination Upon Change-in-Control

            8,790       371,500       407,992       585,650             1,373,932   


58 Brown-Forman


Table of Contents


 Name   

Death

Benefit(1)

     Holiday
Bonus
(2)
    STC(3)     LTC(4)     PBRSUs(5)     SSARs(6)     Total   

Matthew E. Hamel(7)


Voluntary Termination

            10,317        454,487        456,630        581,725               1,503,159   

Involuntary Termination for Cause

                                          –   

Involuntary Termination Not for Cause

            10,317       454,487       456,630       581,725             1,503,159   

Retirement

            10,317       454,487       456,630       581,725             1,503,159   

Death

     2,922,000        10,317       356,600       459,550       660,090             4,408,557   

Change-in-Control

                                          –   

Termination Upon Change-in-Control

            10,317       356,600       459,550       660,090             1,486,557   

Thomas W. Hinrichs(7)


Voluntary Termination

            8,929       566,518       336,754       442,023             1,354,224   

Involuntary Termination for Cause

                                          –   

Involuntary Termination Not for Cause

            8,929       566,518       336,754       442,023             1,354,224   

Retirement

            8,929       566,518       336,754       442,023             1,354,224   

Death

     1,016,794        8,929       444,502       338,922       506,697             2,315,844   

Change-in-Control

                                          –   

Termination Upon Change-in-Control

            8,929       444,502       338,922       506,697             1,299,050   


(1)

Death benefit includes amounts provided by Brown-Forman as an insurance benefit (generally available to all salaried employees) and additional amounts elected and paid for by each NEO as optional insurance coverage.

(2)

Pro-rated holiday bonus is provided in the event of involuntary termination not for cause, retirement, death/permanent disability, and termination upon change in control. Holiday bonus is calculated based on a December 1 to November 30 payment cycle.

(3)

A pro-rated portion of short-term cash incentives may continue, or be immediately earned and promptly paid out, as described below in the event of involuntary termination not for cause, retirement, death/permanent disability, and termination upon change in control. In the event of retirement or involuntary termination not for cause, awards are based on actual company performance and are paid at the same time and in the same manner as to active employees. Short-term cash incentives shown for retirement or involuntary termination not for cause are performance-adjusted awards paid for fiscal 2024. In the event of death/permanent disability or termination upon a change in control, awards are paid as soon as practicable after termination at a target level of performance and are shown at target in the table. Awards shown are not pro-rated because termination is assumed to have occurred on the last day of our fiscal year.

(4)

A pro-rated portion of long-term cash incentives may continue, or be immediately earned and promptly paid out, as described below, in the event of involuntary termination not for cause, retirement, death/permanent disability, or termination upon a change in control. In the event of retirement or involuntary termination not for cause, awards remain outstanding, and amounts earned, if any, are based on actual company performance and are generally paid at the same time and in the same manner as to active employees. Values shown for long-term cash incentives in situations of retirement or involuntary termination not for cause are based on actual payouts for the performance period that ended in fiscal 2024. Achievement of the performance measures for the outstanding long-term incentive awards granted in fiscal 2023 and 2024 are still highly uncertain, and we are unable to provide a narrow estimate of the possible payouts. Therefore, awards granted in fiscal 2023 and 2024 are shown at an estimated payout of 100% of target, even though actual payouts may vary between 0% and 200% of target. In the event of death/ permanent disability or termination upon a change in control, awards are paid as soon as practicable after termination at a target level of performance.

(5)

A pro-rated portion of PBRSU awards may continue, or vest and be promptly paid out, as described below, in the event of involuntary termination not for cause, retirement, death/permanent disability, or termination upon a change in control. In the event of retirement or involuntary termination not for cause, awards remain outstanding, and amounts earned, if any, are based on actual company performance and are generally paid at the same time and in the same manner as to active employees. The performance measure of our PBRSUs is based on TSR relative to the S&P 500 Consumer Staples Index over a three-year performance period. The market has been volatile during both the open performance periods, and, based on this uncertainty, we are unable to provide a narrow estimate of the possible payout results. Values shown for PBRSUs granted in fiscal 2022 in instances of retirement or involuntary termination not for cause are based on the April 30, 2024, market value of restricted shares in fiscal 2021 at actual payout. Awards granted in 2023 and 2024 are shown at an estimated payout of 100% of target, even though actual payouts may vary between 0% and 150% of target. In the event of death/permanent disability or termination upon a change in control, awards are paid as soon as practicable after termination at the target level of performance.

(6)

Continued vesting of a pro-rated portion of SSARs is provided in the event of involuntary termination not for cause, retirement, or death/permanent disability. In the event of retirement or involuntary termination not for cause, SSARs become vested at the same time and in the same manner as they do for active employees. In the event of retirement, SSARs must be exercised by the sooner of the original expiration date or the end of seven years following the date of retirement. Employees terminated not for cause must exercise their SSARs by the sooner of the original expiration date or 12 months following vesting or, if vested, 12 months following termination. In the event of death/permanent disability, SSARs vest immediately and must be exercised by the sooner of the original expiration date or five years following the date of death or termination due to disability. In the event of a termination following a change in control, SSARs vest immediately and remain exercisable until 30 days following the originally scheduled vesting date. Awards granted in the year of termination are adjusted pro-rata based on the time worked during the fiscal year. Awards shown are not pro-rated because termination is assumed to have occurred on the last day of our fiscal year. Amounts shown represent the value realized upon vesting or non-forfeitability of nonvested SSARs based upon the difference between the exercise price and the closing price of our Class B common stock on April 30, 2024.

(7)

As retirement-eligible NEOs, Mr. Whiting, Mr. Hamel and Mr. Hinrichs would each be treated as a retiree in the event of a voluntary termination. Mr. Hamel retired on May 1, 2024, and Mr. Hinrichs announced he will retire on June 30, 2024. In addition to the payments reflected in the table above, Mr. Hinrichs will receive payments of $127,000 per month for consulting services under an agreement with the Company commencing July 1, 2024, and ending April 30, 2025.

(8)

The amount shown for Death Benefit, Holiday Bonus, STC and LTC is the U.S.-dollar equivalent based on the Bloomberg average exchange rate from May 1, 2023, through April 30, 2024, of $1 to 1.08283. The amount shown for PBRSUs and SSARs is the U.S.-dollar equivalent based on the average exchange rate applied at the grant date of each outstanding award.


2024 Proxy Statement and Notice of Annual Meeting of Stockholders 59


Table of Contents

STOCK OWNERSHIP

Beneficial Owners of More Than 5% of Brown-Forman’s Voting Stock

The table below identifies each beneficial owner of more than 5% of our Class A common stock, our only class of voting stock, as of April 30, 2024. Each of the beneficial owners listed in the table is an entity controlled by Brown family members.

The aggregate number of shares of Class A common stock beneficially owned by the persons in this table is 114,081,990 shares, or

67.5% of the 169,108,086 shares of Class A common stock outstanding as of the close of business on April 30, 2024.


     Amount and Nature of Beneficial Ownership Voting and
Investment Power
(1)
        
 Name and Address    Sole      Shared      Total     

Percent of 

Class 


Wolf Pen Branch, LP

Wolf Pen Branch GP, LLC(2)

c/o The Glenview Trust Company

5900 U.S. Highway 42

Louisville, Kentucky 40241

     95,873,686               95,873,686        56.7%   

Avish Agincourt, LLC

829 West Main Street

Louisville, Kentucky 40202

     18,208,304               18,208,304        10.8%   


(1)

Based upon information furnished to Brown-Forman by the named persons and information contained in filings with the SEC. Under SEC rules, a person is deemed to beneficially own shares over which the person has or shares voting or investment power or as to which the person has the right to acquire beneficial ownership within 60 days (including shares underlying options or SSARs that are exercisable within 60 days). Of the shares shown in this table, none are known to be shares with respect to which the beneficial owner has the right to acquire beneficial ownership within sixty days.

(2)

Wolf Pen Branch, LP, has sole voting power with respect to the shares reflected in the table and sole investment power with respect to 42,000,000 shares of Class A common stock. Wolf Pen Branch GP, LLC, has voting and investment power with respect to the same shares by virtue of serving as general partner of Wolf Pen Branch, LP.


LOGO


60 Brown-Forman


Table of Contents


STOCK OWNED BY DIRECTORS AND EXECUTIVE OFFICERS

The following table sets forth, as of April 30, 2024, the number and percentages of shares of our Class A and Class B common stock beneficially owned by each current director, each director nominee, each NEO, and by all directors and executive officers as a group. Some shares shown below are beneficially owned by more than one person. As of the close of business on April 30, 2024, there were 169,108,086 shares of Class A common stock and 303,491,986 shares of Class B common stock outstanding.

STOCK BENEFICIALLY OWNED BY DIRECTORS AND EXECUTIVE OFFICERS AS OF APRIL 30, 2024


     Class A Common Stock(2)(3)
Voting or Investment Power
            Class B Common Stock(2)(3)
Investment Power
       
 Name(1)    Sole      Shared      Total     % of Class       Sole     Shared      Total     % of Class   

Campbell P. Brown(4)

     3,917,120               3,917,120          2.3%        2,583,999       220,180        2,804,179         *   

Elizabeth M. Brown(4)

                   –          *        668,209       15,576        683,785         *   

Stuart R. Brown

     1,111,407        308,980        1,420,387          *        501,707       12,071        513,778         *   

Mark A. Clouse

                   –          *                     –         *   

Leanne D. Cunningham

     4,490               4,490          *        42,589 (5)              42,589         *   

Marshall B. Farrer(4)

                   –          *        44,799              44,799         *   

Matthew E. Hamel

     35,293               35,293          *        446,952 (5)              446,952          *   

Thomas W. Hinrichs

     5,386               5,386          *        108,628              108,628         *   

W. Austin Musselman, Jr.(4)

     5,656,134               5,656,134          3.3%        7,119,928       6,257        7,126,185         2.4%   

Michael J. Roney

                   –          *                     –         *   

Jan E. Singer

                   –          *                     –         *   

Tracy L. Skeans

                   –          *                     –         *   

Elizabeth A. Smith

                   –          *                     –         *   

Michael A. Todman

                   –          *                     –         *   

Lawson E. Whiting

     35,549               35,549          *        476,675              476,675         *   

All Directors and Executive Officers as a

Group (22 persons, including

those named above) (6)

      10,778,312         308,980         11,087,292(7)        6.6%         12,170,982        254,084         12,425,066(8 )      4.1%   


*

Represents less than 1% of the class.

(1)

The address for each person named in the table is 850 Dixie Highway, Louisville, Kentucky 40210.

(2)

Based upon company information, information furnished to Brown-Forman by the named persons, and information contained in filings with the SEC. Under SEC rules, a person is deemed to beneficially own shares over which the person has or shares voting or investment power or as to which the person has the right to acquire beneficial ownership within 60 days (including shares underlying options or SSARs that are exercisable within 60 days).


LOGO


2024 Proxy Statement and Notice of Annual Meeting of Stockholders 61


Table of Contents

(3)

Includes the following Class B SSARs that are currently exercisable or that will become exercisable on or before June 29, 2024 (60 days after April 30, 2024). Class A and Class B DSUs, which are described in “Director Compensation” beginning on page 26, are not included in the main table. PBRSUs were issued as shares of Class A and Class B common stock on June 1, 2024 as reflected below, and also are not included in the main table.


     Class A            Class B  
 Name    PBRSU Shares    

Deferred

Stock Units

           PBRSU Shares     SSARs    

Deferred 

Stock Units 


Campbell P. Brown

           17,361                      37,411       –   

Stuart R. Brown

           16,416                            –   

Mark A. Clouse

           4,569                            –   

Leanne D. Cunningham

     1,600                               39,056       –   

Marshall B. Farrer

     1,109                               23,062          –   

Matthew E. Hamel

     1,737                          242,331       –   

Thomas W. Hinrichs

     1,433                            92,241       –   

Michael J. Roney

           35,129                            4,333   

Jan E. Singer

           5,320                            –   

Tracy L. Skeans

           21,283                            –   

Elizabeth A. Smith

           4,918                            –   

Michael A. Todman

           25,597                            2,934   

Lawson E. Whiting

     12,887                            448,246       –   


(4)

Campbell P. Brown, Elizabeth M. Brown, Marshall B. Farrer, and W. Austin Musselman, Jr., do not hold voting power over any shares of Class A common stock. Each holds sole or shared investment power over the shares of Class A common stock presented in the table.

(5)

Includes Class B common stock held in the 401(k) plan as of the close of business on April 30, 2024, as follows: Leanne D. Cunningham, 13 shares; and Matthew E. Hamel, 20,575 shares.

(6)

“All Directors and Executive Officers as a Group” includes 22 individuals, including those directors and officers named in the table. In calculating the aggregate number of shares and percentages owned by all directors and executive officers as a group, each share is counted only once.

(7)

Directors and executive officers as a group hold 130,593 Class A DSUs, which are not included in the main table.

(8)

Includes 1,026,846 Class B SSARs held by all directors and executive officers as a group that are exercisable on or before June 29, 2024 (60 days after April 30, 2024). Includes 2,199 shares of Class B common stock pledged as security. Directors and executive officers as a group hold 7,267 Class B DSUs, which are not included in the main table.


62 Brown-Forman


Table of Contents


PAY RATIO DISCLOSURE

CEO Pay Ratio

The Dodd-Frank Wall Street Reform and Consumer Protection Act requires us to disclose the ratio between the annual total compensation of our CEO and the annual total compensation of our “median employee.”

In fiscal 2024, the annual total compensation for our CEO, Mr. Whiting, was $13,194,160 as disclosed in the Fiscal 2024 Summary Compensation Table on page 50. In order to determine the annual total compensation of our median employee, Brown-Forman:


  Identified our global employee population as of February 1, 2024.
  Compared payroll data of our global employee population using a consistently applied compensation measure of base salary (including overtime) and holiday bonus paid to our employees during the most recent tax year of January 1, 2023, to December 31, 2023.
  Used the consistently applied compensation measure to identify the median employee.
  Calculated the annual total compensation of our median employee in the same manner used to determine our CEO’s total compensation as disclosed in the Fiscal 2024 Summary Compensation Table.

In identifying our median employee, we did not utilize material estimates, statistical sampling, or assumptions. Following the above methodology, our median employee for fiscal 2024 received annual total compensation of $57,220 in fiscal 2024. Consequently, the ratio of the annual total compensation for our CEO to the annual total compensation for our median employee in fiscal 2024 was 231-to-1.

Given the impact of company performance on CEO pay, combined with employee demographics, varying competitive pay practices, and SEC rules that provide wide flexibility for how a company may calculate its pay ratio, we believe it is important to note that our reported ratio may not have been calculated in the same way as that of other companies. As a result, these ratios may not be a useful basis for comparison. Additional details on our compensation philosophy, objectives, and the decisions of our Compensation Committee may be found in our “Compensation Discussion and Analysis” beginning on page 30.


2024 Proxy Statement and Notice of Annual Meeting of Stockholders 63


Table of Contents
PAY VERSUS PERFORMANCE
Introduction
In accordance with the SEC’s disclosure requirements, the information below compares “Compensation Actually Paid” (CAP) to our performance (PVP). Additional information on how the Compensation Committee makes compensation decisions and aligns pay with performance can be found in our “Compensation and Discussion Analysis” beginning on page
30
.
Most Important Metrics Used for Linking Pay and Performance
 The list below shows the most important metrics used by the Committee to link CAP to company performance.
 
Underlying Net Sales
(1)
Growth


We consider underlying net sales growth and underlying operating income growth to be the most important financial measures used to link pay with performance in fiscal 2024 because they (1) are used to determine 70% of the
short
-term cash incentive award payout for the company’s chief executive officer, who is our principal executive officer (PEO), and other NEOs, and (2) are used on a relative basis to determine 100% of the long-term incentive cash award payout for the PEO and other NEOs.
 
 
Underlying Operating Income
(2)
Growth
 
Relative TSR
 
Stock Appreciation
 
(1)
“Underlying net sales” is not derived in accordance with GAAP. Please refer to Appendix A of this Proxy Statement for information about our use of non-GAAP measures.
(2)
“Underlying operating income” is not derived in accordance with GAAP. Please refer to Appendix A of this Proxy Statement for information about our use of non-GAAP measures.
Pay versus Performance Table
The table below shows the total compensation for our PEO and the average of our
non-PEO
NEOs (as set forth in the Summary Compensation Table on page 50), the CAP for our PEO and the average for our
non-PEO
NEOs, our absolute TSR, the
TSR
of our peer group over the same period, our reported net income, our underlying net sales growth and underlying operating income growth for the last four fiscal years.
FISCAL 2024 PAY VS PERFORMANCE
 
Year
  
Summary
Compensation
Table Total for
PEO
(1)
 
Compensation
Actually Paid
to PEO
(3)
 
Average
 
Summary
Compensation Table
Total for Non-
PEO
NEOs
(2)
 
Average
Compensation
Actually Paid to
Non-
PEO NEOs
(3)
 
B-F
TSR
(4)
 
Peer Group
TSR
(4)(5)
 
Reported
Net Income
(in millions)
 
Underlying
Net Sales
Growth
 
Underlying
Operating
Income
Growth
2024
     $13,194,160       $5,788,644       $2,895,924       $1,878,251       $82       $150       $1,024       4%       12%   
2023
     9,651,262        6,771,842        2,059,136        1,752,991        109        146        783        11%        8%    
2022
     8,364,936       4,476,542       1,567,977       1,271,730       112       143       838       13%       15%   
2021
     9,112,109       11,798,204       2,072,337       2,709,954       124       123       903       6%       4%   
 
(1)
The PEO for each of fiscal 2021, 2022, 2023 and 2024 was
Mr. Whiting
.
(2)
The non-PEO NEOs in fiscal 2024 were Ms. Cunningham, Mr. Farrer, Mr. Hamel and Mr. Hinrichs. The non-PEO NEOs in fiscal 2023 were Ms. Cunningham, Mr. Hinrichs, Mr. Hamel, and Ms. Hawley. The non-PEO NEOs in fiscal 2022 were Ms. Cunningham, Mr. Hinrichs, Mr. Hamel, Ms. Hawley, and Jane Morreau. The non-PEO NEOs in fiscal 2021 were Ms. Morreau, Mr. Hinrichs, Mr. Hamel, and Ms. Hawley.
 
64
Brown-Forman

  
(3)
SEC rules require certain adjustments be made to the Summary Compensation Table totals to determine CAP as reported in the Pay versus
Performance
Table. CAP does not necessarily represent cash and/or equity value transferred to the applicable NEO without restriction, but rather is a valuation calculated under applicable SEC rules. In general, CAP is calculated as summary compensation table total compensation adjusted to (a) include the value of any pension benefit (or loss) attributed to the past fiscal year, including on account of any amendments adopted during such year; and (b) include the fair market value of equity awards as of April 30, 2024 or, if earlier, the vesting date (rather than the grant date) and factor in dividends and interest accrued with respect to such awards. No awards were granted and vested in the same year; no awards granted in any prior fiscal year
failed
to meet applicable vesting conditions during the covered fiscal year; there was no change in fair value of outstanding, vested equity granted in prior years; and there were no dividends or other earnings paid on stock or option awards in the covered fiscal year prior to the vesting date that are not otherwise reported. The following table detail the applicable adjustments:
PENSION VALUE AND EQUITY AWARD ADJ
USTMENTS
 
Year
  
Summary
Compensation
Table Total
    
Deduct
change in
pension value
   
Add Pension
Service Cost
Adjustment
    
Add Prior
Year Pension
Service Cost
Adjustment
    
Deduct Summary
Compensation
Table Stock &
Option Awards
   
Add Year-End Value
of Unvested Equity
Granted in Covered
Fiscal Year
    
Add Change in
Value of Unvested
Equity Granted in
Prior Years
   
Compensation
Actually Paid
 
PEO
                                                                    
2024
     $13,194,160        $(1,145,802     $382,548        $26,726        $(6,982,403     $2,802,694        $(2,489,279     $5,788,644  
2023
     9,651,262        (1,095,610     375,220               (3,862,409     2,773,884        (1,070,505     6,771,842  
2022
     8,364,936        (811,189     386,185               (3,371,539     2,908,042        (2,999,893     4,476,542  
2021
     9,112,109        (1,006,606     376,123               (3,595,862     4,457,842        2,454,598       11,798,204  
Average Non-PEO NEOs
 
                                                           
2024
     2,895,924        (246,725     90,377        4,905        (950,644     381,583        (297,169     1,878,251  
2023
     2,059,136        (143,794     92,310               (500,230     359,253        (113,684     1,752,991  
2022
     1,567,977              112,527               (349,638     301,569        (360,704     1,271,730  
2021
     2,072,337        (297,275     157,787               (486,612     620,239        643,478       2,709,954  
 
(4)
TSR is calculated on a cumulative basis measured from the market close of Brown-Forman’s Class B common stock on April 30, 2020, through the end of the indicated fiscal year.
(5)
Peer Group is defined as the S&P 500 Consumer Staples Index. The companies in this sector are primarily involved in the development and production of consumer products that cover food and drug retailing, beverages, food products, tobacco, household products, and personal products.
Relationship Between “Compensation
Actually
Paid” and Performance Measures
The CAP in the preceding tables reflects the Committee’s emphasis on
pay-for-performance
and alignment with shareholder value
creation
through equity-based compensation. As illustrated in the graphics below, year-over-year
changes
to CAP
were
primarily
driven
by the decline in our stock performance, with Brown-Forman trailing the
peer
group. The year-over-year changes also reflect the level of achievement against the performance metrics in our incentive programs, including underlying net sales growth and underlying operating income growth in our short-term and long-term incentive plans. Reported net income is not a
performance
metric
in the
Company’s
executive
compensation
program.


2024
Proxy Statement and Notice of Annual Meeting of Stockholders
65


Table of Contents

AUDIT MATTERS

This section contains a report of the Audit Committee of the Board of Directors. It also explains the role of the Audit Committee and sets forth the fees paid to our independent registered public accounting firm.

Report of Audit Committee

The Audit Committee is responsible for overseeing the integrity of the company’s financial statements on behalf of the Board. Management is responsible for establishing and maintaining the company’s internal controls, for preparing the financial statements, and for the public financial reporting process. The company’s internal audit function is responsible for preparing and executing an annual internal audit plan under the supervision of the Director of Internal Audit, who is accountable to the Audit Committee. The independent registered public accounting firm is responsible for performing an audit of the company’s financial statements in accordance with the standards of the Public Company Accounting Oversight Board (PCAOB) and for issuing a report on its audit. The independent registered public accounting firm also reports on the effectiveness of the company’s internal control over financial reporting. The Audit Committee reviews the work of management in respect of these matters and has direct responsibility for retaining, compensating, and overseeing the independent registered public accounting firm on behalf of the Board.

On behalf of the Board, the Audit Committee retained Ernst & Young LLP (EY) as the independent registered public accounting firm to audit the company’s consolidated financial statements and the effectiveness of the company’s internal control over financial reporting for fiscal 2024. The Audit Committee reviewed and discussed with management and EY the audited financial statements as of and for the fiscal year ended April 30, 2024. In addition, the Audit Committee reviewed and discussed, with management, management’s assessment of the effectiveness of the company’s internal control over financial reporting and, with EY, EY’s evaluation of the company’s system of internal controls. These discussions included meetings with EY without representatives of management present, and executive sessions with the Director of Internal Audit.

The Audit Committee discussed with EY matters required to be discussed by the applicable requirements of the PCAOB and the SEC. EY provided the Audit Committee with the written disclosures and the letter required by the PCAOB for independent auditor communications with audit committees concerning independence, and the Audit Committee discussed with EY the firm’s independence and ability to conduct the audit. The Audit Committee has determined that EY’s provision of audit and non-audit services to the company is compatible with maintaining auditor independence.

Based on the foregoing, the Audit Committee recommended to the Board that the company’s audited financial statements be included in the company’s Annual Report on Form 10-K for the fiscal year ended April 30, 2024.


AUDIT COMMITTEE

Michael A. Todman, Chair


Jan E. Singer

Tracy L. Skeans


Elizabeth A. Smith


66 Brown-Forman


Table of Contents


Fees Paid to Independent Registered Public Accounting Firm

The following table presents the fees Brown-Forman incurred for the professional services provided by the company’s independent registered public accounting firm, EY, for fiscal years 2023 and 2024. All such fees were pre-approved by the Audit Committee in accordance with the policy described below.


     Fiscal Years    
      2023             2024

 Audit Fees

   $ 2,093,000              $ 2,364,000  

 Audit-Related Fees

     253,000                876,000  

 Tax Fees

     2,260,000                1,598,000  

 Compliance

     1,929,000                1,257,000  

 Advisory and Planning

     331,000                341,000  

 All Other Fees


 Total

   $ 4,606,000              $ 4,838,000  

Audit Fees

This category consists of the audit of Brown-Forman’s annual financial statements included in the Annual Report on Form 10-K, attestation services relating to the report on internal controls in accordance with Section 404 of the Sarbanes-Oxley Act of 2002, review of interim financial statements included in quarterly reports on Form 10-Q, services normally provided in connection with statutory and regulatory filings or engagements, services related to acquisitions and impairment reviews, and statutory audits required by foreign jurisdictions.

Audit-Related Fees

This category consists of fees for assurance and related services that are reasonably related to the performance of the audit or review of Brown-Forman’s financial statements but are not included in the Audit Fees category. Such fees are primarily associated with services related to security offerings and internal controls associated with information technology system implementations and statutory audit reporting.

Tax Fees

This category consists of two types of fees: tax compliance services, which include the preparation of global tax returns, refund claims, and services related to our global mobility program; and tax advisory and planning services, which include tax planning and other consulting services.


2024 Proxy Statement and Notice of Annual Meeting of Stockholders 67


Table of Contents

Audit Committee Pre-Approval Policies and Procedures

It is the policy of the Audit Committee to pre-approve all audit services and permitted non-audit services (including an estimate of the fees or a range of fees) to be performed for Brown-Forman by its independent registered public accounting firm, subject to the de minimis exception for non-audit services described in the Exchange Act and the applicable rules and regulations of the SEC. The Audit Committee pre-approved the fiscal 2024 audit and non-audit services provided by EY. The non-audit services approved by the Audit Committee also were reviewed to ensure compatibility with maintaining EY’s independence. The Audit Committee has delegated to its Chair the authority to pre-approve proposed non-audit services and fees that arise between meetings, with the understanding that any such decision will be reviewed at the next scheduled Audit Committee meeting. During the approval process, the Audit Committee considers the potential impact of the type of service on the independence of the registered public accounting firm. Services and fees must be deemed compatible with the maintenance of the registered public accounting firm’s independence, including compliance with SEC rules and regulations. The Audit Committee may not delegate to management the Audit Committee’s responsibility to pre-approve permitted services of our independent registered public accounting firm. Throughout the year, the Audit Committee reviews any revisions to the estimates of fees initially approved.

The Audit Committee has adopted other policies in an effort to help ensure the independence of our independent registered public accounting firm. The Audit Committee must pre-approve the rendering of personal financial and tax advice to any of Brown-Forman’s designated executive officers by its independent registered public accounting firm. In addition, the Audit Committee has a policy that limits Brown-Forman’s ability to hire certain current and former employees of our independent registered public accounting firm.


LOGO


68 Brown-Forman


Table of Contents


OTHER INFORMATION

Certain Relationships and Related Transactions


Related Person Transactions

Rules and policies. SEC regulations require disclosure of certain transactions between Brown-Forman and a “related person.” For purposes of these regulations, a “related person” generally includes any individual who was a director or executive officer at any time during the last fiscal year, a director nominee, a beneficial owner of more than 5% of our voting securities, and any immediate family member of any such person. To gather information regarding related person transactions, Brown-Forman asked each director, director nominee, executive officer, and more than 5% beneficial owner to disclose any company transaction with a related person since May 1, 2023, or any such proposed transaction. In accordance with our Related Person Transactions Policy, the Audit Committee is responsible for reviewing, and if appropriate, approving related person transactions.

Other transactions. As a family-controlled company, we employ individuals who are considered “related persons” under SEC regulations. As of April 30, 2024, we employed one individual, Keeling W. Brown, who is an immediate family member of one of our directors, Stuart R. Brown. Keeling W. Brown is compensated in a manner consistent with our employment and compensation policies applicable to all employees, and the aggregate amount of compensation paid to Keeling W. Brown during fiscal 2024 in connection with his role as Senior Finance and Strategy Manager for Jack Daniel’s Tennessee Whiskey was $150,108.

On May 24, 2023, after fifteen years of dedicated service, John D. Cook informed the Board that he would not stand for re-election as a director at the Annual Meeting. In order to secure certain transition and consulting services from Mr. Cook, on June 13, 2023, the Company entered into a transition and consulting agreement with Mr. Cook. Pursuant to the agreement, Mr. Cook agreed to provide certain transition and consulting services to the Company for one year following his departure from the Board. For such services, the Company paid Mr. Cook $215,000 in two equal installments.

Compensation Committee Interlocks and Insider Participation

No member of the Compensation Committee is or has been an officer or employee of Brown-Forman, and no executive officer of Brown-Forman has served on the compensation committee or board of any company that employed any member of our Compensation Committee or Board of Directors either during fiscal 2024 or as of the date of this Proxy Statement.

Other Proposed Action at the Meeting

As of June 21, 2024, we know of no additional business that will come before the meeting. If any other matters are properly presented for voting at the Annual Meeting, the proxies will be voted on those matters as the Board may recommend or, in the absence of a recommendation, in accordance with the judgment of the proxy holders.

Stockholder Proposals for the 2025 Annual Meeting

To be considered for inclusion in the Proxy Statement for the 2025 Annual Meeting of Stockholders, stockholder proposals under Rule 14a-8 of the Exchange Act must be received by Brown-Forman at its principal office at 850 Dixie Highway, Louisville, Kentucky 40210, no later than February 21, 2025. Proposals should be sent to the attention of our Secretary, and must comply with SEC requirements related to the inclusion of stockholder proposals under Rule 14a-8 of the Exchange Act in company-sponsored proxy materials. Any notice of a proposal submitted outside the process of Rule 14a-8 of the Exchange Act that a stockholder intends to bring at our 2025 Annual Meeting of Stockholders should be sent to the attention of our Secretary, at the address above between March 27, 2025, and April 26, 2025. The notice must set forth the information required by our By-laws as to the stockholder giving the notice and the proposal or the person whom the stockholder proposes to nominate for election as a director. In addition to satisfying the requirements under our By-laws, to comply with the universal proxy rules, stockholders who intend to solicit proxies in support of director nominees other than Brown-Forman’s nominees must provide notice that sets forth the information required by Rule 14a-19 under the Exchange Act (including a statement that such stockholder intends to solicit the holders of shares representing at least 67% of the voting power of Brown-Forman’s shares entitled to vote on the election of directors in support of director nominees other than Brown-Forman’s nominees).

By Order of the Board of Directors

MICHAEL E. CARR, JR.

Secretary

LOGO

Louisville, Kentucky

June 21, 2024


2024 Proxy Statement and Notice of Annual Meeting of Stockholders 69


Table of Contents

APPENDIX A

NON-GAAP FINANCIAL MEASURES

We use some financial measures in this Proxy Statement that are not measures of financial performance under U.S. generally accepted accounting principles (GAAP). These non-GAAP measures, defined below, should be viewed as supplements to (not substitutes for) our results of operations and other measures reported under GAAP. Other companies may not define or calculate these non-GAAP measures in the same way.

“Underlying change” in measures of statements of operations. We present changes in certain measures, or line items, of the statements of operations that are adjusted to an “underlying” basis. We use “underlying change” for underlying net sales and underlying operating income to calculate components of management incentive compensation. To calculate these measures, we adjust, as applicable, for (a) acquisitions and divestitures, (b) foreign exchange, (c) estimated net changes in distributor inventories, (d) impairment charges, and (e) other items. We explain these adjustments below.

“Acquisitions and divestitures.” This adjustment removes (a) the gain or loss recognized on sale of divested brands, (b) any non-recurring effects related to our acquisitions and divestitures (e.g., transaction, transition, and integration costs), and (c) the effects of operating activity related to acquired and divested brands for periods not comparable year-over-year (non-comparable periods). Excluding non-comparable periods allows us to include the effects of acquired and divested brands only to the extent that results are comparable year-over-year. We believe that these adjustments allow for us to better understand our underlying results on a comparable basis.


In fiscal 2020, we acquired The 86 Company, which owns Fords Gin. This adjustment removes (a) transaction and integration costs related to the acquisition and (b) operating activity for the acquired business for the non-comparable period. With respect to comparisons of fiscal 2021 to fiscal 2020, the non-comparable period is the first quarter of fiscal 2021.


During fiscal 2021, we sold the Early Times, Canadian Mist, and Collingwood brands and related assets, which resulted in a pre-tax gain of $127 million, and entered into a related transition services agreement (TSA) for these brands. This adjustment removes (a) transaction and integration costs related to the divestitures, (b) the gain on sale of Early Times, Canadian Mist, and Collingwood and related assets, (c) operating activity for the non-comparable periods for Early Times, Canadian Mist, and Collingwood, and (d) the net sales and operating expenses recognized pursuant to the TSA related to (i) contract bottling services and (ii) distribution services in certain markets. With respect to comparisons of fiscal 2021 to fiscal 2020, the non-comparable period is the second, third, and fourth quarters of both fiscal 2021 and fiscal 2020. With respect to comparisons of fiscal 2022 and fiscal 2021, the non-comparable operating activity period is the first quarter of fiscal 2021.


During the third quarter of fiscal 2021, we acquired Part Time Rangers Holdings Limited, which owns Part Time Rangers RTDs. This adjustment removes (a) transaction and integration costs related to the acquisition and (b) operating activity for the acquired business for the non-comparable period. With respect to comparisons of fiscal 2021 to fiscal 2020, the non-comparable period is the third and fourth quarters of fiscal 2021. With respect to comparisons of fiscal 2022 to fiscal 2021, the non-comparable period is primarily activity in the first and second quarters of fiscal 2022.


During the third quarter of fiscal 2023, we acquired Gin Mare Brand, S.L.U. and Mareliquid Vantguard, S.L.U., which owned the Gin Mare brand (Gin Mare). This adjustment removes (a) the transaction, transition, and integration costs

  LOGO


70 Brown-Forman


Table of Contents


related to the acquisition, (b) operating activity for the non-comparable periods, and (c) fair value adjustments to Gin Mare’s earn-out contingent consideration liability that is payable in cash no earlier than July 2024 and no later than July 2027. With respect to comparisons of fiscal 2023 and fiscal 2022, the non-comparable period is the third and fourth quarters of fiscal 2023. With respect to comparisons of fiscal 2024 and fiscal 2023, the non-comparable period is the first and second quarters of fiscal 2024.

During the third quarter of fiscal 2023, we acquired (a) International Rum and Spirits Distributors Unipessoal, Lda., (b) Diplomático Branding Unipessoal Lda., (c) International Bottling Services, S.A., (d) International Rum & Spirits Marketing Solutions, S.L., and (e) certain assets of Destilerias Unidas Corp., which collectively own the Diplomático Rum brand and related assets (Diplomático). This adjustment removes (a) the transaction, transition, and integration costs related to the acquisition, and (b) operating activity for the non-comparable periods. With respect to comparisons of fiscal 2023 and fiscal 2022, the non-comparable period is the third and fourth quarter of 2023. With respect to comparisons of fiscal 2024 and fiscal 2023, the non-comparable period is the first three quarters of fiscal 2024.

During the third quarter of fiscal 2024, we sold the Finlandia vodka business, which resulted in a pre-tax gain of $92 million, and entered into a related TSA for this business. This adjustment removes the (a) transaction costs related to the divestiture, (b) the gain on sale of the Finlandia vodka business, (c) operating activity for the non-comparable period, and (d) net sales, cost of sales, and operating expenses recognized pursuant to the TSA related to distribution services in certain markets. With respect to comparisons of fiscal 2024 and fiscal 2023, the non-comparable period is the third and fourth quarters of fiscal 2023.

During the fourth quarter of fiscal 2024, we sold the Sonoma-Cutrer wine business in exchange for an ownership percentage of 21.4% in The Duckhorn Portfolio Inc. (Duckhorn) along with $50 million cash and entered into a related TSA for this business. This transaction resulted in a pre-tax gain of $175 million. This adjustment removes the transaction costs related to the divestiture and the gain on sale of the Sonoma-Cutrer wine business.

During the second quarter of fiscal 2024, we recognized a gain of $7 million on the sale of certain fixed assets. This adjustment removes the gain from our other expense (income), net and operating income to present our underlying results on a comparable basis.

We believe that these adjustments allow us to better understand our underlying results on a comparable basis.

“Foreign exchange.” We calculate the percentage change in certain line items of the statements of operations in accordance with GAAP and adjust to exclude the cost or benefit of currency fluctuations. Adjusting for foreign exchange allows us to understand our business on a constant-dollar basis, as fluctuations in exchange rates can distort the underlying trend both positively and negatively. (In this Proxy Statement, “dollar” always means the U.S. dollar unless stated otherwise.) To eliminate the effect of foreign exchange fluctuations when comparing across periods, we translate current-year results at prior-year rates and remove transactional and hedging foreign exchange gains and losses from current-and prior-year periods.

“Estimated net changes in distributor inventories.” This adjustment refers to the estimated net effect of changes in distributor inventories on changes in certain line items of the statements of operations. For each period compared, we use volume information from our distributors to estimate the effect of distributor inventory changes in certain line items of the statements of operations. We believe that this adjustment reduces the effect of varying levels of distributor inventories on changes in certain line items of the statements of operations and allows us to better understand our underlying results and trends.

“Impairment charges.” During fiscal 2020, we recognized a non-cash impairment charge of $13 million for our Chambord brand name. During the first three quarters of fiscal 2022, we recognized non-cash impairment charges of $9 million for certain fixed assets. During the fourth quarter of fiscal 2022, we recognized a non-cash impairment charge of $52 million for our Finlandia brand name. During the third quarter of fiscal 2023, we recognized a non-cash impairment charge of $96 million for the Finlandia brand name. During the fourth quarter of fiscal 2024, we recognized a non-cash impairment charge of $7 million for an immaterial discontinued brand name. We believe that these adjustments allow us to better understand our underlying results on a comparable basis.

“Other Items.” Other Items include the additional items outlined below.

“Foundation.” During the fourth quarter of fiscal 2021, we committed $20 million to the Brown-Forman Foundation to support the communities where our employees live and work. During the fourth quarter of fiscal 2024, we committed $23 million to the Brown-Forman Foundation and Dendrifund to support the communities where our employees live and work. These adjustments remove commitments to the Foundation from our underlying SG&A expenses and underlying operating income to present our underlying results on a comparable basis.


2024 Proxy Statement and Notice of Annual Meeting of Stockholders 71


Table of Contents

“Jack Daniel’s Country Cocktails business model change (JDCC).” In fiscal 2021, we entered into a partnership with the Pabst Brewing Company for the supply, sales, and distribution of Jack Daniel’s Country Cocktails in the United States while Brown-Forman continued to produce certain products. During fiscal 2024, this production fully transitioned to Pabst Brewing Company for the Jack Daniel’s Country Cocktails products. This adjustment removes the non-comparable operating activity related to the sales of Brown-Forman-produced JDCC products during the fourth quarter of fiscal 2023 and fiscal 2024.

We use the non-GAAP measure “underlying change” to calculate components of management incentive compensation. “Underlying change” differs from “underlying change,” which we use for certain measures, or line items, of the statements of operations when reporting our financial results publicly. “underlying change” includes all of the non-GAAP adjustments that we include in “underlying change,” except that “underlying change” does not include an adjustment for “estimated net change in distributor inventories,” which reflects the estimated net effect of changes in distributor inventories on changes in certain line items of the statements of operations. We provide reconciliations of the “underlying change” in net sales and operating income (non-GAAP) to the change in reported net sales and operating income (GAAP) in the following tables.

RECONCILIATION OF NON-GAAP UNDERLYING CHANGES

RECONCILIATION OF UNDERLYING NET SALES YEAR-OVER-YEAR CHANGE


    Percentage Change Versus Prior Fiscal Year      
       2021      2022      2023      2024 

 Change in reported net sales (GAAP)

  3%   14%   8%   -1% 

 Acquisitions and divestitures

  0%   2%   0%   -1% 

 JDCC(1)

  0%   0%   0%   0% 

 Foreign exchange

  -1%   2%   3%   0% 

 Estimated net change in distributor inventories

  4%   -4%   0%   6% 

 Change in underlying net sales (non-GAAP)

  6%   13%   11%   4% 


(1) 

“JDCC” is included in the “Other Items” non-GAAP financial measure. See above for additional details.

RECONCILIATION OF UNDERLYING OPERATING INCOME YEAR-OVER-YEAR CHANGE


    Percentage Change Versus Prior Fiscal Year      
       2021      2022      2023      2024 

 Change in reported operating income (GAAP)

  7%   3%   -6%   25% 

 Acquisitions and divestitures

  -10%   14%   4%   -27% 

 Impairment charges

  -1%   6%   3%   -7% 

 Other Items(2)

  2%   -2%   0%   2% 

 Foreign exchange

  -2%   6%   7%   4% 

 Estimated net change in distributor inventories

  9%   -12%   0%   14% 

 Change in underlying operating income (non-GAAP)

  4%   15%   8%   12% 

(2) Other Items include “JDCC” and “Foundation”. See “Non-GAAP Financial Measures” above for additional details.

Note: Results may differ due to rounding.

OTHER METRICS

“Return on average invested capital.” This measure refers to the sum of net income and after-tax interest expense, divided by average invested capital. Average invested capital equals assets less liabilities, excluding interest-bearing debt, and is calculated using the average of the most recent five quarter-end balances. After-tax interest expense equals interest expense multiplied by one minus our effective tax rate. We use this non-GAAP measure because we consider return on average invested capital to be a meaningful indicator of how effectively and efficiently we invest capital in our business.

In fiscal 2023, we changed the methodology used to determine average invested capital. Previously, average invested capital was computed using the average of the most recent 13 month-end balances. Average invested capital is now calculated using the average of the most recent five quarter-end balances, which are disclosed in the relevant Quarterly Reports on Form 10-Q and Annual Reports on Form 10-K. This change in methodology was consistently applied to return on average invested capital for each period presented.


72 Brown-Forman


Table of Contents

LOGO


Table of Contents

LOGO


Table of Contents

LOGO


   LOGO

VOTE BY INTERNET

Go to www.proxyvote.com or scan the QR Barcode above

Use the Internet to transmit your voting instructions and for electronic delivery of information up until 11:59 P.M. Eastern Daylight Time, on Wednesday, July 24, 2024. Have your proxy card in hand when you access the web site and enter the control number found on the right-hand side of this card to obtain your records and to create an electronic voting instruction form.

VOTE BY PHONE - 1-800-690-6903

Use any touch-tone telephone to transmit your voting instructions up until 11:59 P.M. Eastern Daylight Time, on Wednesday, July 24, 2024. Have your proxy card in hand when you call and then follow the instructions.

VOTE BY MAIL

Mark, sign, and date your proxy card and return it in the postage paid envelope we have provided or return it to Vote Processing, c/o Broadridge, 51 Mercedes Way, Edgewood, NY 11717.


TO VOTE, MARK BLOCKS BELOW IN BLUE OR BLACK INK AS FOLLOWS:

V52656-P14833-Z87950       KEEP THIS PORTION FOR YOUR RECORDS

— — — — — — — — — — — — — — — — — — — — — — — — — — — — — — — — — — — — — — — — — — — — — — — — — — — 

DETACH AND RETURN THIS PORTION ONLY

THIS PROXY CARD IS VALID ONLY WHEN SIGNED AND DATED.


  BROWN-FORMAN CORPORATION                      


THE BOARD OF DIRECTORS UNANIMOUSLY RECOMMENDS A VOTE

”FOR” PROPOSALS 1 AND 2:


1.  Election of Directors

                       
      Nominees:   For   Against   Abstain                    
 

    1a.   Campbell P. Brown                          


  1b.   Elizabeth M. Brown

                 For    Against    Abstain   


  1c.   Mark A. Clouse


2.  Ratification of the Selection of Ernst & Young LLP as Brown-Forman Corporation’s Independent Registered Public Accounting Firm for Fiscal 2025


  1d.   Marshall B. Farrer


  1e.   W. Austin Musselman, Jr.


  1f.    Michael J. Roney


  1g.   Jan E. Singer


  1h.   Tracy L. Skeans


  1i.    Elizabeth A. Smith


  1j.    Michael A. Todman


  1k.    Lawson E. Whiting


The shares represented by this proxy, when properly executed, will be voted in the manner directed herein by the undersigned stockholder(s). If no direction is made, this proxy will be voted “FOR” the election of each of the nominees for director and “FOR” the ratification of the selection of Ernst & Young LLP as Brown-Forman Corporation’s Independent Registered Public Accounting Firm for Fiscal 2025. If any other business properly comes before the Annual Meeting, the persons named in this proxy will vote in their discretion.


Please sign your name(s) exactly as it/they appear(s) hereon. When signing as attorney, executor, administrator, trustee, or guardian, please add your title as such. When signing as joint tenants, all parties in the joint tenancy must sign. If a signer is a corporation, please sign in full corporate name by a duly authorized officer.


Signature [PLEASE SIGN WITHIN BOX]


Date


 Signature (Joint Owners)


 Date


Table of Contents

Important Notice Regarding the Availability of Proxy Materials for the Annual Meeting:

The Notice of Annual Meeting, Proxy Statement, and Annual Report to Stockholders are available

at www.proxyvote.com.


— — — — — — — — — — — — — — — — — — — — — — — — — — — — — — — — — — — — — — — — — — — — — — — — — — —
V52657-P14833-Z87950  


THIS PROXY IS SOLICITED ON BEHALF OF THE BOARD OF DIRECTORS

FOR THE ANNUAL MEETING OF STOCKHOLDERS ON JULY 25, 2024.


The undersigned hereby appoint(s) Campbell P. Brown, Lawson E. Whiting, and Michael E. Carr, Jr., and each of them, as proxies, with the power to appoint his or her substitute, and hereby authorize(s) them to represent and to vote, as designated on the reverse side of this ballot, all of the shares of Class A common stock of Brown-Forman Corporation that the undersigned is/are entitled to vote at the Annual Meeting of Stockholders to be held at 9:30 A.M. Eastern Daylight Time on Thursday, July 25, 2024, at the Kentucky Center for the Performing Arts, 501 West Main Street, Louisville, Kentucky 40202, and any adjournment or postponement thereof.


THIS PROXY, WHEN PROPERLY EXECUTED, WILL BE VOTED AS DIRECTED BY THE UNDERSIGNED. IF NO SUCH DIRECTIONS ARE MADE, THIS PROXY WILL BE VOTED “FOR” THE ELECTION OF EACH OF THE NOMINEES FOR DIRECTOR LISTED ON THE REVERSE SIDE AND “FOR” THE RATIFICATION OF THE SELECTION OF ERNST & YOUNG LLP AS BROWN-FORMAN CORPORATION’S INDEPENDENT REGISTERED PUBLIC ACCOUNTING FIRM FOR FISCAL 2025. THE VOTES ENTITLED TO BE CAST BY THE UNDERSIGNED WILL BE CAST AT THE DISCRETION OF THE NAMED PROXY HOLDERS UPON ANY OTHER MATTER THAT MAY PROPERLY COME BEFORE THE ANNUAL MEETING AND ANY ADJOURNMENT OR POSTPONEMENT THEREOF.


PLEASE MARK, SIGN, DATE, AND RETURN THIS PROXY CARD PROMPTLY USING THE ENCLOSED REPLY ENVELOPE.


CONTINUED AND TO BE SIGNED ON REVERSE SIDE