Exhibit 99.1
|
|

September 2011
|
|
Forward-Looking Statements
Some of the statements contained in this presentation constitute forward-looking statements within the meaning of the federal securities laws. Forward-looking statements relate to expectations, beliefs, projections, future plans and strategies, anticipated events or trends and similar expressions concerning matters that are not historical facts. In some cases, you can identify forward-looking statements by the use of forward-Looking terminology such as “may,” “will,” “should,” “expects,” “intends,” “plans,” “anticipates,” “believes,” “estimates,” “predicts,” or “potential” or the negative of these words and phrases or similar words or phrases which are predictions of or indicate future events or trends and which do not relate solely to historical matters. You can also identify forward-looking statements by discussions of strategy, plans or intentions.
The forward-looking statements contained in this presentation reflect our current views about future events and are subject to numerous known and unknown risks, uncertainties, assumptions and changes in circumstances, many of which are beyond our control, that may cause our actual results to differ significantly from those expressed in any forward-looking statement. Statements regarding the following subjects, among others, may be forward-looking: the use of proceeds from our public and private offerings (as the case may be); our business and investment strategy; our projected operating results; our ability to obtain financing arrangements; financing and advance rates for our target assets; our expected leverage; general volatility of the securities markets in which we invest; our expected investments; our expected co-investment allocations and related requirements; interest rate mismatches between our target assets and our borrowings used to fund such investments; changes in interest rates and the market value of our target assets; changes in prepayment rates on our target assets; effects of hedging instruments on our target assets; rates of default or decreased recovery rates on our target assets; the degree to which our hedging strategies may or may not protect us from interest rate volatility; impact of changes in governmental regulations, tax law and rates, and similar matters; our ability to maintain our qualification as a REIT for U.S. federal income tax purposes; our ability to maintain our exemption from registration under the 1940 Act; availability of investment opportunities in mortgage-related and real estate-related investments and other securities; availability of qualified personnel; estimates relating to our ability to make distributions to our stockholders in the future; our understanding of our competition; and market trends in our industry, interest rates, real estate values, the debt securities markets or the general economy.
While forward-looking statements reflect our good faith beliefs, assumptions and expectations, they are not guarantees of future performance. Furthermore, we disclaim any obligation to publicly update or revise any forward-looking statement to reflect changes in underlying assumptions or factors, new information, data or methods, future events or other changes. For a further discussion of these and other factors that could cause our future results to differ materially from any forward-looking statements, see the section entitled “Risk Factors” in our Annual Report on Form 10-K for the year ended December 31, 2010 and subsequent filings with the SEC.
This presentation contains statistics and other data that has been obtained from or compiled from information made available by third-party service providers. We have not independently verified such statistics or data.
Certain of the following slides present information related to the prior performance of Colony Capital, LLC and its affiliates. This information is provided for informational purposes only and is not intended to be indicative of future results. Actual performance of Colony Financial, Inc. may vary materially.
1
|
|
Colony Financial, Inc. Overview
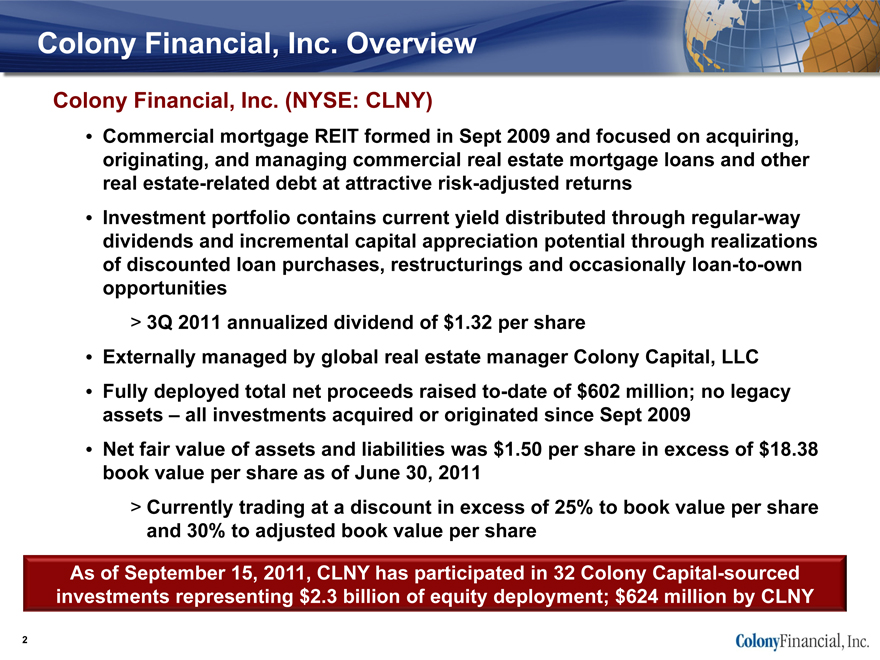
Colony Financial, Inc. (NYSE: CLNY)
• Commercial mortgage REIT formed in Sept 2009 and focused on acquiring, originating, and managing commercial real estate mortgage loans and other real estate-related debt at attractive risk-adjusted returns
• Investment portfolio contains current yield distributed through regular-way dividends and incremental capital appreciation potential through realizations of discounted loan purchases, restructurings and occasionally loan-to-own opportunities
> 3Q 2011 annualized dividend of $1.32 per share
• Externally managed by global real estate manager Colony Capital, LLC
• Fully deployed total net proceeds raised to-date of $602 million; no legacy assets – all investments acquired or originated since Sept 2009
• Net fair value of assets and liabilities was $1.50 per share in excess of $18.38 book value per share as of June 30, 2011
> Currently trading at a discount in excess of 25% to book value per share and 30% to adjusted book value per share
As of September 15, 2011, CLNY has participated in 32 Colony Capital-sourced investments representing $2.3 billion of equity deployment; $624 million by CLNY
2
|
|
Key Financial Metrics & Trading Statistics
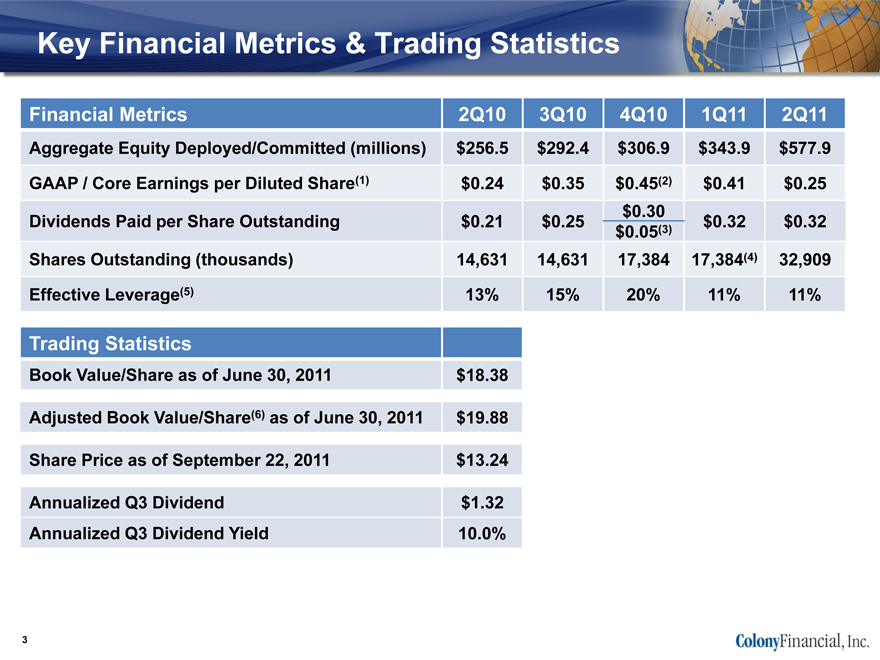
Financial Metrics 2Q10 3Q10 4Q10 1Q11 2Q11
Aggregate Equity Deployed/Committed (millions) $256.5 $292.4 $306.9 $343.9 $577.9
GAAP / Core Earnings per Diluted Share(1) $0.24 $0.35 $0.45(2) $0.41 $0.25
$0.30
Dividends Paid per Share Outstanding $0.21 $0.25 $0.32 $0.32
$0.05(3)
Shares Outstanding (thousands) 14,631 14,631 17,384 17,384(4) 32,909
Effective Leverage(5) 13% 15% 20% 11% 11%
Trading Statistics
Book Value/Share as of June 30, 2011 $18.38
Adjusted Book Value/Share(6) as of June 30, 2011 $19.88
Share Price as of September 22, 2011 $13.24
Annualized Q3 Dividend $1.32
Annualized Q3 Dividend Yield 10.0%
3
|
|
CRE Debt Versus Equity
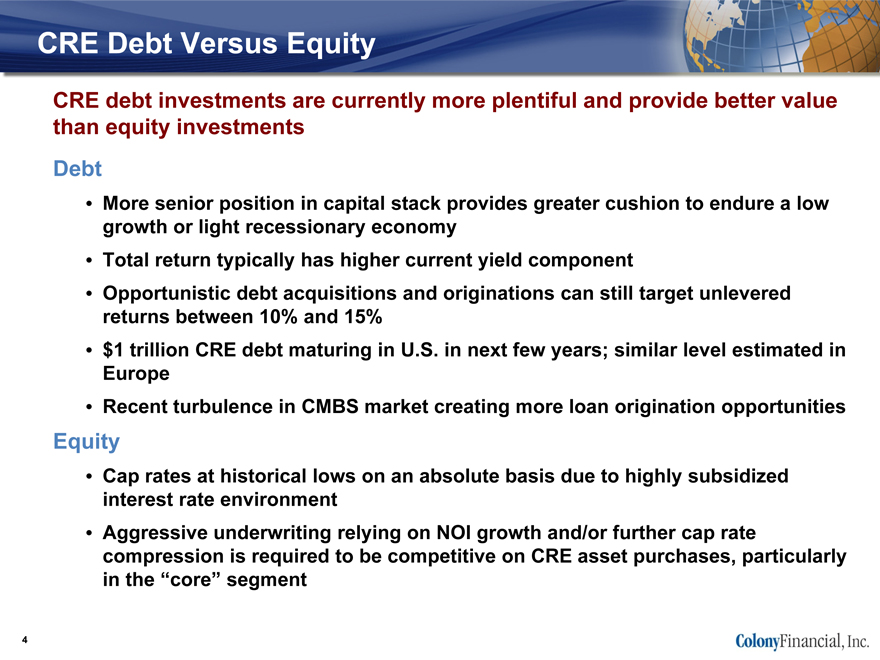
CRE debt investments are currently more plentiful and provide better value
than equity investments
Debt
• More senior position in capital stack provides greater cushion to endure a low
growth or light recessionary economy
• Total return typically has higher current yield component
• Opportunistic debt acquisitions and originations can still target unlevered
returns between 10% and 15%
• $1 trillion CRE debt maturing in U.S. in next few years; similar level estimated in
Europe
• Recent turbulence in CMBS market creating more loan origination opportunities
Equity
• Cap rates at historical lows on an absolute basis due to highly subsidized
interest rate environment
• Aggressive underwriting relying on NOI growth and/or further cap rate
compression is required to be competitive on CRE asset purchases, particularly
in the “core” segment
4
|
|
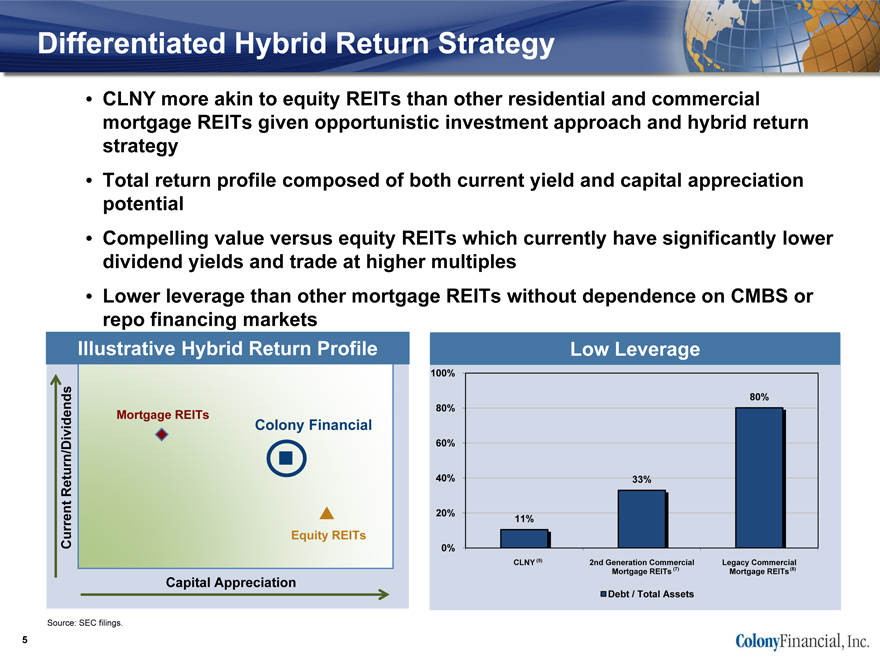
Differentiated Hybrid Return Strategy
• CLNY more akin to equity REITs than other residential and commercial mortgage REITs given opportunistic investment approach and hybrid return strategy
• Total return profile composed of both current yield and capital appreciation potential
• Compelling value versus equity REITs which currently have significantly lower dividend yields and trade at higher multiples
• Lower leverage than other mortgage REITs without dependence on CMBS or repo financing markets
Illustrative Hybrid Return Profile
Mortgage REITs
Colony Financial
Equity REITs
Capital Appreciation
Current Return/Dividends
Low Leverage
100% 80% 60% 40% 20% 0%
80%
33%
11%
CLNY (5)
2nd Generation Commercial Mortgage REITs (7)
Legacy Commercial Mortgage REITs(8)
Source: SEC filings.
5
|
|
Why CLNY?
Highly Differentiated Platform and Strategy
• Alignment of Platform with Colony Capital
> Experienced management team
> Access to extensive pipeline of proprietary global investment opportunities
> Strong asset level underwriting capabilities
> Value-added execution and asset management experience
> Core/integral business for our Sponsor, Colony Capital
• Dynamic and Flexible Investment Strategy
> Higher yielding returns in commercial real estate debt investments with
meaningful current income component
> Target asset classes and geographic markets experiencing improved
relative performance
> Conservative use of additional balance sheet leverage beyond subsidized
seller financing and interim use of credit facility
> Investment bias towards senior loans and select subordinate loans with
attractive collateral and borrower profile
6
|
|
Demonstrated Ability to Execute
We have executed our business plan…
• Full deployment of IPO proceeds within 12 months of IPO, December 2010 PIPE proceeds in Q1 2011 and April 2011 follow-on proceeds within Q3 2011
• Overall portfolio is performing according to underwriting
• Low leverage primarily via subsidized government seller financing
• Liquidity via recently upsized $175 million credit facility
• Accretive opportunities to finance or sell investments within existing portfolio
• Diversified portfolio of investments: co-investment with other vehicles managed by Colony Capital allows access to larger transactions while spreading risk over a broad base of investments
…and are well positioned to continue this performance
• Flexible mandate to pursue diverse real estate debt investment opportunities
• Equipped to quickly pursue and knowledgeably underwrite complex situations and large portfolios, which typically have less competition
• Proprietary global deal flow from Colony Capital’s extensive relationship network
• Manager’s asset management team is highly experienced with successful RTC experience
> Currently managing ~6,000 loans primarily acquired under the FDIC loan sale program
• Management substantially aligned having personally invested $16 million alongside shareholders in CLNY and private fund limited partners in existing CLNY portfolio
7
|
|
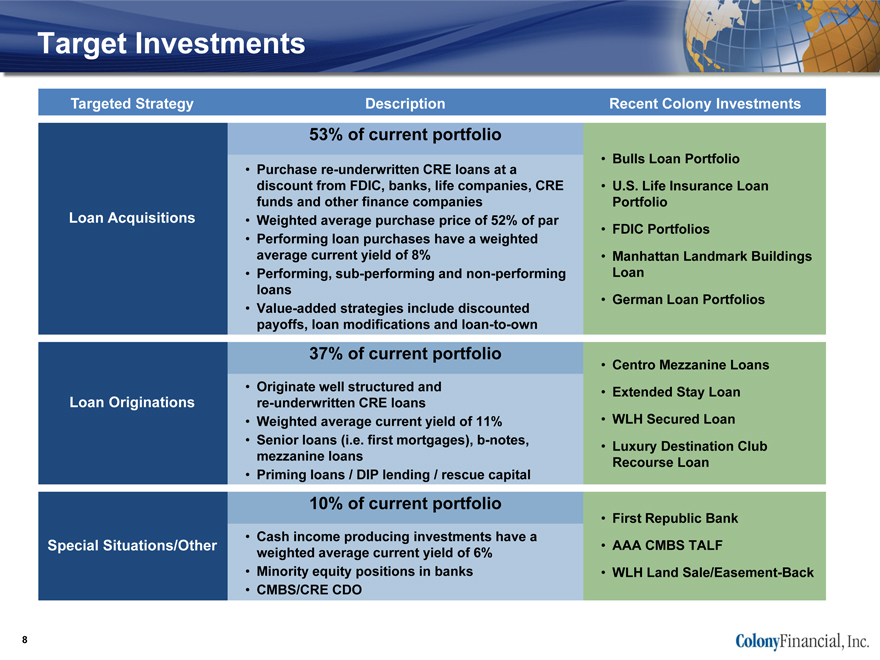
Target Investments
Targeted Strategy Description Recent Colony Investments
53% of current portfolio
• Bulls Loan Portfolio
• Purchase re-underwritten CRE loans at a
discount from FDIC, banks, life companies, CRE • U.S. Life Insurance Loan
funds and other finance companies Portfolio
Loan Acquisitions • Weighted average purchase price of 52% of par • FDIC Portfolios
• Performing loan purchases have a weighted
average current yield of 8% • Manhattan Landmark Buildings
• Performing, sub-performing and non-performing Loan
loans
• Value-added strategies include discounted • German Loan Portfolios
payoffs, loan modifications and loan-to-own
37% of current portfolio
• Centro Mezzanine Loans
• Originate well structured and • Extended Stay Loan
Loan Originations re-underwritten CRE loans
• Weighted average current yield of 11% • WLH Secured Loan
• Senior loans (i.e. first mortgages), b-notes, • Luxury Destination Club
mezzanine loans Recourse Loan
• Priming loans / DIP lending / rescue capital
10% of current portfolio
• First Republic Bank
• Cash income producing investments have a
Special Situations/Other • AAA CMBS TALF
weighted average current yield of 6%
• Minority equity positions in banks • WLH Land Sale/Easement-Back
• CMBS/CRE CDO
8
|
|
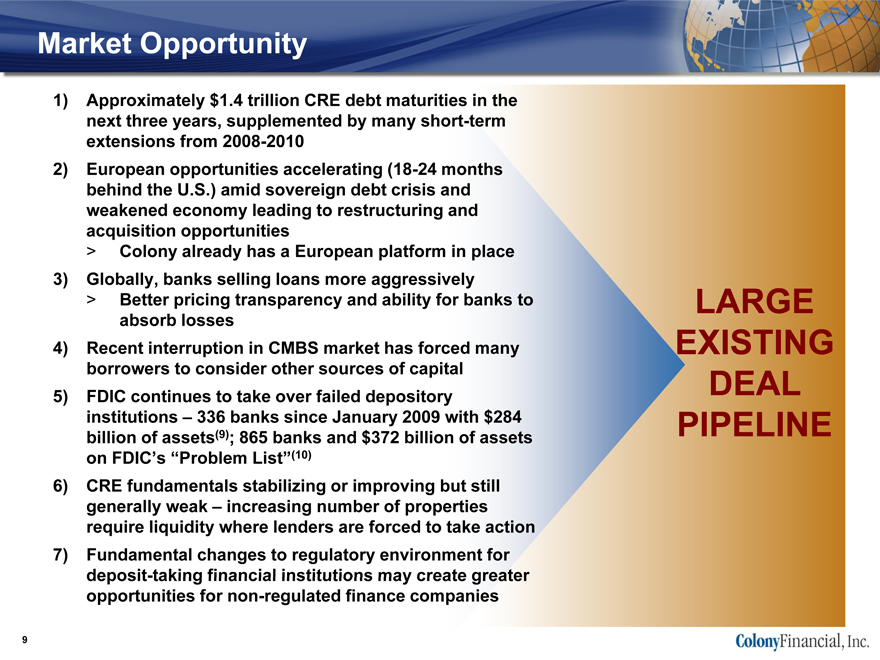
Market Opportunity
1) Approximately $1.4 trillion CRE debt maturities in the next three years, supplemented by many short-term extensions from 2008-2010
2) European opportunities accelerating (18-24 months behind the U.S.) amid sovereign debt crisis and weakened economy leading to restructuring and acquisition opportunities
> Colony already has a European platform in place
3) Globally, banks selling loans more aggressively
> Better pricing transparency and ability for banks to absorb losses
4) Recent interruption in CMBS market has forced many borrowers to consider other sources of capital
5) FDIC continues to take over failed depository institutions – 336 banks since January 2009 with $284 billion of assets(9); 865 banks and $372 billion of assets on FDIC’s “Problem List”(10)
6) CRE fundamentals stabilizing or improving but still generally weak – increasing number of properties require liquidity where lenders are forced to take action
7) Fundamental changes to regulatory environment for deposit-taking financial institutions may create greater opportunities for non-regulated finance companies
LARGE EXISTING
DEAL PIPELINE
9
|
|
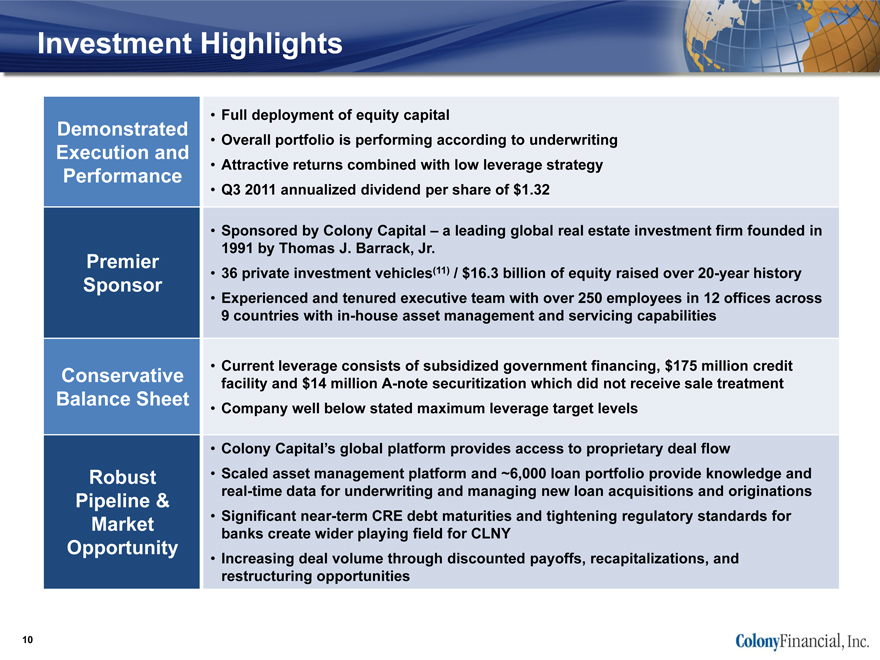
Investment Highlights
• Full deployment of equity capital
Demonstrated • Overall portfolio is performing according to underwriting
Execution and
Performance • Attractive returns combined with low leverage strategy
• Q3 2011 annualized dividend per share of $1.32
• Sponsored by Colony Capital – a leading global real estate investment firm founded in
1991 by Thomas J. Barrack, Jr.
Premier
Sponsor • 36 private investment vehicles(11) / $16.3 billion of equity raised over 20-year history
• Experienced and tenured executive team with over 250 employees in 12 offices across
9 countries with in-house asset management and servicing capabilities
• Current leverage consists of subsidized government financing, $175 million credit
Conservative facility and $14 million A-note securitization which did not receive sale treatment
Balance Sheet • Company well below stated maximum leverage target levels
• Colony Capital’s global platform provides access to proprietary deal flow
Robust • Scaled asset management platform and ~6,000 loan portfolio provide knowledge and
Pipeline & real-time data for underwriting and managing new loan acquisitions and originations
Market • Significant near-term CRE debt maturities and tightening regulatory standards for
banks create wider playing field for CLNY
Opportunity • Increasing deal volume through discounted payoffs, recapitalizations, and
restructuring opportunities
10
|
|
Appendix:
Current Portfolio,
Select Individual Deal Summaries,
Footnotes and Non-GAAP Reconciliation
/ Pro Forma Consolidated Balance Sheet
|
|
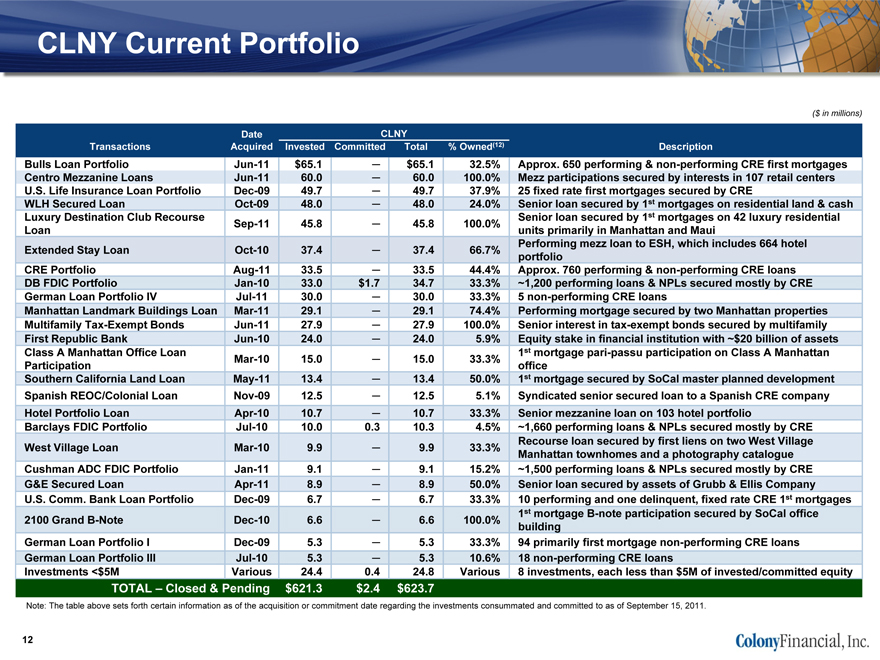
CLNY Current Portfolio
($ in millions)
Transactions
Bulls Loan Portfolio
Centro Mezzanine Loans
U.S. Life Insurance Loan Portfolio
WLH Secured Loan
Luxury Destination Club Recourse
Loan
Extended Stay Loan
CRE Portfolio
DB FDIC Portfolio
German Loan Portfolio IV
Manhattan Landmark Buildings Loan
Multifamily Tax-Exempt Bonds
First Republic Bank
Class A Manhattan Office Loan
Participation
Southern California Land Loan
Spanish REOC/Colonial Loan
Hotel Portfolio Loan
Barclays FDIC Portfolio
West Village Loan
Cushman ADC FDIC Portfolio
G&E Secured Loan
U.S. Comm. Bank Loan Portfolio
2100 Grand B-Note
German Loan Portfolio I
German Loan Portfolio III
Investments <$5M
Date Acquired
Jun-11 Jun-11 Dec-09 Oct-09 Sep-11Oct-10 Aug-11 Jan-10 Jul-11 Mar-11 Jun-11 Jun-10 Mar-10 May-11 Nov-09 Apr-10 Jul-10 Mar-10 Jan-11 Apr-11 Dec-09 Dec-10 Dec-09 Jul-10 Various
Invested $65.1 60.0 49.7 48.0 45.8 37.4 33.5 33.0 30.0 29.1 27.9 24.0 15.0 13.4 12.5 10.7 10.0 9.9 9.1 8.9 6.7 6.6 5.3 5.3 24.4
Committed
— — — — — — — $1.7 — — — — — — — — 0.3 — — — — — — — 0.4
Total $65.1 60.0 49.7 48.0 45.8 37.4 33.5 34.7 30.0 29.1 27.9 24.0 15.0 13.4 12.5 10.7 10.3 9.9 9.1 8.9 6.7 6.6 5.3 5.3 24.8 $623.7
% Owned(12) 32.5% 100.0% 37.9% 24.0% 100.0% 66.7% 44.4% 33.3% 33.3% 74.4% 100.0% 5.9% 33.3% 50.0% 5.1% 33.3% 4.5% 33.3% 15.2% 50.0% 33.3% 100.0% 33.3% 10.6% Various
CLNY
Description
Approx. 650 performing & non-performing CRE first mortgages Mezz participations secured by interests in 107 retail centers 25 fixed rate first mortgages secured by CRE
Senior loan secured by 1st mortgages on residential land & cash Senior loan secured by 1st mortgages on 42 luxury residential units primarily in Manhattan and Maui Performing mezz loan to ESH, which includes 664 hotel portfolio Approx. 760 performing & non-performing CRE loans ~1,200 performing loans & NPLs secured mostly by CRE 5 non-performing CRE loans Performing mortgage secured by two Manhattan properties Senior interest in tax-exempt bonds secured by multifamily Equity stake in financial institution with ~$20 billion of assets 1st mortgage pari-passu participation on Class A Manhattan office 1st mortgage secured by SoCal master planned development Syndicated senior secured loan to a Spanish CRE company Senior mezzanine loan on 103 hotel portfolio ~1,660 performing loans & NPLs secured mostly by CRE Recourse loan secured by first liens on two West Village Manhattan townhomes and a photography catalogue ~1,500 performing loans & NPLs secured mostly by CRE Senior loan secured by assets of Grubb & Ellis Company 10 performing and one delinquent, fixed rate CRE 1st mortgages 1st mortgage B-note participation secured by SoCal office building 94 primarily first mortgage non-performing CRE loans 18 non-performing CRE loans 8 investments, each less than $5M of invested/committed equity
TOTAL – Closed & Pending $621.3 $2.4 $623.7
Note: The table above sets forth certain information as of the acquisition or commitment date regarding the investments consummated and committed to as of September 15, 2011.
12
|
|
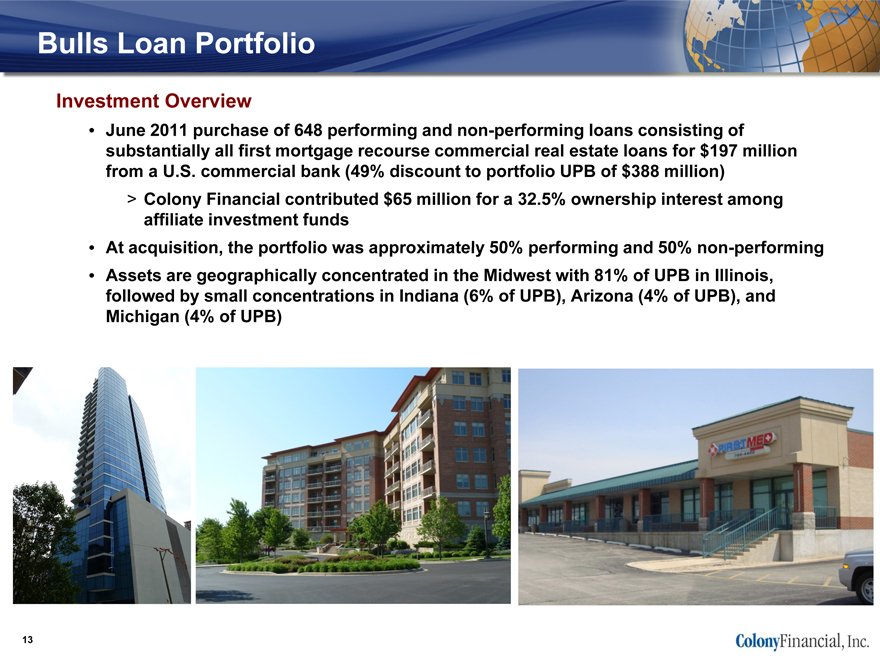
Bulls Loan Portfolio
Investment Overview
• June 2011 purchase of 648 performing and non-performing loans consisting of substantially all first mortgage recourse commercial real estate loans for $197 million from a U.S. commercial bank (49% discount to portfolio UPB of $388 million)
> Colony Financial contributed $65 million for a 32.5% ownership interest among affiliate investment funds
• At acquisition, the portfolio was approximately 50% performing and 50% non-performing
• Assets are geographically concentrated in the Midwest with 81% of UPB in Illinois, followed by small concentrations in Indiana (6% of UPB), Arizona (4% of UPB), and Michigan (4% of UPB)
13
|
|
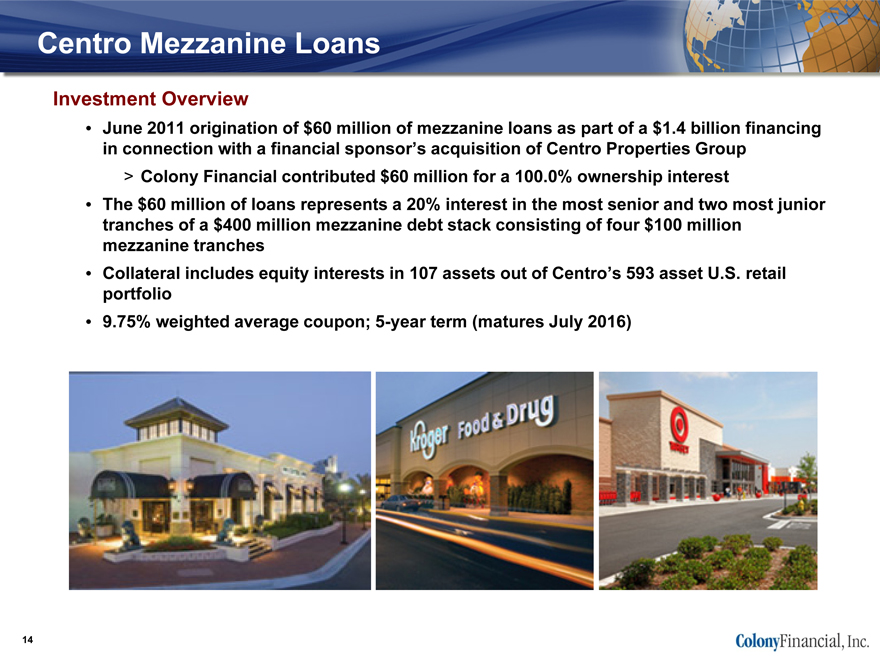
Centro Mezzanine Loans
Investment Overview
• June 2011 origination of $60 million of mezzanine loans as part of a $1.4 billion financing in connection with a financial sponsor’s acquisition of Centro Properties Group
> Colony Financial contributed $60 million for a 100.0% ownership interest
• The $60 million of loans represents a 20% interest in the most senior and two most junior tranches of a $400 million mezzanine debt stack consisting of four $100 million mezzanine tranches
• Collateral includes equity interests in 107 assets out of Centro’s 593 asset U.S. retail portfolio
• 9.75% weighted average coupon; 5-year term (matures July 2016)
14
|
|
Nationwide Loan Portfolio
Investment Description
• December 2009 purchase of 25 performing, first lien commercial loans for $131 million from a U.S. life insurance company (25% discount to portfolio UPB of $175 million)
> Colony Financial contributed $50 million for a 37.9% ownership interest among affiliate investment funds
• Assets located nationwide with largest concentration in PA (21% of UPB), NC (12%), CA, IL, MI, MO, NV, and UT (7-9% each) – 47% retail, 28% office, 22% industrial, 3% hotel
• Initial average interest yield of 8% and cash yield of 10% including principal amortization on purchase price basis
> At acquisition, loans in portfolio had been current for 32 months and had a remaining term of 88 months
• Expected that majority of loans will perform to maturity with some loans modified or resolved early through discounted payoff or foreclosure
15
|
|
William Lyon Homes (“WLH”) Secured Loan
Investment Overview
• October 2009 origination of $206 million senior first mortgage loan secured by substantially all of WLH’s assets and $71 million of pledged cash
> Colony Financial contributed $48 million for a 24.0% ownership interest among affiliate investment funds
• WLH has built over 100,000 homes since 1956
> WLH owns and controls approximately 11,000 lots, homes and models
• 14% coupon and 3% origination fee; 5-year term (matures Oct 2014)
> Interest only with full recourse to WLH
• Debt proceeds used by WLH to increase near-term corporate liquidity, accelerate development and sale of selected projects, extinguish revolver debt and acquire new assets at distressed pricing
Note: An amendment and waiver were granted to WLH with respect to certain financial covenants described in our first quarter 2011 10-Q and 8-K filings filed on March 21, 2011, April 27, 2011, July 25, 2011, and September 20, 2011.
16
|
|
Luxury Destination Club Recourse Loan
Investment Overview
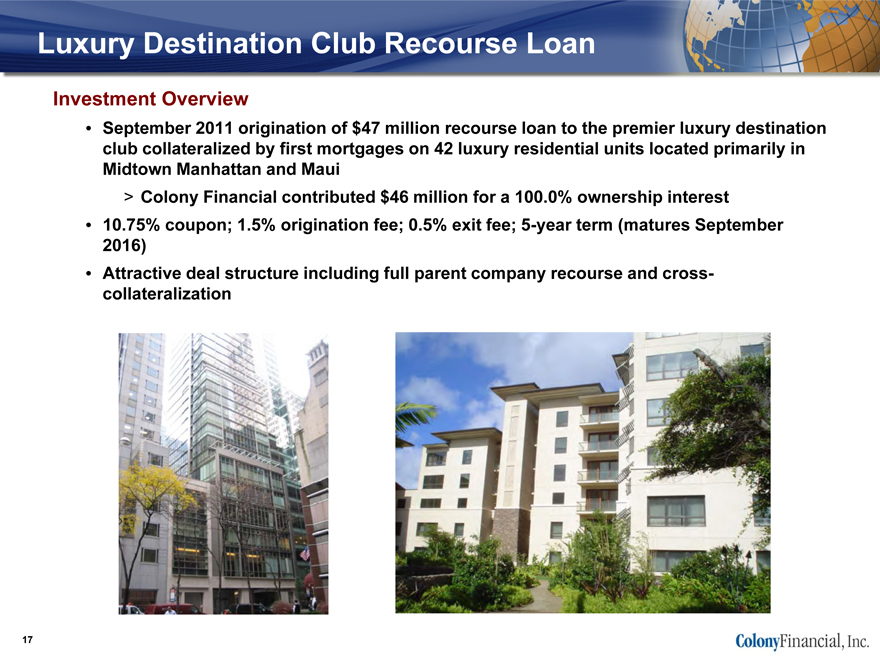
• September 2011 origination of $47 million recourse loan to the premier luxury destination club collateralized by first mortgages on 42 luxury residential units located primarily in Midtown Manhattan and Maui
> Colony Financial contributed $46 million for a 100.0% ownership interest
• 10.75% coupon; 1.5% origination fee; 0.5% exit fee; 5-year term (matures September 2016)
• Attractive deal structure including full parent company recourse and cross-collateralization
17
|
|
Extended Stay Loan
Investment Overview
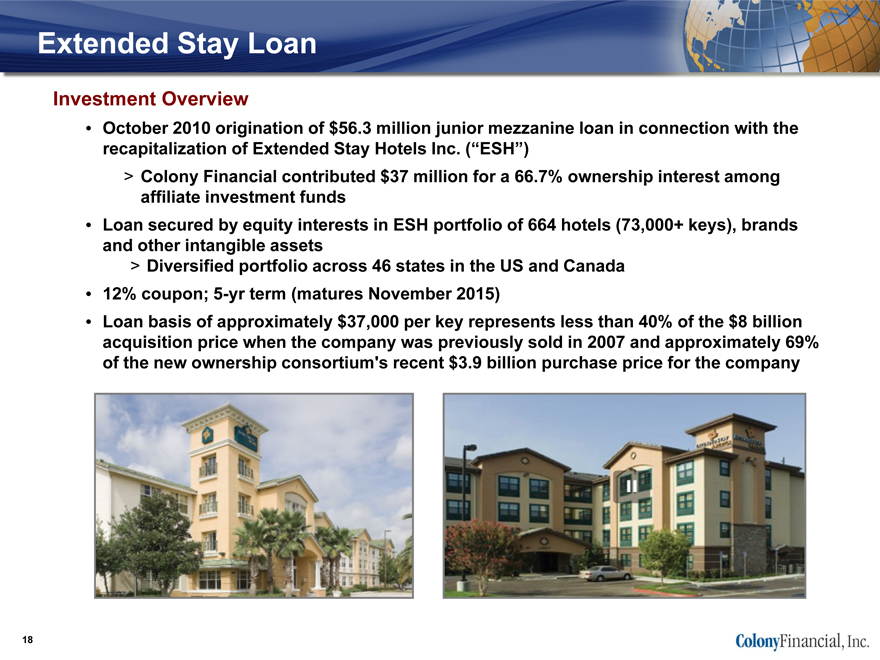
• October 2010 origination of $56.3 million junior mezzanine loan in connection with the recapitalization of Extended Stay Hotels Inc. (“ESH”)
> Colony Financial contributed $37 million for a 66.7% ownership interest among affiliate investment funds
• Loan secured by equity interests in ESH portfolio of 664 hotels (73,000+ keys), brands and other intangible assets
> Diversified portfolio across 46 states in the US and Canada
• 12% coupon; 5-yr term (matures November 2015)
• Loan basis of approximately $37,000 per key represents less than 40% of the $8 billion acquisition price when the company was previously sold in 2007 and approximately 69% of the new ownership consortium’s recent $3.9 billion purchase price for the company
18
|
|
CRE Portfolio
Investment Overview
• August 2011 portfolio acquisition of approximately 760 primarily first lien commercial real estate loans with aggregate unpaid principal balance of approximately $618 million for 53% of face value
> Colony Financial contributed $34 million for a 44.4% ownership interest among affiliate investment funds
• Acquired a 40% managing member equity interest in newly formed limited liability company created to hold acquired loans, with FDIC retaining remaining 60% equity interest
• At acquisition, the majority of the portfolio UPB was non-performing (63%) with the balance performing (37%)
> Collateral located in 25 states with concentrations in Georgia (23%), Illinois (15%), Wisconsin (12%), and Oregon (7%)
> Collateral primarily composed of retail (23%), office (13%), industrial (12%), multifamily (12%), and land (10%)
• FDIC provided highly favorable financing ($170 million – 50% LTV) at 0% interest rate; cash flow sweep after fees and expenses, no covenants
• All loans boarded onto loan servicing and asset management systems
19
|
|
DB FDIC Portfolio
Investment Overview
• January 2010 portfolio acquisition of approximately 1,200 loans with aggregate unpaid principal balance of approximately $1.0 billion for 44% of face value
> Colony Financial contributed $35 million for a 33.3% ownership interest among affiliate investment funds
• Acquired a 40% managing member equity interest in newly formed limited liability company created to hold acquired loans, with FDIC retaining remaining 60% equity interest
• Majority of portfolio comprised of non-performing and sub-performing loans secured by first priority liens on CRE assets and land
> Primarily in California, Nevada, Arizona, Georgia and Florida
> High concentration of loans secured by land and retail assets
• FDIC provided highly favorable financing ($233 million – 50% LTV) at 0% interest rate; cash flow sweep after fees and expenses, no covenants
• All loans boarded onto loan servicing and asset management systems
• Asset managers establishing and executing business plans on asset by asset basis
> Borrowers contacted and discussions underway regarding modifications; foreclosure and other legal strategies being pursued where necessary
20
|
|
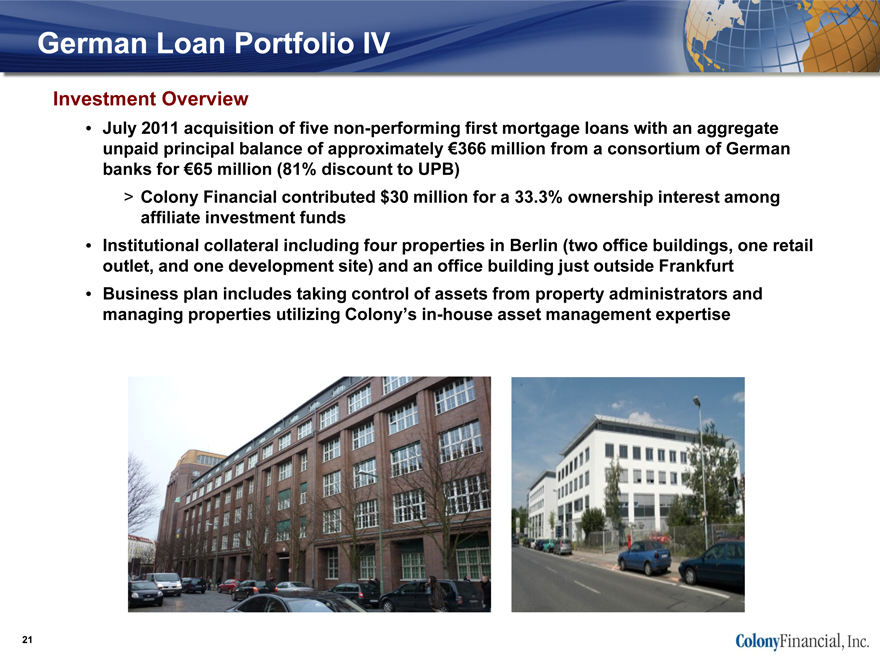
German Loan Portfolio IV
Investment Overview
• July 2011 acquisition of five non-performing first mortgage loans with an aggregate unpaid principal balance of approximately €366 million from a consortium of German banks for €65 million (81% discount to UPB)
> Colony Financial contributed $30 million for a 33.3% ownership interest among affiliate investment funds
• Institutional collateral including four properties in Berlin (two office buildings, one retail outlet, and one development site) and an office building just outside Frankfurt
• Business plan includes taking control of assets from property administrators and managing properties utilizing Colony’s in-house asset management expertise
21
|
|
Footnotes
1) For all periods shown, GAAP Earnings per Diluted Share were equal to Core Earnings per Diluted Share. Core Earnings is a non-GAAP financial measure that adjusts net income, computed in accordance with GAAP, by excluding (i) non-cash equity compensation expense, (ii) the expenses incurred in connection with the formation of the Company and the Initial Public Offering, including the initial underwriting discounts and commissions and the Additional Underwriting Discount, (iii) the Incentive Fee, (iv) real estate depreciation and amortization, (v) any unrealized gains or losses from mark to market valuation changes (other than permanent impairment) that are included in net income, (vi) one-time events pursuant to changes in GAAP and (vii) non-cash items which in the judgment of management should not be included in Core Earnings. For clauses (vi) and (vii), such exclusions shall only be applied after discussions between the Manager and the Independent Directors and approval by a majority of the Independent Directors.
2) Includes $0.10 per share from our share of the gain on sale of FRB’s shares and gain on sale of a loan receivable.
3) Represents special dividend.
4) Actual shares outstanding as of March 31, 2011 were 17,384,000; however, the Company had common stock subscribed as of March 31, 2011 as a result of a follow-on offering. The Company issued 15,525,000 shares related to this follow-on subscription, subsequent exercise of the underwriters’ overallotment option and issuance of anti-dilution shares resulting in 32,909,000 shares of its common stock issued and outstanding.
5) Effective leverage based on pro rata share of unconsolidated JV debt in FDIC and TALF investments, outstanding credit facility, and secured financing related to 2100 Grand investment.
6) Adjusted Book Value per Share is based on adding the excess of the fair values of CLNY’s financial assets over the carrying values, which was $49.5M at 6/30/11, to total stockholders’ equity, as reported in accordance with GAAP, divided by total shares outstanding. The fair values of CLNY’s financial assets are based on CLNY’s prorata share of fair values for investment assets calculated for investment funds managed by affiliates of our manager in accordance with FASB ASC 820 and disclosed in the footnotes to CLNY’s financial statements.
7) Straight average of debt to total assets for STWD, CXS and ARI as of June 30, 2011.
8) Straight average of debt to total assets for SFI, RSO, NRF, NCT, RAS, GKK and CT as of June 30, 2011.
9) FDIC as of April 29, 2011.
10) FDIC as of June 30, 2011.
11) Includes investment-specific co-investment vehicles.
12) Represents Colony Financial’s share of acquisition entities formed by Colony Financial with investment funds and other investment vehicles managed by affiliates of Colony Capital.
22