Exhibit 99.1

FOR IMMEDIATE RELEASE
WESTERN ASSET MORTGAGE CAPITAL CORPORATION
ANNOUNCES FIRST QUARTER 2014 RESULTS
Conference Call and Webcast Scheduled for today at 12:00 p.m. Eastern Time/9:00 a.m. Pacific Time
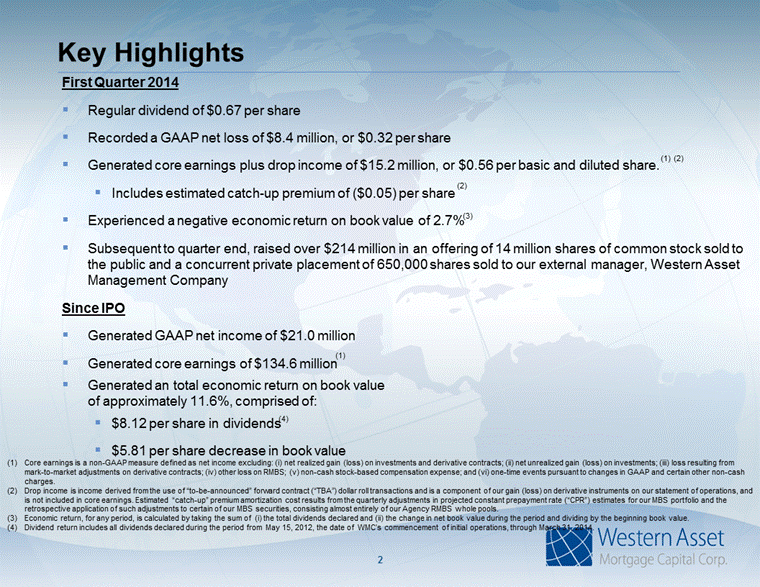
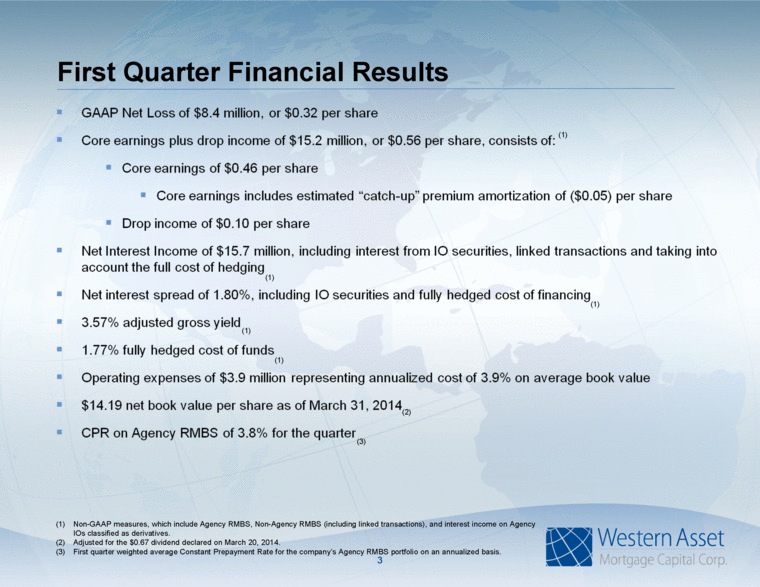
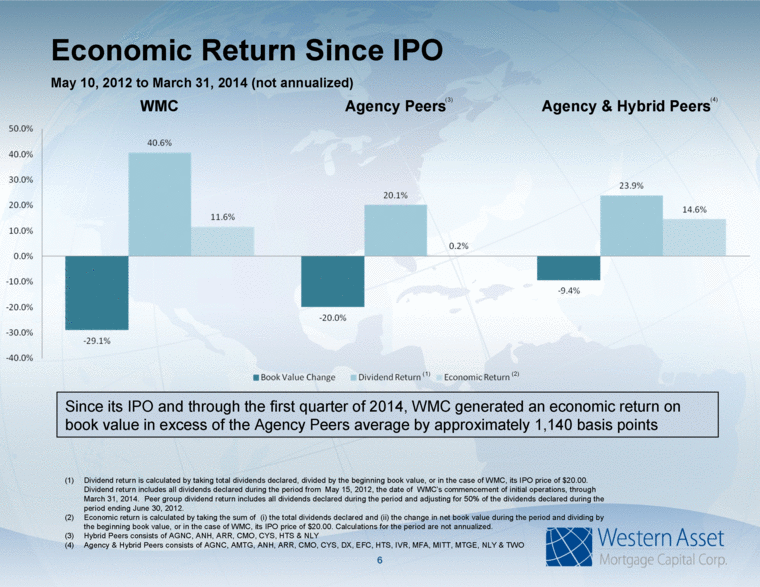
Pasadena, CA, May 8, 2014 — Western Asset Mortgage Capital Corporation (NYSE: WMC) today reported its results for the first quarter ended March 31, 2014. These results reflect the strategic decision by the Company to diversify its portfolio away from a pure Agency REIT and move toward a more “hybrid” REIT model. Actions taken by the Company in order to implement this strategy had a negative impact on both operating results for the period and book value as of March 31, 2014. The Company, which previously declared a $0.67 per share dividend for the quarter, recorded a GAAP net loss of $8.4 million, or $0.32 per basic and diluted share for the first quarter ended March 31, 2014. Core earnings for the period were $12.4 million, or $0.46 per basic and diluted share(1). Core earnings plus drop income for the first quarter was $15.2 million, or $0.56 per basic and diluted share(1),(2). This amount is inclusive of estimated “catch-up” premium amortization for the period of $1.4 million or ($0.05) per basic and diluted share(3). The Company also reported a net book value of $14.19 per share as of March 31, 2014(4), but estimated that its book value as of May 5, 2014 was between $14.92 and $15.02 per share(5).
FIRST QUARTER 2014
· Declared a $0.67 per share cash dividend for the quarter
· Includes carryover taxable income from 2013
· Recorded a GAAP net loss of $8.4 million, or $0.32 per basic and diluted share
· Net loss includes $31.1 million of net unrealized gains on MBS, $2.0 million of net realized gains on MBS, and $57.7 million of net loss on derivative instruments and linked transactions
· Generated core earnings plus drop income of $15.2 million, or $0.56 per basic and diluted share(1),(2)
· Core earnings of $0.46 per share, including estimated “catch-up” premium amortization of ($0.05) per share(3)
· Drop income of $0.10 per share(2)
· $14.19 per share net book value as of March 31, 2014(4)
· Total Stockholders’ Equity of $384.2 million as of March 31, 2014
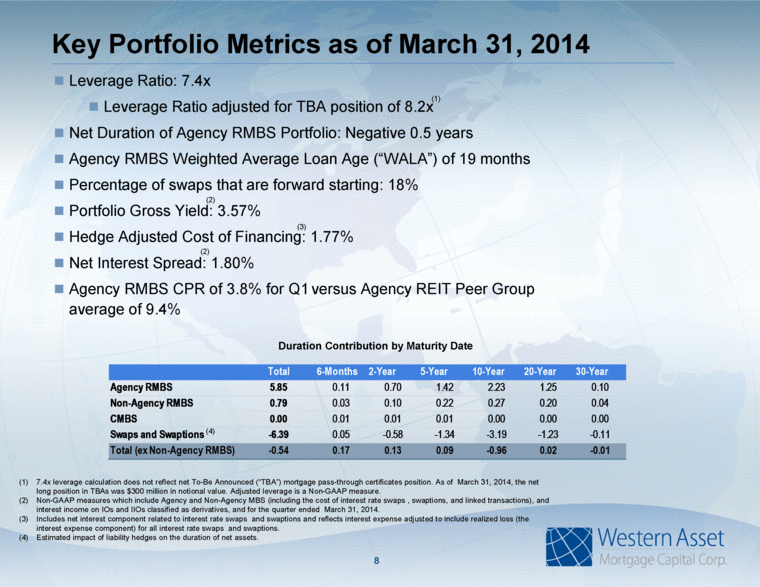
· 3.57% weighted average portfolio yield on Agency and Non-Agency MBS, including IO securities accounted for as derivatives and “linked transactions” under GAAP(1)
· 1.77% weighted average effective cost of financing on Agency and Non-Agency MBS, including swaps and linked transactions(1)
· 1.80% weighted average net interest spread on Agency and Non-Agency MBS, including IO securities accounted for as derivatives and swaps(1)
· $3.3 billion investment portfolio fair value as of March 31, 2014, including linked transactions
· Constant prepayment rate on its Agency RMBS portfolio of 3.8% for the quarter
· 7.4x leverage (including borrowings on linked transactions) as of March 31, 2014
· 8.2x leverage when adjusted for net TBA position (1), (6)
COMMON STOCK OFFERING AND PRIVATE PLACEMENT
On April 9, 2014, the Company closed an offering of 13,000,000 shares of its common stock sold to the public and a concurrent private placement of 650,000 shares of its common stock sold to its external manager Western Asset Management Company. The combined net proceeds from the public offering and the private placement were approximately $200.0 million, after deducting the underwriting discount and estimated offering expenses payable by the Company. The net proceeds of the offering were received and fully invested on April 9, 2014.
On May 2, 2014, underwriters from the April stock offering notified the Company that they had elected to exercise a portion of their overallotment option and purchase an additional 1,000,000 shares of common stock from the Company providing the Company with incremental proceeds of approximately $14.7 million. Such proceeds were received and fully invested yesterday, May 7, 2014.
The offering was overall accretive, on a book value basis, to existing shareholders and increased the market capitalization of the Company by approximately 50%. Given the capital raise and the percentage change in its capitalization, the Company believes that in this particular instance it is important and appropriate to provide additional information
(1) Non — GAAP measure.
(2) Drop income is income derived from the use of ‘to-be-announced’ forward contract (“TBA”) dollar roll transactions and is a component of our gain (loss) on derivative instruments on our statement of operations, and is not included in core earnings.
(3) Estimated “catch-up” premium amortization results primarily from the quarterly adjustments in projected constant prepayment rate (“CPR”) estimates for our MBS portfolio and the retrospective application of such adjustments to certain of our MBS securities, consisting almost entirely of our Agency RMBS whole pools.
(4) March 31, 2014 book value per share reflects the $0.67 per share dividend declared on March 20, 2014.
(5) Estimated book value per share as of May 5, 2014, is unaudited and does not reflect any potential adjustment associated with “catch-up” premium amortization. The estimated book value has not been reviewed or verified by any third party and may fluctuate based on current market conditions, the Company’s operations and other factors. The Company’s actual book value, as of the date of this release, may have changed since the estimate provided as of May 5, 2014.
(6) 7.4x leverage calculation does not reflect net To-Be Announced (“TBA”) mortgage pass-through certificates position. As of March 31, 2014, the net long position in TBAs was $300 million in notional value.
regarding its estimated current book value. As of May 5, 2014, the Company estimated that its book value was between $14.92 and $15.02 per share. This estimated book value is unaudited and has not been reviewed or verified by any third party. The estimated book value does not reflect the use of proceeds associated with the 1,000,000 shares sold as part of the overallotment allocation nor any potential adjustment associated with “catch-up” premium amortization. Book value will fluctuate with market conditions, the results of the Company’s operations and other factors, and the Company’s book value as of the date of this release may be different from the estimate provided as of May 5, 2014.
FIRST QUARTER 2014 RESULTS
For the first quarter ended March 31, 2014, the Company recorded a GAAP net loss of $8.4 million, or $0.32 per basic and diluted share. This compares to net income of $20.8 million, or $0.83 per basic and diluted share for the fourth quarter ended December 31, 2013. After adjusting for the additional shares issued as a result of the stock portion of the dividend declared on December 19, 2013 and paid on January 28, 2014, net income would have been $0.76 per basic and diluted share for the fourth quarter ended December 31, 2013. During the first quarter of 2014, the Company generated core earnings plus drop income of $15.2 million, or $0.56 per basic and diluted share. This amount is inclusive of $1.4 million of estimated “catch-up” premium amortization or ($0.05) per basic and diluted share. This compares to core earnings plus drop income of $18.6 million, or $0.76 per basic and diluted share for the fourth quarter ended December 31, 2013, inclusive of $0.3 million of estimated “catch-up” premium amortization or ($0.01) per basic and diluted share. After adjusting for the additional shares issued as a result of the stock portion of the dividend declared on December 19, 2013 and paid on January 28, 2014, core earnings plus drop income would have been $0.69 per basic and diluted share for the fourth quarter ended December 31, 2013. Core earnings represents a non-GAAP financial measure and is defined as net income (loss) excluding: (i) net realized gain (loss) on investments and derivative contracts; (ii) net unrealized gain (loss) on investments; (iii) loss resulting from mark-to-market adjustments on derivative contracts; (iv) other loss on MBS; (v) non-cash stock-based compensation expense; and (vi) certain other non-cash charges. Drop income represents a non-GAAP financial measure and is derived from the use of ‘to-be-announced’ forward contract (“TBA”) dollar roll transactions and is defined as the difference between the spot price and the forward settlement price for a comparable security on the trade date. Estimated “catch-up” premium amortization cost is due to quarterly adjustments in projected constant prepayment rate (“CPR”) estimates for certain securities in our MBS portfolio.
For the quarter ended March 31, 2014, average amortized cost of MBS held, including Agency and Non-Agency Interest-Only Strips accounted for as derivatives and linked transactions, was $3.09 billion, as compared to $3.47 billion for the quarter ended December 31, 2013.
For the quarter ended March 31, 2014, the Company’s weighted average yield on its portfolio was 3.57%, including Agency and Non-Agency MBS, interest from Interest-Only securities accounted for as derivatives and linked transactions that occurred during
the quarter. The Company’s effective cost of funds on its Agency and Non-Agency MBS financing (including the cost of interest rate swaps and linked transactions) was 1.77%. The annualized net interest spread on its portfolio was 1.80%, including Agency and Non-Agency MBS, interest from Interest-Only securities accounted for as derivatives and linked transactions, and taking into account the cost of the interest rate swaps. This compares with a weighted average yield of 3.61%, an effective cost of funds of 1.46%, and an annualized net interest spread of 2.15% for the quarter ended December 31, 2013.
The actual constant prepayment rate (“CPR”) for the Company’s Agency RMBS portfolio during the first quarter was 3.8% on an annualized basis, as compared to 5.0% for the fourth quarter of 2013.
COMMENTARY
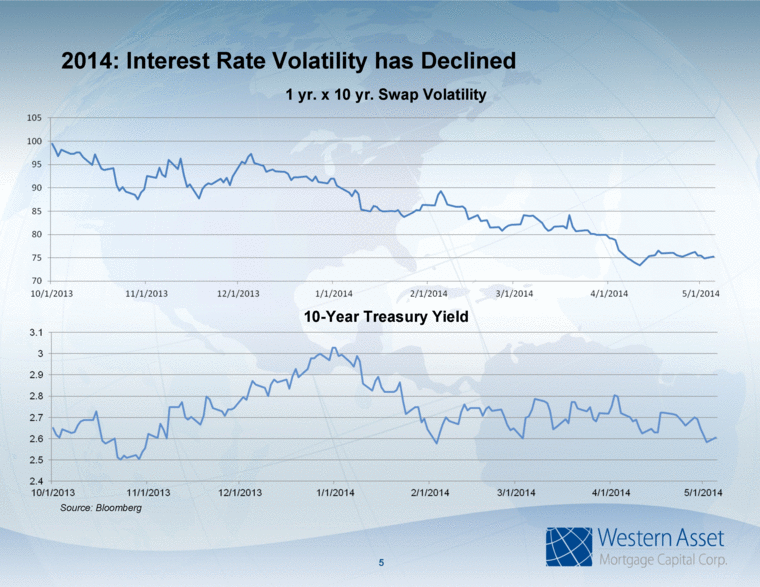
“During the first quarter of 2014, our efforts to increase our exposure to Non-Agency RMBS and CMBS and increase income derived from the use of TBA dollar roll transactions resulted in a smaller overall portfolio and a lower effective net interest spread as compared to the December 2013 quarter, thereby impacting our core earnings,” said Gavin James, Chief Executive Officer of Western Asset Mortgage Capital Corporation. “In addition, our book value per share during the first quarter was impacted by unrealized losses on our interest rate hedges as rates moved towards the low end of our expected range.”
“Shortly after the first quarter ended, we successfully completed our second follow-on stock offering, raising approximately $200.0 million, including approximately $10.0 million in a concurrent private placement from our external manager Western Asset Management Company and exclusive of the partial exercise of the overallotment allocation. The proceeds were invested immediately in a diversified selection of assets across the mortgage spectrum, which is a testament to Western Asset’s strong and resourceful fixed income investment platform. We also continue to have access to repo counterparties well in excess of our current needs, which significantly mitigates funding risk for WMC going forward. Further, we estimate that at May 5, 2014 our book value had increased to between $14.92 and $15.02,” said Mr. James.
Anup Agarwal, Chief Investment Officer of Western Asset Mortgage Capital Corporation, commented, “We are optimistic about the impact that diversifying our portfolio away from a pure Agency REIT and into more of a hybrid REIT model will have on our ability to generate attractive core earnings. We have increased our leverage to approximately eight times as we believe that there are currently opportunities to generate leveraged ROE at relatively attractive levels on new capital invested in a variety of Non-Agency assets, including residential and commercial real estate whole loans and asset-backed securities. With the increase in our portfolio size, our lower expense ratio and the diversification of our portfolio, we believe that we are well positioned to generate attractive core earnings, supplemented by drop income from our TBA positions, while reducing the overall volatility of our book value per share.”
DIVIDEND
On March 20, 2014, the Company declared a regular cash dividend of $0.67 per share for each common share. Since inception in May of 2012, WMC has declared and paid total dividends of $8.12 per share in a combination of cash and stock.
PORTFOLIO COMPOSITION
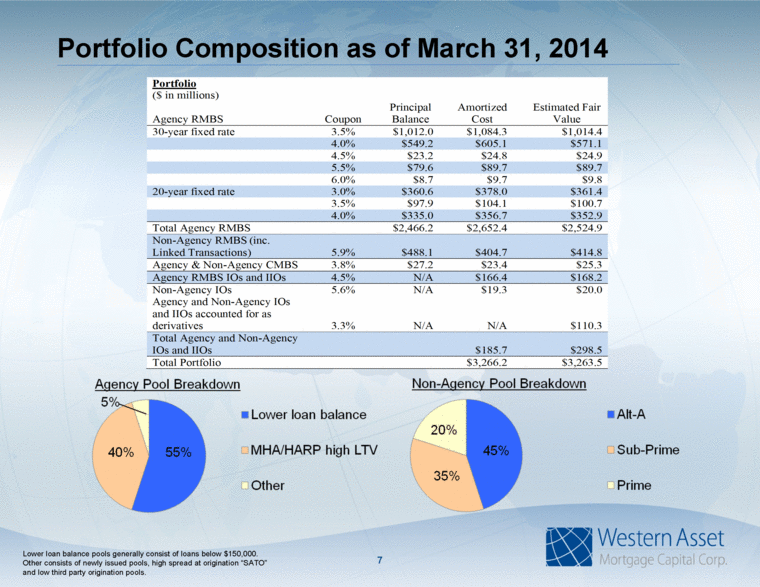
As of March 31, 2014, the Company owned an aggregate securities portfolio equaling $3.26 billion in market value, comprised of $1.71 billion of 30-year fixed-rate Agency RMBS (residential mortgage-backed securities for which the principal and interest payments are guaranteed by a U.S. Government agency or sponsored entity), $815.0 million of 20-year fixed-rate Agency RMBS, $434.8 million of Non-Agency RMBS (including $15.7 million of linked transactions and $20.0 million of interest-only and inverse interest-only strips), $25.3 million of Agency and Non-Agency CMBS (commercial mortgage-backed securities), $94.1 million of Agency RMBS interest-only and $74.1 million of Agency RMBS inverse interest-only strips, and $68.5 million of Agency and Non-Agency MBS interest-only and $41.8 million Agency and Non-Agency MBS inverse interest-only strips accounted for as derivatives.
The following table sets forth additional information regarding the Company’s portfolio as of March 31, 2014:
Portfolio
($ in millions)
|
Agency RMBS |
|
Coupon |
|
Principal |
|
Amortized |
|
Estimated Fair |
| |||
|
30-year fixed rate |
|
3.5 |
% |
$ |
1,012.0 |
|
$ |
1,084.3 |
|
$ |
1,014.4 |
|
|
|
|
4.0 |
% |
$ |
549.2 |
|
$ |
605.1 |
|
$ |
571.1 |
|
|
|
|
4.5 |
% |
$ |
23.2 |
|
$ |
24.8 |
|
$ |
24.9 |
|
|
|
|
5.5 |
% |
$ |
79.6 |
|
$ |
89.7 |
|
$ |
89.7 |
|
|
|
|
6.0 |
% |
$ |
8.7 |
|
$ |
9.7 |
|
$ |
9.8 |
|
|
20-year fixed rate |
|
3.0 |
% |
$ |
360.6 |
|
$ |
378.0 |
|
$ |
361.4 |
|
|
|
|
3.5 |
% |
$ |
97.9 |
|
$ |
104.1 |
|
$ |
100.7 |
|
|
|
|
4.0 |
% |
$ |
335.0 |
|
$ |
356.7 |
|
$ |
352.9 |
|
|
Total Agency RMBS |
|
|
|
$ |
2,466.2 |
|
$ |
2,652.4 |
|
$ |
2,524.9 |
|
|
Non-Agency RMBS (inc. Linked Transactions) |
|
5.9 |
% |
$ |
488.1 |
|
$ |
404.7 |
|
$ |
414.8 |
|
|
Agency & Non-Agency CMBS |
|
3.8 |
% |
$ |
27.2 |
|
$ |
23.4 |
|
$ |
25.3 |
|
|
Agency RMBS IOs and IIOs |
|
4.5 |
% |
N/A |
|
$ |
166.4 |
|
$ |
168.2 |
| |
|
Non-Agency IOs |
|
5.6 |
% |
N/A |
|
$ |
19.3 |
|
$ |
20.0 |
| |
|
Agency and Non-Agency IOs and IIOs accounted for as derivatives |
|
3.3 |
% |
N/A |
|
N/A |
|
$ |
110.3 |
| ||
|
Total Agency and Non-Agency IOs and IIOs |
|
|
|
|
|
$ |
185.7 |
|
$ |
298.5 |
| |
|
Total Portfolio |
|
|
|
|
|
$ |
3,266.2 |
|
$ |
3,263.5 |
| |
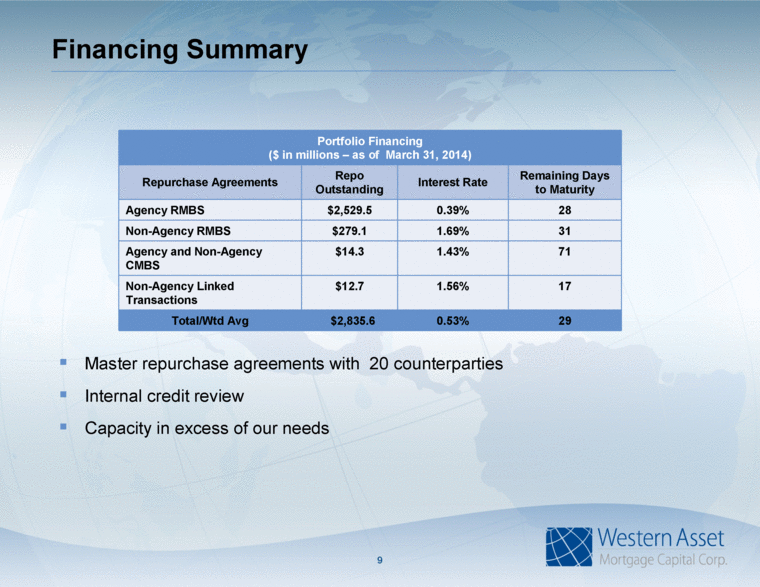
PORTFOLIO FINANCING
At March 31, 2014, the Company financed its portfolio with $2.8 billion of borrowings, including $12.7 million of borrowings related to linked transactions, under master repurchase agreements with sixteen (16) of our twenty (20) approved counterparties, bearing fixed interest rates with maturities between April 2014 and September 2014.
The Company has also entered into approximately $3.4 billion notional amount of pay-fixed interest rate swaps, excluding forward starting swaps of $653.8 million (approximately 22.8 months forward) that have variable maturities between October 2014 and February 2044, and $527.0 million notional amount of pay-variable interest rate swaps that have variable maturities between October 2018 and August 2043. In addition, the Company has entered into approximately $2.2 billion notional amount of pay-fixed interest rate swaptions with swap terms that range between 7 and 10 years and have exercise expiration dates that range from May 2014 to October 2014. As of March 31, 2014, the Company has also entered into approximately $100.0 million notional amount of pay-variable interest rate swaptions with a swap term of 10 years and an exercise expiration date of May 2014, which expired unexercised subsequent to the end of the quarter.
The following tables set forth additional information regarding the Company’s portfolio financing as of March 31, 2014:
Financing as of March 31, 2014
($ in millions)
|
Repurchase agreements |
|
Balance |
|
Weighted |
|
Weighted |
| |
|
Agency RMBS |
|
$ |
2,529.5 |
|
0.39 |
% |
28 |
|
|
Non-Agency RMBS |
|
$ |
279.1 |
|
1.69 |
% |
31 |
|
|
Agency and Non-Agency CMBS |
|
$ |
14.3 |
|
1.43 |
% |
71 |
|
|
Non-Agency Linked Transactions |
|
$ |
12.7 |
|
1.56 |
% |
17 |
|
|
Total |
|
$ |
2,835.6 |
|
0.53 |
% |
29 |
|
The following tables summarize the average pay rate and average maturity for the Company’s interest rate swaps as of March 31, 2014:
Fixed Pay Rate Swap Transactions
($ in millions)
|
Remaining Term to |
|
Notional |
|
Average |
|
Average |
| |
|
1 year or less |
|
$ |
215.9 |
|
0.4 |
% |
0.6 |
|
|
> 1 year to 3 years |
|
$ |
729.1 |
|
0.5 |
% |
1.9 |
|
|
> 3 years to 5 years |
|
$ |
1,104.8 |
|
1.5 |
% |
4.5 |
|
|
> 5 years |
|
$ |
2,023.1 |
|
2.7 |
% |
10.9 |
|
|
Total Fixed Pay Rate |
|
$ |
4,072.9 |
|
1.9 |
% |
7.0 |
|
Variable Pay Rate Swap Transactions
($ in millions)
|
Remaining Term to |
|
Notional |
|
Average |
|
Average |
| |
|
> 3 years to 5 years |
|
$ |
281.0 |
|
0.2 |
% |
4.9 |
|
|
> 5 years |
|
$ |
246.0 |
|
0.2 |
% |
12.5 |
|
|
Total |
|
$ |
527.0 |
|
0.2 |
% |
8.4 |
|
CONFERENCE CALL
The Company will host a conference call with a live webcast today at 12:00 p.m. Eastern Time/9:00 a.m. Pacific Time, to discuss financial results for the first quarter ended March 31, 2014.
Individuals interested in participating in the conference call may do so by dialing 888.317.6016 from the United States, or 412.317.6016 from outside the United States and referencing “Western Asset Mortgage Capital Corporation.” Those interested in listening to the conference call live via the Internet may do so by visiting the Investor Relations section of the Company’s website at www.westernassetmcc.com.
A telephone replay will be available through May 23, 2014 by dialing 877.344.7529 from the United States, or 412.317.0088 from outside the United States, and entering conference ID 10045783. A webcast replay will be available for 90 days.
ABOUT WESTERN ASSET MORTGAGE CAPITAL CORPORATION
Western Asset Mortgage Capital Corporation is a REIT that invests primarily in Agency RMBS, which are residential mortgage-backed securities for which the principal and interest payments are guaranteed by a U.S. Government agency (such as GNMA) or a
U.S. Government-sponsored entity (such as FNMA or FHLMC). The Company also invests in residential mortgage-backed securities that are not guaranteed by a U.S. Government agency or sponsored entity and commercial mortgage-backed securities. In the future, it may opportunistically invest in other asset-backed securities. The Company is externally managed and advised by Western Asset Management Company, an investment advisor registered with the SEC and a wholly-owned subsidiary of Legg Mason, Inc.
FORWARD-LOOKING STATEMENTS
This press release contains statements that constitute “forward-looking statements.” Operating results are subject to numerous conditions, many of which are beyond the control of the Company, including, without limitation, changes in interest rates; changes in the yield curve; changes in prepayment rates; the availability and terms of financing; general economic conditions; market conditions; conditions in the market for mortgage related investments; legislative and regulatory changes that could adversely affect the business of the Company; and other factors, including those set forth in the Risk Factors section of the Company’s annual report on Form 10-K for the period ended December 31, 2013 filed with the Securities and Exchange Commission (“SEC”). The Company undertakes no obligation to update these statements for revisions or changes after the date of this release, except as required by law.
USE OF NON-GAAP FINANCIAL INFORMATION
In addition to the results presented in accordance with GAAP, this release includes certain non-GAAP financial information, including core earnings, core earnings per share, drop income and drop income per share and certain financial metrics derived from non-GAAP information, such as weighted average yield, including IO securities; weighted average effective cost of financing, including swaps; weighted average net interest spread, including IO securities and swaps, which constitute non-GAAP financial measures within the meaning of Regulation G promulgated by the SEC. We believe that these measures presented in this release, when considered together with GAAP financial measures, provide information that is useful to investors in understanding our borrowing costs and net interest income, as viewed by us. An analysis of any non-GAAP financial measure should be made in conjunction with results presented in accordance with GAAP.
###
|
Investor Relations Contact: |
Media Contact: |
|
Larry Clark |
Tricia Ross |
|
Financial Profiles, Inc. |
Financial Profiles, Inc. |
|
(310) 622-8223 |
(310) 622-8226 |
|
lclark@finprofiles.com |
tross@finprofiles.com |
-Financial Tables to Follow-
Western Asset Mortgage Capital Corporation
Balance Sheets (Unaudited)
(in thousands—except share and per share data)
|
|
|
March 31, 2014 |
|
December 31, 2013 |
| ||
|
Assets: |
|
|
|
|
| ||
|
Cash and cash equivalents |
|
$ |
5,492 |
|
$ |
48,525 |
|
|
Mortgage-backed securities, at fair value ($3,100,433 and $2,818,947 pledged as collateral, at fair value, respectively) |
|
3,247,794 |
|
2,853,587 |
| ||
|
Linked transactions, net, at fair value |
|
2,973 |
|
18,559 |
| ||
|
Investment related receivable ($2,416 and $0 pledged as collateral, at fair value, respectively) |
|
2,556 |
|
341 |
| ||
|
Accrued interest receivable |
|
14,529 |
|
12,266 |
| ||
|
Due from counterparties |
|
57,821 |
|
55,434 |
| ||
|
Derivative assets, at fair value |
|
66,736 |
|
105,826 |
| ||
|
Other assets |
|
383 |
|
339 |
| ||
|
Total Assets |
|
$ |
3,398,284 |
|
$ |
3,094,877 |
|
|
|
|
|
|
|
| ||
|
Liabilities and Stockholders’ Equity: |
|
|
|
|
| ||
|
Liabilities: |
|
|
|
|
| ||
|
Borrowings under repurchase agreements |
|
$ |
2,822,961 |
|
$ |
2,579,067 |
|
|
Accrued interest payable |
|
10,298 |
|
12,534 |
| ||
|
Investment related payables |
|
104,526 |
|
— |
| ||
|
Due to counterparties |
|
34,013 |
|
65,861 |
| ||
|
Derivative liability, at fair value |
|
20,753 |
|
4,673 |
| ||
|
Accounts payable and accrued expenses |
|
1,270 |
|
1,353 |
| ||
|
Underwriting and offering costs payable |
|
153 |
|
8 |
| ||
|
Payable to related party |
|
2,006 |
|
1,842 |
| ||
|
Dividend payable |
|
18,136 |
|
19,445 |
| ||
|
Total Liabilities |
|
3,014,116 |
|
2,684,783 |
| ||
|
|
|
|
|
|
| ||
|
Commitments and contingencies |
|
|
|
|
| ||
|
|
|
|
|
|
| ||
|
Stockholders’ Equity: |
|
|
|
|
| ||
|
Common stock, $0.01 par value, 500,000,000 shares authorized, 27,068,467 and 26,853,287 shares issued and outstanding, respectively |
|
270 |
|
268 |
| ||
|
Preferred stock, $0.01 par value, 100,000,000 shares authorized and no shares outstanding |
|
— |
|
— |
| ||
|
Additional paid-in capital |
|
544,796 |
|
544,143 |
| ||
|
Retained earnings (accumulated deficit) |
|
(160,898 |
) |
(134,317 |
) | ||
|
Total Stockholders’ Equity |
|
384,168 |
|
410,094 |
| ||
|
Total Liabilities and Stockholders’ Equity |
|
$ |
3,398,284 |
|
$ |
3,094,877 |
|
Western Asset Mortgage Capital Corporation
Statement of Operations (Unaudited)
(in thousands—except share and per share data)
|
|
|
For the three |
|
For the three |
| ||
|
|
|
|
|
|
| ||
|
Net Interest Income: |
|
|
|
|
| ||
|
Interest income |
|
$ |
23,430 |
|
$ |
33,750 |
|
|
Interest expense |
|
3,390 |
|
5,181 |
| ||
|
Net Interest Income |
|
20,040 |
|
28,569 |
| ||
|
|
|
|
|
|
| ||
|
Other Income (Loss): |
|
|
|
|
| ||
|
Interest income on cash balances and other income (loss), net |
|
(12 |
) |
33 |
| ||
|
Realized gain (loss) on sale of Mortgage-backed securities and other securities, net |
|
3,716 |
|
(11,660 |
) | ||
|
Other loss on Mortgage-backed securities |
|
(1,709 |
) |
(2,268 |
) | ||
|
Unrealized gain (loss) on Mortgage-backed securities and other securities, net |
|
31,091 |
|
(54,759 |
) | ||
|
Gain on linked transactions, net |
|
2,219 |
|
596 |
| ||
|
Gain (loss) on derivative instruments, net |
|
(59,906 |
) |
14,840 |
| ||
|
Other Income (Loss), net |
|
(24,601 |
) |
(53,218 |
) | ||
|
|
|
|
|
|
| ||
|
Operating Expenses: |
|
|
|
|
| ||
|
General and administrative (includes $588 and $286 non-cash stock based compensation, respectively) |
|
2,075 |
|
1,737 |
| ||
|
Management fee — related party |
|
1,805 |
|
2,113 |
| ||
|
Total Operating Expenses |
|
3,880 |
|
3,850 |
| ||
|
|
|
|
|
|
| ||
|
Net loss available to Common Stock and participating securities |
|
$ |
(8,441 |
) |
$ |
(28,499 |
) |
|
|
|
|
|
|
| ||
|
Net loss per Common Share — Basic |
|
$ |
(0.32 |
) |
$ |
(1.18 |
) |
|
Net loss per Common Share — Diluted |
|
$ |
(0.32 |
) |
$ |
(1.18 |
) |
|
Dividends Declared per Share of Common Stock |
|
$ |
0.67 |
|
$ |
— |
|
Western Asset Mortgage Capital Corporation
Reconciliation of GAAP Net Income to Non-GAAP Core Earnings
(Unaudited)
(in thousands—except share and per share data)
The table below summarizes the reconciliation from Net Loss to Core Earnings for the three months ended March 31, 2014 and 2013:
|
(in thousands) |
|
For the three months |
|
For the three |
| ||
|
|
|
|
|
|
| ||
|
Net Loss — GAAP |
|
$ |
(8,441 |
) |
$ |
(28,499 |
) |
|
Adjustments: |
|
|
|
|
| ||
|
|
|
|
|
|
| ||
|
MBS and other securities: |
|
|
|
|
| ||
|
|
|
|
|
|
| ||
|
Unrealized (gain) loss on MBS |
|
(31,091 |
) |
54,759 |
| ||
|
Other loss on mortgage-backed securities |
|
1,709 |
|
2,268 |
| ||
|
Realized (gain) loss on sale of MBS |
|
(3,716 |
) |
11,660 |
| ||
|
|
|
|
|
|
| ||
|
Derivative Instruments: |
|
|
|
|
| ||
|
|
|
|
|
|
| ||
|
Realized gain on termination of interest rate swaps |
|
(2 |
) |
(18,258 |
) | ||
|
Realized gain on settlement of TBAs |
|
(2,370 |
) |
(601 |
) | ||
|
Realized gain on sale/unlinking of securities underlying linked transactions |
|
(1,290 |
) |
— |
| ||
|
Realized loss on Agency Interest-Only Strips — accounted for as derivatives |
|
869 |
|
99 |
| ||
|
Mark-to-market adjustments on interest rate swaps |
|
45,496 |
|
(1,858 |
) | ||
|
Mark-to-market adjustments on interest rate swaptions |
|
9,324 |
|
1,506 |
| ||
|
Mark-to-market adjustments on options |
|
— |
|
324 |
| ||
|
Mark-to-market adjustments on futures contracts |
|
(118 |
) |
— |
| ||
|
Mark-to-market adjustments on TBAs |
|
468 |
|
(1,224 |
) | ||
|
Mark-to-market adjustments on linked transactions |
|
(226 |
) |
(250 |
) | ||
|
Mark-to-market adjustments on derivative instruments |
|
1,220 |
|
2,348 |
| ||
|
|
|
|
|
|
| ||
|
Non-cash stock-based compensation expense |
|
588 |
|
286 |
| ||
|
Total adjustments |
|
20,861 |
|
51,059 |
| ||
|
Core Earnings — Non-GAAP Financial Measure |
|
$ |
12,420 |
|
$ |
22,560 |
|
|
|
|
|
|
|
| ||
|
Basic Core Earnings per Share of Common Stock and Participating Securities - Non-GAAP Financial Measure |
|
$ |
0.46 |
|
$ |
0.93 |
|
|
Diluted Core Earnings per Share of Common Stock and Participating Securities - Non-GAAP Financial Measure |
|
$ |
0.46 |
|
$ |
0.93 |
|
|
|
|
|
|
|
| ||
|
Basic weighted average common shares and participating securities |
|
26,907,391 |
|
24,206,170 |
| ||
|
Diluted weighted average common shares and participating securities |
|
26,907,391 |
|
24,338,990 |
| ||
Reconciliation of Interest Income
(Unaudited, in thousands)
The following table reconciles total interest income to interest income including interest income on Agency and Non-Agency Interest-Only Strips classified as derivatives and interest income on linked transactions (non-GAAP financial measure) for the three months ended March 31, 2014 and 2013:
|
(in thousands) |
|
For the three months |
|
For the three months |
| ||
|
Coupon Interest |
|
$ |
34,578 |
|
$ |
51,001 |
|
|
Premium accretion, discount amortization and amortization of basis, net |
|
(11,148 |
) |
(17,251 |
) | ||
|
Interest Income |
|
$ |
23,430 |
|
$ |
33,750 |
|
|
|
|
|
|
|
| ||
|
Contractual Interest income, net of amortization basis on Agency and Non-Agency Interest-Only and Interest Strips, classified as derivatives(1): |
|
|
|
|
| ||
|
Coupon Interest |
|
$ |
8,426 |
|
$ |
5,943 |
|
|
Amortization of basis (Non-GAAP Financial Measure) |
|
(5,592 |
) |
(4,184 |
) | ||
|
Contractual Interest income, net of discount amortization on Linked Transactions (2): |
|
|
|
|
| ||
|
Coupon Interest |
|
3,100 |
|
106 |
| ||
|
Discount amortization |
|
(2,172 |
) |
329 |
| ||
|
Subtotal |
|
3,762 |
|
2,194 |
| ||
|
Total interest income, including interest income on Agency and Non-Agency Interest-Only Strips, classified as derivatives - Non-GAAP Financial Measure |
|
$ |
27,192 |
|
$ |
35,944 |
|
(1) Reported in gain (loss) on derivative instruments in the Statement of Operations.
(2) Reported in gain (loss) on linked transactions in the Statement of Operations.
The following table reconciles the Effective Cost of Funds (non-GAAP financial measure) with interest expense for the three months ended March 31, 2014 and 2013:
|
|
|
For the three months ended March 31, |
|
For the three months ended March 31, |
| ||||||
|
(dollars in thousands) |
|
Reconciliation |
|
Cost of |
|
Reconciliation |
|
Cost of |
| ||
|
|
|
|
|
|
|
|
|
|
| ||
|
Interest expense |
|
$ |
3,390 |
|
0.53 |
% |
$ |
5,181 |
|
0.46 |
% |
|
Interest expense on linked transactions |
|
225 |
|
1.73 |
% |
90 |
|
1.85 |
% | ||
|
Net interest paid - interest rate swaps |
|
7 852 |
|
1.21 |
% |
4,582 |
|
0.41 |
% | ||
|
Effective Borrowing Costs |
|
$ |
11,467 |
|
1.77 |
% |
$ |
9,853 |
|
0.87 |
% |
|
Weighted average repurchase borrowings (1) |
|
2,628,790 |
|
|
|
4,606,037 |
|
|
| ||
(1) Includes average repurchase borrowings under linked transactions.