Two Harbors Investment Corp. Reports Third Quarter 2012 Financial Results
Delivered Total Return of 18.7%1
NEW YORK, November 6, 2012 - Two Harbors Investment Corp. (NYSE: TWO; NYSE MKT: TWO.WS), a real estate investment trust that invests in residential mortgage-backed securities (RMBS), residential mortgage loans, residential real properties and other financial assets, today announced its financial results for the quarter ended September 30, 2012.
Highlights
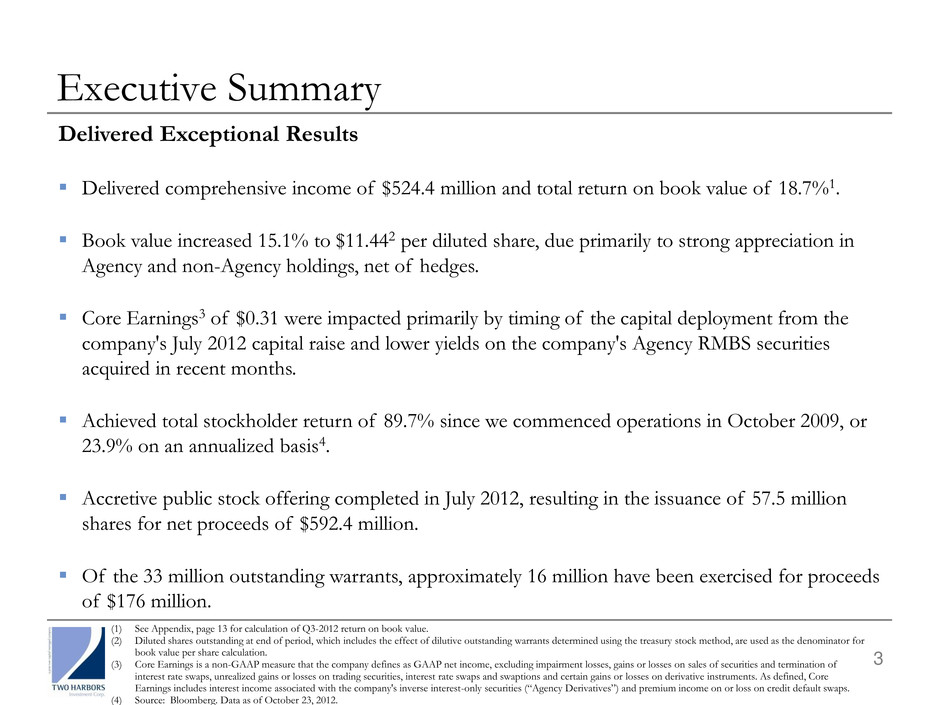
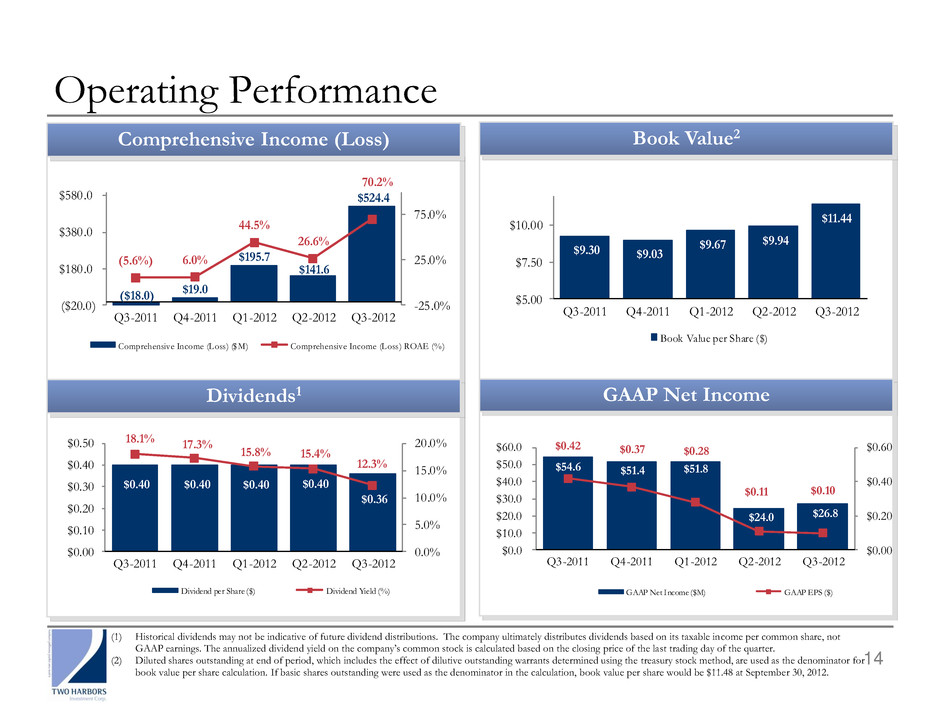
• | The company reported Comprehensive Income of $524.4 million, or $1.94 per diluted weighted average common share. |
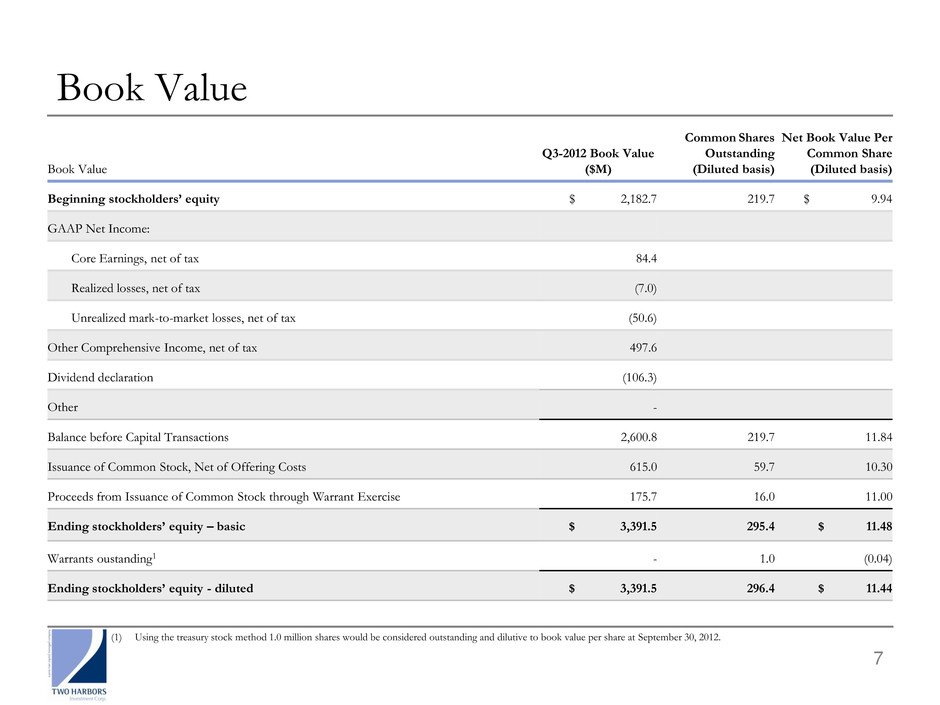
• | Book value increased 15.1% to $11.44 per diluted common share at September 30, 2012, due primarily to strong appreciation in the company's Agency and non-Agency RMBS holdings, net of hedges. |
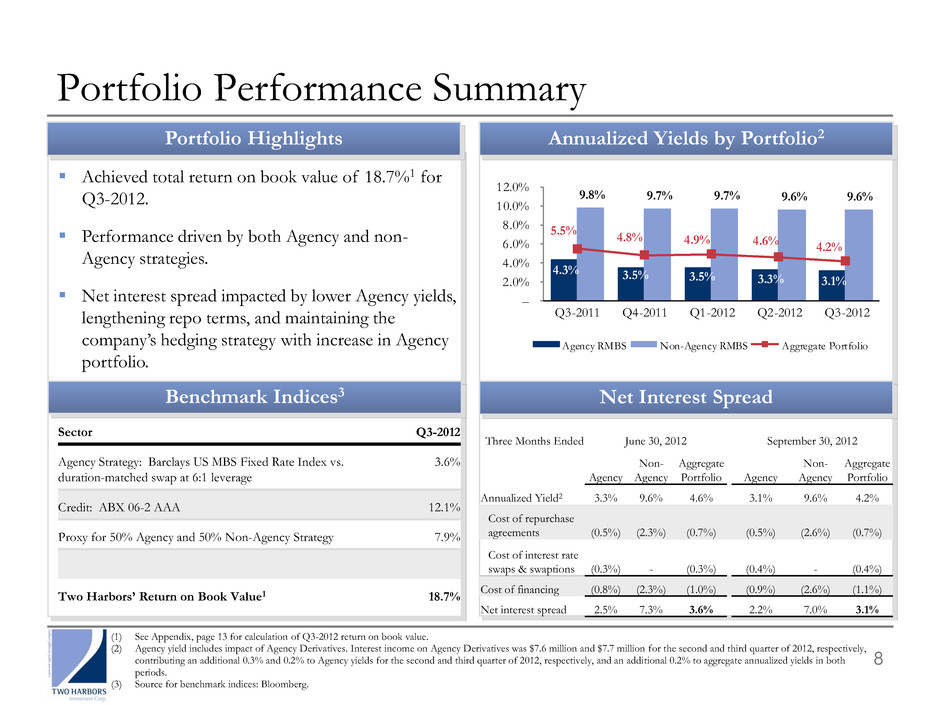
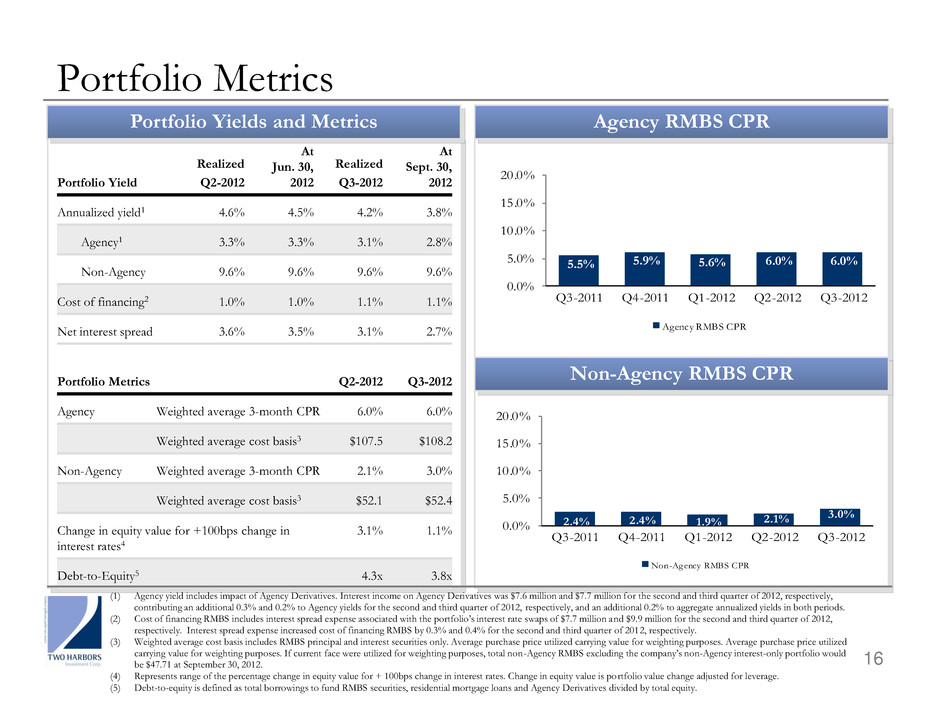
• | The Agency RMBS portfolio, inclusive of IIOs, experienced a low and stable three-month average Constant Prepayment Rate (CPR) of 6%, which contributed to the RMBS portfolio's aggregate yield of 4.2%. |
• | The company reported Core Earnings of $84.4 million, or $0.31 per diluted weighted average common share. Third quarter Core Earnings were impacted by timing of the capital deployment from the company's July 2012 capital raise and lower yields on the company's Agency RMBS securities acquired in recent months. |
• | The company declared a dividend of $0.36 per common share, or 12.3% annualized dividend yield, based upon the September 28, 2012 closing price of $11.75. |
• | The company completed an accretive public stock offering in July 2012, which resulted in the issuance of 57.5 million shares of common stock for net proceeds of approximately $592.4 million. The company completed deployment of the proceeds from this offering primarily by making additional acquisitions of RMBS securities and residential real properties. |
"We had a remarkable quarter," said Thomas Siering, Two Harbors' President and Chief Executive Officer. "Our RMBS portfolio delivered its most outstanding performance since the company's formation, achieving an annualized return on average equity of 70.2% on a Comprehensive Income basis. We believe this performance demonstrates not only the advantages of our hybrid investment strategy, but also highlights the strength of our security selection process and speaks to the high caliber of our investment team."
(1) The term “total return” means (i) the change in Two Harbors' book value per share at September 30, 2012 as compared to June 30, 2012, plus (ii)
dividends declared by Two Harbors in the third quarter of 2012, divided by Two Harbors' book value per share at June 30, 2012.
- 1 -
Operating Performance
The following table summarizes the company's GAAP and non-GAAP earnings measurements and key metrics for the third quarter of 2012:
Two Harbors Operating Performance | ||||||||||||||||
(dollars in thousands, except per share data) | Q3-2012 | YTD 2012 | ||||||||||||||
Earnings | Earnings | Per diluted weighted share | Annualized return on average equity | Earnings | Per diluted weighted share | Annualized return on average equity | ||||||||||
Core Earnings1 | $ | 84,377 | $ | 0.31 | 11.3 | % | $ | 224,213 | $ | 1.00 | 13.0 | % | ||||
GAAP Net Income | $ | 26,802 | $ | 0.10 | 3.6 | % | $ | 102,606 | $ | 0.46 | 6.0 | % | ||||
Comprehensive Income | $ | 524,400 | $ | 1.94 | 70.2 | % | $ | 861,718 | $ | 3.84 | 50.1 | % | ||||
Operating Metrics | Q3-2012 | |||||||||||||||
Dividend per common share | $ | 0.36 | ||||||||||||||
Book value per diluted share at period end | $ | 11.44 | ||||||||||||||
Other operating expenses as a percentage of average equity | 0.9 | % | ||||||||||||||
(1) Core Earnings is a non-GAAP measure that the company defines as GAAP net income, excluding impairment losses, gains or losses on sales of securities and termination of interest rate swaps, unrealized gains or losses on trading securities, interest rate swaps and swaptions and certain gains or losses on derivative instruments. As defined, Core Earnings includes interest income associated with the company's inverse interest-only securities ("Agency Derivatives") and premium income or loss on credit default swaps. | ||||||||||||||||
Earnings Summary
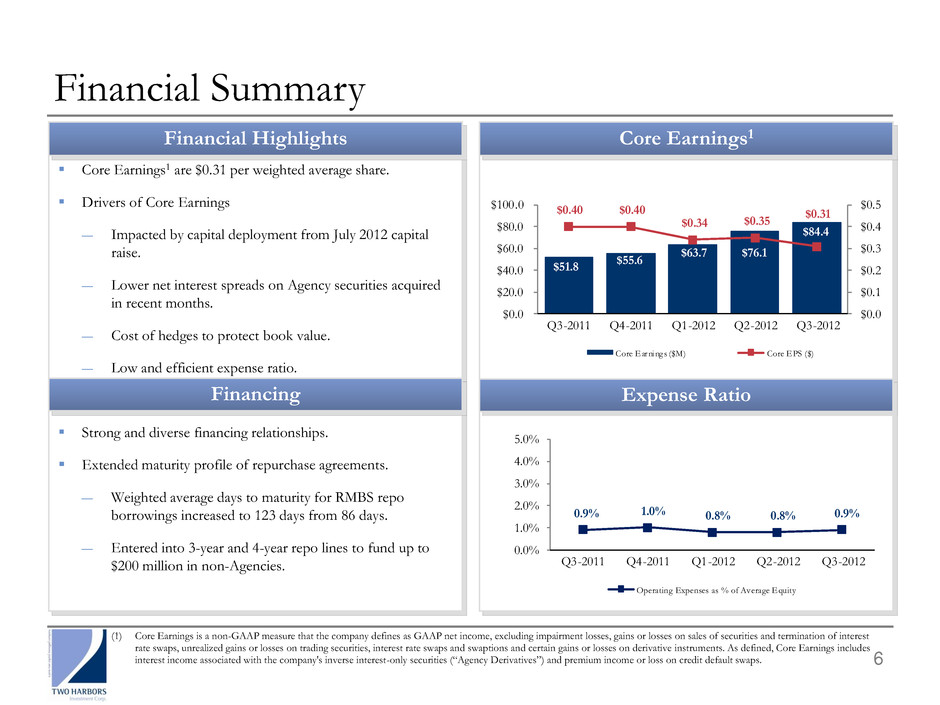
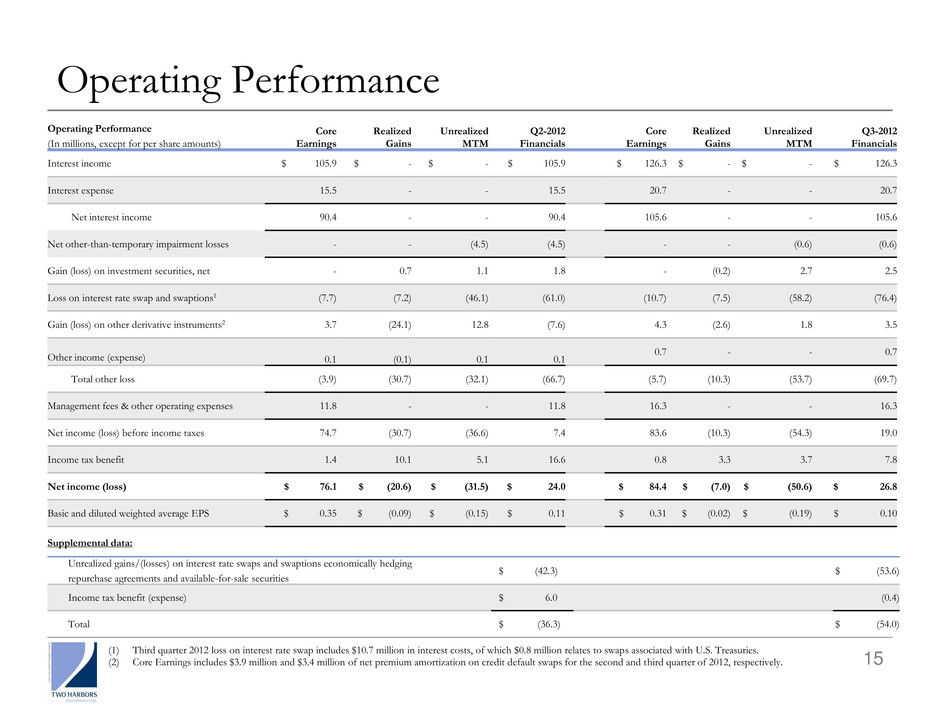
Two Harbors reported Core Earnings for the quarter ended September 30, 2012 of $84.4 million, or $0.31 per diluted weighted average common share outstanding, as compared to Core Earnings for the quarter ended June 30, 2012 of $76.1 million, or $0.35 per diluted weighted average common share outstanding. Core Earnings were impacted by costs associated with timing of capital deployment from the company's July 2012 capital raise and lower yields on the company's Agency RMBS securities acquired in recent months.
During the quarter, the company sold residential mortgage-backed securities for $9.4 million with an amortized
cost of $9.6 million, for a net realized loss of $0.2 million, net of tax; recognized a change in unrealized fair
value gains on U.S. Treasury trading securities of $1.8 million, net of tax; and recognized other-than-temporary
credit impairment losses on its RMBS securities of $0.6 million, net of tax. During the quarter, the company had a net loss of $5.0 million, net of tax, related to swap terminations and swaption expirations. In addition, the company recognized in earnings an unrealized loss, net of tax, of $54.0 million associated with its interest rate swaps and swaptions economically hedging its repurchase agreements and available-for-sale securities; an unrealized loss, net of tax, of $3.0 million associated with its interest rate swaps economically hedging its trading securities; and net gains on other derivative instruments of approximately $3.2 million, net of tax.
The company reported GAAP Net Income of $26.8 million, or $0.10 per diluted weighted average common share outstanding, for the quarter ended September 30, 2012, as compared to $24.0 million, or $0.11 per diluted weighted average common share outstanding, for the quarter ended June 30, 2012. On a GAAP basis, the company earned
an annualized return on average equity of 3.6% and 4.5% for the quarters ended September 30, 2012 and June 30, 2012, respectively.
The company reported Comprehensive Income of $524.4 million, or $1.94 per diluted weighted average common share outstanding, for the quarter ended September 30, 2012, as compared to $141.6 million, or $0.66 per diluted weighted average common share outstanding, for the quarter ended June 30, 2012. The company records unrealized
- 2 -
fair value gains and losses for RMBS securities, classified as available-for-sale, as Other Comprehensive Income in the Statement of Stockholders' Equity. The third quarter 2012 was positively impacted by an aggregate unrealized increase in fair value of $497.6 million on the company's portfolio, driven by appreciation in the company's Agency and non-Agency RMBS holdings. On a Comprehensive Income basis, the company recognized an annualized return on average equity of 70.2% and 26.6% for the quarters ended September 30, 2012 and June 30, 2012, respectively.
Other Key Metrics
Two Harbors declared a quarterly dividend of $0.36 per common share for the quarter ended September 30, 2012. The annualized dividend yield on the company's common stock for the third quarter, based on the September 28, 2012 closing price of $11.75, was 12.3%.
The company's book value per diluted share, after giving effect to the third quarter 2012 dividend of $0.36, was $11.44 as of September 30, 2012, compared to $9.94 as of June 30, 2012.
Other operating expenses for the third quarter 2012 were approximately $6.5 million, or 0.9% of average equity,
compared to approximately $4.2 million, or 0.8%, for the second quarter 2012. Third quarter operating expenses were impacted by an increase in real estate related expenses associated with the company's portfolio of single-family residential properties.
Portfolio Summary
For the quarter ended September 30, 2012, the annualized yield on average RMBS securities and Agency Derivatives was 4.2% and the annualized cost of funds on the average borrowings, which includes net interest rate spread expense on interest rate swaps, was 1.1%. This resulted in a net interest rate spread of 3.1%, which compares to 3.6% in the prior quarter. Net interest spread for the third quarter was impacted primarily by lower yields on the company's Agency RMBS securities acquired in recent months. Third quarter net interest spread was also affected to a lesser extent by significantly extending the company's repurchase agreements and the incremental expense associated with maintaining the company's interest rate hedging strategy as the company aligned its notional hedging positions with the capital deployed from its July 2012 common stock offering.
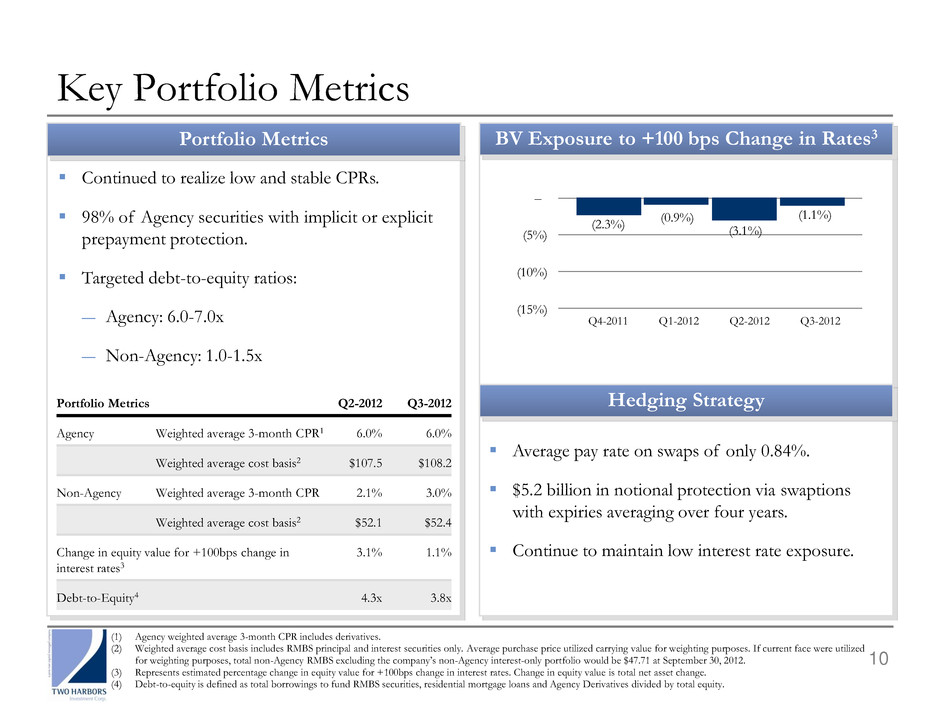
The company reported debt-to-equity, defined as total borrowings to fund RMBS securities, residential mortgage loans and Agency Derivatives divided by total equity, of 3.8:1.0 and 4.3:1.0 at September 30, 2012 and June 30, 2012, respectively. The third quarter debt-to-equity ratio was impacted by proceeds received from the issuance of common stock in connection with warrants exercised in September.
The company's portfolio is principally comprised of RMBS available-for-sale securities and Agency Derivatives. As of September 30, 2012, the total value of the portfolio was $15.3 billion, of which approximately $12.8 billion was Agency RMBS and Agency Derivatives and $2.5 billion was non-Agency RMBS. As of September 30, 2012, fixed-rate securities composed 82.1% of the company's portfolio and adjustable-rate securities composed 17.9% of the company's portfolio. In addition, the company held $1.0 billion of U.S. Treasuries classified on its balance sheet as trading securities and $190.9 million of Investments in Real Estate as of September 30, 2012.
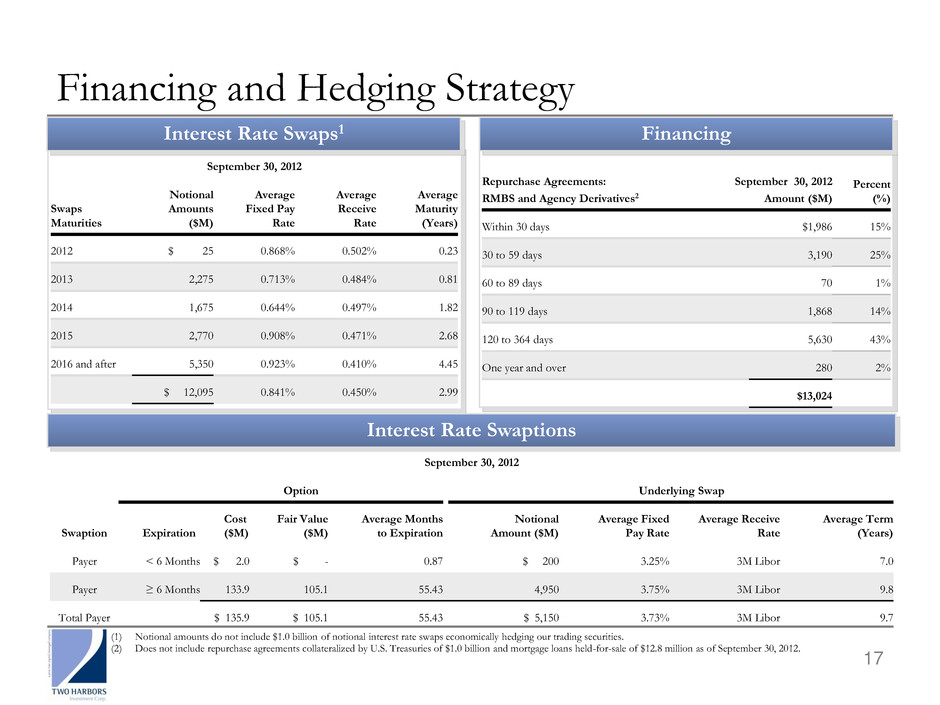
Two Harbors was a party to interest rate swaps and swaptions as of September 30, 2012 with an aggregate notional
amount of $18.2 billion, of which $17.2 billion was utilized to economically hedge interest rate risk associated with the company's short-term LIBOR-based repurchase agreements. During the third quarter, the company maintained its interest rate hedging strategy and aligned its notional hedging positions with the capital deployed from its July 2012 common stock offering.
- 3 -
The following table summarizes the company's investment portfolio:
Two Harbors Portfolio | ||||||
(dollars in thousands, except per share data) | ||||||
RMBS and Agency Derivatives Portfolio Composition | As of September 30, 2012 | |||||
Agency Bonds | ||||||
Fixed Rate Bonds | $ | 12,268,507 | 80.2 | % | ||
Hybrid ARMs | 200,556 | 1.3 | % | |||
Total Agency | 12,469,063 | 81.5 | % | |||
Agency Derivatives | 328,635 | 2.2 | % | |||
Non-Agency Bonds | ||||||
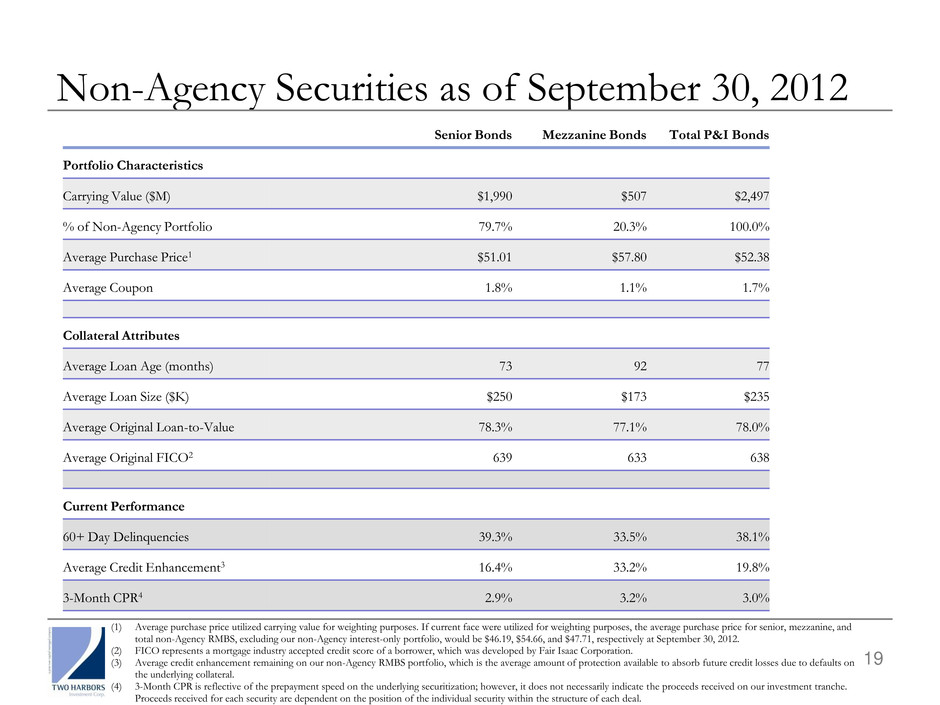
Senior Bonds | 1,989,885 | 13.0 | % | |||
Mezzanine Bonds | 506,620 | 3.3 | % | |||
Non-Agency Other | 4,291 | — | % | |||
Total Non-Agency | 2,500,796 | 16.3 | % | |||
Aggregate Portfolio | $ | 15,298,494 | ||||
Fixed-rate investment securities as a percentage of aggregate portfolio | 82.1 | % | ||||
Adjustable-rate investment securities as a percentage of aggregate portfolio | 17.9 | % | ||||
Portfolio Metrics | For the Quarter Ended September 30, 2012 | |||||
Annualized yield on average RMBS and Agency Derivatives during the quarter | ||||||
Agency | 3.1 | % | ||||
Non-Agency | 9.6 | % | ||||
Aggregate Portfolio | 4.2 | % | ||||
Annualized cost of funds on average repurchase balance during the quarter1 | 1.1 | % | ||||
Annualized interest rate spread for aggregate portfolio during the quarter | 3.1 | % | ||||
Weighted average cost basis of principal and interest securities | ||||||
Agency | $ | 108.15 | ||||
Non-Agency2 | $ | 52.38 | ||||
Weighted average three month CPR for its RMBS and Agency Derivative portfolio | ||||||
Agency | 6.0 | % | ||||
Non-Agency | 3.0 | % | ||||
Debt-to-equity ratio at period-end3 | 3.8 to 1.0 | |||||
(1) Cost of funds includes interest spread expense associated with the portfolio's interest rate swaps. | ||||||
(2) Average purchase price utilized carrying value for weighting purposes. If current face were utilized for weighting purposes, total non-Agency RMBS excluding the company's non-Agency interest-only portfolio would be $47.71 at September 30, 3012. | ||||||
(3) Defined as total borrowings to fund RMBS, residential mortgage loans and Agency Derivatives divided by total equity. | ||||||
"We are extremely proud of our portfolio's performance this quarter," stated Bill Roth, Two Harbors' Co-Chief Investment Officer. "Both our Agency and non-Agency strategies contributed significantly to our return."
"Managing prepayment risk has become increasingly important given today's low rate environment and the government initiated refinancing programs available to homeowners,” continued Roth. "In light of this, we are pleased that our Agency portfolio continues to experience low and stable prepayment speeds."
The company experienced a three-month average CPR of 6.0% for Agency RMBS securities and Agency Derivatives held as of September 30, 2012, comparable to the prior quarter. The weighted average cost basis of the Agency portfolio was 108.2% of par as of September 30, 2012 and 107.5% of par as of June 30, 2012. The net
- 4 -
premium amortization was $39.7 million and $31.0 million for the quarters ended September 30, 2012 and June 30, 2012, respectively.
The company experienced a three-month average CPR of 3.0% for non-Agency RMBS securities held as of September 30, 2012, as compared to 2.1% for securities held as of June 30, 2012. The weighted average cost basis of the non-Agency portfolio was 52.4% of par as of September 30, 2012 and 52.1% of par as of June 30, 2012. The discount accretion was $36.2 million and $34.1 million for the quarters ended September 30, 2012 and June 30, 2012, respectively. The total net discount remaining was $2.3 billion as of September 30, 2012 and June 30, 2012, with $1.3 billion designated as credit reserve as of September 30, 2012.
Business Diversification
Single-Family Residential Properties
On September 11, 2012, the company announced the proposed contribution of its portfolio of single-family residential properties to Silver Bay Realty Trust Corp. (“Silver Bay”), a newly formed entity intended to qualify as a REIT. In exchange for its contribution, Two Harbors would receive shares of common stock of Silver Bay. As of September 30, 2012, Two Harbors had purchased property with a carrying value of $190.9 million in single-family residential properties. The properties are classified as investment in real estate on the consolidated balance sheet.
Securitization
In late 2011, the company began acquiring prime nonconforming residential mortgage loans from select mortgage loan originators and secondary market institutions. As of September 30, 2012 the company had acquired mortgage loans held-for-sale with a carrying value of $14.6 million and had outstanding purchase commitments to acquire an additional $319.9 million. It is the company's intention in the future to securitize these loans and/or exit through a whole loan sale.
Public Stock Offerings
The company completed an accretive public stock offering in July 2012, which resulted in the issuance of 57.5 million shares of common stock for net proceeds of approximately $592.4 million. The company completed deployment of the proceeds from this offering primarily by making additional acquisitions of RMBS securities and residential real properties.
Warrants
During the third quarter 2012, warrant holders exercised warrants to purchase 15,975,017 shares of the company's common stock at an exercise price of $11.00 per share. This resulted in proceeds to the company totaling approximately $175.7 million. As of September 30, 2012, 17,073,983 warrants remain outstanding.
Conference Call
Two Harbors Investment Corp. will host a conference call on November 7, 2012 at 9:00 am EST to discuss third quarter 2012 financial results and related information. To participate in the teleconference, please call toll-free (877) 868-1835 (or (914) 495-8581 for international callers) approximately 10 minutes prior to the above start time. You may also listen to the teleconference live via the Internet on the company's website at www.twoharborsinvestment.com in the Investor Relations section under the Events and Presentations link. For those unable to attend, a telephone playback will be available beginning at 12 p.m. EST on November 7, 2012 through 9 p.m. EST on November 25, 2012. The playback can be accessed by calling (855) 859-2056 (or (404) 537-3406 for international callers) and providing Confirmation Code 50062843. The call will also be archived on the company's website in the Investor Relations section under the Events and Presentations link.
- 5 -
Two Harbors Investment Corp.
Two Harbors Investment Corp., a Maryland corporation, is a real estate investment trust that invests in residential mortgage-backed securities, residential mortgage loans, residential real properties and other financial assets. Two Harbors is headquartered in Minnetonka, Minnesota, and is externally managed and advised by PRCM Advisers LLC, a wholly-owned subsidiary of Pine River Capital Management L.P. Additional information is available at www.twoharborsinvestment.com.
Forward-Looking Statements
This press release includes “forward-looking statements” within the meaning of the safe harbor provisions of the United States Private Securities Litigation Reform Act of 1995. Actual results may differ from expectations, estimates and projections and, consequently, readers should not rely on these forward-looking statements as predictions of future events. Words such as “expect,” “target,” “assume,” “estimate,” “project,” “budget,” “forecast,” “anticipate,” “intend,” “plan,” “may,” “will,” “could,” “should,” “believe,” “predicts,” “potential,” “continue,” and similar expressions are intended to identify such forward-looking statements. These forward-looking statements involve significant risks and uncertainties that could cause actual results to differ materially from expected results. Factors that could cause actual results to differ include, but are not limited to, higher than expected operating costs, changes in prepayment speeds of mortgages underlying our RMBS, the rates of default or decreased recovery on the mortgages underlying our non-Agency securities, failure to recover certain losses that are expected to be temporary, changes in interest rates or the availability of financing, the impact of new legislation or regulatory changes on our operations, the impact of any deficiencies in the servicing or foreclosure practices of third parties and related delays in the foreclosure process, the inability to acquire mortgage loans or securitize the mortgage loans we acquire, the inability to acquire residential real properties at attractive prices or lease such properties on a profitable basis, the impact of new or modified government mortgage refinance or principal reduction programs, and unanticipated changes in overall market and economic conditions.
Readers are cautioned not to place undue reliance upon any forward-looking statements, which speak only as of the date made. Two Harbors does not undertake or accept any obligation to release publicly any updates or revisions to any forward-looking statement to reflect any change in its expectations or any change in events, conditions or circumstances on which any such statement is based. Additional information concerning these and other risk factors is contained in Two Harbors' most recent filings with the Securities and Exchange Commission. All subsequent written and oral forward looking statements concerning Two Harbors or matters attributable to Two Harbors or any person acting on its behalf are expressly qualified in their entirety by the cautionary statements above.
Non-GAAP Financial Measures
In addition to disclosing financial results calculated in accordance with United States generally accepted accounting principles (GAAP), this press release and the accompanying investor presentation present non-GAAP financial measures that exclude certain items. Two Harbors' management believes that these non-GAAP measures enable it to perform meaningful comparisons of past, present and future results of the company's core business operations, and uses these measures to gain a comparative understanding of the company's operating performance and business trends. The non-GAAP financial measures presented by the company represent supplemental information to assist investors in analyzing the results of Two Harbors' operations; however, as these measures are not in accordance with GAAP, they should not be considered a substitute for, or superior to, the financial measures calculated in accordance with GAAP. Our GAAP financial results and the reconciliations from these results should be carefully evaluated. See the GAAP to Non-GAAP reconciliation table on page 10 of this release.
- 6 -
Additional Information
Stockholders and warrant holders of Two Harbors, and other interested persons, may find additional information regarding the company at the SEC's Internet site at www.sec.gov or by directing requests to: Two Harbors Investment Corp., Attn: Investor Relations, 601 Carlson Parkway, Suite 150, Minnetonka, MN 55305, telephone 612-629-2500.
Contact
July Hugen, Investor Relations, Two Harbors Investment Corp., 612-629-2514, july.hugen@twoharborsinvestment.com.
# # #
- 7 -
TWO HARBORS INVESTMENT CORP. | ||||||
CONDENSED CONSOLIDATED BALANCE SHEETS | ||||||
(dollars in thousands, except per share data) | ||||||
September 30, 2012 | December 31, 2011 | |||||
(unaudited) | ||||||
ASSETS | ||||||
Available-for-sale securities, at fair value | $ | 14,969,859 | $ | 6,249,252 | ||
Trading securities, at fair value | 1,002,461 | 1,003,301 | ||||
Mortgage loans held-for-sale, at fair value | 14,553 | 5,782 | ||||
Investment in real estate, net | 190,907 | — | ||||
Cash and cash equivalents | 833,608 | 360,016 | ||||
Restricted cash | 206,190 | 166,587 | ||||
Accrued interest receivable | 46,919 | 23,437 | ||||
Due from counterparties | 28,965 | 32,587 | ||||
Derivative assets, at fair value | 496,788 | 251,856 | ||||
Other assets | 74,445 | 7,566 | ||||
Total Assets | $ | 17,864,695 | $ | 8,100,384 | ||
LIABILITIES AND STOCKHOLDERS’ EQUITY | ||||||
Liabilities | ||||||
Repurchase agreements | $ | 14,034,327 | $ | 6,660,148 | ||
Derivative liabilities, at fair value | 132,322 | 49,080 | ||||
Accrued interest payable | 13,147 | 6,456 | ||||
Due to counterparties | 170,090 | 45,565 | ||||
Accrued expenses | 17,008 | 8,912 | ||||
Dividends payable | 106,325 | 56,239 | ||||
Income taxes payable | — | 3,898 | ||||
Total liabilities | $ | 14,473,219 | $ | 6,830,298 | ||
Stockholders’ Equity | ||||||
Preferred stock, par value $0.01 per share; 50,000,000 shares authorized; no shares issued and outstanding | — | — | ||||
Common stock, par value $0.01 per share; 450,000,000 shares authorized and 295,350,370 and 140,596,708 shares issued and outstanding, respectively | 2,954 | 1,406 | ||||
Additional paid-in capital | 2,910,293 | 1,373,099 | ||||
Accumulated other comprehensive income (loss) | 700,396 | (58,716 | ) | |||
Cumulative earnings | 260,058 | 157,452 | ||||
Cumulative distributions to stockholders | (482,225 | ) | (203,155 | ) | ||
Total stockholders’ equity | 3,391,476 | 1,270,086 | ||||
Total Liabilities and Stockholders’ Equity | $ | 17,864,695 | $ | 8,100,384 | ||
- 8 -
TWO HARBORS INVESTMENT CORP. | ||||||||||||
CONDENSED CONSOLIDATED STATEMENTS OF COMPREHENSIVE INCOME (LOSS) | ||||||||||||
(dollars in thousands, except per share data) | ||||||||||||
Three Months Ended September 30, | Nine Months Ended September 30, | |||||||||||
2012 | 2011 | 2012 | 2011 | |||||||||
(unaudited) | (unaudited) | |||||||||||
Interest income: | ||||||||||||
Available-for-sale securities | $ | 124,621 | $ | 65,919 | $ | 313,154 | $ | 125,413 | ||||
Trading securities | 1,278 | 1,706 | 3,578 | 2,783 | ||||||||
Mortgage loans held-for-sale | 167 | — | 362 | — | ||||||||
Cash and cash equivalents | 243 | 114 | 620 | 241 | ||||||||
Total interest income | 126,309 | 67,739 | 317,714 | 128,437 | ||||||||
Interest expense | 20,743 | 7,218 | 47,737 | 13,580 | ||||||||
Net interest income | 105,566 | 60,521 | 269,977 | 114,857 | ||||||||
Other-than-temporary impairment losses | (559 | ) | (3,371 | ) | (9,310 | ) | (3,665 | ) | ||||
Other income: | ||||||||||||
Gain on investment securities, net | 2,527 | 31,432 | 14,247 | 36,159 | ||||||||
Loss on interest rate swap and swaption agreements | (76,472 | ) | (39,311 | ) | (153,679 | ) | (88,180 | ) | ||||
Gain (loss) on other derivative instruments | 3,454 | 22,361 | (13,053 | ) | 37,474 | |||||||
Other income | 731 | — | 822 | — | ||||||||
Total other (loss) income | (69,760 | ) | 14,482 | (151,663 | ) | (14,547 | ) | |||||
Expenses: | ||||||||||||
Management fees | 9,733 | 4,785 | 24,086 | 9,063 | ||||||||
Other operating expenses | 6,546 | 2,850 | 14,328 | 6,516 | ||||||||
Total expenses | 16,279 | 7,635 | 38,414 | 15,579 | ||||||||
Income before income taxes | 18,968 | 63,997 | 70,590 | 81,066 | ||||||||
(Benefit from) provision for income taxes | (7,834 | ) | 9,388 | (32,016 | ) | 5,064 | ||||||
Net income attributable to common stockholders | $ | 26,802 | $ | 54,609 | $ | 102,606 | $ | 76,002 | ||||
Basic earnings per weighted average common share | $ | 0.10 | $ | 0.42 | $ | 0.46 | $ | 0.90 | ||||
Diluted earnings per weighted average common share | $ | 0.10 | $ | 0.42 | $ | 0.46 | $ | 0.90 | ||||
Weighted average shares outstanding - Basic | 270,005,212 | 130,607,566 | 224,058,762 | 84,751,854 | ||||||||
Weighted average shares outstanding - Diluted | 270,937,960 | 130,607,566 | 224,369,678 | 84,751,854 | ||||||||
Comprehensive income (loss): | ||||||||||||
Net income | $ | 26,802 | $ | 54,609 | $ | 102,606 | $ | 76,002 | ||||
Other comprehensive income (loss): | ||||||||||||
Unrealized gain (loss) on available-for-sale securities, net | 497,598 | (72,573 | ) | 759,112 | (48,944 | ) | ||||||
Other comprehensive income (loss) | 497,598 | (72,573 | ) | 759,112 | (48,944 | ) | ||||||
Comprehensive income (loss) | $ | 524,400 | $ | (17,964 | ) | $ | 861,718 | $ | 27,058 | |||
- 9 -
TWO HARBORS INVESTMENT CORP. | ||||||||||||
RECONCILIATION OF GAAP TO NON-GAAP FINANCIAL INFORMATION | ||||||||||||
(UNAUDITED) | ||||||||||||
(dollars in thousands, except per share data) | ||||||||||||
Three Months Ended | Nine Months Ended | |||||||||||
September 30, | September 30, | |||||||||||
2012 | 2011 | 2012 | 2011 | |||||||||
Reconciliation of net income attributable to common stockholders to | ||||||||||||
Core Earnings: | ||||||||||||
Net income attributable to common stockholders | $ | 26,802 | $ | 54,609 | $ | 102,606 | $ | 76,002 | ||||
Adjustments for non-core earnings: | ||||||||||||
Loss (gain) on sale of securities and mortgage loans, net of tax | 277 | (27,422 | ) | (10,862 | ) | (29,584 | ) | |||||
Other-than-temporary impairment loss, net of tax | 559 | 3,371 | 9,310 | 3,665 | ||||||||
Unrealized gains on trading securities and mortgage loans, net of tax | (2,082 | ) | (2,422 | ) | (2,091 | ) | (3,953 | ) | ||||
Unrealized loss, net of tax, on interest rate swap and swaptions economically hedging repurchase agreements and available-for-sale securities | 53,970 | 16,650 | 86,010 | 49,186 | ||||||||
Unrealized loss (gain), net of tax, on interest rate swap economically hedging trading securities | 3,038 | (4,686 | ) | 10,511 | (3,429 | ) | ||||||
Realized loss on termination or expiration of swaps and swaptions, net of tax | 4,980 | 19,834 | 19,624 | 19,983 | ||||||||
(Gain) loss on other derivative instruments, net of tax | (3,167 | ) | (8,133 | ) | 9,105 | (13,891 | ) | |||||
Core Earnings | $ | 84,377 | $ | 51,801 | $ | 224,213 | $ | 97,979 | ||||
Weighted average shares outstanding - Basic | 270,005,212 | 130,607,566 | 224,058,762 | 84,751,854 | ||||||||
Weighted average shares outstanding - Diluted | 270,937,960 | 130,607,566 | 224,369,678 | 84,751,854 | ||||||||
Core Earnings per weighted average share outstanding - basic and diluted | $ | 0.31 | $ | 0.40 | $ | 1.00 | $ | 1.16 | ||||
- 10 -

