00014632582021FYfalsehttp://fasb.org/us-gaap/2021-01-31#AccountingStandardsUpdate201602MemberP3YP2Y00014632582021-01-012021-12-3100014632582021-06-30iso4217:USD00014632582022-01-31xbrli:shares00014632582021-12-3100014632582020-12-31iso4217:USDxbrli:shares0001463258us-gaap:AlternativeEnergyMember2021-01-012021-12-310001463258us-gaap:AlternativeEnergyMember2020-01-012020-12-310001463258us-gaap:AlternativeEnergyMember2019-01-012019-12-310001463258regi:RenewableIdentificationNumbersMember2021-01-012021-12-310001463258regi:RenewableIdentificationNumbersMember2020-01-012020-12-310001463258regi:RenewableIdentificationNumbersMember2019-01-012019-12-310001463258regi:AlternativeEnergyGovermentIncentivesMember2021-01-012021-12-310001463258regi:AlternativeEnergyGovermentIncentivesMember2020-01-012020-12-310001463258regi:AlternativeEnergyGovermentIncentivesMember2019-01-012019-12-3100014632582020-01-012020-12-3100014632582019-01-012019-12-310001463258us-gaap:ProductAndServiceOtherMember2021-01-012021-12-310001463258us-gaap:ProductAndServiceOtherMember2020-01-012020-12-310001463258us-gaap:ProductAndServiceOtherMember2019-01-012019-12-310001463258us-gaap:CommonStockMember2018-12-310001463258us-gaap:AdditionalPaidInCapitalMember2018-12-310001463258us-gaap:RetainedEarningsMember2018-12-310001463258us-gaap:AccumulatedOtherComprehensiveIncomeMember2018-12-310001463258us-gaap:TreasuryStockMember2018-12-3100014632582018-12-310001463258us-gaap:CommonStockMember2019-01-012019-12-310001463258us-gaap:TreasuryStockMember2019-01-012019-12-310001463258us-gaap:StockAppreciationRightsSARSMemberus-gaap:TreasuryStockMember2019-01-012019-12-310001463258us-gaap:AdditionalPaidInCapitalMember2019-01-012019-12-310001463258us-gaap:AccumulatedOtherComprehensiveIncomeMember2019-01-012019-12-3100014632582018-01-012018-12-310001463258srt:CumulativeEffectPeriodOfAdoptionAdjustmentMemberus-gaap:RetainedEarningsMember2018-12-310001463258srt:CumulativeEffectPeriodOfAdoptionAdjustmentMember2018-12-310001463258us-gaap:RetainedEarningsMember2019-01-012019-12-310001463258us-gaap:CommonStockMember2019-12-310001463258us-gaap:AdditionalPaidInCapitalMember2019-12-310001463258us-gaap:RetainedEarningsMember2019-12-310001463258us-gaap:AccumulatedOtherComprehensiveIncomeMember2019-12-310001463258us-gaap:TreasuryStockMember2019-12-3100014632582019-12-310001463258us-gaap:CommonStockMember2020-01-012020-12-310001463258us-gaap:TreasuryStockMember2020-01-012020-12-310001463258us-gaap:StockAppreciationRightsSARSMemberus-gaap:TreasuryStockMember2020-01-012020-12-310001463258us-gaap:AdditionalPaidInCapitalMember2020-01-012020-12-310001463258us-gaap:AccumulatedOtherComprehensiveIncomeMember2020-01-012020-12-310001463258us-gaap:RetainedEarningsMember2020-01-012020-12-310001463258us-gaap:CommonStockMember2020-12-310001463258us-gaap:AdditionalPaidInCapitalMember2020-12-310001463258us-gaap:RetainedEarningsMember2020-12-310001463258us-gaap:AccumulatedOtherComprehensiveIncomeMember2020-12-310001463258us-gaap:TreasuryStockMember2020-12-310001463258us-gaap:CommonStockMember2021-01-012021-12-310001463258us-gaap:TreasuryStockMember2021-01-012021-12-310001463258us-gaap:StockAppreciationRightsSARSMemberus-gaap:TreasuryStockMember2021-01-012021-12-310001463258us-gaap:AdditionalPaidInCapitalMember2021-01-012021-12-310001463258us-gaap:AccumulatedOtherComprehensiveIncomeMember2021-01-012021-12-310001463258us-gaap:RetainedEarningsMember2021-01-012021-12-310001463258us-gaap:CommonStockMember2021-12-310001463258us-gaap:AdditionalPaidInCapitalMember2021-12-310001463258us-gaap:RetainedEarningsMember2021-12-310001463258us-gaap:AccumulatedOtherComprehensiveIncomeMember2021-12-310001463258us-gaap:TreasuryStockMember2021-12-31regi:facility0001463258srt:NorthAmericaMember2021-01-012021-12-310001463258srt:EuropeMember2021-01-012021-12-31utr:gal0001463258regi:REGNewBostonMember2019-08-310001463258regi:AmberResourcesMember2021-12-30regi:fuel_distribution_location0001463258us-gaap:TradeAccountsReceivableMember2021-12-310001463258us-gaap:TradeAccountsReceivableMember2020-12-310001463258regi:BiodieselMixtureExciseTaxCreditReceivablesMember2021-12-310001463258regi:BiodieselMixtureExciseTaxCreditReceivablesMember2020-12-310001463258regi:OtherTradeReceivablesMember2021-12-310001463258regi:OtherTradeReceivablesMember2020-12-310001463258srt:MinimumMember2021-01-012021-12-31regi:renewable_identification_number0001463258srt:MaximumMember2021-01-012021-12-310001463258us-gaap:AutomobilesMember2021-01-012021-12-310001463258us-gaap:ComputerEquipmentMember2021-01-012021-12-310001463258us-gaap:FurnitureAndFixturesMember2021-01-012021-12-310001463258srt:MinimumMemberus-gaap:MachineryAndEquipmentMember2021-01-012021-12-310001463258srt:MaximumMemberus-gaap:MachineryAndEquipmentMember2021-01-012021-12-310001463258us-gaap:BuildingAndBuildingImprovementsMembersrt:MinimumMember2021-01-012021-12-310001463258srt:MaximumMemberus-gaap:BuildingAndBuildingImprovementsMember2021-01-012021-12-310001463258regi:ServicesMember2020-12-310001463258regi:ServicesMember2021-12-310001463258regi:BiomassbasedDieselMember2021-12-310001463258regi:BiodieselMember2021-01-012021-12-310001463258regi:RenewableDieselMember2020-01-012020-12-310001463258regi:BiodieselMember2020-01-012020-12-310001463258us-gaap:ConvertibleDebtMemberregi:A2036ConvertibleNotesMember2016-06-30xbrli:pure0001463258us-gaap:ConvertibleDebtMemberregi:A2036ConvertibleNotesMember2021-01-012021-06-300001463258us-gaap:ConvertibleDebtMemberregi:A2036ConvertibleNotesMember2020-01-012020-12-310001463258us-gaap:ConvertibleDebtMemberregi:A2036ConvertibleNotesMember2020-12-310001463258regi:SeniorSecuredNotesDue2028Memberus-gaap:SeniorNotesMember2021-05-200001463258regi:January2019Member2019-01-310001463258regi:February2020Member2020-02-290001463258regi:January2019Memberus-gaap:ConvertibleDebtMemberregi:A2036ConvertibleNotesMember2020-01-012020-12-310001463258regi:February2020Memberus-gaap:ConvertibleDebtMemberregi:A2036ConvertibleNotesMember2020-01-012020-12-310001463258regi:February2020Member2021-12-310001463258regi:EquityOfferingMember2021-03-192021-03-190001463258regi:EquityOfferingMember2021-03-190001463258regi:BiomassbasedDieselMemberus-gaap:OperatingSegmentsMemberregi:BiomassbasedDieselMember2021-01-012021-12-310001463258regi:BiomassbasedDieselMemberus-gaap:OperatingSegmentsMemberregi:ServicesMember2021-01-012021-12-310001463258us-gaap:CorporateAndOtherMemberregi:BiomassbasedDieselMemberus-gaap:OperatingSegmentsMember2021-01-012021-12-310001463258regi:BiomassbasedDieselMemberus-gaap:IntersegmentEliminationMember2021-01-012021-12-310001463258regi:BiomassbasedDieselMember2021-01-012021-12-310001463258regi:PetroleumDieselMemberus-gaap:OperatingSegmentsMemberregi:BiomassbasedDieselMember2021-01-012021-12-310001463258regi:PetroleumDieselMemberus-gaap:OperatingSegmentsMemberregi:ServicesMember2021-01-012021-12-310001463258regi:PetroleumDieselMemberus-gaap:CorporateAndOtherMemberus-gaap:OperatingSegmentsMember2021-01-012021-12-310001463258regi:PetroleumDieselMemberus-gaap:IntersegmentEliminationMember2021-01-012021-12-310001463258regi:PetroleumDieselMember2021-01-012021-12-310001463258regi:LCFSCreditsMemberus-gaap:OperatingSegmentsMemberregi:BiomassbasedDieselMember2021-01-012021-12-310001463258regi:LCFSCreditsMemberus-gaap:OperatingSegmentsMemberregi:ServicesMember2021-01-012021-12-310001463258regi:LCFSCreditsMemberus-gaap:CorporateAndOtherMemberus-gaap:OperatingSegmentsMember2021-01-012021-12-310001463258regi:LCFSCreditsMemberus-gaap:IntersegmentEliminationMember2021-01-012021-12-310001463258regi:LCFSCreditsMember2021-01-012021-12-310001463258regi:SeparatedRINsMemberus-gaap:OperatingSegmentsMemberregi:BiomassbasedDieselMember2021-01-012021-12-310001463258regi:SeparatedRINsMemberus-gaap:OperatingSegmentsMemberregi:ServicesMember2021-01-012021-12-310001463258regi:SeparatedRINsMemberus-gaap:CorporateAndOtherMemberus-gaap:OperatingSegmentsMember2021-01-012021-12-310001463258regi:SeparatedRINsMemberus-gaap:IntersegmentEliminationMember2021-01-012021-12-310001463258regi:SeparatedRINsMember2021-01-012021-12-310001463258regi:CoproductMemberus-gaap:OperatingSegmentsMemberregi:BiomassbasedDieselMember2021-01-012021-12-310001463258regi:CoproductMemberus-gaap:OperatingSegmentsMemberregi:ServicesMember2021-01-012021-12-310001463258us-gaap:CorporateAndOtherMemberregi:CoproductMemberus-gaap:OperatingSegmentsMember2021-01-012021-12-310001463258regi:CoproductMemberus-gaap:IntersegmentEliminationMember2021-01-012021-12-310001463258regi:CoproductMember2021-01-012021-12-310001463258regi:RawMaterialMemberus-gaap:OperatingSegmentsMemberregi:BiomassbasedDieselMember2021-01-012021-12-310001463258regi:RawMaterialMemberus-gaap:OperatingSegmentsMemberregi:ServicesMember2021-01-012021-12-310001463258us-gaap:CorporateAndOtherMemberregi:RawMaterialMemberus-gaap:OperatingSegmentsMember2021-01-012021-12-310001463258regi:RawMaterialMemberus-gaap:IntersegmentEliminationMember2021-01-012021-12-310001463258regi:RawMaterialMember2021-01-012021-12-310001463258regi:OtherBiomassbasedDieselProductsMemberus-gaap:OperatingSegmentsMemberregi:BiomassbasedDieselMember2021-01-012021-12-310001463258regi:OtherBiomassbasedDieselProductsMemberus-gaap:OperatingSegmentsMemberregi:ServicesMember2021-01-012021-12-310001463258us-gaap:CorporateAndOtherMemberregi:OtherBiomassbasedDieselProductsMemberus-gaap:OperatingSegmentsMember2021-01-012021-12-310001463258regi:OtherBiomassbasedDieselProductsMemberus-gaap:IntersegmentEliminationMember2021-01-012021-12-310001463258regi:OtherBiomassbasedDieselProductsMember2021-01-012021-12-310001463258regi:OtherProductsandServicesMemberus-gaap:OperatingSegmentsMemberregi:BiomassbasedDieselMember2021-01-012021-12-310001463258regi:OtherProductsandServicesMemberus-gaap:OperatingSegmentsMemberregi:ServicesMember2021-01-012021-12-310001463258us-gaap:CorporateAndOtherMemberregi:OtherProductsandServicesMemberus-gaap:OperatingSegmentsMember2021-01-012021-12-310001463258regi:OtherProductsandServicesMemberus-gaap:IntersegmentEliminationMember2021-01-012021-12-310001463258regi:OtherProductsandServicesMember2021-01-012021-12-310001463258us-gaap:OperatingSegmentsMemberregi:BiomassbasedDieselMember2021-01-012021-12-310001463258us-gaap:OperatingSegmentsMemberregi:ServicesMember2021-01-012021-12-310001463258us-gaap:CorporateAndOtherMemberus-gaap:OperatingSegmentsMember2021-01-012021-12-310001463258us-gaap:IntersegmentEliminationMember2021-01-012021-12-310001463258regi:BiomassbasedDieselMemberus-gaap:OperatingSegmentsMemberregi:BiomassbasedDieselMember2020-01-012020-12-310001463258regi:BiomassbasedDieselMemberus-gaap:OperatingSegmentsMemberregi:ServicesMember2020-01-012020-12-310001463258us-gaap:CorporateAndOtherMemberregi:BiomassbasedDieselMemberus-gaap:OperatingSegmentsMember2020-01-012020-12-310001463258regi:BiomassbasedDieselMemberus-gaap:IntersegmentEliminationMember2020-01-012020-12-310001463258regi:BiomassbasedDieselMember2020-01-012020-12-310001463258regi:PetroleumDieselMemberus-gaap:OperatingSegmentsMemberregi:BiomassbasedDieselMember2020-01-012020-12-310001463258regi:PetroleumDieselMemberus-gaap:OperatingSegmentsMemberregi:ServicesMember2020-01-012020-12-310001463258regi:PetroleumDieselMemberus-gaap:CorporateAndOtherMemberus-gaap:OperatingSegmentsMember2020-01-012020-12-310001463258regi:PetroleumDieselMemberus-gaap:IntersegmentEliminationMember2020-01-012020-12-310001463258regi:PetroleumDieselMember2020-01-012020-12-310001463258regi:LCFSCreditsMemberus-gaap:OperatingSegmentsMemberregi:BiomassbasedDieselMember2020-01-012020-12-310001463258regi:LCFSCreditsMemberus-gaap:OperatingSegmentsMemberregi:ServicesMember2020-01-012020-12-310001463258regi:LCFSCreditsMemberus-gaap:CorporateAndOtherMemberus-gaap:OperatingSegmentsMember2020-01-012020-12-310001463258regi:LCFSCreditsMemberus-gaap:IntersegmentEliminationMember2020-01-012020-12-310001463258regi:LCFSCreditsMember2020-01-012020-12-310001463258regi:SeparatedRINsMemberus-gaap:OperatingSegmentsMemberregi:BiomassbasedDieselMember2020-01-012020-12-310001463258regi:SeparatedRINsMemberus-gaap:OperatingSegmentsMemberregi:ServicesMember2020-01-012020-12-310001463258regi:SeparatedRINsMemberus-gaap:CorporateAndOtherMemberus-gaap:OperatingSegmentsMember2020-01-012020-12-310001463258regi:SeparatedRINsMemberus-gaap:IntersegmentEliminationMember2020-01-012020-12-310001463258regi:SeparatedRINsMember2020-01-012020-12-310001463258regi:CoproductMemberus-gaap:OperatingSegmentsMemberregi:BiomassbasedDieselMember2020-01-012020-12-310001463258regi:CoproductMemberus-gaap:OperatingSegmentsMemberregi:ServicesMember2020-01-012020-12-310001463258us-gaap:CorporateAndOtherMemberregi:CoproductMemberus-gaap:OperatingSegmentsMember2020-01-012020-12-310001463258regi:CoproductMemberus-gaap:IntersegmentEliminationMember2020-01-012020-12-310001463258regi:CoproductMember2020-01-012020-12-310001463258regi:RawMaterialMemberus-gaap:OperatingSegmentsMemberregi:BiomassbasedDieselMember2020-01-012020-12-310001463258regi:RawMaterialMemberus-gaap:OperatingSegmentsMemberregi:ServicesMember2020-01-012020-12-310001463258us-gaap:CorporateAndOtherMemberregi:RawMaterialMemberus-gaap:OperatingSegmentsMember2020-01-012020-12-310001463258regi:RawMaterialMemberus-gaap:IntersegmentEliminationMember2020-01-012020-12-310001463258regi:RawMaterialMember2020-01-012020-12-310001463258regi:OtherBiomassbasedDieselProductsMemberus-gaap:OperatingSegmentsMemberregi:BiomassbasedDieselMember2020-01-012020-12-310001463258regi:OtherBiomassbasedDieselProductsMemberus-gaap:OperatingSegmentsMemberregi:ServicesMember2020-01-012020-12-310001463258us-gaap:CorporateAndOtherMemberregi:OtherBiomassbasedDieselProductsMemberus-gaap:OperatingSegmentsMember2020-01-012020-12-310001463258regi:OtherBiomassbasedDieselProductsMemberus-gaap:IntersegmentEliminationMember2020-01-012020-12-310001463258regi:OtherBiomassbasedDieselProductsMember2020-01-012020-12-310001463258regi:OtherProductsandServicesMemberus-gaap:OperatingSegmentsMemberregi:BiomassbasedDieselMember2020-01-012020-12-310001463258regi:OtherProductsandServicesMemberus-gaap:OperatingSegmentsMemberregi:ServicesMember2020-01-012020-12-310001463258us-gaap:CorporateAndOtherMemberregi:OtherProductsandServicesMemberus-gaap:OperatingSegmentsMember2020-01-012020-12-310001463258regi:OtherProductsandServicesMemberus-gaap:IntersegmentEliminationMember2020-01-012020-12-310001463258regi:OtherProductsandServicesMember2020-01-012020-12-310001463258us-gaap:OperatingSegmentsMemberregi:BiomassbasedDieselMember2020-01-012020-12-310001463258us-gaap:OperatingSegmentsMemberregi:ServicesMember2020-01-012020-12-310001463258us-gaap:CorporateAndOtherMemberus-gaap:OperatingSegmentsMember2020-01-012020-12-310001463258us-gaap:IntersegmentEliminationMember2020-01-012020-12-310001463258regi:BiomassbasedDieselMemberus-gaap:OperatingSegmentsMemberregi:BiomassbasedDieselMember2019-01-012019-12-310001463258regi:BiomassbasedDieselMemberus-gaap:OperatingSegmentsMemberregi:ServicesMember2019-01-012019-12-310001463258us-gaap:CorporateAndOtherMemberregi:BiomassbasedDieselMemberus-gaap:OperatingSegmentsMember2019-01-012019-12-310001463258regi:BiomassbasedDieselMemberus-gaap:IntersegmentEliminationMember2019-01-012019-12-310001463258regi:BiomassbasedDieselMember2019-01-012019-12-310001463258regi:PetroleumDieselMemberus-gaap:OperatingSegmentsMemberregi:BiomassbasedDieselMember2019-01-012019-12-310001463258regi:PetroleumDieselMemberus-gaap:OperatingSegmentsMemberregi:ServicesMember2019-01-012019-12-310001463258regi:PetroleumDieselMemberus-gaap:CorporateAndOtherMemberus-gaap:OperatingSegmentsMember2019-01-012019-12-310001463258regi:PetroleumDieselMemberus-gaap:IntersegmentEliminationMember2019-01-012019-12-310001463258regi:PetroleumDieselMember2019-01-012019-12-310001463258regi:LCFSCreditsMemberus-gaap:OperatingSegmentsMemberregi:BiomassbasedDieselMember2019-01-012019-12-310001463258regi:LCFSCreditsMemberus-gaap:OperatingSegmentsMemberregi:ServicesMember2019-01-012019-12-310001463258regi:LCFSCreditsMemberus-gaap:CorporateAndOtherMemberus-gaap:OperatingSegmentsMember2019-01-012019-12-310001463258regi:LCFSCreditsMemberus-gaap:IntersegmentEliminationMember2019-01-012019-12-310001463258regi:LCFSCreditsMember2019-01-012019-12-310001463258regi:SeparatedRINsMemberus-gaap:OperatingSegmentsMemberregi:BiomassbasedDieselMember2019-01-012019-12-310001463258regi:SeparatedRINsMemberus-gaap:OperatingSegmentsMemberregi:ServicesMember2019-01-012019-12-310001463258regi:SeparatedRINsMemberus-gaap:CorporateAndOtherMemberus-gaap:OperatingSegmentsMember2019-01-012019-12-310001463258regi:SeparatedRINsMemberus-gaap:IntersegmentEliminationMember2019-01-012019-12-310001463258regi:SeparatedRINsMember2019-01-012019-12-310001463258regi:CoproductMemberus-gaap:OperatingSegmentsMemberregi:BiomassbasedDieselMember2019-01-012019-12-310001463258regi:CoproductMemberus-gaap:OperatingSegmentsMemberregi:ServicesMember2019-01-012019-12-310001463258us-gaap:CorporateAndOtherMemberregi:CoproductMemberus-gaap:OperatingSegmentsMember2019-01-012019-12-310001463258regi:CoproductMemberus-gaap:IntersegmentEliminationMember2019-01-012019-12-310001463258regi:CoproductMember2019-01-012019-12-310001463258regi:RawMaterialMemberus-gaap:OperatingSegmentsMemberregi:BiomassbasedDieselMember2019-01-012019-12-310001463258regi:RawMaterialMemberus-gaap:OperatingSegmentsMemberregi:ServicesMember2019-01-012019-12-310001463258us-gaap:CorporateAndOtherMemberregi:RawMaterialMemberus-gaap:OperatingSegmentsMember2019-01-012019-12-310001463258regi:RawMaterialMemberus-gaap:IntersegmentEliminationMember2019-01-012019-12-310001463258regi:RawMaterialMember2019-01-012019-12-310001463258regi:OtherBiomassbasedDieselProductsMemberus-gaap:OperatingSegmentsMemberregi:BiomassbasedDieselMember2019-01-012019-12-310001463258regi:OtherBiomassbasedDieselProductsMemberus-gaap:OperatingSegmentsMemberregi:ServicesMember2019-01-012019-12-310001463258us-gaap:CorporateAndOtherMemberregi:OtherBiomassbasedDieselProductsMemberus-gaap:OperatingSegmentsMember2019-01-012019-12-310001463258regi:OtherBiomassbasedDieselProductsMemberus-gaap:IntersegmentEliminationMember2019-01-012019-12-310001463258regi:OtherBiomassbasedDieselProductsMember2019-01-012019-12-310001463258regi:OtherProductsandServicesMemberus-gaap:OperatingSegmentsMemberregi:BiomassbasedDieselMember2019-01-012019-12-310001463258regi:OtherProductsandServicesMemberus-gaap:OperatingSegmentsMemberregi:ServicesMember2019-01-012019-12-310001463258us-gaap:CorporateAndOtherMemberregi:OtherProductsandServicesMemberus-gaap:OperatingSegmentsMember2019-01-012019-12-310001463258regi:OtherProductsandServicesMemberus-gaap:IntersegmentEliminationMember2019-01-012019-12-310001463258regi:OtherProductsandServicesMember2019-01-012019-12-310001463258us-gaap:OperatingSegmentsMemberregi:BiomassbasedDieselMember2019-01-012019-12-310001463258us-gaap:OperatingSegmentsMemberregi:ServicesMember2019-01-012019-12-310001463258us-gaap:CorporateAndOtherMemberus-gaap:OperatingSegmentsMember2019-01-012019-12-310001463258us-gaap:IntersegmentEliminationMember2019-01-012019-12-310001463258regi:AmberResourcesMember2021-12-302021-12-300001463258us-gaap:CommercialPaperMember2021-12-310001463258us-gaap:CorporateBondSecuritiesMember2021-12-310001463258us-gaap:MunicipalBondsMember2021-12-310001463258us-gaap:CommercialPaperMember2020-12-310001463258us-gaap:CorporateBondSecuritiesMember2020-12-310001463258us-gaap:USTreasuryBillSecuritiesMember2020-12-310001463258us-gaap:MunicipalBondsMember2020-12-310001463258us-gaap:LandMember2021-12-310001463258us-gaap:LandMember2020-12-310001463258us-gaap:BuildingAndBuildingImprovementsMember2021-12-310001463258us-gaap:BuildingAndBuildingImprovementsMember2020-12-310001463258us-gaap:LeaseholdImprovementsMember2021-12-310001463258us-gaap:LeaseholdImprovementsMember2020-12-310001463258us-gaap:MachineryAndEquipmentMember2021-12-310001463258us-gaap:MachineryAndEquipmentMember2020-12-310001463258regi:RawMaterialSupplyAgreementMember2021-12-310001463258us-gaap:TechnologyBasedIntangibleAssetsMember2021-12-310001463258us-gaap:CustomerRelationshipsMember2021-12-310001463258us-gaap:TradeNamesMember2021-12-310001463258us-gaap:OtherIntangibleAssetsMember2021-12-310001463258regi:RawMaterialSupplyAgreementMember2020-12-310001463258us-gaap:TechnologyBasedIntangibleAssetsMember2020-12-310001463258us-gaap:CustomerRelationshipsMember2020-12-310001463258us-gaap:OtherIntangibleAssetsMember2020-12-310001463258regi:RawMaterialSupplyAgreementMember2021-01-012021-12-310001463258us-gaap:CustomerRelationshipsMemberregi:AmberResourcesMember2021-01-012021-12-310001463258us-gaap:CustomerRelationshipsMembersrt:MinimumMember2021-01-012021-12-310001463258us-gaap:CustomerRelationshipsMembersrt:MaximumMember2021-01-012021-12-310001463258regi:AmberResourcesMemberus-gaap:TradeNamesMember2021-01-012021-12-310001463258us-gaap:SeniorNotesMember2021-12-310001463258us-gaap:SeniorNotesMember2020-12-310001463258us-gaap:ConvertibleNotesPayableMember2021-12-310001463258us-gaap:ConvertibleNotesPayableMember2020-12-310001463258regi:REGRalstonTermLoanMemberus-gaap:LondonInterbankOfferedRateLIBORMember2021-01-012021-12-310001463258regi:REGRalstonTermLoanMember2021-12-310001463258regi:REGRalstonTermLoanMember2020-12-310001463258regi:REGCapitalTermLoanMember2021-12-310001463258regi:REGCapitalTermLoanMember2020-12-310001463258regi:OtherBorrowingsMember2021-12-310001463258regi:OtherBorrowingsMember2020-12-310001463258us-gaap:SeniorNotesMemberregi:SeniorSecuredGreenBondsDue2028Member2021-05-200001463258us-gaap:SeniorNotesMemberus-gaap:DebtInstrumentRedemptionPeriodOneMemberregi:SeniorSecuredGreenBondsDue2028Member2021-05-202021-05-200001463258us-gaap:DebtInstrumentRedemptionPeriodTwoMemberus-gaap:SeniorNotesMemberregi:SeniorSecuredGreenBondsDue2028Member2021-05-202021-05-200001463258us-gaap:DebtInstrumentRedemptionPeriodThreeMemberus-gaap:SeniorNotesMemberregi:SeniorSecuredGreenBondsDue2028Member2021-05-202021-05-200001463258us-gaap:DebtInstrumentRedemptionPeriodFourMemberus-gaap:SeniorNotesMemberregi:SeniorSecuredGreenBondsDue2028Member2021-05-202021-05-200001463258us-gaap:SeniorNotesMemberus-gaap:DebtInstrumentRedemptionPeriodFiveMemberregi:SeniorSecuredGreenBondsDue2028Member2021-05-202021-05-200001463258us-gaap:SeniorNotesMemberregi:DebtInstrumentRedemptionPeriodSixMemberregi:SeniorSecuredGreenBondsDue2028Member2021-05-202021-05-200001463258us-gaap:SeniorNotesMemberregi:SeniorSecuredGreenBondsDue2028Member2021-05-202021-05-200001463258us-gaap:ConvertibleDebtMemberregi:A2036ConvertibleNotesMember2016-06-020001463258us-gaap:ConvertibleDebtMemberregi:A2036ConvertibleNotesMember2021-04-122021-04-120001463258regi:REGRalstonTermLoanMember2021-04-220001463258regi:REGCapitalTermLoanMember2021-04-220001463258regi:WellsFargoRevolverMember2020-04-300001463258regi:WellsFargoRevolverMember2021-09-300001463258regi:WellsFargoRevolverMember2021-01-012021-09-300001463258regi:WellsFargoRevolverMember2021-10-012021-12-310001463258regi:WellsFargoRevolverMember2021-01-012021-12-310001463258srt:MinimumMemberregi:WellsFargoRevolverMember2021-01-012021-12-310001463258srt:MaximumMemberregi:WellsFargoRevolverMember2021-01-012021-12-310001463258us-gaap:ForeignCountryMember2021-10-012021-12-310001463258regi:AmberResourcesMemberus-gaap:DomesticCountryMember2021-10-012021-12-3100014632582011-10-2600014632582017-05-082017-05-0800014632582014-05-152014-05-1500014632582017-05-0800014632582014-05-1500014632582021-05-180001463258us-gaap:RestrictedStockUnitsRSUMember2018-12-310001463258us-gaap:RestrictedStockUnitsRSUMember2019-01-012019-12-310001463258us-gaap:RestrictedStockUnitsRSUMember2019-12-310001463258us-gaap:RestrictedStockUnitsRSUMember2020-01-012020-12-310001463258us-gaap:RestrictedStockUnitsRSUMember2020-12-310001463258us-gaap:RestrictedStockUnitsRSUMember2021-01-012021-12-310001463258us-gaap:RestrictedStockUnitsRSUMember2021-12-310001463258us-gaap:RestrictedStockUnitsRSUMembersrt:DirectorMember2021-01-012021-12-310001463258srt:ManagementMemberus-gaap:RestrictedStockUnitsRSUMembersrt:MinimumMember2021-01-012021-12-310001463258srt:MaximumMembersrt:ManagementMemberus-gaap:RestrictedStockUnitsRSUMember2021-01-012021-12-310001463258regi:PerformanceRestrictedStockUnitsPRSUsMember2018-12-310001463258regi:PerformanceRestrictedStockUnitsPRSUsMember2019-01-012019-12-310001463258regi:PerformanceRestrictedStockUnitsPRSUsMember2019-12-310001463258regi:PerformanceRestrictedStockUnitsPRSUsMember2020-01-012020-12-310001463258regi:PerformanceRestrictedStockUnitsPRSUsMember2020-12-310001463258regi:PerformanceRestrictedStockUnitsPRSUsMember2021-01-012021-12-310001463258regi:PerformanceRestrictedStockUnitsPRSUsMember2021-12-310001463258srt:MinimumMemberregi:PerformanceRestrictedStockUnitsPRSUsMember2021-01-012021-12-310001463258srt:MaximumMemberregi:PerformanceRestrictedStockUnitsPRSUsMember2021-01-012021-12-310001463258us-gaap:StockAppreciationRightsSARSMember2018-12-310001463258us-gaap:StockAppreciationRightsSARSMember2019-01-012019-12-310001463258us-gaap:StockAppreciationRightsSARSMember2019-12-310001463258us-gaap:StockAppreciationRightsSARSMember2020-01-012020-12-310001463258us-gaap:StockAppreciationRightsSARSMember2020-12-310001463258us-gaap:StockAppreciationRightsSARSMember2021-01-012021-12-310001463258us-gaap:StockAppreciationRightsSARSMember2021-12-31utr:lbutr:Btu0001463258us-gaap:PrepaidExpensesAndOtherCurrentAssetsMember2021-12-310001463258us-gaap:PrepaidExpensesAndOtherCurrentAssetsMember2020-12-310001463258us-gaap:AccountsPayableMember2020-12-310001463258us-gaap:AccountsPayableMember2021-12-310001463258us-gaap:CommodityContractMember2021-12-310001463258us-gaap:CostOfSalesMemberus-gaap:CommodityContractMember2021-01-012021-12-310001463258us-gaap:CostOfSalesMemberus-gaap:CommodityContractMember2020-01-012020-12-310001463258us-gaap:CostOfSalesMemberus-gaap:CommodityContractMember2019-01-012019-12-310001463258us-gaap:CommercialPaperMember2021-12-310001463258us-gaap:CommercialPaperMemberus-gaap:FairValueInputsLevel1Member2021-12-310001463258us-gaap:CommercialPaperMemberus-gaap:FairValueInputsLevel2Member2021-12-310001463258us-gaap:CommercialPaperMemberus-gaap:FairValueInputsLevel3Member2021-12-310001463258us-gaap:CorporateDebtSecuritiesMember2021-12-310001463258us-gaap:FairValueInputsLevel1Memberus-gaap:CorporateDebtSecuritiesMember2021-12-310001463258us-gaap:FairValueInputsLevel2Memberus-gaap:CorporateDebtSecuritiesMember2021-12-310001463258us-gaap:FairValueInputsLevel3Memberus-gaap:CorporateDebtSecuritiesMember2021-12-310001463258us-gaap:MunicipalBondsMember2021-12-310001463258us-gaap:MunicipalBondsMemberus-gaap:FairValueInputsLevel1Member2021-12-310001463258us-gaap:MunicipalBondsMemberus-gaap:FairValueInputsLevel2Member2021-12-310001463258us-gaap:MunicipalBondsMemberus-gaap:FairValueInputsLevel3Member2021-12-310001463258us-gaap:FairValueInputsLevel1Memberus-gaap:CommodityContractMember2021-12-310001463258us-gaap:FairValueInputsLevel2Memberus-gaap:CommodityContractMember2021-12-310001463258us-gaap:FairValueInputsLevel3Memberus-gaap:CommodityContractMember2021-12-310001463258us-gaap:FairValueInputsLevel1Member2021-12-310001463258us-gaap:FairValueInputsLevel2Member2021-12-310001463258us-gaap:FairValueInputsLevel3Member2021-12-310001463258us-gaap:CommercialPaperMember2020-12-310001463258us-gaap:CommercialPaperMemberus-gaap:FairValueInputsLevel1Member2020-12-310001463258us-gaap:CommercialPaperMemberus-gaap:FairValueInputsLevel2Member2020-12-310001463258us-gaap:CommercialPaperMemberus-gaap:FairValueInputsLevel3Member2020-12-310001463258us-gaap:CorporateDebtSecuritiesMember2020-12-310001463258us-gaap:FairValueInputsLevel1Memberus-gaap:CorporateDebtSecuritiesMember2020-12-310001463258us-gaap:FairValueInputsLevel2Memberus-gaap:CorporateDebtSecuritiesMember2020-12-310001463258us-gaap:FairValueInputsLevel3Memberus-gaap:CorporateDebtSecuritiesMember2020-12-310001463258us-gaap:USTreasuryBillSecuritiesMember2020-12-310001463258us-gaap:FairValueInputsLevel1Memberus-gaap:USTreasuryBillSecuritiesMember2020-12-310001463258us-gaap:USTreasuryBillSecuritiesMemberus-gaap:FairValueInputsLevel2Member2020-12-310001463258us-gaap:USTreasuryBillSecuritiesMemberus-gaap:FairValueInputsLevel3Member2020-12-310001463258us-gaap:MunicipalBondsMember2020-12-310001463258us-gaap:MunicipalBondsMemberus-gaap:FairValueInputsLevel1Member2020-12-310001463258us-gaap:MunicipalBondsMemberus-gaap:FairValueInputsLevel2Member2020-12-310001463258us-gaap:MunicipalBondsMemberus-gaap:FairValueInputsLevel3Member2020-12-310001463258us-gaap:CommodityContractMember2020-12-310001463258us-gaap:FairValueInputsLevel1Memberus-gaap:CommodityContractMember2020-12-310001463258us-gaap:FairValueInputsLevel2Memberus-gaap:CommodityContractMember2020-12-310001463258us-gaap:FairValueInputsLevel3Memberus-gaap:CommodityContractMember2020-12-310001463258us-gaap:FairValueInputsLevel1Member2020-12-310001463258us-gaap:FairValueInputsLevel2Member2020-12-310001463258us-gaap:FairValueInputsLevel3Member2020-12-310001463258us-gaap:CarryingReportedAmountFairValueDisclosureMember2021-12-310001463258us-gaap:EstimateOfFairValueFairValueDisclosureMember2021-12-310001463258us-gaap:CarryingReportedAmountFairValueDisclosureMember2020-12-310001463258us-gaap:EstimateOfFairValueFairValueDisclosureMember2020-12-310001463258us-gaap:CorporateAndOtherMember2021-01-012021-12-310001463258us-gaap:CorporateAndOtherMember2020-01-012020-12-310001463258us-gaap:CorporateAndOtherMember2019-01-012019-12-310001463258us-gaap:MaterialReconcilingItemsMember2021-01-012021-12-310001463258us-gaap:MaterialReconcilingItemsMember2020-01-012020-12-310001463258us-gaap:MaterialReconcilingItemsMember2019-01-012019-12-310001463258us-gaap:OperatingSegmentsMemberregi:BiomassbasedDieselMember2021-12-310001463258us-gaap:OperatingSegmentsMemberregi:BiomassbasedDieselMember2020-12-310001463258us-gaap:OperatingSegmentsMemberregi:ServicesMember2021-12-310001463258us-gaap:OperatingSegmentsMemberregi:ServicesMember2020-12-310001463258us-gaap:CorporateAndOtherMember2021-12-310001463258us-gaap:CorporateAndOtherMember2020-12-310001463258us-gaap:IntersegmentEliminationMember2021-12-310001463258us-gaap:IntersegmentEliminationMember2020-12-310001463258country:US2021-01-012021-12-310001463258country:US2020-01-012020-12-310001463258country:US2019-01-012019-12-310001463258regi:TotalForeignMember2021-01-012021-12-310001463258regi:TotalForeignMember2020-01-012020-12-310001463258regi:TotalForeignMember2019-01-012019-12-310001463258country:US2021-12-310001463258country:US2020-12-310001463258regi:TotalForeignMember2021-12-310001463258regi:TotalForeignMember2020-12-310001463258regi:GeismarProjectMember2020-10-200001463258srt:ScenarioForecastMemberregi:GeismarProjectMember2024-01-310001463258regi:ConstructionCommitmentsMember2021-12-310001463258regi:CommitmentsToPurchaseHydrogenNitrogenUtilitiesAndFeedstocksMember2021-12-3100014632582021-03-3100014632582021-03-022021-06-24regi:claim0001463258us-gaap:SubsequentEventMembersrt:MaximumMemberregi:ZeusMember2022-02-272022-02-2700014632582021-01-012021-03-3100014632582021-04-012021-06-3000014632582021-07-012021-09-3000014632582021-10-012021-12-3100014632582020-01-012020-03-3100014632582020-04-012020-06-3000014632582020-07-012020-09-3000014632582020-10-012020-12-31
UNITED STATES
SECURITIES AND EXCHANGE COMMISSION
Washington, D.C. 20549
______________________________________
FORM 10-K
(Mark One)
| | | | | |
| ☒ | ANNUAL REPORT PURSUANT TO SECTION 13 OR 15(d) OF THE SECURITIES EXCHANGE ACT OF 1934 |
For the fiscal year ended December 31, 2021
or
| | | | | |
| ☐ | TRANSITION REPORT PURSUANT TO SECTION 13 OR 15(d) OF THE SECURITIES EXCHANGE ACT OF 1934 |
For the transition period from to
Commission File Number: 001-35397
______________________________________
RENEWABLE ENERGY GROUP, INC.
(Exact name of registrant as specified in its charter)
| | | | | | | | | | | |
| Delaware | | | 26-4785427 |
(State of other jurisdiction of
incorporation or organization) | | | (I.R.S. Employer
Identification No.) |
| | | |
| 416 South Bell Avenue | Ames | Iowa | 50010 |
| (Address of principal executive offices) | | | (Zip code) |
Registrant’s telephone number, including area code: (515) 239-8000
Securities registered pursuant to Section 12(b) of the Act:
| | | | | | | | |
| Title of each class | Trading Symbol(s) | Name of each exchange on which registered |
| Common Stock, par value $.0001 per share | REGI | The Nasdaq Stock Market LLC |
Securities registered pursuant to Section 12(g) of the Act:
None
(Title of class)
______________________________________
Indicate by check mark if the registrant is a well-known seasoned issuer, as defined in Rule 405 of the Securities Act. Yes x No ¨
Indicate by check mark if the registrant is not required to file reports pursuant to Section 13 or Section 15(d) of the Act. Yes ¨ No x
Indicate by check mark whether the registrant (1) has filed all reports required to be filed by Section 13 or 15(d) of the Securities Exchange Act of 1934 during the preceding 12 months (or for such shorter period that the registrant was required to file such reports), and (2) has been subject to such filing requirements for the past 90 days. Yes x No ¨
Indicate by check mark whether the registrant has submitted electronically every Interactive Data File required to be submitted pursuant to Rule 405 of Regulation S-T (§232.405 of this chapter) during the preceding 12 months (or for such shorter period that the registrant was required to submit such files). Yes x No ¨
Indicate by check mark whether the registrant is a large accelerated filer, an accelerated filer, a non-accelerated filer, a smaller reporting company or an emerging growth company. See the definitions of “large accelerated filer,” “accelerated filer” and “smaller reporting company”, and "emerging growth company" in Rule 12b-2 of the Exchange Act.
| | | | | | | | | | | | | | |
| Large accelerated filer | x | | Accelerated filer | ☐ |
| | | |
| Non-accelerated filer | ☐ | | Smaller reporting company | ☐ |
| | | | |
| | | Emerging growth company | ☐ |
If an emerging growth company, indicate by check mark if the registrant has elected not to use the extended transition period for complying with any new or revised financial accounting standards provided pursuant to Section 13(a) of the Exchange Act. ¨
Indicate by check mark whether the registrant has filed a report on and attestation to its management’s assessment of
the effectiveness of its internal control over financial reporting under Section 404(b) of the Sarbanes-Oxley Act (15 U.S.C.
7262(b)) by the registered public accounting firm that prepared or issued its audit report. x
Indicate by check mark whether the registrant is a shell company (as defined in Rule 12b-2 of the Act). Yes ☐ No x
As of June 30, 2021, the aggregate market value of Common Stock held by non-affiliates was $2,309,771,496.
As of January 31, 2022, 50,318,773 shares of Common Stock of the registrant were issued and outstanding.
______________________________________
Documents Incorporated By Reference
All or a portion of Items 10 through 14 in Part III of this Form 10-K are incorporated by reference to the Registrant’s definitive proxy statement on Schedule 14A, which will be filed within 120 days after the close of the fiscal year covered by this report on Form 10-K, or if the Registrant’s Schedule 14A is not filed within such period, will be included in an amendment to this Report on Form 10-K which will be filed within such 120 day period.
TABLE OF CONTENTS
| | | | | | | | |
| | Page |
| PART I | | |
| ITEM 1. | | |
| ITEM 1A. | | |
| ITEM 1B. | | |
| ITEM 2. | | |
| ITEM 3. | | |
| ITEM 4. | | |
| |
| PART II | |
| ITEM 5. | | |
| ITEM 6. | | |
| ITEM 7. | | |
| ITEM 7A. | | |
| ITEM 8. | | |
| ITEM 9. | | |
| ITEM 9A. | | |
| ITEM 9B. | | |
| ITEM 9C. | | |
| |
| PART III | |
| ITEM 10. | | |
| ITEM 11. | | |
| ITEM 12. | | |
| ITEM 13. | | |
| ITEM 14. | | |
| |
| PART IV | |
| ITEM 15. | | |
| ITEM 16. | | |
Cautionary Statement Regarding Forward-Looking Information
This annual report on Form 10-K contains, in addition to historical information, certain forward-looking statements within the meaning of the Private Securities Litigation Reform Act of 1995. All statements other than statements of historical facts contained in this report, including statements regarding our future results of operations and financial position, strategy and plans, and our expectations for future operations, are forward-looking statements. The words “believe,” “may,” “will,” “would,” “might,” “could,” “estimate,” “continue,” “anticipate,” “design,” “intend,” “plan,” “seek,” “potential,” “expect” and similar expressions are intended to identify forward-looking statements. We have based these forward-looking statements largely on our current expectations and projections about future events and trends that we believe may affect our financial condition, results of operations, strategy, short-term and long-term business operations and objectives, and financial needs. Forward-looking statements include, but are not limited to, statements about:
•our business plans and strategies, including, but not limited to, our downstream objectives and undertakings, and the proposed capacity expansion of our Geismar, Louisiana biorefinery, including financing such expansion;
•our financial performance, including expectations regarding revenues, cost of revenues and operating expenses;
•changes in governmental programs, policymaking and requirements or encouraged use of biofuels, including
Biodiesel Mixture Excise Tax Credit, Renewable Fuels Standard 2 ("RFS2") in the United States, renewable fuel policies in Canada and Europe, and state level programs such as California's Low Carbon Fuel Standard;
•the availability, future price and volatility of feedstocks and other inputs;
•the expansion of our distribution network and transportation costs;
•the future price and volatility of petroleum;
•our liquidity and working capital requirements;
•our leasing practices;
•anticipated trends and challenges in our business and competition in the markets in which we operate;
•our ability to successfully implement our acquisition strategy and integration strategy;
•our ability to protect proprietary technology and trade secrets;
•our risk management activities;
•the industry's capacity, production and imports;
•product performance, in cold weather or otherwise;
•seasonal fluctuations in our business;
•our current products as well as products we are developing;
•our ability to retain and recruit key personnel;
•our current and future indebtedness and our compliance, or failure to comply, with restrictive and financial covenants in our various debt agreements;
•our marketable securities;
•critical accounting policies and estimates, the impact or anticipated impact of recent accounting pronouncements, guidance or changes in accounting principles and future recognition of impairments for the fair value of assets, including goodwill, financial instruments, intangible assets and other assets acquired;
•operating risks and the impact of disruptions to our business including, but not limited to, closures at our plant located in Geismar, Louisiana and the COVID-19 pandemic, including any potential resurgence of COVID-19 such as from the Delta and Omicron variant; and
•assumptions underlying or relating to any of the foregoing.
These statements reflect current views with respect to future events and are based on assumptions and subject to risks and uncertainties. We note that a variety of factors, including but not limited to those Risk Factors discussed in Item 1A, could cause actual results and experience to differ materially from the anticipated results or expectations expressed in our forward-looking statements. Given these uncertainties, you should not place undue reliance on these forward-looking statements.
Forward-looking statements contained in this report present management’s views only as of the date of this report. We undertake no obligation to publicly update forward-looking statements, whether as a result of new information, future events or otherwise. You are advised, however, to consult any further disclosures we make on related subjects in our 10-Q and 8-K reports filed with the Securities and Exchange Commission after the date hereof.
Summary Risk Factors
Our business is subject to numerous risks and uncertainties that could affect our ability to successfully implement our business strategy and affect our financial results. You should carefully consider all of the information in this report and, in particular, the following principal risks and all of the other specific factors described in Item 1A. of this report, "Risk Factors," before deciding whether to invest in our company.
•The Renewable Fuel Standard Program, a federal law requiring the consumption of qualifying biofuels, could be repealed, curtailed or otherwise changed, which would have a material adverse effect on our revenues, operating margins and financial condition.
•Loss of or reductions in federal and state government tax incentives for bio-based diesel production or consumption may have a material adverse effect on our revenues and operating margins.
•We derive a significant portion of our revenues from sales of our renewable fuel in the State of California primarily as a result of California's Low Carbon Fuel Standard, ("LCFS"); adverse changes in this law or reductions in the value of LCFS credits would harm our revenues and profits.
•We derive a significant portion of our revenues from sales of our renewable fuel in Canada and Europe; adverse changes in the programs requiring the use of renewable and lower carbon fuels or reductions in the value of credits would harm our revenues and profits.
•The COVID-19 pandemic may adversely impact our business.
•We derive a substantial portion of our profitability from the production of renewable diesel ("RD") at our plant in Geismar, Louisiana and any interruption in our operations would have a material adverse effect on operations and financial conditions.
•Our planned capacity expansion at our Geismar, Louisiana facility will require significant capital expenditures and there is no guarantee that the project will be completed on time or on budget, which could have a negative effect on revenues and operations.
•Increased industry-wide production of biodiesel due to potential utilization of existing excess production capacity, announced plant expansions of RD and potential co-processing of RD by petroleum refiners, could reduce prices for our fuel and increase costs of feedstocks, which would seriously harm our revenues and operations.
•Our gross margins are dependent on the spread between bio-based diesel prices and feedstock costs, each of which are volatile and can cause our results of operations to fluctuate substantially.
•Risk management transactions could significantly increase our operating costs and may not be effective.
•One customer accounted for a meaningful percentage of revenues and a loss of this customer could have an adverse impact on our total revenues.
•Our facilities and our business, and our customers' facilities, are subject to risks associated with fire, explosions, leaks, natural disasters, including climate change, and political turmoil, which may disrupt our business and increase costs and liabilities.
•Cyberattacks targeting our process control networks or other digital infrastructure could have a material adverse impact on our business and results of operations.
•In addition to biodiesel and RD, we store and transport petroleum-based fuels. The dangers inherent in the storage and transportation of fuels could cause disruptions in our operations and could expose us to potentially significant losses, costs or liabilities.
•Our insurance may not protect us against our business and operating risks.
•We operate in a highly competitive industry and expect that competition in our industry will increase.
•We are dependent upon one supplier to provide hydrogen necessary to execute our RD production process and the loss of this supplier could disrupt our production process.
•Technological advances and changes in production methods in the bio-based diesel industry could render our plants obsolete and adversely affect our ability to compete.
•Our intellectual property is integral to our business. If we are unable to protect our intellectual property, or others assert that our operations violate their intellectual property, our business could be adversely affected.
•Increases in transportation costs or disruptions in transportation services could have a material adverse effect on our business.
•We are dependent upon our key management personnel and other personnel, and the loss of these personnel could adversely affect our business and results of operations.
•We may encounter difficulties in integrating the businesses we acquire, including our international businesses where we have limited operating history.
•We incur significant expenses to maintain and upgrade our operating equipment and plants, and any interruption in the operation of our facilities may harm our operating performance.
•Growth in the use, sale and distribution of biodiesel is dependent on the expansion of related infrastructure which may not occur on a timely basis, if at all, and our operations could be adversely affected by infrastructure limitations or disruptions.
•Our business is subject to seasonal changes based on regulatory factors and weather conditions and this seasonality could cause our revenues and operating results to fluctuate.
•Failure to comply with governmental and state regulations, including EPA requirements relating to RFS2, BTC, LCFS and other programs or new laws designed to deal with climate change, could result in the imposition of higher costs, penalties, fines, or restrictions on our operations and remedial liabilities.
•RD fuel is superior to biodiesel in certain respects and if RD production capacity increases to a sufficient extent, it could largely supplant biodiesel; we may not be successful in expanding our RD production capacity.
•Nitrogen oxide emissions from biodiesel may harm its appeal as a renewable fuel and increase costs.
•We and certain subsidiaries have indebtedness, which subjects us to potential defaults, that could adversely affect our ability to raise additional capital to fund our operations and limits our ability to react to changes in the economy or the bio-based diesel industry.
•Our debt agreements impose significant operating and financial restrictions on our subsidiaries, which may prevent us from capitalizing on business opportunities.
•We may still incur significant additional indebtedness that could increase the risks associated with our indebtedness.
•Certain provisions in the indenture governing our Senior Secured Green Notes (the "Green Notes") could delay or prevent an otherwise beneficial takeover or takeover attempt of us.
•The market price for our common stock may be volatile.
•We have never paid dividends on our capital stock and we do not anticipate paying dividends in the foreseeable future.
•We may issue additional common stock as consideration for future investments or acquisitions.
•If we fail to maintain effective internal control over our financial reporting and financial forecasting, we may not be able to report our financial results accurately, provide accurate financial guidance or prevent fraud, and if we fail to maintain effective internal governance and conduct policies, such as our Code of Business Conduct and Ethics, Code of Ethics for Senior Financial Officers and Trading by Insiders Policy, or if our employees fail to adhere to such policies, we may be unable to maintain a proper control environment. If any of these failures occur, our business could be harmed, our stockholders could lose confidence in our financial reporting and financial guidance or our business integrity and we could suffer negative media attention, which could negatively impact the value of our stock.
•Delaware law and our certificate of incorporation and bylaws contain anti-takeover provisions that could delay or discourage takeover attempts that stockholders may consider favorable.
•The proposed merger is subject to approval of our stockholders as well as the satisfaction of other closing conditions, including government consents and approvals, some or all of which may not be satisfied or completed within the expected timeframe, if at all.
•We may not complete the proposed merger within the time frame we anticipate or at all, which could have an adverse effect on our business, financial results and/or operations.
•We will be subject to various uncertainties while the merger is pending that may cause disruption and may make it more difficult to maintain relationships with customers and other third-party business partners.
•In certain instances, the merger agreement requires us to pay a termination fee to parent, which could affect the decisions of a third party considering making an alternative acquisition proposal.
•We have incurred, and will continue to incur, direct and indirect costs as a result of the merger.
•Litigation challenging the Merger Agreement may prevent the Merger from being consummated within the expected timeframe or at all.
PART I
ITEM 1. Business
General
We are one of North America's largest producers of advanced biofuels focused on providing cleaner, lower carbon transportation fuels. We utilize a nationwide production, distribution and logistics system as part of an integrated value chain model designed to convert natural fats, oils and greases into advanced biofuels. During 2021, we sold 621 million total gallons of fuel (including biofuel and petroleum fuel purchased from third parties for resale) and generated revenues of over $3 billion. We believe our fully integrated approach, which includes acquiring feedstock, operating biorefineries, distributing fuel through a network of terminals, and managing biorefinery facility construction and upgrades, positions us to serve the growing market for cleaner transportation fuels.
In addition to our acquisition of Keck Energy in September 2018, we opened our first REG branded fueling station in July 2019 adjacent to our biorefinery in Seneca, Illinois to serve a variety of customers from trucking fleets to local diesel vehicle owners. In June 2020, we entered into an agreement with a third party pursuant to which it agreed to exclusively sell REG branded fuels at certain of its cardlock locations. In October 2021, we entered into a long-term agreement with GoodFuels, a leading supplier of sustainable marine biofuels and global producer and supplier of renewable fuels, for the supply and development of sustainable marine biofuel solutions for the global shipping industry. In November 2021, we entered into a partnership with Canadian Northern Railway to test bio and RD blends for their locomotive fleet. In December 2021, we acquired Amber Resources, a California-based distributor of bio-based diesel, petroleum diesel and lubricants. This acquisition enables us to access a larger network of end customers. These are part of our downstream strategy, which is focused on three important objectives: margin expansion across the value chain, including by directing production to the most profitable geographies; realization of higher biodiesel values through blends of biodiesel into petroleum and RD; and increased demand for our biodiesel via sales of B100 to end customers.
In October 2020, we announced our plan to expand the effective capacity of our Geismar, Louisiana biorefinery. The Geismar project involves both an improvement project for the existing operating at the site, as well as the capacity expansion. The Geismar project is expected to take total annual site production from 90 million to 340 million gallons, enhance existing operations and improve operational reliability and logistics. The expansion is expected to be mechanically complete in 2023 with full operations in early 2024. We have received all required permits to proceed with construction and officially broke ground to start the construction process in the fourth quarter of 2021. The capital cost for the Geismar project is estimated to be $950 million and is funded with a combination of cash on hand, marketable securities, borrowings under our credit facilities, and proceeds from our public offering of common stock that closed March 19, 2021 and proceeds from our issuance of Green Notes that closed on May 20, 2021, as discussed below. In addition, in connection with the expansion we have entered into a long-term marine terminal lease for terminal and logistics services that will require a separate capital outlay. We have also agreed to construction contracts for large parts of the work associated with the improvements and expansion. There can be no guarantee that we will be able to complete this project in a timely manner or increase the capacity of our biorefinery at Geismar, Louisiana on time, at our estimated budget, or at all. The improvements and expansion are subject to a number of conditions and risks.
On March 19, 2021, we completed an equity offering pursuant to which we sold 5,750,000 shares of common stock to various underwriters at a price of $67.00 per share before underwriting discounts and commissions. The net proceeds from the offering were $365.3 million. We currently intend to use the net proceeds from this offering for working capital and other general corporate purposes, which may include the repayment of our existing indebtedness and the funding of capital expenditures, including capital expenditures related to the Geismar project.
On May 20, 2021, we completed the sale and issuance of $550.0 million aggregate principal amount of our 5.875% Senior Secured Green Note due 2028. We recorded $14.6 million in legal, professional and underwriting fees related to the issuance of the Green Notes. We currently intend to use the net proceeds from this offering for capital expenditures related to the Geismar project.
We believe that the execution of these strategies will enable us to expand our margins, diversify sources of profitability, manage our business through varying market conditions, and increase shareholder value. To help promote these strategies in an environmentally and socially responsible manner, we have integrated environmental, social and governance ("ESG") practices into our business objectives. The process of implementing these ESG practices into our business was collaborative and involved our employees in an effort to maintain our values of safety, integrity, humanity, and driving results the REG way, which seeks to allow us to create a cleaner world and reduce our carbon footprint now and for the future.
Plant Network and Products
In September 2021, we announced the closure of the Houston, Texas biorefinery. Production at this facility ceased in November 2021. We currently own and operate a network of 11 biorefineries. Nine biorefineries are located in the United States and two in Germany. Ten biorefineries produce biodiesel and one produces RD. Our eleven bio-based diesel production facilities have an aggregate nameplate production capacity of 470 million gallons per year ("mmgy").
We own and operate the following facilities in North America and internationally:
| | | | | | | | | | | | | | | | | | | | | | | | | | | | | | | | |
| Property | | Nameplate1 Production Capacity (mmgy) | | Effective Capacity 2 (mmgy) | | REG
Operations
Commenced | | Feedstock Capability | | Use |
| | | | | | | | | | |
Ralston, Iowa 3 | | 30 | | 49 | | 2002 | | Refined Oils and Fats | | Biodiesel production |
Albert Lea, Minnesota 3 | | 30 | | 46 | | 2005 | | Crude, High FFA and Refined Oils and Fats | | Biodiesel production |
Newton, Iowa 3 | | 30 | | 40 | | 2007 | | Crude, High FFA and Refined
Oils and Fats | | Biodiesel production |
Houston, Texas 5 | | 35 | | 53 | | 2008 | | Refined Oils and Fats | | Biodiesel production |
Danville, Illinois 3 | | 45 | | 50 | | 2009 | | Crude, High FFA and Refined
Oils and Fats | | Biodiesel production |
Seneca, Illinois 3 | | 60 | | 80 | | 2010 | | Crude, High FFA and Refined
Oils and Fats | | Biodiesel production |
| | | | | | | | | | |
Mason City, Iowa 3 | | 30 | | 39 | | 2013 | | Crude, High FFA and Refined
Oils and Fats | | Biodiesel production |
Geismar, Louisiana 3,4 | | 75 | | 100 | | 2014 | | Crude, High FFA and Refined
Oils and Fats | | RD production |
| | | | | | | | | | |
Grays Harbor, Washington 3 | | 100 | | 109 | | 2015 | | Refined Oils and Fats | | Biodiesel production |
Madison, Wisconsin 3 | | 20 | | 28 | | 2016 | | Crude, High FFA and Refined
Oils and Fats | | Biodiesel production |
Emden, Germany 3 | | 27 | | 33 | | 2016 | | Crude, High FFA and Refined Oils and Fats | | Biodiesel production |
Oeding, Germany 3 | | 23 | | 25 | | 2016 | | Crude, High FFA and Refined Oils and Fats | | Biodiesel production |
| Total | | 505 | | 652 | | | | | | |
1The nameplate capacity listed above is based on original plant design.
2Effective capacity represents the maximum average throughput that satisfies certain defined technical constraints.
3REG owns this plant and related property and equipment.
4This facility produces RD, naphtha, and liquid petroleum gas.
5We announced the closure of this facility in September 2021 and production ceased in November 2021.
We maintain a testing laboratory at our corporate headquarters in Ames, Iowa, for testing various feedstocks for conversion into bio-based diesel and various new manufacturing processes to produce bio-based diesel. We also have a regional office in Tulsa, Oklahoma, focused on maintaining and developing advanced biofuel technologies. In 2021, we partnered with Iowa State University to create a hydrotreater pilot plant to understand how various biomass feedstocks can play a role in the production of renewable fuels with a specific focus on RD. The plant's research will support our Geismar RD plant by helping to evaluate new low-carbon feedstocks and optimize production of RD and sustainable aviation fuel. In December 2021, we acquired Amber Resources, one of the leading fuel distributors in Southern California. This acquisition does not include real property, but includes leased locations to deliver fuel to end customers, further advancing our downstream strategy.
We produce RD at our Geismar, Louisiana facility. RD generally carries a premium price compared to biodiesel as a result of a variety of factors including the ability to blend it with petroleum diesel seamlessly, better cold weather performance, and because it generates more Renewable Identification Numbers ("RINs") on a per gallon basis. We announced in October 2020 our improvement and expansion of our Geismar, Louisiana facility which is expected to expand the effective capacity of the facility to 340 million gallons annually. We intend to continue to evaluate opportunities to further our ability to leverage our RD technology and expand RD production to meet the growing demand for cleaner transportation fuels.
Our products include biodiesel and RD produced at our facilities or from third parties, including RINs and LCFS credits, transportation, storage and insurance costs to the extent paid for by our customers; petroleum-based heating oil and ultra-low sulfur diesel, or ULSD, acquired from third parties, along with these petroleum-based products further blended with bio-based diesel; glycerin, and other co-products of the bio-based diesel production process. We believe our biodiesel and RD products further our ESG mission to create sustainable, clean energy, and creating value for society, ecosystem, employees, customers, and shareholders. In addition, our products include operations management services that we provide for bio-based diesel production facilities, typically based on production rates of the managed facility; and services performed by us in our role as general contractor and construction manager for upgrades and repairs to our bio-based diesel production facilities.
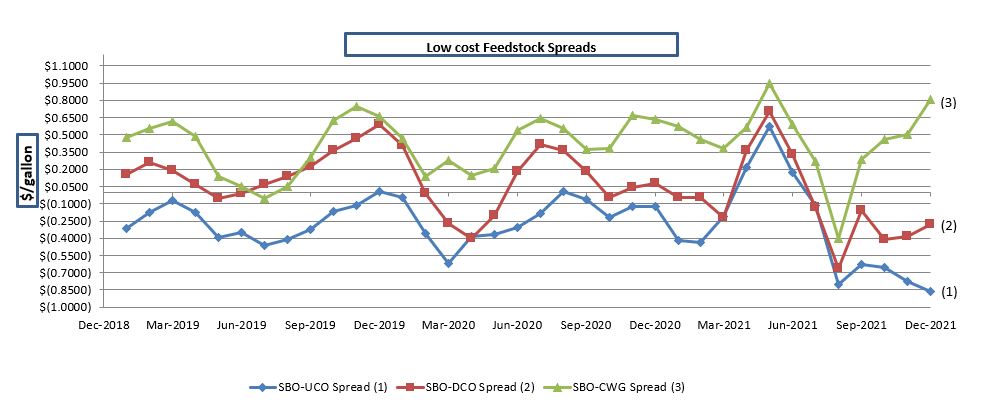
Our Feedstocks and Other Inputs
We are a lower carbon bio-based diesel producer. We primarily produce our bio-based diesel from a wide variety of low carbon feedstocks, including distillers corn oil, used cooking oil and inedible animal fat. We also produce bio-based diesel from virgin vegetable oils, such as soybean oil or canola oil, which tend to be higher in price. We believe our ability to process a wide variety of feedstocks in most of our facilities provides us with a cost advantage over many bio-based diesel producers, particularly those relying primarily on higher cost virgin vegetable oils.
We can adjust our processing in most of our facilities to accommodate different feedstocks and feedstock mixes. Our ability to use a wide range of feedstocks gives us a feedstock cost advantage over many other producers because we have the flexibility to respond to changes in feedstock pricing. In 2021, approximately 78% of our total feedstock usage was distillers corn oil, used cooking oil or rendered animal fat feedstock. The remaining approximately 22% consisted of refined vegetable oils, such as soybean oil or canola oil.
We source our feedstocks from numerous vendors both domestically and internationally in quantities ranging from truckload to railcar to marine vessel. There is no established futures market for the low carbon feedstocks that we utilize. Distillers corn oil is typically purchased on fixed priced contracts in forward positions of one to three months and occasionally longer. We generally purchase used cooking oil and rendered animal fats on one to four week forward positions using fixed pricing or an indexed price compared to a published index such as USDA reports or recognized industry price reports such as The Jacobsen. Soybean and canola oils can be purchased on a spot or forward contract basis from several suppliers and pricing for these vegetable oils is compared to the broadly traded Soybean Oil Futures market on the Chicago Mercantile Exchange.
From time to time, we work with developers of next generation feedstocks, such as algae and camelina, to assist them in bringing these new feedstocks to market. We have converted several of these feedstocks, as well as other second generation feedstocks, into high quality bio-based diesel in our laboratory and production facilities. We believe we are well positioned to incorporate many new feedstocks into our production process as they become commercially available.
We source methanol and chemical catalysts used in our production process such as sodium methylate and hydrochloric acid, under fixed-price contracts and formula-indexed contracts based upon competitive bidding. These sourcing contracts typically last from three months to five years. The price of methanol is indexed to the monthly reported published price. We also enter into a long-term supply agreement with a supplier to source hydrogen necessary for our RD production.
Risk Management
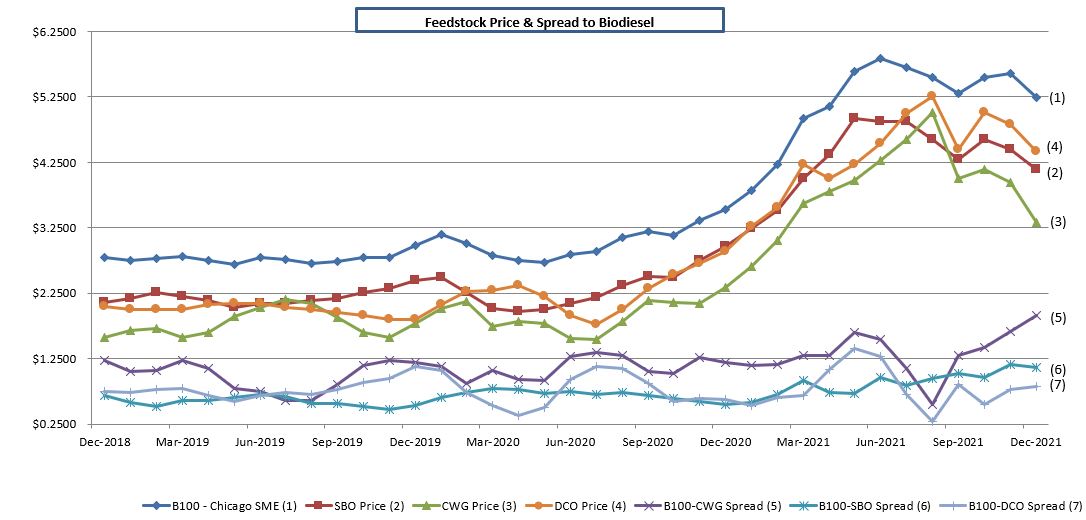
The prices for feedstocks and bio-based diesel, including the value associated with government incentives, can be volatile and are not always closely correlated. Low carbon feedstocks are particularly difficult to risk manage given that such feedstocks are not traded in any public futures market. To manage feedstock and bio-based diesel price risks, we utilize forward contracting, hedging and other risk management strategies, including the use of futures, swaps, options and over-the-counter products.
In establishing our risk management strategies, we draw from our own in-house risk management expertise and consult with industry experts. We utilize research conducted by outside firms to provide additional market information and risk management strategies. We believe combining these sources of knowledge, experience and expertise expands our view of the fluctuating commodity markets for raw materials and energy to improve our risk management strategies.
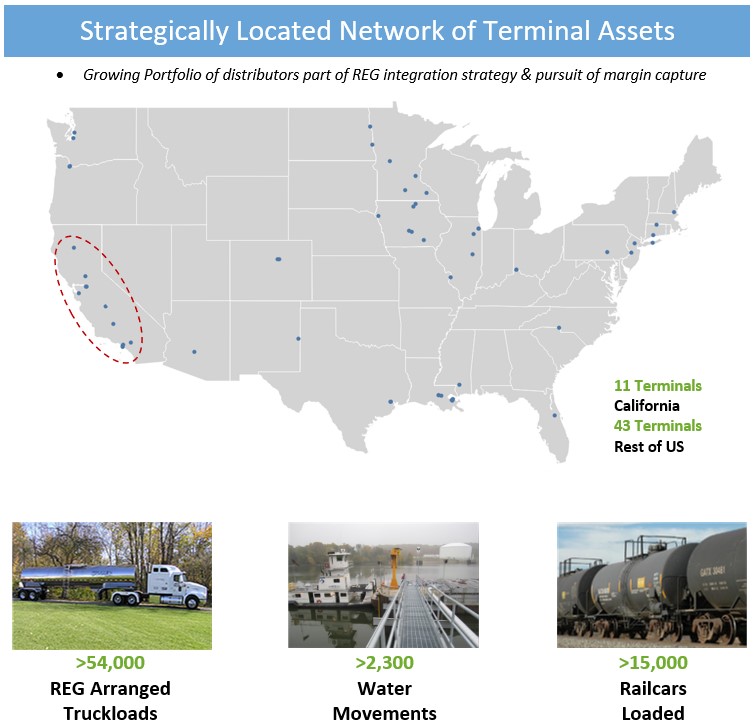
Distribution
We have established a national distribution system to supply bio-based diesel throughout the United States. Each of our bio-based diesel facilities is equipped with an on-site rail loading system, a truck loading system, or both. Our Seneca biorefinery near the Illinois River has direct barge access for supplying customers using the inland waterways system. Our Grays Harbor biorefinery has deep-water capability for PANAMAX class vessels. We also manage some customers’ bio-based diesel storage tanks and replenishment process. Our distribution performance for 2021 in North America is depicted below.
Not pictured above are 8 fuel distribution locations including 3 cardlock locations, acquired as part of the Amber Resources acquisition, located in Southern California.
In addition to our U.S. operations noted above, we have established an international distribution system to supply bio-based diesel throughout Europe. Our products that are produced in Europe and in the United States are distributed to European customers using sea vessels, barges and trucks. Our Emden biorefinery has deep-water capabilities and can load vessels, barges and trucks. Our Oeding biorefinery can only load and unload trucks. We also have storage facilities in the Amsterdam-Rotterdam-Antwerp region, which allows us to distribute our products efficiently.
As of December 31, 2021, we leased over 1,525 railcars for transportation and leased bio-based diesel storage tanks in 47 terminals in North America and two terminals internationally. In general, the terminals in North America where we lease our bio-based diesel storage tanks are largely chemical product and petroleum fuel terminals so that fuel distributors and other bio-based diesel customers can create a bio-based diesel blend at the terminal before further distribution. Terminal contracts typically have one-to three-year terms and are generally renewable subject to certain terms and conditions. During 2021, REG sold products in 44 states and D.C. in the United States, six Canadian Provinces, and nineteen other countries around the world.
We sell heating oil and ultra-low sulfur diesel ("ULSD") at terminals throughout the northeastern United States. We sell additional biofuel blends at terminal locations in the Midwest, West Coast and Texas. We continue to look for terminal expansion and optimization opportunities across North America.
Government Programs Favoring Bio-Based Diesel Production and Use
The bio-based diesel industry benefits from numerous federal and state government programs.
Renewable Fuel Standard
Bio-based diesel has historically been more expensive to produce than petroleum-based diesel. The bio-based diesel industry's growth has largely been the result of federal and state programs that require or incentivize production and use of bio-based diesel, which allows bio-based diesel to be priced competitively with petroleum-based diesel.
The RFS2 bio-based diesel requirement became effective in 2010, requiring for the first time that a certain percentage of the gasoline and diesel fuel consumed in the United States be made from renewable sources. The bio-based diesel requirement can be satisfied by two primary fuels, biodiesel and RD. Required volumes under the RFS2 program, referred to as the renewable volume obligation ("RVO"), are determined by the U.S. Environmental Protection Agency, or EPA. The final and proposed RVO targets for the bio-based diesel and advanced biofuels volumes for the years 2018 to 2022, respectively, as set by the EPA are as follows:
| | | | | | | | | | | | | | | | | | |
| | 2018 | 2019 | 2020 | 2021 | 2022 |
| Bio-based diesel | | 2.10 billion gallons | 2.10 billion gallons | 2.43 billion gallons | 2.43 billion gallons | 2.76 billion gallons** |
| Total advanced biofuels | | 4.29 billion RINs* | 4.92 billion RINs* | 4.63 billion RINs*, ** | 5.20 billion RINs*, ** | 5.77 billion RINs*, ** |
*Ethanol equivalent gallons
** Proposed
The bio-based diesel requirement is one of four separate renewable fuel requirements under RFS2. The RFS2 requirements are based on two primary categories and two subcategories. The two primary categories are conventional renewable fuel, which is primarily satisfied by corn ethanol, and advanced biofuel, which is defined as a biofuel that reduces lifecycle greenhouse gas emissions by at least 50% compared to the petroleum-based fuel the biofuel is replacing. The advanced biofuel category has two subcategories, cellulosic biofuel, to be satisfied by newly developed cellulosic biofuels, such as ethanol made from woody biomass, and bio-based diesel, which is satisfied by biodiesel and RD. RFS2’s total advanced biofuel requirement is larger than the combined cellulosic fuel and bio-based diesel requirements, thus requiring the use of additional volumes of advanced biofuels.
The RFS2 requirement for advanced biofuels can be satisfied by any advanced biofuel, including biodiesel, RD, renewable jet fuel or better known as sustainable aviation fuel ("SAF"), biogas used in transportation, biobutanol, cellulosic ethanol or sugarcane-based ethanol, so long as it meets the 50% greenhouse gas reduction requirement.
The advanced biofuel RVO is expressed in terms of ethanol equivalent volumes, or EEV, which is based on the fuel’s renewable content and energy content compared to ethanol. Biodiesel has an EEV of 1.5 and RD typically has an EEV of 1.7, compared to 1.0 for sugarcane-based ethanol. Accordingly, it requires less bio-based diesel than sugarcane-based ethanol to meet the required volumes as each gallon of bio-based diesel counts as more gallons for purposes of fulfilling the advanced biofuel RVO, providing an incentive for refiners and importers to purchase bio-based diesel to meet their advanced biofuel RVO.
The RFS2 volume requirements apply to petroleum refiners and petroleum fuel importers in the 48 contiguous states and Hawaii, who are defined as “Obligated Parties” in the RFS2 regulations. Obligated Parties are required to incorporate into their petroleum-based fuel a certain percentage of renewable fuel or purchase credits in the form of RINs from those who do.
An Obligated Party’s RVO is based on the volume of petroleum-based gasoline and diesel fuel they produce or import. The largest U.S. petroleum refining companies, such as British Petroleum, Chevron, Citgo, ExxonMobil, Holly Frontier, Marathon, Motiva, PBF, Phillips 66, Shell, and Valero, represent the majority of the total RVO, with the remainder made up of smaller refiners and importers.
Renewable Identification Numbers
The EPA created the RIN system to track renewable fuel production and compliance with the renewable fuel standard. EPA registered producers of renewable fuel may generate RINs for each gallon of renewable fuel they produce. In the case of bio-based diesel, generally 1.5 to 1.7 bio-based diesel RINs may be generated for each gallon of bio-based diesel produced, based upon the fuel's renewable energy content. Renewable fuel, including bio-based diesel, can then be sold with associated RINs attached. RINs may also be separated from the gallons of renewable fuel they represent and once separated they may be sold as a separate commodity. RINs are ultimately used by Obligated Parties to demonstrate compliance with RFS2. Obligated Parties must obtain and retire the required number of RINs to satisfy their RVO during a particular compliance period. An Obligated Party can obtain RINs by buying renewable fuels with RINs attached, buying RINs that have been separated, or producing renewable fuels and generating RINs themselves. All RIN activity under RFS2 must be entered into the EPA’s moderated transaction system, which tracks RIN generation, transfer and retirement. RINs are retired when used for compliance with the RFS2 requirements.
The value of RINs can significantly impact the price of bio-based diesel. In 2021, RIN prices as a percentage contribution to the daily average 100% pure biodiesel (B100) spot price, as reported by the Oil Pricing Information System, or OPIS, fluctuated significantly throughout the year and ranged from a low of $1.40 per gallon, or 37% of the average B100 spot price per gallon, in January to a high of $3.07 per gallon, or 50% of the average spot price, in June.
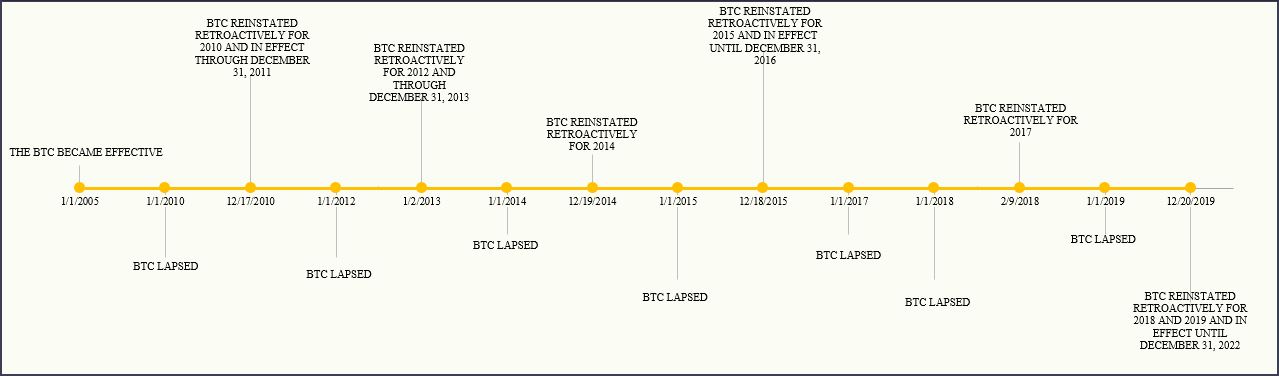
Biodiesel Tax Credit
The federal biodiesel mixture excise tax credit, or BTC, provides a $1.00 refundable tax credit per gallon to the first blender of bio-based diesel with petroleum-based diesel fuel. The BTC can then be credited against federal excise tax liability or the blender can obtain a cash refund from the U.S. Treasury for the value of the credit. The BTC was first implemented on January 1, 2005 and has been allowed to lapse multiple times before being retroactively reinstated, as described in the following table:
The BTC is an incentive shared across the advanced biofuel production and distribution chain through routine, daily trading and negotiation. In December 2019, the BTC was retroactively reinstated for 2018 and 2019, and made effective from January 2020 through December 2022.
California Low Carbon Fuel Standard Credits
In 2006, California passed the Global Warming Solutions Act or AB 32. The legislation established the California Low Carbon Fuel Standard, or LCFS, regulation, which is a rule designed to reduce greenhouse gas emissions associated with transportation fuels used in California. The regulation quantifies lifecycle greenhouse gas emissions by assigning a “carbon intensity” ("CI") score to each transportation fuel based on that fuel’s lifecycle assessment. Each petroleum fuel provider (generally the fuel’s producer or importer, or “regulated party”) is required to ensure that the overall CI score for its fuel pool meets the annual carbon intensity target for a given year. A regulated party’s fuel pool can include gasoline, diesel, and their blendstocks and substitutes.
We obtain carbon credits when we import and sell qualified bio-based diesel into California. During 2021, California LCFS carbon credits ranged from $142.00 per metric ton to $201.00 per metric ton, as reported by OPIS.
Oregon Clean Fuel Program
The Oregon Clean Fuel Program was launched in 2016 and requires a 10% reduction of the average carbon intensity of Oregon’s transportation fuels from 2015 levels by 2025. The baseline year for the program is 2015 and represents 10% ethanol blended with gasoline and 5% biodiesel blended with diesel. The Oregon Renewable Fuels Standard requires all gasoline sold in the state to be blended with 10% ethanol (E10). In addition, all diesel fuel sold in the state must be blended with at least 5% bio-based diesel. In March of 2020, the Oregon Governor issued an executive order to expand the Clean Fuel Program to achieve at least a 20% reduction from 2015 levels by 2030 and a 25% reduction by 2035. The executive order is currently in a rule making process, with a targeted effective date of January 1, 2023.
We obtain carbon credits when we import and sell qualified bio-based diesel in Oregon. During 2021, Oregon OCF carbon credits ranged from $121.50 per metric ton to $131.00 per metric ton, as reported by OPIS.
Other Government Programs
According to the U.S. Department of Energy, more than 40 states have implemented various programs that encourage the use of bio-based diesel through blending requirements as well as various tax incentives. The chart below summarizes some of the most significant programs.
| | | | | | | | |
| Government | | Program description |
| Canada | | The federal government has a nationwide requirement of 2% bio-based content in diesel. In addition a number of provinces in Canada have biofuel programs (British Columbia has an LCFS, Alberta, Saskatchewan, Manitoba and Ontario have usage requirements that exceed the federal standard). The federal government is currently engaged in the rulemaking process on a nationwide Clean Fuel Standard, which may incorporate a number of carbon reducing policies. |
| New York | | In 2019 New York passed the Community Leadership and Climate Protection Act (similar to California's AB 32) which establishes firm carbon reduction goals of 40% reductions by 2030 and 85% reductions in 2050. The state is currently undertaking a rulemaking which will establish an LCFS program for mobile source emissions and fixed source emissions.
In 2016, the City of New York adopted legislation requiring 5% bio-based diesel blends for heating oil starting on October 1, 2017 and the blend level then moves to 10% in 2025, 15% in 2030 and 20% in 2034. In 2021, the state legislature passed a state-wide biodiesel requirement for home heating oil starting with B5 in the fall of 2022 and ramping up to B10 in 2025 and B20 in 2030. Connecticut and Rhode Island have also passed requirements to use bio-based diesel in heating oil ramping up to B50 in 2035 and B50 in 2030, respectively. |
| Illinois | | Illinois offers a tax exemption from the generally applicable 6.25% sales tax on fuel for bio-based diesel blends that incentivizes blending at 11% bio-based diesel, or B11, through December 31, 2023. Illinois’ program has made that state one of the largest bio-based diesel markets in the country. |
| Iowa | | Iowa has a retailer’s incentive for blended fuel which has been modified over time. For 2018 through 2024, retailers earn $0.035 per gallon of 5%-10% biodiesel blends and $0.055 per gallons for 11% and above biodiesel blends. Iowa also has a bio-based diesel production incentive that provides $0.02 per gallon of production capped after the first 25 million gallons per production plant. Iowa also reduces the excise tax on fuel, by $0.024 per gallon for biodiesel blends of 11% and above. Legislation in Iowa has been introduced in the 2022 Iowa Legislature to increase the incentives in a number of areas. |
| Minnesota | | Minnesota law requires a 5% biodiesel blend except during the summer months (April - September) when a 20% blend is required. There is a two week step up from B5 to B10 in the first two weeks of April prior to the B20 requirement. |
| | |
| | |
| | |
| North Dakota | | North Dakota offers a $0.05 per gallon sales tax incentive for retailers who sell 5% and above biodiesel blends. |
| Pennsylvania | | Pennsylvania has adopted legislation requiring bio-based diesel blends beginning at 2% biodiesel blends with incremental increases, provided certain feedstock or production minimums are met. |
| Texas | | The bio-based diesel portion of bio-based diesel blends are exempt from Texas state excise tax, which results in a $0.20 per gallon incentive for 100% pure biodiesel. |
| Washington | | In 2021, the state legislature has passed and the governor signed a Clean Fuel Standard. That law sets targets similar to Oregon and California in carbon reduction. The state is currently engaged in a lengthy rulemaking with a goal of implementation in 2023. The City of Seattle has a heating oil tax exemption for the portion of heating oil that is biodiesel. |
| U.S. Municipalities | | Many cities across the United States have set targets to reduce greenhouse gas emissions. New York, Chicago, Atlanta and 34 other cities have set emissions reduction goals of 80 percent or higher by 2050. |
We believe that other government requirements for the use of biofuels increase demand for our bio-based diesel within such regions and they may help increase the overall demand in addition to the RFS2 requirements. We observe that existing demand for our biofuel from Obligated Parties in connection with federal requirements may shift to regions that have use requirements or tax incentive programs.
RED Program
In the European Union, or EU, the Renewable Energy Directive established a 10% target by 2020 for the use of renewable energy in the transport sector in EU member states. Given the existing limited market presence of alternative fuels or electromobility, the majority of the target has been realized through biofuels. In 2018, a revised Renewable Energy Directive, RED II, was established. RED II set a target of 14% renewables in transport and a 32% reduction of greenhouse gases, to be progressively achieved from 2021 until 2030. Biofuels produced from certain types of waste feedstocks, such as used cooking oil, benefit from extra incentives and so-called advanced feedstocks even get a specific sub-mandate. Additionally, RED II opens up new outlets such as marine fuels or renewable aviation fuels. In 2021, the EU Member States ratified RED II into national legislation. Since the adoption of RED II, the EU has introduced the “European Green Deal”, a package of new measures that are intended to align the EU's environmental goals with the Paris Accord objectives. This resulted in the proposal of a legislative package called "Fit for 55" (meaning 55% GHG reduction by 2030) increasing the target for overall renewables to 40%; the relevant legislative process is expected to be finalized in 2023.
Trends in Market Demand and Competitive Conditions
We face competition from producers and suppliers of petroleum-based diesel fuel, other bio-based diesel producers, marketers, traders and distributors. The size of the bio-based diesel industry is small compared to the size of the petroleum-based diesel fuel industry and large petroleum companies have greater resources than we do. Our principal competitive differentiators are bio-based diesel and RIN quality, supply reliability and price. In the United States, and Canadian bio-based diesel markets, we compete with independent bio-based diesel producers as well as large, multi-product companies that have greater resources than we do. Ag Processing Inc., Archer Daniels Midland Company, Cargill Incorporated, and Louis Dreyfus Commodities Group are major international agribusiness corporations and biodiesel producers with the financial, feedstock sourcing and marketing resources to be formidable competitors in the biodiesel industry. These agribusiness competitors tend to make biodiesel from virgin vegetable oils such as soybean or canola oil, which they produce as part of their integrated agribusinesses.
We also compete with several large and well capitalized producers of RD. Neste Corporation has approximately 882 million gallons of RD production capacity in Asia and Europe, a significant portion of which is imported into the United States. Neste has announced that it is in the process of expanding its RD production capacity in Singapore. Diamond Green Diesel, LLC, a joint venture between Valero Energy Corporation and Darling Ingredients Inc., operates a 275 mmgy capacity RD facility and their additional 400 mmgy plant is online as of December 2021. In January 2021, Valero Energy Corporation announced that it will build a 470-million-gal/year RD plant in Texas with joint venture partner Darling Ingredients. We also face the prospect that petroleum refiners will be increasingly competitive with us, either by converting oil refineries to produce RD or by co-processing renewable feedstock with crude oil. Several petroleum refiners in the United States have effected conversions of their facilities from crude oil to renewables in the past year including Phillips 66, Holly Frontier, Marathon, Exxon, and Shell. Some of the largest refiners have started co-processing renewable feedstocks or have announced plans to do so. If refinery conversions accelerate or if co-processing expands significantly, the competition we face could increase significantly.
We also face competition in the bio-based diesel RIN compliance market from producers of RD and in the advanced biofuel RIN compliance market from producers of other advanced biofuels, such as Brazilian sugarcane ethanol producers and producers of biogas used in transportation. Competition from imported biodiesel changed significantly in 2018, when the International Trade Commission and U.S. Department of Commerce imposed countervailing duties against unfairly subsidized biodiesel exports to the United States from Argentina and Indonesia. According to the U.S. Energy Information Administration data, RD imports from Singapore to the United States have maintained a steady rate. Imports from Singapore totaled 252 million gallons in 2019, 280 million gallons in 2020 and 371 million gallons through November 30, 2021.
In our marketing and distribution operations, besides the integrated producers, we are also faced with competition from bio-based diesel traders such as BP, Lincoln Energy, NGL, Shell, Vitol and others. The integrated producers and traders at times may have advantages because of logistics, feedstock accessibility and price, geographical location to customers, blending infrastructure, financial resources, and risk appetite. These same trading companies may have greater financial resources than we do and are able to take significant bio-based diesel positions in the marketplace. These competitors are often customers and/or suppliers of ours as well.
Seasonality
Our operating results and working capital needs are influenced by seasonal fluctuations in the price of and demand for biodiesel. Seasonal fluctuations may be based on both the weather and the status of both the BTC and RVO.
Demand may be higher in the quarters leading up to the expiration of the BTC as customers seek to purchase bio-based diesel when they can benefit from the agreed upon value sharing of the BTC with producers. This higher demand prompted by an expiring BTC has often resulted in reduced demand for biodiesel in the following quarter. In addition, RIN prices may also be subject to seasonal fluctuations. The RIN is dated for the calendar year in which it is generated. Since 20% of an Obligated Party's annual RVO can be satisfied by prior year RINs, most RINs must come from biofuel produced or imported during the RVO year. As a result, RIN prices can be expected to increase as the calendar year progresses if the RIN market is undersupplied compared to that year's RVO and decrease if it is oversupplied.
Seasonal fluctuation in our business also occurs in the colder months when historically there has been reduced demand for biodiesel in northern and eastern U.S. markets, which are some of the primary markets in which we operate. Biodiesel typically has a higher cloud point than petroleum-based diesel or RD. The cloud point is the temperature below which a fuel exhibits a noticeable cloudiness and eventually gels, leading to fuel handling and performance problems for customers and suppliers. Reduced demand in the winter for our higher cloud point biodiesel may result in excess supply of such higher cloud point biodiesel and lower prices for such higher cloud point biodiesel. To mitigate some of these seasonal fluctuations in demand, we have upgraded our Newton and Danville biorefineries to produce distilled biodiesel which improves cold-weather performance.
Government Regulations
Our manufacturing facilities, like other fuel and chemical production facilities, are subject to various federal, state and local environmental laws and regulations, including those relating to the discharge of materials into the air, water and ground; the generation, storage, handling, use, transportation and disposal of hazardous materials; ecological and natural resources; and the health and safety of our employees, contractors and the public. These laws and regulations require us to obtain and comply with numerous environmental and other regulatory permits to construct and operate each facility. They can require expensive pollution control equipment or operational changes to limit actual or potential impacts to human health and the environment. A violation of these laws, regulations or permit conditions could result in substantial fines, natural resource damage, criminal sanctions, permit revocations and or facility shutdowns. We do not currently have any environmental proceedings either pending or threatened against our facilities that would materially affect our business or financial condition. Furthermore, we do not anticipate a material adverse effect on our business or financial condition as a result of our efforts to comply with these requirements as presently in effect.
Human Capital
As of December 31, 2021, we had 1,093 employees located in the United States and 103 employees located internationally. None of our U.S. employees are represented by a labor organization or under any collective bargaining agreements.
We provide our employees with competitive salaries and bonuses, opportunities for equity ownership, development programs that enable continued learning and growth and an employment package intended to promote well-being across all aspects of their lives, including health care, retirement planning and paid time off. In addition, we regularly conduct an employee survey to gauge employee engagement and identify areas of focus. Since the onset of the COVID-19 pandemic, we have taken an integrated approach to helping our employees manage their work and personal responsibilities, with a strong focus on employee well-being, health and safety.
We believe that an equitable and inclusive environment with diverse teams is crucial to our efforts to attract and retain key talent and produces more creative solutions and innovative products and services. In 2021, we continued to implement and expand certain programs aimed at building an equitable and inclusive culture through a variety of diversity and inclusion initiatives.
Intellectual Property
We own a significant number of U.S. and international patents and expect to file additional patent applications as we continue to pursue innovations. We have also developed trade secrets to protect our know-how, and other proprietary information, including for example the sourcing and processing of low-cost feedstocks and production of renewable fuel products.
Executive Officers of the Registrant
Cynthia J. Warner, age 63, has served as our President and Chief Executive Officer since January 2019. Ms. Warner was Executive Vice President, Operations for Andeavor (formerly known as Tesoro Corporation) from August 2016 until Andeavor's acquisition by Marathon Petroleum Corporation in October 2018. Prior to that, Ms. Warner served as Andeavor's Executive Vice President, Strategy and Business Development, since October 2014. From 2012 to August 2014, Ms. Warner was Chairman and Chief Executive Officer of Sapphire Energy, Inc. and she continued to serve as Chairman through February 2015. From 2009 to 2011, Ms. Warner was President of Sapphire Energy. From 2007 to 2009, she was Group Vice President, Global Refining, at BP plc. Ms. Warner has served as a member of the Board of Directors of IDEX Corporation (NYSE: IEX) since February 2013 and of Sempra Energy since June 2019. She is also a member of the National Petroleum Council. Ms. Warner has a Bachelor of Engineering degree in Chemical Engineering from Vanderbilt University and an MBA from Illinois Institute of Technology.
R. Craig Bealmear, age 55, has served as our Chief Financial Officer since April 2021. Prior to joining REG, Mr. Bealmear served as a Principal at RCB Consulting, LLC since January 2021. Prior to that, Mr. Bealmear held several positions at BP plc (NYSE: BP) ("BP") since 2001. From March 2015 to December 2020, Mr. Bealmear served as Chief Financial Officer - North America Downstream at BP and from January 2013 to February 2015, Mr. Bealmear served as Deputy Chief Financial Officer; Refining and Marketing Segment at BP. Prior to that, Mr. Bealmear held numerous Finance, Strategy and Commercial roles with BP and Atlantic Richfield Corporation over a 30-year career in both the United States and United Kingdom. Mr. Bealmear received an M.B.A. from the Wharton School at the University of Pennsylvania and a B.A. in Business Administration from Bellarmine University.
Chad Stone, age 52, has served as our Senior Vice President, Commercial Performance, since December 2020, and served as Chief Financial Officer from August 2009 until December 2020. Prior to joining REG, from October 2007 to May 2009, he was a Director at Protiviti Inc., a global business consulting and internal audit firm. From August 1997 to September 2007, Mr. Stone served as Director with PricewaterhouseCoopers and he worked at Arthur Andersen from July 1992 to August 1997, departing as a manager. Mr. Stone was elected to the governing Board of the National Biodiesel Board in 2015 and has served as Chairman since November 2019. Previously, Mr. Stone served as Vice-Chairman from November 2018 to November 2019 and as Secretary from November 2016 to November 2018. Mr. Stone served on the Executive Board of the Iowa Biodiesel Board from September 2010 to September 2016, serving as Vice Chairman from 2014-2015. Since October 2015, Mr. Stone has served on the University of Iowa School of Management's Advisory Committee. Mr. Stone has over 20 years of experience in leading financing reporting, strategy, policy and compliance. Mr. Stone holds an M.B.A. with concentrations in finance, economics and accounting from the University of Chicago, Graduate School of Business and a B.B.A. in Accounting from the University of Iowa. He is also a Certified Public Accountant.
Eric M. Bowen, age 50, has served as our General Counsel and Corporate Secretary since April 2020. His title has recently changed to General Counsel, Corporate Secretary and Head of Strategy. Prior to becoming our General Counsel, Eric served as our Vice President, Corporate Business Development & Legal Affairs from January 2013 to April 2020, and led the REG Life Sciences business unit since January 2014 until the sale of the business unit in May of 2019. From June 2010 to January 2013, Mr. Bowen served as our Executive Director, Corporate Business Development and Legal Affairs. From 2005 to June 2010, Mr. Bowen was Founder, President and CEO of Tellurian Biodiesel, Inc., which was acquired by the Company. Prior to entering the biodiesel industry, Mr. Bowen practiced corporate and securities law in Silicon Valley. For 15 years, Mr. Bowen has been at the forefront of the development of the biodiesel and RD industries. Mr. Bowen was a founding member of the California Advanced Biofuels Alliance and served as the founding Chairman from 2007 to 2012. He also served as Chairman of the San Francisco Biodiesel Taskforce and as a member of the California LCFS Advisory Panel. Mr. Bowen has served as a member of the Board of Directors of a company in which REG has invested since November 2013. Mr. Bowen holds a J.D. from the University of California, Berkeley and a B.A. from the University of Oregon Honors College.
Recent Developments
Proposed Merger
On February 27, 2022, we entered into an Agreement and Plan of Merger (the “Merger Agreement”) with Chevron Corporation (“Parent”) and Cyclone Merger Sub Inc., a wholly owned subsidiary of Parent (“Merger Subsidiary” and together with Parent, “Buyer”). Pursuant to the terms and conditions set forth in the Merger Agreement, Merger Subsidiary will merge with and into REG (the “Merger”) with REG continuing as the surviving corporation of the Merger and as a wholly owned subsidiary of Parent. At the effective time of the Merger (the "Effective Time"), each share of our common stock that is issued and outstanding immediately prior to the Effective Time (other than shares to be cancelled pursuant to the Merger Agreement or shares of common stock held by holders who have made a valid demand for appraisal in accordance with Section 262 of the Delaware General Corporation Law), will be automatically converted into the right to receive $61.50 in cash, without interest (the “Merger Consideration”).
At the Effective Time, and as a result of the Merger:
•Each outstanding stock appreciation right with respect to a share of common stock (each, a “Company SAR”) will vest and be cancelled and converted into the right to receive a cash payment, less any applicable withholding taxes, equal to the product of (x) the excess, if any, of the Merger Consideration over the exercise price applicable to such Company SAR multiplied by (y) the number of shares of common stock subject to such Company SAR.
•Each outstanding restricted stock unit award that vests solely on the passage of time held by a Company non-employee director (each, a “Company Director RSU”) will vest and be cancelled and converted into the right to receive a cash payment, less any applicable withholding taxes, equal to the product of (x) the Merger Consideration multiplied by (y) the number of shares of common stock subject to such Company Director RSU.
•Each outstanding restricted stock unit award that vests solely on the passage of time and is not a Company Director RSU (each, a “Company Employee RSU”) to the extent vested immediately prior to the Effective Time will be cancelled and converted into the right to receive a cash payment, less any applicable withholding taxes, equal to the product of (x) the Merger Consideration multiplied by (y) the number of vested shares of common stock subject to such Company Employee RSU.
•Each outstanding Company Employee RSU Award to the extent unvested immediately prior to the Effective Time (each, an “Unvested Company Employee RSU Award”) and certain performance-based restricted stock unit awards set forth on a schedule to the Merger Agreement (the “Scheduled PSU Awards”) will be cancelled and converted into the
right to receive an amount in cash, less any applicable withholding taxes, equal to the product of (x) the Merger Consideration multiplied by (y) the number of shares of common stock subject to such Unvested Company Employee RSU Award or Scheduled PSU Award, as applicable (such converted award, an “Assumed RSU Award”). Each Assumed RSU Award will be subject to the vesting schedule applicable to the corresponding Unvested Company Employee RSU Award immediately prior to the Effective Time (including, with respect to the Scheduled PSU Awards, the performance vesting conditions).
•Except with respect to the Scheduled PSU Awards, each outstanding restricted stock unit award that corresponds to shares of common stock granted under any Company Benefit Plan and vests based on the achievement of performance goals (each, a “Company PSU Award”) will be cancelled and converted into the right to receive an amount in cash, without interest and less any applicable withholding taxes, equal to the product of (A) the Merger Consideration multiplied by (B) the number of shares of common stock subject to such Company PSU Award (assuming that any performance based vesting conditions applicable to such Company PSU Award for any performance period that has not been completed as of the Effective Time are achieved at (x) with respect to Company PSU Awards granted in 2020 and 2021, the greater of the target performance levels and the levels based on actual achievement of pro-rated performance goals through the Effective Time or (y) with respect to Company PSU Awards granted in 2022, the target performance levels) (each such converted award, an “Assumed PSU Award”). Each Assumed PSU Award will be subject to the vesting schedule applicable to the corresponding Company PSU Award immediately prior to the Effective Time (other than any performance based vesting conditions).
The closing of the Merger is subject to various conditions, including (i) the adoption of the Merger Agreement by holders of a majority of the issued and outstanding shares of our common stock; (ii) the expiration or termination of any applicable waiting period under the Hart-Scott-Rodino Antitrust Improvements Act of 1976, as amended (the "HSR Act") and clearance by the European Commission or expiration of any applicable waiting period, in each case under EU Regulation 139/2004 (the "EU Clearance"); (iii) the absence of any order or law prohibiting the consummation of the Merger, except if such order or law is immaterial to Parent and (iv) the accuracy of the representations and warranties contained in the Merger Agreement, subject to customary materiality qualifications, as of the date of the Merger Agreement and as of the closing of the Merger, and compliance in all material respects with the covenants and agreements contained in the Merger Agreement. In addition, the obligation of Parent and Merger Subsidiary to consummate the Merger is subject to the absence, since the date of the Merger Agreement, of a Company Material Adverse Effect (as defined in the Merger Agreement). The closing of the Merger is not subject to a financing condition. Under the terms of the Merger Agreement, consummation of the Merger will occur on the second business day following the fulfillment or waiver of the conditions to closing of the Merger or at such other time as REG and Parent agree.
Our Board of Directors and the board of directors of Merger Subsidiary have each approved the Merger and the Merger Agreement. If approved by our stockholders, we currently expect the Merger to close in the second half of 2022. Until the closing, we will continue to operate as an independent company.
The foregoing description of the Merger Agreement is qualified in its entirety by reference to the full text of the Merger Agreement, which has been filed as Exhibit 2.1 to the Current Report on Form 8-K that we filed with the SEC on February 28, 2022.
Available Information
Our internet address is http://www.regi.com. Through that address, our annual report on Form 10-K, quarterly reports on Form 10-Q, current reports on Form 8-K, and amendments to those reports are available free of charge as soon as reasonably practicable after they are filed with the U.S. Securities and Exchange Commission. The information contained on our website is not included in, or incorporated by reference into, this annual report on Form 10-K.
ITEM 1A. Risk Factors
Our business, financial condition, results of operations and liquidity are subject to various risks and uncertainties, including those described below. As a result, the trading price of our common stock could decline.
RISKS RELATED TO RENEWABLE FUEL AND LOW CARBON FUEL INCENTIVES
The Renewable Fuel Standard Program, a federal law requiring the consumption of qualifying biofuels, could be repealed, curtailed or otherwise changed, which would have a material adverse effect on our revenues, operating margins and financial condition.
We and other participants in the bio-based diesel industry rely on governmental programs requiring or incentivizing the consumption of biofuels. Bio-based diesel has historically been more expensive to produce than petroleum-based diesel fuel and these governmental programs support a market for bio-based diesel that might not otherwise exist.
One of the most important of these programs is the RFS2, a federal law that requires that transportation fuels in the United States contain a minimum amount of renewable fuel. This program is administered by the U.S. Environmental Protection Agency ("EPA"). The EPA's authority includes setting annual minimum aggregate levels of consumption in four renewable fuel categories, including the two primary categories in which our fuel competes bio-based diesel and advanced biofuel. The parties obligated to comply with this RVO are petroleum refiners and petroleum fuel importers.
The petroleum industry is strongly opposed to the RFS2 and can be expected to continue to press for changes both in the RFS2 itself and in the way that it is administered by the EPA. One key point of contention is the rate of growth in the annual RVO. The RVO for bio-based diesel was set at steadily rising levels beginning at 1.00 billion gallons in 2012 and increasing to 2.00 billion gallons in 2017. However, growth in the RVO for bio-based diesel was constrained in years 2017 through 2019, as the bio-based diesel RVO increased by only 100,000 gallons from 2.00 billion to 2.10 billion gallons while the advanced biofuel RVO increased from 4.28 billion gallons to 4.92 billion gallons. For 2020 and 2021, the EPA set the bio-based diesel RVO at 2.43 billion gallons. The 2020 advanced biofuel RVO was set at 4.63 billion gallons which represents zero growth in the advanced biofuels category after taking into account the increase in the cellulosic volumes. We believe that growth in the annual RVOs strongly influences our ability to grow our business and supports the price of our fuel through the RINs. The EPA's future decisions regarding the RVO will significantly influence our revenues and profit margins.
The RFS2 also grants to the EPA authority to waive a qualifying refiner's obligation to comply with RFS2, through a small refinery exemption ("SRE"), based on a determination that the program is causing severe economic harm to that refinery. SREs can significantly harm demand for bio-based diesel and the value of RINs. In December 2019, the EPA issued a ruling on the reallocation of the required volumes under RFS2 in an attempt to offset the effect of the SREs. The ruling detailed the intent to redistribute the exempt volumes granted through the SRE to non-exempt obligated parties. This redistribution will be calculated on a three-year rolling average, based on the U.S. Department of Energy ("DoE") recommended relief. The EPA has consistently granted more relief through small refinery waivers than recommended by the DoE.
The table below summarizes the small refinery waiver petitions requested, granted, denied or pending and the impacted volumes as of February 17, 2022, according to the EPA's website:
| | | | | | | | | | | | | | | | | | | | | | | | | | | | | | | | | | | |
| 2021 | | 2020 | | 2019 | | 2018 | | 2017 | | 2016 |
| Petitions received | 5 | | | 30 | | | 32 | | | 44 | | | 37 | | | 29 | |
| Petitions granted | — | | | — | | | — | | | 31 | | | 35 | | | 19 | |
| Petitions denied or withdrawn | — | | | — | | | 3 | | | 10 | | | 1 | | | 9 | |
| Petitions pending | 5 | | | 30 | | | 29 | | | 3 | | | 1 | | | 1 | |
| Estimated volume of fuel exempted (million gallons) | — | | | — | | | — | | | 13,420 | | | 17,050 | | | 7,841 | |
| Estimated Advanced Biofuel RVO Exempted (million RINs) | — | | | — | | | — | | | 1,430 | | | 1,820 | | | 790 | |
| Estimated Advanced Biofuel RVO Exempted (% of Advanced biofuels RVOs) | — | % | | — | % | | — | % | | 7.4 | % | | 9.4 | % | | 4.3 | % |
Subsequent to the EPA's December 2019 ruling, in January 2020, the 10th Circuit Court of Appeals issued a ruling invalidating the process the EPA had been using to grant SREs. The U.S. Supreme Court overturned this ruling in June 2021. This ruling invalidated the requirement to have a continuous trend of applications for SREs. The EPA could change their procedures to permit more SREs and that has the potential to cause further harm to RIN values.
The EPA released its proposed RVO for 2021 and 2022 with increases in bio-based diesel and advanced categories. The EPA also proposed to retroactively reduce the 2020 RVO as part of the announcement. In addition, EPA sought comments on denying more than 60 pending SRE's between 2016 and 2021. If finalized, these developments will provide more certainty to the industry to know what the requirement of the obligated parties will be in 2022.
The U.S. Congress could repeal, curtail or otherwise change the RFS2 program in a manner adverse to us. Similarly, the EPA could curtail or otherwise change its administration of the RFS2 program in a manner adverse to us, including by not increasing or even decreasing the RVO, by waiving compliance with the RVO or otherwise. In addition, while Congress specified RFS2 volume requirements through 2022 (subject to adjustment in the rulemaking process), beginning in 2023 required volumes of renewable fuel will be largely at the discretion of the EPA (in coordination with the Secretary of Energy and Secretary of Agriculture). We cannot predict what changes, if any, will occur, or the impact of any changes on our business, although adverse changes could seriously harm our revenues, earnings and financial condition.
Loss of or reductions in federal and state government tax incentives for bio-based diesel production or consumption may have a material adverse effect on our revenues and operating margins.
Federal and state tax incentives have assisted the bio-based diesel industry by making the price of bio-based diesel more cost competitive with the price of petroleum-based diesel fuel.
Federal Tax Incentives
The most significant tax incentive program has been the federal biodiesel mixture excise tax credit, referred to as the Biodiesel Tax Credit ("BTC"). Under the BTC, the first person to blend pure bio-based diesel with petroleum-based diesel fuel receives a $1.00-per-gallon refundable tax credit.
The BTC was established on January 1, 2005 and has lapsed and been reinstated retroactively and prospectively several times. Most recently in December 2019, the BTC was retroactively reinstated for 2018 and 2019 and is in effect from January 2020 through December 2022. Unlike the RFS2 program, the BTC has a direct effect on federal government spending and changes in federal budget policy could result in its elimination or in changes to its terms that are less beneficial to us. We cannot predict what action, if any, Congress may take with respect to the BTC after 2022. There is no assurance that the BTC will be reinstated, that it will be reinstated on the same terms or, if reinstated, that its application will be retroactive, prospective or both. Any adverse changes in the BTC can be expected to harm our results of operations and financial condition.
State Tax Incentives
Several states have enacted tax incentives for the use of biodiesel. For example, Illinois has a generally applicable 6.25% sales tax, but offers an exemption from this tax for a blend of fuel that consists of greater than 10% biodiesel that is set to expire at the end of 2022. In Iowa, for 2018 through 2025, retailers earn $0.035 per gallon for 5%-10% biodiesel blends and $0.055 per gallon for 11% and above blends. Iowa also has a bio-based diesel production incentive that provides $0.02 per gallon of production capped at the first 25 million gallons per production plant. The biodiesel and RD portion of fuel blends are exempt from Texas state excise tax, which results in a $0.20 per gallon incentive. Minnesota law requires a 5% biodiesel blend except during the summer months when a 20% biodiesel blend is required. State budget or other considerations could cause the modification or elimination of tax incentive programs. The curtailment or elimination of such incentives could materially and adversely affect our revenues and profitability.
We derive a significant portion of our revenues from sales of our renewable fuel in the State of California primarily as a result of California’s Low Carbon Fuel Standard ("LCFS"); adverse changes in this law or reductions in the value of LCFS credits would harm our revenues and profits.
We estimate that our revenues from the sale of renewable fuel in California and from sales of credits received under LCFS were approximately $593 million in 2021. The LCFS is designed to reduce greenhouse gas ("GHG") emissions associated with transportation fuels used in California by ensuring that the total amount of fuel consumed meets declining targets for such emissions. The regulation quantifies lifecycle GHG emissions by assigning a “carbon intensity” ("CI") score to each transportation fuel based on that fuel’s lifecycle assessment. Each petroleum fuel provider, generally the fuel’s producer or importer is required to ensure that the overall CI score for its fuel pool meets the annual carbon intensity target for a given year. This obligation is tracked through credits and deficits and credits can be traded. We receive LCFS credits when we sell qualified fuels in California. As a result of the trading price of LCFS credits, California has become a desirable market in which to sell our bio-based diesel and an increasing percentage of our revenue and profit is related to sales to California and LCFS credit values. In 2021, LCFS credit prices ranged from a high of $201 per credit in January to a low of $142 per credit in November. If the value of LCFS credits were to materially decrease as a result of over-supply or a lack of demand, our revenues and profits would be seriously harmed. Furthermore, if we experienced reduced demand for our fuels or LCFS credits in California, either as a result of oversupply, competitive pressure, lack of market liquidity, or regulatory change, or for other reasons including the impact of the COVID-19 pandemic, our revenues and profits would be seriously harmed. In addition, if the fuel we produced is deemed not to qualify for LCFS credits, or if the LCFS or the manner in which it is administered or applied were otherwise changed in a manner adverse to us, our revenues and profits would be seriously harmed.
We derive a significant portion of our revenues from sales of our renewable fuel in Canada and Europe; adverse changes in the programs requiring the use of renewable and lower carbon fuels or reductions in the value of credits would harm our revenues and profits.
We estimate that our revenues from the sale of renewable fuels in Canada and Europe were approximately $544 million in 2021. Canadian provinces and certain European countries have policies designed to increase the level of renewable content in transportation fuels and/or reduce GHG emissions associated with such fuels. As a result of these policies, these markets have become increasingly important for our bio-based diesel and an increasing percentage of our revenue and profit is related to sales into these markets. If the value of bio-based diesel in these markets were to materially decrease, as a result of reduced demand or increased supply by competitors, or for other reasons including the impact of the COVID-19 pandemic, if the fuel we produce is deemed not to qualify for compliance in those markets, or those policies are otherwise changed in a manner adverse to us, our revenues and profits could be seriously harmed.
RISKS RELATED TO OUR BUSINESS OPERATIONS AND THE MARKETS IN WHICH WE OPERATE
The COVID-19 pandemic may adversely impact our business.
The COVID-19 pandemic has negatively impacted the global economy. While we did not incur significant, unmanageable operational or financial disruptions during the year ended December 31, 2020 or 2021 from the COVID-19 pandemic and its variants as well as those measures to address the pandemic, the extent to which the COVID-19 pandemic may adversely impact our business depends on future developments, which are highly unpredictable.
The extent of the impact of the COVID-19 pandemic and its variants on our business, including our planned site improvement and capacity expansion at our Geismar, Louisiana facility, is highly uncertain, as information is evolving with respect to the duration and severity of the pandemic. We cannot reasonably estimate the duration and severity of the COVID-19 pandemic, or its impact, which may be significantly harmful to our operations and profitability.
We derive a substantial portion of our profitability from the production of RD at our plant in Geismar, Louisiana and any interruption in our operations would have a material adverse effect on operations and financial conditions.
RD carries a premium price compared to biodiesel as a result of a variety of factors including its ability to be blended with petroleum diesel, better cold weather performance, and generation of more RINs on a per gallon basis. We estimate that our RD production in Geismar, Louisiana generated a significant portion of our net income from continuing operations and our non-GAAP adjusted earnings before interest, taxes, depreciation and amortization, ("EBITDA") for 2021 and 2020. We experienced two fires at this facility in 2015 that each resulted in the plant being shut down for a lengthy period. If production at this facility were interrupted again due to any reason, such as due to natural disasters, it would have a disproportionately significant and material adverse impact on our operations and financial conditions.
Our planned capacity expansion at our Geismar, Louisiana facility will require significant capital expenditures and there is no guarantee that the project will be completed on time or on budget, which could have a negative effect on revenues and operations.
In October 2020, we announced our plan to expand the effective capacity of our Geismar, Louisiana biorefinery. The Geismar project involves both an improvement project for the existing operations at site with the capacity expansion. The Geismar project is expected to take total annual site production capacity from 90 million to 340 million gallons, enhance existing operations and improve operational reliability and logistics. The improvement and expansion is expected to be mechanically complete in 2023 with full operations in early 2024. We have received all required permits to proceed with construction and officially broke ground to start the construction process in the fourth quarter of 2021. The capital cost for the Geismar project is estimated to be $950 million. We have obtained funding to finance the project with a combination of cash on hand, marketable securities, borrowings under our credit facilities, and proceeds from our public offering of common stock that closed in March 2021 and proceeds from our issuance of Green Notes that closed in May 2021. In addition, in connection with the expansion, we have entered into an agreement for a long-term marine terminal lease for terminal and logistics services that will require a separate capital outlay. There is no guarantee that the project will be completed timely or within budget. If there are cost overruns or construction delays, delays due to natural disaster or other reasons, or if we are not able to obtain the governmental permits and third party easements required or necessary to initiate or complete the project, there could be a negative effect on our revenues and operations.
Increased industry-wide production of biodiesel due to potential utilization of existing excess production capacity, announced plant expansions of RD and potential co-processing of RD by petroleum refiners, could reduce prices for our fuel and increase costs of feedstocks, which would seriously harm our revenues and operations.
If additional volumes of advanced biofuel RIN production comes online and the EPA does not increase the RVO in accordance with the increased production, the volume of advanced biofuel RINs generated could exceed the volume required under the RFS2. In the event this occurs, bio-based diesel and advanced biofuel RIN prices would be expected to decrease, potentially significantly, harming demand for our products and our profitability.
Several leading bio-based diesel companies have announced their intention to expand production of RD for the U.S. market. World Energy has announced that it will expand capacity at its Los Angeles area biorefinery from 45 mmgy to over 300 mmgy. Diamond Green Diesel, the largest U.S. producer of RD, has expanded its 275 mmgy capacity by 400 mmgy as well as constructing an additional 470 mmgy biorefinery in Texas. Neste, the largest global producer of RD, is expanding its Singapore facility which exports a significant portion of its production to the U.S. West Coast. Traditional petroleum refiners are also entering the RD market with CVR, Holly Frontier, Marathon Petroleum and Philips 66 converting existing refineries to RD production facilities.
Further, due to economic incentives available, several petroleum refiners have started or may soon start to produce co-processed RD, or CPRD. CPRD uses the same feedstocks to produce bio-based diesel and it generates an advanced biofuel RIN. CPRD may be more cost-effective to produce than bio-based diesel, particularly biodiesel.
If production of competitive advanced biofuels increases significantly as a result of utilization of existing excess production capacity or new capacity as described above, competition for feedstocks would increase significantly, harming margins. Furthermore, if supply of advanced biofuels exceeds demand, prices for RD and for RINs and other credits may decrease significantly, harming profitability and potentially forcing us to idle, reduce capacity, or shut down facilities.
Our gross margins are dependent on the spread between bio-based diesel prices and feedstock costs, each of which are volatile and can cause our results of operations to fluctuate substantially.
Bio-based diesel has traditionally been marketed primarily as an additive or alternative to petroleum-based diesel fuel, and, as a result, bio-based diesel prices have been heavily influenced by the price of petroleum-based diesel fuel, adjusted for government incentives supporting renewable fuels, more so than bio-based diesel production costs. The absence of a close correlation between production costs and bio-based diesel prices means that we may be unable to pass increased production costs on to our customers in the form of higher prices. If there is a decrease in the spread between bio-based diesel prices and feedstock costs, whether as a result of an increase in feedstock prices, availability of feedstocks, or as a result of a reduction in bio-based diesel and credit prices, gross margins, cash flow and operations would be adversely affected.
Energy prices, particularly the market price for crude oil, are volatile. The NYMEX ULSD prices increased throughout 2021 as a result of slow economic recover from the pandemic and continued increases in commodity prices, ranging from a high of $2.59 per gallon to a low of $1.46 per gallon.
In addition, an element of the price of bio-based diesel that we produce is the value of the associated credits, including RINs. RIN prices in the bio-based diesel category, as reported by the OPIS, have been sharply trending higher in 2021, ranging
from $0.94 to $2.05 per RIN, while in 2020, RIN prices were highly volatile ranging from $0.37 to $1.03 per RIN. For the past several years, there has been significant volatility in RIN prices. Reductions in RIN values, such as those experienced in prior years, may have a material adverse effect on our revenues and profits as they directly reduce the value that we are able to capture for our bio-based diesel.
A decrease in the availability or an increase in the price of feedstocks may have a material adverse effect on our financial condition and operating results. The price and availability of feedstocks and other raw materials may be influenced by general economic, market, environmental, and regulatory factors. During periods when the BTC has lapsed, bio-based diesel producers may elect to continue purchasing feedstock and producing bio-based diesel at negative margins under the assumption the BTC will be retroactively reinstated, and consequently, the price of feedstocks may not decrease to a level proportionate to current operating margins. Increasing production of bio-based diesel puts pressure on feedstock supply and availability to the bio-based diesel industry. The bio-based diesel industry may have difficulty in procuring feedstocks at economical prices if competition for bio-based diesel feedstocks increases due to newly added capacity.
Historically, the spread between bio-based diesel prices and feedstock costs has varied significantly. Although actual yields vary depending on the feedstock quality, the average monthly spread between the price per gallon of B100 as reported by OPIS, and the price per gallon for the amount of choice white grease necessary to produce one gallon of B100 was $0.97 in 2019, $1.12 in 2020 and $1.34 in 2021, assuming eight pounds of choice white grease yields one gallon of bio-based diesel. The average monthly spread for the amount of crude soybean oil required to produce one gallon of B100, based on the nearby futures contract as reported on the Chicago Board of Trade, was $0.59 in 2019, $0.70 in 2020 and $0.89 in 2021, assuming 7.5 pounds of soybean oil yields one gallon of bio-based diesel. For 2019, 2020 and 2021, approximately 71%, 65% and 78%, respectively, of our annual total feedstock usage was distillers corn oil, used cooking oil or inedible animal fat, and approximately 29%, 35% and 22%, respectively, was virgin vegetable oils. When the spread between bio-based diesel prices and feedstock prices narrows, our profitability will be harmed.
Risk management transactions could significantly increase our operating costs and may not be effective.
In an attempt to partially offset the effects of volatile feedstock costs and bio-based diesel fuel prices, we enter into contracts that establish market positions in feedstocks, such as distillers corn oil, used cooking oil, inedible animal fats and soybean oil, along with related commodities, such as heating oil and ULSD. The financial impact of such market positions depends on commodity prices at the time that we are required to perform our obligations under these contracts as well as the cumulative sum of the obligations we assume under these contracts.
Risk management activities can themselves result in losses when a position is purchased in a declining market or a position is sold in a rising market. Risk management arrangements expose us to the risk of financial loss where the counterparty defaults on its contract or, in the case of exchange-traded or over-the-counter futures or options contracts, where there is a change in the expected differential between the underlying price in the contract and the actual prices paid or received by us. Changes in the value of these futures instruments are recognized in current income and may result in margin calls. We had risk management gains of $2.4 million from our derivative financial instrument trading activity for the year ended December 31, 2021, compared to risk management gains of $36.9 million for the year ended December 31, 2020. At December 31, 2021, the net notional volumes of NY Harbor ULSD, CBOT Soybean Oil and NYMEX Natural Gas covered under our open risk management contracts were approximately 62.7 million gallons, 133.7 million pounds and 3.2 million million British thermal units, respectively. A 10% positive change in the prices of NYMEX NY Harbor ULSD would have a negative effect of $14.6 million on the fair value of these instruments at December 31, 2021. A 10% positive change in the price of CBOT Soybean Oil would have had a positive effect of $7.6 million on the fair value of these instruments at December 31, 2021. A 10% positive change in the price of NYMEX Natural gas would not have a material impact on the fair value of these instruments. If these adverse changes in derivative instrument fair value were to occur in larger magnitude or simultaneously, a significant amount of liquidity would be needed to fund margin calls. In addition, we may also vary the amount of risk management strategies we undertake, or we may choose not to engage in risk management transactions at all. Our results of operation may be negatively impacted if we are not able to manage our risk management strategy effectively.
One customer accounted for a meaningful percentage of revenues and a loss of this customer could have an adverse impact on our total revenues.
One customer, Pilot Travel Centers LLC ("Pilot"), the largest operator of travel centers in North America, accounted for 15%, 19% and 17% of our total biodiesel gallons sold in each of 2021, 2020 and 2019, respectively. In the event we lose Pilot as a customer or Pilot significantly reduces the volume of bio-based diesel purchased from us, it could be difficult to replace the lost revenues, and our profitability and cash flow could be materially harmed. We do not have a long-term contract with Pilot that ensures a continuing level of business from Pilot.
Our facilities and our business, and our customers' facilities, are subject to risks associated with fire, explosions, leaks, natural disasters, including climate change, and political turmoil, which may disrupt our business and increase costs and liabilities.
Because bio-based diesel and some of its inputs and outputs are combustible and/or flammable, a leak, fire or explosion may occur at a plant or customer’s, supplier's or vendor's facility which could result in damage to the plant and nearby properties, injury or death to employees and others, cause environmental contamination, and interruption of operations. For example, we experienced fires at our Geismar facility in April 2015 and again in September 2015 and there was a fire at our Madison facility in June 2017. As a result of these fires, people were injured, and the affected facilities were shut down for lengthy periods while repairs and upgrades were completed.
The operations at our facilities are also subject to the risk of natural disasters. Our Geismar facility, due to its Gulf Coast location, is vulnerable to hurricanes, tropical storms and flooding, which may cause plant damage, injury or death to employees and others and interruption of operations. For example, in August 2021, Hurricane Ida hit Louisiana causing reduced operating days at our Geismar facility as a result of the damaging winds and flooding that created necessary safety checks for our employees and the facility before it was deemed safe to restart operations. As another example, in August 2016 we experienced reduced operating days at our Geismar facility as a result of local area flooding and reduced operating days at our former Houston facility as a result of Hurricane Harvey in August 2017. A majority of our facilities are located in the Midwest and are subject to tornadic activity. In addition, California has become one of our largest markets, serviced by our Geismar and Midwest facilities. An earthquake, fires, or other natural disaster could disrupt our ability to transport, store and deliver products to California. Changing weather patterns and climatic conditions, such as global warming, have added to the unpredictability and frequency of natural disasters and have created additional uncertainty. The Company's operations could be exposed to a number of physical risks from climate change, such as changes in rainfall rates, rising sea levels, reduced water availability, higher temperatures, fire and other extreme weather events. We are not able to accurately predict the materiality of any potential losses or costs associated with the physical effects of climate change.
If we experience a fire or other serious incident at our facilities or if any of our facilities is affected by a natural disaster, we may incur significant additional costs, including, loss of profits due to unplanned temporary or permanent shutdowns of our facilities, loss of the ability to transport products or increased costs to do so, cleanup costs, liability for damages or injuries, legal and reconstruction expenses. The incurrence of significant additional costs would harm our results of operations and financial condition.
Our operations are reliant on a number of consumables and other components as well as services that are provided by third party suppliers that are critical to our manufacturing processes and overall supply chain. The loss of one of these suppliers may have a significant impact on our business and result in production delays while we seek alternative sources for supply. For
example, our European operations rely on the availability of a particular catalyst. In 2021, the supplier of the catalyst experienced a large explosion at its facility resulting in the interruption of supply of the catalyst. The resulting disruption resulted in the suspension of operations at our facilities in Germany for a period of time while replacement solutions and other suppliers were located.
Political and economic instability (such as the recent events in Ukraine), as well as other impactful events and circumstances in the countries in which we or our suppliers are located, the availability of feedstocks, disruption or delay in the transportation of our products, currency exchange rates, transport availability and cost, transport security, inflation and other factors relating to the suppliers and the countries in which they are located are beyond our control. In addition, the U.S. foreign trade policies, tariffs and other impositions on imported goods, trade sanctions imposed on certain countries, the limitation on the importation of certain types of goods and other factors relating to foreign trade are beyond our control. These and other factors affecting us or our suppliers could adversely affect our financial performance.
Cyberattacks targeting our process control networks or other digital infrastructure could have a material adverse impact on our business and results of operations.
There are numerous and evolving risks to our cybersecurity and privacy from cyber threat actors, including criminal hackers, state-sponsored intrusions, industrial espionage and employee malfeasance. These cyber threat actors, whether internal or external to us, are becoming more sophisticated and coordinated in their attempts to access our information technology (IT) systems and data, including the IT systems of cloud providers and other third parties with whom we conduct business. Although we devote resources to prevent unwanted intrusions and to protect our systems and data, whether such data is housed internally or by external third parties, it is possible we may experience cyber incidents of varying degrees in the conduct of our business. Cyber threat actors could compromise our process control networks or other critical systems and infrastructure, resulting in disruptions to our business operations, injury to people, harm to the environment or our assets, disruptions in access to our financial reporting systems, or loss, misuse or corruption of our critical data and proprietary information, including our intellectual property and business information and that of our employees, customers, partners, suppliers, and other third parties. Any of the foregoing can be exacerbated by a delay or failure to detect a cyber incident or the full extent of such incident.
Further, we have exposure to cyber incidents and the negative impacts of such incidents related to our critical data and proprietary information housed on third-party IT systems, including the cloud. Additionally, authorized third-party IT systems or software and open source platforms used by third parties can be compromised and used to gain access or introduce malware to our IT systems that can materially impact our business. Regardless of the precise method or form, cyber events could result in significant financial losses, legal or regulatory violations, reputational harm, and legal liability and could ultimately have a material adverse effect on our business and results of operations.
In addition to biodiesel and RD, we store and transport petroleum-based fuels. The dangers inherent in the storage and transportation of fuels could cause disruptions in our operations and could expose us to potentially significant losses, costs or liabilities.
We store fuel in above ground storage tanks, underground storage tanks and transport fuel in our own trucks and rail cars as well as with third-party truck and rail carriers. Our operations are subject to significant hazards and risks inherent in transporting and storing fuel. These hazards and risks include, but are not limited to, accidents, fires, explosions, spills, leaks, discharges, and other releases, any of which could result in distribution difficulties and disruptions, environmental pollution, governmentally-imposed fines or clean-up obligations, personal injury or wrongful death claims, and other damage to property. Any such event not covered by our insurance could have a material adverse effect on our business, financial condition and results of operations.
Our insurance may not protect us against our business and operating risks.
We maintain insurance for some, but not all, of the potential risks and liabilities associated with our business. For some risks, we may not obtain insurance if we believe the cost of available insurance is excessive relative to the risks presented. As a result of market conditions, premiums and deductibles for certain insurance policies can increase substantially and, in some instances, certain insurance policies may become unavailable or available only for reduced amounts of coverage. As a result, we may not be able to renew our existing insurance policies or procure other desirable insurance on commercially reasonable terms, if at all. Although we intend to maintain insurance at levels that we believe are appropriate for our business and consistent with industry practice, we will not be fully insured against all risks. In addition, pollution, environmental risks and the risk of natural disasters generally are not fully insurable. Losses and liabilities from uninsured and underinsured events and the delay in the payment of insurance proceeds could have a material adverse effect on our financial condition and results of operations.
We operate in a highly competitive industry and expect that competition in our industry will increase.
The bio-based diesel industry has historically been primarily comprised of smaller entities that engage exclusively in biodiesel production, large integrated agribusiness companies that produce biodiesel along with their soybean and other crop crush businesses. More recently, integrated petroleum companies have announced construction of RD facilities. We face competition for capital, labor, feedstocks and other resources from these companies. In the United States, we compete with processors, including Archer-Daniels-Midland Company, Cargill, and Louis Dreyfus Commodities. In Europe, we compete directly with Greenergy, KFS, Mercuria, Neste and Sunoil. Our indirect competitors in the European market are British Petroleum, Cargill, Shell and Vitol.
In addition, petroleum refiners across the globe are increasingly entering into the bio-based diesel or advanced biofuels business, and many petroleum refiners are converting their existing plants to produce biofuels. Such petroleum refiners include Neste Corporation with RD production in both Asia and Europe, and Valero Energy Corporation through its Diamond Green Diesel joint venture in the United States. In addition, petroleum refiners such as British Petroleum, Eni SPA, Holly Frontier, Philips 66, Marathon Petroleum, Repsol, Saras SRS, Shell, and Total SE, have announced that they have begun or have plans to begin producing RD at a new facility or at a current refinery and/or co-processing bio-based diesel or advanced biofuels at certain of their refineries. All of these existing competitors and potential competitors may have more significant financial resources than we do and may be able to produce bio-based diesel at a lower cost or be more resilient due to their integrated operations, procurement organizations, greater refining capacity and greater financial resources.
According to EIA's Short Term Energy Outlook projections, production of bio-based diesel and advanced biofuels is expected to increase by 19% in 2021 as compared to 2020. The increased production of bio-based diesel or advanced biofuels may increase the demand and prices for feedstocks and other inputs which may materially adversely affect our profitability and results of operations. For example, the combination of increasing margin pressure, driven by higher feedstock costs, and a high fixed cost lease structure made the operation of our Houston, Texas biodiesel facility economically unattractive, and as such we have shutdown of the facility.
Petroleum companies and diesel retailers form the primary distribution networks for marketing bio-based diesel through blended petroleum-based diesel. If these companies increase their direct or indirect bio-based diesel production, including in the
form of co-processing, there will be less need to purchase bio-based diesel and credits from independent bio-based diesel producers like us. Such a shift in the market would materially harm our operations, cash flows and profitability.
We are dependent upon one supplier to provide hydrogen necessary to execute our RD production process and the loss of this supplier could disrupt our production process.
Our Geismar facility relies on one supplier to provide hydrogen necessary to execute the production process. Any disruptions to the hydrogen supply during production from this supplier will result in the shutdown of our Geismar plant operations.
Technological advances and changes in production methods in the bio-based diesel industry could render our plants obsolete and adversely affect our ability to compete.
Advances in the process of converting oils and fats into biodiesel and RD, including CPRD, could allow our competitors to produce bio-based diesel faster and more efficiently and at a substantially lower cost. In addition, we currently produce bio-based diesel to conform to or exceed standards established by the American Society for Testing and Materials ("ASTM"), whose standards for bio-based diesel and bio-based diesel blends may be modified in response to new technologies from the industries involved with diesel fuel.
New standards or production technologies may require us to make additional capital investments in, change equipment and processes, or otherwise modify plant operations to meet these standards. If we are unable to adapt or incorporate technological advances into our operations, our production facilities could become less competitive or obsolete. Further, it may be necessary for us to make significant expenditures to acquire any new technology, acquire licenses or other rights to technology and retrofit our plants in order to remain competitive. There is no assurance that we will be able to obtain such technologies, licenses or rights on favorable terms. If we are unable to obtain, implement or finance new technologies, our production facilities could be less efficient, and our ability to produce bio-based diesel on a competitive level may be harmed, negatively affecting our revenues and profitability.
Our intellectual property is integral to our business. If we are unable to protect our intellectual property, or others assert that our operations violate their intellectual property, our business could be adversely affected.
We rely on a combination of intellectual property rights, including patents, copyrights, trademarks and trade secrets in the United States and in select foreign countries to protect our intellectual property. Effective patent, copyright, trademark and trade secret protection may be unavailable, limited, subject to challenge or not obtained in some countries.
We rely in part on trade secret protection to protect our knowhow, confidential and proprietary information and processes. However, trade secrets are difficult to protect. We have taken measures to protect our trade secrets and proprietary information, but these measures may not be effective. For example, we require new employees and consultants to execute confidentiality agreements upon the commencement of their employment or consulting arrangement with us. These agreements generally require that all confidential information developed by the individual or made known to the individual by us during the course of the individual’s relationship with us be kept confidential and not disclosed to third parties. These agreements also generally provide that knowhow and inventions conceived by the individual in the course of rendering services to us or during the course of employment are our exclusive property. Nevertheless, these agreements may be breached, expire, or may not be enforceable, and our proprietary information may be disclosed. Despite the existence of these agreements, third parties may independently develop or acquire from others equivalent proprietary information and techniques.
It may be difficult to protect and enforce our intellectual property and litigation initiated to enforce and determine the scope of our proprietary rights can be costly and time-consuming. Adverse judicial decision(s) in any legal action could limit our ability to assert our intellectual property rights, limit our ability to develop new products, limit the value of our technology, reduce the scope of coverage of our rights, or otherwise negatively impact our business, financial condition and results of operations.
A competitor could seek to enforce intellectual property claims against us. Defending intellectual property claims asserted against us, regardless of merit, could be time-consuming, expensive to litigate or settle, divert management resources and attention and force us to acquire intellectual property rights and licenses, which may involve substantial royalty payments or settlement fees. Further, a third party claim, if successful, could secure a judgment that requires us to pay significant damages, limit our operations or obtain injunctive relief requiring a design around or other solutions and options to be developed.
Increases in transportation costs or disruptions in transportation services could have a material adverse effect on our business.
Our business depends on transportation services. The costs of these transportation services are affected by the volatility in fuel prices or other factors. Prices per Platts Group 3 (Midwest) decreased steadily in the first two months of 2020 and then plummeted to its low point in late April 2020 of $0.62 and prices slowly increased through mid-November 2020 and then increased more rapidly ending 2020 at $1.46. In 2021, the price of diesel continued to climb from $1.46 at the start of the year to $2.31 at December 31, 2021.
Our transportation costs are also affected by U.S. oil production in the Bakkens, which has had a significant impact on tank car availability and prices. If oil production from this area increases, the demand for rail cars will rise and will significantly increase rail car prices. We have not been able in the past, and may not be able in the future, to pass along part or all of any of these price increases to customers.
If we continue to be unable to increase our prices as a result of increased fuel costs charged to us by transportation providers, or transportation services are unable to provide trucks due to labor shortages, work stoppages or strikes, our gross margins may be materially adversely affected. If any transportation providers fail to deliver raw materials to us in a timely manner, we may be unable to manufacture products on a timely basis. Shipments of products and raw materials may be delayed and any such delay or failure could harm our reputation, negatively affect our customer relationships and have a material adverse effect on our business, financial condition and results of operations.
We are dependent upon our key management personnel and other personnel, and the loss of these personnel could adversely affect our business and results of operations.
Our success depends on the abilities, expertise, judgment, discretion, integrity and good faith of our management and employees. We are highly dependent upon key members of our relatively small management team and employee base that possess unique technical skills for the operation of our facilities and the execution of our business plan. The inability to retain our management team and employee base or attract suitably qualified replacements and additional staff could adversely affect our business. The loss of management and employees could delay or prevent the achievement of our business objectives and have a material adverse effect upon our results of operations and financial position.
We may encounter difficulties in integrating the businesses we acquire, including our international businesses where we have limited operating history.
We may face significant challenges in integrating entities and businesses that we acquire, and we may not realize the benefits anticipated from such acquisitions. Our integration of acquired businesses involves a number of risks, including:
•difficulty in integrating the operations and retaining of personnel, customers and suppliers of the acquired company;
•difficulty in effectively integrating the acquired technologies, products or services with our current technologies, products or services;
•demands on management related to the increase in our size after an acquisition and integration of the acquired business and personnel;
•failure to achieve expected synergies and costs savings;
•difficulties in the assimilation of different cultures and practices, as well as in the assimilation of broad and geographically dispersed personnel and operations;
•difficulties in the integration of departments, systems, including accounting systems, technologies, books and records and procedures, as well as in maintaining uniform standards and controls, including internal control over financial reporting, and related procedures and policies;
•the incurrence of acquisition-related costs or amortization costs for acquired intangible assets that could impact our operating results;
•the need to fund significant working capital requirements of any acquired production or other facilities;
•potential failure of the due diligence processes to identify significant problems, liabilities or other shortcomings or challenges of an acquired company or technology, including but not limited to, issues with the acquired company’s intellectual property, product quality, environmental liabilities, data back-up and security, revenue recognition or other accounting practices, employee, customer or partner issues or legal and financial contingencies;
•exposure to litigation or other claims in connection with, or inheritance of claims or litigation risk as a result of, an acquisition, including but not limited to, claims from terminated employees, customers, former stockholders, suppliers, or other third parties;
•the incurrence of significant exit charges if products or services acquired in business combinations are unsuccessful;
•challenges caused by distance, language, cultural differences, political economic and social instability;
•difficulties in protecting and enforcing intellectual property rights;
•the inability to extend proprietary rights in our technology into new jurisdictions;
•currency exchange rate fluctuations and foreign tax consequences;
•general economic and political conditions in foreign jurisdictions;
•foreign exchange controls or U.S. tax laws in respect of repatriating income earned outside the United States;
•compliance with the U.S.'s Foreign Corrupt Practices Act and other similar anti-bribery and anti-corruption regulations, and
•higher costs associated with doing business internationally, such as those associated with complying with export, import regulations and trade and tariff restrictions.
Our failure to successfully manage and integrate our acquisitions could have an adverse effect on our operating results, ability to recognize international revenue, and our overall financial condition.
We incur significant expenses to maintain and upgrade our operating equipment and plants, and any interruption in the operation of our facilities may harm our operating performance.
The facilities, processes, machines and equipment that we use to produce our products are complex, have many parts and some operate on a continuous basis. We must perform routine maintenance on our equipment and will have to periodically replace a variety of parts, consumables and components. In addition, our facilities require periodic shutdowns to perform major maintenance, consumable replacement and upgrades. Other equipment may have a long lead time requirement if equipment is damaged and needs to be replaced or may otherwise be unavailable to continue operations. These scheduled shutdowns of facilities result in decreased sales and increased costs in the periods in which a shutdown occurs and could result in unexpected operational issues as a result of changes to equipment, operational and mechanical processes made during the shutdown.
Growth in the use, sale and distribution of biodiesel is dependent on the expansion of related infrastructure which may not occur on a timely basis, if at all, and our operations could be adversely affected by infrastructure limitations or disruptions.
While RD has a similar chemical composition as petroleum diesel and can utilize the same distribution infrastructure, biodiesel has a different chemical composition and may require separate or additional infrastructure. Growth in the biodiesel market depends on continued development and expansion of infrastructure for the distribution of biodiesel, which may or may not occur and which is outside of our control. Also, we compete with other biofuel companies for access to some of the key infrastructure components, and the increased production of biodiesel will increase the demand and competition for necessary infrastructure. Any delay or failure in expanding distribution infrastructure could hurt the demand for or prices of biodiesel, impede delivery of our biodiesel, and impose additional costs, each of which would have a material adverse effect on our results of operations and financial condition.
Our business is subject to seasonal changes based on regulatory factors and weather conditions and this seasonality could cause our revenues and operating results to fluctuate.
Our operating results are influenced by seasonal fluctuations in the price of and demand for bio-based diesel. Seasonal fluctuations may be based on both the weather and the status of both the BTC and RVO.
Demand for our bio-based diesel may be higher in the quarters leading up to the expiration of the BTC as customers seek to purchase bio-based diesel when they can benefit from the agreed upon value sharing of the BTC with producers. This higher demand prompted by an expiring BTC has often resulted in reduced demand for biodiesel in the following quarter. In addition, RIN prices may also be subject to seasonal fluctuations. The RIN is dated for the calendar year in which it is generated. Since 20% of an obligated party's annual RVO can be satisfied by prior year RINs, most RINs must come from biofuel produced or imported during the RVO year. As a result, RIN prices can be expected to increase as the calendar year progresses if the RIN market is undersupplied compared to that year's RVO and decrease if it is oversupplied.
Weather also impacts our business because biodiesel typically has a higher cloud point than petroleum-based or RD. The cloud point is the temperature below which a fuel exhibits a noticeable cloudiness and eventually gels, leading to fuel handling and performance problems for customers and suppliers. Reduced demand in the winter for our higher cloud point biodiesel may result in excess supply of such higher cloud point biodiesel and lower prices for such higher cloud point biodiesel. Most of our production facilities are located in colder Midwestern states and our costs of shipping biodiesel to warmer climates generally increase in cold weather months.
The tendency of biodiesel to gel in colder weather may also result in long-term storage problems. In cold climates, fuel may need to be stored in a heated building or heated storage tanks, which results in higher storage costs. Higher cloud point biodiesel may have other performance problems, including the possibility of particulate formation above the cloud point which may result in increased expenses as we try to remedy these performance problems, including the costs of extra cold weather treatment additives. Remedying these performance problems may result in decreased yields, lower process throughput or both, as well as substantial capital costs. Any reduction in the demand for our biodiesel product, or the production capacity of our facilities will reduce our revenues and have an adverse effect on our cash flows and results of operations.
Failure to comply with governmental and state regulations, including EPA requirements relating to RFS2, BTC, LCFS and other programs or new laws designed to deal with climate change, could result in the imposition of higher costs, penalties, fines, or restrictions on our operations and remedial liabilities.
The bio-based diesel industry is subject to extensive federal, state and local laws and regulations, and we could be held strictly liable for the removal or remediation of previously released materials or property contamination regardless of whether we were responsible for the release or contamination, and regardless of whether current or prior operations were conducted consistent with the accepted standards of practice. Many of our assets and plants were acquired from third parties and we may incur costs to remediate property contamination caused by previous owners. In addition, we are subject to similar laws and regulations in Europe and Canada for the renewable fuels we sell there. Compliance with these laws, regulations and obligations could require substantial capital expenditures.
Changes in environmental laws and regulations occur frequently, and changes resulting in more stringent or costly waste handling, storage, transport, disposal or cleanup requirements could require us to make significant expenditures to attain and maintain compliance. In January 2021, the Biden Administration issued an executive order directing all federal agencies to review and take action to address any federal regulations, orders, guidance documents, policies and any similar agency actions promulgated during the prior administration that may be inconsistent with the current administration's policies. As a result, it is unclear the degree to which certain recent regulatory developments may be modified, extended, or rescinded.
Climate change continues to attract considerable attention globally. Numerous proposals have been made and could continue to be made at the international, national, regional, state and local levels of government to monitor and limit existing emissions of GHGs as well as to restrict or eliminate future emissions. In January 2021, the Biden Administration issued another executive order focused on addressing climate change. Among other things, the 2021 climate change executive order directed the federal government to identify "fossil fuel subsidies" to take steps to ensure that, to the extent consistent with applicable law, federal funding is not directly subsidizing fossil fuels. As a result, our operations are subject to a series of regulatory, litigation and financial risks associated with the production and transportation of biofuel products and emission of GHGs. The potential effects of GHG emission limits on our business are subject to significant uncertainties based on, among other things, the timing of the implementation of any new requirements, the required levels of emission reductions, and the nature of any market-based or tax-based mechanisms adopted to facilitate reductions. Compliance with changes in laws and regulations relating to climate change could increase our costs of operating and could require us to make significant financial expenditures that cannot be predicted with certainty at this time. We are subject to various laws and regulations including RFS2, BTC, LCFS, and other jurisdictions. These regulations are highly complex and continuously evolving, requiring us to periodically update our systems to maintain compliance, which could require significant expenditures. In 2014, the EPA issued a final rule to establish a quality assurance program and also implemented regulations related to the generation and sale of bio-based diesel RINs. Any violation of these regulations by us, could result in significant fines and harm our customers’ confidence in the RINs we issue, either of which could have a material adverse effect on our business.
RD fuel is superior to biodiesel in certain respects and if RD production capacity increases to a sufficient extent, it could largely supplant biodiesel; we may not be successful in expanding our RD production capacity.
RD is not as widely available as biodiesel, but it has certain characteristics that favorably distinguish it from biodiesel and as a result RD carries a price premium compared to biodiesel. For example, RD has similar chemical properties to petroleum-based diesel, which permits 100% RD (unlike 100% biodiesel) to flow through the same fuel storage and distribution network as petroleum diesel. RD can be used in its pure form in modern engines rather than as a blend with petroleum diesel and has similar cold weather performance as petroleum diesel. RD and CPRD may receive 1.6 or 1.7 RINs per gallon, whereas biodiesel receives 1.5 RINs per gallon. As the value of RINs increases, this RIN advantage makes RD more valuable. If RD proves to be preferred over biodiesel by market participants, revenues from our biodiesel plants and our results of operations would be adversely impacted.
Nitrogen oxide emissions from biodiesel may harm its appeal as a renewable fuel and increase costs.
In some instances, biodiesel may increase emissions of nitrogen oxide as compared to petroleum-based diesel fuel, which could harm air quality. Nitrogen oxide is a contributor to ozone and smog. While newer diesel engines are believed to eliminate any such increase, emissions from older vehicles may decrease the appeal of biodiesel to environmental groups and agencies who have been historic supporters of the biodiesel industry, potentially harming our ability to market biodiesel.
In addition, several states may act to regulate potential nitrogen oxide emissions from biodiesel. California adopted regulations that limit the volume of biodiesel that can be used or requires an additive to reduce potential emissions. In states where such an additive is required to sell biodiesel, an additive may not be available or if available, the additional cost of the additive may make biodiesel less profitable or make biodiesel less cost competitive against petroleum-based diesel or RD, which in each case would negatively impact our ability to sell biodiesel in such states and therefore have an adverse effect on our revenues and profitability.
Effective August 1, 2021, under California's Alternative Diesel Fuel regulation, existing additives used to mitigate biodiesel NOX emissions above B5 will no longer be available. This change may negatively impact demand for biodiesel in California and reduce our revenue and profit.
In addition, there may also be other requirements of fleet and retail fueling station owners to reduce nitrogen oxide emissions. The requirements relate to the type of vehicle and age of the vehicle. These requirements could result in additional costs for the operators and therefore may make the use of biodiesel less attractive, which could negatively affect our ability to sell biodiesel in such states and therefore have an adverse effect on our revenues and profitability.
RISKS RELATED TO OUR INDEBTEDNESS
We and certain subsidiaries have indebtedness, which subjects us to potential defaults, that could adversely affect our ability to raise additional capital to fund our operations and limits our ability to react to changes in the economy or the bio-based diesel industry.
At December 31, 2021, our total term debt before debt issuance costs was $550.0 million, representing the aggregate carrying value on our $550.0 million face amount, 5.875% Senior Secured Green Note due 2028, which we refer to as the “Green Notes”. At December 31, 2021, we had $249.7 million of unused revolving commitments under our line of credit, subject to borrowing base limitations.
Our indebtedness could:
◦make it difficult for us to satisfy our obligations under the Green Notes, the M&L and Services Revolver and any other future indebtedness and contractual and commercial commitments;
◦require us to dedicate a substantial portion of our cash flow from operations to payments of principal, interest on, and other fees related to such indebtedness, thereby reducing the availability of our cash flow to fund working capital and capital expenditures, and for other general corporate purposes;
◦limit our ability to borrow, or increase our cost of borrowing, additional funds;
◦prevent us from raising the funds necessary to repurchase Green Notes tendered to us if there is a change of control; a change of control which would also constitute a default under the M&L and Services Revolver under the Indenture, dated as of May 20, 2021, pursuant to which the Green Notes were issued (the "Indenture");
◦increase our vulnerability to general adverse economic and bio-based diesel industry conditions, including interest rate fluctuations, because a portion of our revolving credit facilities are and will continue to be at variable interest rates, and
◦limit our flexibility in planning for, or reacting to, changes in our business and the bio-based diesel industry, which may place us at a competitive disadvantage compared to our competitors that have less debt.
Our ability to make scheduled payments of the principal of, to pay interest on or to refinance our indebtedness depends on our future financial performance, which is subject to several factors including economic, financial, competitive and other factors beyond our control. Our business may not generate cash flow from operations in the future sufficient to satisfy our obligations under our indebtedness or any future indebtedness we may incur as well as our ability to make necessary capital expenditures. If we are unable to generate such cash flow, we may be required to adopt one or more alternatives, such as reducing or delaying investments or capital expenditures, selling assets, refinancing or obtaining additional capital on terms that may be onerous or highly dilutive. Our ability to refinance our existing or future indebtedness will depend on the conditions in the capital markets and our financial condition prior to maturity of the indebtedness.
Our debt agreements impose significant operating and financial restrictions on our subsidiaries, which may prevent us from capitalizing on business opportunities.
The M&L and Services Revolver and the Indenture impose significant operating and financial restrictions on certain of our subsidiaries. These restrictions limit certain of our subsidiaries’ ability, among other things, to:
•incur additional indebtedness or issue certain disqualified stock and preferred stock;
•place restrictions on the ability of certain of our subsidiaries to pay dividends or make other payments to us;
•grant certain additional liens on our assets or permit them to exist;
•redeem or repurchase equity securities;
•make certain investments, including acquisitions of substantially all or a portion of another entity’s business assets;
•engage in transactions with affiliates;
•sell certain assets or merge with or into other companies;
•guarantee indebtedness; and
•create liens.
Subject to the terms of the intercreditor agreement entered into in connection with the issuance of the Green Notes, when (and for as long as) the availability under the M&L and Services Revolver is less than a specified amount for a certain period of time, funds deposited into certain deposit accounts used for collections will be transferred on a daily basis into a blocked account with the administrative agent and applied to prepay loans under the M&L and Services Revolver.
As a result of these covenants and restrictions, we may be limited in how we conduct our business and we may be unable to raise additional debt or equity financing to compete effectively or to take advantage of new business opportunities. The terms of any future indebtedness we may incur could include more restrictive covenants, including on us and/or our subsidiaries that are not obligors under the M&L and Services Revolver. There is no assurance that we will be able to maintain compliance with these covenants in the future and, if we fail to do so, that we will be able to obtain waivers from the lenders and/or amend the covenants.
There are limitations on our ability to utilize the full amount of revolving commitments under the M&L and Services Revolver. Currently, the maximum aggregate principal amount that we may borrow under the M&L and Services Revolver is $250.0 million. In addition, the commitments of the lenders under the M&L and Services Revolver is further limited by a specified borrowing base consisting of a percentage of eligible accounts receivable and inventory, less customary reserves. In addition, under the M&L and Services Revolver, a monthly fixed charge coverage ratio would be triggered if availability under the M&L and Services Revolver is less than 10% of the then current revolving loan commitments which equates to $25 million. At December 31, 2021, the M&L and Services Revolver had approximately $249.7 million of unused revolving commitments, after the effect of borrowing base limitations. However, it is possible that availability under the M&L and Services Revolver could fall below the applicable threshold in a future period. If the covenant testing period is triggered, our subsidiaries who are the borrowers under the M&L and Services Revolver would be required to satisfy and maintain on the last day of each month a fixed charge coverage ratio of at least 1.0 to 1.0 for the preceding twelve-month period.
As of December 31, 2021, the fixed charge coverage ratio for the M&L and Services Revolver was above 1.0, which is the minimum amount required for compliance with this ratio. As noted above, we are not required to comply with the minimum fixed charge covenant of 1.0 unless availability under the M&L and Services Revolver drops below the agreed threshold. Our ability to meet the required fixed charge coverage ratio can be affected by events beyond our control, and we cannot assure you that we will meet this ratio. A breach of any of these covenants would result in a default under the M&L and Services Revolver.
We may still incur significant additional indebtedness that could increase the risks associated with our indebtedness.
We and our subsidiaries may be able to incur substantial additional indebtedness, including additional secured indebtedness, in the future. As of December 31, 2021, we had $249.7 million of unused revolving commitments under the M&L and Services Revolver, subject to borrowing base limitations. We currently expect to fund the estimated $950 million of capital expenditures in connection with the improvement and expansion of our Geismar, Louisiana facility with a combination of cash on hand, marketable securities, borrowings under our credit facilities, offerings of equity and debt (including the equity offering completed in March 2021 and the offering of the Green Notes completed in May 2021) or from other sources. If we are unable to complete the improvement and expansion within the estimated budget, we will require additional funds to do so. If new debt or other liabilities are added to our current debt levels, the related risks that we and our subsidiaries now face could intensify. Additionally, debt financing arrangements may also be rated by credit rating agencies. Any potential future negative change in our credit ratings may make it more expensive for us to raise long term permanent financing or additional capital on terms that are acceptable to us, if at all; negatively impact the price of our common stock; increase our overall cost of capital; and have other negative implications on our business, many of which are beyond our control.
Certain provisions in the Indenture governing our Senior Secured Green Notes (the "Green Notes") could delay or prevent an otherwise beneficial takeover or takeover attempt of us.
Certain provisions in the Indenture could make it more difficult or more expensive for a third party to acquire us. If a takeover triggers a “Change of Control” as defined under the Indenture, each holder of the Green Notes will have the right to
require us to repurchase their Green Notes in cash, at a price equal to 101.0% of the aggregate principal amount to be repurchased, plus accrued and unpaid interest, if any, thereon to, but not including the date of repurchase, which could increase the cost of acquiring us or otherwise discourage a third party from acquiring us or removing incumbent management. If we are unable to comply with the restrictions and covenants in our debt agreements, there could be a default under the terms of such agreements, which could result in an acceleration of repayment.
RISKS RELATED TO OUR COMMON STOCK
The market price for our common stock may be volatile.
The market price for our common stock is likely to be highly volatile and subject to wide fluctuations in response to factors including the following:
•actual or anticipated fluctuations in our financial condition and operating results;
•changes in the performance or market valuations of other companies engaged in our industry;
•issuance of new or updated research reports by securities or industry analysts;
•changes in financial estimates by us or of securities or industry analysts;
•investors’ general perception of us and the industry in which we operate;
•investors' reactions to our press releases, other public announcements and filings with the SEC;
•changes in the political climate in the industry in which we operate, existing laws, regulations and policies applicable to our business and products, including RFS2, and the continuation or adoption or failure to continue or adopt renewable energy requirements and incentives, including the BTC;
•other regulatory developments in our industry affecting us, our customers or our competitors;
•announcements of technological innovations by us or our competitors;
•announcement or expectation of additional financing efforts, including sales or expected sales of additional common stock;
•additions or departures of key management or other personnel;
•litigation involving us or our industry, or both, or investigations by regulators into our operations or those of our competitors;
•inadequate trading volume;
•general market conditions in our industry;
•the effects of the COVID-19 pandemic and measures to address the pandemic;
•whether our shares are included in stock market indexes such as the S&P SmallCap 600 index; and
•general economic and market conditions, including continued dislocations and downward pressure in the capital markets.
In addition, stock markets experience significant price and volume fluctuations from time to time that are not related to the operating performance of particular companies. These market fluctuations may have material adverse effect on the market price of our common stock. In the past, following periods of volatility in the market price of a particular company's securities, securities class action litigation has often been instituted against these companies. Any securities litigation that may be instituted against us in the future could result in substantial costs, regardless of the outcome of the litigation, and divert resources and our management's attention to our business. In addition, the occurrence of any of the factors listed above, among others, may cause our stock price to decline significantly, and there can be no assurance that our stock price would recover. As such, you may not be able to sell your shares at or above the price you paid, and you may lose some or all of your investment.
We have never paid dividends on our capital stock and we do not anticipate paying dividends in the foreseeable future.
We have never paid dividends on any of our capital stock and currently intend to retain any future earnings to fund the development and growth of our business. Any determination to pay dividends in the future will be at the discretion of our board of directors and will depend on our financial condition, operating results, capital requirements, general business conditions and other factors that our board of directors may deem relevant. As a result, stockholders must look solely to appreciation of our common stock to realize a gain on their investment. This appreciation may not occur. Investors seeking cash dividends should not invest in our common stock. Furthermore, we may in the future become subject to contractual restrictions on, or prohibitions against, the payment of dividends.
We may issue additional common stock as consideration for future investments or acquisitions.
We have issued in the past, and may issue in the future, our securities in connection with investments and acquisitions. Our stockholders could suffer significant dilution, from our issuances of equity or convertible debt securities. Any new equity securities we issue could have rights, preferences and privileges superior to those of holders of our common stock. The amount of our common stock or securities convertible into or exchangeable for our common stock issued in connection with an investment or acquisition could constitute a material portion of our then outstanding common stock.
If we fail to maintain effective internal control over our financial reporting and financial forecasting, we may not be able to report our financial results accurately, provide accurate financial guidance or prevent fraud, and if we fail to maintain effective internal governance and conduct policies, such as our Code of Business Conduct and Ethics, Code of Ethics for Senior Financial Officers and Trading by Insiders Policy, or if our employees fail to adhere to such policies, we may be unable to maintain a proper control environment. If any of these failures occur, our business could be harmed, our stockholders could lose confidence in our financial reporting and financial guidance or our business integrity and we could suffer negative media attention, which could negatively impact the value of our stock.
Effective internal controls over our financial reporting and adherence to our internal governance and conduct policies are necessary for us to provide reliable financial reports and to prevent fraud. The process of maintaining our internal controls may be expensive and time consuming and may require significant attention from management. The failure to do so may harm our business or our reputation and could negatively impact the value of our stock. Even if our management concludes that, as of the end of a fiscal quarter or fiscal year, our internal control over financial reporting provided reasonable assurance regarding the reliability of financial reporting and the preparation of financial statements for external purposes in accordance with generally accepted accounting principles, because of its inherent limitations, internal control over financial reporting may not prevent or detect fraud or misstatements.
In addition, failure to implement required new or improved controls, or difficulties encountered in their implementation, could harm our results of operations or cause us to fail to meet our reporting obligations. If we or our independent registered public accounting firm discover a material weakness in our internal control over financial reporting, the disclosure of that weakness could harm the value of our stock and our business.
As a result of the matters discussed in the explanatory note to the Form 10-K/A filed by us on February 25, 2021, we concluded that our previously issued audited consolidated financial statements for fiscal years ended December 31, 2019 and 2018, each of our unaudited condensed consolidated financial statements for the quarterly and year-to-date periods during such years, and related disclosures, as well as our unaudited condensed consolidated financial statements and related disclosures for the quarterly periods ended March 31, June 30 and September 30, 2020, should be restated. Two class action lawsuits were filed against us and certain of our current and former executive officers following the restatements. As a result of these restatements and the errors that resulted in these restatements, we are subject to additional risks and uncertainties, including potential additional litigation and loss of investor confidence.
On July 27, 2021, a stockholder derivative complaint was filed in the United States District Court for the District of Delaware based on allegations substantially similar to those in the class action, and purporting to assert claims on the Company's behalf against current and former officers and directors for alleged violation of Sections 14(a) and 20(a) of the Exchange Act, breach of fiduciary duties, unjust enrichment, and waste of corporate assets. On January 20, 2022, the court granted defendants' motion to dismiss with prejudice and entered a judgment dismissing the case. On February 18, 2022, plaintiff filed a notice of appeal of the order granting the motion to dismiss and the entry of judgement.
In connection with this restatement of our historical consolidated financial statements, we identified a material weakness in our internal control over financial reporting, and management concluded that our internal control over financial reporting and disclosure controls and procedures were not effective as of December 31, 2020, which has been remediated as of December 31, 2021.
If we are unsuccessful in remediating any future material weaknesses or other deficiencies in our internal control over financial reporting or disclosure controls and procedures, investors may lose confidence in our financial reporting and the accuracy and timing of our financial reporting and disclosures and our business, reputation, results of operations, liquidity, financial condition, ability to access the capital markets, perceptions of our creditworthiness, and ability to complete acquisitions could be adversely affected. In addition, we may be unable to maintain or regain compliance with applicable securities laws, stock market listing requirements, and the covenants under our debt instruments regarding the timely filing of periodic reports; we may be subject to penalties; we may suffer defaults or accelerations under our debt instruments to the extent we are unable to obtain waivers from the required creditors or counterparties or are unable to cure any breaches; and our stock price may decline.
Further, effective financial forecasting is necessary for us to provide reliable financial guidance. The process of providing accurate financial guidance may be expensive and time consuming, may require significant attention from management, and is inherently uncertain. Nevertheless, the failure to do so accurately may harm our business or our reputation and could negatively
impact the value of our stock. For example, in the second quarter of 2020, we identified errors in our financial guidance model that led to our June 23, 2020 announcement of a revised outlook for the second quarter of 2020, which announcement was followed by a drop in the price of our stock.
It is also necessary for our employees, and in particular our senior officers, to adhere to all of our internal governance and conduct policies, including our Code of Business Conduct and Ethics, Code of Ethics for Senior Financial Officers and Trading by Insiders Policy. Failure to adhere to our policies could result in negative media attention or otherwise harm our reputation and cause stockholders to lose confidence in our business integrity or management. For example, in connection with an internal investigation into the series of events that led to our June 23, 2020 announcement of a revised outlook for the second quarter of 2020, we uncovered certain violations of our policies by senior officers, which resulted in disciplinary actions and remediations for the officers involved. The investigation also prompted a review of all of our internal policies and codes of ethics, which is resulting in a number of revisions intended to further strengthen them and their associated assurance processes. Any failure to maintain these policies or failure by our employees, and in particular our senior officers, to adhere to these policies could still result in harm to our reputation and could negatively impact the value of our stock.
Delaware law and our certificate of incorporation and bylaws contain anti-takeover provisions that could delay or discourage takeover attempts that stockholders may consider favorable.
Provisions in our certificate of incorporation and bylaws may have the effect of delaying or preventing a change of control or changes in our management. These provisions include the following:
•the right of the board of directors to elect a director to fill a vacancy created by the expansion of the board of directors;
•the requirement for advance notice for nominations for election to the board of directors or for proposing matters that can be acted upon at a stockholders’ meeting;
•the ability of the board of directors to alter our bylaws without obtaining stockholder approval;
•the ability of the board of directors to issue, without stockholder approval, up to 10,000,000 shares of preferred stock with rights set by the board of directors, which rights could be senior to those of common stock;
•a classified board;
•the required approval of holders of at least two-thirds of the shares entitled to vote at an election of directors to adopt, amend or repeal our bylaws or amend or repeal the provisions of our amended and restated certificate of incorporation regarding the classified board, the election and removal of directors and the ability of stockholders to take action by written consent; and
•the elimination of the right of stockholders to call a special meeting of stockholders and to take action by written consent.
In addition, because we are incorporated in Delaware, we are governed by the provisions of Section 203 of the Delaware General Corporation Law ("DGCL"). These provisions may prohibit or restrict large stockholders, in particular those owning 15% or more of our outstanding voting stock, from merging or combining with us. These provisions in our certificate of incorporation and bylaws and under Delaware law could discourage potential takeover attempts and could reduce the price that investors might be willing to pay for shares of our common stock in the future and result in our market price being lower than it would without these provisions.
RISKS RELATED TO THE PROPOSED MERGER
The proposed Merger is subject to approval of our stockholders as well as the satisfaction of other closing conditions, including government consents and approvals, some or all of which may not be satisfied or completed within the expected timeframe, if at all.
Completion of the Merger is subject to a number of closing conditions, including obtaining the approval of our stockholders, the expiration or termination of any waiting period (and any extension thereof) applicable to the consummation of the Merger under the HSR Act and the EU Clearance. We can provide no assurance that all required consents and approvals will be obtained or that all closing conditions will otherwise be satisfied (or waived, if applicable), and, even if all required consents and approvals can be obtained and all closing conditions are satisfied (or waived, if applicable), we can provide no assurance as to the terms, conditions and timing of such consents and approvals or the timing of the completion of the Merger. Many of the conditions to completion of the Merger are not within our control, and we cannot predict when or if these conditions will be satisfied (or waived, if applicable). Any adverse consequence of the pending Merger could be exacerbated by any delays in completion of the Merger or termination of the Merger Agreement.
Each party’s obligation to consummate the Merger is also subject to the accuracy of the representations and warranties of the other party (subject to customary materiality qualifications) and compliance in all material respects with the covenants and
agreements contained in the Merger Agreement as of the closing of the Merger, including, with respect to us, covenants to conduct our business in the ordinary course and to not engage in certain kinds of material transactions prior to closing. In addition, the Merger Agreement may be terminated under certain specified circumstances, including, but not limited to, in connection with a change in the recommendation of our Board of Directors to enter into an agreement for a Superior Proposal (as defined in the Merger Agreement). As a result, we cannot assure you that the Merger will be completed, even if our stockholders approve the Merger, or that, if completed, it will be exactly on the terms set forth in the Merger Agreement or within the expected time frame.
We may not complete the proposed Merger within the time frame we anticipate or at all, which could have an adverse effect on our business, financial results and/or operations.
The proposed Merger may not be completed within the expected timeframe, or at all, as a result of various factors and conditions, some of which may be beyond our control. If the Merger is not completed for any reason, including as a result of our stockholders failing to adopt the Merger Agreement, our stockholders will not receive any payment for their shares of our common stock in connection with the Merger. Instead, we will remain a public company, our common stock will continue to be listed and traded on The Nasdaq Global Select Market and registered under the Securities Exchange Act of 1934, as amended, or the Exchange Act, and we will be required to continue to file periodic reports with the SEC. Moreover, our ongoing business may be materially adversely affected, and we would be subject to a number of risks, including the following:
•we may experience negative reactions from the financial markets, including negative impacts on our stock price, and it is uncertain when, if ever, the price of the shares would return to the prices at which the shares currently trade;
•we may experience negative publicity, which could have an adverse effect on our ongoing operations including, but not limited to, retaining and attracting employees, customers, partners, suppliers and others with whom we do business;
•we will still be required to pay certain significant costs relating to the Merger, such as legal, accounting, financial advisory, printing and other professional services fees, which may relate to activities that we would not have undertaken other than in connection with the Merger;
•we may be required to pay a cash termination fee to Parent of $91.0 million, as required under the Merger Agreement under certain circumstances;
•while the Merger Agreement is in effect, we are subject to restrictions on our business activities, including, among other things, restrictions on our ability to engage in certain kinds of material transactions, which could prevent us from pursuing strategic business opportunities, taking actions with respect to our business that we may consider advantageous and responding effectively and/or timely to competitive pressures and industry developments, and may as a result materially adversely affect our business, results of operations and financial condition;
•matters relating to the Merger require substantial commitments of time and resources by our management, which could result in the distraction of management from ongoing business operations and pursuing other opportunities that could have been beneficial to us; and
•we may commit significant time and resources to defending against litigation related to the Merger.
If the Merger is not consummated, the risks described above may materialize, and they may have a material adverse effect on our business operations, financial results and stock price, particularly to the extent that the current market price of our common stock reflects an assumption that the Merger will be completed.
We will be subject to various uncertainties while the Merger is pending that may cause disruption and may make it more difficult to maintain relationships with customers and other third-party business partners.
Our efforts to complete the Merger could cause substantial disruptions in, and create uncertainty surrounding, our business, which may materially adversely affect our results of operation and our business. Uncertainty as to whether the Merger will be completed may affect our ability to recruit prospective employees or to retain and motivate existing employees. Employee retention may be particularly challenging while the Merger is pending because employees may experience uncertainty about their roles following the Merger. As mentioned above, a substantial amount of our management’s and employees’ attention is being directed toward the completion of the Merger and thus is being diverted from our day-to-day operations. Uncertainty as to our future could adversely affect our business and our relationship with customers and potential customers. For example, customers, suppliers and other third parties may defer decisions concerning working with us, or seek to change existing business relationships with us. Changes to or termination of existing business relationships could adversely affect our revenue, earnings and financial condition, as well as the market price of our common stock. The adverse effects of the pendency of the Merger could be exacerbated by any delays in completion of the Merger or termination of the Merger Agreement.
In certain instances, the Merger Agreement requires us to pay a termination fee to Parent, which could affect the decisions of a third party considering making an alternative acquisition proposal.
Under the terms of the Merger Agreement, we may be required to pay Parent a termination fee of $91.0 million under specified conditions, including in the event Parent terminates the Merger Agreement before receipt of our stockholders’ approval due to a change in recommendation by our Board of Directors, in the event we terminate the Merger Agreement to enter into a Superior Proposal, or in the event we enter into an alternative transaction within twelve months of termination of the Merger Agreement in certain circumstances and the alternative transaction is consummated. This payment could affect the structure, pricing and terms proposed by a third party seeking to acquire or merge with us and could discourage a third party from making a competing acquisition proposal, including a proposal that would be more favorable to our stockholders than the Merger.
We have incurred, and will continue to incur, direct and indirect costs as a result of the Merger.
We have incurred, and will continue to incur, significant costs and expenses, including regulatory costs, fees for professional services and other transaction costs in connection with the Merger, for which we will have received little or no benefit if the Merger is not completed. There are a number of factors beyond our control that could affect the total amount or the timing of these costs and expenses. Many of these fees and costs will be payable by us even if the Merger is not completed and may relate to activities that we would not have undertaken other than to complete the Merger.
Litigation challenging the Merger Agreement may prevent the Merger from being consummated within the expected timeframe or at all.
Lawsuits may be filed against us, our Board of Directors or other parties to the Merger Agreement, challenging our acquisition by Parent making other claims in connection therewith. Such lawsuits may be brought by our purported stockholders and may seek, among other things, to enjoin consummation of the Merger. One of the conditions to the consummation of the Merger is that the consummation of the Merger is not restrained, made illegal, enjoined or prohibited by any order or legal or regulatory restraint or prohibition of a court of competent jurisdiction or any governmental entity. As such, if the plaintiffs in such potential lawsuits are successful in obtaining an injunction prohibiting the defendants from completing the Merger on the agreed upon terms, then such injunction may prevent the Merger from becoming effective, or from becoming effective within the expected timeframe.
ITEM 1B. Unresolved Staff Comments
None.
ITEM 2. Properties
We own our corporate headquarters located at 416 South Bell Avenue, Ames, Iowa 50010, comprised of 60,480 square feet of office and laboratory space; as well as two other buildings located at 300 South Bell Avenue, Ames, Iowa 50010 and at 215 Alexander Avenue, Ames, Iowa 50010, which have a combined 26,837 square feet of office space.
The table in Item 1. Business, "Plant Network and Products" lists each of our owned North American and European production facilities, their location, nameplate capacity, effective capacity, REG operations commencement, feedstock capabilities and products produced. Each facility listed is used by our Bio-based diesel Segment.
ITEM 3. Legal Proceedings
On March 2, 2021, a putative class action lawsuit was filed against the Company and certain of its current and former executive officers in the United States District Court for the Southern District of New York. On March 12, 2021, a putative class action lawsuit against the same defendants was filed in the United States District Court for the Central District of California. On June 24, 2021, the two cases were consolidated in the Southern District of New York under the caption In re Renewable Energy Group Securities Litigation, No. 21-cv-1832, and a consolidated amended complaint was filed on July 9, 2021.
The complaint purports to be brought on behalf of shareholders who purchased the Company's common stock between March 8, 2018 and February 25, 2021, the date on which the Company announced its restatement related to BTC. Plaintiffs allege that defendants made false and misleading statements about the Company's business, financial results and prospects in violation of Sections 10(b) and 20(1) of the Securities Exchange Act of 1934 and Rule 10b-5 promulgated thereunder. The complaint seeks unspecified damages, attorneys' fees, and other costs. On January 20, 2022, the court granted defendants' motion to dismiss with prejudice and entered a judgment dismissing the case. On February 18, 2022, plaintiff filed a notice of appeal of the order granting the motion to dismiss and the entry of judgement. The Company denies any and all allegations of wrongdoing and intends to vigorously defend against the litigation.
On July 27, 2021, a stockholder derivative complaint was filed in the United States District Court for the District of Delaware based on allegations substantially similar to those in the class action, and purporting assert claims on the Company's
behalf against current and former officers and directors for alleged violation of Sections 14 (a) and 20 (a) of the Exchange Act, breach of fiduciary duties, unjust enrichment, and waste of corporate assets. On August 2, 2021, a second stockholder derivative complaint purportedly arising out of the same events and purporting to assert similar claims, was filed in the Supreme Court for the state of New York. Both of these derivative actions have been stayed.
In addition, the Securities and Exchange Commission ("SEC") requested information about the restatement, and the Company cooperated with the SEC. On October 1, 2021, the SEC Staff notified the Company that the Staff terminated its investigation with no enforcement action recommended against the Company, in accordance with SEC guidelines.
The Company is also involved in various other legal proceedings in the normal course of business. The Company currently believes that any ultimate liability arising out of such proceedings will not have a material adverse effect on the Company’s financial position, results of operations or cash flows.
ITEM 4. Mine Safety Disclosures
None.
PART II
ITEM 5. Market for Registrant’s Common Equity, Related Stockholder Matters and Issuer Purchases of Equity Securities
Market For Our Common Equity
Our common stock trades on The Nasdaq Global Select Market under the ticker symbol "REGI".
Holders
As of January 31, 2022, there were approximately 1,379 holders of record of our common stock.
Dividends
Our Board of Directors currently intends to retain any future earnings to support operations and to finance the growth and development of our business, and therefore does not intend to pay cash dividends on our common stock for the foreseeable future.
Performance Graph
The following performance graph is not “soliciting material,” is not deemed filed with the SEC, and is not to be incorporated by reference into any of our filings under the Securities Act of 1933 or the Securities Exchange Act of 1934, as amended, respectively.
On May 15, 2018, we were added to the S&P SmallCap 600 index. The following graph shows a comparison of the cumulative total returns for the last 5 years to December 31, 2021 for us, the Elements MLCX Biofuels ETN Index, the Russell 3000 Index and the S&P SmallCap 600. The graph assumes that $100 was invested on December 31, 2016 in our common stock, the Elements MLCX Biofuels ETN Index, the Russell 3000 Index and the S&P SmallCap 600 assuming all dividends were reinvested.
| | | | | | | | | | | | | | | | | | | | | | | | | | | | | | | | | | | | | | | | | | | |
| | | | | | | | | 12/31/2016 | | 12/31/2017 | | 12/31/2018 | | 12/31/2019 | | 12/31/2020 | | 12/31/2021 |
| REGI | | | | | | | | | $ | 100.00 | | | $ | 121.65 | | | $ | 264.95 | | | $ | 277.84 | | | $ | 730.10 | | | $ | 437.53 | |
| Elements MLCX Biofuels ETN | | | | | | | | | 100.00 | | | 91.50 | | | 81.83 | | | 80.39 | | | 86.27 | | | 132.16 | |
| Russell 3000 | | | | | | | | | 100.00 | | | 118.85 | | | 110.54 | | | 142.09 | | | 168.84 | | | 209.36 | |
| S&P SmallCap 600 | | | | | | | | | 100.00 | | | 111.73 | | | 100.83 | | | 121.87 | | | 133.53 | | | 167.28 | |
Sales of Unregistered Securities
None.
Issuer Purchases of Equity Securities
In January 2019 and February 2020, the Company's board of directors approved repurchase programs of up to $75.0 million and $100.0 million, respectively, of the Company's shares of common stock and/or previously outstanding convertible notes (the "2019 Program" and "2020 Program"). Under these programs, the Company may repurchase convertible notes or shares from time to time in open market transactions, privately negotiated transactions or by other means. The timing and amount of repurchase transactions under each program are determined by the Company's management based on its evaluation of market conditions, share price, bond price, legal requirements and other factors.
The Company made no share repurchases during the quarter ended December 31, 2021. The 2019 Program was fully utilized as of September 30, 2020. At December 31, 2021, the Company has $91.9 million remaining under the 2020 Program.
ITEM 6. Selected Financial Data
Reserved.
ITEM 7. Management’s Discussion and Analysis of Financial Condition and Results of Operations
The following discussion and analysis should be read in conjunction with our consolidated financial statements and notes thereto that appear elsewhere in this report. This discussion contains forward-looking statements reflecting our current expectations that involve risks and uncertainties. Actual results may differ materially from those discussed in these forward-looking statements due to a number of factors, including those set forth in the section entitled “Risk Factors” and elsewhere in this report.
Objective
We are one of North America's largest producers of advanced biofuels focused on providing cleaner, lower carbon transportation fuels. We utilize a nationwide production, distribution and logistics system as part of an integrated value chain model designed to convert natural fats, oils and greases into advanced biofuels. We believe our fully integrated approach, which includes acquiring feedstock, operating biorefineries, distributing fuel through a network of terminals, and managing biorefinery facility construction and upgrades, positions us to serve the market for cleaner transportation fuels.
In addition to our acquisition of Keck Energy in September 2018, we opened our first REG branded fueling station in July 2019 adjacent to our biorefinery in Seneca, Illinois to serve a variety of customers from trucking fleets and local diesel vehicle owners. In June 2020, we entered into an agreement with a third party pursuant to which it agreed to exclusively sell REG branded fuels at certain of its cardlock locations. In October 2021, we entered into a long-term agreement with GoodFuels, a leading supplier of sustainable marine biofuels and global producer and supplier of renewable fuels, for the supply and development of sustainable marine biofuel solutions for the global shipping industry. In November 2021, we entered into a partnership with Canadian Northern Railway to test bio and RD blends for their locomotive fleet. In December 2021, we acquired Amber Resources, a California-based distributor of biobased diesel, petroleum diesel and lubricants. This acquisition will help enable us to access a larger network of end customers. These are part of our downstream strategy, which is focused on three important objectives: margin expansion across the value chain, including by directing production to the most profitable geographies; realization of higher biodiesel values through blends of biodiesel into petroleum and RD; and increased demand for our biodiesel via sales of 100% pure biodiesel, or B100, to end consumers.
In October 2020, we announced our plan to expand the effective capacity of our Geismar, Louisiana biorefinery. The Geismar project involves both an improvement project for the existing operations at the site as well as the capacity expansion. The Geismar project is expected to take total annual site production from 90 million to 340 million gallons, enhance existing operations and improve operational reliability and logistics. The expansion is expected to be mechanically complete in 2023 with full operations in early 2024. We have received all required permits to proceed with construction and officially broke ground to start the construction process in the fourth quarter of 2021. The capital cost for the Geismar project is estimated to be $950 million and is funded with a combination of cash on hand, marketable securities, borrowings under our credit facilities, and proceeds from our public offering of common stock that closed in March 2021 and proceeds from our issuance of Green Notes that closed on May 20, 2021, as discussed below. In addition, in connection with the expansion we have entered into a long-term marine terminal lease for terminal and logistics services that will require a separate capital outlay. We have also agreed to construction contracts for large parts of the work associated with the improvements and expansion. There can be no guarantee that we will be able to complete this project in a timely manner or increase the capacity of our biorefinery at Geismar, Louisiana on time, at our estimated budget, or at all. The improvements and expansion are subject to a number of conditions and risks.
On March 19, 2021, we completed an equity offering pursuant to which we sold 5,750,000 shares of common stock to various underwriters at a price of $67.00 per share before underwriting discounts and commissions. The net proceeds from the offering were $365.3 million. We currently intend to use the net proceeds from this offering for working capital and other general corporate purposes, which may include the repayment of our existing indebtedness and the funding of capital expenditures, including capital expenditures related to the improvements and expansion of our Geismar, Louisiana biorefinery.
On May 20, 2021, we completed the sale and issuance of $550.0 million aggregate principal amount of our Green Notes. We recorded $14.6 million in legal, professional and underwriting fees related to the issuance of the Green Notes. We currently intend to use the net proceeds from this offering for capital expenditures related to the improvements and expansion of its Geismar, Louisiana biorefinery.
We believe that the execution of these strategies will enable us to expand our margins, diversify sources of profitability, manage our business through varying market conditions, and increase shareholder value.
In September 2021, we announced the closure of the Houston, Texas biorefinery. Production at this facility ceased in November 2021. The Houston plant's nameplate capacity was 35 mmgy. As a result, we now own and operate a network of 11 biorefineries. Nine biorefineries are located in the United States and two in Germany. Ten biorefineries produce biodiesel and one produces RD. Our eleven bio-based diesel production facilities have an aggregate nameplate production capacity of 470 million gallons per year (“mmgy”).
We are a lower carbon bio-based diesel producer. We primarily produce our bio-based diesel from a wide variety of low carbon feedstocks, including distillers corn oil, used cooking oil and inedible animal fat. We also produce bio-based diesel from virgin vegetable oils, such as soybean oil or canola oil, which tend to be higher in price. We believe our ability to process a wide variety of feedstocks at most of our facilities provides us with a cost advantage over many bio-based diesel producers, particularly those that rely primarily on higher cost virgin vegetable oils.
We also sell petroleum-based heating oil and diesel fuel, which enables us to offer a variety of fuel products to a broader customer base. We sell heating oil and ultra-low sulfur diesel, or ULSD, at terminals throughout the northeastern United States, as well as BioHeat® blended heating fuel at one of these terminal locations. In 2018, we expanded our sales of biofuel blends to
Midwest and West Coast terminal locations and look to potentially expand in other areas across North America and internationally.
In May 2019, we sold the core assets of REG Life Sciences that comprised our Renewable Chemicals segment. As a result, the former Renewable Chemicals segment and the operations of the Renewable Chemicals segment have been classified as discontinued operations for all periods covered by this report.
The table below reflects our gallons sold during the years ended 2021 and 2020 (totals may not foot due to rounding).
| | | | | | | | | | | | | | | | | | | | |
| | | | Gallons sold (millions) |
| | | | Year ended December 31, 2021 | | Year ended December 31, 2020 |
| REG-produced bio-based diesel: | | | | | | |
| | Biodiesel - United States | | 348.0 | | | 375.2 | |
| | Biodiesel - International | | 41.0 | | | 50.1 | |
| | | | | | |
| | | | | | |
| | RD | | 74.0 | | | 76.4 | |
| | | | 463.0 | | | 501.7 | |
| Third party bio-based diesel: | | | | | | |
| | | | | | |
| | | | | | |
| | Biodiesel | | 22.5 | | | 20.9 | |
| | RD | | 57.6 | | | 39.8 | |
| | | | 80.1 | | | 60.7 | |
| | | | | | |
| Petroleum-based diesel | | | | 78.2 | | | 88.1 | |
| Total | | | | 621.3 | | | 650.5 | |
Our businesses are organized into three reportable segments - the Bio-based Diesel segment, the Services segment and Corporate and Other.
Bio-based Diesel Segment
Our Bio-based Diesel segment includes:
•the operations of the bio-based diesel production refineries as included in Item 2 of Part I of this document;
•purchases and resales of bio-based diesel, the renewable portion of sales of biodiesel and RD blended with petroleum-based diesel, RINs and LCFS credits (each as defined herein), and raw material feedstocks acquired from third parties; and
•incentives received from federal and state programs for renewable fuels.
We derive a small portion of our revenues from the sale of co-products of the bio-based diesel production process. In 2021 and 2020, our revenues from the sale of co-products were less than five percent of our total Bio-based diesel segment revenues. During 2021 and 2020, revenues from the sale of petroleum-based heating oil and diesel fuel acquired from third parties, along with the sale of these items further blended with biodiesel produced by our facilities or purchased from third parties, were approximately 5% of our total revenues for both periods.
In accordance with EPA regulations, we generate 1.5 to 1.7 RINS, for each gallon of bio-based diesel we produce. RINs are used to track compliance with the RFS2, using the EPA moderated transaction system, or EMTS. RFS2 allows us to attach between zero and 2.5 RINs to any gallon of bio-based diesel we sell. When we attach RINs to a sale of bio-based diesel gallons, a portion of our selling price for a gallon of bio-based diesel is generally attributable to RFS2 compliance, but no cost is allocated to the RINs generated by our bio-based diesel production because RINs are a form of government incentive and not a result of the physical attributes of the bio-based diesel production. In addition, RINs, once obtained through the production and sale of gallons of bio-based diesel, may be separated by the acquirer and sold separately. We regularly obtain RINs from third parties for resale, and the value of these RINs is reflected in “Prepaid expenses and other assets” on our Consolidated Balance Sheet. At each balance sheet date, this RIN inventory is valued at the lower of cost or net realizable value and resulting adjustments are reflected in our cost of goods sold for the period. The cost of RINs obtained from third parties is determined using the average cost method. Because we do not allocate costs to RINs generated by our bio-based diesel production, fluctuations in the value of our RIN inventory represent fluctuations in the value of RINs we have obtained from third parties.
The value of RINs significantly decreased during the first quarter of 2019 and remained relatively low through the first half of 2020. The prices of RINs started to move up in the second half of 2020 in part due to the 10th Circuit Court of Appeals ruling invalidating the process the EPA had been using to grant SREs. In 2021, RIN prices increased rapidly due to continued support to not issue more SREs and the significant increase in feedstock and ULSD prices.
The table below summarizes our RINs balances available to be sold and the median closing price per RIN at December 31, 2021 and 2020 according to OPIS:
| | | | | | | | | | | | | | | | | | | | | | | |
| Quantity | | OPIS Median Closing Price per RIN |
| December 31, 2021 | | December 31, 2020 | | December 31, 2021 | | December 31, 2020 |
| Bio-based diesel RINs | 31,702,718 | | | 3,962,710 | | | $ | 1.51 | | | $ | 1.02 | |
| Advanced biofuels RINs | 684,773 | | | 817,464 | | | $ | 1.51 | | | $ | 1.02 | |
We generate LCFS credits for our low carbon fuels when our qualified low carbon fuels are imported into states that have adopted an LCFS program and sold for qualifying purposes. As a result, a portion of the selling price for a gallon of bio-based diesel sold into an LCFS market is also attributable to LCFS compliance. Like RINs, LCFS credits that we generate are a form of government incentive and not a result of the physical attributes of the bio-based diesel production. Therefore, no cost is allocated to an LCFS credit when it is generated, regardless of whether the LCFS credit is transferred with the bio-based diesel produced or held by us. LCFS prices in 2020 were high relative to historic prices throughout the year, only declining for short periods of time. We believe these high prices were largely attributable to growing demand for LCFS credits. During 2021, prices began to decline for California LCFS credits as the supply of these type of LCFS credits began to match the demand for the credits resulting in a market correction of prices, while Oregon LCFS credit prices remained relatively consistent.
The below table summarizes the approximate amounts of our LCFS credits available to be sold and the median closing price per LCFS credit at December 31, 2021 and 2020 according to OPIS:
| | | | | | | | | | | | | | | | | | | | | | | |
| Quantity | | OPIS Median Closing Price per LCFS Credit |
| December 31, 2021 | | December 31, 2020 | | December 31, 2021 | | December 31, 2020 |
| California LCFS | 18,690 | | | 2,618 | | | $ | 149.75 | | | $ | 199.00 | |
| Oregon LCFS | 797 | | | 8,967 | | | $ | 124.00 | | | $ | 123.00 | |
Services Segment
Our Services segment, which primarily provides services to our Bio-based Diesel Segment, includes:
•bio-based diesel facility management and operational services, whereby we provide day-to-day management and operational services to bio-based diesel production facilities; and
•construction management services, whereby we act as the construction management and general contractor for the construction of bio-based diesel production facilities.
Corporate and Other Segment
Our Corporate and Other segment includes:
•trading activities related to petroleum-based heating oil and diesel fuel, including the petroleum portion of sales of biodiesel and RD blended with petroleum-based diesel;
•corporate activities, which consist of corporate office expenses such as compensation, benefits, occupancy and other administrative costs, including management service expenses; and
•income/(expense) activities not associated with the reportable segments, such as corporate general and administrative expenses and shared service expense.
Impact of COVID-19 on Our Business
In March 2020, the World Health Organization declared COVID-19 a global pandemic and recommended containment and mitigation measures worldwide. The COVID-19 pandemic has negatively impacted the global economy, disrupted consumer spending and global supply chains, and created significant volatility and disruption of financial markets.
In response to the outbreak and business disruption, we have prioritized the health and safety of our employees. We have established a COVID-19 Emergency Response Team ("ERT") to monitor the health of our employees and mitigate the infection risk of our employees. Based on input from the ERT, we have implemented several initiatives in response to the COVID-19
pandemic, such as a remote workplace requirements for all office and administrative employees, social distancing protocols for our production employees and any visitors to our facilities, and additional paid time off for employees as needed in order to deal with health or family issues related to COVID-19. As more states, counties and schools have been re-opening and with the continued successful distribution of COVID-19 vaccines, we do not anticipate having to curtail or cease our operations due to COVID-19 in the foreseeable future.
Market demand for fuels was significantly impacted by COVID-19 in 2020, with significant signs of recovery in 2021. There continues to be economic activity and loosening of restrictions as more of the U.S. population gets vaccinated. We are optimistic that the U.S. economy is rebounding from the COVID-19 pandemic. The extent of the impact of the COVID-19 pandemic on our business remains uncertain and difficult to predict, as the duration and severity of the global pandemic evolves and variant strains of COVID-19 arise. We cannot estimate the duration and severity of the COVID-19 pandemic, or its overall impact on our business. We continue to monitor the impact of the COVID-19 pandemic and will adjust our operations, as necessary. We believe we have sufficient cash on hand, our investments in short-term marketable securities and the cash available to us to manage the anticipated impact of COVID-19 on our business operations for the foreseeable future. We do not currently plan or anticipate any changes to our workforce due to COVID-19.
For a further discussion of the uncertainties and business risks associated with the COVID-19 pandemic, see Part I, Item 1A. "Risk Factors."
Factors Influencing Our Results of Operations
The principal factors affecting our results of operations and financial conditions are the market prices for bio-based diesel and the feedstocks used to produce bio-diesel, as well as governmental programs designed to create incentives for the production and use of cleaner renewable fuels.
Governmental programs favoring bio-based diesel production and use
Bio-based diesel has historically been more expensive to produce than petroleum-based diesel. The bio-based diesel industry’s growth has largely been the result of federal and state programs that require or incentivize the production and use of bio-based diesel, which allows bio-based diesel to be price-competitive with petroleum-based diesel.
The RFS2 bio-based diesel requirement was implemented in 2010, stipulating volume requirements for the amount of bio-based diesel and other advanced biofuels that must be utilized in the United States each year. Under RFS2, Obligated Parties, including petroleum refiners and fuel importers, must show compliance with these standards. Currently, biodiesel and RD satisfy three categories of an Obligated Party’s annual renewable fuel required volume obligation, or RVO—bio-based diesel, advanced biofuel and renewable fuel. The final or proposed RVO targets for the bio-based diesel and advanced biofuels volumes for the years 2017 to 2022 as set by the EPA are as follows:
| | | | | | | | | | | | | | | | | | | | | |
| | 2017 | 2018 | 2019 | 2020 | 2021 | 2022** |
| Bio-based Diesel | | 2.00 billion gallons | 2.10 billion gallons | 2.10 billion gallons | 2.43 billion gallons | 2.43 billion gallons | 2.76 billion gallons |
| Total Advanced Biofuels | | 4.28 billion RINs* | 4.29 billion RINs* | 4.92 billion RINs* | 4.63 billion RINs*, ** | 5.20 billion RINs*, ** | 5.77 billion RINs* |
*Ethanol equivalent gallons
**Proposed RVO
The federal biodiesel mixture excise tax credit, or the BTC, has historically provided a $1.00 refundable tax credit per gallon to the first blender of bio-based diesel with petroleum-based diesel fuel. The BTC became effective January 1, 2005, but since January 1, 2010 it has been allowed to lapse and then been reinstated a number of times. The BTC was retroactively reinstated on December 20, 2019 for the fiscal years 2018 and 2019. The BTC was also extended through December 31, 2022.
As a result of this history of retroactive reinstatement of the BTC, we and many other bio-based diesel industry producers have adopted contractual arrangements with customers and vendors specifying the allocation and sharing of any retroactively reinstated incentive. The reinstatement of the 2018 and 2019 BTC resulted in an $483 million net benefit to our net income for the year ended December 31, 2019. The BTC net benefit was allocated to the corresponding quarterly non-GAAP adjusted earnings before interest, taxes, depreciation, and amortization ("Adjusted EBITDA") when the business giving rise to the retroactive credit was conducted. For the years ended December 31, 2019 and 2018, the reinstatement of the 2018 and 2019 BTC resulted in a net benefit to our Adjusted EBITDA of $254 million and $229 million, respectively.
Bio-based diesel and feedstock price fluctuations
Our operating results generally reflect the relationship between the price of bio-based diesel, including credits and incentives and the price of feedstocks used to produce bio-based diesel.
Bio-based diesel is a cleaner low carbon, renewable alternative to petroleum-based diesel fuel and is primarily sold to the end user after it has been blended with petroleum-based diesel fuel. Bio-based diesel prices have historically been heavily influenced by petroleum-based diesel fuel prices. Accordingly, bio-based diesel prices have generally been impacted by the same factors that affect petroleum prices, such as crude oil supply and demand balance, worldwide economic conditions, wars and other political events, OPEC production quotas, changes in refining capacity and natural disasters.
Regulatory and legislative factors also influence the price of bio-based diesel. LCFS credits, established by the California Low Carbon Fuel Standard regulation, which is a rule designed to reduce greenhouse gas emissions associated with transportation fuels used in California and the Oregon Clean Fuel Program, which requires a 10% reduction of the average carbon intensity of Oregon’s transportation fuels from 2015 levels by 2025, has had an increasing impact on our bio-based diesel pricing. In addition, bio-based diesel RIN pricing, a value component that was introduced via RFS2 in July 2010, has had a significant impact on our bio-based diesel pricing. The following table shows for 2019, 2020 and 2021 the high and low average monthly contributory value of RINs, as reported by OPIS, to the average B100 spot price of a gallon of biodiesel, as reported by OPIS in terms of dollars per gallon.
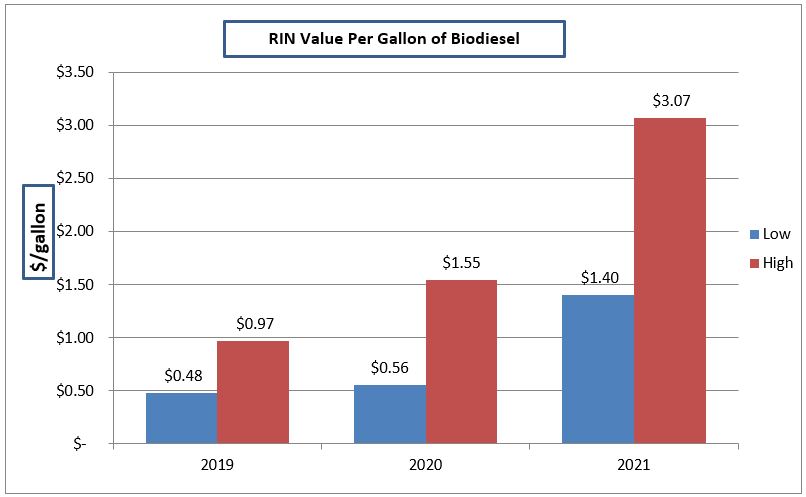
At the beginning of 2021, the value of RINs, as reported by OPIS, to the average B100 spot price of a gallon of biodiesel was $1.48 per gallon. The value of RINs to the average B100 spot price of a gallon of biodiesel grew to $2.26 per gallon at the end of December 2021. It reached a high of $3.07 per gallon of biodiesel in June 2021 and a low of $1.40 per gallon in January 2021. D4 RIN values trended higher throughout 2021, supported by D6 RIN values in which the D4 category can be used to satisfy an Obligated Party's D6 RIN obligation along with an increase in feedstock pricing relative to ULSD as seen in the heating oil to soybean oil ("HOBO") spread. During 2020, RINs were negatively impacted by the overall decrease in demand for transportation fuels due to COVID-19, which translated into reduced volume obligations for Obligated Parties under the RFS. We enter into forward contracts to sell RINs and we use risk management position limits that are intended to manage RIN exposure.
During 2021 and 2020, feedstock expense accounted for 87% and 80% of our direct production cost, respectively. Methanol expense accounted for 3% and 3%, respectively, and chemical catalysts for 2% and 3%, respectively of our costs of goods sold.
Feedstocks for bio-based diesel production, such as distillers corn oil, used cooking oil, inedible animal fat, canola oil and soybean oil are commodities and market prices for them will be affected by a wide range of factors unrelated to the price of bio-based diesel and petroleum-based diesel. There are a number of factors that influence the supply and price of our feedstocks, such as the following: bio-based diesel demand; export demand; government policies and subsidies; weather conditions; ethanol production; cooking habits and eating habits; number of restaurants near collection facilities; hog/beef/poultry supply and demand; palm oil supply; soybean meal demand and/or production, and crop production both in the U.S. and South America. Increasing production of bio-based diesel and, particularly recent and prospective expansion of RD capacity, and the development of alternative fuels and renewable chemicals also put pressure on feedstock supply and availability to the bio-based diesel industry. The bio-based diesel industry may have difficulty procuring feedstocks at economical prices if competition for bio-based diesel feedstocks increases due to newly added production capacity.
During 2021 and 2020, 78% and 65% of the feedstocks used in our operations, respectively, were comprised of distillers corn oil, used cooking oil and inedible animal fats with the remainder coming from virgin vegetable oils.
The recent increase in CME Soyoil Futures price has correlated with an increase in price for all of our feedstocks. This has increased the cost of producing bio-based diesel at our refineries.
The graph below illustrates the spread between the cost of producing one gallon of biodiesel made from soybean oil to the cost of producing one gallon of biodiesel made from the specified low carbon feedstock for the period January 2019 to December 2021. The results were derived using assumed conversion factors for the yield of each feedstock and subtracting the cost of producing one gallon of biodiesel made from each respective low carbon feedstock from the cost of producing one gallon of biodiesel made from soybean oil.
(1)Used cooking oil prices ("UCO") are based on the monthly average of the daily low sales price of C.I. adjusted Gulf of Mexico yellow grease as reported by The Jacobsen for the period of January 1, 2019 through June 30, 2019. The prices from July 1, 2019 through December 31, 2021 are based on the monthly average of the daily low sales price of Gulf of Mexico used cooking oil (based on 8.5 pounds per gallon).
(2)Distillers corn oil ("DCO") prices are reported as the monthly average of the daily distillers’ corn oil market values delivered to Illinois as reported by The Jacobsen (based on 8.2 pounds per gallon).
(3)Choice white grease ("CWG") prices are based on the monthly average of the daily low prices of Missouri River choice white grease as reported by The Jacobsen (based on 8.0 pounds per gallon).
(4)Soybean oil (crude) ("SBO") prices are based on the monthly average of the daily closing sale price of the nearby soybean oil contract as reported by CBOT (based on 7.5 pounds per gallons).
Our results of operations generally will benefit when the spread between bio-based diesel prices and feedstock prices widens and will be harmed when this spread narrows. The following graph shows feedstock cost data for choice white grease and soybean oil on a per gallon basis compared to the per gallon sale price data for biodiesel, and the spread between biodiesel and each of soybean oil and choice white grease from January 2019 to December 2021.
(1)Biodiesel prices are based on the monthly average of the midpoint of the high and low prices of B100 (Chicago SME) as reported by OPIS.
(2)Soybean oil (crude) prices are based on the monthly average of the daily closing sale price of the nearby soybean oil contract as reported by CBOT (based on 7.5 pounds per gallon).
(3)Choice white grease prices are based on the monthly average of the daily low price of Missouri River choice white grease as reported by The Jacobsen (based on 8.0 pounds per gallon).
(4)Distiller corn oil prices are based on the monthly average of the daily low price of Illinois distillers corn oil as reported by the Jacobsen (based on 8.2 pounds per gallon)
(5)Spread between biodiesel price and choice white grease price.
(6)Spread between biodiesel price and soybean oil (crude) price.
(7)Spread between biodiesel price and distillers corn oil price.
During 2021, NY Harbor ULSD prices ranged from a low of $1.46 per gallon at the start of January to a high of $2.59 per gallon in October with an average price for the year of $2.07 per gallon. COVID Omicron variant severely shocked the market in November into mid-December, but by late December demand destruction concerns abated and employment numbers continued to improve. Despite these indications, OPEC+ has remained at its set re-supply level rather than increase supply, and U.S. shale producers continue to slowly add new oil well rigs. Commodity prices have broadly rallied and relatively higher levels of inflation have supported the broader commodity asset class. In November, the EPA released proposed RVO with a 2022 increase in biomass based diesel demand providing support for 2022 D4 RIN values.
The U.S. biodiesel prices increased significantly during 2021. The average U.S. biodiesel price, as indicated by the Chicago SME B100 price reported by OPIS, was $5.23 per gallon for 2021. During 2021, B100 prices reached a high of $6.15 in June and a low of $3.72 in January.
CBOT soybean oil prices ranged from a low of $0.42 per pound in January to a high of $0.72 per pound in June with an average price for the year of $0.58 per pound. The soybean complex rebounded from the November Omicron variant scare and ended the year higher as South American dry weather raised concerns about production and the United States faced a lysine shortage for animal feed, creating demand for soybean meal. Choice white grease prices ranged from a low of $0.30 in January to a high of $0.64 per pound in August with an average price for the year of $0.49 per pound.
Risk Management
The profitability of producing bio-based diesel largely depends on the spread between prices for feedstocks and bio-based diesel, including incentives, each of which is subject to fluctuations due to market factors and each of which is not significantly correlated. Adverse price movements for these commodities directly affect our operating results. We attempt to protect cash margins for our own production and our third-party trading activity by entering into risk management contracts that mitigate the impact on our margins from price volatility in feedstocks and bio-based diesel. We create offsetting positions by using a combination of forward fixed-price physical purchases and sales contracts on feedstock and bio-based diesel and risk management futures contracts, swaps and options primarily on the New York Mercantile Exchange NY Harbor ULSD and CBOT Soybean Oil; however, the extent to which we engage in risk management activities varies substantially from time to time, and from feedstock to feedstock, depending on market conditions and other factors. In making risk management decisions, we utilize research conducted by outside firms to provide additional market information in addition to our internal research and analysis.
Distillers corn oil, used cooking oil, inedible animal fat, canola oil and soybean oil are the primary feedstocks we used to produce bio-based diesel in 2019, 2020 and 2021. We utilize several varieties of inedible animal fat, such as beef tallow, choice white grease and poultry fat derived from livestock. There is no established futures market for these low carbon feedstocks. The purchase prices for low carbon feedstocks are generally set on a negotiated flat price basis or spread to a prevailing market price reported by the USDA price sheet or The Jacobsen. Our efforts to risk manage against changing prices for distillers corn oil, used cooking oil and inedible animal fat have involved entering into futures contracts, swaps or options on other commodity products, such as CBOT soybean oil and New York Mercantile Exchange NY Harbor ULSD. However, these products do not always experience the same price movements as low carbon feedstocks, making risk management for these feedstocks challenging. We manage feedstock supply risks related to bio-based diesel production in a number of ways, including, where available, through long-term supply contracts. The purchase price for soybean oil under these contracts may be indexed to prevailing CBOT soybean oil market prices with a negotiated market basis. We utilize futures contracts, swaps and options to risk manage, or lock in, the cost of portions of our future feedstock requirements generally for varying periods up to one year.
Our ability to mitigate our risk of falling bio-based diesel prices is limited. We have entered into forward contracts to supply bio-based diesel. However, pricing under these forward sales contracts generally has been indexed to prevailing market prices, as fixed price contracts for long periods on acceptable terms have generally not been available. There is no established derivative market for bio-based diesel in the United States. Our efforts to hedge against falling bio-based diesel prices generally involve entering into futures contracts, swaps and options on other commodity products, such as diesel fuel and New York Mercantile Exchange NY Harbor ULSD. However, price movements on these products are not highly correlated to price movements of bio-based diesel.
We generate 1.5 to 1.7 bio-based diesel RINs for each gallon of bio-based diesel we produce and sell. We also obtain RINs from third party transactions which we hold for resale. There is no effective established futures market for bio-based diesel RINs, which severely limits the ability to risk manage the price of RINs. We enter into forward contracts to sell RINs, and we use risk management position limits to manage RIN exposure, however, pricing under those forward contracts generally has been indexed to prevailing market prices as fixed price contracts for long periods have generally not been available.
As a result of our strategy, we frequently have gains or losses on derivative financial instruments that are conversely offset by losses or gains on forward fixed-price physical contracts on feedstocks and bio-based diesel or inventories. Gains and losses on derivative financial instruments are recognized each period in operating results while corresponding gains and losses on physical contracts are generally not recognized until quantities are delivered or title transfers which may be in the same or later periods. Our results of operations are impacted when there is a period mismatch of recognized gains or losses associated with the change in fair value of derivative instruments used for risk management purposes at the end of the reporting period but the purchase or sale of feedstocks or bio-based diesel has not yet occurred and thus the offsetting gain or loss will be recognized in a later accounting period.
We had risk management gains of $2.4 million from our derivative financial instrument trading activity for the year ended December 31, 2021, compared to risk management gains of $36.9 million for the year ended December 31, 2020. Changes in the value of these futures or swap instruments are reflected in current income or loss, generally within our cost of goods sold. In general, risk management gains and losses resulting from fluctuations in feedstock and energy prices are largely offset by an inverse gain or loss on physical product purchases and sales.
Increasing importance of RD
RD is made from the same renewable resources as biodiesel but uses a different production process. The result is a renewable fuel that is chemically identical, and a drop-in replacement, to petroleum diesel. RD is a relatively new fuel but has
quickly become popular because it reduces emissions and delivers strong performance. RD can also be blended with biodiesel. Our proprietary blend of RD and biodiesel which we call REG Ultra Clean® captures the best properties of the two fuels.
RD has become an increasingly significant part of our business. RD carries a premium price to biodiesel as a result of a variety of factors including the ability to blend it with petroleum diesel seamlessly, better cold weather performance, and because it generates more RINs on a per gallon basis. Our RD production facility in Geismar, Louisiana generated a significant portion of our adjusted EBITDA in 2020 and in 2021. We experienced two fires at this facility in 2015 that each resulted in the plant being shut down for a certain period of time. If production at this facility were interrupted again due to a fire or a global pandemic such as COVID-19, it would have a disproportionately significant and material adverse impact on our results of operations and financial condition.
Seasonality
Our operating results are influenced by seasonal fluctuations in the demand for bio-based diesel. Our biodiesel sales tend to decrease during the winter season due to reduced blending concentrations to adjust for performance during colder weather. Colder seasonal temperatures can cause the higher cloud point biodiesel we make from inedible animal fats to become cloudy and eventually gel at a higher temperature than petroleum-based diesel, RD, or lower cloud point biodiesel made from soybean oil, canola oil or distillers corn oil. Such gelling can lead to plugged fuel filters and other fuel handling and performance problems for customers and suppliers. Reduced demand in the winter for our higher cloud point biodiesel can result in excess supply of such higher cloud point biodiesel and lower prices for such biodiesel. In addition, most of our biodiesel production facilities are located in colder Midwestern states in proximity to feedstock origination, and our costs of shipping can increase as more biodiesel is transported to warmer climate geographies during winter. To mitigate some of these seasonal fluctuations, we have upgraded our Newton and Danville biorefineries to produce distilled biodiesel from low-cost feedstocks, which has improved cold-weather performance.
RIN prices may also be subject to seasonal fluctuations. The RIN is dated for the calendar year in which it is generated, commonly referred to as the RIN vintage. Since 20% of the annual RVO of an Obligated Party can be satisfied by prior year RINs, most RINs must come from biofuel produced or imported during the RVO year. As a result, RIN prices can be expected to decrease as the calendar year progresses if the RIN market is oversupplied compared to that year's RVO and increase if the market is undersupplied. See chart below for comparison between actual RIN generation and RVO level for advanced biofuel as set by the EPA.
| | | | | | | | | | | | | | | | | | | | |
| Year | | RIN Generation (Advanced Biofuel) | | Finalized RVO level for Advanced Biofuel | | Estimated Advanced Biofuel RVO Exempted due to SREs |
| 2017 | | 4.23 billion RINs | | 4.28 billion RINs* | | 0.40 billion RINs |
| 2018 | | 4.34 billion RINs | | 4.29 billion RINs* | | 0.32 billion RINs |
| 2019 | | 4.87 billion RINs | | 4.92 billion RINs* | | ** |
| 2020 | | 5.28 billion RINS | | 4.63 billion RINs*, *** | | ** |
| 2021 | | 5.67 billion RINS | | 5.20 billion RINs*** | | ** |
* Ethanol equivalent gallons
** Not yet determined
*** Proposed amount
Industry capacity, production and imports
Our operating results are influenced by our industry's capacity and production, including in relation to RFS2 production requirements. Bio-based diesel production and/or imports, as reported by EMTS, were 2.65 billion gallons in 2019, 2.88 billion gallons in 2020, and 3.09 billion gallons in 2021.
According to the U.S. Energy Information Administration, the amount of imported biodiesel gallons qualifying under RFS2 increased from 423.7 million gallons in 2019 to approximately 476.4 million gallons in 2020. The amount of imported biodiesel was at approximately 552.6 million gallons through November 30, 2021.
Components of Revenues and Expenses
Continuing Operations:
We derive revenues in our Bio-based Diesel segment from the following sources:
•sales of biodiesel and RD produced at our facilities, including RINs and LCFS credits, transportation, storage and insurance costs to the extent paid for by our customers;
•resale of finished bio-based diesel, RD, RINs and LCFS credits acquired from third parties, and raw material feedstocks acquired from others;
•revenues from our sale of petroleum-based heating oil and ultra-low sulfur diesel, or ULSD, acquired from third parties, along with the sale of these petroleum-based products further blended with bio-based diesel;
•sales of glycerin, other co-products of the bio-based diesel production process; and
•incentive payments from federal and state governments, including the BTC, and from the USDA Advanced Biofuel Program.
We derive revenues in our Services segment from the following sources - primarily internal:
•fees received from operations management services that we provide for bio-based diesel production facilities, typically based on production rates and profitability of the managed facility; and
•amounts received for services performed by us in our role as general contractor and construction manager for upgrades and repairs to our bio-based diesel production facilities.
Cost of goods sold for our Bio-based Diesel segment includes:
•with respect to our production facilities, expenses incurred for feedstocks, catalysts and other chemicals used in the production process, leases, utilities, depreciation, salaries and other indirect expenses related to the production process, and, when required by our customers, transportation, storage and insurance;
•with respect to fuel and RINs acquired from third parties, the purchase price of bio-based diesel and RINs on the spot market or under contract, and related expenses for transportation, storage, insurance, labor and other indirect expenses;
•adjustments made to reflect the lower of cost or market values of our finished goods inventory, including RINs acquired from third parties;
•expenses from the purchase of petroleum-based heating oil and ULSD acquired from third parties; and
•changes during the applicable accounting period in the market value of derivative and hedging instruments, such as exchange traded contracts, related to feedstocks and commodity fuel products.
Cost of goods sold for our Services segment includes:
•with respect to our facility management and operations activities, primarily salary expenses for the services of management employees for each facility and others who provide sourcing, marketing and various administrative functions; and
•with respect to our construction management services activities, primarily our payments to subcontractors constructing the production facility and providing the bio-based diesel processing equipment, and, to a much lesser extent, salaries and related expenses for our employees involved in the construction process.
Selling, general and administrative expense consists of expenses generally involving corporate overhead functions at our domestic and international offices, and research and development activities.
Impairment of property, plant and equipment represents non-cash impairment charges of certain property, plant and equipment items.
Other income (expense), net is primarily comprised of the gain (loss) on debt extinguishment, gain on lease termination, interest expense, interest income and other non-operating items.
Discontinued Operations:
There was no activity classified as discontinued operations for the fiscal year ended December 31, 2021 or 2020. Net loss from discontinued operations for the fiscal year ended December 31, 2019 was attributable to costs that primarily relate to certain pre-existing contractual agreements and legal and professional fees related to the disposition and wind-down of our Life Sciences operations.
Critical Accounting Policies
Our discussion and analysis of our financial condition and results of operations is based upon our financial statements, which have been prepared in accordance with accounting principles generally accepted in the United States. The preparation of
these financial statements requires us to make estimates and judgments that affect the reported amount of assets, liabilities, equities, revenues and expenses and related disclosure of contingent assets and liabilities. We evaluate our estimates on an ongoing basis. We base our estimates on historical experience and on various other assumptions that we believe to be reasonable under the circumstances, the results of which form the basis for judgments we make about the carrying values of assets and liabilities that are not readily apparent from other sources. Because these estimates can vary depending on the situation, actual results may differ from the estimates.
We believe the following critical accounting policies affect our more significant judgments used in the preparation of our consolidated financial statements:
Income Taxes
Our income tax provision, deferred income tax assets and liabilities, and liabilities for unrecognized tax benefits represent the Company’s best estimate of current and future income taxes to be paid. We are subject to income taxes in the U.S. and several non-U.S. jurisdictions. Our annual effective tax rate is based on income tax laws, statutory tax rates, taxable income levels and tax planning opportunities available in various jurisdictions where we operate. These tax laws are complex and require significant judgment to determine the consolidated provision for income taxes. Changes in tax laws, statutory tax rates, and estimates of our future taxable income levels could result in actual realization of deferred taxes being materially different from amounts provided for in the consolidated financial statements.
Deferred income taxes represent temporary differences between the tax and the financial reporting basis of assets and liabilities, which will result in taxable or deductible amounts in the future. Deferred tax assets also include loss carryforwards and tax credits. We assess deferred tax assets on an individual jurisdiction basis, and are regularly assessed for the likelihood of recoverability from estimated future taxable income, reversal of deferred tax liabilities and tax planning strategies. To the extent we determine that it is more likely than not a deferred income tax asset will not be realized based on an assessment of positive and negative evidence including historical earnings, future taxable income that incorporates prudent and feasible tax planning strategies, and the scheduled reversals of deferred tax assets and liabilities, a valuation allowance is established. The recoverability analysis of the deferred income tax assets and the related valuation allowances requires significant judgment and relies on estimates. Changes in tax statutes, the timing of deductibility of expenses or expectations for future performance could result in material adjustments to our valuation allowances, which would increase or decrease tax expense.
The indefinite reinvestment in the earnings of non-US subsidiaries assertion is determined by management’s judgment about and intentions concerning future investment in operations. Management’s judgment is that we are not indefinitely reinvested in the undistributed earnings of our non-US subsidiaries at December 31, 2021. The assertion regarding undistributed non-US earnings does not have a material impact on our consolidated financial statements.
Revenue Recognition
Revenue is recognized when a customer obtains control of promised goods or services in an amount that reflects the consideration the entity expects to receive in exchange for those goods or services. We have generally a single performance obligation in our arrangements with customers. We believe for most of our contracts with customers, control is transferred at a point in time, typically upon delivery to the customers. When we perform shipping and handling activities after the transfer of control to the customers (e.g., when control transfers prior to delivery), they are considered as fulfillment activities, and accordingly, the costs are accrued for when the related revenue is recognized. Taxes collected from customers relating to product sales and remitted to governmental authorities are excluded from revenues. We generally expense sales commissions when incurred. We record these costs within selling, general and administrative expenses.
Revenues associated with governmental incentive programs are recognized when the amount to be received is determinable, collectability is reasonably assured and the sale of product giving rise to the incentive has been recognized. Our revenue from governmental incentive programs is generally comprised of amounts received from the USDA Advanced Biofuel Program, or the USDA Program, and the biodiesel tax credit. In connection with the biodiesel tax credit, we file a claim with the Internal Revenue Service for a refund of excise taxes each week for gallons we have blended to B99.9 and sold. The biodiesel tax credit provided a $1.00 refundable tax credit per gallon.
Results of Operations
Fiscal years ended December 31, 2021 and December 31, 2020
Set forth below is a summary of certain financial information (dollars in thousands and gallons in millions except per gallon data) for the periods indicated:
| | | | | | | | | | | |
| Twelve Months Ended
December 31, |
| 2021 | | 2020 |
| Gallons sold | 621.3 | | | 650.5 | |
| Average bio-based diesel price per gallon | $ | 4.46 | | | $ | 2.91 | |
| | | |
| Revenues | $ | 3,244,050 | | | $ | 2,137,148 | |
| Costs of goods sold | 2,874,157 | | | 1,868,794 | |
| Gross profit | 369,893 | | | 268,354 | |
| Selling, general and administrative expenses | 140,511 | | | 119,302 | |
| Gain on disposal of property, plant and equipment | (1,462) | | | (205) | |
| | | |
| Impairment of property, plant and equipment | 7,359 | | | 22,404 | |
| | | |
| Income from operations | 223,485 | | | 126,853 | |
| Other income (expense), net | (24,145) | | | 1,889 | |
| Income tax benefit (expense) | 14,479 | | | (5,929) | |
| | | |
| | | |
| | | |
| | | |
| Net income | 213,819 | | | 122,813 | |
| | | |
| Effects of participating share-based awards | (2,128) | | | (2,398) | |
| Net income available to common stockholders | $ | 211,691 | | | $ | 120,415 | |
| | | |
Results of Operations:
Revenues. Our total revenues increased $1.1 billion, or 52%, to $3.2 billion for the year ended December 31, 2021, from $2.1 billion for the year ended December 31, 2020. The significant increase in revenue was primarily attributable to a substantial increase in the average bio-based diesel price per gallon. In 2021, ULSD prices averaged $2.07 per gallon, compared to $1.25 per gallon in 2020. The significant increase in ULSD prices resulted from general market optimism and improving demand stemming from the easing of lockdown measures in the United States and internationally, particularly when compared to 2020 where prices hit historical lows due to the onset of the COVID-19 pandemic and strict lockdowns and only slowly recovered. RIN values trended higher throughout 2021 along with an increase in feedstock pricing relative to ULSD values as seen in the heating oil to soybean oil spread. As a result of these factors, our average selling price significantly increased by $1.55, or 53%, in 2021 compared to 2020. Sales of LCFS credits and separated RINs were $158.9 million and $355.5 million for the year ended December 31, 2021 compared to $131.3 million and $129.7 million for the year ended December 31, 2020. The increase in total revenues was partially offset by a decrease in total gallons sold of 29.2 million gallons, or 4%, from 2021 compared to 2020, as a result of our focus on product mix and optimization of gallons sold.
The increase in the average sales price contributed to a $1.0 billion increase in revenues for the year ended December 31, 2021, when applied to the number of gallons sold in 2020. The increase in RIN prices also positively affected separated RIN sales resulting in a revenue increase of $225.8 million, or an increase of 174% for the year ended December 31, 2021, compared to 2020. The decrease in gallons sold for the year ended December 31, 2021, accounted for a revenue decrease of $130.2 million, using the average selling price for bio-based diesel for the current period. Also negatively affecting revenues was the $14.5 million decrease in government incentives revenue in 2021, caused by lower BTC revenues due to lower gallons sold.
Costs of goods sold. Our costs of goods sold increased $1.0 billion, or 54%, to $2.9 billion for the year ended December 31, 2021, from $1.9 billion for the year ended December 31, 2020. Costs of goods sold as a percentage of revenues were 89% and 87% for the years ended December 31, 2021 and 2020, respectively. The increase in costs of goods sold was primarily driven by significantly higher feedstock costs in the year ended December 31, 2021 compared to 2020, as described below. The increase was also driven by lower risk management gains of $2.4 million for the year ended December 31, 2021, compared to gains of $36.9 million in 2020.
We experienced significantly higher costs across all of our feedstocks in the year ended December 31, 2021. Average prices for low carbon feedstocks used in our production process for the years ended December 31, 2021 and December 31, 2020, were $0.52 and $0.29 per pound, respectively. Average soybean oil costs for the years ended December 31, 2021 and December 31, 2020 were $0.60 and $0.32 per pound, respectively. Average canola oil costs for the years ended December 31,
2021 and December 31, 2020 were $0.62 and $0.32 per pound, respectively. Average distillers corn oil costs were $0.52 and $0.27 per pound, respectively, for the years ended December 31, 2021 and December 31, 2020.
Selling, general and administrative expenses. Our selling, general and administrative, or SG&A, expenses increased $21.2 million, or 18%, to $140.5 million for the year ended December 31, 2021, compared to $119.3 million for the year ended December 31, 2020. As a percentage of revenues, our SG&A expenses were 4.3% and 5.6% for 2021 and 2020, respectively. The $21.2 million increase year over year resulted primarily from higher employee related compensation and benefits and legal and professional expenses.
Impairment of property, plant and equipment. In 2021, we recorded a property, plant and equipment impairment of approximately $7.4 million, related to certain biodiesel property, plant and equipment as the carrying amounts of these assets were deemed not recoverable given the assets' deteriorating physical conditions identified during the period. During 2020 we recorded $22.4 million, of which $19.0 million relates to certain equipment that we determined will not be used in future RD production expansions. The remaining impairment was related to impairment charges against certain biodiesel property, plant and equipment as the carrying amounts of these assets were deemed not recoverable given the assets' economic obsolescence identified during the period.
Other income (expense), net. Other expense was $24.1 million for the year ended December 31, 2021, compared to other income of $1.9 million for the year ended December 31, 2020. Other income (expense) is primarily comprised of interest expense, interest income, gain (loss) on debt extinguishment, gain on termination, and other non-operating items. In 2021, we had interest expense of $21.9 million primarily due to the issuance of our Green Notes, compared to interest expense of $7.9 million for the same period in 2020. We also had a $4.4 million loss on debt extinguishment and in 2021 compared to a $1.8 million gain on debt extinguishment in the same period in 2020. We had a gain on lease termination for the year ended of December 31, 2020 of $4.5 million.
Income tax benefit (expense). Income tax benefit recorded during the year ended December 31, 2021 was $14.5 million, compared to an income tax expense of $5.9 million for the year ended December 31, 2020, the change for which is primarily resulting from the $6.1 million release of a valuation allowance in a non-US jurisdiction due to a change in judgement about our ability to realize the benefit of deferred tax assets, and the $13.1 million release of a valuation allowance in the US due to the recording of deferred tax liabilities in the acquisition of Amber Resources that will offset future deferred tax assets. At December 31, 2021 and December 31, 2020, we had net deferred income tax assets of approximately $394.4 million and $381.2 million, respectively, with a valuation allowance of $392.9 million and $387.8 million, respectively. As a result, our effective tax rate was (7.3)% and 4.6% for the years ended December 31, 2021 and 2020, respectively.
Effects of participating share-based awards. Effects of participating restricted stock units was $2.1 million and $2.4 million for the years ended December 31, 2021 and 2020, respectively.
Fiscal years ended December 31, 2020 and December 31, 2019
Set forth below is a summary of certain financial information (dollars in thousands and gallons in millions except per gallon data) for the periods indicated:
| | | | | | | | | | | |
| Twelve Months Ended
December 31, |
| 2020 | | 2019 |
| |
| Gallons sold | 650.5 | | | 700.3 | |
| Average bio-based diesel price per gallon (ASP with BTC net benefit allocated to the corresponding period of $3.21 for the year ended December 31, 2019) | $ | 2.91 | | | $ | 3.62 | |
| | | |
| Revenues from continuing operations | $ | 2,137,148 | | | $ | 2,625,216 | |
| Costs of goods sold from continuing operations | 1,868,794 | | | 2,111,324 | |
| Gross profit from continuing operations | 268,354 | | | 513,892 | |
| Selling, general and administrative expenses | 119,302 | | | 118,209 | |
| | | |
| Gain on disposal of property, plant and equipment | (205) | | | — | |
| Impairment of property, plant and equipment | 22,404 | | | 12,208 | |
| Income from operations | 126,853 | | | 383,475 | |
| Other income (expense), net | 1,889 | | | (11,550) | |
| Income tax benefit (expense) | (5,929) | | | 570 | |
| | | |
| Net income from continuing operations | 122,813 | | | 372,495 | |
| | | |
| | | |
| Net loss from discontinued operations | — | | | (9,667) | |
| Net income | 122,813 | | | 362,828 | |
| | | |
| | | |
| Effects of participating share-based awards on continuing operations | (2,398) | | | (8,238) | |
| Net income from continuing operations available to common stockholders | $ | 120,415 | | | $ | 364,257 | |
| Net loss from discontinued operations available to common stockholders | $ | — | | | $ | (9,667) | |
Continuing Operations:
Revenues. Our total revenues decreased $488.1 million, or 19%, to $2.1 billion for the year ended December 31, 2020, from $2.6 billion for the year ended December 31, 2019. Due to the retroactive reinstatement of the BTC in December 2019 for the 2018-2019 periods, in the fourth quarter of 2019, we recognized $490.6 million of BTC government incentives revenue net of sharing with customers, $227.9 million of which was attributable to sales in 2018 and $262.7 million of which was attributable to sales in 2019. In contrast, 2020 total revenues only included the 2020 BTC. The decrease in total revenues was also driven by a decrease in total gallons sold of 49.8 million gallons, or 7%, and a decrease in average selling price including the BTC allocation to the period in which the gallons were sold of $0.30. Sales of LCFS and separated RINs were $131.3 million and $129.7 million for the year ended December 31, 2020 as compared to $106.5 million and $98.3 million for the year ended December 31, 2019 offset the overall decrease in biomass-based diesel revenues in 2020.
Biomass-based diesel revenues including government incentives decreased $487.8 million, or 19%, to $2.1 billion during the year ended December 31, 2020, from $2.6 billion for the year ended December 31, 2019. The decrease in revenues was largely attributable to the recognition in the fourth quarter of 2019 of BTC revenue relating to operations in both 2019 and 2018, while 2020 only included BTC revenue related to 2020 operations. Gallons sold decreased 49.8 million, or 7%, to 650.5 million during the year ended December 31, 2020, compared to 700.3 million during the year ended December 31, 2019. The decrease in gallons sold for the year ended December 31, 2020 accounted for a revenue decrease of $144.9 million using 2020 average sales pricing. Our average biomass-based diesel sales price per gallon including the BTC net benefits decreased $0.71, or 20%, to $2.91 during the year ended December 31, 2020 compared to $3.62 during the year ended December 31, 2019. When allocating the BTC net benefits to the period in which the associated gallons were sold, our average biomass-based diesel sales price decreased $0.30, or 9%, compared to $3.23 for 2019. This decrease was mainly due to the lower energy prices in 2020 as a result of the COVID-19 pandemic and OPEC production policies. The decrease in average sales price with allocated BTC net benefits from 2020 to 2019 contributed to a $210.1 million revenue decrease when applied to the number of gallons sold during 2019.
Costs of goods sold. Our costs of goods sold decreased $242.5 million, or 11%, to $1.9 billion for the year ended December 31, 2020, from $2.1 billion for the year ended December 31, 2019. Costs of goods sold as a percentage of revenues were 87% and 80% for the years ended December 31, 2020 and 2019, respectively.
Biomass-based diesel costs of goods sold as a percentage of revenues increased in 2020 mainly due to a 7% decrease in gallons sold as well as an increase in average costs for feedstocks. Average low carbon feedstocks prices for the years ended
December 31, 2020 and December 31, 2019, were $0.29 and $0.26 per pound, respectively. Average soybean oil costs for the years ended December 31, 2020 and December 31, 2019 were $0.32 and $0.31 per pound. We recorded risk management gains of $36.9 million from our derivative financial instrument activity in 2020, compared to risk management losses of $28.9 million for 2019, contributing to a reduction in the overall costs of goods sold. Our risk management gains and losses are directly impacted by any volatility in the energy and commodities market.
Selling, general and administrative expenses. Our selling, general and administrative, or SG&A, expenses increased $1.1 million, or 1%, to $119.3 million for the year ended December 31, 2020, compared to $118.2 million for the year ended December 31, 2019. As a percentage of revenues, our SG&A expenses were 5.6% and 4.5% for 2020 and 2019, respectively. The increase year over year was driven largely by lower total revenues in 2020.
Impairment of property, plant and equipment. We recorded a property, plant and equipment impairment in 2020 of approximately $22.4 million, of which $19.0 million relates to certain equipment that we determined will not be used in future RD production expansions. In addition, we recorded impairment charges against certain biodiesel property, plant and equipment as the carrying amounts of these assets were deemed not recoverable given the assets' economic obsolescence identified during the period. During 2019, we recorded a $12.2 million impairment charge mainly due to the closure of the New Boston refinery.
Other income (expense), net. Other income was $1.9 million for the year ended December 31, 2020, compared to other expense of $11.6 million for the year ended December 31, 2019. Other income (expense) is primarily comprised of interest expense, gain on debt extinguishment, gain on lease termination, and other non-operating items. In 2020, we had a gain on lease termination of $4.5 million related to the termination of a terminal lease at our non-operational New Orleans facility compared to the absence of lease terminations in 2019. We also had a $1.8 million gain on debt extinguishment and in 2020 compared to a $0.5 million gain on debt extinguishment, a difference of $1.3 million. The $14.3 million net increase in other income (expense) in 2020 was primarily due to the items noted above as well as lower interest expense of $5.3 million between the periods.
Income tax benefit (expense). Income tax expense recorded during the year ended December 31, 2020 was $5.9 million, compared to income tax benefit of $0.6 million for the year ended December 31, 2019, with the increase in expense primarily resulting from additional tax expense incurred in connection with the repurchase of a greater amount of our 2016 convertible debt in 2020 compared to repurchases in 2019, and taxable profits in our foreign operations. At December 31, 2020 and 2019, we had net deferred income tax assets of approximately $381.2 million and $343.9 million, respectively, with a valuation allowance of $387.8 million and $350.9 million, respectively. As a result, our effective tax rate was 4.6% and 0.2% for the years ended December 31, 2020 and 2019, respectively.
Effects of participating share-based awards. Effects of participating restricted stock units was $2.4 million and $8.2 million for the years ended December 31, 2020 and 2019, respectively.
Discontinued Operations:
For the year ended December 31, 2020, there was no activity classified as discontinued operations. Net loss from discontinued operations for the year ended December 31, 2019 of $9.7 million was attributable to the research and development activities at the REG Life Sciences business and costs to sell the business.
Non - GAAP Financial Measures
Adjusted EBITDA
Earnings before interest, taxes, depreciation and amortization ("EBITDA") and Adjusted EBITDA are not measures of financial performance under GAAP. We use EBITDA and EBITDA adjusted for certain additional items, identified in the table below, or Adjusted EBITDA, as a supplemental performance measure. We present EBITDA and Adjusted EBITDA because we believe they assist investors in analyzing our performance across reporting periods on a consistent basis by excluding items that we do not believe are indicative of our core operating performance. In addition, we use Adjusted EBITDA to evaluate, assess and benchmark our financial performance on a consistent and a comparable basis and as a factor in determining incentive compensation for our executives.
| | | | | | | | | | | | | | | | | | | | | | | | | | | | | | | | | | | | | | | | | | | | | | | | | | | | | | | | | | | |
| (In thousands) | | | | | | | | | Year ended December 31, | | | | | | | | | | Year ended December 31, |
| 1Q-2021 | | 2Q-2021 | | 3Q-2021 | | 4Q-2021 | | 2021 | | 1Q-2020 | | 2Q-2020 | | 3Q-2020 | | 4Q-2020 | | 2020 |
| Net income (loss) | $ | 39,222 | | | $ | 79,516 | | | $ | 42,467 | | | $ | 52,614 | | | $ | 213,819 | | | $ | 74,667 | | | $ | (1,685) | | | $ | 22,663 | | | $ | 27,168 | | | $ | 122,813 | |
| Adjustments: | | | | | | | | | | | | | | | | | | | |
Interest expense | 1,117 | | | 4,271 | | | 8,619 | | | 7,942 | | | 21,949 | | | 2,946 | | | 1,664 | | | 1,544 | | | 1,757 | | | 7,911 | |
| Income tax (benefit) expense | 1,633 | | | 2,250 | | | 652 | | | (19,014) | | | (14,479) | | | 1,331 | | | 1,630 | | | 1,046 | | | 1,922 | | | 5,929 | |
Depreciation | 10,915 | | | 11,088 | | | 11,098 | | | 10,329 | | | 43,430 | | | 8,934 | | | 9,103 | | | 9,388 | | | 9,890 | | | 37,315 | |
| Amortization of intangible and other assets | 671 | | | 918 | | | 876 | | | 1,010 | | | 3,475 | | | 353 | | | 318 | | | 591 | | | 510 | | | 1,772 | |
EBITDA | 53,558 | | | 98,043 | | | 63,712 | | | 52,881 | | | 268,194 | | | 88,231 | | | 11,030 | | | 35,232 | | | 41,247 | | | 175,740 | |
| | | | | | | | | | | | | | | | | | | |
Gain on sale of assets | — | | | (39) | | | — | | | (1,423) | | | (1,462) | | | — | | | (187) | | | — | | | (18) | | | (205) | |
| | | | | | | | | | | | | | | | | | | |
| | | | | | | | | | | | | | | | | | | |
(Gain) loss on debt extinguishment | 1,922 | | | 2,527 | | | — | | | — | | | 4,449 | | | (1,172) | | | (619) | | | (18) | | | — | | | (1,809) | |
| Gain on lease termination | — | | | — | | | — | | | — | | | — | | | — | | | (4,459) | | | — | | | — | | | (4,459) | |
| Interest income | (652) | | | (399) | | | (424) | | | (592) | | | (2,067) | | | — | | | (550) | | | (777) | | | (898) | | | (2,225) | |
| Other (income) expense, net | (1,440) | | | (543) | | | (258) | | | 2,055 | | | (186) | | | 304 | | | (1,665) | | | (817) | | | 870 | | | (1,308) | |
Impairment of assets | 822 | | | 916 | | | 3,498 | | | 2,123 | | | 7,359 | | | — | | | — | | | 19,256 | | | 3,148 | | | 22,404 | |
| | | | | | | | | | | | | | | | | | | |
| | | | | | | | | | | | | | | | | | | |
| | | | | | | | | | | | | | | | | | | |
Executive severance | — | | | 663 | | | — | | | — | | | 663 | | | — | | | — | | | — | | | — | | | — | |
| Stock compensation expense | 1,844 | | | 1,962 | | | 1,964 | | | 2,227 | | | 7,997 | | | 1,367 | | | 2,611 | | | 1,811 | | | 1,909 | | | 7,698 | |
| | | | | | | | | | | | | | | | | | | |
| | | | | | | | | | | | | | | | | | | |
| | | | | | | | | | | | | | | | | | | |
| | | | | | | | | | | | | | | | | | | |
| Adjusted EBITDA | $ | 56,054 | | | $ | 103,130 | | | $ | 68,492 | | | $ | 57,271 | | | $ | 284,947 | | | $ | 88,730 | | | $ | 6,161 | | | $ | 54,687 | | | $ | 46,258 | | | $ | 195,836 | |
Adjusted EBITDA is a supplemental performance measure that is not required by, or presented in accordance with, generally accepted accounting principles, or GAAP. Adjusted EBITDA should not be considered as an alternative to net income or any other performance measure derived in accordance with GAAP, or as alternatives to cash flows from operating activities or a measure of our liquidity or profitability. Adjusted EBITDA has limitations as an analytical tool, and should not be considered in isolation, or as a substitute for any of our results as reported under GAAP. Some of these limitations are:
•Adjusted EBITDA does not reflect our cash expenditures or the impact of certain cash charges that we consider not to be an indication of our ongoing operations;
•Adjusted EBITDA does not reflect changes in, or cash requirements for, our working capital requirements;
•Adjusted EBITDA does not reflect the interest expense, or the cash requirements necessary to service interest or principal payments, on our indebtedness;
•although depreciation and amortization are non-cash charges, the assets being depreciated and amortized will often have to be replaced in the future, and Adjusted EBITDA does not reflect cash requirements for such replacements;
•stock-based compensation expense is an important element of our long term incentive compensation program, although we have excluded it as an expense when evaluating our operating performance; and
•other companies, including other companies in our industry, may calculate these measures differently than we do, limiting their usefulness as a comparative measure.
Liquidity and Capital Resources
Our principal sources of liquidity are existing cash balances, marketable securities, cash generated by our operations and our ability to borrow under our revolving credit facilities, or such other credit facilities as we may be able to obtain from time to time. Our principal uses of liquidity are paying the costs and expenses associated with our operations, servicing outstanding indebtedness and making capital expenditures. Our cash requirements will also depend on capital expenditures in connection with future facility projects, such as our announced capacity expansion of our Geismar, Louisiana biorefinery and expenditures in connection with future acquisitions of assets or businesses that are complementary to our operations or part of our growth strategies.
On March 19, 2021, we completed an equity offering pursuant to which we sold 5,750,000 shares of common stock to various underwriters at a price of $67.00 per share before underwriting discounts and commissions. The net proceeds from the offering were $365.3 million. We currently intend to use the net proceeds from this offering for working capital and other general corporate purposes, which may include the repayment of our existing indebtedness and the funding of capital expenditures, including capital expenditures related to the improvements and expansion of our Geismar, Louisiana biorefinery.
On May 20, 2021, we completed the sale and issuance of $550.0 million aggregate principal amount of our Green Notes. We recorded $14.6 million in legal, professional and underwriting fees related to the issuance of the Green Notes. We currently intend to use the net proceeds from the Green Notes for capital expenditures related to the improvements and expansion of our Geismar, Louisiana biorefinery.
Sources of liquidity. At December 31, 2021 and 2020, the total of our cash and cash equivalents and marketable securities was $956.2 million and $354.0 million, respectively. At December 31, 2021, we had total assets of $2,558.9 million, compared to $1,461.4 million at December 31, 2020. At December 31, 2021, we had term debt before debt issuance costs of $550.0 million, compared to term debt before debt issuance costs of $67.0 million at December 31, 2020. Our debt has terms which may subject us to various financial covenants. We were in compliance with all financial covenants associated with the borrowings as of December 31, 2021.
Our term debt (in thousands) is as follows:
| | | | | | | | | | | |
| December 31, |
| 2021 | | 2020 |
| | | |
| 5.875% Senior Secured Green Notes, due 2028 | $ | 550,000 | | | $ | — | |
| 4.00% Convertible Senior Notes, $59,619 face amount at December 31, 2020, due in June 2036 | — | | | 47,057 | |
| | | |
| | | |
| | | |
| | | |
| | | |
| REG Ralston term loan, variable interest rate of LIBOR plus 2.25%, due in October 2025 | — | | | 13,241 | |
| | | |
| REG Capital term loan, fixed interest rate of 3.99%, due in January 2028 | — | | | 6,665 | |
| Other | — | | | 14 | |
| Total debt before debt issuance costs | $ | 550,000 | | | $ | 66,977 | |
2036 Convertible Senior Notes
In the first half of 2021, we received notices of conversions related to the 2036 Convertible Senior Note in total principal amounts of $59.6 million. We elected to settle the respective principal balance of $59.6 million in cash and settle the conversion premium by issuing 4,684,263 shares of common stock from treasury stock. The 2036 Convertible Senior Notes were fully converted as of June 2021 and all obligations thereto have been satisfied and discharged.
During 2020, we used the remaining $67.8 million under our 2019 Program to repurchase $27.8 million principal amount and approximately $8.1 million under our 2020 Program to repurchase $2.2 million principal amount of the 2036 Convertible Senior Notes, reflecting the conversion premium, after tax impact, of $52.7 million and gains on debt extinguishment of $1.8 million.
In addition, we had revolving debt (in thousands) as follows:
| | | | | | | | | | | |
| December 31, |
| 2021 | | 2020 |
| Amount outstanding under lines of credit | $ | — | | | $ | — | |
| Maximum available to be borrowed under lines of credit | $ | 249,666 | | | $ | 149,666 | |
On September 30, 2021, the Company amended the M&L and Services Revolver in order to increase the maximum commitment under the M&L and Services Revolver from $150.0 million to $250.0 million subject to an accordion feature which allows the subsidiary borrowers to request commitments for additional revolving loans in an aggregate amount not to exceed $50.0 million (prior to September 30, 2021) and $100.0 million (on and after September 30, 2021). Availability under this credit agreement is subject to a borrowing base and if availability is less than 10% of the maximum commitment, ($15.0 million prior to giving effect to the amendment and $25.0 million after giving effect to the amendment), then the subsidiary borrowers are required to maintain a fixed charge coverage ratio of at least 1.0 to 1.0. Prior to giving effect to this amendment, as of December 31, 2020, the subsidiary borrowers would not have been able to satisfy that fixed charge coverage ratio if availability was less than 10% of the maximum commitment.
Cash flow. The following table presents information regarding our cash flows and cash, cash equivalents and restricted cash for the years ended December 31, 2021, 2020 and 2019:
| | | | | | | | | | | | | | | | | |
| Year Ended
December 31, |
| 2021 | | 2020 | | 2019 |
| | | (in thousands) | | |
| Cash provided from (used in) operations | $ | (16,241) | | | $ | 543,430 | | | $ | (46,708) | |
| Cash provided from (used in) investing activities | (369,309) | | | (333,910) | | | 5,670 | |
| Cash provided from (used in) financing activities | 799,626 | | | (175,114) | | | (32,052) | |
| Net change in cash, cash equivalents and restricted cash | 414,076 | | | 34,406 | | | (73,090) | |
| Cash, cash equivalents and restricted cash end of period | $ | 501,871 | | | $ | 88,218 | | | $ | 53,436 | |
In 2021, we used $16.2 million of cash for operations, compared to $543.4 million provided from operations in 2020 and $46.7 million used in operations in 2019. Cash used in operations for 2021 was primarily driven by a $235.5 million build in inventory, compared to a build of $47.9 million in 2020, and a draw of inventory of $7.2 million in 2019. The cash used in operations in 2021 was partially offset by net income from continuing operations of $213.8 million, compared to net income of $122.8 million in 2020, and $372.5 million in 2019. In 2020, cash provided from operating activities was impacted by a reduction of accounts receivables of $715.7 million largely due to the receipt of cash related to the 2018 and 2019 BTC, compared to the large accounts receivable build of $786.2 million in 2019, primarily due to the receivables related to the 2018 and 2019 BTC. In 2020, the cash provided from operations was partially offset by a reduction of accounts payable of $266.7 million, also largely related to the payments to vendors and customers for BTC sharing agreements. This was compared to the large build of accounts payable of $279.4 million in 2019 related to the sharing agreements for the BTC.
We had cash used in investing activities of $369.3 million, $333.9 million and cash provided from investing activities of $5.7 million for 2021, 2020 and 2019, respectively. In 2021, the cash used was due primarily to the net marketable securities purchases of $193.3 million, compared to net purchases of $270.5 million in 2020 and net maturities of $51.1 million. Cash paid for property plant and equipment of $99.5 million in 2021 compared to $63.6 million in 2020, and $42.5 million in 2019. Contributed to the cash used in 2021 was the cash paid for the acquisition of Amber Resources of $76.5 million, compared to no cash paid for acquisitions for 2020 or 2019.
We had net cash flows provided from financing activities of $799.6 million in 2021, cash used in financing activities of $175.1 million and $32.1 million for 2020 and 2019, respectively. Cash provided from financing activities in 2021 was primarily due to cash received from the net proceeds of $535.4 million from the Green Notes issuance in May 2021 and $365.3 million from the equity offering in March 2021. Partially offsetting the cash flows provided from financing activities in 2021 and the primary driver for the cash used in financing activities for 2020 and 2019 was repayments on debt of $78.0 million in 2021, $92.3 million in 2020 and $80.4 million in 2019. In 2020, cash used in financing activities was also driven by the net repayments on revolving lines of credit of $77.0 million compared to net borrowings on the lines of credit in 2019 of $62.9 million.
Capital expenditures: During 2021, our capital expenditures were $99.5 million involving various plant optimization projects and the Geismar improvement and expansion. During 2020, our total capital expenditures were $63.6 million involving various project, the majority of which were at the Emden (Germany), Seneca, and Geismar facilities.
In October 2020, we announced that we plan to expand the effective capacity of our Geismar, Louisiana biorefinery. The Geismar project involves both an improvement project for the existing operations at the site and capacity expansion. The Geismar project is expected to take total annual site production capacity from 90 million to 340 million gallons, enhance existing operations and improve operational reliability and logistics. The improvement and expansion project is expected to be mechanically complete in 2023 with full operations in early 2024. We have received all required permits to proceed with construction and officially broke ground to start the construction process in the fourth quarter of 2021. The capital cost for the Geismar project is estimated to be $950 million, which is financed through a combination of cash on hand and marketable securities resulting from our offerings of common stock that closed in March 2021 and proceeds from our issuance of Green Notes that closed in May 2021 or from borrowings under our credit facilities. In connection with the planned improvements and expansion, we have entered into construction and marine terminal lease agreements with total commitments as of December 31, 2021 of $500.9 million. There can be no guarantee that we will be able to increase the capacity of our biorefinery at Geismar, Louisiana on time, at our estimated budget, or at all. The improvements and expansion are subject to a number of conditions and risks.
We estimate that the capital spending for the project will be approximately 15% in 2021, 45% in 2022, with the remainder of spend slated for 2023. At the end of December 2021, almost all of the long lead equipment for the project had been purchased.
In addition, our budgeted capital expenditures for all other projects for 2022 are approximately $90.0 million, which includes investments in low cost, high return projects, environmental, health and safety projects and growth projects.
Contractual Obligations:
See Notes 10, 11, 13, and 18 of Item 8 for additional detail related to our contractual obligations.
Off-Balance Sheet Arrangements
We have no off-balance sheet arrangements that have or are reasonably likely to have a current or future effect on our financial condition, changes in financial condition, revenues or expenses, results of operations, liquidity, capital expenditures or capital resources that is material to investors.
Recent Accounting Pronouncements
For a discussion of new accounting pronouncements affecting us, refer to “Note 2 – Summary of Significant Accounting Policies” to our consolidated financial statements.
ITEM 7A. Quantitative and Qualitative Disclosures about Market Risk
The primary objectives of our investment activity are to preserve principal, provide liquidity and maximize income without significantly increasing risk. Some of the securities we invest in are subject to market risk. This means that a change in prevailing interest rates may cause the principal amount of the investment to fluctuate. To minimize this risk, we maintain a portfolio of cash equivalents in short-term investments in money market funds.
Commodity Price Risk
Over the period from January 2019 through December 2021, average diesel prices based on Platts reported pricing for Group 3 (Midwest) have ranged from a high of approximately $2.52 per gallon reported in October 2021 to a low of approximately $0.62 per gallon in April 2020, with prices averaging $1.73 per gallon during this period. Over the period January 2019 to December 2021, soybean oil prices (based on daily closing nearby futures prices on the Chicago Board Of Trade for crude soybean oil) have ranged from a high of $0.72 per pound, or $5.41 per gallon of biodiesel, in June 2021 to a low of $0.25 per pound, or $1.87 per gallon of biodiesel, in April 2020 assuming 7.5 pounds of soybean oil yields one gallon of biodiesel with sales prices averaging $0.39 per pound, or $2.96 per gallon. Over the period from January 2019 through December 2021, animal fat prices (based on prices from The Jacobsen Missouri River, for choice white grease) have ranged from a high of $0.64 per pound in August 2021 to a low of $0.18 per pound in July 2020, with sales prices averaging $0.32 per pound during this period. Over the period from January 2019 through December 2021, RIN prices (based on prices from OPIS) have ranged from a high of $2.05 in June 2021 to a low of $0.32 in May 2019, with sales prices averaging $0.87 during this period.
Adverse fluctuations in feedstock prices as compared to bio-based diesel prices result in lower profit margins and, therefore, represent unfavorable market conditions. The availability and price of feedstocks are subject to wide fluctuations due to unpredictable factors such as weather conditions during the growing season, rendering volumes, carry-over from the previous crop year and current crop year yield, governmental policies with respect to agriculture and supply and demand.
We have prepared a sensitivity analysis to estimate our exposure to market risk with respect to our sales contracts, low carbon feedstock requirements, soybean oil requirements and the related exchange-traded contracts for 2021. Market risk is estimated as the potential loss in fair value, resulting from a hypothetical 10% adverse change in the fair value of our low carbon feedstock and soybean oil requirements and bio-based diesel sales. The results of this analysis, which may differ from actual results, are as follows:
| | | | | | | | | | | | | | | | | | | | | | | | | | | | | |
| 2021
Volume
(in millions) | | Units | | Hypothetical
Adverse
Change in
Price | | Impact on Annual
Gross
Profit (in
millions) | | Percentage
Change in
Gross
Profit |
| Total Bio-based Diesel | 543.1 | | | gallons | | 10% | | $ | (242.2) | | | (65.5) | % |
| Total Low Carbon Feedstocks | 2,984.1 | | | pounds | | 10% | | $ | (155.2) | | | (41.9) | % |
| Total Canola Oil | 530.6 | | | pounds | | 10% | | $ | (32.9) | | | (8.9) | % |
| Total Soy Oil | 343.4 | | | pounds | | 10% | | $ | (20.6) | | | (5.6) | % |
We attempt to protect operating margins by entering into risk management contracts that reduce the risk of price volatility related to anticipated purchases of feedstocks and energy prices. We create offsetting positions by using a combination of forward physical purchases and sales contracts on feedstock and bio-based diesel, including risk management futures contracts, swaps and options primarily on NYMEX NY Harbor ULSD and CBOT Soybean Oil. The extent to which we engage in risk management activities depends on market conditions and other factors and varies substantially from time to time and from
feedstock to feedstock. A 10% adverse change in the prices of NYMEX NY Harbor ULSD would have a positive effect of $14.6 million on the fair value of these instruments at December 31, 2021. A 10% adverse change in the price of CBOT Soybean Oil would have had a negative effect of $7.6 million on the fair value of these instruments December 31, 2021. A 10% adverse change in the price of NYMEX Natural Gas would have had an negative effect of $1.2 million on our gross margin at December 31, 2021.
Interest Rate Risk
We have minimal exposure to interest rate risk and as such any material changes in interest rates would not have a material effect on our financial position.
Renewable Identification Numbers
We are exposed to market risks related to the volatility in the price of credits needed to comply with governmental programs. For the past several years there has been significant volatility in RIN prices. Reductions in RIN values, such as those experienced in prior years, may have a material adverse effect on our revenues and profits as they directly reduce the value that we are able to capture for our bio-based diesel.
Foreign Currency Risk
We have minimal exposure to foreign currency risk and as such the cost of hedging this risk is viewed to be in excess of the benefit of further reductions in our exposure to foreign currency exchange rate fluctuations.
ITEM 8. Financial Statements and Supplementary Data
REPORT OF INDEPENDENT REGISTERED PUBLIC ACCOUNTING FIRM
To the stockholders and the Board of Directors of Renewable Energy Group, Inc.
Opinions on the Financial Statements and Internal Control over Financial Reporting
We have audited the accompanying consolidated balance sheets of Renewable Energy Group, Inc. and subsidiaries (the "Company") as of December 31, 2021 and 2020, the related consolidated statements of operations, comprehensive income, stockholders' equity, and cash flows for each of the three years in the period ended December 31, 2021, and the related notes (collectively referred to as the "financial statements"). We also have audited the Company’s internal control over financial reporting as of December 31, 2021, based on criteria established in Internal Control — Integrated Framework (2013) issued by the Committee of Sponsoring Organizations of the Treadway Commission (COSO).
In our opinion, the financial statements referred to above present fairly, in all material respects, the financial position of the Company as of December 31, 2021 and 2020, and the results of its operations and its cash flows for each of the three years in the period ended December 31, 2021, in conformity with accounting principles generally accepted in the United States of America. Also, in our opinion, the Company has maintained, in all material respects, effective internal control over financial reporting as of December 31, 2021, based on criteria established in Internal Control — Integrated Framework (2013) issued by COSO.
As described in Management’s Report on Internal Control over Financial Reporting, management excluded from its assessment the internal control over financial reporting at the acquired entities and assets of Amber Resources LLC, M.O. Dion & Sons, Inc., and Amber Petroleum Products, Inc. (collectively “Amber Resources”), which was acquired in December 2021 and whose financial statements constitute 6 percent of total assets and less than 1 percent of total revenues of the consolidated financial statement amounts as of and for the year ended December 31, 2021. Accordingly, our audit did not include the internal control over financial reporting at Amber Resources.
Basis for Opinions
The Company’s management is responsible for these financial statements, for maintaining effective internal control over financial reporting, and for its assessment of the effectiveness of internal control over financial reporting, included in the accompanying Management’s Report on Internal Control over Financial Reporting. Our responsibility is to express an opinion on these financial statements and an opinion on the Company’s internal control over financial reporting based on our audits. We are a public accounting firm registered with the Public Company Accounting Oversight Board (United States) (PCAOB) and are required to be independent with respect to the Company in accordance with the U.S. federal securities laws and the applicable rules and regulations of the Securities and Exchange Commission and the PCAOB.
We conducted our audits in accordance with the standards of the PCAOB. Those standards require that we plan and perform the audits to obtain reasonable assurance about whether the financial statements are free of material misstatement, whether due to error or fraud, and whether effective internal control over financial reporting was maintained in all material respects.
Our audits of the financial statements included performing procedures to assess the risks of material misstatement of the financial statements, whether due to error or fraud, and performing procedures to respond to those risks. Such procedures included examining, on a test basis, evidence regarding the amounts and disclosures in the financial statements. Our audits also included evaluating the accounting principles used and significant estimates made by management, as well as evaluating the overall presentation of the financial statements. Our audit of internal control over financial reporting included obtaining an understanding of internal control over financial reporting, assessing the risk that a material weakness exists, and testing and evaluating the design and operating effectiveness of internal control based on the assessed risk. Our audits also included performing such other procedures as we considered necessary in the circumstances. We believe that our audits provide a reasonable basis for our opinions.
Definition and Limitations of Internal Control over Financial Reporting
A company’s internal control over financial reporting is a process designed to provide reasonable assurance regarding the reliability of financial reporting and the preparation of financial statements for external purposes in accordance with generally accepted accounting principles. A company’s internal control over financial reporting includes those policies and procedures that (1) pertain to the maintenance of records that, in reasonable detail, accurately and fairly reflect the transactions and dispositions of the assets of the company; (2) provide reasonable assurance that transactions are recorded as necessary to permit preparation of financial statements in accordance with generally accepted accounting principles, and that receipts and expenditures of the company are being made only in accordance with authorizations of management and directors of the company; and (3) provide reasonable assurance regarding prevention or timely detection of unauthorized acquisition, use, or disposition of the company’s assets that could have a material effect on the financial statements.
Because of its inherent limitations, internal control over financial reporting may not prevent or detect misstatements. Also, projections of any evaluation of effectiveness to future periods are subject to the risk that controls may become inadequate because of changes in conditions, or that the degree of compliance with the policies or procedures may deteriorate.
Critical Audit Matter
The critical audit matter communicated below is a matter arising from the current-period audit of the financial statements that was communicated or required to be communicated to the audit committee and that (1) relates to accounts or disclosures that are material to the financial statements and (2) involved our especially challenging, subjective, or complex judgments. The communication of critical audit matter does not alter in any way our opinion on the financial statements, taken as a whole, and we are not, by communicating the critical audit matter below, providing separate opinions on the critical audit matter or on the accounts or disclosures to which it relates.
Property, Plant and Equipment, Net - Determination of Impairment Indicators – Refer to Notes 2 and 6 to the financial statements
Critical Audit Matter Description
The Company tests its long-lived assets for recoverability when events or circumstances indicate that its carrying amount may not be recoverable. Possible indications of impairment may include events or changes in circumstances affecting availability or amount of government incentives, technological advances, and expansions to existing facilities that make assets obsolete. When events or circumstances exist, the Company evaluates its long-lived assets for impairment by comparing undiscounted future cash flows expected to be generated over the life of each asset to the respective carrying amount. If the carrying amount of an asset exceeds the undiscounted future cash flows, an analysis is performed to determine the fair value of the asset. The property, plant and equipment, net balance was $677.4 million as of December 31, 2021. During 2021 the Company recorded impairment charges of $7.4 million related to property, plant and equipment as the carrying amounts of these assets were deemed not recoverable.
We identified the determination of impairment indicators for property, plant and equipment as a critical audit matter because of the significant assumptions management makes when determining whether events or changes in circumstances have occurred indicating that the carrying amounts of property, plant and equipment may not be recoverable. This required a high degree of auditor judgment when performing audit procedures to evaluate whether management appropriately identified impairment indicators.
How the Critical Audit Matter Was Addressed in the Audit
Our audit procedures related to the assessment of long-lived assets for possible indications of impairment included the following, among others:
◦We tested the effectiveness of controls over management’s identification of possible circumstances that may indicate the carrying amounts of long-lived assets may not be recoverable.
◦Reading industry and analysts reports and considering the impact of macroeconomic factors, such as future biodiesel prices, or adverse changes in regulatory, legislation or other legal factors that may represent impairment indicators.
◦We evaluated management’s analysis of impairment indicators by:
•Assessing whether property, plant and equipment having indicators of impairment were appropriately identified and further tested for impairment.
◦We inquired of management and facility personnel whether property, plant and equipment may be sold or otherwise disposed of significantly before the end of the assets’ previously estimated useful life.
◦We inspected minutes of the board of directors to understand if there were factors that would represent potential impairment indicators for property, plant and equipment.
◦We compared current facility production levels to facility production capacity and historical production levels to identify if potentially previously unidentified impairment indicators exist.
◦We selected property, plant and equipment classified as construction in process and inspected when the long-lived assets were acquired and obtained evidence regarding management’s intentions for future use.
/s/ Deloitte & Touche LLP
Des Moines, Iowa
March 1, 2022
We have served as the Company's auditor since 2006.
RENEWABLE ENERGY GROUP, INC. AND SUBSIDIARIES
CONSOLIDATED BALANCE SHEETS
AS OF DECEMBER 31, 2021 AND 2020
(IN THOUSANDS, EXCEPT SHARE AND PER SHARE AMOUNTS)
| | | | | | | | | | | |
| 2021 | | 2020 |
| ASSETS | | | |
| CURRENT ASSETS: | | | |
| Cash and cash equivalents | $ | 497,653 | | | $ | 84,441 | |
| Marketable securities | 290,818 | | | 149,521 | |
Accounts receivable (net of allowance for doubtful accounts of $1,814 and $1,631, respectively) | 158,187 | | | 143,475 | |
| Inventories | 453,592 | | | 209,361 | |
| | | |
| Prepaid expenses and other assets | 93,443 | | | 67,657 | |
| Restricted cash | 4,218 | | | 3,777 | |
| | | |
| Total current assets | 1,497,911 | | | 658,232 | |
| Long-term marketable securities | 167,767 | | | 120,022 | |
| Property, plant and equipment, net | 677,444 | | | 594,796 | |
| | | |
| Right of use assets | 51,730 | | | 28,840 | |
| Goodwill | 43,864 | | | 16,080 | |
| Intangible assets, net | 53,175 | | | 10,708 | |
| Deferred income taxes | 6,171 | | | — | |
| | | |
Other assets | 60,882 | | | 32,720 | |
| | | |
| | | |
| TOTAL ASSETS | $ | 2,558,944 | | | $ | 1,461,398 | |
| LIABILITIES AND EQUITY | | | |
| CURRENT LIABILITIES: | | | |
| | | |
| Current maturities of long-term debt | $ | — | | | $ | 50,088 | |
| | | |
| Current maturities of operating lease obligations | 13,026 | | | 14,581 | |
| Accounts payable | 162,847 | | | 132,938 | |
| Accrued expenses and other liabilities | 53,884 | | | 34,875 | |
| | | |
| Deferred revenue | 16,856 | | | 13,488 | |
| | | |
| Total current liabilities | 246,613 | | | 245,970 | |
| | | |
| Deferred income taxes | 4,659 | | | 6,607 | |
| | | |
| | | |
Long-term debt (net of debt issuance costs of $13,243 and $1,731, respectively) | 536,757 | | | 15,158 | |
| | | |
| Long-term operating lease obligations | 38,989 | | | 15,223 | |
| Other liabilities | 4,100 | | | 4,485 | |
| Total liabilities | 831,118 | | | 287,443 | |
| COMMITMENTS AND CONTINGENCIES (NOTE 18) | | | |
| | | |
| EQUITY: | | | |
| | | |
Common stock ($0.0001 par value; 300,000,000 shares authorized; 50,294,505 and 39,334,839 shares outstanding, respectively) | 6 | | | 5 | |
| Common stock—additional paid-in-capital | 709,186 | | | 392,247 | |
| Retained earnings | 1,105,030 | | | 891,211 | |
| Accumulated other comprehensive income (loss) | (2,111) | | | 1,160 | |
Treasury stock (6,240,907 and 10,591,074 shares, respectively) | (84,285) | | | (110,668) | |
| | | |
| | | |
| Total equity | 1,727,826 | | | 1,173,955 | |
| TOTAL LIABILITIES AND EQUITY | $ | 2,558,944 | | | $ | 1,461,398 | |
| | | |
See notes to consolidated financial statements.
RENEWABLE ENERGY GROUP, INC. AND SUBSIDIARIES
CONSOLIDATED STATEMENTS OF OPERATIONS
FOR THE YEARS ENDED DECEMBER 31, 2021, 2020 AND 2019
(IN THOUSANDS, EXCEPT SHARE AND PER SHARE AMOUNTS)
| | | | | | | | | | | | | | | | | |
| 2021 | | 2020 | | 2019 |
| REVENUES: | | | | | |
| Bio-based diesel sales | $ | 2,597,731 | | | $ | 1,700,724 | | | $ | 1,875,076 | |
| Separated RIN sales | 355,541 | | | 129,715 | | | 98,285 | |
| Bio-based diesel government incentives | 290,778 | | | 305,302 | | | 650,215 | |
| 3,244,050 | | | 2,135,741 | | | 2,623,576 | |
| Other revenues | — | | | 1,407 | | | 1,640 | |
| 3,244,050 | | | 2,137,148 | | | 2,625,216 | |
| | | | | |
| | | | | |
| COSTS OF GOODS SOLD | 2,874,157 | | | 1,868,794 | | | 2,111,324 | |
| | | | | |
| | | | | |
| | | | | |
| GROSS PROFIT | 369,893 | | | 268,354 | | | 513,892 | |
SELLING, GENERAL, AND ADMINISTRATIVE EXPENSES | 140,511 | | | 119,302 | | | 118,209 | |
| | | | | |
| GAIN ON DISPOSAL OF PROPERTY, PLANT AND EQUIPMENT | (1,462) | | | (205) | | | — | |
| IMPAIRMENT OF PROPERTY, PLANT, AND EQUIPMENT | 7,359 | | | 22,404 | | | 12,208 | |
| | | | | |
| INCOME FROM OPERATIONS | 223,485 | | | 126,853 | | | 383,475 | |
| OTHER INCOME (EXPENSE), NET: | | | | | |
Change in fair value of contingent consideration | — | | | — | | | (566) | |
| | | | | |
| Gain (loss) on debt extinguishment | (4,449) | | | 1,809 | | | 488 | |
| | | | | |
| Gain on lease termination | — | | | 4,459 | | | — | |
| Interest income | 2,067 | | | 2,225 | | | 1,069 | |
| Other income (expense) | 186 | | | 1,307 | | | 694 | |
Interest expense | (21,949) | | | (7,911) | | | (13,235) | |
| (24,145) | | | 1,889 | | | (11,550) | |
| INCOME FROM CONTINUING OPERATIONS BEFORE INCOME TAXES | 199,340 | | | 128,742 | | | 371,925 | |
| INCOME TAX BENEFIT (EXPENSE) | 14,479 | | | (5,929) | | | 570 | |
| | | | | |
| | | | | |
| | | | | |
| NET INCOME FROM CONTINUING OPERATIONS | 213,819 | | | 122,813 | | | 372,495 | |
| DISCONTINUED OPERATIONS: | | | | | |
| | | | | |
| | | | | |
| | | | | |
| NET LOSS ON DISCONTINUED OPERATIONS | — | | | — | | | (9,667) | |
| NET INCOME | $ | 213,819 | | | $ | 122,813 | | | $ | 362,828 | |
| | | | | |
| LESS—EFFECT OF PARTICIPATING SHARE-BASED AWARDS ON CONTINUING OPERATIONS | (2,128) | | | (2,398) | | | (8,238) | |
| NET INCOME FROM CONTINUING OPERATIONS AVAILABLE TO COMMON STOCKHOLDERS | $ | 211,691 | | | $ | 120,415 | | | $ | 364,257 | |
NET LOSS FROM DISCONTINUED OPERATIONS AVAILABLE TO COMMON STOCKHOLDERS | $ | — | | | $ | — | | | $ | (9,667) | |
| Basic net income (loss) per share available to common stockholders | | | | | |
| Continuing operations | $ | 4.48 | | | $ | 3.07 | | | $ | 9.51 | |
| Discontinued operations | $ | — | | | $ | — | | | $ | (0.25) | |
| Net income per share | $ | 4.48 | | | $ | 3.07 | | | $ | 9.27 | |
| Diluted net income (loss) per share available to common stockholders | | | | | |
| Continuing operations | $ | 4.44 | | | $ | 2.76 | | | $ | 8.61 | |
| Discontinued operations | $ | — | | | $ | — | | | $ | (0.25) | |
| Net income per share | $ | 4.44 | | | $ | 2.76 | | | $ | 8.38 | |
Weighted-average shares used to compute basic net income (loss) per share available to common stockholders: | | | | | |
| Basic | 47,302,924 | | | 39,199,687 | | | 38,288,610 | |
| | | | | |
Weighted-average shares used to compute diluted net income (loss) per share available to common stockholders: | | | | | |
| Continuing operations | 47,718,228 | | | 43,686,989 | | | 42,320,980 | |
| Discontinued operations | 47,718,228 | | | 43,686,989 | | | 38,288,610 | |
| Net income | 47,718,228 | | | 43,686,989 | | | 42,320,980 | |
See notes to consolidated financial statements.
RENEWABLE ENERGY GROUP, INC. AND SUBSIDIARIES
CONSOLIDATED STATEMENTS OF COMPREHENSIVE INCOME
FOR THE YEARS ENDED DECEMBER 31, 2021, 2020 AND 2019
(IN THOUSANDS)
| | | | | | | | | | | | | | | | | |
| 2021 | | 2020 | | 2019 |
| Net income | $ | 213,819 | | | $ | 122,813 | | | $ | 362,828 | |
Unrealized gains (losses) on marketable securities, net of taxes of $0, $10 and $0, respectively | (729) | | | 42 | | | — | |
| Foreign currency translation adjustments | (2,542) | | | 3,112 | | | (338) | |
| Other comprehensive income (loss) | (3,271) | | | 3,154 | | | (338) | |
| Comprehensive income | $ | 210,548 | | | $ | 125,967 | | | $ | 362,490 | |
| | | | | |
| | | | | |
See notes to consolidated financial statements.
RENEWABLE ENERGY GROUP, INC. AND SUBSIDIARIES
CONSOLIDATED STATEMENTS OF STOCKHOLDERS' EQUITY
FOR THE YEARS ENDED DECEMBER 31, 2021, 2020 AND 2019 (IN THOUSANDS EXCEPT SHARE AND PER SHARE AMOUNTS)
| | | | | | | | | | | | | | | | | | | | | | | | | | | | | | | | | | | | | | | | | | | |
| Company Stockholders’ Equity | | | | |
| Common
Stock
Shares | | Common
Stock | | Common
Stock-
Additional
Paid-in Capital | | Retained
Earnings | | Accumulated
Other
Comprehensive
Income (Loss) | | Treasury
Stock | | | | Total |
| BALANCE, January 1, 2019 | 37,318,942 | | | $ | 5 | | | $ | 451,427 | | | $ | 412,086 | | | $ | (1,656) | | | $ | (111,767) | | | | | $ | 750,095 | |
| | | | | | | | | | | | | | | |
| | | | | | | | | | | | | | | |
Conversion of restricted stock units to common stock (net of 140,592 shares of treasury stock purchased) | 345,655 | | | — | | | — | | | — | | | — | | | (3,317) | | | | | (3,317) | |
Settlement of stock appreciation rights in common stock (net of 14,367 shares of treasury stock purchased) | 26,346 | | | — | | | (31) | | | — | | | — | | | (201) | | | | | (232) | |
Convertible debt extinguishment impact (net of tax of $564) | — | | | — | | | (9,715) | | | — | | | — | | | — | | | | | (9,715) | |
Settlement of 2019 Convertible Debt in common stock, net of 1,902,781 shares of treasury stock | 1,902,781 | | | — | | | (18,779) | | | — | | | — | | | 18,779 | | | | | — | |
| Unwind of capped call options | (626,645) | | | — | | | 8,982 | | | — | | | — | | | (8,982) | | | | | — | |
| Stock compensation expense | — | | | — | | | 6,707 | | | — | | | — | | | — | | | | | 6,707 | |
| Other comprehensive loss | — | | | — | | | — | | | — | | | (338) | | | — | | | | | (338) | |
Adoption of ASC Topic 842, Leases | — | | | — | | | — | | | (6,516) | | | — | | | — | | | | | (6,516) | |
| Net income | — | | | — | | | — | | | 362,828 | | | — | | | — | | | | | 362,828 | |
| BALANCE, December 31, 2019 | 38,967,079 | | | 5 | | | 438,591 | | | 768,398 | | | (1,994) | | | (105,488) | | | | | 1,099,512 | |
Conversion of restricted stock units to common stock (net of 143,949 shares of treasury stock purchased) | 294,734 | | | — | | | — | | | — | | | — | | | (3,917) | | | | | (3,917) | |
Settlement of stock appreciation rights in common stock (net of 43,327 shares of treasury stock purchased) | 73,026 | | | — | | | (598) | | | — | | | — | | | (1,263) | | | | | (1,861) | |
Convertible debt extinguishment impact (net of tax of $2,386) | — | | | — | | | (52,688) | | | — | | | — | | | — | | | | | (52,688) | |
| | | | | | | | | | | | | | | |
| | | | | | | | | | | | | | | |
| | | | | | | | | | | | | | | |
| | | | | | | | | | | | | | | |
| | | | | | | | | | | | | | | |
| | | | | | | | | | | | | | | |
| Stock compensation expense | — | | | — | | | 6,942 | | | — | | | — | | | — | | | | | 6,942 | |
| Other comprehensive income | — | | | — | | | — | | | — | | | 3,154 | | | — | | | | | 3,154 | |
| | | | | | | | | | | | | | | |
| | | | | | | | | | | | | | | |
| Net income | — | | | — | | | — | | | 122,813 | | | — | | | — | | | | | 122,813 | |
| BALANCE, December 31, 2020 | 39,334,839 | | | 5 | | | 392,247 | | | 891,211 | | | 1,160 | | | (110,668) | | | | | 1,173,955 | |
Conversion of restricted stock units to common stock (net of 206,302 shares of treasury stock purchased) | 376,010 | | | — | | | — | | | — | | | — | | | (13,495) | | | | | (13,495) | |
Settlement of stock appreciation rights in common stock (net of 127,794 shares of treasury stock purchased) | 149,393 | | | — | | | (782) | | | — | | | — | | | (8,748) | | | | | (9,530) | |
| | | | | | | | | | | | | | | |
| | | | | | | | | | | | | | | |
| | | | | | | | | | | | | | | |
Equity issuance (net of issuance costs of $19,970) | 5,750,000 | | | 1 | | | 365,279 | | | — | | | — | | | — | | | | | 365,280 | |
Settlement of 2036 convertible senior notes conversions (net of tax impact of $2,437) | 4,684,263 | | | — | | | (55,555) | | | — | | | — | | | 48,626 | | | | | (6,929) | |
| Stock compensation expense | — | | | — | | | 7,997 | | | — | | | — | | | — | | | | | 7,997 | |
| | | | | | | | | | | | | | | |
| | | | | | | | | | | | | | | |
| | | | | | | | | | | | | | | |
| Other comprehensive loss | — | | | — | | | — | | | — | | | (3,271) | | | — | | | | | (3,271) | |
| Net income | — | | | — | | | — | | | 213,819 | | | — | | | — | | | | | 213,819 | |
| BALANCE, December 31, 2021 | 50,294,505 | | | $ | 6 | | | $ | 709,186 | | | $ | 1,105,030 | | | $ | (2,111) | | | $ | (84,285) | | | | | $ | 1,727,826 | |
See notes to consolidated financial statements.
RENEWABLE ENERGY GROUP, INC. AND SUBSIDIARIES
CONSOLIDATED STATEMENTS OF CASH FLOWS (IN THOUSANDS)
FOR THE YEARS ENDED DECEMBER 31, 2021, 2020 AND 2019
| | | | | | | | | | | | | | | | | |
| 2021 | | 2020 | | 2019 |
| CASH FLOWS FROM OPERATING ACTIVITIES: | | | | | |
| Net income | $ | 213,819 | | | $ | 122,813 | | | $ | 362,828 | |
| Net loss from discontinuing operations | — | | | — | | | (9,667) | |
| Net income from continuing operations | 213,819 | | | 122,813 | | | 372,495 | |
| Adjustments to reconcile net income to net cash flows from operating activities: | | | | | |
| Depreciation expense | 43,430 | | | 37,315 | | | 36,298 | |
| Amortization expense of assets and liabilities, net | 26,054 | | | 16,628 | | | 22,457 | |
| Accretion of asset retirement obligations | 2,226 | | | 55 | | | 51 | |
| Accretion of convertible note discount | 247 | | | 832 | | | 539 | |
| Accretion of marketable securities | 3,493 | | | 981 | | | (146) | |
| Impairment of property, plant and equipment, net | 7,359 | | | 22,404 | | | 12,208 | |
| Provision for doubtful accounts | 6,013 | | | 734 | | | 447 | |
| Stock compensation expense | 7,997 | | | 6,942 | | | 6,707 | |
| | | | | |
| | | | | |
| Deferred tax expense (benefits) | (12,195) | | | 2,012 | | | (591) | |
| Change in fair value of contingent consideration | — | | | — | | | 566 | |
| | | | | |
| Gain on sales of assets | (1,462) | | | (205) | | | — | |
| | | | | |
| (Gain) loss on debt extinguishment | 4,449 | | | (1,809) | | | (488) | |
| Gain on lease termination | — | | | (4,459) | | | — | |
| Other | 83 | | | (33) | | | 11 | |
| Changes in asset and liabilities: | | | | | |
| Accounts receivable | 1,835 | | | 715,685 | | | (786,178) | |
| Inventories | (235,536) | | | (47,904) | | | 7,151 | |
| Prepaid expenses and other assets | (60,387) | | | (46,171) | | | 11,089 | |
| Accounts payable | (9,167) | | | (266,702) | | | 279,385 | |
| Accrued expenses and other liabilities | 2,701 | | | (5,009) | | | 17,564 | |
| Operating lease obligations | (20,569) | | | (15,546) | | | (20,913) | |
| Deferred revenue | 3,369 | | | 4,867 | | | 8,321 | |
| Net cash flows provided from (used in) operating activities - continuing operations | (16,241) | | | 543,430 | | | (33,027) | |
| Net cash flows used in operating activities - discontinued operations | — | | | — | | | (13,681) | |
| Cash provided from (used in) operations | (16,241) | | | 543,430 | | | (46,708) | |
| CASH FLOWS FROM INVESTING ACTIVITIES: | | | | | |
| Cash paid for marketable securities | (472,082) | | | (354,079) | | | (3,478) | |
| Maturities of marketable securities | 278,821 | | | 83,606 | | | 54,584 | |
| Cash paid for purchase of property, plant and equipment | (99,549) | | | (63,642) | | | (42,518) | |
| | | | | |
| | | | | |
| Cash paid for investments | (1,500) | | | — | | | (6,018) | |
| | | | | |
| Cash paid for acquisition net of cash acquired | (76,461) | | | — | | | — | |
| Other investing activities | 1,462 | | | 205 | | | — | |
| Net cash flows (used in) provided by investing activities - continuing operations | (369,309) | | | (333,910) | | | 2,570 | |
| Net cash flows provided by investing activities - discontinued operations | — | | | — | | | 3,100 | |
| Cash (used in) provided from investing activities | (369,309) | | | (333,910) | | | 5,670 | |
| CASH FLOWS FROM FINANCING ACTIVITIES: | | | | | |
| Net (repayments) borrowings on line of credit | — | | | (76,990) | | | 70,091 | |
| Borrowing on other lines of credit | — | | | — | | | 113,459 | |
| Repayments on other lines of credits | — | | | — | | | (120,644) | |
| Cash received for issuance of debt | 550,000 | | | — | | | — | |
| | | | | |
| | | | | |
| Cash paid on debt | (78,044) | | | (92,346) | | | (80,365) | |
| Cash paid for debt issuance costs | (14,585) | | | — | | | (116) | |
| | | | | |
| | | | | |
| | | | | |
| Cash received from equity offering | 385,250 | | | — | | | — | |
| Cash paid for equity offering costs | (19,970) | | | — | | | — | |
| Cash paid for contingent consideration | — | | | — | | | (10,427) | |
| Cash paid for conversion of restricted stock units and stock appreciation rights | (23,025) | | | (5,778) | | | (3,550) | |
| | | | | |
| Other financing activities | — | | | — | | | (500) | |
| Net cash flows provided by (used in) financing activities - continuing operations | 799,626 | | | (175,114) | | | (32,052) | |
| Net cash flows provided from financing activities - discontinuing operations | — | | | — | | | — | |
| Cash from (used in) financing activities | 799,626 | | | (175,114) | | | (32,052) | |
| NET CHANGE IN CASH, CASH EQUIVALENTS AND RESTRICTED CASH | 414,076 | | | 34,406 | | | (73,090) | |
| CASH, CASH EQUIVALENTS AND RESTRICTED CASH at Beginning of period | 88,218 | | | 53,436 | | | 126,575 | |
| Effect of exchange rate changes on cash | (423) | | | 376 | | | (49) | |
| CASH, CASH EQUIVALENTS AND RESTRICTED CASH at End of period | $ | 501,871 | | | $ | 88,218 | | | $ | 53,436 | |
(continued)
RENEWABLE ENERGY GROUP, INC. AND SUBSIDIARIES
CONSOLIDATED STATEMENTS OF CASH FLOWS
FOR THE YEARS ENDED DECEMBER 31, 2021, 2020 AND 2019
(IN THOUSANDS)
| | | | | | | | | | | | | | | | | |
| 2021 | | 2020 | | 2019 |
| SUPPLEMENTAL DISCLOSURES OF CASH FLOWS INFORMATION: | | | | | |
| Cash paid for income taxes | $ | 4,826 | | | $ | 22 | | | $ | 740 | |
| Cash paid for interest | $ | 19,742 | | | $ | 6,050 | | | $ | 9,054 | |
| Leased assets obtained in exchange for new operating lease liabilities | $ | 27,634 | | | $ | 7,018 | | | $ | 11,581 | |
SUPPLEMENTAL DISCLOSURE OF NON-CASH INVESTING AND FINANCING ACTIVITIES: | | | | | |
| | | | | |
| Amounts included in period-end accounts payable for: | | | | | |
| Purchases of property, plant and equipment | $ | 22,091 | | | $ | 3,215 | | | $ | 3,641 | |
| | | | | |
| 2036 Convertible Senior Notes settlement | $ | — | | | $ | — | | | $ | 9,402 | |
| | | | | |
| | | | | |
| | | | | |
| | | | | |
| | | | | |
| | | | | |
| | | | | |
| | | | | |
| | | | | |
| | | | | |
| | | | | |
| | | | | |
| Issuance of treasury stock to settle 2019 Convertible Senior Notes conversion premium | $ | — | | | $ | — | | | $ | (18,779) | |
| Receipt in treasury stock for settlement of capped call option | $ | — | | | $ | — | | | $ | 8,952 | |
| | | | | |
| | | | | |
| | | | | |
| | | | | |
| | | | | |
| | | | | |
| | | | | |
| | | | | |
|
| | | | | |
See notes to consolidated financial statements.
(concluded)
RENEWABLE ENERGY GROUP, INC. AND SUBSIDIARIES
NOTES TO THE CONSOLIDATED FINANCIAL STATEMENTS
For The Three Years Ended December 31, 2021, 2020 and 2019
(In Thousands, Except Share and Per Share Amounts)
NOTE 1—ORGANIZATION, PRESENTATION, AND NATURE OF THE BUSINESS
Renewable Energy Group, Inc. (the "Company" or "REG") is a company focused on providing cleaner, lower carbon transportation fuels. Today, the Company principally generates revenue as the leading North American advanced biofuels producer with a nationwide distribution and logistics system. The Company participates in each aspect of bio-based diesel production, from acquiring feedstock, managing construction and operating bio-based diesel production facilities, to marketing, selling and distributing bio-based diesel and its co-products. To do this, REG utilizes its nationwide production, distribution and logistics system as part of an integrated value chain model to focus on converting natural fats, oils and greases into advanced biofuels.
As of December 31, 2021, the Company owns and operates eleven biorefineries, with nine locations in North America and two locations in Europe, which includes eleven operating bio-based diesel production facilities with aggregate nameplate production capacity of 470 million gallons per year ("mmgy"). Ten of these plants are “multi-feedstock capable” which allows them to use a broad range of low carbon feedstocks, such as distillers corn oil, used cooking oil and inedible animal fats in addition to vegetable oils, such as soybean oil and canola oil. In September 2021, the Company announced the closure of the Houston, Texas biorefinery. Production at this facility ceased in November 2021. The Houston plant's nameplate capacity was 35 mmgy.
On December 30, 2021, the Company acquired Amber Resources LLC, M.O. Dion & Sons, Inc., and Amber Petroleum Products, Inc., (collectively "Amber Resources"). This acquisition allows the Company to continue to advance its downstream strategy. The Amber Resources acquisition provides the Company with the facilities to deliver its products to end customers at 8 fuel distribution locations including 3 cardlock locations. For more information on Amber Resources and the acquisition, see "Note 3 - Acquisitions".
The bio-based diesel industry and the Company’s business have benefited from certain federal and state incentives. The federal biodiesel mixture excise tax credit (the "BTC") was retroactively reinstated on February 9, 2018 for the year 2017 and on December 20, 2019 for the years 2018 and 2019. The BTC has also been extended through December 31, 2022.
NOTE 2—SUMMARY OF SIGNIFICANT ACCOUNTING POLICIES
Basis of Consolidation
The consolidated financial statements include the accounts of the Company, its wholly-owned subsidiaries, and entities which it controls. All intercompany balances and transactions have been eliminated for consolidated reporting purposes.
Accounting for Business Combinations
The Company accounts for business combinations under the acquisition method of accounting. This method requires the recording of acquired assets, including separately identifiable intangible assets, and assumed liabilities at their acquisition date fair values. The excess of the purchase price over the fair value of assets acquired and liabilities assumed is recorded as goodwill. Determining the fair value of assets acquired and liabilities assumed requires management’s judgment and often involves the use of significant estimates and assumptions, including assumptions with respect to future cash flows, discount rates, royalty rates and asset lives, among other items.
Cash and Cash Equivalents
Cash and cash equivalents consist of money market funds and demand deposits with financial institutions. The Company considers all highly liquid debt instruments purchased with an original maturity of three months or less to be cash equivalents.
Restricted Cash
The Company segregates certain cash balances as restricted cash that represent those funds required to be set aside by a contractual agreement. The Company classifies restricted cash between current and non-current assets based on the length of time of the restricted use. The restricted cash was held as pledges for letters of credit issued to support our operations. See the
table below for reconciliation of Cash and cash equivalents and restricted cash in regard to the Consolidated Statements of Cash Flows:
| | | | | | | | | | | | | | | | | |
| December 31, 2021 | | December 31, 2020 | | December 31, 2019 |
| Cash and cash equivalents | $ | 497,653 | | | $ | 84,441 | | | $ | 50,436 | |
| Restricted cash | 4,218 | | | 3,777 | | | 3,000 | |
| Total cash, cash equivalents and restricted cash shown in the statement of cash flows | $ | 501,871 | | | $ | 88,218 | | | $ | 53,436 | |
Accounts Receivable
Accounts receivable are carried at invoiced amount less allowance for doubtful accounts. Management estimates the allowance for doubtful accounts based on existing economic conditions, the financial conditions of customers and the amount and age of past due accounts. Receivables are considered past due if full payment is not received by the contractual due date. Past due accounts are generally written off against the allowance for doubtful accounts only after reasonable collection attempts have been exhausted.
| | | | | | | | | | | |
| December 31, 2021 | | December 31, 2020 |
Trade accounts receivable from customers (net of allowance for doubtful accounts of $1,814 and $1,631, respectively) | $ | 106,628 | | | $ | 74,774 | |
| BTC receivables from the government | 49,626 | | | 68,125 | |
| Other trade receivables | 1,933 | | | 576 | |
| Total | $ | 158,187 | | | $ | 143,475 | |
Marketable Securities
The Company's marketable securities are classified as available-for-sale and are reported at fair value, with unrealized gains and losses, net of tax, recorded in accumulated other comprehensive income (loss). The Company classifies its marketable securities as either current or long-term based on each instrument's underlying contractual maturity date. Realized gains or losses and declines in value judged to be other-than-temporary, if any, on available-for-sale securities are reported in other income, net. The Company evaluates such investments periodically for possible other-than-temporary impairment. A decline of fair value below amortized costs of debt securities is considered an other-than-temporary impairment if the Company has the intent to sell the security or if it is more likely than not that the Company will be required to sell the security before recovery of the entire amortized cost basis. In those instances, an impairment charge equal to the difference between the fair value and the amortized cost basis is recognized in earnings. Regardless of the Company's intent or requirement to sell a debt security, an impairment is considered other-than-temporary if the Company does not expect to recover the entire amortized cost basis; in those instances, a credit loss equal to the difference between the present value of the cash flows expected to be allocated based on credit risk and the amortized cost basis of the debt security is recognized in earnings. The Company has no current requirement or intent to sell a material portion of marketable securities as of December 31, 2021. The Company expects to recover up to (or beyond) the initial cost of investment for securities held. In computing realized gains and losses on available-for-sale securities, the Company determines cost based on amounts paid, including direct costs such as commissions to acquire the security, using the specific identification method.
Inventories
Inventories are valued at the lower of cost or net realizable value. Cost is determined based on the first-in, first-out method. There were no lower of cost or market adjustments made to the inventory values reported as of December 31, 2021 and 2020.
Renewable Identification Numbers (RINs)
When the Company produces and sells a gallon of bio-based diesel for use in the United States, 1.5 to 1.7 RINs per gallon are generated. RINs are used to track compliance with the Renewable Fuel Standard, using the EPA moderated transaction system. RFS2 allows the Company to attach between zero and 2.5 RINs to any gallon of bio-based diesel. As a result, a portion of the selling price for a gallon of bio-based diesel sold in the U.S. is generally attributable to RFS2 compliance. However, RINs that the Company generates are a form of government incentive and not a result of the physical attributes of the bio-based diesel production. Therefore, no cost is allocated to the RIN when it is generated, regardless of whether the RIN is transferred with the bio-based diesel produced or held by the Company pending attachment to other bio-based diesel production sales. Additionally, RINs, once obtained through the production and sale of gallons of bio-based diesel, may be separated by the acquirer and sold separately.
In addition, the Company also obtains RINs from third parties who have separated the RINs from gallons of bio-based diesel. From time to time, the Company holds varying amounts of these separated RINs for resale. RINs obtained from third parties are initially recorded at their cost and are subsequently revalued at the lower of cost or net realizable value as of the last day of each accounting period. The resulting adjustments are reflected in costs of goods sold for the period. The value of these RINs is reflected in “Prepaid expenses and other assets” on the Consolidated Balance Sheets. The cost of goods sold related to the sale of these RINs is determined using the average cost method, while market prices are determined by RIN values, as reported by the Oil Price Information Service ("OPIS").
Low Carbon Fuel Standard
The Company generates LCFS credits for its low carbon fuels when its qualified low carbon fuels are transported into an LCFS market and sold for qualifying purposes. LCFS credits are used to track compliance with the LCFS. As a result, a portion of the selling price for a gallon of bio-based diesel sold into an LCFS market is also attributable to LCFS compliance. However, LCFS credits that the Company generates are a form of government incentive and not a result of the physical attributes of the bio-based diesel production. Therefore, no cost is allocated to the LCFS credit when it is generated, regardless of whether the LCFS credit is transferred with the bio-based diesel produced or held by the Company.
In addition, the Company also obtains LCFS credits from third-party trading activities. From time to time, the Company holds varying amounts of these third-party LCFS credits for resale. LCFS credits obtained from third parties are initially recorded at their cost and are subsequently revalued at the lower of cost or net realizable value as of the last day of each accounting period, and the resulting adjustments are reflected in costs of goods sold for the period. The value of LCFS credits obtained from third parties is reflected in “Prepaid expenses and other assets” on the Consolidated Balance Sheet. The cost of goods sold related to the sale of these LCFS credits is determined using the average cost method, while market prices are determined by LCFS values, as reported by the OPIS. At December 31, 2021 and 2020, the Company held no LCFS credits purchased from third parties.
The Company records assets acquired and liabilities assumed through the exchange of non-monetary assets based on the fair value of the assets and liabilities acquired or the fair value of the consideration exchanged, whichever is more readily determinable.
Derivative Instruments
The Company offsets the fair value amounts recognized for its commodity contract derivatives with cash collateral with the same counterparty under a master netting agreement. The net position for Derivatives are recorded net on the balance sheet in Prepaid Expenses and Other Assets account and Accounts Payable within the Accounts Payable account. The Company did not elect to use hedge accounting during the periods presented.
Property, Plant and Equipment
Property, plant and equipment is recorded at cost less accumulated depreciation. Maintenance and repairs are expensed as incurred. Depreciation expense is computed on a straight-line method based upon estimated useful lives of the assets. Estimated useful lives are as follows:
| | | | | |
| Automobiles and trucks | 5 years |
| Computers and office equipment | 5 years |
| Office furniture and fixtures | 7 years |
| Machinery and equipment | 5-30 years |
| Leasehold improvements | lease term |
| Buildings and improvements | 30-40 years |
During the years ended December 31, 2021, 2020 and 2019, the Company capitalized interest incurred on debt during the construction of assets of $1,111, $193 and $0, respectively.
Goodwill
Goodwill is tested for impairment annually on July 31 or when impairment indicators exist. Goodwill is allocated and tested for impairment by reporting units. At December 31, 2021 and 2020, the Company had goodwill amounting to $16,080 in the Services reporting unit and $27,784 in the Bio-based Diesel Segment as a result of the Amber Resources acquisition, respectively. As a result of the annual impairment test performed as of July 31, 2021, the Company determined that there were no indications of impairment related to the Services segment's goodwill. No impairment of goodwill was recorded during the years ended December 31, 2021 and 2020.
Impairment of Long-lived Assets
The Company tests its long-lived assets for recoverability when events or circumstances indicate that its carrying amount may not be recoverable. Significant assumptions used in the undiscounted cash flow analysis, when it is required, include the projected demand for bio-based diesel based on annual renewable fuel volume obligations under the Renewable Fuel Standards ("RFS2"), the Company's capacity to meet that demand, the market price of bio-based diesel and the cost of feedstock used in the manufacturing process.
During 2021, the Company recorded impairment charges of $7,359, related to certain biodiesel property, plant and equipment as the carrying amounts of these assets were deemed not recoverable given the assets' deteriorating physical conditions identified during the period.
During 2020, the Company recorded impairment charges of $18,984 related to certain equipment where it was no longer probable that the assets will be utilized in future RD production expansions. In addition, the Company recorded impairment charges of $3,420 against certain biodiesel property, plant and equipment as the carrying amounts of these assets were deemed not recoverable given the assets' deteriorating physical conditions identified during the period.
Convertible Debt
In June 2016, the Company issued $152,000 aggregate principal amount of 4% convertible senior notes due in 2036 (the "2036 Convertible Senior Notes"). See "Note 10 - Debt" for a further description of the 2036 Convertible Senior Notes and information regarding our April 2021 notice of redemption of all such notes. During the first half of 2021, the Company received notices of conversions related to the 2036 Convertible Senior Notes in total principal amount of $59,619. The Company elected to settle the principal balance in cash and the conversion premium by issuing 4,684,263 of common shares from treasury stock, resulting in a loss on debt extinguishment $4,449. The 2036 Convertible Senior Notes were fully converted as of June 2021 and all obligations thereto have been satisfied and discharged.
During the year ended December 31, 2020, the Company used $75,890 to repurchase $30,008 principal amount of the 2036 Convertible Senior Notes, reflecting conversion premium, after tax impact of $52,681 as a reduction of Additional Paid-in Capital and gains on debt extinguishment of $1,809 in the Consolidated Statements of Operations.
Green Notes
On May 20, 2021, the Company completed the sale and issuance of $550,000 aggregate principal amount of 5.875% Senior Secured Notes due in 2028 (the "Green Notes"). The Company recorded $14,619 in legal, professional and underwriting fees related to the issuance of the Green Notes. The Company currently intends to use the net proceeds from this offering for capital expenditures related to the improvement and expansion of its Geismar, Louisiana biorefinery. See "Note 10 - Debt" for a further description of the Green Notes.
Security Repurchase Programs
In January 2019 and February 2020, the Company's Board of Directors approved a repurchase program of up to $75,000 and $100,000, respectively, of the Company's convertible notes and/or shares of common stock (the "2019 Program" and "2020 Program", respectively). Under these programs, the Company may repurchase convertible notes or shares from time to time in open market transactions, privately negotiated transactions or by other means. The timing and amount of repurchase transactions under each program are determined by the Company's management based on its evaluation of market conditions, share price, bond price, legal requirements and other factors. There were no repurchases for the year ended December 31, 2021. The table below sets out the information regarding the activities under the 2019 Program and 2020 Program during 2020:
| | | | | | | | | | | | | | | | | | | | | | | | | | | | | | | |
| | | For the year ended December 31, 2020 |
| | | | | | | | | Number of shares/Principal amount in $'000 | | January 2019 Program | | February 2020 Program | | Both Programs |
| | | | | | | | | | | | | | | |
| | | | | | | | | | | | | | | |
| 2036 Convertible Senior Notes Repurchases | | | | | | | | | $ | 30,008 | | | $ | 67,804 | | | $ | 8,086 | | | $ | 75,890 | |
| | | | | | | | | | | | | | | |
The 2019 Program was fully utilized as of September 30, 2020. At December 31, 2021, the Company has $91,914 remaining under the 2020 Program.
Equity Offering
On March 19, 2021, the Company completed an equity offering pursuant to which we sold 5,750,000 shares of common stock to various underwriters at a price of $67.00 per share before underwriting discounts and commissions. The proceeds that the Company received from the financing activity were $385,250 before underwriting discounts and commissions, fees, and other out-of-pocket costs of $19,970. The net proceeds from the transaction were $365,280.
Foreign Currency Transactions and Translation
The Company’s reporting and functional currency is U.S. dollars. Monetary assets and liabilities denominated in currencies other than U.S. dollars are remeasured into their respective functional currencies at exchange rates in effect at the balance sheet date. The resulting exchange gain or loss is included in the Company’s Consolidated Statements of Operations as foreign exchange gain (loss) unless the remeasurement gain or loss relates to an intercompany transaction that is of a long-term investment nature and for which settlement is not planned or anticipated in the foreseeable future. Gains or losses arising from translation of such transactions are reported as a component of accumulated other comprehensive income (loss) in the Company’s Consolidated Balance Sheets.
The Company translates the assets and liabilities of its foreign subsidiaries from their respective functional currencies to U.S. dollars at the appropriate spot rates as of the balance sheet date. Generally, the Company's foreign subsidiaries use the local currency as their functional currency. Changes in the carrying value of these assets and liabilities attributable to fluctuations in spot rates are recognized in foreign currency translation adjustment, a component of accumulated other comprehensive income (loss) in the Company’s Consolidated Balance Sheets.
The other comprehensive income (loss) amounts presented in the Company's Consolidated Statements of Comprehensive Income and Consolidated Statements of Stockholders' Equity mainly include the foreign currency translation adjustment resulting from translating the financial statements of certain subsidiaries from Euros to US Dollars, the Company's functional currency.
Revenue Recognition
The Company generally has a single performance obligation in its arrangements with customers. The Company believes for most of its contracts with customers, control is transferred at a point in time, typically upon delivery to the customers. When the Company performs shipping and handling activities after the transfer of control to the customers (e.g., when control transfers prior to delivery), they are considered as fulfillment activities, and accordingly, the costs are accrued for when the related revenue is recognized. Taxes collected from customers relating to product sales and remitted to governmental authorities are excluded from revenues. The Company generally expenses sales commissions when incurred because the amortization period would have been less than one year. The Company records these costs within selling, general and administrative expenses.
The following is a description of principal activities from which we generate revenue. Revenues from contracts with customers are recognized when control of the promised goods or services are transferred to our customers, in an amount that reflects the consideration that we expect to receive in exchange for those goods or services.:
•sales of biodiesel and RD produced at our facilities, including RINs and LCFS credits;
•resale of biodiesel, RD and petroleum acquired from third parties, along with the sale of RD and petroleum-based products further blended with biodiesel produced at our wholly owned facilities or acquired from third parties;
•sales of separated RINs and LCFS credits;
•sales of raw materials, glycerin and other co-products of the bio-based diesel production process;
•other revenue, including bio-based diesel facility management and operational services; and
•incentive payments from federal and state governments, including the BTC, and from the USDA Advanced Biofuel Program.
Disaggregation of revenue:
All revenue recognized in the income statement, except for Bio-based diesel Government Incentives, is considered to be revenue from contracts with customers. The following table depicts the disaggregation of revenue according to product line and segment:
| | | | | | | | | | | | | | | | | | | | | | | | | | | | | | | |
| Reportable Segments |
| Year ended December 31, 2021 | Bio-based
Diesel | | Services | | | | Corporate
and other | | Intersegment
Revenues | | Consolidated
Total |
| Bio-based diesel sales | $ | 2,143,832 | | | $ | — | | | | | $ | — | | | $ | (4,897) | | | $ | 2,138,935 | |
| Petroleum diesel sales | — | | | — | | | | | 158,587 | | | — | | | 158,587 | |
| LCFS credit sales | 158,926 | | | — | | | | | — | | | — | | | 158,926 | |
| Separated RIN sales | 355,541 | | | — | | | | | — | | | — | | | 355,541 | |
| Co-product sales | 81,510 | | | — | | | | | — | | | — | | | 81,510 | |
| Raw material sales | 20,974 | | | — | | | | | — | | | — | | | 20,974 | |
| Other bio-based diesel revenue | 38,799 | | | — | | | | | — | | | — | | | 38,799 | |
| Other revenues | — | | | 203,690 | | | | | — | | | (203,690) | | | — | |
| Total revenues from contracts with customers | $ | 2,799,582 | | | $ | 203,690 | | | | | $ | 158,587 | | | $ | (208,587) | | | $ | 2,953,272 | |
| Bio-based diesel government incentives | 290,778 | | | — | | | | | — | | | — | | | 290,778 | |
| Total revenues | $ | 3,090,360 | | | $ | 203,690 | | | | | $ | 158,587 | | | $ | (208,587) | | | $ | 3,244,050 | |
| | | | | | | | | | | | | | | | | | | | | | | | | | | | | | | |
| Reportable Segments |
| Year ended December 31, 2020 | Bio-based
Diesel | | Services | | | | Corporate
and other | | Intersegment
Revenues | | Consolidated
Total |
Bio-based diesel sales, net of BTC related amount due to customers of $1,082 | $ | 1,342,944 | | | $ | — | | | | | $ | — | | | $ | (9,099) | | | $ | 1,333,845 | |
| Petroleum diesel sales | — | | | — | | | | | 116,318 | | | — | | | 116,318 | |
| LCFS credit sales | 131,329 | | | — | | | | | — | | | — | | | 131,329 | |
| Separated RIN sales | 129,715 | | | — | | | | | — | | | — | | | 129,715 | |
| Co-product sales | 48,046 | | | — | | | | | — | | | — | | | 48,046 | |
| Raw material sales | 30,199 | | | — | | | | | — | | | — | | | 30,199 | |
| Other bio-based diesel revenue | 40,987 | | | — | | | | | — | | | — | | | 40,987 | |
| Other revenues | — | | | 87,282 | | | | | — | | | (85,875) | | | 1,407 | |
| Total revenues from contracts with customers | $ | 1,723,220 | | | $ | 87,282 | | | | | $ | 116,318 | | | $ | (94,974) | | | $ | 1,831,846 | |
| Bio-based diesel government incentives | 305,302 | | | — | | | | | — | | | — | | | 305,302 | |
| Total revenues | $ | 2,028,522 | | | $ | 87,282 | | | | | $ | 116,318 | | | $ | (94,974) | | | $ | 2,137,148 | |
| | | | | | | | | | | | | | | | | | | | | | | | | | | | | | | |
| Reportable Segment |
| Year ended December 31, 2019 | Bio-based Diesel | | Services | | | | Corporate and other | | Intersegment Revenues | | Consolidated Total |
Bio-based diesel sales, net of BTC related amount due to customers of $157,896 | $ | 1,399,509 | | | $ | — | | | | | $ | — | | | $ | (11,309) | | | $ | 1,388,200 | |
| Petroleum diesel sales | — | | | — | | | | | 270,326 | | | — | | | 270,326 | |
| LCFS credit sales | 106,524 | | | — | | | | | — | | | — | | | 106,524 | |
| Separated RIN sales | 98,285 | | | — | | | | | — | | | — | | | 98,285 | |
| Co-product sales | 38,777 | | | — | | | | | — | | | — | | | 38,777 | |
| Raw material sales | 26,456 | | | — | | | | | — | | | — | | | 26,456 | |
| Other bio-based diesel revenue | 44,793 | | | — | | | | | — | | | — | | | 44,793 | |
| Other revenues | — | | | 99,086 | | | | | — | | | (97,446) | | | 1,640 | |
| Total revenues from contracts with customers | $ | 1,714,344 | | | $ | 99,086 | | | | | $ | 270,326 | | | $ | (108,755) | | | $ | 1,975,001 | |
| Bio-based diesel government incentives | 650,215 | | | — | | | | | — | | | — | | | 650,215 | |
| Total revenues | $ | 2,364,559 | | | $ | 99,086 | | | | | $ | 270,326 | | | $ | (108,755) | | | $ | 2,625,216 | |
Contract balances
The following table provides information about receivables and contract liabilities from contracts with customers:
| | | | | | | | | | | |
| December 31, 2021 | | December 31, 2020 |
| Trade accounts receivable, gross | $ | 108,443 | | | $ | 74,774 | |
| | | |
| Short-term contract liabilities (deferred revenue) | $ | (1,822) | | | $ | (946) | |
| Short-term contract liabilities (accounts payable) | $ | (699) | | | $ | (914) | |
The Company receives payments from customers based upon contractual billing schedules; accounts receivable are recorded when the right to consideration becomes unconditional. Contract liabilities include payments received in advance of performance under the contract, and are realized with the associated revenue recognized under the contract. Significant changes to the contract liabilities during 2021 and 2020 are as follows:
| | | | | | | | | | | | | | | | | | | | | | | | | | | | | |
| January 1, 2021 | | Cash receipts
(Payments) | | Less: Impact on
Revenue | | Other | | December 31, 2021 |
| Deferred revenue | $ | 946 | | | $ | 41,797 | | | $ | 40,921 | | | $ | — | | | $ | 1,822 | |
| Payables to customers related to BTC | 914 | | | (215) | | | — | | | — | | | 699 | |
| $ | 1,860 | | | $ | 41,582 | | | $ | 40,921 | | | $ | — | | | $ | 2,521 | |
| | | | | | | | | | | | | | | | | | | | | | | | | | | | | |
| January 1, 2020 | | Cash receipts
(Payments) | | Less: Impact on
Revenue | | Other | | December 31, 2020 |
| Deferred revenue | $ | 631 | | | $ | 20,357 | | | $ | 20,042 | | | $ | — | | | $ | 946 | |
| Payables to customers related to BTC | 255,193 | | | (257,235) | | | (1,082) | | | 1,874 | | | 914 | |
| $ | 255,824 | | | $ | (236,878) | | | $ | 18,960 | | | $ | 1,874 | | | $ | 1,860 | |
Freight
Amounts billed to customers for freight are included in bio-based diesel sales. Costs incurred for freight are included in costs of goods sold.
Advertising Costs
Advertising costs are charged to expense as they are incurred. Advertising and promotional expenses were $3,193, $2,302 and $2,795 for the years ended December 31, 2021, 2020 and 2019, respectively.
Employee Benefits Plan
The Company sponsors an employee savings plan under Section 401(k) of the Internal Revenue Code. The Company makes matching contributions equal to 50% of the participant’s pre-tax contribution up to a maximum of 6% of the participant’s eligible earnings. Total expense related to the Company’s defined contribution plan was $2,079, $1,830 and $1,815 for the years ended December 31, 2021, 2020 and 2019, respectively.
Stock-Based Compensation
Stock-based compensation expense is measured at the grant-date fair value of the awards and recognized as compensation expense over the vesting period.
Income Taxes
The Company’s income tax provision, deferred income tax assets and liabilities, and liabilities for unrecognized tax benefits represent the Company’s best estimate of current and future income taxes to be paid. The annual effective tax rate is based on income tax laws, statutory tax rates, taxable income levels and tax planning opportunities available in various jurisdictions where the Company operates.
Deferred tax assets and liabilities are recorded to recognize the expected future tax benefits or liabilities of events that have been, or will be, reported in different years for financial statement purposes. Deferred tax assets and liabilities are calculated based on the difference between the financial statement and tax bases of assets and liabilities using enacted tax rates in effect for the year in which these items are expected to reverse. We review our deferred tax assets to determine if it is more-likely-than-not that they will be realized. If we determine it is not more likely than not that a deferred tax asset will be realized, we record a valuation allowance to reverse the previously recognized tax benefit. The tax laws used to record current and deferred taxes are complex and require significant judgment to determine the consolidated provision for income taxes. Changes in tax laws, statutory tax rates and estimates of the Company’s future taxable income levels could result in actual realization of deferred taxes being materially different from amounts provided for in the consolidated financial statements. We recognize tax benefits related to uncertain tax positions if we believe it is more likely than not the benefit will be realized.
The indefinite reinvestment in the earnings of non-US subsidiaries assertion is determined by management’s judgment about and intentions concerning future investment in operations. As of December 31, 2021, the Company is not indefinitely reinvested in the earnings of non-US subsidiaries.
Concentrations
The Company maintains cash balances at financial institutions, which may at times exceed the $250 coverage by the U.S. Federal Deposit Insurance Company. The Company has experienced no losses in such accounts.
Use of Estimates
The preparation of financial statements in conformity with accounting principles generally accepted in the United States of America ("GAAP") requires management to make estimates and assumptions that affect the reported amounts of assets and liabilities, disclosure of contingent assets and liabilities at the dates of the financial statements and reported amounts of revenues and expenses during the reporting periods. These estimates are based on information that is currently available to management and on various assumptions that the Company believes to be reasonable under the circumstances. Actual results could differ from those estimates.
New Accounting Pronouncements
On December 18, 2019, the FASB issued ASU 2019-12, which affects general principles within ASC 740, Income Taxes. The ASU removes the following exceptions: (1) incremental approach for intra-period tax allocation when there is a loss from continuing operations and income or a gain from other items, (2) exception to the requirement to recognize a deferred tax liability for equity method investments when a foreign subsidiary becomes an equity method investment, (3) exception to the ability not to recognize a deferred tax liability for a foreign subsidiary when a foreign equity method investment becomes a subsidiary, and (4) exception to the general methodology for calculating income taxes in an interim period when a year-to-date loss exceeds the anticipated loss for the year. The ASU also will make changes to franchise tax recognition, consideration of the tax basis recognition of goodwill related to acquisitions, specify tax allocation to subsidiaries, reflecting a change in tax law in the interim period annual effective tax rate computation in the period of enactment, and changes to the employee stock ownership plans and investments. For public business entities, the amendments in ASU 2019-12 are effective for fiscal years beginning after December 15, 2020, and interim periods within those fiscal years. The adoption of ASU 2019-12 did not have a material impact on the Company's consolidated financial statements.
On January 16, 2020, the FASB issued ASU 2020-01, which clarifies the interaction between Topic 321 (Equity Securities), Topic 323 (Equity Method Investments) and Topic 815 (Derivatives and Hedging). This amendment clarifies that an entity should not consider whether the settlement of a forward contract or exercise of an option is accounted for under Topic 323 or whether the fair value option is in accordance with Topic 825. For public business entities, the amendments in ASU 2020-01 are effective for fiscal years beginning December 15, 2020, and interim periods within those fiscal years. The adoption of ASU 2020-01 did not have a material impact on the Company's consolidated financial statements.
On March 9, 2020, the FASB issued ASU 2020-03, which clarifies and updates various topics specific to the Company such as: (1) Amending Topic 820 to explicitly apply to non-financial items accounted for as derivatives under Topic 815. (2) Improve the understanding of Topic 470 and the alignment of Line-of-Credit arrangements and Revolving-Debt arrangements. (3) Clarification on the determination of a contractual term in a net investment in a lease determined in accordance with Topic 842 and Topic 326. For public business entities, the amendments in ASU 2020-03 are effective for fiscal years beginning after December 15, 2019, and interim periods beginning after December 15, 2020. The adoption of ASU 2020-03 did not have a material impact on the Company's consolidated financial statements.
On March 12, 2020, the FASB issued ASU 2020-04, which provides a relief that is elective and applies to all entities, subject to meeting certain criteria, that have contracts, hedging relationships, and other transactions that reference LIBOR or another reference rate expected to be discontinued because of reference rate reform. Optional expedients are provided for contract modification accounting under the following Codification topics and subtopics: ASC 310, Receivables; ASC 470, Debt; ASC 840 or ASC 842, Leases; and ASC 815-15, Derivatives and Hedging: Embedded Derivatives. The ASU also establishes (1) a general contract modification principle that entities can apply in other areas that may be affected by reference rate reform and (2) certain elective hedge accounting expedients. The amendments in ASU 2020-04 are effective for all entities as of March 12, 2020, through December 31, 2022. The Company is still evaluating the impact of the guidance on its consolidated financial statements.
On August 5, 2020, the FASB issued ASU 2020-06, which reduces the complexity of the accounting for convertible debt instruments and its effect on earnings per share calculation. The guidance reduces the number of accounting models used for convertible debt instruments, which will result in fewer embedded conversion features being recognized separately from the original contract. This will also affect the guidance associated with convertible debt for earnings-per-share by requiring the if-converted method rather than the treasury stock method, requiring that potential share settlement be included in the calculation of diluted earnings per share and clarifying that an entity should use the weighted-average share count from each quarter when calculating the year-to-date weighted-average share count. For public business entities, the amendments in ASU 2020-06 are effective for fiscal years beginning after December 15, 2021, including interim periods within those years, and early adoption is permitted for fiscal years beginning after December 15, 2020, including interim periods within those years. The Company is evaluating the impact of the guidance on its consolidated financial statements, but does not expect the impact to be material.
On October 28, 2021, the FASB issued ASU 2021-08, which updates the guidance related to the acquisition of revenue contracts in a business combination. The new guidance requires that the acquiring entity recognize and measure contract assets and liabilities acquired in a business combination in accordance with Topic 606. At the acquisition date the acquirer should recognize the contract assets and liabilities under Topic 606 as they would have been recognized at contract origination rather than at fair value at the time of the acquisition. The intent is to create more comparability of recognition and measurement of the acquired contracts in business combinations. For public business entities, the amendments in ASU 2021-08 are effective for fiscal years beginning after December 15, 2022, including interim periods within those fiscal years. The Company is evaluating the impact of the guidance on its consolidated finance statements.
On November 17, 2021, the FASB issued ASU 2021-10, which requires business entities to provide certain disclosures when they (1) have received government assistance and (2) use a grant or contribution accounting model by analogy to other accounting guidance. The guidance will require business entities to disclose the nature of the transactions, accounting policies used to account for the transactions, and state which line items on the balance sheet and income statement are affected by these transactions and the amount applicable to each financial statement line. Business entities will also have to disclose significant terms and conditions of transactions with a government such as the duration of the agreement, any commitments made by either side, provisions, and contingencies. The guidance in ASU 2021-10 is effective for all entities for fiscal years beginning after December 15, 2021. Entities may apply the provision either (1) prospectively to all transactions within the scope of ASC 832 that are reflected in the financial statements as of the adoption date and all new transactions entered into after the date of adoption or (2) retrospectively. Early adoption is permitted. The Company is still evaluating the impact of the guidance on its consolidated financial statements.
NOTE 3—ACQUISITIONS
On December 30, 2021, the Company acquired 100% of the stock of Amber Resources. Amber Resources is one of the leading full-service petroleum distributors and providers in Southern California, offering a broad product line of fuel, lubricants
and diesel exhaust fluid ("DEF") solutions via highly differentiated, service-oriented model. Amber Resources is consolidated into REG in accordance with ASC 805, Business Combinations and is part of the Bio-based Diesel Reportable Segment. The Company completed its preliminary accounting of this business combination as the valuation of the acquired assets and assumed liabilities, including a tax reserve, was not finalized as of the date of this report. The consideration for the acquisition of Amber Resources was $82,104.
The Company used the income approach to value certain intangible assets. Under the income approach, an intangible asset’s fair value is equal to the present value of future economic benefits to be derived from ownership of the asset. The Company used the income approach known as the relief from royalty method to value the fair value of the trade names. The relief from royalty method is based on the hypothetical royalty stream that would be received if we were to license the trade name and was based on expected revenues. The determination of the fair value of other assets acquired and liabilities assumed involves assessing factors such as the expected future cash flows associated with individual assets and liabilities and appropriate discount rates at the date of the acquisition.
The following table summarizes the fair values of the assets acquired and liabilities assumed at the acquisition date.
| | | | | |
| December 30, 2021 |
| Assets (liabilities) acquired of Amber Resources: | |
| Cash | $ | 5,643 | |
| Accounts receivable (net of allowance for doubtful accounts) | 17,360 | |
| Inventory | 8,830 | |
| Other current assets | 4,558 | |
| Property, plant and equipment | 16,301 | |
| Right of use assets | 15,773 | |
| Intangibles | 44,900 | |
| Goodwill | 27,784 | |
| Other assets | 4,024 | |
| Total assets acquired | 145,173 | |
| |
| Accounts payable | 20,467 | |
| Accrued expenses and other liabilities | 11,353 | |
| Current maturities of operating lease obligations | 1,528 | |
| Other liabilities | 2,625 | |
| Deferred income taxes | 12,682 | |
| Long-term operating lease obligations | 14,414 | |
| Total liabilities acquired | $ | 63,069 | |
NOTE 4—MARKETABLE SECURITIES
The Company's investments in marketable securities are stated at fair value and are available-for-sale. The following table summarizes the Company's investments in marketable securities for the year ended December 31, 2021 and 2020:
| | | | | | | | | | | | | | | | | | | | | | | | | | | | | |
| December 31, 2021 |
| Maturity | | Gross Amortized Cost | | Total Unrealized Gains | | Total Unrealized Losses | | Fair Value |
| Short-term marketable securities |
| Commercial paper | Within one year | | $ | 116,937 | | | $ | 1 | | | $ | (36) | | | $ | 116,902 | |
| Corporate bonds | Within one year | | 166,311 | | | 2 | | | (170) | | | 166,143 | |
| | | | | | | | | |
| Municipal bonds | Within one year | | 7,781 | | | — | | | (8) | | | 7,773 | |
| Total | | | $ | 291,029 | | | $ | 3 | | | $ | (214) | | | $ | 290,818 | |
| Long-term marketable securities |
| Corporate bonds | within one - five years | | $ | 164,071 | | | $ | — | | | $ | (437) | | | $ | 163,634 | |
| | | | | | | | | |
| Municipal bonds | within one - five years | | 4,162 | | | — | | | (29) | | | 4,133 | |
| Total | | | $ | 168,233 | | | $ | — | | | $ | (466) | | | $ | 167,767 | |
| | | | | | | | | | | | | | | | | | | | | | | | | | | | | |
| December 31, 2020 |
| Maturity | | Gross Amortized Cost | | Total Unrealized Gains | | Total Unrealized Losses | | Fair Value |
| Short-term marketable securities |
| Commercial paper | Within one year | | $ | 48,685 | | | $ | 31 | | | $ | (2) | | | $ | 48,714 | |
| Corporate bonds | Within one year | | 78,282 | | | 45 | | | (18) | | | 78,309 | |
| U.S. Treasury bills | Within one year | | 19,995 | | | 2 | | | — | | | 19,997 | |
| Municipal bonds | Within one year | | 2,500 | | | 1 | | | — | | | 2,501 | |
| Total | | | $ | 149,462 | | | $ | 79 | | | $ | (20) | | | $ | 149,521 | |
| Long-term marketable securities |
| Corporate bonds | within one - five years | | $ | 91,694 | | | $ | 35 | | | $ | (40) | | | $ | 91,689 | |
| U.S. Treasury bills | within one - five years | | 25,000 | | | 1 | | | (5) | | | 24,996 | |
| Municipal bonds | within one - five years | | 3,335 | | | 2 | | | — | | | 3,337 | |
| Total | | | $ | 120,029 | | | $ | 38 | | | $ | (45) | | | $ | 120,022 | |
NOTE 5—INVENTORIES
Inventories consist of the following at December 31:
| | | | | | | | | | | |
| 2021 | | 2020 |
| Raw materials | $ | 168,039 | | | $ | 65,969 | |
| Work in process | 7,920 | | | 5,515 | |
| Finished goods | 277,633 | | | 137,877 | |
| Total | $ | 453,592 | | | $ | 209,361 | |
NOTE 6—PROPERTY, PLANT AND EQUIPMENT
Company's owned property, plant and equipment consists of the following at December 31:
| | | | | | | | | | | |
| 2021 | | 2020 |
| Land | $ | 9,756 | | | $ | 10,094 | |
| Building and improvements | 175,252 | | | 157,488 | |
| Leasehold improvements | 3,949 | | | 12,182 | |
| Machinery and equipment | 641,919 | | | 636,269 | |
| 830,876 | | | 816,033 | |
| Accumulated depreciation | (292,759) | | | (273,003) | |
| 538,117 | | | 543,030 | |
| Construction in process | 139,327 | | | 51,766 | |
| Total | $ | 677,444 | | | $ | 594,796 | |
During 2021, the Company recorded impairment charges of $7,359, related to certain biodiesel property, plant and equipment as the carrying amounts of these assets were deemed not recoverable given the assets' deteriorating physical conditions identified during the period.
During 2020, the Company recorded impairment charges of $18,984 related to certain equipment where it was determined that the assets will no longer be used in future RD production expansions and their carrying amount was deemed not recoverable. In addition, the Company recorded impairment charges of $3,420 against certain biodiesel property, plant and equipment as the carrying amounts of these assets were deemed not recoverable given the assets' economic obsolescence identified during the period.
NOTE 7—INTANGIBLE ASSETS
Amortizing intangible assets consist of the following at December 31:
| | | | | | | | | | | | | | | | | |
| December 31, 2021 |
| Cost | | Accumulated Amortization | | Net |
| Raw material supply agreement | $ | 6,230 | | | $ | (4,296) | | | $ | 1,934 | |
| RD technology | 8,300 | | | (4,196) | | | 4,104 | |
| Acquired customer relationships | 44,947 | | | (2,510) | | | 42,437 | |
| | | | | |
| | | | | |
| | | | | |
| | | | | |
| Trade names | 4,700 | | | — | | | 4,700 | |
| Other intangible assets | 200 | | | (200) | | | — | |
| Total intangible assets | $ | 64,377 | | | $ | (11,202) | | | $ | 53,175 | |
| | | | | | | | | | | | | | | | | |
| December 31, 2020 |
| Cost | | Accumulated Amortization | | Net |
| Raw material supply agreement | $ | 6,230 | | | $ | (3,618) | | | $ | 2,612 | |
| RD technology | 8,300 | | | (3,643) | | | 4,657 | |
| Acquired customer relationships | 4,747 | | | (2,025) | | | 2,722 | |
| | | | | |
| | | | | |
| | | | | |
| Other intangible assets | 904 | | | (187) | | | 717 | |
| Total intangible assets | $ | 20,181 | | | $ | (9,473) | | | $ | 10,708 | |
The raw material supply agreement acquired is amortized over its 15 year term based on actual usage under the agreement and expires in 2025. The Company determined the estimated amount of raw materials to be purchased over the life of the agreement to calculate a per pound rate of consumption. The rate is then multiplied by the actual usage each period for expense reporting purposes.
The acquired customer relationships obtained through the acquisition of Amber Resources of $40,200 is amortized over a 15 year life, expiring in 2037. Acquired customer relationships are amortized on a straight-line basis over 10 years to 15 years. Trade names were acquired as part of the Amber Resources acquisition and are amortized on a straight-line basis over 5 years.
Amortization expense of $1,729, $1,310 and $1,628 for intangible assets was recorded for the years ended December 31, 2021, 2020 and 2019, respectively.
Estimated amortization expense for fiscal years ended December 31 is as follows:
| | | | | |
| 2022 | $ | 5,239 | |
| 2023 | 5,249 | |
| 2024 | 5,260 | |
| 2025 | 4,988 | |
| 2026 | 4,301 | |
| Thereafter | 28,138 | |
| Total | $ | 53,175 | |
NOTE 8—OTHER ASSETS
Prepaid expenses and other current assets consist of the following at December 31:
| | | | | | | | | | | |
| 2021 | | 2020 |
| Commodity derivatives and related collateral, net | $ | 9,651 | | | $ | 5,433 | |
| Prepaid expenses | 25,537 | | | 27,933 | |
| | | |
| | | |
| Deposits | 1,830 | | | 2,047 | |
| RIN inventory | 5,741 | | | 869 | |
| Taxes receivable | 43,735 | | | 29,621 | |
| | | |
| Other | 6,949 | | | 1,754 | |
| Total | $ | 93,443 | | | $ | 67,657 | |
RIN inventory is valued at the lower of cost or net realizable value and consists of (i) RINs the Company generates in connection with its production of bio-based diesel and (ii) RINs acquired from third parties. RINs generated by the Company are recorded at no cost, as these RINs are government incentives and not a tangible output from its bio-based diesel production. The cost of RINs acquired from third parties is determined using the average cost method. RIN market value is based upon pricing as reported by the OPIS. Since RINs generated by the Company have zero cost associated to them, the lower of cost or market adjustment in RIN inventory reflects only the value of RINs obtained from third parties. There were no lower of cost or market adjustments made to RIN inventory values reported at December 31, 2021 or 2020.
Other noncurrent assets consist of the following at December 31:
| | | | | | | | | | | |
| 2021 | | 2020 |
| Investments | $ | 15,724 | | | $ | 13,005 | |
| Spare parts inventory | 2,756 | | | 2,610 | |
| Catalysts | 14,985 | | | 7,408 | |
| Deposits | 357 | | | 451 | |
| Long term notes receivable | 11,259 | | | 542 | |
| Other | 15,801 | | | 8,704 | |
| Total | $ | 60,882 | | | $ | 32,720 | |
NOTE 9—ACCRUED EXPENSES AND OTHER LIABILITIES
Accrued expenses and other liabilities consist of the following at December 31:
| | | | | | | | | | | |
| 2021 | | 2020 |
| Accrued property taxes | $ | 1,684 | | | $ | 1,807 | |
| Accrued employee compensation | 31,862 | | | 19,640 | |
| Accrued interest | 2,752 | | | 4,049 | |
| | | |
| | | |
| | | |
| | | |
| Tax payable | 7,791 | | | 5,569 | |
| | | |
| Asset retirement obligations | 3,000 | | | 83 | |
| Other | 6,795 | | | 3,727 | |
| Total | $ | 53,884 | | | $ | 34,875 | |
Other noncurrent liabilities consist of the following at December 31:
| | | | | | | | | | | |
| 2021 | | 2020 |
| | | |
| | | |
| | | |
| | | |
| Asset retirement obligations | $ | — | | | $ | 747 | |
| Other | 4,100 | | | 3,738 | |
| Total | $ | 4,100 | | | $ | 4,485 | |
NOTE 10—DEBT
Term debt
The Company’s term debt at December 31 is as follows:
| | | | | | | | | | | |
| 2021 | | 2020 |
| | | |
5.875% Senior Secured Green Notes, due 2028 | $ | 550,000 | | | $ | — | |
4.00% Convertible Senior Notes, $59,619 face amount at December 31, 2020, due in June 2036 | — | | | 47,057 | |
| | | |
| | | |
| | | |
| | | |
| | | |
REG Ralston term loan, variable interest rate of LIBOR plus 2.25%, due in October 2025 | — | | | 13,241 | |
| | | |
| | | |
REG Capital term loan, fixed interest rate of 3.99%, due in January 2028 | — | | | 6,665 | |
| Other | — | | | 14 | |
| Total debt before debt issuance costs | 550,000 | | | 66,977 | |
| Less: Current portion of long-term debt | — | | | 50,088 | |
Less: Debt issuance costs (net of accumulated amortization of $1,376 and $990, respectively) | 13,243 | | | 1,731 | |
| Total long-term debt | $ | 536,757 | | | $ | 15,158 | |
Green Notes
On May 20, 2021, the Company completed the sale and issuance of $550,000 aggregate principal amount 5.875% Senior Secured Green Notes due 2028 pursuant to an indenture, dated as of May 20, 2021 (the "Indenture"), by and among the Company, certain of its subsidiaries, as guarantors, and UMB Bank, N.A., a national banking association, as trustee. The Green Notes bear interest at a rate of 5.875% per annum, payable semi-annually in arrears on June 1 and December 1, beginning on December 1, 2021. The Green Notes will mature on June 1, 2028, unless earlier repurchased or redeemed. The Company currently intends to use the net proceeds from this offering for capital expenditures related to the improvement and expansion of its Geismar, Louisiana RD biorefinery. The Company recorded $14,619 in legal, professional and underwriting fees related to the issuance of the Green Notes. These financing costs are being amortized using the effective interest method over the term of the debt. Prior to June 1, 2024, the Company may, at its option but subject to the conditions in the Indenture, (i) redeem up to 35% of the aggregate principal amount of the Green Notes at a redemption price equal to 105.875% of the aggregate principal amount thereof, plus accrued and unpaid interest, if any, to, but not including, the redemption date, with the net cash proceeds received by the Company in one or more equity offerings; provided that at least 65% of the aggregate principal amount of the Green Notes issued under the Indenture (including any additional notes originally issued under the Indenture) remain outstanding after each such redemption or (ii) redeem all or part of the Green Notes at a price equal to 100% of the principal
amount thereof, plus accrued and unpaid interest, if any, to , but not including, the applicable redemption date of the notes redeemed by us and a "make-whole" premium. On or after June 1, 2024, 2025 and 2026, respectively, the Company may, at its option, redeem some or all of the Green Notes at the redemption price of 102.938%, 101.469% and 100.000%, respectively, plus accrued and unpaid interest, if any, to, but not including, the applicable redemption date of the notes redeemed by us. Upon the occurrence of a "change in control" (as defined in the Indenture), each holder of their Green Notes may require the Company to repurchase all or a portion of the Green Notes in cash at a price equal to 101.0% of the aggregate principal amount to be repurchased, plus accrued and unpaid interest, if any, thereon to, but not including, the date of repurchase.
The Indenture contains covenants that, among other things, limit the Company's ability and the ability of its restricted subsidiaries to:
•incur additional indebtedness or issue certain disqualified stock or preferred stock;
•create liens;
•pay dividends or distributions, redeem or repurchase equity;
•prepay subordinated indebtedness or make certain investments;
•transfer or sell assets;
•engage in a consolidation or merger, or sell, transfer or otherwise dispose of all or substantially all of their assets; and
•enter into certain transactions with affiliates.
These covenants are subject to a number of exceptions and limitations as set forth in the Indenture. The Green Notes and related guarantees are secured by substantially all of the assets of the Company and its guarantor subsidiaries subject to certain exceptions and limitations; provided that the security interests granted by the Company and such guarantor subsidiaries that are obligors under the M&L and Services Revolver on (i) their working capital assets (including accounts receivable and inventory) will be contractually senior and (ii) all other assets will be contractually subordinated, in each case, to the security interests granted by them on such assets to secure the Green Notes and related guarantees pursuant to an intercreditor agreement.
The Indenture provides for customary events of default (subject in certain cases to customary grace and cure periods), which include nonpayment, breach of certain covenants, payment defaults or acceleration of other indebtedness, a failure to pay certain judgements and certain events of bankruptcy and insolvency. Generally, if an event of default occurs and is continuing, the trustee or holders of at least 25% in principal amount of the then outstanding Green Notes may declare the principal of, premium, if any, and accrued but unpaid interest on all the Green Notes to be due and payable. Upon such a declaration, such principal, premium, if any, and accrued and unpaid interest will be due and payable immediately. Notwithstanding the foregoing, if certain events of bankruptcy or insolvency occur with respect to the Company, certain of its significant subsidiaries or any group of certain of its subsidiaries that taken as a whole would constitute a significant subsidiary, such principal, premium, if any, and accrued and unpaid interest will become due and payable immediately without further action or notice.
The Green Notes are due in full at maturity. The Green Notes mature in June 2028 at which time the Company will pay the principal amount of $550,000 and any outstanding interest.
2036 Convertible Senior Notes
On June 2, 2016, in a private offering to qualified institutional buyers, the Company issued $152,000 aggregate principal amount of the 2036 Convertible Senior Notes bearing interest at a rate of 4.00% per year payable semi-annually in arrears on June 15 and December 15 of each year, beginning December 15, 2016.
On April 12, 2021, the Company issued a notice of redemption to redeem all outstanding 2036 Convertible Senior Notes on June 15, 2021 at a redemption price equal to 100% of the principal amount of the notes redeemed. Because the redemption date is the interest payment date relating to the regular record date of June 1, 2021, the holders of the notes on June 1, 2021 were entitled to receive, on the redemption date, the unpaid interest that had accrued on such note. By June 11, 2021, the Company had received notices of conversion from all bondholders on the remaining 2036 Convertible Senior Notes and as of June 15, 2021, all outstanding 2036 Convertible Senior Notes were fully redeemed and all obligations thereto were satisfied and discharged. The Company elected to settle all conversions of each $1,000 principal amount of such notes being converted, with $1,000 in cash and any conversion value in excess of that amount in shares of the Company's common stock.
Other term debt
On April 22, 2021, REG Ralston, LLC and REG Capital, LLC paid off the outstanding balance of the term loans owed of $12,556 and $6,596, respectively.
Lines of Credit
The following table shows the Company's lines of credit:
| | | | | | | | | | | |
| 2021 | | 2020 |
| Total revolving loans (current) | $ | — | | | $ | — | |
| Maximum remaining available to be borrowed under revolving lines of credit | $ | 249,666 | | | $ | 149,666 | |
On September 30, 2021, REG Services Group, LLC and REG Marketing & Logistics, LLC, wholly-owned subsidiaries of the Company (which subsidiaries are referred to as the "subsidiary borrowers" under the following credit agreement), entered into Amendment No. 17 to Credit Agreement, which amends that certain Credit Agreement, dated as of December 23, 2011, by and among the subsidiary borrowers, the lenders party thereto (the “Lenders”), and Wells Fargo Capital Finance, LLC, as the agent (as amended, the “M&L and Services Revolver”). Effective from September 30, 2021, the maximum commitment of the Lenders under the M&L and Services Revolver to make revolving loans increased from $150,000 to $250,000 subject to borrowing base limitations and further subject to an accordion feature, which allows the subsidiary borrowers to request commitments for additional revolving loans in an aggregate amount not to exceed $50,000 (prior to September 30, 2021) and $100,000 (on and after September 30, 2021), the making of which is subject to customary conditions, including the consent of Lenders providing such additional commitments.
The maturity date of the M&L and Services Revolver is September 30, 2026. Loans advanced under the M&L and Services Revolver bear interest based on a one-month LIBOR rate (which shall not be less than zero), plus a margin based on Quarterly Average Excess Availability (as defined in the Revolving Credit Agreement), which may range from 1.50% per annum to 2.00% per annum.
The M&L and Services Revolver contains various loan covenants that restrict each subsidiary borrower’s ability (and subject to certain exceptions, each Plant Loan Party's (as defined below) ability) to take certain actions, including restrictions on incurrence of indebtedness, creation of liens, mergers or consolidations, dispositions of assets, repurchase or redemption of capital stock, making certain investments, making distributions to the Company unless certain conditions are satisfied, entering into certain transactions with affiliates or changing the nature of the subsidiary’s business. In addition, the subsidiary borrowers are required to maintain a fixed charge coverage ratio of at least 1.0 to 1.0 if excess availability under the M&L and Services Revolver is less than 10% of the total $250,000 of current revolving loan commitments, or $25,000 currently. The M&L and Services Revolver is secured by the subsidiary borrowers’ membership interests and substantially all of their assets. In addition, the M&L and Services Revolver is secured by the accounts receivable and inventory of REG Albert Lea, LLC, REG Geismar, LLC, and REG Seneca, LLC (collectively, the "Plant Loan Parties") subject to an overall dollar limitation with respect to each Plant Loan Party, and the obligations under the M&L and Services Revolver are guaranteed by the Company.
NOTE 11—INCOME TAXES
Income tax benefit (expense) related to continuing operations for the years ended December 31 is as follows:
| | | | | | | | | | | | | | | | | |
| 2021 | | 2020 | | 2019 |
| Current income tax expense | | | | | |
| | | | | |
| State | $ | (178) | | | $ | (135) | | | $ | (12) | |
| Foreign | (3,300) | | | (3,798) | | | (33) | |
| (3,478) | | | (3,933) | | | (45) | |
| Deferred income tax benefit (expense) | | | | | |
| Federal | (3,248) | | | (24,746) | | | (8,093) | |
| State | 1,418 | | | (2,882) | | | 1,904 | |
| Foreign | (395) | | | (1,162) | | | 1,494 | |
| | | | | |
| Net operating loss carryforwards created | 25,745 | | | 62,989 | | | 68,344 | |
| 23,520 | | | 34,199 | | | 63,649 | |
| Income tax benefit before valuation allowances | 20,042 | | | 30,266 | | | 63,604 | |
| Deferred tax valuation allowances | (5,563) | | | (36,195) | | | (63,034) | |
| Income tax benefit (expense) | $ | 14,479 | | | $ | (5,929) | | | $ | 570 | |
A reconciliation of the reported amount of income tax expense to the amount computed by applying the statutory federal income tax rate to earnings before income taxes from continuing operations is as follows:
| | | | | | | | | | | | | | | | | |
| 2021 | | 2020 | | 2019 |
U.S. Federal income tax expense at statutory rates of 21 percent for all periods | $ | (41,862) | | | $ | (27,036) | | | $ | (78,105) | |
| State taxes, net of federal income tax benefit | 3,573 | | | 4,954 | | | 12,394 | |
| Tax position on government incentives | 52,223 | | | 58,602 | | | 124,553 | |
| Global intangible low tax income | (1,313) | | | (5,188) | | | — | |
| | | | | |
| | | | | |
| | | | | |
| | | | | |
| | | | | |
| | | | | |
| Equity and executive compensation | 9,447 | | | 2,086 | | | — | |
| Foreign rate differential | (1,473) | | | (1,576) | | | — | |
| Research & development tax credit | — | | | 473 | | | 2,703 | |
| Non-deductible expenses | (659) | | | (1,245) | | | — | |
| Unrecognized tax benefits | (349) | | | (427) | | | (24) | |
| Other | 455 | | | (377) | | | 2,083 | |
| Total benefit (expense) for income taxes before valuation allowances | 20,042 | | | 30,266 | | | 63,604 | |
| Valuation allowances | (5,563) | | | (36,195) | | | (63,034) | |
| Total benefit (expense) for income taxes | $ | 14,479 | | | $ | (5,929) | | | $ | 570 | |
The Company receives government incentive payments and excludes this revenue from federal and state taxable income. This tax position of excluding government incentives from taxable income has been accepted by the Internal Revenue Service for the audit cycle 2010-2011, the results of which were approved by the Joint Committee on Taxation. As a result of excluding these government incentive payments in the U.S., the Company currently has cumulative U.S. losses in recent years and initially established a valuation allowance to reduce its total deferred tax assets to the amount more-likely-than-not to be realized. After weighing the available positive and negative evidence, the Company changed its judgment and believes the realizability of deferred tax assets in a non-U.S. jurisdiction is more-likely-than-not, and recorded a tax benefit for the reversal of its valuation allowance.
The tax effects of temporary differences that give rise to the Company’s deferred tax assets and liabilities at December 31 are as follows:
| | | | | | | | | | | |
| 2021 | | 2020 |
| Deferred Tax Assets: | | | |
| Net operating loss carryforwards | $ | 439,738 | | | $ | 411,726 | |
| Goodwill | 7,981 | | | 13,658 | |
| | | |
| Stock-based compensation | 2,040 | | | 3,550 | |
| Interest expense carryforward | 9,388 | | | 5,391 | |
| Tax credit carryforwards | 4,233 | | | 6,521 | |
| | | |
| | | |
| Leases | 12,235 | | | 7,818 | |
| Intangibles | — | | | 1,459 | |
| Risk management unrealized loss | 377 | | | 1,548 | |
| Accrued compensation | 5,463 | | | 4,336 | |
| Inventory capitalization | 9,648 | | | 3,226 | |
| | | |
| Other | 5,141 | | | 5,235 | |
| Deferred tax assets | 496,244 | | | 464,468 | |
| Deferred Tax Liabilities: | | | |
| Property, plant and equipment | (76,247) | | | (68,948) | |
| Leases | (12,163) | | | (7,822) | |
| Convertible debt | — | | | (3,253) | |
| | | |
| Intangibles | (10,080) | | | — | |
| Prepaid expenses | (2,878) | | | (2,644) | |
| | | |
| Other | (498) | | | (622) | |
| Deferred tax liabilities | (101,866) | | | (83,289) | |
| Net deferred tax assets | 394,378 | | | 381,179 | |
| Valuation allowance | (392,866) | | | (387,786) | |
| Net deferred tax assets (liabilities) | $ | 1,512 | | | $ | (6,607) | |
At December 31, 2021, the Company has recorded a net deferred tax asset before valuation allowance of $439,738 related to the benefit of federal, state and foreign net operating loss carry-forwards. Federal net operating loss carry-forward totals $1,667,000 and will begin to expire in 2028, while the amount and expiration dates of state net operating losses vary by jurisdiction. Changes in ownership of the Company, as defined by Section 382 of the Internal Revenue Code of 1986, as amended, in any one year may limit the utilization of federal and state net operating losses and credit carry-forwards. The Company has performed an ownership change analysis during 2021 to determine the impact of changes in ownership on utilization of carry-forward attributes, the results of which have been incorporated into our financial statements.
In evaluating available evidence around the recoverability of net deferred tax assets, the Company considers, among other factors, historical financial performance, expectation of future earnings, length of statutory carry-forward periods and ability to carry back losses to prior periods, experience with operating loss and tax credit carry-forwards expiring unused, tax planning strategies and timing for the of reversals of temporary differences. In evaluating losses, management considers the nature, frequency and severity of losses in light of the conditions giving rise to those losses. During the quarter ended December 31, 2021, the Company changed its judgement about the realizability of its deferred tax assets in a non-U.S. jurisdiction, resulting in the recognition of a tax benefit of $6,100 due to the reversal of the valuation allowance offsetting certain deferred tax assets. The primary drivers of this change in judgement resulted from changes in operating results in recent years, plus positive evidence due to Board approved capital investment which supports future earnings projections. Related to the U.S., as a result of the above described tax position of excluding government incentive payments from U.S. taxable income, the Company currently has cumulative U.S. losses in recent years and has established a valuation allowance to reduce its total deferred tax assets to the amount more-likely-than-not to be realized. In the acquisition accounting for Amber Resources the Company recorded deferred tax liabilities, which resulted in an income tax benefit of $12,683 from the partial reversal of the valuation allowance offsetting U.S. deferred tax assets outside of acquisition accounting. Activity regarding the valuation allowance for deferred tax assets was as follows:
| | | | | | | | | | | | | | | | | |
| 2021 | | 2020 | | 2019 |
| Beginning of year balance | $ | 387,786 | | | $ | 350,902 | | | $ | 283,805 | |
| Changes in valuation allowance charged to income | (561) | | | 36,195 | | | 65,558 | |
| Change in valuation allowance due to change in judgment | 6,124 | | | — | | | — | |
| Foreign currency translation | (658) | | | 689 | | | (164) | |
| Change in valuation allowance charged to OCI | 175 | | | — | | | (7) | |
| Change in valuation allowance charged to equity | — | | | — | | | 1,710 | |
| | | | | |
| End of year balance | $ | 392,866 | | | $ | 387,786 | | | $ | 350,902 | |
The Company analyzes filing positions in all of the federal, state and foreign jurisdictions where it is required to file income tax returns, and all open tax years in these jurisdictions to determine if it has any uncertain tax positions on any of its income tax returns. An uncertain tax position represents a tax position taken to not file a tax return, and also tax positions in a filed tax return or planned to be taken in a tax return not yet filed, the benefit of which has not been reflected in measuring income tax expense for financial reporting purposes. The Company does not recognize income tax benefits associated with uncertain tax positions where it is determined that it is not more-likely-than-not, based on the technical merits, that the position will be sustained upon examination.
A reconciliation of the total amounts of unrecognized tax benefits at December 31 is as follows:
| | | | | | | | | | | | | | | | | |
| 2021 | | 2020 | | 2019 |
| Beginning of year balance | $ | 3,232 | | | $ | 2,777 | | | $ | 2,028 | |
| Increases to tax positions expected to be taken | 2,708 | | | — | | | 732 | |
| Increases to tax positions taken during prior years | 288 | | | 427 | | | 24 | |
| | | | | |
| | | | | |
| Foreign currency translation | (50) | | | 28 | | | (7) | |
| End of year balance | $ | 6,178 | | | $ | 3,232 | | | $ | 2,777 | |
The current year increase includes an unrecognized tax benefit liability in acquisition accounting associated with the assumption of uncertain tax positions in the acquisition of Amber Resources. The amount of unrecognized tax benefits that would affect the effective tax rate if the tax benefits were recognized was $5,301 at December 31, 2021, $726 at December 31, 2020, and $274 at December 31, 2019. The remaining liability for unrecognized tax benefits is related to tax positions for which there is a related deferred tax asset. The Company does not believe it is reasonably possible that the amounts of unrecognized tax benefits existing as of December 31, 2021 will significantly increase or decrease over the next twelve months. Interest and penalties related to unrecognized tax benefits are recognized as a component of income tax expense.
The Company is subject to tax in the United States and various state and foreign jurisdictions. The U.S. Internal Revenue Service has examined the Company's federal income tax returns through 2008, as well as 2010 and 2011. During the fourth quarter of 2020, the German tax authorities began an examination of the Company's corporate income tax returns for the years 2016 through 2018, and have previously examined such tax returns through 2014. All other years in the United States and Germany are subject to examination, while various state and other foreign income tax returns also remain subject to examination by taxing authorities.
Although not considered indefinitely reinvested, the Company has not made a provision for United States or additional foreign withholding taxes due to provisional accumulated tax deficits outside the United States. The Company has not recorded a deferred tax asset for the outside basis difference related to investments in its foreign subsidiaries as it is not expected that the difference will reverse in the foreseeable future.
NOTE 12—STOCK-BASED COMPENSATION
On October 26, 2011, the stockholders approved the 2009 Stock Incentive Plan ("the 2009 Plan") which authorizes up to 4,160,000 shares of Company Common Stock to be issued for the award of restricted stock, restricted stock units ("RSUs"), performance restricted stock units ("PRSUs") and stock appreciation rights ("SARs") at the discretion of the Company Board as compensation to employees, consultants of the Company and to non-employee directors. Under the 2009 Plan, an additional 2,350,000 shares, or 6,510,000 shares in total, are reserved for issuance as approved by shareholders on May 15, 2014 and May 8, 2017. From May 18, 2021, no new shares will be granted under the 2009 Plan.
On May 18, 2021, the stockholders approved the 2021 Stock Incentive Plan ("the 2021 Plan") which authorizes up to 1,900,000 shares of Company Common Stock to be issued for the award of restricted stock, restricted stock units ("RSUs"), performance restricted stock units ("PRSUs") and stock appreciation rights ("SARs") at the direction of the Company Board as compensation to employees, consultants of the Company and to non-employee directors.
The expense for both plans is measured at the grant-date fair value of the award and recognized as compensation expense on a straight-line basis over the service period, which is the vesting period. There was no cash flow impact resulting from the grants of these awards. The 2009 and 2021 Plans are generally protected from anti-dilution via adjustments for any stock dividends, stock split, combination or other recapitalization.
The Company recorded stock-based compensation expense of $7,997, $6,942 and $6,707 for the years ended December 31, 2021, 2020 and 2019, respectively. The stock-based compensation costs were included as a component of selling, general and administrative expenses. At December 31, 2021, there was $12,716 of unrecognized compensation expense related to unvested awards, which is expected to be recognized over a period of approximately 2.7 years.
Restricted Stock Units
The following table summarizes information about the Company’s Common Stock RSU’s granted, vested, exercised and forfeited:
| | | | | | | | | | | |
| Number of
Awards | | Weighted
Average Issue
Price |
| Awards outstanding - January 1, 2019 | 1,022,274 | | | $ | 13.04 | |
| Issued | 277,711 | | | $ | 21.76 | |
| Vested and restriction lapsed | (425,041) | | | $ | 9.79 | |
| Forfeited | (89,779) | | | $ | 11.85 | |
| Awards outstanding - December 31, 2019 | 785,165 | | | $ | 18.02 | |
| Issued | 292,638 | | | $ | 24.06 | |
| Vested and restriction lapsed | (319,541) | | | $ | 14.66 | |
| Forfeited | (10,379) | | | $ | 14.82 | |
| Awards outstanding - December 31, 2020 | 747,883 | | | $ | 21.87 | |
| Issued | 132,721 | | | $ | 60.84 | |
| Vested and restriction lapsed | (479,516) | | | $ | 17.38 | |
| Forfeited | (21,178) | | | $ | 33.49 | |
| Awards outstanding - December 31, 2021 | 379,910 | | | $ | 35.50 | |
The RSUs convert into one share of common stock upon vesting. The majority of the RSU grants in 2019 and after vest one third on each of the three anniversary dates following the grant date. The service period for these RSU awards, excluding those issued to the Company’s Board of Directors (one year) and certain executive management (three to four years), is a three year period from the grant date. The performance conditions provide for accelerated vesting upon various conditions including a change in control or other common stock liquidity events.
Performance Restricted Stock Units
The following table summarizes information about the Company’s Common Stock PRSU’s granted, vested, exercised and forfeited:
| | | | | | | | | | | |
| Number of Awards | | Weighted Average Issue Price |
| Awards outstanding -January 1, 2019 | 208,085 | | | $ | 12.68 | |
| Issued | 148,118 | | | $ | 19.31 | |
| Vested and restriction lapsed | (25,000) | | | $ | 9.17 | |
| Forfeited | (8,739) | | | $ | 12.90 | |
| Awards outstanding - December 31, 2019 | 322,464 | | | $ | 15.99 | |
| Issued | 145,709 | | | $ | 22.30 | |
| Vested and restriction lapsed | (123,711) | | | $ | 15.40 | |
| Forfeited | (50,293) | | | $ | 10.17 | |
| Awards outstanding - December 31, 2020 | 294,169 | | | $ | 20.36 | |
| Issued | 54,581 | | | $ | 69.84 | |
| Vested and restriction lapsed | (76,136) | | | $ | 11.10 | |
| Forfeited | (15,173) | | | $ | 31.25 | |
| Awards outstanding - December 31, 2021 | 257,441 | | | $ | 32.94 | |
The PRSUs convert into one share of common stock upon vesting. PRSUs vest in different tranches upon meeting certain performance conditions, which are generally based on the Company's stock price performance or return on invested capital and expressly provided service. These PRSUs are fair valued at grant date based on Monte Carlo simulations or at a percentage of the stock price at grant date. The derived service period for these PRSU awards as a result of the Monte Carlo simulation, is an approximately two to three year period from the grant date. The performance conditions provide for accelerated vesting upon various conditions including a change in control or other common stock liquidity events.
Stock Appreciation Rights
The following table summarizes information about SARs granted, forfeited, vested and exercisable:
| | | | | | | | | | | | | | | | | |
| Number of
SAR’s | | Weighted Average
Exercise
Price | | Weighted
Average
Contractual
Term |
| SAR's outstanding - January 1, 2019 | 1,036,677 | | | $ | 10.19 | | | |
| Granted | — | | | $ | — | | | |
| Exercised | (85,652) | | | $ | 10.54 | | | |
| Forfeited | (50,723) | | | $ | 10.82 | | | |
| SAR's outstanding - December 31, 2019 | 900,302 | | | $ | 10.12 | | | 3.8 years |
| Granted | — | | | $ | — | | | |
| Exercised | (218,760) | | | $ | 9.67 | | | |
| Forfeited | (80) | | | $ | 9.26 | | | |
| SAR's outstanding - December 31, 2020 | 681,462 | | | $ | 10.27 | | | 3.0 years |
| Granted | — | | | $ | — | | | |
| Exercised | (348,084) | | | $ | 9.92 | | | |
| Forfeited | (20,403) | | | $ | 10.54 | | | |
| SAR's outstanding - December 31, 2021 | 312,975 | | | $ | 10.64 | | | 2.3 years |
| SAR's exercisable - December 31, 2021 | 312,975 | | | $ | 10.64 | | | 2.3 years |
| SAR's expected to vest - December 31, 2021 | — | | | $ | — | | | 2.3 years |
The SARs vest 25% annually on each of the four anniversary dates following the grant date and expire after ten years. The fair value of each SAR grant was estimated using the Black-Scholes option-pricing model. The Company no longer issues or grants new SARs.
NOTE 13—LEASES
The Company leases land, property and equipment under certain operating leases. The Company's leases consist primarily of access to distribution terminals, bio-based diesel and feedstock storage tanks, railcars and vehicles. The Company determines at the inception of a lease whether an arrangement that provides the Company control over the use of an asset is a lease. The Company recognizes at lease commencement a right-of-use ("ROU") asset and lease liability based on the present value of the future lease payments over the lease term. The Company has elected not to recognize a ROU asset and lease liability for leases with terms of 12 months or less. At the end of the lease term the Company, generally, has the option to (a) return the leased equipment to the lessor, (b) purchase the property at its then fair value or (c) renew its lease at the fair rental value on a year-to-year basis or for an agreed upon term. When it is reasonably certain that the Company will exercise the option, the impact of the option is included in the lease term for purposes of determining total future lease payments. As most of its lease agreements do not explicitly state the discount rate implicit in the lease, the Company uses its incremental borrowing rate on the commencement date to calculate the present value of future payments.
The Company's leases commonly include payments that are based on the Consumer Price Index ("CPI") or other similar indices. If the indices are known at inception of the leases, they are included in the calculation of the ROU asset and lease liability. Other variable lease payments, such as usage-based amounts or when the indices are not known at inception, are excluded from the ROU asset and lease liability, and are expensed as incurred.
In addition to the base rent, office equipment leases typically contain provisions for maintenance services, which are considered non-lease components for accounting purposes. For these leases, non-lease components are excluded from our ROU assets and lease liabilities and expensed as incurred. For all other types of leases, we apply a practical expedient to include these non-lease components in calculating the ROU asset and lease liability.
The following table summarizes information about the Company's lease expense for the years ended December 31, 2021 and 2020:
| | | | | | | | | | | |
| December 31, 2021 | | December 31, 2020 |
| Lease expense: | | | |
| Operating lease expenses | $ | 19,348 | | | $ | 18,022 | |
| Variable lease expenses | 1,885 | | | 1,682 | |
| Short-term and other lease expenses | 974 | | | 1,778 | |
| Total lease expense | $ | 22,207 | | | $ | 21,482 | |
The weighted-average remaining lease term for the Company's operating leases is 5.70 years as of December 31, 2021. The weighted-average discount rate for the Company's operating leases is 3.24% as of December 31, 2021.
For each of the next five calendar years and thereafter, future minimum lease payments and scheduled maturities under operating leases that have initial or remaining noncancelable lease terms in excess of one year are as follows:
| | | | | | | | | | | | | | | | | |
| Total payments | | Less: Discount | | Operating lease obligation |
| 2022 | $ | 14,407 | | | $ | 1,381 | | | $ | 13,026 | |
| 2023 | 11,767 | | | 1,002 | | | 10,765 | |
| 2024 | 8,847 | | | 732 | | | 8,115 | |
| 2025 | 6,183 | | | 546 | | | 5,637 | |
| 2026 | 3,931 | | | 410 | | | 3,521 | |
| 2027 and thereafter | 11,764 | | | 813 | | | 10,951 | |
| Total | $ | 56,899 | | | $ | 4,884 | | | $ | 52,015 | |
In addition, the Company has additional minimum lease commitments related to the Geismar plant expansion project - refer to Note 18 - Commitments and Contingencies for more detail.
NOTE 14 — DERIVATIVE INSTRUMENTS
The Company enters into New York Mercantile Exchange NY Harbor ULSD ("NY Harbor ULSD" or previously referred to as heating oil), CBOT Soybean Oil (previously referred to as soybean oil) and New York Mercantile Exchange ("NYMEX") Natural Gas futures, swaps and options ("commodity contract derivatives") to reduce the risk of price volatility related to
anticipated purchases of feedstock raw materials and to protect cash margins from potentially adverse effects of price volatility on bio-based diesel sales where prices are set at a future date. All of the Company’s commodity contract derivatives are not hedge accounting designated derivatives and recorded at fair value on the Consolidated Balance Sheets. Unrealized gains and losses are recognized as a component of bio-based diesel costs of goods sold reflected in current results of operations. At December 31, 2021, the net notional volumes of NY Harbor ULSD, CBOT Soybean Oil and NYMEX Natural Gas covered under the open commodity derivative contracts were approximately 62.7 million gallons and 133.7 million pounds and 3.2 million million British thermal units, respectively.
The Company offsets the fair value amounts recognized for its commodity contract derivatives with cash collateral with the same counterparty under a master netting agreement. The net position is presented within Prepaid and other assets in the Consolidated Balance Sheets, see "Note 8 – Other Assets". As of December 31, 2021 and December 31, 2020, the net position included within prepaid and other assets was $9,651 and $5,433, respectively, and no amounts were included in accounts payable for either respective period. The Company posted $11,110 of collateral associated with its commodity-based derivatives with an overall net liability position of $1,459.
The following table sets forth the fair value of the Company's commodity contract derivatives and amounts that offset within the Consolidated Balance Sheets:
| | | | | | | | | | | | | | | | | | | | | | | |
| | December 31, 2021 | | December 31, 2020 |
| | Assets | | Liabilities | | Assets | | Liabilities |
| Gross amounts of commodity derivative contracts recognized at fair value | $ | 4,783 | | | $ | 6,242 | | | $ | 3,458 | | | $ | 12,164 | |
| Cash collateral | 11,110 | | | | | 14,139 | | | — | |
| Total gross amount recognized | 15,893 | | | 6,242 | | | 17,597 | | | 12,164 | |
| Gross amounts offset | (6,242) | | | (6,242) | | | (12,164) | | | (12,164) | |
| Net amount reported in the Consolidated Balance Sheets | $ | 9,651 | | | $ | — | | | $ | 5,433 | | | $ | — | |
The following table sets forth the commodity contract derivatives gains and (losses) included in the Consolidated Statements of Operations:
| | | | | | | | | | | | | | | | | | | | | | | |
| | Location of Gain (Loss)
Recognized in income | | 2021 | | 2020 | | 2019 |
| | | | | | | |
| | | | | | | |
| Commodity derivatives | Cost of goods sold – Bio-based diesel | | $ | 2,394 | | | $ | 36,931 | | | $ | (28,898) | |
| | | | | | | |
| | | | | | | |
NOTE 15—FAIR VALUE MEASUREMENT
The fair value hierarchy prioritizes the inputs used in measuring fair value as follows:
•Level 1—Quoted prices for identical instruments in active markets.
•Level 2—Quoted prices for similar instruments in active markets, quoted prices for identical or similar instruments in markets that are not active and model-derived valuations, in which all significant inputs are observable in active markets.
•Level 3—Unobservable inputs in which there is little or no market data, which require the reporting entity to develop its own assumptions.
A summary of assets (liabilities) measured at fair value is as follows:
| | | | | | | | | | | | | | | | | | | | | | | |
| As of December 31, 2021 |
| Total | | Level 1 | | Level 2 | | Level 3 |
| | | | | | | |
| | | | | | | |
| Commercial paper | $ | 116,902 | | | $ | — | | | $ | 116,902 | | | $ | — | |
| Corporate bonds | $ | 329,777 | | | — | | | 329,777 | | | — | |
| | | | | | | |
| Municipal bonds | $ | 11,906 | | | — | | | 11,906 | | | — | |
| Commodity contract derivatives | $ | (1,459) | | | (366) | | | (1,093) | | | — | |
| | | | | | | |
| $ | 457,126 | | | $ | (366) | | | $ | 457,492 | | | $ | — | |
| | | | | | | | | | | | | | | | | | | | | | | |
| As of December 31, 2020 |
| Total | | Level 1 | | Level 2 | | Level 3 |
| | | | | | | |
| | | | | | | |
| Commercial paper | $ | 48,714 | | | $ | — | | | $ | 48,714 | | | $ | — | |
| Corporate bonds | $ | 169,998 | | | — | | | 169,998 | | | — | |
| U.S. Treasury bills | $ | 44,992 | | | 44,992 | | | — | | | — | |
| Municipal bonds | $ | 5,839 | | | — | | | 5,839 | | | — | |
| Commodity contract derivatives | $ | (8,706) | | | (3,069) | | | (5,637) | | | — | |
| | | | | | | |
| | | | | | | |
| $ | 260,837 | | | $ | 41,923 | | | $ | 218,914 | | | $ | — | |
The carrying amounts reported in the Consolidated Balance Sheets for cash and cash equivalents, accounts receivable, accounts payable and accrued expenses approximate their fair values. Money market funds are included in cash and cash equivalents on the Consolidated Balance Sheets.
The Company used the following methods and assumptions to estimate fair value of its financial instruments:
Marketable securities: The fair value of marketable securities, which include commercial papers, corporate notes/bonds, U.S. Treasury bills and municipal notes/bonds, is obtained using quoted prices for similar assets or liabilities in active markets; quoted prices for identical or similar assets in markets that are not active and inputs other than quoted prices, e.g., interest rates and yield curves.
Commodity derivatives: The instruments held by the Company consist primarily of futures contracts, swap agreements, purchased put options and written call options. The fair value of contracts based on quoted prices of identical assets in an active exchange-traded market is reflected in Level 1. Contract fair value is determined based on quoted prices of similar contracts in over-the-counter markets and are reflected in Level 2.
Debt and lines of credit: The fair value of long-term debt and lines of credit was established using discounted cash flow calculations and current market rates reflecting Level 2 inputs.
The estimated fair values of the Company’s financial instruments, which are not recorded at fair value are as follows as of December 31:
| | | | | | | | | | | | | | | | | | | | | | | |
| 2021 | | 2020 |
| Asset (Liability)
Carrying Amount | | Estimated Fair Value | | Asset (Liability)
Carrying Amount | | Estimated Fair Value |
| Financial Liabilities: | | | | | | | |
| Debt and lines of credit | $ | (550,000) | | | $ | (552,877) | | | $ | (66,977) | | | $ | (418,107) | |
NOTE 16—NET INCOME (LOSS) PER SHARE
Basic net income (loss) per share is presented in conformity with the two-class method required for participating securities. Participating securities include restricted stock units.
Under the two-class method, net income is reduced for distributed and undistributed dividends earned in the current period. The remaining earnings are then allocated to Common Stock and the participating securities. The Company calculates the effects of participating securities on diluted earnings per share (EPS) using both the “if-converted or treasury stock” and "two-class" methods and discloses the method which results in a more dilutive effect. The effects of stock appreciation rights and convertible notes on diluted EPS are calculated using the treasury stock method unless the effects are anti-dilutive to EPS.
For the 2036 Convertible Senior Notes, the Company's intent was to settle conversions using cash for the principal amount of convertible senior notes converted, with the remaining value satisfied at the Company's option in cash, stock or a combination of cash and stock. Therefore, the dilutive effect of the convertible senior notes was limited to the conversion premium. There were no anti-dilutive shares within the periods presented.
The following table presents the calculation of diluted net income (loss) from continuing and discontinued operations per share:
| | | | | | | | | | | | | | | | | |
| 2021 | | 2020 | | 2019 |
| Net income from continuing operations available to common stockholders - Basic | $ | 211,691 | | | $ | 120,415 | | | $ | 364,257 | |
| | | | | |
| Plus (less): effect of participating securities | 2,128 | | | 2,398 | | | 8,238 | |
| Net income available to common stockholders | 213,819 | | | 122,813 | | | 372,495 | |
| Less: effect of participating securities | (2,128) | | | (2,398) | | | (8,238) | |
| Net income from continuing operations available to common stockholders - Diluted | $ | 211,691 | | | $ | 120,415 | | | $ | 364,257 | |
| | | | | |
| Net loss from discontinued operations available to common stockholders - Basic | $ | — | | | $ | — | | | $ | (9,667) | |
| | | | | |
| Plus (less): effect of participating securities | — | | | — | | | — | |
| Net loss available to common stockholders | — | | | — | | | (9,667) | |
| Less: effect of participating securities | — | | | — | | | — | |
| Net loss from discontinued operations available to common stockholders - Diluted | $ | — | | | $ | — | | | $ | (9,667) | |
| | | | | |
| Net income available to common stockholders - Basic | $ | 211,691 | | | $ | 120,415 | | | $ | 354,804 | |
| | | | | |
| Plus (less): effect of participating securities | 2,128 | | | 2,398 | | | 8,024 | |
| Net income available to common stockholders | 213,819 | | | 122,813 | | | 362,828 | |
| Less: effect of participating securities | (2,128) | | | (2,398) | | | (8,024) | |
| Net income available to common stockholders - Diluted | $ | 211,691 | | | $ | 120,415 | | | $ | 354,804 | |
| | | | | |
| Net income available to common stockholders - Diluted | | | | | |
| Weighted-average shares used to compute basic net income (loss) per share | 47,302,924 | | | 39,199,687 | | | 38,288,610 | |
| | | | | |
| Adjustment to reflect conversion of convertible notes | — | | | 3,915,439 | | | 3,589,065 | |
| Adjustment to reflect stock appreciation right conversions | 415,304 | | | 571,863 | | | 443,305 | |
| Weighted-average shares used to compute diluted net income (loss) per share | 47,718,228 | | | 43,686,989 | | | 42,320,980 | |
| Net income (loss) per share available to common stockholders - Diluted | | | | | |
| Continuing operations | $ | 4.44 | | | $ | 2.76 | | | $ | 8.61 | |
| Discontinued operations | $ | — | | | $ | — | | | $ | (0.25) | |
| Diluted net income | $ | 4.44 | | | $ | 2.76 | | | $ | 8.38 | |
NOTE 17—REPORTABLE SEGMENTS AND GEOGRAPHIC INFORMATION
The Company reports its reportable segments based on products and services provided to customers. The Company re-assesses its reportable segments on an annual basis. The Company's reportable segments generally align the Company's external financial reporting segments with its internal operating segments, which are based on its internal organizational structure, operating decisions, and performance assessment. The Company's reportable segments at December 31, 2021 and for the year ended December 31, 2020 are composed of Bio-based Diesel (formerly known as the Biomass-based Diesel segment), Services and Corporate and other activities. The accounting policies of the segments are the same as those described in the summary of significant accounting policies.
The Bio-based Diesel segment processes waste vegetable oils, animal fats, virgin vegetable oils and other feedstocks into bio-based diesel. The Bio-based Diesel segment also includes the Company’s purchases and resales of bio-based diesel produced by third parties. Revenue is derived from the purchases and sales of bio-based diesel, the renewable portion of sales of biodiesel and RD blended with petroleum-based diesel, RINs and raw material feedstocks acquired from third parties, sales of
processed bio-based diesel from Company facilities, related byproducts and renewable energy government incentive payments, in the U.S. and internationally.
The Services segment offers services for managing the construction of bio-based diesel production facilities and managing ongoing operations of third-party plants and collects fees related to the services provided. The Company does not allocate items that are of a non-operating nature or corporate expenses to the business segments. Revenues from services provided to other segments are recorded by the Services segment at cost.
The Corporate and Other segment includes trading activities related to petroleum-based heating oil and diesel fuel, including the petroleum portion of sales of biodiesel and RD blended with petroleum-based diesel; as well as corporate activities, which consist of corporate office expenses such as compensation, benefits, occupancy, and other administrative costs, including management service expenses. Corporate and Other also includes income/(expense) not associated with the reportable segments, such as corporate general and administrative expenses, shared service expenses, interest expense and interest income, all reflected on an accrual basis of accounting. In addition, Corporate and Other includes cash and other assets not associated with the reportable segments, including investments. Intersegment revenues are reported by the Services and Corporate and Other segments.
The following table represents the significant items by reportable segment:
| | | | | | | | | | | | | | | | | |
| 2021 | | 2020 | | 2019 |
| Net sales from continuing operations: | | | | | |
| Bio-based Diesel | $ | 3,090,360 | | | $ | 2,028,522 | | | $ | 2,364,559 | |
| Services | 203,690 | | | 87,282 | | | 99,086 | |
| | | | | |
| Corporate and other | 158,587 | | | 116,318 | | | 270,326 | |
| Intersegment revenues | (208,587) | | | (94,974) | | | (108,755) | |
| $ | 3,244,050 | | | $ | 2,137,148 | | | $ | 2,625,216 | |
| Income (loss) from continuing operations before income taxes | | | | | |
| Bio-based diesel | $ | 219,537 | | | $ | 138,358 | | | $ | 371,248 | |
| Services | 11,429 | | | (4,498) | | | 6,092 | |
| | | | | |
| Corporate and other | (31,626) | | | (5,118) | | | (5,415) | |
| $ | 199,340 | | | $ | 128,742 | | | $ | 371,925 | |
| Depreciation and amortization expense, net: | | | | | |
| Bio-based diesel | $ | 62,800 | | | $ | 49,038 | | | $ | 54,513 | |
| Services | 3,430 | | | 3,279 | | | 2,479 | |
| | | | | |
| Corporate and other | 3,254 | | | 1,626 | | | 1,763 | |
| $ | 69,484 | | | $ | 53,943 | | | $ | 58,755 | |
| Cash paid for purchases of property, plant and equipment: | | | | | |
| Bio-based diesel | $ | 92,592 | | | $ | 52,498 | | | $ | 40,567 | |
| Services | 3,067 | | | 4,775 | | | 1,840 | |
| | | | | |
| Corporate and other | 3,890 | | | 6,369 | | | 111 | |
| $ | 99,549 | | | $ | 63,642 | | | $ | 42,518 | |
| | | | | | | | | | | |
| 2021 | | 2020 |
| Goodwill: | | | |
| Bio-based diesel | $ | 27,784 | | | $ | — | |
| Services | 16,080 | | | 16,080 | |
| | | |
| $ | 43,864 | | | $ | 16,080 | |
| | | |
| Assets: | | | |
| Bio-based diesel | $ | 1,668,801 | | | $ | 1,101,179 | |
| Services | 122,843 | | | 69,152 | |
| | | |
| Corporate and other | 1,315,674 | | | 784,829 | |
| Intersegment eliminations | (548,374) | | | (493,762) | |
| | | |
| $ | 2,558,944 | | | $ | 1,461,398 | |
Geographic Information:
The following geographic data include net sales attributed to the countries based on the location of the subsidiaries making the sale and long-lived assets based on physical location. Long-lived assets represent the net book value of property, plant and equipment.
| | | | | | | | | | | | | | | | | |
| 2021 | | 2020 | | 2019 |
| Revenues: | | | | | |
| United States | $ | 2,813,760 | | | $ | 1,758,577 | | | $ | 2,366,724 | |
| | | | | |
| | | | | |
| International | 430,290 | | | 378,571 | | | 258,492 | |
| $ | 3,244,050 | | | $ | 2,137,148 | | | $ | 2,625,216 | |
| | | | | | | | | | | |
| 2021 | | 2020 |
| Property, Plant and Equipment: | | | |
| United States | $ | 642,204 | | | $ | 565,657 | |
| | | |
| | | |
| International | 35,240 | | | 29,139 | |
| $ | 677,444 | | | $ | 594,796 | |
NOTE 18—COMMITMENTS AND CONTINGENCIES
Commitments
In October 2020, the Company announced that it planned to expand the effective capacity of its Geismar, Louisiana biorefinery. The Geismar project brings together the planned improvement and expansion project for the existing site. The Geismar project is expected to take total site production capacity from 90 mmgy to 340 mmgy, enhance existing operations and improve operational reliability and logistics. The expansion is expected to be mechanically complete in 2023 with full operations in early 2024. The capital cost for the Geismar project is estimated to be $950,000. The Company has received all required permits to proceed with construction and officially broke ground to start the construction process in the fourth quarter of 2021. The Company has entered into construction, marine terminal lease, which is expected to commence in August 2023, and other long-lead time contracts for the project. Currently the estimated total future commitments under these contracts on an undiscounted basis amount to approximately $500,856.
The following table outlines the future contract commitments related to the executed contracts noted above as at December 31, 2021.
| | | | | | | | | | | | | | | | | |
| Constructions Commitments | | Minimum Lease Commitments | | Total Commitments |
| 2022 | $ | 121,716 | | | $ | — | | | $ | 121,716 | |
| 2023 | 51,988 | | | 9,083 | | | 61,071 | |
| 2024 | 156 | | | 21,800 | | | 21,956 | |
| 2025 | — | | | 21,800 | | | 21,800 | |
| 2026 | — | | | 21,800 | | | 21,800 | |
| Thereafter | — | | | 252,513 | | | 252,513 | |
| Total | $ | 173,860 | | | $ | 326,996 | | | $ | 500,856 | |
The Company has entered into various contracts for supplies of hydrogen, nitrogen, utilities and feedstocks for various REG production facilities. The following table outlines the minimum take or pay requirement related to the hydrogen, nitrogen, utilities and feedstocks at December 31, 2021.
| | | | | |
| 2022 | $ | 2,976 | |
| 2023 | 4,984 | |
| 2024 | 12,911 | |
| 2025 | 12,048 | |
| 2026 | 12,048 | |
| Thereafter | 142,568 | |
| Total | $ | 187,535 | |
Contingencies
In the last quarter of 2020, the Company discovered a blending discrepancy in connection with its preparation for a standard IRS audit of its BTC filings. The Company self-reported the findings to the IRS and initiated an investigation overseen by the Audit Committee of the Company's Board of Directors. In March 2021, the Company paid the IRS the $40,505 assessment, excluding interest which was paid in April 2021, to correct the REG Seneca BTC claims (hereafter "BTC Correction"). The Company is working with its customers on BTC re-filings on the relevant gallons to reduce further the BTC Correction, which may include recovering amounts from its customers. There can be no assurances that future reduction to the BTC Correction will occur.
On March 2, 2021, a putative class action lawsuit was filed against the Company and certain of its current and former executive officers in the United Stated District Court for the Southern District of New York. On March 12, 2021, a putative class action lawsuit against the same defendants was filed in the United States District Court for the Central District of California. On June 24, 2021, the two cases were consolidated in the Southern District of New York under the caption In re Renewable Energy Group Securities Litigation, No. 21-cv-1832, and a consolidated amended complaint was filed on July 9, 2021.
The complaint purports to be brought on behalf of shareholders who purchased the Company’s common stock between March 8, 2018 and February 25, 2021, the date on which the Company announced its restatement related to BTC. Plaintiffs allege that defendants made false and misleading statements about the Company’s business, financial results and prospects in violation of Sections 10(b) and 20(a) of the Securities Exchange Act of 1934 and Rule 10b-5 promulgated thereunder. The complaint seeks unspecified damages, attorneys’ fees, and other costs. On January 20, 2022, the court granted defendants' motion to dismiss with prejudice and entered a judgment dismissing the case. On February 18, 2022, plaintiff filed a notice of appeal of the order granting the motion to dismiss and the entry of judgement. The Company denies any and all allegations of wrongdoing and intends to vigorously defend against the litigation.
On July 27, 2021, a stockholder derivative complaint was filed in the United States District Court for the District of Delaware based on allegations substantially similar to those in the class action, and purporting to asset claims on the Company's behalf against current and former officers and directors for alleged violation of Sections 14(a) and 20(a) of the Exchange Act, breach of fiduciary duties, unjust enrichment, and waste of corporate assets. On August 2, 2021, a second stockholder derivative complaint purportedly arising out of the same events and purporting to assert similar claims, was filed in the Supreme Court for the State of New York. Both of these derivative actions have been stayed.
In addition, the Securities and Exchange Commission ("SEC") requested information about the restatement, and the Company cooperated with the SEC. On October 1, 2021, the SEC Staff notified the Company that the Staff terminated its investigation with no enforcement action recommended against the Company, in accordance with SEC guidelines.
The Company is also involved in various other legal proceedings in the normal course of business. The Company currently believes that any ultimate liability arising out of such proceedings will not have a material adverse effect on the Company’s financial position, results of operations or cash flows.
NOTE 19—SUBSEQUENT EVENTS
Proposed Merger
On February 27, 2022, the Company entered into an Agreement and Plan of Merger (the “Merger Agreement”) with Chevron Corporation (''Parent'') and Cyclone Merger Sub Inc., a wholly owned subsidiary of Parent (“Merger Subsidiary” and together with Parent, “Buyer”). Pursuant to the terms and conditions set forth in the Merger Agreement, Merger Subsidiary will merge with and into REG (the ''Merger'') with REG continuing as the surviving corporation of the Merger and as a wholly owned subsidiary of Parent. At the Effective Time, each share of common stock that is issued and outstanding immediately prior to the Effective Time (other than shares to be cancelled pursuant to the Merger Agreement or shares of common stock held by holders who have made a valid demand for appraisal in accordance with Section 262 of the Delaware General Corporation Law), will be automatically converted into the right to receive the Merger Consideration.
At the Effective Time, and as a result of the Merger:
•Each Company SAR will vest and be cancelled and converted into the right to receive a cash payment, less any applicable withholding taxes, equal to the product of (x) the excess, if any, of the Merger Consideration over the exercise price applicable to such Company SAR multiplied by (y) the number of shares of common stock subject to such Company SAR.
•Each Company Director RSU will vest and be cancelled and converted into the right to receive a cash payment, less any applicable withholding taxes, equal to the product of (x) the Merger Consideration multiplied by (y) the number of shares of common stock subject to such Company Director RSU.
•Each Company Employee RSU to the extent vested immediately prior to the Effective Time will be cancelled and converted into the right to receive a cash payment, less any applicable withholding taxes, equal to the product of (x) the Merger Consideration multiplied by (y) the number of vested shares of common stock subject to such Company Employee RSU.
•Each Unvested Company Employee RSU Award and the Scheduled PSU Awards will be cancelled and converted into the right to receive an amount in cash, less any applicable withholding taxes, equal to the product of (x) the Merger Consideration multiplied by (y) the number of shares of common stock subject to such Assumed RSU Award. Each Assumed RSU Award will be subject to the vesting schedule applicable to the corresponding Unvested Company Employee RSU Award immediately prior to the Effective Time (including, with respect to the Scheduled PSU Awards, the performance vesting conditions).
•Each Company PSU Award will be cancelled and converted into the right to receive an amount in cash, without interest and less any applicable withholding taxes, equal to the product of (A) the Merger Consideration multiplied by (B) the number of shares of common stock subject to such Company PSU Award (assuming that any performance based vesting conditions applicable to such Company PSU Award for any performance period that has not been completed as of the Effective Time are achieved at (x) with respect to Company PSU Awards granted in 2020 and 2021, the greater of the target performance levels and the levels based on actual achievement of pro-rated performance goals through the Effective Time or (y) with respect to Assumed PSU Awards, the target performance levels. Each Assumed PSU Award will be subject to the vesting schedule applicable to the corresponding Company PSU Award immediately prior to the Effective Time (other than any performance based vesting conditions).
The closing of the Merger is subject to various conditions, including (i) the adoption of the Merger Agreement by holders of a majority of the issued and outstanding shares of our common stock; (ii) the expiration or termination of any applicable waiting period under the HSR Act and EU Clearance; (iii) the absence of any order or law prohibiting the consummation of the Merger, except if such order or law is immaterial to Parent and (iv) the accuracy of the representations and warranties contained in the Merger Agreement, subject to customary materiality qualifications, as of the date of the Merger Agreement and the closing of the Merger, and compliance in all material respects with the covenants and agreements contained in the Merger Agreement. In addition, the obligation of Parent and Merger Subsidiary to consummate the Merger is subject to the absence, since the date of the Merger Agreement, of a Company Material Adverse Effect. The closing of the Merger is not subject to a financing condition. Under the terms of the Merger Agreement, consummation of the Merger will occur on the second business
day following the fulfillment or waiver of the conditions to closing of the Merger or at such other time as REG and Parent agree.
The Company expects to incur certain significant costs relating to the Merger, such as legal, accounting, financial advisory, printing and other professional services fees, as well as other customary payments. In the event that the Merger is terminated, the Company may also be required to pay a cash termination fee to Parent of $91,000, as required under the Merger Agreement under certain circumstances.
NOTE 20—SUPPLEMENTAL QUARTERLY INFORMATION (UNAUDITED)
The following table represents the significant items for the results of operations on a quarterly basis for the years ended December 31, 2021 and 2020:
| | | | | | | | | | | | | | | | | | | | | | | |
| Three Months
Ended
March 31,
2021 | | Three Months
Ended
June 30,
2021 | | Three Months
Ended
September 30,
2021 | | Three Months
Ended
December 31,
2021 |
| Revenues | $ | 539,744 | | | $ | 816,220 | | | $ | 1,006,342 | | | $ | 881,744 | |
| Gross profit | 73,802 | | | 123,513 | | | 88,908 | | | 83,670 | |
| Selling, general, and administrative expenses including research and development expense | 31,177 | | | 35,015 | | | 34,354 | | | 39,965 | |
| Gain on disposal of property, plant and equipment | — | | | (39) | | | — | | | (1,423) | |
| Impairment of property, plant and equipment | 822 | | | 916 | | | 3,498 | | | 2,123 | |
| Income from operations | 41,803 | | | 87,621 | | | 51,056 | | | 43,005 | |
| Other expense, net | (948) | | | (5,855) | | | (7,937) | | | (9,405) | |
| | | | | | | |
| | | | | | | |
| Net income | $ | 39,222 | | | $ | 79,516 | | | $ | 42,467 | | | $ | 52,614 | |
| Net income available to common stockholders | $ | 38,583 | | | $ | 78,787 | | | $ | 42,133 | | | $ | 52,212 | |
| | | | | | | |
| Basic net income per share available to common stockholders: | | | | | | | |
| | | | | | | |
| | | | | | | |
| Net income per share | $ | 0.95 | | | $ | 1.64 | | | $ | 0.84 | | | $ | 1.04 | |
| Diluted net income per share available to common stockholders: | | | | | | | |
| | | | | | | |
| | | | | | | |
| Net income per share | $ | 0.88 | | | $ | 1.62 | | | $ | 0.83 | | | $ | 1.03 | |
| | | | | | | | | | | | | | | | | | | | | | | |
| Three Months
Ended
March 31,
2020 | | Three Months
Ended
June 30,
2020 | | Three Months
Ended
September 30,
2020 | | Three Months
Ended
December 31,
2020 |
| Revenues | $ | 472,957 | | | $ | 543,905 | | | $ | 572,358 | | | $ | 547,928 | |
| Gross profit | 105,561 | | | 22,556 | | | 73,956 | | | 66,281 | |
| Selling, general, and administrative expenses including research and development expense | 27,485 | | | 28,427 | | | 31,059 | | | 32,331 | |
| Gain on disposal of property, plant and equipment | — | | | (187) | | | — | | | (18) | |
| Impairment of property, plant and equipment | — | | | — | | | 19,256 | | | 3,148 | |
| Income (loss) from operations | 78,076 | | | (5,684) | | | 23,641 | | | 30,820 | |
| Other income (expense), net | (2,078) | | | 5,628 | | | 68 | | | (1,729) | |
| | | | | | | |
| | | | | | | |
| Net income (loss) | $ | 74,667 | | | $ | (1,685) | | | $ | 22,663 | | | $ | 27,168 | |
| Net income (loss) available to common stockholders | $ | 73,158 | | | $ | (1,685) | | | $ | 22,223 | | | $ | 26,685 | |
| | | | | | | |
| Basic net income (loss) per share available to common stockholders: | | | | | | | |
| | | | | | | |
| | | | | | | |
| Net income (loss) per share | $ | 1.88 | | | $ | (0.04) | | | $ | 0.57 | | | $ | 0.68 | |
| Diluted net income (loss) per share available to common stockholders: | | | | | | | |
| | | | | | | |
| | | | | | | |
| Net income (loss) per share | $ | 1.67 | | | $ | (0.04) | | | $ | 0.51 | | | $ | 0.60 | |
ITEM 9. Changes in and Disagreements with Accountants on Accounting and Financial Disclosure
None.
ITEM 9A. Controls and Procedures
Evaluation of Disclosure Controls and Procedures
Disclosure controls and procedures are designed to ensure that information required to be disclosed in the Company’s reports we file or submit under the Securities Exchange Act of 1934 (the "Exchange Act") is recorded, processed, summarized and reported within the time periods specified in the Securities Exchange Commission’s rules and forms, and that such information is accumulated and communicated to management, including our Chief Executive Officer ("CEO") and the Chief Financial Officer ("CFO"), as appropriate, to allow timely decisions regarding required disclosure. In designing and evaluating the disclosure controls and procedures, management recognized that any controls and procedures, no matter how well designed and operated, can provide only reasonable assurance of achieving the desired control objectives.
Our management, under the supervision of and with the participation of our CEO and CFO, performed an evaluation of the effectiveness of our disclosure controls and procedures (as defined in Rule 13a-15(e) under the Exchange Act) as of the end of the period covered by this report, December 31, 2021. In connection with our management's evaluation of our disclosure controls and procedures, our CEO and CFO have concluded that our disclosure controls and procedures were effective as of December 31, 2021.
Management’s Report on Internal Control over Financial Reporting
Our management is responsible for establishing and maintaining adequate internal control over financial reporting (as defined in Rule 13a-15(f) under the Exchange Act).
As previously disclosed in Item 9A of our Annual Report on Form 10-K for the year ended December 31, 2020, management concluded that there was a material weakness in internal control over financial reporting related to effective preventive and review controls over the purchase and use of the petroleum diesel gallons when blending with biodiesel. This resulted in an overstatement of bio-based diesel government incentive revenue and an understatement of interest expense for the quarters ended September 30, 2020, June 30, 2020, and March 31, 2020 as well as the years ended December 31, 2019 and 2018 and a corresponding understatement of accounts payable and accrued expenses and other liabilities as of September 30, 2020, June 30, 2020, and March 31, 2020, and December 31, 2019 and 2018. Additionally this material weakness could have resulted in a misstatement of the aforementioned account balances or disclosures that would have resulted in a material misstatement to the annual or interim consolidated financial statements that would not have been prevented or detected.
Since identifying the material weakness and during the year ended December 31, 2021, management, with oversight from the Audit Committee of our Board of Directors, took the following steps to address the underlying causes of the material weakness and remediate the material weakness:
◦For the Seneca facility:
▪Limiting the loading to modes where the existing system is known to be functional, until the system is redesigned to work in all operating modes; and
▪Implemented a control system calculation and readout tool that enables the loading operator to validate that the proper number of petroleum diesel gallons were added to each load;
◦Then, to further reinforce our system-wide controls:
▪Performing weekly procedures at each biodiesel facility to validate that the amount of petroleum diesel used matches the amount of petroleum diesel required to be blended;
▪Performing monthly physical inventory procedures to ensure petroleum inventory levels reflected in the accounting system are within expected tolerances; and
▪Performing monthly reconciliations of petroleum inventory usage prior to filing the BTC to re-confirm that the required volume of petroleum diesel has been blended.
On December 30, 2021, we acquired Amber Resources. We are in the process of integrating Amber Resources and our management is in the process of evaluating any related changes to our internal control over financial reporting as a result of this integration. Amber Resources represented 6 percent of total assets and less than 1 percent of total revenues of the consolidated financial statement amounts as of and for the year ended December 31, 2021.
Management has been testing our enhanced controls to determine whether they operate effectively over time. Management conducted an evaluation of the effectiveness of our internal control over financial reporting based on the framework in Internal Control-Integrated Framework (2013) issued by the Committee of Sponsoring Organizations of the Treadway Commission. Based on this evaluation, management concluded that our internal control over financial reporting was effective as of December 31, 2021. Because of its inherent limitations, internal control over financial reporting may not prevent or detect misstatements. Projections of any evaluation of effectiveness to future periods are subject to the risks that controls may become inadequate because of changes in conditions, or that the degree of compliance with the policies or procedures may deteriorate.
Deloitte & Touche LLP has audited our internal control over financial reporting as of December 31, 2021 and has issued
an attestation report regarding its assessment included herein.
Changes in Internal Control over Financial Reporting
Other than as described in the third and fourth paragraphs above under "in Management's Report on Internal Control over Financial Reporting," there have been no changes in our internal control over financial reporting (as such term is defined in Rule 13a-15(f) under the Exchange Act) during the quarter ended December 31, 2021 that have materially affected, or are reasonably likely to materially affect, our internal control over financial reporting.
ITEM 9B. Other Information
None.
ITEM 9C. Disclosure Regarding Foreign Jurisdictions that Prevent Inspections.
Not Applicable.
PART III
ITEM 10. Directors, Executive Officers and Corporate Governance
This Item is incorporated by reference to our definitive proxy statement on Schedule 14A, which will be filed within 120 days after the close of the fiscal year covered by this report on Form 10-K, or if our proxy statement is not filed by that date, will be included in an amendment to this Report on Form 10-K.
ITEM 11. Executive Compensation
This Item is incorporated by reference to our definitive proxy statement on Schedule 14A, which will be filed within 120 days after the close of the fiscal year covered by this report on Form 10-K, or if our proxy statement is not filed by that date, will be included in an amendment to this Report on Form 10-K.
ITEM 12. Security Ownership of Certain Beneficial Owners and Management and Related Stockholder Matters
Securities Authorized for Issuance Under Equity Compensation Plans
The following table provides certain information as of December 31, 2021, with respect to our equity compensation plans:
| | | | | | | | | | | | | | | | | | | | | | | |
| PLAN CATEGORY | NUMBER OF
SECURITIES
TO BE ISSUED
UPON
EXERCISE OF
OUTSTANDING
OPTIONS,
WARRANTS
AND RIGHTS | | | WEIGHTED
AVERAGE
EXERCISE
PRICE OF
OUTSTANDING
OPTIONS,
WARRANTS
AND RIGHTS | | | NUMBER OF
SECURITIES
REMAINING
AVAILABLE
FOR FUTURE
ISSUANCE
UNDER EQUITY
COMPENSATION
PLANS |
| Equity compensation plans approved by stockholders | 950,326 | | 1 | | $ | 10.64 | | 2 | | 1,876,358 | |
| Equity compensation plans not approved by stockholders | — | | | | — | | | | — | |
| Total | 950,326 | | | | $ | 10.64 | | | | 1,876,358 | |
1Includes 379,910 shares underlying outstanding restricted stock units, 257,441 shares underlying outstanding performance restricted stock units, and 312,975 shares underlying outstanding stock appreciation rights.
2Restricted stock units and performance restricted stock units do not have an exercise price and therefore have not been included in the calculation of weighted average exercise price.
The remainder of this Item is incorporated by reference to our definitive proxy statement on Schedule 14A, which will be filed within 120 days after the close of the fiscal year covered by this report on Form 10-K, or if our proxy statement is not filed by that date, will be included in an amendment to this Report on Form 10-K.
ITEM 13. Certain Relationships and Related Transactions, and Director Independence
This Item is incorporated by reference to our definitive proxy statement on Schedule 14A, which will be filed within 120 days after the close of the fiscal year covered by this report on Form 10-K, or if our proxy statement is not filed by that date, will be included in an amendment to this Report on Form 10-K.
ITEM 14. Principal Accounting Fees and Services
Information for this Item regarding our principal accountant, Deloitte & Touche LLP (PCAOB ID No. 34) is incorporated by reference to our definitive proxy statement on Schedule 14A, which will be filed within 120 days after the close of the fiscal year covered by this report on Form 10-K, or if our proxy statement is not filed by that date, will be included in an amendment to this Report on Form 10-K.
PART IV
ITEM 15. Exhibits, Financial Statement Schedules
(a) Financial Statements
(i)Consolidated Balance Sheets as of December 31, 2021 and 2020
(ii)Consolidated Statements of Operations for the years ended December 31, 2021, 2020 and 2019
(iii)Consolidated Statements of Comprehensive Income (Loss) for the years ended December 31, 2021, 2020 and 2019
(iv)Consolidated Statements of Stockholders' Equity for the years ended December 31, 2021, 2020 and 2019
(v)Consolidated Statements of Cash Flows for the years ended December 31, 2021, 2020 and 2019
(vi)Notes to the Consolidated Financial Statements for the years ended December 31, 2021, 2020 and 2019
(b) Exhibits
The Exhibits filed as part of this Annual Report on Form 10-K, or incorporated by reference, are listed on the Exhibit Index immediately preceding such Exhibits, which Exhibit Index is incorporated herein by reference.
(c)Financial Statement Schedules
All schedules are omitted because of the absence of the conditions under which they are required or because the information required is shown in the consolidated financial statements or the notes thereto.
ITEM 16. Form 10-K Summary
Not applicable.
EXHIBIT INDEX
| | | | | | | | |
Exhibit Number | | Description |
| | |
| 2.1 | | |
| | |
| 3.1 | | |
| | |
| 3.2 | | |
| | |
| 4.1 | | |
| | |
| 4.2 | | |
| | |
| 4.3 | | |
| | |
| 10.1 | | |
| | |
| 10.2 | | |
| | |
| 10.3 | | |
| | |
| 10.4 | | |
| | |
| 10.5 | | |
| | |
| | | | | | | | |
Exhibit Number | | Description |
| 10.6 | | |
| | |
| 10.7 | | |
| | |
| 10.8 | | |
| | |
| 10.9 | | |
| | |
| 10.10 | | |
| | |
| 10.11 | | |
| | |
| 10.12 | | |
| | |
| 10.13 | | Amendment No. 17 to Credit Agreement, dated as of September 30, 2021, by and among the lenders identified on the signature pages thereto, Wells Fargo Capital Finance, LLC, as agent, REG Services Group, LLC and REG Marketing and Logistics Group, LLC (incorporated by reference to Exhibit 10.2 to the Company’s Current Report on Form 8-K filed October 4, 2021). |
| | |
| 10.14 | | |
| | |
| 10.15 | | |
| | |
| 10.16 | | |
| | |
| 10.17 | | |
| | |
| 10.18 | | |
| | |
| 10.19 | | |
| | |
| 10.20 | | |
| | |
| 10.21 | | |
| | |
| 10.22 | | |
| | |
| 21.1** | | |
| | |
| 23.1** | | |
| | |
| 24.1 | | |
| | |
| 31.1** | | |
| | |
| 31.2** | | |
| | |
| | | | | | | | |
Exhibit Number | | Description |
| 32.1** | | |
| | |
| 32.2** | | |
| | |
| | |
| 101.1 | | The following financial information of the Company and its subsidiaries for the fiscal year ended December 31, 2020, is formatted in Inline XBRL interactive data files: (i) Consolidated Balance Sheets, (ii) Consolidated Statements of Operations; (iii) Consolidated Statements of Stockholders' Equity; (iii) Consolidated Statements of Cash Flows; and (v) Notes to Consolidated Financial Statements tagged as blocks of text and including detailed tags |
| | |
| 104 | | Cover Page Interactive Data File (embedded within the Inline XBRL document and included in Exhibit 101) |
| | |
*Management contract or compensatory plan, contract or arrangement.
**Filed herewith.
The certifications attached as Exhibit 32.1 and Exhibit 32.2 that accompany this Annual Report on Form 10-K are deemed furnished and not filed with the Securities and Exchange Commission and are not to be incorporated by reference into any filing of the Company under the Securities Act of 1933, as amended, or the Securities Exchange Act of 1934, as amended, whether made before or after the date of this Annual Report on Form 10-K, irrespective of any general incorporation language contained in such filing.
SIGNATURES
Pursuant to the requirements of Section 13 or 15(d) of the Securities Exchange Act of 1934, the registrant has duly caused this report to be signed on its behalf by the undersigned, thereunto duly authorized.
| | | | | |
| RENEWABLE ENERGY GROUP, INC. |
| |
| By: | /s/ Cynthia J. Warner |
| Cynthia J. Warner |
| President and Chief Executive Officer |
Date: March 1, 2022
POWER OF ATTORNEY
KNOW ALL PERSONS BY THESE PRESENTS, that each person whose signature appears below constitutes and appoints Craig Bealmear and Todd Samuels, and each of them, his or her true and lawful attorneys-in-fact, each with full power of substitution, for him or her in any and all capacities, to sign any amendments to this report on Form 10-K and to file the same, with exhibits thereto and other documents in connection therewith, with the Securities and Exchange Commission, hereby ratifying and confirming all that each of said attorneys-in-fact or their substitute or substitutes may do or cause to be done by virtue hereof.
Pursuant to the requirements of the Securities Exchange Act of 1934, this report has been signed below by the following persons on behalf of the registrant and in the capacities and on the dates indicated.
| | | | | | | | |
| | Date |
| /s/ Cynthia J. Warner | President, Chief Executive Officer and Director (Principal Executive Officer) | March 1, 2022 |
| Cynthia J. Warner | |
| | |
| /s/ R. Craig Bealmear | Chief Financial Officer
(Principal Financial Officer) | March 1, 2022 |
| R. Craig Bealmear | |
| | |
| /s/ Todd M. Samuels | Chief Accounting Officer
(Principal Accounting Officer) | March 1, 2022 |
| Todd M. Samuels | |
| | |
| /s/ Jeffrey Stroburg | Director (Chairman) | March 1, 2022 |
| Jeffrey Stroburg | | |
| | |
| /s/ Randolph L. Howard | Director (Vice Chairman) | March 1, 2022 |
| Randolph L. Howard | | |
| | |
| /s/ Delbert Christensen | Director | March 1, 2022 |
| Delbert Christensen | | |
| | |
| /s/ Peter J.M. Harding | Director | March 1, 2022 |
| Peter J. M. Harding | | |
| | |
| /s/ Debora M. Frodl | Director | March 1, 2022 |
| Debora M. Frodl | | |
| | |
| /s/ Christopher Sorrells | Director | March 1, 2022 |
| Christopher Sorrells | | |
| | |
| /s/ James C. Borel | Director | March 1, 2022 |
| James C. Borel | | |
| | |
| /s/ Walter Berger | Director | March 1, 2022 |
| Walter Berger | | |
| | |
| /s/ Dylan Glenn | Director | March 1, 2022 |
| Dylan Glenn | | |
| | |
| /s/ Niharika T. Ramdev | Director | March 1, 2022 |
| Niharika T. Ramdev | | |