As filed with the Securities and Exchange Commission on April 28, 2015
UNITED STATES
SECURITIES AND EXCHANGE COMMISSION
Washington, D.C. 20549
FORM 20-F
ANNUAL REPORT PURSUANT TO
SECTION 13 OR 15(d) OF
THE SECURITIES EXCHANGE ACT OF 1934
For the fiscal year ended December 31, 2014
Commission file number: 001-34175
ECOPETROL S.A.
(Exact name of Registrant as specified in its charter)
N/A
(Translation of Registrant’s name into English)
REPUBLIC OF COLOMBIA
(Jurisdiction of incorporation or organization)
Carrera 13 No. 36 – 24
BOGOTA – COLOMBIA
(Address of principal executive offices)
Tel. (571) 234 4000
Claudia Trujillo
Investor Relations Officer
investors@ecopetrol.com.co
Tel. (571) 234 5190
Carrera 13 N.36-24 Piso 7
Bogota, Colombia
(Name, Telephone, E-Mail and/or Facsimile number and Address of Company Contact Person)
Securities registered or to be registered pursuant to Section 12(b) of the Act.
| Title of each class | Name of each exchange on which registered: | |
| American Depository Shares (as evidenced by American Depository Receipts), each representing 20 common shares par value Ps$250 per share | New York Stock Exchange | |
| Ecopetrol common shares par value Ps$250 per share | New York Stock Exchange (for listing purposes only) | |
| 7.625% Notes due 2019 | New York Stock Exchange | |
| 4.250% Notes due 2018 | New York Stock Exchange | |
| 5.875% Notes due 2023 | New York Stock Exchange | |
| 4.125% Notes due 2025 | New York Stock Exchange | |
| 7.375% Notes due 2043 | New York Stock Exchange | |
| 5.875% Notes due 2045 | New York Stock Exchange |
Securities registered or to be registered pursuant to Section 12(g) of the Act: None
Securities for which there is a reporting obligation pursuant to Section 15(d) of the Act: None
Indicate the number of outstanding shares of each of the issuer’s classes of capital or common stock as of the close of the period covered by the annual report.
41,116,698,456 Ecopetrol common shares, par value Ps$250 per share
Indicate by check mark if the registrant is a well-known seasoned issuer, as defined in Rule 405 of the Securities Act.
x Yes ¨ No
If this report is an annual or transition report, indicate by check mark if the registrant is not required to file reports pursuant to Section 13 or 15(d) of the Securities Exchange Act of 1934.
¨ Yes x No
Indicate by check mark whether the registrant (1) has filed all reports required to be filed by Section 13 or 15(d) of the Securities Exchange Act of 1934 during the preceding 12 months (or for such shorter period that the registrant was required to file such reports), and (2) has been subject to such filing requirements for the past 90 days.
x Yes ¨ No
Indicate by check mark whether the registrant has submitted electronically and posted on its corporate Web site, if any, every Interactive Data File required to be submitted and posted pursuant to Rule 405 of Regulation S-T (§232.405 of this chapter) during the preceding 12 months (or for such shorter period that the registrant was required to submit and post such files).
N/A
Indicate by check mark whether the registrant is a large accelerated filer, an accelerated filer, or a non-accelerated filer. See definition of “accelerated filer and large accelerated filer” in Rule 12b-2 of the Exchange Act. (Check one):
| Large accelerated filer x | Accelerated filer ¨ | Non-accelerated filer ¨ |
Indicate by check mark which basis of accounting the registrant has used to prepare the financial statements included in this filing:
| ¨ U.S. GAAP | International Financial Reporting Standards as issued by the International Accounting Standards Board |
x Other |
If “Other” has been checked in response to the previous question, indicate by check mark which financial statement item the registrant has elected to follow:
¨ Item 17 x Item 18
If this is an annual report, indicate by check mark whether the registrant is a shell company (as defined in Rule 12b-2 of the Exchange Act).
¨ Yes x No
Annual Report on Form 20-F 2014
| 2 |
| 3 |
| 4 |
| 6.5.1 | Colombian Tax Considerations | 131 | ||
| 6.5.2 | U.S. Federal Income Tax Consequences | 134 | ||
| 6.6. | Exchange Controls and Limitations | 137 | ||
| 6.7. | Exchange Rates | 138 | ||
| 6.8. | Major Shareholders | 139 | ||
| 6.9. | Enforcement of Civil Liabilities | 139 | ||
| 7. | Corporate Governance | 140 | ||
| 7.1. | Bylaws | 141 | ||
| 7.2. | Code of Ethics | 145 | ||
| 7.3. | Board of Directors | 145 | ||
| 7.3.1 | Board Practices | 147 | ||
| 7.3.2 | Board Committees | 148 | ||
| 7.4. | Compliance with NYSE Listing Rules | 150 | ||
| 7.5. | Management | 152 | ||
| 7.6. | Compensation of Directors and Management | 155 | ||
| 7.7. | Share Ownership of Directors and Executive Officers | 155 | ||
| 7.8. | Controls and Procedures | 155 | ||
| 8. | Financial Statements | 159 | ||
| 9. | Signature Page | 160 | ||
| 10. | Exhibits | 161 | ||
| 11. | Cross-reference to Form 20-F | 162 | ||
| 5 |
| 1. | Introduction |
| 1.1. | About This Report |
We file our Annual Report on Form 20-F and other information with the U.S. Securities and Exchange Commission.
We file reports, including annual reports on Form 20-F, and other information with the SEC pursuant to the rules and regulations of the SEC that apply to foreign private issuers. You may read and copy any materials filed with the SEC in the SEC’s public reference room at 100 F Street, NE, Washington, D.C. 20549. Please call the SEC at 1-800-SEC-0330 for further information on the operation of the public reference room. Any filings we make are also available to the public over the Internet at the SEC’s website at www.sec.gov and at our website at www.ecopetrol.com.co. (This URL is intended to be an inactive textual reference only. It is not intended to be an active hyperlink to our website. The information on our website, which might be accessible through a hyperlink resulting from this URL, is not and shall not be deemed to be incorporated into this annual report.)
Unless the context otherwise requires, the terms “Ecopetrol,” “we,” “us,” “our” or the “Company” are used in this annual report to refer to Ecopetrol S.A. and its subsidiaries on a consolidated basis.
References to the Nation in this annual report relate to the Republic of Colombia, our controlling shareholder. References made to the Government of Colombia or the Government correspond to the executive branch including the President of Colombia, the ministries and other governmental agencies responsible for regulating our business.
| 1.2. | Forward-looking Statements |
This annual report on Form 20-F contains forward-looking statements within the meaning of the safe harbor provisions of the U.S. Private Securities Litigation Reform Act of 1995. These statements are not based on historical facts and reflect our expectations for future events and results. Most facts are uncertain because of their nature. Words such as “anticipate,” “believe,” “could,” “estimate,” “expect,” “should,” “plan,” “potential,” “predicts,” “prognosticate,” “project,” “target,” “achieve” and “intend,” among other similar expressions, are understood as forward-looking statements. We have made forward-looking statements that address, among other things:
| · | our exploration and production activities, including drilling; |
| · | import and export activities; |
| · | our liquidity, cash flow, and sources of funding; |
| · | our projected and targeted capital expenditures and other cost commitments and revenues; and |
| · | dates by which certain areas will be developed or will come on-stream. |
Our forward-looking statements are not guarantees of future performance and are subject to assumptions that may prove incorrect and to risks and uncertainties that are difficult to predict. Actual results could differ materially from those expressed or forecast in any forward-looking statements as a result of a variety of factors. These factors may include, but are not limited to, the following:
| · | general economic and business conditions, including crude oil and other commodity prices, refining margins and prevailing exchange rates; |
| · | competition; |
| 6 |
| · | our ability to obtain financing; |
| · | our ability to find, acquire or gain access to additional reserves and our ability to develop existing reserves; |
| · | uncertainties inherent in making estimates of our reserves; |
| · | significant political, economic and social developments in Colombia and other countries where we do business; |
| · | natural disasters, military operations, terrorist acts, wars or embargoes; |
| · | regulatory developments, including regulations related to climate change; |
| · | receipt of government approvals and licenses; |
| · | technical difficulties; and |
| · | other factors discussed in Section 5.1 of this document as “Risk Factors.” |
All forward-looking statements attributed to us are qualified in their entirety by this cautionary statement. We undertake no obligation to publicly update or revise any forward-looking statements, whether as a result of new information or for any other reason. Accordingly, readers should not place undue reliance on the forward-looking statements contained in this annual report.
| 1.3. | Selected Financial and Operating Data |
The following table sets forth, for the periods and at the dates indicated, our selected historical financial and certain key operating data. The selected financial data has been derived from and should be read in conjunction with, and is qualified in its entirety by reference to, our consolidated audited financial statements, presented in Pesos. PricewaterhouseCoopers Ltda. audited our consolidated financial statements for the years ended December 31, 2014 and 2013. KPMG Ltda. audited our consolidated financial statements for the years ended December 31, 2012 and 2011. PricewaterhouseCoopers Ltda. also audited our consolidated financial statements for the year ended December 31, 2010.
| 2014 | 2013 | 2012 | 2011 | 2010 | ||||||||||||||||
| Operating Information | ||||||||||||||||||||
| Oil and gas production (mboed) | 755.4 | 788.2 | 754.0 | 724.1 | 615.8 | |||||||||||||||
| Proved oil and gas reserves (Mmboe) (1) | 2,084 | 1,972 | 1,877 | 1,857 | 1,714 | |||||||||||||||
| Exploratory Wells(2) | 28 | 22 | 23 | 39 | 28 | |||||||||||||||
| Refinery Through-put (bpd) (3) | 240,484 | 283,362 | 296,340 | 305,631 | 296,044 | |||||||||||||||
| 1P Reserves replacement ratio | 146 | % | 139 | % | 108 | % | 164 | % | 193 | % | ||||||||||
| 7 |
| Financial Information | ||||||||||||||||||||
| COLOMBIAN GAAP | ||||||||||||||||||||
| (Expressed in millions of Colombian pesos, except for the net income per share and net operating income per share, which is expressed in Colombian pesos) | ||||||||||||||||||||
| Total revenue | 68,925,338 | 70,428,715 | 68,852,002 | 65,967,514 | 42,089,745 | |||||||||||||||
| Operating profit | 16,601,989 | 21,834,729 | 23,342,904 | 25,044,016 | 12,747,448 | |||||||||||||||
| Net income | 7,510,270 | 13,106,503 | 14,778,947 | 15,452,334 | 8,146,471 | |||||||||||||||
| Net operating income per share | 404 | 531 | 568 | 616 | 315 | |||||||||||||||
| Weighted average number of shares outstanding(4) | 41,116,698,456 | 41,116,698,456 | 41,116,698,456 | 40,634,882,725 | 40,472,512,588 | |||||||||||||||
| Net income per share(5) | 183 | 319 | 359 | 380 | 201 | |||||||||||||||
| Total assets | 142,181,291 | 132,427,994 | 113,879,578 | 92,277,386 | 68,769,356 | |||||||||||||||
| Shareholders’ Equity | 68,545,972 | 71,119,203 | 64,740,881 | 54,688,855 | 41,328,181 | |||||||||||||||
| Subscribed capital | 10,279,175 | 10,279,175 | 10,279,175 | 10,279,175 | 10,118,128 | |||||||||||||||
| Number of common shares(6) | 41,116,698,456 | 41,116,698,456 | 41,116,698,456 | 41,116,698,456 | 40,472,512,588 | |||||||||||||||
| Dividends declared per share | 133 | 260 | 300 | 145 | 91 | |||||||||||||||
| Total Liabilities | 69,439,384 | 56,735,043 | 46,536,530 | 35,335,900 | 26,955,224 | |||||||||||||||
| U.S. GAAP | ||||||||||||||||||||
| (Expressed in millions of Colombian pesos, except net income per share and net operating income per share, which is expressed in Colombian pesos) | ||||||||||||||||||||
| Total revenue | 66,117,500 | 68,432,645 | 66,867,137 | 62,715,815 | 40,879,324 | |||||||||||||||
| Operating profit | 16,461,798 | 23,319,936 | 23,556,963 | 23,673,787 | 13,878,515 | |||||||||||||||
| Net income attributable to Ecopetrol | 6,819,550 | 13,946,855 | 14,695,649 | 14,817,207 | 8,211,035 | |||||||||||||||
| Net operating income per share | 400 | 567 | 573 | 583 | 343 | |||||||||||||||
| Weighted average number of shares outstanding(4) | 41,116,698,456 | 41,116,698,456 | 41,116,698,456 | 40,634,882,725 | 40,472,512,588 | |||||||||||||||
| Net income per share | 166 | 339 | 357 | 365 | 203 | |||||||||||||||
| Total Assets | 102,310,815 | 91,687,916 | 81,519,332 | 70,909,079 | 52,332,148 | |||||||||||||||
| Shareholders’ Equity | 42,072,910 | 41,875,226 | 37,648,352 | 36,055,173 | 27,175,285 | |||||||||||||||
| Number of common shares (6) | 41,116,698,456 | 41,116,698,456 | 41,116,698,456 | 41,116,698,456 | 40,472,512,588 | |||||||||||||||
| Dividends declared per share | 133 | 260 | 300 | 145 | 91 | |||||||||||||||
| Total Liabilities | 57,589,537 | 46,997,359 | 41,436,532 | 32,565,787 | 24,847,512 | |||||||||||||||
| (1) | For 2014, proved reserves exclude proved oil royalties and include gas royalties. Data for 2010 through 2013 excludes proved oil and gas royalties. |
| (2) | Gross exploratory wells. |
| (3) | Refinery through-put includes Barrancabermeja, Reficar, Apiay and Orito. The Cartagena refinery was shutdown in March 2014 to complete an expansion program of the refinery. It will resume operations during the second half of 2015. |
| (4) | The weighted average number of common shares outstanding reflects the issuance of 644,185,868 shares to the public in connection with our second offering of shares in Colombia in September 2011. |
| (5) | Net income per share and net operating income per share are calculated using the weighted average number of outstanding shares during the year. |
| (6) | The number of common shares includes 644,185,868 shares issued to the public in connection with our second offering of shares in Colombia in September 2011. |
| 8 |
Our consolidated financial statements have been prepared under the Public Accounting Regime (Régimen de Contabilidad Pública), or RCP, as adopted by the Colombian National Accounting Office (Contaduría General de la Nación), or CGN in September, 2007 and applicable to Ecopetrol beginning with the fiscal year ended December 31, 2008. See Note 1—Economic Entity and Principal Accounting Policies and Practices, to the consolidated financial statements included in this Annual Report. We refer to RCP as Colombian Government Entity GAAP. Colombian Government Entity GAAP differs in certain significant respects from generally accepted accounting principles in the United States, or U.S. GAAP. Note 33 to the consolidated financial statements included in this Annual Report provides a description of the principal differences between Colombian Government Entity GAAP and U.S. GAAP as they relate to our audited consolidated financial statements and provides a reconciliation of net income and shareholders’ equity for the years and as of the dates indicated therein. As a state-owned company, our consolidated financial statements are periodically reviewed by the CGN. However, the review of our accounts by the CGN does not constitute an audit.
In this annual report, references to “US$” or “U.S. dollars” are to United States dollars and references to “Ps$,” “Peso” or “Pesos” are to Colombian Pesos, the functional currency under which we prepare our financial statements. This annual report translates certain Peso amounts into U.S. dollars at specified rates solely for the convenience of the reader. Unless otherwise indicated, such Peso amounts have been translated at the rate of Ps$2,392.46 per US$1.00, which corresponds to the Tasa Representativa del Mercado (TRM), or Representative Market Exchange Rate, for December 31, 2014. Such conversion should not be construed as a representation that the Peso amounts correspond to, or have been or could be converted into, U.S. dollars at that rate or any other rate. On April 28, 2015, the Representative Market Exchange Rate was Ps$2,419.81 per US$1.00.
Certain figures shown in this annual report have been subject to rounding adjustments and, accordingly, certain totals may therefore not precisely equal the sum of the numbers presented. In this annual report a billion is equal to one with nine zeros.
| 2. | Strategy and Market Overview |
In the second half of 2014, international crude oil benchmark prices declined dramatically. From its peak in June 2014, the Brent monthly contract price fell by more than 50% by year-end, directly impacting the revenue of oil producing companies. It is believed that the main reason behind the drop in prices is an imbalance between global supply and demand. According to some estimates, 2014 global oil demand growth was 1,500 mboepd less than supply growth. Non-OPEC supply grew 2,090 mboepd in 2014 with most of the growth coming from the United States (+1,590 mboepd). Thanks to the shale revolution, for the past three years, the United States has been the world’s fastest-growing hydrocarbon producer. U.S. crude oil production rose by 40% over that period, while natural gas production has grown by 29% since 2008, transforming this country into the main supplier of natural gas and the third largest supplier of crude oil worldwide. On the other hand, global demand grew 0.890 mboepd, mainly due to weak global economic growth of the Euro zone and Japan, along with lower expectations for China´s growth.
 |
 |
Source: Energy Information Administration (EIA), “Annual Energy Outlook”.
PIRA Energy Group, “World Oil Market Forecast”
| 9 |
Those imbalances caused a significant rise in global oil inventories during the first half of 2014, from 739 to 776 million barrels. As of December 31, 2014 global inventories were an estimated 770 million barrels, and since then they have increased further to 858 million barrels as of March 31, 2015. Historically such an excess of supply would have been offset through a cut in production from OPEC states. Nevertheless, OPEC members at their November 27, 2014 meeting decided to maintain their production levels. Given the fact that both the supply and demand of oil are relatively inelastic, particularly in the short term, Ecopetrol believes it will take some time for end consumers to see a reduction in gasoline prices significant enough to stimulate demand and for higher-cost production to decrease in reaction to lower crude prices. Thus, overall business sentiment points to an environment of short term weakness in crude oil prices.
Although international oil prices and global demand and supply dynamics are significant factors affecting our business and financial condition, local economic dynamics in Colombia have also influenced and could continue to influence our performance given that we conduct substantially all our business in Colombia. In 2014 Colombia’s GDP grew by 4.6%, compared to 4.9% in 2013, driven mainly by the performance of the construction, services and financial sectors. This economic performance resulted in higher local demand for liquid fuels, which increased by 3.5%.
Recently, the Colombian Government reduced its forecasted economic growth for 2015 from 4%-4.5% to 3.5%-4%, reflecting the impact of lower commodity prices, especially crude oil prices. Growth in 2015 is expected to be driven by the building construction and infrastructure sectors, mainly as a result of two ongoing programs: 4G (Cuarta Generacion) highway concessions, an ambitious program to build and operate under concession contracts more than 8,000 km of roads and 159 tunnels, and Mi Casa, a housing subsidy program aimed at Colombia’s low-income population that seeks to deliver 100,000 new houses at no cost plus other initiatives based on a reduction of the mortgage interest rate and direct subsidies.
Despite these positive events, Colombia’s economy faces significant challenges as a result of the lower crude oil lower prices, given that the country is a net oil exporter, and the slow recovery of its main business and trading partners. These factors have resulted in an increased current account deficit in Colombia and placed pressure on the exchange rate of the Colombian Peso against the U.S. dollar.
| 2.1. | Our Corporate Strategy |
Ecopetrol is currently in the approval phase of its strategy for the period 2015-2030. This new strategy aims at generating sustainable value for Ecopetrol, reaffirming the Group’s strength after a decade of consistent growth that led Ecopetrol to consolidate its position as the largest Colombian company and one of the 35 largest oil companies in the world.
Ecopetrol has launched an ambitious corporate transformation program in response to recent business dynamics and changes in the global energy market, with two main objectives: (i) streamline processes and improve the efficiency of the company to protect its financial and operational strength, and (ii) strengthen the capacities of Ecopetrol, to ensure a path for creating sustainable value in the medium and long term. In January 2015, the corporate transformation program was structured around eight key topics: Efficiency, Exploration, Recovery Factor, Culture and Leadership, Community Relationship, Projects, Technology and Capital Discipline.
Efficiency is the first axis of the transformation program. Ecopetrol is determined to achieve cumulative structural savings through the implementation of best practices in processes and focus on high-value activities. In addition, the program includes a thorough review of the project execution area and a more dynamic investment portfolio management, with the aim of optimizing capital allocation and ensuring that projects meet their budgets in terms of costs, time and profitability.
| 10 |
Strengthening the capacities of the company is also a key objective of the transformation program. For this reason, Ecopetrol is already structuring a comprehensive program for the improvement of its oil recovery factor, which will maximize cash generation from current productive fields. In addition, Ecopetrol will reinforce its technical capabilities in exploration and will launch a capacity-building technology program, fundamental to the creation of sustainable value in the oil and gas industry. Finally, the transformation program aims at designing a new model for successfully relating Ecopetrol with its environment, and includes actions intended to reinforce the corporate culture of Ecopetrol and enhance its human talent and leadership.
This transformation program is the first piece of a new strategy for Ecopetrol for the period 2015-2030, which will be presented in detail once approved definitively by the Board
Consistent with the new corporate strategy in the long term, and after a thorough review of the project portfolio to prioritize investments that maximize shareholder value, the Board of Directors of Ecopetrol approved a $7.860 billion investment plan for the year 2015. The plan aims at achieving an annual average production of 760 thousand barrels of oil and gas equivalent per day for the corporate group, of which 710 thousand correspond to Ecopetrol S.A.
Out of the total $7.86 billion investment plan approved for the Corporate group, $4.11 billion will be invested directly by Ecopetrol S.A. and $3.75 billion by subsidiaries, including $1.93 billion to be contributed by Ecopetrol S.A to its subsidiaries. Out of these investments, 92% will be held in Colombia and the remaining 8% abroad through subsidiaries. The highest percentage of resources will be directed toward production, the culmination of the modernization of the Cartagena refinery and the strengthening of the transportation capacity. The detail of the investments approved per segment is as follows:
| Investment Plan 2015 for Ecopetrol S.A. and subsidiary companies | ||||
| Business Segment | Million USD | |||
| Exploration | 503 | |||
| Production | 4,145 | |||
| Non-conventional hydrocarbons | 40 | |||
| Transportation and Logistics | 1,234 | |||
| Refining, Petrochemicals, and Biofuels | 1,800 | |||
| Others | 138 | |||
| TOTAL | 7,860 | |||
The resources required for the investment plan will come from internal cash generation, divestments in non-strategic assets and financing, consistent with preserving business and financial metrics that will ensure maintenance of Ecopetrol’s investment grade credit rating.
| 3. | Business Overview |
| 3.1. | Our History |
We were formed in 1951 by the Colombian government as Empresa Colombiana de Petróleos and began operating the crude oil fields at La Cira-Infantas and the pipeline that connected that field with the Barrancabermeja refinery and the port of Cartagena. In 1961, we assumed the direct operation of the Barrancabermeja refinery and continued its transformation into an industrial complex. In 1974, we acquired the Cartagena refinery, which had been in operation since 1957.
In 1970, we adopted our first bylaws that transformed us into a governmental industrial and commercial company administered by the Ministry of Mines and Energy. In 2003, we were transformed from an industrial and commercial company into a state-owned corporation, and renamed Ecopetrol S.A.
Pursuant to Decree Law 1760 of 2003, we were granted greater autonomy over our business decisions and we accelerated our exploration activities. Since 2003, we have been evolving from a wholly state-owned entity to a mixed-economy company with private capital. This process has resulted in a substantial change in the legal framework to which we are subject and in the nature of our relationship with the Nation. We carried out our initial public offering in November 2007 when our common shares became listed on the Colombian Securities Exchange. Our American Depository Shares were listed on the New York Stock Exchange in 2008.
| 11 |
The following table sets forth a list of our material acquisitions since January 1, 2009 and the effective date as of which each acquisition has been reflected in our operating results.
| Company | Date | Participation acquired in transaction | Sector | Price (US$)(1) | ||||||||||
| Offshore International Group Inc. (OIG) | February 2009 | 50 | %(2) | Exploration and Production | 639 million | |||||||||
| Oleoducto Central S.A. (Ocensa) | March 2009 | 24.7 | %(3) | Transportation | 418 million | |||||||||
| Hocol Petroleum Limited | March 2009 | 100 | %(4) | Exploration and Production | 807 million | |||||||||
| Refinería de Cartagena S.A. (Reficar) | May 2009 | 51 | %(5) | Refining | 545 million | |||||||||
| Equión Energía | January 2011 | 51 | %(6) | Exploration and Production | 814 million | |||||||||
| (1) | Includes amounts of adjustment on transaction prices. |
| (2) | U.S. parent of Savía Perú (formerly Petrotech Peruana S.A.). |
| (3) | As a result of this transaction, our ownership of Ocensa increased to 60%. |
| (4) | We acquired 100% of Maurel et Prom’s interest in Hocol Petroleum Limited, whose most important assets are Hocol S.A. and Homcol Cayman Inc. As a result of the acquisition, our ownership in Oleoducto de Colombia (“ODC”), increased from 43.85% to 65.57%. |
| (5) | As a result of this transaction, we became the sole owner of Reficar. |
| (6) | As a result of this acquisition, our ownership increased to 72.65% in Ocensa, 73.00% in ODC, and to 85.12% in Oleoducto del Alto Magdalena or OAM. We also obtained a 10.2% interest in Transgas de Occidente. |
We are in the process of selling some of our non-core shareholdings:
| · | We currently own 6.87% of the total outstanding shares of Empresa de Energía de Bogotá. We have obtained all governmental authorizations in order to start the divestiture process (Decree 2305 of November 13, 2014). The next step in the process is the offering of the shares to the Solidary Sector (as defined by law 226 of 1995 and law 789 of 2002), which principally includes workers, retirees and former workers of Empresa de Energía de Bogotá, associations thereof, unions, and employee funds, mutual investment funds, and severance and pension funds. This next step is expected to take place in the second quarter of 2015. Any shares remaining after the completion of the offering of the shares to the Solidary Sector are expected to be offered to the general public using the most appropriate mechanism for the volume and value of the remaining shares. |
| · | We currently own 5.32% of the total outstanding shares of Interconexion Electrica S.A. As of the date of this Annual Report, the date of any potential transaction has not been established. We are in the process of obtaining administrative and governmental authorizations to divest all or part of our stake in Interconexion Electrica S.A., as prescribed by law. On April 13, 2015, Ecopetrol received approval from the Council of Ministers for this divestiture. The next step in the process is the issuance of a Presidential Decree with the final approval to begin the divestiture process under Law 226 of 1995. |
| 3.2. | Our Corporate Structure |
We operate in the following business segments: 1) Exploration and Production; 2) Transportation and Logistics; 3) Refining, Petrochemicals, and Biofuels.
| 12 |
We have a number of directly and indirectly held subsidiaries both in Colombia and abroad. Our subsidiaries are either directly owned by us or indirectly owned by us through one or more of our other subsidiaries. As of March 31, 2015, we have eight directly owned and 16 indirectly owned subsidiaries.
In June 2014 we organized a new wholly owned German subsidiary, Ecopetrol Germany GmbH, to manage the 10% exploration and productions rights acquired from Statoil in Blocks 38 and 39 in Angola.
Our subsidiaries Refinería de Cartagena (Reficar), Cenit Transporte y Logística de Hidrocarburos S.A.S. (Cenit) and Oleoducto Central S.A. (Ocensa) are significant subsidiaries as such term is defined under SEC Regulation S-X.
The following table identifies our principal operating subsidiaries, their respective countries of incorporation, and our percentage ownership in each (both directly and indirectly through other subsidiaries), in each case as of March 31, 2015. See Exhibit 8.1 to this annual report for a complete list of our subsidiaries, their respective countries of incorporation, and our percentage of ownership in each.
| COMPANY | COUNTRY OF INCORPORATION | OWNERSHIP % | ||||
| Exploration and Production | ||||||
| Ecopetrol Óleo e Gás do Brasil Ltda.** | Brazil | 100.00 | ||||
| Ecopetrol del Perú S.A.** | Peru | 100.00 | ||||
| Ecopetrol Germany GmbH ** | Germany | 100.00 | ||||
| Ecopetrol America Inc.** | United States | 100.00 | ||||
| Hocol S.A. ** | Cayman Island | 100.00 | ||||
| Equión Energía Limited | United Kingdom | 51.00 | ||||
| Transportation | ||||||
| Oleoducto de los Llanos Orientales S.A. (ODL)** | Panama | 65.00 | ||||
| Oleoducto de Colombia S.A.** | Colombia | 73.00 | ||||
| Oleoducto Central S.A.** | Colombia | 72.65 | ||||
| Oleoducto Bicentenario de Colombia S.A.S.** | Colombia | 55.97 | ||||
| Cenit Transporte y Logística de Hidrocarburos S.A.S. | Colombia | 100.00 | ||||
| Refining and Petrochemicals | ||||||
| Refinería de Cartagena S.A.* | Colombia | 100.00 | ||||
| Propilco S.A.* | Colombia | 100.00 | ||||
| Compounding and Masterbatching Industry Ltda. (COMAI)** | Colombia | 100.00 | ||||
| Biofuels | ||||||
| Bioenergy S.A.** | Colombia | 93.47 | ||||
| Other | ||||||
| Black Gold Re Ltd. | Bermuda | 100.00 | ||||
| * | Direct and indirect participation. |
| ** | Solely indirect participation through other subsidiaries or affiliates. |
The following organization chart illustrates the relationships between Ecopetrol S.A. and its direct and indirect subsidiaries as of March 31, 2015.
| 13 |

| 3.3. | Our Business |
We are a vertically integrated oil company with a presence in Colombia, Peru, Brazil, Angola and the U.S. Gulf Coast. The Nation currently controls 88.49% of our voting capital stock. We are among the top 50 oil and gas companies in the world based on the Petroleum Intelligence Weekly Top 50 Ranking and in the top 5 in Latin America based on production volume. We are the largest corporation in Colombia as measured by revenues, Ebitda, shareholders’ equity, net income and net worth, and we play a key role in the local hydrocarbon market.
| 3.4. | Exploration and Production |
Our Exploration and Production business segment includes exploration, development and production activities in Colombia and abroad. We began local exploration in 1955 and international exploration in 2006. We conduct exploration and production activities directly in Ecopetrol S.A., through some of our subsidiaries, and through joint ventures with third parties. As of December 31, 2014, we were the largest operator and the largest producer of crude oil and natural gas in Colombia, and we maintained the largest acreage under exploration in Colombia.
| 3.4.1 | Exploration Activities |
Our exploration plan in Colombia is focused on exploration of: (1) production sites in close proximity to existing ones and (2) currently producing basins and exploration of frontier areas, including off-shore areas primarily operated by our business partners, which we believe have the potential for large discoveries. Our exploration strategy outside of Colombia is focused on locating prospects and establishing joint ventures with experienced operators.
| 14 |
For purposes of this exploration section, “we” refers to Ecopetrol S.A., its subsidiaries and partnerships in which Ecopetrol has an interest. Unless otherwise stated, all figures are given before deductions for royalties.
| 3.4.1.1 | Exploration Activities in Colombia |
We have exploration activities in all of the sedimentary basins in Colombia in which active oil and gas operations are found. The following map shows the basins where we conduct exploration activities.

| 15 |
We conduct exploration activities in Colombia on our own and through joint ventures with regional and global oil and gas companies. In 2014 Ecopetrol S.A. acquired 6,607 equivalent kilometers of seismic data, both directly and through business partners.
Exploratory Wells
The following table sets forth for the periods indicated the number of gross and net productive and dry exploratory wells drilled by us and our joint venture partners, and the exploratory wells drilled by third parties pursuant to sole risk contracts with us.
| For the year ended December 31, | ||||||||||||
| 2014 | 2013 | 2012 | ||||||||||
| COLOMBIA | ||||||||||||
| Ecopetrol S.A. | ||||||||||||
| Gross Exploratory Wells | ||||||||||||
| Owned and operated by Ecopetrol | ||||||||||||
| Productive(1) | 3 | 4 | 4 | |||||||||
| Dry(2) | 9 | 2 | 2 | |||||||||
| Total | 12 | 6 | 6 | |||||||||
| Operated by Partner in Joint Venture | ||||||||||||
| Productive(3) | 1 | 3 | - | |||||||||
| Dry | 2 | 2 | - | |||||||||
| Total | 3 | 5 | - | |||||||||
| Operated by Ecopetrol in Joint Venture | ||||||||||||
| Productive | 1 | - | - | |||||||||
| Dry | - | - | - | |||||||||
| Total | 1 | - | - | |||||||||
| Net Exploratory Wells(4) | ||||||||||||
| Productive | 4.1 | 5.5 | 3.3 | |||||||||
| Dry | 10.7 | 3.0 | 2.0 | |||||||||
| Total | 14.8 | 8.5 | 5.3 | |||||||||
| Sole Risk | ||||||||||||
| Productive | - | - | - | |||||||||
| Dry | - | - | 1 | |||||||||
| Total | - | - | 1 | |||||||||
| Equion | ||||||||||||
| Gross Exploratory Wells | ||||||||||||
| Productive | - | - | - | |||||||||
| Dry | - | - | 1 | |||||||||
| Total | - | - | 1 | |||||||||
| Hocol | ||||||||||||
| Gross Exploratory Wells | ||||||||||||
| Productive | - | 1 | 4 | |||||||||
| Dry | 4 | 6 | 4 | |||||||||
| Total | 4 | 7 | 8 | |||||||||
| Net Exploratory Wells(4) | ||||||||||||
| Productive | - | 0.5 | 3 | |||||||||
| Dry | 3 | 5.0 | 4 | |||||||||
| Total | 3 | 5.5 | 7 | |||||||||
| (1) | A productive well is an exploratory well that has evidence of hydrocarbons. |
| (2) | A dry well or hole is an exploratory well found to be incapable of producing either crude oil or natural gas in sufficient quantities to justify completion as a crude oil or natural gas well. |
| 16 |
| (3) | This number does not include the QFN-CS1 well that was under evaluation at December 31, 2014. |
| (4) | Net exploratory wells are calculated according to our percentage of ownership in these wells. |
Ecopetrol S.A. drilled a total of 17 wildcat exploratory wells (A3-A2) in 2014, including the QFN-CS1 well, in which Ecopetrol holds a 40% working interest in partnership with Metrapetroleum (operator) and which was under evaluation as of December 31, 2014. There was evidence of hydrocarbons in five wells: Orca-1 the first discovery in deep waters of the Colombian Caribbean, in which Ecopetrol holds a 30% working interest, in partnership with Petrobras (operator, 40%) and Repsol (30%); Nueva Esperanza in block CPO09, operated by Ecopetrol (55%) in partnership with Talisman Colombia Oil & Gas Ltd. (45%) and in Tibirita-1A, Cacica-1 and Golosa, each of which are 100% owned by Ecopetrol. Eleven wells were dry. Hocol drilled four A3 wells, all of which were dry.
During 2014, Ecopetrol S.A. participated in the bidding round launched by the National Hydrocarbons Agency to offer licenses for exploratory activities in Colombia, and was awarded one exploration block located in the Colombian Caribbean (Sin Off-7) with an extension area of approximately 173 thousand hectares. Ecopetrol S.A. has a 35% stake in this contract. Hocol S.A. submitted the best offer for four blocks in the Sinu San Jacinto Basin: Blocks SN-8, SN-15, SN-18 and YDSN1.
| 3.4.1.2 | Exploration Activities Outside of Colombia |
Our international exploration strategy is focused on participating in bidding rounds to secure blocks available for exploration and entering into joint ventures with international and regional oil companies. We believe exploring outside Colombia allows us to diversify our risks and improve the possibilities of increasing our crude oil and natural gas reserves.
In association with our business partners, we have undertaken deep water exploratory drilling in the U.S. Gulf Coast, Angola and in Brazil.
| For the year ended December 31, | ||||||||||||
| 2014 | 2013 | 2012 | ||||||||||
| INTERNATIONAL | ||||||||||||
| Ecopetrol America Inc. | ||||||||||||
| Gross Exploratory Wells | ||||||||||||
| Productive(1) | 2 | - | 2 | |||||||||
| Dry(2) | 3 | 2 | 1 | |||||||||
| Total | 5 | 2 | 3 | |||||||||
| Net Exploratory Wells(3)(4) | ||||||||||||
| Productive | 0.7 | - | 0.3 | |||||||||
| Dry | 0.5 | 0.5 | 0.6 | |||||||||
| Total | 1.2 | 0.5 | 0.9 | |||||||||
| Ecopetrol Óleo e Gás do Brasil Ltda. | ||||||||||||
| Gross Exploratory Wells | ||||||||||||
| Productive | - | - | - | |||||||||
| Dry | - | 1 | 3 | |||||||||
| Total | - | 1 | 3 | |||||||||
| Net Exploratory Wells(3) | ||||||||||||
| Productive | - | - | - | |||||||||
| Dry | - | 0.3 | 1 | |||||||||
| Total | - | 0.3 | 1 | |||||||||
| Ecopetrol Germany(5) | ||||||||||||
| Gross Exploratory Wells | ||||||||||||
| Productive | - | - | - | |||||||||
| Dry | 2 | - | - | |||||||||
| Total | 2 | - | - | |||||||||
| 17 |
| For the year ended December 31, | ||||||||||||
| 2014 | 2013 | 2012 | ||||||||||
| Net Exploratory Wells(3) | ||||||||||||
| Productive | - | - | - | |||||||||
| Dry | 0.2 | - | - | |||||||||
| Total | 0.2 | - | - | |||||||||
| Savía Perú(6) | ||||||||||||
| Gross Exploratory Wells | ||||||||||||
| Productive | - | 1 | - | |||||||||
| Dry | - | - | 3 | |||||||||
| Total | - | 1 | 3 | |||||||||
| Net Exploratory Wells(3) | ||||||||||||
| Productive | - | 0.5 | - | |||||||||
| Dry | - | - | 1.5 | |||||||||
| Total | - | 0.5 | 1.5 | |||||||||
| (1) | A productive well is an exploratory well that has evidence of hydrocarbons. |
|
(2) | A dry well or hole is an exploratory well found to be incapable of producing either crude oil or natural gas in sufficient quantities to justify completion as a crude oil or natural gas well. |
| (3) | Net exploratory wells are calculated according to our percentage of ownership in these wells. |
| (4) | None of our international wells were dug pursuant to a sole risk contract. |
| (5) | Exploratory wells for Ecopetrol Germany were drilled in the Angola blocks 38 and 39 offshore Angola. |
| (6) | Colan 2x well drilled in 2013 by Savía Perú S.A., which was under evaluation as of December 31, 2013, was declared as dry in 2014, but was subsequently reclassified as an appraisal well. |
In 2014, we drilled seven international gross exploratory wells through our subsidiaries and partners as follows:
| · | Gulf of Mexico: Ecopetrol America drilled five gross exploratory wells, of which two were declared successful: the Leon well, in which Ecopetrol America has a 40% working interest, which was drilled with our partner Repsol North America (operator); and the Rydberg well, in which Ecopetrol America has a 28.5% working interest, which was drilled with our partners Shell (operator) and Nexen Energy. |
Three wells were declared dry holes: the Deep Nansen well, in which Ecopetrol America had a 15% working interest, which was drilled with our partners Anadarko Petroleum Corporation (operator), Conoco Phillips, Marubeni Oil & Gas (USA) Inc. and Venari Resources; the Titan well, in which Ecopetrol America has a 30% working interest, which was drilled with our partners Murphy Oil Corporation (operator) and Venari Resources; and the K2 Exploration Tail well in which Ecopetrol America has a 9.21% working interest, which was drilled with our partners Anadarko Petroleum Corporation (operator), Eni Petroleum, ConocoPhillips, Nippon Oil Expl. and MCX GOM.
| · | Angola: Ecopetrol Germany drilled two gross exploratory wells operated by Statoil: the Dilolo 1 well, drilled in Block 39, and the Jacare 1 well, drilled in Block 38. Ecopetrol Germany has a 10% working interest in each well. Both wells were declared dry holes |
| · | Brazil: Ecopetrol Óleo e Gás do Brasil Ltda. has a 100% interest in the POT-M-567 and FZA-M-320 blocks. Ecopetrol Óleo e Gás do Brasil Ltda. has a 50% working interest in the CE-M-715 block, along with Chevron Brasil Upstream Frade Ltda. (operator). |
| 18 |
| 3.4.2 | Production Activities |
Our consolidated average production was 755.4 thousand bpd in 2014, 33 thousand bpd below that of the previous year. The main factors affecting this result were: 1) the operational difficulties associated with our community relations, including blockades which delayed the start-up of new facilities and new wells in several fields (approximately 22 thousand bpd), 2) the water disposal limitations, essentially in the Rubiales field (9.5 thousand bpd), 3) attacks on our infrastructure, which forced the temporary closure of some of our fields (5 thousand bpd), and 4) the temporary reduction in production in the Guajira gas fields due to the start of GACE IV recovery factor improvement project, which required a temporary stop in production. These factors were partially offset by the increase in production by Ecopetrol S.A.’s affiliates and subsidiaries (3.5 thousand bpd).
Despite these difficulties, we managed to reverse the trend of decreasing production experienced at the beginning of the year such that we were on a path of production growth in the last two quarters of 2014. This reversal was driven mainly by the results of our direct operations in fields like Chichimene, where we reached production records, and the increase in production of the Castilla field. In addition we made progress on the Akacias field project located in the Llanos Region, where production increased to 10.5 mbpoed by year-end.
The following table summarizes the results of our oil and gas production activities for the periods indicated:
| For the year ended December 31, | ||||||||||||||||||||||||||||||||||||
| 2014 | 2013 | 2012 | ||||||||||||||||||||||||||||||||||
| (thousand bpoed) | ||||||||||||||||||||||||||||||||||||
| Oil(2) | Gas(1) | Total | Oil(2) | Gas(1) | Total | Oil(2) | Gas(1) | Total | ||||||||||||||||||||||||||||
| Total production in Colombia | 610.9 | 133.3 | 744.2 | 643.9 | 136.6 | 780.5 | 626.5 | 118.5 | 745 | |||||||||||||||||||||||||||
| Total International production | 8.6 | 2.6 | 11.2 | 7.2 | 0.5 | 7.7 | 8.2 | 0.9 | 9.1 | |||||||||||||||||||||||||||
| Total production of Ecopetrol Group | 619.5 | 135.9 | 755.4 | 651.1 | 137.1 | 788.2 | 634.7 | 119.4 | 754.1 | |||||||||||||||||||||||||||
| (1) | Gas liquids are included in the gas totals. |
| (2) | Conversion between mcfpd and boepd is performed at 5,700 mcfpd to 1 boepd. |
| 3.4.2.1 | Production Activities in Colombia |
| 3.4.2.1.1. | Ecopetrol S.A.’s Production Activities in Colombia |
For the year ended December 31, 2014, Ecopetrol S.A was the largest participant in the Colombian hydrocarbons industry, accounting for approximately 58% of crude oil production and approximately 63% of natural gas production.
In 2014, we carried out development drilling in all our producing regions in Colombia, drilling 761 development wells; 177 of those through our direct operations and 584 through our joint ventures. As part of an internal administrative restructuring process we recently reorganized the management of the production activities of Ecopetrol S.A., which will allow us to improve our control on operations, while at the same time giving us a closer and more effective interaction with communities and partners. Beginning on July 1, 2014, our fully owned fields were divided into three main Vice-presidencies or administrative regions:
| · | Central Region: comprising 28 fields located in seven provinces across the Middle Magdalena Valley and Catatumbo regions. |
| · | Orinoquia Region: covering 29 fields in the provinces of Meta, Casanare, Arauca y Vichada. |
| 19 |
| · | Southern Region: comprising 42 fields and covering operations in the provinces of Huila, Tolima, Putumayo, Nariño and Caquetá. |
A fourth Vice-presidency, the Vice-presidency of Associated Assets, will be responsible for all of the production activities in which a partner is involved, regardless of the location of such activities in Colombia.
The map below indicates the locations of our operations in Colombia. Production information for each of the new administrative regions is included in the discussion following the maps.

Crude Oil Production
The average daily production of crude oil in Colombia by Ecopetrol S.A. (excluding its subsidiaries), was 579.7 thousand bpd in 2014, 33 thousand bpd less than in 2013, which represents a year-to-year decrease of 5.4%. The drop in the average daily production is mainly due to a 10.5% reduction in production in at our associated operations, and the above-described restrictions in our direct operations, mainly in the Orinoquía region where our production dropped by 2.2% as compared to 2013.
The following chart summarizes Ecopetrol S.A.’s average daily crude oil production in Colombia, prior to deducting royalties, for the periods indicated.
| 20 |
| For the year ended December 31, | ||||||||||||
| 2014 | 2013 | 2012 | ||||||||||
| (thousand bpd) | ||||||||||||
| Central Region | ||||||||||||
| 1) La Cira – Infantas | 24.6 | 23.5 | 21.7 | |||||||||
| 2) Casabe | 22.0 | 22.8 | 23.1 | |||||||||
| 3) Yarigui | 16.7 | 14.9 | 14.3 | |||||||||
| 4) Other | 21.0 | 20.3 | 22.4 | |||||||||
| Total Central Region | 84.3 | 81.4 | 81.5 | |||||||||
| Orinoquía Region | ||||||||||||
| 1) Castilla | 104.4 | 112.9 | 111.4 | |||||||||
| 2) Chichimene | 56.2 | 53.1 | 44.1 | |||||||||
| 3) Cupiagua | 16.4 | 18.5 | 20.8 | |||||||||
| 4) Other | 26.0 | 23.8 | 22.8 | |||||||||
| Total Orinoquia Region | 203.0 | 208.3 | 199.2 | |||||||||
| Southern Region | ||||||||||||
| 1) San Francisco | 9.2 | 10.0 | 6.9 | |||||||||
| 2) Huila Area | 8.2 | 7.9 | 9.4 | |||||||||
| 3) Tello | 4.3 | 4.4 | 4.7 | |||||||||
| 4) Other | 11.8 | 11.8 | 12.1 | |||||||||
| Total Southern Region | 33.6 | 34.2 | 33.1 | |||||||||
| Associated Operations | ||||||||||||
| 1) Rubiales | 104.3 | 120.0 | 102.0 | |||||||||
| 3) Quifa | 33.0 | 33.5 | 22.1 | |||||||||
| 4) Caño Limon | 30.0 | 36.4 | 39.2 | |||||||||
| 5) Cusiana | 7.0 | 8.8 | 10.0 | |||||||||
| 6) Other | 83.9 | 89.8 | 101.8 | |||||||||
| Total Associated Operations | 258.2 | 288.5 | 275.1 | |||||||||
| Production tests* | 0.7 | 0.2 | 2.06 | |||||||||
| Total average daily crude oil production Ecopetrol S.A. (Colombia) | 579.7 | 612.6 | 591.0 | |||||||||
| * | From associated operations. Production tests from operations in which we are the sole operator are reported within the regions. |
ECOPETROL S.A. PRODUCTION PER TYPE OF CRUDE (IN MBOD):
| 2014 | 2013 | Year-on-Year ∆ (%) | 2012 | Year-on-Year ∆ (%) | ||||||||||||||||
| Light | 44.51 | 49.12 | (9.4 | )% | 59.58 | (17.5 | )% | |||||||||||||
| Medium | 198.54 | 215.78 | (8.0 | )% | 227.85 | (5.3 | )% | |||||||||||||
| Heavy | 336.61 | 347.73 | (3.2 | )% | 303.55 | 14.6 | % | |||||||||||||
| Total | 579.66 | 612.63 | (5.4 | )% | 590.98 | 3.7 | % | |||||||||||||
Ecopetrol S.A.’s crude oil production during 2014 consisted of approximately 42% light and medium crudes and 58% heavy crudes, confirming our shift to heavy crude production. In 2013, approximately 43% of the crude oil production corresponded to light and medium crudes while the remaining 57% to heavy crudes. During 2012, production distribution was approximately 49% of light and medium crudes and 51% of heavy crudes.
Our most important heavy crude oil assets are:
| · | Cubarral Block. Located in the Orinoquia region and comprised of the Castilla and Chichimene fields. Together, these fields produced approximately 161 thousand bpd in 2014. |
| 21 |
| · | Rubiales - Quifa. The Rubiales and Quifa fields are part of our associated operations and are developed in joint venture with Metapetroleum. The Rubiales and Quifa fields produced 137 thousand bpd in 2014. |
Ecopetrol and Pacific Rubiales Energy announced in 2015 that they have agreed not to extend the Rubiales risk participation and Piriri joint venture contracts that expire in 2016. Ecopetrol will be examining different options for the operation of the Rubiales field. Both Ecopetrol and Pacific Rubiales Energy have expressed interest in continuing to develop business opportunities for the benefit of both parties and that of the country.
Natural Gas Production
In 2014, the average daily production of natural gas by Ecopetrol S.A. reached 125.4 thousand boepd, a 2.7% reduction when compared with 2013 production.
We have three main natural gas production fields, Guajira, Cusiana and Cupiagua. The majority of our production of natural gas in Colombia is undertaken by joint ventures. In the Guajira field, we have partnered with Chevron. In the development of Cusiana field, our partners are Equión and Sinochem Petroleum Exploration and Production. Ecopetrol S.A. directly operates the Cupiagua field, including the Cupiagua gas plant, which is connected with the Cusiana field through the Cupiagua-Cusiana gas pipeline.
Of our total natural gas production as of December 31, 2014, 40% was supplied from the Guajira field, 21% from the Cusiana field, 18% from the Cupiagua field and the remaining 21% from fields located in other regions.
The following table sets forth Ecopetrol S.A.’s average daily natural gas production in Colombia, prior to deducting royalties, for the years ended December 31, 2014, 2013, and 2012.
| For the year ended December 31, | ||||||||||||
| 2014 | 2013 | 2012 | ||||||||||
| (thousand boepd) | ||||||||||||
| COLOMBIA | ||||||||||||
| Central Region | ||||||||||||
| 1) La Cira – Infantas | 0.16 | 0.14 | 0.18 | |||||||||
| 2) Casabe | 0.00 | 0.04 | 0.08 | |||||||||
| 3) Yarigui | 0.50 | 0.60 | 0.61 | |||||||||
| 4) Other | 10.60 | 10.32 | 9.89 | |||||||||
| Total Central Region | 11.26 | 11.10 | 10.76 | |||||||||
| Orinoquía Region | ||||||||||||
| 1) Cupiagua | 22.80 | 20.08 | 0.69 | |||||||||
| 2) Other | 1.37 | 1.48 | 1.55 | |||||||||
| Total Orinoquia Region | 24.17 | 21.55 | 2.24 | |||||||||
| Southern Region | ||||||||||||
| 1) Huila Area | 1.14 | 1.09 | 1.05 | |||||||||
| 2) Tello | 0.26 | 0.20 | 0.20 | |||||||||
| 3) Other | 0.04 | 0.02 | 0.03 | |||||||||
| Total Southern Region | 1.43 | 1.31 | 1.28 | |||||||||
| Associated Operations | ||||||||||||
| 1) Guajira | 50.11 | 58.97 | 59.47 | |||||||||
| 2) Cusiana | 26.53 | 23.93 | 26.42 | |||||||||
| 3) Other | 11.87 | 12.04 | 10.82 | |||||||||
| 4) Direct Operation | ||||||||||||
| 5)Associated Operation | ||||||||||||
| Total Associated Operations | 88.52 | 94.94 | 96.72 | |||||||||
| Production tests | 0.00 | 0.00 | 0.01 | |||||||||
| Total Natural Gas Production (Colombia) | 125.38 | 128.90 | 111.01 | |||||||||
| Note: | Conversion between mcfpd and boepd is performed at 5,700 mcfpd to 1 boepd. |
| 22 |
Development Wells
The following table sets forth the number of gross and net development wells drilled exclusively by Ecopetrol S.A. and by its joint ventures in Colombia for the years ended December 31, 2014, 2013 and 2012.
DEVELOPMENT WELLS
| For the year ended December 31, | ||||||||||||
| 2014 | 2013 | 2012 | ||||||||||
| COLOMBIA | ||||||||||||
| Central Region | ||||||||||||
| Gross wells owned and operated by Ecopetrol | 104 | 67 | 47 | |||||||||
| Orinoquía Region | ||||||||||||
| Gross wells owned and operated by Ecopetrol | 65 | 77 | 134 | |||||||||
| Southern Region | ||||||||||||
| Gross wells owned and operated by Ecopetrol | 8 | 2 | 1 | |||||||||
| Associated Operations | ||||||||||||
| Gross wells in joint ventures | 584 | 628 | 541 | |||||||||
| Net wells(1) | 374 | 404 | 412 | |||||||||
| Total Ecopetrol S.A. | ||||||||||||
| Total gross wells owned and operated by Ecopetrol S.A in Colombia | 177 | 146 | 182 | |||||||||
| Total gross wells in joint ventures Ecopetrol S.A in Colombia | 584 | 628 | 541 | |||||||||
| Total net wells Ecopetrol S.A. in Colombia | 374 | 404 | 412 | |||||||||
|
(1) | Net wells correspond to the sum of wells entirely owned by Ecopetrol S.A. and our ownership percentage of wells owned in joint ventures with our partners. |
Production Acreage
The following table sets forth Ecopetrol S.A.’s developed and undeveloped gross and net acreage of crude oil and natural gas production in Colombia for the year ended December 31, 2014.
| Production Acreage as of December 31, 2014 (in acres) | ||||||||||||||||
| Developed | Undeveloped | |||||||||||||||
| Gross | Net | Gross | Net | |||||||||||||
| Ecopetrol S.A. | 411,114 | 309,127 | 4,994,487 | 3,563,224 | ||||||||||||
| 23 |
Gross and Net Productive Wells
The following table sets forth Ecopetrol S.A.’s total gross and net productive wells by region as of December 31, 2014.
| As of December 31, 2014 | ||||||||||||||||
Crude Oil (1) | Natural Gas (2) | |||||||||||||||
| Gross | Net | Gross | Net | |||||||||||||
| COLOMBIA | ||||||||||||||||
| Ecopetrol S.A. | ||||||||||||||||
| Central region | 2,122 | 2038 | 3 | 3 | ||||||||||||
| Orinoquía region | 763 | 759 | 0 | 0 | ||||||||||||
| Southern region | 663 | 529 | 1 | 1 | ||||||||||||
| Region of Associated Operations | 3,441 | 1,837 | 37 | 21 | ||||||||||||
| Total (Ecopetrol S.A.) | 6,989 | 5,163 | 41 | 25 | ||||||||||||
Note: The above table reflects the productive wells that directly contribute to hydrocarbon production and therefore excludes wells used for injection, disposal, water abstraction, or other similar activities.
| (1) | We consider crude oil wells to be those in which the main operation is oil production, although many of these wells produce gas associated with oil production that, in some cases, have a commercial purpose. |
| (2) | Natural gas wells are those in which operations are directed only toward the production of commercial gas. |
| 3.4.2.1.2. | Ecopetrol S.A.’s Affiliates and Subsidiaries’ Production Activities in Colombia |
Crude Oil Production
The following table sets forth our average daily crude oil production from Hocol and Equión, prior to deducting royalties, for the periods indicated.
| For the year ended December 31, | ||||||||||||
| 2014 | 2013 | 2012 | ||||||||||
| (thousand bpd) | ||||||||||||
| COLOMBIA | ||||||||||||
| Hocol | - | |||||||||||
| Joint venture operation | 2.5 | 2.6 | 2.8 | |||||||||
| Direct operation | 18.8 | 18.6 | 22.0 | |||||||||
| Total Hocol | 21.3 | 21.2 | 24.8 | |||||||||
| Equión | ||||||||||||
| Joint venture operation | - | - | - | |||||||||
| Direct operation | 10.0 | 10.1 | 10.6 | |||||||||
| Total Equión | 10.0 | 10.1 | 10.6 | |||||||||
| Production tests | - | - | 2.1 | |||||||||
| Total average daily crude oil production (Subsidiaries in Colombia) | 31.3 | 31.3 | 37.5 | |||||||||
Hocol’s production decrease in 2013 was mainly the result of (1) the end of the term of the contract relating to the Palermo field; the production of that field is now a 100% owned by the Group through Ecopetrol S.A. and (2) the natural decline in Ocelote’s production (Hocol’s main production contract).
Equión’s 0.1% production decrease in 2014 as compared to 2013 was mainly due to lower base peoduction in the Cusiana and Recetor fields.
| 24 |
Natural Gas Production
The following table sets forth our subsidiaries’ average daily natural gas production, prior to deducting royalties, for the periods indicated.
| For the year ended December 31, | ||||||||||||
| 2014 | 2013 | 2012 | ||||||||||
| (Thousand boepd )(1) | ||||||||||||
| Hocol | ||||||||||||
| Joint venture operation | - | - | 0 | |||||||||
| Direct operation | 0.1 | 0.2 | 1.3 | |||||||||
| Total Hocol | 0.1 | 0.2 | 1.3 | |||||||||
| Equión | ||||||||||||
| Joint venture operation | - | - | - | |||||||||
| Direct operation | 7.8 | 7.5 | 7.3 | |||||||||
| Total Equión | 7.8 | 7.5 | 7.3 | |||||||||
| Production Tests | - | - | - | |||||||||
| Total Natural Gas Production (Subsidiaries in Colombia) | 7.9 | 7.7 | 8.6 | |||||||||
Note: Conversion between mcfpd and boepd is performed at 5,700 mcfpd to 1 boepd.
Development Wells
The following table sets forth the number of gross and net productive and dry development wells drilled exclusively by our subsidiaries and in their joint ventures in Colombia for the periods indicated.
| For the year ended December 31, | ||||||||||||
| 2014 | 2013 | 2012 | ||||||||||
| Hocol | ||||||||||||
| Gross wells owned and operated by Hocol | 16 | 18 | 25 | |||||||||
| Gross wells in joint ventures | 6 | 4 | 5 | |||||||||
| Net wells(1) | 17 | 18 | 24 | |||||||||
| Equión | ||||||||||||
| Gross wells owned and operated by Equión | 2 | 6 | 3 | |||||||||
| Gross wells in joint ventures | - | - | - | |||||||||
| Net wells(1) | 1 | 2 | 2 | |||||||||
| Total gross wells owned and operated in Colombia | 18 | 24 | 28 | |||||||||
| Total gross wells in joint ventures in Colombia | 6 | 4 | 5 | |||||||||
| Total net wells (Subsidiaries in Colombia) | 18 | 20 | 26 | |||||||||
| (1) | Net wells correspond to the sum of wells owned and operated by our subsidiaries and their ownership percentage of wells owned in joint ventures with their partners. |
The following table sets forth our subsidiaries’ developed and undeveloped gross and net acreage of crude oil and natural gas production in Colombia by region for the year ended December 31, 2014.
| Production acreage as of December 31, 2014 | ||||||||||||||||
| Developed | Undeveloped | |||||||||||||||
| Gross | Net | Gross | Net | |||||||||||||
| (in acres) | ||||||||||||||||
| Hocol | 4,391 | 4,021 | 933 | 912 | ||||||||||||
| Equión | 21,757 | 8,590 | 119,651 | 48,445 | ||||||||||||
| Total (Subsidiaries in Colombia) | 26,148 | 12,611 | 120,584 | 49,357 | ||||||||||||
| 25 |
The following table sets forth our subsidiaries’ total gross and net productive wells in Colombia for the year ended December 31, 2014. We consider crude oil wells to be those in which the main operation is oil production, although many of these wells produce gas associated with oil production that, in some cases, have a commercial purpose. Natural gas wells are those in which operations are directed only towards production of commercial gas. Information in the table below reflects productive wells that directly contribute to hydrocarbons production and therefore excludes wells used for injection, disposal, water abstraction, or other similar activities.
| As of December 31, 2014 | ||||||||||||||||
| Crude Oil | Natural Gas | |||||||||||||||
| Gross | Net | Gross | Net | |||||||||||||
| Hocol | 213 | 139 | 1 | 1 | ||||||||||||
| Equión | 43 | 13 | - | - | ||||||||||||
| Total Subsidiaries in Colombia | 256 | 152 | 1 | 1 | ||||||||||||
| 3.4.2.2 | Production Activities Outside Colombia |
Crude Oil Production
The following table sets forth our average daily crude oil production outside Colombia, prior to deducting royalties, for the periods indicated.
| For the year ended December 31, | ||||||||||||
| 2014 | 2013 | 2012 | ||||||||||
| (thousand bpd) | ||||||||||||
| Savía Perú | 5.9 | 5 | 6 | |||||||||
| Ecopetrol America Inc. | 2.6 | 1.4 | 2 | |||||||||
| Total average daily crude oil production (International) | 8.5 | 6.4 | 8 | |||||||||
Natural Gas Production
The following table sets forth our average daily natural gas production outside Colombia, prior to deducting royalties, for the periods indicated.
| For the year ended December 31, | ||||||||||||
| 2014 | 2013 | 2012 | ||||||||||
| (Thousand boepd )(1) | ||||||||||||
| Savía Perú | 0.5 | 0.3 | 1 | |||||||||
| Ecopetrol America Inc. | 2.1 | 0.2 | 0.2 | |||||||||
| Total average daily crude oil production (International) | 2.6 | 0.5 | 1.2 | |||||||||
The following table sets forth the number of gross and net productive and dry development wells outside Colombia, drilled exclusively by us and in joint ventures for the periods indicated. Information in the table below reflects productive wells that directly contribute to hydrocarbons production and therefore excludes wells used for injection, disposal, water abstraction, or other similar activities.
| 26 |
| For the year ended December 31, | ||||||||||||
| 2014 | 2013 | 2012 | ||||||||||
| Savía Perú | - | |||||||||||
| Gross wells | 13 | 20 | 18 | |||||||||
| Net wells(1) | 6.5 | 10 | 9 | |||||||||
| Ecopetrol America Inc. | - | |||||||||||
| Gross wells | - | - | - | |||||||||
| Net wells(1) | - | - | - | |||||||||
| Total gross wells (International) | 13 | 20 | 18 | |||||||||
| Total net wells (International) | 6.5 | 10 | 9 | |||||||||
| (1) | Net wells correspond to the sum of wells entirely owned by us or our subsidiaries and our ownership percentage of wells owned in joint ventures with our partners. |
The following table sets forth our developed and undeveloped gross and net acreage of crude oil and natural gas production outside Colombia by region for the year ended December 31, 2014.
| Production acreage as of December 31, 2014 | ||||||||||||||||
| Developed | Undeveloped | |||||||||||||||
| Gross | Net | Gross | Net | |||||||||||||
| (in acres) | ||||||||||||||||
| Savía Perú | 81,180 | 40,590 | 3,935 | 3,935 | ||||||||||||
| Ecopetrol America Inc. (1) | 43,920 | 8,835 | 41,300 | 10,340 | ||||||||||||
| Total (International) | 12,5100 | 49,425 | 45,235 | 14,275 | ||||||||||||
|
(1) | Production and acreage from Ecopetrol America Inc. is related to the K2, Dalmatian and Gunflint field blocks in the Gulf of Mexico. For K2 there are six blocks, four of which are in the production stage and are held by production, while two are exploratory blocks that expire on June 30, 2016 and on May 31, 2021. For Dalmatian field production acreage, six blocks are included, four of which are held by production, while two are held by suspension of production until the production of Dalmatian South starts. For Gunflint field there are five blocks held by suspension of production until the production starts. |
The following table sets forth our total gross and net productive wells outside Colombia for the year ended December 31, 2014.
| As of December 31, 2014 | ||||||||
| Crude Oil | ||||||||
| Gross | Net | |||||||
| INTERNATIONAL | ||||||||
| Savía Perú | 650 | 325 | ||||||
| Ecopetrol America Inc. | 9 | 1.2 | ||||||
| Total (International) | 659 | 326.2 | ||||||
| 3.4.2.3 | Marketing of Crude Oil and Natural Gas |
| 3.4.2.3.1. | Ecopetrol S.A. |
In 2014, 96% of Ecopetrol S.A.’s income was based on sales of crude oil, gas and products (including fuels and petrochemicals). Total sales revenue amounted to $58 trillion Pesos, representing a decrease of 7.1% as compared to 2013. In 2014, Ecopetrol S.A. sold 913 mboepd, out of which 521 mboepd represented sales of crude oil, 291 mboepd products and the remaining 101 mboepd natural gas (equivalent to 730.4 gbtud out of which 666.4 correspond to domestic sales and 64 to exports).
| 27 |
Ecopetrol S.A.’s natural gas sales grew 11% (10 mboepd) compared with 2013. Export sales of crude (excluding sales to the free trade zone) increased about 1.4% (6.6 mboepd), as compared with 2013. Domestic crude sales rose 42.5% (14.5 mboepd) due to synergies with companies such as Hocol and Equion in order to improve transportation volumes and the cost of transportation.
Products sales in 2014 were 291.3 mboepd, an increase of 5.2% compared with 2013. Domestic sales of products increased 9.3 mboepd (an increase of 4.3%) mainly due to growth in demand for gasoline and diesel. Exports (excluding sales to the free trade zone) increased 4 mboepd, an increase of 6.8% as compared to 2013, due to higher fuel oil production.
Crude Oil Export Sales
Our crude oil export sales are made both in the spot market and through long term contracts, primarily to refiners in Asia, the U.S. Gulf Coast, Europe, Latin America and the U.S. West Coast.
Castilla is the principal source for foreign sales of crude, with 337 mboepd sold during 2014 (a 73% share of our crude oil basket) representing a 1.6 mboepd decrease as compared with 2013), followed by Vasconia Norte with 70 mboepd (a 15% share in our crude oil basket), representing a 63 mboepd increase as compared to 2013. These sales offset lower exports of Vasconia crude, which totaled 4 mboepd, and Magdalena Blend, which totaled 22 mboepd during 2014.
The price of our crude export basket decreased by $12.8/BL, as compared to 2013, due to a general decline in international prices.
A strategy of market diversification allowed Ecopetrol S.A. to continue switching sales of oil from the Gulf Coast of United States, decreasing, in terms of volume, from 40% of total export sales in 2013 to 27% in 2014. Importantly, the growth in crude sales to the Far East increased from 37% to 41% of total export sales as a result of term contracts signed with companies in China and India and other new Asian customers. Europe maintained its position as the third largest export destination with 15% of our total export sales.
Crude Oil Purchase Contracts
Ecopetrol S.A. has signed a number of crude oil purchase contracts with certain of our business partners and third parties. We also purchase crude oil received by the ANH as royalties from us and other producers in Colombia. Crude oil purchased from the ANH and our business partners is either processed in our refineries or exported. The purchase price is calculated based on international market prices.
The term of some of our purchase contracts is linked to the term of the exploration and production contracts signed with our business partners. Other clauses of the contracts such as price and place of delivery may be subject to renegotiation during the term of the contract. Certain purchase contracts not linked to joint venture agreements may be extended and renegotiated by the parties.
The table below sets forth the volumes of crude oil purchased from our business partners and third parties and volumes of crude oil purchased from the ANH corresponding to royalties for the years ended December 31, 2014, 2013 and 2012.
| For the year ended December 31, | ||||||||||||
| 2014 | 2013 | 2012 | ||||||||||
| (million barrels) | ||||||||||||
| Ecopetrol S.A.(1) | ||||||||||||
| Crude oil purchased from the ANH | 45.4 | 49.5 | 48.0 | |||||||||
| Crude oil purchased from our business partners and third parties | 20.3 | 18.9 | 25.4 | |||||||||
| 28 |
Import of Diluents
In 2014 we increased by 15.7% (8 mboepd) the imports of diluents (principally naphtha) used to allow our heavy crudes to be pumped through pipelines.
Natural Gas Sales
In 2014, Ecopetrol supplied 666.4 gbtud of the total natural gas demand in Colombia (excluding exports), representing a market share of 63.1% in 2014 as compared to 51.4% in 2013, with production used for our own consumption by refineries and for sale to natural gas distributors, for compressed natural gas for vehicles, to power plants, to the industrial sector and for export. Our market share in 2014, including foreign sales, was 63.3% and 54.4% in 2013.
Demand for natural gas in 2014 registered a decrease of 6.1% compared to the previous year, resulting in demand of 1,153 gbtud in 2014. For 2013 and 2012, demand for natural gas was 1,228 gbtud and 1,090 gbtud, respectively. The decrease in demand in 2014 was resulted from a decrease of approximately 52% in the quantities of natural gas exported to Venezuela as a result of less availability from the Guajira field.
We sell natural gas to distribution companies through firm, interruptible and conditional contracts. Today there are more than 30 natural gas distribution companies with operations in Colombia. Those distributors supply natural gas to the residential market, for compressed natural gas for vehicles and to industries in Colombia. We also market and sell natural gas to the industrial sector and to gas-fired and combined cycle power plants.
We also export natural gas. In 2007, we and our partner Chevron entered into a long-term natural gas supply contract with PDVSA. This contract was amended in June 2014 so that it expires on June 30, 2015. In 2014, we and Chevron delivered 98 gbtud to PDVSA, exceeding the quantity of natural gas we agreed to supply in our gas export contract. Of the total volume of gas delivered in 2014 to PDVSA, 66% came from us and 34% came from Chevron. In 2013 and 2012, we and Chevron delivered 204 gbtud and 186 gbtud respectively. Pursuant to the terms of the agreement, Chevron assumes 43%, and Ecopetrol 57%, of the responsibility to deliver natural gas to PDVSA.
Natural Gas Delivery Commitments
In August 2013 CREG issued natural gas sale guidelines through Resolution 089 of 2013. In accordance with those guidelines, a marketing process for natural gas was held during 2014, in which 63 contracts were signed with 16 different companies. Through that process, we sold 100% of Ecopetrol’s Guajira gas (97.2 gbtud available for commitments of one year or less and 26.7 gbtud available for commitments of five years) and 65% of the Ecopetrol’s Cusiana and Cupiagua gas available for one year (17.1 gbtud) and 100% of gas available for five or more years (62.3 gbtud). Those commitments are in addition to the existing agreements (52.6 gbtud from Guajira and 233.8 gbtud from Cusiana/Cupiagua) due to expire in 2018.
The table below sets forth the commitments Ecopetrol S.A. has under firm contracts with local natural gas distribution companies, local industries, gas fired power generators, international companies, including PDVSA in Venezuela, and internal agreements with our refineries and fields.
| For the year ended December 31, | ||||||||||||||||
| 2015 | 2016 | 2017 | 2018 | |||||||||||||
| (gbtud) | ||||||||||||||||
| Volume for sales third parties | 374 | 374 | 374 | 374 | ||||||||||||
| Volume for self-consumption | 209 | 225 | 228 | 334 | ||||||||||||
| Total Commitments | 583 | 599 | 602 | 708 | ||||||||||||
| 29 |
The following table sets forth domestic deliveries by Ecopetrol S.A. of natural gas, including deliveries to our refineries, for the periods indicated.
| For the year ended December 31, | ||||||||||||
| 2014 | 2013 | 2012 | ||||||||||
| (gbtud) | ||||||||||||
| Gas-fired power plants | 131.0 | 103.1 | 86.1 | |||||||||
| Refineries | 123.1 | 119.1 | 116.8 | |||||||||
| Petrochemical | 2.7 | 3.2 | 1.6 | |||||||||
| Industrial | 255.2 | 152.7 | 157.0 | |||||||||
| Distributors(1) | 85.3 | 102.8 | 78.1 | |||||||||
| Compressed Natural Gas for vehicles | 69.0 | 40.5 | 39.2 | |||||||||
| Producers | - | 5.3 | 5.4 | |||||||||
| Total Deliveries | 666.4 | 526.8 | 484.2 | |||||||||
| (1) | Deliveries to distributors include deliveries to industrial clients that are required to purchase natural gas from distributors. |
| 3.4.3 | Reserves |
The reserves audit process was conducted in accordance with SEC definitions and rules set forth in Rule 4-10(a) of Regulation S-X and the disclosure guidelines contained in the SEC’s Modernization of Oil and Gas Reporting final rule dated December 31, 2008 and effective as of January 1, 2010.
The estimated reserve amounts presented in this report, as of December 31, 2014, are based on the average prices during the 12-month period prior to the ending date of the period covered in this report, determined as the unweighted arithmetic averages of the prices in effect on the first-day-of-the-month for each month within such period, unless prices were defined by contractual arrangements, as required by the SEC regulations. See Note 22—Memorandum accounts, to the consolidated financial statements.
Our crude oil and natural gas net proved reserves include reserves from our subsidiaries located in the United States (Gulf of Mexico) and Peru, and Equión and Hocol’s assets in Colombia.
Estimated Net Proved Reserves
The following table sets forth our estimated net proved reserves (developed and undeveloped) of crude oil and gas by region for the years ended December 31, 2014, 2013 and 2012.
| Net Proved Developed Reserves | Colombia | North America | South America excluding Colombia | Total | ||||||||||||
| Net Proved Developed oil and NGL reserves in million barrels oil equivalent | ||||||||||||||||
| At December 31, 2012 | 922 | 1 | 10 | 933 | ||||||||||||
| At December 31, 2013 | 921 | 1 | 10 | 933 | ||||||||||||
| At December 31, 2014 | 1,030 | 2 | 10 | 1,042 | ||||||||||||
| Net Proved Developed gas reserves in billion standard cubic feet | ||||||||||||||||
| At December 31, 2012 | 2,524 | 2 | 10 | 2,536 | ||||||||||||
| At December 31, 2013 | 2,654 | 2 | 7 | 2,663 | ||||||||||||
| At December 31, 2014 | 3,260 | 14 | 9 | 3,284 | ||||||||||||
| Net Proved Developed oil, NGL and gas reserves in million barrels oil equivalent | ||||||||||||||||
| At December 31, 2012 | 1,365 | 1 | 12 | 1,378 | ||||||||||||
| At December 31, 2013 | 1,387 | 2 | 11 | 1,400 | ||||||||||||
| At December 31, 2014 | 1,602 | 5 | 12 | 1,618 | ||||||||||||
| 30 |
The conversion rate used is 5,700 standard cubic feet = 1 barrel of oil equivalent.
We are required, as are all oil companies undertaking exploratory and production activities in Colombia, to pay a percentage of our production to the Government as royalties. However, the ANH’s Resolution 877 of 2013, Resolution 351 of 2014 and Resolution 640 of 2014 require natural gas royalties to be paid in cash, which means that the determination of the property rights to the quantities of natural gas we produce is based on the total volume produced without deductions on account of royalties. As a result, reported reserves increased by 148 million boe in 2014. The main producing gas fields are, Cusiana, Cupiagua, Pauto, and Chuchupa, which represent 90% of the increase in reserves due to the change in the form of royalty payments. For further information on the effect of this regulation on reserves, see the section Business Overview—Exploration and Production—Reserves.
The following table summarizes our proved oil and gas reserves as of December 31, 2014.
| Reserves Category | Oil and NGL (million barrels) | Natural Gas (bcf) | Total Oil and Gas (Mmboe) | |||||||||
| PROVED DEVELOPED RESERVES | ||||||||||||
| Total (Colombia) | 1,030 | 3,260 | 1,602 | |||||||||
| Total (International) | 13 | 24 | 17 | |||||||||
| North America | 2 | 14 | 5 | |||||||||
| South America | 10 | 9 | 12 | |||||||||
| TOTAL PROVED DEVELOPED RESERVES | 1,042 | 3,284 | 1,618 | |||||||||
| PROVED UNDEVELOPED RESERVES | ||||||||||||
| Total (Colombia) | 401 | 230 | 442 | |||||||||
| Total (International) | 22 | 15 | 24 | |||||||||
| North America | 11 | 14 | 13 | |||||||||
| South America | 11 | 1 | 11 | |||||||||
| TOTAL PROVED UNDEVELOPED RESERVES | 423 | 245 | 466 | |||||||||
| TOTAL PROVED RESERVES | 1,465 | 3,529 | 2,084 | |||||||||
Note: The conversion rate used is 5,700 cf = 1 boe.
Reserves Replacement
The reserves replacement ratio is defined as the sum of additions and revisions of proved reserves divided by produced volumes in any given period. The following table presents the changes in reserves in each category relating to the reserve replacement ratio for the years 2014, 2013 and 2012.
| 31 |
Changes in Proved Reserves
| As of December 31 | ||||||||||||
| Consolidated Company (million barrels oil equivalent) | 2014 | 2013 | 2012 | |||||||||
| Revisions of previous estimates | 270 | 232 | 44 | |||||||||
| Purchase of Minerals | 0 | 9 | 0 | |||||||||
| Improved Recovery | 34 | 27 | 65 | |||||||||
| Extensions and discoveries | 51 | 75 | 143 | |||||||||
| Sales | 0 | (3 | ) | 0 | ||||||||
| Total reserves additions | 355 | 340 | 252 | |||||||||
| Production | (243 | ) | (245 | ) | (232 | ) | ||||||
| Net change in proved reserves | 112 | 95 | 20 | |||||||||
The reserves replacement ratio for 2014 was 1.46 compared to 1.39 in 2013. The average replacement ratio for the last three years was 1.31.
| As of December 31 | ||||||||||||
| 2014 | 2013 | 2012 | ||||||||||
| Reserves replacement ratio (including purchase and sales) | ||||||||||||
| Annual | 1.46 | 1.39 | 1.08 | |||||||||
| Three year average | 1.31 | 1.37 | 1.55 | |||||||||
Revisions of Previous Estimates
In 2014, net revisions increased reserves by 270 million boe. As discussed above, beginning on January 1, 2014, the royalties associated with natural gas and NGL are required to be paid to the ANH in cash, and are therefore considered a financial obligation and are no longer deducted from net reserves. As a result, reported reserves increased by 148 million boe in 2014. New development projects in Caño Sur, Moriche, Quifa, Rubiales, Provincia and Palagua fields resulted in a 91 million boe increase in reserves.
The revisions described above accounted for 88% of the increase in reserves due to revisions in 2014. The remaining 12% were due to varying increases and decreases from other fields.
Improved Recovery
In 2014, improved recovery increased reserves by 34 million boe. The additions were associated with the continued development of waterflood projects through existing wells, though additional drilling may be required to fully optimize the development configuration. The main additions were in La Cira, Infantas and Yarigui Cantagallo fields, which collectively accounted for a 25 million boe increase.
Extensions and Discoveries
Extensions and discoveries during 2014 amounted to 51 million boe, which is comprised of 47 million boe of extensions of proved acreage and 4 million boe from newly discovered fields and reservoirs. The newly discovered fields in Colombia corresponded to the Guando South West and Rex fields, and in the southern Gulf of Mexico, the Dalmatian South field. New reservoirs were discovered in the La Cañada Norte and Chipiron fields.
The extensions of proved acreage resulted mainly from activities in new proved areas in the Chichimene, Gibraltar Provincia, and Rubiales fields, which accounted for 33 million boe of the total of 47 million boe from extensions of proved acreage. The remaining 14 million boe corresponds to smaller changes in several other fields.
Purchases & Sales
In 2014, we neither purchased nor sold any participation in producing oil or gas properties.
| 32 |
Development of reserves
As of December 31, 2014, our total proved undeveloped oil and gas reserves amounted to 466 million boe, 30% of which are related to the Castilla and Rubiales fields in Colombia which have continuous development activities. The Caño Sureste, Pauto, and Tibú fields collectively account 21% of total proved undeveloped oil and gas reserves.
Our proved undeveloped reserves represent 22% of our total proved reserves.
The company’s year-end development plans are consistent with SEC guidelines for the development of proved undeveloped reserves within five years.
The following table reflects the developed and undeveloped proved reserves estimates through the past three fiscal years.
| Proved Reserves as of December 31, | Oil | Gas | Total | |||||||||
| Mmbls | Bcf | Mmboe | ||||||||||
| 2014 proved reserves | ||||||||||||
| Developed | 1,042 | 3,284 | 1,618 | |||||||||
| Undeveloped | 423 | 245 | 466 | |||||||||
| 2013 proved reserves | ||||||||||||
| Developed | 933 | 2,663 | 1,400 | |||||||||
| Undeveloped | 501 | 405 | 572 | |||||||||
| 2012 proved reserves | ||||||||||||
| Developed | 933 | 2,536 | 1,378 | |||||||||
| Undeveloped | 437 | 351 | 498 | |||||||||
Of the total amount of proved undeveloped reserves that Ecopetrol had at the end of 2013 (572 million boe), we converted approximately 166 million boe, or 29%, to proved developed reserves during 2014, primarily associated with the development of crude oil projects through drilling and workovers in Castilla, Rubiales, Pidemonte, La Cira Infantas, Quifa Suroeste, and Casabe fields. These projects accounted for approximately 77% of the total conversion. The conversion of the remaining 23% is associated with development execution in other fields such as the Ballena, Peñas Blancas, Yarigui-Cantagallo and Provincia fields, among others.
The amount of investments made during 2014 to convert proved undeveloped reserves to proved developed reserves was US$2,459 million.
Reserve Estimation Process
Ecopetrol’s reserves process is supervised and coordinated by the Corporate Reserves Director, a highly experienced petroleum engineer, who reports to the Chief Financial Officer. The reserves audit group is comprised of reserves coordinators who are geologist and petroleum engineers, each with more than 10 years of experience in reservoir characterization, field development, estimation and reporting of reserves and who have supervision and supporting responsibilities over the professionals involved in the estimation and reporting process.
Reserves are first estimated internally, supervised and coordinated by the Corporate Manager of Reservoirs, a geologist who holds a Master’s degree in geology and has more than 20 years of experience in projects associated with reservoir characterization and development, estimation, and reporting of reserves. The employees involved in the reserves process meet the Society of Petroleum Engineers qualifications for reserves estimators. Internally estimated reserves are submitted to an external audit process, which was conducted by the external engineers (Ryder Scott and DeGolyer and MacNaughton). According to our corporate policy, we report the reserves values obtained from the external engineers, even if they are lower than our internal estimated reserves.
| 33 |
The reserves estimation process ends when the Corporate Reserves Director consolidates the results and presents them to the Reserves Committee, whose members are the Chief Financial Officer, Vice-President of Development and Production, and the Chief Strategy and Development Officer. Results are presented to the Audit Committee of the Board of Directors and finally approved by the Board of Directors.
Petroleum engineering consultants DeGolyer and MacNaughton and Ryder Scott have audited Ecopetrol’s proved reserves as of December 31, 2014. These external engineers audited 99% of our estimated net proved reserves. The reserves reports of the external engineers are included as exhibits to this annual report. The external engineers DeGolyer and MacNaughton, Ryder Scott and Gaffney and Cline audited 99% of our estimated net proved reserves for each of the years ended December 31, 2013, and 2012.
Ecopetrol uses deterministic methods that are commonly used internationally to estimate reserves. These methods have some uncertainty with respect to degradation, and thus, the estimates should not be interpreted as being exact amounts. However, the technology used to estimate reserves is considered reliable. The majority of the producing proved reserves were estimated by applying appropriate decline curves or other performance relationships. In analyzing decline curves, reserves were estimated by calculating economic limits that are based on current economic conditions. In certain cases, where the methods previously employed could not be used, reserves were estimated by analogy with similar reserves for which more complete data was available.
Estimates of reserves were prepared by geological and engineering standard methods commonly used in the oil and gas industry. The method or combination of methods used in the analysis of each reserve was adopted from experience analogy reserves, including information on the stage of development, quality and completeness of basic data and production history.
The following table reflects the estimated proved reserves of oil and gas as of December 31, 2012 through 2014, and the changes therein.
| Consolidated companies | Colombia | North America | South America excluding Colombia | Total | ||||||||||||
| Net proved oil, NGL and gas reserves in mboe | ||||||||||||||||
| At December 31, 2012 | 1,856 | 6 | 14 | 1,877 | ||||||||||||
| Revisions | 221.5 | 2.0 | 8.4 | 231.9 | ||||||||||||
| Purchase of Minerals | 0 | 9.4 | 0.0 | 9.4 | ||||||||||||
| Improved Recovery | 26.4 | 0.0 | 0.3 | 26.7 | ||||||||||||
| Extensions and discoveries | 74.7 | 0.0 | 0.2 | 74.9 | ||||||||||||
| Sales | (2.8 | ) | 0.0 | 0.0 | (2.8 | ) | ||||||||||
| Production | (242.6 | ) | (0.5 | ) | (1.9 | ) | (244.9 | ) | ||||||||
| At December 31, 2013 | 1,934 | 17 | 21 | 1,972 | ||||||||||||
| Revisions | 264.7 | 1.7 | 4.0 | 270.4 | ||||||||||||
| Purchase of Minerals | 0.0 | 0.0 | 0.0 | 0.0 | ||||||||||||
| Improved Recovery | 34.1 | 0.0 | 0.0 | 34.1 | ||||||||||||
| Extensions and discoveries | 50.1 | 0.8 | 0.0 | 50.9 | ||||||||||||
| Sales | 0.0 | 0.0 | 0.0 | 0.0 | ||||||||||||
| Production | (239.6 | ) | (1.5 | ) | (2.0 | ) | (243.0 | ) | ||||||||
| At December 31, 2014 | 2,043 | 18 | 23 | 2,084 | ||||||||||||
| 34 |
For more information regarding the potential impacts of low prices on our reserve estimates, see the sections Financial Review—Trend Analysis and Risk Review—Risk Factors.
| 3.4.4 | Joint Venture and Other Contractual Arrangements |
We conduct our exploration and production business through a variety of types of contractual arrangements with the Colombian government or third parties. Below is a general description of each type of contractual arrangement to which we were a party as of December 31, 2014:
Association Contract
The Association Contract was created by the Decree 2310 of 1974. Its purpose is the exploration of the area covered by the contract, and the exploitation of hydrocarbons found in that area. This type of contract, together with E&P contracts and Special Contracts (Casabe and La Cira) which are described below, are the most significant in terms of our production and proved reserves.
Under Association Contracts, the exploratory risk is assumed entirely by Ecopetrol S.A.’s contractual partner, the associate. If there is a discovery and Ecopetrol S.A. agrees that the relevant field is commercially viable, Ecopetrol S.A. will participate in the field’s development. A joint account will be created and Ecopetrol S.A. and the partner will participate in the expenses and investments in the proportions established in the contract. Ecopetrol S.A. will reimburse the direct exploratory expenses incurred by the contractual partner in the proportions established by the contract.
If Ecopetrol S.A. does not believe that the relevant field is commercially viable, the partner has the right to execute on its own all activities considered necessary for the field’s exploitation as a “sole risk operation”, and to be reimbursed for a defined percentage of all investments for such sole risk operation in accordance with the contract.
Every Association Contract provides for an executive committee that makes all technical, financial and operational decisions if Ecopetrol S.A. has agreed that a field is economically viable. All major decisions of this committee must be made unanimously by the parties.
The maximum term of an Association Contract is 28 years. The first six years of the contract is for the exploratory phase, and is extendible for 1 or 2 more years at the partner’s request. The remaining time is for the exploitation phase.
Incremental Production Contract
We enter into Incremental Production Contracts to obtain incremental hydrocarbon production beyond a base production curve that is established based on the proven reserves of a specific field or well. Under this type of arrangement, Ecopetrol S.A. owns 100% of the hydrocarbons defined by the base production curve. The incremental production (i.e. the hydrocarbon volume obtained beyond the basic production as a result of investment activities), will be owned by the parties to the Incremental Production Contract in the proportions established by the contract.
The initial phase of an Incremental Production Contract has a term of up to 3 years, in which the contractual partner executes an initial work program approved by Ecopetrol S.A. in order to gain the right (but not the obligation) to continue with the second phase. If Ecopetrol’s partner decides to continue with the project for the second phase (the complementary phase), it must inform Ecopetrol S.A. in writing no later than 90 days prior to the termination date of the initial phase and deliver a proposed development plan for each covered field. The second phase is the production phase and has a maximum term of 22 years minus the length of the initial phase.
Incremental Production Contracts provide for an executive committee that is responsible for taking all decisions in order to approve, control, and supervise all operations that take place during the duration of the contract. These contracts also provide for a steering committee, which is responsible for the supervision of the execution of the work programs, the annual budget, and other items.
| 35 |
Risk Production Contract for Discovered Undeveloped and Inactive Fields (First Round 2003)
We have entered into risk production contracts for discovered undeveloped fields to promote exploration by private companies of both undeveloped and inactive fields. Under these contracts, the contracting party assumes all costs and expenses for the development and operation of a field in exchange for a percentage interest in the fields’ production as specified in the contract. This type of contract has a ten-year term calculated as from its date of execution; one year for the evaluation period and a maximum of nine years for the development period. Some of these contracts have subsequently been extended beyond their original term.
Operation for Risk Production Contracts for Discovered Undeveloped and Inactive Fields (Second Round 2005)
The contracts awarded in the second round of undeveloped and inactive discovered fields are service contracts wherein services rendered are payable with a percentage of the production. Ecopetrol S.A. keeps all rights to explore and exploit hydrocarbons found in the area.
These contracts have a 10 year term, including an evaluation period of 8 months, within which the Operator has to comply with a minimum commitment to conduct a technical evaluation of the field at its own risk.
The facilities built during the term of the contract, other than facilities associated with drilled wells, will be owned by Operator, who will remain responsible for it, even after contract ends. Only drilled wells become property of Ecopetrol S.A. upon the contract’s termination.
Risk Participation Contract
The purpose of this contract is the exploration of the contracted area, and the exploitation of the oil found in the contracted area. Unlike in the Association Contract, Ecopetrol S.A., shares exploratory risks and costs with the contractual partner, the associate, together with the oil produced, in the proportions established by the contract.
Risk Participation Contracts provide for an executive committee which is created upon the execution of the contract.
These contracts have 28 year terms, including an exploratory period of six years (which period is extendible under certain contracts for one or two years), after which the exploitation period commences.
Special Contracts
We are party to a Joint Venture Contract for Exploration and Exploitation of “La Cira-Infantas” Area; and a Services and Technical Collaboration Contract for the “Casabe” field.
Joint Venture Contract for Exploration and Exploitation of “La Cira-Infantas” Area
The contract between Ecopetrol S.A. and Occidental Andina LLC, executed on September 6th, 2005, has as purpose a joint collaboration between the parties with the goal of increasing the economic value of the La Cira Infantas field, by means of hydrocarbon exploration and production activities including, among others, an incremental production project to improve the recovery factor, process optimization, and exploratory activities.
| 36 |
Ecopetrol S.A partially assigned its exploratory and production rights in the Contracted Area to Occidental Andina LLC. Ecopetrol S.A. provides financial resources and the preferential rights of use for the existing infrastructure in that zone and Occidental Andina LLC provides financial resources and the technical and operative experience in mature fields redevelopment projects and enhanced recovery technologies.
Ecopetrol S.A. is the Operator, and on behalf of the parties is responsible for the conduction, execution and control, directly or via contractors, of the operational activities.
The contract’s term is divided in three phases. The first phase lasts 180 days, the second 730 days and the third up to the economical limit.
The incremental production, after deduction of the royalties, is owned 52% by Ecopetrol S.A. and 48% by Occidental Andina LLC. These same percentages apply to the participation in the operational and direct expenses. Adjustments to the participations for the benefit of Ecopetrol S.A. will occur if there are high production levels or high prices.
Services and Technical Collaboration Contract “Casabe”
The purpose of the contract executed between Ecopetrol S.A and Schlumberger Surenco S.A. on April 26, 2004, is the evaluation, design and execution of work programs specifically with the purpose of increasing the value in the Casabe field, by means of development of activities to obtain incremental production, application of new technologies, application of techniques for deposits management and operational costs reduction. Ecopetrol S.A. is the operator and Schlumberger Surenco S.A. keeps the right of first option regarding the activities to be executed in the area of interest.
Both parties can invest in all the activities seeking to evaluate, obtain and incorporate incremental value in the area of interest. Such activities are developed directly by the parties or via contractors (Ecopetrol) or subcontractors (Schlumberger). Amounts expended pursuant to the contract are reimbursed depending on the incremental value (monthly valuation in USD of the results obtained from the execution of the work programs) created through the contract and the activities executed thereunder.
Both Ecopetrol S.A. and Schlumberger Surenco S.A. commit to assume full responsibility for damages and/or losses suffered by their respective personnel and goods in development of the contract, regardless of the cause. The maximum authority is the Management Committee.
The contract had an initial term of 10 years, and was amended several times to include an additional term of six years for which a new business was structured.
The National Hydrocarbons Agency (ANH) and its Contracts
The National Hydrocarbon Agency was created by Decree Law 1760 of 2003 and was given the authority to administer all national hydrocarbon reserves under contracts executed beginning on January 1, 2004 (Decree Law 1760 of 2003 states, “The Empresa Colombiana de Petróleos, Ecopetrol, is split, its organic structure is modified, and the Agencia Nacional de Hidrocarburos and the Sociedad Promotora de Energía de Colombia S.A. are created”). Prior to January 1, 2004, Ecopetrol S.A. had the authority to contract with third parties for the exploration and production of new areas. The creation of the ANH did not modify the rights or obligations of Ecopetrol or other parties with respect to contracts in existence at the time when ANH was created.
Below, we include a brief description of each type of contract that we have entered into with the ANH:
| 37 |
Technical Evaluation Contract (TEA)
This type of contract grants to the contractor the right to develop technical evaluation operations with operational autonomy at its own cost and risk, seeking to appraise the hydrocarbon potential, with the purpose of identifying the zones of prospective interest in the area by means of the execution of an exploratory program. The contractor has the option to request the conversion of a TEA into one or more E&P Contracts that cover the area of the TEA (or a portion thereof).
The contractor can conduct evaluation activities for terms that vary between 18, 24 and 36 months, depending on the terms of reference of the ANH’s bidding round.
E&P Contract
The ANH enters into concession contracts pursuant to which the Nation grants exploration and production rights, and receives royalties and taxes. In turn, the contractor provides 100% of the investment and expenses resources, and receives 100% of the production after royalties and taxes. The ANH has named this contract an “Exploration and Production Contract” (E&P Contract).
Pursuant to the first contractual model, the ANH only received a percentage of oil revenues in two cases: (i) when the international oil prices rose beyond a specified price, above which the ANH has a right to participate in a share of the increased revenues generated, or (ii) in the case of recognition of production rights in an extended contractual phase.
Under all E&P contracts executed since ANH’s 2008 bidding round, the ANH receives a percentage of the production from the beginning of the contract, and not only in the extension phase of the contract as mentioned in the previous paragraph, in addition to economic rights when the price of oil exceeds a reference price set in the contract (high price fee) and the superficiary canon.
E&P contracts have two phases: an exploration period, which term is six years counted from the Effective Date, renewable for two additional years, and a production period, which is, with respect to each production field, 24 years plus any extensions, which are counted from the date of Declaration of Commerciality of the corresponding field. The above-mentioned terms have been modified during ANH´s 2014 bidding round for unconventional and offshore reservoirs to an exploration period of nine years and a 30 years exploration period.
ANH and Ecopetrol Agreements (Convenios)
At the time of termination or extension of any association contract (executed by Ecopetrol S.A. before December 31, 2003), the rights over the production area and over the movable and immovable assets therein will continue to belong to Ecopetrol S.A. Pursuant to article 2 of Decree 2288 of 2004, which regulates Decree Law 1760 of 2003, Ecopetrol S.A. must execute an agreement with the ANH to regulate the exploration and exploitation terms and conditions of the relevant area, previously subject to an association contract.
Decree 2288 of 2004 also established that Ecopetrol S.A. would have to execute agreements with ANH covering fields directly operated by Ecopetrol S.A. Under these agreements ANH recognizes the exclusive right of Ecopetrol S.A to explore and exploit the hydrocarbons property of the Nation that are obtained in the areas they cover, until resource depletion or until Ecopetrol S.A. returns the area to the Nation through the ANH.
These agreements also provide the conditions under which Ecopetrol S.A. is able to assign, partially or completely, its rights and duties thereunder to third parties.
| 3.5. | Transportation and Logistics |
| 3.5.1 | Open Access Business Model |
In October 2012, Ecopetrol transferred its direct interests in Ocensa, ODC, Oleoducto Bicentenario, ODL and Serviport to Cenit. On April 1, 2013, Ecopetrol S.A. transferred its hydrocarbon transport and logistics assets (crude oil and multiproduct pipelines and loading and unloading facilities) to Cenit, and Cenit started its operations as owner of the transportation and logistics infrastructure. On January 1, 2014 Ecopetrol transferred is port concessions and assets to Cenit.
| 38 |
The purpose of Cenit is to serve the strategic transportation and logistical needs of the country’s oil and refined products industry. Furthermore, it is designed to strengthen and expand the network with high standards of industrial safety, reliability and contribute to the environmental preservation.
This decision is a step forward in the growth of the industry, as well as a signal of clear rules to the market, by separating Ecopetrol’s role as owner, planner, operator and user of transport systems. Cenit operates with an open model in which all interested parties have the possibility of accessing crude oil transportation capacity in Colombia.
Cenit contracts capacity for its pipelines to third parties and oversees and manages transportation infrastructure projects. Cenit also takes the lead in finding and exploiting profitable transportation and logistics opportunities. Cenit’s responsibilities will focus on commercial management, system planning and development, new businesses, and third-party liability.
On April 1, 2013, Ecopetrol S.A. entered into a number of contracts with Cenit establishing their ongoing relationship. Pursuant to transportation and service agreements, Cenit provides Ecopetrol S.A. for a term of 30 years with hydrocarbon and refined products transportation, storage, loading and unloading and logistics services through the transportation assets transferred to it as an in-kind capitalization. Ecopetrol S.A. also entered into an operation and maintenance agreement with Cenit pursuant to which Ecopetrol S.A. is in charge of the operation and maintenance of the transportation assets for a term of 15 years. In return, Cenit will pay Ecopetrol S.A. a variable monthly payment for the services rendered. The companies also entered into a project management agreement, pursuant to which Ecopetrol S.A. provides project management services on market terms to Cenit for a term of 15 years.
In December 2014, Ecopetrol S.A. received authorization from the superintendence of ports to merge its wholly owned subsidiary EPI into Cenit. This merger action was completed on December 19, 2014, adding Ps$1 billion in assets to Cenit. As a result, Cenit is now a direct wholly owned subsidiary of Ecopetrol S.A.
| 3.5.1.1 | Transportation Activities |
The transportation and logistics segment includes the transportation of crude oil, motor fuels, fuel oil and other refined products including diesel and biofuels. We conduct most of these activities through our wholly-owned subsidiary Cenit and Cenit’s subsidiaries.
The map below shows the locations of the main transportation networks owned by our business partners and us.
| 39 |
Transportation Infrastructure
Map of Pipelines

Map of Multiproduct Pipeline
| 40 |
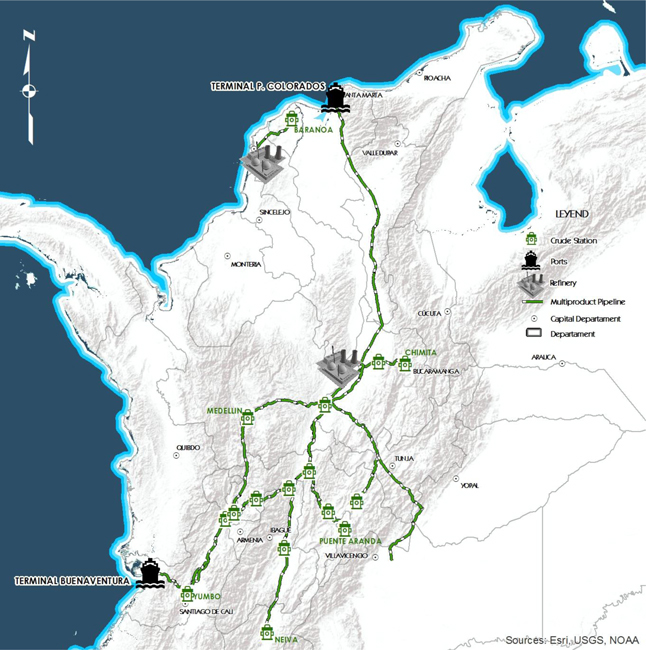
The table below sets forth the volumes of crude oil and refined products transported through the crude oil pipelines and multipurpose pipelines owned by us.
| For the year ended December 31, | ||||||||||||
| 2014 | 2013 | 2012 | ||||||||||
| (thousand bpd) | ||||||||||||
| Crude oil transport(1) | 954 | 950 | 918 | |||||||||
| Refined products transport(2) | 251 | 237 | 234 | |||||||||
| Total | 1,205 | 1,188 | 1,152 | |||||||||
| (1) | The crude oil transported volumes correspond to the following systems: Ocensa Segment 3, ODC, Vasconia-Galan, Ayacucho-Galan, Ayacucho-Coveñas and Trasandino Pipeline. |
| 41 |
| (2) | The pipelines transporting refined products include the following: Galan-Sebastopol, Galan-Salgar, Galan-Bucaramanga, Buenaventura-Yumbo and Cartagena-Baranoa. |
The volume of crude transported by the main Cenit systems and those of affiliates increased in 2014 by 0.41% compared to the previous year. This was mainly the result of higher volumes transported in the Caño Limón - Coveñas and Oleoducto Transandino systems due to the decline in the number of attacks. Of the total volume of crude transported by oil pipeline, approximately 85% was Ecopetrol’s own product. The volume of refined products transported by Cenit increased by 5.81% in 2014 mainly due to the larger volume of naphtha (heavy crude diluent) transported in the Pozos Colorados – Galán and Galán – Apiay systems. Of the total volume of products transported in pipelines during the year, 49.6% belonged to Ecopetrol.
Transportation Capacity
During 2014, we increased capacity in our primary and secondary oil pipelines and loading facilities due to several projects carried out by Cenit and its subsidiaries. Our main crude oil pipeline systems’ operating capacity increased from 1,268,000 bpd in 2013 to 1,328,000 bpd in 2014.
Our main refined products pipeline systems increased from 322,500 bpd in 2013 to 351,700 bpd in 2014. This increase corresponds to an increase in the transportation capacity of the pipelines that belong to Cenit and its subsidiaries which transport crude oil volumes to the ports or the Barrancabermeja refinery. Besides those main transportation systems, we have other feeder systems that transport volumes from producing facilities or other pumping stations to those main pipelines. The refined products transportation capacity refers to those pipelines that initiate in the Galan station of the Barrancabermeja and Cartagena Refinery.
The foregoing increase in capacity was primarily the result of the completion in 2014 of the Ocensa Delta 35 expansion project and the progress in the Vasconia-Galan project. Regarding refined products, the higher capacity is explained by the expansion in the Galan-Sebastopol system.
References to our crude oil transportation capacity in this Annual Report refer to the capacity of the pipelines that belong to Cenit and its subsidiaries that transport crude oil volumes either to the Barrancabermeja refinery or to our export facilities. (In addition to those main transportation systems, we have other systems that transport volumes from producing facilities or other pumping stations to these main pipelines.) References to our refined products transportation capacity refer to the capacity of pipelines that begin in the Galan and Cartagena station (Barrancabermeja and Cartagena Refineries).
| 3.5.1.2 | Pipelines |
As of December 31, 2014, we, directly or indirectly with private sector participants, owned, operated and maintained an extensive network of crude oil and refined products pipelines connecting our own and third-party production centers and terminals to refineries, major distribution points and export facilities in Colombia. Cenit directly owns 46% of the total crude oil pipeline shipping capacity in Colombia. When aggregated with the crude oil pipelines in which Cenit owns an interest, Cenit owns 79% of the oil pipeline shipping capacity in Colombia. By December 31, 2014, our network of crude oil and multi-purpose pipelines was approximately 8,986 kilometers in length. The transportation network consists of approximately 5,269 kilometers of main crude oil pipeline networks connecting various fields to the Barrancabermeja refinery and Reficar, as well as to export facilities. We also own 3,717 kilometers of multi-purpose pipelines for transportation of refined products from the Barrancabermeja refinery and from Reficar to wholesale distribution points.
Out of the 5,269 kilometers of crude oil pipelines owned by us 3,029 kilometers of crude oil pipeline are wholly owned and 2,240 kilometers of crude oil pipeline is owned through non-wholly owned subsidiaries.
| 42 |
The following table sets forth our main pipelines in which we own an indirect interest as of December 31, 2014.
| Pipeline | Kilometers | Capacity (kbpd) | Product Transported | Origin | Destination | Indirect Ownership Percentage | ||||||||||||
| Caño Limón-Coveñas | 771 | 250 | Crude Oil | Caño Limón | Coveñas | 100.00 | % | |||||||||||
| Oleoducto de Alto Magdalena (OAM) | 397 | 110 | Crude Oil | Tenay | Vasconia | 87.29 | % | |||||||||||
| Oleoducto de Colombia (ODC) | 480 | 236 | Crude Oil | Vasconia | Coveñas | 73.00 | % | |||||||||||
| Oleoducto Central (Ocensa Segment 2) | 836 | 616 | Crude Oil | Cupiagua | Coveñas | 72.65 | % | |||||||||||
| Oleoducto de los Llanos (ODL) | 262 | 340 | Crude Oil | East fields | Monterrey Cusiana | 65.00 | % | |||||||||||
| Oleoducto Bicentenario de Colombia S.A.S | 230 | 110 | (1) | Crude Oil | Araguaney | Banadia | 55.97 | % | ||||||||||
| (1) | Represents the contractual crude oil transportation capacity for the project currently in operation. |
As of December 31, 2014, we owned 72 stations—32 located in crude oil pipelines, 30 in refined products pipelines, six in supply plants, two in crude oil ports and two in refined product ports. As of December 31, 2014, we had a nominal storage capacity associated with the transportation network of 16 million barrels of crude oil and 4 million barrels of refined products. We also sell storage capacity to third parties in our Pozos Colorados, Tocancipa and Mansilla facilities and in the Coveñas port. We do not own any tankers.
Pipeline Projects
SAN FERNANDO – MONTERREY
The San Fernando – Monterrey project’s objectives include ensuring the ability to transport 390,000 bpd of diluted crude oil from the Chichimene and Castilla fields to the Monterrey pumping station, the reversion of the Monterrey – Araguaney pipeline to transport 53,000 bpd of crude oil and the transportation of 85,000 bpd of diluent (naptha) between the Apiay station and the Castilla and Chichimene fields.
The scope of the project includes the construction of a new 30” 171 km crude oil pipeline, a receipt, storage and pumping station, and the reversion/conversion of the existing pipeline of 16” between Castilla II – Apiay in order to transport diluent (naptha) from the Apiay to the Castilla II plant.
In 2014, we finished a loop increasing the capacity between Apiay and Monterrey by 40,000 bpd and signed the construction contract for the remaining activities of the project.
COSTA NORTE COLOMBIANA – GALÁN
The Costa Norte – Galán project’s objective is to increase the transportation capacity to 160,000 bpd in the Pozos – Galán system for the transportation of imported naptha of up to 100,000 bpd and refined products (motor fuels and oils and gasoline) of up to 60,000 bpd.
The scope of the first module of the project, designed to increase capacity by 130,000 bpd, involves the construction of new infrastructure and optimization of the existing infrastructure from Pozos Colorados to Galán; the main effort is the installation of new pumping units in the Pozos Colorados and Copey stations. The second module, designed to increase capacity by 30,000 bpd, includes the construction of two storage tanks in Pozos Colorados. During 2014, we completed our detailed engineering work and began construction of the first module.
| 43 |
MAGDALENA MEDIO 100
The Magdalena Medio 100 project’s main objectives include increasing the storage capacity in the Coveñas – CENIT terminal to 610,000 barrels and the transportation capacity of crude oil in the Ayacucho – Coveñas 16” system pipeline to 100,000 bpd. During 2014, we completed our detailed engineering work and additional activities required to finalize the project by 2016.
OCENSA (P135)
The OCENSA P135 project has as its main objective increasing the pipeline transportation capacity by 135,000 bpd starting in the first semester of 2016. The project involves improving the pumping system and increasing the storage capacity. During 2014, we began the project’s construction.
OLEODUCTO AL PACIFICO SAS
Cenit is participating in the Oleoducto al Pacífico SAS, led by Enbridge, which will transport heavy crude oil to the eastern market. In 2014, the scope of work was focused on reviewing the business case for the development of the project, conducting advance prior consultations with communities along the rights of way, negotiating project governance matters and reviewing regulatory, commercial and technical issues.
| 3.5.1.3 | Export and Import Facilities |
We currently have concessions granted by the Nation for four export/import docks for crude oil and refined products: Coveñas, Tumaco, Pozos Colorados and Buenaventura. Our export capacity reached 1.14 million bpd for crude oil. Our import capacity reached 0.13 million bpd.
Our crude oil loading facilities can load tankers of up to 350,000 deadweight tonnage, or DWT. Adjacent to these loading facilities we also have crude oil storage facilities that are capable of storing 7.7 million barrels. Our docks used for import and export of refined products can load tankers of 85 thousand DWT. Additionally, these facilities have storage capacity of up to 1.2 million barrels.
| 3.5.2 | Other Transportation Facilities |
We have entered into transportation agreements with tanker-truck and barge companies in order to transport crude oil from locations that do not have pipeline connections to refineries and export facilities. The volume of refined products that cannot be transported in pipelines or in tanker trucks because of capacity limitation is transported by barges. During 2014, 33.5 million barrels of crude oil and refined products were transported by tanker trucks and 7.9 million barrels of crude oil and refined products were transported by barges.
| 3.5.3 | Vice-Presidency of Transportation and Logistics |
Ecopetrol S.A., through its Vice-Presidency of Transportation and Logistics, operates Cenit’s pipelines pursuant to a contract with Cenit. The Vice-Presidency focuses on maintaining the integrity of the transportation infrastructure by improving our operational risk model for transportation infrastructure with respect to weather conditions and damage caused by third parties, as well as deploying new technologies to monitor transportation infrastructure and its environment and to permit intervention in portions of the infrastructure where it is susceptible to incidents that could have severe consequences.
The Vice-Presidency now comprises four main areas: Operations and Maintenance, Comprehensive Transportation and Logistics Solutions, Asset Management, and Commercial and Customer Service. All of these areas aim to accomplish their obligations to their customers: Cenit, ODL, ODC, Ocensa and Oleoducto Bicentenario de Colombia.
| 44 |
During 2014, we met our customer satisfaction index goal, and we maintained our ISO 9001:2008, ISO 14001 and OHSAS 18001 certifications for all of our transportation processes. We also attained the certification by the Oil Companies International Marine Forum (OCIMF), which provides standards for hydrocarbons reception, storage, dispatch by pipes and pipelines and the import and export facilities of our ports.
| 3.5.4 | Marketing of Transportation Services |
Cenit’s main line of business are crude oil pipeline transport (39% of Cenit’s revenues), refined products pipeline transport (50% of Cenit’s revenues) and ports and related services (10% of Cenit’s revenues).
Transportation contracts of crude oil may take several forms: ship or pay (payment for the availability of a fixed capacity in the system), ship and pay (payment for volumes actually transported) or spot. The main clients for the crude oil transportation business are Ecopetrol S.A., Pacific Rubiales Energy, Occidental de Colombia, Mansarovar and Grantierra, who collectively represented 95% of this business segment’s revenues in 2014. Transportation services for crude oil provided to Ecopetrol S.A. represented 75% of Cenit’s crude oil transport revenues.
Cenit also transports refined products. The main client for this service include Ecopetrol S.A., which accounted for 36% of refined products pipeline transport revenues in 2014, principally due to the transport of naphtha. Cenit also has 15 other fuel wholesaler customers for whom it transports other refined products. Wholesalers representing most of the volume are Organizacion Terpel, ExxonMobil, Chevron Petroleum Company, Biocombustibles and Petrobras Colombia. We currently have no written contracts in place with these wholesalers, though the CREG is currently defining the framework for the implementation of such contracts. Contract types for naphtha transportation are ship or pay and ship and pay.
Cenit transports LPG for 13 clients, under written contracts. LPG transport represents 1% of Cenit´s revenue.
Deregulated businesses such as ports and crude loading facilities represent a smaller portion of Cenit’s revenue (10% in 2014). Clients for these businesses include some of the same parties for which Cenit provides crude oil and refined products transportation services.
Cenit was launched in April 2013 with a commitment to introduce transparency, equal and open access as well as to increase the focus on customer service in the hydrocarbon transportation business. In line with this commitment, Cenit undertook initiatives to better understand customer needs, including personal interviews, quarterly client meetings and an annual satisfaction tracker. The findings of these approaches are the basis of Cenit’s customer service model currently being implemented.
| 3.6. | Refining and Petrochemicals |
| 3.6.1 | Refining |
Our main refineries are the Barrancabermeja refinery, which Ecopetrol S.A. directly owns and operates, and a refinery in the Free Trade Zone in Cartagena that is operated by Reficar S.A., a wholly owned subsidiary of Ecopetrol S.A. Ecopetrol S.A. also owns and operates two other minor refineries—Orito and Apiay. Our refineries produce a full range of refined products, including gasoline, diesel, jet fuel, liquefied petroleum gas (LPG), and heavy fuel oils, among others.
The following table sets forth our daily average installed and actual refinery capacity for each of the last three years:
| 45 |
| For the year ended December 31, | ||||||||||||||||||||||||||||||||||||
| 2014 | 2013 | 2012 | ||||||||||||||||||||||||||||||||||
| Capacity | Through -put | % Use | Capacity | Through -put | % Use | Capacity | Through -put | % Use | ||||||||||||||||||||||||||||
| (bpd) | (bpd) | (bpd) | (bpd) | (bpd) | (bpd) | |||||||||||||||||||||||||||||||
| Barrancabermeja | 250,000 | 226,900 | 91 | % | 250,000 | 214,845 | 86 | % | 250,000 | 219,385 | 88 | % | ||||||||||||||||||||||||
| Reficar* | 80,000 | 10,420 | 13 | % | 80,000 | 66,314 | 83 | % | 80,000 | 74,545 | 93 | % | ||||||||||||||||||||||||
| Apiay | 2,500 | 1,380 | 55 | % | 2,500 | 1,303 | 52 | % | 2,500 | 1,617 | 65 | % | ||||||||||||||||||||||||
| Orito | 2,500 | 1,784 | 71 | % | 2,500 | 900 | 36 | % | 2,500 | 793 | 32 | % | ||||||||||||||||||||||||
| Total | 335,000 | 240,484 | 72 | % | 335,000 | 283,362 | 85 | % | 335,000 | 296,340 | 88 | % | ||||||||||||||||||||||||
Note: Apiay and Orito are considered to be part of the exploration and production segment, not the refining segment, and the majority of products produced by them are used by us (self-consumption).
*Reficar operations were shut down starting in March 2014 and are scheduled to resume upon the completion of the expansion and modernization plan at the Cartagena refinery.
| 3.6.1.1 | Barrancabermeja |
At Barrancabermeja, we produce a variety of fuels, such as regular and premium unleaded gasoline, diesel fuel, kerosene, jet fuel, aviation fuel, LPG, fuel oil and sulfur. We also produce petrochemicals and industrial products, including paraffin waxes, lube base oils, low-density polyethylene, aromatics, asphalts, alkylates, cyclohexane and aliphatic solvents, as well as refinery grade propylene. The Barrancabermeja refinery supplies approximately 72.5% of the fuels consumed in Colombia.
The following table sets forth the production of refined products of Barrancabermeja for the periods indicated.
| For the year ended December 31, | ||||||||||||
| 2014 | 2013 | 2012 | ||||||||||
| (bpd) | ||||||||||||
| LPG, Propylene and Butane | 13,834 | 13,572 | 14,546 | |||||||||
| Gasoline Fuels and Naphtha | 68,914 | 67,592 | 71,552 | |||||||||
| Diesel | 44,273 | 45,179 | 52,486 | |||||||||
| Jet Fuel and Kerosene | 23,227 | 19,546 | 19,043 | |||||||||
| Fuel Oil | 66,928 | 58,852 | 51,618 | |||||||||
| Lube Base Oils and Waxes | 1,103 | 1,468 | 2,011 | |||||||||
| Aromatics and Solvents | 2,640 | 2,632 | 2,953 | |||||||||
| Asphalts and Aromatic Tar | 7,501 | 6,174 | 5,892 | |||||||||
| Polyethylene, Sulfur and Sulfuric Acid | 1,094 | 1,118 | 1,149 | |||||||||
| Total | 229,515 | 216,133 | 221,250 | (1) | ||||||||
| Difference between Inventory of Intermediate Products | -640 | 538 | 208 | (1) | ||||||||
| Total Production | 228,875 | 216,671 | 221,458 | (1) | ||||||||
| (1) | Amounts adjusted upwards based on updated measurements. |
The gross refining margin increased from $10.9 per barrel in 2013 to $14.6 per barrel in 2014, mainly due to the decrease on the average price of the crude purchased in the Barrancabermeja Refinery of $12.2 per barrel from 2013 to 2014, while the price of the refined products only decreased $8.6 per barrel.
The average conversion ratio for Barrancabermeja was 71.4% in 2014 and 72.5% in 2013. This decrease in the conversion ratio was primarily caused by less feed to visbreaking units, and as a consequence, a higher yield of fuel oil and a lower conversion to diesel.
| 46 |
We are currently evaluating the potential implementation of a modernization process to convert Barrancabermeja into a deep-conversion refinery, which would allow it to process more extra-heavy and heavy crudes produced at local fields and increase production of mid-distillates for the local market. After the completion of the Reficar project, described below, and, if the Barrancabermeja project is undertaken, we would expect to be able to supply the entire Colombian market without the need for imports of refined products.
During 2014, Barrancabermeja Refinery delivered 70.8 mboepd of low sulfur gasoline (less than 300 parts per million sulfur content) and 84.3 mboepd of low sulfur diesel (less than 50 parts per million sulfur content) to meet existing fuel quality standards while satisfying rising domestic demand. In order to achieve this, in 2014 we increased imports of ultra-low sulfur diesel by 1.8 mboepd over the 2013 level.
Natural gas from the Ballena terminal located in the La Guajira fields is transported to Barrancabermeja pursuant to a natural gas transportation agreement entered into on October 1, 2008, between Ecopetrol and TGI for the transportation of 116,500 thousand cfpd from December 1, 2012 to December 31, 2020. Pursuant to the terms of the agreement, we pay to TGI a regulated transportation tariff composed of a fixed fee, variable fee depending on transported volumes and an administration, operation and maintenance fee. Payments for transported volume are quoted in US dollars and settled in Pesos. During 2014, we paid Ps$119 billion to TGI under the agreement.
| 3.6.1.2 | Reficar |
The following table sets forth the production of refined products of Reficar for the periods indicated.
For the year ended December 31,(1) | ||||||||||||
| 2014 | 2013 | 2012 | ||||||||||
| (bpd) | ||||||||||||
| LPG, Propylene and Butane | 0 | 3,264 | 3,447 | |||||||||
| Motor Fuels | 1,997 | 19,679 | 21,602 | |||||||||
| Diesel | 2,254 | 15,669 | 17,982 | |||||||||
| Jet Fuel and Kerosene | 812 | 6,090 | 6,776 | |||||||||
| Fuel Oil | 3,352 | 15,468 | 18,110 | |||||||||
| Aromatic Tar | 0 | 691 | 729 | |||||||||
| Other Products | 0 | 27 | 29 | |||||||||
| Total | 8,415 | 60,888 | 68,676 | |||||||||
| Difference between Inventory of Intermediate Products | 1,896 | 6,613 | 6,521 | |||||||||
| Total Production | 10,311 | 67,502 | 75,197 | |||||||||
(1) | The table shows the entire production of Reficar. The refinery was shutdown in March 2014 and is expected to resume operation during the second semester of 2015 |
During 2014, Reficar’s production decreased to 10.3 thousand bpd, from 67.5 thousand bpd in 2013, primarily due to its scheduled shutdown in March 2014. The shutdown was necessary in order to move forward with the expansion project requirements and to allow completion of the expansion project. The refinery remained shut down for the rest of 2014 and is expected to resume operations during the second half of 2015. Reficar is currently evaluating the viability of integrating former assets along with the new refinery.
The following tables set forth the imports and sales of refined products of Reficar for the periods indicated.
| 47 |
| Imports | For the year ended December 31, | |||||||||||
| 2014 | 2013 | 2012 | ||||||||||
| (bpd) | ||||||||||||
| Motor Fuels | 11.460 | 5,742 | 6.323 | |||||||||
| Diesel | 18,334 | 17,490 | 16,764 | |||||||||
| Jet Fuel and Kerosene | 3.419 | 0 | 0 | |||||||||
| Total Imports | 33,212 | 23,232 | 23,087 | |||||||||
| Sales | For the year ended December 31, | |||||||||||
| 2014 | 2013 | 2012 | ||||||||||
| (bpd) | ||||||||||||
| Motor Fuels | 14,154 | 21,561 | 24,020 | |||||||||
| Diesel | 21,942 | 34,548 | 35,651 | |||||||||
| Jet Fuel and Kerosene | 3,681 | 5,468 | 6,079 | |||||||||
| Fuel Oil | 4,335 | 15,014 | 18,181 | |||||||||
| Other Products | 2,194 | 11,448 | 10,170 | |||||||||
| Total Sales | 46,305 | 88,039 | 94,101 | |||||||||
During 2014 Reficar increased imports due to the Crude Distillation Unit (CDU) shutdown; the imports made were to cover the North Coast sales demand. Due to the CDU , Visbreaking and Cracking units’ shutdown, lower sales were made during 2014; only the North Coast local demand was fulfilled and therefore lower exports were made during the year.
As part of our expansion and modernization plan, we expect to increase the competitiveness and profitability of Reficar through the modernization of its facilities and processes, and the improvement of its reliability. We currently expect to complete the modernization process and resume operations during the second half of 2015. Once completed, the refinery’s nominal production capacity is expected to be 165 thousand bpd. We expect to improve refining margins by processing lower cost heavy crude oils, raising the conversion ratio, and producing a higher quality slate of products. We also expect to reduce the sulfur content in gasoline and diesel fuel, thus complying with current national and international fuel standards without the need to blend imported Ultra Low Sulfur Diesel.
On December 30, 2011, with the previous approval from the Ministry of Finance, Reficar executed a US$3.5 billion project finance to partially fund the expansion and modernization of the refinery in Cartagena, loans with tenors of 14 and 16 years for Commercial Banks and Export Credit Agency Facilities, respectively. As of December 2014, Reficar had drawn US$3,497 million under the finance agreements, and paid US$ 241 million in debt service.
As part of the project finance structure, Ecopetrol S.A. entered into a Construction Support Agreement and a Debt Service Guarantee Agreement to support certain obligations of Reficar. Pursuant to the terms of the Construction Support Agreement, Ecopetrol S.A. agrees to support up to the completion date, any additional costs, expenses or delays incurred during the construction phase of the expansion and modernization of the refinery in Cartagena.
During 2014, the requested amount by Reficar under the Construction Support Agreement was US$1,354 million. The requested amount for 2014 was contributed by means of capital injections and by a subordinated loan from Ecopetrol Capital AG. Any increase in the project’s capital expenditures is expected to be funded under the Construction Support Agreement between Reficar and Ecopetrol S.A.
The funds requested under the Construction Support Agreement for the project during 2014, were funded as follows: (i) US$590 million from a share capitalization process carried out by its main shareholders Ecopetrol S.A. and Andean Chemicals Ltda. and (ii) US$764 million by means of a subordinated loan from Ecopetrol Capital AG.
| 48 |
By means of the Debt Service Guarantee Agreement, Ecopetrol S.A. provides a liquidity mechanism, allowing Reficar to pay its debt service in the situations in which there are liquidity shortfalls, as well as being a mechanism to exit the project finance by transferring its debt to Ecopetrol S.A.
During 2014, the requested amount by Reficar under the Debt Service Guarantee Agreement was US$ 241 million. This was contributed by means of a subordinated loan from Ecopetrol Capital AG for a maximum amount of USD 249 million.
| 3.6.2 | Petrochemicals and Other Products |
We own and operate four petrochemical plants and one paraffin and lube plant located within Barrancabermeja. In 2014, we produced 31,051 tons per year of low-density polyethylene, a decrease of 11.7% compared to the production of 35,184 tons per year in 2013. This decrease was due primarily to a main turnaround in the cracking and Ethylene units and as a consequence, less feed to the petrochemical and paraffin units. We produced 676.7 mboepd of aromatics (benzene, toluene, xylene, orthoxylene, heavy aromatics and cyclohexane), a 2.6% increase as compared with the production of 659.7 thousand barrels of aromatics in 2013. The growth was mainly caused by an increase in toluene production instead of cyclohexane.
| 3.6.2.1 | Propilco |
During 2014, Propilco’s production totaled 390 thousand tons of petrochemical products, a 1.5% decrease compared to the 396 thousand tons produced in 2013. The total contribution margin in 2014 (including the contribution of polypropylene, polyethylene and masterbatches) was 11% higher than in 2013, an increase from US$215 per ton in 2013 to US$239 per ton in 2014. The increase in contribution margin was primarily due to the execution of a new commercial strategy focused on differentiation and value-added products and services.
For the year ended December 31,(2) | ||||||||||||
| 2014 | 2013 | 2012 | ||||||||||
| (Metric Tons) | ||||||||||||
| Average capacity | 475,000 | 475,000 | 475,000 | |||||||||
| Throughput | 389,604 | 395,869 | 408,933 | |||||||||
| % Use | 82 | % | 83 | % | 86 | % | ||||||
| (1) | This margin includes the total contribution of polypropylene, polyethylene and masterbatches. In our 2013 Annual Report on Form 20-F, the margin included the contribution of polypropylene and splitter (US$212 in 2013 and US$265 in 2014). |
| (2) | The current figures have been revised from those presented in our 2013 Annual Report on Form 20-F version in order to reflect the same information the company reports on the financial statements, which only includes produced, packed and stored polypropylene. |
| 3.6.3 | Marketing and Supply of Refined Products |
We market a full range of refined and feed-stock products locally including regular and high octane gasoline, diesel fuel, jet fuel, natural gas and petrochemical products, among others.
Local sales of regular gasoline, LPG, jet fuel and diesel fuel are subject to government price regulation with reference to international benchmarks. We are the main producer and supplier of refined products in Colombia.
The CREG (Energy and Gas Regulatory Commission, for its acronym in Spanish), has the responsibility of setting forth regulation related to chain liquid fuels. This function was performed by the Ministry of Mines and Energy.
| 49 |
The responsibilities assigned to the CREG are:
| · | Setting the prices of petroleum products along the entire chain of production and distribution (except for regular gasoline, diesel and biofuels, the retail prices for which are set by the Ministry of Mines and Energy). |
| · | Regulating the activities of refining, importation, storage, distribution and transportation of liquid fuels derived from petroleum. |
| · | Regulate tariffs in pesos per kilometer or per gallon for transportation through the fuel pipeline system. |
| · | Regulating LPG, including LPG prices. |
| 3.7. | Research and Development; Intellectual Property |
Our Vice-Presidency of Technology and Innovation was created to add value to our business chain through innovation, technology, knowledge and the development of competitive advantage. The Vice-Presidency of Technology oversees three directorates: The Colombian Petroleum Institute, the Directorate of Information Technology and the new Strategic Directorate of Knowledge, Innovation and Technology.
Our research and development activities are conducted by the Colombian Petroleum Institute. Its activities are focused on developing technology solutions for us and the Colombian oil industry. Its scope covers our entire value chain: exploration, production, refining, transportation, supply and marketing, as well as environmental issues, integrity and automatization. Each year, we present to the Colombian Institute for the Development of Science and Technology (Instituto Colombiano para el Desarrollo de la Ciencia y la Tecnología, or COLCIENCIAS) our research and development projects in order to get a certification for our investment in science and technology. In 2014, COLCIENCIAS recognized investments of US$111 million, in science and technology projects. Our total investment in innovation and technology during 2014 was approximately US$156 million.
Our intellectual capital is preserved through a technological value-generation process and an intellectual property protection process, which includes the consolidation of trade secrets, patents, copyrights, trademarks and publications in specialized journals. In the last eight years, we have filed 162 new patent applications including 13 in 2014 for technologies related to equipment and processes for the preparation of emulsions in oil fields, surfactant formulations for enhanced oil recovery, performance analysis of artificial lifting systems, virtual method of flow measuring and water cuts in oil wells with electric submersible pumps, portable modular anchorages underground and decanting valves, among others.
We currently hold 64 patents in Colombia, the United States, China, Mexico, Russia, Peru, Venezuela, Ecuador, Brazil, Nigeria, Korea and Indonesia. In 2014, we were granted 13 new patents. In 2014, we were granted 180 copyrights. We also keep 33 trademarks, including our first slogan, “Clean Barrels.”
In 2014 eleven technological products developed by Ecopetrol were licensed to ten national and international companies for marketing and after-sales support. Technological products have been tested and used successfully in the organization and solve problems related to refining, production and transportation of hydrocarbons, and some have potential uses in other industries
| 50 |
| 3.8. | Applicable Laws and Regulations |
| 3.8.1 | Principal Regulatory Bodies |
The main authorities that regulate our activities in Colombia are: the Ministry of Mines and Energy, the National Hydrocarbons Agency (ANH), the Energy and Gas Regulatory Commission (CREG), the Ministry of Environment and Sustainable Development, and the National Authority on Environmental Licensing (ANLA).
Ministry of Mines and Energy
The Ministry of Mines and Energy is responsible for managing and regulating Colombia’s non-renewable natural resources, ensuring their optimal use by defining and adopting national policies regarding exploration, production, transportation, refining, distribution and export of minerals and hydrocarbons.
National Hydrocarbons Agency – ANH
The ANH’s purpose is to manage the hydrocarbon reserves owned by the Nation through the design, promotion and negotiation of the exploration and production agreements in areas where hydrocarbons may be found that are not subject to joint ventures executed before December 31, 2003 and still in force, that are directly operated by Ecopetrol S.A.
The ANH is also responsible for creating and maintaining attractive conditions for investments in the hydrocarbon sector and for designing bidding rounds for exploration blocks. Furthermore, the ANH is responsible for managing all the royalties paid by oil and gas producers in Colombia.
The role of the ANH as administrator of the Nation’s hydrocarbon resources was assigned to Ecopetrol since 1974 until 2003. As part of this public function, Ecopetrol had the authority to assign areas for exploration and to execute various types of contracts with third parties, with the exception of concession contracts. As from 2003, and with the issuance of Decree Law 1760 of 2003, the public function of administration of the Nation’s hydrocarbon resources was assigned to the ANH, and Ecopetrol transferred all exploratory areas to the ANH, with certain exceptions as indicated below.
The aforementioned Decree Law provided that Ecopetrol would continue administrating Association Contracts executed by Ecopetrol with third parties before the date of entry into force of Decree Law 1760. It also provided that Ecopetrol would keep the exploration and productions rights to all areas that it was operating directly and/or subject to other service contracts or incremental production agreements different to Association Contracts. Therefore, the reform enacted in 2003 created a transitional regime by virtue of which Ecopetrol kept the administration of Association Contracts. This administration authority was confirmed by Decrees 4137 of 2011, and 714 of 2012 wherein it is clearly stated that ANH does not administrate Association Contracts.
Energy and Gas Regulatory Commission – CREG
CREG, a special administrative unit of the Ministry of Mines and Energy, is responsible for establishing the standards for the exploitation and use of energy and regulating the domestic utilities of electricity and fuel gas (liquefied petroleum gas and natural gas). CREG is also responsible for fostering the development of the energy services industry, promoting competition and responding to consumer and industry needs. It sets prices of petroleum products, except for regular motor gasoline, diesel and biofuels, along the entire chain of production and distribution; determines criteria and methodology for calculating the price of fuel; carries out the studies required for the determination and pricing of natural gas destined for use as automotive fuel and other purposes inherent in the commercialization of the same; regulates the rates in Pesos per kilometer/gallon for transportation through the pipeline system; and regulates the activities of refining, import, storage, distribution and transportation of liquid fuels derived from petroleum.
| 51 |
Ministry of Environment and Sustainable Development
The Ministry of Environment and Sustainable Development has among its main functions the issuance of public policies regarding the use and exploitation of natural resources and the regulation of national environmental laws.
The Ministry of Environment and Sustainable Development defines the procedures and guidelines that regulate the issuance of environmental licenses and permits necessary for the development of the following activities: production, exploration, extraction, transportation and refining.
National Authority on Environmental Licensing (ANLA)
The National Authority on Environmental Licensing issues environmental licenses and permits required for hydrocarbon-related activities. The ANLA is an administrative unit of the Environment Ministry, which is in charge of granting environmental licenses. Additionally, the National Authority on Environmental Licensing constantly monitors license compliance, handles complaints and grievances presented by local communities, and, has overall responsibility for regulating the procedures by which the environmental permits needed for Ecopetrol’s operation are issued and enforced. The ANLA also has power to impose preventive measures and/or sanctions to offenders of environmental laws and regulations.
ANLA has enacted regulations regarding environmental licenses as a complement to Resolution 90341 of 2014, the Ministry of Environment and Sustainable Development issued Resolution 0421 of 2014, which contains the terms of reference for the preparation of the environmental impact assessment (EIA) for oil exploration and exploitation projects. As of the first quarter of 2015, the terms of reference for the preparation of such EIAs are open for public comment and their enactment is expected by the first semester of 2015.
Other Authorities Related to Environmental Matters
Regional Autonomous Corporations
The Regional Autonomous Corporations are responsible for the administration of natural resources located within their jurisdiction and, although they do not have legal jurisdiction over issues related to the oil industry, they are responsible for granting permits for the use of certain natural resources, such as water, air and soil necessary for the development of our activities.
Ministry of Internal Affairs
The Ministry of Internal Affairs is responsible for certifying the existence of ethnic communities, such as Aboriginal, Afro Colombian and “Raizales”, a Colombian legal term that refers to the people born in the San Andrés Island archipelago. Such certification is intended to establish the presence of ethnic communities in areas in which seismic, exploration, extraction, transportation and refining activities are intended to take place. In addition, the Ministry has the ability to issue general guidelines that must be fulfilled through consultation with the relevant communities and which are necessary for the viability of any work, project or activity intended to be done in the territories of those communities.
| 3.8.2 | Regulation of Exploration and Production Activities |
| 3.8.2.1 | Business Regulation |
Pursuant to the Colombian Constitution, the Nation is the exclusive owner of all hydrocarbon resources located in Colombia and has full authority to determine the rights to be held and royalties or compensation to be paid by investors for the exploration or production of any hydrocarbon reserves. The Ministry of Mines and Energy and the ANH are the authorities responsible for regulating all activities related to the exploration and production of hydrocarbons in Colombia.
| 52 |
Decree Law 1056 of 1953 (the Petroleum Code—Código de Petróleos) declares that the hydrocarbon industry and its activities of exploration, exploitation, refinement, transportation are of public interest.
Ministry of Mines and Energy Resolution 18 1495 of 2009, as amended by Resolution 40048 of 2015, establishes a series of regulations regarding hydrocarbon exploration and production.
Ministry of Mines and Energy Resolution 18 0742 of 2012, as amended by Resolution 90341 of 2014, included a series of technical regulations for unconventional hydrocarbon resources, including the procedures for advancing the exploration and exploitation of unconventional reserves. It also provides the types of wells and their classification as well as the fulfillment of those minimum (drilling and abandoning) conditions, necessary to initiate or perform E&P activities. Furthermore, it contemplates the applicable procedure to resolve disputes between mining sector and the oil and gas sector, regarding the coexistence of their rights in some specific projects.
Agreement (Acuerdo, a type of regulation) 004 of 2012, as issued by the ANH, amends Agreement 008 of 2004 and sets forth the rules governing the award of exploration and production rights, the award of hydrocarbon exploration and exploitation areas and the execution of E&P Contracts, which can be accomplished through the following methods: open competitive process, closed competitive process and direct assignment.
Agreement 003 of 2014, as issued by the ANH, complements Agreement 004 of 2012 by setting forth the contractual framework for the carrying out of activities in unconventional reservoirs, the procurement regulations for the exploration and exploitation of unconventional fields in Colombia and the procurement process for the awarding of hydrocarbon exploration and exploitation areas.
| 3.8.2.1.1. | Environmental Licensing and Prior Consultation |
Law 99 of 1993 and other environmental regulations, such as particularly Decree 2041 of 2014, impose on companies, including oil and gas companies, the obligation to obtain an environmental license prior to undertaking any activity that may result in the serious deterioration of renewable natural resources, or that have the capacity of materially modifying the physical environment.
The National Authority on Environmental Licensing (ANLA), created by means of Decree 3573 of 2011, is the entity responsible for evaluating the applications and issuing the environmental licenses for oil & gas-related activities, as well as surveilling and overseeing all hydrocarbons projects and monitoring the environmental compliance of such activities.
If the projects or activities could have a direct impact over the territories or the interests of indigenous, Afro-Colombian or Raizal communities, the Colombian Constitution provides that the companies developing such projects or activities must undertake a consultancy process with those communities before initiating such projects or activities. This consultation procedure is a pre-requisite for obtaining the required environmental licenses.
In addition, the Colombian Constitution and laws establish that, as part of the public participation mechanisms, Colombian individuals may demand information regarding the activities of the project and their potential impacts. They may also request to undertake an environmental hearing so as to obtain information the project.
The environmental licensing process encompasses all of the necessary permits, authorizations, concessions and other control instruments necessary under Colombian environmental law to undertake a project or activity that may result in the serious deterioration of renewable natural resources, or that have the capacity of materially modifying the physical environment. The licensing process establishes specific conditions under which the beneficiary of the license may undertake such project or activity. This process begins when the company files an Environmental Impact Study (EIA) relating to the project with the ANLA. The licensing process includes an application for the use of natural renewable resources (water, soil and air), the filing of an EIA and a plan to prevent, mitigate, correct and compensate for any activity that may harm the environment, known as the Environmental Management Plan (PMA).
| 53 |
According to recently issued regulations, obtaining a license may take between 165 and 265 business days, depending on whether the authority requires the applicant to file additional information and whether it is necessary to establish a governmental committee to determine the viability of the project.
On January 1, 2015, a new environmental licensing process came into force in Colombia as a result of Decree 2041 of 2014, repealing the licensing process defined in decree 2820 of 2010. According to the new regulation currently in effect, the procedure to obtain an environmental license shall not take more than 90 business days but, depending on the complexity of the information requested by the ANLA and some administrative delays, the procedure may take longer. The new procedure incorporates an oral hearing between the ANLA and the applicant in order to evaluate the information provided in the license application and whether it is necessary to request additional information about the proposed project. The ANLA will have no other opportunities to request additional information after this hearing.
The Ministry of Environment and Sustainable Development is also responsible for establishing guidelines regarding climate change policies for the hydrocarbon sector in Colombia. We are in compliance with those guidelines. At present, the Ministry of Environment has not proposed any specific steps for the implementation of the Kyoto Protocol as it relates to our operations. We are continuously monitoring climate change requirements that could be applicable to us.
A company that does not comply with the applicable environmental laws and regulations, does not execute the Environmental Management Plan (PMA) approved by the environmental authority or ignores the requirements imposed by an environmental license may be subject to an administrative proceeding initiated by the National Authority on Environmental Licensing or the regional environmental authorities established by Law 1333 of 2009. The proceeding may result in oral or written warnings, monetary penalties, fines, license revocation or the temporary or permanent suspension of the activity being undertaken. Apart from administrative sanctions, the Colombian judiciary or other law enforcement authorities may also impose civil and even criminal sanctions if environmental damages are verified as a consequence of having breached the environmental laws and regulations applicable to the project.
| 3.8.2.1.2. | Royalties |
In Colombia, the Nation is the owner of minerals and non-renewable resources located in the subsoil, including hydrocarbons. Thus, companies engaged in exploration and production of hydrocarbons, such as Ecopetrol, must pay to the ANH, as representative of the National Government, a royalty on the production volume of each production field, as determined by the Ministry of Mines and Energy.
Royalties may be paid in kind or in cash. Each production contract has its applicable royalty arrangement in accordance with applicable law. In 1999, a modification to the royalty regime established a sliding scale for royalty payments for crude oil and natural gas production fields discovered after July 29, 1999 and depending on the quality of the crude oil produced. Since 2002, as a result of the enactment of Law 756 of 2002, the royalty rate was fixed as a sliding scale depending on the produced volume from 8% for fields producing up to 5,000 bpd to 25% for fields producing in excess of 600,000 bpd. Changes in the royalty regime only apply to new discoveries and do not apply to fields already in the production stage as of July 29, 1999. Producing fields pay royalties in accordance with the royalty law in force at the time of the discovery.
Regarding natural gas, in accordance with Resolution 877 of 2013, as amended by Resolution 640 of 2014, starting on January 1, 2014, the ANH has received royalties in cash rather than in kind. Thus, the producer may dispose of its gas production volumes corresponding to royalties paid in cash.
| 54 |
| 3.8.3 | Regulation of Transportation Activities |
Hydrocarbon transportation activity is considered a public interest activity in Colombia and a public service. As such, it is under governmental supervision and control, regulated mainly by the Ministry of Mines and Energy and the CREG.
Transportation and distribution of crude oil, liquified petroleum gas and refined products must comply with the Petroleum Code, the Code of Commerce and all governmental decrees and resolutions According to Law 681 of 2001, multipurpose pipelines owned by Ecopetrol (through Cenit) must be open to third-party use on the basis of equal access to all.
Notwithstanding the general rules for hydrocarbon transportation in Colombia, natural gas transportation is subject to regulations specific to the natural gas industry as issued by CREG, due to the categorization of natural gas distribution as a public interest activity under Colombian laws.
Transportation systems, classified as crude oil pipelines and refined product pipelines, may be owned by private parties. Pipeline construction, operation and maintenance must comply with environmental, social, technical and economic requirements under national guidelines and international standards for the oil and gas industry.
Construction of transportation systems requires licenses and local permits awarded by the Ministry of the Environment and regional environmental authorities, respectively.
Crude oil transport
The Colombian regulatory framework relating to crude oil transportation accounts for both private use and public use pipelines. Private use pipelines are those built by the operating or refining entity for its own exclusive right and that of its affiliates. Public access pipelines are defined as pipelines built and operated by a public or private legal entity, for the purpose of publicly providing crude oil transportation services. The Colombian Government has the preferential right to use up to 20% of the total capacity of any public access pipeline to transport its share of production. However, for both private and public access pipelines, the ANH must cover any tariff expenses to transport this production.
The Ministry of Mines and Energy is responsible for reviewing and approving the design and blueprints of crude oil pipelines. The Ministry establishes transport rates based on information provided by the service providers. It also oversees the calculation and payment of hydrocarbon transport-related taxes and manages the information system for the oil product distribution chain.
In 2014, the Ministry updated the transport regulation and the rate calculation method for this line of business. It introduced a framework for the secondary market and incentives for new pipeline construction and current pipeline capacity expansions. According to the Petroleum Code, rates are to be revised every four years with the next revision taking place in 2015.
The Port Superintendence is the authority that oversees the port business for crude oil and refined products. Although this business is not regulated, market participants are required to report certain information to the Port Superintendence.
As a result of the enactment of Decree 119 of 2015, operators of private use hydrocarbon ports are currently able to provide hydrocarbon transport services to third parties pursuant to a mechanism established under that decree.
| 55 |
Refined products transport
In 2014 the CREG assumed responsibility for regulating product pipeline transportation from the Ministry of Mines and Energy, in addition to its pre-existing regulatory responsibility for Liquefied Petroleum Gas, Natural Gas and Electric Energy transportation.
CREG is in the process of defining and introducing the transportation regulation and the rate calculation method for refined products. These regulations are expected to be in place in 2015 and 2016, respectively.
The Domestic Public Service Superintendence also oversees the Liquefied Petroleum Gas transportation business. Cenit reports key operational and financial indicators to it on a monthly basis.
| 3.8.4 | Regulation of Refining and Petrochemical Activities |
Article 58 of the Petroleum Code establishes that oil refining activities can be developed throughout the Colombian territory and are not reserved to the State. However, Article 4 establishes that such activities are considered public interest subject to governmental regulation, and the development of those activities must comply with technical requirements established by regulation.
In 2008, Law 1205 was issued with the main purpose of contributing to a healthier environment. It established the minimum quality specifications for fuels in Colombia. Since August 2010, Ecopetrol has been selling diesel and gasoline at its refinery in Barrancabermeja in order to produce diesel and gasoline that complies with the requirements of the aforementioned law.
The Ministry of Mines and Energy establishes the safety standards for LPG, storage equipment, maintenance and distribution of LPG. Regulations issued in 1992 established that every local, commercial and industrial facility with a storage capacity of LPG greater than 420 pounds must receive an authorization for operations from the Ministry of Mines and Energy.
| 3.8.4.1 | Regulation of Liquefied Petroleum Gas (LPG) and Liquid Fuels |
Wholesale marketing, transport, distribution and retail marketing of LPG are mainly regulated by CREG Resolution 74 of 1996, and subsequent resolutions. LPG in Colombia is primarily obtained through Ecopetrol’s refineries, field production and imports. The LPG must meet minimum quality standards to be marketed. Our wholesale marketing and transport activities are regulated by Resolutions 53 of 2011 and 92 of 2009. The LPG price is regulated by CREG Resolutions 66 of 2007 and 59 of 2008.
According to Article 212 of the Petroleum Code and Law 39 of 1987, the distribution of liquid fuels and their derivatives is considered a public utility. Consequently, individuals or entities engaged in these activities are subject to regulations issued by the Colombian government. The Government has the power to determine quality standards, measurement and control of liquid fuels, and establish penalties that may apply to dealers who do not operate in compliance therewith.
The Ministry of Mines and Energy is the entity that controls and exercises technical supervision over the distribution of liquid fuels derived from petroleum, including the refining, import, storage, transportation and distribution in the country. Law 812 of 2003 identified the agents of the supply chain of petroleum-derivated liquid fuels.
The distribution of liquid fuels, except LPG, is governed by Decree 4299 of 2005, as modified by Decrees 1333 and 1717 of 2007 and 2008, respectively, which establishes the requirements, obligations and penalties applicable to supply agents in the distribution, refining, import, storage, wholesale, transportation, retail sale and consumption of liquid fuels.
| 56 |
Decrees 283 of 1990 and 1521 of 1998, and their modifications, establish minimum technical requirements for the construction of storage plants and service stations. The Decrees also regulate the distribution of liquid fuels, establishing the minimum requirements for distributors and the activities and types of agreements permitted for these agents. The Ministry of Mines and Energy also regulates the types of liquid fuels that can be sold and purchased and the penalties for noncompliance with governmental regulations.
The distribution of fuels in areas near Colombian borders is subject to specific regulations that impose strong control procedures and requirements. Ecopetrol is not responsible for fuel distribution in these areas. That responsibility was transferred to the Ministry of Mines and Energy, pursuant to Law 1430 of 2010.
| 3.8.4.2 | Regulation Concerning Production and Prices |
Since May 2012, CREG regulates the prices for most crude oil by-products. In the case of gasoline, diesel, ACPM and biofuels, CREG determines the methodology for calculating the price of those by-products, and the Ministry of Mines and Energy establishes the relevant prices in accordance with the methodology established by CREG. The ANH determines the formula that is used to calculate royalty payments corresponding to the production of crude oil and the crude oil price reference for local refining. The methodology for calculating jet fuel prices is set out in Law 1450 of 2011, and jet fuel prices themselves are set by the Ministry of Mines and Energy.
Decree 381 of 2012 and 1617 of 2013 restructured the Ministry of Mines and Energy and gave it the responsibility to study industry problems and implement short- and long-term refining planning policies. The Ministry is also responsible for establishing the governmental policies and goals to ensure the reliability, stability and continuity for the production of liquid fuels, biofuels and others.
Pursuant to Article 58 of the Petroleum Code, any refining company operating in Colombia must provide a portion or, if needed, the total of its production to supply local demand prior to exporting any production. If local demand increases, and imported crudes are needed, the refining company may charge the State additional transportation costs in proportion to the imported crudes delivered to the refinery.
The Fuel Price Stabilization Fund (FEPC) was created by means of Law 1151 of 2007 with the aim to mitigate in the domestic market, the impact of fluctuations in fuel prices (gasoline and motor fuel oil) in international markets. As per article 101 of the Law 1450 of 2011, the funding for the operation of the FEPC come from the following sources: (a) financial returns on the funds of the FEPC; (b) extraordinary contributions from the National Treasury; and (c) revenues obtained from the negative difference between the international parity price and the reference price established by the Ministry of Mines and Energy.
Notwithstanding the above, the Constitutional Court, by means of decision C-621 of September 10, 2013 declared unconstitutional section c) of article 101 of Law 1450 of 2011. As a consequence thereof, Law 1739 of 2014 created the Participation Differential as a so-called parafiscal contribution to the FEPC, which control, management, supervision, liquidation, determination and collection is entrusted to the Ministry of Energy and Mines. The Participation Differential arises when the international parity price is lower than the reference price established by the Ministry of Mines and Energy.
FEPC is currently regulated by Decree 1880 of 2014, which sets forth the calculation method of the Differential as the product of the volume reported by the refiner and/or importer to the Ministry of Energy and Mines times the difference between the international parity price and the reference price. It also provides that refiners and importers shall submit monthly reports to the Ministry of Energy and Mines on the volume and origin of the fuel (gasoline and motor fuel oil) sold in the domestic market for said period. Based on those reports the Ministry of Energy and Mines shall calculate and liquidate the Differential between the regulated price set and the import parity price (the “Net Position”) every six months by issuing a resolution provided, however, that such Net Position results from the sum of the Differentials for the relevant semester. Decree 1880 of 2014 also provides that the FEPC shall pay in pesos the value corresponding to the semestral Net Position of each refiner and/or importer within the term that the Ministry of Mines and Energy establishes and based on availability of resources of the FEPC.
| 57 |
The Ministry of Mines and Energy has not calculated or settled the Net Positions corresponding to the last quarter of 2013 (taking into account that the regulations in force at that time stated that the calculation and settlement took place on a quarterly basis), nor those corresponding to the two semesters of the year 2014. Applicable regulations do not provide for the payment of interest on the Net Positions to be paid by the FEPC.
Ecopetrol estimates that the value to be recognized in favor of Ecopetrol for this concept is approximately the sum of Ps$828 billion.
On the other hand, and pursuant to Resolutions 181384 of 2010 and 124600 of 2010, the actual costs of the volumes imported by Ecopetrol to cover the deficit of internal demand that have yet not been recognized, will be paid with resources obtained from the FEPC provided that said amounts have not been offset against the projects developed in the Barrancabermeja Refinery. We estimate that the amount to be recognized as a Compensation Differential in respect of this matter is of Ps$78 billion (this figure is included in the figure mentioned in the paragraph above).
| 3.8.4.3 | Regulation of Biofuel and Related Activities |
The sale and distribution of biofuels is regulated by the Ministry of Mines and Energy. Regulations establish the quality and pricing standards for biofuels and impose minimum requirements for mixing ethanol with gasoline and biodiesel with diesel.
| 3.8.5 | Regulation of the Natural Gas Market |
Decree 2100 of 2011, issued by the Ministry of Energy and Mines, established that all producers have to issue a production statement that includes the volumes of natural gas available for sale for a period of ten years. This decree also introduced a new regime for the selling and marketing of natural gas in Colombia, including specific procedures that regulate the Colombian market in order to manage the remaining natural gas reserves owned by the Nation, and to protect domestic consumers, especially residential consumers, by prioritizing delivery of gas to residential consumers, regulating the export of natural gas and setting forth the export restrictions applicable during an internal shortage of natural gas.
Currently in Colombia, other than with respect to the Opón field, the price of natural gas is determined by the market.
CREG issued Resolutions 088 of 2013 and 089 of 2013 that established the procedures for marketing natural gas in Colombia. Pursuant to Decree 2100 of 2011, however, such procedures do not apply to the following activities: a) natural gas exports; b) natural gas as raw material in petrochemical production; c) natural gas commercialization from minor fields (production capacity under 30 million cfpd); d) natural gas commercialization from hydrocarbon fields under testing phase or which have not yet been declared commercially viable; e) natural gas commercialization from unconventional reservoirs and f) internal consumption from natural gas producers.
CREG determines which agents can participate in the primary and secondary markets. Ecopetrol is authorized to participate as a seller in the primary market as a natural gas producer and as a buyer in the secondary market when Ecopetrol requires natural gas from other producers for its own needs. CREG regulations provide that a natural gas producer cannot participate as a merchant of natural gas in the secondary market except it may purchase gas to meet its existing contractual obligations. Ecopetrol is also able to re-sell available natural gas transportation capacity into the secondary market.
| 58 |
Priorities for Delivery of Natural Gas
The export of natural gas, in contrast, is not considered a public utility activity under Colombian law and therefore is not subject to Law 142 of 1994. Nevertheless, the internal supply of natural gas is a priority for the Colombian government and is considered to be a public utility complementary activity, and therefore public utility regulations apply to the internal supply of natural gas. Decrees 880 of 2007, 4500 of 2009 and 2100 of 2011 provide that in the event the supply of natural gas is reduced or halted as a result of a shortage, the Colombian government has the right to suspend the supply of natural gas for exportation. If such export contracts are suspended by the Colombian government, the export agents are entitled to receive compensation in accordance to article 4 and 27 of Decree 2100, 2011. Notwithstanding the foregoing, Decree 2100 of 2011 establishes freedom to export natural gas under normal gas-reserve conditions. Producers of natural gas may enter into natural gas export contracts if the ratio of proved reserves to consumption exceeds seven years, as determined by the Colombian Energy Planning Authority (or UPME for its Colombian acronym).
The Ministry of Mines and Energy establishes distribution priorities in the event of a shortfall of reserves or production of natural gas. Residential consumers with existing supply contracts, small businesses and distributors of compressed natural gas have the first priority for delivery.
The Ministry of Mines and Energy also establishes distribution priorities in the event of a natural gas shortfall derived from supply or infrastructure issues. This order of priority is based on the type of contract, with firm supply contracts having priority over interruptible supply contracts.
Decree 2100 of 2011 and CREG Resolutions 089 of 2013 and 204 of 2013 provide specific procedures and forms of supply agreements determined by CREG pursuant to which an agent may sell and buy natural gas in the Colombian primary and secondary market produced from large fields (capacity of more than 30 million cfpd). Decree 2100 of 2011 and CREG Resolution 089 of 2013 permits the sale of natural gas from small fields (capacity under 30 million cfpd) pursuant to contracts that fulfill certain regulatory requirements but whose form is not prescribed by law.
| 3.9. | Sustainability Initiatives |
| 3.9.1 | HSE |
The following section describes the health, safety and environmental (HSE) practices of Ecopetrol S.A. Currently, subsidiaries of Ecopetrol S.A. establish their own HSE models, provided that these models must be consistent with guidelines established by Ecopetrol S.A.
| 3.9.1.1 | Ecopetrol S.A. |
One of the principles that guide Ecopetrol is our commitment to our people and the development of those communities in which we operate. For that reason, Ecopetrol S.A. is devoted to improving our health, safety and environmental (HSE) practices.
HSE management is essential for us because it promotes policies designed to recognize and understand process risks and prevent occupational accidents and other major incidents.
We have several programs in place aimed at increasing the safety of our industrial processes and minimizing the number of occupational accidents and other major incidents. Our HSE management model is based on key focus areas that are aligned with our integrated management system:
| 59 |

Applying these policies, we have made the following improvements in our key focus areas:
| (1) | STRATEGY AND DIRECTION |
| · | Align HSE policies with the Company Strategy, and generate programs to improve performance. |
(2)PEOPLE
| · | Promote participation and open communication with management. |
| · | Establish a management control structure for HSE issues |
| · | Implement operational discipline designed to assure compliance in all operating and maintenance procedures |
| · | Safety corporate practices. Develop the HSE competency of our employees and contractors and focus on closing their competency gaps with respect to critical processes. |
| · | Perform assessments of Process Safety Management (PSM) factors during the selection process of our contractors. |
| (3) | INFORMATION AND KNOWLEDGE-BUILDING |
| · | Take inventory of available process technology information related to PSM and develop a plan to update such information for all of our facilities and train our workers following the updates. |
| (4) | OPERATIONS |
| · | Ensure that our contractors perform critical maintenance procedures. |
| · | Improve preparedness and emergency response plans. |
| 60 |
| · | Conduct emergency drills in order to promote our emergency readiness. |
| (5) | MATERIAL RESOURCES |
| · | Reduce risks through an inspection, testing and maintenance program designed to ensure the integrity of our critical equipment and parts. |
| (6) | RISKS AND CONTROLS |
| · | Carry out our risk management strategies. |
| · | Mitigate the impacts of occupational accidents and other major incidents by the implementation of controls. |
| · | Intervene and remediate any technological risks identified in order to mitigate their effects. |
| · | Improve in electrical competences for the employees. |
| (7) | MONITORING AND IMPROVING |
| · | Promote self-evaluation and require systematic evaluation. |
The results of these strategies in 2014, compared with the prior year, were:
| · | 60% decrease in road accidents. |
| · | Improvement in the real time monitoring of drivers’ safety habits. |
| · | 24,000 critical procedures training sessions for our workers. |
| · | Reduction in the severity of occupational incidents. |
| · | Reduction to zero of accidents during the start-up of projects or major maintenance. |
| · | Reduction in oil spills. |
| · | Improvement in reporting of minor oil spills and identification of their causes. |
Contingency Plans and Environmental Remediation
All of our operational areas have preparedness and emergency response plans, each in accordance with Colombian legal requirements and our new internal guidelines for emergency management.
Our preparedness and emergency response plans have been developed based on our analysis of risk scenarios, the estimated consequences of these events and the implementation of strategies to be followed in response to each scenario.
The objectives of our contingency plans are to:
| · | Protect the health and safety of our workers, contractors and the communities in which we operate. |
| · | Prevent oil spills and leaks of harmful substances in offshore and onshore areas, fires and explosions and mitigating environmental impacts. |
| 61 |
Our contingency plans include:
| · | Procedures for the containment of oil and other harmful substances, as well as procedures to safeguard the safety of affected communities and the personnel involved in such containment actions. |
| · | Strategies for responding to emergencies located outside of our facilities and mutual aid emergency plans, including actions developed with local environmental authorities, stakeholders, the local community and other organizations for containment and recovery of spilled product, and cleaning and recovery of affected areas, monitoring of the environmental effects and compensation for local communities and other affected persons. |
In offshore operations, our operator has the responsibility of designing and implementing plans and strategies aligned with international best practices that cover various emergency response scenarios.
Total Recordable Incident Rate – Employees and Contractors
Ecopetrol S.A. places an important emphasis on understanding, monitoring and controlling our impacts on workers and contractors.
Ecopetrol S.A. monitors a standard measure of occupational safety known as the Total Recordable Incidents Frequency Index (TRIF), which represents the number of employee or contractor injuries that require medical treatment or time off for every million hours worked.
TRIF has improved from 4.28 incidents per million hours worked in 2010, to 2.16 in 2014. In 2014, 28% of occupational accidents affecting our employees resulted in a disability that lasted for three days or less. This represents a significant decline in the seriousness of injuries resulting from such occupational accidents.
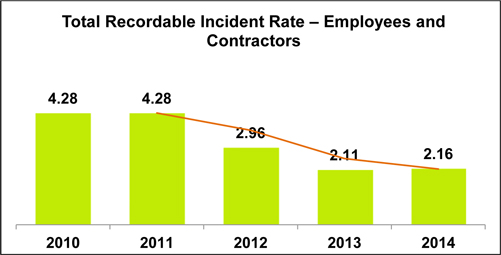
| * | Number of employee or contractor injuries requiring medical treatment or time off for every million hours worked |
| ** | Includes data for Ecopetrol S.A. and the Transport and Logistic Vice-presidency, but does not include data for subsidiaries of Ecopetrol S.A. |
Frequency of process safety incidents
Since 2009, we have been working on a “Process Safety Management” (PSM) system aimed at minimizing operational incidents, such as fire, explosion, loss of primary containment and multiple fatalities. Our PSM Strategy is to: first, define high-risk processes; second, prioritize intervention in high-risk processes; and third, apply all PSM elements in the prioritized high-risk processes.
| 62 |
Loss of primary containment (LOPC) is the number of unplanned or uncontrolled releases of oil, gas or other hazardous materials.
Our indicator includes Tier 1 process safety incidents per million hours worked has improved and the costs associated with these incidents have declined by 50% in 2014 as compared to 2013. In 2014, there were 20 Tier 1 process safety incidents.
The reporting thresholds for API-754 Tier 1 is an unplanned or uncontrolled release of any material, including non-toxic and non-flammable materials, from a process that results in one or more health, safety or environmental consequences set forth under those guidelines.
Frequency of Tier 1 process safety incidents per hours worked (per million hours worked):

| * | Tier 1 process safety incidents per million hours worked (API-754) |
| ** | Includes data for Ecopetrol S.A. and the Transport and Logistic Vice-presidency classified according to the criteria in API-754 Tier 1, but does not include figures for Ecopetrol S.A.’s subsidiaries. |
Environmental Incidents
In 2014, Ecopetrol S.A. recorded 29 environmental incidents compared with; 34 in 2013 and 27 in 2012. The volume of oil spills was 885 barrels in 2014, a substantial decrease from 6,843 barrels in 2013 and 4,059 barrels in 2012. The decrease in the numbers of environmental incidents and oil spills was the result of the identification of critical equipment operating in high or very high risk conditions, and the implementation of asset integrity plans designed to mitigate those risk conditions.
| 3.9.1.2 | Cenit |
Until 2013, Ecopetrol maintained responsibility for Cenit’s HSE guidelines. In 2014, however, we delegated responsibility over Cenit’s HSE guidelines to Cenit’s internal staff. Cenit has continued to follow Ecopetrol’s HSE practices through 2014, but is currently undergoing a transition process to establish its own HSE governance.
| 63 |
| 3.9.1.3 | Refinería de Cartagena |
In 2014, around 36 million man-hours were employed conducting Reficar’s business activities. Our HSE performance indicators for Total Accident Frequency Rate (AFR), Total Accident Severity Rate (ASR) and Environmental Incident Index (EI) were well-within our established guidelines, as shown in the table below:
| INDICATOR | GOAL | OUTCOME 2014 | ||||
| AFR | 1.69 or less | 1.03 | ||||
| ASR | 1.5 or less | 0 | ||||
| EI | 0 | 0 | ||||
Other related performance indicators were outstanding during the current year. The results were:
| · | Lost Time Injury Incidents (LTI): zero incidents |
| · | Medical Treatment Injury (MTI): 37 incidents without having an impact on working hours. 33 incidents accounted for EPC Contractor, Chicago Bridge & Iron Company (CB&I) and 4 incidents accounted for Reficar and other subcontractors. |
| · | Construction or Operation-Related Security Incidents: zero incidents |
| · | Environmental Incidents: zero incidents. |
| · | First Aid Cases (FAC): 818 incidents |
In addition, in 2014 some of Reficar’s accomplishments include:
| · | Outlined and implemented HSE plans for the pre-commissioning, commissioning and start-up of all the refinery units to be delivered by the operator CB&I to Reficar. |
| · | Obtained accreditation of Reficar’s Vocational Center by the Colombian Ministry of Labor through CB&I. 9,763 employees were trained to fulfill Resolution 1409 of 2012, which provides workplace safety standards for persons working at heights. Additionally, 23,335 employees were trained in several other labor certifications. |
| · | Upgraded and implemented revised chapters of our emergency plan. |
| · | Carried out an evacuation drill for Ammonia (NH3) spill in our neighboring company Abocol. |
| · | Carried out a performance assessment by our Health and Welfare Committees. |
| · | Organized the HSE Awareness Week in Cartagena and Bogotá |
| · | Outstanding results of our Yearly Environmental Auditing Report, which revealed zero breaches of environmental regulations related to the Cartagena refinery expansion project. |
| · | Approval from the National Environmental License Authority for PetCoke loading in covered roofed vessels in Reficar’s port facility to be transported to Mamonal’s port facility. |
| · | 9,401 trees planted under our Forestry Compensation Program regulated by environmental authorities. |
Historical Performance
Over the last three years, our HSE performance has continuously improved. The following table and chart cover our Total Accident Frequency Rate (AFR) and Total Accident Severity Rate (ASR) from 2012 to 2014.
| 64 |
| For the year ended December 31, | ||||||||||||
| 2014 | 2013 | 2012 | ||||||||||
| Man-Hours | 36,065,413 | 26,106,164 | 17,641,197 | |||||||||
| Recordable Accidents | 37 | 49 | 36 | |||||||||
| Accident Frequency Rate (AFR)* | Accident Severity Rate (ASR)* | |
 |
 |
(*) Year-on-year figures are shown from November to November of each year.
| 3.9.2 | Human rights |
In 2013, Ecopetrol updated its Human Rights Policy and adopted an integrated and systemic management approach to human rights based on the due diligence principle. In 2014, Ecopetrol focused its efforts on strengthening its approach to human rights.
Ecopetrol maintains corporate mechanisms to ensure its compliance with national and international human rights laws and certain non-binding international standards, as well as to generate value to the company and to society through the promotion of human rights. These mechanisms are:
| · | The Human Rights Committee; |
| · | The Tactical Plan on Human Rights; |
| · | The Human Rights Monitoring System; and |
| · | Human rights and international humanitarian law risks analysis. |
In view of our commitment to respect and promote human rights, we have begun a process of promoting these values in all of our controlled subsidiaries. In 2014, Ecopetrol released a Human Rights Guideline which establishes the key considerations that our subsidiaries must take into account with regard to Human Rights in terms of planning, risks analysis, monitoring, and best practices.
Regarding human rights risks analysis, our monitoring process has been strengthened in order to prevent and mitigate negative impacts on human rights. Sources of information-gathering have been amplified, internal monitoring systems have begun to integrate human rights aspects and the areas involved in the monitoring process have increased, according to the type of risk.
Additionally, Ecopetrol S.A. has continued its work in promoting human rights in the several territories where it has operations by promoting initiatives that support:
| 65 |
| · | Human rights dialogue with stakeholders, |
| · | Rights of ethnic groups, |
| · | Equal gender rights, |
| · | Children and teenager rights, |
| · | Right of association and collective bargaining and |
| · | Reconciliation and enterprise. |
Ecopetrol S.A. has carried out a human rights risk assessment in order to evaluate and mitigate human rights impacts. As a result of this assessment, Ecopetrol S.A. has focused its efforts on the following principles:
| · | Right to life, liberty and personal security, |
| · | Right of association and collective bargaining, |
| · | Abolition of forced or compulsory labor, |
| · | Abolition of child labor, |
| · | Equality and non-discrimination at work, |
| · | Just, equitable, and satisfactory conditions of work, |
| · | Rights of ethnic groups, and |
| · | Collective rights and the environment. |
An important tool in our promotion of human rights is the Human Rights Monitoring System, which was implemented in 2013 and monitors human rights risks in order to identify potential impacts that can be prevented or mitigated.
In 2014, Ecopetrol increased the number of locations covered by the Mine Risk Education Project implemented jointly with the Presidential Program on Integral Action against Landmines. Ecopetrol reached various high risk municipalities such Orito, Saravena, Tumaco, Puerto Leguizamo, Inzá, Jambaló, Popayán, Doncello, Cubará, Cumaribo and Cantagallo. 622 people, including indigenous community members, Afro-Colombian people, rural teachers, children and teenagers participated in the workshops executed under the program, twice the number of participants involved in 2013.
| 3.9.3 | Dow Jones Sustainability Index |
For the fourth consecutive year, Ecopetrol was listed in the Dow Jones Sustainability Index-World (DJSI). The DJSI is a global indicator that monitors the financial performance of leading companies committed to corporate sustainability. Ecopetrol remained within the top 10% (20 companies) of oil & gas companies around the world, among the 2,500 companies listed and included in the Dow Jones Index.
| 66 |
| 3.9.4 | Environmental Sustainability |
| 3.9.4.1 | Environmental Practices |
Ecopetrol S.A.
During 2014, the environmental management strategy of Ecopetrol included the following components:
| 1. | Environmental Viability: this strategy concentrates on obtaining environmental licenses and permits as well as adequate land management that ensures the sustainability of operations through timely prevention efforts and management of environmental impacts, constant and systematic relationships with stakeholders and participation in the sustainable development of the territories in which we operate. |
| 2. | Climate Change: this strategy aims to decrease our carbon emissions and reduce the vulnerability of our operations and our facilities to the effects of climate change through the implementation of four strategic action lines: |
| · | Mitigation: reducing our carbon dioxide emissions and creating carbon offset alternatives; |
| · | Vulnerability and Adaptation: reducing the risks and impacts to our operations posed by climate variability and change; |
| · | Research and Technology: reducing our greenhouse gas emissions through action on research and development, process optimization, implementation of energy efficient strategies, carbon capture and sequestration and diversification into low carbon energy sources. |
| · | Involvement in Policymaking: informing and influencing government policies on climate change. |
| 3. | Biodiversity: this strategy aims to reduce Ecopetrol’s impacts on the ecosystems in areas where we operate. This strategy mainly focuses on knowledge building and conservation efforts in areas where we operate. |
| 4. | Eco-efficiency: this strategy aims to maximize our efficient use of resources and mitigate our environmental impacts. Through this strategy, which extends to our supply chain, we seek to utilize energy, materials, and in general all natural resources as efficiently as we can, thereby reducing the environmental impacts from our operations and projects and minimizing emissions, effluents and waste disposal from our operations and projects while taking into account our production benchmarks. |
| 5. | Integrated Management of Water Resources: this strategy aims to ensure compliance with water resources laws and reduce conflicts over water use in the areas near our projects and operations. Our core focus areas under this strategy are aligned with the objectives defined by the 2010 National Water Policy for the Management of Water Resources in Colombia which focuses on water supply, demand, quality, risk governance and institutional strengthening. |
Since 2009, Ecopetrol has reported its achievements in the sphere of environmental management to various relevant organizations focused on promoting sustainable business practices, such as the Dow Jones Sustainability Index, the Carbon Disclosure Project (CDP) and the CDP Water Information Request; Environmental Benchmarking of ARPEL.
| 67 |
Refinería de Cartagena
Environmental Investments
To fulfill commitments regarding EIA and Colombian ruling, during 2014 the following investments were executed:
| Activity Description | millions of Pesos | |||
| Medical and Hazardous Material Collection, Transport and Disposal | 183.9 | |||
| Ordinary Material Collection | 2,007.9 | |||
| Wildlife relocation and vector control | 659.0 | |||
| Portable Bathrooms Leasing and Maintenance | 3,887.2 | |||
| Forestry Compensation Program (Avenida Santander y el Barrio el Cabrero de Cartagena) | 127.4 | |||
| Forestry Compensation Program (Parque de Las Flores) | 15.0 | |||
| Forestry Compensation Program (Reficar Perimeter Facilities) | 111.1 | |||
| Forestry Compensation Program (Predio de Casablanca) | 184.7 | |||
| Forestry Compensation Program (Waterbed of Refinery’s Stream) | 79.0 | |||
| Forestry Compensation Program (Ciénaga de la Vírgen) | 53.6 | |||
| Project Monitoring Service (Air quality and Noise Levels) | 83.23 | |||
| 3.9.4.2 | Energy Projects |
Ecopetrol S.A. has been undertaking significant efforts to make efficient and rational use of energy resources in our production processes and reduce energy consumption and costs and carbon dioxide emissions. We focus on efficiency, reliability and optimization, and energy diversification. During 2014, Ecopetrol S.A.’s average monthly energy consumption was 678 MW equivalents, from which 90% was provided through self-generation and the remaining 10% with non-regulated energy purchased from the National Transmission System.
Corporate Efficiency Energy Plan
Our Corporate Efficiency Plan accomplished the following during 2014:
| § | Construction of 10 new base lines of medium efficiency, out of a total of 35 lines identified for the Barrancabermeja Refinery and 21 base lines for Cartagena Refinery. These base lines are the foundation to generate strategies and actions oriented to reduce energy consumption. |
| § | In the transportation segment, energy savings of 2.3 GW-h-y were achieved during the year due to optimization in consumption schedules. |
| § | An energy surplus utilization plan was agreed with the refineries to provide energy to production, seeking the better use of the improved infrastructure. |
Energy Surplus Sales
According to CREG and Public Services Superintedency regulations, a company that has energy self-generation capacity, such as Ecopetrol, can sell its energy surplus to related companies, that is, companies from the same economic group.
In 2014, Ecopetrol, as a marginal producer, which is a generator whose production is higher than their own consumption of self-generated energy, sold energy that was self-generated from the operations in Galán (Barrancabermeja) and Apiay pumping station to Cenit for Ps$3.7 billion. In addition, Ecopetrol is also looking to supply demand from other related companies. This contributes to decreased energy costs and increased energy efficiency within our economic group.
| 68 |
| 3.10. | Related Party Transactions |
Set forth below is a description of material related party transactions. For additional information about transactions with related parties, see clause xxvi to Note 33—Differences between Colombian Governmental Entity accounting principles and U.S. GAAP to the consolidated financial statements.
Ocensa
Ecopetrol S.A. has entered into a number of agreements with its 72.65%-owned subsidiary Ocensa, of which the following are the most significant:
| · | In March 1995, Ecopetrol S.A. entered into an agreement for the transportation of crude oil through the Ocensa pipeline. Pursuant to the terms of this agreement, Ecopetrol S.A. was required to make monthly payments that varied depending on both the volume of crude oil we transported through the pipeline and a tariff imposed by Ocensa on the basis of Ocensa’s financial projections and their expected volumes of crude oil. In 2014, payments made by Ecopetrol S.A. under this agreement amounted to US$885.83 million. On January 17, 2013, this agreement was amended as a result of Ocensa’s new business model. Among other changes, this amendment to the transportation agreement establishes the payment of the tariff calculated according to Resolutions issued in 2010 by the Ministry of Mines and Energy. In 2013, another amendment was executed that modified the terms by which the payments of invoices should be made. |
| · | In December 1999, Ecopetrol S.A. entered into an operation and maintenance agreement for the Porvenir, Miraflores and Vasconia pumping stations. In 2014, pursuant to the terms of this agreement, Ecopetrol S.A. received payments of approximately US$12.5 million plus applicable taxes, fixed and variable costs in 2014. |
| · | On July 10, 2012, Ecopetrol entered into a ship or pay agreement for the operation of Ocensa’s unloading facilities at which Ecopetrol unloads crude oil. This agreement was later amended on March 12, 2013 and on July 19, 2013. The fees correspond to a cost of US$1.50 per barrel of crude oil that is unloaded. The agreement is for a term of five years. On April 11, 2014 Ecopetrol entered into an additional ship or pay agreement for the operation of Ocensa’s unloading facilities by means of which Ecopetrol has the right to unload an additional 2,000 barrels per day. By virtue of these agreements, Ecopetrol S.A. paid fees of US$4.7 million to Ocensa in 2014. |
| · | On January 17, 2013, Ocensa and its shareholders—Cenit, Ecopetrol Pipelines International Limited, Santiago Pipelines Company, New Santiago Pipelines Company, Total Colombia Pipeline, Inversiones Sol del Sur S.A.S. and Cepsa Colombia S.A.—entered into a shareholders agreement that establishes the basis for a new business model, pursuant to which Ocensa has become a profit center instead of a cost center. This agreement became effective as of the date of execution and will be in effect until Ocensa is registered on an exchange. Additionally, this agreement might be renegotiated if the control structure of Ocensa is modified. |
The Ocensa shareholders’ agreement establishes the basis for Ocensa’s corporate governance model. It provides for a board of directors composed of five members, two of which must be independent. Cenit may nominate three members of the board of directors, including the two independent members, while minority shareholders may together nominate the remaining two members.
The Ocensa shareholders’ agreement provides the minority shareholders with certain rights, including the right to nominate two members of the five-member board of directors. Significant decisions must be approved by a qualified majority of at least four Ocensa shareholders, and by supermajorities of the outstanding Ocensa shares. These actions include, among others:
| 69 |
| o | issuing additional shares or publicly listing shares, declarations of dividends in amounts other than all distributable income and certain amendments to Ocensa’s bylaws; |
| o | asset sales in excess of U.S.$50 million; |
| · | On October 28, 2013, Ecopetrol entered into a natural gas supply contract in force until November 30, 2018, pursuant to which Ecopetrol S.A. supplies gas to Ocensa and receives a fixed price per MBTU (million British Thermal Units). This agreement replaced the contract for natural gas supply entered into on December of 2004, under which Ocensa paid a variable rate to Ecopetrol. In 2013, Ecopetrol S.A. received an aggregate sum of US$2.28 million under the former contract. |
Ocensa has entered into the following agreements, among others, with some of our other subsidiaries:
| · | In March 1995, Equión Energia Limited and Santiago Oil Company entered into an agreement for the transportation of crude oil through the Oleoducto Central S.A. (Ocensa) pipeline. In November 2012, Equión Energía Limited and Santiago Oil Company transferred, by means of various transactions, its shares (24.8%) and transportation rights (19.8%) holdings in the Ocensa pipeline to wholly owned subsidiaries of Ecopetrol S.A. (51%) and Talisman (49%). Equión Energía Limited and Santiago Oil Company kept 5% of transportation rights in Ocensa. In 2014, the transportation fees billed by Ocensa were: Equión Energía Limited (US$44.4 million), Santiago Oil Company (US$3.8 million) and Hocol and Homcol (US$30.8 million). |
| · | On July 9, 2012, Ocensa and ODL entered into a strategic alliance for the dilution of crude oil in Cusiana station. ODL paid Ocensa US$2.87 million under this contract in 2014. The term of this contract is of 5 years. One the initial term of the agreement ends, Ocensa has a purchase option over the assets that perform the dilution process. |
| · | On March 18, 2014, Cenit and Ocensa entered into an asset sale agreement, by means of which Cenit sold to Ocensa certain assets pertaining to Miraflores and Porvenir stations, as a consequence of a purchase option that was established in a previous leasing agreement among the parties. Ocensa paid Cenit US$46 million. Prior to the asset sale agreement there was in place a lease agreement between the parties by means of which Ocensa paid to Cenit in 2014 US$2.9 million. |
Oleoducto de Colombia S.A. (ODC)
Ecopetrol S.A. entered into the following agreements with its 73%-owned subsidiary ODC:
| · | In July 1992, a take-and-pay agreement for the transportation of hydrocarbons. Pursuant to this agreement, Ecopetrol S.A. must pay a previously agreed tariff over the volume of hydrocarbons transported. The duration of this agreement is indefinite; however the contract will remain in force as long as Ecopetrol S.A. holds shares in Oleoducto de Colombia S.A., whether directly, or through an affiliate. As of January 2013, the parties agreed that the applicable tariff would be the one set by the Ministry of Mines and Energy (MME). The MME Tariff had been set in 2011 for a four-year term, with a yearly adjustment based on the consumer price index. For 2014, the tariffs were US$1.7705 per barrel (January through June) and US$1.7542 per barrel (July through December). |
| · | In August 1992, an operation and maintenance agreement for the Vasconia and Coveñas terminals both property of ODC. Pursuant to the terms of this agreement, ODC paid in 2014 approximately US$39.7 million, which referred to services rendered by Ecopetrol directly or by third party contractors hired by Ecopetrol through mandate; with a variable surcharge over expenses and third party contracts between 5% and 12% plus any applicable taxes. The duration of this agreement is indefinite, but can be terminated by any party upon six-months’ notice. |
| 70 |
| · | In March 1998, a joint operation agreement for the TLU-1 Coveñas buoy. Pursuant to the terms of this agreement, ODC paid Ecopetrol S.A. approximately US$13.8 million in 2014. The duration of this agreement is indefinite and can be terminated by mutual agreement. In December 2013, Ecopetrol S.A. assigned its rights under this agreement to Cenit, though Ecopetrol S.A. kept its role as operator under the agreement. |
| · | In September 1999, a joint operation agreement for the TLU-3 Coveñas buoy with Ocensa and ODC. Pursuant to the terms of this agreement, ODC paid approximately US$11.2 million in 2014. The duration of this agreement is indefinite. In December 2013, Ecopetrol S.A. assigned its rights under this agreement to Cenit, though Ecopetrol S.A. kept its role as operator under the agreement. |
| · | In July 2006, an operation and maintenance agreement for the Caucasia Station and the Vasconia-Coveñas pipeline system. Since 2010, this agreement only covers the operation of the Caucasia station and the Vasconia-Coveñas pipeline system, both property of ODC. Pursuant to the terms of this agreement, Ecopetrol S.A. received payments of approximately US$16.4 million in 2014, which referred to services rendered by Ecopetrol directly or by third party contractors hired by Ecopetrol through mandate; with a variable surcharge over expenses and third party contracts between 5% and 12% plus any applicable taxes. The duration of this agreement is indefinite. |
ODC has entered into the following agreements with some of our other subsidiaries:
| · | Between March 1992 and January 1993, Hocol, Equión Energía Limited and Santiago Oil Company each entered into agreements with ODC for the transportation of crude oil through the Vasconia-Coveñas pipeline. The term of each of these agreements is indefinite. As of January 2013, the applicable tariff is the one set by the Ministry of Mines and Energy. |
Oleoducto de los Llanos Orientales (ODL)
Ecopetrol S.A. has entered into the following agreements, among others, with its 65%-owned subsidiary ODL:
| · | In March 2009, Ecopetrol S.A. entered into a ship-or-pay agreement with ODL that establishes a financing tariff used to pay ODL’s indebtedness to Grupo Aval for five years. This agreement was superseded by a new contract executed in May 2010, with a seven-year term, to reflect new conditions agreed with Grupo Aval. In August 2013, this contract was amended, providing a new term of seven years, including a two two-year grace periods, and an interest rate of DTF + 2.5%. This financing tariff is collected through a trust fund, which in turn is responsible for making the debt service payments to Grupo Aval. Under this agreement, ODL has committed to transport 75,000 bpd during the initial two-year grace period of the facility and 90,000 bpd during the remaining years including the new term. Ecopetrol S.A. is responsible for 65% of this capacity. Payments by Ecopetrol S.A. under this contract were Ps.$ 27.2 billion in 2014. |
| · | In September 2009, Ecopetrol S.A. entered into a second ship-or-pay agreement with ODL that establishes a financing tariff collected through a trust fund that in turn is responsible for making debt service payments to security holders. Under this agreement, ODL committed to transport 19,500 bpd during the first phase of the ODL project (which began in September 2009 and ended in the first quarter of 2010) and 39,000 bpd upon commencement of the second phase of the ODL project which occurred in the first quarter of 2010 and finishes in the third quarter of 2016. Payments by Ecopetrol S.A. under this contract were Ps.$ 124.8 billion in 2014. |
| · | In December 2009, Ecopetrol S.A. entered into a service agreement with ODL to transport crude oil. This agreement was replaced in January 2014 by a new agreement that expires in December 2020. This is a Ship or Pay agreement covering 167,000 bpd for 2014, 149,000 bpd for 2015 and 139,000 bpd until 2020. Payments by Ecopetrol S.A. under this contract were Ps.$296 billion in 2014. |
| 71 |
| · | In March 2010, Ecopetrol S.A. entered into a pipeline operating and maintenance agreement with ODL. This agreement has a five-year term and the amount payable to Ecopetrol S.A. for the entire term of the agreement is Ps$56.4 billion, plus any applicable taxes. |
| · | In July 2013, Ecopetrol S.A. entered into a service agreement with ODL to dilute, in the facilities of Cusiana (CPF Cusiana), crude oil transported in the Rubiales – Monterrey/Cusiana pipeline, with a committed capacity of 182,000 bpd. For 2014, 124,429 bpd of the committed capacity corresponds to the “Take or Pay” volume. Payments by Ecopetrol S.A. under this contract were Ps.$ 23.8 billion in 2014. |
Oleoducto Bicentenario de Colombia S.A.S.
Ecopetrol S.A. has entered into the following agreements, among others, with its 55.97% owned subsidiary Oleoducto Bicentenario de Colombia S.A.S.:
| · | In November 2011, Ecopetrol S.A. signed a five-year technical assistance services contract for the construction of the Araguaney-Coveñas pipeline. This contract has finished its first phase on June 30, 2014. Future phases are under evaluation. Pursuant to the terms of this agreement, in 2013 and 2014 Bicentenario paid to Ecopetrol S.A. Ps$9.5 billion and Ps$138.5 thousand plus applicable taxes. |
| · | In June 2012, Ecopetrol S.A. entered into ship-or-pay and ship-and-pay crude oil transportation agreements with Oleoducto Bicentenario that establishes a price, which requires the payment of Bicentenario’s indebtedness to local banks for 12 years. This tariff is collected through a trust; the trust is also responsible for making the debt service payments to the banks. The duration of the ship-or-pay agreement is the earlier of 12 years or when the credit has been entirely paid, and the duration of the ship-and-pay agreement is 20 years after the ship-or-pay terminates. Under these agreements, Bicentenario has committed to transport at least 110,000 bpd, of which the 55% of the agreement volume is provided directly by Ecopetrol S.A. and 0.97% indirectly by Hocol. Pursuant to the terms of this agreement, in 2013 Ecopetrol paid to Bicentenario S.A. Ps$294 billion plus applicable taxes and in 2014 Ecopetrol paid Ps$415 billons plus applicable taxes. In March 2014, the parties signed an amendment to this contract under which Bicentenario acknowledges having received an advance tariff payment which can be amortized through volumes of crude transported in excess of 110,000 bpd. |
| · | In June 2012, Ecopetrol S.A. entered into storage-or-pay and storage-and-pay agreements with Oleoducto Bicentenario. Under these agreements, Bicentenario is committed to receive, store, preserve and deliver our crude oil. The storage-or-pay agreement will terminate when Bicentenario’s indebtedness to local banks has been entirely paid, and the duration of the storage-and-pay agreement is 20 years after the storage-or-pay agreement terminates. Pursuant to the terms of this agreement, in 2014, year when contract started, Ecopetrol paid to Bicentenario S.A. Ps$25.5 billion plus applicable taxes. |
| · | In August 2012, Ecopetrol S.A. entered into an Operation and Maintenance agreement for the Arguaney – Banadia pipeline system. Pursuant to the terms of this agreement Ecopetrol S.A. received Ps$23 billion from the beginning of the contract through December 2013. Ecopetrol S.A. will receive estimated payments of US$36.4 million per year. The duration of this agreement is 15 years. |
| 72 |
Ecodiesel
| · | Ecopetrol S.A. entered into a supply agreement with Ecodiesel, a company in which Ecopetrol S.A. has a 50% equity interest. This agreement has been operative since August 1, 2010. Pursuant to the terms of this agreement, Ecodiesel must deliver to Ecopetrol S.A.—and Ecopetrol S.A. must in turn purchase—at least 80% of Ecodiesel’s biodiesel production each month. Payments vary depending on the purchased volumes of biodiesel. This agreement expires on December 31, 2017. In 2014, a total of Ps$239 billion were paid under this contract. |
Transactions with Other State-Controlled Entities
Other than the agreements that we have entered into with the ANH and described in the section Business overview – Joint Venture and Other Contracts, in the ordinary course of business we enter into transactions with other state-owned entities that include but are not limited to the following:
| · | Selling and purchasing goods, including crude oil purchases of ANH royalties (see below); |
| · | Properties and other assets; |
| · | Rendering and receiving services; |
| · | Leasing assets; |
| · | Depositing and borrowing money; and |
| · | Using public utilities. |
For the years ended December 31, 2014, 2013, and 2012, we purchased the following volumes of crude oil from the ANH (National Hydrocarbon Agency) corresponding to royalties paid in kind by oil producers in Colombia: 44.0 million barrels, 49.5 million barrels and 48.0 million barrels, respectively. See the section Business overview–Applicable laws and regulations–Regulation of exploration and production activities–Business regulation–Royalties for a description of the current royalty scheme.
| 3.11. | Insurance |
We have a clear and defined corporate policy based on risk financing guidelines that summarizes the Company’s risk transference and retention alternatives and provides support and guidance for all the insurance-related issues of all of our affiliated and subsidiary companies.
There are two corporate insurance programs covering Ecopetrol S.A. and its subsidiaries. In the text and tables below, we set forth our insurance programs and the companies covered, along with limits and coverage details.
World-Wide Umbrella Program: This insurance program provides coverage for downstream (assets and operations) of Ecopetrol S.A. and all of its subsidiaries in excess of their local insurance programs, and also in excess of the “Global Energy Package” program, when applicable. Coverage includes all physical damage, sabotage and terrorism, general liability, directors and officers, crime and marine cargo. Physical damage, sabotage and terrorism coverages were designed to cover downstream operations, while general liability, directors and officers, crime and marine cargo coverages were designed to cover down-, mid- and upstream operations.
| 73 |
| Limit (eel/agg(1)) | Deductible | |||||||||||||||||||||||||||||
| Policies | Onshore | Offshore | Onshore | Offshore | Ecopetrol Downstream | Reficar | Proplico | Ecopetrol Upstream | Equión | Hocol | Ecopetrol America | Ecopetrol Brazil(2) | ODL | Cenit | ||||||||||||||||
| (US$ in million) | ||||||||||||||||||||||||||||||
| Property all risk | 2,000 | NA | 5 - 10 | N/A | X | X | X | NA | NA | NA | NA | NA | NA | NA | ||||||||||||||||
| Sabotage and terrorism | 600 | NA | 0.5 | N/A | X | X | X | NA | NA | NA | NA | NA | NA | NA | ||||||||||||||||
| Third-party Liability | 500 | NA | 1 – 5(3) | NA | X | X | X | X | X | X | NA | NA | X | X | ||||||||||||||||
| Crime | 50 | NA | Various | NA | X | X | X | X | X | X | NA | NA | NA | X | ||||||||||||||||
| Directors and Officers | 250 | NA | Various | NA | X | X | X | X | X | X | X | X | NA | X | ||||||||||||||||
| Cargo | 250 | NA | 3% Dispatch | NA | X | X | NA | X | NA | X | NA | NA | NA | NA | ||||||||||||||||
| (1) | Eel: each and every loss. Agg: Aggregate. |
| (2) | There are no insurable assets in Brazil. |
| (3) | US$5M deductible for pollution liability only. |
Global Energy Package. This program provides coverage for upstream and midstream (assets and operations) of Ecopetrol’s interests and all of its upstream subsidiaries, including all physical damage, sabotage and terrorism, general liability and control of wells.
| Limit (eel/agg(1)) | Deductible | |||||||||||||||||||||||||||||
| Policies | Onshore | Offshore | Onshore | Offshore | Ecopetrol Upstream | Equión | Hocol | Ecopetrol America | Ecopetrol
Brazil | ODL | Cenit | |||||||||||||||||||
| (US$ in million) | ||||||||||||||||||||||||||||||
| Property All Risk | 400 | 400 | 0.025 | 0.5 | X | X | X | X | NA | X | X | |||||||||||||||||||
| Sabotage and terrorism | 50 | 50 | 0.5 | N/A | X | X | X | NA | NA | X | X | |||||||||||||||||||
| Third-party Liability | NA | 500 | N/A | 0.15 | X | NA | NA | X | X | NA | NA | |||||||||||||||||||
| Control of wells | 25-250 | (2) | 400 | 0.25 | 5 | X | X | X | X | X | NA | NA | ||||||||||||||||||
| (1) | Eel: each and every loss. Agg: Aggregate. |
| (2) | Drilling US$250M / Production US$25m |
Our third-party liability insurance policies cover Ecopetrol S.A., our subsidiaries and affiliates in excess of local underlying policy limits for claims made against them by third parties. Our commercial general liability, umbrella liability, and excess liability coverages will pay on behalf of or indemnify amounts for which an insured becomes legally obligated to pay, including damages in respect of bodily injury, property, pollution and product liability. Coverage of bodily injury and property damage is subject to coverage territory during the policy period.
With respect to offshore operations in the U.S. Gulf Coast, Ecopetrol America Inc. is party to Operating Agreements, or OAS, that include customary conditions and which contain similar terms and provisions to those in the Model Form of Offshore Deepwater Operating Agreement of the American Association of Professional Landmen (AAPL). In general, pursuant to these OAs, the obligations, duties, and liabilities of the contract parties are several, and not joint or collective, for all operations covered by the OAs.
| 74 |
Ecopetrol Óleo e Gás do Brasil Ltda. and Ecopetrol del Perú are parties to Joint Operating Agreements (JOA) based on the Association of International Petroleum Negotiators (AIPN) model. Liability is generally the same as described for the OAS above, with the following variations: if claims arise from third parties as part of a claim not involving an operator’s gross negligence or willful misconduct, and the operator pays such claims, all parties must concur and reimburse such claim amounts. In certain contracts, all environmental damages are distributed according to the parties’ participation interest, regardless of whether the damages were caused by an operator’s gross negligence or willful misconduct. In certain cases, non-operators may intervene and directly verify compliance of the operator’s HSE programs. Ecopetrol uses the same liability clauses in JOAs for offshore operations in Colombia, when Colombian laws do not govern such agreements.
| 3.12. | Human Resources/Labor Relations |
| 3.12.1 | Employees |
As of December 31, 2014, Ecopetrol S.A. had 9,150 employees, an increase of 4% from 2013. Most of our employees are located in Colombia. The table below presents the breakdown of Ecopetrol employees according to the business segments where they work, and the personnel of our subsidiaries for the years ended December 31, 2014, 2013, and 2012.
| As of December 31, | ||||||||||||
2014(2) | 2013(1) | 2012 | ||||||||||
| Ecopetrol S.A. | ||||||||||||
| Exploration and Production | ||||||||||||
| Exploration | 187 | 188 | 174 | |||||||||
| Production | 2,022 | 1,867 | 1,725 | |||||||||
| Others | 429 | 437 | 386 | |||||||||
| Total Exploration and Production | 2,638 | 2,492 | 2,285 | |||||||||
| Downstream | ||||||||||||
| Refining | 2,771 | 2,716 | 2,425 | |||||||||
| Marketing | 199 | 187 | 181 | |||||||||
| Others | 19 | 18 | 16 | |||||||||
| Total Downstream | 2,989 | 2,921 | 2,622 | |||||||||
| Transport | 1,251 | 1,184 | 1,097 | |||||||||
| Others | 3 | |||||||||||
| Total Operations | 6,881 | 6,597 | 6,004 | |||||||||
| Corporate | 2,269 | 2,203 | 2,083 | |||||||||
| TOTAL ECOPETROL S.A. | 9,150 | 8,800 | 8,087 | |||||||||
| Ecopetrol America Inc. | 57 | 47 | 28 | |||||||||
| Bioenergy S.A. | 96 | 106 | 143 | |||||||||
| Bioenergy Zona Franca S.A.S. | 94 | 92 | 35 | |||||||||
| Hocol S.A. | 185 | 197 | 194 | |||||||||
| Equión Energía Limited | 462 | 486 | 493 | |||||||||
| Oleoducto Central S.A. | 249 | 245 | 133 | |||||||||
| Oleoducto de Colombia S.A. | 1 | 1 | 1 | |||||||||
| Oleoducto de los Llanos S.A. | 33 | 16 | 17 | |||||||||
| Oleoducto Bicentenario de Colombia S.A.S. | 39 | 28 | 27 | |||||||||
| Ecopetrol del Perú S.A. | 0 | 2 | 12 | |||||||||
| Refinería de Cartagena S.A. | 247 | 234 | 158 | |||||||||
| Ecopetrol Óleo e Gás do Brasil Ltda. | 14 | 14 | 14 | |||||||||
| Propilco S.A. (Esenttia S.A.) | 367 | 353 | 339 | |||||||||
| Cenit | 75 | 65 | 20 | |||||||||
| TOTAL | 11,069 | 10,686 | 9,701 | |||||||||
| (1) | 193 persons employed by us during 2013 were not included in our 2013 employee statistics as they were independent contractors involved in non-regular activities and cannot be classified as temporary employees. |
| 75 |
| (2) | 79 persons employed by us during 2014 were not included in our 2014 employee statistics as they were independent contractors involved in non-regular activities and cannot be classified as temporary employees. |
Loans and investment on training and development for our employees
To improve the quality of life of our employees, Ecopetrol S.A. extends various types of loans to them, including housing loans and general-purpose loans. The principal amount of the loan depends on the applicant’s tenure and cannot exceed 59 times the applicant’s monthly salary. Ecopetrol S.A. does not guarantee any loans made by third parties. In 2014, Ecopetrol S.A. extended 856 housing loans for a total of Ps$ 33,565 billion and 1,462 general-purpose loans for a total of Ps$10,807 billion. Ecopetrol S.A. also provided on-site and external training and development courses to our employees. As of December 31, 2014, Ecopetrol S.A.’s investments in employees’ development amounted to Ps$28,920 billion, and it extended a total of Ps$103,487 billion in subsidies for education.
Other than maintaining housing loans to some executive officers as described in the table below, neither Ecopetrol S.A. nor any of its subsidiaries, have provided loans, extended or maintained credit lines, arranged for the extension of credit by third parties, materially modified or renewed an extension of credit lines, in the form of a personal loan to or for any of our executive officers since our ADSs were registered under the Exchange Act. Certain executive officers received loans from Ecopetrol S.A. prior to becoming executive officers; these loans have not been discontinued upon such persons’ appointment to executive office, nor have they been amended. The balance of our outstanding loans to executive officers was made prior to Ecopetrol S.A. becoming a public company.
The following table sets forth a description of the loans outstanding to our executive officers as of December 31, 2014 (figures in millions of Colombian Pesos).
| Executive Officer | Date of Approval | Nature of the Loan and Date of Disbursement | Principal Amount of the Loan | Amount Outstanding at December 31, 2014 | Largest Amount Outstanding during period | Termination Date | Applicable Interest Rate | |||||||||||||
| Pedro A. Rosales | April 30, 1997 | Housing, August 16,1997 | 47.3 | 0 | 247.5 | - | - | |||||||||||||
| September 16, 2003 | Housing, December 11,2003 | 231.9 | 97 | December 2018 | UVR | |||||||||||||||
| Nestor Saavedra(2) | August 10,2007 | Housing, October 25,2007 | 134.1 | 80 | 134.1 | April 2018 | UVR | |||||||||||||
| Jaime Bocanegra Bernal(3) | November 12, 2010 | December 15, 2011 | 271.4 | 237 | 271.4 | June 2027 | UVR | |||||||||||||
Magda Manosalva(4)
| October 10, 2007 | November 27, 2007 | 133.4 | 215 | 318 | - | - | |||||||||||||
| March 30, 2009 | May 26, 2009 | 184.6 | July 2024 | UVR | ||||||||||||||||
| Ingrid Lorena Dumez Montero(5) | July 21, 2005 | Housing, August 8, 2005 | 126 | 81 | 279 | August 2020 | UVR | |||||||||||||
| November 12, 2010 | Housing, November 11, 2011 | 153 | 133 | UVR | ||||||||||||||||
| (1) | As the regulatory entity for these purposes, the Central Bank of Colombia (Banco de la República) defines the term “UVR” as Unidad de Valor Real (Real Value Unit), an accounting unit which reflects purchasing power based exclusively on the consumer price index variation certified by the National Statistics Department of Colombia (DANE). The UVR is used to calculate the cost of housing credits in Colombia. This accounting unit allows financial entities to adjust credit values to the cost of living increase in Colombia. |
| (2) | Néstor Saavedra became an executive officer in September 2012. |
| (3) | Jaime Bocanegra became an executive officer in July 2013. |
| (4) | Magda Manosalva became an executive officer in November 2013. |
| (5) | Ingrid Lorena Dumez became an executive officer in May 2014. |
| 76 |
Labor Regulation
In accordance with article 123 of the Colombian Constitution and the article 7th of the Law 1118 of 2006, our employees are considered “public servants”; even though they are subject to the common labor law. As such, their behavior is subject to the rules to those who handle public interests and goods and could be held liable for their illegal actions and omissions pursuant to the following regimes (1) disciplinary (Law 734 of 2002), (2) criminal or (3) civil.
| 3.12.2 | Collective Bargaining Arrangements |
Ecopetrol S.A.
A collective bargaining agreement between us and our main labor unions governs the labor relations we have with our unionized employees, which amounted to 2,941 employees as of December 31, 2014. The agreement also governs the labor relations with the 1,020 non-unionized employees that agreed to abide by it after requesting a waiver of Agreement 01 of 1977.
We currently have three industry-wide labor unions and one company labor union:
| · | Unión Sindical Obrera de la Industria del Petróleo — USO (industry labor union); |
| · | Asociación de Directivos Profesionales, Técnicos y Trabajadores de las Empresas de la Rama de Actividad Económica del Recurso Natural del Petróleo y sus Derivados de Colombia — ADECO (industry labor union); |
| · | Sindicato Nacional de Trabajadores de Empresas Operadoras, Contratistas, Subcontratistas de Servicios y Actividades de la Industria del Petróleo y Similares — SINDISPETROL (industry labor union); and |
| · | Sindicato Nacional de Trabajadores de Ecopetrol — SINCOPETROL (company labor union). |
| · | Asociación de Profesionales de Ecopetrol — ASPEC (company labor union). |
Currently Ecopetrol S.A. does not have any workers in the SINCOPETROL union. This union does not participate in the negotiation process.
Our employees and any employee working for any company in the oil and gas industry may join the USO, ADECO or Sindispetrol. Sincopetrol and ASPEC may only be joined by our employees.
The following are the relevant terms of the five-year collective bargaining agreement with USO, ADECO and Sindispetrol in effect since 2014 and expiring on June 30, 2018. These agreements cover all workers benefiting from the Collective Labor Convention, regardless of whether they are part of any labor union:
| · | Education Subsidy. This subsidy covers 90% of tuition and board expenses and fixed amounts of transportation and textbooks for our employees and their children. |
| · | Health Benefits. We pay 100% of medical expenses for workers and their families. The health benefits include comprehensive health care service, and programs in the prevention of diseases, the supply of medicines and others. |
| · | Six-Months’ Bonus. Ecopetrol S.A. pays an additional 48 days of regular wage to all its workers each year: 24 days of additional regular wage in June and 24 in December. |
| · | Stability Clause. Employees affiliated with the Unión Sindical Obrera de la Industria del Petroleo labor union (USO) who, as of December 1, 2004, had worked over 16 months continuously, cannot be terminated without good cause. 2,379 employees are covered by this clause (26% of employees). |
| 77 |
| · | Retirement Plan for Employees. Employees hired after January 29, 2003 are not covered by our retirement scheme but are covered by the national social security system. 8,693 employees are covered by the national social security system (95% of employees). |
| · | Five-Year Bonus. A cash bonus accrues on a yearly basis and is paid out at the end of each five-year period that an employee works in the Ecopetrol S.A. These bonuses increase incrementally over the length of an employee’s employment with the Ecopetrol S.A., and range from a payment equivalent to 5 days’ minimum wage for an employee who has worked for the Ecopetrol S.A. for a total of 5 years to 45 days’ minimum wage for an employee who has worked for the Ecopetrol S.A. for 45 years. |
| 78 |
| 4. | Financial Review |
The following discussion considers our financial results and the factors affecting those results under Colombian Government Entity GAAP, unless otherwise indicated.
Certain line items from our consolidated financial statements as of December 31, 2012 and 2013 related to the presentation of the consolidated Balance Sheet and the Consolidated Statement of Financial, Economic, Social and Environmental Activities have been reclassified in order to make the presentation of such financial statements comparable to that of our financial statements as of December 31, 2014.
Our consolidated financial statements were consolidated line by line and all transactions and significant balances between affiliates have been eliminated. These financial statements include the financial results of all subsidiary companies controlled by Ecopetrol S.A. See Note 1—Economic entity and principal accounting policies and practices, to the consolidated financial statements included in this Annual Report.
| 4.1. | Factors Affecting Our Operating Results |
Our operating results are affected mainly by international prices of crude oil and, to a somewhat lesser extent, international prices for refined products and natural gas, as well as sales volumes, product mix, and our operational environment. Crude oil prices and volumes are particularly important to the results of our exploration and production segment. This is because as export volumes of crude oil or export prices decrease, so do revenues. Results from our refining activities are also affected by conversion ratios, utilization rates and refining capacity, all of which affect our refining margins. Changes in the value of foreign currencies, particularly the U.S. dollar against the Peso, can also have a significant effect on our financial statements. Finally, terrorist attacks by guerillas against our pipelines and other facilities can lead to loss of revenues in addition to the direct costs of repair.
Sales volumes and prices
The results from the exploration and production segment depend on sales volumes and average local and international prices for crude oil and natural gas that we bring to market. Additionally, sales volumes are affected by the purchase of crude oil and natural gas that we make from our business partners, third parties and the ANH.
We sell crude oil mainly in the international market as exports. We also both process crude oil at the Barrancabermeja and Reficar refineries and sell refined and other petrochemical products in local and international markets.
Local sales and prices
We have a number of crude oil and natural gas long-term supply contracts with local customers, including gas-fired power plants and local natural gas distribution companies. Local sale prices are determined in accordance with existing regulations, contractual arrangements and the spot market linked to international benchmarks.
International Sales and Prices
We export surpluses of crude oil and refined products only after our supply commitments with our refineries and local customers have been fulfilled. International sales have accounted for 63% of our total revenues, on average, for the past three years.
| 79 |
Our commercial strategy focuses on market diversification. We sell our products in various regions such as Asia, Europe, Latin America and the U.S. Gulf Coast. In our negotiations with potential customers, we seek to use the most liquid benchmark reference prices in each region.
Exploration costs
We account for exploratory drilling costs using the successful efforts method, whereby all costs associated with the exploration and drilling of productive wells are initially capitalized. Costs incurred in exploring and drilling of dry or unsuccessful wells are expensed in the period in which the well is determined to be a dry or unsuccessful well and are accounted for under “operating expenses—studies and projects.” Consequently, an increase in the number of exploratory wells we declare as dry or unsuccessful will negatively affect our results and may cause volatility in our operating expenses.
Royalties
Each of our production contracts has its own royalty arrangement. In 1999, a modification to the royalty system established a sliding scale for royalty payments linked to the production level of crude oil and natural gas fields discovered after July 29, 1999, depending on whether the production is crude oil or natural gas, and on the quality of the crude oil produced. Since 2002, the royalty percentage has ranged from 8% for fields producing up to 5,000 bpd to 25% for fields producing in excess of 600 thousand bpd. Producing fields pay royalties in accordance with the applicable royalty rate at the time of the discovery.
From July 2012 until December 2013, pursuant to an agreement with the ANH, we commercialized, on behalf of the ANH, the natural gas received in-kind by the ANH when the producer did not decide to directly commercialize the royalties. Since January 2014, the ANH has collected natural gas production royalties from producers in cash based on a formula linked to the applicable royalty rate, regardless of whether the producer has sold the gas. As a result, we no longer market this gas on behalf of the ANH. In addition, because the royalties are now payable to the ANH in cash, all of the gas we produce is counted as part of our production, without any deduction for royalties.
Purchases of hydrocarbons
We continue purchasing all crude oil delivered to the ANH as royalties by us and by third parties. The purchase price is calculated according to a formula set forth in a contract between us and the ANH that reflects our export sales prices (crudes and products), a quality adjustment for API gravity and sulfur content, transportation rates from the wellhead to the Coveñas and Tumaco ports, the cost of the refining process and a marketing fee. We sell the physical product purchased from the ANH as part of our ordinary business. On December 31, 2014, this contract between the ANH and us was extended until June 30, 2015.
Our purchases of hydrocarbons from the ANH are made in the ordinary course of business, and on terms comparable to those offered to private parties. We have established procurement policies and approval processes for purchases of products and services, which do not depend on whether the counterparties are state-owned entities.
| 4.2. | Effect of Taxes, Exchange Rate Variation, Inflation and the Price of Oil on our Results |
| 4.2.1 | Taxes |
In December 2014, the Colombian Congress adopted Law 1739 of 2014, a new tax reform which introduced significant changes to the Colombian tax system, including the following:
| · | Wealth Tax: a new tax that will be levied from 2015 to 2017 on domestic and foreign companies that, as of January 1, 2015, hold net wealth for tax purposes (assets less allowable liabilities) in Colombia in excess of Ps$1 billion. The applicable rates for this wealth tax are: 1.15% for 2015, 1% for 2016, and 0.4% for 2017, subject to certain exceptions. |
| 80 |
| · | CREE tax rate increase – increase of the CREE tax rate from 8% to 9%. |
| · | CREE surcharge (“Sobretasa al Impuesto de Renta para la Equidad”) – a new surcharge for corporations and entities whose net income for fiscal years 2015 to 2018 is equal to or greater than Ps$800 million. The applicable rates for the CREE surcharge are: 5% for 2015, 6% for 2016, 8% for 2017 and 9% for 2018. |
As a result of these CREE tax changes, the overall corporate income tax rate from 2015 to 2018 will be as follows: 39% in 2015, 40% in 2016, 42% in 2017 and 43% in 2018.
Effect on other taxes
The tax reform has also included other provisions which are relevant to and may impact our results of operations:
| · | An extension of a 0.4% charge on financial transactions (“GMF” for its acronym in Spanish), which will be fully in effect until 2019 and will be progressively reduced from 2020 to 2022. |
| · | A provision under which companies will be eligible for a credit against their income tax liability of up to 2% of the VAT paid on the acquisition or importation of capital assets (i.e., tangible and amortizable assets that are not sold or transferred in the ordinary course of business and that are used for the production of goods and/or services). |
| · | Limitations on the benefit related to the discounting of VAT accrued and paid on the acquisition or importation of heavy machinery for certain basic industries. |
| · | Extension of the current deduction applicable for investments in certain research and development projects as determined by the criteria and conditions established by the Government. |
| · | Exchange rate differences on foreign investments in fixed assets may not be considered items of income or tax expense until the time of disposal of such investments. |
| · | Clarification that the National Gasoline Tax will apply upon the sale, write-off or importation of gasoline, regardless of whether such gasoline is imported for consumption or for sale. |
See Note 16—Taxes, contributions and duties payable, to the consolidated financial statement.
| 4.2.2 | Exchange Rate Variation |
In compliance with Colombian regulations, our results are reported in Pesos, and we maintain our financial books and records in Pesos. However, a substantial majority of our revenues for local sales and exports of crude oil, natural gas and refined products are sold at prices referenced to benchmarks quoted in U.S. dollars.
An appreciation of the Peso has a negative impact on our results of operations because our revenues from exports of crude oil, natural gas and refined products are expressed in Pesos. Costs of imported goods and contracted services expressed in U.S. dollars will also be lower when expressed in Pesos, but on balance, our operating income in Pesos tends to decline when the Peso appreciates, other factors being equal. Conversely, when the Peso depreciates against the U.S. dollar, our reported revenues, costs related to imported goods and services, interest costs, and operating income, all tend to increase.
| 81 |
During 2014 and 2013, the Peso depreciated on average 7.05% and 3.93%, respectively, against the U.S. dollar. During 2012, in contrast, the Peso appreciated against the U.S. dollar on average by 2.7%. Additionally, as of December 31, 2014 and December 31, 2013, the peso depreciated 24.17% and 8.97%, respectively, from the rate a year earlier. As of the December 31, 2012, the peso appreciated 8.98% against the U.S. dollar from the rate a year earlier. The year-end exchange rate affects our reported net financial expenses because of our U.S. dollar net monetary liability position, which increases in terms of Pesos when the Peso depreciates against the dollar from one balance sheet date to the next.
In 2014 and 2013, Ecopetrol S.A. raised US$3,200 million and US$2,500 million, respectively, through international bond issuances and US$288 million through US Eximbank facilities In 2014, Ocensa raised US$500 million through an international bond issuance, while in 2013 Reficar raised US$616 million in U.S. dollar-denominated debt transactions through various export credit agency facilities. In 2012, we did not incur any U.S. dollar-denominated debt.
| 4.2.3 | Effects of Inflation |
Inflation in Colombia has remained relatively stable for the past ten years. As measured by the general consumer price index, average annual inflation in Colombia for the year ending December 31, 2014 was 3.66%. For the years 2013 and 2012, inflation was 1.94% and 2.44%, respectively. Cost inflation in the prices of goods, raw materials and services that are necessary for the development and operation of oil and gas producing assets can vary over time and between each market segment.
The effect of inflation on non-monetary balance sheet accounts was required to be recognized until December 31, 2006. The accumulated inflation adjustments were eliminated in the process of reconciling our financial statements to U.S. GAAP.
| 4.2.4 | Effects of the Price of Oil |
The average price of Brent crude was approximately $99.3 USD/bl in 2014, $108.7 USD/bl in 2013 and $111.7 USD/bl in 2012. As a consequence, the average price of Ecopetrol S.A.’s crude oil basket decreased by $12.3 USD/bl in 2014 compared to 2013, with most of the decline occurring in the fourth quarter of 2014. The average price of our crude oil basket was 87.55 USD/bl in 2014 compared with 98.85 USD/bl in 2013. This decline is mainly explained by a market surplus led primarily by an increase in North American production as well as the higher availability of Canadian crude as a result of higher transport capacity. OPEC elected in November 2014 not to cut its output in response to these developments. In addition to this, global demand was only slightly up in 2014 owing to the decreased economic momentum of Asian and European countries.
| 4.3. | Accounting Policies |
| 4.3.1 | Colombian Government Entity GAAP and Transition to IFRS |
We prepare our consolidated financial statements in accordance with the Colombian Government Entity GAAP. The accounting principles and policies that are summarized in ―Note 1. Economic Entity and Principal Accounting Policies and Practices of our consolidated financial statements included in this Annual Report.
In 2014, Ecopetrol and its subsidiaries began their transition to International Financial Reporting Standards (IFRS) as issued by the International Accounting Standards Board. In accordance with Colombian regulations, Ecopetrol's financial statements will be reported in accordance with IFRS as from January 1, 2015. For more information, please see Note 1—Economic entity and principal accounting policies and practices, to the consolidated financial statements included in this Annual Report.
| 82 |
| 4.3.2 | U.S. GAAP |
As required by SEC rules, we have prepared a reconciliation of our net income and shareholders’ equity to U.S. GAAP. The accounting principles and regulations under Colombian Government Entity GAAP differ in certain significant respects from U.S. GAAP. See Note 33—Differences between Colombian Governmental Entity accounting principles and U.S. GAAP, to the consolidated financial statements for a description of the most significant differences.
Recently Adopted U.S. Accounting Standards
The Company did not adopt authoritative guidance in 2014 that had a material impact on the Company´s consolidated financial statements.
With regard to the ASUs issued in 2013, as of the reporting date, Ecopetrol had no operations within the scope of those ASUs. See Note 33—Differences between Colombian Governmental Entity accounting principles and U.S. GAAP—Recently adopted U.S. Accounting Standards, to the consolidated financial statements for a description of recently U.S. GAAP pronouncements.
| 4.4. | Critical Accounting Judgments and Estimates |
Critical accounting policies are those policies that require us to exercise judgment or involve a higher degree of complexity in the application of the accounting policies that currently affect our financial condition and results of operations. The accounting judgments and estimates we make in these contexts require us to calculate variables and make assumptions about matters that are highly uncertain. In each case, if we had made other estimates, or if changes in the estimates occur from period to period, our financial condition and results of operations could be materially affected.
This information should be read together with Note 1 — Economic entity and principal accounting policies and practices, to our consolidated financial statements for a summary of the principal accounting policies and practices applicable to us. There are many other areas in which we use estimates about uncertain matters, but we believe the reasonably likely effect of changed or different estimates would not be material to our financial presentation.
Oil and Gas Reserves Estimates and Impact on Our Financial Statements
The estimation of hydrocarbon reserves is subject to several uncertainties inherent to the determination of proved reserves, production recovery rates, the timelines with which investments are made to develop the reservoirs and the degree of maturity of the fields.
Crude oil prices have traditionally fluctuated as a result of a variety of factors such as changes in international prices, long-term changes in the demand for crude oil, natural gas and refined products, regulatory changes, inventory levels, increase in the cost of capital, economic conditions, development of new technologies, economic and political events, and local and global demand and supply. Revisions to estimated proved reserves of crude oil and gas and the effect of such price variations are presented in Note 33—Differences between Colombian Governmental Entity accounting principles and U.S. GAAP, to our consolidated financial statements.
| 83 |
Changes in the crude oil and natural gas price may affect the calculation of our estimated proved reserves in the future as well as our estimate of the recoverability of our investment in our oil and gas properties. A decrease in our estimated proved reserves due to pricing may result in the impairment of oil and gas properties.
The calculation of units-of-production depreciation and depletion is a critical accounting estimate that measures the depreciation and depletion of upstream assets. The units of production are equal to the ratio of actual volumes produced to total proved developed reserves (those proved reserves recoverable through existing wells with existing equipment and operating methods) and applied to our asset cost. A decrease in our estimated proved reserves due to lower prices could result in higher depreciation, depletion and amortization expenses.
Proved oil and gas properties held and used by us are reviewed for impairment whenever events or circumstances indicate that the carrying amounts may not be recoverable. Impairments are measured by the amount by which the carrying value exceeds its fair value. Any impairment tests that we perform make use of our long-term price assumptions for the crude oil and natural gas markets and petroleum products, which are different from the unweighted average of the month-end prices during the year which we use in accordance with SEC regulations to calculate our proved reseves. The results of the impairment tests are sensitive to the long-term price assumptions.
Volumes produced and asset costs are known, while proved reserves have a reasonable certainty of recoverability and are based on estimates that are subject to some variability. The impact of changes in estimated proved reserves is treated prospectively by depreciating the remaining book value of the assets over the future expected production, affecting the following year’s net income.
Suspended Exploratory Well Costs
We capitalize exploratory well costs when the well has found a sufficient quantity of reserves to justify its completion as a producing well and the Company is making sufficient progress assessing the reserves and the economic and operating viability of the project. Exploratory well costs that do not meet these criteria are charged as an expense. The facts and circumstances that support continued capitalization of suspended wells as of year-end 2014 are disclosed in Note 33—Differences between Colombian Governmental Entity accounting principles and U.S. GAAP, to our consolidated financial statements.
Impairment of Long-lived Assets
During impairment testing under U.S. GAAP, our management must make reasonable and supportable assumptions and estimates with respect to, among other factors, (1) the market value of reserves, (2) oil fields’ production profiles and future production of refined and chemical products, (3) future investments, taxes and costs, (4) future capital expenditures and useful life for properties, (5) future prices and (6) discount rates. Any change in the variables used to prepare such assumptions and estimates may have a significant effect on the impairment tests.
Financial Derivative Instruments
We may enter into hedging agreements to reduce our exposure to the fluctuations of international crude oil and products prices. Under Colombian Government Entity GAAP, amounts paid and income received under hedging operations is recognized as financial income/expense. We are not permitted to enter into hedging contracts for speculative purposes according to the internal hedging guidelines issued by our Board of Directors.
Under Colombian Government Entity GAAP, our estimates of the value of hedges made throughout the year are based on the spot prices for the date the hedge was entered into, subject to market variations according to the regulation and methodology established by the Superintendency of Finance – Superintendencia Financiera de Colombia.
| 84 |
See Note 1—Economic entity and principal accounting policies and practices, to the consolidated financial statements for more information.
Pension Plans and Other Benefits
The determination of the expense, liability and adjustments in memorandum accounts relating to our pension and other retirement benefits requires us to use judgment in the determination of actuarial assumptions. These include the number of active employees with indefinite term contracts, retirees and their heirs, pension benefits, healthcare and education expenses, the number of temporary employees who will remain with us until retirement, voluntary retirement plans and pension bonuses.
These actuarial assumptions include estimates of future mortality, withdrawal, changes in compensation and discount rate to reflect the time value of money as well as the rate of return on pension bonds and other plan assets. These assumptions are reviewed annually and may differ materially from actual results. See Note 33—Differences between Colombian Governmental Entity accounting principles and U.S. GAAP, to the consolidated financial statements for a sensitivity analysis relating to certain of these assumptions.
Litigation and Tax Assessments
We are subject to claims for substantial amounts, regulatory and arbitration proceedings, tax assessments and other claims arising in the normal course of business. Management and legal counsel evaluate these situations based on their nature, the likelihood that they materialize, and the amounts involved, to decide on any changes to the amounts accrued and/or disclosed. This analysis, which may require considerable judgment, includes assessment of current legal proceedings brought against us and claims not yet initiated. In accordance with management’s evaluation and guidance provided by Colombian Government Entity GAAP, we created provisions to meet these costs when the liability is probable and reasonable estimates of the liability can be made.
Estimates are based on legal counsel’s evaluation of the cases and management’s judgment. For a discussion of differences between Colombian Government Entity GAAP and U.S. GAAP with respect to the accounting for litigation and tax contingencies see Note 33—Differences between Colombian Governmental Entity accounting principles and U.S. GAAP, to our consolidated financial statements.
Income taxes are accounted for under the assets and liability method. Deferred tax assets and liabilities are recognized for the future tax consequences attributable to differences between the carrying amounts of existing assets and liabilities in our financial statements and their respective tax bases. Deferred taxes on assets and liabilities are calculated based on statutory tax rates that we believe will be applied to our taxable income during the years in which temporary differences between the carrying amounts are expected to be recovered. Changes to deferred tax assets and liabilities require technical judgments to interpret and apply complicated tax laws and regulations, and the valuation of deferred tax assets requires management to project future earnings from operations to determine whether the deferred tax assets will be realized. The determination of deferred tax assets and liabilities therefore involves considerable judgment and estimates that could vary materially from actual results.
Abandonment of Fields
Upon completion of our work at a production site, we are required by law to remove equipment and restore disturbed land or seabeds. To estimate the cost of abandoning fields, we include estimated plugging costs and the costs of abandonment of wells, dismantling of facilities and environmental recovery of the areas and wells. Changes resulting from new estimates of the liability for abandonment can occur as a result of changes in economic conditions. We accrue the estimated discounted costs of dismantling and removing these facilities at the time of installation of the assets. We use economic factors from different sources and develop our own internal estimates of future inflation rates and discount rates. The determination of obligation relating to abandonment of fields requires considerable judgment. We believe that the assumptions used in recording our asset retirement costs and obligations are reasonable based on our experience and market conditions. In the past there have not been significant disparities between estimates and asset retirement costs paid, although no assurance can be given that such costs will not exceed the related estimates in the future.
| 85 |
Differences between Colombian Government Entity GAAP and U.S. GAAP in the accounting for costs of abandoning fields are disclosed in Note 33—Differences between Colombian Governmental Entity accounting principles and U.S. GAAP, to our consolidated financial statements.
| 4.5. | Operating Results |
The following discussion is based on information contained in our audited consolidated financial statements and should be read in conjunction therewith.
| 4.5.1 | Consolidated Results of Operations |
The following table sets forth components of our income statement for the years ended December 31, 2014, 2013, and 2012.
| Income Statement (Pesos in millions) | For the Year ended December 31, | % Change | ||||||||||||||||||
| 2014 | 2013 | 2012 | 2014/2013 | 2013/2012 | ||||||||||||||||
| Revenue | 68,925,338 | 70,428,715 | 68,852,002 | (2 | )% | 2 | % | |||||||||||||
| Cost of Sales | 45,054,016 | 42,554,282 | 40,535,508 | 6 | % | 5 | % | |||||||||||||
| Gross Profit | 23,871,322 | 27,874,433 | 28,316,494 | (14 | )% | (2 | )% | |||||||||||||
| Operating Expenses | 7,269,333 | 6,039,703 | 4,973,590 | 20 | % | 21 | % | |||||||||||||
| Operating Income | 16,601,989 | 21,834,730 | 23,342,904 | (24 | )% | (6 | )% | |||||||||||||
| Non-operating income (expenses) | (1,181,242 | ) | 47,478 | (1,011,203 | ) | n.m | (105 | )% | ||||||||||||
| Income before income tax | 15,420,747 | 21,882,208 | 22,331,701 | (30 | )% | (2 | )% | |||||||||||||
| Income tax | 7,135,068 | 8,088,839 | 7,133,395 | (12 | )% | 13 | % | |||||||||||||
| Non-controlling interest | (775,409 | ) | (686,866 | ) | (419,359 | ) | 13 | % | 64 | % | ||||||||||
| Net Income | 7,510,270 | 13,106,503 | 14,778,947 | (43 | )% | (11 | )% | |||||||||||||
| 4.5.1.1 | Total Revenues |
The following table sets forth our principal sources of third-party revenues by business segment for the years ended December 31, 2014, 2013, and 2012. An explanation of how we classify our operations into business segments is included in Section 4.5.2 below.
| 86 |
| 2014 | 2013 | 2012 | %
change sales revenues | |||||||||||||||||||||||||||||||||||||||||
| Revenue by segment | Volume
(barrels equivalent) | Average
price US dollars/barrels | Sales revenues(Pesos in millions) | Volume
(barrels equivalent) | Average
price US dollars/barrels | Sales
revenues (Pesos in millions) | Volume
(barrels equivalent) | Average
price US dollars/barrels | Sales revenues(Pesos in millions) | 2014-2013 | 2013-2012 | |||||||||||||||||||||||||||||||||
| Local Crude oil | 3,573,076 | 68.5 | 442,173 | 9,925,751 | 61.7 | 1,145,278 | 4,621,107 | 69.0 | 823,191 | (61.4 | ) | 39.1 | ||||||||||||||||||||||||||||||||
| Export Crude oil | 207,321,538 | 87.9 | 36,311,352 | 190,106,364 | 100.8 | 35,820,182 | 192,216,579 | 103.9 | 35,886,860 | 1.4 | (0.2 | ) | ||||||||||||||||||||||||||||||||
| Natural gas local | 36,071,793 | 22.4 | 1,615,471 | 27,277,037 | 24.6 | 1,527,691 | 24,702,562 | 25.0 | 1,382,396 | 5.7 | 10.5 | |||||||||||||||||||||||||||||||||
| Export natural gas | 6,706,483 | 31.1 | 423,461 | 9,976,846 | 33.6 | 586,687 | 9,924,841 | 34.5 | 563,411 | (27.8 | ) | 4.1 | ||||||||||||||||||||||||||||||||
| Other income (1) | 584,018 | - | - | 514,567 | - | - | 414,448 | 13.5 | 24.2 | |||||||||||||||||||||||||||||||||||
| Exploration and production sales | 253,672,890 | 39,376,475 | 237,285,998 | 39,594,405 | 231,465,089 | 39,070,306 | (0.6 | ) | 1.3 | |||||||||||||||||||||||||||||||||||
| Local refined products | 97,427,268 | 109.1 | 20,956,935 | 94,683,145 | 116.9 | 20,463,151 | 92,890,866 | 118.9 | 20,068,579 | 2.4 | 2.0 | |||||||||||||||||||||||||||||||||
| Export refined products | 30,034,448 | 91.1 | 5,431,618 | 41,997,257 | 99.1 | 7,854,089 | 41,880,845 | 107.9 | 8,016,228 | (30.8 | ) | (2.0 | ) | |||||||||||||||||||||||||||||||
| Other income (1) | - | 12,951 | - | - | 4,935 | - | (226,488 | ) | 162.4 | (102.2 | ) | |||||||||||||||||||||||||||||||||
| Refining and petrochemicals | 127,461,716 | 26,401,504 | 136,680,402 | 28,322,175 | 134,771,711 | 27,858,319 | (6.8 | ) | 1.7 | |||||||||||||||||||||||||||||||||||
| Transportation services | - | - | 3,147,359 | - | - | 2,512,135 | - | 1,923,377 | 25.3 | 30.6 | ||||||||||||||||||||||||||||||||||
| Transportation and logistics | - | - | 3,147,359 | 2,512,135 | 1,923,377 | 25.3 | 30.6 | |||||||||||||||||||||||||||||||||||||
| Total sales | 381,134,606 | - | 68,925,338 | 373,966,400 | 70,428,715 | 366,236,800 | 68,852,002 | (2.1 | ) | 2.3 | ||||||||||||||||||||||||||||||||||
Note: All intercompany sales transactions have been eliminated in full in order to show our sales to third parties.
| (1) | In the case of the Exploration and Production segment, corresponds to services and sales of refined products (mainly LPG and asphalt) allocated to our exploration and production segment. In the case of the Refining and Petrochemicals segment, corresponds to industrial services. |
In 2014, total revenues decreased by 2% as compared to 2013, mainly due to: 1) a 61.4% decrease in local crude oil revenues as volumes shifted toward export sales as a consequence of higher transport capacity for foreign sales, 2) the impact of an 8.6% reduction in the average price of Brent in 2014 as compared to 2013 and 3) a decrease in the export sales of refined products as a consequence of the shutdown of the Cartagena Refinery. This decrease was partially offset by: 1) an increase in crude export sales, 2), an increase in transportation revenues due to a larger volume of crude oil transported for third parties, 3) the start-up of operations at the Bicentenario Pipeline in November 2013 and 4) the depreciation of Peso against the U.S. dollar in 2014.
In 2013, total revenues increased by 2.3% as compared with 2012, mainly due to 1) a 1.3% increase in revenues from sales of crude and gas sales to third parties, which in turn resulted from higher local sales of crude oil and natural gas that more than offset a small decline in crude oil exports and lower average prices in U.S. dollars; (2) higher local sales of gasolines and medium distillates due to an increase in local demand for these products, (3) a 30.6% increase in the transportation segment sales to third parties due to the change in the business models of ODC and Ocensa from cost to profit centers and (4) the depreciation of Peso against the U.S. dollar in 2013.
| 4.5.1.2 | Cost of Sales |
Our cost of sales was principally affected by the factors described below. See Note 24—Cost of sales, to the consolidated financial statements for more detail.
| 87 |
Cost of sales in 2014 was Ps$45,054 billion, representing a Ps$2,500 billion (6%) increase as compared to 2013, primarily as a result of the following factors:
1) a Ps$1,762 billion, or 14,%, increase in the cost of input purchases mainly corresponding to naphtha for use as a crude diluent, as well as to increased purchases of refined product to substitute for the loss of production resulting from the shutdown of the Cartagena Refinery;
2) a Ps$893 billion increase in the amortization, depletion and depreciation of property, plant and equipment due to higher investments in the Castilla, Chichimene, Quifa and Rubiales fields and the Cupiagua gas plant;
3) a Ps$399 billion increase in costs related to (i) subsoil maintenance, (ii) increased maintenance activity in the Barrancabermeja Refinery and (iii) transportation-related maintenance costs (as a result of the start-up of operations at the Bicentenario Pipeline);
4) a Ps$207 billion increase resulting from the drawdown of crude oil inventories in 2014 as a result of lower production and an increase in purchases;
5) a Ps$1,438 billion decrease due to lower purchases of crude oil royalties from the ANH and other crude association and concession contracts in line with the 2% industry-wide decline in production in Colombia and lower purchased prices for purchased crude, which are indexed to our average export prices of both crude oil and gas.
Cost of sales in 2013 was Ps$42,554 billion, representing a Ps$ 2,018 billion (5%) increase as compared to 2012, primarily as a result of the following factors:
1) purchases of imported products increased by 25.6% in 2013 to Ps$11,862 billion as a result of higher volumes of naphtha purchased for use as a crude diluent, higher purchases of low sulphur gasoline and diesel for blending with our local production to meet local environmental regulations and higher purchases of petrochemicals and industrial products to fulfill our obligations under commercial agreements in the local market;
2) purchases of crude oil and gas from the ANH decreased by 9.7% in 2013 to Ps$7,808 billion as a result of lower purchase prices and a decrease in the volumes of gas purchased;
3) purchases of crude oil from third parties decreased by 19.4% in 2013 to Ps$5,806 billion as a result of lower transportation availability for Ecopetrol S.A. in the Ocensa pipeline;
4) the cost of services contracted with associations, which are pro rata expenses for our joint ventures, increased by 13% in 2013 to Ps$2,295 billion mainly due to our increased production. This increase resulted mainly from higher subsoil maintenance and water treatment costs due to increased sediment in crude oil;
5) maintenance costs increased by 16.6% to Ps$2,241 billion in 2013 due to the integrity program for the reliability of transport infrastructure, higher repair costs for pumping systems and higher costs to resume production after attacks on transportation infrastructure;
6) labor costs increased by 15.1% in 2013 to Ps$1,260 billion mainly due to a 10.2% increase in the number of employees and 3.7% increase in payroll expenses;
7) the cost of services contracted with third parties increased by 20.3% in 2013 to Ps$1,356 billion mainly as a result of an increase in leasing, professional, technological and surveillance services due to increased exploration activity;
| 88 |
| 4.5.1.3 | Operating Expenses |
Operating expenses and selling, general and administrative expenses amounted to Ps$7,269 billion in 2014, a Ps$1,230 billion (20%) increase as compared to 2013, mainly as a result of the following factors. See Note 25—Operating expenses, to the consolidated financial statements for more detail.
| · | a Ps$1,251 billion increase in exploration expenses in 2014 as compared to 2013 due primarily to higher dry well expenses and increased purchases of seismic studies. |
| · | a Ps$195 billion increase in maintenance expenses in 2014 as compared to 2013, as a consequence of the scheduled shutdown of the Cartagena Refinery. |
| · | a Ps$108 billion increase in expenses mainly related to the repairs made in our transportation system due to guerilla attacks and losses through clandestine valves. |
| · | This increase was partially offset by a Ps$363 billion decrease in provisions in 2014 as compared to 2013 as a consequence of the net effect of : 1) Ps$695 billion decrease in the contingency for pension obligations of the company as a result of improved performance of the portfolios of trust funds linked to those pension obligations, and 2) a Ps$258 billion provision for impairment of our upstream properties as a result of recent decreases in international oil prices. |
In 2013, our operating expenses increased by Ps$1,066 billion (21.4%) as compared to 2012, mainly as a result of the following factors:
| · | a 104.2% net increase in provision expenses to Ps$651 billion primarily due to an increase in the calculation of pension liabilities as well as the lower profitability of the portfolios of trust funds linked to the pension obligations of the company (PAP), offset in part by a recovery in provisions for litigation. |
| · | a Ps$353 billion impairment charge for goodwill relating to Offshore International Group and Polipropileno del Caribe S.A. |
| · | a Ps$477 billion (56%) increase in overhead operational expenses in 2013 as compared to 2012 to Ps$1,327 billion due to additional agreements signed with the national army and police force to guarantee the normal course of operation at pipelines and facilities, higher freight and customs charges on export sales and the execution of social investment agreements. |
| · | a 3% increase in taxes to Ps$989 billion mainly due to higher industry and trade taxes stemming from an increase in local sales, higher payments of financial transaction taxes due to increased dividends and loan payments, and a 70.4% increase in the fee charged by the General Comptroller Office to a total of Ps$95 billion, which it receives from all entities surveyed by its audit function. |
Each of our operating segments bears the costs and expenses incurred for product use and marketing and each segment assumes administrative expenses and all non-operational transactions related to its activity. Discussion of operating expenses by business segment is included in the section Financial Review – Operating Results — Segment Performance and Analysis.
| 4.5.1.4 | Non-Operating Income (Expenses) |
Financial Income (expenses). Net financial income mainly includes exchange difference gains or losses and interest expense, yields and interest from our investments, and results from our hedging operations. Financial income amounted to a loss of Ps$671 billion in 2014 as compared to a gain of Ps$46 billion in 2013. The decrease was mainly due to: 1) higher interest expenses as a result of international bond offerings in May 2014 and September 2014 of US$2.0 billion and US$1.2 billion, respectively, 2) the negative impact resulting from the depreciation of the Peso against the U.S. dollar on our US dollar net liability position in the magnitude of Ps$275 billion and 3) Ps$127 billion in increased expenses relating to exchange rate hedging transactions entered into by Ocensa. For more detail see Note 26—Finance Income (expenses), net), to our consolidated financial statements.
| 89 |
Net financial income amounted to a profit of Ps$46 billion in 2013 as compared to a loss of Ps$168 billion in 2012. During 2013, our results reflected a net financial income due to the positive exchange rate gain resulting from the depreciation of the Peso against the U.S. dollar, partially offset by higher interest expenses due primarily to the local and international bond issuance of Ecopetrol S.A. in August and September 2013, respectively.
Pension expenses. Pension expenses include pension liabilities for health and education. This item increased by Ps$77 billion (16%) in 2014 as compared with 2013, mostly as a result of an increase in amortization of actuarial calculation and pensions as a consequence of a calculation update of the health reserve due to a 4.4% increase in the population covered by these services (retirees and their beneficiaries) and higher expected costs of health services per beneficiary. The latter was offset partially by a 4% decrease in the education provisions.
In 2013, pension expenses decreased by Ps$470 billion (50%) as compared to 2012, principally as a result of (1) a decrease in amortization of the actuarial calculation and pensions due to an actuarial calculation update of the health reserve which yielded a decrease of approximately 5.8% in the average health services costs per beneficiary and (2) a 0.2% decrease in the education reserve.
Other net income (expenses). Other net income includes recovery of expenses, other revenues and other recoveries. Other net expenses include legal and contribution expenses unrelated to income. Other net income decreased by Ps$435 billion in 2014 as compared to 2013, mainly due to extraordinary income recognized in 2013 due to certain asset divestments and recovery of expenses.
Other net income increased significantly in 2013 as compared to 2012, mainly due to an increase in recovery of certain expenses (owing mostly to our success in the Quifa field arbitration which resulted in other income of Ps.$ 215 billion) and the sale of certain fixed assets.
| 4.5.1.5 | Income Tax |
Income taxes amounted to Ps$ 7,135 billion in 2014, which is equivalent to an effective tax rate of 46.3%. In 2013, income taxes amounted to Ps$ 8,089 billion, which is equivalent to an effective tax rate of 36.9% and in 2012 amounted to Ps$ 7,133 billion in 2012, which is equivalent to an effective tax rate of 31.9%.
The increase in the effective tax rate from 2013 to 2014 was mainly due to a higher fiscal taxable income of Ecopetrol S.A. resulting from non-deductible foreign exchange gains related to our equity investments in subsidiary companies abroad. The increase in the effective tax rate from 2012 to 2013 was due to the new Equality Income Tax (Impuesto de Renta para la Equidad – CREE).
| 4.5.1.6 | Net income |
As a result of the foregoing, in 2014 our net income decreased by 43% as compared with 2013. In 2013, it decreased by 11% compared with 2012.
| 4.5.1.7 | Segment Performance and Analysis |
In this section, including the tables below, our financial information is presented by segment: Exploration and Production, Refining and Petrochemicals and Transportation and Logistics. See the section Business Overview for a description of each segment.
| 90 |
Our reporting segments have changed since the first quarter of 2013, when we eliminated the marketing and supply segment. This change was made because of the marginal role of the segment with respect to our core business and the support role of marketing and supply to other segments, making it possible to attribute marketing and supply to the other segments. Therefore, the activities of marketing and supply have been reclassified to exploration and production, refining and transportation segments for the year 2012.
The following table presents our sales and net income by business segment for the year ended December 31, 2014, 2013, and 2012:
| Year ended December 31, | % change | |||||||||||||||||||
| Revenues by segment | 2014 | 2013 | 2012 | 2014-2013 | 2013-2012 | |||||||||||||||
| Exploration and Production | 44,756,059 | 49,979,203 | 52,651,123 | (10.5 | )% | (5.1 | )% | |||||||||||||
| Third parties | 39,376,475 | 39,594,405 | 39,070,306 | (0.6 | )% | 1.3 | % | |||||||||||||
| Local Crude oil | 442,173 | 1,145,278 | 823,191 | (61.4 | )% | 39.1 | % | |||||||||||||
| Export Crude oil | 36,311,352 | 35,820,182 | 35,886,860 | 1.4 | % | (0.2 | )% | |||||||||||||
| Natural gas local | 1,615,471 | 1,527,691 | 1,382,396 | 5.7 | % | 10.5 | % | |||||||||||||
| Export natural gas | 423,461 | 586,687 | 563,411 | (27.8 | )% | 4.1 | % | |||||||||||||
| Other income | 584,018 | 514,567 | 414,448 | 13.5 | % | 24.4 | % | |||||||||||||
| Inter-segment net operating revenues | 5,379,584 | 10,384,798 | 13,580,817 | (48.2 | )% | (23.5 | )% | |||||||||||||
| Refining and Petrochemicals | 27,110,257 | 29,235,679 | 29,512,101 | (7.3 | )% | (0.9 | )% | |||||||||||||
| Third parties | 26,401,504 | 28,322,175 | 27,858,319 | (6.8 | )% | 1.7 | % | |||||||||||||
| Local refined products | 20,956,935 | 20,463,151 | 20,068,579 | 2.4 | % | 2.0 | % | |||||||||||||
| Export refined products | 5,431,618 | 7,854,089 | 8,016,228 | (30.8 | )% | (2.0 | )% | |||||||||||||
| Other income | 12,951 | 4,935 | (226,488 | ) | 162.4 | % | (102.2 | )% | ||||||||||||
| Inter-segment net operating revenues | 708,753 | 913,504 | 1,653,782 | (22.4 | )% | (44.8 | )% | |||||||||||||
| Transportation and Logistics | 7,965,712 | 6,215,127 | 4,052,165 | 28.2 | % | 53.4 | % | |||||||||||||
| Third parties | 3,147,359 | 2,512,135 | 1,923,377 | 25.3 | % | 30.6 | % | |||||||||||||
| Inter-segment net operating revenues | 4,818,353 | 3,702,992 | 2,128,788 | 30.1 | % | 73.9 | % | |||||||||||||
| Eliminations of consolidations | (10,906,690 | ) | (15,001,294 | ) | (17,363,387 | ) | (27.3 | )% | (13.6 | )% | ||||||||||
| Total revenues | 68,925,338 | 70,428,715 | 68,852,002 | (2.1 | )% | 2.3 | % | |||||||||||||
Total income by segment includes exports and local sales to third-parties and inter-segment sales. See the section Financial Review–Operating Results–Consolidated Results of Operations–Total Revenues for prices and volumes to third parties.
| Year ended December 31, | % change | |||||||||||||||||||
| Net income by segment | 2014 | 2013 | 2012 | 2014-2013 | 2013-2012 | |||||||||||||||
| Exploration and Production | 6,399,646 | 13,322,109 | 15,638,488 | (52.0 | )% | (14.8 | )% | |||||||||||||
| Refining and Petrochemicals | (897,918 | ) | (1,300,546 | ) | (919,600 | ) | (31.0 | )% | 41.4 | % | ||||||||||
| Transportation and Logistics | 1,766,498 | 1,124,264 | 186,259 | 57.1 | % | 503.6 | % | |||||||||||||
| Eliminations of consolidations | 242,044 | (39,325 | ) | (126,199 | ) | (715.5 | )% | (68.8 | )% | |||||||||||
| Net Income | 7,510,270 | 13,106,502 | 14,778,948 | (42.7 | )% | (11.3 | )% | |||||||||||||
| 91 |
| 4.5.1.8 | Exploration and Production Segment Results |
In 2014, Exploration and Production segment sales were Ps$44,756 billion, compared to Ps$49,979 billion in 2013 and Ps$52,651 billion in 2012. In 2014, our segment sales decreased by 10.5% as compared with 2013 mainly as a result of:
| · | lower inter-segment sales, which decreased by 48%, mainly due to the scheduled shutdown of the Cartagena Refinery since March 2014; |
| · | revenues from sales of crude oil to local third parties decreased by 61% as a consequence of increased export sales resulting from increased transport capacity for export; and |
| · | lower crude oil prices resulted in a 11.4% decrease in our crude oil basket in 2014 as compared to 2013. |
The impact of the foregoing factors was partially offset by an increase in total revenues due to increased sales volumes of local natural gas to third parties mainly due to increased demand from the domestic thermal power and industrial sectors and the increase of crude export sales.
In 2013, Exploration and Production segment sales decreased by 5% as compared with 2012 mainly as a result of the following factors:
| · | in 2013, the inter-segment sales decreased by 24% as compared to 2012 mainly to lower revenues from sales of crude oil to the refining segment as a consequence of a larger proportion of heavier crude in our feedstock mix; |
| · | our third party revenues from exports of crude oil decreased by 0.2% in 2013 as compared to 2012 mainly due to a 3% decrease in the average export price per barrel explained primarily by the lower Brent and Maya benchmarks prices and a decrease in export volumes by 1.1% during the same period due to restrictions in pipeline transportation capacity; |
| · | third party revenues from local sales of crude oil increased by 39.1% in 2013 as compared to 2012 mainly due to a 114.8% increase in volumes sold as a consequence of limited crude export sales; |
| · | third party revenues from local sales of natural gas increased by 10.5% in 2013 as compared to 2012 due to an increase in production (mainly in the Cupiagua and Guajira fields), which led to an increase of 10.4% in the volume of local sales during the same period due to a higher demand of natural gas from the thermoelectric sector; and |
| · | export sales of natural gas to third parties increased by 4.1% in 2013 as compared to 2012 despite a 2.8% decrease in average export prices in U.S. dollars during the same period. Higher sales were due principally to a 0.5% increase in volumes sold as a result of higher production of natural gas. |
Cost of sales affecting our exploration and production segment is mainly related to: 1) the amortization and depletion of our production assets, 2) contracted services in association contracts and 3) the costs related to maintenance, operational services, projects and labor of this segment. In addition, this segment’s costs are impacted by imported naphtha and by transportation services.
In 2014, the cost of sales for this segment increased by 5.4% as compared with 2013, due to the net effect of:
| · | fixed costs increasing by 21.6% in 2014 as compared to 2013 mainly as a result of a Ps$1,065 billion increase in the costs of hydrocarbon transportation services as a result of a ship or pay contract, indexed to the U.S. dollar, between the Upstream and Transportation segments for the Bicentenario pipeline and the effect of the Colombian Peso devaluation and a Ps$306 billion increase in the costs of contracted services due to our direct operation of additional fields; and |
| 92 |
| · | variable costs decreasing by 0.2% in 2014 as compared to 2013 as a result of lower purchases of crude oil, which were partially offset by higher consumption of crude inventories, field amortization and higher purchases of naphta. |
In 2013, the cost of sales for this segment decreased by 2.8% as compared with 2012, due to a decrease in variable costs due to a lower volume of crude oil purchased from third parties as a result of transport capacity restrictions mainly on the pipelines located in the southern region, an increase in fixed costs mainly due to higher depreciation, depletion and amortization and increased costs of subsoil maintenance and water disposal.
Operating expenses increased by 46% in 2014 as compared with 2013 as a result of 1) an increase in dry well expenditures, 2) an increase in expenditures for seismic studies due to increased on-shore activities and 3) higher impairment charges relating to certain of our fields.
In 2013, operating expenses increased by 11.2% as compared with 2012 mainly due to a higher provision for the calculation of the pension liabilities in Ecopetrol S.A.
The segment recorded net income of Ps$6,399 billion in 2014, Ps$13,322 billion in 2013 and Ps$15,638 billion in 2012.
Lifting and Production Costs
The aggregate average production costs on a Colombian Peso basis, has increased to Ps$24,872 per boe during 2014 from Ps$23,601 per boe during 2013, mainly due to:
(1) Decrease of 3.93% in volumes of production in direct and associated contracts (excluding production tests and discovery of undeveloped fields), mainly explained by the effect of: i) pipeline and field disruptions caused by community blockages, public order and violent action matters, ii) pending environmental licenses, iii)operational failures led by instability of the power grid, iv) fluid treatment hurdles, and v) rescheduling of maintenance mainly in the Orinoquia and Southern Regions;
(2) Increased costs in our joint venture contracts as a result of: i) higher water volumes requiring the application of injection techniques for water disposal demanding higher energy consumption, ii) higher repair costs as a consequence of increased terrorist attacks on the oil infrastructure in the Orinoquia and Southern regions and iii) rains that flooded our oilfields (especially in the Orinoquia region) and led to higher costs for maintenance, reconditioning and safety improvements. This increase was partially offset by a decrease in direct operation costs, especially in Orinoquia and Central region due to lower costs obtained once we implemented optimization projects to increase efficiency in processes like: subsurface and surface maintenance, energy savings, fluid treatment, and dilution of heavy crudes.
As a result of the above-mentioned factors, our aggregate average lifting costs on a Peso basis increased in 2014 compared to 2013. However on a dollar basis, it decreased to US$11.29 per boe in 2014 from US$11.57 per boe in 2013 due to a 7.05% depreciation of the average exchange rate of the Colombian Peso against the U.S. dollar.
The aggregate average production costs on a Colombian Pesos basis, increased to Ps$23,601 per boe during 2013 from Ps$23,088 per boe during 2012, mainly due to:
| 93 |
| · | Higher costs from joint ventures, related to higher volumes of water production and related disposal costs, |
| · | Higher maintenance cost, in order to improve the integrity of surface equipment, |
| · | Higher direct operating costs. |
As a result of the above-mentioned factors our aggregate average lifting costs on a Peso basis increased in 2013 compared to 2012. However on a dollar basis it decreased to US$11.57 in 2013 from US$11.93 in 2012 due to a 3.93% depreciation of the average exchange rate of the Colombian Peso against the U.S. dollar.
The difference between the aggregate average lifting costs and aggregate average production costs is that lifting costs do not include the costs related to consumption of hydrocarbons by Ecopetrol in its Production process and sold to our refineries and natural gas liquid plants.
The following table sets forth crude oil and natural gas average sales prices, the aggregate average lifting costs and aggregate average unit production costs for the years ended December 31, 2014, 2013 and 2012.
| 2014 | 2013 | 2012 | ||||||||||
| Crude Oil Average Sales Price (U.S. dollars per barrel)(1) | 87.55 | 98.85 | 103.11 | |||||||||
| Crude Oil Average Sales Price (Ps$per barrel)(1) | 174,274 | 184,768 | 186,004 | |||||||||
| Natural Gas Average Sales Price (U.S. dollars per barrel equivalent) | 23.72 | 26.99 | 27.80 | |||||||||
| Natural Gas Average Sales Price (Ps$per per barrel equivalent) | 47,663 | 50,448 | 49,983 | |||||||||
| Aggregate Average Unit Production Costs (U.S. dollars per boe)(2) | 12.43 | 12.63 | 12.84 | |||||||||
| Aggregate Average Unit Production Cost (Ps$per boe)(2) | 24,872 | 23,601 | 23,088 | |||||||||
| Aggregate Average Lifting Costs (U.S. dollars per boe)(3)(4) | 11.29 | 11.57 | 11.93 | |||||||||
| Aggregate Average Lifting Costs (Ps$per boe)(3)(4) | 22,581 | 21,624 | 21,441 | |||||||||
| (1) | Corresponds to our average sales price on a consolidated basis. |
| (2) | Unit production costs correspond to consolidated average costs on total production volumes net of royalties. Production costs do not include costs related to transport, commercialization and administrative expenses. |
| (3) | Lifting costs per barrel are calculated based on total production (excluding production tests and discovered undeveloped fields), which are net of royalties, and correspond to our lifting costs on a consolidated basis. |
| (4) | The cost indicator is calculated by using the cost of production (does not include costs related to hydrocarbons consumption by Ecopetrol in the production process, such as by our refineries and natural gas liquid plants) and dividing by the net produced volume (excluding royalties) as the denominator. |
| 94 |
| 4.5.1.9 | Transportation and Logistics Segment Results |
In 2014, our transportation and logistics segment sales were Ps$7,966 billion compared to Ps$6,215 billion in 2013 and Ps$4,052 billion in 2012. This 28.2% increase in 2014 as compared with 2013 was mainly due to higher capacity and volume of crude oil and naphtha transported by Cenit, Ocensa and ODL, the start-up of Bicentenario Pipeline in November 2013 and the positive effect on our U.S. dollar-indexed transportation fees resulting from the devaluation of the Peso against the U.S. dollar.
In 2013, our transportation and logistics segment sales increased by 53% as compared with 2012 mainly due to: 1) the new profit-center model for the segment; 2) an increase in the transported volumes of crude oil associated with higher crude oil production in Colombia and 3) higher volume of products transported, mainly as a result of higher volumes of naphtha transported to dilute heavy crude oil.
The cost of sales for our transportation and logistics segment is mainly related to: 1) project costs associated with the maintenance of transportation networks and 2) the construction and conversion of existing pipelines for the transportation of heavy crude oil.
The cost of sales amounted Ps$3,866 billion in 2014, Ps$3,519 billion in 2013 and Ps$2,952 billion in 2012. The cost of sales for this segment increased by 9.9% in 2014 as compared with 2013 mainly due to an increase of fixed costs associated with operating supplies and depreciation due to the start of operation of the Bicentenario Pipeline.
The cost of sales for this segment increased by 19.2% in 2013 as compared with 2012 mainly due to 58.6% change in variable costs as a result of an increase in transported volumes (especially of heavy crude oil). Fixed costs increased 13.7% mainly due to an increase in the costs associated with the development of our pipeline integrity program.
In 2014, operating expenses increased by 5.5% as compared with 2013 due to the emergencies generated by attacks on our transportation infrastructure. In 2013, operating expenses decreased by 20.3% compared with 2012, largely as a result of different capitalization criteria of Ecopetrol S.A. and Cenit for transportation assets when, as part of the transfer of assets to Cenit, Cenit recognized expenses as part of property, plant and equipment.
The segment recorded a net income of Ps$1,767 billion in 2014, Ps$1,124 billion in 2013 and Ps$186 billion.
| 4.5.1.10 | Refining and Petrochemicals Segment Results |
In 2014, the refining and petrochemical segment sales were Ps$27,110 billion compared to Ps$29,236 billion in 2013 and Ps$29,512 billion in 2012. In 2014, sales of refined products and petrochemicals decreased by 7% as compared with 2013, mainly due to: 1) a decrease in the international price of fuels and 2) a drop in export sales volumes due to the shutdown of the Cartagena Refinery in March 2014 in preparation for the new refinery. Sales decreased less than production because, given reduced output from the Cartagena Refinery, this segment purchased and resold refined products to meet domestic demand.
In 2013, sales of refined products and petrochemicals decreased by 1% as compared with 2012 mainly due to lower intersegment sales of naphtha and the scheduled shutdown of the U-250 unit in the Barrancabermeja Refinery. Total refining and petrochemicals segment sales to third parties increased by 1.7% mainly as a result of the higher demand for gasoline and middle distillates from the automotive, aviation and mining sectors.
| 95 |
The cost of sales for our refined products and petrochemicals segment is mainly related to the purchase of crude oil and natural gas for our refineries, imported products to substitute for the loss of production due to the planned shutdown of the Cartegena Refinery, feed stock transportation services, services contracted for maintenance of the refinery and the amortization and depreciation of refining assets. Cost of sales amounted Ps$25,947 billion in 2014 compared to Ps$29,214 billion in 2013 and Ps$29,423 billion in 2012.
In 2014, the cost of sales for this segment decreased 11% as compared with 2013, principally due to lower international oil prices, reduced purchases of crude oil mainly as a consequence of the shutdown of Refinería de Cartagena and lower imports of jet and diesel fuels due to increased production in the Barrancabermeja Refinery. This decrease was partially offset by higher imports of fuels (mainly gasoline) to meet demand in the north coast of the country because of the shutdown of Refineria de Cartagena.
In 2013, cost of sales for this segment decreased by 0.7% as compared with 2012 due to a 1.4% decrease in variable costs, which accounts for 93% of total costs, mainly as a result of the reduction in throughput of Barrancabermeja refinery as a result of crude unit U-250’s scheduled shutdown and lower availability of light crudes. On the other hand, fixed costs increased by 9.6%, primarily as a consequence of the 2012 tax reform, which required us to assume a higher VAT tax burden.
In 2014, the operating expenses decreased by 6.7% as compared with 2013 mainly due to a lower pension liabilities provision which was partially offset by an increase in loss from fixed assets from Reficar mainly due to obsolescence. In 2013, operating expenses increased by 75% as compared with 2012 mainly due to a higher pension provision.
The operating margin in 2014 was -1.3%, compared to -5.5% in 2013. The increase in the operating margin was explained principally by a higher decrease in the oil price (feedstock) compared to the decrease in fuel prices (output).
The refining and petrochemicals segment recorded a net loss of Ps$898 billion in 2014, Ps$1,301 billion in 2013 and Ps$920 billion in 2012.
| 4.6. | Liquidity and Capital Resources |
Our principal sources of liquidity in 2014 were cash flows from our operations amounting to Ps$17,505 billion and cash flows from financing activities, mainly from the proceeds of our additional indebtedness, which totaled Ps$7,153 billion.
Our principal uses of liquidity in 2014 were 1) Ps$15,682 billion in capital expenditures, which included investments in natural and environmental resources and reserves and additions to our property, plant and equipment and 2) dividend payments for the fiscal year 2014 amounting to Ps$12,558 billion.
| 4.6.1 | Review of Cash Flows |
Cash from operating activities
Net cash provided by operating activities decreased by 0.10% in 2014 as compared with 2013, mainly as a result of 1) a 2% drop in our revenues resulting from the decrease in international prices of crude oil later in the year, 2) higher cost of sales mainly resulting from higher naphtha and ultra low sulfur diesel purchases, and 3) an increase in dry well expenditures and purchases of seismic studies, partially offset by costs for purchased crude oil, gas and refined products and lower working capital needs.
Net cash provided by operating activities decreased by 17% in 2013 compared with 2012 as a result of a 5% increase in cost of sales mostly due to the increase in 1) purchases of imported products, mainly naphtha and ultra low sulfur diesel, 2) higher service costs in association contracts mainly for water treatment, 3) maintenance costs for the pipeline integrity program and 4) labor costs. The 21% increase in operating expenses in 2013 negatively impacted net cash as well, compared with 2012.
| 96 |
Cash used in investing activities
In 2014, net cash used in investing activities increased by 46% as compared with 2013 mainly due to 1) larger investments in capital expenditures mainly in Cartagena and Barrancabermeja Refineries modernization projects and investments in Castilla, Rubiales and Chichimene fields 2) a lower net cash contribution from purchases and sales of fixed income investments.
Net cash used in investing activities decreased by 42% in 2013 as compared with 2012 mainly due to (1) a 49% reduction of investments for liquidity purposes, 2) a 19% decrease in investments in property, plant and equipment and natural resources and 3) a 13% decrease in the redemptions and sales of securities, the effect of which was offset in part by a 12% increase in natural resources investments.
Cash used in financing activities
Net cash used in financing activities decreased 24% in 2014 compared with 2013 mainly due to a 14% decrease in dividend payments.
Net cash used in financing activities increased 110% in 2013 compared with 2012 mainly due to the 73% increase in dividend payments which was partially offset by cash resources from financial obligations which increased 47%, mainly from international and local bond issuances from Ecopetrol S.A.
| 4.6.2 | Capital Expenditures |
The following table sets forth our consolidated capital expenditures for each of our business segments for 2014, 2013, and 2012.
| For the year ended December 31, | ||||||||||||
| 2014 | 2013 | 2012 | ||||||||||
| (Pesos in millions) | ||||||||||||
| Exploration and Production | 9,848,039 | 9,622,932 | 8,225,642 | |||||||||
| Refining and Petrochemicals | 4,251,036 | 3,835,556 | 4,460,105 | |||||||||
| Transportation and Logistics | 1,583,317 | 766,326 | 2,782,115 | |||||||||
| Total | 15,682,392 | 14,224,814 | 15,467,862 | |||||||||
Our investment plan approved for 2015 totals US$7,860 million. The investments will be distributed as follows: 61% for exploration and production, 16% for refining and petrochemicals, and 23% for transportation and logistics.
The resources required for the investment plan will be funded through internal cash generation, divestment of non-strategic assets and financing. The Company has borrowing capacity, investment grade rating and access to capital markets in Colombia and abroad.
| 4.6.3 | Dividends |
In 2014, we paid dividends of Ps$12,558 billion to our shareholders, including the Nation. As of December 31, 2014, we had no outstanding obligations to pay dividends.
On March 26, 2015, our shareholders at the ordinary general shareholders’ meeting approved dividends for the fiscal year ended December 31, 2014 amounting to Ps$5,469 billion, or Ps$133 per share, based on the number of outstanding shares as of December 31, 2014.
The dividends corresponding to the Nation will be paid in four installments. The first payment will be made on October 23, 2015, the second will be made on November 20, 2015, the third will be made on December 15, 2015 and the fourth will be made between December 21, 2015 and March 11, 2016. The dividends corresponding to minority shareholders will be paid on a single installment on June 22, 2015.
| 97 |
No interest will accrue on the above-mentioned payments.
| 4.7. | Financial Indebtedness and Other Contractual Obligations |
As of December 31, 2014, we had outstanding consolidated indebtedness of Ps$35,649 billion, which corresponded mainly to the following long term transactions:
| Company | Type | Initial Date | Original Amount | Maturity | Interest Rate | Amortization | ||||||||
| Ecopetrol S.A. | Bonds | July 23, 2009 | USD $1,500 million | July 23, 2019 | 7.625 | % | Bullet | |||||||
| September 18, 2013 | USD $350 million | September 18, 2018 | 4.250 | % | Bullet | |||||||||
| September 18, 2013 | USD $1,300 million | September 18, 2023 | 5.875 | % | Bullet | |||||||||
| September 18, 2013 | USD $ 850 million | September 18, 2043 | 7.375 | % | Bullet | |||||||||
| May 28, 2014 | USD $2,000 million | May 28, 2045 | 5.875 | % | Bullet | |||||||||
| September 16, 2014 | USD $1,200 million | January 16, 2025 | 4.125 | % | Bullet | |||||||||
| December 1, 2010 | COP $97,100 million | December 1, 2015 | Floating | Bullet | ||||||||||
| December 1, 2010 | COP $138,700 million | December 1, 2017 | Floating | Bullet | ||||||||||
| December 1, 2010 | COP $479,900 million | December 1, 2020 | Floating | Bullet | ||||||||||
| December 1, 2010 | COP $284,300 million | December 1, 2040 | Floating | Bullet | ||||||||||
| August 27, 2013 | COP $120,950 million | August 27, 2018 | Floating | Bullet | ||||||||||
| August 27, 2013 | COP $168,600 million | August 27, 2023 | Floating | Bullet | ||||||||||
| August 27, 2013 | COP $347,500 million | August 27, 2028 | Floating | Bullet | ||||||||||
| August 27, 2013 | COP $262,950 million | August 27, 2043 | Floating | Bullet | ||||||||||
| Bank Loan* | May 27, 2013 | COP $1,839 billion | May 27, 2025 | Floating | Semi-annual | |||||||||
| ECA | March 22, 2013 | USD $245 million | July 25, 2023 | Floating | Semi-annual | |||||||||
| March 22, 2013 | USD $151 million | July 6, 2019 | Floating | Semi-annual | ||||||||||
| Reficar | Project Finance | December 30, 2011 | USD $ 3,497 million | December 20, 2027 | Floating / Fixed | Semi-annual | ||||||||
| Ocensa | Bond | May 7, 2014 | USD $500 million | May 7, 2021 | 4.000 | % | Bullet | |||||||
| Oleoducto Bicentenario | Bank Loan | July 5, 2012 | COP $2,100 billion | July 5, 2024 | Floating | Quarterly | ||||||||
| ODL | Bank Loan* | August 1, 2013 | COP $647,029 million | August 1, 2020 | Floating | Quarterly | ||||||||
| * | Bank Loans were refinanced from its original conditions. |
The main new long term debt transactions executed in 2014 were international bonds, as follows:
| · | the issuance by Ecopetrol S.A.of US $2,000 million (Ps $4,785 billion) aggregate principal amount of SEC-registered 5.875% Notes due May 2045, issued in May 2014. The notes were listed on the NYSE. |
| 98 |
| · | the issuance by Ecopetrol S.A. of US $1,200 million (Ps $2,870 billion) aggregate principal amount of SEC-registered 4.125% Notes to due January 2025, issued in September 2014. The notes were listed on the NYSE. |
| · | the issuance by Ocensa in May 2014, of US $500 million (Ps$1,196 billion) aggregate principal amount of its 4.00% Notes due 2021. The Notes were unregistered and issued pursuant to Rule 144A/Reg S. |
Contractual Obligations
We enter into various commitments and contractual obligations that may require future cash payments. The following table summarizes our contractual obligations as of December 31, 2014.
| Payments due by period | ||||||||||||||||||||
| Ps$ millions | Total | Less than 1 year | 1 to 3 years | 3 to 5 years | More than 5 years | |||||||||||||||
| Contractual Obligations: | ||||||||||||||||||||
| Employee Benefit Plan | 27,081,826 | 1,071,196 | 2,215,947 | 2,389,112 | 21,405,571 | |||||||||||||||
| Contract Service Obligations | 11,579,822 | 4,873,992 | 6,059,789 | 320,541 | 325.500 | |||||||||||||||
| Operating Lease Obligations | 419,274 | 14,176 | 26,479 | 55,699 | 322,920 | |||||||||||||||
| Natural Gas Supply Agreements | 1,910,410 | 160,122 | 533,491 | 415,205 | 801,601 | |||||||||||||||
| Purchase Obligations | 1,464,795 | 961,522 | 439,558 | 16,914 | 46,800 | |||||||||||||||
| Energy Supply Agreements | 2,385,454 | 217,178 | 1,668,804 | 73,255 | 426,218 | |||||||||||||||
| Capital Expenditures | 4,873,706 | 3,911,667 | 895,420 | 50,799 | 15,820 | |||||||||||||||
| Build, Operate, Maintain and Transfer Contracts (BOMT) | 345,009 | 70,467 | 127,530 | 69,290 | 77,722 | |||||||||||||||
| Capital (Finance) Lease Obligations | ||||||||||||||||||||
| Financial Sector Debt | 13,853,131 | 2,128,426 | 3,335,629 | 3,309,171 | 5,079,906 | |||||||||||||||
| Bonds | 20,321,942 | 97,100 | 1,097,011 | 5,264,820 | 13,863,011 | |||||||||||||||
| Total | 84,253,377 | 13,505,846 | 16,399,659 | 11,964,805 | 42,365,068 | |||||||||||||||
| 4.8. | Off Balance Sheet Arrangements |
As of December 31, 2014, we did not have off-balance sheet arrangements of the type that is required to be disclosed under Item 5.E of Form 20-F.
| 4.9. | Trend Analysis and Sensitivity Analysis |
Trend Analysis
After a decade of strong growth that led Ecopetrol to establish itself as one of the 35 largest oil companies in the world, the Company is currently in the approval stage of the new strategy aimed to generate sustainable value to shareholders.
Consistent with the crude oil price environment and the Company’s focus on value creation, Ecopetrol revised its investment plan, prioritizing investments that maximize value for shareholders. As a result, the Group's investment plan totals US$7.860 billion for 2015, 9% lower than capital expenditures made in 2014, in which the predominant percentage of funds will be allocated toward improving production, completing the modernization of the Cartagena refinery, and strengthening transportation capacity. A further reduction of international crude oil prices could result in a delay or a change in our capital expenditure plan, in particular delaying exploration and development activities.
| 99 |
We are engaged in different initiatives aimed at aligning cost structures in our different business segments, streamlining the corporate structure and the optimization of support processes. For 2015 our budget estimates savings of around US$3.6 billion, out of which US$2.9 billion come mainly from lower value of purchases of crude oil, diluent and products due to the price declining and US$0.7 billion from lower maintenance, operational and administrative expenses. Under a scenario in which current prices continue declining, additional savings would be required in order to preserve the cash flow of the Group without risking the safety of our people, the environment and our facilities.
Our exports, which represented 61% of our total sales in 2014, will continue to be our primary source of revenues, including expected exports of premium products from the Cartagena refinery, which is expected to resume operations during the second half of 2015.
We anticipate that heavy crude oil indexes, as Maya, will remain under pressure by the larger availability of Canadian crudes in the US Gulf Coast. In spite of this, we expect the Maya-Brent differential to narrow to between US$10 and US$12 per barrel, below the US$13 per barrel differential observed in 2014, due to a greater decline in the price of light crudes, such as Brent.
We believe our strategy of diversifying export destinations and selling under term contracts with fixed discounts to benchmark prices will help us mitigate the negative impact of the current crude oil oversupply on the discounts from our export basket. We expect our crude basket to reflect an approximately US$11 per barrel average discount to Brent crude in 2015.
In terms of production, the Company seeks to achieve an average production of 760,000 boe per day in 2015. Our investments are being allocated to the highest value projects in our portfolio fitting the available cash. As a consequence, some development projects have been postponed or delayed, which could limit growth in production in future years.
Our exploration activities in 2015 include drilling in the Colombian Caribbean offshore and the US Gulf of Mexico, as well as in the Colombian onshore. These activities will build on the first deep water discovery in Colombia, the Orca-1 well, completed in 2014 by Petrobras (40%), in joint venture with Ecopetrol (30%) and Repsol (30%). However, a trend of even lower crude prices could affect the development of some of the new discoveries. In refining, we anticipate that output from the modernized Cartagena refinery, together with products from our refinery at Barrancabermeja, will be sufficient to meet domestic Colombian demand for diesel and jet fuel for the next five years.
In Transportation and logistics, we are striving to implement world-class operational standards and practices and an efficient development of our transport and logistics infrastructure. A lower production outlook for Colombia could lead us to revise and postpone some investments for the expansion of our transportation network. For more information on our planned pipeline projects, see the section Business Overview–Transportation and Logistics–Open Access Business Model–Pipelines.
Furthermore, a long-term trend of lower crude oil prices would result in the de-booking of some of our proved reserves. See the section Risk Review–Risk Factors.
Sensitivity Analysis
The following table provides information about the sensitivity of our results as of December 31, 2014, to variations of US$1 in the price of Brent crude and of 1% in the COP$/US$ exchange rate.
| 100 |
| Income Statement 2014 | Income | Difference Between Real 2014 and Case Brent | Income | Difference Between Real 2014 and Case TRM | ||||||||||||||||
| (Ps$ in billions) | ||||||||||||||||||||
| Local Revenue | 26,715.01 | 26,919.08 | 204.06 | 26,829.46 | 114.44 | |||||||||||||||
| Export Revenue | 42,210.32 | 42,507.50 | 297.18 | 42,331.66 | 121.34 | |||||||||||||||
| Total Revenue | 68,925.34 | 69,426.58 | 501.24 | 69,161.12 | 235.78 | |||||||||||||||
| Cost of Sales | 45,054.02 | 45,254.82 | 200.80 | 45,132.59 | 78.57 | |||||||||||||||
| Selling Operating Expenses | 5,591.94 | 5,591.94 | 0.00 | 5,591.94 | 0.00 | |||||||||||||||
| Administrative Operating Expenses | 1,677.39 | 1,677.39 | 0.00 | 1,677.39 | 0.00 | |||||||||||||||
| Operating Profit | 16,601.99 | 16,902.42 | 300.43 | 16,759.19 | 157.21 | |||||||||||||||
| Non-Operating Income (Expenses) | (1,181.24 | ) | (1,181.24 | ) | 0.00 | (1,181.24 | ) | 0.00 | ||||||||||||
| Profit before Income Tax | 15,420.75 | 15,721.18 | 300.43 | 15,577.95 | 157.21 | |||||||||||||||
| Income Tax | (7,135.07 | ) | (7,150.41 | ) | (15.35 | ) | (7,155.51 | ) | (20.44 | ) | ||||||||||
| Minority Interest | (775.41 | ) | (775.41 | ) | 0.00 | (775.41 | ) | 0.00 | ||||||||||||
| Net Income | 7,510.27 | 7,795.36 | 285.09 | 7,647.03 | 136.76 | |||||||||||||||
| (1) | Brent = US$99.58 per barrel |
| (2) | TRM = COP$2000.33/US$1 |
Assumptions for the Sensitivity Analysis of Financial Statements
| · | The base scenario on which our sensitivity analysis is made corresponds to the Consolidated Statements of Financial, Economic, Social and Environmental Activity or Income Statement for 2014, as presented elsewhere in this annual report. |
| · | The sensitivity of the Brent price index is the increase of one U.S. dollar per barrel of crude oil in the average Brent reference price based on a 365-day year for 2014. Prices assumed correspond to realized prices for crude oil, natural gas and refined products for 2014, adjusted to account for the differences between such realized prices and the Brent reference price. |
| · | The sensitivity of our results to changes in the exchange rates is the 7.05% average depreciation of the Peso against the U.S. dollar during 2014. Prices assumed correspond to realized prices of crude oil, natural gas and refined products in 2014, proportionally adjusted to account for differences between actual and the monthly average exchange rate. |
The table below sets forth the line items that are being affected by the variation on the reference prices or the average exchange rate.
| 101 |
| VARIATION ON BRENT REFERENCE PRICE | VARIATION ON AVERAGE EXCHANGE RATE |
| OPERATING INCOME | |
| Local Sales | Local Sales |
| Crude Oil | Crude Oil |
| Refined products | Refined products |
| Natural gas | Natural gas |
| Exports | Exports |
| Crude Oil | Crude Oil |
| Refined products | Refined products |
| Natural gas | Natural gas |
| COST OF SALES | |
| Local purchases | Local purchases |
| Purchases from business partners | Purchases from business partners |
| Purchases of hydrocarbons from the ANH | Purchases of hydrocarbons from the ANH |
| Purchases of Natural gas | Purchases of Natural gas |
| Imports | Imports |
| Crude Oil (not required for 2014) | Crude Oil |
| Products | Products |
| NON-OPERATING INCOME | |
| Exchange income | |
| Exchange loss | |
| 5. | Risk Review |
| 5.1. | Risk Factors |
The risks discussed below could have a material adverse effect, separately or in combination, on our business’s operating results, cash flows, liquidity and financial condition. Investors should carefully consider these risks.
| 5.1.1 | Risks Related to Our Business |
This section describes the most significant potential risks to our business.
Our crude oil and natural gas reserve estimates involve some degree of uncertainty and may prove to be incorrect over time, which could adversely affect our ability to generate revenue.
Reserves estimates are prepared using generally accepted geological and engineering evaluation methods and procedures. Estimates are based on geological, topographical and engineering facts but also depend on many factors and assumptions, including various assumptions that are based on conditions in existence as of the dates of the estimates. Any material changes in those conditions or other factors affecting those assumptions could impair the quantity and value of our reserves, and actual reserves and production may vary materially from estimates presented in this Annual Report.
| 102 |
Hydrocarbon reserves presented in this Annual Report were calculated in accordance with SEC regulations. As required by those regulations, reserves were valued based on the unweighted average of closing prices for the first day of each month in the 12-month periods ended December 31, 2014, 2013 and 2012, as well as other conditions in existence at those dates. For 2014, the average of closing prices for the first day of each month in the 12-month period was Brent crude oil of US$101.80 per barrel.
Any significant future price change could have a material effect on the quantity and present value of our proved reserves. The average benchmark closing prices of Brent crude oil for the first day of the first four months of 2015 was US$58.01 per barrel. Unless crude oil prices increase during the remainder of 2015 to levels well in excess of those currently expected by market participants, a portion of our proved reserves, and possibly a material portion, would be deemed uneconomic and no longer be classified as proved as of December 31, 2015. For more information, see the section Business Overview–Exploration and Production–Reserves.
Any downward revision in our estimated quantities of proved reserves would indicate lower future production volumes, which could result in higher expenses for depreciation, depletion and amortization for properties to which we apply the units of production method for calculating these expenses. These higher expenses, and any lower revenues as a result of actual production volumes and realized prices, could adversely impact our results of operations and financial condition. In addition, estimated proved reserves are used to calculate future cash flows from oil and gas properties, which are used to assess whether any impairment loss has occurred with respect to our oil and gas properties. The smaller is the volume of estimated reserves, the higher is the likelihood of asset impairment.
Achieving our long-term growth prospects depends on our ability to execute our Strategic Plan — specifically, the discovery and successful development of additional reserves.
Our long-term growth objectives depend largely on our ability to discover and/or acquire new reserves, and in turn successfully develop them and to improve our recovery factor. Our exploration activities expose us to the inherent risks of drilling including the risk that we will not discover commercially productive crude oil or natural gas reserves and the risk that some exploratory wells initially budgeted for may be drilled at a later stage or not be drilled at all. The costs associated with drilling wells are often uncertain, and numerous factors beyond our control may cause drilling operations to be curtailed, delayed or cancelled.
If we are unable to successfully discover and develop additional reserves, or if we do not acquire properties having proved reserves, our level of proved reserves will decline. Failure to secure additional reserves may impede us from achieving or maintaining production targets, and may have a negative impact on our results of operation and financial condition.
See the section Strategy and Market Overview–Our Corporate Strategy for a discussion of our Strategic Plan.
Our business depends substantially on international prices for crude oil and refined products. The prices for these products are volatile; a sharp decrease could adversely affect our business prospects and results of operations.
As of December 2014, in Ecopetrol S.A., nearly 96% of our revenues came from sales of crude oil, natural gas and refined products and 99% of our revenues from the sales of these products are indexed to international reference prices or benchmarks such as Brent and fuel oil. Consequently, fluctuations in those international indexes have a direct effect on our financial condition and results of operations.
| 103 |
Prices of crude oil, natural gas and refined products have traditionally fluctuated as a result of a variety of factors including, among others, competition within the oil and natural gas industry; changes in international prices of natural gas and refined products; long-term changes in the demand for crude oil, natural gas and refined products; regulatory changes; inventory levels; changes in the cost of capital; adverse economic conditions; global financial crises, such as the financial crisis of 2008; development of new technologies; global and regional economic and political developments in the Organization of the Petroleum Exporting Countries, or OPEC; the willingness and ability of the OPEC and its members to set production levels and prices; local and global demand and supply for crude oil, refined products and natural gas; trading activity in oil and natural gas; transactions in derivative financial instruments related to oil and gas; development or availability of alternative fuels; weather conditions; natural events or disasters; and terrorism and global conflict.
Ecopetrol S.A. has not entered into transactions that hedge the risk of changes of oil or gas prices. Therefore, any substantial or extended declines in international crude oil prices may have a material adverse effect on our business, results of operations and financial condition, and the value of our proved reserves. In addition, a reduction of international crude oil prices could result in a delay or a change in our capital expenditure plan, in particular delaying exploration and development activities, thereby delaying the development of reserves and affecting future cash flows.
Changes in the Peso/U.S. dollar exchange rate could have an adverse effect on our financial condition and results of operations given the amount of U.S. dollar denominated debt obtained by the company and the fact that most of our revenues is derived from sales of products quoted in or with reference to U.S. dollars.
Most of our revenues is derived from sales of products quoted in or with reference to U.S. dollars. The impact of fluctuations in exchange rates, especially the Peso/U.S. dollar rate, on our operations has been and may continue to be material. From a cash flow perspective, as exports still account for a large portion of our sales, a substantial share of our liquid assets are held in U.S. dollars and gain value when converted into Pesos as the Peso depreciates against the U.S. dollar and lose value when converted into Pesos as the Peso appreciates against the U.S. dollar.
The U.S. dollar/Peso exchange rate has fluctuated during the last several years. The Peso depreciated 3.9% on average against the U.S. dollar in 2013, and in 2014 depreciated 7.1%. When the Peso appreciates against the U.S. dollar, our revenues from exports decrease when converted into Pesos. However, imported goods, oil services and interest on external debt denominated in U.S. dollars become less expensive for us. Conversely, when the Peso depreciates against the U.S. dollar, our revenues from exports, when converted into Pesos, increase, and our imports and external debt service become more expensive. Because as of December 31, 2014 our U.S. dollar-denominated liabilities are almost four times as much as our U.S. dollar denominated assets, future depreciation in the exchange rate of the Peso against the U.S. dollar may adversely affect our financial results when converted into Pesos and our ability to comply with our obligations under our existing indebtedness and our ability to pay dividends
Increased competition from local and foreign crude oil companies may have a negative impact on our ability to gain access to additional crude oil and natural gas reserves in Colombia.
We must bid for exploration blocks offered by the ANH, the governmental entity responsible for promoting oil and gas investments in Colombia, establishing terms of reference for exploration rounds and assigning exploration blocks to domestic and foreign oil and gas companies via competitive rounds. This means we compete under the same conditions as other domestic and foreign oil and gas companies, and receive no special treatment. Our ability to obtain access to potential production fields also depends on our ability to evaluate and select potential hydrocarbon-producing fields and to adequately bid for these exploration fields.
We are also exposed to international competition as a result of our international exploratory activities. Currently, we are developing exploratory activities in Brazil, Peru and the Gulf of Mexico, where we face competition from other oil and gas companies operating in those locations.
If we are unable to adequately compete with local and foreign oil companies, or if we cannot enter into joint ventures with market players with exploration projects where we could potentially find additional reserves, we may be limited to conducting exploration activities in less attractive blocks. This could reduce our share of the market and, in turn, adversely affect our financial condition.
| 104 |
If operational risks to which we are exposed in Colombia or overseas materialize, the health and safety of our workforce, the local community and the environment may be affected. In addition, we may suffer a disruption or shutdown of our operational activities.
Our exploration, production, refining and transportation activities in Colombia and in the foreign countries in which we operate are subject to industry-specific operating risks, some of which, despite our internal procedures and adherence to industry practices, are beyond our control. Our operations may be curtailed, delayed or cancelled due to adverse or abnormal weather conditions, natural disasters, equipment failures or accidents, oil or natural gas spills or leaks, shortages or delays in the availability or in the delivery of equipment, delays or cancellation of environmental licenses or other government authorizations, fires, explosions, blow-outs, surface cratering, pipeline failures, theft and damage to our transportation infrastructure, sabotage, terrorist attacks and criminal activities.
Some of our operations in Colombia and abroad could be conducted in remote and uninhabited locations which involve health and safety risks that could affect our workforce. By our own Company policy and practices, as well as under Colombian law and international industrial safety regulations, we are required to have health and safety practices that minimize risks and health issues faced by our workforce. Failure to comply with health and safety regulations in the jurisdictions where we operate may lead to investigations by health officials that could result in lawsuits or fines.
We may be required to incur additional costs and expenses to allocate funds to industrial safety and health compliance under Colombian law and international industrial safety regulations. Additionally, if any operational incident occurs that affects local communities in nearby areas, we will need to incur additional costs and expenses in order to return affected areas to normality and to compensate for any damages we may cause. These additional costs may have a negative impact on the profitability of the projects we may decide to undertake.
The occurrence of any of these operating risks could result in substantial losses or slowdowns to our operations, including injury to our employees, malfunction or destruction of property, equipment and infrastructure, clean-up responsibilities, third-party liability claims, government investigations and imposition of fines, withdrawal of environmental licenses and other government permits, suspension or shutdown of our activities and loss of revenue. The occurrence of any of these events may have a material adverse effect on our financial condition and results of operations.
Our involvement in deep water drilling either as direct operators or in conjunction with our business partners involves certain risks and costs, which may be outside of our control.
Our deepwater drilling activities present several risks, such as the risk of spills, explosions in platforms and drilling operations, and natural disasters. The occurrence of any of these events or other incidents could result in personal injuries, loss of life, severe environmental damage with the resulting containment, clean-up and repair expenses, equipment damage and liability in civil and administrative proceedings. Heightened risks and costs associated with deep water drilling may have a negative effect on our results of operations, financial condition and reputation. See the section Business Overview–Exploration Activities–Exploration Activities Outside of Colombia for a summary of our current deepwater drilling activities.
As a result of the oil spill in the Macondo field operated by British Petroleum in the U.S. Gulf Coast in April 2010, significant concerns regarding the safety of deep water drilling have been raised and, as a result, applicable regulations in various countries have changed. More stringent government regulation may result in increased costs and longer exploration and development timeframes for our deep water drilling operations and consequently could adversely affect our results of operations and financial condition.
| 105 |
We are exposed to the credit, political and regulatory risks of our customers and any material nonpayment or nonperformance by our key customers could adversely affect our cash flow and results of operations.
Some of our customers may experience financial problems that could have a significant negative effect on their creditworthiness. Severe financial problems encountered by our customers could limit our ability to collect amounts owed to us, or to enforce the performance of obligations owed to us under contractual arrangements. In addition, many of our customers finance their activities through their cash flows from operations, the incurrence of short and long term debt or the issuance of equity.
The combination of decreasing cash flows as a result of declines in commodity prices, a reduction in borrowing bases under reserve-based credit facilities and the lack of availability of debt or equity financing may result in a significant reduction of our customers’ liquidity and limit their ability to make payments or perform their obligations to us.
Furthermore, some of our customers may be highly leveraged and subject to their own operating expenses. Therefore, the risk we face in doing business with these customers may increase. Other customers may also be subject to regulatory changes, which could increase the risk of defaulting on their obligations to us. Financial problems experienced by our customers could result in the impairment of our assets, a decrease in our operating cash flows and may also reduce or curtail our customers’ future use of our products and services, which may have an adverse effect on our revenues and our ability to make payments under our existing debt obligations.
Our ability to access the credit and capital markets on favorable terms to obtain funding for our capital projects may be limited due to the deterioration of these markets and the authorizations we need before incurring any financial indebtedness.
We expect to make significant capital and operations expenditures to reach our corporate goals. Our ability to fund these expenditures is dependent on our ability to access the capital necessary to finance them on terms acceptable to us. In recent years, domestic and global financial markets and economic conditions have been weak and volatile and have contributed significantly to a substantial deterioration in the credit and capital markets. A new financial crisis, a renewal of the European sovereign debt crisis, which in turn could worsen the risk perception in the emerging markets, or the occurrence of any of the risks described in the section Risk Review – Risk Factors – Risks related to Colombia’s political and regional environment could also make it more difficult for us and our subsidiaries to access international capital markets and finance our operations and capital expenditures in the future on terms acceptable to us. These conditions, along with significant write-offs in the financial services sector and the re-pricing of credit risk, can make it difficult for us to obtain funding for our capital needs on favorable terms. As a result, we may be forced to revise the timing and scope of these projects as necessary to adapt to existing market and economic conditions, or access the financial markets on terms less favorable, therefore negatively affecting our results of operations and financial condition.
In addition, under applicable regulation, the Government, through the Ministry of Finance and Public Credit and the National Planning Department, must authorize all indebtedness of state-owned entities and government-controlled companies through a majority equity stake. Consequently, all of our indebtedness, except for our foreign subsidiaries or those subsidiaries in which we hold minority interest, must be previously authorized by the Colombian Ministry of Finance and Public Credit and the National Planning Department. As such, our indebtedness is subject to the Government’s time frames and policies, and we cannot guarantee that such authorizations would be granted in a timely fashion or granted at all.
We may be exposed to increases in interest rates, thereby increasing our financial costs.
We may incur debt locally and in the international capital markets and, consequently, may be affected by changes in prevailing interest rates. If market interest rates increase, our financing expenses may increase, which could have an adverse effect on our results of operations and financial condition.
| 106 |
As of December 31, 2014, approximately 28.20%, or US$ 4,066 billion, of our total long term indebtedness consisted of floating rate debt. If market interest rates rise, our financing expenses will increase, which could have an adverse effect on our results of operations and financial condition. In addition, as we refinance our existing debt in the coming years, the mix of our indebtedness may change, specifically as it relates to the ratio of fixed to floating interest rates, the ratio of short-term to long-term debt, and the currencies in which our debt is denominated in or indexed to. We cannot assure you that such changes will not result in increased financing expenses borne by us.
Our current and planned investments and exploration activities outside Colombia are exposed to political and economic risks.
As part of our Strategic Plan, we operate through business partners, subsidiaries or affiliates outside of Colombia. We currently have investments and subsidiaries incorporated in Peru, Angola, Brazil, Bermuda, Panama, the Cayman Islands, Switzerland, Germany, Spain, the United Kingdom and the United States, and we are analyzing investments in other countries. In connection with making investments, we are and will be subject to risks related to economic and political conditions and governmental economic actions. We cannot predict the positions of foreign governments relating to the oil and gas industry, land tenure, protection of private property, environmental standards, regulation or taxation; nor can we assure you that future governments will maintain policies favorable to foreign investment or repatriation of capital.
We began exploration activities outside Colombia in 2006 through our Brazilian subsidiary, Ecopetrol Óleo e Gás do Brasil Ltda. Our foreign subsidiaries have subsequently entered into a number of joint venture exploration agreements with regional and international oil companies to explore blocks in Peru, Angola, Brazil and the U.S. Gulf Coast. We have limited experience exploring outside Colombia. We may face new and unexpected risks involving environmental and other legal requirements beyond those we currently face.
The results of operations and financial condition of our subsidiaries in these countries also may be adversely affected not only by risks associated with hydrocarbon exploration and production, but also by fluctuations in their local economies, political instability and government actions, including: the imposition of price controls, the imposition of restrictions on hydrocarbon exports, fluctuation of local currencies against the Peso, the nationalization of oil and gas reserves, increases in export tax and income tax rates for crude oil and oil products, and unilateral (governmental) institutional and contractual changes, including controls on investments and limitations on new projects.
Any of these conditions occurring could disrupt or terminate our operations, causing our development activities to be curtailed or terminated in these areas, or our production to decline; limit our ability to pursue new opportunities; affect the recoverability of our assets; or cause us to incur additional costs or delay the timeline of our projects.
Our future performance depends on the successful development and deployment of new technologies and the knowledge to apply and improve them.
Technology, knowledge and innovation are essential to our business, especially for improvements in the production of heavy crude oil, the exploitation of mature fields, the development of unconventional hydrocarbons and reductions in our operating cost. If we do not develop the right technology or do not obtain the expertise to operate new technology or to improve our processes, do not have access to, or do not deploy the knowledge necessary to apply and improve such technology effectively, the execution of our corporate goals, our profitability and our earnings may be adversely affected.
| 107 |
We may not be able to achieve our corporate goals if we face difficulty in finding competent successors to our current management and employees.
Our growth strategy and the successful achievement of our corporate goals depend on the competence and skills of our management and employees, and our ability to successfully recruit new employees, in particular technical specialists such as petroleum engineers and scientists, as well as our ability to retain our current employees. If our managers and employees decide to retire or leave us, it may be difficult for us to find adequate successors with the required skills, knowledge, leadership and qualifications for the job. In addition, we may face difficulties in retaining our key managers and employees because of the high level of competition for human resources with experience and knowledge in the oil and gas industries. Furthermore, our compensation structure may not be able to meet industry levels and, as a result, our key employees may leave for jobs offering higher compensation.
Inability to develop human capacity and capability, both across the organization and in specific operating locations, could jeopardize performance delivery. Execution of short- and long- and term goals will depend on recruiting and retaining high-quality employees. See the section Corporate Governance—Board of Directors.
Our operations may not be able to keep pace with the increasing demand for natural gas or our natural gas supply commitments.
According to Colombian Commission for Regulation of Energy and Gas (CREG) Resolution 089 of 2013, a supplier of natural gas must possess sufficient economically viable natural gas before executing a natural gas delivery contract with a customer. In the long term we may not be able to keep up with increasing local demand for natural gas if demand outpaces the rate of our new natural gas developments and discoveries or because of the decline of our fields. As a result, we may lose market share, which may negatively impact our financial condition and results of operations.
Additionally, we are party to certain national and international gas supply contracts that have firm gas commitments. If we are unable to deliver natural gas to these clients as a result of cuts in operations, delays in the completion of projects relating to our production facilities or the acceleration of the decline in our gas production, among other reasons, we may be required to compensate our customers for our failure to supply natural gas.
Delays in the start of new projects could result in penalties imposed on us by our clients. Although we did not pay any such penalties in 2014, we cannot assure you that in the future we will not be subject to additional monetary fines which can in turn affect our financial condition and results of operations.
We depend on others for the construction and availability of natural gas transportation infrastructure for the transport of our gas, which may limit our ability to develop new or existing fields or lead to the deterioration of related assets and may not allow us to recover the cost of capital invested in natural gas discoveries.
We are prohibited by law from holding more than 25% of the equity of any natural gas transportation company. Therefore, there can be no assurance that the transportation infrastructure necessary to transport natural gas from the fields to distribution points and our customers will be built by third parties or that if built there will be sufficient capacity available to us for the exploitation of new natural gas discoveries or the development of existing fields. The failure to commercially exploit new or existing discoveries may result in impairment of the related assets and our inability to recover the capital expenditures invested to make these natural gas discoveries. As a result, we may be required to enter into agreements with natural gas transportation companies on terms that are not favorable to us.
For example, we have developed natural gas reserves in the Cusiana and Cupiagua fields, but transportation capacity to deliver gas from these fields is currently limited.
| 108 |
Our operations could be affected by conflicts with labor unions.
In the past, we have been affected by strikes and work stoppages promoted by our own labor unions as well as our industry’s labor unions. Because of the expiration of the collective bargaining agreement that was in effect from 2009 to 2014 and the filing of petitions by four of our labor unions (USO, ADECO, SINDISPETROL and ASPEC), a process of collective bargaining began in the second half of 2014 and concluded with the signing of a new collective bargaining agreement with a term of four years, beginning on July 1, 2014. This collective bargaining agreement establishes the conditions that govern the labor contracts during its term and it applies to all unionized employees of the Company as well as to those unionized employees who voluntarily decide to benefit from it. The collective bargaining agreement also establishes the labor conditions that govern the contracts during its term. The 2014 negotiation was conducted without Company employee strikes, and the parties signed the collective agreement in the direct settlement stage. Nevertheless, we cannot assure you that we will not experience labor unrest in the future. If relations with the labor unions deteriorate, which could result in strikes, work stoppages or even sabotage, our results of operations and financial condition could be adversely affected.
Our subsidiaries are also exposed to strikes and work stoppages. For example, during 2014, Bioenergy was affected by 25 work stoppages that in total represented 269 nonproductive hours for the company. The main cause of these events was the non-fulfillment by the Isolux Ingeniería’s subcontractors of their labor obligations with the workers of the company. Cenit was also affected by a number of work stoppages promoted by the USO and organized by employees of certain of its contractor and subcontractors, including the stoppage during the maintenance activities in the section “Billete Blanco" of Galán – Salgar pipeline, which resulted in 17 nonproductive days.
Our activities may be interrupted or affected by external factors, such as abnormal weather conditions and natural disasters.
We are exposed to several risks that may partially interrupt our activities. They include fires or explosions, natural disasters, criminal acts and acts of terror, malfunction of pipelines and emission of toxic substances.
Also, the effects of climate change could create impacts and losses in any part of our business operations resulting, for instance, in incidents generated by effects of rainfall in different areas of the country, like the potential effects of the “El Niño” phenomenon, causing overflows in Ecopetrol infrastructure such as tanks, observation well, pools, API boxes, among others.
For instance, in 2011 we were affected by weather conditions that intensified the strength of the average rain season in Colombia, causing landslides due to the abnormal concentration of water in the soil. On December 11, 2011, our Caño Limón-Coveñas oil pipeline ruptured, and on December 23, 2011, our Salgar-Cartago pipeline ruptured, in both cases as a result of soil movement caused by heavy rains.
As a result of the occurrence of similar events in the future, our activities could be significantly affected or even paralyzed. These risks could result in property damage, loss of revenue, loss of life, pollution and harm to the environment, among others. If any of these occur, we may be exposed to economic sanctions, damages, fines or penalties in addition to the costs required to repair or remediate the related damage. These costs, fines and penalties may adversely affect our financial condition and results of operations.
| 109 |
Our operations, including our activities in areas classified as indigenous reserves and Afro-Colombian lands, are subject to opposition from members of communities in the surrounding area.
We carry out and plan to carry out activities in areas classified by the Government as indigenous reserves (resguardos) and Afro-Colombian lands (territorios colectivos). In order to undertake these activities, we must first comply with the Previous Consultancy process, set forth by Colombian law. These consultation processes are part of the administrative procedures for obtaining environmental permits or licenses to start our projects, works or activities in areas belonging to ethnic communities. Generally, these consultation processes last between four to six months, but may be significantly delayed if we cannot reach an agreement with the communities. We strive to be respectful of the Constitution and laws and the autonomy of indigenous and Afro-descendant communities, and we therefore do not enter their territories until we have reached an agreement with them.
Our activities are subject to opposition, including protests by communities in the surrounding area, and even in areas in which the previous consultancy process does not apply.
No assurance can be given that we will be able to reach an agreement with the different communities opposed to our operations or that such communities will participate in consultancy processes if available. We may be exposed to similar delays due to opposition from local communities in other countries where we carry out our activities.
We have made significant investments in acquisitions and we may not realize the expected value.
We have acquired interests in several companies in Colombia and abroad. See the section Business Overview—Our Corporate Structure. Obtaining the expected benefits of the acquisitions will depend, in part, on our ability to (1) obtain the expected operational and financial results from these acquisitions, (2) manage disparate operations and integrate distinct corporate cultures and (3) manage our objectives as a corporate group. These efforts may not succeed. Our failure to successfully obtain the expected results from our acquisitions could adversely affect our financial condition and results of operations.
Our construction projects, such as those being undertaken by our subsidiaries Reficar and Bioenergy, may be delayed or cost more than projected, which could affect our operating results and financial condition.
Our current and future investment projects could face planning and implementation problems, which could impact the competitiveness of our programs and projects, adversely affecting our results of operation and financial condition.
For example, Reficar raised US$3.5 billion through a limited-recourse project financing in which we acted as sponsor and provided both a construction support and a debt service guarantee. If the construction of the project to upgrade the Cartagena refinery is delayed because of operational problems, Ecopetrol S.A. must provide the sufficient financial resources, either by means of capital contributions or by granting a subordinated loan, so that Reficar can reach completion. Operational problems may include, but are not limited to, labor productivity or unavailability of construction material in the development of the project, or failure of the upgraded refinery to reach the expected performance level in terms of the quality of products and/or volumes produced. If Ecopetrol S.A. is required to provide additional capital or guarantees, other strategic projects may be delayed or cancelled, thereby affecting our operating results and financial condition.
During 2013 and 2014 we were called upon to provide Reficar with financial support beyond the US$3.5 billion Reficar raised through limited-recourse project financing. First, in 2013, Reficar requested approximately US$1 billion, under the Construction Support Agreement, and in 2014, Reficar requested US$1.4 billion for its construction project. Any increase in the project’s capital expenditures is expected to be funded under the Construction Support Agreement between Reficar and Ecopetrol S.A.. See the section Business Overview—Refining and Petrochemicals—Refining—Reficar. Further delays in the implementation of the project may result in larger capital expenditures, which could increase the overall cost of the project and impact our financial results.
Bioenergy is executing the construction of an ethanol plant with an installed capacity of 480,000 liters per day. The project is currently expected to begin commercial operations in the second half of 2016. Any performance defaults by the new contractor, social unrest, strikes or other labor actions strikes could negatively impact this estimated date, costs of the project and our financial results.
| 110 |
Our results may be affected by the performance of our business partners or their third-party service providers, as many of our operations are executed under association and joint venture agreements with business partners.
Many of our operations are executed through associations, joint ventures and other agreements with our business partners. Consequently, we depend on the performance of our business partners. The poor performance of any of our business partners, especially in those projects in which we do not act as operators, could negatively impact oil and natural gas production, which in turn could have a negative impact on our results of operations and financial condition. We are exposed to the risk of not finding business partners with the appropriate skills and performance that we require for our projects. We are also indirectly exposed to the supply agreements and other third-party services contracted by our business partners in fields where we are not the operator.
Our insurance policies do not cover all liabilities and may not be available for all risks.
Our insurance policies do not cover all liabilities, and insurance may not be available for all risks. There can be no assurance that incidents will not occur in the future, that insurance will adequately cover the entire scope or extent of our losses or that we will not be found liable in connection with claims arising from these and other events, which could adversely affect our financial condition and results of operations.
A failure in our information technology systems or cyber security attacks may adversely affect our financial results.
We depend on the reliability and security of our information technology systems to conduct certain exploration, development and production activities, process financial records and operating data, communication with our employees and business partners, and for many other activities related to our business. Our information technology systems may fail or have other significant shortcomings due to operational system flaws or employee misuse, tampering or manipulation. In addition, we may become the target of cyber-attacks or information security breaches that could result in the unauthorized release, gathering, monitoring, misuse, loss or destruction of proprietary and other information. Any of these occurrences could disrupt our business, result in potential liability or reputational damage or otherwise have an adverse effect on our financial results. During 2014, our internal cyber security systems identified 288,194 Command & Control attacks designed to extract information from Ecopetrol S.A as well as an effective “Defacement” attack on a secondary site of Ecopetrol S.A.’s website (www.ecopetrol.com.co).
We have experienced a number of cyber attacks in the past, and although we have not experienced any material losses relating to failure of our information technology systems or cyber incidents, there can be no assurance that we will not suffer such losses in the future.
We are exposed to behaviors incompatible with our ethics and compliance standards.
Given the large number of contracts that we are a party to in Colombia and abroad with local and foreign suppliers, the geographic distribution of our operations and the great variety of actors that we interact within the course of business, we are subject to the risk that our employees, contractors, or any person having business relations with us may misappropriate our assets, manipulate our assets or information or engage in money laundering or the financing of terrorism, for such person’s personal or business advantage. Our systems for identifying and monitoring these risks may not be effective to fully mitigate them in all situations. Such acts may result in material financial losses or reputational harm to the Company.
| 111 |
Unavailability of electric power may affect or limit the continuity of our operations or growth.
Ecopetrol S.A.’s average energy consumption in 2014 was 678 MW equivalent, of which 90% was supplied through self-generation, and the remaining 10% through unregulated purchases of electrical energy in the open market. Ecopetrol’s energy demand is expected to increase in 2015 to 978.8 MW equivalent, which would be supplied through similar proportions of self-generation and unregulated purchases. Given the growth in production and the start of a new transport and refining system, it is possible that during the next few years there will be insufficient electrical energy for our operations or the operations of fields in which we are a non-operating partner. This is because of the unavailability of market power given the delay of several energy transmission and generation infrastructure projects, the increase in the share of consumption by non-regulated users, and because of high dependency on the execution of self-generation and transmission projects and contracts managed by us or by our business partners that are exposed to a number of risks, including high volatility in national energy conditions (such as hydrology, availability of natural gas), licensing restrictions and attacks on infrastructure, among others.
Rising water production levels may affect or constrain our crude oil production.
During 2014, Ecopetrol S.A. and its partners produced more than 8 million barrels of water per day. Limitations on the available water disposal capacity from time to time during the year affected our overall average oil production by almost 12,000 bpd, mainly in the Rubiales, Castilla and Chichimene fields. Although some of these limitations have been already addressed, taking into account the nature of our reservoirs, we expect during 2015 a further increase in the water production levels in our main fields. Ecopetrol, in order to achieve its oil & gas production goals and to avoid any additional production restrictions in the future, will need to secure the required capacity to manage water levels. Factors that may trigger a possible constraint in our crude oil production due to the rising water production levels are: (1) ineffective project management of the required facilities and developments, (2) the Company’s and its partners ability to timely obtain the environmental permits related to water management, (3) social and community interactions that could affect the development and operation of these projects, and (4) at the current price levels, the availability of capital to execute the required projects. Higher water production levels could cause lower crude oil production, which could in turn negatively impact our results of operations.
| 5.1.2 | Risks relating to Colombia’s Political and Regional Environment |
This section discusses potential risks related to our extensive operations in Colombia.
The Colombian Government could seize or expropriate Ecopetrol’s assets under certain circumstances.
Pursuant to Article 58 of the Colombian constitution, the Government can exercise its eminent domain powers in respect of Ecopetrol’s assets in the event such action is deemed by the Government to be required in order to protect public interests. According to Law 388 of 1997, eminent domain powers may be exercised through: (i) an ordinary expropriation proceeding (expropiación ordinaria), (ii) an administrative expropriation (expropriación administrativa) or (iii) an expropriation for war reasons (expropiación en caso de guerra). In all cases we would be entitled to a fair compensation for the expropriated assets. Also, as a general rule, compensation must be paid before the asset is effectively expropriated. However, the compensation may be lower than the price for which the expropriated asset could be sold in a free-market sale or the value of the asset as part of an ongoing business.
| 112 |
Colombia has experienced internal security issues that have had or could have a negative effect on the Colombian economy and on us.
Colombia has experienced internal security issues, primarily due to the activities of guerrillas, paramilitary groups, drug cartels and criminal bands known as Bacrim. From time to time, guerrillas target crude oil and multi-purpose pipelines, including the Oleoducto Transandino, Caño Limón-Coveñas and Ocensa pipelines, and other related infrastructure disrupting our activities and those of our business partners. During 2014, the attacks against our pipeline infrastructure decreased by 43% in relation to 2013 (225 attacks in 2013 compared with 130 attacks in 2014). This situation especially affected the infrastructure located in Putumayo, Nariño, Arauca and Norte de Santander and the following pipelines: San Miguel Orito, Transandino, Bicentenario and Caño Limón Coveñas. On several occasions, guerilla attacks have resulted in unscheduled shutdowns of transportation systems in order to repair or replace sections of pipelines or production facilities that have been damaged and deferral of production in certain fields, as well as caused us to undertake environmental remediation. For the pipeline infrastructure managed by Ecopetrol S.A., the direct cost of repair pipeline infrastructure due to terrorist attacks in 2014 was approximately Ps$85,826 billion (US$33.56 million). Guerrilla groups and other illegal armed groups also attacked natural gas transportation infrastructure that have affected our natural gas production in the past. These activities, their possible escalation and the effects associated with them have had, and may have in the future, a negative impact on the Colombian economy or on us, which may affect our customers, employees, assets or the environment, with resulting containment, clean-up and repair expenses. In the context of this complex security situation, allegations and court judgments have been levied against members of the Colombian Congress and on government officials for possible ties with illegal groups. This situation may have a negative impact on the credibility of the Colombian government, which could in turn have a negative impact on the Colombian economy or on us in the future.
Likewise, theft of refined products and crude oil—which are the results of security issues—may impact our results in the future. Theft of refined products, which reached a peak of 7,270 bpd in 2002, was reduced to 23.1 bpd in 2013, but in 2014 increased to 51 bpd mainly due to the activity of gang leaders who have recently resumed their criminal acts. The theft of crude oil increased from 541 bpd in 2013 to 840 bpd in 2014, mainly due to the security situation in southern Colombia and the presence of illegal groups who attack oil and gas infrastructure, including the theft of crude oil from pipelines.
Since 2012, the Colombian government has been in negotiations with the Revolutionary Armed Forces of Colombia, or FARC, the largest guerrilla group in Colombia, with a view to end the armed conflict. This is the latest attempt in a series of unsuccessful negotiations between the Colombian government and the FARC. While the process is ongoing, military operations and hostilities continue. If the negotiations fail, the intensity of the internal armed conflict could increase, resulting in a deterioration of Colombia’s national security and, consequently, negatively impacting our operating results. We cannot assure you that, if the negotiations turn out to be successful, some of the guerrilla groups may not continue their illegal and terrorist activities, which could affect our operations.
There have been certain events in Colombia and abroad, which have resulted in political tensions between Colombia and some of its neighboring countries.
Diplomatic relations between Colombia and some of its neighboring countries, in particular Ecuador and Venezuela, have been tense in the past. These political tensions were heightened by the Colombian Government’s allegations that neighboring countries were supporting the guerilla groups, as well as by claims made by Venezuela stating that the Colombian army has entered its territory while in pursuit of FARC members. Although relations with these countries have stabilized, there can be no assurance that similar allegations that may result in new and heightened tensions with Colombia’s neighbors would not be made again as was done in the past, and would not have a negative impact on Colombia’s economy and general security situation.
Companies operating in Colombia, including us, are subject to the prevailing economic conditions and the investment climate in Colombia, which may be less stable than the prevailing economic conditions and investment climate in developed countries.
Market prices of securities issued by Colombian companies, including us, are subject to the prevailing economic conditions in Colombia. A large portion of our assets and operations are located in Colombia and most of our sales are currently derived from our crude oil and natural gas production and the production of our refineries located in Colombia. Accordingly, our financial condition and results of operations depend to a significant extent on macroeconomic and political conditions prevailing from time to time in Colombia and on the rates of exchange between the Peso and the U.S. dollar.
| 113 |
If the perception of improved overall security in Colombia deteriorates or if the investment climate worsens, the Colombian economy may face lower growth rates than the ones posted recently, which could negatively affect our financial condition and results of operations. Furthermore, the market price of our shares and American Depositary Shares, or ADSs, may be adversely affected by changes in governmental policies, particularly those affecting economic growth, exchange rates, interest rates, inflation and taxes. The Government has changed monetary, fiscal, taxation, labor and other policies over time and has thus influenced the performance of the Colombian economy. We have no control over the extent and timing of government intervention and policies.
Colombian political and economic conditions have a direct impact on our business and may have a material adverse effect on us.
Colombia’s economic policies may have direct impact on our company as well as market conditions, the prices of securities and our ability to access national and international capital markets. Our financial condition and results of operations may be adversely affected by the following factors, among others, and the Government’s response to such factors: exchange rate movements; inflation; exchange control policies; price instability; interest rates; liquidity of domestic capital and lending markets; tax policy; regulatory policy for the oil and gas industry, including pricing policy; and other political, diplomatic, social and economic developments in or affecting Colombia.
Uncertainty over whether the Government will implement changes in policy or regulations that may affect any of the factors mentioned above or other factors in the future may lead to economic uncertainty in Colombia and increase the volatility of the Colombian securities market and securities issued abroad by Colombian companies, which may have a material adverse effect on our results of operations and financial condition.
Developments and the perception of risk in other countries, especially emerging market countries, may adversely affect the market price of Colombian securities, including our ADSs.
Securities issued by Colombian companies may be affected by economic and market conditions in other countries, including other Latin American and emerging market countries. Although economic conditions in Latin American countries and in other emerging market countries may differ significantly from economic conditions in Colombia, investors’ reactions to developments in these other countries may have an adverse effect on the market value of securities of Colombian issuers and our ability to access capital markets.
Due to past financial crises in several emerging market countries (such as the Asian financial crisis of 1997, the Russian financial crisis of 1998 and the Argentine financial crisis of 2001), the world financial crisis of 2008 and the recent sovereign debt crises in certain European countries, investors may view investments in emerging markets with heightened caution. In the past, as a result of crises in other countries, flows of investments into Colombia have been reduced. Crises in other countries, especially in emerging market countries, may hamper investor enthusiasm for securities of Colombian issuers. If Latin America experiences a new slow-down or if the price for securities of Latin American issuers falls, the price for our ADSs could follow this trend and could be adversely affected as could our ability to access domestic or international capital markets.
| 114 |
The Ministry of Mines and Energy has not calculated or liquidated the Net Position for each refiner and/or importer and for each fuel (gasoline and motor fuel oil) to be recognized by the FEPC to Ecopetrol since, and including, the last quarter of 2013.
The obligations on FEPC related to the payment of the Net Position in favor of Ecopetrol, when and if applicable, are subject to the issuance of a resolution by the Ministry of Mines and Energy indicating the respective amounts and the deadline for its payment in Colombian Pesos, taking into account the availability of resources of the FEPC, all in accordance with the terms of Decree 1880 of 2014. Said Decree does not expressly state the obligation to liquidate and pay delayed interest on those amounts. Delays in the calculation, liquidation or payment of the Net Position in favor of Ecopetrol, when and if applicable, may have an adverse effect on the financial situation, the operational results and the liquidity of the Company. For more information regarding the FEPC, please see the section Business Overview—Applicable Laws and Regulations—Regulation of Refining and Petrochemical Activities—Regulation Concerning Production and Prices.
New or higher taxes resulting from changes in tax regulations or the interpretation thereof in Colombia could adversely affect our results of operations and financial condition.
New tax laws and regulations, and uncertainties in the interpretation with respect to existing and future tax policies pose risks to us. In recent years, the Colombian Congress and tax authorities have imposed additional taxes such as the Impuesto sobre la Renta para la Equidad CREE surtax, an income tax with specific purpose of the funding of social investment programs for the benefit of population in need and others, and enacted modifications to taxes related to financial transactions, income, value added tax, or VAT, and taxes on net worth. For a description of taxes affecting our results of operations and financial condition in 2014, see the section Financial Review—Effect of Taxes, Exchange Rate Variation, Inflation and the Price of Oil on Our Results—Taxes. Changes in tax-related laws and regulations, and interpretations thereof, can affect tax burdens by increasing tax rates and fees, creating new taxes, limiting tax deductions, and eliminating tax-based incentives and non-taxed income. In addition, tax authorities and tax courts may interpret tax regulations differently than we do, which could result in tax litigation and associated costs and penalties. For Colombian income tax purposes and, as a general rule, dividends that are distributed from profits taxed at the corporate level are not taxed or subject to withholding tax at the shareholder level. Tax treaty rules might also apply on dividend distributions when a shareholder is a resident in a country that has executed a tax treaty with Colombia. However, this tax treatment may change in the future, and any change could have an adverse effect on our results of operations and financial condition.
| 5.1.3 | Legal and Regulatory Risks |
This section discusses potential legal and regulatory risks to Ecopetrol, including the risk of having to comply with new laws and regulations.
Our operations are subject to extensive regulation.
The Colombian hydrocarbons industry is subject to extensive regulation and supervision by the Government and regulatory agencies in matters including the award of exploration and production blocks by the ANH, the imposition of specific drilling and exploration obligations, restrictions on production, price controls, capital expenditures and required divestments. Existing regulation applies to virtually all aspects of our operations in Colombia and abroad. The commercialization activities of some of our products also face extensive regulation. Such regulation is subject to change by the applicable regulator affecting our ability to commercialize our products. See the section Business Overview—Applicable Laws and Regulations.
The terms and conditions of the agreements with the ANH under which we explore and produce crude oil and natural gas generally reflect negotiations with the ANH and other governmental authorities and may vary by fields, basins and hydrocarbons discovered.
We are required, as are all oil companies undertaking exploratory and production activities in Colombia, to pay a percentage of our production to the Government as royalties. The Colombian Congress has modified the royalty program for crude oil and natural gas production several times in the last 20 years, as it has modified the regime regulating new contracts entered into with the Government. In the future, the Colombian Congress may once again amend royalty payment levels for new contracts and such changes could have an adverse effect on our future exploration and production in Colombia. See the section Business Overview–Applicable Laws and Regulations–Regulation of Exploration and Production Activities – Business Regulation–Royalties for a description of the current royalty scheme.
| 115 |
Our operations in Colombia are subject to extensive national, state and local environmental regulations. Environmental rules and regulations are applicable to our exploration, production, refining, transportation, supply and marketing activities, as well as the biofuels we produce. These regulations establish, among other things, quality standards for hydrocarbon products, air emissions and greenhouse gases, water discharges and waste disposal, environmental standards for abandoned crude oil wells, soil remediation, water pollution and the general storage, handling, transportation and treatment of hydrocarbons in Colombia. Currently, all exploratory projects drilling in areas that do not yet have a license must undergo an environmental impact assessment and must receive an environmental license from the governmental agency responsible for awarding environmental licenses, the Environmental License National Agency or ANLA. Environmental authorities with jurisdiction over our activities routinely inspect our crude oil fields, refineries and other production sites, and they may decide to open investigations or sanction proceedings, which may result in the imposition of fines, restrictions on operations or other sanctions in connection with potential non-compliance with environmental laws.
We are also subject to regional environmental regulations issued by the Corporaciones Autónomas Regionales or CARs, which oversee compliance with regional environmental regulations. If we fail to comply with any of these national or regional environmental regulations, we could be subject to administrative and criminal penalties, including warnings, fines or closure orders of our facilities. See the section Business Overview–Applicable Laws and Regulations–Regulation of Exploration and Production Activities–Business Regulation–Environmental Licensing and Prior Consultation.
Environmental regulation has become more stringent in Colombia in recent years. As a result, we have allocated a greater percentage of our expenditures toward compliance with applicable law, and dedicated a management team in charge of environmental compliance. If environmental laws continue to impose additional costs on us, and as new laws and regulations relating to climate change become applicable to us, we may need to reduce our investments on strategic projects in order to allocate funds to environmental compliance. We are also exposed to delays in obtaining environmental licenses from ANLA, which can lead to cost overruns or to changes in our investment plans. These additional costs may have a negative impact on the profitability of the projects we intend to undertake or may make them economically unattractive, in turn having a negative impact on our results of operations and financial condition.
We are subject to foreign environmental regulations for the exploratory activities conducted by us outside Colombia. Failure to comply with foreign environmental regulations may result in investigations by foreign regulators, which could lead to fines, warnings or temporary suspensions of our operations, which could have a negative impact on our financial condition and results of operations.
Under certain of our credit agreements, we are under an obligation to comply with international environmental standards established by our lenders or by multilateral institutions. Failure to comply with such environmental standards could result in an event of default under the relevant credit agreements that we, or our subsidiaries, have entered into, which would affect our financial condition. For instance, the credit facility executed by Reficar for the financing of its expansion and modernization project includes an obligation to comply with the U.S.-Exim Environmental Procedures and Guidelines and the Organization for Economic Co-operation and Development (OECD) Common Approaches on Environment and Officially Supported Export Credits, and a credit agreement executed by Ecopetrol S.A. to finance purchases of U.S. goods and services requires Ecopetrol S.A. to comply with the U.S.-Exim Environmental Procedures and Guidelines.
In addition, we may be subject to foreign health and safety and environmental regulations for our exploratory activities conducted outside Colombia. Foreign health and safety regulations may be more severe than those established under Colombian law and, therefore, we may be required to make additional investments to comply with those regulations.
| 116 |
Legislation and regulatory initiatives relating to hydraulic fracturing and other drilling activities for unconventional oil and gas reserves could increase the cost of implementing our projects and the future costs of doing business or cause delays and adversely affect our operations.
Hydraulic fracturing is a commonly used process that involves injecting water, sand and small volumes of chemicals into the wellbore to fracture the hydrocarbon-bearing rock thousands of feet below the surface to facilitate higher flow of hydrocarbons into the wellbore. We expect to begin using hydraulic fracturing combined with horizontal drilling in the production of oil and natural gas from certain reservoirs, especially shale formations. The Government has promulgated a set of technical and environmental regulations to guide exploration activities in reservoirs which require these types of technologies. As a result, we are pursuing the relevant licenses to make these projects viable within our portfolio.
Outside Colombia, a number of groups have proposed initiatives to, among other things: further regulate hydraulic fracturing practices; limit water withdrawals and water use; require disclosure of fracturing fluid constituents; restrict which additives may be used; and implement temporary or permanent bans on hydraulic fracturing. Some of these initiatives have resonated with certain local groups, which are promoting banning or suspending hydraulic fracturing and other unconventional drilling activities in Colombia. These efforts may affect the regulatory framework related to these activities and could significantly increase the cost of, or cause delays in, the implementation of our Strategic Plan and adversely affect our operations and results of operations.
We may incur losses and spend time and money defending pending lawsuits and arbitrations.
We are currently a party to several legal proceedings filed against us. We are also subject to labor-related lawsuits filed by current and former employees in connection with pension plans and retirement benefits. For example, as of December 31, 2014, Ecopetrol S.A. was a party to 2,929 legal proceedings relating to civil, administrative, environmental, tax, and labor claims filed against us of which 270 met the accounting threshold for an accrual provision. We allocate substantial amounts of money and time to defend against these claims, in which the claimants often seek substantial sums of money as well as other remedies. See Note 18—Estimated liabilities and provisions, and Note 29—Contingencies, to our consolidated financial statements and see the section Risk review – Legal Proceedings.
| 5.1.4 | Risks relating to our ADSs |
This section discusses potential risks associated with an investment in our American Depository Shares (as opposed to our common shares) by investors outside Colombia.
Holders of our ADSs may encounter difficulties in protecting their interests.
Holders of our ADSs do not have the same voting rights as holders of our shares. As set forth in the Deposit Agreement, ADSs may instruct our current depositary, JP Morgan Chase Bank, N.A., to vote on shareholder matters prior to a shareholders’ meeting. Colombia law does not, however, require Ecopetrol to request proxies from existing shareholders. Thus, shareholders may not become aware of some matters in time to instruct the depositary to vote their shares.
The Deposit Agreement provides ADSs with the right to instruct the depositary to vote common shares separately. The viability of this contractual provision is unclear. This is because regulatory agencies have advanced inconsistent positions regarding whether a depository must vote common shares as a single block or may vote them separately. Going forward, the Colombian regulatory authorities may change their interpretation as to how the voting rights should be exercised by ADS holders, and such possible interpretation could adversely affect the value of the common shares and ADSs.
| 117 |
Our ADSs holders may be subject to restrictions on foreign investment in Colombia.
Colombia’s International Investment Statute regulates the manner in which non-Colombian residents can invest in Colombia and participate in the Colombian securities market. Among other requirements, Colombian law requires foreign investors to register certain foreign exchange transactions with the Colombian Central Bank and outlines the necessary procedures to authorize certain types of foreign investments. Colombian law requires that certain foreign exchange transactions, including international investment in foreign currency between Colombian residents and non-Colombian residents, must be made through authorized foreign exchange market participants. Any income or expenses under our American Depositary Receipt, or ADR, program must be made through the foreign exchange market.
Investors acquiring our ADRs are not required to register with the Colombian Central Bank, as they will benefit from the registration to be obtained by the custodian for our common shares underlying the ADRs in Colombia. If investors in ADRs choose to surrender their ADRs and withdraw common shares, they must register their investment in the common shares as a portfolio investment through their local representative, which may be a brokerage firm, trust company or investment management companies supervised by the Superintendency of Finance. Investors will only be allowed to transfer dividends abroad after their foreign investment registration procedure with the Colombian Central Bank has been completed. Investors withdrawing common shares could incur expenses and/or suffer delays in the application process. The failure of a non-resident investor to report or register foreign exchange transactions with the Colombian Central Bank relating to investments in Colombia on a timely basis may prevent the investor from remitting dividends, or initiate an investigation that may result in a fine. In the future, the Government, the Colombian Congress or the Colombian Central Bank may amend Colombia’s International Investment Statute or the foreign investment rules, which could result in more restrictive rules and could negatively affect trading of our ADSs.
While Colombia currently has a floating exchange rate system, it is subject to change. If a more restrictive system is implemented, the depositary may experience difficulties converting Peso amounts into U.S. dollars to remit dividend payments. See the section Shareholder Information–Exchange Controls and Limitations.
Holders of our ADSs may not be able to effect service of process on us, our directors or executive officers within the United States, which may limit your recovery in any foreign judgment you obtain against us.
We are a mixed economy company organized under the laws of Colombia. In addition, most of our Directors and executive officers reside outside the United States. All or a substantial portion of our assets and the assets of these persons are located outside of the United States. As a result, it may not be possible for you to effect service of process within the United States upon us or these persons or to enforce judgments against us or them in U.S. courts obtained in such courts predicated upon the civil liability provisions of the U.S. federal securities laws. Colombian courts determine whether to enforce a U.S. judgment predicated on the U.S. securities laws through a procedural system known as exequatur. For a description of these limitations, see the section Shareholder Information–Enforcement of Civil Liabilities.
The protections afforded to minority shareholders in Colombia are different from those in the United States, and may be difficult to enforce.
Under Colombian law, the protections afforded to minority shareholders are different from those in the United States. In particular, the legal framework with respect to shareholder disputes is substantially different under Colombian law than U.S. law and there are different procedural requirements for commencing shareholder lawsuits, such as shareholder derivative suits. As a result, it may be more difficult for our minority shareholders to enforce their rights against us or our Directors or controlling shareholder than it would be for shareholders of a U.S. company.
| 118 |
ADRs do not have the same tax treatment as other equity investments in Colombia.
Although ADRs represent Ecopetrol’s common shares, for Colombian tax purposes, ADRs are securities different from their underlying assets. Therefore, ADR holders are not entitled to the tax treatment granted to holders of the common shares. Such tax treatment include, among others, those benefits relating to dividends and profits derived from sale of Colombian common shares. For further information see the section Shareholder Information–Taxation–Colombian Tax Considerations.
Judgments of Colombian courts with respect to our ADSs will be payable only in Pesos.
If proceedings are brought in the courts of Colombia seeking to enforce the rights of ADS holders of common shares, we will be required to discharge our obligation amounts in Pesos. Colombian law provides that an obligation in Colombia to pay amounts denominated in foreign currency may only be satisfied in Colombian currency at the Representative Market Exchange Rate of the date the judgment is obtained, and such amounts are then adjusted to reflect exchange rate variations through the effective payment date.
The relative volatility and illiquidity of the Colombian securities markets may substantially limit our investors’ ability to sell our ADSs at the price and time they desire.
Investing in securities that are traded in emerging markets, such as Colombia, often involves greater risk when compared with other world markets, and these investments are generally considered to be more speculative in nature.
The Colombian securities market is substantially smaller, less liquid, more concentrated and can be more volatile than other securities markets in the United States. The Colombian Stock Exchange (Bolsa de Valores de Colombia), or BVC, had a market capitalization of approximately Ps$364,107 billion (US$153 billion using the closing rate for 2014) as of December 31, 2014, a 12.4% decrease when compared with the amount at the end of 2013, a daily average trading volume of approximately Ps$167,448 million (US$83.77 million, using the average exchange rate for 2014), a 0.6% decrease when compared with the volume in 2013. By comparison, the New York Stock Exchange, or NYSE, had a market capitalization of US$19.35 trillion as of December 31, 2014, and a daily trading volume of approximately US$49.9 billion in 2014.
As of December 31, 2014, our shares represented the highest market capitalization of the BVC accounting for 23.5% of the total COLCAP index, which reflects the price volatiliy of the 20 most-liquid stocks.
Given the current ownership structure of our shares, it may be difficult for you to purchase large quantities of shares from a single shareholder. We cannot assure you that a liquid trading market for our ADSs will develop or, if developed, that it will be maintained. Without a liquid trading market, the ability of investors in our ADSs to sell them at the desired price and time could be substantially limited.
We are not required to disclose as much information to investors as a U.S. issuer is required to disclose.
We are subject to the reporting requirements of the Superintendency of Finance and the BVC. The corporate disclosure requirements that apply to us may not be equivalent to the disclosure requirements that apply to a U.S. issuer and, as a result, you may receive less interim information about us than you would receive from a U.S. issuer.
| 119 |
| 5.1.5 | Risks related to State Ownership |
Our controlling shareholder’s interests may be different from those of our minority shareholders.
Colombian Law 1118 of 2006 requires the Nation to maintain the majority of our outstanding capital stock. The Nation currently holds 88.49% of our outstanding capital stock, making it our controlling shareholder. The Nation as our controlling shareholder has majority voting rights at the shareholders’ meeting to elect the members of our Board of Directors. The Nation may propose and approve decisions that are in its own interest and in furtherance of its own economic and political interests that do not necessarily benefit minority shareholders.
Our controlling shareholder may approve dividends at the ordinary general shareholders’ meeting, notwithstanding the interest of minority shareholders, in an amount that results in us having to reduce our capital expenditures, thereby negatively affecting our prospects, results of operations and financial condition. See the section Shareholder Information–Dividend Policy.
Additionally, given our controlling shareholder’s interests, it may undertake projects, approve decisions or make announcements about its intentions related to its holding of our capital stock which may not be in our best interest or in the best interest of our minority shareholders, including holders of our ADSs, and could impact the price of our shares or ADSs
| 5.2. | Risk Management |
| 5.2.1 | Managing Enterprise Risk |
Since 2003, Ecopetrol S.A. has an Enterprise Risk Management -ERM- system, which is framed within the Internal Control System, is aligned with the strategic plan of the organization and is systematically monitored by the Board of Directors semiannually and by the Enterprise Management Committee on a monthly basis.
The main purpose of the Ecopetrol S.A. ERM system is to contribute to achieving the strategic plan, ensuring proper management of risks that may cause deviations from the achievement of goals or affect the most valuable resources of the company, generating relevant information for decision-making and confidence in their stakeholders.
Ecopetrol S.A.’s ERM system has been designed and implemented across all the organization, with focus in two levels: Level 0 Processes and Enterprise Level.
Our risk management approach is based around the risk management cycle, consisting in six (6) main stages: planning, identifying, evaluating, treatment and monitoring risks, as well as a cross-stage communication. This cycle is supported in three (3) pillars of risk management: culture, organizational structure and normative and management tools.
Each of the identified risks has an analysis of causes and consequences. Ecopetrol S.A. does use multidimensional risk analysis in which each risk impact is assessed in five (5) dimensions (People, Environment, Economics, Reputation and Clients) which represent the most important resources to be protected by the company. This analysis is done to prioritize the risks by assigning values within predefined scales of impact and probability. The risk level (Very High, High, Medium, Low or None) is obtained from the combination of the consequences (impacts) and the probability of occurrence of those consequences. According with the level of risk, action plans for management and mitigation are defined.
Also, as part of the monitoring stage of the risk management cycle, Ecopetrol has implemented Key Risk Indicators (KRIs) as a high impact tool for risk analysis. KRIs are metrics used to provide early signals of increasing risk exposures. These signals constitute information for proactive decision making in order to avoid risk materialization. Each one of the strategic risks identified in the company has at least one related KRI.
| 120 |
Ecopetrol S.A. has defined guidelines and minimum requirements to implement an ERM System framework for its subsidiaries. These guidelines provide different risk classifications according to the size and risk management maturity level of each subsidiary. The risk classification of each subsidiary determines the scope of implementation of the ERM system. Under those guidelines, each subsidiary must report its risk management performance to its audit committee. In addition, they have to report it annually to Ecopetrol S.A. To assure the above, the subsidiaries have methodological support from Ecopetrol S.A. when it is requested. Additionally, yearly the information reported by the subsidiaries is also part of the analysis to update the Ecopetrol S.A. Strategic Risks Map.
| 5.2.2 | Managing Information Security and Cybersecurity |
Ecopetrol S.A. has a dedicated management team focused on information security issues and such as the treatment of information, safe information management practices, classification of critical business information, controls systems compliance and effectiveness of available information security technologies, all of which are articulated with the ERM system at the enterprise level.
Ecopetrol S.A. has recently reviewed its cybersecurity exposure risks. During 2014, a working group was formed, led by the our Vice-president of Innovation and Technology and with the participation of managers of industrial control systems (SCADA systems), informatics security and information security, with the purpose of identifying our cybersecurity risks.
Although Ecopetrol S.A. is still at an early stage of managing its cybersecurity risks, our Vice-president of Innovation and Technology has begun a process of socialization and involvement by the higher-level employees of the organization, such as the Audit Committee of the Board of Directors, to which a report was presented summarizing the most relevant aspects of our cyber security issues. As a result of this process, we are currently reviewing the feasibility of incorporating elements and strategic tools to the management of the cyber security threat; including, among others, policies, hedging, and specialized monitoring and control mechanisms.
In addition, Ecopetrol S.A. shares information with the “Comando Conjunto Cibernético”, an entity under the Ministry of Defense, through which the national government is monitoring cyber security themes, in order to have a clearer view of the scope of protection required in these infrastructures.
| 5.2.3 | Managing Financial Risk |
We are exposed to certain risks associated with the nature of our operations and the financial instruments we use. Among those risks that affect our financial assets, liabilities and expected future cash flows are the changes in commodity prices, currency exchange rates, interest rates and the credit quality of our counterparties.
Commodity price risk is associated with our day-to-day operations as we export and import crude oil, natural gas, and refined products. We control our exposure to commodity price volatility using the “cash flow at risk” methodology, under which we estimate the impact that price fluctuations have over the liquidity of the company. We occasionally use hedges attached to cash flows to protect our financial statements from price fluctuations. We do not use derivative financial instruments for speculative or profit-generating purposes.
Consequently, part of our financial exposure under crude oil and refined products purchase contracts with certain of our business partners and third parties depends on international oil prices. We believe that the risk of such exposure is naturally hedged since we either export the crude oil at international market prices or sell refined products at prices which are correlated with international market prices. Under most of our existing contracts, the purchases are subject to pipeline capacity.
| 121 |
Currency risk arises in our operations because we have to sell U.S. dollars regularly in order to cover any currency mismatches that may arise. For example, such currency mismatches can be observed in that approximately 64% of Ecopetrol S.A.’s income is denominated in U.S. dollars while only 33% of its expenses are denominated in U.S. dollars. Similarly, 67% of Ecopetrol S.A.’s expenses are denominated in Colombian Pesos, while 36% our income is denominated in Colombian Pesos. When possible, Ecopetrol S.A. controls its currency risk through natural hedging by maintaining funds in U.S. dollars and Colombian Pesos to meet its expenses in each respective currency. In addition, Ecopetrol S.A. usually use derivative financial instruments such as forwards, futures and swaps depending on the impact of exchange rate on its U.S. dollar-denominated obligations, which may affect the cash flow of the Company. These strategies partially mitigate any adverse effect that currency risk may have over our financial statements.
Interest rate risk arises from our exposure to changes in interest rates, as we have floating-rate instruments in our investment portfolio and issuances of floating rate debt linked to LIBOR, DTF and IPC rates. Thus, volatility in interest rates may affect the fair value and cash flows related to our investments and floating rate debt. In 2014, our analysis of the situation about credit risk events and the global financial markets drove us to decide not to hedge the interest rate risk. Nevertheless, our treasury office continuously monitors the performance of interest rates and its impact on our financial statements. Ecopetrol S.A. controls the exposure to interest rate risk of its fixed income portfolio by establishing limits to its effective duration (between +/- 25% of the portfolio’s benchmark duration), Value at Risk of not more than 1.65% of the carrying value of the fixed income portfolio and Tracking Error, a measure of the return based on the funds' net asset value, relative to the return of the index over time, of not more than 80 basis points relative to the benchmark index for the fixed income portfolio.
The trust funds linked to Ecopetrol S.A.’s pension obligations (PAP) are also exposed to changes in interest rates, as they include fixed- and floating-rate instruments that are marked to market. This exposure is continuously monitored by our treasury office given the potential impact volatility may have on our financial statements. The treasury office’s information is gathered from reports sent by the asset managers. These reports refer to regulatory limits as well as market, credit and liquidity risks. The investment guidelines with respect to the PAPs are issued by the Colombian regulation for pension funds, as stipulated in the Decree 941 of 2002 and Decree 1861 of 2012, where it is indicated that they have to follow the same regime as the regular obligatory pension funds in their moderate (i.e., neither conservative nor aggressive) portfolio. For further information regarding the trust funds linked to the pension obligations of the company, see Note 22—Memorandum accounts, to the consolidated financial statements.
Finally, counterparty risk is the potential probability that a borrower or counterparty defaults on any obligation. In our case, we are exposed to this risk as we invest in different financial instruments and receive letters of credit in order to mitigate our exposure with our commercial counterparties. We manage this risk through analysis of the issuer’s creditworthiness, the stock price behavior, spreads on credit default swaps and their probabilities of default.
Investment Guidelines
Ecopetrol S.A.
Following the promulgation of Decree 1525 of 2008, which provides general rules on investments for public entities, Ecopetrol S.A.’s management established guidelines for our investment portfolios. These guidelines determine that investments in Ecopetrol S.A.’s U.S. dollar portfolio are generally limited to investments of our excess cash in fixed-income securities issued by entities rated A or higher in the long term and A1/P1/F1 or higher in the short term (international scale) by Standard & Poor’s Ratings Services, Moody’s Investors Service or Fitch Ratings. In addition, Ecopetrol S.A. may also invest in securities issued or guaranteed by the U.S. government or Colombian government, without regard to the ratings assigned to such securities. In Ecopetrol S.A.’s Peso portfolio, it must invest our excess cash in fixed-income securities of issuers rated AAA in the long term, and F1+/BRC1+ in the short term (local scale) by Fitch Ratings Colombia or BRC Standard & Poor’s. In addition, Ecopetrol S.A. may also invest in securities issued or guaranteed by the Colombian government without rating restrictions.
| 122 |
In order to diversify risk in our Peso portfolio, Ecopetrol S.A. does not invest more than 10% of the excess of cash in one specific issuer. In the case of our U.S. dollar portfolio, it does not invest more than 5% of the excess of cash in one specific issuer in the short term, or 1% in the long term.
Ecopetrol S.A.’s investment portfolio in U.S. dollars is segmented into four tranches, each one matching our liquidity needs. The working capital tranche is calculated taking into account our cash flow needs for the next 60 days. The liquidity tranche is calculated as the contingent cash flow needs over the working capital, taking into account the development of capital expenditures related to projects. The asset liability tranche is built to match our long-term debt. The investment tranche includes the remaining amount of the total portfolio after deducting the amounts pertaining to the above mentioned tranches and after subtracting the Peso portfolio.
Ecopetrol S.A.’s investment portfolio in Pesos is segmented in two tranches, each one matching our liquidity needs. The first tranche is calculated taking into account our cash flow needs for the next 30 days, and the second tranche is built for investment purposes.
| 5.3. | Legal Proceedings and Related Matters |
We are a party to various legal proceedings in the ordinary course of business. Other than the proceedings disclosed in this annual report, we are not involved in any pending (or, to our knowledge, threatened) litigation or arbitration proceeding that we believe will have a material adverse effect on our Company. Other legal proceedings that are pending against or involve us and our subsidiaries are incidental to the conduct of our and their business. We believe that the ultimate disposition of such other proceedings individually or in an aggregate basis will not have a material adverse effect on our consolidated financial condition or results of operations.
As of December 31, 2014, Ecopetrol S.A. was a party to 2,929 legal proceedings relating to civil, administrative, environmental, tax and labor claims filed against us in the Colombian courts and arbitration tribunals, of which 270 had an accrual provision. We allocate sufficient amounts of money and time to defend these claims. Historically, we have been successful in defending lawsuits filed against us. Other than the environmental administrative proceedings described in the last paragraph of this section, based on the advice of our legal advisors, it is reasonable to assume that the litigation procedures brought against us will not materially affect our financial position or solvency regardless of the outcome. See Note 29—Contingencies, to the consolidated financial statements included in this annual report for a discussion of our legal proceedings.
Llanos Oil
In December 2010, Llanos Oil Exploration Ltd., or Llanos Oil, filed a lawsuit against us in a district court of the Netherlands before The Court of The Hague which, if decided against us, could materially affect our financial condition. The plaintiff alleges early termination attributable to us of the following exploration activity contracts: the 1997 Las Nieves Association Contract and the 2002 Guatapurí Association Contract. These contracts were terminated because of the default by Llanos Oil on July 28, 2000, and July 23, 2003, respectively, in accordance with the provisions of the contracts. In the incidental proceedings judgment of May 30, 2012, the district court in The Hague ruled that it lacks jurisdiction to hear the case and rejected all the legal grounds of the plea of Llanos Oil regarding the jurisdiction of the court. Llanos Oil appealed on August 2012. On October 15, 2013, the Court of Appeals rejected Llanos Oil’s appeal in full; the judgment of the Court of First Instance that the Dutch Courts do not have jurisdiction was confirmed. Llanos Oil appealed the judgment of the Court of Appeals before the Supreme Court. On March 18, 2015, the Supreme Court summarily denied Llanos Oil’s appeal, thereby rejecting Llanos Oil’s case against Ecopetrol in the Dutch courts.
| 123 |
Caño Limón-Coveñas Crude Oil Pipeline Spill
On December 11, 2011, the Caño Limón-Coveñas oil pipeline ruptured and caused the spill of approximately 3,267 barrels of crude oil into the Iscala creek, which connects with the Pamplonita River that provides water to the city of Cúcuta. The incident did not cause any fatalities or injuries.
We launched an internal investigation and hired a highly renowned international consultant to investigate the causes of this incident. The conclusion of the investigations was that the rupture occurred as a result of an unusual movement of soil and the tensioning of the pipeline.
A class action lawsuit has been filed against Ecopetrol S.A. and against employees of the company, and the First Administrative Court of Cucuta has jurisdiction to conduct the case, which is in the probatory stage.
The Regional Environmental Authority of Norte de Santander, or Corporación Autónoma Regional de la Frontera Nororiental – CORPONOR, initiated an investigation into the causes of the incident and also initiated enforcement actions against us for the allegedly wrongful implementation of the contingency plan. These proceedings were assumed by the National Authority on Environmental Licensing – ANLA according to national jurisdiction rules. As of the date of this annual report, the Agency has ceased all efforts on the aforementioned investigation and is determining whether or not to open a new investigation.
The Colombian General Comptroller’s Office initiated an investigation to determine whether Ecopetrol’s President, the Vice-president of Transportation, and two other employees of the company should be held financially liable for the Caño Limón-Coveñas pipeline spill and consequently for having caused a decrease in the assets of Ecopetrol. As of the date of this annual report, the investigation is in the probatory stage.
CORPONOR has filed a lawsuit against Ecopetrol at the First Administrative Court of Cucuta claiming for (i) the environmental loss caused by the incident and (ii) for compensation costs relating to the environment damage for approximately Ps$33 billion. Ecopetrol’s legal counsel filed to dismiss the lawsuit on June 2, 2014, based on three grounds: (i) there is no proof of environmental loss, (ii) CORPONOR does not have the authority to file this lawsuit and (iii) CORPONOR’s petition for direct compensation is not the proper legal action according to the applicable procedural rules.
Ecopetrol and national and local authorities are developing a project for the development of an alternative to the water supply in the intake of the aqueduct in Cúcuta, which was approved by the Company’s Board of Directors in December 2011 as part of the strengthening of its contingency plans and its relationship with its stakeholders. We are currently designing detailed engineering plans for the project.
BT Energy Challenger
On October 22, 2014, we were served with a class action suit against us seeking monetary damages of approximately Ps$7.4 trillion related to an incident that occurred on August 21, 2014, during the loading operations of the BT Energy Challenger vessel. The claimants alleged possible damage to the port area of Ecopetrol’s terminal in Coveñas, as well as of marine and submarine areas and beaches that form the geographical area of the Morrosquillo Gulf. This allegation is currently under investigation by the Harbour Master of Coveñas. Ecopetrol filed a motion requesting the judge to require the claimants to amend their claim to more precisely set forth the facts and evidence it believes establishes Ecopetrol’s liability. As of the date of this annual report, the judge has not decided on Ecopetrol’s motion, so the period for Ecopetrol to file the answer to the lawsuit has not yet ended.
| 124 |
PetroTiger
As highlighted in a previous 20-F and previous 6-K filing, on January 6, 2014, the United States Department of Justice (DOJ) announced the unsealing of charges against two former co-chief executive officers (CEOs) and the former general counsel of PetroTiger Ltd. (PetroTiger), alleging, among other things, violations of the U.S. Foreign Corrupt Practices Act (FCPA) and conspiracy to commit violations of the FCPA and money laundering in connection with payments made to an Ecopetrol employee. By the time of the DOJ announcement, that employee no longer worked at the Company. The DOJ alleged the payments were made to secure Ecopetrol’s approval for PetroTiger’s entry into an oil services contract with Mansarovar Energy Colombia Ltd. Ecopetrol participated in the Mansarovar project as non-operating partner in a joint operating agreement. Also on January 6, 2014, the DOJ announced that the general counsel of PetroTiger had pled guilty on November 8, 2013, to one count of conspiracy to violate the FCPA and to commit wire fraud. One of the charged former co-CEOs pleaded guilty on February 18, 2014, to the same charge. On May 9, 2014, the DOJ charged the other former co-CEO with conspiracy to violate the anti-bribery provisions of the FCPA, conspiracy to commit wire fraud, conspiracy to launder money, and substantive FCPA anti-bribery and money laundering violations.
After the DOJ unsealed its charges on January 6, 2014, Ecopetrol filed a complaint the same month, jointly with the Transparency Secretariat of the Presidency of the Republic, to Colombia's Attorney General's office requesting the investigation of individuals who may have been involved in the wrongdoing related to the Mansarovar contract. Colombian authorities initiated a proceeding related to PetroTiger, and on March 11, 2015, arrested four current Ecopetrol employees and two former Ecopetrol employees related to their investigation of the Mansarovar project and five other contracts involving PetroTiger and Ecopetrol.
Ecopetrol has responded to information requests from the DOJ and Colombian authorities in connection with their investigations of PetroTiger. Ecopetrol has suspended the employees, consistent with Colombian law. Ecopetrol has also initiated an internal investigation focused on issues identified in the U.S. and Colombian proceedings and, upon completion of that investigation, will evaluate any further measures.
Salgar-Cartago Multipurpose Pipeline Spill
On December 23, 2011 our Salgar-Cartago pipeline ruptured. Internal and external experts believe this incident occurred as a result of creep movement of soil caused by severe weather conditions, causing the soil surrounding the pipeline to exert strong pressure on the pipeline and rupture it. Due to the rupture, approximately 59,976 U.S. gallons of gasoline spilled into the surrounding area in La Divisa and Villa Carola in the Municipality of Dosquebradas, Risaralda. The spilled gasoline from the pipeline subsequently came into contact with a heat source which ignited it, causing several explosions that tragically resulted in 33 fatalities and 35 injuries, as well as damage to the neighboring houses and buildings. In January 2012, we launched the Dosquebradas Project to address the effects of the incident, and as of the date of this annual report the project’s health, legal, environmental and social components have been successfully completed.
Colombia’s National Authority on Environmental Licensing (ANLA) conducted an investigation into Ecopetrol’s fulfillment of its obligations regarding forest conservation and subterranean-waters and soils monitoring. The investigation was closed on September 10, 2014 because ANLA accepted and agreed with Ecopetrol’s internal investigation of the incident, which concluded that the origin of the rupture of the pipeline was the result of a creep movement caused by severe weather conditions in the area, causing the surrounding soil to exert strong pressure on the pipeline.
Environmental Administrative Proceedings
As of December 2014, Ecopetrol S.A. was party to 166 environmental administrative proceedings, of which 146 were initiated before 2014, and 20 during 2014. During 2014, eight proceedings were concluded, in two of them we were subject to monetary fines. It is not possible for us to determine whether the pending proceedings could have a material effect on Ecopetrol.
| 125 |
| 6. | Shareholder Information |
| 6.1. | 2015 Shareholders’ General Assembly |
Our Shareholders’ General Assembly was held on March 26, 2015. In it, the following matters were approved:
| · | The declaration of a cash dividend for the fiscal year ended December 31, 2014 in the aggregate amount of Ps 5,469 Billion or Ps$133 per share; and |
| · | The capitalization of reserves by means of an increase of the nominal share value of each issued and outstanding share of Ecopetrol from Ps$250 per share to Ps$609 per share, pursuant to Articles 155, 454 and 455 of the Code of Commerce of Colombia. |
| · | The adoption of certain corporate governance practices recommended by the Financial Superintendency regarding the New Code of Corporate Best Practices of Colombia. For more information, see the section Corporate Governance—Bylaws. |
| 6.2. | Dividend Policy |
We do not have a dividend policy. Pursuant to Colombian law, dividend distribution to our shareholders must be approved by a 78% majority of the shares represented in the corresponding shareholders’ meeting. In the absence of this special majority, at least 50% of the net profits must be distributed. In 2012, 2013 and 2014 the shareholders approved the distribution of 79.9%, 79.9% and 80.1% of 2011, 2012 and 2013 net income, respectively. On March 26, 2015, our shareholders at the ordinary general shareholders’ meeting approved an ordinary dividend of 70% of net income for the fiscal year ended December 31, 2014. See the section Financial Review–Liquidity and Capital Resources–Dividends.
Ecopetrol S.A. is required to have legal reserves equal to 50% of its subscribed capital. If the legal reserves are less than 50% of subscribed capital, we will contribute 10% of net income to our legal reserves every year until our legal reserves meet the required level. After giving effect to the capitalization of our reserves by $14.76 billion pesos at the 2015 shareholders meeting, our subscribed capital will be Ps$25,040 billion.
| 6.3. | Market and Market Prices |
In August 2007, we conducted an initial public offering of 10.1% of our common shares in Colombia. As a result of such offering, our common shares have traded on the Colombia Stock Exchange (Bolsa de Valores de Colombia) or BVC since November 2007 under the symbol “ECOPETROL.” Our ADSs, representing 20 common shares, have been traded on the NYSE under the symbol “EC” since September 2008. JPMorgan Chase Bank, N.A. serves as depositary for our ADSs.
Since August 2010, our ADSs have been traded on the Toronto Stock Exchange under the symbol “ECP.”
The second round of the equity offering program took place between July 27 and August 17, 2011. The offer was directed exclusively to investors in Colombia as permitted by Law 1118 of 2006. A total of 644,185,868 shares were allotted, equivalent to approximately Ps$2.38 trillion. Out of the 219,054 investors participating in this round, 73% were new stockholders. In addition, 87% of the offering was allocated to retail investors and the remaining 13% to institutional investors. Funds obtained by us through this offering were allocated to the Company’s investment plan.
| 126 |
In the future, the Nation (via the Ministry of Finance and Public Credit), as our controlling shareholder, may make decisions or announcements about its intention to sell part of its holding of our capital stock, as it has announced in recent years. We understand that our cooperation is necessary for the successful coordination of the Nation’s process.
The following table sets forth reported high and low closing prices in Pesos for our shares and the reported average daily trading volume of our shares on the BVC for the periods indicated. The table also sets forth information on the trading price of our shares in Pesos and U.S. dollars, as well as the average trading volume.
| Shares Traded on the BVC | ||||||||||||||||||||
| Pesos per share | U.S. dollars per share(1) | Average number of shares traded | ||||||||||||||||||
| High | Low | High | Low | Per day | ||||||||||||||||
| 2010 | 4,660 | 2,370 | 2.5582 | 1.1958 | 8,764,023 | |||||||||||||||
| 2011 | 4,300 | 3,575 | 2.2823 | 1.9466 | 6,750,979 | |||||||||||||||
| 2012 | 5,850 | 4,200 | 3.3236 | 2.1619 | 8,396,801 | |||||||||||||||
| 2013 | 5,710 | 3,695 | 3.2091 | 1.8992 | 7,018,859 | |||||||||||||||
| 2014 | 4,030 | 1,815 | 2.0556 | 0.7546 | 8,222,596 | |||||||||||||||
| Most recent quarters | ||||||||||||||||||||
| First quarter 2013 | 5,710 | 4,895 | 3.2091 | 2.7050 | 6,608,557 | |||||||||||||||
| Second quarter 2013 | 5,020 | 3,850 | 2.7447 | 1.9815 | 9,265,648 | |||||||||||||||
| Third quarter 2013 | 4,495 | 3,875 | 2.3672 | 2.0181 | 6,141,186 | |||||||||||||||
| Fourth quarter 2013 | 4,590 | 3,695 | 2.4388 | 1.8992 | 6,081,654 | |||||||||||||||
| First quarter 2014 | 4,030 | 3,390 | 2.0506 | 1.6755 | 7,720,085 | |||||||||||||||
| Second quarter 2014 | 4,030 | 3,410 | 2.0556 | 1.7042 | 7,977,622 | |||||||||||||||
| Third quarter 2014 | 3,380 | 3,110 | 1.8092 | 1.4223 | 7,405,784 | |||||||||||||||
| Fourth quarter 2014 | 3,140 | 1,815 | 1.5529 | 0.7546 | 9,767,957 | |||||||||||||||
| First quarter 2015 | 2,305 | 1,800 | 0.9575 | 0.7016 | 12,356,758 | |||||||||||||||
| Most recent six months | ||||||||||||||||||||
| October 2014 | 3,140 | 2,750 | 1.5529 | 1.3411 | 8,759,299 | |||||||||||||||
| November 2014 | 2,750 | 2,290 | 1.3337 | 1,0577 | 10,975,313 | |||||||||||||||
| December 2014 | 2,285 | 1,815 | 1.0357 | 0,7546 | 9,726,740 | |||||||||||||||
| January 2015 | 2,080 | 1,815 | 0,8694 | 0,7586 | 10,121,171 | |||||||||||||||
| February 2015 | 2,305 | 2,070 | 0,9575 | 0,8392 | 14,028,575 | |||||||||||||||
| March 2015 | 2,005 | 1,800 | 0,8030 | 0,7016 | 13,072,511 | |||||||||||||||
| April 2015 (through 27) | 2,085 | 1,985 | 0,8431 | 0,7697 | 10,146,381 | |||||||||||||||
| (1) | U.S. dollars per common share translated at the Representative Market Exchange Rate as of each period. |
The following table sets forth reported high and low closing prices in U.S. dollars for our ADSs and the average daily trading volume of our ADSs on the NYSE for the periods indicated. The table also sets forth information on the trading price of our ADSs in U.S. dollars, as well as the average trading volume.
| 127 |
| ADSs Traded on NYSE | ||||||||||||
| U.S. dollars per ADS(1) | Average number of adss Traded | |||||||||||
| High | Low | per day | ||||||||||
| 2010 | 51.92 | 23.60 | 163,749 | |||||||||
| 2011 | 46.00 | 38.47 | 357,289 | |||||||||
| 2012 | 67.48 | 44.52 | 551,410 | |||||||||
| 2013 | 63.80 | 37.93 | 464,193 | |||||||||
| 2014 | 41.16 | 14.77 | 603,083 | |||||||||
| Most recent quarters | ||||||||||||
| First quarter 2013 | 63.80 | 53.71 | 480,344 | |||||||||
| Second quarter 2013 | 54.70 | 39.87 | 621,213 | |||||||||
| Third quarter 2013 | 47.69 | 40.40 | 337,225 | |||||||||
| Fourth quarter 2013 | 48.91 | 37.93 | 420,859 | |||||||||
| First quarter 2014 | 40.79 | 33.20 | 624,531 | |||||||||
| Second quarter 2014 | 41.16 | 34.05 | 468,611 | |||||||||
| Third quarter 2014 | 36.39 | 28.60 | 425,034 | |||||||||
| Fourth quarter 2014 | 30.94 | 14.77 | 892,769 | |||||||||
| First quarter 2015 | 19.80 | 13.89 | 1,083,162 | |||||||||
| Most recent six months | ||||||||||||
| October 2014 | 30.94 | 26.80 | 743,780 | |||||||||
| November 2014 | 26.08 | 20.29 | 816,741 | |||||||||
| December 2014 | 20.11 | 14.77 | 1,107,871 | |||||||||
| January 2015 | 17.14 | 14.93 | 1,087,704 | |||||||||
| February 2015 | 19.80 | 16.71 | 948,535 | |||||||||
| March 2015 | 15.74 | 13.89 | 1,201,011 | |||||||||
| April 2015 (through 27) | 17.26 | 15.52 | 844,549 | |||||||||
| (1) | Each ADS represents the right to receive 20 of our common shares. |
TRADING ON THE COLOMBIA STOCK EXCHANGE
The BVC is the largest stock exchange in Colombia for trading securities and derivatives. The BVC is a member of the World Federation of Exchanges and the Federación Iberoamericana de Bolsas.
The BVC is the only exchange where our common shares trade in Colombia. The table below sets forth the reported aggregate market capitalization of the companies traded on the BVC, as of December 31, 2014.
| Aggregate Market Capitalization of the BVC | ||||||||
| Market Capitalization | Market Capitalization | |||||||
| (Ps$ in billions) | (US$ in billions)(1) | |||||||
| December 31, 2014 | 364,107 | 153,078 | ||||||
| (1) | Representative Market Exchange Rate as of December 30, 2014. |
Registration and Transfer of Shares
Under Colombian law, transfers of shares must be registered on the issuer’s stock ledger. Only those holders registered on the stock ledger are considered by law as shareholders. Ecopetrol’s shares are in electronic form, other than those shares held by the Nation, which are in physical form.
Transfers of shares evidenced in electronic form required to be negotiated through the Colombia Stock Exchange. In Colombia, only the relevant stockbrokers called sociedades comisionistas de bolsa are authorized to make the transfers of shares through the Colombia Stock Exchange. The transfers of shares are registered in the Centralized Security Deposit (Depósito Centralizado de Valores) or DECEVAL, through the relevant stockbrokers. DECEVAL records the share transfer on its systems, in order to make the corresponding registration in the issuer stock ledger.
| 128 |
Under Colombian legislation, if a transfer of shares for a value equivalent to or higher than 66,000 UVR (UVR= 215.0333 as of December 31, 2014) must be made through the BVC if the shares are registered with the BVC. Otherwise, shareholders can freely negotiate a transfer of shares.
Nevertheless, the following transfers are not required to be executed through the BVC:
| · | Transfers between shareholders who are considered to be the same beneficial owner; |
| · | Transfers of shares owned by financial institutions, under supervision of Superintendency of Finance, that are in a liquidation process; |
| · | Repurchases of shares by the issuer; |
| · | Property delivered in lieu of payment, or payment of money or other valuable property, different than the amount owed or demanded, in exchange for the extinguishment of the debt; |
| · | Transfers of shares made by the Nation or the Financial Institutions Warranty Fund (Fondo de Garantías de Instituciones Financieras) or FOGAFIN; |
| · | Transfers of shares issued abroad by Colombian companies, provided they take place outside Colombia; |
| · | Transfers of shares issued by foreign companies, offered through a public offer in Colombia, provided that they take place outside Colombia; and |
| · | Any other transaction specifically authorized by the Superintendency of Finance to take place outside the BVC. |
For the purposes described above, multiple transfer transactions made within one hundred twenty (120) calendar days, between the same parties on shares of the same issuer and under similar conditions, are treated as a single transfer.
| 6.4. | Ecopetrol ADR Programme Fees |
Fees and Charges That a Holder of Our ADSs May Have to Pay, Either Directly or Indirectly
JPMorgan Chase Bank, N.A., our Depositary, may charge each person to whom ADSs are issued, including, without limitation, issuances against deposits of shares, issuances in respect of share distributions, rights and other distributions, issuances pursuant to a stock dividend or stock split declared by us or issuances pursuant to a merger, exchange of securities or any other transaction or event affecting the ADSs or deposited securities, and each person surrendering ADSs for withdrawal of deposited securities in any manner permitted by the deposit agreement or whose ADRs are cancelled or reduced for any other reason, US$5.00 for each 100 ADS (or any portion thereof) issued, delivered, reduced, cancelled or surrendered, as the case may be. The Depositary may sell (by public or private sale) sufficient securities and property received in respect of a share distribution, rights and/or other distribution prior to such deposit to pay such charge.
The Depositary collects its fees for issuance and cancellation of ADSs directly from investors depositing shares or surrendering ADSs for the purpose of withdrawal or from intermediaries acting for them. The Depositary collects fees for making distributions to investors by deducting those fees from the amounts distributed or by selling a portion of distributable property to pay the fees. The Depositary may collect its annual fee for Depositary services by deduction from cash distributions, or by directly billing investors, or by charging the book-entry system accounts of participants acting for them. The Depositary may generally refuse to provide services to any holder until the fees and expenses owing by such holder for those services or otherwise are paid.
| 129 |
The following additional charges may be incurred by ADS holders, by any party depositing or withdrawing shares or by any party surrendering ADSs or to whom ADSs are issued (including, without limitation, issuance pursuant to a stock dividend or stock split declared by us or an exchange of stock regarding the ADRs or the deposited securities or a distribution of ADSs), whichever is applicable:
| · | A fee of US$1.50 per ADR or ADRs for transfers of certificated or direct registration ADRs; |
| · | A fee of up to US$0.02 per ADS for any cash distribution made pursuant to the deposit agreement; |
| · | A fee of US$0.05 per ADS per calendar year (or portion thereof) for services performed by the Depositary in administering our ADR program (which fee may be charged on a periodic basis during each calendar year and shall be assessed against holders of ADRs as of the record date or record dates set by the Depositary during each calendar year and shall be payable in the manner described in the next succeeding provision); |
| · | Any other charge payable by the Depositary, or any of the Depositary’s agents, including, without limitation, the custodian, or the agents of the Depositary’s agents in connection with the servicing of our shares or other deposited securities (which charge shall be assessed against registered holders of our ADRs as of the record date or dates set by the Depositary and shall be payable at the sole discretion of the Depositary by billing such registered holders or by deducting such charge from one or more cash dividends or other cash distributions); |
| · | A fee for the distribution of securities (or the sale of securities in connection with a distribution), such fee being in an amount equal to the fee for the execution and delivery of ADSs which would have been charged as a result of the deposit of such securities (treating all such securities as if they were shares) but which securities or the net cash proceeds from the sale thereof are instead distributed by the Depositary to those holders entitled thereto; |
| · | Stock transfer or other taxes and other governmental charges; |
| · | Cable, telex and facsimile transmission and delivery charges incurred at the ADS holder’s request; |
| · | Transfer or registration fees for the registration of transfer of deposited securities on any applicable register in connection with the deposit or withdrawal of deposited securities; |
| · | Expenses of the Depositary in connection with the conversion of foreign currency into U.S. dollars; and |
| · | Such fees and expenses as are incurred by the Depositary (including, without limitation, expenses incurred in connection with compliance with foreign exchange control regulations or any law or regulation relating to foreign investment) in delivery of deposited securities or otherwise in connection with the Depositary’s or its custodian’s compliance with applicable laws, rules or regulations. |
We will pay all other charges and expenses of the Depositary and any agent of the Depositary (except the custodian) pursuant to agreements from time to time between us and the Depositary. The fees described above may be amended from time to time.
| 130 |
Fees and Other Direct and Indirect Payments Made by the Depositary to Us
Our Depositary has agreed to reimburse us for certain expenses we incur that are related to establishment and maintenance of the ADR program, including investor relations expenses and exchange application and listing fees. In 2013, the Depositary did not make reimbursements to us. In 2014, reimbursements were made in the amount of approximately US$3,093,346 for expenses related to investor relations activities.
| 6.5. | Taxation |
| 6.5.1 | Colombian Tax Considerations |
The following is a general description of the Colombian tax considerations for investments in common shares in Colombia or for the purchase of ADSs, in a foreign securities market. This description is based on applicable law in effect as of the date of this annual report is issued, which may be subject to changes.
Prospective purchasers of common shares or ADSs should consult their own tax advisors for a detailed analysis of the tax consequences in Colombia, resulting from the acquisition, ownership and disposition of common shares or ADSs.
General Rules
Colombian entities and individuals who are deemed to be residents within the Colombian national territory for Colombian tax purposes, are subject to Colombian income tax on their worldwide income. Foreign entities and individuals who are not deemed to be residents in Colombia for tax purposes are subject to income tax in Colombia only with respect to their national-source income, which is generally defined as income obtained from (i) the rendering of services inside Colombian territory, (ii) the exploitation of tangible and intangible assets in Colombia, and (iii) the sale of tangible or intangible assets that are located inside Colombian territory at the time of title passage. Double taxation treaties signed by Colombia, if applicable, may provide for special regulations regarding income tax.
For Colombian tax purposes, an individual is considered to be a Colombian resident when he/she meets any of the following criteria:
| (1) | He/she remains in Colombia continuously or discontinuously for more than 183 calendar days within any given 365-consecutive-day term; |
| (2) | He/she is related to the Colombian Government’s foreign service or to individuals who are in the Colombian Government’s foreign service and who, by virtue of the Vienna Conventions on diplomatic and consular relations, are exempted from taxes during the time of their service; or |
| (3) | He/she is a Colombian national and: |
| - | Has a spouse or permanent companion, or dependent children, who are tax residents in Colombia, or |
| - | 50% or more of his or her total income is Colombian source income, or |
| - | 50% or more of his or her assets are managed in Colombia, or |
| - | 50% or more of his or her assets are deemed to be located or possessed in Colombia, or |
| - | Has failed to provide proof of residency in another country (different from Colombia) upon previous official request by the Colombian tax office, or |
| - | He/she has a tax residency in a country considered by the Colombian Government to be a low tax jurisdiction or a tax haven. |
| Law 1739 of 2014 clarifies that Colombian nationals who meet any of the following requirements, will not be deemed as tax residents: |
| - | If more than 50% of his or her annual income, has its source in the jurisdiction where he or she is domiciled and whose country of domicile is not Colombia. |
| 131 |
| - | If more than 50% of his/her assets are located in the jurisdiction where he or she is domiciled and whose country of domicile is not Colombia. |
For purposes of Colombian taxation, an entity is deemed to be a “national” or a “Colombian entity” and, therefore, subject to taxation in Colombia on its worldwide income, if it meets any of the following criteria:
| (1) | It has its place of effective management, in Colombia during the corresponding year or taxable period; |
| (2) | It has its main domicile in the Colombian territory; or |
| (3) | It has been incorporated in Colombia, in accordance with Colombian laws. |
Pursuant to the Colombian Tax Statute, a foreign company or non-resident individual has a permanent establishment in Colombia when said company or individual performs activities in Colombia through: (1) a fixed place of business (i.e., branches, factories or offices), or (2) an individual who is not an independent agent empowered to execute agreements on behalf of the foreign company. Permanent establishments are considered Colombian taxpayers in connection with the Colombian-source income and Colombian-source taxable gains attributed to said permanent establishment. A foreign company or entity will not be deemed to have a permanent establishment by the sole fact that it acts through a broker or any other independent agent.
Tax Treatment of a Non-Colombian Entity and a Non-Resident Individual of Colombia Who Purchases an ADS in a Foreign Securities Market
Dividends
As a general rule, dividends paid to foreign companies, foreign entities or non-resident individuals who are investing in ADSs which underlying assets are Colombian shares are treated as Colombian-source income and are thus subject to Colombian income tax.
To avoid double taxation, dividends paid by Colombian entities are not subject to income tax at the shareholder level when they are paid out of corporate profits that have been previously taxed at the corporate level.
In light of the above, the applicable withholding tax rate for an entity or a non-resident individual investing through a Foreign Funds Administration Account (FFAA) is 25%, since its investment qualifies as portfolio investments and the dividends that are distributed by the Colombian entity are not taxed at the corporate level (assuming that the dividends cannot be attributed to a permanent establishment in Colombia belonging to the shareholder). These foreign shareholders subject to this withholding tax are not required to file an income tax return in Colombia.
Taxation of Capital Gains From the Sale of ADSs
Capital gains obtained from the sale of ADSs by non-Colombian entities, Colombian individuals who are non-residents in Colombia and foreign non-resident individuals, are not subject to income tax in Colombia as such sale does not generate Colombian-source income to the extent that the ADSs are not deemed to be possessed in Colombia.
If the holder of the ADSs who is a non-resident entity, a Colombian individual who is not a resident in Colombia or a foreign non-resident individual, decides to surrender the ADSs and withdraw the underlying common shares, it is arguable that such transaction does not generate a capital gain subject to income tax in Colombia. However, different interpretations may be adopted by the Colombian Tax Authorities on this matter.
| 132 |
Tax Treatment in Colombia of a Non-Colombian Entity and a Non-Resident Individual of Colombia Who Purchases Ecopetrol’s Shares in Colombia’s Securities Market
Dividends
As a general rule, dividends paid to foreign companies, foreign entities, or to non-resident individuals in Colombia, who are investing in Colombian shares directly or through a FFAA, are treated as national-source income; thus, they are subject to Colombian income tax.
To avoid double taxation, dividends are not subject to income tax at the shareholder level when they are paid out of corporate profits that have been previously taxed at the corporate level.
If the shareholder is a non-resident entity or a non-resident individual investing directly, it will be taxed upon distribution, by means of the withholding tax mechanism, provided that its investment does not qualify as portfolio investments and dividends that are distributed are not taxed at the corporate level. In this case, dividends will likely be subject to income tax withholding at a rate of 39% (FY 2015), 40% (FY 2016), 42% (FY 2017) and 43% (FY2018) upon distribution.
There is a line of interpretation according to which a fixed withholding rate of 33% should be applicable. Further regulations clarifying this point may be issued by the relevant authorities. Foreign shareholders subject to this withholding tax are not required to file an income tax return in Colombia.
Non-resident entities or non-resident individuals will be taxed upon distribution by means of the withholding tax mechanism, provided that their investments qualify as portfolio investments (i.e., investing through a FFAA and dividends that are distributed by the Colombian entity are not taxed at the corporate level. In this case, the applicable withholding tax rate is 25%, assuming that the dividends cannot be attributed to a permanent establishment in Colombia belonging to the shareholder). These foreign shareholders subject to this withholding tax are not required to file an income tax return in Colombia.
Taxation of Capital Gains for the Sale of Shares
Capital gains derived from the sale of shares listed on the BVC and owned by the same beneficial owner, are deemed as non-taxable income in Colombia, provided that the shares sold during the same taxable year do not represent more than 10% of the outstanding shares of the listed company. Pursuant to Article 18 of Decree 2634 of 2012, sellers of shares are not required to file an income tax return for the transfer of securities that are listed in the National Registry of Securities and Issuers (Registro Nacional de Valores y Emisores or RNVE) as long as the foreign investment is treated as a portfolio investment according to article 3 of Decree 2080 of 2000.
If the above-mentioned requirements are not met, the capital gain obtained in the sale of shares is subject to income tax or capital gains tax, under the following rules:
| · | The gain or loss arising therefrom will be equivalent to the difference between the sale price and the tax basis of the shares. As a general rule, the tax basis of shares is equal to the price paid for such shares (i.e., cost of acquisition). |
| · | The applicable tax rate and the withholding tax rate have to be determined on a case-by-case basis. |
| 133 |
Tax Treatment of Non-Residents Who Purchase Ecopetrol’s Shares in the BVC Market and Exchange Them for ADSs
Dividends
Payment of dividends by Colombian entities to foreign companies, foreign entities or to non-resident individuals who are investing in ADSs which underlying assets are Colombian shares or in Colombian shares directly are subject to the tax treatment described above.
Taxation on Capital Gains for the Sale of Shares
If the holder of the Colombian shares is a non-resident entity, a Colombian individual who is not a resident in Colombia or a foreign non-resident individual, and such holder decides to exchange such common shares for ADSs, it is arguable that such transaction should not generate a capital gain subject to income tax in Colombia. However, different interpretations may be adopted by the Colombian tax authorities on this matter. For instance, assuming that the exchange of securities is treated as a sale of Ecopetrol’s shares, the seller would be subject to the tax treatment described above in connection with the taxation of capital gains for the sale of shares.
| 6.5.2 | U.S. Federal Income Tax Consequences |
This summary describes the principal U.S. federal income tax consequences of the ownership and disposition of common shares or ADSs, but it does not purport to be a comprehensive description of all of the U.S. tax consequences that may be relevant to a decision to hold or dispose of common shares or ADSs. This summary applies only to purchasers of common shares or ADSs who will hold the common shares or ADSs as capital assets for tax purposes and does not apply to special classes of holders such as dealers in securities or currencies, holders whose functional currency is not the U.S. dollar, holders of ten percent or more of our shares (taking into account shares held directly or through depositary arrangements), tax-exempt organizations, financial institutions, holders liable for the alternative minimum tax, securities traders who elect to account for their investment in common shares or ADSs on a mark-to-market basis, partnerships or other pass-through entities, insurance companies, U.S. expatriates, persons that purchase or sell common shares or ADSs as part of a wash sale for tax purposes, and persons holding common shares or ADSs in a hedging transaction or as part of a straddle, conversion or other integrated transaction for U.S. federal income tax purposes. The statements regarding U.S. tax law set forth in this summary is based on the Internal Revenue Code of 1986, as amended, which we call the “Code,” its legislative history, existing and proposed regulations, published rulings and court decisions all as in force on the date of this annual report, and changes to such law subsequent to the date of this annual report may affect the tax consequences described herein (possibly with retroactive effect). This summary is also based in part on the representations of the Depositary and the assumption that each obligation in the deposit agreement and any related agreement will be performed in accordance with its terms.
Each holder is encouraged to consult such holder’s tax advisor concerning the overall tax consequences to it, including the consequences under laws other than U.S. federal income tax laws, of an investment in common shares or ADSs.
In this discussion, references to a “U.S. Holder” are to a beneficial holder of a common share or an ADS that is (1) a citizen or resident of the United States, (2) a corporation, or any other entity taxable as a corporation, organized under the laws of the United States, any state thereof or the District of Columbia, (3) an estate whose income is subject to United States federal income tax regardless of its source, or (4) a trust if a United States court can exercise primary supervision over the trust's administration and one or more United States persons are authorized to control all substantial decisions of the trust.
For United States federal income tax purposes, holders of ADSs will generally be treated as owners of the common shares represented by such ADSs.
| 134 |
This discussion addresses only United States federal income taxation. Holders of common shares or ADSs should consult their own tax advisor regarding the United States federal, state and local and other tax consequences of owning and disposing of common shares and ADSs in their particular circumstances.
Distributions on Common Shares or ADSs
A distribution to U.S. Holders made by us of cash or property with respect to common shares or ADSs generally will be treated as a dividend for U.S. federal income tax purposes to the extent paid out of our current or accumulated earnings and profits (as determined under U.S. federal income tax principles). Distributions in excess of our current or accumulated earnings and profits, as determined for United States federal income tax purposes, will be treated first as a tax-free return of capital reducing such U.S. Holder’s adjusted tax basis in the common shares or ADSs. Any distribution in excess of such adjusted tax basis will be treated as capital gain and will be either long-term or short-term capital gain depending upon whether the U.S. Holder held the common shares or ADSs for more than one year. Distributions of additional common shares or ADSs to U.S. Holders that are part of a pro rata distribution to all of our shareholders generally will not be subject to U.S. federal income tax. We do not maintain calculations of our earnings and profits under U.S. federal income tax principles, and, therefore, U.S. Holders should expect that any distributions generally will be reported as dividends for U.S. federal income tax purposes. As used below, the term “dividend” means a distribution that constitutes a dividend for U.S. federal income tax purposes.
The amount of any distribution will include the amount of any Colombian tax withheld on the amount distributed, and the amount of a distribution paid in Pesos will be measured by reference to the exchange rate for converting Pesos into U.S. dollars in effect on the date the distribution is received by the Depositary (or by a U.S. Holder in the case of a holder of common shares) regardless of whether the payment is in fact converted into U.S. dollars. If the Depositary (or U.S. Holder in the case of a holder of common shares) does not convert such Pesos into U.S. dollars on the date it receives them, generally, any gain or loss resulting from currency exchange fluctuations during the period from the date the dividend payment is included in income to the date the payment is converted into U.S. dollars will be treated as ordinary income or loss and will not be eligible for the special tax rate applicable to qualified dividend income (as discussed below). The gain or loss generally will be income or loss from sources within the United States for foreign tax credit limitation purposes. Dividends paid by us will not be eligible for the dividends received deduction allowed to corporations under the Code.
If you are a noncorporate U.S. Holder, dividends that constitute qualified dividend income will be taxable to you at the preferential rates applicable to long-term capital gains provided that you meet certain holding requirements. Dividends paid on the ADSs will be treated as qualified dividend income if (1) the ADSs are readily tradable on an established securities market in the United States and (2) we were not, in the year prior to the year in which the dividend was paid, and are not, in the year in which the dividend is paid, a passive foreign investment company (PFIC). The ADSs are listed on the New York Stock Exchange, and will qualify as readily tradable on an established securities market in the United States so long as they are so listed. Based on our audited financial statements and relevant market and shareholder data, we believe that we were not treated as a PFIC for U.S. federal income tax purposes with respect to our 2013 taxable year. In addition, based on our audited financial statements and our current expectations regarding the value and nature of our assets, the sources and nature of our income, and relevant market and shareholder data, we do not anticipate becoming a PFIC for the 2014 taxable year. However, this conclusion is a factual determination that is made annually and thus may be subject to change. Based on existing guidance, it is not clear whether dividends received with respect to the common shares will be treated as qualified dividends. In addition, the U.S. Treasury has announced its intention to promulgate rules pursuant to which holders of ADSs or common shares and intermediaries through whom such securities are held will be permitted to rely on certifications from issuers to treat dividends as qualified for tax reporting purposes. Because such procedures have not yet been issued, it is not clear whether we will be able to comply with them. Holders of ADSs and common shares should consult their own tax advisers regarding the availability of the reduced dividend tax rate in the light of the considerations discussed above and their own particular circumstances.
| 135 |
A U.S. Holder will be entitled, subject to a number of complex limitations and conditions, to claim a U.S. foreign tax credit in respect of any Colombian income taxes withheld on dividends received on common shares or ADSs. U.S. Holders who do not elect to claim a credit for any foreign income taxes paid during the taxable year may instead claim a deduction in respect of such Colombian income taxes provided the U.S. Holder elects to deduct (rather than credit) all foreign income taxes for that year. Dividends received with respect to the common shares or ADSs will be treated as foreign source income, subject to various classifications and other limitations. For the purposes of the U.S. foreign tax credit limitations, the dividends paid with respect to our common shares or ADSs will generally constitute either “passive” or “general” income. The rules relating to computing foreign tax credits or deducting foreign income taxes are extremely complex, and U.S. Holders are urged to consult their own independent tax advisers regarding the availability of foreign tax credits with respect to any Colombian income taxes withheld.
Sale, Exchange or Other Taxable Dispositions of Common Shares or ADSs
A U.S. Holder generally will recognize capital gain or loss upon the sale, exchange or other taxable disposition of common shares or ADSs in an amount equal to the difference between the U.S. dollar value of the amount realized on the sale, exchange or other taxable disposition of the common shares or ADSs and the U.S. Holder’s adjusted tax basis, determined in U.S. dollars, in the common shares or ADSs. Any gain or loss will be long-term capital gain or loss if the common shares or ADSs have been held for more than one year. Certain non-corporate U.S. Holders (including individuals) may be eligible for preferential rates of U.S. federal income tax in respect of long-term capital gains. The deductibility of capital losses is subject to limitations under the Code.
If you are a U.S. Holder of common shares or ADSs, the initial tax basis of your common shares or ADSs will be the U.S. dollar value of the Peso-denominated purchase price determined on the date of purchase. If the common shares or ADSs are treated as traded on an “established securities market,” a cash basis U.S. Holder, or, if it elects, an accrual basis U.S. Holder, will determine the dollar value of the cost of such common shares or ADSs by translating the amount paid at the spot rate of exchange on the settlement date of the purchase. If you convert U.S. dollars to Pesos and immediately use that currency to purchase common shares or ADSs, such conversion generally will not result in taxable gain or loss to you.
With respect to the sale or exchange of common shares or ADSs, the amount realized generally will be the U.S. dollar value of the payment received determined on (1) the date of receipt of payment in the case of a cash basis U.S. Holder and (2) the date of disposition in the case of an accrual basis U.S. Holder. If the common shares or ADSs are treated as traded on an “established securities market,” a cash basis taxpayer, or, if it elects, an accrual basis taxpayer, will determine the U.S. dollar value of the amount realized by translating the amount received at the spot rate of exchange on the settlement date of the sale.
Deposits and withdrawals of common shares in exchange for ADSs, and ADSs for common shares generally will not result in the realization of gain or loss for U.S. federal income tax purposes.
Backup Withholding and Information Reporting
In general, dividends on common shares or ADSs, and payments of the proceeds of a sale, exchange or other taxable disposition of common shares or ADSs, paid within the United States, by a U.S. payor through certain U.S.-related financial intermediaries to a U.S. Holder are subject to information reporting and may be subject to backup withholding at a current rate of 28% unless the holder (1) establishes that it is a corporation or other exempt recipient or (2) with respect to backup withholding, provides an accurate taxpayer identification number and certifies that it is a U.S. person and that no loss of exemption from backup withholding has occurred.
Backup withholding is not an additional tax. The amount of any backup withholding tax from a payment to a U.S. Holder will be allowed as a credit against the U.S. Holder’s U.S. federal income tax liability, provided that the required information is timely furnished to the Internal Revenue Service (the “IRS”). A U.S. Holder generally may obtain a refund of any amounts withheld under the backup withholding rules that exceed its U.S. federal income tax liability by timely filing a refund claim with the IRS.
| 136 |
U.S. Tax Considerations for Non-U.S. Holders
A holder or beneficial owner of common shares or ADSs that is not a U.S. Holder for U.S. federal income tax purposes (a “non-U.S. Holder”) generally will not be subject to U.S. federal income or withholding tax on dividends received on common shares or ADSs, unless the dividends are “effectively connected” with the non-U.S. Holder’s conduct of a trade or business within the United States. In such a case a non-U.S. Holder generally will be taxed in the same manner as a U.S. Holder. In the case of “effectively connected” dividends received by a corporate non-U.S. Holder, the corporate non-U.S. Holder may, under certain circumstances, be subject to an additional “branch profits tax” at a 30% rate.
A non-U.S. Holder of common shares or ADSs will not be subject to U.S. federal income or withholding tax on gain realized on the sale of common shares or ADSs, unless (i) the gain is “effectively connected” with the non-U.S. Holder’s conduct of a trade or business in the United States, or (ii) in the case of gain realized by an individual non-U.S. Holder, the non-U.S. Holder is present in the United States for 183 days or more in the taxable year of the sale and certain other conditions are met. In the case of “effectively connected” gains realized by a corporate non-U.S. Holder, the corporate non-U.S. Holder may, under certain circumstances, be subject to an additional “branch profits tax” at a 30% rate.
Although non-U.S. Holders generally are exempt from backup withholding and information reporting requirements, a non-U.S. Holder may be required to comply with certification and identification procedures in order to establish its exemption from information reporting and backup withholding.
| 6.6. | Exchange Controls and Limitations |
Payments in foreign currency with respect to certain foreign exchange transactions including international investments between Colombian residents and non-Colombian residents must by law be conducted through the commercial exchange market. Therefore, any foreign currency income or expenses under the ADRs must be channeled through that market. Transactions conducted through the commercial exchange market are made at market rates freely negotiated with authorized intermediaries (banks, financial corporations, administrators and others).
Foreign portfolio investments must be made through authorized foreign exchange investment management companies. Only brokerage firms, trust companies and investment management companies, subject to the inspection and supervision of the Superintendency of Finance, are allowed to make investments in the local Colombian market on behalf of foreign investors. Such firms, trust companies and investment management companies also act as the foreign investors’ local representatives for tax and foreign exchange purposes.
Colombian law provides that the Colombian Central Bank may intervene in the foreign exchange market at its own discretion at any time. Likewise, from time to time, the Colombian government introduces amendments to the International Investment Statute. The Colombian Central Bank may also limit the remittance of dividends and/or investments of foreign currency received by Colombian residents whenever the international reserves fall below an amount equal to three months of imports. We cannot assure you that the Colombian Central Bank will not intervene in the future. However, since the establishment of the current foreign exchange regime in 1991, the Colombian Central Bank has never taken such action except for a brief restriction by the national government in 2004. See the section Risk Review–Risk Factors–Risks Relating to Colombia’s Political and Regional Environment.
| 137 |
Registration of Foreign Investment Represented in Underlying Shares
Colombia’s International Investment Statute and the regulations issued by the Colombian Central Bank, which have been amended from time to time through related decrees and regulations, regulate the manner in which non-Colombian resident entities and individuals can invest in Colombia and participate in the Colombian securities markets. Among other requirements, the statute and regulations mandate registration of foreign investment transactions with the Colombian Central Bank and specify procedures to authorize and administer such foreign investment transactions. Additionally, pertinent information must be updated on a regular basis (yearly or monthly, depending on the type of information).
Under these foreign investment regulations, the failure of a foreign investor to report or register with the Colombian Central Bank foreign exchange transactions relating to investments in Colombia on a timely basis may prevent the investor from obtaining remittance rights, constitute an exchange control infraction, and result in a fine.
Foreign investors who acquire ADRs are not required to register this investment with Colombian authorities. Holders of ADRs will benefit from the registration to be obtained by the custodian for our common shares underlying the ADRs in Colombia. Such registration allows the custodian to convert dividends and other distributions with respect to the common shares into foreign currency and remit the proceeds abroad. If investors in ADRs choose to surrender their ADRs and withdraw common shares, they must retain an administrator for the investments and register their investments in common shares as a portfolio investment through their local representative. The local representative is the brokerage firm, trust company or investment management company that acts on behalf of the holders of the ADRs in Colombia, and the request for registration is made by them.
Colombian residents who acquire ADRs and either receive profits from this investment, surrender their ADRs or liquidate their investment in ADRs must register these operations with the Colombian authorities and comply with applicable regulations through its Colombian brokerage firm.
In obtaining its own foreign investment registration, an investor who surrenders its ADRs and sells common shares may incur expenses and/or suffer delays in the application process. Investors would only be allowed to transfer dividends abroad or transfer funds received as distributions relating to our common shares after their foreign investment registration procedure with the Colombian Central Bank has been completed. In addition, the depositary’s foreign investment registration may also be adversely affected by future legislative changes, but its rights to transfer dividends abroad or profits arising from distributions relating to our common shares must be maintained according to Colombian law and foreign investment treaties entered into by Colombia in force at the time of the registration of the investment, except when Colombia’s international reserves fall below an amount equivalent to three months’ worth of imports.
| 6.7. | Exchange Rates |
On April 28, 2015, the Representative Market Exchange Rate was Ps$2,419.81 per US$1.00. The Federal Reserve Bank of New York does not report a noon-buying rate for Colombian Pesos. The Superintendencia Financiera, or Superintendency of Finance, calculates the Representative Market Exchange Rate based on the weighted averages of the buy and sell foreign exchange rates quoted daily by foreign exchange rate market intermediaries including financial institutions for the purchase and sale of U.S. dollars. The Superintendency of Finance also calculates the Representative Market Exchange Rate for each month for purposes of preparing financial statements and converting amounts in foreign currency to Pesos.
The following table sets forth the high, low, average and period-end exchange rate for Peso/U.S. dollar Representative Market Exchange Rate for each of the last five years and for the last six months.
| 138 |
| Exchange Rates | ||||||||||||||||
| High | Low | Average | Period-End | |||||||||||||
| 2010 | 2,044.23 | 1,786.20 | 1,897.89 | 1,913.98 | ||||||||||||
| 2011 | 1,972.76 | 1,748.41 | 1,848.17 | 1,942.70 | ||||||||||||
| 2012 | 1,942.70 | 1,754.89 | 1,798.23 | 1,768.23 | ||||||||||||
| 2013 | 1,952.11 | 1,758.45 | 1,868.90 | 1,926.83 | ||||||||||||
| 2014 | 2,446.35 | 1,846.12 | 2,000.68 | 2,392.46 | ||||||||||||
| October | 2,074.40 | 2,021.49 | 2,047.03 | 2,050.52 | ||||||||||||
| November | 2,206.35 | 2,061.92 | 2,127.25 | 2,206.19 | ||||||||||||
| December | 2,446.35 | 2,206.19 | 2,344.23 | 2,392.46 | ||||||||||||
| 2015: | ||||||||||||||||
| January | 2,452.11 | 2,361.54 | 2,397.69 | 2,441.10 | ||||||||||||
| February | 2,500.59 | 2,371.31 | 2,420,38 | 2,496.99 | ||||||||||||
| March | 2,677.97 | 2,486.99 | 2,586.58 | 2,576.05 | ||||||||||||
| April (through April 28) | 2,598.36 | 2,419.81 | 2,506.99 | 2,419.81 | ||||||||||||
Source: Superintendency of Finance for historical data. Banco de la República, or the Colombian Central Bank, for averages.
| 6.8. | Major Shareholders |
Major Shareholders
The following table sets forth the names of our major shareholders, and the number of shares and the percentage of outstanding shares owned by them at March 31, 2015:
| At March 31, 2015 | ||||||||
| Shareholders | Number of shares | % Ownership | ||||||
| Nation(1) – Ministry of Finance and Public Credit | 36,384,788,817 | 88.49 | ||||||
| Public float | 4,731,909,639 | 11.51 | ||||||
| Total | 41,116,698,456 | 100 | ||||||
| (1) | Includes 2,000 shares owned by other state entities. |
All our common shares have identical voting rights.
As of March 31, 2015, 1.47% of our common shares were held of record in the form of American Depository Shares. As of March 31, 2015, we had 35 registered holders and as of February 23, 2015 we had 15,242 beneficiaries of common shares, or ADSs representing common shares, in the United States.
Changes in the Capital of the Company
There are no conditions in our bylaws governing changes in our capital stock that are more stringent than those required under Colombian law, with the exception that the Nation must hold a minimum of 80% of our capital stock at all times.
| 6.9. | Enforcement of Civil Liabilities |
We are a Colombian company. All of our Directors and executive officers and some of the experts named in this annual report reside outside the United States. All or a substantial portion of our assets and the assets of these persons are located outside of the United States. As a result, it may not be possible for you to effect service of process within the United States upon us or these persons or to enforce against us or them judgments in U.S. courts obtained in such courts predicated upon the civil liability provisions of the U.S. federal securities laws. Colombian courts will enforce a U.S. judgment predicated on the U.S. securities laws through a procedural system known under Colombian Law as exequatur. The Colombian Supreme Court will enforce a foreign judgment, without reconsideration of the merits only if the judgment satisfies the requirements set forth in Articles 693 through 695 of the Colombian Civil Procedure Code (Código de Procedimiento Civil) which will be abrogated by Articles 605 through 607 of Law 1564 of 2012 (Código General del Proceso) subject to the entry into force of Law 1564 of 2012 in the terms of Article 627, paragraph 6 thereof and as determined by the Colombian Superior Council of the Judiciary (Consejo Superior de la Judicatura) as follows:
| 139 |
| · | A treaty exists between Colombia and the country where the judgment was granted relating to the recognition and enforcement of foreign judgments or, in the absence of such treaty, there is reciprocity in the recognition of foreign judgments between the courts of the relevant jurisdiction and the courts of Colombia; |
| · | The foreign judgment does not relate to “in rem rights” vested in assets that were located in Colombia at the time the suit was filed; |
| · | The foreign judgment does not contravene or conflict with Colombian laws relating to public order other than those governing judicial procedures; |
| · | The foreign judgment, in accordance with the laws of the country where it was rendered, is final and is not subject to appeal; |
| · | A duly certified and authenticated copy of the judgment (together with an official translation into Spanish if the judgment is issued in a foreign language) has been presented to the Supreme Court of Colombia (Article 606 of law 1564 of 2012 only requires a legalized copy of the foreign judgment); |
| · | The foreign judgment does not refer to any matter upon which Colombian courts have exclusive jurisdiction; |
| · | No proceeding is pending in Colombia with respect to the same cause of action, and no final judgment has been awarded in any proceeding in Colombia on the same subject matter and between the same parties; |
| · | In the proceeding commenced in the foreign court that issued the judgment, the defendant is served in accordance with the laws of such jurisdiction and in a manner reasonably designated to give the defendant an opportunity to defend against the action; and |
| · | The legal requirements pertaining to the exequatur proceedings have been observed; |
The United States and Colombia do not have a bilateral treaty providing for automatic reciprocal recognition and enforcement of judgments in civil and commercial matters. The Colombian Supreme Court has in the past accepted that reciprocity exists when it has been proven that either a U.S. court has enforced a Colombian judgment or that a U.S. court would enforce a foreign judgment, including a judgment issued by a Colombian court. However, such enforceability decisions are considered by Colombian courts on a case-by-case basis.
| 7. | Corporate Governance |
Since 2004, Ecopetrol S.A. has voluntarily adopted transparency, governance and control practices to facilitate corporate governance in order to generate confidence among stakeholders and ensure the sustainability of its business.
The corporate governance practices at Ecopetrol S.A.:
| · | Promote and guarantee all stakeholders transparency, objectivity and competiveness. |
| 140 |
| · | Add value to the company and attract investors. |
| · | Assure a balanced management. |
| · | Protect shareholders, investors and stakeholders rights. |
| · | Encourage financial markets confidence. |
| · | Accomplish the highest corporate governance standards. |
Statement of the Nation as Majority Shareholder
Ecopetrol’s majority shareholder (the Nation, represented by the Ministry of Finance), is unilaterally committed to protect the interests of the minority shareholders in the following topics:
| · | Composition of Board of Directors: including in its list of candidates a Representative for hydrocarbon producing departments operated by Ecopetrol and a Representative for the minority shareholders, who will be chosen by the 10 shareholders with the largest stock participations. |
| · | Dividend policy: guaranteeing the right of each shareholder to receive his pro rata dividends in accordance with Colombian law. |
| · | Issues not included in the agenda of extraordinary meetings of the Shareholders Assembly: permitting a vote on those initiatives submitted by one or more shareholders representing at least 2% of the subscribed shares of the company. |
| · | Asset disposal: ensuring that any asset disposal of an amount equal or higher than 15% of the stock exchange capitalization of Ecopetrol is discussed and decided by the Shareholders’ Assembly and that the Nation will only vote affirmatively if the vote of minority shareholders is equal to or exceeds 2% of the shares subscribed by shareholders other than the Nation. |
| 7.1. | Bylaws |
The Bylaws of Ecopetrol S.A. are contained in Public Deed No. 5314 of December 14, 2007, issued by the Second Notary of Bogotá; amended by Public Deed No. 560 of May 23, 2011, issued by the Notary Forty- Six of Bogotá, and the Deed No. 666 of May 7, 2013, issued by the Notary Sixty-Five of Bogotá.
This summary does not purport to be complete and is qualified by reference to our bylaws, which are filed as an exhibit to this annual report. For a description of the provisions of our bylaws relating to our Board of Directors and its committees, see the sections Corporate Governance—Board of Directors—Board Practices and—Board Committees.
On March 26, 2015, the Shareholders’ General Assembly approved the following amendments to our bylaws (as to which the corresponding deed has not yet been issued):
| 1. | The adoption of the following corporate governance practices recommended by the Financial Superintendency regarding the New Code of Corporate Best Practices of Colombia: |
| · | Extension of the deadline for convening ordinary and extraordinary meetings (amendment to Articles 19 and 20). |
| · | The majority of the Board of Directors will be constituted by independent members (amendment to paragraph 1, Article 23). |
| · | Possibility of performing different kind of evaluations of the Board of Directors (amendment to paragraph 5, Article 23). |
| · | Reference to certain guidelines concerning the appointment and duties of the Chairman and Secretary of the Board of Directors (new paragraph 6, Article 23). |
| 141 |
| · | Modification in the name of the Audit Committee of the Board of Directors in order to make explicit its risk management role (amendment to Paragraph 27.1 of Article 27). |
| · | Obligation to comply with voluntarily adopted corporate governance practices (new Article 52). |
| 2. | The company’s reserves accounts amounting to Ps$14.76 trillion in the financial statements as of December 31, 2014 were capitalized by increasing the nominal value of shares from Ps$250 to Ps$609 per share. |
General Meeting of Shareholders
Shareholders’ meetings may be ordinary or extraordinary. Ordinary meetings will take place in our legal domicile located in Bogota, Colombia, within the first three months following the end of each fiscal year, on the day and at the time set forth in the notice for the general shareholders’ meeting. The call for the general shareholders’ meeting may be made electronically or by written communication sent to each shareholder. In both cases the call must be published in a newspaper of wide circulation 30 calendar days prior to the date on which the meeting will take place and on the Sunday previous to the meeting, must be published at Ecopetrol S.A.’s website www.ecopetrol.com.co.
In the ordinary general shareholders’ meeting, our Board of Directors and the external auditor are appointed and our annual financial statements, profit distribution, audit and management reports and any other matter provided under applicable law or our corporate bylaws are approved.
Extraordinary meetings of shareholders may be called by our Board of Directors, by our president or chief executive officer, by our external auditor, or by shareholders holding at least 5% of the shares outstanding, or when unforeseen or urgent needs of the Company require it. Calls to extraordinary meetings should be made at least 15 calendar days prior to the date of the meeting, with the exception of the case where the Law requires a greater time between the summons and the meeting, and may be made electronically or by written communication to each shareholder; in both cases the call must be published in a newspaper of wide circulation. The meeting notice must specify the agenda for the meeting.
The required quorum for both ordinary and extraordinary meetings is a plural number of shareholders representing 50% plus one of the subscribed shares entitled to vote and decisions are approved with a majority of the members present. This quorum is exempted in the case of “second-call meetings,” which may take place when a meeting fails to obtain the required quorum and is called within a period between 10 business days and 30 business days from the first date, in which case decisions may be adopted by a majority of the shares present regardless of the number represented.
Decisions made at ordinary and extraordinary shareholders’ meeting must be approved by a plural number of shareholders representing the majority of the shares present. Colombian law requires supermajorities in the following cases:
| · | The vote of at least 70% of the shares present and entitled to vote at the ordinary shareholders’ meeting is required to approve the issuance of stock not subject to preemptive rights; |
| · | The vote of at least 78% of the shares represented entitled to vote is required to approve the distribution of the annual net profits. In the absence of this special majority, at least 50% of the net profits must be distributed. If the sum of all legal reserves (statutory, legal and optional) exceeds the amount of the outstanding capital, the Company must distribute at least 70% of the annual net profits; |
| 142 |
| · | The vote of at least 80% of the shares represented is required to approve the payment of dividends in shares; and |
| · | The vote of 100% of the outstanding and issued shares is required to replace a vacancy on the Board of Directors without applying the electoral quotient system. |
Shareholders may be represented by proxies provided that the proxy: (1) is in writing (faxes and electronic documents are valid), (2) specifies the name of the representative, (3) specifies the date or time of the meeting for which the proxy is given and (4) includes other information specified by the applicable law. Proxies granted abroad do not require legalization or an apostille.
During our ordinary annual shareholders’ meeting, our employees and Directors are only allowed to represent their own shares, unless they act as legal representatives.
Preference Rights and Restrictions Attaching to Our Shares
We have only one class of stock without special rights or restrictions (ordinary shares). Our shareholders do not have any type of preemptive rights.
Under Commercial Colombian law, our shareholders have the following economic privileges and voting rights:
| · | To participate and vote on the decisions of the general shareholders’ meeting; |
| · | To receive dividends based on the financial performance of the Company in proportion to their share ownership; |
| · | To transfer and sell shares according to our bylaws and Colombian law; |
| · | To inspect corporate books and records 15 business days prior to the ordinary shareholders’ meeting where the year-end financial statements are to be approved; |
| · | Upon liquidation, to receive a proportional amount of the corporate assets after the payment of external liabilities; and |
| · | To sell the shares, known as derecho de retiro, if a corporate restructuring affects the economic or voting rights of the shareholders in the terms and conditions established under Colombian law. |
Our bylaws and corporate governance code provide additional rights to our minority shareholders. These rights include:
| · | Sale of Assets. For a ten-year period counted from the date of subscription of the declaration of the Nation dated July 26, 2007 or until the Nation loses its status as majority shareholder, the Nation guarantees that any sale of 15% or more of our assets requires the approval of the general shareholders’ meeting and that the Nation would only be allowed to vote its shares in favor of the proposal if 2% or more of our minority shareholders accept the proposal. |
| · | Candidate List. Pursuant to our bylaws and Law 1118 of 2006, the Nation will include in its candidate list for election of members of the Board of Directors one member selected by the departments that produce hydrocarbons. In addition, pursuant to the declaration of the Nation dated July 26, 2007, the Nation will include in its candidate list for election of members of the Board of Directors one member selected by the ten largest minority shareholders. The minority shareholders’ right to select a candidate loses its effect when minority shareholders, according to their share participation, name a member to our Board of Directors. |
| 143 |
| · | Extraordinary Meetings. Our bylaws and corporate governance code provide that the entity exercising permanent control over Ecopetrol must instruct the Company’s CEO or External Auditor to call an extraordinary meeting of the Company’s shareholders when so requested by a plurality of shareholders holding at least 5% of the total number of outstanding shares. Such requests shall be made in writing and must clearly indicate the purpose of the meeting. |
| · | Investor Attention Office. Ecopetrol has an investor attention office, a specialized unit responsible for receiving complaints from our shareholders. Pursuant to our bylaws, shareholders holding at least 5% of the total number of shares outstanding may request that the investor attention office conduct a special audit of the following documents: the income statement; the proposal for the distribution of profits; the report of the Board of Directors as to the economic and financial status of our Company; the report from our general counsel as to the legal status of our Company; and the report from the independent auditors. Special audits cannot be made of documents that contain scientific, technological or statistical information of our Company, or agreement that gives us competitive and economic advantages over our competitors, or in respect of any document related to intellectual property. Shareholders also have the right to propose good corporate governance recommendations to the office for the protection of investors. |
| · | Others. Pursuant to our bylaws, shareholders holding at least 5% of the total number of shares outstanding may propose recommendations to our Board of Directors pertaining to the management of our Company. Any shareholder may file a written petition to our Board of Directors to investigate corporate governance violations that the shareholder believes to have been committed. |
Amendments to Rights and Restrictions to Shares
We have only one class of stock and it has no special rights or restrictions (ordinary shares). Our shareholders do not have any type of preemptive rights. The rights given to our shareholders by law are described in our bylaws and may only be modified through an amendment to the law.
The additional rights given to our minority shareholders in our bylaws and corporate governance code may only be modified through an amendment of those internal documents.
Limitations on the Rights to Hold Securities
There are no limitations in our bylaws or Colombian law on the rights of Colombian residents or foreign investors to own the shares of our Company, or on the right to hold or exercise voting rights with respect to those shares, except in cases of legal representation and except that the Nation must hold a minimum of 80% of our capital stock at all times.
Restrictions on Change of Control Mergers, Acquisitions or Corporate Restructuring of the Company
Under Colombian law and our bylaws, the general shareholders’ meeting has full authority to approve any corporate restructuring, including any mergers, acquisitions or spin-offs. Corporate restructurings are also subject to the requirement that the Nation must hold a minimum of 80% of our common stock at all times. So long as Law 1118 of 2006 is in effect, there cannot be any restructuring that results in a change of control of our Company.
Ownership Threshold Requiring Public Disclosure
Our corporate governance code (Title III, chapter 1, Section 5, Identification of the Main Shareholders) provides that we must disclose periodically on our web page, the names of the shareholders of our Company including, at least, the 20 shareholders with the greatest number of shares. We must also disclose this information to the Superintendency of Finance at the end of each quarter.
| 144 |
Colombian securities regulations set forth the obligation to disclose any material event or hecho relevante. Any transfer of shares equal or greater than 5% of our capital stock or any person acquiring a percentage of shares that would make him the beneficial owner of 5% or more of our capital stock, is a material event, and therefore, must be disclosed to the Superintendency of Finance. The regulation includes other criteria in order to identify when to report a material event other than the situations described in the previous sentence.
External Auditor
Pursuant to our bylaws, our external auditor shall not be appointed for more than five consecutive one-year terms by us. However, an external auditor may be hired again after two terms have passed since the conclusion of its last term of appointment. At the ordinary general shareholders’ meeting on March 26, 2015, the shareholders appointed PricewaterhouseCoopers Ltda. as external auditor of Ecopetrol.
| 7.2. | Code of Ethics |
We have adopted a code of ethics, which complies with applicable U.S. and Colombian law. Our code of ethics applies to our chief Executive Officer, our Chief Financial Officer, principal accounting officer, persons performing similar functions and other personnel.
Our code of ethics is available on our website at http://www.ecopetrol.com.co/especiales/codigoEtica_/index.html.
If we amend the provisions of our code of ethics that apply to our chief Executive Officer, our Chief Financial Officer, our principal accounting officer and persons performing similar functions, or if we grant any waiver of such provisions, we will disclose such amendment or waiver on our website at the same address.
| 7.3. | Board of Directors |
The information below sets forth the names and business experience of each of our current Directors elected at the shareholders’ ordinary meeting held on March 26, 2015 for terms of one year beginning on that date, as of the date hereof:
Minister of Mines and Energy, Tomás González Estrada (44) has been a member of our Board of Directors since August 29, 2014. He holds a BA in economics from the University of Los Andes with a Master’s Degree in Economic Sciences and a phd in Economics from the University of London. He has accumulated over 15 years of experience in both the private and public sectors. Within the public sector, he was the Vice-Minister of Mines and Energy from 2010 to 2013, a period where he presided over the Commission for the Regulation of Energy and Gas (CREG), taking the lead in the creation of the National Mining Agency (ANM), the reorganization of the gas sector and the restructuring of state entities related to mining and energy activities.
He has also served in the public sector as an Economic Advisor to President Andrés Pastrana and as the Deputy Director of the National Department of Planning (DNP). Additional positions have included his role as the technical secretary of the National Council for Social and Economic Policy (CONPES) and as a member of the boards of directors for different public and private organizations, including Isa, Isagen and Hocol.
Mr. González worked for BP Colombia as a manager of external affairs and has been a professor at the University of London and the University of Los Andes, where he taught a seminar on Economy, Petroleum and Development. He was appointed as a Director by the Nation.
| 145 |
Minister of Finance and Public Credit, Mauricio Cárdenas Santamaría (52) has been a member of our Board of Directors since March 27, 2008. Mr. Cárdenas was the Minister of Mines and Energy of Colombia from September 26, 2011 to August 30, 2012. He has served as Senior Fellow and Director at the Latin America Initiative of the Brookings Institution in Washington, D.C. Previously, Mr. Cárdenas served as Executive Director of Fedesarrollo (Fundación para la Educación Superior y el Desarrollo), President of Empresa de Energía Eléctrica de Bogotá, Minister of Economic Development, Minister of Transport and Director of the National Planning Agency of Colombia. Mr. Cárdenas has also served as a member of the Board of Directors of various organizations, including the Latin American and Caribbean Economic Association (LACEA), Universidad de los Andes and the BVC. Currently, he is a Director of the Central Bank of Colombia. Mr. Cárdenas holds a BA and an MSC in economics from the Universidad de los Andes and a Ph.D. in economics from the University of California, Berkeley. In 2001, Mr. Cárdenas was a visiting scholar at Harvard University’s Center for International Development. In 1999, he was elected by Time Magazine and CNN as one of Latin America’s Leaders for the New Millennium. Mr. Cárdenas was appointed as Director by the Nation.
Director of the National Planning Agency of Colombia, Simón Gaviria Muñoz (34) is member of our Board of Directors since August 29, 2014. He is an economist from the University of Pennsylvania with a Master’s Degree in mathematics and econometrics from the same university. Before reaching the National Planning Agency, Mr. Gaviria was the head of the Colombian Liberal Party. Between 2006 and 2014 he served as representative to the Cámara de Representantes by Bogotá. Between July 2011 and July 2012 he served as chairman of the Cámara de Representantes.
During his early professional years he worked as a financial analyst at US banks, JP Morgan Chase Corporate Finance in New York. In 2005 he was adviser to the candidate for President of the Republic, Enrique Peñalosa. Mr. Gaviria was the author of the Insolvency Act and the Cellular One Number Act. It also highlights its initiative of Statute Law Consumer and general framework of warrant to facilitate access to credit at lower interest rates. Mr. Gaviria was appointed as a Director by the Nation.
Jorge Pinzón Sánchez (55) has been a member of our Board of Directors since December 6, 2012. He is a freelance attorney and an arbitrator registered at the Centers of Conciliation and Arbitration of the Chambers of Commerce of Bogotá and Barranquilla. He was a partner at Estudios Palacios Lleras S.A., a law firm in consulting and arbitration of business, commercial and tax law. He also has served as the head of the Superintendency of Corporations as well as of the Superintendency of Finance of Colombia. He was also a member of the Advisory Committee of the Banking Superintendency, member of the General Board of the Securities Superintendency of Colombia, Secretary General of the Ministry of Finance and Public Credit and Deputy General Counsel, Secretary General and General Counsel of Banco del Comercio, among other positions in the public and private sector. He serves as an arbitrator in the Center of Arbitration of the Chamber of Commerce of Bogotá and served several years as a Colombian representative to the United Nations Commission on International Trade Law (UNCITRAL). Mr. Pinzón has been a member of several boards of directors of Colombian financial sector companies. He also was a law professor at Universidad Javeriana, Universidad de los Andes, as well as other universities. He has also published several legal articles. Mr. Pinzón earned a degree in law and a master’s degree in Philosophy from Universidad Javeriana. He was appointed as an independent Director.
Luis Fernando Ramírez (56) serves as President of Federación Colombiana de Compañías de Leasing. Previously, Mr. Ramírez served as Minister of National Defense from 1999 to 2001, Minister of Labor and Social Security from 1992 to 1994, Vice-Minister of Finance and Public Credit and General Director of Taxes from 1986 to 1992. Mr. Ramírez earned a degree in Accounting from Universidad Jorge Tadeo Lozano and he was Fellow of the Center for International Affairs from Harvard University, Cambridge, Massachusetts. Mr. Ramírez was appointed as an independent Director.
| 146 |
Joaquín Moreno Uribe (65) has been a member of our Board of Directors since March 27, 2008. Mr. Moreno worked for 33 years for the Royal Dutch/Shell Group. He has held various positions such as Project Manager in Colombia; Project and Operations Manager and Marketing and Operations Manager of Shell Química de Venezuela; Director of Marketing for Agrochemical Products and Global Marketing Manager for Petrochemical Products at Shell Centre–Shell International Chemicals Company in London; Director of Shell Venezuela S.A.; Director of Shell Colombia S.A., Director of Cerromatoso S.A., a Colombian mining company that is located in the department of Córdoba, dedicated to the production of ferro-nickel and iron-nickel alloy, and Exploration and Production Business Economics and Strategic Planning Director for Europe and the Middle East at the Shell International Headquarters in The Hague, the Netherlands. Mr. Moreno has also served as Country Chairman and President for Shell in Mexico, Colombia and Venezuela, as well as Regional CEO for Downstream Oil Business in the Northern Latin American Region. Mr. Moreno has been a member of the boards of directors of various local and international companies. Mr. Moreno earned a degree in civil engineering from Universidad Industrial de Santander and completed a program in advanced management at Harvard University Business School in Cambridge, Massachusetts. He was appointed as an independent Director.
Gonzalo Restrepo López (64) serves as Chairman of the Board of Directors. Mr. Restrepo was the Chief Executive Officer of Grupo Éxito S.A. for 23 years. Prior to this position, he served as CEO of Caribú Internacional, a textile and apparel company in Medellín; Caribe Motor S.A. and other private companies. Mr. Restrepo has been a member of different boards of directors of Colombian companies. In 2013, he received the Cross of Boyacá in the Order of Grand Official, the highest decoration and distinction of the Colombian state, given by the President of the country. Mr. Restrepo earned a degree in Management from Syracuse University, United States and an MBA in Marketing from the University of Georgia, Athens, Georgia. Mr. Restrepo was appointed as an independent Director.
Horacio Ferreira (45) is an executive leader with more than 20 years of international experience in the oil industry. His knowledge and expertise stem from previous positions as CEO and President of an oilfield services company in Houston, TX to application of state of art technologies in the oil industry. He has led and executed numerous reservoir engineering projects in the Americas, Europe, Africa, Middle East and Far East and has conducted research in optimization of multiphase meters, underbalanced reservoir engineering, real time reservoir and production analysis, reservoir simulation and waterflood techniques with horizontal wells. Mr. Ferreira has several technical publications in reservoir management with a focus on production optimization and reservoir management. He holds a BS from Texas A&M University, MS and D.Eng. Degrees in Petroleum Engineering from Texas A&M University, and a business graduate degree in Management of International Corporations from Texas A&M University. He was appointed as an independent Director representing the hydrocarbon producing provinces of Colombia.
Roberto Steiner Sampedro (55) has been a member of our Board of Directors since October 12, 2011. Mr. Steiner is an associate researcher and former Executive Director of Fedesarrollo. He served as Alternate Executive Director of the International Monetary Fund from 2002 to 2007, Director of the Economics Research Department of the Central Bank of Colombia from October 1989 to April 1993, Director of the Economic Development Research Centre of Universidad de los Andes, Consultant at the World Bank from 1995 to 1996, Deputy Director of Fedesarrollo from 1993 to 1994, Deputy Director of the Economics Research Department of the Central Bank of Colombia from 1988 to 1989, and Senior Economist at the Central Bank of Colombia from 1986 to 1988. He was a professor and researcher at various Colombian universities, including the Universidad de los Andes, Universidad Javeriana and Universidad Nacional. In 1995, he was a summer professor at Columbia University in New York. He has published several books, articles and research papers on economics. Mr. Steiner earned a degree in economics from Universidad de los Andes and M.A. and M.Phil degrees in economics from Columbia University in New York. Mr. Steiner was appointed as an independent Director.
| 7.3.1 | Board Practices |
Our Board of Directors is composed of nine members and is responsible for, among other things, establishing our general business policies. The majority of the Board of Directors must be independent, and must be elected pursuant to the criteria set out in paragraph two, Article 44, Law 964, 2005, and in accordance with the procedure determined in Decree 3923, 2006, or any other provisions that regulate, amend, replace or add such regulations. In addition, pursuant to our bylaws and in accordance the procedures described therein, our majority shareholder must include, in its list of candidates for the last two seats in the Board of Directors, the name of one individual jointly proposed by departments that produce hydrocarbons and one individual jointly proposed by the ten minority shareholders with the highest equity participation. According to Colombian law, the members of the Board of Directors must be elected at the annual shareholders’ meeting in accordance with a proportional representation system similar to cumulative voting (through an electoral quota voting system). The number of votes required to fill each position is calculated by dividing the number of possible votes by the number of open board positions. The members of the Board of Directors may be elected without an electoral quota voting system when there is unanimity. Pursuant to our bylaws, Directors are elected for a one-year term, and the positions are filled either by person or by position. Members of the Board may be reelected indefinitely. Currently, we have three members appointed by their position: the Minister of Mines and Energy, the Minister of Finance and Public Credit and the Director of the National Planning Agency. Our current Directors were elected at the ordinary shareholders’ meeting held on March 26, 2015. Directors may be removed without cause at any moment by a majority of the shareholders present at a general shareholders’ meeting.
| 147 |
Our CEO is appointed by the Board of Directors and has two alternates. The CEO is elected for a two-year term, may be reelected indefinitely and freely removed prior to the expiration of his term. In accordance with our bylaws, the Board of Directors must evaluate the performance of the CEO and such results must be published in Ecopetrol’s web page or in an alternative media vehicle.
The compensation of our Directors is set exclusively by the shareholders at the general shareholders’ meeting. Directors are compensated for attending board meetings and committee meetings. A Board meeting requires a quorum of at least five members and decisions are approved with a majority of the members present. None of the contracts of any of our Directors contains provisions for benefits upon termination of such Director’s services.
Under Colombian law, a director or executive officer must disclose during the general shareholders’ meeting any transaction that may result in a conflict of interest. The general shareholders’ meeting may approve or reject the transaction giving rise to the conflict of interest with the vote of the majority of the shares present at the shareholders’ meeting. If the director or executive officer who has the conflict is a shareholder, his or her vote must be excluded. We disclose conflicts of interest of our employees, executive officers and directors in our Corporate Governance and Board of Directors reports.
Neither our bylaws nor our corporate governance code provide a retirement age for our Directors. Under our bylaws, there is no requirement for a person to have a minimum number of shares to be elected as a Director. Colombian law provides that Directors willing to sell or purchase shares in our Company need prior authorization from the entire Board of Directors. Colombian law does not impose any limitation as to the number of shares that may be acquired by a Director.
| 7.3.2 | Board Committees |
Pursuant to our bylaws, our Board of Directors has four committees (Audit Committee, Corporate Governance and Sustainability Committee, Compensation and Nomination Committee and Business Committee), which establish guidelines, set specific actions and evaluate and submit proposals designed to improve performance in the areas under their supervision and control. These committees are comprised of members of the Board of Directors who are also appointed by the members of the Board of Directors. In addition to applicable regulations, the committees also have their own specific regulations that establish their purposes, duties and responsibilities.
Board Committees’ Composition as of April 17, 2015.
|
Audit Committee |
Compensation
and |
Corporate Governance and Sustainability Committee | ||
|
Horacio Ferreira Rueda Roberto Steiner Sampedro Jorge Pinzón Sánchez Luis Fernando Ramírez |
Minister of Finance and Public Credit Minister of Mines and Energy Gonzalo Restrepo Lopez Luis Fernando Ramírez |
Horacio Ferrerira Rueda Gonzálo Restrepo López Jorge Pinzón Sánchez Roberto Steiner Sampedro Minister of Finance and Public Credit |
| 148 |
|
Business Committee |
||||
|
Minister of Mines and Energy Minister of Finance and Public Credit Gonzalo Restrepo López Horacio Ferreira Rueda Joaquín Moreno Uribe |
Audit and Risk Committee
Our audit and risk committee, which must be comprised of at least three members, all of them independent Directors, is our highest internal control body and provides support to our Board of Directors on risk, accounting and financial matters. It is in charge of guaranteeing the design, implementation and supervision of our internal control over financial reporting. It also ratifies the annual hydrocarbons reserves report and provides support for our Board on analyzing topics related to financial matters, risks, control environment and the assessment of the Company’s internal and external auditors.
All committee members are required to be knowledgeable in accounting matters and at least one of them is required to be an expert in financial and accounting matters.
Our Board of Directors has determined that Luis Fernando Ramirez qualifies as an “audit committee financial expert,” and he is independent under the definition of “independent” applicable to us under the rules of the NYSE.
The audit and risk committee approves on a case-by-case basis any engagement of our external independent auditors to provide services different than those related to auditing our financial statements. Occasionally, the Audit Committee will have no doubt that these additional services do not compromise the external auditor’s independence. When in doubt, the Committee will request the opinion of the internal auditor.
Compensation and Nomination Committee
Our compensation and nomination committee, which must be comprised of at least three members, including at least one independent director, provides general guidelines for the selection and compensation of our executive officers and employees.
Corporate Governance and Sustainability Committee
Our corporate governance and sustainability committee, which must be comprised of at least three members, including at least one independent director, makes proposals to our Board of Directors to ensure and supervise the fulfillment of our good corporate governance and sustainability practices in accordance with our corporate governance code.
Business Committee
Our business committee, which must be comprised of at least five members, including at least one independent Director, assists our Board in analyzing potential business ventures. Based on its delegation of power, the committee studies and analyzes capital expenditure policies, major investment projects, strategy, new business and other matters that would help us move forward in our efforts toward the consolidation of our strategy. The primary criteria used in the committee’s decision-making process are the optimization of our portfolio and the proper allocation of our resources.
| 149 |
| 7.4. | Compliance with NYSE Listing Rules |
The following is a summary of the significant differences between our corporate governance practices and those required for U.S. companies under the NYSE listing standards.
| NYSE Standards | Our Corporate Governance Practices | |
| Director Independence | ||
| The majority of the board of directors must be independent. §303A.01. “Controlled companies,” which would include Ecopetrol if we were a U.S. issuer, are exempt from this requirement. A controlled company is one in which more than 50% of the voting power is held by an individual, group or another company, rather than the public. §303A.00. | Law 964 of 2005 establishes that (1) the board of directors of listed companies must be comprised of a minimum of five directors and a maximum of ten directors and (2) at least 25% of board members must be independent. Under our corporate governance guidelines, our board of directors must be comprised of nine directors, of which at least three must be independent. As of the date of this annual report, we have six (6) independent directors. | |
| Executive Sessions | ||
| The non-management directors of each listed company must meet at regularly scheduled executive sessions without management. §303A.03. | A comparable rule does not exist under Colombian law. Except for our Audit Committee, our Board of Directors does not meet without management. | |
| Nominating/Corporate Governance and Sustainability Committee | ||
| A nominating/corporate governance and sustainability committee composed entirely of independent directors is required. The committee must have a charter specifying the purpose, duties and evaluation procedures of the committee. §303A.04. “Controlled companies” are exempt from these requirements. §303A.00. | Colombian law does not require the establishment of a nominating and corporate governance and sustainability committee composed entirely of independent directors. Pursuant to our bylaws, both our corporate governance and sustainability committee and our nomination and compensation committee shall be composed of at least one independent director that acts pursuant to a written charter. | |
| Compensation Committee | ||
| A compensation committee composed entirely of independent directors is required, which must evaluate and approve executive officer compensation. The committee must have a charter specifying the purpose, duties and evaluation procedures of the committee. §303A.05. “Controlled companies” are exempt from this requirement. §303A.00. | Colombian law does not require the establishment of a compensation committee composed entirely of independent directors. Pursuant to our bylaws, our nomination and compensation committee shall be composed of at least one independent director who acts pursuant to a written charter. | |
| 150 |
| NYSE Standards | Our Corporate Governance Practices | |
| Audit Committee | ||
| An audit committee with a minimum of three independent directors satisfying the independence and other requirements of Rule 10A-3 under the Exchange Act and the more stringent requirements under the NYSE standards is required. §§303A.06 and 303A.07. | According to Law 964 of 2005, Colombian companies that are authorized to issue securities by the Superintendency of Finance must have an audit committee that satisfies the requirements of Law 964 of 2005, including its minimum number of members, independence criteria and audit related duties. Our audit committee is composed entirely of independent directors, and the committee meets the requirements of Law 964 of 2005 and Rule 10A-3 under the Exchange Act. | |
| Equity Compensation Plans | ||
| Equity compensation plans and all material revisions thereto require shareholder approval, subject to limited exemptions. §§303A.08 and 312.03. | Under Colombian law, no similar right to vote on equity compensation plans and material revisions thereto is given to shareholders. We do not give our shareholders the right to vote on equity compensation plans and material revisions thereto. | |
| Corporate Governance Guidelines | ||
| Listed companies must adopt and disclose corporate governance guidelines. §303A.09. | The Superintendency of Finance recommends the adoption of corporate governance guidelines to all Colombian issuers. According to Superintendency of Finance Circular No. 007/2011, the adoption of corporate governance guidelines is voluntary. Listed companies must annually publish a corporate governance survey comparing their corporate governance standards with those recommended by the Superintendency of Finance. Our corporate governance guidelines (Corporate Governance Code) and the survey of the adoption of Colombian practices are published on our website at http://www.ecopetrol.com.co. | |
| The Superintendency of Finance released new corporate guidelines for Colombian issuers On September 30, 2014. These guidelines are effective beginning 2016. | ||
| Code of Ethics for Directors, Officers and Employees | ||
| Corporate governance guidelines and a code of business conduct and ethics is required, with disclosure of any waiver for directors or executive officers. The code must contain compliance standards and procedures that will facilitate the effective operation of the code. §303A.10. | We have adopted a code of ethics which complies with applicable U.S. and Colombian law. Our code of ethics applies to our chief executive officer, chief financial officer, principal accounting officer, persons performing similar functions and generally to all the employees, members of the board of directors, suppliers, and contractors of Ecopetrol S.A. and its corporate group. Our code of ethics is available on our website at http://www.ecopetrol.com.co. | |
| 151 |
| 7.5. | Management |
The following presents information concerning our executive officers and senior management. Unless otherwise noted, all of these individuals are Colombian citizens.
Juan Carlos Echeverry (52) Mr. Echeverry is the Chief Executive Officer of Ecopetrol, Colombia’s National Oil Company. He has previously served as Colombia’s Minister of Finance and Minister of Economic Planning. During his mandate as Minister of Finance in 2011, four international publications (The Banker, America Economía, Emerging Markets, and Institutional Investor) awarded him as the Best Finance Minister of the Americas. Previously, Mr. Echeverry represented Colombia in the Board of Directors of the Inter-American Development Bank (Washington D.C.) and served as Dean of Economics at Universidad de los Andes (Bogotá). He is the author of several books about the Colombian economy and co-author of publications focusing on developing economies. Among his work there are economic studies on Africa and countries of the Pacific Basin.
Mr. Echeverry has a Ph.D. in Economics from New York University and an outstanding academic career in the field of Economics.
Camilo Marulanda (37) has been our Executive Vice-president since March 2015 He has over 11 years of experience in the oil and gas industry, having occupied important positions such as Chief Executive Officer of CENIT and Vicepresident of Strategy and Growth as well as Vice-president of Supply and Marketing at Ecopetrol. He has also held other managerial positions at Ecopetrol, such as Sales Manager of Refined and Petrochemical Products as well as Department Head of Marketing. Mr. Marulanda began his career as Category and Account Manager at Procter & Gamble. He holds an Executive MBA with a specialty in Marketing and Economics from the Universidad de los Andes in Bogotá
Max Torres (57) has served as Exploration Vice President since September 2014. Mr. Torres holds a B.S. degree in Geology from Universidad Nacional of Tucumán in Argentina and an M.S. in Stratigraphy from Georgia State University (1987). He has more than 28 years of experience in oil and gas exploration and production and is a proven world class oil gas finder and a champion of Latin American oil and gas exploration. Among his many professional accomplishments, Mr. Torres was directly responsible for 16 the Tcfg Perla gas field discovery in Venezuela, the 275 Tcfg super giant Galkynysh gas field discovery in Turkmenistan, as well as other oil and gas discoveries. Prior to joining Ecopetrol, Mr. Torres worked at Repsol from 1997 to 2013 as Exploration Director for Europe and the Middle East, Exploration Director for Europe and Africa and Exploration Director for Latin America.
Adriana M. Echeverri (44) joined Ecopetrol in 1994. She is currently serving as Chief Strategy and Development Officer (CSO) and previously served as Chief Financial Officer until May 2013. Previously, Mrs. Echeverri also worked as Head of the Finance and Treasury Unit and Head of the Corporate Finance Unit. She earned a bachelor’s degree in finance and foreign affairs as well as an MBA from Universidad Externado de Colombia.
Magda Manosalva (43) joined Ecopetrol in 2005. She has been serving as Ecopetrol S.A.’s Chief Financial Officer since November 2013. Prior to being appointed as our CFO, Mrs. Manosalva was assigned, in 2012, as the Chief Financial Officer of Reficar S.A. Mrs. Manosalva earned a degree and a master’s degree in Economics from Universidad Nacional de Colombia, and a specialization degree in finance at Harvard Extension School. Over the course of her career she has worked on matters related to Treasury, financial risks and liquidity management.
| 152 |
Margarita Obregón (56) joined Ecopetrol in 2000. Mrs. Obregón has served as Secretary General and Secretary of the Board of Directors since January 2008. She also serves as the company’s Chief Ethics and Compliance Officer, whose responsibilities include monitoring and supervising the ethics and compliance program, among others, and as Leader of Corporate Social Responsibility, Corporate Governance and Corporate Communications. Prior to joining Ecopetrol, Mrs. Obregón worked in the supply department of Previsora S.A., an insurance company, and as a legal advisor of lands for British Petroleum Company – BP, at Alvaro Rengifo y Cia. She also served as the head of the Business and Administration department of the Fiduciaria del Estado. Mrs. Obregón earned a law degree from Colegio Mayor de Nuestra Señora del Rosario with specialization degrees in public management and financial law.
Hector Manosalva (52) joined Ecopetrol in 1986 and serves as Vice-President for Development and Production. Mr. Manosalva holds a degree in petroleum engineering from the Universidad de América in Bogotá, and completed post-graduate studies in Finance at the Universidad EAFIT and Executive Management at the Universidad de los Andes. Over the course of his career at Ecopetrol, Mr. Manosalva has held various positions, including Executive Vice-President for Production and Exploration, Vice-President of Production, Production Manager of the Central Region, President of Colombia’s Advisor for Safety and Security of National Energy Infrastructure, Director of HSE and Corporate Social Responsibility, Production Manager of the Southern Region and Head of the Production Planning Division.
Pedro A. Rosales (51) joined Ecopetrol in 1989, and has served as our Downstream Executive Vice-President since February 2008. Mr. Rosales is responsible for the Company’s refining, petrochemicals, marketing and distribution, biofuels and gas businesses. Mr. Rosales has held several positions in the Company within the areas of maintenance, operations, projects, planning and administration. Prior to becoming our Downstream Executive Vice-President, Mr. Rosales served as our Vice-President of Transportation since January 2003 and as our Chief Operations Officer since 2006. Mr. Rosales earned a degree in mechanical engineering and an MBA from Universidad de los Andes.
Rafael Espinosa (48) has served as Vice-President of Transportation since January 15, 2015. Mr. Espinosa earned a degree in civil engineering from Universidad Santo Tomas in Colombia, a specialization degree in Strategic Leadership and an MBA from Universidad de los Andes. He also holds studies in development and management innovation from Universidad Francisco de Paula Santander. He has worked for Ecopetrol for the last 22 years and has held various positions within the company, including oil & gas plant coordinator, head of the operations department, crude oil pipelines manager, general manager of operations and maintenance, as well as other functions within the spheres of crude oil pipeline maintenance and community relations.
Jaime Bocanegra (46) has served as Deputy Vice-President of Sustainable Development and Environmental since January 2015. Mr. Bocanegra earned a bachelor’s degree in petroleum engineering from Universidad de América in Colombia, a specialization degree in Management, a specialization degree in International Management of Oil and Gas Industry and Strategic Leadership. He has worked for Ecopetrol for the last 22 years and has held various positions within the company, including Vice-President of Transportation, Plant Coordinator, Multipurpose Pipelines Manager, Chief of Department, Program Manager of Dosquebradas and Chief of the Centralized Operations.
Alejandro Linares (55) Mr. Linares Cantillo has been Vice-president of Legal Affairs and General Counsel at Ecopetrol since October 1, 2014. He has more than thirty years of professional experience. He was a Partner at the law firm of Gómez-Pinzón Zuleta Abogados for twenty years and was recently nominated by the Council of State as a candidate to the Constitutional Court of Colombia. Mr. Alejandro Linares Cantillo holds a bachelor’s degree in Law from Universidad de los Andes in Bogotá and earned a graduate degree in finance at Universidad de los Andes as well as an LLM from Harvard Law School. He also earned a graduate diploma on international tax from Harvard University and is currently in the process of obtaining a PhD in Law from the Universidad Externado de Colombia.
| 153 |
Alejandro Arango (54) Mr. Arango has been Vice-president of Human Resources at Ecopetrol S.A. since October 14, 2014. He has more than twenty years of professional experience around the world and has worked as a Vice-president of Human Resources at Banco Santander in Colombia, also as Human Resources Director of the Consumer Finance Division, Strategy Division and Cards Division at Banco Santander in Spain. Mr. Arango has also served as Human Resources Director for the Asia-Pacific region at Banco Santander in Hong Kong and as a Global Human Resources Division T&O, among others. Mr. Arango holds a degree in Strategic Marketing from CESA School of Business and a bachelor’s degree in Theology from the Universidad Hochschule Sankt Georgen (Frankfurt) and a bachelor’s degree in Philosophy from Javeriana University.
Néstor Saavedra (52) has served as our Vice-President of Innovation and Technology since September 2012. Mr. Saavedra earned a degree in petroleum engineering from Universidad Industrial de Santander and a master’s degree in petroleum engineering from Texas A&M University. His work within the Company has included serving as Director of the Colombian Petroleum Institute of Ecopetrol, coordinating horizontal well technology and rock mechanics projects, as well as assessing and predicting the behavior of Colombian oil fields. Mr. Saavedra was Director of the Society of Petroleum Engineers in the South American and Caribbean Region from 2012 to 2014.
Carlos Zamudio (49) has been the Director of Shared Services since August 2012. Mr. Zamudio has more than 20 years of extensive experience in service delivery operations in multinational companies at regional and global levels. He previously worked at Belcorp, where he was the Corporate Director of the Shared Services Center, overseeing 15 countries including the U.S. and Brazil. He also worked at Procter & Gamble, where he was the Corporate Finance Manager for Chile, Brazil, Costa Rica and Colombia, as well as the Global Business Services Manager for the Latin America region.
Edgar Rey (55) has served as Internal Audit Director of Ecopetrol since November 2009. Has over 25 years of experience in the oil and gas industry, having worked in the United States, the United Kingdom and in Latin America. Some of his prior experience includes having served in senior audit and internal control roles for BP as well as nine years of experience at one of the big four International Audit firms. Mr. Rey earned a bachelor’s degree in Public Accounting and an MBA from the Universidade de Los Andes and Cidenal with FFMM in Colombia.
Ingrid Lorena Dumez (47) joined Ecopetrol in 2000 and has headed the Ethics and Compliance Office since its creation. Mrs. Dumez’s responsibilities include overseeing the promotion of corporate ethical values and the prevention of corruption, fraud, money laundering and terrorist financing.
Andres Macias Franco (41) is the acting Head of the Disciplinary Control Office. He has more than 15 years of experience within disciplinary issues; 10 of those years having been spent at Ecopetrol and 5 years between the Central Board of Accountants and the Administrative Department of Security (DAS). He holds a Law degree with a specialization in Public Law from Autonoma de Bucaramanga University as well as a specialization degree in Labor Law at Pontificia Universidad Javeriana. In 2010, Mr. Franco attended the training course for judges and magistrates of the Republic of Colombia. Mr. Franco also worked as a professor of Collective Labor Law at Universidad Cooperativa de Colombia in Barrancabermeja.
Bernardo Castro (51) has served as Commercial and Marketing Deputy Vice-President since February 15, 2015. Mr. Castro holds a degree in Mechanical Engineering from Universidad de America and a specialization degree in Hydrocarbons Management from Universidad Industrial de Santander. He has worked in Ecopetrol for the last 26 years and has worked in maintenance, planning and costs and budget divisions within the company. He has also served in the Coordination of Operations Department and the Economics Department of Reficar, and the Investment Management and Budget division within Ecopetrol S.A. Mr. Castro has worked as the Manager of Operational Planning for the last 4 years
None of our Directors or executive officers has any familial relationship with any director or executive officer.
| 154 |
| 7.6. | Compensation of Directors and Management |
Based on a resolution adopted at our annual shareholders’ meeting in 2012, compensation for directors’ attendance in person at meetings of the Board of Directors and/or committee meetings increased from the equivalent of four to six minimum monthly wage salaries, which totals approximately Ps$3.7 million for 2014 and Ps$3.9 million for 2015. Fees for attendance at virtual meetings are set at 50% of the in-person meeting fee.
The total compensation paid to our Directors, executive officers and senior management during 2014 amounted to Ps$9.1 billion.
Our Directors are not eligible to receive pension and retirement benefits from us. The total amount set aside to provide pension and retirement benefits to our eligible executive officers totals Ps$13.4 billion.
| 7.7. | Share Ownership of Directors and Executive Officers |
No individual Director or executive officer beneficially owns more than 1% of our outstanding shares.
The following Directors and executive officers own shares of Ecopetrol:
| Director | Shares | % | ||
| Joaquín Moreno Uribe | * | * | ||
| Mauricio Cárdenas Santamaría | * | * | ||
| Gonzalo Restrepo López | * | * | ||
| Roberto Steiner Sampedro | * | * | ||
| Executive Officer | Shares | % | ||
| Héctor Manosalva | * | * | ||
| Jaime A. Pineda | * | * | ||
| Federico Maya | * | * | ||
| Claudia Castellanos | * | * |
| (*) | The person does not beneficially own more than 1% of our outstanding shares. |
Under Colombian law, all of our shareholders have the same economic privileges and voting rights.
| 7.8. | Controls and Procedures |
Disclosure Controls and Procedures
As required by Rules 13a-15(e) and 15d-15(e) under the Securities Exchange Act of 1934, as of December 31, 2014, we evaluated the design and effectiveness of our financial disclosure controls and procedures under the supervision and participation of our management, including our Chief Executive Officer and Chief Financial Officer. There are inherent limitations to the effectiveness of any system of disclosure controls and procedures, including the possibility of human error and the circumvention or overriding of the controls and procedures. Accordingly, even if effective, disclosure controls and procedures can only provide reasonable assurance of achieving their control objectives.
Based upon this evaluation, our Chief Executive Officer and Chief Financial Officer concluded that as of the end of the period covered by this annual report, our disclosure controls and procedures were effective to provide reasonable assurance that the information required to be disclosed in the reports that we file and submit under the Securities Exchange Act of 1934 is recorded, summarized and reported as and when required and is accumulated and communicated to our management, including our Chief Executive Officer and Chief Financial Officer, or persons performing similar functions, as appropriate to allow timely decisions regarding required disclosure.]
| 155 |
Management’s Annual Report on Internal Control over Financial Reporting
Our management is responsible for establishing and maintaining adequate internal control over financial reporting as defined in Rules 13a-15(f) and 15(d)-15(f) under the Securities Exchange Act of 1934. Our internal control over financial reporting is a process designed under the supervision of our Chief Executive Officer and Chief Financial Officer, and affected by our board of directors, management and other personnel, to provide reasonable assurance regarding the reliability of financial reporting and the preparation of our financial statements for external reporting purposes in accordance with generally accepted accounting principles, and it includes those policies and procedures that:
• pertain to the maintenance of records that, in reasonable detail, accurately and fairly reflect transactions and dispositions of our assets;
• provide reasonable assurance that transactions are recorded as necessary to permit preparation of financial statements in accordance with generally accepted accounting principles, and that receipts and expenditures are being made only in accordance with authorization of our management and directors; and
• provide reasonable assurance regarding prevention or timely detection of unauthorized acquisition, use or disposition of our assets that could have a material effect on our financial statements.
Because of its inherent limitations, internal control over financial reporting may not prevent or detect misstatements. Therefore, effective control over financial reporting cannot, and does not, provide absolute assurance of achieving our control objectives. Also, projection of any evaluation of the effectiveness of the internal controls to future periods is subject to the risk that controls may become inadequate because of changes in conditions or that the degree of compliance with the policies or procedures may deteriorate.
As of the year ended December 31, 2014, our management conducted an assessment of the effectiveness of our internal control over financial reporting in accordance with the criteria established in the publication “Internal Control – Integrated Framework (2013)”, issued by the Committee of the Sponsoring Organizations of the Treadway Commission (COSO), as well as the rules set by the SEC in its Final Rule “Management’s Report on Internal Control Over Financial Reporting and Certification of Disclosure in Exchange Act Periodic Reports.”
Based on the assessment performed, management concluded that our internal control over financial reporting was effective as of the end of the period covered by this annual report.
The effectiveness of our internal control over financial reporting has been audited by PricewaterhouseCoopers Ltda., an independent registered public accounting firm, as stated in their audit report accompanying our consolidated financial statements.
Audit and Non-Audit Fees
Our consolidated financial statements for the fiscal years ended December 31, 2014 and December 31, 2013 were audited by PricewaterhouseCoopers Ltda. and our consolidated financial statements for the fiscal year ended December 31, 2012 were audited by KPMG Ltda.
The following table sets forth the fees billed to us by PricewaterhouseCoopers Ltda. during the fiscal year ended December 31, 2014.
| 156 |
| 2014 PricewaterhouseCoopers Ltda. | ||||
| (in millions of Pesos, excluding 16% value added tax) | ||||
| Audit fees | 9,533 | |||
| Audit-related fees | 458 | |||
| Tax fees | 30 | |||
| All other fees (1) | 65 | |||
| Total | 10,085 | |||
| (1) | These fees are comprised of coaching sessions in management skills dictated to officers of some affiliates as well as participation in open training courses. |
Audit Fees. The audit fees listed in the table above are the aggregated fees billed by PricewaterhouseCoopers Ltda. in connection with their audits of our annual consolidated financial statements (under Colombian Government Entity GAAP and U.S. GAAP), interim consolidated financial statements (under Colombian Government Entity GAAP), audits of subsidiaries (under local GAAP) and periodic review of documents filed with the SEC. In addition, these audit fees include fees related to our independent auditors’ audits of our internal controls over financial reporting.
Audit-related Fees. The audit-related fees listed in the table above are those fees billed by PricewaterhouseCoopers Ltda. in connection with their agreed-upon audit procedures of our variable compensation bonus system.
Tax Fee. The tax fees listed in the table above correspond to (1) assisting some subsidiaries in the preparation of the income tax return and information submitted in magnetic means, (2) preparation of the income tax returns and information for submission in magnetic means for some expatriate officers of the Company, and (3) review of compliance with transfer pricing obligations.
The following table sets forth the fees billed to us by PricewaterhouseCoopers Ltda. during the fiscal year ended December 31, 2013 and KPMG Ltda. during the fiscal year ended 2012.
| As of December 31, | ||||||||
| 2013 PricewaterhouseCoopers Ltda | 2012 KPMG Ltda | |||||||
| (in millions of pesos, excluding 16% value added tax) | ||||||||
| Audit fees | 7,029 | 6,548 | ||||||
| Audit-related fees | 378 | 225 | ||||||
| Tax fees | 151 | 295 | ||||||
| All other fees(1) | 384 | 3,384 | ||||||
| Total | 7,942 | 10,452 | ||||||
Audit Fees. The audit fees listed in the table above are the aggregated fees billed by KPMG Ltda. in connection with their audits of our annual consolidated financial statements (under Colombian Government Entity GAAP and U.S. GAAP), interim consolidated financial statements (under Colombian Government Entity GAAP), subsidiary audits (under local GAAP) and review of periodic documents filed with the SEC. In addition, these audit fees include fees related to our independent auditors’ audits of our internal controls over financial reporting.
Audit-related Fees. The audit-related fees listed in the table above are the fees billed by KPMG Ltda. in connection with their agreed-upon procedures of our variable compensation bonus system.
| 157 |
Tax Fee. The tax fees listed in the table above correspond to (1) assisting some subsidiaries in the preparation and filing of appropriate tax returns with the tax authorities (including electronic filings), (2) advising some subsidiaries about the tax consequences associated with new or proposed legislation and (3) rendering advice to some subsidiaries on the likely tax consequences of proposed transactions and the appropriate methods of structuring and reporting.
Changes in Internal Control over Financial Reporting
There were no changes made in our internal control over financial reporting during the year ended December 31, 2014 that have materially affected or are reasonably likely to materially affect the Company’s internal controls over financial reporting.
Attestation Report of the Registered Public Accounting Firm
Pricewaterhousecoopers Ltda.’s attestation report on our internal control over financial reporting is included in their audit report accompanying our consolidated financial statements. See Report of Independent Registered Public Accounting Firm—PricewaterhouseCoopers Ltda, to the consolidated financial statements.
Significant Changes
For a description of significant events since December 31, 2014, please see Note 31—Subsequent events, to our consolidated financial statements.
| 158 |
| 8. | Financial Statements |
Ecopetrol S.A. and Subsidiaries
Consolidated Financial Statements
Years ended December 31, 2014, 2013 and 2012
| 159 |
Ecopetrol S.A. and Subsidiaries
Consolidated Financial Statements
Years ended December 31, 2014, 2013 and 2012
Contents
| F-1 |
Report of Independent Registered Public Accounting Firm
To the Board of Directors
and Shareholders of Ecopetrol S.A.
In our opinion, the accompanying consolidated balance sheets and the related consolidated statements of financial, economic, social and environmental activities, of changes in shareholders’ equity and of cash flows present fairly, in all material respects, the financial position of Ecopetrol S.A. and its subsidiaries (the “Company”) at December 31, 2014 and 2013, and the results of their operations and their cash flows for the two years ended December 31, 2014 in conformity with generally accepted accounting principles for Colombian Government Entities issued by the Contaduría General de la Nación. Also in our opinion, the Company maintained, in all material respects, effective internal control over financial reporting as of December 31, 2014, based on criteria established in Internal Control - Integrated Framework 2013 issued by the Committee of Sponsoring Organizations of the Treadway Commission (COSO). The Company's management is responsible for these financial statements, for maintaining effective internal control over financial reporting and for its assessment of the effectiveness of internal control over financial reporting, included in Item 7.8. of this Form 20-F as December 31, 2014. Our responsibility is to express opinions on these financial statements and on the Company's internal control over financial reporting based on our integrated audits. We conducted our audits in accordance with the standards of the Public Company Accounting Oversight Board (United States). Those standards require that we plan and perform the audits to obtain reasonable assurance about whether the financial statements are free of material misstatement and whether effective internal control over financial reporting was maintained in all material respects. Our audits of the financial statements included examining, on a test basis, evidence supporting the amounts and disclosures in the financial statements, assessing the accounting principles used and significant estimates made by management, and evaluating the overall financial statement presentation. Our audit of internal control over financial reporting included obtaining an understanding of internal control over financial reporting, assessing the risk that a material weakness exists, and testing and evaluating the design and operating effectiveness of internal control based on the assessed risk. Our audits also included performing such other procedures as we considered necessary in the circumstances. We believe that our audits provide a reasonable basis for our opinions.
Generally accepted accounting principles for Colombian Government Entities vary in certain significant respects from accounting principles generally accepted in the United States of America. Information relating to the nature and effect of such differences is presented in Note 33 to the consolidated financial statements.
A company’s internal control over financial reporting is a process designed to provide reasonable assurance regarding the reliability of financial reporting and the preparation of financial statements for external purposes in accordance with generally accepted accounting principles. A company’s internal control over financial reporting includes those policies and procedures that (i) pertain to the maintenance of records that, in reasonable detail, accurately and fairly reflect the transactions and dispositions of the assets of the company; (ii) provide reasonable assurance that transactions are recorded as necessary to permit preparation of financial statements in accordance with generally accepted accounting principles, and that receipts and expenditures of the company are being made only in accordance with authorizations of management and directors of the company; and (iii) provide reasonable assurance regarding prevention or timely detection of unauthorized acquisition, use, or disposition of the company’s assets that could have a material effect on the financial statements.
Because of its inherent limitations, internal control over financial reporting may not prevent or detect misstatements. Also, projections of any evaluation of effectiveness to future periods are subject to the risk that controls may become inadequate because of changes in conditions, or that the degree of compliance with the policies or procedures may deteriorate.
/s/ PricewaterhouseCoopers Ltda.
Bogotá, Colombia
April 28, 2015
| F-2 |
Report of Independent Registered Public Accounting Firm
To the Board of Directors and Shareholders of
Ecopetrol S.A.:
We have audited the accompanying consolidated balance sheets of Ecopetrol S.A. and subsidiaries (the “Company”) as of December 31, 2012, and the related consolidated statements of Financial, Economic, Social and Environmental Activities, Changes in Stockholders’ Equity, and Cash Flows for the year ended December 31, 2012. Our responsibility is to express an opinion on these consolidated financial statements based on our audits.
We conducted our audits in accordance with the standards of the Public Company Accounting Oversight Board (United States). Those standards require that we plan and perform the audits to obtain reasonable assurance about whether the financial statements are free of material misstatement. Our audits of the consolidated financial statements included examining, on a test basis, evidence supporting the amounts and disclosures in the financial statements, assessing the accounting principles used and significant estimates made by management, and evaluating the overall financial statement presentation. Our audits also included performing such other procedures as we considered necessary in the circumstances. We believe that our audits provide a reasonable basis for our opinion.
In our opinion, the consolidated financial statements referred to above present fairly, in all material respects, the financial position of the Company as of December 31, 2012 and the results of its operations and its cash flows for the years then ended, in conformity with accounting principles generally accepted in Colombia, promulgated by the National Accounting Office (Contaduría General de la Nación or CGN).
Accounting principles generally accepted for Colombian Government Entities vary in certain significant respects from accounting principles generally accepted in the United States of America. Information relating to the nature and effects of such differences is presented in Note 33 to the consolidated financial statements.
/s/ KPMG Ltda.
Bogotá, Colombia
April 29, 2013
| F-3 |
ECOPETROL S. A. and Subsidiaries
Consolidated Balance Sheets
As of December 31, 2014 and December 31, 2013
(Expressed in millions of Colombian pesos)
| 2014 | 2013 | |||||||
| Assets | ||||||||
| Current assets: | ||||||||
| Cash and cash equivalents (Notes 2 and 3) | $ | 7,951,201 | $ | 8,841,438 | ||||
| Investments (Notes 2 and 4) | 1,087,439 | 1,883,235 | ||||||
| Accounts and notes receivable, net (Notes 2 and 5) | 4,109,054 | 6,176,891 | ||||||
| Inventories, net (Note 6) | 3,023,503 | 3,625,904 | ||||||
| Advances and deposits ( Notes 2 and 7) | 8,330,229 | 8,614,050 | ||||||
| Deferred tax assets | 53,908 | 27,732 | ||||||
| Prepaid expenses (Note 8) | 197,064 | 148,344 | ||||||
| Total current assets | $ | 24,752,398 | $ | 29,317,594 | ||||
| Long term assets: | ||||||||
| Investments (Notes 2 and 4) | 1,605,987 | 1,363,672 | ||||||
| Accounts and notes receivable, net (Note 5) | 857,630 | 520,056 | ||||||
| Advances and deposits (Notes 7) | 225,197 | 192,613 | ||||||
| Deposits held in trust (Note 9) | 508,259 | 468,794 | ||||||
| Property, plant and equipment, net (Note 10) | 50,656,194 | 40,150,534 | ||||||
| Natural and environmental resources, net (Note 11) | 31,660,175 | 27,071,381 | ||||||
| Deferred charges (Note 12) | 2,724,176 | 2,872,435 | ||||||
| Other assets (Notes 2 and 13) | 3,006,929 | 3,509,819 | ||||||
| Valuations | 26,184,346 | 26,961,096 | ||||||
| Total assets | 142,181,291 | 132,427,994 | ||||||
| Liabilities and shareholders' Equity | ||||||||
| Current liabilities: | ||||||||
| Financial obligations (Notes 2 and 14) | 1,789,320 | 774,559 | ||||||
| Accounts payable (Notes 2 and 15) | 8,968,120 | 9,472,824 | ||||||
| Taxes, contributions and duties payable (Note 16) | 7,088,490 | 9,183,501 | ||||||
| Labor and pension liabilities (Note 17) | 369,205 | 289,628 | ||||||
| Estimated liabilities and provisions (Notes 2 and 18) | 2,173,242 | 2,515,005 | ||||||
| Total current liabilities | 20,388,377 | 22,235,517 | ||||||
| Long term liabilities: | ||||||||
| Financial obligations (Notes 2 and 14) | 33,859,657 | 21,423,992 | ||||||
| Accounts payable (Notes 2 and 15) | 219,370 | 591,998 | ||||||
| Labor and pension liabilities (Note 17) | 4,574,158 | 4,277,831 | ||||||
| Estimated liabilities and provisions (Note 18) | 6,937,470 | 5,163,819 | ||||||
| Other long-term liabilities (Note 19) | 3,460,352 | 3,041,886 | ||||||
| Total liabilities | 69,439,384 | 56,735,043 | ||||||
| Non-controlling interest (Note 20) | 4,195,935 | 4,573,748 | ||||||
| Shareholders' equity | ||||||||
| (Note 21 and see attached statement) | 68,545,972 | 71,119,203 | ||||||
| Total liabilities and Shareholders' Equity | 142,181,291 | 132,427,994 | ||||||
| Memorandum accounts | ||||||||
| Debtors (Note 22) | 172,448,043 | 152,210,701 | ||||||
| Creditors (Note 22) | $ | (149,920,013 | ) | $ | (111,774,620 | ) | ||
The accompanying notes are an integral part of the Consolidated Financial Statements
| F-4 |
ECOPETROL S. A. and Subsidiaries
Consolidated Statements of Financial, Economic, Social and Environmental Activities
For the years ended December 31, 2014, 2013 and 2012
(Expressed in millions of Colombian pesos, except for earnings per share which is expressed in Colombian pesos)
| 2014 | 2013 | 2012 | ||||||||||
| Revenues (Note 23): | ||||||||||||
| Domestic sales | 26,715,013 | 26,207,900 | 24,361,913 | |||||||||
| Foreign sales | 42,210,325 | 44,220,815 | 44,490,089 | |||||||||
| Total revenues | 68,925,338 | 70,428,715 | 68,852,002 | |||||||||
| Cost of sales (Note 24) | 45,054,016 | 42,554,282 | 40,535,508 | |||||||||
| Gross margin | 23,871,322 | 27,874,433 | 28,316,494 | |||||||||
| Operating expenses (Note 25) | ||||||||||||
| Administration | 1,677,391 | 1,455,717 | 874,980 | |||||||||
| Operation and projects | 5,591,942 | 4,583,986 | 4,098,610 | |||||||||
| Operating income | 16,601,989 | 21,834,730 | 23,342,904 | |||||||||
| Non-operating income (expenses): | ||||||||||||
| Financial Income (expenses), net (Note 26) | (671,490 | ) | 45,652 | (167,889 | ) | |||||||
| Pension expenses (Note 27) | (555,246 | ) | (478,737 | ) | (948,455 | ) | ||||||
| Inflation gain | - | 156 | 97,663 | |||||||||
| Other income (expenses), net (Note 28) | 45,494 | 480,407 | 7,478 | |||||||||
| Income before income tax and non-controlling interest | 15,420,747 | 21,882,208 | 22,331,701 | |||||||||
| Current income tax (Note 16) | 6,731,655 | 8,291,572 | 7,095,874 | |||||||||
| Deferred income tax (Note 16) | 403,413 | (202,733 | ) | 37,521 | ||||||||
| Income before non-controlling interest | 8,285,679 | 13,793,369 | 15,198,306 | |||||||||
| Non-controlling interest | (775,409 | ) | (686,866 | ) | (419,359 | ) | ||||||
| Net income for the year | 7,510,270 | 13,106,503 | 14,778,947 | |||||||||
| Earnings per share | 182.66 | 318.76 | 359.44 | |||||||||
The accompanying notes are an integral part of the Consolidated Financial Statements
| F-5 |
ECOPETROL S. A. and Subsidiaries
Consolidated Statement of Changes in Shareholders´ Equity
For the twelve-month periods ended December 31, 2014 and 2013.
(Expressed in millions of Colombian pesos, except for the dividend per share which is expressed in Colombian pesos)
| Subscribed and paid-in capital | Additional paid-in capital | Legal and other reserves | Incorporated institutional equity | Equity method surplus | Valuation Surplus | Public Accounting regime | Accumulated retained earnings | Total shareholders' equity | ||||||||||||||||||||||||||||
| Balance as of December 31, 2012 | 10,279,175 | 6,954,247 | 12,292,735 | 174,080 | 824,701 | 19,775,661 | (16,231 | ) | 14,456,513 | 64,740,881 | ||||||||||||||||||||||||||
| Distribution of dividends ($291 per share) | - | - | - | - | - | - | - | (11,964,960 | ) | (11,964,960 | ) | |||||||||||||||||||||||||
| Additional paid-in capital receivable | - | 45 | - | - | - | - | - | - | 45 | |||||||||||||||||||||||||||
| Additional paid-in capital - called in guarantees | - | 82 | - | - | - | - | - | - | 82 | |||||||||||||||||||||||||||
| Valuation surplus | - | - | - | - | - | 4,830,558 | - | - | 4,830,558 | |||||||||||||||||||||||||||
| Property, plant and equipment revaluation | - | - | - | - | - | - | 1,363 | - | 1,363 | |||||||||||||||||||||||||||
| Regulatory Decree 2336/95 reserve appropriation | - | - | 215,407 | - | - | - | - | (215,407 | ) | - | ||||||||||||||||||||||||||
| Corporate Group unrealized reserve appropriation | - | - | 3,461,741 | - | - | - | - | (3,461,741 | ) | - | ||||||||||||||||||||||||||
| Appropriation of reserves for new explorations. | - | - | 2,595,112 | - | - | - | - | (2,595,112 | ) | - | ||||||||||||||||||||||||||
| Appropriation of reserves for investment projects | - | - | 2,628,878 | - | - | - | - | (2,628,878 | ) | - | ||||||||||||||||||||||||||
| Appropriation of reserves for infill drilling campaign | - | - | 1,260,000 | - | - | - | - | (1,260,000 | ) | - | ||||||||||||||||||||||||||
| Release of the Regulatory Decree 2336/95 reserves for the previous year | - | - | (1,829,362 | ) | - | - | - | - | 1,829,362 | - | ||||||||||||||||||||||||||
| Release of the Corporate Group's unrealized reserves from prior years | - | - | (2,595,112 | ) | - | - | - | - | 2,595,112 | - | ||||||||||||||||||||||||||
| Release transportation infrastructure integrity strengthening reserve | - | - | (605,135 | ) | - | - | - | - | 605,135 | - | ||||||||||||||||||||||||||
| Release of the Corporate Group's unrealized reserves | - | - | (2,123,538 | ) | - | - | - | - | 2,123,538 | - | ||||||||||||||||||||||||||
| Equity method surplus exchange rate adjustment | - | - | - | - | 404,504 | - | - | - | 404,504 | |||||||||||||||||||||||||||
| Incorporated institutional equity adjustment | - | - | - | 227 | - | - | - | - | 227 | |||||||||||||||||||||||||||
| Net income for the period | - | - | - | - | - | - | - | 13,106,503 | 13,106,503 | |||||||||||||||||||||||||||
| Balance as of December 31, 2013 | 10,279,175 | 6,954,374 | 15,300,726 | 174,307 | 1,229,205 | 24,606,219 | (14,868 | ) | 12,590,065 | 71,119,203 | ||||||||||||||||||||||||||
| Distribution of dividends ($260 per share) | - | - | - | - | - | - | - | (10,690,342 | ) | (10,690,342 | ) | |||||||||||||||||||||||||
| Additional paid-in capital receivable | - | 41 | - | - | - | - | - | - | 41 | |||||||||||||||||||||||||||
| Additional paid-in capital - called in guarantees | - | 31 | - | - | - | - | - | - | 31 | |||||||||||||||||||||||||||
| Valuation surplus | - | - | - | - | - | (657,990 | ) | - | - | (657,990 | ) | |||||||||||||||||||||||||
| Property, plant and equipment impairment | - | - | - | - | - | - | 7,718 | - | 7,718 | |||||||||||||||||||||||||||
| Regulatory Decree 2336/95 reserve appropriation | - | - | 20,989 | - | - | - | - | (20,989 | ) | - | ||||||||||||||||||||||||||
| Corporate Group unrealized reserves appropriation from prior years | - | - | 3,169,024 | - | - | - | - | (3,169,024 | ) | - | ||||||||||||||||||||||||||
| Corporate Group unrealized reserves appropriation for the year | - | - | 2,159,429 | - | - | - | - | (2,159,429 | ) | - | ||||||||||||||||||||||||||
| Appropriation of reserves for new explorations | - | - | 3,855,112 | - | - | - | - | (3,855,112 | ) | - | ||||||||||||||||||||||||||
| Appropriation of reserves for future investments | - | - | 3,619,229 | - | - | - | - | (3,619,229 | ) | - | ||||||||||||||||||||||||||
| Release of the Regulatory Decree 2336/95 reserve for the previous year | - | - | (215,406 | ) | - | - | - | - | 215,406 | - | ||||||||||||||||||||||||||
| Release of the Corporate Group´s unrealized reserves from previous years | - | - | (3,461,742 | ) | - | - | - | - | 3,461,742 | - | ||||||||||||||||||||||||||
| Release for new explorations | - | - | (2,595,113 | ) | - | - | - | - | 2,595,113 | - | ||||||||||||||||||||||||||
| Release of reserve for investment projects | - | - | (2,628,878 | ) | - | - | - | - | 2,628,878 | - | ||||||||||||||||||||||||||
| Release for infill drilling campaign | - | - | (1,260,000 | ) | - | - | - | - | 1,260,000 | - | ||||||||||||||||||||||||||
| Equity method capital surplus exchange rate adjustment | - | - | - | - | 1,271,403 | - | - | - | 1,271,403 | |||||||||||||||||||||||||||
| Incorporated institutional equity adjustment | - | - | - | (14,362 | ) | - | - | - | - | (14,362 | ) | |||||||||||||||||||||||||
| Net income for the year | - | - | - | - | - | - | - | 7,510,270 | 7,510,270 | |||||||||||||||||||||||||||
| Balance as of December 31, 2014 | 10,279,175 | 6,954,446 | 17,963,370 | 159,945 | 2,500,608 | 23,948,229 | (7,150 | ) | 6,747,349 | 68,545,972 | ||||||||||||||||||||||||||
The accompanying notes are an integral part of the Consolidated Financial Statements
| F-6 |
ECOPETROL S. A. and Subsidiaries
Consolidated Statements of Cash Flows
For the twelve-month periods ended December 31, 2014 and 2013.
(Expressed in millions of Colombian pesos)
| December 2014 | December 2013 | December 2012 | ||||||||||
| Cash flows from operating activities: | ||||||||||||
| Net income for the year | 7,510,270 | 13,106,503 | 14,778,947 | |||||||||
| Adjustments to reconcile net income to cash provided by operating activities: | ||||||||||||
| Non-controlling interest | 775,409 | 686,866 | 419,359 | |||||||||
| Deferred income and CREE tax, net | 403,413 | (202,733 | ) | 37,521 | ||||||||
| Property, plant and equipment depreciation | 2,248,409 | 1,982,706 | 2,027,658 | |||||||||
| Exchange rate differences | 257,735 | (17,972 | ) | 309,130 | ||||||||
| Amortizations | 4,234,957 | 3,535,383 | 3,441,192 | |||||||||
| Provisions, net of recovery | 297,267 | 660,036 | 319,297 | |||||||||
| Pension liabilities (health and pension) | 308,584 | 226,244 | 869,491 | |||||||||
| Property, plant and equipment write-off | 315,157 | 27,233 | 127 | |||||||||
| Recovery of property, plant and equipment | - | (152,964 | ) | - | ||||||||
| Goodwill impairment | 182,631 | 353,012 | - | |||||||||
| Natural and environmental resource write-off | 852,060 | 843,228 | 34,191 | |||||||||
| Loss in investments valuation | 227,201 | 4,728 | 65,096 | |||||||||
| Profit in equity method investments | (44,914 | ) | (120,060 | ) | (125,277 | ) | ||||||
| Net changes in operating asset and liabilities: | ||||||||||||
| Accounts and notes receivable | 1,765,004 | (6,090,115 | ) | (2,522,804 | ) | |||||||
| Inventories | 567,950 | (465,611 | ) | (390,847 | ) | |||||||
| Deferred charges and other assets | 201,812 | 118,186 | 895,618 | |||||||||
| Accounts payable | 94,667 | 676,518 | 2,601,167 | |||||||||
| Taxes, contributions and duties payable | (2,159,387 | ) | 2,300,118 | (730,923 | ) | |||||||
| Labor and pension obligations | (70,303 | ) | (790,808 | ) | 34,632 | |||||||
| Estimated liabilities and provisions | (378,108 | ) | 1,085,193 | 116,552 | ||||||||
| Other long-term liabilities | (84,765 | ) | (242,930 | ) | (998,029 | ) | ||||||
| Net cash provided by operating activities | 17,505,049 | 17,522,761 | 21,182,098 | |||||||||
| Cash flows from investing activities: | ||||||||||||
| Payment and advance for the companie, net of acquired cash | - | - | ||||||||||
| Increase in investments | (5,684,018 | ) | (7,567,590 | ) | (14,911,124 | ) | ||||||
| Redemption and sale of investments | 7,106,487 | 11,933,852 | 13,772,436 | |||||||||
| Dividends received | 80,147 | 98,281 | 70,690 | |||||||||
| Investment in natural and environmental resources | (8,135,660 | ) | (6,267,691 | ) | (5,615,306 | ) | ||||||
| Additions to property, plant and equipment | (7,546,732 | ) | (7,957,123 | ) | (9,852,556 | ) | ||||||
| Proceeds from sales of natural resources | 734 | 100,790 | - | |||||||||
| Proceeds from sales of property, plant and equipment | 79,381 | (2,963 | ) | - | ||||||||
| Net cash used in investing operating activities | (14,099,661 | ) | (9,662,444 | ) | (16,535,860 | ) | ||||||
| Cash flows from financing activities: | ||||||||||||
| Non-controlling interests | (69,823 | ) | ||||||||||
| Financial obligations | 7,153,041 | 7,492,632 | 5,110,249 | |||||||||
| Capitalizations | 41 | 82 | 10,390 | |||||||||
| Dividends paid by Ecopetrol S.A. | (12,000,234 | ) | (14,570,467 | ) | (8,419,332 | ) | ||||||
| Dividends paid by controlled entities | (558,016 | ) | - | - | ||||||||
| Net cash used in financing activities | (5,405,168 | ) | (7,077,753 | ) | (3,368,516 | ) | ||||||
| Net (decrease) increase in cash and cash equivalents | (1,999,780 | ) | 782,563 | 1,277,722 | ||||||||
| Exchange rate difference in cash and cash equivalents | 1,109,543 | 118,185 | (116,969 | ) | ||||||||
| Cash and cash equivalents at the beginning of the year | 8,841,438 | 7,940,690 | 6,779,937 | |||||||||
| Cash and cash equivalents at the end of the year | 7,951,201 | 8,841,438 | 7,940,690 | |||||||||
The accompanying notes are an integral part of the Consolidated Financial Statements.
| F-7 |
Ecopetrol S.A. and Subsidiaries
Notes to the Consolidated Financial Statements
Years ended December 31, 2014, 2013 and 2012
(Expressed in millions of Colombian pesos)
| (1) | Economic entity and principal accounting policies and practices |
Reporting entity
Ecopetrol S.A. (hereinafter Ecopetrol or the Company) was constituted by Law 165 of 1948 and transformed through Extraordinary Decree 1760 of 2003 (as well as Decree 409 of 2006) and Law 1118 of 2006 into a state-owned stock company and then into a mixed economy company of a commercial nature, at the national level, linked to the Ministry of Mines and Energy, with an indefinite life term. Ecopetrol’s corporate purpose is the development, in Colombia or abroad, of commercial or industrial activities arising from or related to the exploration, production, refining, transportation, storage, distribution, and selling of hydrocarbons, their by-products and associated products, as well as subsidiary operations, connected or complementary to these activities, in accordance with applicable regulations. Ecopetrol’s main domicile is Bogotá, Colombia, and it may establish subsidiaries, branches and agencies in Colombia or abroad.
Pursuant to Transformation Decree 1760 of 2003, all administration of the Colombian nation’s hydrocarbon reserves, as well as the administration of non-strategic assets represented by stocks and shares in companies, were separated from Ecopetrol. Furthermore, Ecopetrol’s basic structure was changed and two entities were created: a) the Agencia Nacional de Hidrocarburos (National Hydrocarbons Agency, hereinafter ANH) was created to issue and develop Colombian oil policy from that point forward (formerly the responsibility of Ecopetrol), and b) Sociedad Promotora de Energía de Colombia S.A., which received the non-strategic assets owned by Ecopetrol.
Law 1118 of December 27, 2006 changed the legal nature of Ecopetrol and authorized the Company to issue shares to be placed on the public market and acquired by Colombian individuals or legal entities. Once the shares corresponding to 10.1% of the authorized capital were issued and placed, at the end of 2007, the Company became a public-private entity of a commercial nature, at the national level, related to the Ministry of Mines and Energy.
Ecopetrol entered into a deposit agreement with JP Morgan Chase Bank, N.A., as depositary, for the issuance of ADSs evidenced by ADRs. Each of the ADSs represents 20 of Ecopetrol’s common shares or the right to receive 20 common shares of Ecopetrol.
On September 12, 2008, Ecopetrol submitted an application to the U.S. Securities and Exchange Commission (SEC) to register and list the Company’s ADSs evidenced by ADRs on the New York Stock Exchange (NYSE). The Company’s ADSs began trading on the NYSE under the “EC” symbol on September 18, 2008.
On December 3, 2009, the National Oversight Commission for Entities and Securities of Peru (from the Spanish Comisión Nacional Supervisora de Empresas y Valores del Perú - CONASEV) approved the listing of Ecopetrol’s ADRs on the Lima Stock Exchange and the registration of such securities with the Public Registry of the Securities Market. The ADRs began trading on the Lima Stock Exchange on December 4, 2009 in the Peruvian market under the “EC” symbol.
On August 13, 2010, Ecopetrol began trading its ADRs on the Toronto Stock Exchange, Canada. Thus, Ecopetrol became the first Colombian company to be listed on the Toronto Stock Exchange.
Between July 27 and August 17, 2011, Ecopetrol carried out the second placement of its public offering, authorized by Law 1118 of 2006. As a result of this process, 644,185,868 common shares were issued at a nominal price of $3,700 per share, for a total amount of $2,383,488. The common shares were registered with the National Registry of Securities and Issuers in accordance with Decree 2555 of 2010. Following this, the Colombian National Government’s equity participation in Ecopetrol was 88.49%.
| F-8 |
Ecopetrol S.A. and Subsidiaries
Notes to the Consolidated Financial Statements
Years ended December 31, 2014, 2013 and 2012
(Expressed in millions of Colombian pesos)
The companies consolidated by Ecopetrol S.A. are:
| Subsidiary | Ecopetrol ownership share |
Activity | Subsidiaries | Date of incorporation |
Country/ Domicile |
Geographic area of operations | ||||||
| Ecopetrol Oleo é Gas do Brasil Ltda. | 100% | Hydrocarbon exploration and exploitation. | - | 14-Dec-06 | Brazil | Brazil | ||||||
| Ecopetrol del Perú S.A. | 100% | Hydrocarbon exploration and exploitation. | - | 27-Aug-07 | Peru | Peru | ||||||
| Ecopetrol America Inc. | 100% | Hydrocarbon exploration and exploitation. | - | 09-Oct-07 | United States | United States | ||||||
| Black Gold Re Ltd. | 100% | Reinsurer of Ecopetrol and it’ssubsidiaries | - | 24-Aug-06 | Bermuda | Bermuda | ||||||
| Andean Chemicals Ltd. | 100% | Investment vehicle | Bioenergy S. A., Refinería de Cartagena, Propileno del Caribe S.A. y Comai S.A. | 30-Jan-97 | Bermuda | Bermuda | ||||||
| ODL S. A. | 65% | Pipeline transportation of crude oil | ODL S. A. | 10-Jan-08 | Panama | Colombia | ||||||
| Propileno del Caribe Propilco S. A. | 100% | Production and marketing of polypropylene resin | Comai S. A., Refinería de Cartagena, Bioenergy S. A. | 16-Mar-89 | Colombia | Colombia | ||||||
| Bioenergy S. A. | 91.43% | Biofuels production | Bioenergy Zona Franca S.A. | 13-Dec-05 | Colombia | Colombia | ||||||
| Ecopetrol Global Energy | 100% | Investment vehicle | Ecopetrol America Inc., Ecopetrol oleo & Gas do Brasil Ltda, Ecopetrol del Perú S.A., Ecopetrol Germany Gmbh, Refinería de Cartagena S. A., Bioenergy S. A. | 26-Mar-09 | Spain | Spain | ||||||
| Oleoducto Central S. A. - Ocensa | 72.65% | Pipeline transportation of crude oil | - | 14-Dec-94 | Colombia | Colombia | ||||||
| COMAI - Compounding and Masterbatchin Industry | 100% | Manufacturing of polypropylene compounds and master batches for a wide range of uses | Refinería de Cartagena, Bioenergy S. A. | 21-May-91 | Colombia | Colombia | ||||||
| Refinería de Cartagena S. A. | 100% | Hydrocarbons refining, marketing and distribution. | - | 11-Oct-06 | Colombia | Colombia | ||||||
| Hocol Petroleum Limited | 100% | Investment vehicle | Hocol S. A. | 29-Sep-95 | Bermuda | Bermuda | ||||||
| Oleoducto de Colombia S. A. – ODC | 73% | Pipeline transportation of crude oil | - | 10-Jul-89 | Colombia | Colombia | ||||||
| Oleoducto Bicentenario de Colombia SAS | 55.97% | Pipeline transportation of crude oil | - | 18-Aug-10 | Colombia | Colombia | ||||||
| Ecopetrol Capital AG | 100% | Financing, liquidation of funding for companies, groups or any business or related activity. | - | 07-Dec-10 | Switzerland | Switzerland | ||||||
| Equion Energía Limited | 51% | Hydrocarbon exploration and exploitation. | Santiago Oil Company, ODC | 05-Jun-59 | United Kingdom | Colombia | ||||||
| Hocol S.A | 100% | Hydrocarbon exploration and exploitation. | - | 15-Oct-79 | Cayman Islands | Colombia | ||||||
| Ecopetrol Global Capital SL | 100% | Investment vehicle | - | 10-Jan-11 | Spain | Spain | ||||||
| Cenit S.A.S. | 100% | Hydrocarbons storage and transportation via pipelines | Oleoducto Bicentenario, Ocensa, ODC, ODL | 15-Jun-12 | Colombia | Colombia | ||||||
| Ecopetrol Germany Gmbh | 100% | Hydrocarbon exploration and exploitation. | - | 23-Jun-14 | Germany | Angola |
| F-9 |
Ecopetrol S.A. and Subsidiaries
Notes to the Consolidated Financial Statements
Years ended December 31, 2014, 2013 and 2012
(Expressed in millions of Colombian pesos)
Cartagena Refinery Operations
As from March 5, 2014, the crude oil division ceased its refining operations at the Cartagena Refinery. As from that date, the division primarily, focused on marketing activities.
The Company and some of its subsidiaries carry out exploration and production operations through Exploration and Production (E&P) Contracts and Technical Evaluation Contracts and Agreements (TEA) signed with the ANH, as well as through Association Contracts and other types of contracts in various forms.
A summary of the production and exploration contracts for 2014 is as follows:
| Number of Contracts | ||||||||||||||||||||||||
| Type of contract | Ecopetrol S. A. | Hocol Petroleum Ltd. | Ecopetrol Oleo é Gas do Brasil Ltda. | Ecopetrol America Inc. | Ecopetrol del Perú S. A. | Equión Energía Limited | ||||||||||||||||||
| Exploration | ||||||||||||||||||||||||
| E&P-ANH Contracts | 44 | 18 | - | - | 6 | 2 | ||||||||||||||||||
| E&P-ANH Agreements | 6 | - | - | - | - | - | ||||||||||||||||||
| TEA’s – ANH | 7 | 1 | - | - | - | - | ||||||||||||||||||
| Association Contracts | 3 | 1 | 3 | 16 | - | - | ||||||||||||||||||
| Production | ||||||||||||||||||||||||
| Association | 51 | 7 | - | 3 | - | 4 | ||||||||||||||||||
| E&P-ANH Contracts | - | 1 | - | - | - | - | ||||||||||||||||||
| Undeveloped and inactive discovered fields (CDNDI) | 9 | - | - | - | - | - | ||||||||||||||||||
| Incremental production | 5 | 1 | - | - | - | - | ||||||||||||||||||
| Risk participation | 3 | - | - | - | - | - | ||||||||||||||||||
| Technological partnership | 1 | - | - | - | - | - | ||||||||||||||||||
| Business cooperation | 1 | - | - | - | - | 1 | ||||||||||||||||||
| Shared risk participation | 1 | - | - | - | - | - | ||||||||||||||||||
| Operation | 1 | - | - | - | - | - | ||||||||||||||||||
| Production services with risk | 1 | - | - | - | - | - | ||||||||||||||||||
| 133 | 29 | 3 | 19 | 6 | 7 | |||||||||||||||||||
| F-10 |
Ecopetrol S.A. and Subsidiaries
Notes to the Consolidated Financial Statements
Years ended December 31, 2014, 2013 and 2012
(Expressed in millions of Colombian pesos)
A summary of the production and exploration contracts for 2013 is as follows:
| Number of Contracts | ||||||||||||||||||||||||
| Contract Modality | Ecopetrol S. A. | Hocol Petroleum Ltd. | Ecopetrol Oleo é Gas do Brasil Ltda. | Ecopetrol America Inc. | Ecopetrol del Perú S. A. | Equión Energía Limited | ||||||||||||||||||
| Exploration | ||||||||||||||||||||||||
| E&P-ANH Contracts | 47 | 15 | - | - | - | 3 | ||||||||||||||||||
| E&P-ANH Agreements | 6 | - | - | - | - | - | ||||||||||||||||||
| TEA’s – ANH | 7 | 1 | - | - | - | - | ||||||||||||||||||
| Association Contracts | 3 | 1 | 16 | 14 | 1 | - | ||||||||||||||||||
| Production | ||||||||||||||||||||||||
| Association | 51 | 8 | - | 4 | - | 4 | ||||||||||||||||||
| E&P-ANH Contracts | - | 1 | - | - | - | - | ||||||||||||||||||
| Undeveloped and inactive discovered fields (CDNDI) | 9 | - | - | - | - | - | ||||||||||||||||||
| Incremental production | 5 | 1 | - | - | - | - | ||||||||||||||||||
| Risk participation | 3 | - | - | - | - | - | ||||||||||||||||||
| Technological partnership | 1 | - | - | - | - | - | ||||||||||||||||||
| Business cooperation | 1 | - | - | - | - | 1 | ||||||||||||||||||
| Shared risk participation | 1 | - | - | - | - | - | ||||||||||||||||||
| Operation | 1 | - | - | - | - | - | ||||||||||||||||||
| Production services with risk | 1 | - | - | - | - | - | ||||||||||||||||||
| 136 | 27 | 16 | 18 | 1 | 8 | |||||||||||||||||||
Principal accounting policies and practices
The Contaduría General de la Nación (CGN – National Accounting Office) adopted the Public Accounting Regime (RCP) in September 2007, defining its configuration, scope and application. Pursuant to CGN Communication No. 20079-101345 of September 28, 2007, RCP went into effect for Ecopetrol on January 1, 2008.
Consolidation process
The consolidated financial statements have been prepared in accordance with Articles 23 and 122 of Decree 2649 of 1993. The latter article states that an economic entity that owns more than 50% of the capital stock of the other economic entities, must present along with its basic financial statements, the consolidated financial statements, and their respective notes. The consolidation method used is the full consolidation method set out in External Circular Letter No. 005 of April 6, 2000 issued by the Office of the Superintendent of Corporations, which establishes that the consolidated financial statements must be aggregated based on the individual financial statements of the parent company and of each of its subsidiaries, identifying the effect on assets, liabilities, equity and results of operations of all the transactions carried out between group companies.
The consolidation of the group was performed with the financial statements of the parent company and its subsidiaries, as of the same cut-off date of December 31, 2014 and 2013, after they were standardized according to the Public Accounting Regime, issued by the Office of the General Accountant of the Nation.
| (a) | Basis of presentation |
The consolidated financial statements were prepared in accordance with Colombian Government Entity GAAP standards and principles issued by the CGN, and other legal provisions. These principles may differ in certain respects from those established by other standards and other control authorities, and CGN opinions on specific matters prevail over other standards.
The accrual method was applied for the accounting recognition of financial, economic, environmental and social activities.
A structure was established in accordance with the rules for the inspection, supervision, and/or control of Ecopetrol, and the companies that apply the regime of public accounting (RCP, to record operations at the level of source documents, or for standardization purposes, to define the accounting treatment of operations not covered by the CGN.The structure involves: i) principal and permanent inspection, supervision, and control: Superintendence of Domiciliary Public Services; ii) residual control: Superintendence of Corporations; and iii) concurrent control: Superintendence of Finance, of the activities of the Company in its capacity as issuer in the stock market. International Financial Reporting Standards (IFRS) are applied to define regulatory differences, while accounting standards under Generally Accepted Accounting Principles in the United States (USGAAP) are applied for accounting issues related to crude oil and natural gas activities.
| F-11 |
Ecopetrol S.A. and Subsidiaries
Notes to the Consolidated Financial Statements
Years ended December 31, 2014, 2013 and 2012
(Expressed in millions of Colombian pesos)
The basic consolidated financial statements defined by the CGN are: the Balance Sheet, the Statement of Financial, Economic, Social and Environmental Activity, the Statement of Changes in Shareholders’ Equity and the Statement of Cash Flows. The notes to the basic consolidated financial statements are an integral part of thereof.
The consolidated financial statements include the accounts of the businesses in which the Company holds a direct or indirect share of over 50% of capital, or over which it has significant influence without being a majority shareholder. All inter-company transactions among consolidated companies have been eliminated. The attached consolidated financial statements consolidate the assets, liabilities, equity and results of the subsidiaries.
The accompaning financial statements consolidate assets, liabilities, equity and results of operations of the subsidiary companies. The investments recorded in those companies are recognized by the equity method. The annual consolidated financial statements are presented before the General Assembly of Shareholders and are the basis for dividend distribution and other appropriations.
| (b) | Materiality criterion |
An economic fact is material whenever, due to its nature, amount and surrounding circumstances, the knowledge or ignorance of it, may significantly alter the economic decisions of users of such financial information.
As set forth by the RCP, the information disclosed in the financial statements and financial accounting reports must cover the main aspects of the Government Accounting entity in a way that must be significantly close to the truth, so that it is relevant and reliable for decision-making purposes or the required evaluations based on accounting information objectives. Materiality depends on the nature of the facts or the magnitude of the amounts disclosed or not revealed.
The consolidated financial statements include specific headings in accordance with legal requirements or for elements representing 5% or more of total assets, current assets, total liabilities, current liabilities, working capital, equity and income, as appropriate. In addition, lower amounts are shown when they are deemed to contribute to a better interpretation of financial information.
| (c) | Use of estimates |
The preparation of consolidated financial statements requires that the management of the Company make estimates and assumptions that could affect the recorded amounts of assets, liabilities, results of activities and the attached notes. These estimates are carried out based on technical criteria, judgment and tenets pursuant to the regulations and legal provisions in effect. Actual results may differ from such estimates.
| (d) | Foreign currency transactions |
Foreign currency transactions are recognized in accordance with applicable regulations and recorded at the appropriate exchange rates on the transaction date. Balances denominated in foreign currencies are expressed in Colombian pesos at the representative market exchange rates at the end of each period.
The exchange difference resulting from asset adjustments is recorded in results, except those generated by variable yield investments in foreign subsidiaries, which are recorded as an increase or decrease in equity value in accordance with Decree 4918 of December 26, 2007 issued by the Ministerio de Comercio, Industria y Turismo (Ministry of Trade, Industry and Tourism). In cases where the investment is settled, this value is recorded in the results for the year.
Exchange differences resulting from liabilities are recorded in results only when they are not attributable to asset acquisition costs. Exchange differences are attributable to asset acquisition costs during the construction, installation or start-up phase of those assets and until they are in operable condition.
While performing its oil industry activities, the Company can freely deal in foreign currencies, provided that it complies with the provisions of Colombia’s exchange rate regime.
The conversion of financial statements of subsidiaries that use currencies other than the Colombian peso, is performed by translate from the functional currency into US Dollars and then into Colombian pesos. For translation of asset and liability balances, was used the Market Representative Exchange Rate (TRM) as of December 31, 2014 was used. For translation of income statement figures, the monthly average TRMs were used, and historical rates were used for capital figures.
| (e) | Joint venture contracts |
Joint venture contracts are entered into between Ecopetrol and third parties in order to share the risk, secure capital, maximize operating efficiency and optimize the recovery of reserves. In these joint ventures, one party is designated as the operator to execute the expense and investment budget and report to partners according to their participation interests. Each party takes its share of the hydrocarbons (crude oil or gas) produced according to its agreed participation.
| F-12 |
Ecopetrol S.A. and Subsidiaries
Notes to the Consolidated Financial Statements
Years ended December 31, 2014, 2013 and 2012
(Expressed in millions of Colombian pesos)
When Ecopetrol participates as a non-operator partner, it records the assets, liabilities, revenues, costs and expenses based on information reported by the operators. When Ecopetrol is the direct operator of the joint venture contracts, it records 100% of the assets, liabilities, revenues, costs and expenses, recognizing, on a monthly basis, the distribution based on each partner’s participation interests in the line items corresponding to assets, liabilities, expenses, costs and revenues assigned to the associate by said participation.
| (f) | Cash and cash equivalents |
Cash and cash equivalents are represented by negotiable investments with maturity dates that fall within ninety (90) days of their acquisition, and are recorded as liquidity management investments.
Cash from joint operations in which the Company is the operating partner corresponds to advances from partners (including the companies in the group), according to their contractually agreed participation percentages, and funds are managed in a joint operation exclusive-use bank account.
| (g) | Derivative financial instruments |
Ecopetrol and the Companies in the group enter into financial hedging agreements to hedge against international fluctuations in crude-oil prices, product prices and exchange rates. The difference between the contract value and market value, generated by hedging operations, is recognized as financial income or expense in the statement of Financial, Economic, Social and Environmental Activity. The Group does not use said financial instruments for speculative purposes.
| (h) | Investments |
The investments are classified as: i) liquidity management investments, ii) investments for policy purposes, and iii) equity investments.
| i. | Liquidity management investments correspond to resources invested in debt and participative securities with the objective of obtaining profits through short-term price fluctuations. Their initial recording corresponds to their historical cost and they are updated based on valuation methods issued by the Superintendence of Finance of Colombia. |
| ii. | Investments for policy purposes are made up of national or foreign debt securities acquired in compliance with the macroeconomic or internal policies of the Group, which include investments held through their maturity date and those available for sale, which are kept for at least one (1) year, as of the first day on which they were classified for the first time, or when they were reclassified. |
| Investments held to maturity are updated based on the internal rate of return (IRR) as set out in the methodology adopted by the Superintendence of Finance of Colombia; the investments for the purpose of macroeconomic policy and those available for sale must be updated based on the methodology adopted by the Superintendence of Finance of Colombia for tradable investments. |
| iii. | Equity investments are classified as being in controlled and uncontrolled entities. Equity investments in controlled entities are recognized at their acquisition cost whenever it is lower than the intrinsic value; otherwise, they are recognized at the intrinsic value, and the difference between the purchase price and the intrinsic value corresponds to goodwill. |
Their values are updated using the equity method, as established in CGN Resolution 145 of 2008.
Investments in entities in which Ecopetrol and/or its subsidiaries exert significant influence are recorded using the equity method.
Significant influence is defined as the power the entity has, whether or not the percentage of ownership is 50% or lower, to participate in setting and directing the financial and operational policies of another entity for the purpose of obtaining profits from that entity.
Significant influence may be present in one or more of the following ways:
| § | Representation on the Board of Directors or equivalent governing body of the associate; |
| § | Participation in policy-making; |
| § | Significant transactions between the investor and the associate; |
| § | Exchange of officers; or |
| § | Supplying essential technical information. |
For foreign subsidiaries, the equity method must be applied in the Colombian legal currency, prior translation of the foreign-currency financial statements.
| F-13 |
Ecopetrol S.A. and Subsidiaries
Notes to the Consolidated Financial Statements
Years ended December 31, 2014, 2013 and 2012
(Expressed in millions of Colombian pesos)
Equity investments in uncontrolled entities include low or minimum trading shares, or shares not listed on an exchange. They do not enable any type of control or significant influence and are recorded at historical cost; their change in value arises from periodically comparing the cost of the investment to its intrinsic value or its market value.
Investments made in foreign currency are recognized applying the TRM on the transaction date. The amount should be periodically restated based upon the TRM, provided that the valuation methodology does not consider it.
Changes in equity generated by an adjustment for conversion of a controlled entity are recorded as equity method surplus, without prejudice to a debit balance in the sub-account, the foregoing is in compliance with CGN resolution 193 of July 27, 2010.
| (i) | Accounts and notes receivable and allowance for doubtful accounts |
Accounts and notes receivable are recorded at their original amount or at the value accepted by the debtor, subject to periodic updating according to legal provisions in effect, or according to agreed upon contract terms.
The accounts receivable allowance is reviewed and updated periodically based on the age of the balances and the recovery analysis of individual accounts. The Group carries out the necessary administrative and legal steps to recover overdue accounts receivable and to collect interest from clients who do not comply with payment policies.
Accounts and notes receivable are only written off against the allowances when there is reasonable legal or material certainty of the total or partial loss of the incorporated or represented right.
| (j) | Inventories |
Inventories include assets extracted, in production process, transformed or acquired for any reason, for the purpose of being sold, transformed and consumed in the production process, or as part of services delivered. A perpetual inventory system is used.
Inventories are stated at historical cost or at purchase price, including direct and indirect charges incurred to prepare the inventory for sale or production.
The value of inventories is measured using the weighted average cost method, taking into account the following parameters:
| * | Inventories of oil produced by the Company, at average production cost; |
| * | Crude oil purchases, at acquisition costs, including transportation and delivery costs incurred; |
| * | Inventory of finished products, at total production costs; |
| * | Work in progress inventory, at production costs; and |
| * | Raw materials inventory, at weighted average cost. |
Raw materials and supplies in joint ventures are controlled by the operator and reported in a joint account at the acquisition cost (recorded in the original currency at average costs). Inventory consumption is charged to the joint venture as a cost, expense or investment, as appropriate.
Furthermore, inventories are valued at market cost or average cost, whichever is lower, and in-transit inventories are valued at actual cost incurred. At the end of the fiscal year allowances are calculated to take into account impairment, obsolescence, excess, or loss of market value.
| (k) | Property, plant and equipment and depreciation |
Property, plant and equipment are recorded at historical cost, which includes: a) asset acquisition, construction and start-up costs; b) financial expenses and exchange differences on liabilities incurred in foreign currency from their acquisition up until commissioning of the asset; c) for assets acquired with specific debt, financial revenues from the unused portion of financial obligations acquired to finance the investment projects; and d) adjustments for inflation accumulated up until December 31, 2001.
When an asset is sold or retired, the adjusted cost and accumulated depreciation are written off and any gain or loss is recorded in the year’s results.
Depreciation is calculated on the total acquisition cost using the straight-line method, based on the assets’ useful life, which is reviewed periodically. Annual depreciation rates are:
| % | ||||
| Buildings and pipelines | 5 | |||
| Plant and equipment | 10 | |||
| Transportation equipment | 20 | |||
| Computer equipment | 33.3 | |||
| F-14 |
Ecopetrol S.A. and Subsidiaries
Notes to the Consolidated Financial Statements
Years ended December 31, 2014, 2013 and 2012
(Expressed in millions of Colombian pesos)
Disbursements for maintenance and repairs are recorded as expenses. Significant disbursements that improve efficiency of an asset or extend its useful life are capitalized as an increase in the value of that asset.
The value of property, plant and equipment is subject to periodic update by comparing the net book value with the value determined through technical appraisals. When the value of an asset’s technical appraisal is greater than its net book value, the difference is recorded as an asset valuation and credited to the surplus account for equity valuation; for the opposite scenario, it is recorded as an allowance for devaluations and charged to results.
The allowance for devaluations of assets constructed up until 2007 is recorded and charged to the valuation surplus in accordance with accepted accounting principles.
Upon termination of a partnership contract, the Group receives, at no cost, the property, plant and equipment and materials. This transaction does not affect the Group´s results. The results of technical appraisals of property, plant and equipment are recorded as valuations in the respective asset and equity accounts.
| (l) | Natural and environmental resources |
The Group follows the successful efforts method of accounting for investments in exploration and production or development. Expenses for geological, geophysical, and seismic studies are recorded as expenses as they are incurred.
Acquisition and exploration costs are capitalized until it is determined whether the exploration drilling was successful or not. If it is not successful, all of the costs incurred are charged to expenses. When a project is approved for development, the accumulated value of the acquisition and exploration costs are classified in the oil investment account, including financial expenses and the exchange difference on attributable financial obligations and field abandonment costs. Asset and liability balances related to asset retirement costs are updated annually. Production and support equipment is accounted for on a historical cost basis and is included in property, plant and equipment subject to depreciation.
Oil investments are amortized by applying the amortization factor based on technical units of production and proven developed reserves per field, after royalties, estimated as of December 31 of the immediately preceding year. The amortization charged to results is adjusted at the end of December, recalculating the DD&A (Depletion, Depreciation and Amortization) as of January 1 of the current year, based on the reserve study updated at the end of the current year.
Oil investments are reviewed for possible impairment in their recoverable value when events or changes in circumstances indicate that their book value may be impaired. If circumstances require an oil or gas asset to be tested for possible loss, the Company will compare the expected undiscounted cash flows of the assets with their book value. If the asset’s book value is not recoverable from undiscounted future cash flows, an allowance is recorded in the amount by which the book value exceeds its fair value.
In the same way that it receives property, plant and equipment upon termination of a partnership contract, Ecopetrol receives, at no cost, the associate´s percentage share on amortizable oil investments that were an associate’s property.
Ecopetrol has established a corporate process for reserves led by the Reserves Corporate Management, which reports directly to the Vice-President Corporate Finance. The reserves are audited by internationally recognized external consultants and approved by the Company’s Board of Directors. Proven reserves consist of the estimated quantities of crude oil and natural gas demonstrated with reasonable certainty by geological and engineering data to be recoverable in future years from known reserves under existing economic and operating conditions, that is, at the prices and costs that apply at the date of the estimate.
Estimating hydrocarbon reserves is subject to several uncertainties inherent in determining proven reserves, including the production recovery rates, the timeliness in making the investments to develop oilfields and the degree of maturity of fields.
When a well located in an exploration area is determined to have no proven reserves, it is classified as a dry well or non-commercial well and its accumulated costs are recorded as an expense in the same year during which such determination is made.
Since Ecopetrol became an issuer on the Colombian Stock Exchange (Bolsa de Valores de Colombia - BVC) and the New York Stock Exchange - NYSE, the Company has applied the methodology approved by the SEC (Securities Exchange Commission) for estimating reserves.
In accordance with the provisions of Resolution 494 of December 22, 2009, issued by the National Hydrocarbons Agency (ANH, Agencia Nacional de Hidrocarburos), Ecopetrol is in compliance with the release of information to the ANH using the SEC methodology. Reserves contained in the reports are audited by three independent specialized firms.
| F-15 |
Ecopetrol S.A. and Subsidiaries
Notes to the Consolidated Financial Statements
Years ended December 31, 2014, 2013 and 2012
(Expressed in millions of Colombian pesos)
| (m) | Deferred charges |
Deferred charges include: i) deferred income tax and deferred income tax for equality - CREE generated by temporary differences between the basis for determining accounting income and taxable income in the current year, and which are determined based on the tax rates applicable when said differences are expected to reverse; ii) discounts in issuance of bonds and government securities; and iii) the equity tax, which was amortized up to 2014.
| (n) | Other assets |
Other assets include goodwill, which corresponds to the difference between the purchase value of equity investments in controlled or joint-control entities, and their intrinsic value, which reflects the economic benefits expected to be achieved from the investment, created by brand name, specialized personnel, preferential credit reputation, prestige due to sale of better products and services, favorable location and the expectations of new businesses, among other things.
Goodwill is amortized using the straight-line method over the term for expected recovery of the investment, which is 10 to 18 years. At the close of each accounting period, the Group must evaluate goodwill to determine whether the conditions for the generation of future economic benefits still exist; otherwise, the asset must be impaired. If the carrying value of the equity investment plus the carrying value of goodwill, which includes its historical cost including all price adjustments and amortizations, is greater than the market value, the asset shall, as a result of such difference, be impaired in the related period, with a charge to results, and the reasons for said impairment shall be disclosed.
Intangible assets such as software, licenses and patents are recognized at acquisition, development or production cost. Intangible assets are amortized using the straight-line method over the periods during which the benefits arising from the incurred costs and expenses are expected to occur, or during the term of the legal or contractual coverage of the granted rights.
Assets acquired under financial leases are subject to depreciation in order to recognize the loss of operational capacity due to their use.
Works and improvements on leasehold property or third party property other than property that can be recognized as property, plant and equipment are amortized during the period established in the contract covering the use of such property, or the estimated useful life of the property, whichever is shorter, resulting from additions or improvements made, only when the cost of said works and improvements is not reimbursable.
| (o) | Valuations |
Valuations of assets that are part of equity include:
| a) | Differences between the net carrying value of permanent investments and their intrinsic value or quoted price on the stock exchange. |
| b) | The difference between the net carrying cost of property, plant and equipment and their market value for real estate or the current use value (CUV) for plant and equipment, determined by specialists registered with the Colombian Real Estate Association or by suitable technical personnel, as appropriate. |
The methodology used for plant and equipment appraisals is the current use value (CUV) for running businesses, for the economic valuation of assets, taking into account a facilities’ current conditions and useful life in terms of production capability and ability to generate income.
When the recoverability of the accounting value of oil and gas tangible assets is evaluated, and their accounting value is found to exceed their fair value, the difference is recorded as a decrease in the valuations of said assets and charged against the valuation surplus until the latter has been exhausted. Any additional default is recorded as a loss in the results statement.
It is not mandatory to adjust the value of movable property when its historical value, taken individually, is lower than 35 current monthly legal minimum wages, or of property, plant and equipment located in high risk zones.
| (p) | Financial obligations |
Public credit operations pertain to any actions undertaken or contracts entered into, in compliance with legal regulations governing public credit, to supply the Company with resources, goods and services under specific payment terms such as loans, issue and placement of bonds and public credit securities, and suppliers’ credit.
| F-16 |
Ecopetrol S.A. and Subsidiaries
Notes to the Consolidated Financial Statements
Years ended December 31, 2014, 2013 and 2012
(Expressed in millions of Colombian pesos)
With respect to loans, public credit operations must be recorded for the actual disbursed amount, while bonds and securities placed are recorded at their par value. Issuance costs are carried directly to expenses.
| (q) | Income tax and income tax for equality CREE |
The provision for income tax and income tax for equality (CREE) is calculated by applying the effective tax rate, as of the close of the corresponding fiscal year, on the pre-tax taxable income.
The effect of temporary differences between the basis for determining accounting income and taxable income in the current year is recorded as a deferred tax asset or liability, for both income tax and income tax for equality (CREE) and the corresponding surcharge, as appropriate, provided that there is a reasonable expectation that such differences will be reversed for the deferred tax asset, or sufficient taxable income is generated to recover taxes. Deferred income tax is calculated at the rates established by current legislation.
The determination of the taxable income basis for the withholding of income and related taxes and income tax for equality (CREE) is subject to current regulations in each case.
| (r) | Labor and pension obligations |
Salaries and benefits for Ecopetrol staff are governed by the Collective Labor Agreement 01 of 1977, and in their absence, by the Substantive Labor Code. In addition to the legally mandated benefits, employees are entitled to fringe benefits which are subject to the place of work, type of work, length of service, and basic salary. Annual interest of 12% is recognized on accumulated severance amounts for each employee, and the payment of indemnities is provided for when special circumstances arise that result in the non-voluntary termination of the contract, without just cause, and in periods other than the probationary period.
For pensions, the actuarial calculation includes active employees, as described in the paragraphs below, with indefinite term contracts, pensioners and heirs, for pension, health care and education plans; similarly, it includes pension bonds for temporary employees, active employees and voluntary retirements. Health care and education obligations do not comprise pension liabilities; they are part of benefit obligations.
All social benefits of employees who joined the Company before 1990 are the responsibility of Ecopetrol, without the involvement of any social security entity or institution. The cost of health services for the employee and his/her relatives registered with the Company is determined by means of the mortality table, prepared based on facts occurring during the year. Similarly, Ecopetrol calculates educational allowances according to experience, based on the annual average cost of each business, subdivided in accordance with the type of studies: Pre-school, elementary, high school and university.
For employees who joined the Company subsequent to the entry into effect of Act 50 of 1990, the Company makes periodic contributions for severance payments, pensions and occupational injuries to the funds created for these respective obligations. Similarly, Act 797 of January 29, 2003 determined that Ecopetrol employees who joined the Company as of that date would be subject to the provisions of the General Pension Regime.
Pursuant to Legislative Act 01 of 2005, enacted by the Colombian Congress, the pension regimes excludes the General Social Security System in Colombia expired on July 31, 2010. In accordance with the provisions therein, the Ministry of Social Protection’s judicial pronouncement on the matter and the analysis conducted by Ecopetrol’s labor advisers, it was concluded that those workers who had met the age and continuous or discontinuous service time requirements of the law, the Collective Bargaining Agreement in effect and/or Agreement 01 of 1977, prior to August 1, 2010, had consolidated their right to their pension. It was, however, mandatory for other workers, who were not covered, to join the General Pension System. The pension administrator chosen by the worker (either Colpensiones or Private Pension Fund or whichever may correspond) would be responsible for recognizing and paying the respective pension.
As set out in Decree 941 of 2002, upon approval of the actuarial calculation by the Ministry of Finance in October 2008, and upon approval of the mechanism by the Ministry of Social Protection through the Administration Act of December 29, 2008, the Company partially switched over the value corresponding to monthly pension payments from its pension liabilities, transferring the said liabilities and their underlying amounts to pension-related autonomous equities (PAP, per its acronym in Spanish). The funds transferred, and returns on those funds, cannot be redirected nor can they be returned to the Company until all of the pension obligations have been fulfilled.
The transferred liability corresponds only to pension allowances and pension bonds. The portion relating to health care and education services remains within Ecopetrol’s labor liabilities.
At each period end, Ecopetrol S.A. must review the amount reported by the PAP with respect to the value of the pension liability updated based on the latest actuarial computation. In the event that the equity yields are insufficient to cover 100% of the liability, the Company must recognize an allowance for the difference, which must be funded should the contingency materialize. Ecopetrol remains materially responsible for payment of the pension liabilities.
| F-17 |
Ecopetrol S.A. and Subsidiaries
Notes to the Consolidated Financial Statements
Years ended December 31, 2014, 2013 and 2012
(Expressed in millions of Colombian pesos)
Through Resolution 1555 of July 30, 2010, the Superintendence of Finance replaced the mortality tables used to prepare actuarial calculations and stipulated that the effects of the change could be recognized gradually. Subsequently, Decree 4565 of December 7, 2010 modified the accounting standards for amortization of the actuarial calculation in effect up to that date. Pursuant to the new decree, the companies that had amortized 100% of their actuarial calculation at December 31, 2009 could gradually amortize the increase in the actuarial calculation for 2010 using the new mortality tables, up to 2029.
Given the above, in 2010 Ecopetrol modified its accounting policy for amortization of the actuarial calculation of monthly pension payments, pension quotas and bonds (transferred liabilities) and health bonds, and adopted a five-year term to amortize the increase in the 2010 actuarial calculation. At the end of December 2014, the corresponding liabilities are fully amortized.
| (s) | Advances received from Ecogas to cover BOMT (Build, Operate, Maintain and Transfer) obligations |
Pursuant to the sale of Ecogas by the National Government, and following specific instructions from CGN, the Company recorded as deferred income the net present value of the future payment scheme in connection with Ecopetrol’s debt toward BOMT contractors. These liabilities are due in 2017, the year when the contract obligations will be fulfilled.
| (t) | Hydrocarbon purchases |
The Company purchases hydrocarbons that the ANH receives from all production in Colombia, at prices established according to section four of Law 756 of 2002 and Resolution 18-1709 of 2003 of the Ministry of Mines and Energy, taking into account international reference prices.
Hydrocarbons are also purchased from partners and other producers in Colombia and abroad to meet the Group’s needs and operating plans.
| (u) | Revenue recognition |
Revenue from crude oil and natural gas sales is recognized at the time of transfer of title to the buyer, including risks and rewards. In the case of refined and petrochemical products, revenue is recognized when products are shipped by the refinery and subsequently adjusted in accordance with the volumes actually delivered. Revenue from transportation services is recognized when products are transported and delivered to the buyer in accordance with sale terms. In other cases, revenue is recognized at the time it is earned and a true, probable and quantifiable right to demand its payment arises.
Under current regulations, Ecopetrol and Refinería de Cartagena S.A, sell at a regulated price, and the National Government recognizes for the Company the amount of the subsidy on regular gasoline and diesel granted to local consumers, which is generated by adding the difference between the producer’s regulated revenues and the parity price; the latter is equivalent to the opportunity cost of the local product or to the import cost of gas or ACPM at the U.S. Gulf Coast reference price. Decree 1880 of September 2014 and Resolution 180522 of 2010, issued by the Ministry of Mines and Energy, regulate the procedure for recognizing subsidies in the event that they exist.
| (v) | Cost of sales and expenses |
Costs are recognized at their historic value both for goods purchased for sale and for the accumulated production costs of goods produced and services rendered. Costs are disclosed according to the operation generating them.
Expenses correspond to the amounts required for the development of ordinary activities and include those related to activities caused by extraordinary events. Expenses are disclosed in accordance with their nature and the occurrence of extraordinary events.
Costs and expenses are recognized upon receipt of goods or services or when there is certainty that the economic event will occur. Fuel shortages and losses due to theft and explosions are recorded as non-operating expenses.
| (w) | Abandonment of fields |
The Group recognizes an estimated liability for future environmental obligations, and its contra entry is a higher value for natural resource and environmental assets. The estimate includes the cost of plugging and abandoning wells, dismantling facilities and the environmental recovery of areas and wells. Amortization is recorded as production costs, using the technical units-of-production method, based on remaining proved developed reserves. Changes resulting from new estimates of liability for abandonment and environmental restoration are accounted for under the corresponding asset.
| F-18 |
Ecopetrol S.A. and Subsidiaries
Notes to the Consolidated Financial Statements
Years ended December 31, 2014, 2013 and 2012
(Expressed in millions of Colombian pesos)
Depending on the scope of certain partnership contracts, field abandonment costs are taken on by partners according to the same participation percentages set out in each contract. Ecopetrol has not allocated funds to cover these obligations, with the exception of the Casanare, Orocue, Garcero, Estero, Corocora, Monas, Guajira, Tisquirama, Cravo Norte and Opon partnership contracts; however, as activities linked to field abandonment take place, they will be covered by the Group.
| (x) | Accounting for contingencies |
On the date of issuance of these consolidated Financial Statements, conditions might exist that could result in losses for the Company that will only be known if specific future circumstances arise. The nature, probability of such situations, and the amounts involved are evaluated by Management, the Vice-President of Legal Affairs, and legal consultants, so that decisions can be made regarding changes to amounts provisioned and/or disclosed. This analysis includes current legal suits against the companies of the Group.
For the assessment of the contingencies lawsuits and arbitrations filed against Ecopetrol, a methodology is established based on procedural risk indicators, strength of lawsuits, sufficiency of evidences, strength of contestation, and case law background.
| (y) | Memorandum accounts |
Creditor and debtor memorandum accounts represent the estimated value of facts or circumstances that could affect the Company’s financial, economic, social and environmental situation. They also disclose the value of the goods, rights and obligations that require control, the amount of the claims on litigations and lawsuits of uncertain resolution, and differences between accounting information and the information used for tax purposes, among others.
| (z) | Net earnings per share |
Net earnings per share is calculated based on net earnings for the year, divided by the weighted average number of subscribed shares in circulation.
The Company does not have share-based employee incentive plans.
| (aa) | Transition to International Accounting Standards |
On December 29, 2012, the Ministry of Commerce, Industry and Tourism issued Decree 2784, and on December 27, 2013, said entity issued Decrees 3023 and 3024, regulating Law 1314 of 2009 setting forth the technical regulatory framework for preparers of financial information that comprise group 1: security issuers, public interest entities and large entities that meet certain parameters as defined by said provisions.
This technical framework was prepared based on International Financial Reporting Standards (IFRS), International Accounting Standards (IAS); SIC interpretations, IFRIC interpretations and the conceptual framework for financial information, issued in Spanish on January 1, 2012, by the International Accounting Standards Board (IASB).
According to the implementation schedule, 2013 was a preparation period to define implementation plans, and 2014 was a transition period toward full adoption of the new regulatory framework in 2015, which requires the preparation of an opening statement of Financial Position as at January 1, 2014, under the new standards, so as to accomplish the transition during 2014, with the simultaneous application of current and new accounting standards.
The last official financial statements prepared in accordance with the accounting rules and principles of the Colombian Public Accounting Regime correspond to the period ended December 31, 2014, and the first financial statements under the new standards will correspond to 2015, which require a comparison with transition information for 2014.
| F-19 |
Ecopetrol S.A. and Subsidiaries
Notes to the Consolidated Financial Statements
Years ended December 31, 2014, 2013 and 2012
(Expressed in millions of Colombian pesos)
| (2) | Assets and liabilities denominated in foreign currency |
Transactions and balances in foreign currency are converted at the representative market exchange rate certified by the Superintendence of Finance of Colombia.
As of December 31, 2014 and December 31, 2013, the consolidated financial statements include the following assets and liabilities denominated in foreign currency (converted to Colombian pesos at the closing exchange rates of $2,392.46 and $1,926.83 per US$1, respectively).
| 2014 | 2013 | |||||||||||||||
| Thousands of dollars | Equivalent millions of pesos | Thousands of dollars | Equivalent millions of pesos | |||||||||||||
| Assets | ||||||||||||||||
| Cash and cash equivalents | 2,088,438 | 4,996,504 | 1,814,012 | 3,495,293 | ||||||||||||
| Investments | 434,825 | 1,040,302 | 1,177,758 | 2,269,340 | ||||||||||||
| Accounts and notes receivable | 1,477,837 | 3,535,666 | 2,222,269 | 4,281,935 | ||||||||||||
| Advances and deposits | 153,979 | 368,390 | 143,544 | 276,584 | ||||||||||||
| Other assets | 143,596 | 343,547 | 470,659 | 906,878 | ||||||||||||
| 4,298,675 | 10,284,409 | 5,828,242 | 11,230,030 | |||||||||||||
| Liabilities | ||||||||||||||||
| Financial obligations | 11,945,733 | 28,579,688 | 7,814,330 | 15,056,886 | ||||||||||||
| Accounts payable | 1,581,418 | 3,783,480 | 1,546,046 | 2,978,968 | ||||||||||||
| Estimated liabilities and provisions | 201,652 | 482,446 | 206,443 | 397,781 | ||||||||||||
| Other liabilities | 187,478 | 448,535 | 247,447 | 476,790 | ||||||||||||
| 13,916,281 | 33,294,149 | 9,814,268 | 18,910,425 | |||||||||||||
| Net liability position | (9,617,606 | ) | (23,009,740 | ) | (3,986,027 | ) | (7,680,394 | ) | ||||||||
The net liability position in 2013 were adjusted relative to the previous year's report, to display the values of financial liabilities and investments in foreign currency shown in the respective–Note 4–Investments and Note 14–Financial obligations from our financial statements. This change has no impact on the Company's reported net income or shareholders' equity.
| (3) | Cash and cash equivalents |
The balance of cash and cash equivalents as of December 31, is comprised as follows:
| 2014 | 2013 | |||||||
| Banks and corporations (1) | 5,549,330 | 6,440,081 | ||||||
| Fixed-term deposit certificates | 1,384,183 | 906,106 | ||||||
| Special funds (2) | 1,016,938 | 1,494,760 | ||||||
| Cash | 750 | 491 | ||||||
| 7,951,201 | 8,841,438 | |||||||
| (1) | Includes advances made by partners for the exclusive use of the joint venture, in the amount of $148,425 (2013 – $95,916 and the Group’s own resources of $5,400,905 (2013 $6,344,165). |
| (2) | Includes foreign currency in the amount of $655,138 (2013 - $960,575) and special funds in pesos in the amount of $1,758 (2013 – $73,741) and other investments for $360,042 (2013 $460,444). |
| F-20 |
Ecopetrol S.A. and Subsidiaries
Notes to the Consolidated Financial Statements
Years ended December 31, 2014, 2013 and 2012
(Expressed in millions of Colombian pesos)
| (4) | Investments |
The balance of investments as of December 31, is comprised as follows:
| 2014 | 2013 | |||||||
| Current | ||||||||
| Variable yield – Shares (1) | 223,925 | 223,925 | ||||||
| Fixed yield | ||||||||
| Term deposits | 248,273 | 954,705 | ||||||
| Bonds and securities of private or foreign entities | 173,286 | 260,991 | ||||||
| Bonds issued by the Colombian Government | 40,599 | 153,343 | ||||||
| Specific purpose fund – legal contingencies (2) | 187,509 | 110,427 | ||||||
| Treasury securities – TES | 99,705 | - | ||||||
| Hedging financial instruments | 113,752 | 179,725 | ||||||
| Trust rights | 153 | 119 | ||||||
| Other investments | 237 | - | ||||||
| Total fixed yield | 863,514 | 1,659,310 | ||||||
| Total current | 1,087,439 | 1,883,235 | ||||||
| Non-current | ||||||||
| Variable yield – Shares (1) | 1,125,147 | 995,819 | ||||||
| Fixed yield | ||||||||
| Bonds and securities of foreign entities | 106,313 | 13,981 | ||||||
| Bonds issued by the Colombian Government | 13,624 | 86,616 | ||||||
| Specific purpose fund – legal contingencies (2) | 360,903 | 260,960 | ||||||
| Other investments | - | 6,296 | ||||||
| Total fixed yield | 480,840 | 367,853 | ||||||
| Total non-current | 1,605,987 | 1,363,672 | ||||||
| (1) | The National Government approved the shares disposal program for shares held by Ecopetrol in Empresa de Energía de Bogotá S.A. E.S.P. corresponding to 6.87% (631,098,000 shares). Similarly, the Company’s Board of Directors approved to start the process of disposal for all or part of the equity participation at Interconexión Eléctrica S.A. – ISA, corresponding to 5.32% (58,925,480 shares). The account balance as of December 31, 2014 and 2013 amounts to $154,376 for Empresa de Energía de Bogotá S.A. E.S.P and $69,549 for Interconexión Eléctrica S.A. Corresponding balances as of December 31, 2013, were reclassified for purposes of comparison with 2014 |
| (2) | Corresponds to restricted resources made up of fixed yield investments entered into based on the court rulings linked to the Derecho Comuneros – Santiago de las Atalayas and Pueblo Viejo de Cusiana proceedings, with regard to the attachment and seizure of royalty payments that Ecopetrol was to have paid pursuant to Royalty Contracts Nos. 15, 15A, 16 and 16A, declared null by statute in the State Council ruling of September 13, 1999. |
The following is a breakdown of the variable yield investments at December 31, 2014 and December 31, 2013:
| 2014 | 2013 | |||||||
| Companies: | ||||||||
| Significant influence | 1,112,842 | 982,847 | ||||||
| Non-strategic | 236,247 | 236,897 | ||||||
| Less – Investment protection allowance | (17 | ) | - | |||||
| Total | 1,349,072 | 1,219,744 | ||||||
| F-21 |
Ecopetrol S.A. and Subsidiaries
Notes to the Consolidated Financial Statements
Years ended December 31, 2014, 2013 and 2012
(Expressed in millions of Colombian pesos)
A summary of long-term investments as of December 31, 2014, recognized by the equity method, is as follows:
| Company | Number of Shares and/or Quotas | Percentage of ownership | Valuation date | Historical cost | Book value | Equity Method Effect | ||||||||||||||||
| Significant Influence | ||||||||||||||||||||||
| Ecodiesel Colombia S. A. | 10,500,000,000 | 50 | December | 10,500 | 38,984 | 28,484 | ||||||||||||||||
| Invercolsa S. A. | 1,213,801,146 | 43.35 | November | 61,671 | 223,481 | 161,810 | ||||||||||||||||
| Offshore International Group | 250 | 50 | December | 396,627 | 801,731 | 405,104 | ||||||||||||||||
| Sociedad Portuaria | 349,992 | 50 | November | 649 | 693 | 44 | ||||||||||||||||
| Serviport S. A. | 58,800,000 | 49 | December | 2,081 | 8,382 | 6,301 | ||||||||||||||||
| Transgas | 27,372,771 | 20 | November | 4,051 | 39,571 | 35,520 | ||||||||||||||||
| Total | 475,579 | 1,112,842 | 637,263 | |||||||||||||||||||
A summary of long-term investments as of December 31, 2013, recognized using equity method, is as follows:
| Company | Number of Shares and/or Quotas | Percentage of ownership | Valuation date | Historical cost | Book value | Equity Method Effect | ||||||||||||||||
| Significant Influence | ||||||||||||||||||||||
| Ecodiesel Colombia S. A. | 10,500,000,000 | 50 | December | 10,500 | 26,677 | 16,177 | ||||||||||||||||
| Invercolsa S. A. | 1,213,801,146 | 43.35 | December | 61,671 | 269,342 | 207,671 | ||||||||||||||||
| Offshore International Group | 250 | 50 | December | 319,434 | 637,778 | 318,344 | ||||||||||||||||
| Serviport S. A. | 58,800,000 | 49 | December | 2,081 | 7,319 | 5,238 | ||||||||||||||||
| Transgas | 27,372,771 | 20 | October | 4,051 | 41,731 | 37,680 | ||||||||||||||||
| Total | 397,737 | 982,847 | 585,110 | |||||||||||||||||||
A summary of long-term investments as of December 31, 2014, recognized by the cost method, is as follows:
| Company | Number of Shares and/or Quotas | Participation Percentage | Valuation Date | Historical Cost | Market/ intrinsic value | Appreciation/ depreciation | ||||||||||||||||
| STRATEGIC | ||||||||||||||||||||||
| Zona Franca de Cartagena S,A, | 290 | 10 | November | 392 | 1,737 | 1,345 | ||||||||||||||||
| Sociedad Portuaria del Dique | 200 | 1 | November | 5 | 35 | 30 | ||||||||||||||||
| Los Arces Group (1) | 10,001 | 100 | December | 5,100 | 5,100 | - | ||||||||||||||||
| Amandine Holding (1) | 500 | 100 | December | 6,657 | 6,657 | - | ||||||||||||||||
| 12,154 | 13,529 | 1,375 | ||||||||||||||||||||
| NON STRATEGIC | ||||||||||||||||||||||
| Empresa de Energía de Bogotá | 631,098,000 | 6.87 | December | 154,376 | 1,072,867 | 918,491 | ||||||||||||||||
| Interconexión Eléctrica S. A. | 58,925,480 | 5.32 | December | 69,549 | 509,944 | 440,395 | ||||||||||||||||
| Concentra Inteligencia en Energía S.A.S. | 168,000 | 9.52 | November | 168 | 149 | (19 | ) | |||||||||||||||
| 224,093 | 1,582,960 | 1,358,867 | ||||||||||||||||||||
| 236,247 | 1,596,489 | 1,360,242 | ||||||||||||||||||||
| (1) | The companies Los Arces Group and Amandine Holding in which Ecopetrol holds 100% share through Bioenergy S. A., are not consolidated because they are in a winding-up process. |
| F-22 |
Ecopetrol S.A. and Subsidiaries
Notes to the Consolidated Financial Statements
Years ended December 31, 2014, 2013 and 2012
(Expressed in millions of Colombian pesos)
A summary of long-term investments as of December 31, 2013, recognized by the cost method, is as follows:
| Company | Number of Shares and/or Quotas | Participation Percentage | Valuation Date | Historical Cost | Market/ intrinsic value | Appreciation/ depreciation | ||||||||||||||||
| STRATEGIC | ||||||||||||||||||||||
| Zona Franca de Cartagena S.A. | 290 | 10 | November | 394 | 1,478 | 1,084 | ||||||||||||||||
| Sociedad Portuaria del Dique | 200 | 1 | November | 5 | 44 | 39 | ||||||||||||||||
| Sociedad Portuaria Olefinas | 249,992 | 50 | November | 649 | 1,462 | 813 | ||||||||||||||||
| Los Arces Group | 10,001 | 100 | December | 5,100 | 5,100 | - | ||||||||||||||||
| Amandine Holding | 500 | 100 | December | 6,657 | 6,657 | - | ||||||||||||||||
| 12,805 | 14,741 | 1,936 | ||||||||||||||||||||
| NON-STRATEGIC | ||||||||||||||||||||||
| Empresa de Energía de Bogotá | 631,098,000 | 6.87 | December | 154,375 | 968,736 | 814,361 | ||||||||||||||||
| Interconexión Eléctrica S. A. | 58,925,480 | 5.32 | December | 69,549 | 536,222 | 466,673 | ||||||||||||||||
| Concentra Inteligencia en Energía S.A,S. | 168 | 9.52 | November | 168 | 150 | (18 | ) | |||||||||||||||
| 224,092 | 1,505,108 | 1,281,016 | ||||||||||||||||||||
| 236,897 | 1,519,849 | 1,282,952 | ||||||||||||||||||||
Restrictions on long-term investments – variable yield:
As of January 10, 2015, regarding the legal proceedings of Invercolsa S.A.: The cessation extraordinary appeal put forth by AFIB S.A. and Fernando Londoño Hoyos against the sentence of the Superior Court of the Judicial District of Bogota – Civil Chamber, on January 11, 2011 and confirming the first instance sentence issued by the 28th Civil Circuit Court on February 8, 2007 have been submitted to the civil chamber of the Supreme Court of Justice. The following proceedings were had during the processing of the aforementioned extraordinary appeal: i) On October 6, 2014, transfer was set for Explotaciones Cóndor S.A., and South American Gula Oil Company –Sagoc, which expired on October 27, 2014; ii) On October 22, 2014, the legal representative of the aforementioned companies, Jorge Buitrago, filed the defence to the aforementioned claim; and, iii) On January 28, 2015, transfers expire and shall be submitted to the Reporting Judge for resolution.
The appeal sentence of January 11, 2011 ordered: i) That the purchase of 145 million shares of Invercolsa by Fernando Londoño Hoyos are to be cancelled; ii) that the cancellation of the said transaction is to be recorded in the shareholders’ book, including the pledge in favor of the Pacífico Colombia y Panamá banks, as well as the payment in kind of the shares of Arrendadora Financiera Internacional Bolivariana S.A.; iii) that Fernando Londoño Hoyos and AFIB are forced to return the Invercolsa dividends, along with the new shares received as profit and/or revaluations; iv) to declare that Fernando Londoño Hoyos did not acquire or possess in good faith the 145 million Invercolsa shares; and v) that Invercolsa is to adjust its operation and the Shareholders’ meeting to the declarations made in the sentence.
The economic activity for the entities in which Ecopetrol Group has direct investments through the equity method is as follows:
| Company | Economic activity | |
| Invercolsa S. A. | Investments in companies in the energy sector, including activities specific to the hydrocarbon and mining industry and trade. | |
| Ecodiesel Colombia S. A. | Production, marketing and distribution of biofuels and oleo chemicals. | |
| Offshore International Group | Hydrocarbon exploration, development, production and processing. | |
| Serviport | Services for oil-vessel loading and unloading support; supply of equipment for the same purpose; technical inspections and loading measurements. | |
| Transgas de Occidente | Transportation of fuel gas through the construction, operation and maintenance of transportation systems and subsystems. |
| F-23 |
Ecopetrol S.A. and Subsidiaries
Notes to the Consolidated Financial Statements
Years ended December 31, 2014, 2013 and 2012
(Expressed in millions of Colombian pesos)
Maturity of fixed-yield investments – non-current
The following is a summary showing the maturity of non-current fixed-yield investments as of December 31, 2014:
| Maturity | >1 - 3 Years | > 5 Years | Total | |||||||||
| Bonds and other fiering securities | 106,312 | - | 106,312 | |||||||||
| Bonds issued by the Colombian Government | 13,625 | - | 13,625 | |||||||||
| Specific destination fund | 336,134 | 24,769 | 360,903 | |||||||||
| 456,071 | 24,769 | 480,840 | ||||||||||
The following is a summary showing the maturity of non-current fixed-yield investments as of December 31, 2013:
| Maturity | >1 - 3 Years | < 5 Years | > 5 Years | Total | ||||||||||||
| Bonds and other fiering securities | 8,251 | 5,730 | - | 13,981 | ||||||||||||
| Bonds issued by the Colombian Government | - | 86,616 | - | 86,616 | ||||||||||||
| Specific destination fund | 217,011 | 1,994 | 41,955 | 260,960 | ||||||||||||
| Others | - | 6,296 | - | 6,296 | ||||||||||||
| 225,262 | 100,636 | 41,955 | 367,853 | |||||||||||||
| (5) | Accounts and notes receivable, net |
The balance of accounts and notes receivable, net, as of December 31, is comprised as follows:
| 2014 | 2013 | |||||||
| Current portion | ||||||||
| Customers | ||||||||
| Domestic | 1,197,370 | 1,121,881 | ||||||
| Foreign | 1,717,447 | 2,943,686 | ||||||
| Price differential to be received from the Ministry of Mines and Energy (1) | 750,055 | 1,058,738 | ||||||
| Various debtors | 358,526 | 988,904 | ||||||
| Reimbursements and yields on investments | 83 | 439 | ||||||
| Accounts receivable from employees | 21,878 | 23,821 | ||||||
| Doubtful accounts | 9,544 | 1,527 | ||||||
| Industrial service clients | 19,337 | 14,594 | ||||||
| Employee loans (2) | 43,884 | 50,844 | ||||||
| Total | 4,118,124 | 6,204,434 | ||||||
| Less – Allowance for doubtful accounts | (9,070 | ) | (27,543 | ) | ||||
| Total current | 4,109,054 | 6,176,891 | ||||||
| Non-current portion | ||||||||
| Domestic | 155,134 | 5,664 | ||||||
| Foreign | 16,530 | 2,506 | ||||||
| Employee loans (2) | 455,637 | 393,158 | ||||||
| Price differential to be received from the Ministry of Mines and Energy (1) | 77,510 | 77,510 | ||||||
| Credit portfolio | 1,349 | 10,227 | ||||||
| Others | 151,470 | 32,195 | ||||||
| Doubtful accounts | 239,455 | 227,372 | ||||||
| Total | 1,097,085 | 748,632 | ||||||
| Less – Allowance for doubtful accounts | (239,455 | ) | (228,576 | ) | ||||
| Total Non-current | 857,630 | 520,056 | ||||||
| F-24 |
Ecopetrol S.A. and Subsidiaries
Notes to the Consolidated Financial Statements
Years ended December 31, 2014, 2013 and 2012
(Expressed in millions of Colombian pesos)
The following shows the changes in the allowance for doubtful accounts:
| 2014 | 2013 | 2012 | ||||||||||
| Opening balance | 256,119 | 236,755 | 138,673 | |||||||||
| Additions (new allowances) | 3,332 | 31,681 | 88,441 | |||||||||
| Recovery of allowances | (251 | ) | (2,716 | ) | (5,945 | ) | ||||||
| Accounts receivable write-off | (22,871 | ) | (255 | ) | (78 | ) | ||||||
| Use of allowances | 12,196 | (9,346 | ) | 14,461 | ||||||||
| Closing balance | 248,525 | 256,119 | 235,552 | |||||||||
| (1) | Account receivable from the Ministry of Finance and Public Credit, arising from the regular motor gasoline and diesel price differential pursuant to Resolution 180522 issued on March 29, 2010. The Ministry makes the payment in consideration of the resolution for the net liquidation position in favor of Ecopetrol for months with pending payments, which has been historically emitted annually. |
| (2) | The administration, management and control of loans granted to employees by Ecopetrol were transferred to Cavipetrol, which, in its capacity as administrator, monitors, in its database and financial system, the details per employee of said loans and their respective conditions. |
Future collections of accounts receivable from Cavipetrol as of December 31, 2014 are estimated as follows:
| Maturity | Amount | |||
| 2015 | 43,847 | |||
| 2016 | 17,638 | |||
| 2017 | 18,662 | |||
| 2018 and beyond | 399,231 | |||
| 479,378 | ||||
As of December 31, 2014 there are loans made to employees of Equión amounting to $10,700, Hocol amounting to $8,724; Propilco, $605; Comai, $66; Ecopetrol Oleo e Gas do Brasil Ltda. $11; and Others by $37.
| (6) | Inventories, net |
The balance of inventories, net, as of December 31, is comprised as follows:
| 2014 | 2013 | |||||||
| Finished products | ||||||||
| Crude oil | 664,539 | 1,179,509 | ||||||
| Fuels | 928,666 | 895,384 | ||||||
| Petrochemicals | 131,793 | 87,024 | ||||||
| Purchased products | ||||||||
| Fuels | 102,796 | 124,269 | ||||||
| Crude oil | 310,085 | 419,203 | ||||||
| Petrochemicals | 25,515 | 21,790 | ||||||
| Agricultural Products | 1,625 | 869 | ||||||
| Raw materials | ||||||||
| Crude oil | 101,345 | 31,854 | ||||||
| Petrochemicals | 48,815 | 36,985 | ||||||
| Agricultural Products | 681 | |||||||
| Products in process | ||||||||
| Fuels | 747,633 | 362,929 | ||||||
| Petrochemicals | 16,813 | 11,309 | ||||||
| Packaging material | 1,658 | 1,940 | ||||||
| Materials for the production of goods | 19,619 | 483,117 | ||||||
| Materials in transit | 61,456 | 79,746 | ||||||
| Total | 3,163,039 | 3,735,928 | ||||||
| Less – Allowance for inventories | (139,536 | ) | (110,024 | ) | ||||
| Total | 3,023,503 | 3,625,904 | ||||||
| F-25 |
Ecopetrol S.A. and Subsidiaries
Notes to the Consolidated Financial Statements
Years ended December 31, 2014, 2013 and 2012
(Expressed in millions of Colombian pesos)
The following shows a breakdown of the changes in the allowance for inventories:
| 2014 | 2013 | 2012 | ||||||||||
| Opening balance | 110,024 | 27,150 | 27,653 | |||||||||
| Allowance increase (decrease) | 29,512 | 82,874 | (503 | ) | ||||||||
| Closing balance | 139,536 | 110,024 | 27,150 | |||||||||
Natural gas imbalance: The Group uses the entitlement method of ownership for gas balancing agreements, through which the quantity of natural gas sold is based upon the shared ownership interest. As of December 31, 2014, the Group showed gas imbalance of $824 (US$ 344,304) in its favor, equivalent to 155,643 MBTU. As of December 31, 2013 the Group showed gas imbalance of $4,142 (US$ 2,064,417) in its favor, equivalent to 516,436 MBTU. The natural gas imbalances are settled through sales or purchases to the partner that are recorded at end of the period.
| (7) | Advances and deposits |
The balance of advances and deposits as of December 31, is comprised as follows:
| 2014 | 2013 | |||||||
| Current portion | ||||||||
| Official entities (1) | 7,223,443 | 7,845,825 | ||||||
| Partners in joint ventures (2) | 749,598 | 388,276 | ||||||
| Customs agents | 584 | 3,587 | ||||||
| Advanced payments to contractors | 5,558 | 12,610 | ||||||
| Agreements (3) | 28,265 | 19,593 | ||||||
| Advances to employees | 933 | 855 | ||||||
| Advances to suppliers | 321,848 | 343,304 | ||||||
| Total current portion | 8,330,229 | 8,614,050 | ||||||
| Non-current portion | ||||||||
| Advances and deposits | 225,197 | 192,613 | ||||||
| Total non-current portion | 225,197 | 192,613 | ||||||
| Total | 8,555,426 | 8,806,663 | ||||||
| (1) | Includes mainly the advances on income tax for the 2014 taxation year of $2,912,685 (2013 – $4,699,415), self-withholdings for income and CREE tax of $1,871,862, (2013 – $1,752,066) and balances in favor of VAT (IVA) of $1,299,007 (2013 – $1,394,344), among others. |
| F-26 |
Ecopetrol S.A. and Subsidiaries
Notes to the Consolidated Financial Statements
Years ended December 31, 2014, 2013 and 2012
(Expressed in millions of Colombian pesos)
| (2) | The following shows a breakdown of the advances and deposits with partners in joint operations: |
| 2014 | 2013 | |||||||
| Partners in contracts for which Ecopetrol is not the operator | ||||||||
| Meta Petroleum Ltd. | 172,223 | 39,787 | ||||||
| Occidental de Colombia Inc. | 24,303 | 26,907 | ||||||
| Perenco Colombia Limited | 61,173 | 25,721 | ||||||
| Petrobras Colombia Limited | 51,358 | 21,770 | ||||||
| Repsol Exploración Colombia S. A. | 12,517 | 16,166 | ||||||
| Anadarko Colombia Company | - | 15,245 | ||||||
| Emerald Energy PLC Suc Colombia | 5,149 | 13,375 | ||||||
| Vanco Energy | - | 7,352 | ||||||
| Mansarovar Energy Colombia Ltd. | 46,199 | 6,744 | ||||||
| Occidental Andina Llc | 247 | 5,559 | ||||||
| CEPSA Colombia S. A. | 6,386 | 4,484 | ||||||
| Petrosantander Colombia Inc. | 3,584 | 4,182 | ||||||
| Petroleos del Norte S. A. | 15,041 | 3,822 | ||||||
| Chevron Petroleum Company | 169 | 2,698 | ||||||
| Anadarko Petroleum Corporation | 28,095 | 275 | ||||||
| Petrobras Energía Perú S. A. | - | 181 | ||||||
| Petrobras Internacional Braspetro B.V. | 42,324 | 127 | ||||||
| Talisman Perú BV, Sucursal del Perú | - | 111 | ||||||
| Talisman Colombia Oil & Gas Ltd | 1,023 | - | ||||||
| Petrominerales | - | 78 | ||||||
| Maurel et Prom Colombia B.V. | (71 | ) | - | |||||
| Lewis Energy Colombia | 2,403 | - | ||||||
| Other operations | 12,080 | 10,546 | ||||||
| Pacific Stratus energy Colombia Ltda. | 6,707 | - | ||||||
| Total E&P Colombie Sucursal Colombia | 1,705 | - | ||||||
| Petroleos Brasilerios S. A. | 209 | - | ||||||
| Repsol Sinopec | 608 | - | ||||||
| Partners in contracts for which Ecopetrol is the operator: | ||||||||
| Bloque CPO-9 | 115,156 | 89,962 | ||||||
| La Cira | 40,839 | 23,712 | ||||||
| Crudos Pesados Bloque CPE-4 | 14,149 | 19,137 | ||||||
| Oleoducto Caño Limón | 17,460 | 16,360 | ||||||
| Acuerdo operación TLU-3 | 22,074 | 10,028 | ||||||
| Crudos Pesados Bloque CPE-2 | 5,189 | 8,816 | ||||||
| Acuerdo operación TLU-1 | 25,251 | 5,817 | ||||||
| JOA Caño Sur | 4,001 | 3,838 | ||||||
| DOIMA | 269 | - | ||||||
| San Jacinto y Rio Paez | 383 | - | ||||||
| Oleoducto Alto Magdalena | 31 | - | ||||||
| Tangara | 111 | - | ||||||
| Rio Cabrera | 133 | - | ||||||
| Mundo Nuevo | 273 | - | ||||||
| Other operations | 10,847 | 5,476 | ||||||
| Total | 749,598 | 388,276 | ||||||
| (3) | Represents the resources transferred to workers as an advance for the education plan. |
| F-27 |
Ecopetrol S.A. and Subsidiaries
Notes to the Consolidated Financial Statements
Years ended December 31, 2014, 2013 and 2012
(Expressed in millions of Colombian pesos)
| (8) | Prepaid expenses |
The balance of prepaid expenses as of December 31, is comprised as follows:
| 2014 | 2013 | |||||||
| Insurance (1) | 77,131 | 144,890 | ||||||
| Other (2) | 119,933 | 3,454 | ||||||
| 197,064 | 148,344 | |||||||
| (1) | The amount pending to be amortized mainly consists of Ecopetrol, $55,187; America Inc., $5,218; Oleoducto Bicentenario, $4,804; Ocensa, $2,895; Refinería de Cartagena, $2,638; Cenit, $2,212; and Propilco, $1,998. |
| (2) | It mainly includes subscribed agreements that should be executed in 2015. |
| (9) | Deposits held in trust |
The balance of deposits held in trust as of December 31, is comprised as follows:
| 2014 | 2013 | |||||||
| Pension funds (1) | 329,960 | 314,114 | ||||||
| Securitization Corficolombiana – ODL | 139,688 | 134,015 | ||||||
| Other | 37,532 | 20,665 | ||||||
| Abandonment fund | 1,079 | - | ||||||
| Total | 508,259 | 468,794 | ||||||
| (1) | Corresponds to pension funds administered by the Fiduciaria Bancolombia Trust, received upon termination of the Asociación Cravo Norte contract with Occidental de Colombia. |
| (10) | Property, plant and equipment |
The property, plant and equipment shown below, along with related accumulated depreciation, are under the full ownership and control of the Group. There are no restrictions or pledges on the assets, nor have they been offered as collateral for obligations. As of December 31, they included:
| December 31, 2014 | Adjusted cost | Accumulated depreciation | Allowances (2) | Net cost | Valuation | Net plus Valuation | ||||||||||||||||||
| Plant and equipment | 19,562,381 | (12,377,361 | ) | (153,157 | ) | 7,031,863 | 5,088,700 | 12,120,563 | ||||||||||||||||
| Pipelines, networks and lines | 24,606,294 | (11,722,961 | ) | (55,993 | ) | 12,827,340 | 14,016,404 | 26,843,744 | ||||||||||||||||
| Construction in progress (1) | 24,011,883 | - | - | 24,011,883 | 353,469 | 24,365,352 | ||||||||||||||||||
| Buildings | 5,544,102 | (1,655,479 | ) | (182,805 | ) | 3,705,818 | 1,723,809 | 5,429,627 | ||||||||||||||||
| Equipment on deposit and in transit | 1,586,226 | - | - | 1,586,226 | - | 1,586,226 | ||||||||||||||||||
| Computer equipment | 493,032 | (371,018 | ) | (7,355 | ) | 114,659 | 68,970 | 183,629 | ||||||||||||||||
| Transportation equipment and other assets | 621,210 | (326,144 | ) | (18,637 | ) | 276,429 | 101,392 | 377,821 | ||||||||||||||||
| Land | 929,242 | (1,660 | ) | (8,314 | ) | 919,268 | 3,471,341 | 4,390,609 | ||||||||||||||||
| Operation materials | 202,636 | - | (19,928 | ) | 182,708 | - | 182,708 | |||||||||||||||||
| Total | 77,557,006 | (26,454,623 | ) | (446,190 | ) | 50,656,194 | 24,824,085 | 75,480,279 | ||||||||||||||||
| December 31, 2013 | Adjusted cost | Accumulated depreciation | Allowances (2) | Net cost | Valuation | Net plus valuation | ||||||||||||||||||
| Plant and equipment | 17,412,346 | (10,988,633 | ) | (29,826 | ) | 6,393,887 | 5,144,384 | 11,538,271 | ||||||||||||||||
| Pipelines, networks and lines | 22,155,219 | (10,992,889 | ) | (87,570 | ) | 11,074,760 | 14,588,429 | 25,663,189 | ||||||||||||||||
| Construction in progress | 16,405,380 | - | - | 16,405,380 | - | 16,405,380 | ||||||||||||||||||
| Agricultural plantations | 62,862 | - | - | 62,862 | - | 62,862 | ||||||||||||||||||
| Buildings | 4,370,321 | (1,468,769 | ) | (141,075 | ) | 2,760,477 | 2,231,946 | 4,992,423 | ||||||||||||||||
| Equipment on deposit and in transit | 1,227,278 | - | - | 1,227,278 | - | 1,227,278 | ||||||||||||||||||
| Computer equipment | 552,013 | (391,669 | ) | (5,357 | ) | 154,987 | 38,775 | 193,762 | ||||||||||||||||
| Transportation equipment and other assets | 1,725,372 | (907,123 | ) | (106,157 | ) | 712,092 | 245,422 | 957,514 | ||||||||||||||||
| Land | 1,210,828 | - | (8,358 | ) | 1,202,470 | 3,429,170 | 4,631,640 | |||||||||||||||||
| Operation materials | 171,107 | - | (14,766 | ) | 156,341 | - | 156,341 | |||||||||||||||||
| Total | 65,292,726 | (24,749,083 | ) | (393,109 | ) | 40,150,534 | 25,678,126 | 65,828,660 | ||||||||||||||||
| F-28 |
Ecopetrol S.A. and Subsidiaries
Notes to the Consolidated Financial Statements
Years ended December 31, 2014, 2013 and 2012
(Expressed in millions of Colombian pesos)
Depreciation charged to results of operations in 2014 amounted to $2,248,409 (2013 – $1,982,706).
| (1) | Mainly includes: (i) investments made for the modernization of the Cartagena Refinery in the amount of $13,447,483, in projects for the development of the Castilla, Rubiales, Chicheme fields, modernization projects at the Barrancabermeja Refinery and the master plan for industrial services $5,864,747 ii) capitalized interest on loans and bonds amounting to $930,185 and exchange difference amounting to $3,012,952. Up until 2013, the Company recorded the exchange difference on its financial obligations related to the construction of assets in its results, since they were not significant. |
Starting in 2014, the Company has been reflecting property, plant and equipment construction in progress separately from explorations underway, which partially represents the changes in account balances. Up until that date, explorations underway were reflected together with construction in progress. Corresponding balances as of December 31, 2013 were reclassified for comparison purposes with 2014.
| (2) | The following is a breakdown of the changes in the allowance for property, plant and equipment: |
| 2014 | 2013 | 2012 | ||||||||||
| Opening balance | 393,109 | 563,996 | 1,057,740 | |||||||||
| Additions to new allowances (a) | 126,726 | 54,874 | 315,627 | |||||||||
| Adjustment to existing provisions | (4,162 | ) | (292,396 | ) | 30,590 | |||||||
| Depreciation of assets | (8,087 | ) | (1,364 | ) | (680,128 | ) | ||||||
| (Impairment) recovery | (61,396 | ) | 67,999 | (159,833 | ) | |||||||
| Closing balance | 446,190 | 393,109 | 563,996 | |||||||||
| (a) | Includes $64,762 for allowance related to oil and gas tangible assets which were evaluated for possible loss in their recoverable value. |
Technical appraisals of fixed assets take place every three years in accordance with the stipulations of the Public Accounting Regime. At the close of 2013, the last technical appraisal of assets for the Barrancabermeja Refinery was updated by the T.F. Auditores & Asesores firm.
| (11) | Natural and environmental resources, net |
The balance of natural and environmental resources, net, as of December 31, is comprised as follows:
| 2014 | 2013 | |||||||
| Amortizable oil investments (1) | 46,286,127 | 40,445,485 | ||||||
| Less: Accumulated amortization of oil investments (2) | (26,880,037 | ) | (23,489,999 | ) | ||||
| 19,406,090 | 16,955,486 | |||||||
| Plugging and abandonment, facility dismantling and environmental recovery costs | 6,733,161 | 4,936,316 | ||||||
| Less: Accrued amortization for facility abandonment (2) | (2,858,900 | ) | (2,309,036 | ) | ||||
| 3,874,261 | 2,627,280 | |||||||
| Reservoirs and appraisals | 701,590 | 701,590 | ||||||
| Less: Accumulated depletion | (649,372 | ) | (642,299 | ) | ||||
| 52,218 | 59,291 | |||||||
| Exploration activities (3) | 8,586,014 | 7,429,324 | ||||||
| Total | 31,918,583 | 27,071,381 | ||||||
| Less: – Allowance for natural and environmental resources (4) | (258,408 | ) | - | |||||
| Total | 31,660,175 | 27,071,381 | ||||||
| (1) | As of December 31, 2014, net capital expenditures of natural resources amounted to $8,135,660 (2013 – $6,267,691) represented mainly in the following fields: Castilla, Casabe, Chichimene, Rubiales, Pauto, Caño Sur Este, Quifa, Cusiana, Nare and Akacías CPO-9. Starting in 2014, investments aimed at obtaining incremental production at the Casabe field are reflected as an increase in the value of amortizable oil investments. Up until 2014, said investments were reflected as deferred charges. The balance as of December 31, 2013 was reclassified for comparison purposes. |
| (2) | Total amortization charged to natural resources and facility abandonment results for the year ended December 31, 2014 amounted to $3,288,658 and $538,557, respectively (2013 – $2,865,778 and $220,238, respectively). |
| (3) | Includes mainly explorations in progress of Ecopetrol by $7,258,987 Ecopetrol America Inc $724,091, Hocol Petroleum Limited $322,909, Equion $239,922 and Ecopetrol Oleo & Gas de Brasil $40,103. |
| F-29 |
Ecopetrol S.A. and Subsidiaries
Notes to the Consolidated Financial Statements
Years ended December 31, 2014, 2013 and 2012
(Expressed in millions of Colombian pesos)
| (4) | Allowance for possible loss on assets related to oil and gas activities, resulting from the evaluation based on the estimated fair value of future cash flows of principal oil investments. |
| (12) | Deferred charges |
The balance of deferred charges as of December 31, is comprised as follows:
| 2014 | 2013 | |||||||
| Deferred income tax and deferred tax on CREE | 2,293,571 | 2,112,829 | ||||||
| Other deferred charges, net | 430,605 | 759,606 | ||||||
| 2,724,176 | 2,872,435 | |||||||
| (13) | Other assets |
The balance of other assets as of December 31, is comprised as follows:
| 2014 | 2013 | |||||||
| Goodwill (1) | 1,747,561 | 2,175,084 | ||||||
| Assets acquired under financial leasing | 393,320 | 405,600 | ||||||
| Intangibles (net): (brands, licences, patents and software) | 261,310 | 293,286 | ||||||
| Trust funds (2) | 155,472 | 217,980 | ||||||
| National Royalties Fund (3) | 80,671 | 73,469 | ||||||
| Other assets (4) | 368,595 | 344,400 | ||||||
| Total | 3,006,929 | 3,509,819 | ||||||
| (1) | Goodwill as of December 31, 2014 and 2013 is comprised as follows: |
| Company | Acquisition date | Goodwill amount | Amortized amount | Pending amortization | Amortization period (years) | |||||||||||||
| Propilco S.A. | 07/04/2008 | 176,507 | (77,384 | ) | 99,123 | 17.8 | ||||||||||||
| Andean Chemicals | 07/04/2008 | 205,541 | (88,379 | ) | 117,162 | 17.8 | ||||||||||||
| IPL Enterprises | 17/03/2009 | 880,127 | (263,859 | ) | 616,268 | 15 | ||||||||||||
| Offshore International (a) | 06/02/2009 | 248,635 | (147,691 | ) | 100,944 | 14 | ||||||||||||
| Hocol Petroleum Limited | 27/05/2009 | 742,345 | (251,836 | ) | 490,509 | 16 | ||||||||||||
| Equión Energía Limited | 24/01/2011 | 629,375 | (306,720 | ) | 322,655 | 10 | ||||||||||||
| Bioenergy Zona Franca | 30/08/2008 | 900 | - | 900 | ||||||||||||||
| Total | 2,883,430 | (1,135,869 | ) | 1,747,561 | ||||||||||||||
| (a) | In 2014, the Company recorded a goodwill impairment in Offshore International Group, in the amount of $182,630 (2013 – $229,876) due to the economic evaluation of discounted free cash flows, carried out in accordance with Resolution 145 of 2008, issued by the National Accounting Office. |
| Company | Acquisition date | Goodwill amount | Amortized amount | Pending amortization | Amortization period (years) | |||||||||||||
| Propilco S.A. | 07/04/2008 | 176,507 | (68,370 | ) | 108,137 | 17.8 | ||||||||||||
| Andean Chemicals | 07/04/2008 | 205,541 | (77,729 | ) | 127,812 | 17.8 | ||||||||||||
| IPL Enterprises | 17/03/2009 | 880,127 | (196,631 | ) | 683,496 | 15 | ||||||||||||
| Offshore International | 06/02/2009 | 536,079 | (194,631 | ) | 341,448 | 14 | ||||||||||||
| Hocol Petroleum Limited | 27/05/2009 | 742,345 | (204,747 | ) | 537,598 | 16 | ||||||||||||
| Equión Energía Limited | 24/01/2011 | 629,375 | (253,682 | ) | 375,693 | 10 | ||||||||||||
| Bioenergy Zona Franca | 30/08/2008 | 900 | - | 900 | ||||||||||||||
| Total | 3,170,874 | (995,790 | ) | 2,175,084 | ||||||||||||||
| (2) | It mainly includes the mandatesamonts in Oleoducto Bicentenario de Colombia amounting to $96,740, which correspondscorresponds to trusts created to manage the resources from the syndicated loan and the tax withholdings as collateral exercised to the work contractors of the Bioenergy pipeline work of $40,795 for purchase of lands and Ecopetrol S.A., $11,092. |
| F-30 |
Ecopetrol S.A. and Subsidiaries
Notes to the Consolidated Financial Statements
Years ended December 31, 2014, 2013 and 2012
(Expressed in millions of Colombian pesos)
| (3) | Corresponds to deposits to the Oil Savings and Stabilization Fund (from the Spanish Fondo de Ahorro y Estabilización Petrolera - FAEP) in Ecopetrol’s favor to address the remainder of the National Royalties Fund. It’s sole purpose is the payment of debts and financing development programs and projects in hydrocarbon producing and non-producing municipalities and departments. Ecopetrol disburses amounts after the Ministry of Finance issues the corresponding approvals. |
| (4) | Includes mainly: i) Restricted funds in the amount of $84,465 (2013 – $57,347), represented by judicial deposits to pay for labor, civil and tax litigation; ii) the balance for pending long-term agreements of $63,748; and iii) third-party property improvements on assets received through concessions for the Colorados and Tumaco wells in the amount of $48,314 (2013 – $46,750);) iv) funds Cavipetrol of $9,951; ODL S.A. mainly includes BOMT contracts amounting to $90,277 (2013 - $141,383); Andean Chemicals includes assets received as payment for the liability of Louisiana Green Fuels amounting to $38,758 (2013 - $58,477); Oleoducto Bicentenario (2013 - $4,265), Hocol Petroleum $7,534 (2013 - $934), (2013 - Peru $640) and Others $25,548 (2013 - $122). |
| (14) | Financial obligations |
The balance of financial obligations as of December 31, is comprised as follows:
| 2014 | 2013 | |||||||
| Current | ||||||||
| Foreign-currency debt (1) | 425,378 | 337,967 | ||||||
| Local-currency debt (2) and (4) | 934,247 | 216,860 | ||||||
| Bonds and issued (3) | 429,695 | 219,732 | ||||||
| Total Current | 1,789,320 | 774,559 | ||||||
| Non-current | ||||||||
| Local-currency debt (2) nd (4) | 4,679,027 | 4,805,073 | ||||||
| Foreing-currency debt (1) | 27,377,730 | 14,718,919 | ||||||
| Bonds and issued (3) | 1,802,900 | 1,900,000 | ||||||
| Total non-current | 33,859,657 | 21,423,992 | ||||||
| (1) | Includes in Ecopetrol S.A. the following: The US EximBank granted collateral to Ecopetrol S.A., through its Long Term Guarantee (LTG) and Medium Term (MTG) programs. To access these facilities, the Company selected 4 international banks as lenders in the LTG facility and 2 for the CGF. |
Terms and conditions of the guarantee programs are as follows:
| Financing Contract: | Long term (LTG) | Medium Term (MTG) |
| Amount in USD million: | Up to 426.6 | Up to 420.6 |
| Term: | Up to 10 years | Between 2 and 7 years |
| Interest Rate of: | Libor of 6 months + 0.90% | Libor of 6 months + 0.65% |
| Commission: | 0.15% E.A. R Share 0.40% Paid in each disbursement Exposure: 7.28% Paid in each disbursement |
0.15% E.A. R Share 0.35% Paid in each disbursement Exposure between 1.83% and 5.28% Paid in each disbursement |
| Guarantee: | Guarantee US EximBank on political and trading risk | |
| Amortizations: | Every six months | |
As of December 31 2013, the Company concluded the disbursements under the LTG for an amount of US$245 million and those of the MTG program for an amount US$151 million in July 2014. With closing as of December 2014 the payments of principal and interest for each facility have been made, and thus the balances in effect are US$220 million for LTG and US$145 million for MTG as of December 2014 and 2013.
Summary of the issuance of international bonds:
Issuance of International Bonds 2009
On July 23, 2009, the Company issued unsecured and unsubordinated debt bonds (notes) with the right to register them with the SEC for an amount of US$1,500 million and maturing in 2019. The registration took place on October 6, 2009. The notes were issued under Rule-144A/Regulation S with SEC registration rights. The terms of the transaction were:
| F-31 |
Ecopetrol S.A. and Subsidiaries
Notes to the Consolidated Financial Statements
Years ended December 31, 2014, 2013 and 2012
(Expressed in millions of Colombian pesos)
| Redemption term: | 10 years |
| Maturity: | July 23, 2019 |
| Amount US$ (millions): | 1,500 |
| Coupon: | 7.625% |
| Make Whole Call (pbs): | 50 |
| Dates for payment of interest: | July 23 and January 23 |
Issuance of International Bonds 2013
On September 18, 2013, the Company issued unsecured and unsubordinated debt bonds (notes) for an amount of US$2,500 million, registered with the SEC, divided into three tranches and with the following terms and conditions:
| Redemption term: | 5 years | 10 years | 30 years |
| Maturity: | September 18, 2018 | September 18, 2023 | September 18, 2043 |
| Amount US$ (millions): | 350 | 1,300 | 850 |
| Coupon: | 4.250% | 5.875% | 7.375% |
| Make Whole Call (pbs): | 40 | 45 | 50 |
| Dates for payment of interest: | March 18 and September 18 | ||
Issuance of International Bonds 2014
On May 28, 2014, the Company issued unsecured and unsubordinated debt bonds (notes) for an amount of US$2,000 million, registered with the SEC, with the following terms and conditions:
| Redemption term: | 31 years |
| Maturity: | May 28, 2045 |
| Amount US$ (millions): | 2,000 |
| Coupon: | 5.875% |
| Make Whole Call (pbs): | 40 |
| Dates for payment of interest: | May 28 and November 28, starting November 28, 2014 |
Subsequently, on September 16, 2014, the Company issued new unsecured and unsubordinated debt bonds (notes) for an amount of US$1,200 million, registered with the SEC, with the following terms and conditions:
| Redemption term: | 10.3 years |
| Maturity: | January 16, 2025 |
| Amount US$ (millions): | 1,200 |
| Coupon: | 4.125% |
| Make Whole Call (pbs): | 25 |
| Dates for payment of interest: | January 16 and July 16, starting January 16, 2015 |
In accordance with the definitions set forth in the issuance documents for 2009, 2013 and 2014, the Company has complied with the various covenants, including the due and timely payment of interest and capital; no creation of collateral pledges by Ecopetrol and its subsidiaries, except for authorized collateral; and the offer to purchase the bonds in the event of repurchasing for control change.
| F-32 |
Ecopetrol S.A. and Subsidiaries
Notes to the Consolidated Financial Statements
Years ended December 31, 2014, 2013 and 2012
(Expressed in millions of Colombian pesos)
As of December 31, 2014 Refinería de Cartagena S.A. has current the following loans amounting to US$ 3,497 million:
| Trench | Lender | US$ Amount |
Conditions | |||
| Interest rate: 2.78 | ||||||
| US Exim Direct Loan Agreement | US Exim | 2,650 | Payment period: 14 years | |||
| Semi-annual payments as from June 20, 2014 | ||||||
| Interest rate: 1 al 2 - Libor +2.50% | ||||||
| Commercial Facility Agreement | Sumitomo Bank of Tokyo, BBVA, HSBC | 440 | Years 3 to 8: Libor +2.75% | |||
| After year 9: Libor +3% | ||||||
| Payment period: 14 years | ||||||
| Semi-annual payments as from June 20, 2014 | ||||||
| Interest rate: 1 al 7 – Libor + 1.75% | ||||||
|
SACE Facility Agreement |
Sumitomo Bank of | 210 | As from year 8: Libor +2% | |||
| Tokyo, BBVA, HSBC | Payment period: 14 years | |||||
| Semi-annual payments as from June 20, 2014 | ||||||
| Interest rate: Commercial interest rate published by the bank 4.06% | ||||||
| EKN Facility Agreement | HSBC | 97 | Payment period: 14 years | |||
| Semiannual payments as from June 20, 2014 | ||||||
| Interest rate: Libor + 0.60% | ||||||
| US Exim Guaranteed | HSBC | 100 | Payment period: 14 years | |||
| Semi-annual payments as from June 20, 2014 |
| (2) | During the last quarter of 2014, US dollar financed remittance transactions were carried out with local banks for the payment of imports that amounted to US$ 196 million. The financing rate for these transactions is Libor plus a spread between 0.5 and 0.8 %. |
Likewise, it mainly includes, other financial liabilities acquired by Group companies, mainly by: ODL Finance S.A., 7-year syndicated loan of $647,029 at interest rate equal to DTF + 2.50%; and Bioenergy, 15-year, $411,282 with average interest rate of DTF + 3%.
Provided below is a summary of the guarantees granted by ODL as of December 31, 2014:
Irrevocable mercantile trust agreement between Oleoducto de los Llanos Orientales S.A. Sucursal Colombia and Fiduciaria Corficolombiana S.A. creating ODL – Ecopetrol Issuers of the ODL securities– Ecopetrol trust funds.
Guarantee: ODL – Ecopetrol loan securities.
According to clause seven of the contract, “ODL shall use the resources from the placement to finance the project to build and commission the pipeline, and to return capital to the pipeline sponsors, as established in the Information Prospectus”. Additionally, Clause 10.2.1 mentions that there will be a Prime Fund that will be a book account of the trust fund that will be created to manage the resources coming from the payment of the Financial tariff payments (“Tarifa Financiera Títulos”) for Ecopetrol, and Clause 10.2.2.2 states that the resources deposited in the Interim Reserve Fund may only be used to make debt payments.
| F-33 |
Ecopetrol S.A. and Subsidiaries
Notes to the Consolidated Financial Statements
Years ended December 31, 2014, 2013 and 2012
(Expressed in millions of Colombian pesos)
As of the December 31, 2014, the promissory notes have the following balances:
| Financial Entity | Obligation | Promissory Note Number | ||||
| Banco de Bogotá | 416,000 | 7690162443-1 | ||||
| Banco AV Villas | 56,000 | 001214219-9 | ||||
| Banco de Occidente | 84,000 | 2630008697-3 | ||||
| Banco Popular | 84,000 | 06613600944-1 | ||||
| 640,000 | ||||||
Currently, Bioenergy is in the process of releasing the mortgage that had been granted for the disbursements of the loans given by Bancolombia through a Finagro credit line in 2008, which is secured with the property “La Esperanza” whose carrying value is $4,096.
Domestic Bank Loan
Corresponds to financing in local currency with seven Colombian banks, with the following terms:
| Disbursement date: | May 27, 2013 |
| Term: | 12 years with a 3-year grace period |
| Payment of interest: | Starting November 2013 |
| Rate: | FTD + 2.5% anticipated quarterly rate |
| Amortization: | Semi-annually |
| Guarantees: | None |
The following shows a breakdown of long-term capital amortization payments:
| 2016 | 102,167 | |||
| 2017 | 204,333 | |||
| 2018 | 204,334 | |||
| 2019 | 204,333 | |||
| 2020 | 204,333 | |||
| 2021 | 204,333 | |||
| 2022 | 204,334 | |||
| 2023 | 204,333 | |||
| 2024 | 204,333 | |||
| 2025 | 102,167 | |||
| 1,839,000 |
| (3) | Summary of the issuance of Local Bonds: |
Issuance of Local Bonds 2010
Through Resolution No. 3150 on October 20, 2010, Ecopetrol was authorized by the Ministry of Finance and Public Credit to issue, subscribe and place internal public debt bonds for an amount of up to one billion pesos, to finance the 2010 Investment Plan. Subsequently, through Resolution No. 2176 of November 11, 2010, the Company obtained the Finance Superintendence of Colombia’s authorization to register its internal public debt bonds with the National Register of Securities and Issuing Agencies, and to place them through public offering.
The terms of the issuance and placement of the internal public debt bonds are as follows:
| Amount placed: | $1,000,000 million | ||||
| Issuance date: | December 1, 2010 | ||||
| Amortization: | At maturity | ||||
| Series A: | Bonds denominated in pesos with a variable rate based on the CPI | ||||
| Redemption term: | 5 years | 7 years | 10 years | 30 years | |
| Rate: | CPI + 2.80% | CPI + 3.30% | CPI + 3.94% | CPI + 4.90% | |
| Amount (millions) | $ | 97,100 | 138,700 | 479,900 | 284,300 |
| F-34 |
Ecopetrol S.A. and Subsidiaries
Notes to the Consolidated Financial Statements
Years ended December 31, 2014, 2013 and 2012
(Expressed in millions of Colombian pesos)
Issuance of Local Bonds 2013
Through Resolution No. 2462 on July 30, 2013, issued by the Ministry of Finance and Public Credit, Ecopetrol was authorized to issue, subscribe and place up to three billion pesos in bonds and commercial paper in the Colombian Public Stock Market through the Programa de Emisión y Colocación (Issuance and Placement Program). Subsequently, through Resolution No. 1470 of August 2, 2013, the Finance Superintendence of Colombia granted the Company authorization to register the bonds and commercial paper under said program with the National Register of Securities and Issuing Agencies, and place the bonds in public offering.
The following was the result of the first issuance and placement of internal public debt bonds under the program:
| Amount placed: | $900,000 million | ||||
| Issuance date: | August 27, 2013 | ||||
| Amortization: | At maturity | ||||
| Interest paid: | Semi-annually | ||||
| Series C: | Bonds denominated in pesos with a variable rate based on the CPI | ||||
| Redemption term: | 5 years | 10 years | 15 years | 30 years | |
| Rate: | CPI + 3.79% | CPI + 4.60% | CPI + 4.90% | CPI + 5.15% | |
| Amount (millions) | $ | 120,950 | 168,600 | 347,500 | 262,950 |
| (15) | Accounts payable |
The balance for accounts payable as of December 31, is comprised as follows:
| 2014 | 2013 | |||||||
| Current | ||||||||
| Suppliers | 6,304,889 | 5,459,752 | ||||||
| Partner advances | 1,112,536 | 854,884 | ||||||
| Various creditors | 760,531 | 348,987 | ||||||
| Income and VAT tax withholdings | 407,123 | 459,866 | ||||||
| Deposits received from third parties | 316,466 | 626,945 | ||||||
| Reimbursement of exploratory costs | 22,533 | 23,158 | ||||||
| Interest payable | 22,408 | - | ||||||
| Purchase of hydrocarbons from National Hydrocarbons Agency | 17,930 | 385,636 | ||||||
| Dividends payable | 3,704 | 1,313,596 | ||||||
| Total Current | 8,968,120 | 9,472,824 | ||||||
| Non-current | ||||||||
| Other accounts payables | 219,370 | 591,998 | ||||||
| Total non-current | 219,370 | 591,998 | ||||||
| (16) | Taxes, contributions and duties payable |
The balance for taxes, contributions and duties payable as of December 31, is comprised as follows:
| 2014 | 2013 | |||||||
| Income tax and complementary taxes | 6,018,066 | 7,872,189 | ||||||
| Income tax for equality (CREE) | 356,926 | 315,218 | ||||||
| National tax on gasoline and surtax on gasoline | 269,612 | 224,694 | ||||||
| Sales tax – VAT | 3,877 | 24,826 | ||||||
| Tax on Equity (1) | - | 567,002 | ||||||
| Industry and commerce tax and other minor taxes | 440,009 | 91,649 | ||||||
| Audit fee | - | 87,923 | ||||||
| Total | 7,088,490 | 9,183,501 | ||||||
| (1) | The last two equity tax payments were made in 2014. |
The balance of deferred income tax, income tax for equity CREE and surtax CREE asset/liability is as follows:
| 2014 | 2013 | |||||||
| Deferred tax asset | ||||||||
| Initial balance Income and CREE | 2,140,561 | 1,557,224 | ||||||
| Movement for the year Income, CREE and surtax CREE | 206,918 | 583,337 | ||||||
| Ending balance | 2,347,479 | 2,140,561 | ||||||
| Deferred tax liability | ||||||||
| Initial balance Income and CREE | 2,201,728 | 1,790,546 | ||||||
| Movement for the year Income, CREE and surtax CREE | 610,744 | 411,182 | ||||||
| Ending balance | 2,812,472 | 2,201,728 | ||||||
| F-35 |
Ecopetrol S.A. and Subsidiaries
Notes to the Consolidated Financial Statements
Years ended December 31, 2014, 2013 and 2012
(Expressed in millions of Colombian pesos)
Breakdown of expenses for income tax, capital gain tax, income tax for equality CREE and surcharge tax CREE
The expense for income tax, capital gains tax and income tax for equality CREE, and surcharge CREE, is comprised as follows:
| 2014 | 2013 | 2012 | ||||||||||
| Current taxes | ||||||||||||
| Current income tax and CREE | 6,727,229 | 8,283,605 | 7,081,647 | |||||||||
| Income and CREE tax from prior periods | 4,426 | 7,967 | 14,227 | |||||||||
| Deferred income tax assets, CREE and Surtax CREE | (158,217 | ) | 27,661 | 35,199 | ||||||||
| Deferred income tax liability, CREE and Surtax CREE | 561,630 | (230,394 | ) | 2,322 | ||||||||
| 7,135,068 | 8,088,839 | 7,133,395 | ||||||||||
The effect of temporary differences that imply the payment of a lower or greater income tax in the current year is recorded as deferred tax asset or liability, both for the income tax and for the income tax for equity CREE and surtax CREE, as applicable, provided that there are reasonable expectations that those differences shall revert in the case of the deferred tax asset, or enough taxable income is generated to recover the tax.
The determination of the taxable income basis for the withholding of income and related taxes and income tax for equality (CREE) is subject to current regulations in each case. The write-off of the tax bases is described as follows:
Income tax and complementary taxes
Current tax regulations applicable to Colombia establish the following:
| a) | Starting January 1, 2013, taxable revenues in Colombia are taxed at the rate of 25% for income tax and complementary taxes, except for taxpayers with an express provision for special rates. For the companies declared Free Trade Zone Users, the income tax rate is 15%. |
| b) | The basis for determining the income tax may not be lower than 3% of the net equity on the last day of the immediately preceding taxable period. |
| c) | Beginning with the 2007 fiscal period, the inflation adjustments system was eliminated for tax purposes, and the tax on capital gains was reactivated. Article 109 of Act 1607 of December 2012 established a new tax rate on occasional gains for companies and is to be applied as from 2013; such rate is equivalent to 10%. |
The Tax Authorities can review the income tax returns within the two years following their filing.
Income tax for equality – CREE
Current tax regulations applicable to Colombia establish the following:
| a) | Starting January 1, 2013, Law 1607 of December 2012 created the income tax for equality (CREE) as a contribution from taxpaying companies and legal and naturalized persons filing income and complementary taxes to benefit workers, job creation and social investment. Non-profit entities, natural persons and tax-exempt companies at the 15% rate are not subject to the income tax for equality (CREE). |
| b) | The basis for determining the income tax for equality (CREE) cannot be lower than 3% of the taxpayer’s net equity on the last day of the immediately preceding fiscal period. |
| c) | A rate of 9% is applicable to income tax for equality (CREE) in accordance with Law 1739 of December 2014. |
| d) | According to Article 25 of Act 1607 of December 2012, effective as from July 1, 2013, legal persons and assimilated income tax payers, are exempted from paying payroll taxes (National Training Service - SENA and Colombian Institute for Family Welfare - ICBF). Corresponding to workers individually earning up to ten (10) minimum monthly wages in force. This exemption does not apply to taxpayers not subject to the income tax for equality - CREE. |
| F-36 |
Ecopetrol S.A. and Subsidiaries
Notes to the Consolidated Financial Statements
Years ended December 31, 2014, 2013 and 2012
(Expressed in millions of Colombian pesos)
| e) | The taxable basis for the income tax for equality (CREE) is established by subtracting returns, allowances and reductions made in the taxable year from gross income likely to increase equity, and subtracting from the resulting amount all income deemed non-taxable as established in the Tax Statute. From the resulting net income, total costs and deductions subject to the CREE tax are subtracted, in accordance with the provisions of articles 107 and 108 of the Tax Statute. Income deemed exempt, as expressly provided for in Article 22 of Law 1607 of 2012, may be subtracted from the amount resulting from the above calculations. |
| f) | As from 2015, in conformity with the provisions of Law 1739 of December 2014, fiscal losses and excesses of minimum base may be offset with future income originated in the income tax for equity, considering the same rules foreseen for the income taxes. |
Income tax for equality (CREE) returns can be reviewed by tax authorities up to two years after filing. The review period for the 2013 return is currently open.
Income tax for equality (CREE) surcharge
For the years 2015, 2016, 2017 and 2018, Law 1739 of December 23, 2014 establishes a surtax on the Income tax for equality (CREE) payable by individuals and entities subject to said tax, to be applied to taxable income over $800 million at the rates of 5%, 6%, 8% and 9% per year, respectively. The impact of said surtax on the current year is taken into account for the purposes of properly determining the deferred tax.
Wealth tax
Through Law 1739 of 2014, the wealth tax was established, which defines as its taxable event the possession of wealth as of January 1, 2015, 2016 and 2017, to be paid by income tax payers. Ecopetrol shall determine its wealth tax under the following terms:
| Lower limit | Upper limit | 2015 rate | 2016 rate | 2017 rate |
| >=5,000,000,000 | Beyond | (Tax base –
5,000,000,000) *1.15% + 22,500,000 |
(Tax base –
5,000,000,000) *1.00%+ 15,500,000 |
(Tax base –
5,000,000,000) *0.40%+ 6,000,000 |
Transfer pricing
Since 2004, income taxpayers who had entered into transactions with related parties abroad, and/or with residents of countries considered to be tax havens, are under the obligation of determining, for income tax purposes, their ordinary and extraordinary income, costs and deductions, and assets and liabilities, taking into account the denominated market prices and profit margins for these transactions (Arm’s length principles). Based on the opinion of the Company’s advisor, no significant changes are expected for taxable year 2014 related to the compliance with the principle of full jurisdiction set out in Article 260-1 of the Colombian Tax Code, and there are no foreseen adjustments to the determination of income tax expenses for the said year.
| (17) | Labor and pension liabilities |
The balance of labor and pension liabilities as of December 31, is comprised as follows:
| 2014 | 2013 | |||||||
| Current portion | ||||||||
| Vacations | 113,806 | 101,241 | ||||||
| Premiums, bonuses and allowances | 144,574 | 91,489 | ||||||
| Severance payments | 63,335 | 52,739 | ||||||
| Salaries and pensions payable | 7,751 | 5,774 | ||||||
| Interest on severance | 7,047 | 5,961 | ||||||
| Other | 32,692 | 32,424 | ||||||
| Total current portion | 369,205 | 289,628 | ||||||
| Non-current portion | ||||||||
| Actuarial liability for health and education (1) | 4,500,173 | 4,211,288 | ||||||
| Retirement pensions joint ventures | 73,985 | 66,543 | ||||||
| Total non-current portion | 4,574,158 | 4,277,831 | ||||||
| Total | 4,943,363 | 4,567,459 | ||||||
| (1) | An actual interest rate of 4.8% and a 3% expected inflation rate, for a nominal annual rate of 7.944% (2013 – 7.9358%) were used for estimating and updating the health and education reserves. For estimating the future provisions of health services, a 6% increase was considered for year 1 (2013 - 5.992%) and a 5% increase as from year 4 (2013 - 4.92%). In the case of education, the increase considered is 5.5% (2013 - 5.492%). At the 2014 closing, the health reserve is 100% amortized. |
| F-37 |
Ecopetrol S.A. and Subsidiaries
Notes to the Consolidated Financial Statements
Years ended December 31, 2014, 2013 and 2012
(Expressed in millions of Colombian pesos)
The following is the detail of the actuarial liability:
| Concept | 2014 | 2013 | ||||||
| Actuarial calculation of health liabilities | 4,131,205 | 4,053,865 | ||||||
| Less - Actuarial calculation pending amortization | - | (227,416 | ) | |||||
| Amortized actuarial health liability | 4,131,205 | 3,826,449 | ||||||
| Actuarial calculation of education liabilities | 368,968 | 384,839 | ||||||
| Amortized actuarial health and education liability | 4,500,173 | 4,211,288 | ||||||
The variation on the amortized actuarial liability is as follows:
| 2014 | 2013 | Variation | ||||||||||
| Health | ||||||||||||
| Active Personnel | 549,202 | 518,089 | 31,113 | |||||||||
| Retirees | 3,582,003 | 3,308,360 | 273,643 | |||||||||
| Education | ||||||||||||
| Active Personnel | 9,424 | 48,081 | (38,657 | ) | ||||||||
| Retirees | 359,544 | 336,758 | 22,786 | |||||||||
| Total | 4,500,173 | 4,211,288 | 288,885 | |||||||||
| (18) | Estimated liabilities and provisions |
The balance of estimated liabilities and provisions as of December 31, is comprised as follows:
| 2014 | 2013 | |||||||
| Current portion | ||||||||
| Provisions for contingencies (1) | 1,072,625 | 926,118 | ||||||
| Other Provisions | 576,440 | 953,893 | ||||||
| Provision for legal proceedings (2) (see note 29) | 297,442 | 524,937 | ||||||
| Provision for abandonment, facility dismantling and environmental recovery costs (3) | 226,735 | 109,557 | ||||||
| Provision for pension obligations | - | 500 | ||||||
| Total current portion | 2,173,242 | 2,515,005 | ||||||
| Non-current portion | ||||||||
| Provision for abandonment, facility dismantling and environmental recovery costs (3) | 6,276,739 | 4,636,968 | ||||||
| Provisions for comuneros (community members) (4) | 551,497 | 445,364 | ||||||
| Provision for legal proceedings (2) | 9,932 | 16,910 | ||||||
| Other Provisions | 99,302 | 64,577 | ||||||
| Total non-current portion | 6,937,470 | 5,163,819 | ||||||
| Total | 9,110,712 | 7,678,824 | ||||||
| (1) | The balance of provisions for contingencies is represented mainly by: i) $941,916 (2013 – $804,358) to fulfill stand-alone equity obligations to pay transferred pension liabilities (see note 22), ii) $95,323 to cover environmental impact events (2013 – $86,101), and iii) $35,217 (2013 – $28,364) for potential PDVSA claims for payment to clean up and decontaminate Lake Maracaibo in Venezuela. |
| (2) | The following shows the changes in the provisions for legal proceedings as of December 31, 2014 |
| 2014 | 2013 | |||||||
| Opening balance | 541,847 | 792,894 | ||||||
| Additions, new allowances | 48,578 | 107,107 | ||||||
| Recovery | (251,288 | ) | (314,144 | ) | ||||
| Use | (31,763 | ) | (44,010 | ) | ||||
| Closing balance | 307,374 | 541,847 | ||||||
| Number of proceedings at year-end | 360 | 368 | ||||||
| (3) | The following shows the short-term and long-term changes in the provision for abandonment, facility dismantling and environmental recovery costs: |
| F-38 |
Ecopetrol S.A. and Subsidiaries
Notes to the Consolidated Financial Statements
Years ended December 31, 2014, 2013 and 2012
(Expressed in millions of Colombian pesos)
| 2014 | 2013 | 2012 | ||||||||||
| Opening balance | 4,746,525 | 3,946,560 | 3,843,550 | |||||||||
| Abandonment cost evaluation update | 1,819,134 | 1,016,762 | 392,197 | |||||||||
| Withdrawals and Use | (96,878 | ) | (232,813 | ) | (273,325 | ) | ||||||
| Effect from exchange rates | 34,693 | 16,016 | (15,862 | ) | ||||||||
| Closing balance | 6,503,474 | 4,746,525 | 3,946,560 | |||||||||
| (4) | Included the interim relief ordered by the Council of State in its decree of June 24, 1994 in the invalidity action brought by the Ministry of Mines and Energy against Comuneros (community members) of Santiago de las Atalayas and Pueblo Viejo de Cusiana, corresponding to the attachment and seizure of the payments to be made by Ecopetrol for royalties, based on Royalty contracts Nos. 15, 15A, 16 and 16A, declared nul and void by the Council of State in its ruling of September 13, 1999, in which it was ordered that said interim relief should be cancelled and that the attached and seized amounts should be handed over to the State – the Ministry of Mines. Ecopetrol has capacity as receiver of said amount, $90,752 corresponds to the value initially recognized by Ecopetrol, as well as the valuation of the fund containing the resources; $460,745 corresponds to generated net interest. In a ruling on December 12, 2012, notified by edict on January 21, 2013, the Council of State declared that the special plea for reconsideration filed by the Comuneros was dismissed. In November 2014, a new application was filed whereby Ecopetrol reiterated its request that the amounts seized in these proceedings be handed over, as the Company has paid the Nation and the beneficiary territorial entities the amount of total royalties incurred during the enforcement of the interim relief, and subsequently, it is entitled to the amounts of the relief. |
| (19) | Other long-term liabilities |
The balance of other long-term liabilities as of December 31, is comprised as follows:
| 2014 | 2013 | |||||||
| Deferred income tax credit | 2,774,106 | 2,177,409 | ||||||
| Advances received from Ecogas for BOMT | 333,310 | 402,660 | ||||||
| Other liabilities | 352,936 | 461,817 | ||||||
| Total | 3,460,352 | 3,041,886 | ||||||
| (20) | Non- controlling interest |
| 2014 | 2013 | |||||||
| Ocensa S.A. | 2,144,251 | 2,187,766 | ||||||
| Equion S.A. | 1,030,114 | 1,376,968 | ||||||
| ODL Finance S.A. | 394,033 | 377,245 | ||||||
| Oleoducto Bicentenario S.A.S. | 350,070 | 312,515 | ||||||
| Oleoducto de Colombia S.A. | 258,444 | 299,851 | ||||||
| Bioenergy S.A. | 19,023 | 19,403 | ||||||
| Total | 4,195,935 | 4,573,748 | ||||||
Non-controlling interest is calculated by taking the total equity of consolidated subsidiaries and multiplying by the share percentage that is attributable to stockholders that are foreign to the controlling company.
| (21) | Shareholders’ equity |
Subscribed and paid-in capital
Ecopetrol’s authorized capital amounts to $15,000,000, and is comprised by 60,000,000,000 ordinary nominative shares at a $250 pesos par value each. 41,116,698,456 of such shares have been subscribed represented by 11.51% of non-controlling interest and 88.49% held of shareholders from Government entities. The value of the reserve shares amounts to $4,720,825 comprised by 18,883,301,544 shares.
Additional paid-in capital
Mainly corresponds to: (i) surplus with respect to its nominal value derived from the sale of shares upon capitalization in 2007, in the amount of $4,700,963, (ii) $31,225, the value generated by the process of placing the shares on the secondary market, arising from the calling of guarantees from debtors in arrears, according to the stipulations of Article 397 of the Commercial Code, and (iii) to the surplus over nominal value arising from the sale of shares awarded in the second round, which took place in September 2011, in the amount of $2,222,443.
| F-39 |
Ecopetrol S.A. and Subsidiaries
Notes to the Consolidated Financial Statements
Years ended December 31, 2014, 2013 and 2012
(Expressed in millions of Colombian pesos)
The following shows the breakdown of additional paid-in capital as of December 31:
| 2014 | 2013 | |||||||
| Additional paid-in capital | 6,954,672 | 6,954,631 | ||||||
| Additional paid-in capital receivable | (226 | ) | (257 | ) | ||||
| Total | 6,954,446 | 6,954,374 | ||||||
Effect of applying the Public Accounting Regime
Corresponds to the transfer of negative balances derived from devaluation of property, plant and equipment constructed up until 2007, pursuant to the Public Accounting Regime.
This heading also shows the responsibilities pending decision arising from the proceedings on loss of materials, through enforcement of the process established in the above-mentioned standard.
Equity reserves
The legal reserve is made up of 10% of net income and can be used as compensation for losses or for distribution in the event of liquidation of the Company.
On March 26, 2014, the results for the 2014 period were made available to the General Shareholders’ Meeting. It was decided that the legal reserve should not be increased, since it currently represents 50% of the subscribed capital.
As of December 31, the reserves included:
| 2014 | 2013 | |||||||
| Legal | 5,139,587 | 5,139,587 | ||||||
| Occasional reserves for investment programs | 12,802,794 | 9,945,733 | ||||||
| Reserve for investment appreciation (Decree 2336/95) | 20,989 | 215,406 | ||||||
| Total | 17,963,370 | 15,300,726 | ||||||
Incorporated institutional equity
Corresponds to the product of commercial activity linked mainly to the following partnership contracts: Nare, Matambo, Garcero, Corocora, Estero, Caracara, for the Sardinas 6, Remache Norte 3, Abejas 3, Jaguar T5 and T6 wells, Orocué, the Guarilaque 7 well, Campo Rico for the Candalay, Jordán 5, Remache Norte 2 and 5, Abejas 2 and Vigia wells, and the incorporation of the Cocorná materials warehouse. Additionally, it contemplates the effect of the merger through absorption between Cenit and Ecopetrol Pipelines International Limited.
| (22) | Memorandum accounts |
The following is a breakdown of memorandum accounts as of December 31
| 2014 | 2013 | |||||||
| Debtors | ||||||||
| Exploitation rights - Decree 727 of 2007 (1) | 72,796,569 | 61,016,768 | ||||||
| Other contingent rights and debtor accounts (2) | 54,013,087 | 42,656,068 | ||||||
| Tax debtors | 31,749,770 | 34,836,502 | ||||||
| Autonomous pension trust (3) | 11,707,688 | 11,449,876 | ||||||
| Securities given in custody and guarantee | 1,347,968 | 1,447,325 | ||||||
| Implementation of investment projects | - | 21,953 | ||||||
| Legal proceedings | 832,961 | 782,209 | ||||||
| Total | 172,448,043 | 152,210,701 | ||||||
| Creditors | ||||||||
| Legal proceedings | 45,569,723 | 28,804,122 | ||||||
| Goods received in custody (4) | 30,045,734 | 20,455,350 | ||||||
| Contractual guarantees (5) | 25,344,883 | 17,434,639 | ||||||
| Tax creditors | 21,818,865 | 16,988,683 | ||||||
| Autonomous pension trust (6) | 12,649,604 | 12,254,234 | ||||||
| Project contracts | 2,633,141 | 3,267,904 | ||||||
| Mandate agreements (7) | 978,250 | 1,279,886 | ||||||
| Savings and petroleum stabilization fund | 1,012,940 | 1,033,557 | ||||||
| Future BOMT payments | 421,038 | 170,028 | ||||||
| Other contingent obligations | 9,445,835 | 9,680,448 | ||||||
| Potential obligations – pension liabilities (6) | - | 405,769 | ||||||
| Total | 149,920,013 | 111,774,620 | ||||||
| F-40 |
Ecopetrol S.A. and Subsidiaries
Notes to the Consolidated Financial Statements
Years ended December 31, 2014, 2013 and 2012
(Expressed in millions of Colombian pesos)
| (1) | Reserves valued as of December 31, 2014 based on the volumes in the audited reserves study and applying the unweighted arithmetic average of the First-day-of-the-month price for each month within the twelve month period prior to the end of the year to comply with Decree 727 of 2007 with respect to the recognition, in memorandum accounts, of exploration and production rights owned as of the closing date of the financial statements pursuant to the provisions set forth by the National Accounting Office (CGN). |
| (2) | The balance corresponds to: (i) tax memorandum accounts in the amount of $42,397,686 (2013 – $30,224,255), which reflect the differences between the values of both equity and income accounts, taken from the 2013 tax return, and the accounting balances. The differences are derived from concepts such as valuations, allowances that are not accepted for tax purposes, the difference in the amortization method for oil investments, which is done using the units-of-production method for accounting purposes, and using the straight-line method for tax purposes, and the effect of the adjustment for inflation, and (ii) securities in custody in the amount of $4,553,581 (2013 – $5,308,492). |
| (3) | Reflects the contingent right (debtor account) on resources put in the autonomous pension trust, to pay transferred pension liabilities, in order to control the existence of liquid resources in the stand-alone equity fund. The value transferred on the date of transfer, December 31, 2008, was $10,092,528, corresponding to pension liability for monthly pension payments, shares and pension bonds; the amounts tied to health and education are within Ecopetrol’s pension liability. The destination of the transferred resources, and their yields, cannot change or be returned to the Company until all pension obligations have been fulfilled. |
The following shows a breakdown of autonomous pension trust funds:
| 2014 | 2013 | |||||||
| Consorcio Ecopensiones 2011 | 3,063,193 | 3,007,450 | ||||||
| Porvenir S.A. | 2,588,139 | 2,525,046 | ||||||
| Consorcio Pensiones Ecopetrol 2011 | 1,779,768 | 2,058,602 | ||||||
| Unión Temporal Skandia-HSBC | 2,026,434 | 1,813,095 | ||||||
| Consorcio Bogotá-Colpatria-Occidente | 2,250,154 | 2,045,683 | ||||||
| 11,707,688 | 11,449,876 | |||||||
| (4) | Includes, i) the value of royalties corresponding to the balance of Ecopetrol reserves, in the amount of $29,332,285 (2013 – $19,740,624), calculated according to SEC-approved regulations, ii) the inventories of products sold and materials pending delivery to clients, in the amount of $39,089 (2013 – $43,453) iii) Black Gold investments administered by Ecopetrol for $244,177 (2013 – $193,658), and iv) for 2013, included goods received in concession custody Coveñas Pozos Colorados and Tumaco for $68,800. |
| (5) | Includes the value of contracts pending execution as of December 31, 2014 in the amount of $24,258,460 (2013 – $12,917,756) and stand-by letters of credit, which includes guarantee contracts signed by Ecopetrol in the amount of $999,897 (2013 – $1,084,975). |
On December 30, 2011, the financial closure took place for Ecopetrol to grant two contingency guarantees to Refinería de Cartagena S.A. - Reficar, as part of the financing granted by a group of export credit agencies and commercial banks, for the project to expand and modernize the Cartagena Refinery. The Project Finance financing structure has a maximum repayment period of 14 years, starting six months after the date of completion of the Project. For the purposes of financing the Project, Ecopetrol gave Reficar: i) a contingent commercial agreement for construction support for resources needed to complete the project – US$722 million equivalent to $1,727,356 (2013 – $2,788,123); and ii) a contingent guarantee to pay potential amounts that Reficar may need to service the debt for the immediately following year, that is, 2015 (US$378.6 million equivalent to $905,785 million (2013 – $479,781).
| (6) | Made up of the value of the actuarial calculation of monthly pension payments, shares and bonds as of December 31, 2014, plus the percentage of amortization of the reserve that arose in 2010 from an update on mortality tables. At the end of December 2014, the corresponding liabilities were fully amortized. |
| F-41 |
Ecopetrol S.A. and Subsidiaries
Notes to the Consolidated Financial Statements
Years ended December 31, 2014, 2013 and 2012
(Expressed in millions of Colombian pesos)
The actuarial calculation for 2014 and 2013 was carried out using a technical interest rate of 4%. The increase in salaries, pensions in cash and pensions in kind was calculated using the average inflation rate by the Departamento Administrativo Nacional de Estadística (DANE – National Administrative Department of Statistics), for the three years immediately preceding the calculation year.
The balance of amortized actuarial liability is as follows:
| Concept | 2014 | 2013 | ||||||
| Actuarial calculation of the obligation for monthly pension payments and pension bonds | 12,649,604 | 12,660,003 | ||||||
| Less – Actuarial calculation pending amortization | - | (405,769 | ) | |||||
| Amortized actuarial liability | 12,649,604 | 12,254,234 | ||||||
As of December 31, 2014, 13,042 (2013 – 13,106) people were covered in the actuarial calculation and 14,556 (2013 – 13,885) were covered in pension bonds
| (7) | Includes the value of assets received in custody from Refinería de Cartagena S.A. in fulfillment of obligations acquired under the mandate contract signed between Ecopetrol and that Company to operate the refinery, namely: product inventories in the amount of $133,146 (2013 – $358,351), and property, plant and equipment in the amount of $845,104 (2013 – $921,355).(2013 – $358,351), and property, plant and equipment in the amount of $845,104 (2013 – $921,355). |
| (23) | Revenues |
The following is the detail of revenues for the years ended of December 31:
| 2014 | 2013 | 2012 | ||||||||||
| Domestic sales | ||||||||||||
| Domestic- distillates | 11,984,024 | 11,582,902 | 11,132,983 | |||||||||
| Gasoline | 6,396,282 | 5,968,084 | 5,697,178 | |||||||||
| Services | 2,858,302 | 2,535,867 | 2,077,858 | |||||||||
| Natural gas | 1,615,471 | 1,255,092 | 1,108,164 | |||||||||
| Other products | 2,047,362 | 1,738,288 | 2,100,780 | |||||||||
| L.P.G. and propane | 426,920 | 375,358 | 492,440 | |||||||||
| Asphalts | 459,072 | 392,010 | 369,768 | |||||||||
| Crude | 442,171 | 1,421,620 | 572,969 | |||||||||
| 26,229,604 | 25,269,221 | 23,552,140 | ||||||||||
| Recognition of price differential (1) | 485,409 | 938,679 | 809,773 | |||||||||
| 26,715,013 | 26,207,900 | 24,361,913 | ||||||||||
| Foreign sales | ||||||||||||
| Crude | 36,311,352 | 35,726,701 | 35,884,535 | |||||||||
| Fuel oil | 3,921,703 | 4,463,237 | 4,283,814 | |||||||||
| Natural gas | 423,461 | 586,687 | 563,412 | |||||||||
| Gasoline and turbo fuel | 127,091 | 789,071 | 1,182,367 | |||||||||
| Propylene | - | 272 | - | |||||||||
| Plastic and Rubber | 975,862 | 857,397 | - | |||||||||
| Diesel | 179,738 | 1,195,704 | 1,223,159 | |||||||||
| Other products | 271,118 | 601,746 | 1,352,802 | |||||||||
| 42,210,325 | 44,220,815 | 44,490,089 | ||||||||||
| Total revenues | 68,925,338 | 70,428,715 | 68,852,002 | |||||||||
| (1) | Corresponds to the application of Decree 1880 of September 2014 and Resolution 180522 of 2010, which defined the procedure for price differentials (value generated by the difference between parity price and regulated price, which can be positive or negative). |
| F-42 |
Ecopetrol S.A. and Subsidiaries
Notes to the Consolidated Financial Statements
Years ended December 31, 2014, 2013 and 2012
(Expressed in millions of Colombian pesos)
| (24) | Cost of sales |
The cost of sales for the years ended December 31, is comprised as follows:
| 2014 | 2013 | 2012 | ||||||||||
| Variable costs | ||||||||||||
| Imported products (1) | 13,242,615 | 11,862,265 | 9,447,041 | |||||||||
| Hydrocarbon purchases – ANH (2) | 6,705,881 | 7,808,844 | 8,646,762 | |||||||||
| Purchases of crude in association and concession | 5,470,951 | 5,805,854 | 7,207,707 | |||||||||
| Amortization and depletion | 3,827,215 | 3,202,007 | 3,000,758 | |||||||||
| Purchases of other products and gas | 979,772 | 598,035 | 618,715 | |||||||||
| Hydrocarbon transportation services | 973,171 | 1,610,287 | 1,106,649 | |||||||||
| Services contracted in associations | 612,013 | 603,011 | 512,138 | |||||||||
| Electric power | 411,731 | 308,927 | 306,942 | |||||||||
| Gas royalties in cash (3) | 388,147 | - | - | |||||||||
| Processing materials | 289,544 | 310,657 | 276,550 | |||||||||
| Volume adjustments and other allocations | 134,715 | (72,837 | ) | (296,434 | ) | |||||||
| Units of production depreciation | 93,699 | 94,760 | 105,805 | |||||||||
| 33,129,454 | 32,131,810 | 30,932,633 | ||||||||||
| Fixed costs: | ||||||||||||
| Maintenance | 2,639,336 | 2,240,543 | 1,921,008 | |||||||||
| Depreciation | 2,096,806 | 1,828,228 | 1,886,620 | |||||||||
| Services contracted in associations | 1,673,548 | 1,691,656 | 1,519,143 | |||||||||
| Contracted services | 1,582,635 | 1,356,452 | 1,127,284 | |||||||||
| Labor costs | 1,393,891 | 1,260,436 | 1,095,495 | |||||||||
| Hydrocarbon transportation services | 620,716 | 2,257 | - | |||||||||
| Taxes and contributions | 607,744 | 625,272 | 401,576 | |||||||||
| General costs | 522,084 | 450,922 | 402,672 | |||||||||
| Materials and operating supplies | 425,536 | 364,554 | 388,673 | |||||||||
| Non-capitalized project costs | 191,189 | 469,926 | 561,416 | |||||||||
| Amortization of the actuarial calculation for health and education | 40,895 | 104,499 | 127,086 | |||||||||
| Amortization of deferred charges, intangible assets and insurance policies | 130,182 | 27,727 | 171,902 | |||||||||
| 11,924,562 | 10,422,472 | 9,602,875 | ||||||||||
| 45,054,016 | 42,554,282 | 40,535,508 | ||||||||||
| (1) | Corresponds mainly to purchases of ACPM and diluent agents to facilitate the transportation of heavy crude oil. |
| (2) | Corresponds mainly to the purchases of crude royalties that Ecopetrol makes from the ANH derived from national production, both by the Company in direct operation and by third parties. |
| (3) | Through Resolution 877 of September 2013, the National Hydrocarbons Agency established that, starting January 1, 2014, it will collect payment for royalties generated by gas exploitation in cash and not in kind. |
| (25) | Operating expenses |
Operating expenses for the years ended December 31, are comprised as follows:
| 2014 | 2013 | 2012 | ||||||||||
| Administration | ||||||||||||
| Labor expenses | 491,201 | 412,586 | 321,643 | |||||||||
| General expenses | 322,088 | 221,666 | 172,735 | |||||||||
| Amortizations (1) | 277,559 | 344,868 | 313,344 | |||||||||
| Maintenance (2) | 208,364 | 6,794 | 5,756 | |||||||||
| Goodwill impairment | 182,631 | 353,012 | - | |||||||||
| Taxes | 119,803 | 63,827 | 4,932 | |||||||||
| Depreciations | 57,904 | 35,169 | 35,233 | |||||||||
| Rentals and leasing | 15,670 | 16,025 | 12,441 | |||||||||
| Amortization of the actuarial calculation for health and education | 2,022 | 1,770 | 8,896 | |||||||||
| Fees | 149 | - | - | |||||||||
| 1,677,391 | 1,455,717 | 874,980 | ||||||||||
| Operations and projects | ||||||||||||
| Exploration expenses (3) | 2,605,706 | 1,355,007 | 1,419,530 | |||||||||
| Projects expenses | - | - | 237,280 | |||||||||
| General expenses | 1,000,877 | 1,105,733 | 678,792 | |||||||||
| Taxes | 923,895 | 924,620 | 957,407 | |||||||||
| Provision and provision recover (4) | 287,770 | 650,660 | 318,629 | |||||||||
| Labor expenses | 268,092 | 231,454 | 277,430 | |||||||||
| Fuel loss | 209,742 | 100,857 | 83,039 | |||||||||
| Contributions and donations | 118,215 | 44,661 | 39,293 | |||||||||
| Audit fees | 101,223 | 95,062 | 55,786 | |||||||||
| Previous year | 60,027 | 50,160 | (124,167 | ) | ||||||||
| Transportation via gas pipelines | 13,996 | 17,287 | 136,573 | |||||||||
| Maintenance | 2,399 | 8,485 | 19,018 | |||||||||
| 5,591,942 | 4,583,986 | 4,098,610 | ||||||||||
| Total operating expenses | 7,269,333 | 6,039,703 | 4,973,590 | |||||||||
| F-43 |
Ecopetrol S.A. and Subsidiaries
Notes to the Consolidated Financial Statements
Years ended December 31, 2014, 2013 and 2012
(Expressed in millions of Colombian pesos)
| (1) | Includes mainly goodwill amortization at the companies: Polipropileno del Caribe S.A., Oleoducto Central S.A., Hocol S.A., Andean Chemicals Ltd., Offshore International Group and Equión Energía Limited in the amount of $221,743 (2013 - $282,400). |
| (2) | Expenses associated to the plants that are out of service as a result of the general shutdown of the Refinería de Cartagena since March 2014. |
| (3) | Exploratory expenses in 2014 correspond mainly to dry wells amounting to $1,484,670 (2013 - $571,070) related to Ecopetrol $468,652, Ecopetrol America Inc $462,060, Ecopetrol Germany $285,241, Hocol $151,950 y Ecopetrol Oleo & Gas de Brasil $116,718, and geological and geophysical studies for $974,868 (2013 - $773,255). |
| (4) | The detail of operating provisions, for the years ended December 31, are the following: |
| Allowance (Recovery) | 2014 | 2013 | 2012 | |||||||||
| Oil investments (see note 11) | 258,408 | - | - | |||||||||
| Pension transfer | 137,557 | 833,248 | 23,087 | |||||||||
| Inventories | 29,512 | 13,449 | 2,493 | |||||||||
| Receivables | 3,082 | 28,964 | 86,961 | |||||||||
| Property, plant and equipment | 65,458 | 54,515 | 144,525 | |||||||||
| Litigations | (202,709 | ) | (194,299 | ) | 333,578 | |||||||
| Other | (3,538 | ) | (85,217 | ) | (272,015 | ) | ||||||
| Operating provisions, net | 287,770 | 650,660 | 318,629 | |||||||||
| (26) | Finance income (expenses), net |
Net financial expenses for the years ended December 31, is comprised as follows:
| 2014 | 2013 | 2012 | ||||||||||
| Income: | ||||||||||||
| Foreign exchange gain | 9,069,249 | 3,219,704 | 4,087,029 | |||||||||
| Yields and interest | 467,073 | 461,303 | 383,795 | |||||||||
| Equity method profit | 173,603 | 120,060 | 125,474 | |||||||||
| Dividends in cash | 54,352 | 66,635 | 32,541 | |||||||||
| Investment portfolio valuation earnings | 22,540 | 59,608 | 178,076 | |||||||||
| Others | 3,585 | 8,328 | 5,647 | |||||||||
| Hedging transactions | 2,806 | 2,847 | 20,906 | |||||||||
| 9,793,208 | 3,938,485 | 4,833,468 | ||||||||||
| Expenses: | ||||||||||||
| Foreign exchange loss | 9,326,984 | 3,201,732 | 4,396,159 | |||||||||
| Interest | 817,546 | 592,643 | 581,597 | |||||||||
| Hedging transactions | 141,347 | 14,148 | 4,253 | |||||||||
| Equity method loss | 128,689 | - | 197 | |||||||||
| Administration and issuance of securities | - | - | 59 | |||||||||
| Other minor expenses | 50,132 | 84,310 | 19,092 | |||||||||
| 10,464,698 | 3,892,833 | 5,001,357 | ||||||||||
| Net | (671,490 | ) | 45,652 | (167,889 | ) | |||||||
| F-44 |
Ecopetrol S.A. and Subsidiaries
Notes to the Consolidated Financial Statements
Years ended December 31, 2014, 2013 and 2012
(Expressed in millions of Colombian pesos)
| (27) | Pension expenses |
Pension expenses for the years ended December 31, is comprised as follows:
| 2014 | 2013 | 2012 | ||||||||||
| Amortization of actuarial calculation and pensions | 265,668 | 196,747 | 688,693 | |||||||||
| Health care services | 234,127 | 226,643 | 204,269 | |||||||||
| Education services | 55,451 | 55,347 | 55,493 | |||||||||
| 555,246 | 478,737 | 948,455 | ||||||||||
| (28) | Other income (expenses) net |
Other income (expenses), net, for the years ended December 31, is comprised as follows:
| 2014 | 2013 | 2012 | ||||||||||
| Other income | ||||||||||||
| Deferred BOMT income | 140,372 | 130,690 | 125,542 | |||||||||
| Other minor income | 138,916 | 221,361 | 132,714 | |||||||||
| Recovery of expenses | 60,092 | 285,723 | 61,443 | |||||||||
| Earnings from the sale of materials and property, plant and equipment | 34,994 | 111,760 | 5,052 | |||||||||
| Compensation received | 24,673 | 14,326 | 19,512 | |||||||||
| Income from services | 5,159 | 20,792 | 18,551 | |||||||||
| Income prior years | 14 | - | - | |||||||||
| Recovery of exploration expenses | - | - | 23,722 | |||||||||
| Recovery of services to associates | - | - | 4,743 | |||||||||
| Assigned rights revenue | - | 73,494 | 725 | |||||||||
| 404,220 | 858,146 | 392,004 | ||||||||||
| Other expenses | ||||||||||||
| Loss on fixed assets write-off | 163,026 | 32,993 | 1,495 | |||||||||
| Gas pipeline availability under BOMT contracts | 102,916 | 102,819 | 108,134 | |||||||||
| Other minor expenses | 66,853 | 241,927 | 274,897 | |||||||||
| Provisions | 11,244 | - | - | |||||||||
| Taxes | 8,154 | - | - | |||||||||
| Expenses from prior years – net | 5,419 | - | - | |||||||||
| Contributions and donations | 1,114 | - | - | |||||||||
| 358,726 | 377,739 | 384,526 | ||||||||||
| 45,494 | 480,407 | 7,478 | ||||||||||
| F-45 |
Ecopetrol S.A. and Subsidiaries
Notes to the Consolidated Financial Statements
Years ended December 31, 2014, 2013 and 2012
(Expressed in millions of Colombian pesos)
| (29) | Contingencies |
The following is a summary of the most significant proceedings with claims above $10,000, for which allowances have been recognized, according to evaluations by the Company’s internal and external advisors, as of December 31, 2014 and 2013:
| Proceeding | Suit | 2014 | 2013 | |||||||
| Municipality of Arauca | Class action suit. Contributions to the solidarity and electric-power-generation income redistribution fund, pursuant to Law 142 of 1994. | 141,505 | 283,010 | |||||||
| Garcero partnership contract | Class action suit by Luis Enrique Olivera Petro against Ecopetrol, the Nation, the Ministry of Mines and others, on the extension of the Garcero partnership contract. | 77,592 | 155,184 | |||||||
| Compensation for damages for hydrocarbon easement | Proceeding for damages for easement in property preventing its use and exploitation. | 11,019 | - | |||||||
| Reassessment of salaries, social benefits and/or pension based at CCTV | Labor proceeding of 2007 for the reassessment of salaries and social benefits to 232 Ecopetrol contractors. Claimants Marcos Leonel Sánchez Jaimes and others. | 10,060 | - | |||||||
| Salary Impact – Saving Stimulus suit | Proceeding to reassess social, legal and extralegal benefit payments and monthly pension payments made under the saving stimulus heading. | 4,731 | 18,689 | |||||||
| Offshore Exploration and Production, LLC | International Court of Arbitration. In the framework of the purchase of Offshore International Group, the Seller (Offshore Exploration and Production, LLC) filed a claim against the Buyers (Ecopetrol and KNOC) in an international arbitration court, before the International Center of Dispute Resolution, seeking to establish the liability limits acquired and established in the Purchase Contract, with the aim of being able to reject claims and requests for compensation presented by Ecopetrol and KNOC to the Seller. Ecopetrol and KNOC filed a counterclaim. A favorable ruling in the proceedings was obtained in the second half of 2014. | - | 23,122 | |||||||
As of December 31, 2014, the balance of the allowance for legal proceedings amounts to $279,261 (2013 - $516,446).
| (30) | Commitments |
Gas supply contracts
In addition to existing contracts, the Company has concluded new gas sale or supply contracts with third parties, such as Surtigas S.A. E.S.P., Gases del Caribe S.A. E.S.P., Zona Franca S.A. E.S.P., Gecelca S.A. E.S.P., and Gas Natural S.A. E.S.P.
Ship or Pay contracts
Ecopetrol S.A. and ODL Finance S.A. have signed a Ship or Pay contract under which it is established that the transporter owns a hydrocarbons transportation system called Oleoducto de los Llanos Orientales, under which the transporter commits to providing transportation and custody services for the sender’s crude oil through the pipeline: (i) from the Rubiales pump station to receipt points at Monterrey station and Cusiana station, (ii) under the ‘Ship or Pay’ and ‘Ship and Pay’ modalities, (iii) for the committed capacity equivalent to 221,000 Bpd at 18° API, until 2020. In exchange for the shipping service, the sender must pay a fixed monthly tariff, even if no barrels at all are shipped, corresponding to (i) a volume of 167,000 Bpd of diluted crude oil (GSV), starting on the effective date and until December 31, 2014, (ii) a volume of 149,000 Bpd of diluted crude oil (GSV), from January 1, 2015 until December 31, 2015, and (iii) a volume of 139,000 Bpd of diluted crude oil (GSV), from January 1, 2016 until December 31, 2020, which shall be billed and paid for by the sender under the Ship or Pay modality. In addition, in the event that the nomination exceeds capacity in the ‘Ship or Pay’ modality, the ‘Ship and Pay’ modality shall be applied, which consists of multiplying the number of barrels of diluted crude oil (GSV) nominated in excess, times the tariff, times the number of days in the calendar month being billed, considering that in this modality the number of barrels actually transported must be paid. The contract is effective until December 31, 2020, and renewable.
Bicentenario Ship or Pay contract for crude oil transportation
The contract concluded between Ecopetrol and Oleoducto Bicentenario aims to ensure the financial viability of the construction and maintenance of the Araguaney - Banadía route under a Ship or Pay modality in which the Company shall pay the tariff corresponding to the committed capacity based on its equity participation. During the term of the “Ship or Pay” contract; Ecopetrol pledges to pay Bicentenario a tariff for the committed capacity per number of days in the calendar month, regardless of whether the nominated amount is lower than the committed capacity.
| F-46 |
Ecopetrol S.A. and Subsidiaries
Notes to the Consolidated Financial Statements
Years ended December 31, 2014, 2013 and 2012
(Expressed in millions of Colombian pesos)
According to Exhibit Nº 2 it was established that in the event that the tariff payment start date occurs before the service start date, Ecopetrol pledges to pay the amount calculated in the foregoing paragraph. Said payments shall be processed as follows: provided that Bicentenario can address payment obligations incurred in the construction, operation, maintenance, administration, among others, the amounts corresponding to the tariff paid by Ecopetrol between the tariff payment start date (July 1, 2013) and December 31, 2013 shall be considered payment advances charged to Ecopetrol in favors of Bicentenario. Amounts corresponding to the tariff paid by Ecopetrol starting January 1, 2014 shall be considered amounts actually paid under the Ship or Pay modality; therefore, they shall not be considered an advance and, as such, cannot be allocated or offset by any payment.
The contract shall be effective (i) for the term of the Ship or Pay contract, corresponding to the committed capacity and subject to availability and for the barrels actually transported corresponding to the conditional capacity, and ii) for the term of the Ship and Pay contract, up to Ecopetrol’s committed capacity, and subject to availability and the number of barrels actually transported corresponding to the conditional capacity.
Commitments of Ecopetrol Peru
The local financial statement details the list of bailment letters in force and effect as of this date. According to the Peruvian Organic Act of Hydrocarbons, Article 21 states that:
“In every contract, each period of the exploration phase must have a minimum mandatory work program. Each of these programs will be guaranteed with a bailment the amount of which will be agreed-to with the Contracting Party, which shall be joint and several, unconditional, irrevocable, or immediate realization in Peru, without the benefit of legal seizure and issued by a duly qualified entity of the Financial System, domiciled in the country.” By virtue of this Law, Ecopetrol Peru keeps in force and effect a series of bailment letters that guarantee the commitment of the company to comply with the minimum mandatory work programs in the various sub-stages of exploration of the different oil plots as per the following detail:
| Detail | Maturity | Bailment Letter | % | US | ||||||||||||||||
| Start Date | Number | Description | Beneficiary | Date | Value | Share | Dollars | |||||||||||||
| 24/08/2011 | cf N° oc 110586 52 9800185976 | License Contract Plot 101 | SCOTIABANK PERU SA | 25/01/2015 | 1,521,850 | 30 | % | 456,555 | ||||||||||||
| 28/12/2012 | cf N° oc 110586 52 9800243429 | License Contract Plot 158 | MINISTERIO DE ENERGIA Y MINAS | 25/12/2014 | 66,507 | 100 | % | 66,507 | ||||||||||||
| 28/12/2012 | cf N° oc 110586 55 9800243437 | License Contract Plot 134 | SCOTIABANK PERU SA | 25/12/2014 | 99,760 | 45 | % | 44,892 | ||||||||||||
| 02/10/2013 | cf N° oc 110586 52 9800271686 | License Contract Plot 109 | PERUPETRO SA | 26/03/2015 | 2,100,000 | 30 | % | 630,000 | ||||||||||||
| Total bailment letters | 1,197,954 | |||||||||||||||||||
Commitments of Hocol
On May 2013, Hocol S.A. and Surtigás S.A. E.S.P. signed a “Take or Pay” contract for gas production from Bonga and Mamey field. Hocol as the seller has signed a guarantee in the amount of US$32,700,000 in favor of Surtigás, in order to comply with the obligations under the contract. This guarantee must be in effect during the term of the contract or until the Energy and Gas Regulatory Commission "CREG" (from the Spanish Comisión Reguladora de Energía y Gas) approve all the investments required to expand the capacity of the transportation system of the Atlantic coast in the Mamey, San Mateo, Sincelejo and Cartagena trenches. The expiration date of guarantee is November 30, 2015 (third yearr) and according to the contract it should be renewed and updated thirty days before its expiration and have a term of one year. Hocol should recognize no liability associated with this transaction.
Additionally, the Company has bank collateral amounting to US$ 25,000,000 and twenty-five letters of credit amounting to US$ 46,977,337, which seek to guarantee the different commitments that Hocol has with the National Hydrocarbons Agency (ANH) in the exploration and production contracts. These collaterals have a validity term between 2015 and 2018.
| F-47 |
Ecopetrol S.A. and Subsidiaries
Notes to the Consolidated Financial Statements
Years ended December 31, 2014, 2013 and 2012
(Expressed in millions of Colombian pesos)
| (31) | Subsequent events |
The main subsequent events are listed below:
Fall in international oil and gas prices
The crude oil and natural gas market is characterized by its highly volatile prices. Although prices may fall significantly, in the long term they are determined by supply and demand. Significantly lower oil and gas prices could lead to future losses in assets and reserves if such a fall in prices indicates a long-term trend.
Financing
On February 12, 2015, Ecopetrol obtained a commercial loan for US$1,925 million. The transaction was carried out with the participation of eight international banks: JPMorgan Chase Bank, N.A.; BNP Paribas; Mizuho Bank Ltd.; Bank of America, N.A.; HSBC Bank USA, National Association; Banco Bilbao Vizcaya Argentaria S.A., Grand Cayman Branch; Banco Santander, S.A.; Citibank, N.A. The financing term is five years, with amortization at maturity and interest paid semi-annually at the Libor rate + 140 basis points.
Dry Wells
As disclosed in Note xiv. Ecopetrol charged to expense an amount of $126,427 of capitalized exploratory costs regarding the Bonga, adjustment Blocks 38 and 39, Agrio,Circe, Pasifea, Estracasu, Latino, Pinocho and Pastinaca 5, dry wells declared during first quarter 2015.
Inventories
Received the final reports of volume metric for quality by pipelines, whose main impact is related to higher deliveries of volumes of inventories by third parts, Ecopetrol should recognize more inventories for $15,224 and account payable.
| (32) | Presentation |
Certain line items from the financial statements as of December 31, 2013 were reclassified in order to make the presentation of such financial statements comparable to that of the financial statements as of December 31, 2014, as disclosed in the related notes.
Some details of the tables’s contents may not cross directly with subtotals or totals with other information due to arithmetic rounding.
| F-48 |
Ecopetrol S.A. and Subsidiaries
Notes to the Consolidated Financial Statements
Years ended December 31, 2014, 2013 and 2012
(Expressed in millions of Colombian pesos)
| (33) | Differences between Colombian Governmental Entity accounting principles and U.S. GAAP |
The Company's consolidated financial statements are prepared in accordance with Colombian Government Entity GAAP (RCP). These principles and regulations differ in certain significant aspects from accounting principles generally accepted in the United States of America (U.S. GAAP), and therefore this note presents reconciliations of net income and shareholders’ equity determined under Colombian Government Entity GAAP to those same amounts as determined according to U.S. GAAP. Also presented in this note are those disclosures required under U.S. GAAP but not required under Colombian Government Entity GAAP.
A) Reconciliation of net income attributable to Ecopetrol:
The following table presents the reconciliation of consolidated net income under Colombian Government Entity GAAP to consolidated net income under U.S. GAAP attributable to Ecopetrol for the years ended December 31, 2014, 2013 and 2012:
| 2014 | 2013 | 2012 | ||||||||||||
| Consolidated net income under Colombian Government Entity GAAP | $ | 7,510,270 | $ | 13,106,503 | $ | 14,778,947 | ||||||||
| i. | Investment securities: | |||||||||||||
| a. Unrealized gain (loss) | (1,608 | ) | 75,458 | (45,199 | ) | |||||||||
| b. Impairment | (3,197 | ) | 65,921 | (34,657 | ) | |||||||||
| ii. | Investments in non-marketable securities: | |||||||||||||
| a. Equity method | 240,419 | 66,558 | (109,749 | ) | ||||||||||
| b. Variable interest entity (VIE) | - | 13 | - | |||||||||||
| c. Impairment | (294,931 | ) | (51,664 | ) | 9 | |||||||||
| iii. | Derivatives | 3,160 | (3 | ) | (4,709 | ) | ||||||||
| v. | Deferred charges | 521,356 | 476,091 | 493,159 | ||||||||||
| vi. | Employee benefit plans | (105,137 | ) | (40,439 | ) | (157,893 | ) | |||||||
| vii. | Provisions and contingencies | 273,446 | 802,341 | 141,755 | ||||||||||
| viii. | Assets and liabilities present value | (1,157 | ) | (39,029 | ) | (99,188 | ) | |||||||
| ix. | Deferred income taxes | 1,076,387 | (685,981 | ) | (392,593 | ) | ||||||||
| x. | Revenue recognition: | |||||||||||||
| a. Cost of sales – over and under deliveries | (29,522 | ) | 296,317 | 208,644 | ||||||||||
| b. Other income | (28,096 | ) | 28,242 | 6,100 | ||||||||||
| xi. | Inflation adjustment | 37,282 | 46,283 | 165,867 | ||||||||||
| xii. | Inventories | (9,124 | ) | 30,289 | (16,699 | ) | ||||||||
| xiii. | Lease accounting | (45,470 | ) | (50,101 | ) | (75,203 | ) | |||||||
| xiv. | Property, plant and equipment: | |||||||||||||
| a. Interest | (272,907 | ) | (480,513 | ) | (607,200 | ) | ||||||||
| b. Impairment | (159,300 | ) | (188,615 | ) | (43,609 | ) | ||||||||
| d. Capitalized expenses | (39,104 | ) | (53,987 | ) | 17,685 | |||||||||
| e. Exchange difference | (2,366,138 | ) | (17,953 | ) | 28,793 | |||||||||
| xv. | Depreciation, depletion and amortization | 82,035 | (33,177 | ) | 239,571 | |||||||||
| xvi. | Asset retirement obligations | (46,104 | ) | (41,964 | ) | (117,988 | ) | |||||||
| xvii. | Equity contributions: | |||||||||||||
| a. Incorporated institutional equity | 11,100 | 9,113 | 14,195 | |||||||||||
| b. Reversal of concession rights contributed as capital | 1,780 | 2,280 | 2,725 | |||||||||||
| xviii. | Indebtedness cost | 5,131 | 1,385 | (36 | ) | |||||||||
| xix. | Business combinations: | |||||||||||||
| a. Goodwill | 221,771 | 403,460 | 275,271 | |||||||||||
| xx. | Non-controlling interest | 91,868 | 147,177 | 227,514 | ||||||||||
| xxi. | Cumulative translation adjustment | 145,340 | 72,850 | (199,863 | ) | |||||||||
| Consolidated net income under U.S. GAAP attributable to Ecopetrol | $ | 6,819,550 | $ | 13,946,855 | $ | 14,695,649 | ||||||||
| F-49 |
Ecopetrol S.A. and Subsidiaries
Notes to the Consolidated Financial Statements
Years ended December 31, 2014, 2013 and 2012
(Expressed in millions of Colombian pesos)
B) Reconciliation of shareholders’ equity attributable to Ecopetrol:
The following table presents the reconciliation of Ecopetrol shareholders’ equity under Colombian Government Entity GAAP to Ecopetrol shareholders’ equity under U.S. GAAP attributable to Ecopetrol for the years ended December 31, 2014 and 2013:
| 2014 | 2013 | |||||||||
| Consolidated shareholders’ equity under Colombian Government Entity GAAP | $ | 68,545,972 | $ | 71,119,203 | ||||||
| i. | Investment securities: | |||||||||
| a. Unrealized gain | 1,325,299 | 1,248,863 | ||||||||
| ii. | Investments in non-marketable securities: | |||||||||
| a. Equity method | (1,669,644 | ) | (1,639,221 | ) | ||||||
| b. Variable interest entity (VIE) | 320,600 | 320,600 | ||||||||
| c. Valuation surplus | (1,359,646 | ) | (1,282,966 | ) | ||||||
| d. Impairment | (399,630 | ) | (104,699 | ) | ||||||
| iii. | Derivatives | 1,843 | (2 | ) | ||||||
| iv. | Exchange of non-monetary assets | 1,135,175 | 1,135,175 | |||||||
| v. | Deferred charges | (78,681 | ) | (597,966 | ) | |||||
| vi. | Employee benefit plans | (829,763 | ) | (2,177,494 | ) | |||||
| vii. | Provisions and contingencies | 1,568,010 | 1,294,564 | |||||||
| viii. | Assets and liabilities present value | (40,894 | ) | (39,737 | ) | |||||
| ix. | Deferred income taxes | (3,117,604 | ) | (3,722,236 | ) | |||||
| x. | Revenue recognition: | |||||||||
| a. Over and under deliveries - cost of sales | 88,830 | 117,650 | ||||||||
| b. Other income | (1,113 | ) | 27,112 | |||||||
| xi. | Inflation adjustment | (2,982,062 | ) | (3,022,227 | ) | |||||
| xii. | Inventories | (12,410 | ) | (18,410 | ) | |||||
| xiii. | Lease accounting | 146,811 | 190,612 | |||||||
| xiv. | Property, plant and equipment: | |||||||||
| a. Interest | (1,708,135 | ) | (1,403,746 | ) | ||||||
| b. Impairment | (1,209,286 | ) | (1,046,498 | ) | ||||||
| c. Revaluation of property, plant and equipment and public accounting effect | (24,824,704 | ) | (25,678,134 | ) | ||||||
| d. Capitalized expenses | (655,370 | ) | (616,023 | ) | ||||||
| e. Exchange difference | (5,118,707 | ) | (180,764 | ) | ||||||
| xv. | Depreciation, depletion and amortization | 5,334,250 | 5,357,117 | |||||||
| xvi. | Asset retirement obligations | 45,427 | 93,320 | |||||||
| xvii. | Equity contributions: | |||||||||
| a. Incorporated institutional equity | (19,195 | ) | (28,613 | ) | ||||||
| b. Reversal of concession rights contributed as capital | (12,953 | ) | (14,733 | ) | ||||||
| xviii. | Indebtedness cost | 12,959 | 7,828 | |||||||
| xix. | Business combinations: | |||||||||
| a. Goodwill | 1,283,577 | 1,061,806 | ||||||||
| b. Fair value adjustments to assets and liabilities acquired | (1,405,659 | ) | (1,405,659 | ) | ||||||
| xx. | Non-controlling interest | 2,564,628 | 2,775,478 | |||||||
| xxi. | Cumulative translation adjustment | 5,144,985 | 105,025 | |||||||
| Consolidated Ecopetrol shareholders’ equity under U.S. GAAP | $ | 42,072,910 | $ | 41,875,225 | ||||||
| F-50 |
Ecopetrol S.A. and Subsidiaries
Notes to the Consolidated Financial Statements
Years ended December 31, 2014, 2013 and 2012
(Expressed in millions of Colombian pesos)
C) Supplemental condensed consolidated financial statements under U.S. GAAP
1. Supplemental condensed consolidated balance sheets of the Company as of December 31, 2014 and 2013 in conformity with under U.S. GAAP are presented below:
| 2014 | 2013 | |||||||
| Assets | ||||||||
| Current assets: | ||||||||
| Cash and cash equivalents | $ | 7,982,225 | $ | 8,750,039 | ||||
| Investments | ||||||||
| Available for sale | 2,206,791 | 743,987 | ||||||
| Held to maturity | 4,713 | 99,007 | ||||||
| Trading securities | - | 569,119 | ||||||
| Accounts and notes receivable, net | 6,240,505 | 8,139,457 | ||||||
| Inventories | 2,717,753 | 3,209,523 | ||||||
| Prepaid expenses and other assets | 501,932 | 593,550 | ||||||
| Deferred income taxes | 970,592 | 683,140 | ||||||
| Restricted assets | 102,374 | 123,031 | ||||||
| Total current assets | $ | 20,726,885 | $ | 22,910,853 | ||||
| Long term assets | ||||||||
| Investments | ||||||||
| Available for sale | 295,244 | 1,748,497 | ||||||
| Equity method | 1,033,371 | 1,119,981 | ||||||
| Accounts and notes receivable, net | 878,505 | 541,019 | ||||||
| Restricted assets | 745,781 | 605,915 | ||||||
| Property, plant and equipment, net | 47,329,687 | 36,558,890 | ||||||
| Natural and environmental resources, net | 27,878,388 | 25,181,018 | ||||||
| Goodwill | 1,356,331 | 1,095,047 | ||||||
| Deferred charges and other assets | 903,670 | 1,018,400 | ||||||
| Deferred income taxes | 695,350 | 405,840 | ||||||
| Capital lease | 467,603 | 502,456 | ||||||
| Total assets | $ | 102,310,815 | $ | 91,687,916 | ||||
| Liabilities and shareholders’ equity | ||||||||
| Current liabilities: | ||||||||
| Financial obligations | $ | 1,801,885 | $ | 759,703 | ||||
| Accounts payable and related parties | 9,047,494 | 8,653,917 | ||||||
| Taxes payable | 2,063,632 | 2,975,099 | ||||||
| Dividends Payable | 3,704 | 1,313,596 | ||||||
| Labor and pension plan obligations | 369,206 | 289,629 | ||||||
| Estimated liabilities and provisions | 1,495,142 | 2,047,490 | ||||||
| Capital lease liability | 115,956 | 126,695 | ||||||
| Other short-term liabilities | - | 25,170 | ||||||
| Total current liabilities | $ | 14,897,019 | $ | 16,191,299 | ||||
| Financial obligations, long-term | 33,280,826 | 21,192,120 | ||||||
| Accounts payable, long-term | 201,311 | 56,230 | ||||||
| Capital lease liability | 771,866 | 772,273 | ||||||
| Pension plan obligation and other labor obligations, long-term | 5,408,780 | 6,459,947 | ||||||
| Estimated liabilities and provisions | 2,713,354 | 2,020,030 | ||||||
| Other long-term liabilities | 316,381 | 305,460 | ||||||
| Total long term liabilities | 42,692,518 | 30,806,060 | ||||||
| Total liabilities | 57,589,537 | 46,997,359 | ||||||
| Shareholders’ equity of Ecopetrol | 42,072,910 | 41,875,226 | ||||||
| Non-controlling interest | 2,648,368 | 2,815,331 | ||||||
| Total equity | $ | 44,721,278 | $ | 44,690,557 | ||||
| Total liabilities and shareholders’ equity | $ | 102,310,815 | $ | 91,687,916 | ||||
| F-51 |
Ecopetrol S.A. and Subsidiaries
Notes to the Consolidated Financial Statements
Years ended December 31, 2014, 2013 and 2012
(Expressed in millions of Colombian pesos)
2. Supplemental consolidated statements of income
The consolidated statements of income of the Company for the years ended December 31, 2014, 2013 and 2012 in conformity with under U.S. GAAP are presented below:
| 2014 | 2013 | 2012 | ||||||||||
| Revenue: | ||||||||||||
| Local sales | $ | 26,758,252 | $ | 26,425,495 | $ | 24,918,476 | ||||||
| Foreign sales | 39,359,248 | 42,007,150 | 41,948,661 | |||||||||
| Total revenue | 66,117,500 | 68,432,645 | 66,867,137 | |||||||||
| Cost of sales | 42,173,581 | 40,173,040 | 38,353,685 | |||||||||
| Gross income | 23,943,919 | 28,259,605 | 28,513,452 | |||||||||
| Operating expenses: | ||||||||||||
| Administration | 2,092,609 | 1,457,994 | 2,057,796 | |||||||||
| Selling and projects | 5,389,512 | 3,481,675 | 2,898,693 | |||||||||
| Operating income | 16,461,798 | 23,319,936 | 23,556,963 | |||||||||
| Non-operating income, net | (2,900,026 | ) | (58,573 | ) | (1,143,481 | ) | ||||||
| Income before income tax | 13,561,772 | 23,261,363 | 22,413,482 | |||||||||
| Income tax: | ||||||||||||
| Current income tax | 6,731,655 | 8,291,571 | 7,095,874 | |||||||||
| Deferred income tax | (672,974 | ) | 483,248 | 430,114 | ||||||||
| 6,058,681 | 8,774,819 | 7,525,988 | ||||||||||
| Net income | 7,503,091 | 14,486,544 | 14,887,494 | |||||||||
| Less: Net income attributable to non-controlling interest | (683,541 | ) | (539,689 | ) | (191,845 | ) | ||||||
| Net Income attributable to Ecopetrol | $ | 6,819,550 | $ | 13,946,855 | $ | 14,695,649 | ||||||
| Earnings per share (Basic) attributable to Ecopetrol common shareholders | $ | 165.86 | $ | 339.20 | $ | 357.41 | ||||||
| Weighted-average shares outstanding (Basic) | 41,116,698,456 | 41,116,698,456 | 41,116,698,456 | |||||||||
| F-52 |
Ecopetrol S.A. and Subsidiaries
Notes to the Consolidated Financial Statements
Years ended December 31, 2014, 2013 and 2012
(Expressed in millions of Colombian pesos)
3. Supplemental consolidated comprehensive income
| 2014 | 2013 | 2012 | ||||||||||
| Net income | $ | 7,503,091 | $ | 14,486,544 | $ | 14,887,494 | ||||||
| Other comprehensive income, net of tax: | ||||||||||||
| Unrealized gain (loss) on investment securities, net of tax: | 80,127 | 44,293 | 18,088 | |||||||||
| Unrealized actuarial gain (loss), net of tax | 958,893 | 731,709 | (57,500 | ) | ||||||||
| Translation gain (loss) adjustment | 3,250,928 | 1,556,233 | (943,192 | ) | ||||||||
| Total other comprehensive income | 4,289,948 | 2,332,236 | (982,604 | ) | ||||||||
| Comprehensive income | 11,793,039 | 16,929,458 | 13,904,890 | |||||||||
| Comprehensive income attributable to the non-controlling interest | (905,085 | ) | (627,438 | ) | (141,999 | ) | ||||||
| Comprehensive income attributable to Ecopetrol | $ | 10,887,954 | 16,191,692 | $ | 13,762,891 | |||||||
A reconciliation of accumulated other comprehensive income attributable to Ecopetrol, including the related income tax effects, is presented below:
| 2014 | ||||||||||||
| Before-Income Tax Amount | Income Tax (Expense) Benefit | Net of Income Tax Amount | ||||||||||
| Unrealized gain on securities available for sale | $ | 1,320,531 | $ | 468 | $ | 1,320,999 | ||||||
| Pension liability – net unamortized actuarial gain (loss) | (1,658,862 | ) | 532,894 | (1,125,968 | ) | |||||||
| Cumulative translation adjustment | 3,022,171 | - | 2,759,348 | |||||||||
| Other comprehensive income (loss) | $ | 2,683,840 | $ | 533,362 | $ | 2,954,379 | ||||||
| 2013 | ||||||||||||
| Before-Income Tax Amount | Income Tax (Expense) Benefit | Net of Income Tax Amount | ||||||||||
| Unrealized gain on securities available for sale | $ | 1,239,347 | $ | 1,457 | $ | 1,240,804 | ||||||
| Pension liability – net unamortized actuarial gain (loss) | (3,111,731 | ) | 1,026,871 | (2,084,860 | ) | |||||||
| Cumulative translation adjustment | (7,144 | ) | - | (7,495 | ) | |||||||
| Other comprehensive income (loss) | $ | (1,879,528 | ) | $ | 1,028,326 | $ | (851,552 | ) | ||||
| 2012 | ||||||||||||
| Before-Income Tax Amount | Income Tax (Expense) Benefit | Net of Income Tax Amount | ||||||||||
| Unrealized gain (loss) on securities available for sale | $ | 1,242,990 | $ | (46,437 | ) | $ | 1,196,553 | |||||
| Pension liability – net unamortized actuarial gain (loss) | (4,203,835 | ) | 1,387,265 | (2,816,570 | ) | |||||||
| Cumulative translation adjustment | (1,476,022 | ) | - | (1,476,022 | ) | |||||||
| Other comprehensive income (loss) | $ | (4,436,867 | ) | $ | 1,340,828 | $ | (3,096,039 | ) | ||||
The following table axplain the reclasifications out of Accumulated Other Comprehensive Income for the period ended december 31, 2014, 2013 and 2012
| Unrealized Gains and Losses on available-for-sale Securities | ||||||||||||
| 2014 | 2013 | 2012 | ||||||||||
| Beginning Balance | $ | 1,240,803 | $ | 1,196,553 | $ | 1,178,586 | ||||||
| Other Comprehensive income before reclasifications | 78,807 | 180,951 | 49,918 | |||||||||
| Amounts reclassified from accumulated other comprehensive income (a) | 1,389 | (136,701 | ) | (31,951 | ) | |||||||
| Net current-period other comprehensive income | 80,196 | 44,250 | 17,967 | |||||||||
| Ending Balance | $ | 1,320,999 | $ | 1,240,803 | $ | 1,196,553 | ||||||
(a) Affected Line item in the statement Where Net Income Is Presented: Realized gain/ (loss) on sale of securities
| F-53 |
Ecopetrol S.A. and Subsidiaries
Notes to the Consolidated Financial Statements
Years ended December 31, 2014, 2013 and 2012
(Expressed in millions of Colombian pesos)
4. Supplemental condensed consolidated statements of cash flows
The statements of cash flows of the Company for the years ended December 31, 2014, 2013 and 2012 under U.S. GAAP are presented below:
| 2014 | 2013 | 2012 | ||||||||||
| Cash flows provided by operating activities: | ||||||||||||
| Net income | $ | 6,819,550 | $ | 13,946,855 | $ | 14,695,649 | ||||||
| Adjustments to reconcile net income to cash provided by operating activities: | ||||||||||||
| Non-controlling interest | 683,540 | 539,689 | 191,845 | |||||||||
| Equity method in non-marketable securities | (204,657 | ) | (185,514 | ) | (15,528 | ) | ||||||
| Depreciation, depletion and amortization | 5,500,002 | 4,849,461 | 4,977,009 | |||||||||
| Accretion Expense | 202,013 | 177,545 | 148,593 | |||||||||
| Capitalized exploratory well costs charged to expense | 854,265 | 939,419 | 278,254 | |||||||||
| Impairment | 787,905 | 377,792 | 276,147 | |||||||||
| Provisions | 58,507 | (219,692 | ) | 431,293 | ||||||||
| Deferred income tax | (672,974 | ) | 483,248 | 428,559 | ||||||||
| Exchange gain (loss) | 2,379,089 | (84,783 | ) | 267,125 | ||||||||
| Loss on retirement of property, plant and equipment | 467,919 | 19,678 | 64,385 | |||||||||
| Losses in retirement of natural and environmental resources | 734 | 19,438 | 358,599 | |||||||||
| Net changes in operating assets and liabilities: | ||||||||||||
| Accounts and notes receivable | 1,193,872 | (3,922,852 | ) | (1,099,884 | ) | |||||||
| Inventories | 531,820 | (472,975 | ) | (423,073 | ) | |||||||
| Deferred charges and other assets | 432,357 | (231,681 | ) | (1,060,411 | ) | |||||||
| Accounts payable and related parties | (289,620 | ) | 1,186,615 | 2,668,864 | ||||||||
| Taxes payable | (918,056 | ) | (785,356 | ) | (2,890,533 | ) | ||||||
| Labor obligations | 149,675 | 165,724 | 888,708 | |||||||||
| Estimated liabilities and provisions | (936,036 | ) | (41,752 | ) | (58,268 | ) | ||||||
| Net cash provided by operating activities | 17,039,905 | 16,760,859 | 20,127,333 | |||||||||
| Cash flows from investing activities: | ||||||||||||
| Dividends received | 80,147 | 73,501 | 32,541 | |||||||||
| Purchase of investment securities | (5,453,019 | ) | (7,656,234 | ) | (15,281,566 | ) | ||||||
| Redemption of investment securities | 7,106,488 | 11,933,853 | 14,458,913 | |||||||||
| Proceeds from sales of property, plant and equipment | 80,114 | 103,753 | - | |||||||||
| Investment in natural and environmental resources | (8,075,147 | ) | (6,278,439 | ) | (5,872,995 | ) | ||||||
| Additions to property, plant and equipment | (7,295,534 | ) | (7,226,860 | ) | (9,350,074 | ) | ||||||
| Net cash used in investing activities | (13,556,951 | ) | (9,050,426 | ) | (16,013,181 | ) | ||||||
| Cash flows from financing activities: | ||||||||||||
| Payment of financial obligations | (1,461,438 | ) | (3,207,566 | ) | (1,203,309 | ) | ||||||
| Proceeds from financial obligations | 8,658,650 | 10,727,037 | 5,995,738 | |||||||||
| Proceeds from issuance of shares | 41 | 82 | 171,582 | |||||||||
| Cash paid to acquire a non-controlling interest | - | - | (1,917 | ) | ||||||||
| Dividends paid | (12,558,250 | ) | (14,570,466 | ) | (8,419,331 | ) | ||||||
| Net cash used in financing activities | (5,360,997 | ) | (7,050,913 | ) | (3,457,237 | ) | ||||||
| Effect of exchange rate changes on cash | 1,110,229 | 118,184 | 241,870 | |||||||||
| Net increase (decrease) in cash and cash equivalents | (1,878,043 | ) | 659,520 | 656,915 | ||||||||
| Cash and cash equivalents at beginning of year | 8,750,039 | 7,972,335 | 7,073,550 | |||||||||
| Cash and cash equivalents at end of year | $ | 7,982,225 | $ | 8,750,039 | $ | 7,972,335 | ||||||
| F-54 |
Ecopetrol S.A. and Subsidiaries
Notes to the Consolidated Financial Statements
Years ended December 31, 2014, 2013 and 2012
(Expressed in millions of Colombian pesos)
| 2014 | 2013 | 2012 | ||||||||||
| Supplemental cash flows information | ||||||||||||
| Cash paid during the year | ||||||||||||
| Interest | $ | 1,113,264 | $ | 581,541 | $ | 732,335 | ||||||
| Income taxes | $ | 5,168,043 | $ | 7,289,682 | $ | 8,320,779 | ||||||
| Non-cash transactions | ||||||||||||
| Assets acquired through capital lease contracts | $ | 3,658 | $ | 8,460 | $ | 260,648 | ||||||
| Increase of natural and environmental resources through asset retirement obligations | $ | 666,912 | $ | 417,238 | $ | (156,871 | ) | |||||
Under Colombian Government Entity GAAP as in effect from 2007, some deposits with banks were considered as short-term investments since they produced yields and the Company has defined them to be used for specific purposes. Under U.S. GAAP, these deposits are considered cash and are valued at fair value. The amounts reclassified as of December 31, 2014 was $719, as of December 31, 2013 was $119.
| F-55 |
Ecopetrol S.A. and Subsidiaries
Notes to the Consolidated Financial Statements
Years ended December 31, 2014, 2013 and 2012
(Expressed in millions of Colombian pesos)
5. Supplemental consolidated statements of shareholders’ equity.
The statements of shareholders’ equity of the Company for the years ended December 31, 2014, 2013 and 2012 under U.S. GAAP as follows:
| Common Stock | ||||||||||||||||||||||||||||||||||||
| Millions of shares | Value | Additional paid- in-capital | Comprehensive Income | Retained earnings | Accumulated Other Comprehensive income (loss) | Ecopetrol’s Equity | Non- Controlling Interest | Total Equity | ||||||||||||||||||||||||||||
| Balance at December 31, 2011 | 41,117 | $ | 10,279,175 | $ | 5,215,300 | $ | 22,723,983 | $ | (2,163,281 | ) | $ | 36,055,173 | $ | 2,288,119 | $ | 38,343,292 | ||||||||||||||||||||
| Acquired non-controlling interest | - | - | - | - | (689 | ) | - | (689 | ) | (1,125 | ) | (1,814 | ) | |||||||||||||||||||||||
| Other non-controlling interest | - | - | - | - | (103 | ) | - | (103 | ) | - | (103 | ) | ||||||||||||||||||||||||
| Spin-off | (37 | ) | (37 | ) | ||||||||||||||||||||||||||||||||
| Issuance of Company shares | - | - | 166,090 | - | - | - | 166,090 | 5,492 | 171,582 | |||||||||||||||||||||||||||
| Distribution of dividends ($300 per share) | - | - | - | - | (12,335,009 | ) | - | (12,335,009 | ) | - | (12,335,009 | ) | ||||||||||||||||||||||||
| Comprehensive income: | ||||||||||||||||||||||||||||||||||||
| Net income | - | - | - | $ | 14,887,494 | 14,695,648 | - | 14,695,648 | 191,845 | 14,887,493 | ||||||||||||||||||||||||||
| Other comprehensive income, net of tax: | ||||||||||||||||||||||||||||||||||||
| Unrealized earnings on investment securities, net of tax effect of $(27,734) | - | - | - | 18,088 | - | - | 17,967 | 121 | 18,088 | |||||||||||||||||||||||||||
| Actuarial (loss), net of tax effect of $27,522 | - | - | - | (57,500 | ) | - | - | (57,500 | ) | - | (57,500 | ) | ||||||||||||||||||||||||
| Translation adjustment | - | - | - | (943,192 | ) | - | - | (893,225 | ) | (49,967 | ) | (943,192 | ) | |||||||||||||||||||||||
| Total other comprehensive income | - | - | - | $ | (982,604 | ) | - | (932,758 | ) | - | - | - | ||||||||||||||||||||||||
| Comprehensive income | - | - | - | $ | 13,904,890 | - | - | - | - | - | ||||||||||||||||||||||||||
| Balance at December 31, 2012 | 41,117 | $ | 10,279,175 | $ | 5,381,390 | - | $ | 25,083,830 | $ | (3,096,039 | ) | $ | 37,648,352 | $ | 2,434,448 | $ | 40,082,800 | |||||||||||||||||||
| Other non-controlling interest | - | - | - | - | 14 | 14 | 14 | |||||||||||||||||||||||||||||
| Issuance of Company shares | - | - | 127 | - | - | 127 | 9,164 | 9,291 | ||||||||||||||||||||||||||||
| Distribution of dividends ($291 per share) | - | - | - | - | (11,964,960 | ) | (11,964,960 | ) | (255,719 | ) | (12,220,679 | ) | ||||||||||||||||||||||||
| Comprehensive income: | ||||||||||||||||||||||||||||||||||||
| Net income | - | - | - | $ | 14,486,544 | 13,946,855 | - | 13,946,855 | 539,689 | 14,486,544 | ||||||||||||||||||||||||||
| Other comprehensive income, net of tax: | ||||||||||||||||||||||||||||||||||||
| Unrealized earnings on investment securities, net of tax effect of $47,894 | - | - | - | 44,293 | - | - | 44,250 | 43 | 44,293 | |||||||||||||||||||||||||||
| Actuarial (loss), net of tax effect of $(360,396) | - | - | - | 731,709 | - | - | 731,709 | - | 731,709 | |||||||||||||||||||||||||||
| Translation adjustment | - | - | - | 1,556,584 | - | - | 1,468,878 | 87,706 | 1,556,584 | |||||||||||||||||||||||||||
| Total other comprehensive income | - | - | - | $ | 2,332,586 | - | 2,244,837 | - | - | - | ||||||||||||||||||||||||||
| Comprehensive income | - | - | - | $ | 16,819,130 | - | - | - | - | - | ||||||||||||||||||||||||||
| Balance at December 31, 2013 | 41,117 | $ | 10,279,175 | $ | 5,381,517 | $ | 27,065,740 | $ | (851,202 | ) | $ | 41,875,226 | $ | 2,815,331 | $ | 44,690,558 | ||||||||||||||||||||
| Other non-controlling interest | - | - | - | - | - | - | (48 | ) | (48 | ) | ||||||||||||||||||||||||||
| Issuance of Company shares | - | - | 72 | - | - | 72 | 3,578 | 3,650 | ||||||||||||||||||||||||||||
| Distribution of dividends ($260 per share) | - | - | - | - | (10,690,342 | ) | (10,690,342 | ) | (1,075,159 | ) | (11,765,501 | ) | ||||||||||||||||||||||||
| Return of capital due to a spin-off | - | - | - | - | - | - | (420 | ) | (420 | ) | ||||||||||||||||||||||||||
| Comprehensive income: | ||||||||||||||||||||||||||||||||||||
| Net income | - | - | - | $ | 7,503,091 | 6,819,550 | - | 6,819,550 | 683,541 | 7,503,091 | ||||||||||||||||||||||||||
| Other comprehensive income, net of tax: | ||||||||||||||||||||||||||||||||||||
| Unrealized earnings on investment securities, net of tax effect of $(989) | - | - | - | 80,127 | - | - | 80,196 | (69 | ) | 80,127 | ||||||||||||||||||||||||||
| Actuarial (loss), net of tax effect of $ (493,975) | - | - | - | 958,893 | - | - | 958,893 | - | 958,893 | |||||||||||||||||||||||||||
| Translation adjustment | - | - | - | 3,250,928 | - | - | 3,029,315 | 221,614 | 3,250,929 | |||||||||||||||||||||||||||
| Total other comprehensive income | - | - | - | $ | 4,289,948 | - | 4,068,404 | - | - | - | ||||||||||||||||||||||||||
| Comprehensive income | - | - | - | $ | 11,793,039 | - | - | - | - | - | ||||||||||||||||||||||||||
| Balance at December 31, 2014 | 41,117 | $ | 10,279,175 | $ | 5,381,589 | $ | 23,194,948 | $ | 3,217,202 | $ | 42,072,910 | $ | 2,648,368 | $ | 44,721,278 | |||||||||||||||||||||
| F-56 |
Ecopetrol S.A. and Subsidiaries
Notes to the Consolidated Financial Statements
Years ended December 31, 2014, 2013 and 2012
(Expressed in millions of Colombian pesos)
D) Summary of significant differences between Colombian Government Entity GAAP and U.S. GAAP and required U.S. GAAP disclosures
| i. | INVESTMENT SECURITIES |
The Company’s investments include both marketable and non-marketable securities. Under Colombian Government Entity GAAP, the Company classifies investment securities based on the form of their investment return, either as fixed-yield investment or as variable-yield investments. Fixed-yield investments generally represent debt securities and are initially recorded at cost with subsequent adjustments to fair value recorded in the income statement. Variable-yield investments generally represent equity securities or interests in other entities and are initially recorded at cost. Subsequent adjustments to fair value are made with increases in fair value resulting in an increase to equity, while decreases in fair value are charged to the income statement. Fair values are determined using quoted market prices, if and when available. In the absence of quoted market prices, these investments are recorded at Management’s estimate of fair value using discounted cash flow techniques.
Under U.S. GAAP, the Company has classified its investment securities as held to maturity or available for sale, as defined in ASC 320-10-25, Accounting for Certain Investments in Debt and Equity Securities. Debt security investments for which the Company has demonstrated its ability and intent to hold until maturity are classified as held-to-maturity. Such investments are reported at amortized cost. Investments classified as available-for-sale are reported at fair value, with unrealized gains and losses reported, net of taxes, as a component of other comprehensive income. Investment held for trading securities are recorded at fair value with unrealized holding gains and losses included in net income.
In the event that any other than temporary impairment of the investments value occurs, the impairment loss is recorded in net income.
The Company’s short-term and long-term investments at December 31, 2014, 2013, and 2012 consist of the following:
| As of December 31, 2014 | Aggregated Fair Value | Gross Unrealized Holding Gains | Gross Unrealized Holding Losses | Gross Recognized Losses | Cost Basis | |||||||||||||||
| Short-term investments – available for sale securities: | ||||||||||||||||||||
| Securities issued or secured by Colombian government | $ | 140,338 | $ | 192 | $ | - | $ | - | $ | 104,146 | ||||||||||
| Securities issued or secured by the U.S. government | 6,939 | 2 | - | - | 6,936 | |||||||||||||||
| Securities issued or secured by financial entities | 453,905 | 55 | - | - | 453,905 | |||||||||||||||
| Other debt securities | 24,216 | 12 | - | - | 24,201 | |||||||||||||||
| Securities issued by mixed – economy governmental entities | 1,581,393 | 1,320,395 | 260,998 | |||||||||||||||||
| Total short-term investments classified as available for sale | $ | 2,206,791 | $ | 1,320,656 | $ | (1 | ) | $ | - | $ | 886,136 | |||||||||
| Long-term investments – available for sale securities: | ||||||||||||||||||||
| Securities issued or secured by Colombian government | 43,025 | - | (455 | ) | - | 43,480 | ||||||||||||||
| Securities issued or secured by government sponsored enterprise (GSEs) | 124,620 | 6 | (134 | ) | - | 124,749 | ||||||||||||||
| Securities issued or secured by financial entities | 2,324 | - | (2 | ) | - | 2,326 | ||||||||||||||
| Securities issued or secured by the U.S. government | 116,083 | 28 | (46 | ) | - | 116,102 | ||||||||||||||
| Other debt securities | 9,192 | - | (4 | ) | - | 9,195 | ||||||||||||||
| Securities issued by mixed- economy governmental entities | - | 5 | (4 | ) | - | (2 | ) | |||||||||||||
| Total long-term investments classified as available for sale | $ | 295,244 | $ | 39 | $ | (646 | ) | $ | - | $ | 295,851 | |||||||||
| Total available for sale | $ | 2,502,035 | $ | 1,320,695 | $ | (646 | ) | $ | - | $ | 1,181,987 | |||||||||
| Aggregated Fair Value | Gross Unrealized Holding Gains | Gross Unrealized Holding Losses | Net Carrying Amount | |||||||||||||
| Short-term investments – held to maturity securities: | ||||||||||||||||
| Other debt securities | $ | 4,713 | $ | - | $ | - | $ | 4,713 | ||||||||
| Total short-term investments classified as held to maturity | $ | 4,713 | $ | - | $ | - | $ | 4,713 | ||||||||
| Total held to maturity | $ | 4,713 | $ | - | $ | - | $ | 4,713 | ||||||||
| As of December 31, 2013 | Aggregated Fair Value | Gross Unrealized Holding Gains | Gross Unrealized Holding Losses | Gross Recognized Losses | Cost Basis | |||||||||||||||
| Short-term Investments – available for sale securities: | ||||||||||||||||||||
| Securities issued or secured by Colombian government | $ | 100,299 | $ | 130 | $ | (825 | ) | $ | - | $ | 100,994 | |||||||||
| Securities issued or secured by financial entities | 643,688 | 7 | - | - | 643,681 | |||||||||||||||
| Other debt securities | - | - | - | - | - | |||||||||||||||
| Total short-term investments classified as available for sale | 743,987 | 137 | (825 | ) | - | 744,675 | ||||||||||||||
| Long-term investments – available for sale securities: | ||||||||||||||||||||
| Securities issued or secured by Colombian government | 110,195 | - | (1,668 | ) | - | 111,863 | ||||||||||||||
| Securities issued or secured by government sponsored enterprise (GSEs) | 42,129 | 13 | (29 | ) | - | 42,145 | ||||||||||||||
| Securities issued or secured by financial entities | 8,136 | - | (1 | ) | - | 8,137 | ||||||||||||||
| Securities issued or secured by the U.S. government | 73,794 | 76 | - | - | 73,718 | |||||||||||||||
| Other debt securities | 9,286 | - | (108 | ) | - | 9,394 | ||||||||||||||
| Securities issued by mixed- economy governmental entities | 1,504,957 | 1,243,959 | - | - | 260,998 | |||||||||||||||
| Total long-term investments classified as available for sale | 1,748,497 | 1,244,048 | (1,806 | ) | - | 506,255 | ||||||||||||||
| Total available for sale | $ | 2,492,484 | $ | 1,244,185 | $ | (2,631 | ) | $ | - | $ | 1,250,930 | |||||||||
| F-57 |
Ecopetrol S.A. and Subsidiaries
Notes to the Consolidated Financial Statements
Years ended December 31, 2014, 2013 and 2012
(Expressed in millions of Colombian pesos)
| Aggregated Fair Value | Gross Unrealized Holding Gains | Gross Unrealized Holding Losses | Net Carrying Amount | |||||||||||||
| Short-term investments – held to maturity securities: | ||||||||||||||||
| Securities issued or secured by Colombian government | $ | 98,039 | $ | 3,950 | $ | - | $ | 94,089 | ||||||||
| Other debt securities | 1,692 | - | (3,226 | ) | 4,918 | |||||||||||
| Total short-term investments classified as held to maturity | 99,731 | 3,950 | (3,226 | ) | 99,007 | |||||||||||
| Total held to maturity | $ | 99,731 | $ | 3,950 | $ | (3,226 | ) | $ | 99,007 | |||||||
| As of December 31, 2012 | Aggregated Fair Value | Gross Unrealized Holding Gains | Gross Unrealized Holding Losses | Gross Recognized Losses | Cost Basis | |||||||||||||||
| Short-term Investments – available for sale securities: | ||||||||||||||||||||
| Securities issued or secured by Colombian government | $ | 844,764 | $ | 29,365 | $ | (41 | ) | $ | (27,899 | ) | $ | 843,338 | ||||||||
| Securities issued or secured by government sponsored enterprise (GSEs) | 92,536 | - | (57 | ) | - | 92,594 | ||||||||||||||
| Securities issued or secured by financial entities | 197,933 | 989 | (5 | ) | (734 | ) | 197,683 | |||||||||||||
| Other debt securities | 196,432 | 1,000 | (90 | ) | (967 | ) | 196,490 | |||||||||||||
| Total short-term investments classified as available for sale | $ | 1,331,665 | $ | 31,354 | $ | (193 | ) | $ | (29,600 | ) | $ | 1,330,105 | ||||||||
| Long-term investments – available for sale securities: | ||||||||||||||||||||
| Securities issued or secured by Colombian government | 2,156,611 | 59,719 | (1,059 | ) | (17,363 | ) | 2,115,315 | |||||||||||||
| Securities issued or secured by government sponsored enterprise (GSEs) | 1,545,377 | 3,466 | (401 | ) | (2,865 | ) | 1,545,178 | |||||||||||||
| Securities issued or secured by financial entities | 18,112 | 362 | - | (309 | ) | 18,059 | ||||||||||||||
| Securities issued or secured by the U.S. government | 44,265 | 18 | - | - | 44,247 | |||||||||||||||
| Other debt securities | 464,202 | 5,103 | (283 | ) | (2,466 | ) | 461,847 | |||||||||||||
| Securities issued by mixed- economy governmental entities | 1,367,178 | 1,106,181 | - | - | 260,998 | |||||||||||||||
| Total long-term investments classified as available for sale | $ | 5,595,745 | $ | 1,174,849 | $ | (1,743 | ) | $ | (23,003 | ) | $ | 4,445,644 | ||||||||
| Total available for sale | $ | 6,927,410 | $ | 1,206,203 | $ | (1,936 | ) | $ | (52,603 | ) | $ | 5,775,749 | ||||||||
| Aggregated Fair Value | Gross Unrealized Holding Gains | Gross Unrealized Holding Losses | Net Carrying Amount | |||||||||||||
| Short-term investments – held to maturity securities: | ||||||||||||||||
| Other debt securities | $ | 2,411 | $ | - | $ | (2,642 | ) | $ | 5,054 | |||||||
| Total short-term investments classified as held to maturity | $ | 2,411 | $ | - | $ | (2,642 | ) | $ | 5,054 | |||||||
| Long-term investments- held to maturity securities: | ||||||||||||||||
| Securities issued or secured by Colombian government | 96,791 | 8,803 | - | 87,988 | ||||||||||||
| Total long-term investments classified as held to maturity | $ | 96,791 | $ | 8,803 | $ | - | $ | 87,988 | ||||||||
| Total held to maturity | $ | 99,202 | $ | 8,803 | $ | (2,642 | ) | $ | 93,042 | |||||||
| 2014 | 2013 | 2012 | ||||||||||
| Short-term Investments – Trading securities: | ||||||||||||
| Other debt securities or mixed/economy governmental entities | $ | - | $ | 569,119 | $ | - | ||||||
| Total Short-term Investments classified as Trading | $ | - | $ | 569,119 | $ | - | ||||||
| F-58 |
Ecopetrol S.A. and Subsidiaries
Notes to the Consolidated Financial Statements
Years ended December 31, 2014, 2013 and 2012
(Expressed in millions of Colombian pesos)
The maturities of fixed-income investments as of December 31, 2014 and 2013 are as follows:
| As of December 31, 2014 | ||||||||||||||||
| Available for Sale | Held to Maturity | |||||||||||||||
| Cost Basis | Fair Value | Cost Basis | Fair Value | |||||||||||||
| Due in one year or less | $ | 625,137 | $ | 625,398 | $ | 4,713 | $ | 4,713 | ||||||||
| Due in one to five years | 556,850 | 1,876,638 | - | - | ||||||||||||
| Total | $ | 1,181,987 | $ | 2,502,035 | $ | 4,713 | $ | 4,713 | ||||||||
| As of December 31, 2013 | ||||||||||||||||
| Available for Sale | Held to Maturity | |||||||||||||||
| Cost Basis | Fair Value | Cost Basis | Fair Value | |||||||||||||
| Due in one year or less | $ | 744,674 | $ | 743,987 | $ | 99,007 | $ | 99,731 | ||||||||
| Due in one to five years | 506,256 | 1,748,497 | - | - | ||||||||||||
| Total | $ | 1,250,930 | $ | 2,492,484 | $ | 99,007 | $ | 99,731 | ||||||||
Amounts recorded in other comprehensive income in prior years realized on available for sale securities sold during 2014, 2013 and 2012 were:
| 2014 | 2013 | 2012 | ||||||||||
| Losses | $ | 5,617 | $ | 1,566 | $ | 2,004 | ||||||
| Gains | $ | 4,228 | $ | 138,268 | $ | 33,955 | ||||||
| a. | Unrealized gain (loss) |
Available-for-sale securities in an unrealized loss position as of December 31, 2014 and 2013 are as follows:
| As of December 31, 2014 | ||||||||||||||||||||||||
| Less than 12 months | 12 Months or Greater | Total | ||||||||||||||||||||||
| Descriptions of Securities | Fair Value | Unrealized Losses | Fair Value | Unrealized Losses | Fair Value | Unrealized Losses | ||||||||||||||||||
| Securities issued or secured by Colombian government | $ | 140,338 | $ | - | $ | 43,025 | $ | 455 | $ | 183,363 | $ | 455 | ||||||||||||
| Securities issued or secured by financial entities | 453,905 | - | 2,324 | 2 | 456,229 | 2 | ||||||||||||||||||
| Securities issued or secured by government sponsored enterprise (GSEs) | - | - | 124,620 | 134 | 124,620 | 134 | ||||||||||||||||||
| Securities issued or secured by government USA | 6,939 | - | 116,083 | 46 | 123,022 | 46 | ||||||||||||||||||
| Other debt securities | 24,216 | - | 9,192 | 7 | 33,408 | 7 | ||||||||||||||||||
| Total | $ | 625,398 | $ | - | $ | 295,244 | $ | 644 | $ | 920,642 | $ | 644 | ||||||||||||
| As of December 31, 2013 | ||||||||||||||||||||||||
| Less than 12 months | 12 Months or Greater | Total | ||||||||||||||||||||||
| Descriptions of Securities | Fair Value | Unrealized Losses | Fair Value | Unrealized Losses | Fair Value | Unrealized Losses | ||||||||||||||||||
| Securities issued or secured by Colombian government | $ | 90,089 | $ | 825 | $ | 110,195 | $ | 1,668 | $ | 200,284 | $ | 2,492 | ||||||||||||
| Securities issued or secured by financial entities | 25,308 | - | 1,840 | 1 | 27,147 | 1 | ||||||||||||||||||
| Securities issued or secured by government sponsored enterprise (GSEs) | - | - | 24,470 | 29 | 24,470 | 29 | ||||||||||||||||||
| Other debt securities | - | - | 9,286 | 108 | 9,286 | 108 | ||||||||||||||||||
| Total | $ | 115,397 | $ | 825 | $ | 145,791 | $ | 1,806 | $ | 261,187 | $ | 2,630 | ||||||||||||
Restricted Assets
Under U.S. GAAP the Company classifies as restricted assets, those assets where their availability depends on a court decision, contractual or legal restrictions, such as cash, trust funds or investments. The detail of restricted assets as of December 31, 2014 and 2013 is as follows:
| F-59 |
Ecopetrol S.A. and Subsidiaries
Notes to the Consolidated Financial Statements
Years ended December 31, 2014, 2013 and 2012
(Expressed in millions of Colombian pesos)
| Concept | 2014 | 2013 | ||||||
| Investment securities | $ | 548,413 | $ | 371,386 | ||||
| Specific destination funds | 226,094 | 299,703 | ||||||
| Cash | 73,649 | 57,857 | ||||||
| Total | $ | 848,156 | $ | 728,946 | ||||
In Specific destination funds the most significant items are resources intended to guarantee contractual obligations of our subsidiaries Equión $6,299, ODL Finance $9,402, Oleoducto Bicentenario $85,890, Ocensa $982 and Cenit $33,617.
Other significant restricted assets are related to Santiago de las Atalayas Fund which is detailed in the chart below:
| Concept | 2014 | 2013 | ||||||
| Investments available for sale | $ | 548,413 | $ | 371,387 | ||||
| Specific destination funds * | 172 | 73,467 | ||||||
| Cash | 2,912 | 510 | ||||||
| Total | $ | 551,497 | $ | 445,364 | ||||
*This fund receives the coupons and principal payments of Santiago de las Atalayas investments in U.S. dollars.
The investments related to Santiago de las Atalayas at December 31, 2014 and 2013 consist of the following:
| As of December 31, 2014 | Aggregated Fair Value | Gross Unrealized Holding Gains | Gross Unrealized Holding Losses | Gross Recognized Losses | Cost Basis | |||||||||||||||
| Short-term Investments - Available for Sale Securities: | ||||||||||||||||||||
| Securities issued or secured by Colombian government | $ | 45,422 | $ | 44 | $ | (74 | ) | $ | - | $ | 45,453 | |||||||||
| Securities issued by mixed – economy governmental entities | - | - | - | - | - | |||||||||||||||
| Securities issued or secured by financial entities | 111,013 | 4 | - | - | 11,101 | |||||||||||||||
| Securities issued or secured by government sponsored enterprise (GSEs) | 7,178 | - | (1 | ) | - | 7,179 | ||||||||||||||
| Securities issued or secured by government USA | 11,963 | 4 | - | - | 11,959 | |||||||||||||||
| Other debt securities | 11,933 | - | - | - | 11,932 | |||||||||||||||
| Total Short-term Investments classified as available for sale | $ | 187,509 | $ | 51 | $ | (75 | ) | $ | - | $ | 187,533 | |||||||||
| Long-term Investments - Available for Sale Securities: | 69,544 | - | (991 | ) | - | 70,535 | ||||||||||||||
| Securities issued or secured by Colombian government | 439 | 18 | - | - | 422 | |||||||||||||||
| Securities issued or secured by financial entities | 132,341 | 76 | (248 | ) | - | 132,512 | ||||||||||||||
| Securities issued or secured by government sponsored enterprise (GSEs) | 136,267 | 75 | (110 | ) | (68 | ) | 13,637 | |||||||||||||
| Securities issued or secured by government USA | 22,312 | 4 | (1,039 | ) | - | 23,347 | ||||||||||||||
| Other debt securities | $ | 360,903 | 173 | (2,387 | ) | (68 | ) | 363,185 | ||||||||||||
| Total Available for Sale | $ | 548,413 | $ | 224 | $ | (2,462 | ) | $ | (68 | ) | $ | 550,718 | ||||||||
| As of December 31, 2013 | Aggregated Fair Value | Gross Unrealized Holding Gains | Gross Unrealized Holding Losses | Gross Recognized Losses | Cost Basis | |||||||||||||||
| Short-term Investments – available for sale securities: | ||||||||||||||||||||
| Securities issued or secured by Colombian government | $ | 9,118 | $ | 23 | $ | (45 | ) | $ | - | $ | 9,140 | |||||||||
| Securities issued by mixed – economy governmental entities | 16,064 | - | (24 | ) | - | 16,088 | ||||||||||||||
| Securities issued or secured by financial entities | 65,889 | 133 | (15 | ) | (133 | ) | 65,904 | |||||||||||||
| Total Short-term Investments classified as available for sale | $ | 91,071 | $ | 156 | $ | (84 | ) | $ | (133 | ) | $ | 91,132 | ||||||||
| Long-term Investments – available for sale securities: | ||||||||||||||||||||
| Securities issued or secured by Colombian government | 62,123 | 174 | (1,272 | ) | - | 63,221 | ||||||||||||||
| Securities issued or secured by government sponsored enterprise (GSEs) | 162,130 | 22 | (70 | ) | - | 162,178 | ||||||||||||||
| Securities issued by mixed- economy governmental entities | 36,888 | 340 | (1,273 | ) | - | 37,821 | ||||||||||||||
| Securities issued or secured by the U.S. government | 19,175 | - | (37 | ) | - | 19,212 | ||||||||||||||
| Total Long-term Investments classified as available for sale | $ | 280,316 | 536 | (2,652 | ) | - | 282,432 | |||||||||||||
| Total Available for Sale | $ | 371,387 | $ | 692 | $ | (2,736 | ) | $ | (133 | ) | $ | 373,564 | ||||||||
The unrealized gains and losses of the restricted assets are recognized in other comprehensive income.
| b. | Impairment |
Impairment of investment securities available for sale are reported differently under Colombian Government Entity GAAP and U.S. GAAP. Under Colombian Government Entity GAAP, impairment is charged to income in the current period, but recoveries in value can be recorded up to the amount that was originally impaired. Under U.S. GAAP, other-than-temporary impairments should be charged to income in the current period and a new cost basis for the security is established. Subsequent increases in the cost basis of an impaired investment as a result of a recovery in fair value are included in other comprehensive income.
| F-60 |
Ecopetrol S.A. and Subsidiaries
Notes to the Consolidated Financial Statements
Years ended December 31, 2014, 2013 and 2012
(Expressed in millions of Colombian pesos)
The Company has a policy under which they conduct periodic reviews of marketable securities to assess whether other-than-temporary impairment exists. A number of factors are considered in performing an impairment analysis of securities. Those factors include:
| a) | The length of time and the extent to which the fair value of the security has been less than cost; |
| b) | The financial condition and near-term prospects of the issuer, including any specific events which influence the operations of the issuer (such as changes in technology that may impair the earnings potential of the investment, or the discontinuance of a segment of a business that may affect the future earnings potential); and |
| c) | The analysis as instructed in ASC 320-10-65-1, which includes the comparison of the fair value and the amortized cost, evaluates the Company’s intention to sell the security. If it is more-likely-than-not, the company will be required to sell the security prior to recovery, including the existence of a credit loss. |
The Company also takes into account changes in global and regional economic conditions and changes related to specific issuers or industries that could adversely affect these values.
Ecopetrol’s marketable security portfolio consists only of debt securities, such as treasury investments, bonds, and commercial papers. For this reason, the Company has an internal policy to limit the ratings of their investments and issuers as follows:
| Credit Rating Agency | Short – Term Credit Rating | Long – Term Credit Rating | ||
| Standard & Poor’s | A-1 | A | ||
| Moody’s Investors Services | P-1 | A2 | ||
| Fitch Ratings | F-1 | A |
The Company recognized impairments on its investment securities resulting from the exchange differences amounting to $1,352, $133 and $50,126 in 2014, 2013 and 2012, respectively. In addition, we recognized an other than temporary impairment for fair value in an amount of $1,971 in 2014. There was no other than temporary impairment for fair value in 2013 and 2012.
| ii. | INVESTMENTS IN NON-MARKETABLE SECURITIES |
| a. | Equity Method and Valuation Surplus |
Under Colombian Government Entity GAAP, equity securities for which prices are unquoted, or for which trading volume is lower, and the Company does not control the investee, are accounted for under the cost method and subsequently are valued by the equity method. Under the equity method, the Company accounts for the difference between its proportionate share of shareholders' equity of the investee and its acquisition cost, adjusted for inflation through 2001, in a separate valuation account in the assets and equity (valuation surplus), if the proportionate share of shareholders’ equity of the investee is higher than its cost or as an allowance for losses, affecting net income, if the cost is higher than the proportionate share of shareholders’ equity of the investee. Under this method, the Company only records dividends as income when received. From 2008 the Colombian Government Entity GAAP incorporated the concept of significant influence for the recognition of investments in associated entities and established the equity method to update these investments.
Under U.S. GAAP, an investment in a non-marketable equity security is recorded using the equity method when the investor can exercise significant influence over the investee, or the cost method when significant influence cannot be exercised. Under the equity method of accounting for U.S. GAAP the carrying value of such an investment is adjusted to reflect (1) the Company’s proportionate share of earnings or losses from the investee and (2) additional investments and distributions of dividends. The Company’s proportionate share of income or loss is reported in earnings however any dividends or additional investments are reported only as an adjustment of the carrying amount of the investment.
The differences between the application of the cost and the equity method under U.S. GAAP were:
| · | Reversal of valuations and allowances for losses recorded under Colombian Government Entity GAAP |
| · | Reversal of inflation adjustments recorded under Colombian Government Entity GAAP |
| · | Reversal of Goodwill amortization and impairment |
| · | Inclusion of share of earnings or losses under U.S. GAAP, net of inter-company eliminations |
| · | Inclusion of share in Other Comprehensive Income under U.S. GAAP |
| · | Recognition of impairment under U.S. GAAP |
| F-61 |
Ecopetrol S.A. and Subsidiaries
Notes to the Consolidated Financial Statements
Years ended December 31, 2014, 2013 and 2012
(Expressed in millions of Colombian pesos)
The summary of the investments valued by the equity method for U.S. GAAP purposes is shown in the following table:
For the Year Ended December 31, 2014
| Company | Percentage Voting Interest | Equity Calculated | Equity Under Colombian GAAP | Assets Under Colombian | Liabilities Under Colombian GAAP | Net Income (Loss) Under Colombian GAAP | Investment Under U.S. GAAP Equity Method | Equity Method Accounting Adj (*) |
Impairment | Total Equity Method Investment | ||||||||||||||||||||||||||||||
| Invercolsa S.A. | 43.35 | % | $ | 130,903 | $ | 515,527 | $ | 516,075 | $ | 548 | $ | 70,261 | $ | 56,746 | $ | - | $ | $ | 56,746 | |||||||||||||||||||||
| Serviport S.A. | 49.00 | % | 12,704 | 17,106 | 47,222 | 32,284 | 2,511 | 6,225 | - | 6,225 | ||||||||||||||||||||||||||||||
| Offshore International Group | 50.00 | % | 1,351,924 | 1,351,924 | 2,244,434 | 892,510 | 15,471 | 675,962 | 521,646 | 294,933 | 902,675 | |||||||||||||||||||||||||||||
| Ecodiesel S.A. | 50.00 | % | 64,511 | 77,968 | 151,438 | 73,470 | 22,376 | 32,256 | - | 32,256 | ||||||||||||||||||||||||||||||
| Sociedad Portuaria de Olefinas | 50.00 | % | 1,050 | 1,386 | 1,562 | 176 | 87 | 525 | - | 525 | ||||||||||||||||||||||||||||||
| Transgas de Occidente S.A. | 20.00 | % | 177,035 | 211,622 | 308,656 | 97,024 | 12,525 | 35,407 | (463 | ) | 34,944 | |||||||||||||||||||||||||||||
| $ | 807,121 | $ | 521,183 | $ | 294,933 | $ | 1,033,371 | |||||||||||||||||||||||||||||||||
For the Year Ended December 31, 2013
| Company | Percentage of Voting Interest | Equity Calculated under U.S. GAAP | Equity Under Colombian GAAP | Assets Under Colombian GAAP | Liabilities Under Colombian GAAP | Net Income (Loss) Under Colombian GAAP | Investment Under U.S. GAAP Equity Method | Equity Method Accounting Adj (*) | Impairment Under U.S. GAAP | Total Equity Method Investment | ||||||||||||||||||||||||||||||
| Invercolsa S.A. | 43.35 | % | $ | 252,973 | $ | 621,319 | $ | 622,105 | $ | 785 | $ | 51,644 | $ | 109,664 | $ | - | $ | - | $ | 109,664 | ||||||||||||||||||||
| Serviport S.A. | 49.00 | % | 15,525 | 14,938 | 47,222 | 32,284 | 2,511 | 7,607 | - | - | 7,607 | |||||||||||||||||||||||||||||
| Offshore International Group | 50.00 | % | 1,076,347 | 1,076,347 | 2,049,502 | 973,155 | 109,925 | 538,174 | 472,094 | 51,671 | 958,597 | |||||||||||||||||||||||||||||
| Ecodiesel S.A. | 50.00 | % | 52,976 | 53,353 | 137,384 | 84,031 | 22,765 | 26,488 | - | - | 26,488 | |||||||||||||||||||||||||||||
| Sociedad Portuaria de Olefinas | 50.00 | % | 1,022 | 1,299 | 1,518 | 219 | 198 | 511 | - | - | 511 | |||||||||||||||||||||||||||||
| Transgas de Occidente S.A. | 20.00 | % | 149,189 | 211,622 | 308,655 | 97,024 | 12,525 | 29,838 | (12,724 | ) | - | 17,114 | ||||||||||||||||||||||||||||
| $ | 712,282 | $ | 459,370 | $ | 51,671 | $ | 1,119,981 | |||||||||||||||||||||||||||||||||
| Concept | 2014 | 2013 | ||||||
| Fair value of property, plant and equipment | $ | 3,075 | $ | (9,946 | ) | |||
| Goodwill | 518,571 | 469,316 | ||||||
| Total | $ | 521,646 | $ | 459,370 | ||||
The number of shares which the Company owns with respect to its investment in Invercolsa S.A. has been subject to a legal dispute with another Invercolsa shareholder. Lower court decisions had ruled in favor of both the Company and the other shareholder and a final court decision in January 2011 determined that 324 million shares, equivalent to 11.58% of the capital stock of Invercolsa should be returned to Ecopetrol. As a result Ecopetrol controls 43.35%. The dividends paid relating to the shares returned to Ecopetrol are still in dispute, as well as the ownership of shares constituting 8.53% of Invercolsa. The resolution of these matters is still pending.
| b. | Variable Interest Entity (VIE) |
Under U.S. GAAP, ASC 810-10-15-10 requires that consolidated financial statements include subsidiaries in which the Company has a controlling financial interest, i.e., a majority voting interest. However, application of the majority voting interest requirement to certain types of entities may not identify the party with a controlling financial interest because that interest may be achieved through other arrangements. Thus, the U.S. GAAP rules also require a Company to consolidate a variable interest entity if that company is the primary beneficiary of the VIE, with that has the power to direct the activities of the VIE that most significantly affect the entity’s economic performance and will absorb a majority of the entity’s expected losses, receive a majority of the entity’s expected residual returns, or both. In determining whether it is a primary beneficiary of a variable interest entity, a company shall treat variable interests in that same entity held by the Company’s related parties as its own interest. Under Colombian Government Entity GAAP, consolidated financial statements only include subsidiaries in which the Company has the majority voting interest.
In October 2009, the subsidiary Oleoducto de los Llanos Orientales (hereinafter “ODL”) assigned its rights under a "Ship or Pay” contract for the completion of a securitization for the purpose of obtaining funds required to finish the second phase of the project, the refund of capital to the associates, and maintaining the capital structure initially agreed. The structure of this issuance was made through assets in a trust fund (hereinafter “Fideicomiso P.A. ODL - ECOPETROL”) administered by Corficolombiana S.A., who has to pay the security holder on the due dates. Additionally, each month, the trust company must report to ODL income and expenses that are generated in this process and that are paid, if applicable, to ODL as advances.
| F-62 |
Ecopetrol S.A. and Subsidiaries
Notes to the Consolidated Financial Statements
Years ended December 31, 2014, 2013 and 2012
(Expressed in millions of Colombian pesos)
Based on the ASC 810, ODL determined that it must consolidate Fideicomiso P.A. ODL - ECOPETROL, since it is a VIE and ODL is the primary beneficiary.
The adjustments of Fideicomiso P. A. ODL – ECOPETROL, according to financial information under U.S. GAAP as of and for the years ended December 31, 2014 and 2013, are as follows:
| 2014 | 2013 | |||||||
| Assets | $ | (96,055 | ) | $ | (93,076 | ) | ||
| Liabilities | 96,055 | 93,076 | ||||||
| Equity | $ | - | $ | - | ||||
| Net income | $ | - | $ | - | ||||
The financial information summary of Fideicomiso P. A. ODL - ECOPETROL according to U.S. GAAP as of and for the years ended December 31, 2014 and 2013, are as follows:
| 2014 | 2013 | |||||||
| Assets | $ | 336,902 | $ | 433,560 | ||||
| Liabilities | (206,616 | ) | (306,923 | ) | ||||
| Equity | $ | 130,286 | $ | 126,636 | ||||
| Net income | $ | 105,213 | $ | 106,675 | ||||
| c. | Impairment |
Under Colombian Government Entity GAAP it is not mandatory to perform impairment tests of the Equity Method Investments unless positive evidence is identified. For the years 2014 and 2013, the investment in Offshore International Group was evaluated for impairment resulting in an impairment loss in the amount of $182,631 and $123,136 respectively.
Under U.S. GAAP ASC 323-10-35-31 to 33 and 325-20-35 1A and 2, assets held at cost, including non-marketable equity investments, should be evaluated for impairment if the Company is aware of any events or changes in circumstances that may have significant adverse effects on the fair value of the investment. If the Company believes such circumstances exist, the Company would estimate the asset’s fair value and compare that to cost to determine if any impairment is necessary.
During 2014 and 2013 the Company evaluated its investments and concluded that there were recorded an impairment of $ 294,933 and $51,672 respectively, regarding Offshore International Group – “OIG”. The main reasons that explain Savia’s impairment were the decreases of international oil prices (Brent reference).
| iii. | DERIVATIVES |
Ecopetrol is exposed to market risk from changes in foreign currency exchange rates, interest rate risk of its financial obligations and to commodity price risk, resulting from the fluctuations of international crude oil prices which affect its earnings, cash flows and financial condition. Ecopetrol manages its exposure to these market risks through its regular operating and financial activities and, when appropriate, through the use of derivative financial instruments. Ecopetrol has established control activities to assess, approve and monitor derivative financial instrument operations. Ecopetrol does not buy, hold or sell derivative financial instruments for trading purposes. Ecopetrol's primary foreign currency exposures relate to the U.S. dollar; however, Ecopetrol manages its foreign currency risk position internally, using non-deliverable forwards, according to the size of the mismatches between its asset-liability position in U.S. dollars and its asset-liability position in Colombian pesos. If no mismatches occur, Ecopetrol has a perfect natural hedge. Ecopetrol also utilizes other derivative agreements to mitigate changes in the fair value of commodities. None of the derivatives were designated or documented for hedge accounting.
As of December 31, 2014, only the subsidiaries HOCOL S.A. and OCENSA are exposed to foreign currency fluctuations. Such exposures arise primarily from expenditures that are denominated in currencies other than the functional currency. The Company constantly monitors its exposure to foreign currency risks. To reduce its foreign currency exposure associated with operating expenses incurred in Colombian pesos, the Company may enter into foreign currency derivatives to manage such risks. These derivatives are recognized at their fair value as either a financial asset or obligation with the corresponding income or expense recognized.
Total results recognized related to derivative activities during the years are as follows:
| 2014 | 2013 | 2012 | ||||||||||||||||||||||
| Realized | Unrealized | Realized | Unrealized | Realized | Unrealized | |||||||||||||||||||
| Options (1) | $ | (1,497 | ) | $ | (3,992 | ) | $ | 467 | $ | (45 | ) | $ | 4,315 | $ | 4,619 | |||||||||
| Swaps | - | - | - | - | - | - | ||||||||||||||||||
| Forwards | 380 | (130,272 | ) | 542 | - | 695 | - | |||||||||||||||||
| Total | $ | (1,117 | ) | $ | (134,264 | ) | $ | 1,009 | $ | (45 | ) | $ | 5,010 | $ | 4,619 | |||||||||
(1) Amounts include premiums paid
| F-63 |
Ecopetrol S.A. and Subsidiaries
Notes to the Consolidated Financial Statements
Years ended December 31, 2014, 2013 and 2012
(Expressed in millions of Colombian pesos)
Under RCP, each derivative has its own accounting treatment depending on the type of derivative. Option premiums paid are recorded as deferred charges and amortized to the income statement as financial expense on a straight-line basis over the life of the contract, the option contract is recognized in memo accounts unless it is likely to be exercised, and the gain is recognized as an investment. Swap and forward contract net results are recorded as an investment. In all cases, gains and losses are recognized in earnings as financial income or expense. Amounts receivable or payable upon maturity resulting from net payments are recorded using current rates for the period.
U.S. GAAP requires that all derivative instruments be recorded on the balance sheet at fair value. Changes in the fair value of derivatives are recorded each period in current earnings. The fair value of derivatives instruments is recorded as other assets and other liabilities.
Under U.S. GAAP, embedded derivative instruments shall be separated from the host contract, and accounted for using different measurement attributes, if certain conditions are met. In the case of the Company, some contracts to which the Company is counterparty include embedded foreign exchange derivatives. According to ASC paragraph 815-15-15-10 through 13 these contracts do not require separate accounting for the embedded derivative and the host contract because contract payments are made in the functional currency of a party to the contract or contract payments are made in a currency in which the price of the good or service delivered is routinely denominated in international commerce. In other cases, contracts indexed to inflation considered clearly and closely related.
| iv. | EXCHANGE OF NON-MONETARY ASSETS |
During 2007, the Company exchanged a refinery business with a book value of $234,371 for a 49% interest in Refinería de Cartagena S.A. The Company estimated the fair value of the 49% investment as $1,369,546. Under Colombian Government Entity GAAP, this difference between the cost of the assets given and the fair value of the assets received was recorded as an increase to asset revaluation and equity. However, under ASC 845-10-30, 51% of the difference between the book value of the Refinery and the fair value of the assets received, which the Company determined to be a more reliable indicator of the value of the exchange, was recorded in the results of operations as a gain in the amount of $578,939. The remaining 49% of unrealized gain was recorded as a deferred gain with a corresponding increase to the investment, equivalent to a deferred gain of $556,236, to be amortized over the expected useful life of the equipment. In 2011, the Company determined that in 2009, as a result of the acquisition of the remaining participation in Reficar S.A., the unamortized unrealized gain should have been recorded at fair value since the Company obtained the remaining 51% of Refinería de Cartagena S.A. in 2009 in line with the acquired entity’s fair value of the assets and liabilities acquired as of May 27, 2009. However, according to ASC 250 and SAB 108, we do not consider such amount significant and decided to fully amortize the remaining balance as of 2011. As a result, the net income reconciliation includes amortized income of $425,521 in 2011.
| v. | DEFERRED CHARGES |
Under Colombian Government Entity GAAP, the Equity Tax is recognized as a deferred charge for the total amount due payable during the years 2011 through 2014. The deferred charge is amortized as an expense of the year based on the payments made. The local regulatory entities also allowed companies that applied inflation adjustments and still have outstanding balances in the Equity Revaluation account to reduce such balance instead of recognizing a deferred charge. Under U.S. GAAP Equity Tax was fully expensed in 2011 since amortization of certain expenses is not allowed under ASC 350.
Other deferred assets recognized under Colombian Government Entity GAAP are related to certain pre-operating expenses and other charges that include normal recurring maintenance and fees. Under U.S. GAAP ASC 730 forbids namely capitalization of pre-operating expenses and thus established that these are expensed as incurred.
For U.S. GAAP purposes, the amount of the adjustment in the Company’s net income related to deferred expenses amounting to $521,358 in 2014, $476,091 in 2013 and $493,159 in 2012.
| vi. | EMPLOYEE BENEFIT PLANS |
Under Colombian Government Entity GAAP, the Company estimates the net present value of its actuarial obligation for all pension plans and other post-retirement obligations. Annually, the Company estimates the net present value of the actuarial obligation and adjusts it accordingly. The amounts of the adjustments related to health care, education and severance plans are reflected in the Company’s net income. However, the amounts related to the pension and bonds plans are recorded in memorandum accounts.
For other post-retirement benefits, the payments are made according to seniority and the salary at the time of retirement, as stipulated in the Collective Labor Convention and Agreement No. 01.
| F-64 |
Ecopetrol S.A. and Subsidiaries
Notes to the Consolidated Financial Statements
Years ended December 31, 2014, 2013 and 2012
(Expressed in millions of Colombian pesos)
Under the post-retirement benefits plan those workers who had met the age and continuous or discontinuous service time requirements of the law, the Collective Bargaining Agreement in effect and/or Agreement 01 of 1977, prior to August 1, 2010, had consolidated their right to their pension with Ecopetrol. However, it was mandatory for other workers, who were not covered, to join the General Pension System. The pension administrator chosen by the worker (either Colpensiones or Private Pension Fund or whichever may correspond) would be responsible for recognizing and paying the respective pension.
Under the post-retirement benefits plan for Ecopetrol personnel, the Company covers 90% of educational expenses for children of employees, including enrollment fees, tuition and other associated costs. A fixed annual sum, depending on education level, is also provided for the acquisition of textbooks. Educational coverage includes kindergarten, elementary school, high school and college. Ecopetrol´s financial statements must also show the cost of post-retirement educational benefits for children of retired employees, since benefits continue irrespective of retirement or death.
According to the Collective Labor Agreement and Agreement No. 01, the Company will pay for health services for employees and enrolled family members. Health services include: office visits and required laboratory services, drugs, diagnostic examinations, ambulatory treatment, hospitalization due to illness or accident, surgery due to illness or accident, maternity and rehabilitation treatments and orthopedic parts. Therefore, such post-retirement health benefit costs are recorded in the consolidated financial statements of the Company prepared in accordance with Colombian Government Entity GAAP, since retired workers and enrolled family members continue to receive full medical coverage. The same is true for deceased non-retired employees.
The Collective Labor Agreement was negotiated in 2014. See details of the final agreement on 3.12.2 Collective Bargaining Arrangements.
Under U.S. GAAP, the Company applies the provisions of ASC 710, 715 and 835 as amended. Accordingly, the Company accrues for its obligations under its employee defined benefit plans, net of plan assets. The cost of defined benefit pensions and other post-employment benefits is actuarially determined using the projected benefit method based on length of service and reflects Management’s best estimate of salary escalation, retirement ages of employees and expected future health care costs. The expected return on plan assets is based on historical and projected rates of return for assets in the investment plan portfolio. The actual return is based on the fair value of plan assets. The projected benefit obligation is discounted using the market interest rate on high-quality corporate debt instruments as at the measurement date. Actuarial gains and losses related to the change in the over-funded or under-funded status of the defined benefit pension plan and other post-employment benefit plans are recognized in other comprehensive income.
Under Colombian law, employees are entitled to one month salary for each year of service. This benefit is known as the “severance obligation” or “cesantias”. This benefit accumulates during the time of employment and is paid to employees upon their termination or retirement from Ecopetrol. However, employees may request advanced benefit payments at any time. In 1990, the Colombian government revised its labor regulations to permit companies, subject to employee approval, to pay the severance obligation to their employees on a current basis. Law 50 of 1990 also enabled each employee to freely choose which trust fund would manage the amount accrued during each year in which they are eligible for severance payments. This amount must be transferred by the company to the trust fund no later than February 14th in the subsequent year.
In addition, under Colombian law the Company must pay pension bonds for certain employees when they leave Ecopetrol. Those bonds payable accrue interest at the DTF rate, according to the class of bonds, as follows:
| 1) | For pension bonds type B, DTF + 4%; |
| 2) | For pension bonds type A, with date of transfer before December 31, 1998, DTF + 4%; |
| 3) | For the remaining pension bonds type A, DTF + 3%. |
The economic assumptions used in the determination of pension obligations under U.S. GAAP differ from those used under RCP since the latter are established by Colombian regulations.
The combined costs for the above mentioned benefit plans, determined using U.S. GAAP, for the years ended December 31, 2014, 2013 and 2012 are summarized below: (all obligations were measured at year-end)
| 2014 | 2013 | 2012 | ||||||||||||||||||||||||||||||||||
| Components of net periodic benefit costs: | Pension | Other Benefits (*) | Total | Pension | Other Benefits (*) | Total | Pension | Other Benefits (*) | Total | |||||||||||||||||||||||||||
| Service cost | $ | - | 60,982 | 60,982 | $ | - | $ | 63,742 | $ | 63,742 | $ | - | $ | 44,089 | $ | 44,089 | ||||||||||||||||||||
| Interest cost | 775,297 | 431,219 | 1,206,516 | 739,816 | 402,817 | 1,142,633 | 840,944 | 525,628 | 1,366,572 | |||||||||||||||||||||||||||
| Expected return on plan assets | (568,964 | ) | (40,182 | ) | (609,146 | ) | (592,897 | ) | (38,922 | ) | (631,819 | ) | (720,034 | ) | (45,265 | ) | (765,299 | ) | ||||||||||||||||||
| Amortization of net actuarial gain or loss | 10,989 | 19,050 | 30,039 | 31,605 | 69,126 | 100,731 | 18,531 | 81,589 | 100,120 | |||||||||||||||||||||||||||
| Net periodic pension cost under U.S. GAAP | 217,322 | 471,069 | 688,391 | 178,524 | 496,763 | 675,287 | 139,441 | 606,041 | 745,482 | |||||||||||||||||||||||||||
| Net periodic pension cost under Colombian GAAP (gain) or loss | - | 583,254 | 583,254 | - | 500,855 | 500,855 | (83,776 | ) | 849,961 | 766,185 | ||||||||||||||||||||||||||
| Difference to be recognized under U.S. GAAP (income) loss | $ | 217,322 | (112,185 | ) | 105,137 | $ | 178,524 | $ | (4,092 | ) | $ | 174,432 | $ | 223,217 | $ | (243,920 | ) | $ | (20,703 | ) | ||||||||||||||||
(*) Other benefits include education, health care, pension bonds and accrued retroactive severance.
| F-65 |
Ecopetrol S.A. and Subsidiaries
Notes to the Consolidated Financial Statements
Years ended December 31, 2014, 2013 and 2012
(Expressed in millions of Colombian pesos)
In 2008, Ecopetrol was approved by Colombian Government to partially transfer its pension net liability to an autonomous trust fund. According to Colombian Government Entity GAAP (RCP), the assets and liabilities transferred shall be accounted for in memorandum accounts, off balance sheet. This implies that the net liability transferred is not part of the assets and liabilities of Ecopetrol instead a pension trust fund, a separate entity not controlled by the Company. In 2012, we found a misstatement in our reconciliation to U.S. GAAP, due to we considered the transferred assets and liabilities to be a part of the Company’s balance sheet, when reconciling our financial statements to U.S. GAAP. According to ASC 250, we analyzed the effect of this error and conclude it did not have a material effect on previously issued financial statements. As of December 2012, this error had a net effect on the net actuarial liability of $89,775, net after tax. Since this is not a material misstatement, we corrected it prospectively in our 2013 financial statements.
The changes in the benefit obligations and in plan assets for the above mentioned benefit plans, determined using U.S. GAAP, for the years end December 31, 2014 and 2013, are summarized below:
| Pension Plan | Other Benefits | |||||||||||||||
| 2014 | 2013 | 2014 | 2013 | |||||||||||||
| Reconciliation of project benefit obligation: | ||||||||||||||||
| Project benefit obligation as of January 1 | $ | (11,422,854 | ) | $ | (12,179,576 | ) | $ | (6,412,978 | ) | $ | (6,770,823 | ) | ||||
| Service cost | - | - | (60,982 | ) | (63,742 | ) | ||||||||||
| Interest cost | (775,297 | ) | (739,816 | ) | (431,219 | ) | (402,817 | ) | ||||||||
| Actuarial gain (loss) | 575,360 | 826,026 | 428,672 | 541,090 | ||||||||||||
| Benefit payments | 680,313 | 670,512 | 295,885 | 283,314 | ||||||||||||
| Plan amendments | 86,597 | |||||||||||||||
| Projected benefit obligation as of December 31 | $ | (10,942,478 | ) | $ | (11,422,854 | ) | $ | (6,094,025 | ) | $ | (6,412,978 | ) | ||||
| Reconciliation of plan assets : | ||||||||||||||||
| Fair value of plan assets as of January 1 | 10,691,989 | 11,122,471 | 757,887 | 743,593 | ||||||||||||
| Fund contribution | 200,778 | - | 91,886 | 281,561 | ||||||||||||
| Actual return on assets | 877,256 | 240,030 | 64,090 | 16,047 | ||||||||||||
| Benefits paid | (680,313 | ) | (670,512 | ) | (295,885 | ) | (283,314 | |||||||||
| Fair value of plan assets as of December 31 | $ | 11,089,710 | $ | 10,691,989 | $ | 617,978 | $ | 757,887 | ||||||||
| Net liability | 147,232 | (730,865 | ) | (5,476,047 | ) | (5,655,091 | ) | |||||||||
| Net liability under Colombian Government Entity GAAP | - | - | (4,499,052 | ) | (4,208,462 | ) | ||||||||||
| Net effect under pension plan and other benefits | $ | 147,232 | $ | (730,865 | ) | $ | (976,995 | ) | $ | (1,446,629 | ) | |||||
| Amounts recognized in other comprehensive (income) | (458,860 | ) | (1,353,502 | ) | (1,286,599 | ) | (1,758,229 | ) | ||||||||
Net liability of employee benefit plans, net of other employee benefits, is classified as follows:
| Pension Plans | Other Benefits | TOTAL | ||||||||||||||||||||||
| 2014 | 2013 | 2014 | 2013 | 2014 | 2013 | |||||||||||||||||||
| Current portion | $ | - | $ | - | $ | (321,261 | ) | $ | (281,019 | ) | $ | (321,261 | ) | $ | (281,019 | ) | ||||||||
| Long-term portion | 147,232 | (730,865 | ) | (5,154,786 | ) | (5,374,072 | ) | (5,007,554 | ) | (6,104,937 | ) | |||||||||||||
| Net liability | $ | 147,232 | $ | (730,865 | ) | $ | (5,476,047 | ) | $ | (5,655,091 | ) | $ | (5,328,815 | ) | $ | (6,385,956 | ) | |||||||
As of December 31, 2014 and 2013, net obligation amounts recognized in the balance sheet related to pension, health, education, bonds and severance obligations consist of:
| 2014 | 2013 | |||||||
| Long-term liability | ||||||||
| Pension | $ | 147,232 | $ | (730,865 | ) | |||
| Health care | (4,546,652 | ) | (4,910,787 | ) | ||||
| Education | (605,099 | ) | (449,269 | ) | ||||
| Bonds | - | (13,183 | ) | |||||
| Severance | (3,035 | ) | (833 | ) | ||||
| Total long-term liability | $ | (5,007,554 | ) | $ | (6,104,937 | ) | ||
As of December 31, 2014, 2013 and 2012, the amounts recognized in accumulated other comprehensive income, related to pension, health and education obligations consist of:
| 2014 | 2013 | 2012 | ||||||||||
| Other comprehensive income | ||||||||||||
| Actuarial income (loss) | ||||||||||||
| Pension | $ | (458,860 | ) | $ | (1,353,502 | ) | $ | (1,858,266 | ) | |||
| Health care | (2,034,211 | ) | (2,671,715 | ) | (3,239,842 | ) | ||||||
| Education | (450,216 | ) | (215,252 | ) | (213,816 | ) | ||||||
| Bonds | 1,244,440 | 1,124,927 | 1,102,706 | |||||||||
| Severance | 4,553 | 3,811 | 5,382 | |||||||||
| Total other comprehensive income (loss) | (1,694,294 | ) | (3,111,731 | ) | (4,203,836 | ) | ||||||
| Deferred income tax effect | 532,896 | 1,026,871 | 1,387,266 | |||||||||
| Total | $ | (1,161,398 | ) | $ | (2,084,860 | ) | $ | (2,816,570 | ) | |||
| F-66 |
Ecopetrol S.A. and Subsidiaries
Notes to the Consolidated Financial Statements
Years ended December 31, 2014, 2013 and 2012
(Expressed in millions of Colombian pesos)
The significant variation in other comprehensive income from 2013 to 2014 relates to Health and Pension plans due to changes in actuarial assumptions since the last actuarial valuation.
The Company expects the following amounts in other comprehensive income to be recognized as components of net periodic pension cost during 2015:
| Amortization Gain (loss) | ||||
| Health Care | $ | (81,021 | ) | |
| Education | (33,377 | ) | ||
| Bonds | 99,793 | |||
| Severance | 371 | |||
| Total | $ | (14,234 | ) | |
As of December 31, 2014 and 2013, the amounts of gain (loss) in the year and accumulated related to pension, health, education bonds and severance consist of:
| 2014 | 2013 | |||||||||||||||
| Gain (loss) in the year | Cumulative Gain (loss) | Gain (loss) in the year | Cumulative gain (loss) | |||||||||||||
| Pension | $ | 883,652 | $ | (458,860 | ) | $ | 473,159 | $ | (1,353,502 | ) | ||||||
| Health care | 474,994 | (2,034,211 | ) | 434,236 | (2,671,715 | ) | ||||||||||
| Education | (243,421 | ) | (450,216 | ) | (9,437 | ) | (215,252 | ) | ||||||||
| Bonds | 220,265 | 1,244,440 | (94,583 | ) | 1,124,927 | |||||||||||
| Severance | $ | 742 | $ | 4,553 | $ | (1,167 | ) | $ | 3,811 | |||||||
The economic assumptions adopted are shown below in nominal terms. Those assumptions were used in determining the actuarial present value of the pension obligation and the projected pension obligations for the plans:
| 2014 | 2013 | |||||||||||||||||||||||||||||||||||||||
| Pension | Health | Education | Bonds | Severance | Pension | Health | Education | Bonds | Severance | |||||||||||||||||||||||||||||||
| Discount rate | 7.50 | % | 7.50 | % | 6.75 | % | 7.00 | % | 7.50 | % | 7.00 | % | 7.00 | % | 6.50 | % | 6.25 | % | 6.75 | % | ||||||||||||||||||||
| Rate of compensation increase | 4.25 | % | N/A | N/A | N/A | 4.25 | % | 4.50 | % | N/A | N/A | N/A | 4.50 | % | ||||||||||||||||||||||||||
| Rate of pension and bonds increase | 3.00 | % | N/A | N/A | 3.00 | % | N/A | 3.00 | % | N/A | N/A | 3.00 | % | N/A | ||||||||||||||||||||||||||
| Cost trend rate | N/A | 9.60 | % | 9.40 | % | N/A | N/A | N/A | 10.40 | % | 7.50 | % | N/A | N/A | ||||||||||||||||||||||||||
| Expected rate of return | 6.00 | % | N/A | N/A | 6.00 | % | N/A | 5.50 | % | N/A | N/A | 5.50 | % | N/A | ||||||||||||||||||||||||||
| Mortality table | * | * | * | * | * | * | * | * | * | * | ||||||||||||||||||||||||||||||
* Colombian Mortality Table ISS, male and female, 2005-2008.
The actuarial assumptions of the Health Plan have changed since the last actuarial valuation as of December 31, 2013. In 2013 we used a health cost trend rate starting at 10.40% and grading down to general inflation +1% over 9 years. In 2014, trend rate starts at 9.60% and grades down to inflation + 1% in 10 years, since the most recent analyses by the health department shows a decrease tendency related to costs control initiatives from management.
Regarding the education plans, in 2014; the cost trend rate started at 9.4% and grades down to inflation +1% in 9 years; in 2013, we used a cost trend rate starting at 7.5% and grading down to general inflation +1% over 7 years.
The 2014 and 2013 pension bond liability was calculated assuming that if a retired participant had not claimed his bond there was a likelihood that we would never claim it of: a) 100 % after 3 years and b) 0% for less than 3 years.
Estimated future benefit payments
The benefit payments, which reflect expected future service, as appropriate, are expected to be paid as follows:
| Period | Pension Benefits | Health Care benefits | Education benefits | Pension Bonds | Severance Plan | |||||||||||||||
| 2015 | $ | 715,455 | $ | 241,141 | $ | 78,771 | $ | 32,927 | $ | 1,349 | ||||||||||
| 2016 | 731,772 | 259,547 | 83,403 | 6,171 | 62 | |||||||||||||||
| 2017 | 750,301 | 276,709 | 84,737 | 17,415 | 67 | |||||||||||||||
| 2018 | 768,747 | 295,414 | 83,734 | 25,933 | 73 | |||||||||||||||
| 2019 | 786,807 | 309,855 | 80,935 | 28,737 | 110 | |||||||||||||||
| Years 2020 – 2024 | $ | 4,191,082 | $ | 1,725,029 | $ | 326,330 | $ | 226,682 | $ | 931 | ||||||||||
| F-67 |
Ecopetrol S.A. and Subsidiaries
Notes to the Consolidated Financial Statements
Years ended December 31, 2014, 2013 and 2012
(Expressed in millions of Colombian pesos)
All of the benefits estimated in the table above are to be paid from plan assets. The Company does not have any insurance policies that are intended to cover benefits that plan participants are to receive in the future.
Furthermore, the Company does not intend to contribute to the fund in the upcoming fiscal year. Management believes that the plan assets will provide for a sufficient return to cover any payments that are necessary to be made in the upcoming year.
Assumed health care cost trend rates have an effect on the amounts reported for the health care plans. A one percentage point change in assumed health care cost trend rates would have the following effects:
| 1% Percentage Point | ||||||||
| Increase | Decrease | |||||||
| Effect on total of service and interest cost components | $ | 63,501 | $ | (51,238 | ) | |||
| Effect on postretirement benefit obligation | $ | 650,388 | $ | (554,518 | ) | |||
The discount rate is a critical assumption on the actuarial calculation. The effect of variations in the projected benefit obligation by plan is as follows:
| % point variation | Increase | Decrease | ||||||||||
| Pension plan | 0.5 | % | $ | (579,801 | ) | $ | 638,313 | |||||
| Medical plan | 0.5 | % | (295,149 | ) | 329,499 | |||||||
| Education plan | 0.5 | % | (18,832 | ) | 19,812 | |||||||
| Pension Bonds plan | 0.5 | % | (31,613 | ) | 33,997 | |||||||
| Severance plan | 0.5 | % | $ | (149 | ) | $ | 157 | |||||
Plan assets
Medical, Education and Severance plans are unfunded. Pension and pension bonds plans are covered by assets in five trust funds with the following investment allocation:
| Investment | 2014 | 2013 | ||||||||||||||
| Colombian Government treasury bonds (TES) | $ | 4,298,278 | 37 | % | $ | 4,311,575 | 38 | % | ||||||||
| Non-governmental entity bonds | 3,591,046 | 30 | % | 3,567,065 | 31 | % | ||||||||||
| Other securities in COP | 2,094,568 | 18 | % | 2,038,017 | 18 | % | ||||||||||
| Other bonds | 825,970 | 7 | % | 864,917 | 8 | % | ||||||||||
| Other securities in foreign currency | 480,712 | 4 | % | 389,416 | 3 | % | ||||||||||
| Foreign countries government treasury bonds | 230,772 | 2 | % | 196,404 | 1 | % | ||||||||||
| Variable yield investments and other | 210,505 | 2 | % | 82,948 | 1 | % | ||||||||||
| Total | $ | 11,731,851 | 100 | % | $ | 11,450,342 | 100 | % | ||||||||
The plan assets do not contain any shares of stock of Ecopetrol or any of its related parties. However it includes bonds issued by the Company, representing 1.0% of fund investments. There is no significant risk concentrations within the plan assets.
The fair value of plan asset is calculated using quoted market prices in active markets. The company obtains these quoted prices from renowned trustworthy financial data providers in Colombia or abroad depending on the investment. For those portfolio items not having a quoted price the Company uses an income approach technique capturing observable market data. Our fair value measurements do not use any unobservable inputs for significant valuations.
Decree 1861 of 2012 establishes the investment regime for trust funds guaranteeing pension plans of governmental entities, whose precepts are intended to bear a moderate risk. Assets fund investment decisions are made accordingly, following, among other, the following restrictions:
| - | Investments in public debt shall not exceed 50% of fund assets value. |
| - | Investments in joint portfolios, limited to 5% of fund assets value, are allowed only if its index is representative of general market behavior, and is not related to specific economic sectors or specific issuers. |
| - | Investments in funds representing a foreign index are limited to 5% of fund assets. |
| - | Investments in Ecopetrol S.A. shares are allowed. |
| F-68 |
Ecopetrol S.A. and Subsidiaries
Notes to the Consolidated Financial Statements
Years ended December 31, 2014, 2013 and 2012
(Expressed in millions of Colombian pesos)
| - | Forbidden investments: |
| o | Shares of foreign companies or securities representing these shares. |
| o | Asset-backed securities different from mortgage-backed securities. |
| o | Private capital funds. |
| o | Investments regarding related parties of the trust fund manager. |
| vii. | PROVISIONS AND CONTINGENCIES |
For U.S. GAAP, Accounting for Contingencies (ASC 450), provides guidance for recording contingencies. Under ASC 450, there are three levels of assessment of contingent events – probable, reasonably possible and remote. The term probable in ASC 450 is defined as “the future event or events that are likely to occur”. The term reasonably possible is defined as “the chance of the future event or events occurring is more than remote but less than likely”. While the term remote is defined as “the chance of the future event or events occurring is slight”.
Under ASC 450, an estimated loss related to a contingent event shall be accrued by a charge to income if both of the following conditions are met:
| • | Information available prior to issuance of the financial statements indicates that it is probable that an asset had been impaired or a liability had been incurred at the date of the financial statements |
| • | The amount of loss can be reasonably estimated. |
The amount recorded is an estimate of the amount of loss at the date of the financial statements. If the contingent event is evaluated to be reasonably possible, no provision for the contingent event may be made, but disclosure of the event is required with amount of loss that is reasonably possible.
As a result of the difference in the definition of “probable” between Colombian Government Entity GAAP and U.S. GAAP, and the general interpretation of the definition in practice in Colombia, there is a difference in the amount of the provision for legal proceedings.
Under Colombian Government Entity GAAP, it is required to recognize additional provisions regarding to capitalize the pension assets. According to Colombian actuarial assumptions, we estimate the difference between pension assets and liabilities, and accrued a provision due to capitalize the five trusts funds during 2014. Under U.S. GAAP, the estimates is write-off due to the explanation showed at note vi. Employee benefit plans.
The effects of these adjustments in the reconciliation of income were $273,446; $802,341 and $141,755 in December 2014, 2013 and 2012, respectively.
The effects of these adjustments in the reconciliation of consolidated shareholders´ equity were $1,568,010 and 1,294,564 in December 2014 and 2013, respectively.
| viii. | ASSETS AND LIABILITIES PRESENT VALUE |
Under Colombian government Entity GAAP, accounts receivable and payable are recognized at amortized cost, represented by any uncollected or unpaid balances, regardless if such balances are due within the year or not. For U.S. GAAP purposes, the Company measures the long-term balances at present value by discounting future cash flows at the appropriate discount rate. Such balance is amortized using the effective interest method.
The estimated discount rate for long-term liability is based on the Colombian Government Treasury bonds as it was considered that the Company has a similar credit risk.
As a result of the measurement of the Equity Tax liability and after minor adjustments recognized by Ecopetrol and its subsidiaries in the year 2014, 2013 and 2012, an adjustment for $(1,157) $39,029, and $(99,188), respectively was recorded.
| ix. | DEFERRED INCOME TAXES |
Under U.S. GAAP a valuation allowance is provided for deferred tax assets to the extent that it is more likely than not that they will not be realized.
Under Colombian Government Entity GAAP, deferred income taxes are calculated using the current statutory tax rate. Under U.S. GAAP, deferred income taxes are calculated based on rates and tax laws enacted at the reporting date considering the future tax rate that will apply when the deferred income tax difference will be realized.
All of the income tax effects in the U.S. GAAP reconciliation are the tax effect of pretax adjustments, and none relate to differences between the accounting for income tax standards.
| F-69 |
Ecopetrol S.A. and Subsidiaries
Notes to the Consolidated Financial Statements
Years ended December 31, 2014, 2013 and 2012
(Expressed in millions of Colombian pesos)
The Company and its subsidiaries file separate income tax returns since tax regulations do not allow consolidated income tax returns. There are no requirements to file tax returns by segments. Tax returns for each legal entity are required. Tax rate of Refineria de Cartagena S.A. Bioenergy and Comai is 15% because it has tax benefit for are located to the free trade zone until 2023, 2025 and 2021, respectively. The tax savings for the last three years has not been significant.
Taxable loss carry forwards will be deductible in future years, depend on countries’ tax regulations. As of December 31, 2014, Ecopetrol’s subsidiaries had accumulated tax loss carry-forwards and excesses of presumptive income generated in previous years, as follows:
| Expiration date | Loss carry-forwards | Deferred Income Tax | Excess of presumed income | Deferred Income Tax | ||||||||||||
| 2015 | $ | 61 ,424 | $ | 9,276 | $ | $ | ||||||||||
| 2016 | 38,488 | 5,868 | ||||||||||||||
| 2017 | 34,876 | 5,431 | ||||||||||||||
| 2018 | 16,600 | 2,615 | ||||||||||||||
| 2019 | 25,896 | 3,633 | ||||||||||||||
| 2020 | 2,143 | 528 | ||||||||||||||
| With no Maximum expiry date | 1,476,566 | 527,794 | ||||||||||||||
| $ | 179,428 | $ | 27,351 | $ | 1,476,566 | $ | 527,794 | |||||||||
Tax reform
The Colombian Congress adopted Law 1739 of 2014, which introduces significant reforms to the Colombian tax system, such as:
The Wealth Tax – The wealth tax would apply for 2015 through 2017 to domestic and foreign companies that hold any wealth in Colombia. The progressive rates for wealth tax are: 1.15% for 2015, 1% for 2016, and 0.4% for 2017. For individual tax payers would range from 0.20% to 1.5% until 2018.
CREE surtax - Impose a new CREE surtax for corporations and entities whose net income in fiscal years 2015 to 2018 is equal or greater than COP $800 million, with the CREE surtax rate imposed at a rate of 5% for 2015, 6% for 2016, 8% for 2017 and 9% for 2018.
Therefore, the rate of the income tax for Colombia-source income of foreign corporations and entities not attributable to a permanent establishment or branch in Colombia, according to the following schedule: 39% in 2015; 40% in 2016; 42% in 2017; 43% in 2018 and 34% since 2019 onwards.
The following information regarding income taxes has been prepared under U.S. GAAP:
Income Taxes
Total income taxes for the years ended December 31, 2014, 2013 and 2012 were comprised as follows:
| 2014 | 2013 | 2012 | ||||||||||
| Income tax expense | $ | 6,058,681 | $ | 8,774,819 | $ | 7,525,988 | ||||||
| Income tax effects based on items of other comprehensive income: | ||||||||||||
| Pension plan liability | 494,000 | 360,395 | 28,321 | |||||||||
| Available-for-sale securities | 1,000 | (47,894 | ) | (27,721 | ) | |||||||
| $ | 6,553,681 | $ | 9,087,320 | $ | 7,526,588 | |||||||
Income tax expense attributable to income consists of:
| 2014 | 2013 | 2012 | ||||||||||
| Current provision | $ | 6,731,655 | $ | 8,291,571 | $ | 7,095,874 | ||||||
| Deferred tax | (672,974 | ) | 483,248 | 430,114 | ||||||||
| $ | 6,058,681 | $ | 8,774,819 | $ | 7,525,988 | |||||||
In 2014, 2013 and 2012, there are foreign subsidiaries that do not pay income taxes and therefore do not generate income tax expense or deferred tax effects. Those entities that do pay taxes and are currently not generating taxable income will record a valuation allowance against any deferred tax asset recorded.
During 2014, the foreign pretax income of Hocol Petroleum Limited, Andean and Ecopetrol Pipelines International Limited, where reclassified to domestic pretax income due to decree 3026 of 2013. Those investment vehicles are considered local companies for tax purposes, even if there are located outside of Colombia
| F-70 |
Ecopetrol S.A. and Subsidiaries
Notes to the Consolidated Financial Statements
Years ended December 31, 2014, 2013 and 2012
(Expressed in millions of Colombian pesos)
Amount of foreign and domestic pretax income:
| 2014 | 2013 | 2012 | ||||||||||
| Domestic pretax income | $ | 15,009,647 | $ | 22,692,204 | $ | 21,083,067 | ||||||
| Foreign pretax income | (1,447,875 | ) | 569,160 | 1,330,415 | ||||||||
| Income before income tax | $ | 13,561,772 | $ | 23,261,364 | $ | 22,413,482 | ||||||
Unremitted earnings accumulated as of December 31, 2014 of certain international subsidiaries totaling $1,210,345 are permanently invested. No deferred tax liability was recognized for the remittance of such earnings. The income tax liability that might be incurred if such earnings were remitted to Colombia is not practicable to estimate.
Tax Rate Reconciliation
Income tax expense attributable to income was $6,058,681 $8,774,819, and $7,525,988, for the years ended December 31, 2014, 2013, and 2012 respectively, and differed from the amounts computed by applying the statutory income tax rate for Colombian entities that is 34% in 2014-2013 and 33% in 2012 to pretax income from continuing operations as follows:
| 2014 | 2013 | 2012 | ||||||||||
| Statutory income tax | 34.00 | % | 34.00 | % | 33.00 | % | ||||||
| Non – taxable income (exempt domestic dividend income) | 1.83 | % | (0.36 | )% | 0.04 | % | ||||||
| Non – deductible expenses | 2.45 | % | 3.03 | % | 0.28 | % | ||||||
| Others | 3.44 | % | 0.62 | % | (0.15 | )% | ||||||
| Other exempt income | - | % | - | % | (0.30 | )% | ||||||
| Income taxable at other tax rate | 4.68 | % | 0.47 | % | 0.60 | % | ||||||
| Changes in tax rate | (1.72 | )% | (0.03 | )% | 0.11 | % | ||||||
| Effective income tax under U.S. GAAP | 44.67 | % | 37.72 | % | 33.58 | % | ||||||
Ecopetrol has no unrecognized tax benefits. The taxes years open to the taxing authority’s reviews by major components are as follows:
| Company | Tax years | |
| Bioenergy | 2009 to 2013 | |
| Cenit | 2012 to 2013 | |
| Comai | 2012 to 2013 | |
| Equion | 2012 to 2013 | |
| Hocol | 2010 to 2013 | |
| Propilco | 2012 to 2013 | |
| Reficar | 2007 to 2013 | |
| Oleoducto de los Llanos | 2009 to 2013 | |
| Oleoducto Bicentenario | 2010 to 2013 | |
| Oleoducto de Colombia | 2009 to 2013 | |
| Ocensa | 2010 to 2013 | |
| Peru | 2009 to 2013 | |
| Ecopetrol | 2012 to 2013 |
The Company is subject to income taxation in many jurisdictions around the world. Unrecognized tax benefits reflect the difference between positions taken or expected to be taken on income tax returns and the amounts recognized in the financial statements.
We recognize interest accrued related to an underpayment of income taxes in interest expense. Penalties, if recognized, would be presented as a component of other expense.
Deferred Taxes
The significant components of deferred income tax expense attributable to income for the years ended December 31, 2014, 2013 and 2012 are as follows:
| F-71 |
Ecopetrol S.A. and Subsidiaries
Notes to the Consolidated Financial Statements
Years ended December 31, 2014, 2013 and 2012
(Expressed in millions of Colombian pesos)
| 2014 | 2013 | 2012 | ||||||||||
| Deferred income tax expense (exclusive of the effects of other components below): | ||||||||||||
| Accounts payable | $ | 51,161 | $ | (64,485,00 | ) | $ | 100,511 | |||||
| Inventories | (100,447 | ) | 314 | (5,967 | ) | |||||||
| Property, plant and equipment, principally due to DD&A | (1,090,163 | ) | (123,172 | ) | 78,201 | |||||||
| Deferred charges | (15,804 | ) | (13,357 | ) | (11,185 | ) | ||||||
| Prepaid expenses | (3,031 | ) | 161 | (75 | ) | |||||||
| Capital lease asset | (52,268 | ) | (43,086 | ) | 83,829 | |||||||
| Monetary correction and other | 29,055 | 84,370 | (275,294 | ) | ||||||||
| DD&A and inflation adjustments | 777,499 | 191,961 | 310,351 | |||||||||
| Investment | (179,334 | ) | (236,500 | ) | (352,018 | ) | ||||||
| Direct finance lease | 12,482 | 44,847 | (39,922 | ) | ||||||||
| Estimated liabilities and provisions | (324,892 | ) | (101,425 | ) | (73,955 | ) | ||||||
| Accounts and notes receivable | 59,391 | (80,492 | ) | (6,194 | ) | |||||||
| Carry forward loss | (125,181 | ) | (914,601 | ) | (159,549 | ) | ||||||
| Pension and benefits obligations | 407,674 | 363,630 | (56,941 | ) | ||||||||
| Natural and environmental resources capitalized expenses | (578,758 | ) | 667,635 | 381,072 | ||||||||
| Valuation allowance | 450,979 | 304,623 | 604,394 | |||||||||
| Additional tax discount on the acquisition of productive assets according to ASC 740 (1) | 9,226 | (15,114 | ) | 534 | ||||||||
| Excess in presumptive income tax | 22,055 | 641,773 | (373,085 | ) | ||||||||
| Other | 388,916 | (88,861 | ) | 37,676 | ||||||||
| Amortization of actuarial loss recorded in OCI | (493,975 | ) | (360,395 | ) | 28,321 | |||||||
| Unrealized loss in available for sale securities | (989 | ) | 47,894 | (27,721 | ) | |||||||
| Amortization of fiscal goodwill according to (ASC 830) | 83,430 | 177,527 | 187,132 | |||||||||
| $ | (672,974 | ) | $ | 483,247 | $ | 430,115 | ||||||
| (1) | This value corresponds to the deferred tax generated by the calculation of ASC 740, due to the implementation of the special deduction for investment in real productive assets. |
The tax effects of temporary differences that give rise to significant portions of the deferred tax assets and deferred tax liabilities at December 31, 2014, 2013 and 2012 are presented below:
| 2014 | 2013 | 2012 | ||||||||||
| Deferred income tax assets and liabilities | ||||||||||||
| Deferred income tax assets: | ||||||||||||
| Inventories | $ | 140,019 | $ | 39,572 | $ | 39,886 | ||||||
| Investments | 440,711 | 195,808 | 1,390,880 | |||||||||
| Accounts and notes receivable | 32,281 | 97,920 | 6,896 | |||||||||
| Deferred income | - | - | - | |||||||||
| Property, plant and equipment, principally due to DD&A | 4,346,543 | 3,263,018 | 2,991,078 | |||||||||
| Deferred charges | 57,510 | 41,706 | 28,348 | |||||||||
| Prepaid expenses | 3,039 | 9 | 169 | |||||||||
| Financial obligation, principally due to capitalized leasing | 158,150 | 105,882 | 62,797 | |||||||||
| Pension obligations | 332,851 | 740,525 | 1,104,155 | |||||||||
| Accounts payable | 183,400 | 234,561 | 170,076 | |||||||||
| Carry forward loss (1) | 1,373,126 | 1,247,945 | 333,344 | |||||||||
| Excess in presumptive income tax (2) | 27,351 | 49,406 | 691,179 | |||||||||
| Other | 10,365 | (7,813 | ) | 1,295 | ||||||||
| Amortization of fiscal goodwill according to ASC 830 | 112,573 | 206,734 | 385,800 | |||||||||
| Estimated liabilities and provisions | 1,345,086 | 1,020,194 | 918,770 | |||||||||
| Total gross deferred income tax assets | 8,563,005 | 7,235,467 | 8,124,673 | |||||||||
| Less valuation allowance (3) | (1,582,215 | ) | (1,131,236 | ) | (826,612 | ) | ||||||
| Deferred income tax assets | 6,980,790 | 6,104,231 | 7,298,061 | |||||||||
| Accounts and notes receivable | 4,284 | 10,532 | - | |||||||||
| Natural and environmental properties due to the difference between the methods of amortization | 2,004,034 | 2,582,791 | 1,915,156 | |||||||||
| Monetary correction and other | 534,634 | 590,158 | 505,788 | |||||||||
| DD&A and inflation adjustments | 2,160,509 | 1,383,011 | 1,191,049 | |||||||||
| Investments | 469,479 | 403,910 | 1,835,482 | |||||||||
| Cash and equivalents | 84,579 | - | - | |||||||||
| Direct finance lease | 57,329 | 44,847 | - | |||||||||
| Deferred income tax liabilities | 5,314,848 | 5,015,249 | 5,447,475 | |||||||||
| Net deferred income tax assets | $ | 1,665,942 | $ | 1,088,982 | $ | 1,850,586 | ||||||
| F-72 |
Ecopetrol S.A. and Subsidiaries
Notes to the Consolidated Financial Statements
Years ended December 31, 2014, 2013 and 2012
(Expressed in millions of Colombian pesos)
The realization of the net deferred tax assets detailed above is expected given that it is more likely than not that the results of future operations will generate sufficient taxable income to realize the deferred tax. For those which realization are not sure or have some doubts, a valuation allowances have been provided.
| (1) | Carry forwards losses are generated by subsidiaries and according to local tax laws, these losses do not expire. |
| (2) | The excess in presumptive income tax are generated by subsidiaries and will expire in 5 years. |
| (3) | The changes in the valuation allowance are mainly due to 2014 tax losses originated by Ecopetrol do Brazil, America INC, Ecopetrol del Perú, Bioenergy and Refineria de Cartagena $450,979 as detailed bellow: |
Valuation allowance
| 2014 | Variation | 2013 | ||||||||||
| Ecopetrol do Brazil | $ | 305,875 | $ | (340 | ) | $ | 306,215 | |||||
| Ecopetrol del Peru | 59,489 | 2,266 | 57,223 | |||||||||
| Ecopetrol Germany | 77,519 | 77,519 | - | |||||||||
| Bioenergy | 463 | - | 463 | |||||||||
| Ecopetrol America Inc. | 1,138,869 | 392,869 | 746,000 | |||||||||
| Refineria de Cartagena | - | (21,335 | ) | 21,335 | ||||||||
| $ | 1,582,215 | $ | 450,979 | $ | 1,131,236 | |||||||
| x. | REVENUE RECOGNITION |
| a.1 | Cost of sales - over and under deliveries |
Under Colombian Government Entity GAAP, the Company recognizes receivables from or payables to partners and to pipeline companies based on the cost of the inventory.
For U.S. GAAP purposes, the Company utilizes the entitlement method of accounting for over and under positions by which the amount of crude oil sold is based on its shared interest in the properties, and revenue is recognized based on market prices. The pipeline imbalances determined through volume allocation are recorded as either receivables or payables as per ASC 932-10-S99-5 valued at selling prices.
The Company’s crude oil under balance position at December 31, 2014 was $114,226 and at December 31, 2013 was $119,010 equivalent to 1,281,022 and 662,545 barrels, respectively.
During 2013, in the U.S. GAAP reconciliation process we did not reversed the previously adjustment for over & under lifting. As a result, the amount reported as an account receivable in 2013 was increased on $77,031. According to ASC 250, we analyzed the effect of this error and conclude it did not have a material effect on previously issued financial statements. This adjustment was corrected in our 2014 financial statements.
| a.2 | Cost of Sales |
Under U.S. GAAP, the related cost of sale in the reconciliation of net income for over and under deliveries transactions described at a.1 above amounted to $(29,522), $296,317 and $208,644 during 2014, 2013 and 2012, respectively, in comparison with the amount recognized under Colombian Government Entity GAAP.
| a.3 | Net vs. Gross sales |
The Company the sales transactions where it transports crude oil, from the supplier to the customer, using its pipelines. For U.S. GAAP purposes, when price is fixed, there are no changes made to the product and the Company has no physical inventory loss risk, among other criteria, the Company records such sales on a net basis. Under Colombian Government Entity GAAP, such crude oil sales are recognized gross.
| xi. | INFLATION ADJUSTMENTS |
The Colombian Government Entity GAAP consolidated financial statements were adjusted for inflation based on the variation in the IPC (Colombia’s equivalent to the consumer price index in the United States) for middle income-earners from January 1, 1992 to December 31, 2001 for Ecopetrol S.A. and from January 1, 1992 to December 31, 2006 for Oleoducto de Colombia S.A. (ODC), Hocol S.A., Oleoducto Central S.A. (Ocensa), Equion, and Reficar S.A. The adjustment was applied monthly to non-monetary assets, equity (except for the valuation surplus) and memorandum accounts.
Under U.S. GAAP, the aforementioned adjustments under Colombian Government Entity GAAP are not applicable and have been reversed.
| F-73 |
Ecopetrol S.A. and Subsidiaries
Notes to the Consolidated Financial Statements
Years ended December 31, 2014, 2013 and 2012
(Expressed in millions of Colombian pesos)
| xii. | INVENTORIES |
Under Colombian Government Entity GAAP, inventories are valued at the lower of average cost or sale price. Under U.S. GAAP, inventories are valued at the lower of average cost or market value, the determination of which can be made using several different methods acceptable under U.S. GAAP. An adjustment has been recorded to reflect the difference in the method used to determine the valuation of inventories that arises from using sale price instead of market value, as defined by U.S. GAAP. Inventories are also affected by the effect of adjustments to cost of sales included in this reconciliation. These adjustments are related to depreciation, capitalized expenses in property, plant and equipment, asset retirement cost and impairment of long-lived assets.
The effects of this adjustment (loss) gain in the reconciliation of income were $(9,124), $30,289 and $(16,699) in December 2014, 2013 and 2012, respectively.
The effects of these adjustments in the reconciliation of equity and the corresponding effect in inventory were $(12,410) and $(18,410) at December 31, 2014 and 2013, respectively.
| xiii. | LEASE ACCOUNTING |
Under both Colombian Government Entity GAAP and U.S. GAAP there are, lessee accounting for capital leases and operating leases. However, the tests used to determine if a lease is a capital or an operating lease differs between Colombian Government Entity GAAP and U.S. GAAP. In applying the tests in accordance with Colombian Government Entity GAAP, the Company has determined that all leases are operating leases. Under U.S. GAAP some of these leases should be accounted for as capital leases in accordance with ASC 840-10. As a result, adjustments were recorded to reflect the related assets and liabilities, and to recognize interest expense and de-recognize operating expenses associated with the lease payments.
Embedded Leasing
Under Colombian Government Entity GAAP, there is no requirement to identify whether the arrangements or contracts contain leases.
Under U.S. GAAP, an arrangement contains a lease if both of the following criteria are met:
| 1. | The arrangement depends on a specific fixed asset, either identified contractually or implicitly identified as no alternative item could feasibly be used. |
| 2. | The purchaser has the right to control the use of the underlying fixed asset, such control demonstrated by the existence of any of the following qualitative conditions: |
| a) | The purchaser can operate the asset or direct others to operate the asset while obtaining or controlling more than a minor amount of the asset’s output; | |
| b) | The purchaser can control physical access to the asset while obtaining or controlling more than a minor amount of the asset’s output; or | |
| c) | Probability is remote that another party will take more than minor amount of the asset’s output and the price is not fixed per unit. |
Under U.S. GAAP, if the arrangement contains a lease, ASC 840 is applied by both purchaser and supplier for recognition, measurement, classification and disclosure purposes.
Build, Operate, Maintain and Transfer (BOMT)
| Future Payments | Ecogas (1) - ECP | |||||||
| Year | USD (million) | Pesos | ||||||
| 2015 | 17.0 | 40,641 | ||||||
| 2016 | 16.2 | 38,825 | ||||||
| 2017 | 10.4 | 24,825 | ||||||
| Payments after 2018 | - | - | ||||||
| $ | 43.6 | $ | 104,290 | |||||
| F-74 |
Ecopetrol S.A. and Subsidiaries
Notes to the Consolidated Financial Statements
Years ended December 31, 2014, 2013 and 2012
(Expressed in millions of Colombian pesos)
| Future Payments | Termo ERB (2) - ODL | Termo Servicios (2) - ODL | Termo Proyectos (2) - ODL | |||||||||||||||||||||
| Year | USD (million) | Pesos | USD (million) | Pesos | USD (million) | Pesos | ||||||||||||||||||
| 2015 | 1.85 | 4,420.48 | 1.83 | 4,374.15 | 1.84 | 4,400.31 | ||||||||||||||||||
| 2016 | 1.90 | 4,553.10 | 1.88 | 4,505.37 | 1.89 | 4,532.32 | ||||||||||||||||||
| 2017 | 1.96 | 4,689.69 | 1.94 | 4,640.54 | 1.95 | 4,668.29 | ||||||||||||||||||
| 2018 | 2.02 | 4,830.38 | 2.00 | 4,779.75 | 2.01 | 4,808.34 | ||||||||||||||||||
| Payments after 2019 | 4.95 | 11,841.97 | 5.44 | 13,021.94 | 6.58 | 15,752.85 | ||||||||||||||||||
| $ | 12.68 | $ | 30,335.63 | $ | 13.09 | $ | 31,321.75 | $ | 14.28 | $ | 34,162.09 | |||||||||||||
In 2010, we entered in a new BOMT, corresponding to the gas treatment plant located in the Dina-Tello field with an estimated value of construction US$28 million. This BOMT is accounted as capital lease in accordance with ASC 840 such as the contracts described previously, this contract had an original term of 8 years, ending in 2017.
Ecopetrol subscribed a contract with Unión Temporal Gas Gibraltar firm to advance the design, build, operation and maintenance of a treatment plant with 30 mpcd capacity. Likewise, we entered into a contract with Natural Gas E.S.P for marketing purposes. The Gibraltar gas processing plant is located between the cities of Toledo (Norte de Santander) and Cubará (Boyacá). This BOMT is accounted as a capital lease in accordance with ASC 840. This contract had original term of 15 years, ending in 2026.
Since 2012, the gas treatment plant located in Dina- Tello field, and the contracts with Unión Temporal Gas Gibraltar were recognized in our local financial statements, as a result of an internal consistency process between local and U.S. GAAP requirements.
| (1) | Three original leases that were accounted for as capital leases under U.S. GAAP are BOMT contracts, the use of which are specifically required under Colombian law for projects that involve the building, operating, maintaining and transferring of natural gas pipelines for the transportation of natural gas. These contracts had original terms of 20 years, no renewal provisions, and a purchase option. The rights to the leased assets were subsequently transferred to a related Company (ECOGAS) that was sold, but Ecopetrol was not relieved of the primary obligation under the original lease. This transfer was considered a sublease accounted for as a direct finance lease. In 2007, Ecopetrol received a prepayment of all amounts to be received during the term of the sublease contract. |
| (2) | ODL signed three agreements for the acquisition of energy conversation assets to meet the needs of power consumption of the booster stations ER1, ER2 and Rubiales field.
The assets will be owned by ODL if the purchase option is exercised during the term or at the end the contract. However, ODL has the alternative of not exercising the purchase option, in which case the assets will be removed by the Contractor.
Under U.S. GAAP these contacts were accounted for by ODL as finance leases registering the present value of the corresponding assets and liabilities net of amortization |
| xiv. | PROPERTY, PLANT AND EQUIPMENT |
Under Colombian Government Entity GAAP, property, plant and equipment are recorded at cost and are adjusted for inflation until 2001. The cost includes administrative expenses until 2004, financial expenses and exchange differences from foreign currency financing until the asset is placed in service. Normal disbursements for maintenance and repairs are charged to expense and those significant costs that improve efficiency or extend the useful life are capitalized. Under U.S. GAAP, cost includes expenditures until the asset is placed in service such as installation cost, freight, interest, retirement cost; construction cost and other direct expenses are capitalized, with exception of adjustment for inflation and foreign currency loss. For U.S. GAAP purposes, administrative expenses capitalized were eliminated from property, plant and equipment. In addition, a deferred income tax asset resulted from the application of the provisions of ASC 740-10, Accounting for Acquired Temporary Differences in Certain Purchase Transactions that are not Accounted for as Business Combinations, since the investment in real productive assets creates an additional tax deduction of 30% in 2010. Starting in January 2011, income tax deductions from investments in said asset are no longer be available.
The following table reflects the net changes in capitalized exploratory wells during 2014 and 2013. It does not include amounts that were capitalized and recorded as expenses during the same period under the successful efforts method.
| 2014 | 2013 | |||||||
| Opening balance at January 1 | $ | 2,353,822 | $ | 1,427,947 | ||||
| Additions to capitalized exploratory well costs | 960,641 | 1,456,994 | ||||||
| Reclassifications to wells, facilities and equipment based on the determination of proved reserves | (350,419 | ) | (136,747 | ) | ||||
| Capitalized exploratory well costs charged to expense* | (653,752 | ) | (394,372 | ) | ||||
| Retirement for sale due to declarations of commerciality | (917 | ) | - | |||||
| Conversion effect | 90,381 | - | ||||||
| Ending balance at December 31 | $ | 2,399,756 | $ | 2,353,822 | ||||
* Includes $126,427 and $110,327 of capitalized exploratory well costs at December 31, 2014 and 2013 respectively, which were declared as dry wells during 2015 and 2014 respectively.
| F-75 |
Ecopetrol S.A. and Subsidiaries
Notes to the Consolidated Financial Statements
Years ended December 31, 2014, 2013 and 2012
(Expressed in millions of Colombian pesos)
Accounting For Suspended Exploratory Wells
The following table represents a classification by ages for constructions in progress based on the drilling completion date and the number of projects that are in ongoing drilling for a period exceeding one year as from the completion date.
| 2014 | 2013 | |||||||
| Between 1 and 3 years (a) | $ | 416,687 | $ | 400,276 | ||||
| Between 3 and 5 years (b) | 25,703 | 53,028 | ||||||
| More than 5 years (c) | 41,622 | 33,521 | ||||||
| Total suspended exploratory wells | $ | 484,011 | $ | 486,825 | ||||
| No. of projects exceeding 1 year | 36 | 26 | ||||||
| (a) | Corresponds to 6 projects of Ecopetrol, 1 projects of Ecopetrol America Inc. and 10 projects of Hocol that are pending project tradability statement or that are temporarily closed due to environmental issues. | |
| (b) | For 2014, its mainly relates to Huron-2 well owned by Hocol, which is in improved recovery period. For 2013, it corresponds to well Oripaya 1 which was temporarily abandoned. It will be reactivated when required as a producing well after conducting workover procedure. |
| (c) | Corresponds to Huron-1 well closed because it is not connected to production facilities. There is a currently development project to associate at the facilities of the Piedemonte contract, because the size and Huron’s economy do not support an independent development. We expect to start production in 2016. |
| a. | Interest |
Under Colombian Government Entity GAAP, all interest paid net of interest income is subject to capitalization regardless of the utilization of the funds. Exchange rate differential is also capitalized as part of the asset.The Company´s assessment of the methodology followed to determine the capitalization amount under U.S. GAAP considered more detailed information available to estimate the interest to be capitalized.
Previous to 2010, the calculations were made based on the average monthly disbursements, as an improvement, the Company obtained a detail of the assets associated to the debt and was able to apply the analysis and calculations based on each project, providing further detail of interest capitalized. The impact was recognized during 2010 as it was considered a change in an accounting estimate per ASC 250-10-45-17 and 18, Change in Accounting Estimates.
The total interest capitalized during 2014 under Colombian Government Entity GAAP was $687,371 and the total interest capitalized under U.S. GAAP was $414,464. The effect of this adjustment in the reconciliation of income was $272,907. The total interest capitalized during 2013 under Colombian Government Entity GAAP was $637,043 and the total interest capitalized under U.S. GAAP was $156,530. The effect of this adjustment in the reconciliation of income was $480,513. The total interest capitalized during 2012 under Colombian Government Entity GAAP was $761,199 and the total interest capitalized under U.S. GAAP was $153,999. The effect of this adjustment in the reconciliation of income was $607,200.
| b. | Impairment |
Under Colombian Government Entity GAAP, technical appraisals for property, plant and equipment are performed at least every three years. If the technical study is higher or lower that the carrying value, the difference is recorded as an increase or decrease of equity. If the technical study reduces the valuation surplus below zero, the negative difference is recorded as expenses in results of operations. Under U.S. GAAP, in accordance with ASC 360-10, Property, Plant, and Equipment - Impairment or Disposal of Long-Lived Assets (ASC 360-10), property, plant, and equipment are reviewed for impairment whenever events or changes in circumstances indicate that the carrying amount of an asset may not be recoverable. If circumstances require a long-lived asset to be tested for possible impairment, the Company first compares undiscounted cash flows expected to be generated by the asset to the carrying value of the asset. If the carrying value of the long-lived asset is not recoverable on an undiscounted cash flow basis, impairment is recognized to the extent that the carrying value exceeds its fair value. Until 2013, fair value was determined through discounted cash flow models computed by applying unweighted arithmetic average of the first-day-of-the-month for oil and gas price to year-end quantities of estimated net proved reserves. In 2014, fair value was determined through discounted cash flow models computes applying market prices as a result of decline in the international oil prices. For U.S. GAAP purposes, the Company reviewed property, plant and equipment for impairment as of December 31, 2014, 2013, 2012, and recorded impairment losses when required.
For U.S. GAAP purposes, the Company recorded an impairment loss of $402,247 in 2014 related mainly to the decline in the international oil prices and the decrease of reserve estimate revision. In 2013 the Company recognized an impairment loss of $45,620 related to the decrease of reserves estimate revision. In 2012, the company recognized an impairment loss of $276,145, $80,242 corresponding to production fields and $195,903 related to pipeline transportation systems.
| F-76 |
Ecopetrol S.A. and Subsidiaries
Notes to the Consolidated Financial Statements
Years ended December 31, 2014, 2013 and 2012
(Expressed in millions of Colombian pesos)
| c. | Revaluation of property, plant and equipment and public accounting effect |
Under Colombian Government Entity GAAP valuation surplus of property, plant and equipment and public accounting effect correspond to the difference between net book value and the market value for real estate or the current value in use for property, plant and equipment, determined by specialists. These accounts are reflected as valuations and as valuation surplus from reappraisals of assets and the public accounting effect (components of equity) in the Company’s consolidated balances sheets. The last valuation was in December 2013. Technical appraisals are valid for three years.
Under U.S. GAAP, the valuation surplus of assets and the public accounting effect are not permitted.
| xv. | DEPRECIATION, DEPLETION AND AMORTIZATION |
Under Colombian Government Entity GAAP, all tangible equipment, including those used in crude oil and natural gas, exploration and development, are depreciated on a straight-line basis over the related estimated useful lives. Intangible crude oil and natural gas assets reflected on the Company’s consolidated balance sheets as natural and environmental resources are depleted on a units-of-production basis.
In the case of HOCOL, all tangible and intangible assets used in the production of crude and natural gas production are depreciated or depleted using the units of production method, using proved developed reserves, except for the pipeline assets which are depreciated on a straight-line basis over the related estimated useful life (18, 23 and 40 years). For BIOENERGY, in relation to agricultural sugarcane crops, the company develops the plantations that it will use as base for the production of Bioethanol. The cost of the agricultural plantations will be amortized during productive cycle time frame, using a method at recognized technical value.
Under U.S. GAAP, all assets, including tangible equipment, used in crude oil and natural gas producing activities are required to be depreciated or depleted using a units-of-production method, using proved developed reserves calculated in accordance with SEC requirements. Therefore, an adjustment to net income per U.S. GAAP has been recorded to account for the difference in depreciation, depletion and amortization expense based on the above-described differences in the methods used. In addition, the financial statements reflect the amortization of those assets affected by the application of ASC 740-10, Accounting for Acquired Temporary Differences in Certain Purchase Transactions That Are Not Accounted for as Business Combinations. Therefore, an adjustment to net income per U.S. GAAP has been recorded to account for the difference in depreciation, depletion and amortization expense.
| xvi. | ASSET RETIREMENT OBLIGATIONS |
Under Colombian Government Entity GAAP, the Company updates annually the analysis of the estimated liability for future asset retirement obligations as of each balance sheet date. The liability is adjusted to the current value and an offsetting amount is recorded as an adjustment to the asset cost.
For purposes of U.S. GAAP reporting, the Company follows the provisions of Accounting Standards Codification ASC 410-20 Asset Retirement Obligations. ASC 410-20 requires the Company to recognize a liability for the present value of all legal obligations associated with the retirement of tangible, long-lived assets as of the date when the legal obligation began and capitalize an equal amount as an asset retirement cost (asset). Each period the liability is accreted using the effective interest rate method. The accretion is included as an operating expense. The cost associated with the abandonment obligation, is included in the computation of depreciation, depletion and amortization.
An adjustment has been recorded in the consolidated financial statements to reflect accretion expense, and the related obligation and assets in accordance with ASC 410-20.
For Pipeline systems there is insufficient information to reasonably determine the timing and/or method of settlement for estimating the fair value of the asset retirement obligation. In these cases, the asset retirement obligation cost is considered indeterminate because there is no data or information that can be derived from past practice, industry practice, our intentions or the estimated economic life of the asset. Useful lives of most pipeline systems are primarily derived from available supply resources and ultimate consumption of those resources by end users. Variables can affect the remaining lives of the assets which preclude us from making a reasonable estimate of the asset retirement obligation.
Indeterminate asset retirement obligation costs will be recognized in the period in which sufficient information exists to allow us to reasonably estimate potential settlement dates and methods.
In addition to the aforementioned situation, it is not possible at this time to reasonably estimate the amount of any obligation for asset retirement obligation related to refineries. In addition, The Company believes there is not sufficient information available to estimate the fair value of the asset retirement obligation because the settlement date or the range of potential settlement dates have not been specified by others and information is not available to apply an expected present value technique.
The following table presents the changes in asset retirement obligations for 2014 and 2013 as is required by ASC 410-20.
| F-77 |
Ecopetrol S.A. and Subsidiaries
Notes to the Consolidated Financial Statements
Years ended December 31, 2014, 2013 and 2012
(Expressed in millions of Colombian pesos)
| 2014 | 2013 | |||||||
| Balance at beginning of year | $ | 2,754,070 | $ | 2,219,651 | ||||
| Liabilities incurred in the current year | 168,669 | 25,097 | ||||||
| Revisions in estimated cash flows | 436,412 | 426,727 | ||||||
| Liabilities settled in the current period | (102,840 | ) | (94,950 | ) | ||||
| Accretion expense | 202,013 | 177,545 | ||||||
| Balance at end of year | $ | 3,458,324 | $ | 2,754,070 | ||||
| xvii. | EQUITY CONTRIBUTIONS |
| a. | Incorporated Institutional Equity |
At the end of association contracts that were signed prior to January 1, 2004, private companies are required to transfer, without cost, to Ecopetrol, all producing wells, facilities and other real estate and assets acquired in executing the contracts. Under Colombian Government Entity GAAP, the Company accounts for the receipt, using the relinquishing Company’s reported historical cost, by recording an increase to assets and equity. The assets are then depreciated in accordance with the Company’s previously disclosed accounting policies. For U.S. GAAP reporting purposes, these balances and their related impacts on accumulated depreciation, depletion and amortization, and cost of production have been removed from the financial statements, based on the fact that the cost of these assets is zero.
The adjustment to conform to U.S. GAAP in 2014 was a reduction in equity of $18,812 (original value of $151,387 net of $132,575 in accumulated depreciation or the assets received), holds materials of $1,062.
The adjustment to conform to U.S. GAAP in 2013 was a reduction in equity of $28,300 (original value of $149,923 net of $121,623 in accumulated depreciation or the assets received), holds materials of $1,068.
| b. | Reversal of Concession Rights Contributed as Capital |
Under Colombian Government Entity GAAP, the Company recorded as reservoirs the contributions of the Nation represented by crude oil and natural gas reserves deriving from the reversion of concessions of oilfield areas in favor of the Nation, given before the effectiveness of Decree 1760 of 2003. Reserves were valued by means of the technical-economic model where the value per barrel resulted from the relation of the net present value obtained at a discount rate and the total proved reserves on the contribution date.
For U.S. GAAP purposes, these reversions were considered a transfer of assets between entities under common control. Ecopetrol, the entity that received the net assets, recognized the assets transferred at their carrying amounts in the accounts of the transferring entity at the date of transfer which was zero value. The unamortized amount reverted at December 31, 2014 and 2013 was $12,953 and $14,733 respectively. Since 2003 (creation of the Agencia Nacional de Hidrocarburos - ANH) there have not been reversals of concessions.
| xiii. | INDEBTEDNESS COST |
Under Colombian Government Entity GAAP, the borrowing costs correspond to interest paid, lender commissions and other costs related to the debt transactions, the exchange difference for the interest rate to be paid, the amortization of premiums and discounts in the placement of bonds and securities, and any income results earned on the temporary investment of such loans.
Under U.S. GAAP, the borrowing costs correspond to interest paid, lender commissions and other costs related to the debt transactions, the amortization of premiums and discounts in the placement of bonds and securities, should not offset interest expense with interest income, unless the financing transaction involves restricted, tax-exempt borrowings. Unlike Colombian Government Entity GAAP, the cost of borrowing does not include the exchange difference for the interest rate to be paid, unless such difference forms part of the negotiation of the interest rate for the transaction.
The total indebtedness cost incurred during 2014 under Colombian Government Entity GAAP was $652,489 and the total indebtedness cost incurred under U.S. GAAP was $647,358. The effects of this adjustment in the reconciliation of income were $5,131. The total indebtedness cost incurred during 2013 under Colombian Government Entity GAAP was $1,022,774 and the total indebtedness cost incurred under U.S. GAAP was $1,021,389. The effects of this adjustment in the reconciliation of income were $1,385. The total indebtedness cost incurred during 2012 under Colombian Government Entity GAAP was $820,821 and the total indebtedness cost incurred under U.S. GAAP was $820,856. The effects of this adjustment in the reconciliation of income were $36.
In 2013 an amount of $389,259 about the foreign exchange difference related to indebtedness cost on Reficar were capitalized. According to ASC 250, we analyzed the effect of this error and conclude it did not have a material effect on previously issued financial statements, we corrected it prospectively in our 2014 financial statements.
| F-78 |
Ecopetrol S.A. and Subsidiaries
Notes to the Consolidated Financial Statements
Years ended December 31, 2014, 2013 and 2012
(Expressed in millions of Colombian pesos)
| xix. | BUSINESS COMBINATIONS |
| a. | Goodwill |
Under Colombian Government Entity GAAP, goodwill corresponds to the difference between the acquisition price and the book value of the acquired company and is recognized as an intangible asset. Separate intangibles are not identified under Colombian Government Entity GAAP nor are assets stepped up to fair values as a result of acquisitions; if the book value is higher than the acquisition price, the resulting difference is recorded as a gain. The amount recognized as goodwill is amortized during the period in which the Company expects to receive future benefits; in addition, it is subject to an annual impairment test.
Under U.S. GAAP ASC 350-20-35-3, we first assess qualitative factors to determine whether to perform the goodwill impairment test. If determined necessary, we use the two step impairment test in order to identify potential goodwill impairments and to measure the amount of impairment loss to be recognized. In the first step, we compare the fair value of a reporting unit with its carrying amount, including goodwill. If the carrying amount of a reporting unit exceeds its fair value of the reporting unit, goodwill of the reporting unit is considered impaired; thus, the second step of the impairment test is necessary.
The second step of the goodwill impairment test, used to measure the amount of impairment loss, compares the implied fair value of reporting unit goodwill with the carrying amount of that goodwill. If the carrying amount of reporting unit goodwill exceeds the implied fair value of that goodwill, an impairment loss shall be recognized in an amount equal to that excess. The loss recognized cannot exceed the carrying amount of goodwill.
After a goodwill impairment loss is recognized, the adjusted carrying amount of goodwill shall be its new accounting basis.
The following table shows, by Company, the goodwill balance as of December 31, 2014, 2013 and 2012, net of the amount of deferred income tax on goodwill and the translation adjustment:
| Company | Balance before impairment 2013 | Goodwill acquired during 2014 | Exchange rate effect | Deferred income tax | Balance before impairment 2014 | Accumulated impairment 2014 | Balance 2014 | |||||||||||||||||||||
| Propilco | $ | 687,337 | $ | - | $ | 87,405 | $ | (1,540 | ) | $ | 773,202 | $ | (327,183 | ) | $ | 446,019 | ||||||||||||
| Refineria de Cartagena S.A. | 725,900 | - | 175,419 | - | 901,319 | - | 901,319 | |||||||||||||||||||||
| Bioenergy | 8,993 | - | - | - | 8,993 | - | 8,993 | |||||||||||||||||||||
| Total | $ | 1,422,230 | $ | - | $ | 262,824 | $ | (1,540 | ) | $ | 1,683,514 | $ | (327,183 | ) | $ | 1,356,331 | ||||||||||||
| Company | Balance before impairment 2012 | Goodwill acquired
during | Exchange rate effect | Deferred income tax | Balance before impairment 2013 | Accumulated impairment 2013 | Balance 2013 | |||||||||||||||||||||
| Propilco | $ | 636,018 | $ | - | $ | 52,859 | $ | (1,540 | ) | $ | 687,337 | $ | (327,183 | ) | $ | 360,154 | ||||||||||||
| Refineria de Cartagena S.A. | 666,150 | - | 59,750 | - | 725,900 | - | 725,900 | |||||||||||||||||||||
| Bioenergy | 8,993 | - | - | - | 8,993 | - | 8,993 | |||||||||||||||||||||
| Total | $ | 1,311,161 | $ | - | $ | 112,609 | $ | (1,540 | ) | $ | 1,422,230 | $ | (327,183 | ) | $ | 1,095,047 | ||||||||||||
| F-79 |
Ecopetrol S.A. and Subsidiaries
Notes to the Consolidated Financial Statements
Years ended December 31, 2014, 2013 and 2012
(Expressed in millions of Colombian pesos)
Under Colombian Government Entity GAAP, the following table shows the amounts deductible for income tax purposes for 2014 and 2013.
| 2014 | ||||||||||||||||||||
| Company | Goodwill | Accumulated Amortization | Balance | Net Effect | Remaining time-years | |||||||||||||||
| Propilco | $ | 176,506 | $ | (78,133 | ) | $ | 98,373 | $ | 36,766 | 12.8 | ||||||||||
| Andean Chemicals Ltd | 205,541 | (89,267 | ) | 116,274 | 43,456 | 12.8 | ||||||||||||||
| IPL Enterprises | 880,127 | (269,462 | ) | 610,665 | 232,389 | 10.0 | ||||||||||||||
| Offshore International Group – “OIG” | 248,636 | (150,585 | ) | 98,050 | 116,092 | 9.0 | ||||||||||||||
| Hocol | 742,345 | (255,760 | ) | 486,585 | 182,783 | 11.0 | ||||||||||||||
| Equion | 629,375 | (311,141 | ) | 318,234 | 127,736 | 6.3 | ||||||||||||||
| Total | $ | 2,882,530 | $ | (1,154,348 | ) | $ | 1,728,182 | $ | 739,223 | |||||||||||
| 2013 | ||||||||||||||||||||
| Company | Goodwill | Accumulated Amortization | Balance | Net Effect | Remaining time-years | |||||||||||||||
| Propilco | $ | 176,506 | $ | (68,370 | ) | $ | 108,137 | $ | 36,766 | 13.8 | ||||||||||
| Andean Chemicals Ltd | 205,541 | (77,729 | ) | 127,812 | 43,456 | 13.8 | ||||||||||||||
| IPL Enterprises | 880,127 | (196,631 | ) | 683,496 | 232,389 | 11.0 | ||||||||||||||
| Offshore International Group – “OIG” | 536,079 | (194,631 | ) | 341,448 | 116,092 | 10.0 | ||||||||||||||
| Hocol | 742,345 | (204,747 | ) | 537,598 | 182,783 | 12.0 | ||||||||||||||
| Equion | 629,375 | (253,682 | ) | 375,693 | 127,736 | 7.3 | ||||||||||||||
| Total | $ | 3,169,973 | $ | (995,790 | ) | $ | 2,174,184 | $ | 739,222 | |||||||||||
Under Colombian Government Entity GAAP in 2014 and 2013, $158,559 and $144,356 were amortized in regard to goodwill acquired from OIG, Hocol, Andean Chemicals, IPL Enterprises, Propilco and Equion. The amortization in the table above represents the accumulated amortization of the companies that could be deductible for income tax purposes. Under U.S. GAAP, goodwill acquired from OIG, which is recognized by the equity method, is included as part of the investment.
Under U.S. GAAP, Ecopetrol tests goodwill for impairment at least annually using a two-step process that begins with an estimation of the fair value of a reporting unit. The first step is a screen for potential impairment and the second step measures the amount of impairment. Ecopetrol did not perform a qualitative analysis although allowed.
For impairment purposes fair value is determined by reference to market value, if available, or by a qualified evaluator or pricing model. Determination of a fair value by a qualified evaluator or pricing model requires management to make assumptions and use estimates. Management believes that the assumptions and estimates used are reasonable and supportable in the existing market environment and commensurate with the risk profile of the assets valued. However, different assumptions and estimates could be used which would lead to different results. The valuation models used to determine the fair value of these companies are sensitive to changes in the underlying assumptions. For example, the prices and volumes of product sales to be achieved and the prices which will be paid for the purchase of raw materials are assumptions which may vary in the future. Adverse changes in any of these assumptions could lead the Company to record a goodwill impairment charge.
During 2013, Ecopetrol performed an impairment test of goodwill which showed that the Propilco was impaired by $280,493. During 2013, lower supply from Ecopetrol increased the variable costs, as the company switched their raw material suppliers. Furthermore, the company performance was challenged by shifts in the petrochemical markets, as a result of new shale gas discoveries in the U.S. and low costs products coming from Asia. During 2014 and 2012, Ecopetrol performed an impairment test of goodwill and there was no impairment.
| b. | Business Combination |
During 2014 and 2013, Ecopetrol was not in any business combinations.
| xx. | NON-CONTROLLING INTEREST |
Next table presents the carrying amount of total equity (net assets) attributable to the non-controlling interest under U.S. GAAP as of December 31st of 2014, 2013 and 2012.
| OCENSA | ODC | ODL | BIOENERGY | OBC | EQUION | TOTAL | ||||||||||||||||||||||
| Balance 2011 | $ | 92,307 | $ | 2,646 | $ | 227,639 | $ | 7,230 | $ | 306,888 | $ | 1,651,409 | $ | 2,288,119 | ||||||||||||||
| Acquired non-controlling interest | - | - | - | (1,797 | ) | 672 | - | (1,125 | ) | |||||||||||||||||||
| Issuance of Company shares | - | - | - | 5,492 | - | - | 5,492 | |||||||||||||||||||||
| Net income (loss) | 51,408 | 11,888 | 46,133 | (1,593 | ) | (13,700 | ) | 97,709 | 191,845 | |||||||||||||||||||
| Other comprehensive income | - | - | - | - | - | 121 | 121 | |||||||||||||||||||||
| Translation adjustments | - | - | (44 | ) | - | - | (49,923 | ) | (49,967 | ) | ||||||||||||||||||
| Spin-off of Ocensa shares | 73,797 | (73,797 | ) | - | ||||||||||||||||||||||||
| Dividends for Spin-Off | (37 | ) | (37 | ) | ||||||||||||||||||||||||
| Balance 2012 | $ | 217,512 | $ | 14,534 | $ | 273,728 | $ | 9,332 | $ | 293,860 | $ | 1,625,482 | $ | 2,434,448 | ||||||||||||||
| Payment of dividends | (255,719 | ) | (255,719 | ) | ||||||||||||||||||||||||
| Capital contribution | 9,164 | 9,164 | ||||||||||||||||||||||||||
| Net income (loss) | 344,247 | 18,566 | 56,583 | (2,335 | ) | (37,992 | ) | 160,620 | 539,689 | |||||||||||||||||||
| Other comprehensive income | 43 | 43 | ||||||||||||||||||||||||||
| Translation adjustments | 85 | 87,621 | 87,706 | |||||||||||||||||||||||||
| Balance 2013 | $ | 306,040 | $ | 33,100 | $ | 330,396 | $ | 16,161 | $ | 255,868 | $ | 1,873,766 | $ | 2,815,331 | ||||||||||||||
| Net income (loss) | 388,728 | 29,309 | 81,417 | (5,054 | ) | 93,300 | 95,793 | 683,493 | ||||||||||||||||||||
| Payment of dividends | (388,188 | ) | (19,005 | ) | (71,030 | ) | - | (38,920 | ) | (558,016 | ) | (1,075,159 | ) | |||||||||||||||
| Return of capital to shareholders | - | (8,935 | ) | - | - | - | - | (8,935 | ) | |||||||||||||||||||
| Translation adjustments | - | - | (1,279 | ) | - | - | 222,893 | 221,614 | ||||||||||||||||||||
| Issuance of company shares | - | 3,578 | - | - | 3,578 | |||||||||||||||||||||||
| Transfer to retained earnings | - | 8,515 | - | - | - | - | 8,515 | |||||||||||||||||||||
| Other comprehensive Income | - | - | - | - | - | (69 | ) | (69 | ) | |||||||||||||||||||
| Balance 2014 | $ | 306,580 | $ | 42,984 | $ | 339,504 | $ | 14,685 | $ | 310,248 | $ | 1,634,367 | $ | 2,648,368 | ||||||||||||||
| F-80 |
Ecopetrol S.A. and Subsidiaries
Notes to the Consolidated Financial Statements
Years ended December 31, 2014, 2013 and 2012
(Expressed in millions of Colombian pesos)
| xxi. | CUMULATIVE TRANSLATION ADJUSTMENT |
Under Colombian Government Entity GAAP, the companies domiciled outside Colombia, regardless of their functional currency, must report in USD and translate balances to Colombian pesos with the impact recorded as a cumulative translation adjustment.
For U.S. GAAP, the Company must remeasure all subsidiary financial information to its functional currency and then translate it to the reporting currency. This difference in methodology results in a difference in the translated amounts recorded in the consolidated financial statements.
| xxii. | EARNINGS PER SHARE |
Under Colombian Government Entity GAAP, earnings per share ("EPS") are calculated by dividing net income by the weighted average of both common and preferred shares outstanding for each period presented. However, although the Company has presented EPS under Colombian Government Entity GAAP for informational purposes, the presentation of EPS is not required for financial statements issued under Colombian Government Entity GAAP. The Company does not have any issued or outstanding preferred shares.
U.S. GAAP requires dual presentation of basic and diluted EPS for entities with complex capital structures, as well as a reconciliation of the basic EPS calculation with the diluted EPS calculation. Basic EPS is calculated by dividing net income available to common shareholders by the weighted average of common shares outstanding for the corresponding period.
Diluted EPS assumes the issuance of common shares for all dilutive potential common shares outstanding during the reporting period. For the years ended December 31, 2014, 2013 and 2012, the Company had a simple capital structure. There are not any other compensation plan involving shares. Therefore, the Company is not required to present diluted EPS for these years.
| xxiii. | RECENTLY ADOPTED U.S. ACCOUNTING STANDARDS |
The Company did not adopt authoritative guidance in 2014 that had a material impact on the Company´s consolidated financial statements.
In May 2014, the FASB issued ASU 2014-09, which becomes effective for the company January 1, 2017. Early adoption is not permitted. The standard provides that an entity should recognize revenue to align with the transfer of promised goods or services to customers in an amount that reflects the consideration that the entity expects to be entitled to receive in exchange for those goods or services. The ASU, which replaces most existing revenue recognition guidance in U.S. GAAP, provides a five-step model for recognition of revenue, guidance on the accounting for certain costs of obtaining or fulfilling contracts with customers and specific disclosure requirements. Transition guidance permits either retrospective application or presentation of the cumulative effect at the adoption date. The company is reviewing the requirements of the ASU to determine the transition method it will apply and to update its assessments developed throughout the FASB’s deliberation period. The company is evaluating the effect of the standard on the company’s consolidated financial statements.
Note: At its April 1, 2015, meeting, the FASB tentatively decided to defer for one year the effective date of the new revenue standard (ASU 2014-09), this is beginning after December 15, 2017. Also entities would be permitted to early adopt the standard as of the original effective date in ASU 2014-09.
Other accounting standards that have been issued by the FASB or other standards-setting bodies are not expected to have a material impact on the Ecopetrol’s financial position, results of operations and/or cash flows.
| Recently issued Accounting Standards and U.S. GAAP Pronouncements |
In January, 2015, FASB issued ASU No. 2015-01 Income Statement—Extraordinary and Unusual Items (Subtopic 225-20), simplifying Income Statement presentation by eliminating the concept of Extraordinary Items. Eliminating the concept of extraordinary items will save time and reduce costs for preparers because they will not have to assess whether a particular event or transaction event is extraordinary (even if they ultimately would conclude it is not). This also alleviates uncertainty for preparers, auditors, and regulators because auditors and regulators no longer will need to evaluate whether a preparer treated an unusual and/or infrequent item appropriately. The amendments in this Update are effective for fiscal years, and interim periods within those fiscal years, beginning after December 15, 2015; early adoption is permitted. As of the reporting date we do not expect any significant effects arising from the adoption of this ASU.
| F-81 |
Ecopetrol S.A. and Subsidiaries
Notes to the Consolidated Financial Statements
Years ended December 31, 2014, 2013 and 2012
(Expressed in millions of Colombian pesos)
In February, 2015 ASU No. 2015-02 Consolidation was issued by FASB. The amendments in this Update affect reporting entities that are required to evaluate whether they should consolidate certain legal entities. All legal entities are subject to reevaluation under the revised consolidation model. Specifically, the amendments:
| 1. | Modify the evaluation of whether limited partnerships and similar legal entities are variable interest entities (VIEs) or voting interest entities |
| 2. | Eliminate the presumption that a general partner should consolidate a limited partnership |
| 3. | Affect the consolidation analysis of reporting entities that are involved with VIEs, particularly those that have fee arrangements and related party relationships |
| 4. | Provide a scope exception from consolidation guidance for reporting entities with interests in legal entities that are required to comply with or operate in accordance with requirements that are similar to those in Rule 2a-7 of the Investment Company Act of 1940 for registered money market funds. |
The amendments in this Update are effective for public business entities for fiscal years, and for interim periods within those fiscal years, beginning after December 15, 2015. For all other entities, the amendments in this Update are effective for fiscal years beginning after December 15, 2016, and for interim periods within fiscal years beginning after December 15, 2017. Early adoption is permitted, however Ecopetrol has not been considered it yet.
In April 2015, FASB issued ASU No 2015-03 Interest—Imputation of Interest (Subtopic 835-30). The Board received feedback that having different balance sheet presentation requirements for debt issuance costs and debt discount and premium creates unnecessary complexity. To simplify presentation of debt issuance costs, the amendments in this Update require that debt issuance costs related to a recognized debt liability be presented in the balance sheet as a direct deduction from the carrying amount of that debt liability, consistent with debt discounts. The recognition and measurement guidance for debt issuance costs are not affected by the amendments in this Update. For a public entity, the amendments in this Update are effective for annual reporting periods beginning after December 15, 2015 Ecopetrol is still assessing the impact of ASU No. 2015-03 in their financial statements.
In April, 2015 ASU No. 2015-04 Compensation – Retirement Benefits was issued by FASB. If a contribution or significant event (such as a plan amendment, settlement, or curtailment that calls for a remeasurement in accordance with existing requirements) occurs between the month-end date used to measure defined benefit plan assets and obligations and an entity’s fiscal year-end, the entity should adjust the measurement of defined benefit plan assets and obligations to reflect the effects of those contributions or significant events. However, an entity should not adjust the measurement of defined benefit plan assets and obligations for other events that occur between the month-end measurement and the entity’s fiscal year-end that are not caused by the entity (for example, changes in market prices or interest rates).
Currently, Ecopetrol actuarial calculations are performed in an interim date closest the end of the year. In addition, recent changes to the collective labor agreement were conducted in June 2014 and are effective for the next four years. The valuations take into account those changes and amendments made to each benefit plan.
Given the above and since the date of application of this ASU is December 15, 2015, Ecopetrol has not considered for early adoption, the update would have no impact.
| xxiv. | CONCENTRATIONS |
In 2014 one customer of the refining segment accounted for 12.1% of total sales. No other customers accounted for more than 10% of total sales in 2014. In 2013 there was one customer of the refining segment that accounted 11.4% of total sales. In 2012 there were no customers in excess of 10% of total sales. There was no exposure that affects the financial position of Ecopetrol if the company lost the client.
The majority of the Company’s assets and activities are located in Colombia. The financial position and results of operations of those subsidiaries located outside of Colombia are not material to the Company.
| xxv. | SEGMENT INFORMATION |
From the first quarter of 2013 a change was implemented in the reported segments, which consisted of removing the segment of Supply and Marketing. This change is because the marketing margin, which was the reason for that segment, has suffered different impacts (changes in the marketing scheme ANH royalties and therefore in agreement with that entity; preference of the Refinery by loading ANH crude and third parties, leaving this segment the crude oil marketing that has lower earning, among others) that make such a small margin today; and therefore cannot be considered in itself a core business of the company. This activity could migrate to a simple model of marketing services to Exploration and Production and Refining segments.
By eliminating the Supply and Marketing segment, which was approved by the Board Director, revenues and costs associated with the marketing of refined products, buying crude oil and gas, were allocated in proportion to their use to the Refining & Petrochemicals and Exploration & Production segments. The amounts for 2012 were restated for comparative purposes.
The following segment information has been prepared according to ASC 280, Disclosure about Segments of an Enterprise and Related Information. Financial information by business segment is reported in accordance with the internal reporting system under RCP and shows internal segment information that is used by the chief operating decision maker to manage and measure the performance of Ecopetrol.
| F-82 |
Ecopetrol S.A. and Subsidiaries
Notes to the Consolidated Financial Statements
Years ended December 31, 2014, 2013 and 2012
(Expressed in millions of Colombian pesos)
The financial information among segments is reported considering each business as a separate entity. Prices between segments are established by referencing those that would apply in an arm’s length transaction. Each segment should bear the costs and expenses required to put the product in terms of use or marketing. Each segment assumes its administrative expenses and all non-operational transactions related to their activity.
The Company operates under the following segments, which are described as follows:
Exploration and Production - this segment includes the Company’s oil & gas exploration and production activities. Revenue is derived from the sale of crude oil and natural gas to inter-company segments, at market prices, and to third parties. Revenue is derived from local sales of crude oil, regulated fuels, non-regulated fuels and natural gas. Sales are made to local and foreign distributors. Costs include those costs incurred in production. Expenses include all exploration costs that are not capitalized.
Refining and Petrochemicals - this segment includes the Company’s refining activities. Goods sold, both internally and to third parties, include refined products such as motor fuels, fuel oils and petrochemicals at market prices. This segment also includes sales of industrial services to third parties.
Transportation and Logistics - this segment includes the Company’s sales and costs associated with the Company’s pipelines and other transportation activities
These functions have been defined as the operating segments of the Company since these are the segments (a) that engage in business activities from which revenues are earned and expenses are incurred; (b) whose operating results are regularly reviewed by the Company's chief operating decision maker to allocate resources to the segments and assess their performance; and (c) for which discrete financial information is available. Internal transfers represent sales to intercompany segments and are recorded and presented at market prices.
The following tables present the Company’s consolidated balance sheet by segment in accordance with Colombian Government Entity GAAP:
| As of December 31, 2014 | ||||||||||||||||||||
| Exploration &
Production | Refining Activities | Transportation & logistics | Eliminations | Total | ||||||||||||||||
| Current assets | ||||||||||||||||||||
| Cash and cash equivalents | $ | 3,762,124 | $ | 756,415 | $ | 3,432,662 | $ | - | $ | 7,951,201 | ||||||||||
| Accounts and notes receivable | 2,346,871 | 1,395,581 | 673,263 | (306,661 | ) | 4,109,054 | ||||||||||||||
| Inventories | 1,361,538 | 1,463,727 | 232,885 | (34,647 | ) | 3,023,503 | ||||||||||||||
| Investments | 886,760 | 32,791 | 167,888 | - | 1,087,439 | |||||||||||||||
| Other current assets | 6,987,538 | 934,428 | 666,666 | (7,431 | ) | 8,581,201 | ||||||||||||||
| 15,344,831 | 4,582,942 | 5,173,364 | (348,739 | ) | 24,752,398 | |||||||||||||||
| Investments in non-consolidated companies | 1,511,367 | 58,823 | 35,797 | - | 1,605,987 | |||||||||||||||
| Property, plant and equipment, net | 13,376,080 | 23,730,491 | 13,678,119 | (128,496 | ) | 50,656,194 | ||||||||||||||
| Natural and environmental resources, net | 31,650,038 | 10,137 | - | - | 31,660,175 | |||||||||||||||
| Other long term assets | 8,035,797 | 7,893,999 | 17,570,021 | 6,720 | 33,506,537 | |||||||||||||||
| Long term assets | 54,573,282 | 31,693,450 | 31,283,937 | (121,776 | ) | 117,428,893 | ||||||||||||||
| Total assets | $ | 69,918,113 | $ | 36,276,392 | $ | 36,457,301 | $ | (470,515 | ) | $ | 142,181,291 | |||||||||
| Accounts payable | $ | (5,203,899 | ) | $ | (2,708,409 | ) | $ | (1,353,731 | ) | $ | 297,919 | $ | (8,968,120 | ) | ||||||
| Financial obligations short-term | (781,245 | ) | (421,432 | ) | (586,643 | ) | - | (1,789,320 | ) | |||||||||||
| Other current liabilities | (4,924,191 | ) | (2,625,015 | ) | (2,084,971 | ) | 3,240 | (9,630,937 | ) | |||||||||||
| Current liabilities | (10,909,335 | ) | (5,754,856 | ) | (4,025,345 | ) | 301,159 | (20,388,377 | ) | |||||||||||
| Financial obligations long-term | (11,866,828 | ) | (14,762,680 | ) | (7,232,456 | ) | 2,307 | (33,859,657 | ) | |||||||||||
| Other long term liabilities | (11,939,476 | ) | (1,920,398 | ) | (1,338,304 | ) | 6,828 | (15,191,350 | ) | |||||||||||
| Long term liabilities | (23,806,304 | ) | (16,683,078 | ) | (8,570,760 | ) | 9,135 | (49,051,007 | ) | |||||||||||
| Total liabilities | (34,715,639 | ) | (22,437,934 | ) | (12,596,105 | ) | 310,294 | (69,439,384 | ) | |||||||||||
| Non-controlling interest | (1,030,114 | ) | (19,023 | ) | (3,146,798 | ) | - | (4,195,935 | ) | |||||||||||
| Shareholders’ equity of Ecopetrol | (34,172,360 | ) | (13,819,435 | ) | (20,714,398 | ) | 160,221 | (68,545,972 | ) | |||||||||||
| Total equity | (35,202,474 | ) | (13,838,458 | ) | (23,861,196 | ) | 160,221 | (72,741,907 | ) | |||||||||||
| Total liabilities and equity | $ | (69,918,113 | ) | $ | (36,276,392 | ) | $ | (36,457,301 | ) | $ | 470,515 | $ | (142,181,291 | ) | ||||||
| Capital expenditures | $ | 9,901,856 | $ | 4,274,267 | $ | 1,591,969 | $ | (85,700 | ) | $ | 15,682,392 | |||||||||
| Goodwill | $ | 914,107 | $ | 217,186 | $ | 616,268 | $ | $ | 1,747,561 | |||||||||||
| As of December 31, 2013 | ||||||||||||||||||||
Exploration & Production | Refining Activities | Transportation & logistics | Eliminations | Total | ||||||||||||||||
| Current assets | ||||||||||||||||||||
| Cash and cash equivalents | $ | 4,341,135 | $ | 870,078 | $ | 3,630,225 | $ | - | $ | 8,841,438 | ||||||||||
| Accounts and notes receivable | 4,514,267 | 2,482,038 | 960,467 | (1,779,881 | ) | 6,176,891 | ||||||||||||||
| Inventories | 2,091,002 | 1,649,069 | 58,738 | (172,905 | ) | 3,625,904 | ||||||||||||||
| Investments | 2,546,465 | 7,322 | 263,497 | (934,049 | ) | 1,883,235 | ||||||||||||||
| Other current assets | 7,728,544 | 653,566 | 411,047 | (3,031 | ) | 8,790,126 | ||||||||||||||
| 21,221,413 | 5,662,073 | 5,323,974 | (2,889,866 | ) | 29,317,594 | |||||||||||||||
| Investments in non-consolidated companies | 469,027 | 263,406 | 263,384 | - | 995,817 | |||||||||||||||
| Property, plant and equipment, net | 9,390,055 | 17,505,340 | 13,305,781 | (50,642 | ) | 40,150,534 | ||||||||||||||
| Natural and environmental resources, net | 27,071,381 | - | - | - | 27,071,381 | |||||||||||||||
| Other long term assets | 10,174,551 | 4,787,534 | 21,331,735 | (1,401,152 | ) | 34,892,668 | ||||||||||||||
| Long term assets | 47,105,014 | 22,556,280 | 34,900,900 | (1,451,794 | ) | 103,110,400 | ||||||||||||||
| Total assets | $ | 68,326,427 | $ | 28,218,353 | $ | 40,224,874 | $ | (4,341,660 | ) | $ | 132,427,994 | |||||||||
| Accounts payable | $ | (5,505,697 | ) | $ | (3,139,887 | ) | $ | (2,488,495 | ) | $ | 1,661,255 | $ | (9,472,824 | ) | ||||||
| Financial obligations short-term | (236,376 | ) | (451,817 | ) | (261,708 | ) | 175,342 | (774,559 | ) | |||||||||||
| Other current liabilities | (7,239,844 | ) | (2,777,506 | ) | (1,970,784 | ) | - | (11,988,134 | ) | |||||||||||
| Current liabilities | (12,981,917 | ) | (6,369,210 | ) | (4,720,987 | ) | 1,836,597 | (22,235,517 | ) | |||||||||||
| Financial obligations long-term | (6,814,352 | ) | (10,901,056 | ) | (5,081,564 | ) | 1,372,980 | (21,423,992 | ) | |||||||||||
| Other long term liabilities | (10,003,930 | ) | (1,904,224 | ) | (2,103,773 | ) | 936,393 | (13,075,534 | ) | |||||||||||
| Long term liabilities | (16,818,282 | ) | (12,805,280 | ) | (7,185,337 | ) | 2,309,373 | (34,499,526 | ) | |||||||||||
| Total liabilities | (29,800,199 | ) | (19,174,490 | ) | (11,906,324 | ) | 4,145,970 | (56,735,043 | ) | |||||||||||
| Non-controlling interest | (1,376,969 | ) | (19,402 | ) | (3,177,377 | ) | - | (4,573,748 | ) | |||||||||||
| Shareholders’ equity of Ecopetrol | (37,149,259 | ) | (9,024,461 | ) | (25,141,173 | ) | 195,690 | (71,119,203 | ) | |||||||||||
| Total equity | (38,526,228 | ) | (9,043,863 | ) | (28,318,550 | ) | 195,690 | (75,692,951 | ) | |||||||||||
| Total liabilities and equity | $ | (68,326,427 | ) | $ | (28,218,353 | ) | $ | (40,224,874 | ) | $ | 4,341,660 | $ | (132,427,994 | ) | ||||||
| Capital expenditures | $ | 9,633,996 | $ | 3,972,027 | $ | 834,826 | $ | (216,035 | ) | $ | 14,224,814 | |||||||||
| Goodwill | $ | 1,254,739 | $ | 236,849 | $ | 683,497 | $ | - | $ | 2,175,084 | ||||||||||
| F-83 |
Ecopetrol S.A. and Subsidiaries
Notes to the Consolidated Financial Statements
Years ended December 31, 2014, 2013 and 2012
(Expressed in millions of Colombian pesos)
The Company’s consolidated statement of net income by segment is as follows in accordance with Colombian Government Entity GAAP:
| Year ended December 31, 2014 | ||||||||||||||||||||
| Exploration &
Production | Refining
Activities | Transportation
& logistics | Eliminations | Total | ||||||||||||||||
| Revenues: | ||||||||||||||||||||
| Local sales | $ | 2,510,099 | $ | 20,956,935 | $ | - | $ | - | $ | 23,467,034 | ||||||||||
| Foreign sales, net | 36,778,707 | 5,431,618 | - | - | 42,210,325 | |||||||||||||||
| Services | 87,669 | 12,951 | 3,147,359 | - | 3,247,979 | |||||||||||||||
| Inter-segment net operating revenues | 5,379,584 | 708,753 | 4,818,353 | (10,906,690 | ) | - | ||||||||||||||
| Total Revenue | 44,756,059 | 27,110,257 | 7,965,712 | (10,906,690 | ) | 68,925,338 | ||||||||||||||
| Cost of sales | 21,446,806 | 25,363,205 | 3,092,744 | (10,975,387 | ) | 38,927,368 | ||||||||||||||
| Depreciation, depletion and amortization | 4,769,778 | 583,813 | 773,057 | - | 6,126,648 | |||||||||||||||
| Selling and projects | 4,663,772 | 969,004 | 335,160 | (193,363 | ) | 5,774,573 | ||||||||||||||
| Administration expenses | 607,480 | 547,516 | 341,463 | (1,699 | ) | 1,494,760 | ||||||||||||||
| Costs and expenses | 31,487,836 | 27,463,538 | 4,542,424 | (11,170,449 | ) | 52,323,349 | ||||||||||||||
| Operating income | 13,268,223 | (353,281 | ) | 3,423,288 | 263,759 | 16,601,989 | ||||||||||||||
| Financial income (expenses), net | (551,492 | ) | (290,574 | ) | 170,930 | (354 | ) | (671,490 | ) | |||||||||||
| Pension expenses | (225,208 | ) | (255,913 | ) | (74,125 | ) | - | (555,246 | ) | |||||||||||
| Other non-operating income (expenses) | 153,080 | (90,074 | ) | (12,352 | ) | (5,160 | ) | 45,494 | ||||||||||||
| Other expenses, net | (623,620 | ) | (636,561 | ) | 84,453 | (5,514 | ) | (1,181,242 | ) | |||||||||||
| Income before income taxes and non-controlling | 12,644,603 | (989,842 | ) | 3,507,741 | 258,245 | 15,420,747 | ||||||||||||||
| Income tax benefit (expense) | (6,051,719 | ) | 87,784 | (1,154,932 | ) | (16,201 | ) | (7,135,068 | ) | |||||||||||
| Non-Controlling interest | (193,238 | ) | 4,140 | (586,311 | ) | - | (775,409 | ) | ||||||||||||
| Net income for the year | $ | 6,399,646 | $ | (897,918 | ) | $ | 1,766,498 | $ | 242,044 | $ | 7,510,270 | |||||||||
| Year ended December 31, 2013 | ||||||||||||||||||||
| Exploration &
Production | Refining
Activities | Transportation
& logistics | Eliminations | Total | ||||||||||||||||
| Revenues: | ||||||||||||||||||||
| Local sales | $ | 3,141,286 | $ | 20,463,151 | $ | - | $ | - | $ | 23,604,437 | ||||||||||
| Foreign sales, net | 36,440,725 | 7,854,089 | - | - | 44,294,814 | |||||||||||||||
| Services | 12,394 | 4,935 | 2,512,135 | - | 2,529,464 | |||||||||||||||
| Inter-segment net operating revenues | 10,384,798 | 913,504 | 3,702,992 | (15,001,294 | ) | - | ||||||||||||||
| Total Revenue | 49,979,203 | 29,235,679 | 6,215,127 | (15,001,294 | ) | 70,428,715 | ||||||||||||||
| Cost of sales | 20,962,509 | 28,642,962 | 2,970,887 | (15,052,311 | ) | 37,524,047 | ||||||||||||||
| Depreciation, depletion and amortization | 3,911,239 | 570,900 | 548,096 | - | 5,030,235 | |||||||||||||||
| Selling and projects | 2,963,917 | 1,150,460 | 301,145 | 168,464 | 4,583,986 | |||||||||||||||
| Administration expenses | 640,800 | 475,518 | 340,175 | (776 | ) | 1,455,717 | ||||||||||||||
| Costs and expenses | 28,478,465 | 30,839,840 | 4,160,303 | (14,884,623 | ) | 48,593,985 | ||||||||||||||
| Operating income | 21,500,738 | (1,604,161 | ) | 2,054,824 | (116,671 | ) | 21,834,730 | |||||||||||||
| Financial income (expenses), net | 58,161 | (153,974 | ) | 126,068 | 15,397 | 45,652 | ||||||||||||||
| Pension expenses | (192,587 | ) | (218,827 | ) | (67,323 | ) | - | (478,737 | ) | |||||||||||
| Other non-operating income (expenses) | 250,126 | 158,437 | 72,340 | (340 | ) | 480,563 | ||||||||||||||
| Other expenses, net | 115,700 | (214,364 | ) | 131,085 | 15,057 | 47,478 | ||||||||||||||
| Income before income taxes and non-controlling | 21,616,438 | (1,818,525 | ) | 2,185,909 | (101,614 | ) | 21,882,208 | |||||||||||||
| Income tax benefit (expense) | (8,039,278 | ) | 515,831 | (627,682 | ) | 62,290 | (8,088,839 | ) | ||||||||||||
| Non-Controlling interest | (255,051 | ) | 2,148 | (433,963 | ) | - | (686,866 | ) | ||||||||||||
| Net income for the year | $ | 13,322,109 | $ | (1,300,546 | ) | $ | 1,124,264 | $ | (39,324 | ) | $ | 13,106,503 | ||||||||
| F-84 |
Ecopetrol S.A. and Subsidiaries
Notes to the Consolidated Financial Statements
Years ended December 31, 2014, 2013 and 2012
(Expressed in millions of Colombian pesos)
| Year ended December 31, 2012 | ||||||||||||||||||||
| Exploration &
Production | Refining
Activities | Transportation | Eliminations | Total | ||||||||||||||||
| Revenues: | ||||||||||||||||||||
| Local sales | $ | 2,472,532 | $ | 19,807,144 | $ | - | $ | - | $ | 22,279,676 | ||||||||||
| Services | 36,473,861 | 8,016,228 | - | - | 44,490,089 | |||||||||||||||
| Foreign sales, net | 123,913 | 34,947 | 1,923,377 | - | 2,082,237 | |||||||||||||||
| Inter-segment net operating revenues | 13,580,817 | 1,653,782 | 2,128,788 | (17,363,387 | ) | - | ||||||||||||||
| Total Revenue | 52,651,123 | 29,512,101 | 4,052,165 | (17,363,387 | ) | 68,852,002 | ||||||||||||||
| Cost of sales | 21,910,603 | 28,871,613 | 2,179,951 | (17,419,842 | ) | 35,542,325 | ||||||||||||||
| Depreciation, depletion and amortization | 3,669,404 | 551,625 | 772,154 | - | 4,993,183 | |||||||||||||||
| Selling and projects | 2,769,044 | 724,073 | 605,493 | - | 4,098,610 | |||||||||||||||
| Administration expenses | 471,779 | 204,423 | 198,778 | - | 874,980 | |||||||||||||||
| Costs and expenses | 28,820,830 | 30,351,734 | 3,756,376 | (17,419,842 | ) | 45,509,098 | ||||||||||||||
| Operating income | 23,830,293 | (839,633 | ) | 295,789 | 56,455 | 23,342,904 | ||||||||||||||
| Financial income (expenses), net | (153,936 | ) | 76,245 | 63,997 | (154,195 | ) | (167,889 | ) | ||||||||||||
| Pension expenses | (379,565 | ) | (431,320 | ) | (137,570 | ) | - | (948,455 | ) | |||||||||||
| Other non-operating income (expenses) | 140,002 | (22,969 | ) | 16,738 | (28,630 | ) | 105,141 | |||||||||||||
| Other expenses, net | (393,499 | ) | (378,044 | ) | (56,835 | ) | (182,825 | ) | (1,011,203 | ) | ||||||||||
| Income before income taxes and non-controlling | 23,436,794 | (1,217,677 | ) | 238,954 | (126,370 | ) | 22,331,701 | |||||||||||||
| Income tax benefit (expense) | (7,445,657 | ) | 296,938 | 15,325 | (1 | ) | (7,133,395 | ) | ||||||||||||
| Non-Controlling interest | (352,649 | ) | 1,139 | (68,020 | ) | 171 | (419,359 | ) | ||||||||||||
| Net income for the year | $ | 15,638,488 | $ | (919,600 | ) | $ | 186,259 | $ | (126,200 | ) | $ | 14,778,947 | ||||||||
The following tables illustrate sales by geographic zones:
Sales by geographic zones December 31, 2014
| Zone | Products | Value | Participation | |||||||
| Colombia* | Crude oil, Refined, Petrochemicals and natural gas | $ | 26,949,939 | 39.1 | % | |||||
| United States of America | Crude oil, Refined and Petrochemicals | 18,002,467 | 26.1 | % | ||||||
| Asia | Crude oil, Refined and Petrochemicals | 13,395,766 | 19.4 | % | ||||||
| Europe | Crude oil, Refined and Petrochemicals | 6,328,423 | 9.2 | % | ||||||
| Central America and Caribbean | Crude oil, Refined and Petrochemicals | 3,042,278 | 4.4 | % | ||||||
| South America | Crude oil, Refined Petrochemicals and natural gas | 973,615 | 1.4 | % | ||||||
| Other | Petrochemicals | 232,850 | 0.3 | % | ||||||
| $ | 68,925,338 | 100.0 | % | |||||||
*Inludes sales to free trade zone by $128,516
Sales by geographic zones December 31, 2013
| Zone | Products | Value | Participation | |||||||
| Colombia* | Crude oil, Refined, Petrochemicals and natural gas | $ | 26,352,462 | 37.4 | % | |||||
| United States of America | Crude oil, Refined and Petrochemicals | 20,609,349 | 29.2 | % | ||||||
| Asia | Crude oil, Refined and Petrochemicals | 11,326,247 | 16.1 | % | ||||||
| Europe | Crude oil, Refined, and Petrochemicals | 4,895,570 | 7.0 | % | ||||||
| South America | Crude oil, Refined Petrochemicals and natural gas | 1,666,422 | 2.4 | % | ||||||
| Central America and Caribbean | Crude oil, Refined and Petrochemicals | 3,640,865 | 5.2 | % | ||||||
| Other | Petrochemicals | 1,937,800 | 2.7 | % | ||||||
| $ | 70,428,715 | 100.0 | % | |||||||
*Includes sales to free trade zone by $144,562
Sales by geographic zones December 31, 2012
| Zone | Products | Value | Participation | |||||||
| Colombia* | Crude oil, Refined, Petrochemicals and natural gas | $ | 24,447,603 | 35.5 | % | |||||
| United States of America | Crude oil, Refined and Petrochemicals | 24,721,340 | 35.9 | % | ||||||
| Asia | Crude oil, Refined and Petrochemicals | 7,201,295 | 10.5 | % | ||||||
| Africa | Refined and Petrochemicals | 330,775 | 0.5 | % | ||||||
| Europe | Crude oil, Refined, and Petrochemicals | 3,977,682 | 5.8 | % | ||||||
| South America | Crude oil, Refined Petrochemicals and natural gas | 1,791,111 | 2.6 | % | ||||||
| Central America and Caribbean | Crude oil, Refined and Petrochemicals | 6,213,770 | 9.0 | % | ||||||
| Other | Petrochemicals | 168,426 | 0.2 | % | ||||||
| $ | 68,852,002 | 100.0 | % | |||||||
*Includes sales to free trade zone by $85,690
| F-85 |
Ecopetrol S.A. and Subsidiaries
Notes to the Consolidated Financial Statements
Years ended December 31, 2014, 2013 and 2012
(Expressed in millions of Colombian pesos)
The following tables illustrate sales of products by segment:
Sales of products by segment December 31, 2014
| Local Sales | Exploration & Production | Refining Activities | Transportation | Eliminations | Total | |||||||||||||||
| Medium distillates | $ | 1,241 | $ | 11,982,782 | $ | - | $ | - | $ | 11,984,023 | ||||||||||
| Gasolines | - | 6,396,282 | - | - | 6,396,282 | |||||||||||||||
| Crude oil | 442,173 | - | - | - | 442,173 | |||||||||||||||
| Other products | 226,536 | 1,246,189 | - | - | 1,472,725 | |||||||||||||||
| Services | 87,670 | 12,951 | 3,147,359 | - | 3,247,980 | |||||||||||||||
| Natural gas | 1,615,471 | - | - | - | 1,615,471 | |||||||||||||||
| L.P.G. | 178,341 | 248,578 | - | - | 426,919 | |||||||||||||||
| Diesel and gasoline subsidies | 46,336 | 412,736 | - | - | 459,072 | |||||||||||||||
| Plastic and rubber | - | 670,368 | - | - | 670,368 | |||||||||||||||
| Total local sales | $ | 2,597,768 | $ | 20,969,886 | $ | 3,147,359 | $ | - | $ | 26,715,013 | ||||||||||
| Foreign Sales | Exploration & Production | Refining Activities | Transportation | Eliminations | Total | |||||||||||||||
| Crude oil | $ | 36,311,351 | $ | - | $ | - | $ | - | $ | 36,311,351 | ||||||||||
| Fuel oil | - | 3,921,703 | - | - | 3,921,703 | |||||||||||||||
| Gasolines | - | 127,091 | - | - | 127,091 | |||||||||||||||
| Diesel | - | 179,738 | - | - | 179,738 | |||||||||||||||
| L.P.G | 13,444 | 30,477 | - | - | 43,921 | |||||||||||||||
| Natural gas | 423,462 | - | - | - | 423,462 | |||||||||||||||
| Plastic and rubber | - | 975,862 | - | - | 975,862 | |||||||||||||||
| Other products and services | 30,450 | 196,747 | - | - | 227,197 | |||||||||||||||
| Total foreign sales | $ | 36,778,707 | $ | 5,431,618 | $ | - | $ | - | $ | 42,210,325 | ||||||||||
Sales of products by segment December 31, 2013
| Local Sales | Exploration & Production | Refining Activities | Transportation | Eliminations | Total | |||||||||||||||
| Medium distillates | $ | 4,428 | $ | 11,578,473 | $ | - | $ | - | $ | 11,582,901 | ||||||||||
| Gasolines | 613 | 5,967,471 | - | - | 5,968,084 | |||||||||||||||
| Crude oil | 1,145,278 | - | - | - | 1,145,278 | |||||||||||||||
| Other products | 327,234 | 1,123,788 | - | - | 1,451,022 | |||||||||||||||
| Services | 12,394 | 4,935 | 2,512,135 | - | 2,529,464 | |||||||||||||||
| Natural gas | 1,527,691 | - | - | - | 1,527,691 | |||||||||||||||
| L.P.G. | 136,042 | 239,316 | - | - | 375,358 | |||||||||||||||
| Diesel and gasoline subsidies | - | 938,679 | - | - | 938,679 | |||||||||||||||
| Plastic and rubber | - | 615,424 | - | - | 615,424 | |||||||||||||||
| Total local sales | $ | 3,153,680 | $ | 20,468,086 | $ | 2,512,135 | $ | - | $ | 26,133,901 | ||||||||||
| Foreign Sales | Exploration &
Production | Refining Activities | Transportation | Eliminations | Total | |||||||||||||||
| Crude oil | $ | 35,820,182 | $ | - | $ | - | $ | - | $ | 35,820,182 | ||||||||||
| Fuel oil | - | 5,374,617 | - | - | 5,374,617 | |||||||||||||||
| Gasolines | - | 52,664 | - | - | 52,664 | |||||||||||||||
| Diesel | - | 23,231 | - | - | 23,231 | |||||||||||||||
| L.P.G | 8,702 | 19,988 | - | - | 28,690 | |||||||||||||||
| Natural gas | 586,687 | - | - | - | 586,687 | |||||||||||||||
| Plastic and rubber | - | 2,029,870 | - | - | 2,029,870 | |||||||||||||||
| Other products and services | 25,154 | 353,719 | - | - | 378,873 | |||||||||||||||
| Total foreign sales | $ | 36,440,725 | $ | 7,854,089 | $ | - | $ | - | $ | 44,294,814 | ||||||||||
| F-86 |
Ecopetrol S.A. and Subsidiaries
Notes to the Consolidated Financial Statements
Years ended December 31, 2014, 2013 and 2012
(Expressed in millions of Colombian pesos)
Sales of products by segment December 31, 2012
| Local Sales | Exploration & Production | Refining Activities | Transportation | Eliminations | Total | |||||||||||||||
| Medium distillates | $ | 1,839 | $ | 11,131,140 | $ | - | $ | - | $ | 11,132,979 | ||||||||||
| Gasolines | - | 5,697,178 | - | - | 5,697,178 | |||||||||||||||
| Crude oil | 823,191 | - | - | - | 823,191 | |||||||||||||||
| Other products | 116,265 | 1,112,132 | - | - | 1,228,397 | |||||||||||||||
| Services | 123,913 | 34,947 | 1,923,377 | - | 2,082,237 | |||||||||||||||
| Natural gas | 1,382,396 | - | - | - | 1,382,396 | |||||||||||||||
| L.P.G. | 148,750 | 343,690 | - | - | 492,440 | |||||||||||||||
| Diesel and gasoline subsidies | - | 809,773 | - | - | 809,773 | |||||||||||||||
| Plastic and rubber | 91 | 713,231 | - | - | 713,322 | |||||||||||||||
| Total local sales | $ | 2,596,445 | $ | 19,842,091 | $ | 1,923,377 | $ | - | $ | 24,361,913 | ||||||||||
| Foreign Sales | Exploration &
Production | Refining Activities | Transportation | Eliminations | Total | |||||||||||||||
| Crude oil | $ | 35,886,859 | $ | - | $ | - | $ | - | $ | 35,886,859 | ||||||||||
| Fuel oil | - | 4,283,814 | - | - | 4,283,814 | |||||||||||||||
| Gasolines | - | 1,182,367 | - | - | 1,182,367 | |||||||||||||||
| Diesel | - | 1,216,213 | - | - | 1,216,213 | |||||||||||||||
| L.P.G | 2,968 | 48,540 | - | - | 51,508 | |||||||||||||||
| Natural gas | 563,412 | - | - | - | 563,412 | |||||||||||||||
| Plastic and rubber | - | 754,648 | - | - | 754,648 | |||||||||||||||
| Other products and services | 20,622 | 530,646 | - | - | 551,268 | |||||||||||||||
| Total foreign sales | $ | 36,473,861 | $ | 8,016,228 | $ | - | $ | - | $ | 44,490,089 | ||||||||||
NOTE: Certain amounts of the consolidated financial statements of December 2013 and December 2012 were reclassified for presentation purposes consistent with those of December 31, 2014.
| xxvi. | RELATED PARTIES |
The Company is majority owned by Colombian Government, so other state-owned companies and governmental entities are considered to be related parties. In addition to those transactions disclosed in 3.10 Related Party Transactions, numerous transactions with these entities exist. The most significant of them are disclosed below.
Fuel subsidy: Selling prices of regular motor gasoline and diesel are regulated by government. However a subsidy is granted to producers to compensate the difference between selling price and U.S. Gulf reference market price. The amount received by the Company in 2014, 2013 and 2012 was $485,409, $938,679, and $809,773, respectively.
Purchases of hydrocarbons from ANH: The Company purchases the physical product that the ANH receives from all producers in Colombia at prices set forth by Law 756 of 2002 and Resolution 18-1709 of 2003, which references international prices. For more information on this transaction, please see Note 24.
The Company also paid in kind royalties over certain fields as set forth in Law 141 of 1994, the Administrative Agreement of Collaborative Collection of Liquid Hydrocarbon Royalties signed on September 16, 2010, with the ANH, and Decree 4923 of 2011. The quantities of oil and gas paid as in-kind royalties to the ANH for the years ended December 31, 2014, 2013 and 2012 were 45,421,258, 51,973,436 boe and 54,095,846 boe, respectively.
The following tables present consolidated accounts receivable, accounts payable as well as revenues and expenses with related parties of the Company as of December 31, 2014 and 2013:
| F-87 |
Ecopetrol S.A. and Subsidiaries
Notes to the Consolidated Financial Statements
Years ended December 31, 2014, 2013 and 2012
(Expressed in millions of Colombian pesos)
| 2014 | 2013 | |||||||||||||||
| Assets | Liabilities | Assets | Liabilities | |||||||||||||
| Direccion de Impuestos y Aduanas Nacionales | $ | 5,308,166 | $ | 782,497 | $ | 4,893,051 | $ | 866,996 | ||||||||
| E.S.P. Empresa de Energía de Bogotá S.A. | 1,072,880 | - | 968,735 | - | ||||||||||||
| Interconexión Eléctrica S.A. | 508,611 | - | 536,222 | - | ||||||||||||
| Ministerio de Minas y Energía | 206,767 | 71 | 50,401 | 278 | ||||||||||||
| Ministerio de Hacienda y Crédito Público | 119,727 | 620 | 586,870 | 1,457,389 | ||||||||||||
| Entidades Territoriales | 97,781 | 120,914 | 63,217 | 39,307 | ||||||||||||
| E.S.P. Generadora y Comercializadora de Energía del Caribe S.A. | 20,345 | 26,214 | 11,184 | 2,231 | ||||||||||||
| Isagen S.A. | 14,226 | 12,569 | 12,689 | 5 | ||||||||||||
| Empresas Públicas de Medellín | 8,796 | 28,151 | 9,168 | 101 | ||||||||||||
| Banco Agrario de Colombia | 5,316 | 80,397 | 5,482 | 276,128 | ||||||||||||
| U.A.E. Agencia Nacional de Hidrocarburos | 1,157 | 18,064 | 61 | 2,345 | ||||||||||||
| Instituto Colombiano de Bienestar Familiar | 925 | 1,924 | - | 2,315 | ||||||||||||
| Contraloría General de la Republica | - | - | - | 87,923 | ||||||||||||
| Ministerio de Defensa Nacional | - | 66,234 | - | - | ||||||||||||
| Fondo Rotario de la Policía Nacional | - | 6,776 | - | 138 | ||||||||||||
| Corporación Autónoma Regional de la Frontera Nororiental | - | 6,363 | - | 1 | ||||||||||||
| Others | 10,164 | 26,304 | 10,178 | 12,197 | ||||||||||||
| $ | 7,374,861 | $ | 1,177,098 | $ | 7,147,258 | $ | 2,747,354 | |||||||||
Other transactions with related parties during 2014, 2013 and 2012 are:
| 2014 | 2013 | 2012 | ||||||||||||||||||||||
| Income | Expenses | Income | Expenses | Income | Expenses | |||||||||||||||||||
| Direccion de Impuestos y Aduanas Nacionales | $ | 31 | $ | 229,475 | $ | 19 | $ | 17,828 | $ | - | $ | 16,563 | ||||||||||||
| U.A.E. Agencia Nacional de Hidrocarburos | 23 | 214,346 | 1,950 | 317,060 | 1,158 | 213,974 | ||||||||||||||||||
| Contraloría General de la Republica | - | 112,538 | - | 88,786 | - | 64,519 | ||||||||||||||||||
| Fuerzas Militares | - | 106,823 | - | 280,665 | 225,019 | |||||||||||||||||||
| Entidades Territoriales | 290 | 66,856 | - | 79,309 | 1 | 59,313 | ||||||||||||||||||
| Instituto Colombiano de Bienestar Familiar | - | 7,439 | - | 6,621 | - | 6,892 | ||||||||||||||||||
| Unidad de Planeación Minero Energética | - | 5,027 | - | 7,282 | - | 1,287 | ||||||||||||||||||
| Corporación Autónoma Regional de la Orinoquia | - | 499 | 4 | 631 | 2 | 2,433 | ||||||||||||||||||
| Fiduciaria la Previsora S. A. | 12 | 350 | 36 | 854 | - | 501 | ||||||||||||||||||
| E.S.P. Transportadora de Gas Internacional S.A. | - | 278 | 736 | 330 | - | 600 | ||||||||||||||||||
| Fondo Nacional Ambiental | - | 203 | 11 | 865 | - | 281 | ||||||||||||||||||
| Ministerio de Hacienda y Crédito publico | 353,312 | 200 | - | 126,836 | 616 | 196,404 | ||||||||||||||||||
| E.S.P. Empresa de Energía del Casanare - Enerca S.A. | - | 189 | 686 | 137 | 78 | 70 | ||||||||||||||||||
| Banco Agrario de Colombia | 20,730 | 99 | - | 11,641 | - | 20,696 | ||||||||||||||||||
| E.S.P. Empresa de Acueducto y Alcantarillado de Bogotá | 57 | 10 | 45 | 9 | 44 | 1 | ||||||||||||||||||
| Fondo Rotario de la Policía Nacional | - | - | - | 13,093 | - | 5,610 | ||||||||||||||||||
| Empresas Públicas de Medellín | - | - | 26,511 | 641 | 19,220 | - | ||||||||||||||||||
| Ministerio de Minas y Energía | - | - | 331 | - | - | 173 | ||||||||||||||||||
| E.S.P. Aguas de Barrancabermeja S.A. | - | - | - | 13,000 | - | - | ||||||||||||||||||
| Others | 91 | 15,580 | 237 | 41,096 | 3,237 | 32,019 | ||||||||||||||||||
| $ | 374,546 | $ | 759,912 | $ | 30,566 | $ | 1,006,684 | $ | 24,356 | $ | 846,355 | |||||||||||||
| xxvii. | FAIR VALUE |
Accounting standards for fair value measurement (ASC 820) establish a framework for measuring fair value and stipulate disclosures about fair value measurements. The standards apply to recurring and non-recurring financial and non-financial assets and liabilities that require or permit fair-value measurements. Among the required disclosures is the fair-value hierarchy of inputs the Company uses to value an asset or a liability. The three levels of the fair-value hierarchy are described as follows:
Level 1: Quoted prices (unadjusted) in active markets for identical assets and liabilities. For the Company, Level 1 inputs include marketable securities that are actively traded.
Level 2: Inputs other than Level 1 that is observable, either directly or indirectly. For the Company, Level 2 inputs include quoted prices for similar assets, prices obtained through third-party broker quotes, and prices that can be corroborated with other observable inputs for substantially the complete term of a contract.
Level 3: Unobservable inputs - The Company does not use Level 3 inputs for any of its recurring fair-value measurements. Level 3 inputs may be required for the determination of fair value associated with certain non-recurring measurements of non-financial assets and liabilities. The Company uses Level 3 inputs to determine the fair value of certain non-recurring non-financial assets.
The fair value hierarchy for recurring assets measured at fair value at December 31, 2014, and December 31, 2013, is as follows:
| F-88 |
Ecopetrol S.A. and Subsidiaries
Notes to the Consolidated Financial Statements
Years ended December 31, 2014, 2013 and 2012
(Expressed in millions of Colombian pesos)
| Fair Value at Reporting Date Using | Fair Value at Reporting Date Using | |||||||||||||||||||||||||||||||
Quoted
Price Markets for Identical Assets | Significant Other Observable Inputs | Significant Unobservable Inputs (i) | Quoted Price in Active Markets for Identical Assets | Significant Other Observable Inputs | Significant Unobservable Inputs | |||||||||||||||||||||||||||
| Description | 2014 | (Level 1) | (Level 2) | (Level 3) | 2013 | (Level 1) | (Level 2) | (Level 3) | ||||||||||||||||||||||||
| ASSETS | ||||||||||||||||||||||||||||||||
| Available for sale debt securities | ||||||||||||||||||||||||||||||||
| Securities issued by mixed – economy governmental entities | $ | 1,581,393 | $ | 1,581,393 | $ | - | $ | - | $ | 1,504,957 | $ | 1,504,957 | $ | - | $ | - | ||||||||||||||||
| Securities issued or secured by Colombian government | 183,363 | 183,363 | - | - | 210,493 | 210,493 | - | - | ||||||||||||||||||||||||
| Securities issued or secured by government sponsored enterprise (GSEs) | 124,620 | - | 124,620 | - | 42,129 | 42,129 | - | - | ||||||||||||||||||||||||
| Securities issued or secured by financial entities | 2,324 | - | 2,324 | - | 10,167 | 10,167 | - | - | ||||||||||||||||||||||||
| Securities issued or secured by financial entities | 453,905 | - | 176,279 | 277,626 | 641,658 | - | 641,658 | - | ||||||||||||||||||||||||
| Other debt securities | 33,408 | - | 33,408 | - | 9,286 | 9,286 | - | - | ||||||||||||||||||||||||
| Securities issued or secured by USA government | 123,022 | - | 123,022 | - | 73,794 | 73,794 | - | - | ||||||||||||||||||||||||
| Total available for sale debt securities | $ | 2,502,035 | $ | 1,754,756 | $ | 459,653 | $ | 277,626 | $ | 2,492,484 | $ | 1,850,826 | $ | 641,658 | $ | - | ||||||||||||||||
| Short-term Investments – held to maturity securities: | ||||||||||||||||||||||||||||||||
| Securities issued or secured by Colombian government | - | - | - | - | 98,039 | - | - | - | ||||||||||||||||||||||||
| Other debt securities | 4,713 | - | - | - | 1,692 | - | - | - | ||||||||||||||||||||||||
| Total Short-term Investments classified as held to maturity | $ | 4,713 | $ | - | $ | - | $ | - | $ | 99,731 | $ | - | $ | - | $ | - | ||||||||||||||||
| Derivatives | ||||||||||||||||||||||||||||||||
| Option | (3,992 | ) | - | (3,992 | ) | - | (45 | ) | - | (45 | ) | - | ||||||||||||||||||||
| Swap | - | - | - | - | - | - | - | - | ||||||||||||||||||||||||
| FX Forward | (130,272 | ) | - | (130,272 | ) | - | - | - | - | - | ||||||||||||||||||||||
| Total derivatives | (134,264 | ) | - | (134,264 | ) | - | (45 | ) | - | (45 | ) | - | ||||||||||||||||||||
| Total Recurring Assets at fair value | $ | 2,372,484 | $ | 1,754,756 | $ | 325,389 | $ | 277,626 | $ | 2,592,170 | $ | 1,850,826 | $ | 641,613 | $ | - | ||||||||||||||||
| (i) | During 2014, $277,626 of securities issued or secured by financial entities were classified in Level 3, due to lack of a liquid market. As a result, the Company applied an internal methodology considering market experience, information and methodology referred to by pricing services. |
The fair value plan assets
Medical, Education and Severance plans are unfunded. Pension and pension bonds plans are covered by assets in five trust funds with the following investment allocation:
| Investment | 2014 | Level | 2013 | Level | ||||||||
| Colombian government treasury bonds in COP | $ | 4,298,278 | 1 | $ | 3,099,060 | 1 | ||||||
| Other securities, liquidity, non-governmental entity bonds in COP | - | 978,427 | 1 | |||||||||
| Colombian government treasury bonds in COP | - | 472,085 | 2 | |||||||||
| Other securities, liquidity, non-governmental entity bonds in COP | 5,685,614 | 2 | 6,143,307 | 2 | ||||||||
| Colombian government treasury bonds in USD | 230,772 | 1 | 175,791 | 1 | ||||||||
| Other securities, liquidity, non-governmental entity bonds in USD | - | 562,401 | 1 | |||||||||
| Other securities, liquidity, non-governmental entity bonds in USD | 480,712 | 2 | 19,271 | 2 | ||||||||
| Other bonds | 1,036,475 | 2 | - | |||||||||
| Total | $ | 11,731,851 | $ | 11,450,342 | ||||||||
The fair value of the plan assets is calculated using the information published by INFOVALMER, a renowned trustworthy financial price provider authorized by the Colombian Financial Regulator (Superintendencia Financiera de Colombia). Accordingly, there are two methodologies to calculate the prices of the securities: Average Price and Estimated price.
The Average Price is calculated mainly from representative market transactions carried through electronic platforms approved and supervised by the named regulator. The Investments that reflect this condition are located under level 1, bearing in mind that they include marketable securities that are actively traded. Likewise, the Estimated Price is calculated for investments that do not reflect enough information to estimate an average market price, replicating quoted prices for similar assets or prices obtained through third-party broker quotes. This estimated price is also given by INFOVALMER as a result of the application of robust methodologies approved by the Financial Regulator and broadly used by the financial industry. The investments reflecting this condition are located under level 2.
| F-89 |
Ecopetrol S.A. and Subsidiaries
Notes to the Consolidated Financial Statements
Years ended December 31, 2014, 2013 and 2012
(Expressed in millions of Colombian pesos)
The fair value restricted assets
Under U.S. GAAP the Company classifies as restricted assets, those assets where their availability depends on a court decision, contractual or legal restriction, such as cash, trust funds or investments. The detail of restricted assets mainly is as follows:
| Concept | 2014 | Level | 2013 | Level | ||||||||||||
| Investment securities | $ | 114,966 | 1 | $ | 336,714 | 1 | ||||||||||
| Investment securities | 310,692 | 2 | 34,673 | 2 | ||||||||||||
| Investment securities | 122,755 | 3 | - | - | ||||||||||||
| Specific destination funds | 226,094 | 2 | 299,702 | 2 | ||||||||||||
| Total™ | $ | 774,507 | $ | 671,089 | ||||||||||||
The most significant restricted assets are related to Santiago de Las Atalayas Fund which are detailed as follows:
| Concept | 2014 | Level | 2013 | Level | ||||||||||||
| Investments available for sale | $ | 114,966 | 1 | $ | 336,714 | 1 | ||||||||||
| Investments available for sale | 310,692 | 2 | 34,673 | 2 | ||||||||||||
| Investments available for sale | 122,755 | 3 | - | - | ||||||||||||
| Total | $ | 548,413 | $ | 371,387 | ||||||||||||
For fair value analysis purposes, the assets related to Santiago de Las Atalayas and other founds do not include the cash and cash equivalents.
Other restricted assets like specific destination, Equión $6,299, ODL Finance $9,402, Oleoducto Bicentenario $85,890, Ocensa $982 and Cenit Transporte y Logística $33,617 Classify all in level 2.
Marketable Securities: The Company calculates fair value for its marketable securities based on quoted market prices.
Derivatives: The Company’s derivative instruments principally include foreign exchange and refined-product (asphalt) swaps, options and forward contracts, principally with financial institutions and other oil and gas companies, the fair values for which are obtained from third-party broker quotes, industry pricing services and exchanges.
The Company obtains multiple sources of pricing information for the Level 2 instruments. Since this pricing information is generated from observable market data, it has historically been very consistent. The Company does not materially adjust this information.
The fair value hierarchy for non-recurring assets measured at fair value at December 31, 2014 is as follows:
| Fair Value Measurements Using | ||||||||||||||||||||||||
| Description | 2014 | Quoted Price in Active Markets for Identical Assets Level 1 | Significant Other Observable Inputs Level 2 | Significant Unobservable Inputs Level 3 | Total Gains (Losses) | 2013 | ||||||||||||||||||
| Goodwill | $ | - | $ | - | $ | - | $ | - | $ | - | $ | 930,023 | ||||||||||||
| Production fixed assets with impairment | 17,960 | - | - | 17,960 | (402,247 | ) | 94,193 | |||||||||||||||||
| Total Non-Recurring Assets | $ | 17,960 | $ | - | $ | - | $ | 17,960 | $ | (402,247 | ) | $ | 1,024,216 | |||||||||||
Impairment of “Goodwill”- During 2012, Ecopetrol performed an impairment test of goodwill which showed that goodwill was cero. In 2013, Ecopetrol performed an impairment test on the recognized goodwill, resulting in a Propilco impairment of $280,493. During 2013, lower supply from Ecopetrol increased the variable costs, as the company switched their raw material suppliers. Furthermore, the company performance was challenged by shifts in the petrochemical markets, as a result of new shale gas discoveries in the U.S. and low costs products coming from Asia. During 2014 the impairment was cero.
Impairment of “Properties, plant and equipment”- During 2014 and in accordance with the accounting standard for the impairment or disposal of long-lived assets (ASC 360), long-lived assets “held and used” with a carrying amount of $420,207 were written down to a fair value of $17,960, resulting in a before-tax loss of $402,247. The fair values were determined from internal cash-flow models, using discount rates consistent with those used by the Company to evaluate cash flows of other assets of a similar nature. The respective long-lived assets were reviewed for impairment on a field-by-field basis.
Assets and Liabilities Not Required to Be Measured at Fair Value
The Company holds cash and cash equivalents. The instruments held are primarily time deposits and money market funds. The fair values reflect the cash that would have been received or paid if the instruments were settled at year-end. Cash equivalents had carrying/fair values of $7,982,225 and $8,750,039 at December 31, 2014 and 2013, respectively. Fair values of other financial instruments at the end of 2014 and 2013 were not material.
| F-90 |
Ecopetrol S.A. and Subsidiaries
Notes to the Consolidated Financial Statements
Years ended December 31, 2014, 2013 and 2012
(Expressed in millions of Colombian pesos)
The Company’s financial instruments that are exposed to concentrations of credit risk consist primarily of cash and accounts receivables. The carrying value of cash and accounts receivable reflects management’s assessment of credit risk. As of December 31, 2014 and 2013, cash and cash equivalents includes balances in savings and checking accounts, as well as term deposits and certificates of deposit, placed primarily with governments and financial institutions with strong investment grade ratings.
The carrying amounts of the Company’s accounts receivable, accounts payable and current notes payable approximate fair value because they have relatively short-term maturities and bear interest at rates tied to market indicators, as appropriate. The Company’s long-term debt consists of debt instruments that bear interest at fixed or variable rates tied to market indicators.
The carrying amount and estimated fair values of the Company’s financial instruments that are not recognized in the balance sheets at fair value as of December 31 are as follows:
| 2014 | 2013 | |||||||||||||||||||
| Description | Carrying Amount | Estimated Fair Value | Fair value hierarchy | Carrying Amount | Estimated Fair Value | Fair value hierarchy | ||||||||||||||
| Long-term notes payable | $ | 13,955,114 | $ | 13,357,850 | Level 2 | $ | 11,284,800 | $ | 10,757,433 | Level 2 | ||||||||||
| Long-term debt | $ | 19,325,712 | $ | 20,206,915 | Level 1 | $ | 9,907,320 | $ | 10,998,186 | Level 1 | ||||||||||
| Total | $ | 33,280,826 | $ | 33,564,765 | $ | 21,192,120 | $ | 21,755,619 | ||||||||||||
National Bank Loan: The assessment was made discounting the projected flow of credit, according to their contractual terms, at a rate estimated using the average of two quotations received by two banks participating in the credit spreads reflect on current DTF for credit of these characteristics. DTF for the forward curve at 12/31/2014 calculated by the prices provider Infovalmer was used.
International Banking Loan: The assessment was performed by projecting the flow of credit in accordance with their contractual terms. To calculate the Libor 6M, the SWAP Bloomberg calculator was used, considering the average life of the loans. To discount the CIRR rate (minimum rate would charge the Exim Bank in a direct credit) for loans with similar terms are used.
The note ii. investments in non-marketable securities describes the impairment test of the equity method investment.
| xxviii. | SUPPLEMENTAL INFORMATION ON OIL AND GAS PRODUCING ACTIVITIES (UNAUDITED) |
In accordance with the requirements of the United States Securities and Exchange Commission (SEC), Accounting Standards Codification 932 and the ASU- 2010-03 “Oil and Gas reserve Estimation and Disclosures” rule, this section provides supplemental information on oil and gas exploration and producing activities of the Company. The information included in items (i) through (iii) provides historical cost information pertaining to costs incurred in exploration, property acquisitions and development, capitalized costs and results of operations. The information included in items (iv) and (v) presents information on Ecopetrol’s estimated net proved reserve quantities, standardized measure of estimated discounted future net cash flows related to proved reserves, and changes in estimated discounted future net cash flows.
The following information corresponds to Ecopetrol’s oil and gas producing activities at December 31 2014, 2013 and 2012 in direct and joint operations.
Under the SEC final rule, optional disclosure of possible and probable reserves is allowed. But, the Company opted not to do so. Ecopetrol estimated its reserves without considering non-traditional resources.
Table i – Capitalized costs relating to oil and gas producing activities
| Year ended December 31 | ||||||||||||
| 2014 | 2013 | 2012 | ||||||||||
| Natural and environmental properties | $ | 38,659,400 | $ | 30,639,705 | $ | 25,836,787 | ||||||
| Wells, equipment and facilities – property, plant and equipment | 14,034,676 | 11,714,769 | 10,045,169 | |||||||||
| Construction in progress | 9,625,512 | 8,064,129 | 5,841,384 | |||||||||
| Accumulated depreciation, depletion and amortization | (28,186,559 | ) | (22,647,249 | ) | (18,802,677 | ) | ||||||
| Net capitalized costs | $ | 34,133,029 | $ | 27,771,354 | $ | 22,920,663 | ||||||
It includes information of the exploration and production segment subsidiaries.
In accordance with ASC 410-20, these natural and environmental costs include the asset retirement obligations amounting $52,487, $12,598, and $80,244, during 2014, 2013 and 2012, respectively.
| F-91 |
Ecopetrol S.A. and Subsidiaries
Notes to the Consolidated Financial Statements
Years ended December 31, 2014, 2013 and 2012
(Expressed in millions of Colombian pesos)
For 2012, we disclosed an amount increased in $19,014 due to a difference between our ARO tool and the accounting system. According to ASC 250, we consider this difference is not material.
Table ii – Costs incurred in oil and gas exploration and development activities
Costs incurred are summarized below and include both amounts expensed and capitalized in the corresponding period.
| Year ended December 31 | ||||||||||||
| 2014 | 2013 | 2012 | ||||||||||
| Acquisition of proved properties (1) | $ | 16,747 | $ | 336,954 | - | |||||||
| Acquisition of unproved properties (2) | - | - | 67,016 | |||||||||
| Exploration costs | 2,801,928 | 2,486,283 | 1,676,821 | |||||||||
| Development costs | 8,068,975 | 9,724,280 | 9,204,629 | |||||||||
| Total costs incurred | $ | 10,887,650 | $ | 12,547,517 | $ | 10,948,466 | ||||||
| (1) | Represents the scheduled buy-in costs paid to Murphy Oil (Operator) to participate in the Dalmatian and Gunflint projects in 2014 and 2013. |
| (2) | Represents the scheduled buy-in costs paid to Murphy Oil (Operator) to participate in the Dalmatian project in 2012 and wells, equipment and facilities associated with Caño Sur in 2011. |
Table iii – Results of operations for oil and gas producing activities
| 2014 | 2013 | 2012 | ||||||||||
| Net revenues | ||||||||||||
| Sales | $ | 40,509,025 | $ | 44,727,535 | $ | 29,515,227 | ||||||
| Transfers | 4,595,252 | 5,601,988 | 12,980,714 | |||||||||
| Total | $ | 45,104,277 | $ | 50,329,523 | $ | 42,495,941 | ||||||
| Production cost (1) | 8,395,246 | 6,752,329 | 5,361,603 | |||||||||
| Depreciation, depletion and amortization (2) | 4,737,037 | 3,439,227 | 3,365,845 | |||||||||
| Other production costs (3) | 14,687,318 | 15,387,409 | 6,502,268 | |||||||||
| Exploration expenses (4) | 2,484,642 | 1,473,261 | 1,392,834 | |||||||||
| Other expenses (5) | 2,942,740 | 2,257,494 | 1,369,032 | |||||||||
| Total | $ | 33,246,983 | $ | 29,309,720 | $ | 17,991,582 | ||||||
| Income before income tax | 11,857,294 | 21,019,803 | 24,504,359 | |||||||||
| Income tax expenses | (5,454,355 | ) | (7,777,327 | ) | (8,064,384 | ) | ||||||
| Results of operations for producing activities | $ | 6,402,939 | $ | 13,242,476 | $ | 16,439,975 | ||||||
Note: Effects of naphtha addition are included into results of operations in the table above. During 2014, 2013 and 2012 the additional total barrels (million boe) were 27.5, 25.1 and 19.4 respectively.
| (1) | Production costs are lifting costs incurred to operate and maintain productive wells and related equipment and facilities, including costs such as operating labor, materials, supplies, and fuel consumed in operations and the costs of operating natural gas liquids plants. In addition, it includes accretion expense related to the asset retirement obligations that were recognized during 2014, 2013, and 2012, amounting approximately $193,092, $159,988 and $ 150,754, respectively. The Company’s results of operations from oil and gas producing activities for the years ending December 31, 2014, 2013 and 2012 are shown above. |
| (2) | In accordance with ASC 410-20, the expense related to asset retirement obligations that were recognized during 2014, 2013 and 2012 in depreciation, depletion and amortization, amounted approximately to $183,324, $92,406 and $131,342, respectively. |
| (3) | Corresponds to transportation costs and naphtha that are not part of the Company´s lifting cost. |
| (4) | Exploration expenses include the costs of geological and geophysical activities as well as the non-productive exploratory wells. |
| (5) | Corresponds to administration and marketing expenses. |
During 2014, 2013 and 2012, respectively, the Company transferred approximately 10%, 11% and 31% of its crude oil and gas production; (percentages based on the value sales in Colombian pesos) to intercompany business units. Base on volume, those transfers were 39%, 36%, and 39%, respectively (including Reficar). The intercompany transfers were recorded at values equal to the Company’s market prices.
| F-92 |
Ecopetrol S.A. and Subsidiaries
Notes to the Consolidated Financial Statements
Years ended December 31, 2014, 2013 and 2012
(Expressed in millions of Colombian pesos)
Table iv – Reserve information
The reserve information presented in this section is based on the definitions and rules used for U.S. GAAP purposes. The estimates for proved oil and gas reserves used in the preparation of the consolidated financial statements were prepared by Ecopetrol’s engineers, audited in a 99% by the “external engineers”.
Reserves are first estimated internally. This process is supervised and coordinated by the corporate manager of reservoirs, a geologist who holds a master’s degree in geology and has more than 20 years of experience in projects associated with reservoir characterization and development, estimation, and reporting of reserves. The employees involved in the reserves process meet the Society of Petroleum Engineers, or SPE, qualifications for reserves estimators. Internally estimated reserves are submitted to an external audit process, which was conducted by the external engineers Ryder Scott Company and DeGolyer and MacNaughton as of December 31, 2014. These firms have audited 99% of our total net proved reserves. The external engineers DeGolyer and MacNaughton, Ryder Scott Company, and Gaffney & Cline audited 99% of our estimated net proved reserves for each of the years ended December 31, 2013, and 2012. According to our corporate policy, we report the reserves values obtained from the External Engineers.
The reserves estimation process ends when the Corporate Reserves Director consolidates the results and presents them to the Reserves Committee, whose members are the Chief Financial Officer, Vice-President of Development and Production, and the Corporate Vice President of Strategy and Growth. Results are presented to the Audit Committee of the Board of Directors and finally approved by the Board of Directors.
Information concerning the technical definitions used for the estimated proved reserves is included in this annual report. The information provided in this annual report about our 2014 net proved reserves is based on the 2014 audited reserve reports for 99% of our total reserves prepared by experts under the SEC definitions and rules. The remaining 1% corresponds to calculations made by us internally using SEC definitions and rules set forth in Rule 4-10(a) of Regulation S-X and the disclosure guidelines contained in the SEC’s “Modernization of Oil and Gas Reporting” final rule dated December 31, 2008 and effective as of January 1, 2010.
Our crude oil and natural gas net proved reserves include reserves from our subsidiaries located in the United States (Gulf of Mexico) and Perú, and Equión and Hocol’s assets in Colombia.
The Company’s proved reserves as of December 31, 2014, 2013 and 2012 are based on the SEC average price methodology for U.S. GAAP purposes, which mirrors the average price methodology used by the Company in Colombia during this period.
Future development, abandonment and production costs were computed by estimating the expenditures to be incurred in developing, producing, and abandoning proved oil and gas reserves at the end of the year, based on year-end costs. Future income taxes were computed by applying statutory tax rates to the estimated net pre-tax cash flows after consideration of tax basis and tax credits and carry forwards. Discounted future net cash flows are calculated using 10% mid period discount factors. This discounting requires a year-by-year estimate of when the future expenditures will be incurred and when the reserves will be produced.
The arbitrary valuation methodology prescribed under ASU 2010-03 and ASU-2010-14 requires assumptions as to the timing and amount of future development and production costs. The calculations are made as of December 31 each year and should not be relied upon as an indication of the Company’s future cash flows or the value of its oil and gas reserves.
Ecopetrol used deterministic methods that are commonly used internationally to estimate reserves. These methods have some uncertainty in degradation, and thus, the estimates should not be interpreted as being exact amounts. However, the technology used to estimate reserves is considered reliable.
Estimates of reserves were prepared by geological and engineering methods commonly used in the oil industry. The method or combination of methods used in the analysis of each reserve was adopted from experience with similar reserves, stage of development, quality and completeness of basic data and production history.
The majority of the producing proved reserves were estimated by applying appropriate decline curves or other performance relationships. In analyzing decline curves, reserves were estimated by calculating economic limits that are based on current economic conditions. In certain cases, where the methods previously employed could not be used, reserves were estimated by analogy with similar reserves where more complete data was available.
Most of the Company’s activities and reserves are located in Colombia. The Colombian Nation is the owner of all mineral interests located in Colombia. The Company and, by extension of joint association contracts, its partners, are given the right to explore, develop, produce and sell those reserves, but do not own them. The reserve quantities and their standardized measure, presented in the following tables, represent those reserves and their estimated value that the Company has the right to extract and sell.
| F-93 |
Ecopetrol S.A. and Subsidiaries
Notes to the Consolidated Financial Statements
Years ended December 31, 2014, 2013 and 2012
(Expressed in millions of Colombian pesos)
The information provided does not represent management’s estimate of the Company’s expected future cash flows or value of proved oil and gas reserves. Estimates of proved reserve quantities involve uncertainty and change over time as new information becomes available.
The table below sets forth the Company’s total proved oil and gas reserves together with their changes therein as of and for the years ended December 31, 2014, 2013 and 2012. The estimates (oil in million barrels, gas in billion cf, gas converted to million barrels at 5.7 billion cf per million barrels) using the SEC rules in effect for each respective year.
The following is the reserve quantity information:
| 2014 | 2013 | 2012 | ||||||||||||||||||||||||||||||||||
| Oil | Gas | Total | Oil | Gas | Total | Oil | Gas | Total | ||||||||||||||||||||||||||||
| million barrels | billion cf | million boe | million barrels | billion cf | Million boe | Million barrels | billion cf | million boe | ||||||||||||||||||||||||||||
| Proved Reserves: | ||||||||||||||||||||||||||||||||||||
| Beginning of year | 1,433.6 | 3,068.4 | 1,971.9 | 1,370.3 | 2,886.4 | 1,876.7 | 1,371.0 | 2,768.4 | 1,856.7 | |||||||||||||||||||||||||||
| Revisions of previous estimates | 154.4 | 665.8 | 271.2 | 172.7 | 337.5 | 231.9 | 42.7 | 8.8 | 44.2 | |||||||||||||||||||||||||||
| Improved recovery | 34.0 | 0.4 | 34.1 | 23.2 | 19.9 | 26.7 | 65.3 | - | 65.3 | |||||||||||||||||||||||||||
| Purchases of minerals in place | - | - | - | 7.5 | 11.0 | 9.4 | - | - | - | |||||||||||||||||||||||||||
| Extensions and discoveries | 39.9 | 58.2 | 50.1 | 66.2 | 49.3 | 74.9 | 90.4 | 298.6 | 142.8 | |||||||||||||||||||||||||||
| Sales of minerals in place | - | - | - | (0.6 | ) | (12.3 | ) | (2.8 | ) | - | - | - | ||||||||||||||||||||||||
| Production | (196.8 | ) | (263.8 | ) | (243.0 | ) | (205.7 | ) | (223.5 | ) | (244.9 | ) | (199.2 | ) | (189.3 | ) | (232.4 | ) | ||||||||||||||||||
| End of year | 1,465.1 | 3,529.0 | 2,084.3 | 1,433.6 | 3,068.4 | 1,971.9 | 1,370.3 | 2,886.4 | 1,876.7 | |||||||||||||||||||||||||||
| Proved developed reserves: | ||||||||||||||||||||||||||||||||||||
| Beginning of year | 933.3 | 2,663.3 | 1,400.3 | 933.3 | 2,535.9 | 1,378.2 | 855.8 | 2,229.5 | 1,246.9 | |||||||||||||||||||||||||||
| End of year | 1,042.2 | 3,284.0 | 1,618.3 | 933.0 | 2,663.3 | 1,400.3 | 933.3 | 2,535.9 | 1,378.2 | |||||||||||||||||||||||||||
| Proved undeveloped reserves: | ||||||||||||||||||||||||||||||||||||
| Beginning of year | 500.6 | 405.0 | 571.7 | 437.0 | 350.6 | 498.5 | 515.2 | 538.9 | 609.8 | |||||||||||||||||||||||||||
| End of year | 422.9 | 244.9 | 465.9 | 500.6 | 405.0 | 571.7 | 437.0 | 350.6 | 498.5 | |||||||||||||||||||||||||||
Revisions
In 2014, net revisions increased reserves by 271 million boe. As discussed above, beginning on January 1, 2014, the royalties associated with natural gas and NGL are required to be paid to the ANH in cash, and are therefore considered a financial obligation and are no longer deducted from net reserves. As a result, reported reserves increased by 148 million boe in 2014. New development projects in Caño Sur, Moriche, Quifa, Rubiales, Provincia and Palagua fields resulted in a 91 million boe increase in reserves.
The revisions described above accounted for 88% of the increase in reserves due to revisions in 2014. The remaining 12% were due to varying increases and decreases from other fields.
Improved Recovery
In 2014, improved recovery increased reserves by 34 million boe. The additions were associated with the continued development of waterflood projects through existing wells, though additional drilling may be required to fully optimize the development configuration. The main additions were in La Cira, Infantas and Yarigui Cantagallo fields representing a 25 million boe increase.
Extensions and Discoveries
Extensions and discoveries during 2014 amounted to 50 million boe, which is comprised of 47 million boe of extensions of proved acreage and 4 million boe from newly discovered fields and reservoirs. The newly discovered fields in Colombia corresponded to the Guando South West and Rex fields, and in the southern Gulf of Mexico, the Dalmatian South field. New reservoirs were discovered in the La Cañada Norte and Chipiron fields.
The extensions of proved acreage resulted mainly from activities in new proved areas in the Chichimene, Gibraltar Provincia, and Rubiales fields, which accounted for 33 million boe of the total of 47 million boe from extensions of proved acreage. The remaining 14 million boe corresponds to smaller changes in several other fields.
Purchases & Sales
In 2014, we neither purchased nor sold any participation in producing oil or gas properties.
| F-94 |
Ecopetrol S.A. and Subsidiaries
Notes to the Consolidated Financial Statements
Years ended December 31, 2014, 2013 and 2012
(Expressed in millions of Colombian pesos)
| Table v – | Standardized measure of discounted future net cash flows relating to proved oil and gas quantities and changes therein |
The standardized measure of discounted future net cash flows, related to the above proved crude oil and natural gas reserves, is calculated in accordance with the requirements of ASU 2010-03. Estimated future cash inflows from production under U.S. GAAP are computed by applying unweighted arithmetic average of the first-day-of-the-month for oil and gas price to year-end quantities of estimated net proved reserves.
| 2014 | 2013 | 2012 | ||||||||||
| Future cash inflows | $ | 310,138,127 | $ | 264,155,176 | $ | 251,891,162 | ||||||
| Future production cost | (107,629,865 | ) | (72,941,680 | ) | (68,593,660 | ) | ||||||
| Future development costs | (23,504,455 | ) | (17,793,007 | ) | (12,811,379 | ) | ||||||
| Future income tax expenses | (60,366,272 | ) | (58,115,581 | ) | (55,445,509 | ) | ||||||
| Future net cash flow | 118,637,535 | 115,304,908 | 115,040,614 | |||||||||
| 10% annual discount for estimated timing of cash flows | (43,604,395 | ) | (42,044,683 | ) | (42,457,937 | ) | ||||||
| Standardized measure of discounted future net cash flows | $ | 75,033,140 | $ | 73,260,225 | $ | 72,582,677 | ||||||
The following are the principal sources of change in the standardized measure of discounted net cash flows:
| 2014 | 2013 | 2012 | ||||||||||
| Net change in sales and transfer prices and in production (lifting) cost related to future production | $ | 11,813,532 | $ | 11,751,390 | $ | 8,921,835 | ||||||
| Changes in estimated future development costs | (10,987,031 | ) | (5,387,485 | ) | 2,092,588 | |||||||
| Sales and transfer of oil and gas produced during the period | (36,709,031 | ) | (43,577,194 | ) | (37,134,338 | ) | ||||||
| Net change due to extensions and discoveries | (902,356 | ) | (142,673 | ) | 2,370,545 | |||||||
| Net change due to purchase and (sales) of minerals in place | - | 55,199 | - | |||||||||
| Net change due to revisions in quantity estimates | 18,712,764 | 15,600,101 | 3,017,004 | |||||||||
| Previously estimated development costs incurred during the period | 8,702,964 | 6,176,479 | 5,928,223 | |||||||||
| Accretion of discount | 11,018,459 | 10,756,496 | 10,527,661 | |||||||||
| Timing and other | 1,378,320 | 7,387,316 | 6,564,830 | |||||||||
| Net change in income taxes | (1,254,706 | ) | (1,942,081 | ) | 1,293,602 | |||||||
| Aggregate change in the Standardized measure of discounted future net cash flows for the year | $ | 1,772,915 | $ | 677,548 | $ | 3,581,950 | ||||||
| F-95 |
| 9. | Signature Page |
SIGNATURES
The registrant hereby certifies that it meets all of the requirements for filing on Form 20-F and that it has duly caused and authorized the undersigned to sign this annual report on its behalf.
| Ecopetrol S.A. | |||
| By: | /s/ Magda Manosalva | ||
| Name: | Magda Manosalva | ||
| Title: | Chief Financial Officer | ||
| By: | /s/ Juan Carlos Echeverry | ||
| Name: | Juan Carlos Echeverry | ||
| Title: | Chief Executive Officer | ||
Dated: April 28, 2015
| 160 |
| 10. | Exhibits |
| Exhibit No. | Description | |
| 1.1 | Amended and Restated Bylaws of Ecopetrol, S.A., dated March 21, 2013, as recorded under Public Deed No. 666 of May 7, 2013 (incorporated by reference to Exhibit 3.1 on Form F-3 filed with the U.S. Securities and Exchange Commission on July 26, 2013 (File No. 333-190198)) (English Translation). | |
| 4.1 | Transportation Agreement between Ecopetrol S.A. and Oleoducto Central S.A., dated March 31, 1995 (incorporated by reference to Exhibit 4.1 on Form 20-F filed with the U.S. Securities and Exchange Commission on September 12, 2008 (File No. 001-34175)) (English Translation). | |
| 4.2 | Supplementary Agreement to Transportation Agreement between Ecopetrol S.A. and Oleoducto Central S.A., dated January 13, 2013 (incorporated by reference to Exhibit4.2 on Form 20-F filed with the U.S. Securities and Exchange Commission on April 29, 2013 (File No.001-34175)) (English Translation). | |
| 4.3 | Natural Gas Transportation Agreement between Ecopetrol S.A. and Transportadora de Gas del Interior S.A. ESP, dated October 1, 2008 (incorporated by reference to Exhibit 4.3 on Form 20-F filed with the U.S. Securities and Exchange Commission on April 29, 2013 (File No.001-34175)) (English Translation). | |
| 4.4 | Supplementary Agreement No. 1, dated December 5, 2008, to the Natural Gas Transportation Agreement between Ecopetrol S.A. and Transportadora de Gas del Interior S.A. ESP, dated October 1, 2008 (incorporated by reference to Exhibit 4.4 on Form 20-F filed with the U.S. Securities and Exchange Commission on April 29, 2013 (File No.001-34175)) (English Translation). | |
| 4.5 | Supplementary Agreement No. 2, dated April 11, 2012, to the Natural Gas Transportation Agreement between Ecopetrol S.A. and Transportadora de Gas Internacional S.A. E.S.P., dated October 1, 2008 (incorporated by reference to Exhibit 4.5 on Form 20-F filed with the U.S. Securities and Exchange Commission on April 29, 2013 (File No.001-34175)) (English Translation). | |
| 4.6 | Crude Oil Transportation Services Agreement between Ecopetrol S.A. and Cenit Transporte y Logística de Hidrocarburos S.A.S., dated April 1, 2013 (incorporated by reference to Exhibit 4.6 on Form20-F filed with the U.S. Securities and Exchange Commission on April 29, 2013 (File No.001-34175)) (English Translation). | |
| 4.7 | Refined Products Transportation Services Agreement between Ecopetrol S.A. and Cenit Transporte y Logística de Hidrocarburos S.A.S., dated April 1, 2013 (incorporated by reference to Exhibit 4.7 on Form 20-F filed with the U.S. Securities and Exchange Commission on April 29, 2013 (File No.001-34175)) (English Translation). | |
| 4.8 | Indenture, dated as of July 23, 2009, between the Company and The Bank of New York Mellon, as trustee (incorporated by reference to Exhibit 4.2 to the Company’s Form F-4 filed with the U.S. Securities and Exchange Commission on July 31, 2009 (File No. 333-160965)). | |
| 4.9 | Bicentenario Transport Contract between Oleoducto Bicentenario de Colombia S.A.S. and Ecopetrol S.A., dated June 20, 2012 incorporated by reference to Exhibit 4.9 on Form 20-F filed with the U.S. Securities and Exchange Commission on April 25, 2014 (File No.001-34175)) (English Translation). |
| 161 |
| Exhibit No. | Description | |
| 8.1 | List of subsidiaries of Ecopetrol S.A. | |
| 12.1 | Section 302 Certification of the Chief Executive Officer. | |
| 12.2 | Section 302 Certification of the Chief Financial Officer. | |
| 13.1 | Section 906 Officer Certification. | |
| 15.1 | Consent letter of PricewaterhouseCoopers Ltda. | |
| 15.2 | Consent letter of KMPG Ltda. | |
| 15.3 | Consent letter of Ryder Scott Company, L.P. | |
| 15.4 | Consent letter of DeGolyer and MacNaughton. | |
| 99.1 | Third-Party Reserve Report of Ryder Scott Company, L.P. | |
| 99.2 | Third-Party Reserve Report of DeGolyer and MacNaughton . |
| 11. | Cross-reference to Form 20-F |
| Sections | ||||
| Item 1. | Identity of Directors, Senior Management and Advisers | N/A | ||
| Item 2. | Offer Statistics and Expected Timetable | N/A | ||
| Item 3. | Key Information | |||
| A. Selected Financial Data | 1.3; 4.6.3; 6.2; 6.3; 6.7 | |||
| B. Capitalization and Indebtedness | N/A | |||
| C. Reasons for the Offer and Use of Proceeds | N/A | |||
| D. Risk Factors | 5.1 | |||
| Item 4. | Information on the Company | |||
| A. History and Development of the Company | 3.1; 3.3 - 3.6; Note 1 to the consolidated financial statements | |||
| B. Business Overview | 2; 3.3 - 3.9 | |||
| C. Organizational Structure | 3.2 | |||
| D. Property, Plants and Equipment | 3.5; 4.6.2; Notes 10 and 33 to the consolidated financial statements |
| 162 |
| Sections | ||||
| E. Oil and Gas Disclosures | 3.4-3.6; Note 33 to the consolidated financial statements | |||
| Item 4A. | Unresolved Staff Comments | None | ||
| Item 5. | Operating and Financial Review and Prospects | |||
| A. Operating Results | 4.1-4.5 | |||
| B. Liquidity and Capital Resources | 2; 4.6; 4.7; Notes 1, 3, 14 and 33 to the consolidated financial statements | |||
| C. Research and development, Patents and Licenses, etc. | 3.7; Note 13 to the consolidated financial statements | |||
| D. Trend Information | 4.9 | |||
| E. Off-Balance Sheet Arrangements | 4.8 | |||
| F. Tabular Disclosure of Contractual Obligations | 4.7; Note 30 to the consolidated financial statements. | |||
| G. Safe Harbor | 1.1; 1.2 | |||
| Item 6. | Directors, Senior Management and Employees | |||
| A. Directors and Senior Management | 7.3; 7.5 | |||
| B. Compensation | 7.6; Note 33 to the consolidated financial statements | |||
| C. Board Practices | 7.3 | |||
| D. Employees | 3.12 | |||
| E. Share Ownership | 7.7 | |||
| Item 7. | Major Shareholders and Related Party Transactions | |||
| A. Major Shareholders | 6.8 | |||
| B. Related Party Transactions | 3.10; Note 33 to the consolidated financial statements | |||
| C. Interests of Experts and Counsel | N/A |
| 163 |
| Sections | ||||
| Item 8. | Financial Information | |||
| A. Consolidated Statements and Other Financial Information | 4.6.3; 6.2; 5.3; 8; Note 29 to the consolidated financial statements | |||
| B. Significant Changes | 7.8; Note 31 to the consolidated financial statements | |||
| Item 9. | The Offer and Listing | |||
| A. Offer and Listing Details | 6.3 | |||
| B. Plan of Distribution | N/A | |||
| C. Markets | 6.3 | |||
| D. Selling Shareholders | N/A | |||
| E. Dilution | N/A | |||
| F. Expenses of the Issue | N/A | |||
| Item 10. | Additional Information | |||
| A. Share Capital | N/A | |||
| B. Memorandum and Articles of Association | 7.1 | |||
| C. Material Contracts | 3.4.4; 4.7; Note 30 to the consolidated financial statements; Exhibits 4.1 - 4.9 | |||
| D. Exchange Controls | 6.6 | |||
| E. Taxation | 4.2.1; 6.5; Notes 16 and 33 to the consolidated financial statements | |||
| F. Dividends and Paying Agents | N/A | |||
| G. Statements by Experts | N/A | |||
| H. Documents On Display | 1.1 | |||
| I. Subsidiary Information | N/A | |||
| Item 11. | Quantitative and Qualitative Disclosures About Market Risk | 4.9; 5.2.1; 5.2.3; Note 33 to the consolidated financial statements | ||
| Item 12. | Description of Securities Other than Equity Securities |
| 164 |
| Sections | ||||
| A. Debt Securities | N/A | |||
| B. Warrants and Rights | N/A | |||
| C. Other Securities | N/A | |||
| D. American Depositary Shares | 6.4; 6.8 | |||
| Item 13. | Defaults, Dividend Arrearages and Delinquencies | None | ||
| Item 14. | Material Modifications to the Rights of Security Holders and Use of Proceeds | None | ||
| Item 15. | Controls and Procedures | 7.8; 5.2 | ||
| Item 16A. | Audit Committee Financial Expert | 7.3.2 | ||
| Item 16B. | Code of Ethics | 7.2; 7.4 | ||
| Item 16C. | Principal Accountant Fees and Services | 7.8 | ||
| Item 16D. | Exemptions from the Listing Standards for Audit Committees | N/A | ||
| Item 16E | Purchases of Equity Securities by the Issuer and Affiliated Purchases | N/A | ||
| Item 16F. | Changes in Registrant’s Certifying Accountant | N/A | ||
| Item 16G. | Corporate Governance | 6.1; 7.1; 7.2; 7.3.1; 7.3.2; 7.4 | ||
| Item 16H | Mine Safety Disclosure | N/A | ||
| Item 17 | Financial Statements | N/A | ||
| Item 18. | Financial Statements | 9 | ||
| Item 19. | Exhibits | 10 |
| 165 |