UNITED
STATES
SECURITIES
AND EXCHANGE COMMISSION
Washington, D.C. 20549
_________________
FORM 8-K
_________________
CURRENT
REPORT
Pursuant to Section 13 or 15(d) of the
Securities
Exchange Act of 1934
Date of Report (Date of earliest
event reported): October
20, 2016
_________________
CLEARWATER
PAPER CORPORATION
(Exact
name of registrant as specified in its charter)
_________________
Delaware |
001-34146 |
20-3594554 |
(State or other jurisdiction |
(Commission File Number) |
(IRS Employer |
601 West Riverside Ave., Suite 1100
Spokane, WA 99201
(Address
of principal executive offices) (Zip Code)
Registrant’s telephone number, including area code: (509) 344-5900
_________________
Check the appropriate box below if the Form 8-K filing is intended to simultaneously satisfy the filing obligation of the registrant under any of the following provisions:
⃞ Written communications pursuant to Rule 425 under the Securities Act (17 CFR 230.425)
⃞ Soliciting material pursuant to Rule 14a-12 under the Exchange Act (17 CFR 240.14a-12)
⃞ Pre-commencement communications pursuant to Rule 14d-2(b) under the Exchange Act (17 CFR 240.14d-2(b))
⃞ Pre-commencement communications pursuant to Rule 13e-4(c) under the Exchange Act (17 CFR 240.13e-4(c))
Item 2.02. Results of Operations and Financial Condition.
On October 20, 2016, Clearwater Paper Corporation announced its results of operations and financial condition for the third quarter ending September 30, 2016. A copy of the press release containing this announcement is furnished as Exhibit 99.1 hereto. In addition, a copy of the Company’s Third Quarter 2016 Supplemental Information is furnished as Exhibit 99.2 hereto.
The information in this Form 8-K, including Exhibits 99.1 and 99.2, shall not be deemed “filed” for purposes of Section 18 of the Securities Exchange Act of 1934, as amended (the “Exchange Act”), nor shall it be deemed incorporated by reference in any filing under the Securities Act of 1933, as amended, or the Exchange Act, except as shall be expressly set forth by specific reference in such filing.
Item 9.01. Financial Statements and Exhibits
(d) Exhibits.
99.1 Press release issued by Clearwater Paper Corporation, dated
October 20, 2016:
CLEARWATER PAPER REPORTS THIRD QUARTER
2016 RESULTS
99.2 Clearwater Paper Corporation Third Quarter 2016 Supplemental
Information
---------------------------------------------------------------------------------------------
SIGNATURES
Pursuant to the requirements of the Securities Exchange Act of 1934, the
registrant has duly caused this report to be signed on its behalf by the
undersigned hereunto duly authorized.
Date: |
October 20, 2016 |
||||
|
CLEARWATER PAPER CORPORATION |
||||
|
|||||
|
|
|
|||
By: |
/s/ Michael S. Gadd |
||||
Michael S. Gadd, Corporate Secretary |
EXHIBIT INDEX
Exhibit |
Description |
99.1 |
Press release issued by Clearwater Paper Corporation, dated October 20, 2016: CLEARWATER PAPER REPORTS THIRD QUARTER 2016 RESULTS |
99.2 |
Clearwater Paper Corporation Third Quarter 2016 Supplemental Information |
Exhibit 99.1
Clearwater Paper Reports Third Quarter 2016 Results
SPOKANE, Wash.--(BUSINESS WIRE)--October 20, 2016--Clearwater Paper Corporation (NYSE:CLW) today reported financial results for the third quarter of 2016.
The company reported net sales of $435.3 million for the third quarter of 2016, down 1.6% compared to net sales of $442.2 million for the third quarter of 2015. Net earnings determined in accordance with generally accepted accounting principles, or GAAP, for the third quarter of 2016 were $0.9 million, or $0.05 per diluted share, compared to $23.1 million, or $1.21 per diluted share, for the third quarter of 2015. Excluding certain items identified in the attached reconciliations to GAAP, third quarter 2016 adjusted net earnings were $2.4 million, or $0.14 per diluted share, compared to third quarter 2015 adjusted net earnings of $24.4 million, or $1.28 per diluted share. The decrease in net earnings was due primarily to $18.0 million of pre-tax planned major maintenance at the company’s Lewiston, Idaho pulp and paperboard facility, lower paperboard pricing and shipments, $3.5 million of pre-tax net costs incurred from an unplanned power outage at the Lewiston facility, a $3.5 million pre-tax settlement charge associated with a pension lump sum buyout, and contractual wage increases. These items were partially offset by higher productivity and lower input costs for transportation, chemicals and natural gas.
Earnings before interest, taxes, depreciation and amortization, or EBITDA, was $32.0 million for the third quarter of 2016 compared to $61.3 million for the third quarter of 2015. Adjusted EBITDA for the quarter was $34.3 million, down 45.7% compared to third quarter 2015 Adjusted EBITDA of $63.2 million.
"Clearwater Paper achieved third quarter financial results at the high end of our outlook with increased retail sales volumes in consumer products that helped to mitigate continued challenging paperboard market conditions,” said Linda K. Massman, president and chief executive officer. “The team’s outstanding focus on implementing our strategic capital projects and operational efficiencies also contributed to our results."
“Through the third quarter, we have purchased approximately 1.1 million shares at an average price of $46.91 as part of our $100 million stock repurchase program we announced last December. Our stock repurchase program reflects our confidence in future cash generation capabilities and a commitment to return capital to shareholders,” said Massman.
THIRD QUARTER 2016 SEGMENT PERFORMANCE
Consumer Products
Net sales in the Consumer Products segment were $253.3 million for the third quarter of 2016, up 2.5% compared to third quarter 2015 net sales of $247.0 million. This increase was due to market share gains, which resulted in growth of total tissue volume and a richer product mix that included a 7.0% increase in retail tons sold.
On a GAAP basis, the segment had operating income of $17.2 million in the third quarter of 2016, compared to operating income of $15.5 million in the third quarter of 2015. Adjusted operating income of $15.9 million for the third quarter of 2016 was down from $16.7 million compared to the same period in 2015, after adjusting for a $1.8 million net gain in the third quarter of 2016 resulting from the release of an indemnity escrow related to the sale of the company’s former specialty tissue mills, $0.5 million and $0.7 million of costs in the third quarters of 2016 and 2015, respectively, related to the previously announced Long Island, New York facility closure, and $0.5 million of reorganization related expenses in the third quarter of 2015. The adjusted operating margin declined from 6.8% in the third quarter of 2015 to 6.3% in the most recent period due to higher maintenance and wage costs which were partially offset by higher shipment volumes, a richer product mix and lower transportation costs.
Pulp and Paperboard
Net sales in the Pulp and Paperboard segment were $182.0 million for the third quarter of 2016, down 6.8% compared to third quarter 2015 net sales of $195.2 million. The decrease was primarily due to lower paperboard shipments and pricing. Operating income for the quarter decreased $27.4 million to $10.0 million, compared to $37.4 million for the third quarter of 2015, primarily due to $18.0 million of planned major maintenance at the Lewiston, Idaho mill, $3.5 million of net costs incurred from an unplanned power outage at the Lewiston facility, and contractual wage increases. These factors were partially offset by lower input costs for polyethylene, natural gas, and transportation.
Taxes
The company's GAAP tax rate for the third quarter of 2016 was a provision of 48.8% compared to 28.3% in the third quarter of 2015 due to a low level of pre-tax income in the period. On an adjusted basis, the third quarter 2016 tax rate was 41.4%. The company expects its annual GAAP and adjusted tax rate to be approximately 36% plus or minus two percentage points for 2016.
Note Regarding Use of Non-GAAP Financial Measures
In this press release, the company presents certain non-GAAP financial information for the third quarters of 2016 and 2015, including EBITDA, Adjusted EBITDA, adjusted net earnings, adjusted net earnings per diluted share, adjusted operating income, adjusted operating margin and adjusted tax rate. Because these amounts are not in accordance with GAAP, reconciliations to net earnings, net earnings per diluted share, operating income and adjusted tax rate as determined in accordance with GAAP are included at the end of this press release. The company presents these non-GAAP amounts because management believes they assist investors and analysts in comparing the company's performance across reporting periods on a consistent basis by excluding items that the company does not believe are indicative of its core operating performance.
WEBCAST INFORMATION
Clearwater Paper Corporation will discuss these results during an earnings conference call that begins at 2:00 p.m. Pacific Time today. A live webcast and accompanying supplemental information will be available on the company's website at http://ir.clearwaterpaper.com. A replay of today's conference call will be available on the website at http://ir.clearwaterpaper.com/results.cfm beginning at 5:00 p.m. Pacific Time today.
ABOUT CLEARWATER PAPER
Clearwater Paper manufactures quality consumer tissue, away-from-home tissue, parent roll tissue, bleached paperboard and pulp at manufacturing facilities across the nation. The company is a premier supplier of private label tissue to major retailers and wholesale distributors, including grocery, drug, mass merchants and discount stores. In addition, the company produces bleached paperboard used by quality-conscious printers and packaging converters. Clearwater Paper's employees build shareholder value by developing strong customer partnerships through quality and service.
FORWARD-LOOKING STATEMENTS
This press release contains certain forward-looking statements within the meaning of the Private Securities Litigation Reform Act of 1995 as amended, including the company's stock repurchase program, cash flow generation, return of capital to shareholders and expected tax rate for 2016. These forward-looking statements are based on current expectations, estimates, assumptions and projections that are subject to change, and actual results may differ materially from the forward-looking statements. Factors that could cause actual results to differ materially include, but are not limited to, competitive pricing pressures for the company’s products, including as a result of increased capacity as additional manufacturing facilities are operated by the company’s competitors; changes in the U.S. and international economies and in general economic conditions in the regions and industries in which the company operates; changes in customer product preferences and competitors’ product offerings; the loss of or changes in prices in regards to a significant customer; cyclical industry conditions; changes in the cost and availability of wood fiber and wood pulp; inability to successfully implement the company’s operational efficiencies and expansion strategies; changes in transportation costs and disruptions in transportation services; customer acceptance, timing and quantity of purchases of the company’s tissue products; changes in costs for and availability of packaging supplies, chemicals, energy and maintenance and repairs; environmental liabilities or expenditures; labor disruptions; manufacturing or operating disruptions, including IT system and IT system implementation failures, equipment malfunction and damage to the company’s manufacturing facilities; changes in expenses and required contributions associated with the company’s pension plans; reliance on a limited number of third-party suppliers for raw materials; and other risks and uncertainties described from time to time in the company's public filings with the Securities and Exchange Commission, including its Annual Report on Form 10-K for the year ended December 31, 2015. The forward-looking statements are made as of the date of this press release and the company does not undertake to update any forward-looking statements based on new developments or changes in the company's expectations.
Clearwater Paper Corporation | ||||||||||||||||||||||||||||||
Consolidated Statements of Operations | ||||||||||||||||||||||||||||||
Unaudited (Dollars in thousands - except per-share amounts) | ||||||||||||||||||||||||||||||
Three Months Ended | Nine Months Ended | |||||||||||||||||||||||||||||
September 30, | September 30, | |||||||||||||||||||||||||||||
2016 | 2015 | 2016 | 2015 | |||||||||||||||||||||||||||
Net sales | $ | 435,320 | 100 | % | $ | 442,222 | 100 | % | $ | 1,309,195 | 100 | % | $ | 1,320,806 | 100 | % | ||||||||||||||
Costs and expenses: | ||||||||||||||||||||||||||||||
Cost of sales | (396,605 | ) | 91 | % | (373,892 | ) | 85 | % | (1,127,103 | ) | 86 | % | (1,148,071 | ) | 87 | % | ||||||||||||||
Selling, general and administrative expenses | (29,435 | ) | 7 | % | (28,284 | ) | 6 | % | (94,885 | ) | 7 | % | (85,379 | ) | 6 | % | ||||||||||||||
Total operating costs and expenses | (426,040 | ) | 98 | % | (402,176 | ) | 91 | % | (1,221,988 | ) | 93 | % | (1,233,450 | ) | 93 | % | ||||||||||||||
Income from operations | 9,280 | 2 | % | 40,046 | 9 | % | 87,207 | 7 | % | 87,356 | 7 | % | ||||||||||||||||||
Interest expense, net | (7,520 | ) | 2 | % | (7,882 | ) | 2 | % | (22,559 | ) | 2 | % | (23,438 | ) | 2 | % | ||||||||||||||
Earnings before income taxes | 1,760 | 0 | % | 32,164 | 7 | % | 64,648 | 5 | % | 63,918 | 5 | % | ||||||||||||||||||
Income tax provision | (859 | ) | 0 | % | (9,100 | ) | 2 | % | (24,437 | ) | 2 | % | (19,500 | ) | 1 | % | ||||||||||||||
Net earnings | $ | 901 | 0 | % | $ | 23,064 | 5 | % | $ | 40,211 | 3 | % | $ | 44,418 | 3 | % | ||||||||||||||
Net earnings per common share: | ||||||||||||||||||||||||||||||
Basic | $ | 0.05 | $ | 1.22 | $ | 2.35 | $ | 2.33 | ||||||||||||||||||||||
Diluted |
|
0.05 | 1.21 |
|
2.33 | 2.30 | ||||||||||||||||||||||||
Average shares outstanding (in thousands): | ||||||||||||||||||||||||||||||
Basic | 16,845 | 18,860 | 17,141 | 19,088 | ||||||||||||||||||||||||||
Diluted | 17,060 | 19,091 | 17,253 | 19,284 | ||||||||||||||||||||||||||
Clearwater Paper Corporation | ||||||||||
Condensed Consolidated Balance Sheets | ||||||||||
Unaudited (Dollars in thousands) | ||||||||||
September 30, | December 31, | |||||||||
2016 | 2015 | |||||||||
ASSETS | ||||||||||
Current assets: | ||||||||||
Cash and cash equivalents | $ | 331 | $ | 5,610 | ||||||
Restricted cash | — | 2,270 | ||||||||
Short-term investments | — | 250 | ||||||||
Receivables, net | 134,384 | 139,052 | ||||||||
Taxes receivable | 7,634 | 14,851 | ||||||||
Inventories | 252,126 | 255,573 | ||||||||
Other current assets | 5,414 | 9,331 | ||||||||
Total current assets | 399,889 | 426,937 | ||||||||
Property, plant and equipment, net | 914,945 | 866,538 | ||||||||
Goodwill | 209,087 | 209,087 | ||||||||
Intangible assets, net | 16,280 | 19,990 | ||||||||
Pension Assets | 2,035 | 596 | ||||||||
Other assets, net | 5,578 | 4,221 | ||||||||
TOTAL ASSETS | $ | 1,547,814 | $ | 1,527,369 | ||||||
LIABILITIES AND STOCKHOLDERS' EQUITY | ||||||||||
Current liabilities: | ||||||||||
Accounts payable and accrued liabilities | $ | 223,803 | $ | 220,368 | ||||||
Revolving credit facility borrowings | 13,012 | — | ||||||||
Current liability for pensions and other postretirement employee benefits | 7,559 | 7,559 | ||||||||
Total current liabilities | 244,374 | 227,927 | ||||||||
Long-term debt | 569,563 | 568,987 | ||||||||
Liability for pensions and other postretirement employee benefits | 85,991 | 89,057 | ||||||||
Other long-term obligations | 42,310 | 46,738 | ||||||||
Accrued taxes | 1,523 | 1,676 | ||||||||
Deferred tax liabilities | 132,850 | 118,118 | ||||||||
Stockholders' equity, excluding accumulated other comprehensive loss, net of tax | 524,166 | 530,414 | ||||||||
Accumulated other comprehensive loss, net of tax | (52,963 | ) | (55,548 | ) | ||||||
TOTAL LIABILITIES AND STOCKHOLDERS' EQUITY | $ | 1,547,814 | $ | 1,527,369 | ||||||
Clearwater Paper Corporation | ||||||||||
Consolidated Statements of Cash Flows | ||||||||||
Unaudited (Dollars in thousands) | ||||||||||
Nine Months Ended |
||||||||||
2016 | 2015 | |||||||||
CASH FLOWS FROM OPERATING ACTIVITIES | ||||||||||
Net earnings | $ | 40,211 | $ | 44,418 | ||||||
Adjustments to reconcile net earnings to net cash flows from operating activities: | ||||||||||
Depreciation and amortization | 65,921 | 62,844 | ||||||||
Equity-based compensation expense | 9,826 | 2,495 | ||||||||
Deferred tax provision (benefit) | 12,329 | (12,403 | ) | |||||||
Employee benefit plans | (500 | ) | 2,122 | |||||||
Deferred issuance costs on long-term debt | 637 | 714 | ||||||||
Disposal of plant and equipment, net | 30 | 1,109 | ||||||||
Non-cash adjustments to unrecognized taxes | (153 | ) | (1,123 | ) | ||||||
Changes in working capital, net | 4,045 | 15,471 | ||||||||
Changes in taxes receivable, net | 7,217 | 1,255 | ||||||||
Excess tax benefits from equity-based payment arrangements | (157 | ) | (3,848 | ) | ||||||
Funding of qualified pension plans | — | (3,179 | ) | |||||||
Other, net | (523 | ) | (2,320 | ) | ||||||
Net cash flows from operating activities | 138,883 | 107,555 | ||||||||
CASH FLOWS FROM INVESTING ACTIVITIES | ||||||||||
Changes in short-term investments, net | 250 | 40,000 | ||||||||
Additions to plant and equipment | (105,514 | ) | (78,461 | ) | ||||||
Proceeds from sale of assets | — | 587 | ||||||||
Net cash flows from investing activities | (105,264 | ) | (37,874 | ) | ||||||
CASH FLOWS FROM FINANCING ACTIVITIES | ||||||||||
Purchase of treasury stock | (51,528 | ) | (84,305 | ) | ||||||
Borrowings on revolving credit facility | 944,844 | — | ||||||||
Repayments of revolving credit facility borrowings | (931,832 | ) | — | |||||||
Payment of tax withholdings on equity-based payment arrangements | (488 | ) | (3,129 | ) | ||||||
Excess tax benefits from equity-based payment arrangements | 157 | 3,848 | ||||||||
Other, net | (51 | ) | (9 | ) | ||||||
Net cash flows from financing activities | (38,898 | ) | (83,595 | ) | ||||||
Decrease in cash and cash equivalents | (5,279 | ) | (13,914 | ) | ||||||
Cash and cash equivalents at beginning of period | 5,610 | 27,331 | ||||||||
Cash and cash equivalents at end of period | $ | 331 | $ | 13,417 | ||||||
Clearwater Paper Corporation | ||||||||||||||||||||||||||||||
Segment Information | ||||||||||||||||||||||||||||||
Unaudited (Dollars in thousands) | ||||||||||||||||||||||||||||||
Three Months Ended | Nine Months Ended | |||||||||||||||||||||||||||||
September 30, | September 30, | |||||||||||||||||||||||||||||
2016 | 2015 | 2016 | 2015 | |||||||||||||||||||||||||||
Segment net sales: | ||||||||||||||||||||||||||||||
Consumer Products | $ | 253,319 | 58 | % | $ | 247,039 | 56 | % | $ | 746,249 | 57 | % | $ | 721,606 | 55 | % | ||||||||||||||
Pulp and Paperboard | 182,001 | 42 | % | 195,183 | 44 | % | 562,946 | 43 | % | 599,200 | 45 | % | ||||||||||||||||||
Total segment net sales | $ | 435,320 | 100 | % | $ | 442,222 | 100 | % | $ | 1,309,195 | 100 | % | $ | 1,320,806 | 100 | % | ||||||||||||||
Operating income (loss): | ||||||||||||||||||||||||||||||
Consumer Products | $ | 17,201 | 185 | % | $ | 15,521 | 39 | % | $ | 54,135 | 62 | % | $ | 44,948 | 51 | % | ||||||||||||||
Pulp and Paperboard | 9,956 | 107 | % | 37,446 | 94 | % | 85,151 | 98 | % | 81,394 | 93 | % | ||||||||||||||||||
27,157 | 52,967 | 139,286 | 126,342 | |||||||||||||||||||||||||||
Corporate1 | (17,877 | ) | 193 | % | (12,921 | ) | 32 | % | (52,079 | ) | 60 | % | (38,986 | ) | 45 | % | ||||||||||||||
Income from operations | $ | 9,280 | 100 | % | $ | 40,046 | 100 | % | $ | 87,207 | 100 | % | $ | 87,356 | 100 | % | ||||||||||||||
1 |
Corporate expenses for the three and nine months ended September 30, 2016 include a $3.5 million settlement accounting charge associated with a pension lump sum buyout for term-vested participants. | |
Clearwater Paper Corporation | ||||||||||||||||||
Reconciliation of Non-GAAP Financial Measures | ||||||||||||||||||
EBITDA and Adjusted EBITDA | ||||||||||||||||||
Unaudited (Dollars in thousands) | ||||||||||||||||||
Three Months Ended | Nine Months Ended | |||||||||||||||||
September 30, | September 30, | |||||||||||||||||
2016 | 2015 | 2016 | 2015 | |||||||||||||||
Net earnings | $ | 901 | $ | 23,064 | $ | 40,211 | $ | 44,418 | ||||||||||
Add back: | ||||||||||||||||||
Interest expense, net | 7,520 | 7,882 | 22,559 | 23,438 | ||||||||||||||
Income tax provision | 859 | 9,100 | 24,437 | 19,500 | ||||||||||||||
Depreciation and amortization expense | 22,747 | 21,204 | 65,921 | 62,844 | ||||||||||||||
EBITDA1 | $ | 32,027 | $ | 61,250 | $ | 153,128 | $ | 150,200 | ||||||||||
Directors' equity-based compensation expense (benefit) | $ | 89 | $ | (1,914 | ) | $ | 4,425 | $ | (3,841 | ) | ||||||||
Pension settlement expense | 3,482 | — | 3,482 | — | ||||||||||||||
Costs associated with Long Island facility closure | 466 | 728 | 1,431 | 2,017 | ||||||||||||||
Gain associated with the sale of the specialty mills | (1,755 | ) | — | (1,755 | ) | (1,462 | ) | |||||||||||
Legal expenses and settlement costs | — | 1,972 | — | 1,972 | ||||||||||||||
Reorganization related expenses | — | 1,185 | — | 1,185 | ||||||||||||||
Costs associated with labor agreement | — | — | — | 1,730 | ||||||||||||||
Adjusted EBITDA2 | $ | 34,309 | $ | 63,221 | $ | 160,711 | $ | 151,801 | ||||||||||
1 |
EBITDA is a non-GAAP measure that management uses to evaluate the cash generating capacity of the company. The most directly comparable GAAP measure is net earnings. EBITDA is net earnings adjusted for net interest expense, income taxes, and depreciation and amortization. It should not be considered as an alternative to net earnings computed under GAAP. |
|
2 |
Adjusted EBITDA excludes the impact of the items listed that we do not believe are indicative of our core operating performance. |
|
Clearwater Paper Corporation | ||||||||||||||||||
Reconciliation of Non-GAAP Financial Measures | ||||||||||||||||||
Adjusted Net Earnings and Adjusted Net Earnings Per Diluted Common Share | ||||||||||||||||||
Unaudited (Dollars in thousands, except per-share amounts) | ||||||||||||||||||
Three Months Ended | Nine Months Ended | |||||||||||||||||
September 30, | September 30, | |||||||||||||||||
2016 | 2015 | 2016 | 2015 | |||||||||||||||
GAAP net earnings | $ | 901 | $ | 23,064 | $ | 40,211 | $ | 44,418 | ||||||||||
Special items, after-tax1: | ||||||||||||||||||
Directors' equity-based compensation expense (benefit) | 57 | (1,307 | ) | 2,857 | (2,630 | ) | ||||||||||||
Pension settlement expense | 2,240 | — | 2,240 | — | ||||||||||||||
Costs associated with Long Island facility closure | 300 | 497 | 922 | 1,384 | ||||||||||||||
Gain associated with the sale of the specialty mills | (1,129 | ) | — | (1,129 | ) | (1,003 | ) | |||||||||||
Legal expenses and settlement costs | — | 1,346 | — | 1,346 | ||||||||||||||
Reorganization related expenses | — | 809 | — | 809 | ||||||||||||||
Costs associated with labor agreement | — | — | — | 1,197 | ||||||||||||||
Adjusted net earnings2 | $ | 2,369 | $ | 24,409 | $ | 45,101 | $ | 45,521 | ||||||||||
GAAP net earnings per diluted share | $ | 0.05 | $ | 1.21 | $ | 2.33 | $ | 2.30 | ||||||||||
Special items, after-tax1: | ||||||||||||||||||
Directors' equity-based compensation expense (benefit) | — | (0.07 | ) | 0.17 | (0.14 | ) | ||||||||||||
Pension settlement expense | 0.13 | — | 0.13 | — | ||||||||||||||
Costs associated with Long Island facility closure | 0.02 | 0.03 | 0.05 | 0.07 | ||||||||||||||
Gain associated with the sale of the specialty mills | (0.07 | ) | — | (0.07 | ) | (0.05 | ) | |||||||||||
Legal expenses and settlement costs | — | 0.07 | - | 0.07 | ||||||||||||||
Reorganization related expenses | — | 0.04 | - | 0.04 | ||||||||||||||
Costs associated with labor agreement | — | — | - | 0.06 | ||||||||||||||
Adjusted net earnings per diluted share2 | $ | 0.14 | $ | 1.28 | $ | 2.61 | $ | 2.36 | ||||||||||
1 |
Tax effect was calculated using the estimated annual effective tax rate for the period presented. | |
2 |
Adjusted net earnings and Adjusted net earnings per diluted share exclude the impact of the items listed that we do not believe are indicative of our core operating performance. | |
Clearwater Paper Corporation | ||||||||||||||||||
Reconciliation of Non-GAAP Financial Measures | ||||||||||||||||||
Segment EBITDA, Adjusted EBITDA, EBITDA Margin and Adjusted EBITDA Margin | ||||||||||||||||||
Unaudited (Dollars in thousands) | ||||||||||||||||||
Three Months Ended | Nine Months Ended | |||||||||||||||||
September 30, | September 30, | |||||||||||||||||
2016 | 2015 | 2016 | 2015 | |||||||||||||||
Consumer Products: | ||||||||||||||||||
Net sales | $ | 253,319 | $ | 247,039 | $ | 746,249 | $ | 721,606 | ||||||||||
GAAP operating income | 17,201 | 15,521 | 54,135 | 44,948 | ||||||||||||||
Depreciation and amortization expense | 15,022 | 14,048 | 42,984 | 40,463 | ||||||||||||||
Consumer Products EBITDA1 | $ | 32,223 | $ | 29,569 | $ | 97,119 | $ | 85,411 | ||||||||||
Costs associated with Long Island facility closure | 466 | 728 | 1,431 | 2,017 | ||||||||||||||
Gain associated with the sale of the specialty mills | (1,755 | ) | — | (1,755 | ) | (1,462 | ) | |||||||||||
Costs associated with labor agreement | — | — | — | 814 | ||||||||||||||
Reorganization related expenses | — | 494 | — | 494 | ||||||||||||||
Consumer Products Adjusted EBITDA2 | $ | 30,934 | $ | 30,791 | $ | 96,795 | $ | 87,274 | ||||||||||
Consumer Products EBITDA margin3 | 12.7 | % | 12.0 | % | 13.0 | % | 11.8 | % | ||||||||||
Consumer Products Adjusted EBITDA margin4 | 12.2 | % | 12.5 | % | 13.0 | % | 12.1 | % | ||||||||||
Pulp and Paperboard: | ||||||||||||||||||
Net sales | $ | 182,001 | $ | 195,183 | $ | 562,946 | $ | 599,200 | ||||||||||
GAAP operating income | 9,956 | 37,446 | 85,151 | 81,394 | ||||||||||||||
Depreciation and amortization expense | 6,530 | 6,535 | 19,346 | 20,583 | ||||||||||||||
Pulp and Paperboard EBITDA1 | $ | 16,486 | $ | 43,981 | $ | 104,497 | $ | 101,977 | ||||||||||
Costs associated with labor agreement | — | — | — | 916 | ||||||||||||||
Reorganization related expenses | — | 239 | — | 239 | ||||||||||||||
Pulp and Paperboard Adjusted EBITDA2 | $ | 16,486 | $ | 44,220 | $ | 104,497 | $ | 103,132 | ||||||||||
Pulp and Paperboard EBITDA margin3 | 9.1 | % | 22.5 | % | 18.6 | % | 17.0 | % | ||||||||||
Pulp and Paperboard Adjusted EBITDA margin4 | 9.1 | % | 22.7 | % | 18.6 | % | 17.2 | % | ||||||||||
1 |
Segment EBITDA is segment operating income adjusted for depreciation and amortization. | |
2 |
Segment Adjusted EBITDA excludes the impact of the items listed that we do not believe are indicative of our core operating performance. | |
3 |
Segment EBITDA margin is defined as Segment EBITDA divided by Segment Net sales. | |
4 |
Segment Adjusted EBITDA margin is defined as Segment Adjusted EBITDA divided by Segment Net sales. | |
Clearwater Paper Corporation | ||||||||||||||||||
Reconciliation of Non-GAAP Financial Measures | ||||||||||||||||||
Segment Adjusted Operating Income and Operating Margin | ||||||||||||||||||
Unaudited (Dollars in thousands) | ||||||||||||||||||
Three Months Ended | Nine Months Ended | |||||||||||||||||
September 30, | September 30, | |||||||||||||||||
2016 | 2015 | 2016 | 2015 | |||||||||||||||
Consumer Products: | ||||||||||||||||||
Net sales | $ | 253,319 | $ | 247,039 | $ | 746,249 | $ | 721,606 | ||||||||||
GAAP operating income | 17,201 | 15,521 | 54,135 | 44,948 | ||||||||||||||
Costs associated with Long Island facility closure | 466 | 728 | 1,431 | 2,017 | ||||||||||||||
Gain associated with the sale of the specialty mills | (1,755 | ) | — | (1,755 | ) | (1,462 | ) | |||||||||||
Costs associated with labor agreement | — | — | — | 814 | ||||||||||||||
Reorganization related expenses | — | 494 | — | 494 | ||||||||||||||
Consumer Products Adjusted operating income1 | $ | 15,912 | $ | 16,743 | $ | 53,811 | $ | 46,811 | ||||||||||
Consumer Products operating margin | 6.8 | % | 6.3 | % | 7.3 | % | 6.2 | % | ||||||||||
Consumer Products Adjusted operating margin2 | 6.3 | % | 6.8 | % | 7.2 | % | 6.5 | % | ||||||||||
Pulp and Paperboard: | ||||||||||||||||||
Net sales | $ | 182,001 | $ | 195,183 | $ | 562,946 | $ | 599,200 | ||||||||||
GAAP operating income | 9,956 | 37,446 | 85,151 | 81,394 | ||||||||||||||
Costs associated with labor agreement | — | — | — | 916 | ||||||||||||||
Reorganization related expenses | — | 239 | — | 239 | ||||||||||||||
Pulp and Paperboard Adjusted operating income1 | $ | 9,956 | $ | 37,685 | $ | 85,151 | $ | 82,549 | ||||||||||
Pulp and Paperboard operating margin | 5.5 | % | 19.2 | % | 15.1 | % | 13.6 | % | ||||||||||
Pulp and Paperboard Adjusted operating margin2 | 5.5 | % | 19.3 | % | 15.1 | % | 13.8 | % | ||||||||||
1 |
Segment Adjusted operating income excludes the impact of the items listed that we do not believe are indicative of our core operating performance. | |
2 |
Segment Adjusted operating margin is defined as Segment Adjusted operating income divided by Segment Net sales. | |
Clearwater Paper Corporation | |||||||||||||||||
Reconciliation of Non-GAAP Financial Measures | |||||||||||||||||
Adjusted Income Tax Provision | |||||||||||||||||
Unaudited (Dollars in thousands) | |||||||||||||||||
Three Months Ended | Nine Months Ended | ||||||||||||||||
September 30, | September 30, | ||||||||||||||||
2016 | 2015 | 2016 | 2015 | ||||||||||||||
GAAP income tax provision | $ | (859 | ) | $ | (9,100 | ) | $ | (24,437 | ) | $ | (19,500 | ) | |||||
Special items, after-tax: | |||||||||||||||||
Directors' equity-based compensation (expense) benefit | (32 | ) | 607 | (1,568 | ) | 1,211 | |||||||||||
Pension settlement expense | (1,242 | ) | — | (1,242 | ) | — | |||||||||||
Costs associated with Long Island facility closure | (166 | ) | (231 | ) | (509 | ) | (633 | ) | |||||||||
Gain associated with the sale of the specialty mills | 626 | — | 626 | 459 | |||||||||||||
Legal expenses and settlement costs | — | (626 | ) | — | (626 | ) | |||||||||||
Reorganization related expenses | — | (376 | ) | — | (376 | ) | |||||||||||
Costs associated with labor agreement | — | — | — | (533 | ) | ||||||||||||
Adjusted income tax provision1 | $ | (1,673 | ) | $ | (9,726 | ) | $ | (27,130 | ) | $ | (19,998 | ) | |||||
Adjusted income tax provision rate1,2 | 41.4 | % | 28.5 | % | 37.5 | % | 30.5 | % | |||||||||
1 |
Adjusted income tax provision and Adjusted income tax provision rate exclude the impact of the items listed that we do not believe are indicative of our core operating performance. | |
2 |
The Adjusted income tax provision rate is defined as [Adjusted income tax provision / (Adjusted income tax provision + Adjusted net earnings)]. | |
CONTACT:
Clearwater Paper Corporation
(News media)
Matt Van
Vleet
509.344.5912
or
(Investors)
Robin Yim
509.344.5906
Exhibit 99.2
Clearwater Paper Corporationthird quarter 2016Supplemental Information Linda Massman President, Chief Executive Officer and DirectorJohn HertzSenior Vice President Finance and Chief Financial Officer 10/20/16
Forward-Looking Statements This presentation of supplemental information contains, in addition to historical information, certain forward-looking statements within the meaning of the Private Securities Litigation Reform Act of 1995, including statements regarding financial models; the costs, timing and benefits associated with strategic capital investments and operational improvements; segment, corporate and consolidated outlook for Q4 2016; production; revenue; product volumes shipped; product pricing and sales mix; pulp and wood fiber costs and supply; chemical costs; operational and packaging supply costs; transportation costs; energy costs; cost and timing of major maintenance and repairs; cost of wages and benefits; selling, general, and administrative expenses; corporate expenses; estimated Q4 2016 EBITDA and adjusted EBITDA. These forward-looking statements are based on management’s current expectations, estimates, assumptions and projections that are subject to change. Our actual results of operations may differ materially from those expressed or implied by the forward-looking statements contained in this presentation. Important factors that could cause or contribute to such differences include the risks and uncertainties described from time to time in the company's public filings with the Securities and Exchange Commission, as well as the following: competitive pricing pressures for our products, including as a result of increased capacity as additional manufacturing facilities are operated by our competitors in North America and abroad;changes in the U.S. and international economies and in general economic conditions in the regions and industries in which we operate;changes in customer product preferences and competitors' product offerings;the loss of or changes in prices in regards to a significant customer;cyclical industry conditions;changes in the cost and availability of wood fiber and wood pulp;inability to successfully implement our operational efficiencies and expansion strategies;changes in transportation costs and disruptions in transportation services;customer acceptance, timing and quantity of purchases of our tissue products;changes in costs for and availability of packaging supplies, chemicals, energy and maintenance and repairs;environmental liabilities or expenditures;labor disruptions;manufacturing or operating disruptions, including IT system and IT system implementation failures, equipment malfunction and damage to our manufacturing facilities;changes in expenses and required contributions associated with our pension plans;reliance on a limited number of third-party suppliers for raw materials;inability to fund our debt obligations;restrictions on our business from debt covenants and terms; andchanges in laws, regulations or industry standards affecting our business.Forward-looking statements contained in this presentation present management’s views only as of the date of this presentation. We undertake no obligation to publicly update forward-looking statements, whether as a result of new information, future events or otherwise. 1
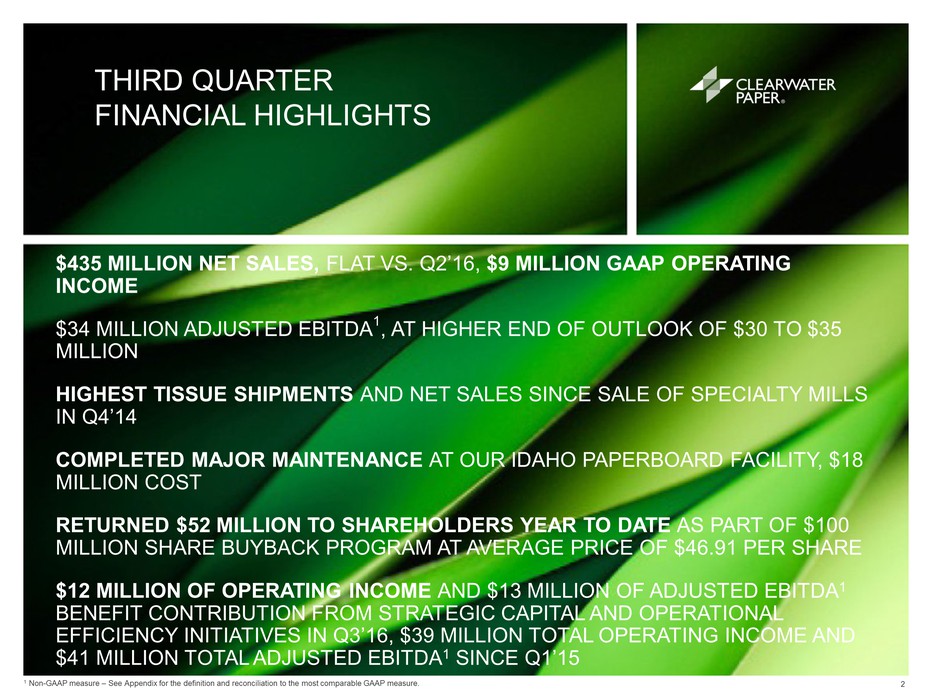
third Quarter financial highlights $435 million net sales, flat VS. Q2’16, $9 million gaap operating income$34 million adjusted EBitda1, at higher end of outlook of $30 to $35 millionHighest tissue shipments and net sales since sale of specialty mills in Q4’14Completed major maintenance at our Idaho paperboard facility, $18 million costReturned $52 million to shareholders year to date as part of $100 million share buyback program at average price of $46.91 per share$12 million of operating income and $13 million of adjusted ebitda1 benefit contribution from strategic capital and operational efficiency initiatives in q3’16, $39 million total operating income and $41 million total adjusted ebitda1 since q1’15 2 1 Non-GAAP measure – See Appendix for the definition and reconciliation to the most comparable GAAP measure.
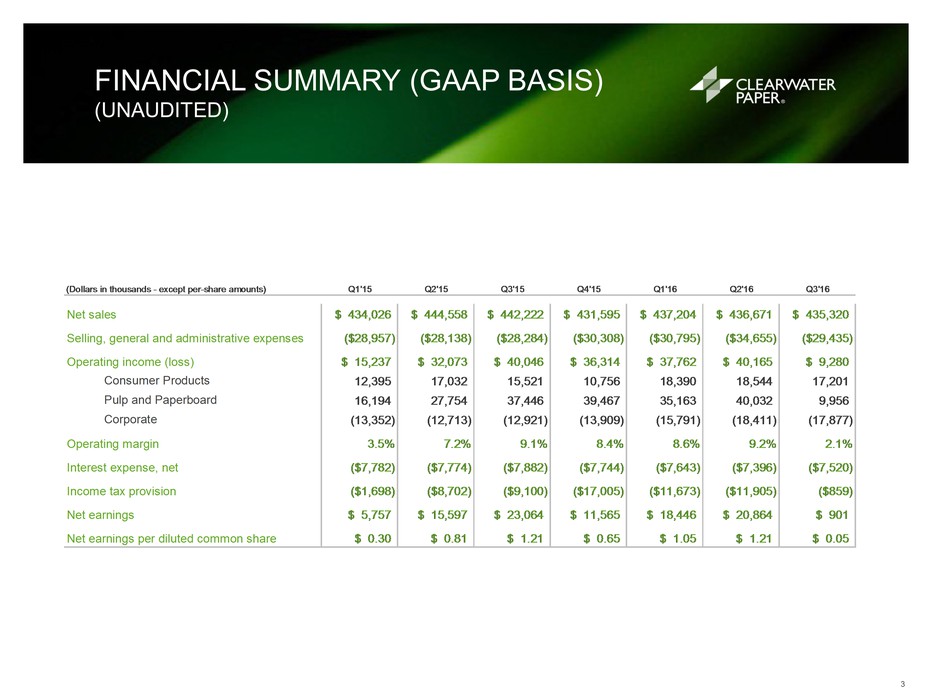
Financial Summary (GAAP basis)(Unaudited) 3
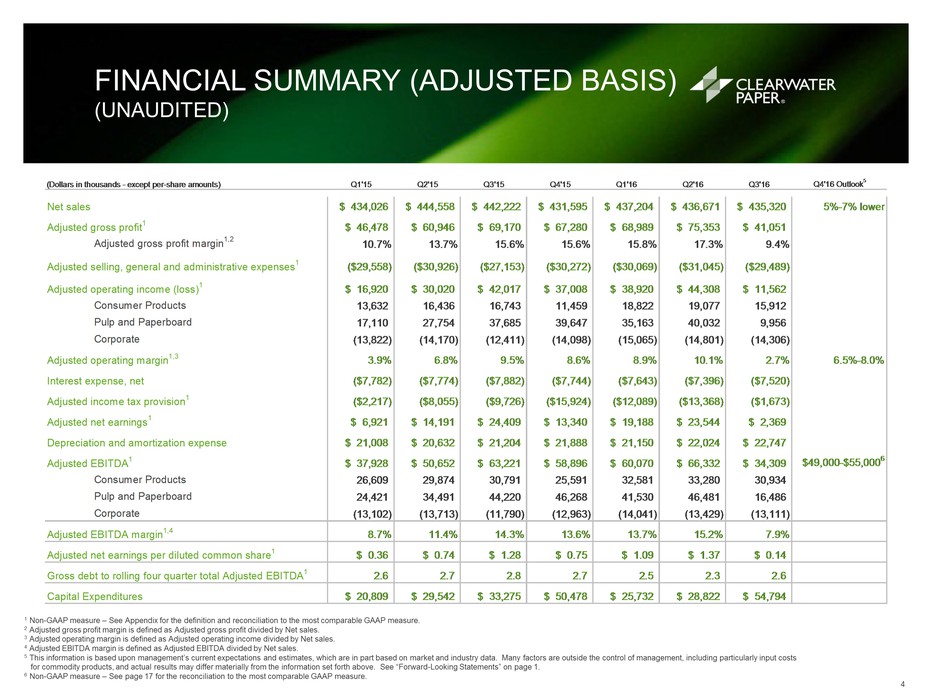
Financial Summary (adjusted basis)(Unaudited) 1 Non-GAAP measure – See Appendix for the definition and reconciliation to the most comparable GAAP measure.2 Adjusted gross profit margin is defined as Adjusted gross profit divided by Net sales.3 Adjusted operating margin is defined as Adjusted operating income divided by Net sales.4 Adjusted EBITDA margin is defined as Adjusted EBITDA divided by Net sales.5 This information is based upon management’s current expectations and estimates, which are in part based on market and industry data. Many factors are outside the control of management, including particularly input costs for commodity products, and actual results may differ materially from the information set forth above. See “Forward-Looking Statements” on page 1.6 Non-GAAP measure – See page 17 for the reconciliation to the most comparable GAAP measure... 4
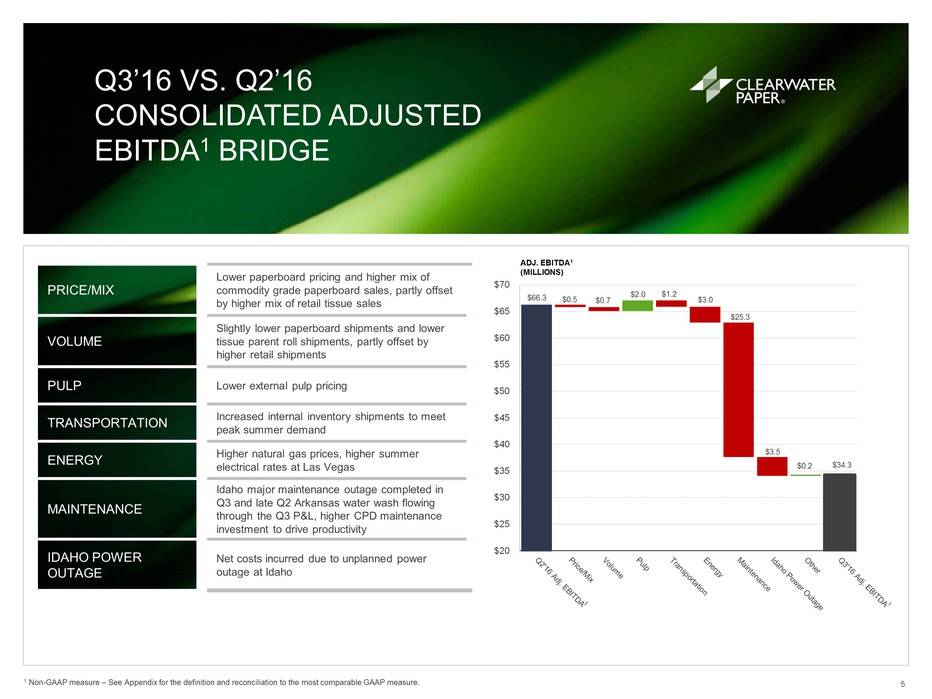
Q3’16 vs. Q2’16Consolidated Adjusted EBITDA1 Bridge 5 1 Non-GAAP measure – See Appendix for the definition and reconciliation to the most comparable GAAP measure. Price/mix Lower paperboard pricing, partly offset by higher mix of retail tissue sales volume Slightly lower paperboard shipments and lower tissue parent roll shipments, partly offset by higher retail shipments Pulp Lower external pulp pricing transportation Increased internal inventory shipments to meet peak summer demand energy Higher natural gas prices, higher summer electrical rates at Las Vegas maintenance Idaho major maintenance outage completed in Q3 and late Q2 Arkansas water wash flowing through the Q3 P&L, higher CPD maintenance investment to drive productivity Idaho power outage Net costs incurred due to unplanned power outage at Idaho
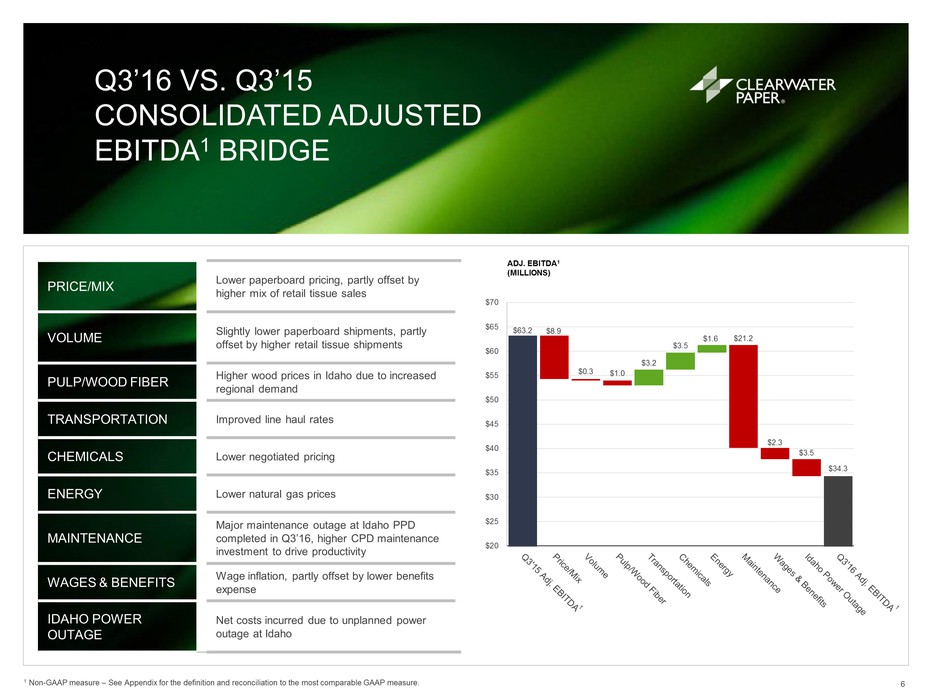
Q3’16 vs. Q3’15Consolidated Adjusted EBITDA1 Bridge 6 1 Non-GAAP measure – See Appendix for the definition and reconciliation to the most comparable GAAP measure. Price/Mix Lower paperboard pricing, partly offset by higher mix of retail tissue sales Volume Slightly lower paperboard shipments, partly offset by higher retail tissue shipments Pulp/wood fiber Higher wood prices in Idaho due to increased regional demand transportation Improved line haul rates chemicals Lower negotiated pricing energy Lower natural gas prices Maintenance Major maintenance outage at Idaho PPD completed in Q3’16, higher CPD maintenance investment to drive productivity Wages & Benefits Wage inflation, partly offset by lower benefits expense Idaho power outage Net costs incurred due to unplanned power outage at Idaho
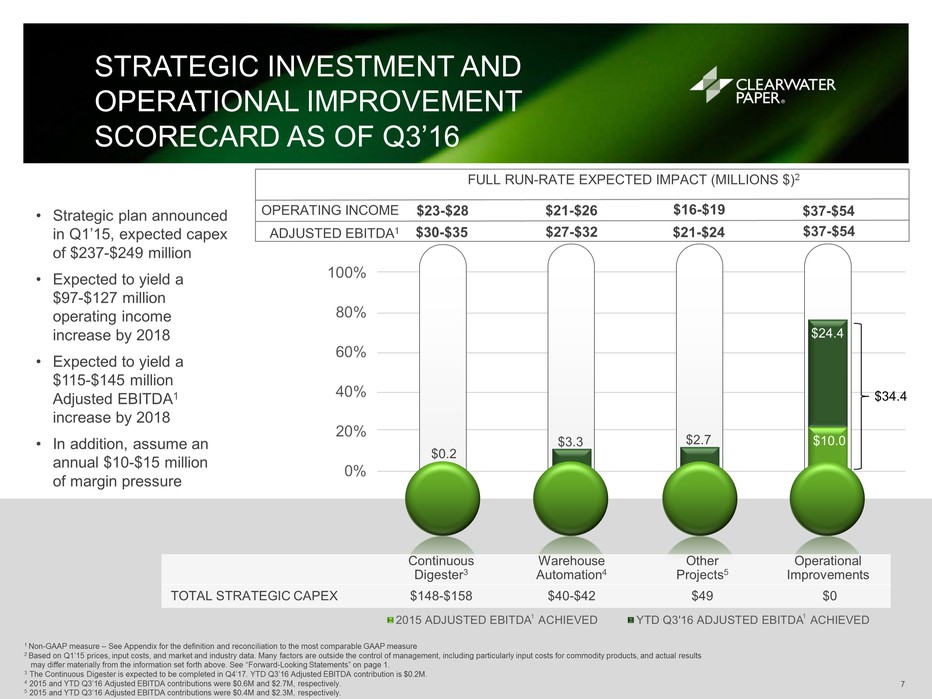
Strategic investment and operational improvement scorecard as of Q3’16 7 Strategic plan announced in Q1’15, expected capex of $237-$249 millionExpected to yield a $97-$127 million operating income increase by 2018Expected to yield a $115-$145 million Adjusted EBITDA1 increase by 2018In addition, assume an annual $10-$15 million of margin pressure Continuous Digester3 Warehouse Automation4 Other Projects5 Operational Improvements TOTAL STRATEGIC CAPEX $148-$158 $40-$42 $49 $0 1 Non-GAAP measure – See Appendix for the definition and reconciliation to the most comparable GAAP measure2 Based on Q1’15 prices, input costs, and market and industry data. Many factors are outside the control of management, including particularly input costs for commodity products, and actual results may differ materially from the information set forth above. See “Forward-Looking Statements” on page 1.3 The Continuous Digester is expected to be completed in Q4’17. YTD Q3’16 Adjusted EBITDA contribution is $0.2M.4 2015 and YTD Q3’16 Adjusted EBITDA contributions were $0.6M and $2.7M, respectively.5 2015 and YTD Q3’16 Adjusted EBITDA contributions were $0.4M and $2.3M, respectively.. 1 1 FULL RUN-RATE EXPECTED IMPACT (MILLIONS $)2 ADJUSTED EBITDA1 $23-$28 OPERATING INCOME $21-$26 $34.4
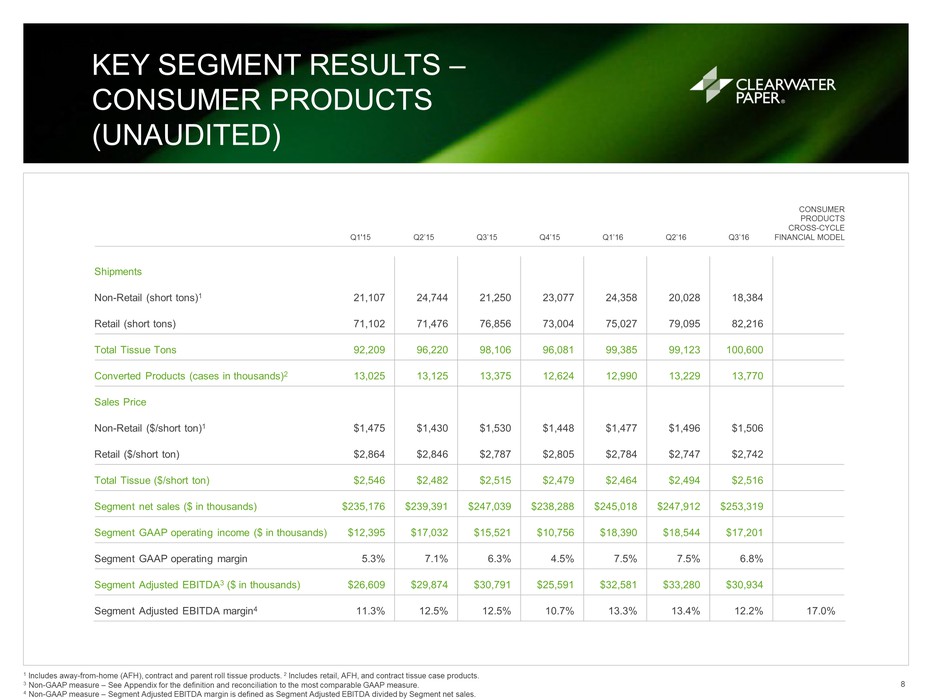
Key Segment Results – Consumer Products (Unaudited) 8 1 Includes away-from-home (AFH), contract and parent roll tissue products. 2 Includes retail, AFH, and contract tissue case products. 3 Non-GAAP measure – See Appendix for the definition and reconciliation to the most comparable GAAP measure. 4 Non-GAAP measure – Segment Adjusted EBITDA margin is defined as Segment Adjusted EBITDA divided by Segment net sales. Q1'15 Q2’15 Q3’15 Q4’15 Q1’16 Q2’16 Q3’16 Consumer Products Cross-Cycle Financial Model Shipments Non-Retail (short tons)1 21,107 24,744 21,250 23,077 24,358 20,028 18,384 Retail (short tons) 71,102 71,476 76,856 73,004 75,027 79,095 82,216 Total Tissue Tons 92,209 96,220 98,106 96,081 99,385 99,123 100,600 Converted Products (cases in thousands)2 13,025 13,125 13,375 12,624 12,990 13,229 13,770 Sales Price Non-Retail ($/short ton)1 $1,475 $1,430 $1,530 $1,448 $1,477 $1,496 $1,506 Retail ($/short ton) $2,864 $2,846 $2,787 $2,805 $2,784 $2,747 $2,742 Total Tissue ($/short ton) $2,546 $2,482 $2,515 $2,479 $2,464 $2,494 $2,516 Segment net sales ($ in thousands) $235,176 $239,391 $247,039 $238,288 $245,018 $247,912 $253,319 Segment GAAP operating income ($ in thousands) $12,395 $17,032 $15,521 $10,756 $18,390 $18,544 $17,201 Segment GAAP operating margin 5.3% 7.1% 6.3% 4.5% 7.5% 7.5% 6.8% Segment Adjusted EBITDA3 ($ in thousands) $26,609 $29,874 $30,791 $25,591 $32,581 $33,280 $30,934 Segment Adjusted EBITDA margin4 11.3% 12.5% 12.5% 10.7% 13.3% 13.4% 12.2% 17.0%
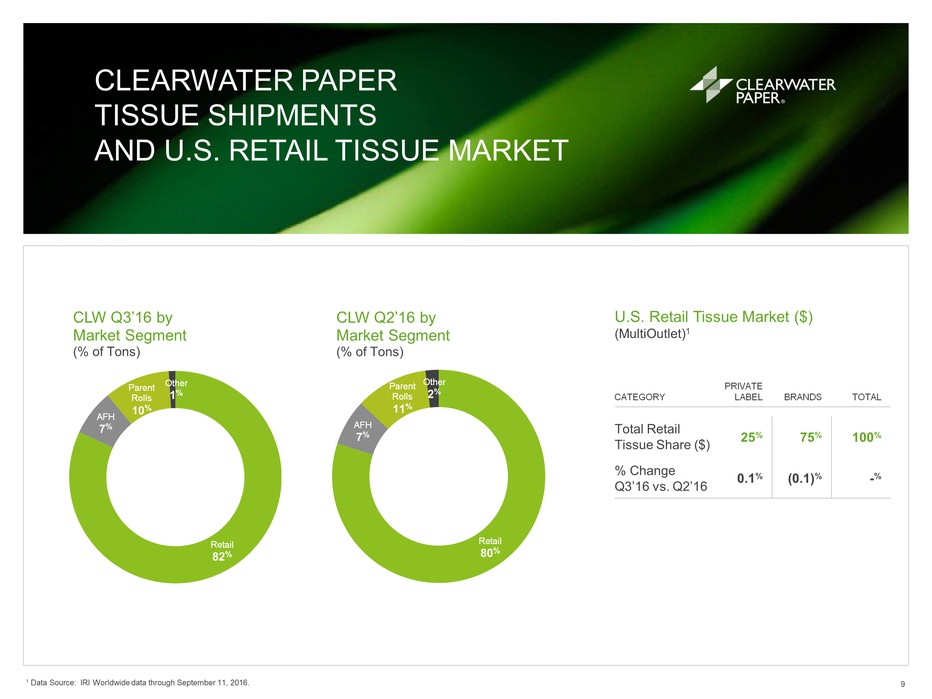
Clearwater Paper Tissue Shipmentsand U.S. Retail Tissue Market 9 U.S. Retail Tissue Market ($) (MultiOutlet)1 Category Private Label BRANDS Total Total RetailTissue Share ($) 25% 75% 100% % ChangeQ3’16 vs. Q2’16 0.1% (0.1)% -% 1 Data Source: IRI Worldwide data through September 11, 2016.
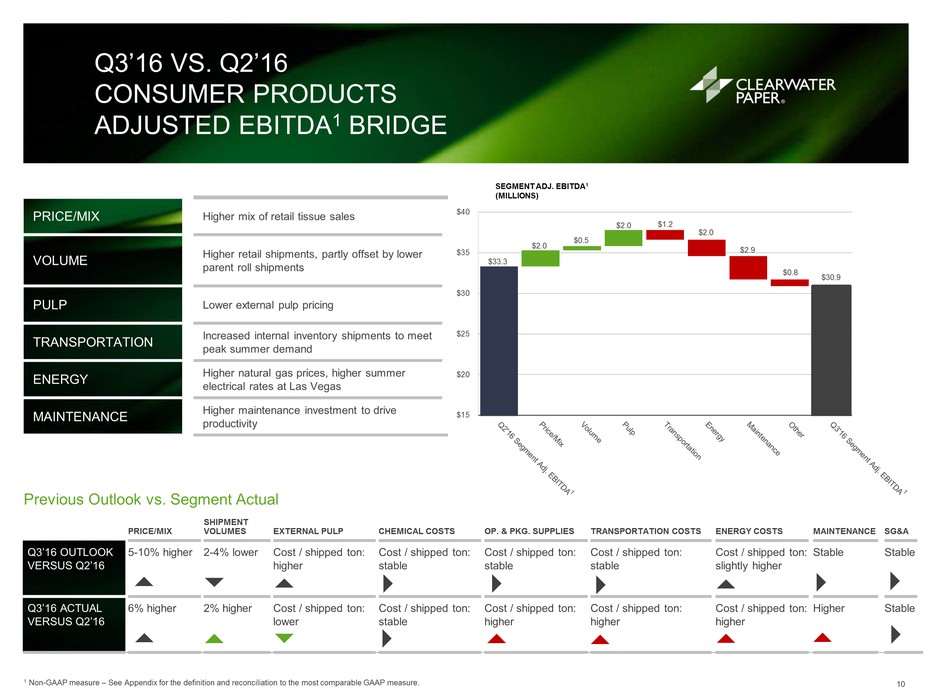
Price/Mix Shipment volumes External Pulp Chemical costs Op. & Pkg. Supplies Transportation costs Energy costs Maintenance SG&A Q3’16 OutlookVersus Q2’16 5-10% higher 2-4% lower Cost / shipped ton: higher Cost / shipped ton: stable Cost / shipped ton: stable Cost / shipped ton: stable Cost / shipped ton: slightly higher Stable Stable Q3’16 ActualVersus Q2’16 6% higher 2% higher Cost / shipped ton: lower Cost / shipped ton: stable Cost / shipped ton: higher Cost / shipped ton: higher Cost / shipped ton: higher Higher Stable Price/mix Higher mix of retail tissue sales volume Higher retail shipments, partly offset by lower parent roll shipments Pulp Lower external pulp pricing Transportation Increased internal inventory shipments to meet peak summer demand Energy Higher natural gas prices, higher summer electrical rates at Las Vegas maintenance Higher maintenance investment to drive productivity Q3’16 vs. Q2’16Consumer Products Adjusted EBITDA1 Bridge 10 1 Non-GAAP measure – See Appendix for the definition and reconciliation to the most comparable GAAP measure. Previous Outlook vs. Segment Actual 1
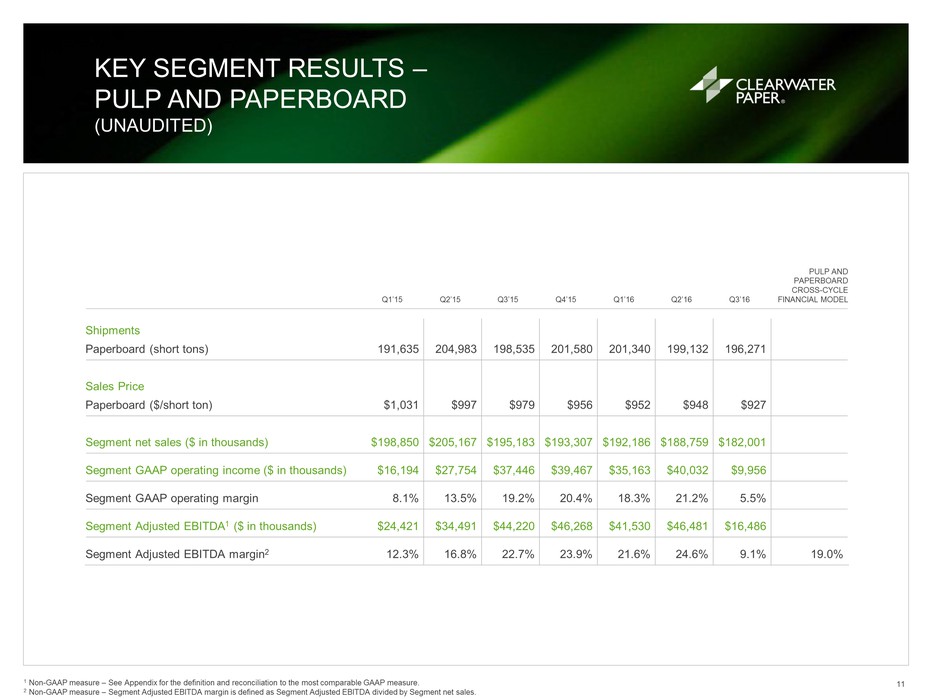
Key Segment Results – Pulp and Paperboard(Unaudited) 11 1 Non-GAAP measure – See Appendix for the definition and reconciliation to the most comparable GAAP measure.2 Non-GAAP measure – Segment Adjusted EBITDA margin is defined as Segment Adjusted EBITDA divided by Segment net sales. Pulp and PaperboardCross-Cycle Financial Model Q1’15 Q2’15 Q3’15 Q4’15 Q1’16 Q2’16 Q3’16 Shipments Paperboard (short tons) 191,635 204,983 198,535 201,580 201,340 199,132 196,271 Sales Price Paperboard ($/short ton) $1,031 $997 $979 $956 $952 $948 $927 Segment net sales ($ in thousands) $198,850 $205,167 $195,183 $193,307 $192,186 $188,759 $182,001 Segment GAAP operating income ($ in thousands) $16,194 $27,754 $37,446 $39,467 $35,163 $40,032 $9,956 Segment GAAP operating margin 8.1% 13.5% 19.2% 20.4% 18.3% 21.2% 5.5% Segment Adjusted EBITDA1 ($ in thousands) $24,421 $34,491 $44,220 $46,268 $41,530 $46,481 $16,486 Segment Adjusted EBITDA margin2 12.3% 16.8% 22.7% 23.9% 21.6% 24.6% 9.1% 19.0%
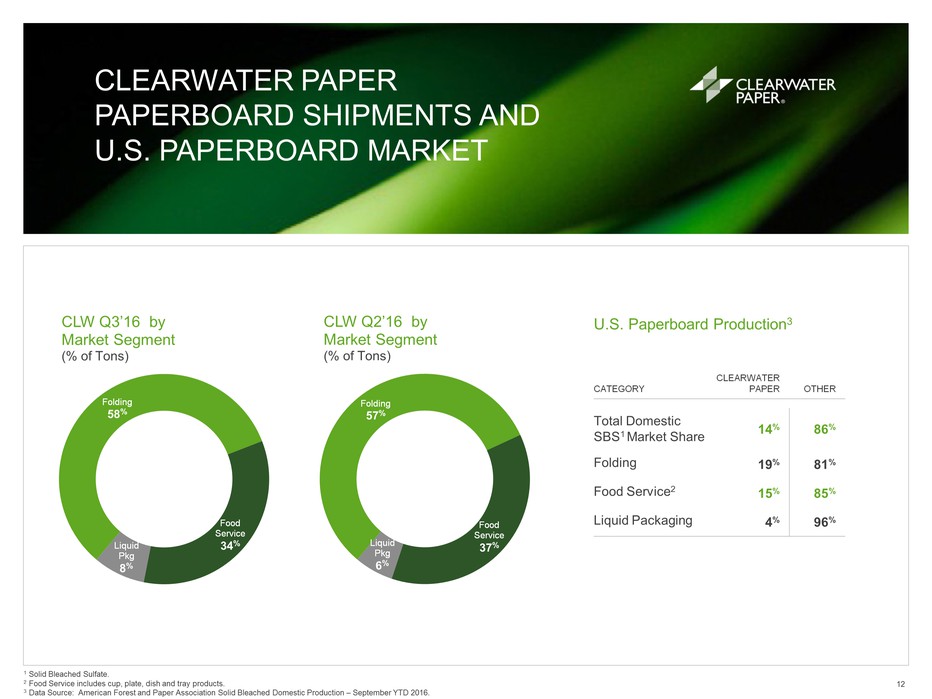
Clearwater Paper Paperboard Shipments and U.S. Paperboard Market 12 U.S. Paperboard Production3 Category Clearwater Paper Other Total Domestic SBS1 Market Share 14% 86% Folding 19% 81% Food Service2 15% 85% Liquid Packaging 4% 96% 1 Solid Bleached Sulfate.2 Food Service includes cup, plate, dish and tray products.3 Data Source: American Forest and Paper Association Solid Bleached Domestic Production – September YTD 2016.
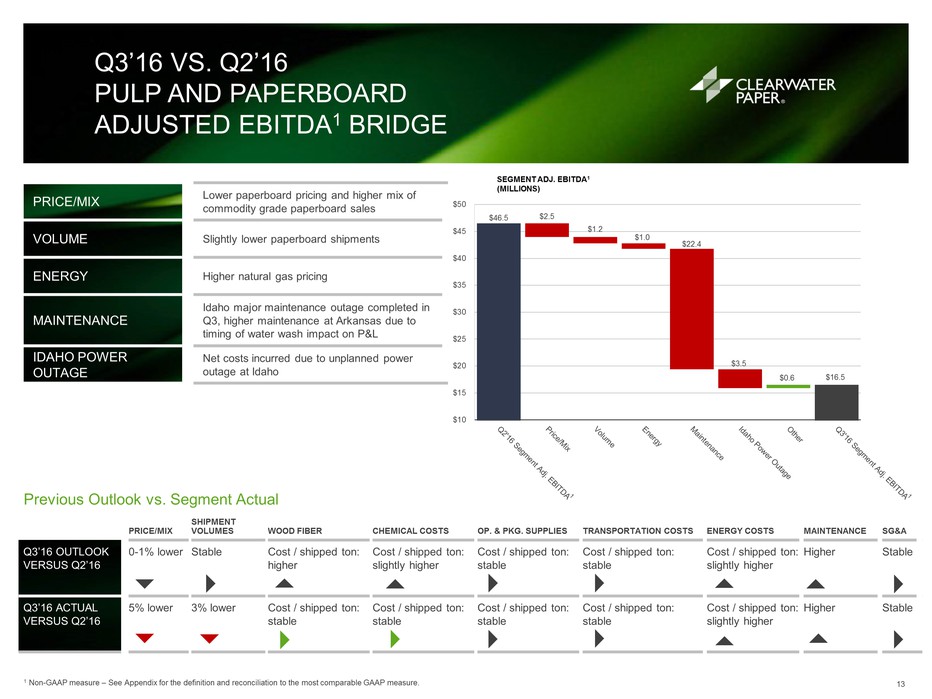
Price/Mix Shipment volumes Wood Fiber Chemical costs Op. & Pkg. Supplies Transportation costs Energy costs Maintenance SG&A Q3’16 OutlookVersus Q2’16 0-1% lower Stable Cost / shipped ton: higher Cost / shipped ton: slightly higher Cost / shipped ton: stable Cost / shipped ton: stable Cost / shipped ton: slightly higher Higher Stable Q3’16 ActualVersus Q2’16 5% lower 3% lower Cost / shipped ton: stable Cost / shipped ton: stable Cost / shipped ton: stable Cost / shipped ton: stable Cost / shipped ton: slightly higher Higher Stable Price/mix Lower paperboard pricing volume Slightly lower paperboard shipments Energy Higher natural gas pricing Maintenance Idaho major maintenance outage completed in Q3, higher maintenance at Arkansas due to timing of water wash impact on P&L Idaho power outage Net costs incurred due to unplanned power outage at Idaho Q3’16 vs. Q2’16 Pulp and Paperboard Adjusted EBITDA1 Bridge 13 1 Non-GAAP measure – See Appendix for the definition and reconciliation to the most comparable GAAP measure. Previous Outlook vs. Segment Actual 1 1
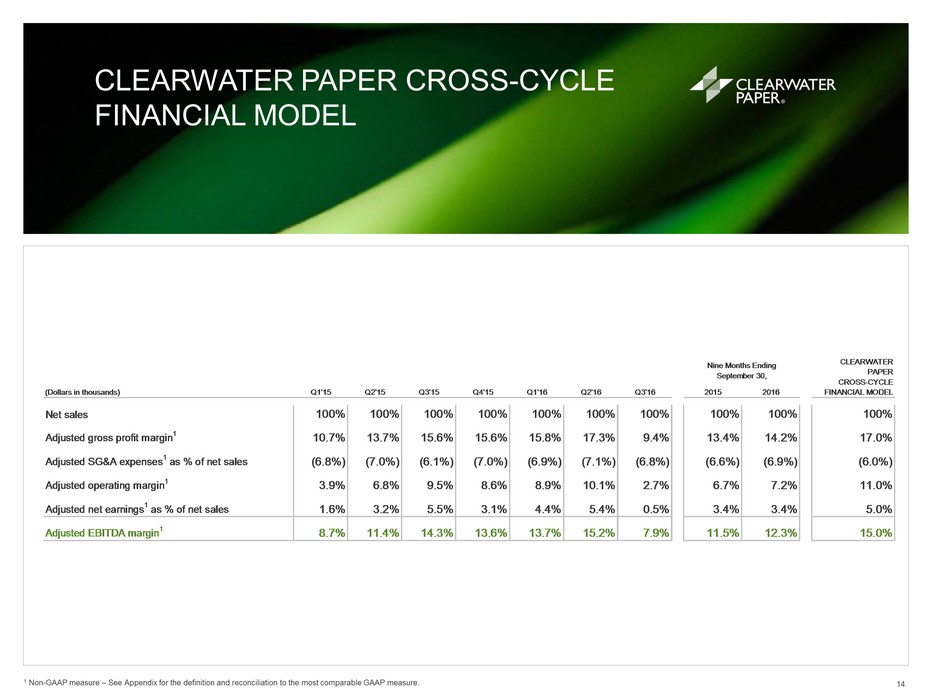
Clearwater Paper Cross-Cycle Financial Model 14 1 Non-GAAP measure – See Appendix for the definition and reconciliation to the most comparable GAAP measure.
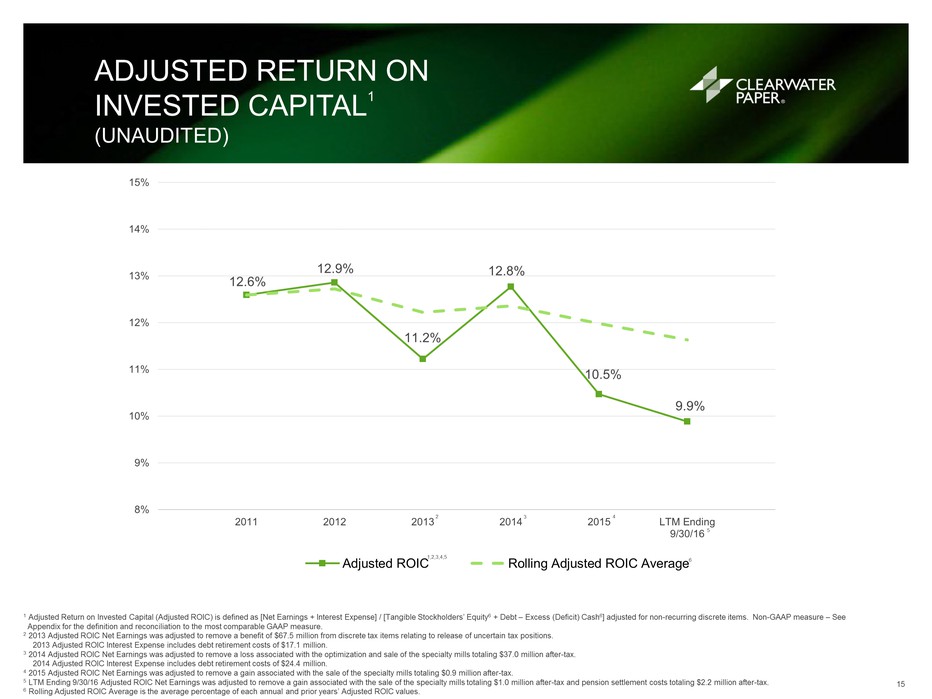
Adjusted Return on Invested Capital1(Unaudited) 15 1 Adjusted Return on Invested Capital (Adjusted ROIC) is defined as [Net Earnings + Interest Expense] / [Tangible Stockholders’ Equity6 + Debt – Excess (Deficit) Cash6] adjusted for non-recurring discrete items. Non-GAAP measure – See Appendix for the definition and reconciliation to the most comparable GAAP measure.2 2013 Adjusted ROIC Net Earnings was adjusted to remove a benefit of $67.5 million from discrete tax items relating to release of uncertain tax positions.2013 Adjusted ROIC Interest Expense includes debt retirement costs of $17.1 million.3 2014 Adjusted ROIC Net Earnings was adjusted to remove a loss associated with the optimization and sale of the specialty mills totaling $37.0 million after-tax.2014 Adjusted ROIC Interest Expense includes debt retirement costs of $24.4 million. 4 2015 Adjusted ROIC Net Earnings was adjusted to remove a gain associated with the sale of the specialty mills totaling $0.9 million after-tax.5 LTM Ending 9/30/16 Adjusted ROIC Net Earnings was adjusted to remove a gain associated with the sale of the specialty mills totaling $1.0 million after-tax and pension settlement costs totaling $2.2 million after-tax.6 Rolling Adjusted ROIC Average is the average percentage of each annual and prior years’ Adjusted ROIC values.
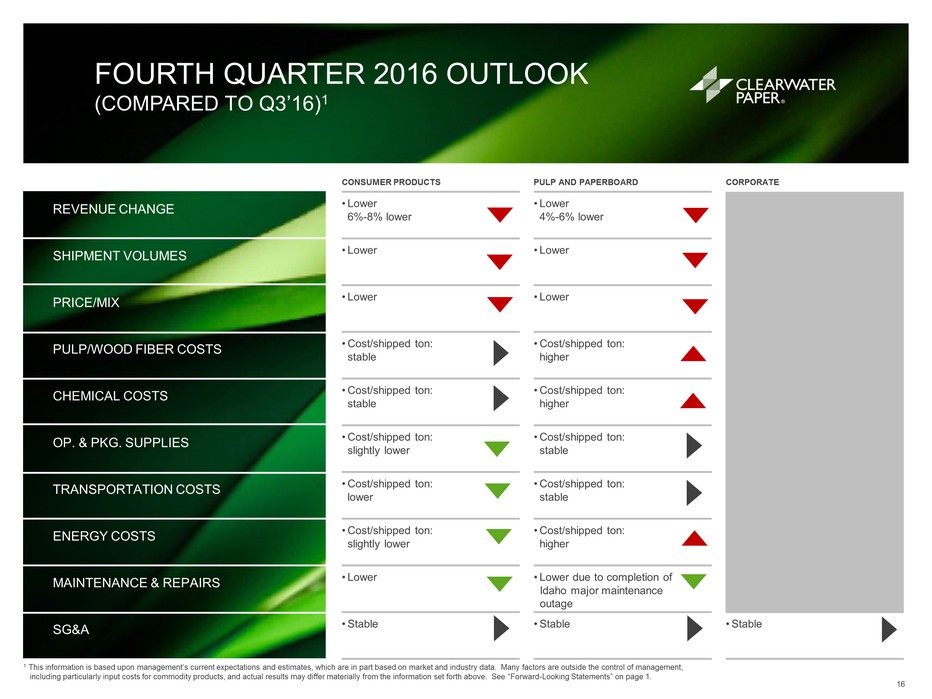
fourth quarter 2016 Outlook(Compared to Q3’16)1 16 Consumer products Pulp and Paperboard Corporate Revenue change Lower6%-8% lower Lower4%-6% lower Shipment volumes Lower Lower Price/mix Lower Lower Pulp/Wood Fiber Costs Cost/shipped ton:stable Cost/shipped ton:higher Chemical Costs Cost/shipped ton:stable Cost/shipped ton:higher Op. & Pkg. Supplies Cost/shipped ton:slightly lower Cost/shipped ton:stable Transportation Costs Cost/shipped ton:lower Cost/shipped ton:stable Energy Costs Cost/shipped ton:slightly lower Cost/shipped ton:higher Maintenance & Repairs Lower Lower due to completion of Idaho major maintenance outage SG&A Stable Stable Stable 1 This information is based upon management’s current expectations and estimates, which are in part based on market and industry data. Many factors are outside the control of management, including particularly input costs for commodity products, and actual results may differ materially from the information set forth above. See “Forward-Looking Statements” on page 1.
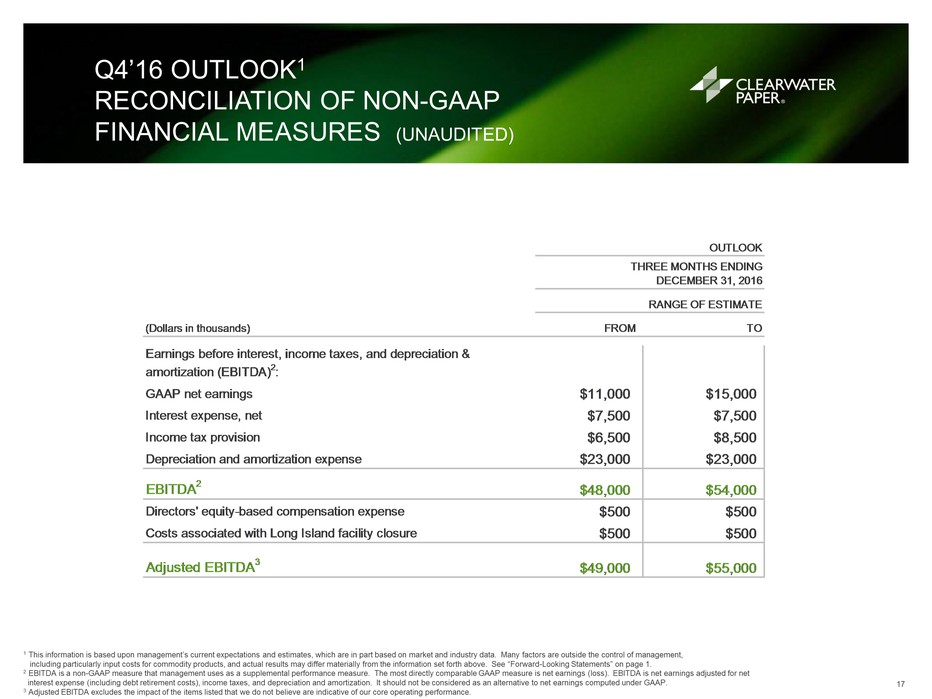
Q4’16 Outlook1Reconciliation of Non-GAAP Financial Measures (Unaudited) 17 1 This information is based upon management’s current expectations and estimates, which are in part based on market and industry data. Many factors are outside the control of management, including particularly input costs for commodity products, and actual results may differ materially from the information set forth above. See “Forward-Looking Statements” on page 1.2 EBITDA is a non-GAAP measure that management uses as a supplemental performance measure. The most directly comparable GAAP measure is net earnings (loss). EBITDA is net earnings adjusted for net interest expense (including debt retirement costs), income taxes, and depreciation and amortization. It should not be considered as an alternative to net earnings computed under GAAP.3 Adjusted EBITDA excludes the impact of the items listed that we do not believe are indicative of our core operating performance.
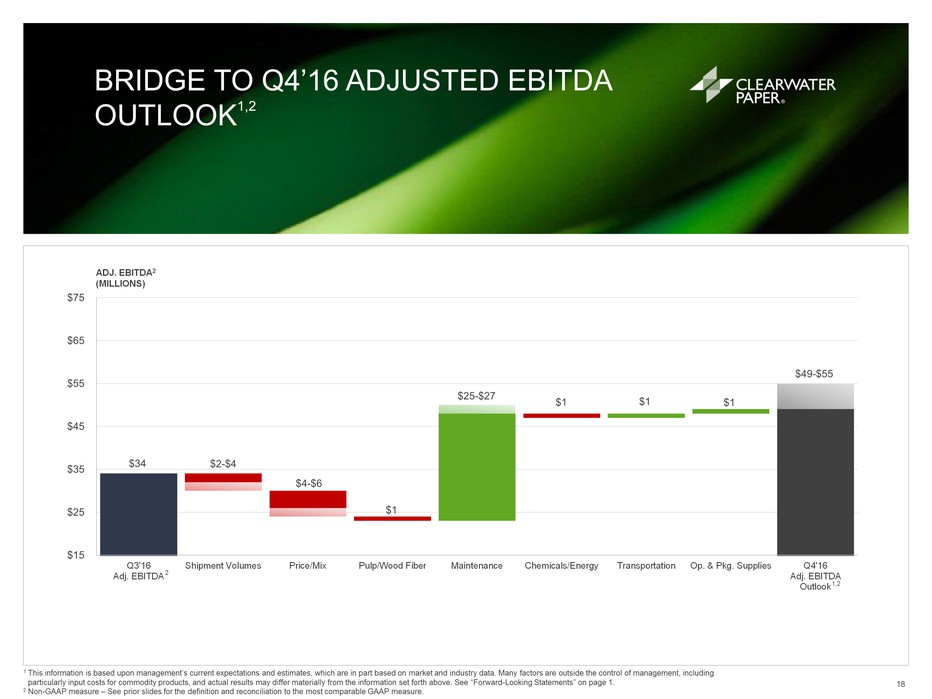
BRIDGE TO Q4’16 ADJUSTED EBITDA OUTLOOK1,2 18 1 This information is based upon management’s current expectations and estimates, which are in part based on market and industry data. Many factors are outside the control of management, including particularly input costs for commodity products, and actual results may differ materially from the information set forth above. See “Forward-Looking Statements” on page 1.2 Non-GAAP measure – See prior slides for the definition and reconciliation to the most comparable GAAP measure.
Appendix 19
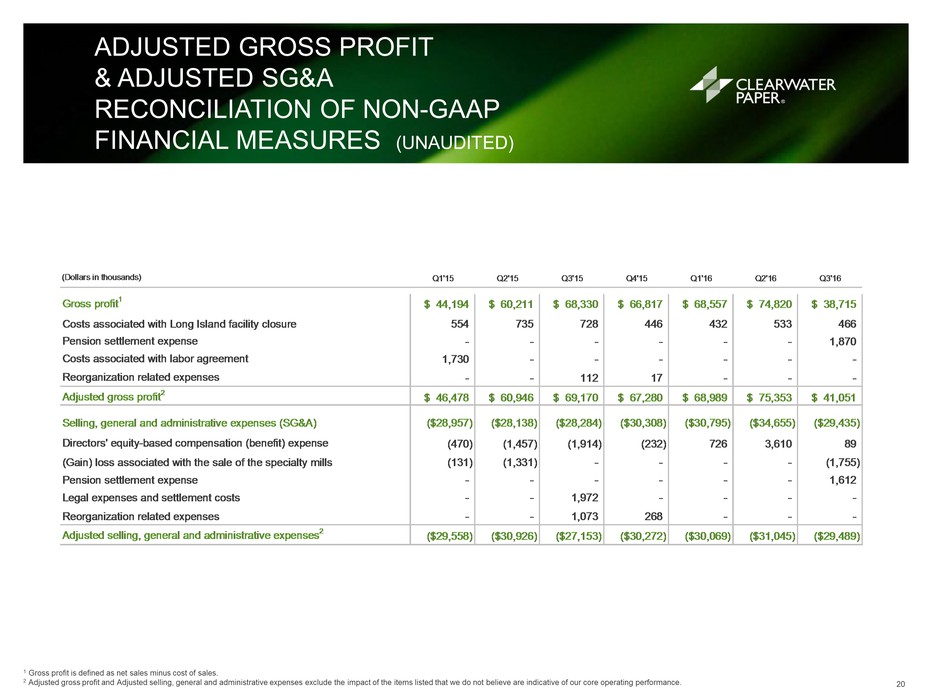
Adjusted Gross Profit& Adjusted SG&AReconciliation of Non-GAAP Financial Measures (Unaudited) 20 1 Gross profit is defined as net sales minus cost of sales.2 Adjusted gross profit and Adjusted selling, general and administrative expenses exclude the impact of the items listed that we do not believe are indicative of our core operating performance.
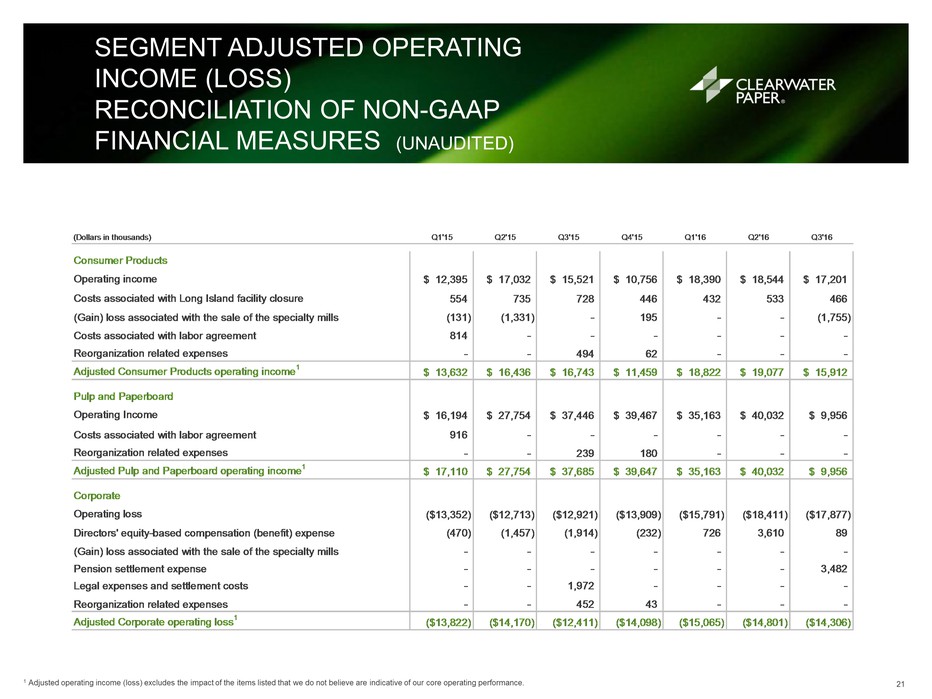
Segment Adjusted Operating Income (Loss)Reconciliation of Non-GAAP Financial Measures (Unaudited) 21 1 Adjusted operating income (loss) excludes the impact of the items listed that we do not believe are indicative of our core operating performance.
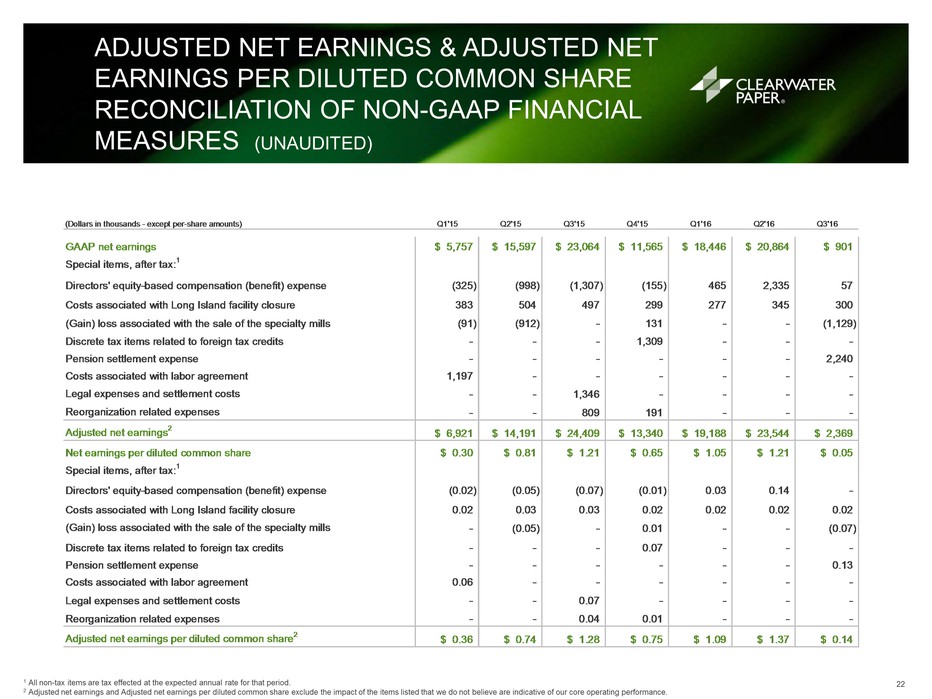
Adjusted Net Earnings & Adjusted Net Earnings per Diluted common shareReconciliation of Non-GAAP Financial Measures (Unaudited) 22 1 All non-tax items are tax effected at the expected annual rate for that period.2 Adjusted net earnings and Adjusted net earnings per diluted common share exclude the impact of the items listed that we do not believe are indicative of our core operating performance.
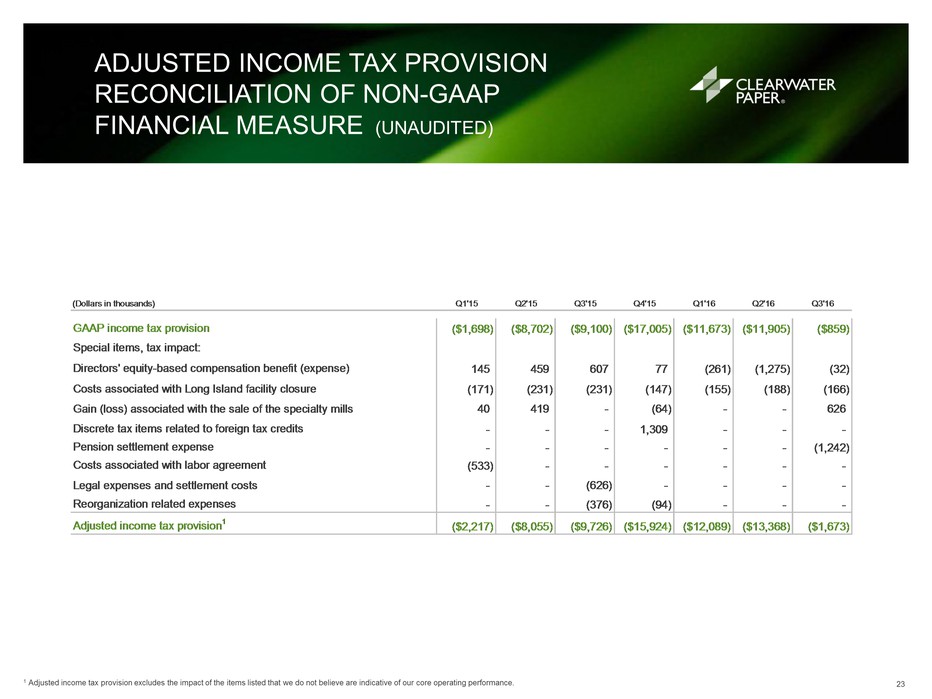
Adjusted Income Tax ProvisionReconciliation of Non-GAAP Financial Measure (Unaudited) 23 1 Adjusted income tax provision excludes the impact of the items listed that we do not believe are indicative of our core operating performance.
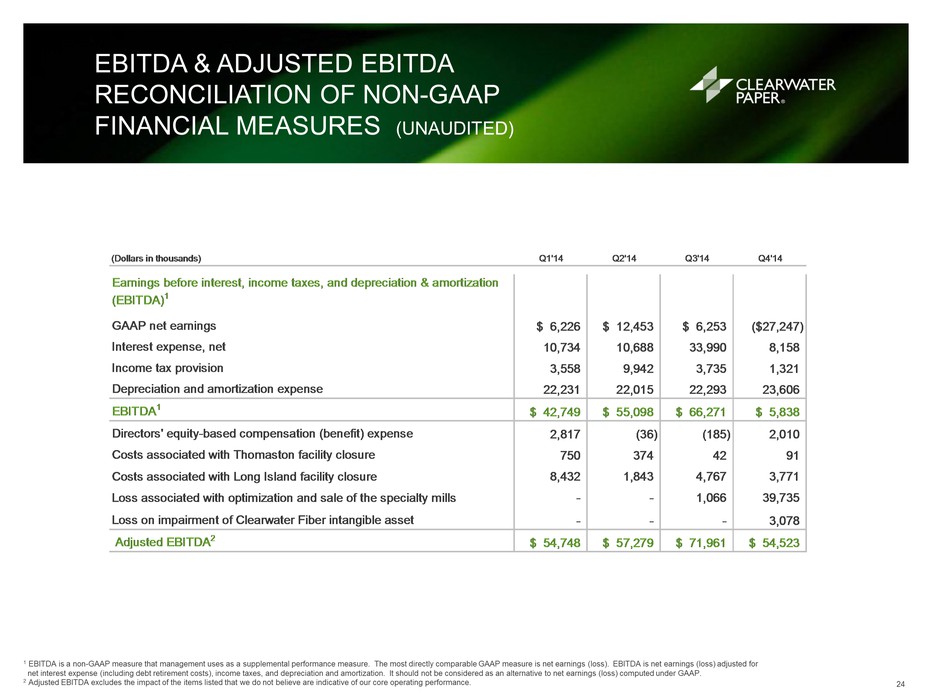
EBITDA & Adjusted EBITDA Reconciliation of Non-GAAP Financial Measures (Unaudited) 24 1 EBITDA is a non-GAAP measure that management uses as a supplemental performance measure. The most directly comparable GAAP measure is net earnings (loss). EBITDA is net earnings (loss) adjusted for net interest expense (including debt retirement costs), income taxes, and depreciation and amortization. It should not be considered as an alternative to net earnings (loss) computed under GAAP.2 Adjusted EBITDA excludes the impact of the items listed that we do not believe are indicative of our core operating performance.
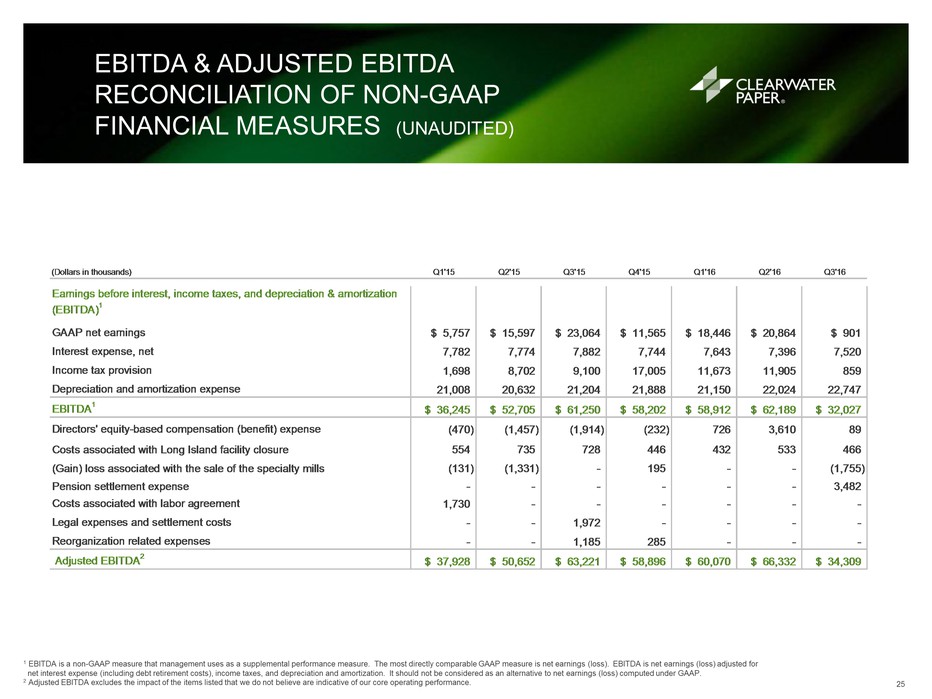
EBITDA & Adjusted EBITDA Reconciliation of Non-GAAP Financial Measures (Unaudited) 25 1 EBITDA is a non-GAAP measure that management uses as a supplemental performance measure. The most directly comparable GAAP measure is net earnings (loss). EBITDA is net earnings (loss) adjusted for net interest expense (including debt retirement costs), income taxes, and depreciation and amortization. It should not be considered as an alternative to net earnings (loss) computed under GAAP.2 Adjusted EBITDA excludes the impact of the items listed that we do not believe are indicative of our core operating performance.
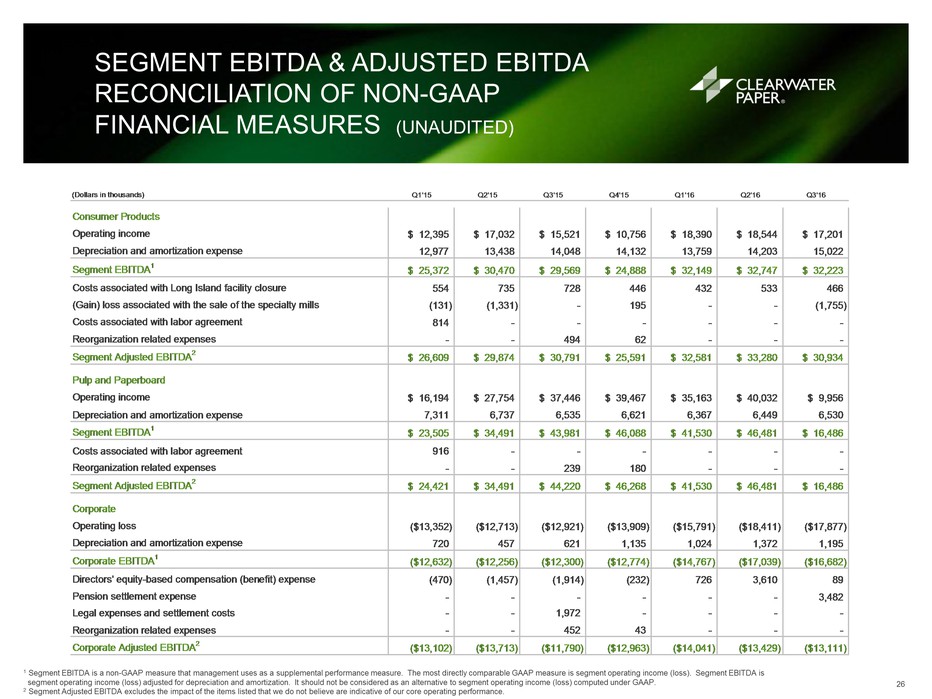
Segment EBITDA & Adjusted EBITDA Reconciliation of Non-GAAPFinancial Measures (Unaudited) 26 1 Segment EBITDA is a non-GAAP measure that management uses as a supplemental performance measure. The most directly comparable GAAP measure is segment operating income (loss). Segment EBITDA is segment operating income (loss) adjusted for depreciation and amortization. It should not be considered as an alternative to segment operating income (loss) computed under GAAP. 2 Segment Adjusted EBITDA excludes the impact of the items listed that we do not believe are indicative of our core operating performance.
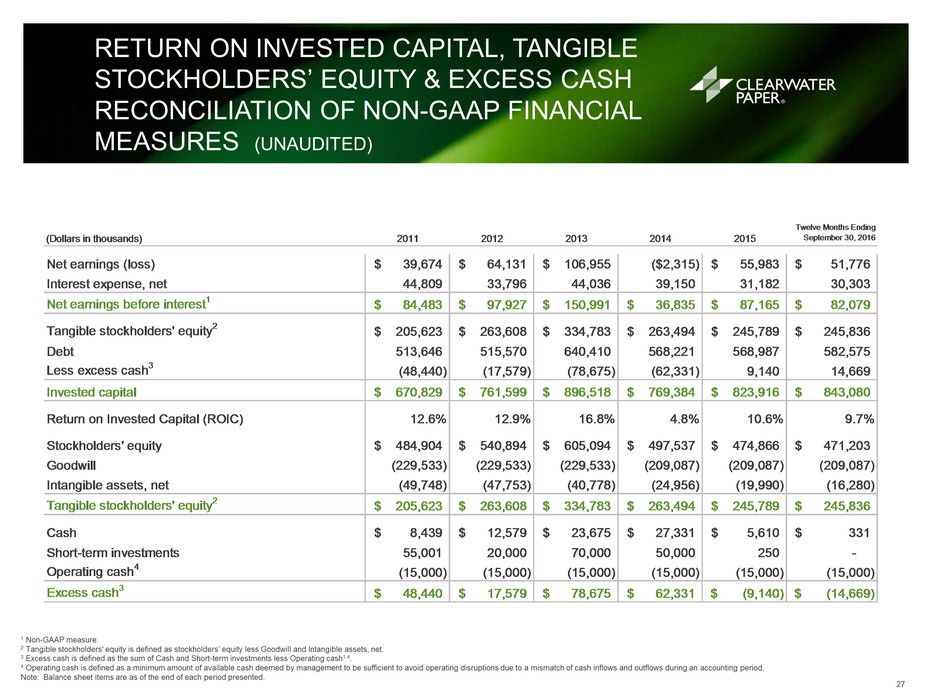
Return on Invested Capital, Tangible Stockholders’ Equity & Excess Cash Reconciliation of Non-GAAP Financial Measures (Unaudited) 27 1 Non-GAAP measure.2 Tangible stockholders' equity is defined as stockholders’ equity less Goodwill and Intangible assets, net.3 Excess cash is defined as the sum of Cash and Short-term investments less Operating cash1,4.4 Operating cash is defined as a minimum amount of available cash deemed by management to be sufficient to avoid operating disruptions due to a mismatch of cash inflows and outflows during an accounting period.Note: Balance sheet items are as of the end of each period presented.
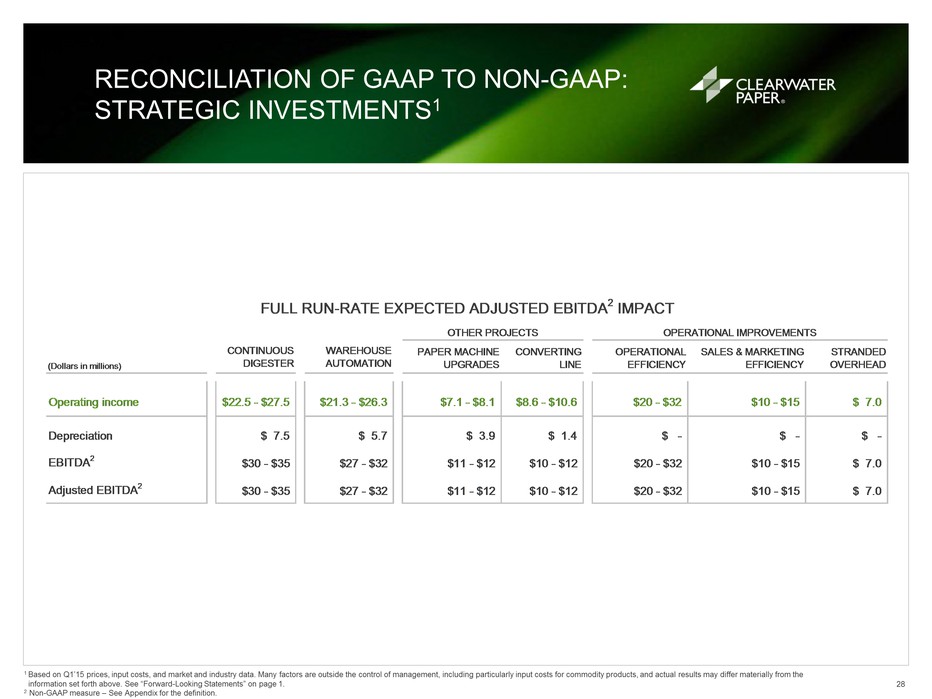
Reconciliation of GAAP to Non-GAAP: Strategic investments1 28 1 Based on Q1’15 prices, input costs, and market and industry data. Many factors are outside the control of management, including particularly input costs for commodity products, and actual results may differ materially from the information set forth above. See “Forward-Looking Statements” on page 1.2 Non-GAAP measure – See Appendix for the definition.
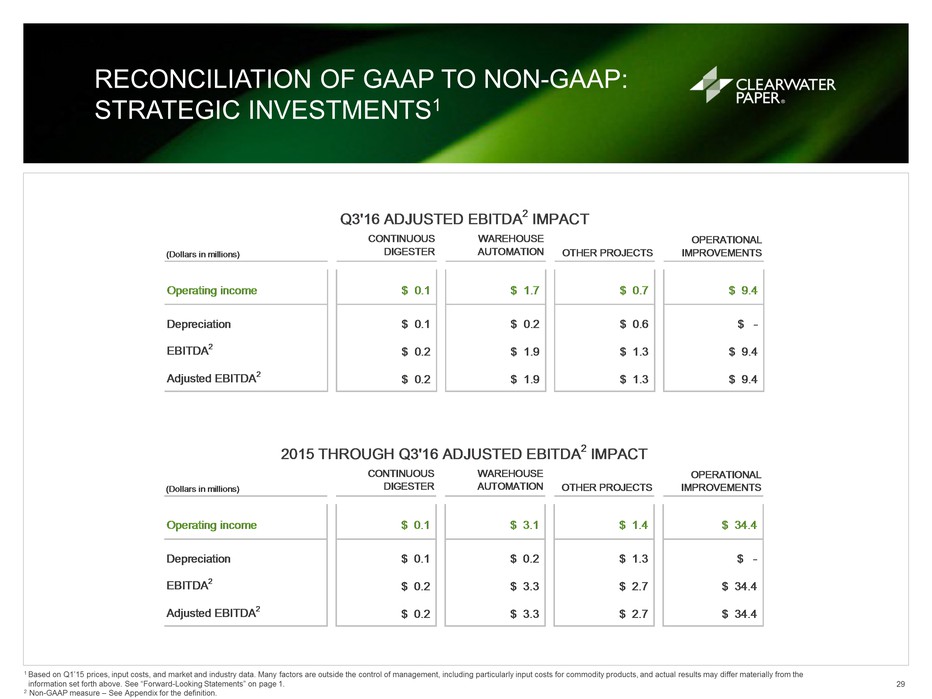
Reconciliation of GAAP to Non-GAAP: Strategic investments1 29 1 Based on Q1’15 prices, input costs, and market and industry data. Many factors are outside the control of management, including particularly input costs for commodity products, and actual results may differ materially from the information set forth above. See “Forward-Looking Statements” on page 1.2 Non-GAAP measure – See Appendix for the definition.
For more information:www.clearwaterpaper.com 30
GPOM71+64^JWQ_\ B:Y)Y9E_P!DM/\ XJAOVZ_A>/\ FG^H_P#@':?_ !5;O 9>
MW_OD?N9G*C@V_P#>H_
*208=3[!A7T-^PU&J_M)>&R.#]GO./\ MW>O
M7/'O[9GPY\5^!O$&C6/@>_M+S4=/GM()WM;4+&[QLJL2&) !(/'-?/\ ^SS\
M0;'X0_%/2?%6HVES>VEG#/&T5IM\QB\108W$#J?6N=+#8'&490K*<;IMV:M9
MG(I4<+BZ3A54XW3;2:MJ>@_\% E)^/D>!D?V+:_^AS5\XPQ$)SW'3K7L?[2G
MQ4TSXV?$5/$6F6-W8VXL(;7RKS;OW(SDGY21CYQ^5>4)'L<]A7FYGB(5L95J
M4G>+>C^XYL?B(U,34G"6C;L?H#^R/\7+/XX_#34/A_XP":EJ=A:FWD2YY-]8
MD;0Q]67A6/7[C=37QU\;_A!=_!3X@ZAX>N-\MF#Y]A=N/^/BW8G8W^\,%6]U
M/J*S/AUXVU+X:^,]*\2Z2^V\L90^PG"RH>'C;_99<@_7/:O>_P!HK]HWP+\>
MO!T%K'H&KV&OV$GFV-Y,(2BYP)(W(?.QAZ#JJGUKU*N-H9CERCB)J-:GLW]I
M=O7]4NYW3QM+&X*U6:56GLW]I=MM_P!;=SY4E@##/K3!9#EL9XK56UWMCJ*?
MY0&5Q@U\G[2Q\Q*HWNS[V^+2$_L%:>N.?[$TGC_@<%? ,=KS_=S7U#XT_:=T
M#Q-^SG;?#VWTK4HM3BT^RM#=2>7Y&Z%HRQX;=@[#CCN*^;&D2,?-@>Y->]GF
M+I8JK2="7,E"*=NZW1[N;8JE7J4Y497M"*?JMR$6V,Y;\A79_!KX=-\3/B=X
M?\.A2\%U