Exhibit 99.2
Clearwater Paper
Corporation First Quarter 2014 Supplemental Information Linda Massman
President, Chief Executive Officer and Director John Hertz Senior Vice
President, Finance and Chief Financial Officer
This supplemental information contains, in addition to historical information, certain forward-looking statements within the meaning of the Private Securities Litigation Reform Act of 1995, including statements regarding outlook for Q2 2014, production, product volumes shipped, product pricing and sales mix, pulp costs, wood fiber costs and supply, chemical costs, operational and packaging supply costs, transportation costs, energy costs including natural gas, cost and timing of major maintenance and repairs, selling, general, and administrative expenses, corporate expenses, cost reductions, segment and consolidated EBITDA margins, and our pro forma quarterly EBITDA run rate. These forward-looking statements are based on management’s current expectations, estimates, assumptions and projections that are subject to change. Our actual results of operations may differ materially from those expressed or implied by the forward-looking statements contained in this presentation. Important factors that could cause or contribute to such differences include the risks and uncertainties described from time to time in the company's public filings with the Securities and Exchange Commission, as well as the following: • customer acceptance, timing and quantity of purchases of our new through-air-dried, or TAD, products; • competitive pricing pressures for our products, including as a result of increased capacity as additional manufacturing facilities are operated by our competitors; • difficulties with the optimization and realization of the benefits expected from our new TAD paper machine and converting lines in Shelby, North Carolina; • the loss of or changes in prices in regards to a significant customer; • manufacturing or operating disruptions, including equipment malfunction and damage to our manufacturing facilities caused by fire or weather-related events and IT system failures; • changes in the cost and availability of wood fiber and wood pulp;• changes in transportation costs and disruptions in transportation services; • labor disruptions; • changes in costs for and availability of packaging supplies, chemicals, energy and maintenance and repairs; • changes in customer product preferences and competitors' product offerings; • changes in expenses and required contributions associated with our pension plans; • environmental liabilities or expenditures; • changes in the U.S. and international economies and in general economic conditions in the regions and industries in which we operate; • increased supply and pricing pressures resulting from increasing Asian paper production capabilities; • cyclical industry conditions; • reliance on a limited number of third-party suppliers for raw materials; • inability to successfully implement our expansion strategies; • inability to fund our debt obligations; • restrictions on our business from debt covenants and terms; • changes in laws, regulations or industry standards affecting our business; and • our qualification to retain, or ability to utilize, tax credits associated with alternative fuels or cellulosic biofuels and the tax treatment associated with receipt of such credits. Forward-looking statements contained in this presentation present management’s views only as of the date of this presentation. We undertake no obligation to publicly update forwardlooking statements, whether as a result of new information, future events or otherwise. 1 Forward-Looking Statements 1
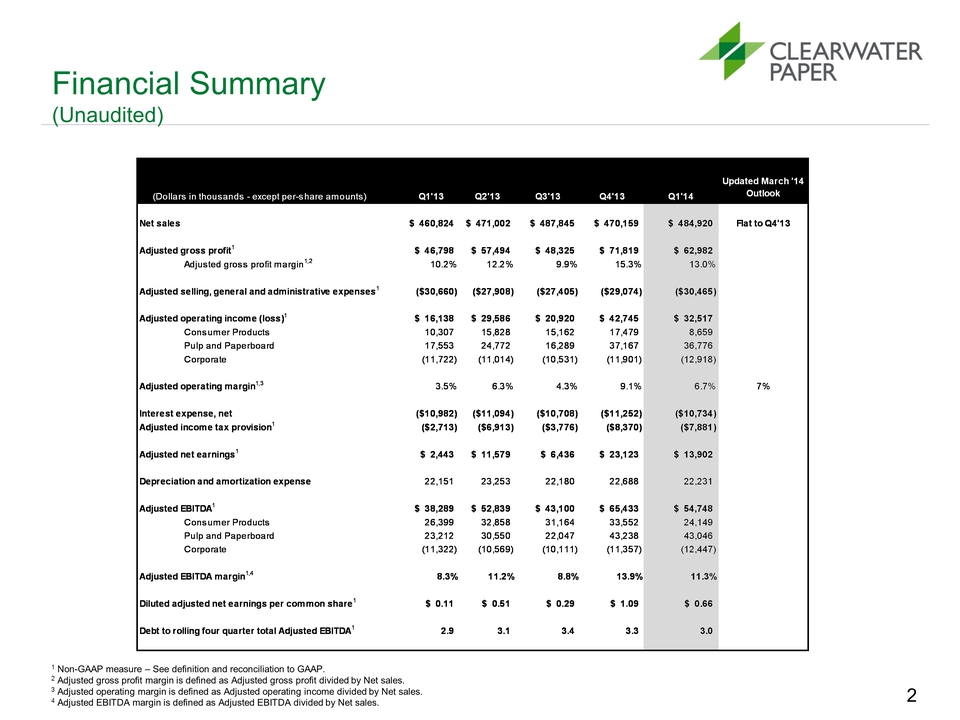
Financial Summary (Unaudited) 1 Non-GAAP measure – See definition and reconciliation to GAAP. 2 Adjusted gross profit margin is defined as Adjusted gross profit divided by Net sales. 3 Adjusted operating margin is defined as Adjusted operating income divided by Net sales. 4 Adjusted EBITDA margin is defined as Adjusted EBITDA divided by Net sales. 2 Q1'13 Q2'13 Q3'13 Q4'13 Q1'14 Net sales $ 460,824 $ 471,002 $ 487,845 $ 470,159 $ 484,920 Flat to Q4'13 Adjusted gross profit1 $ 46,798 $ 57,494 $ 48,325 $ 71,819 $ 62,982 Adjusted gross profit margin1,2 10.2% 12.2% 9.9% 15.3% 13.0% Adjusted selling, general and administrative expenses1 ($30,660) ($27,908) ($27,405) ($29,074) ($30,465) Adjusted operating income (loss)1 $ 16,138 $ 29,586 $ 20,920 $ 42,745 $ 32,517 Consumer Products 10,307 15,828 15,162 17,479 8,659 Pulp and Paperboard 17,553 24,772 16,289 37,167 36,776 Corporate (11,722) (11,014) (10,531) (11,901) (12,918) Adjusted operating margin1,3 3.5% 6.3% 4.3% 9.1% 6.7% 7% Interest expense, net ($10,982) ($11,094) ($10,708) ($11,252) ($10,734) Adjusted income tax provision1 ($2,713) ($6,913) ($3,776) ($8,370) ($7,881) Adjusted net earnings1 $ 2,443 $ 11,579 $ 6,436 $ 23,123 $ 13,902 Depreciation and amortization expense 22,151 23,253 22,180 22,688 22,231 Adjusted EBITDA1 $ 38,289 $ 52,839 $ 43,100 $ 65,433 $ 54,748 Consumer Products 26,399 32,858 31,164 33,552 24,149 Pulp and Paperboard 23,212 30,550 22,047 43,238 43,046 Corporate (11,322) (10,569) (10,111) (11,357) (12,447) Adjusted EBITDA margin1,4 8.3% 11.2% 8.8% 13.9% 11.3% Diluted adjusted net earnings per common share1 $ 0.11 $ 0.51 $ 0.29 $ 1.09 $ 0.66 Debt to rolling four quarter total Adjusted EBITDA1 2.9 3.1 3.4 3.3 3.0 (Dollars in thousands - except per-share amounts) Updated March '14 Outlook 2
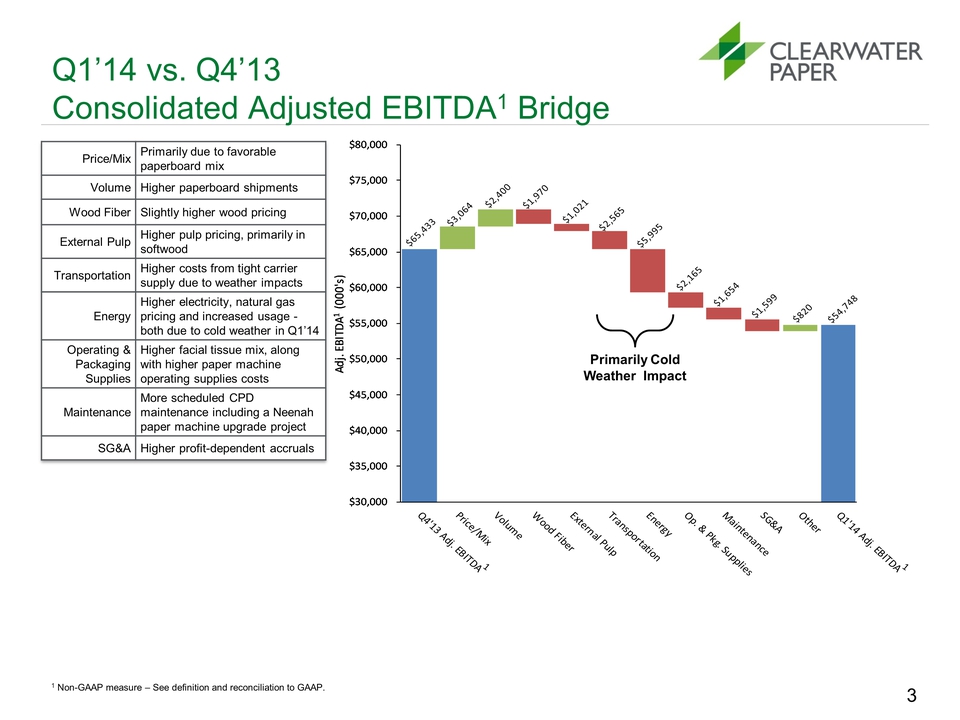
$30,000 $35,000 $40,000 $45,000 $50,000 $55,000 $60,000 $65,000 $70,000 $75,000 $80,000 Adj. EBITDA1 (000's) 3 Q1’14 vs. Q4’13 Consolidated Adjusted EBITDA1 Bridge Price/Mix Primarily due to favorable paperboard mix Volume Higher paperboard shipments Wood Fiber Slightly higher wood pricing External Pulp Higher pulp pricing, primarily in softwood Transportation Higher costs from tight carrier supply due to weather impacts Energy Higher electricity, natural gas pricing and increased usage -both due to cold weather in Q1’14 Operating & Packaging Supplies Higher facial tissue mix, along with higher paper machine operating supplies costs Maintenance More scheduled CPD maintenance including a Neenah paper machine upgrade project SG&A Higher profit-dependent accruals 1 Non-GAAP measure – See definition and reconciliation to GAAP. Primarily Cold Weather Impact 3
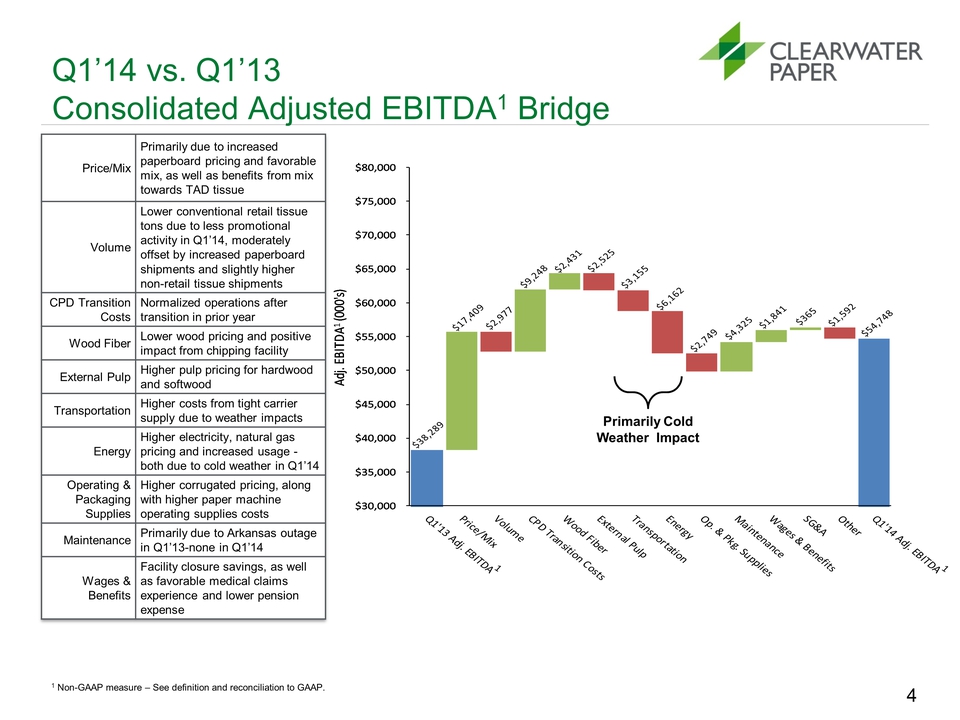
$30,000 $35,000 $40,000 $45,000 $50,000 $55,000 $60,000 $65,000 $70,000 $75,000 $80,000 Adj. EBITDA1 (000's) Q1’14 vs. Q1’13 Consolidated Adjusted EBITDA1 Bridge 1 Non-GAAP measure – See definition and reconciliation to GAAP. Price/Mix Primarily due to increased paperboard pricing and favorable mix, as well as benefits from mix towards TAD tissue Volume Lower conventional retail tissue tons due to less promotional activity in Q1’14, moderately offset by increased paperboard shipments and slightly higher non-retail tissue shipments CPD Transition Costs Normalized operations after transition in prior year Wood Fiber Lower wood pricing and positive impact from chipping facility External Pulp Higher pulp pricing for hardwood and softwood Transportation Higher costs from tight carrier supply due to weather impacts Energy Higher electricity, natural gas pricing and increased usage - both due to cold weather in Q1’14 Operating & Packaging Supplies Higher corrugated pricing, along with higher paper machine operating supplies costs Maintenance Primarily due to Arkansas outage in Q1’13-none in Q1’14 Wages & Benefits Facility closure savings, as well as favorable medical claims experience and lower pension expense 4 Primarily Cold Weather Impact 4
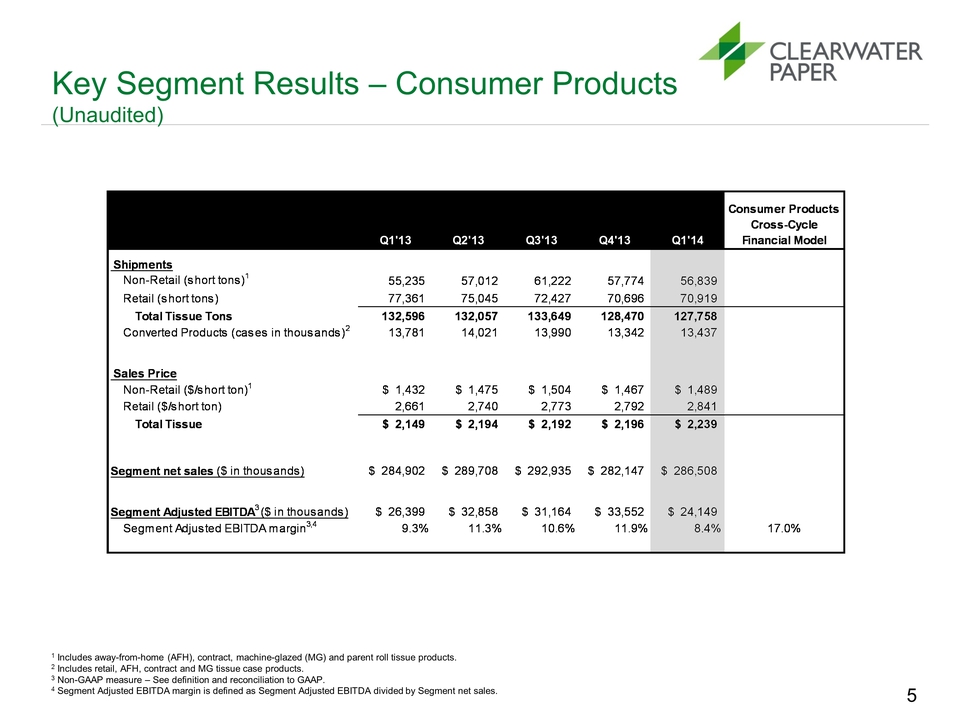
Key Segment Results – Consumer Products (Unaudited) 5 1 Includes away-from-home (AFH), contract, machine-glazed (MG) and parent roll tissue products. 2 Includes retail, AFH, contract and MG tissue case products. 3 Non-GAAP measure – See definition and reconciliation to GAAP. 4 Segment Adjusted EBITDA margin is defined as Segment Adjusted EBITDA divided by Segment net sales. Q1'13 Q2'13 Q3'13 Q4'13 Q1'14 Shipments Non-Retail (short tons)1 55,235 57,012 61,222 57,774 56,839 Retail (short tons) 77,361 75,045 72,427 70,696 70,919 Total Tissue Tons 132,596 132,057 133,649 128,470 127,758 Converted Products (cases in thousands)2 13,781 14,021 13,990 13,342 13,437 Sales Price Non-Retail ($/short ton)1 $ 1,432 $ 1,475 $ 1,504 $ 1,467 $ 1,489 Retail ($/short ton) 2,661 2,740 2,773 2,792 2,841 Total Tissue $ 2,149 $ 2,194 $ 2,192 $ 2,196 $ 2,239 Segment net sales ($ in thousands) $ 284,902 $ 289,708 $ 292,935 $ 282,147 $ 286,508 Segment Adjusted EBITDA3 ($ in thousands) $ 26,399 $ 32,858 $ 31,164 $ 33,552 $ 24,149 Segment Adjusted EBITDA margin3,4 9.3% 11.3% 10.6% 11.9% 8.4% 17.0% Consumer Products Cross-Cycle Financial Model 5
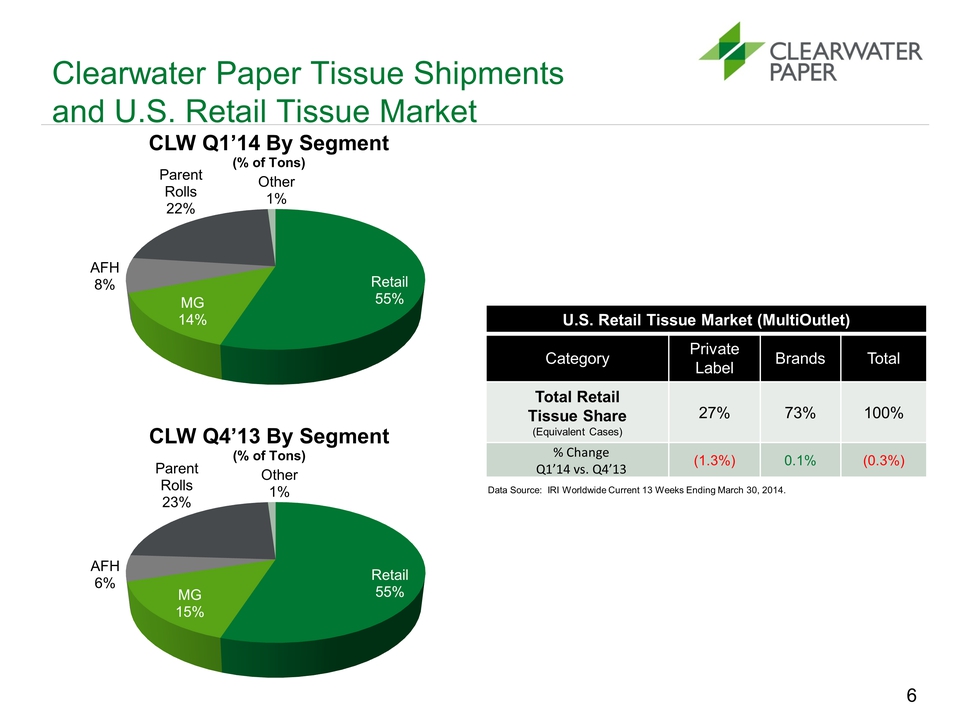
Retail 55% MG 15% AFH 6% Parent Rolls 23% Other 1% CLW Q4’13 By Segment (% of Tons) Clearwater Paper Tissue Shipments and U.S. Retail Tissue Market Retail 55% MG 14% AFH 8% Parent Rolls 22% Other 1% CLW Q1’14 By Segment (% of Tons) U.S. Retail Tissue Market (MultiOutlet) Category Private Label Brands Total Total Retail Tissue Share (Equivalent Cases) 27% 73% 100% % Change Q1’14 vs. Q4’13 (1.3%) 0.1% (0.3%) Data Source: IRI Worldwide Current 13 Weeks Ending March 30, 2014. 6
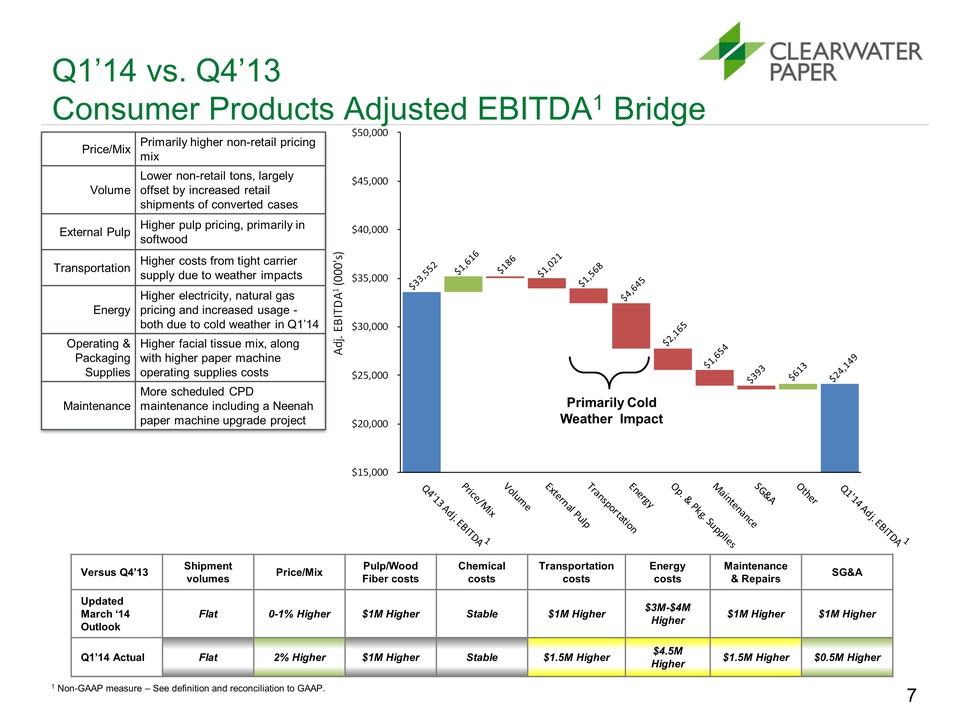
$15,000 $20,000 $25,000 $30,000 $35,000 $40,000 $45,000 $50,000 Adj. EBITDA1 (000's) 7 Q1’14 vs. Q4’13 Consumer Products Adjusted EBITDA1 Bridge Price/Mix Primarily higher non-retail pricing mix Volume Lower non-retail tons, largely offset by increased retail shipments of converted cases External Pulp Higher pulp pricing, primarily in softwood Transportation Higher costs from tight carrier supply due to weather impacts Energy Higher electricity, natural gas pricing and increased usage - both due to cold weather in Q1’14 Operating & Packaging Supplies Higher facial tissue mix, along with higher paper machine operating supplies costs Maintenance More scheduled CPD maintenance including a Neenah paper machine upgrade project 1 Non-GAAP measure – See definition and reconciliation to GAAP. Primarily Cold Weather Impact Versus Q4’13 Shipment volumes Price/Mix Pulp/Wood Fiber costs Chemical costs Transportation costs Energy costs Maintenance & Repairs SG&A Updated March ’14 Outlook Flat 0-1% Higher $1M Higher Stable $1M Higher $3M-$4M Higher $1M Higher $1M Higher Q1’14 Actual Flat 2% Higher $1M Higher Stable $1.5M Higher $4.5M Higher $1.5M Higher $0.5M Higher 7
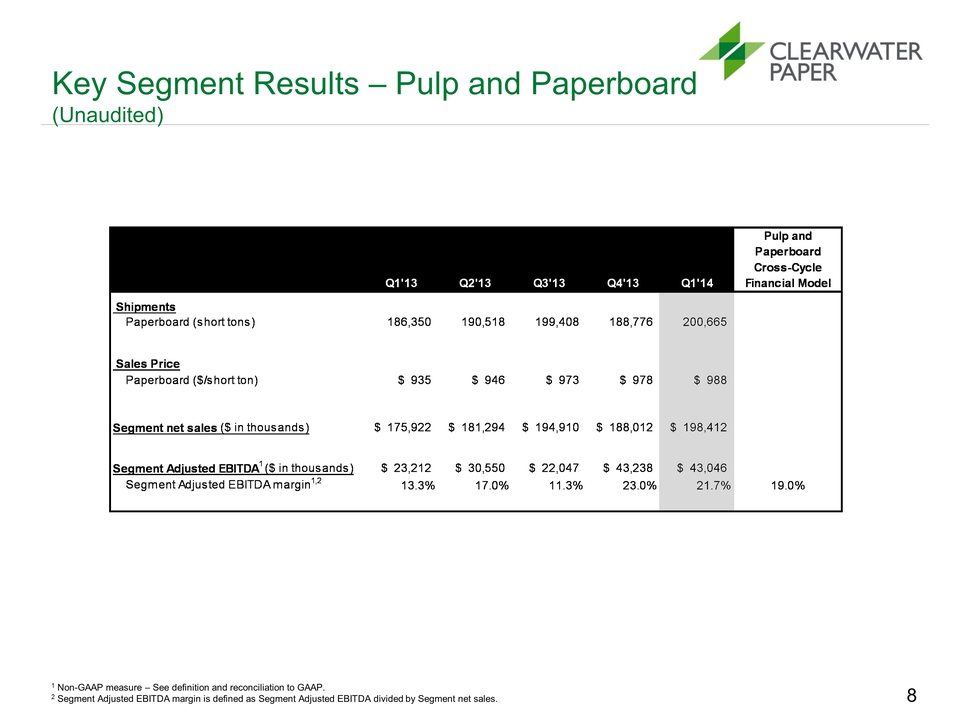
Key Segment Results – Pulp and Paperboard (Unaudited) 8 1 Non-GAAP measure – See definition and reconciliation to GAAP. 2 Segment Adjusted EBITDA margin is defined as Segment Adjusted EBITDA divided by Segment net sales. Q1'13 Q2'13 Q3'13 Q4'13 Q1'14 Shipments Paperboard (short tons) 186,350 190,518 199,408 188,776 200,665 Sales Price Paperboard ($/short ton) $ 935 $ 946 $ 973 $ 978 $ 988 Segment net sales ($ in thousands) $ 175,922 $ 181,294 $ 194,910 $ 188,012 $ 198,412 Segment Adjusted EBITDA1 ($ in thousands) $ 23,212 $ 30,550 $ 22,047 $ 43,238 $ 43,046 Segment Adjusted EBITDA margin1,2 13.3% 17.0% 11.3% 23.0% 21.7% 19.0% Pulp and Paperboard Cross-Cycle Financial Model 8
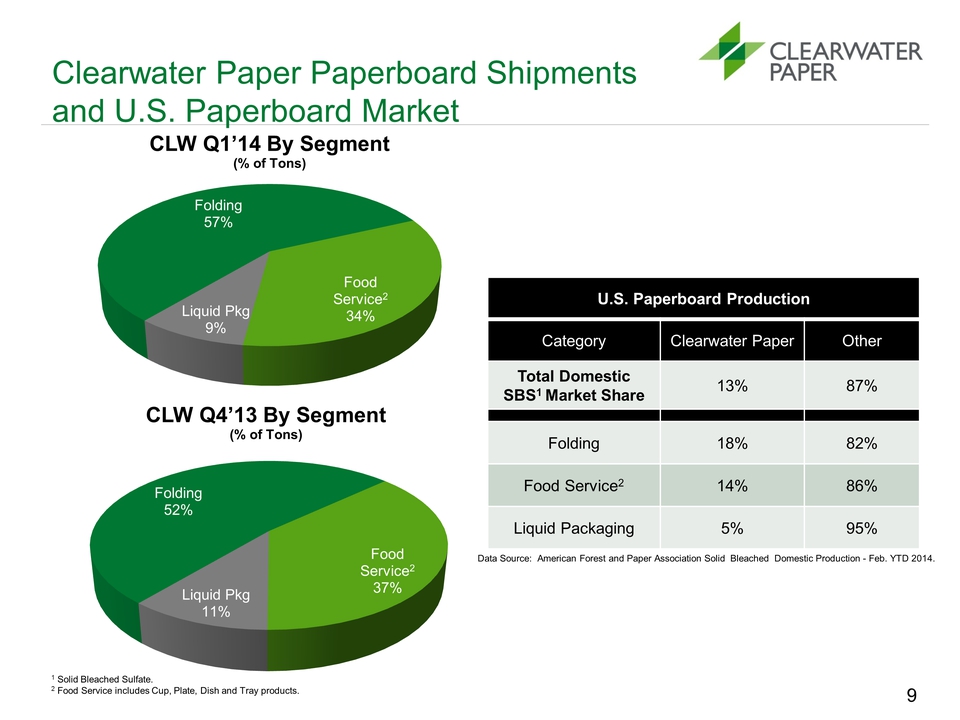
Clearwater Paper Paperboard
Shipments and U.S. Paperboard Market U.S. Paperboard Production Category
Clearwater Paper Other Total Domestic SBS1 Market Share 13% 87% Folding
18% 82% Food Service2 14% 86% Liquid Packaging 5% 95% Data Source:
American Forest and Paper Association Solid Bleached Domestic Production
- Feb. YTD 2014. Folding 57% Food Service2 34% Liquid Pkg 9% CLW Q1’14
By Segment (% of Tons) Folding 52% Food Service2 37% Liquid Pkg 11% CLW
Q4’13 By Segment (% of Tons) 1 Solid Bleached Sulfate. 2 Food Service
includes Cup, Plate, Dish and Tray products. 9
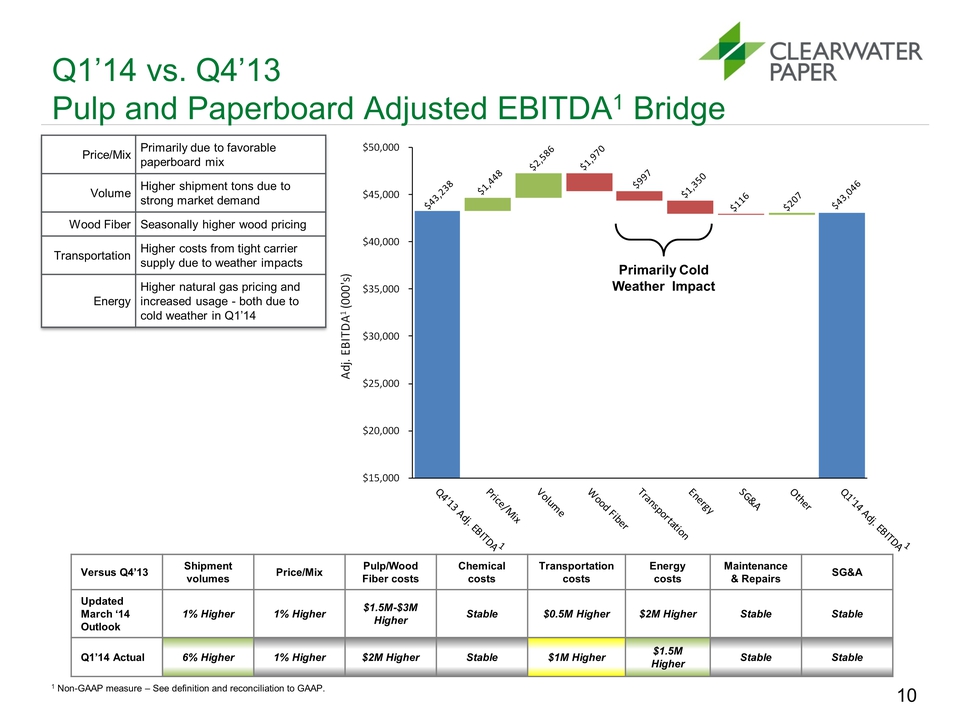
$15,000 $20,000 $25,000 $30,000 $35,000 $40,000 $45,000 $50,000 Adj. EBITDA1 (000's) Q1’14 vs. Q4’13 Pulp and Paperboard Adjusted EBITDA1 Bridge 1 Non-GAAP measure – See definition and reconciliation to GAAP. Price/Mix Primarily due to favorable paperboard mix Volume Higher shipment tons due to strong market demand Wood Fiber Seasonally higher wood pricing Transportation Higher costs from tight carrier supply due to weather impacts Energy Higher natural gas pricing and increased usage - both due to cold weather in Q1’14 10 Primarily Cold Weather Impact Versus Q4’13 Shipment volumes Price/Mix Pulp/Wood Fiber costs Chemical costs Transportation costs Energy costs Maintenance & Repairs SG&A Updated March ’14 Outlook 1% Higher 1% Higher $1.5M-$3M Higher Stable $0.5M Higher $2M Higher Stable Stable Q1’14 Actual 6% Higher 1% Higher $2M Higher Stable $1M Higher $1.5M Higher Stable Stable 10
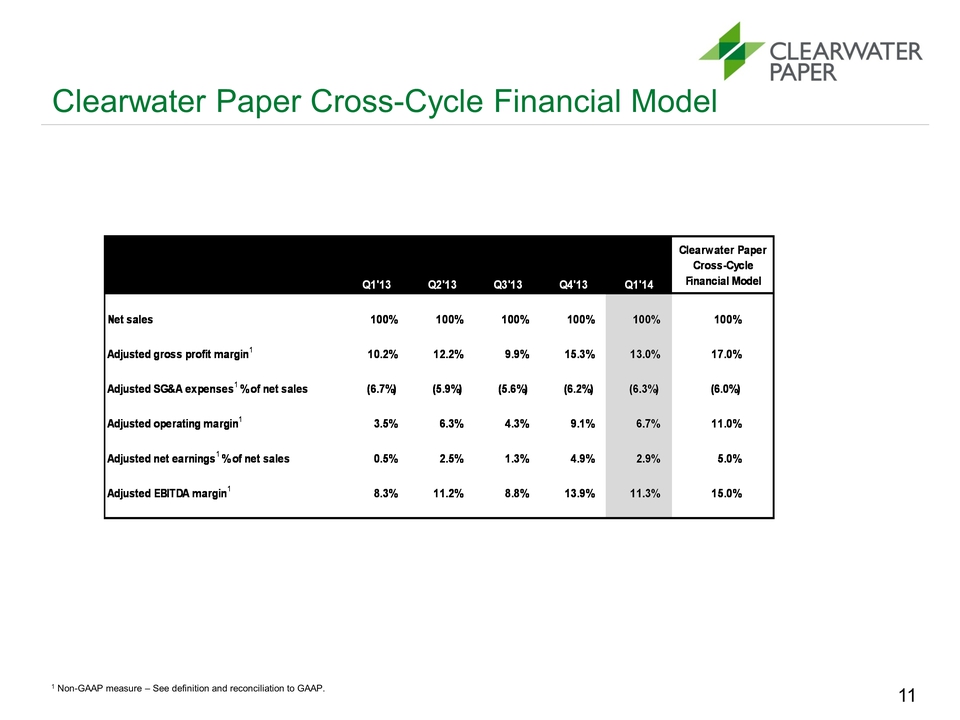
Clearwater Paper Cross-Cycle Financial Model 11 1 Non-GAAP measure – See definition and reconciliation to GAAP. Q1'13 Q2'13 Q3'13 Q4'13 Q1'14 Net sales 100% 100% 100% 100% 100% 100% Adjusted gross profit margin1 10.2% 12.2% 9.9% 15.3% 13.0% 17.0% Adjusted SG&A expenses1 % of net sales (6.7%) (5.9%) (5.6%) (6.2%) (6.3%) (6.0%) Adjusted operating margin1 3.5% 6.3% 4.3% 9.1% 6.7% 11.0% Adjusted net earnings1 % of net sales 0.5% 2.5% 1.3% 4.9% 2.9% 5.0% Adjusted EBITDA margin1 8.3% 11.2% 8.8% 13.9% 11.3% 15.0% Clearwater Paper Cross-Cycle Financial Model 11
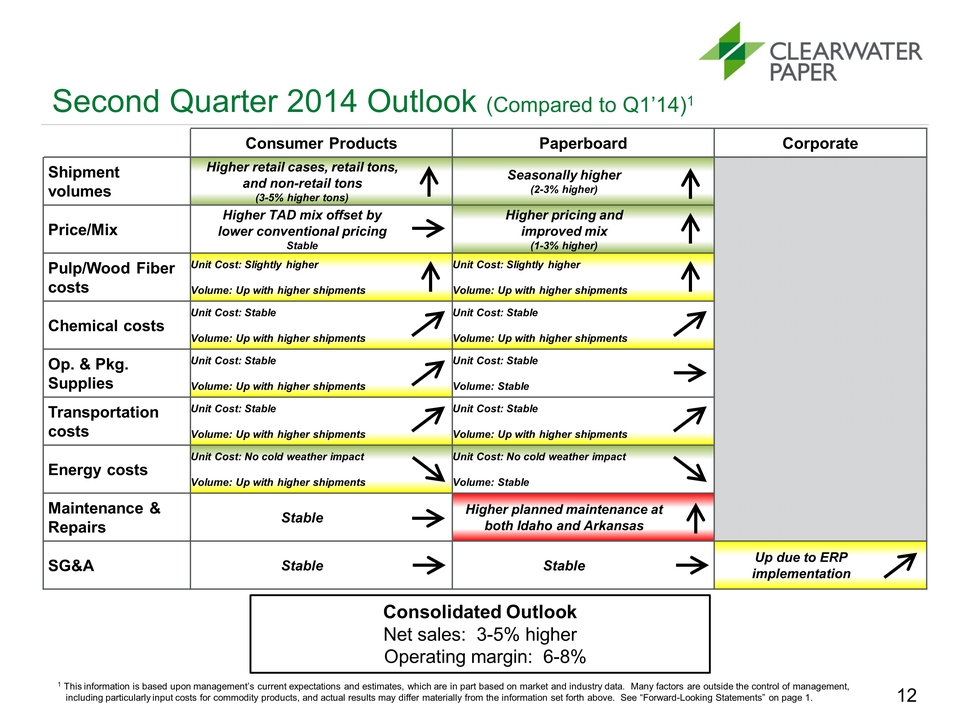
Second Quarter 2014 Outlook (Compared to Q1’14)1 Consumer Products Paperboard Corporate Shipment volumes Higher retail cases, retail tons, and non-retail tons (3-5% higher tons) Seasonally higher (2-3% higher) Price/Mix Higher TAD mix offset by lower conventional pricing Stable Higher pricing and improved mix (1-3% higher) Pulp/Wood Fiber costs Unit Cost: Slightly higher Volume: Up with higher shipments Unit Cost: Slightly higher Volume: Up with higher shipments Chemical costs Unit Cost: Stable Volume: Up with higher shipments Unit Cost: Stable Volume: Up with higher shipments Op. & Pkg. Supplies Unit Cost: Stable Volume: Up with higher shipments Unit Cost: Stable Volume: Stable Transportation costs Unit Cost: Stable Volume: Up with higher shipments Unit Cost: Stable Volume: Up with higher shipments Energy costs Unit Cost: No cold weather impact Volume: Up with higher shipments Unit Cost: No cold weather impact Volume: Stable Maintenance & Repairs Stable Higher planned maintenance at both Idaho and Arkansas SG&A Stable Stable Up due to ERP implementation 1 This information is based upon management’s current expectations and estimates, which are in part based on market and industry data. Many factors are outside the control of management, including particularly input costs for commodity products, and actual results may differ materially from the information set forth above. See “Forward-Looking Statements” on page 1. 12 Net sales: 3-5% higher Operating margin: 6-8% 12
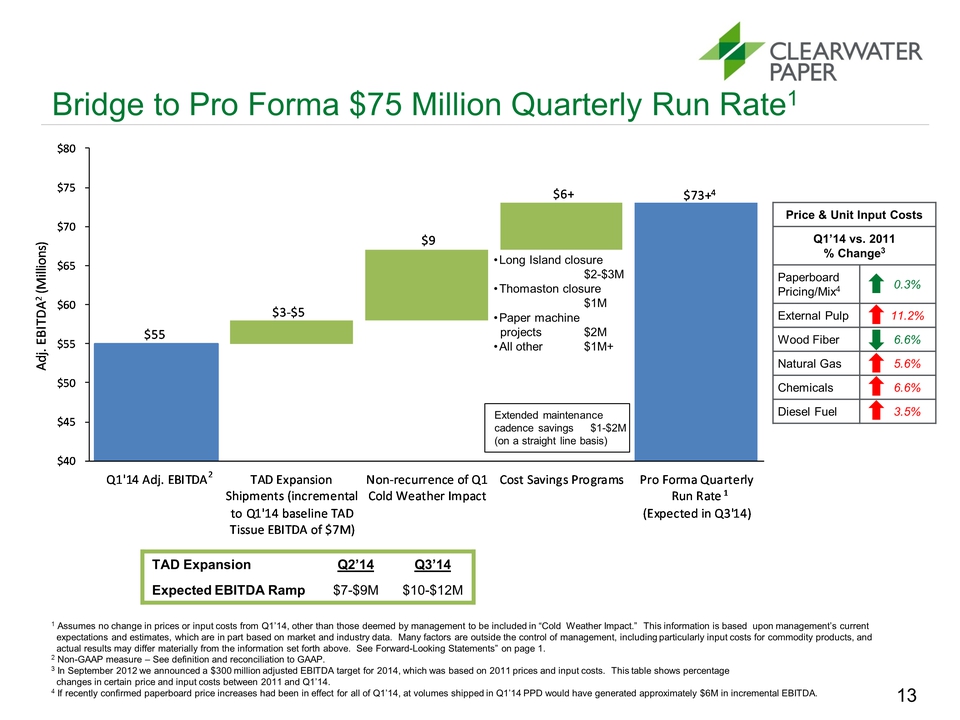
$55 $3-$5 $9 $6+ $73+ $40 $45 $50 $55 $60 $65 $70 $75 $80Q1'14 Adj. EBITDA TAD Expansion Shipments (incremental to Q1'14 baseline TAD Tissue EBITDA of $7M) Non-recurrence of Q1 Cold Weather Impact Cost Savings Programs Pro Forma Quarterly Run Rate (Expected in Q3'14) Adj. EBITDA2 (Millions) 1 2 Bridge to Pro Forma $75 Million Quarterly Run Rate1 1 Assumes no change in prices or input costs from Q1’14, other than those deemed by management to be included in “Cold Weather Impact.” This information is based upon management’s current expectations and estimates, which are in part based on market and industry data. Many factors are outside the control of management, including particularly input costs for commodity products, and actual results may differ materially from the information set forth above. See Forward-Looking Statements” on page 1. 2 Non-GAAP measure – See definition and reconciliation to GAAP. 3 In September 2012 we announced a $300 million adjusted EBITDA target for 2014, which was based on 2011 prices and input costs. This table shows percentage changes in certain price and input costs between 2011 and Q1’14. 13 •Long Island closure $2-$3M •Thomaston closure $1M •Paper machine projects $2M •All other $1M+ Price & Unit Input Costs Q1’14 vs. 2011 % Change3 Paperboard Pricing/Mix 0.3% External Pulp 11.2% Wood Fiber 6.6% Natural Gas 5.6% Chemicals 6.6% Diesel Fuel 3.5% Extended maintenance cadence savings $1-$2M (on a straight line basis) TAD Expansion Q2’14 Q3’14 Expected EBITDA Ramp $7-$9M $10-$12M 13 4 If recently confirmed paperboard price increases had been in effect for all of Q1’14, at volumes shipped in Q1’14 PPD would have generated approximately $6M in incremental EBITDA.
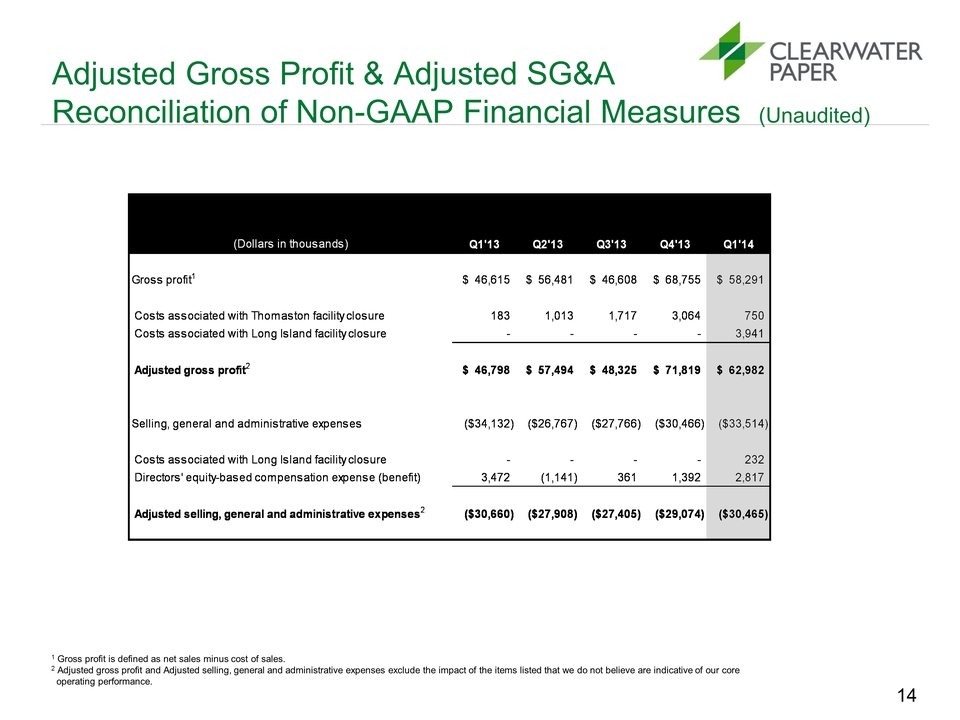
Adjusted Gross Profit & Adjusted SG&A Reconciliation of Non-GAAP Financial Measures (Unaudited) 1 Gross profit is defined as net sales minus cost of sales. 2 Adjusted gross profit and Adjusted selling, general and administrative expenses exclude the impact of the items listed that we do not believe are indicative of our core operating performance. 14 (Dollars in thousands) Q1'13 Q2'13 Q3'13 Q4'13 Q1'14 Gross profit1 $ 46,615 $ 56,481 $ 46,608 $ 68,755 $ 58,291 Costs associated with Thomaston facility closure 183 1,013 1,717 3,064 750 Costs associated with Long Island facility closure 3,941 Adjusted gross profit2 $ 46,798 $ 57,494 $ 48,325 $ 71,819 $ 62,982 Selling, general and administrative expenses ($34,132) ($26,767) ($27,766) ($30,466) ($33,514) Costs associated with Long Island facility closure 232 Directors' equity-based compensation expense (benefit) 3,472 (1,141) 361 1,392 2,817 Adjusted selling, general and administrative expenses2 ($30,660) ($27,908) ($27,405) ($29,074) ($30,465) 14
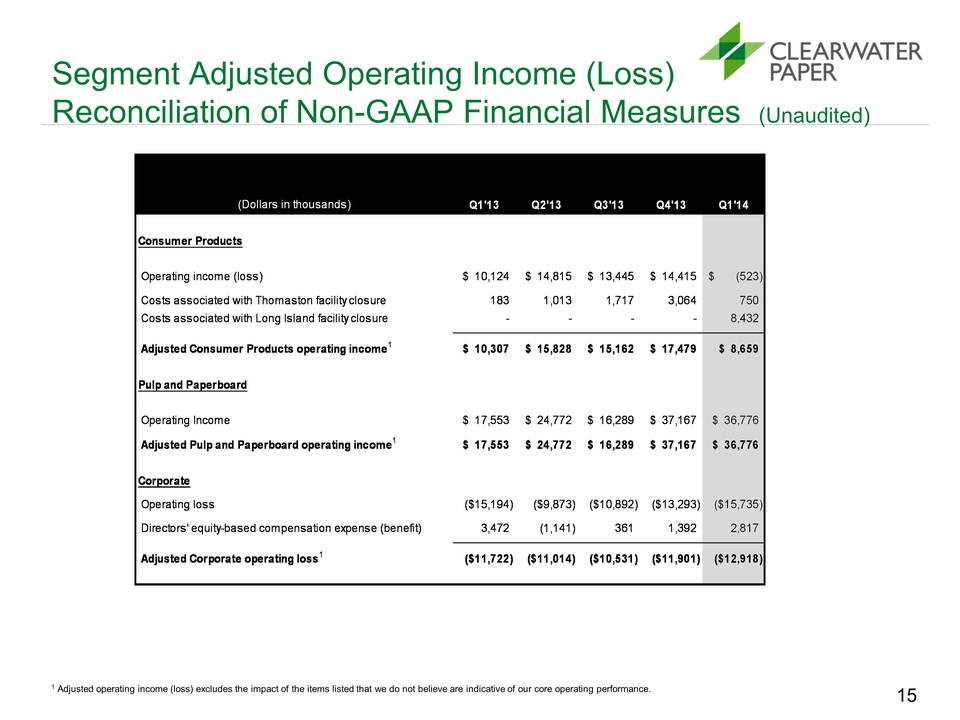
Segment Adjusted Operating Income (Loss) Reconciliation of Non-GAAP Financial Measures (Unaudited) 1 Adjusted operating income (loss) excludes the impact of the items listed that we do not believe are indicative of our core operating performance. 15 (Dollars in thousands) Q1'13 Q2'13 Q3'13 Q4'13 Q1'14 Consumer Products Operating income (loss) $ 10,124 $ 14,815 $ 13,445 $ 14,415 (523) $ Costs associated with Thomaston facility closure 183 1,013 1,717 3,064 750 Costs associated with Long Island facility closure - - - - 8,432 Adjusted Consumer Products operating income1 $ 10,307 $ 15,828 $ 15,162 $ 17,479 $ 8,659 Pulp and Paperboard Operating Income $ 17,553 $ 24,772 $ 16,289 $ 37,167 $ 36,776 Adjusted Pulp and Paperboard operating income1 $ 17,553 $ 24,772 $ 16,289 $ 37,167 $ 36,776 Corporate Operating loss ($15,194) ($9,873) ($10,892) ($13,293) ($15,735) Directors' equity-based compensation expense (benefit) 3,472 (1,141) 361 1,392 2,817 Adjusted Corporate operating loss1 ($11,722) ($11,014) ($10,531) ($11,901) ($12,918) 15
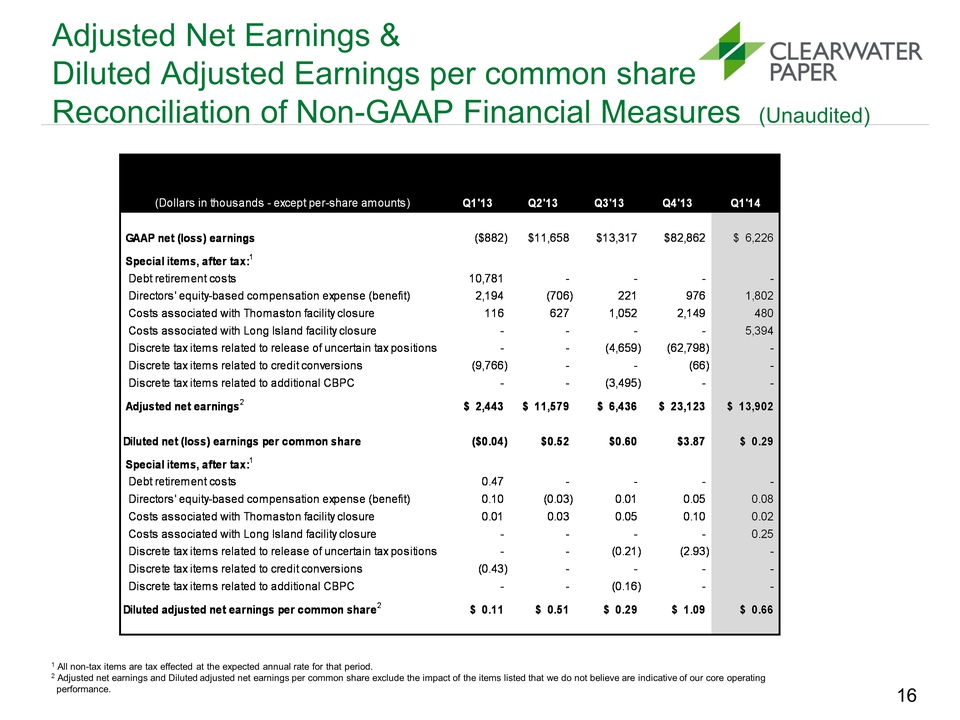
Adjusted Net Earnings & Diluted Adjusted Earnings per common share Reconciliation of Non-GAAP Financial Measures (Unaudited) 1 All non-tax items are tax effected at the expected annual rate for that period. 2 Adjusted net earnings and Diluted adjusted net earnings per common share exclude the impact of the items listed that we do not believe are indicative of our core operating performance. 16 (Dollars in thousands - except per-share amounts) Q1'13 Q2'13 Q3'13 Q4'13 Q1'14 GAAP net (loss) earnings ($882) $11,658 $13,317 $82,862 $ 6,226 Special items, after tax:1 Debt retirement costs 10,781 Directors' equity-based compensation expense (benefit) 2,194 (706) 221 976 1,802 Costs associated with Thomaston facility closure 116 627 1,052 2,149 480 Costs associated with Long Island facility closure 5,394 Discrete tax items related to release of uncertain tax positions (4,659) (62,798) - Discrete tax items related to credit conversions (9,766) (66) Discrete tax items related to additional CBPC - - (3,495) Adjusted net earnings2 $ 2,443 $ 11,579 $ 6,436 $ 23,123 $ 13,902 Diluted net (loss) earnings per common share ($0.04) $0.52 $0.60 $3.87 $ 0.29 Special items, after tax:1 Debt retirement costs 0.47 Directors' equity-based compensation expense (benefit) 0.10 (0.03) 0.01 0.05 0.08 Costs associated with Thomaston facility closure 0.01 0.03 0.05 0.10 0.02 Costs associated with Long Island facility closure 0.25 Discrete tax items related to release of uncertain tax positions - - (0.21) (2.93) Discrete tax items related to credit conversions (0.43) Discrete tax items related to additional CBPC (0.16) Diluted adjusted net earnings per common share2 $ 0.11 $ 0.51 $ 0.29 $ 1.09 $ 0.66 16
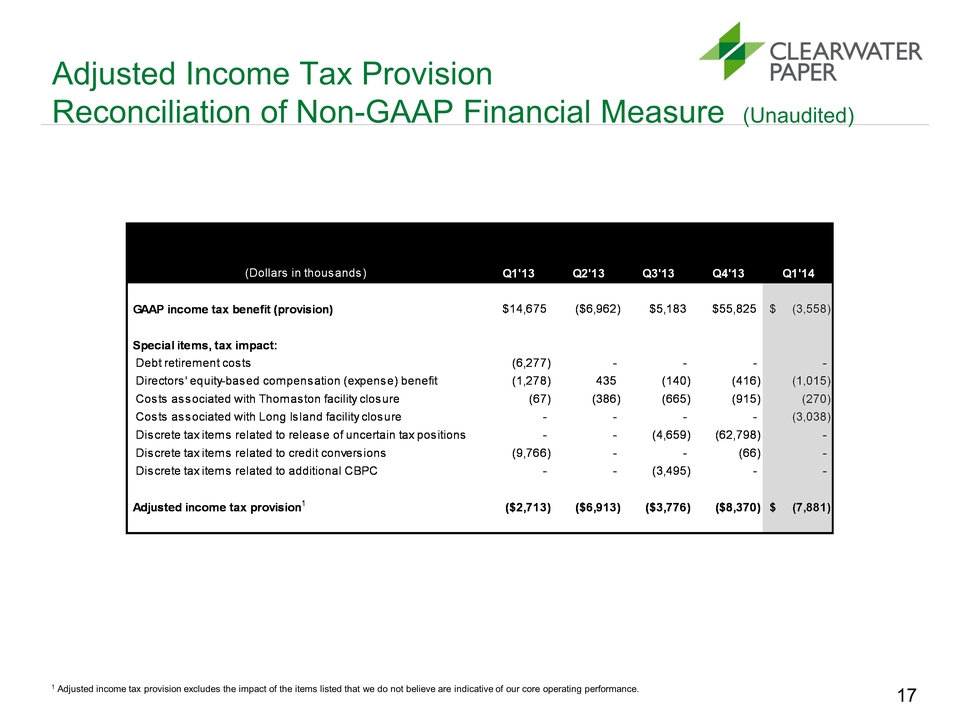
Adjusted Income Tax Provision Reconciliation of Non-GAAP Financial Measure (Unaudited) 1 Adjusted income tax provision excludes the impact of the items listed that we do not believe are indicative of our core operating performance. 17 (Dollars in thousands) Q1'13 Q2'13 Q3'13 Q4'13 Q1'14 GAAP income tax benefit (provision) $14,675 ($6,962) $5,183 $55,825 (3,558) $ Special items, tax impact: Debt retirement costs (6,277) Directors' equity-based compensation (expense) benefit (1,278) 435 (140) (416) (1,015) Costs associated with Thomaston facility closure (67) (386) (665) (915) (270) Costs associated with Long Island facility closure (3,038) Discrete tax items related to release of uncertain tax positions - - (4,659) (62,798) Discrete tax items related to credit conversions (9,766) (66)-Discrete tax items related to additional CBPC (3,495) Adjusted income tax provision1 ($2,713) ($6,913) ($3,776) ($8,370) (7,881) $ 17
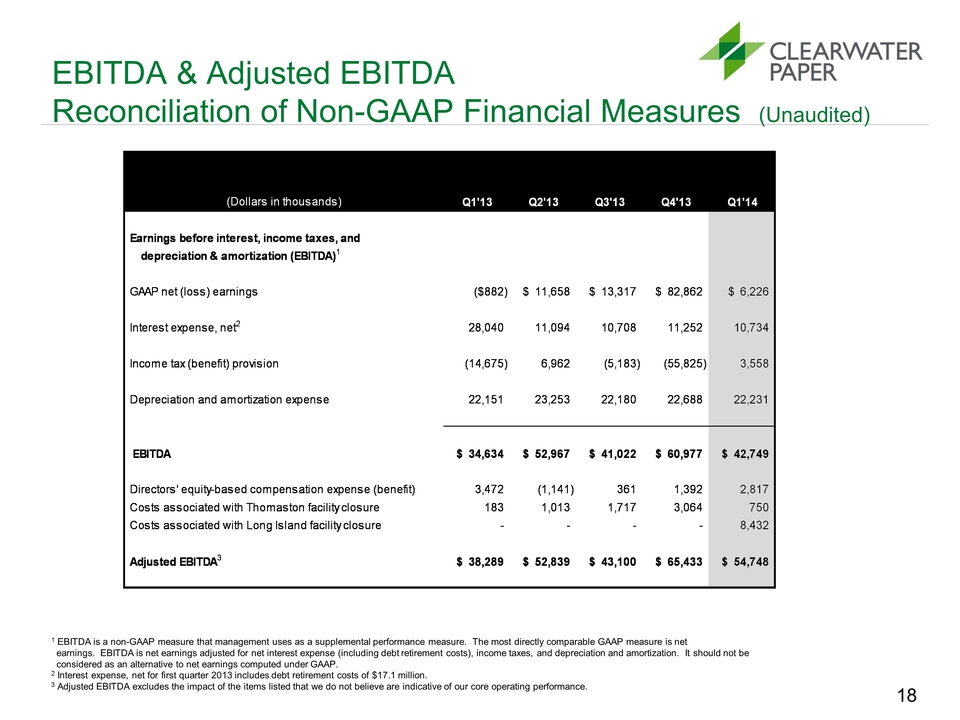
EBITDA & Adjusted EBITDA Reconciliation of Non-GAAP Financial Measures (Unaudited) 1 EBITDA is a non-GAAP measure that management uses as a supplemental performance measure. The most directly comparable GAAP measure is net earnings. EBITDA is net earnings adjusted for net interest expense (including debt retirement costs), income taxes, and depreciation and amortization. It should not be considered as an alternative to net earnings computed under GAAP. 2 Interest expense, net for first quarter 2013 includes debt retirement costs of $17.1 million. 3 Adjusted EBITDA excludes the impact of the items listed that we do not believe are indicative of our core operating performance. 18 (Dollars in thousands) Q1'13 Q2'13 Q3'13 Q4'13 Q1'14 Earnings before interest, income taxes, and depreciation & amortization (EBITDA)1 GAAP net (loss) earnings ($882) $ 11,658 $ 13,317 $ 82,862 $ 6,226 Interest expense, net2 28,040 11,094 10,708 11,252 10,734 Income tax (benefit) provision (14,675) 6,962 (5,183) (55,825) 3,558 Depreciation and amortization expense 22,151 23,253 22,180 22,688 22,231 EBITDA $ 34,634 $ 52,967 $ 41,022 $ 60,977 $ 42,749 Directors' equity-based compensation expense (benefit) 3,472 (1,141) 361 1,392 2,817 Costs associated with Thomaston facility closure 183 1,013 1,717 3,064 750 Costs associated with Long Island facility closure 8,432 Adjusted EBITDA3 $ 38,289 $ 52,839 $ 43,100 $ 65,433 $ 54,748 18
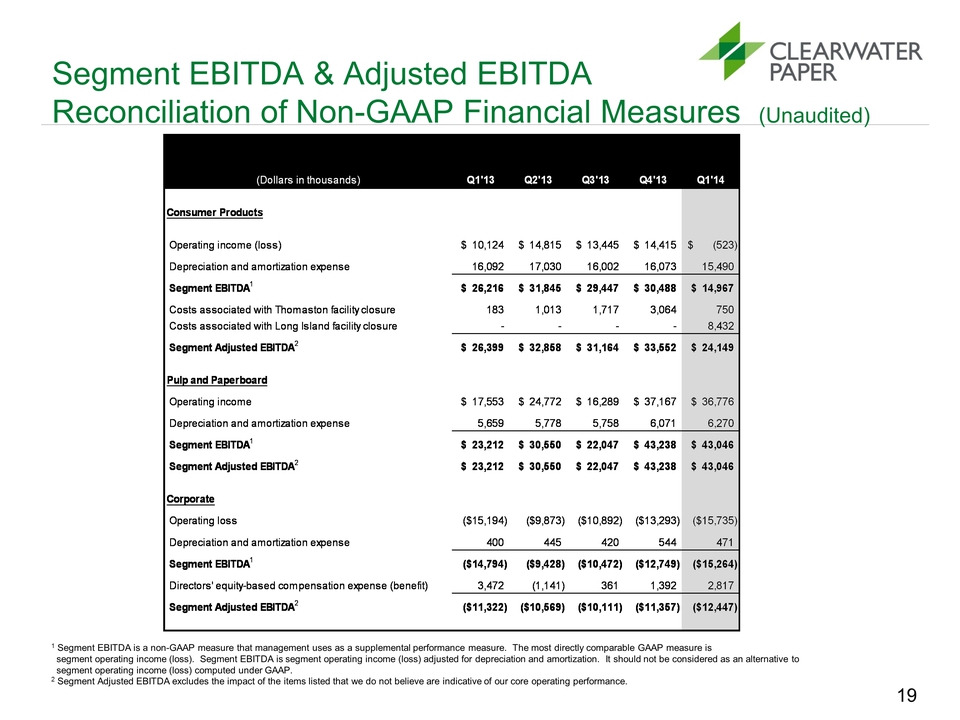
Segment EBITDA & Adjusted EBITDA Reconciliation of Non-GAAP Financial Measures (Unaudited) 1 Segment EBITDA is a non-GAAP measure that management uses as a supplemental performance measure. The most directly comparable GAAP measure is segment operating income (loss). Segment EBITDA is segment operating income (loss) adjusted for depreciation and amortization. It should not be considered as an alternative to segment operating income (loss) computed under GAAP. 2 Segment Adjusted EBITDA excludes the impact of the items listed that we do not believe are indicative of our core operating performance. 19 (Dollars in thousands) Q1'13 Q2'13 Q3'13 Q4'13 Q1'14 Consumer Products Operating income (loss) $ 10,124 $ 14,815 $ 13,445 $ 14,415 (523) $ Depreciation and amortization expense 16,092 17,030 16,002 16,073 15,490 Segment EBITDA1 $ 26,216 $ 31,845 $ 29,447 $ 30,488 $ 14,967 Costs associated with Thomaston facility closure 183 1,013 1,717 3,064 750Costs associated with Long Island facility closure- 8,432 Segment Adjusted EBITDA2 $ 26,399 $ 32,858 $ 31,164 $ 33,552 $ 24,149 Pulp and Paperboard Operating income $ 17,553 $ 24,772 $ 16,289 $ 37,167 $ 36,776 Depreciation and amortization expense 5,659 5,778 5,758 6,071 6,270 Segment EBITDA1 $ 23,212 $ 30,550 $ 22,047 $ 43,238 $ 43,046 Segment Adjusted EBITDA2 $ 23,212 $ 30,550 $ 22,047 $ 43,238 $ 43,046 Corporate Operating loss ($15,194) ($9,873) ($10,892) ($13,293) ($15,735) Depreciation and amortization expense 400 445 420 544 471 Segment EBITDA1 ($14,794) ($9,428) ($10,472) ($12,749) ($15,264) Directors' equity-based compensation expense (benefit) 3,472 (1,141) 361 1,392 2,817 Segment Adjusted EBITDA2 ($11,322) ($10,569) ($10,111) ($11,357) ($12,447) 19

For more information: www.clearwaterpaper.com 20