Exhibit 99.2
Clearwater Paper Corporation Third Quarter 2013 Supplemental Information Linda Massman President, Chief Executive Officer and Director John Hertz Senior Vice President, Finance and Chief Financial Officer
Forward-Looking Statements This supplemental information contains, in addition to historical information, certain forward-looking statements within the meaning of the Private Securities Litigation Reform Act of 1995, including statements regarding outlook for Q4 2013, production, product volumes shipped, product pricing, pulp costs, wood fiber costs and supply, chemical costs, transportation costs, energy costs including natural gas, cost and timing of major maintenance and repairs, corporate expenses, production and shipments from our new tissue machine and converting lines in Shelby, North Carolina and our Pro Forma Quarterly Run Rate. These forward-looking statements are based on management’s current expectations, estimates, assumptions and projections that are subject to change. Our actual results of operations may differ materially from those expressed or implied by the forward-looking statements contained in this presentation. Important factors that could cause or contribute to such differences include the risks and uncertainties described from time to time in the company's public filings with the Securities and Exchange Commission, as well as the following: •customer acceptance and timing of purchases of our new through-air-dried (TAD) products and capacity; •competitive pricing pressures for our products, including as a result of increased capacity as additional manufacturing facilities are operated by our competitors; •manufacturing or operating disruptions, including equipment malfunction and damage to our manufacturing facilities; •difficulties with the optimization and realization of the benefits expected from our new TAD paper machine and converting lines in Shelby, North Carolina; •increased dependence on wood pulp; •changes in the cost and availability of wood fiber and wood pulp; •the loss of business from a significant customer; •changes in transportation costs and disruptions in transportation services; •changes in costs for and availability of packaging supplies, chemicals, energy and maintenance and repairs; •changes in customer product preferences and competitors' product offerings; •changes in the U.S. and international economies and in general economic conditions in the regions and industries in which we operate; •increased supply and pricing pressures resulting from increasing Asian paper production capabilities; •cyclical industry conditions; •reliance on a limited number of third-party suppliers for raw materials; •labor disruptions; •our ability to generate cash; and •inability to successfully implement our expansion strategies. Forward-looking statements contained in this presentation present management’s views only as of the date of this presentation. We undertake no obligation to publicly update forward-looking statements, whether as a result of new information, future events or otherwise.1
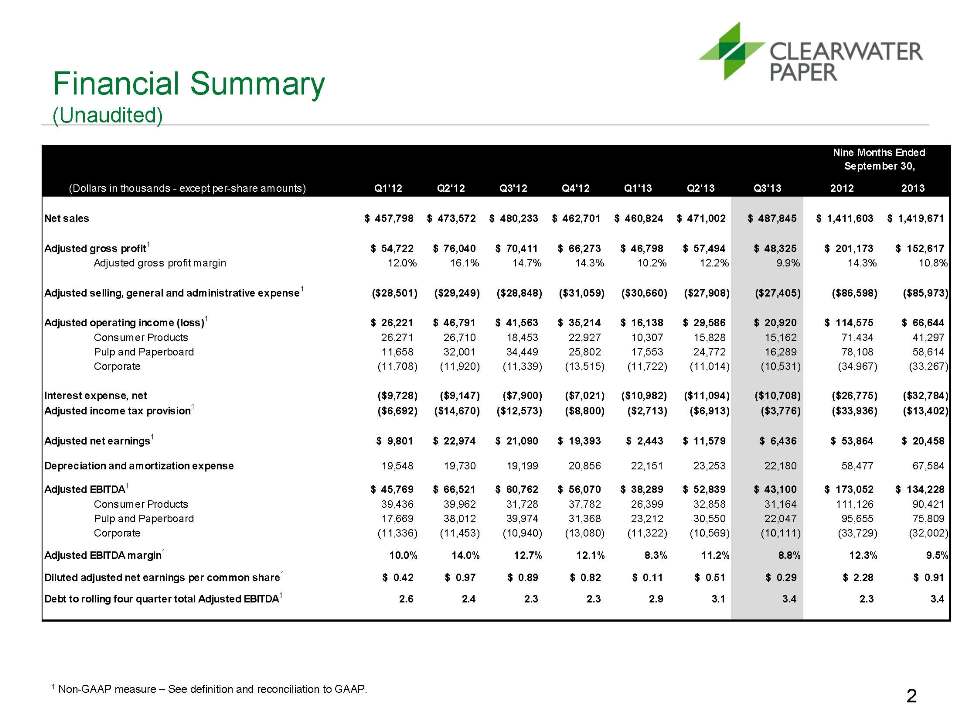
Financial Summary (Unaudited) 1 Non-GAAP measure – See definition and reconciliation to GAAP. 2 Q1'12Q2'12Q3'12Q4'12Q1'13Q2'13Q3'1320122013Net sales$ 457,798$ 473,572$ 480,233$ 462,701$ 460,824$ 471,002$ 487,845$ 1,411,603$ 1,419,671Adjusted gross profit1$ 54,722$ 76,040$ 70,411$ 66,273$ 46,798$ 57,494$ 48,325$ 201,173$ 152,617Adjusted gross profit margin12.0%16.1%14.7%14.3%10.2%12.2%9.9%14.3%10.8%Adjusted selling, general and administrative expense 1 ($28,501) ($29,249) ($28,848) ($31,059) ($30,660) ($27,908) ($27,405) ($86,598) ($85,973) Adjusted operating income (loss) 1 $ 26,221 $ 46,791 $ 41,563 $ 35,214 $ 16,138 $ 29,586 $ 20,920 $ 114,575 $ 66,644 Consumer Products 26,271 26,710 18,45322,92710,30715,82815,16271,43441,297Pulp and Paperboard11,65832,00134,44925,80217,55324,77216,28978,10858,614Corporate (11,708)(11,920)(11,339)(13,515)(11,722)(11,014)(10,531)(34,967)(33,267)Interest expense, net($9,728)($9,147)($7,900)($7,021)($10,982)($11,094)($10,708)($26,775)($32,784)Adjusted income tax provision1($6,692)($14,670)($12,573)($8,800)($2,713)($6,913)($3,776)($33,936)($13,402)Adjusted net earnings1$ 9,801$ 22,974$ 21,090$ 19,393$ 2,443$ 11,579$ 6,436$ 53,864$ 20,458Depreciation and amortization expense19,54819,73019,19920,85622,15123,25322,18058,47767,584Adjusted EBITDA1$ 45,769$ 66,521$ 60,762$ 56,070$ 38,289$ 52,839$ 43,100$ 173,052$ 134,228Consumer Products39,43639,96231,72837,78226,39932,85831,164111,12690,421Pulp and Paperboard 17,66938,01239,97431,36823,21230,55022,04795,65575,809Corporate(11,336)(11,453)(10,940)(13,080)(11,322)(10,569)(10,111)(33,729)(32,002)Adjusted EBITDA margin 110.0% 14.0% 12.7% 12.1% 8.3% 11.2% 8.8% 12.3% 9.5% Diluted adjusted net earnings per common share1$ 0.42$ 0.97$ 0.89$ 0.82$ 0.11$ 0.51$ 0.29$ 2.28$ 0.91Debt to rolling four quarter total Adjusted EBITDA12.6 2.4 2.3 2.3 2.9 3.1 3.4 2.3 3.4 (Dollars in thousands - except per-share amounts)Nine Months Ended September 30,
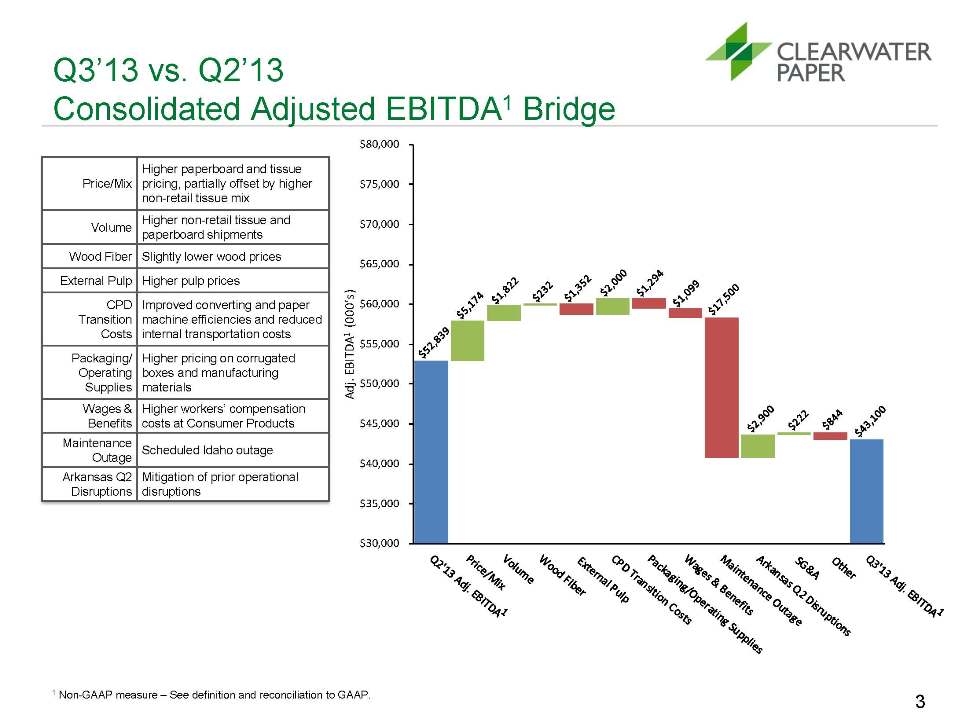
$30,000 $35,000 $40,000 $45,000 $50,000 $55,000 $60,000 $65,000 $70,000 $75,000 $80,000Adj. EBITDA1(000's)Q3’13 vs. Q2’13 Consolidated Adjusted EBITDA1 Bridge 1 Non-GAAP measure – See definition and reconciliation to GAAP. Price/Mix Higher paperboard and tissue pricing, partially offset by higher non-retail tissue mix Volume Higher non-retail tissue and paperboard shipments Wood Fiber Slightly lower wood prices External Pulp Higher pulp prices CPD Transition Costs Improved converting and paper machine efficiencies and reduced internal transportation costs Packaging/ Operating Supplies Higher pricing on corrugated boxes and manufacturing materials Wages & Benefits Higher workers’ compensation costs Maintenance Outage Scheduled Idaho outage Arkansas Q2 Disruptions Mitigation of prior operational disruptions 3
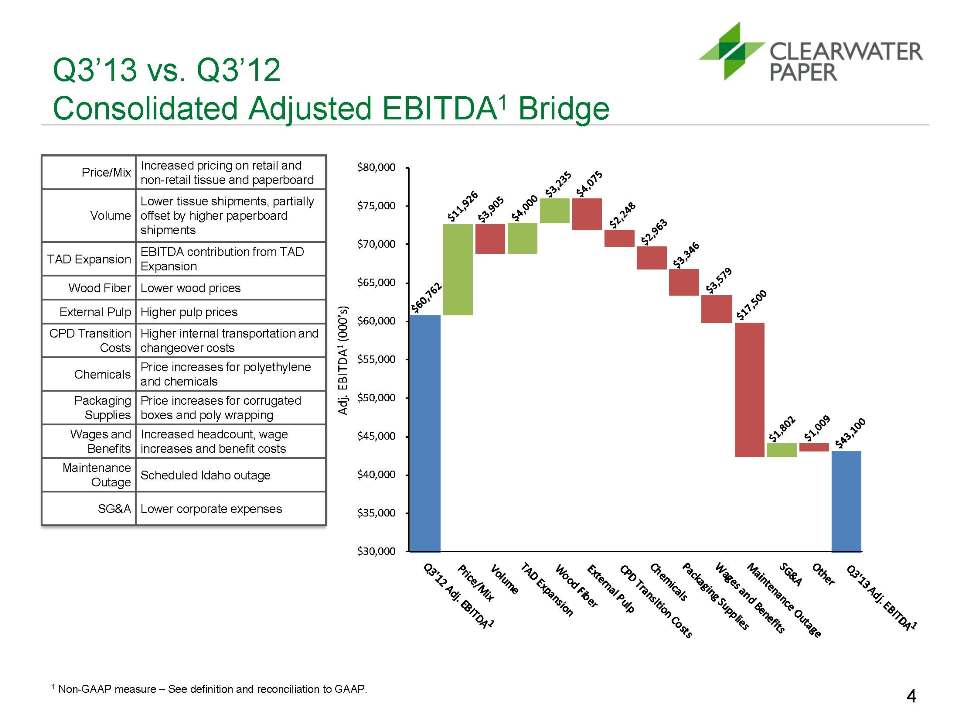
$30,000 $35,000 $40,000 $45,000 $50,000 $55,000 $60,000 $65,000 $70,000 $75,000 $80,000Adj. EBITDA1(000's)Q3’13 vs. Q3’12 Consolidated Adjusted EBITDA1 Bridge 1 Non-GAAP measure – See definition and reconciliation to GAAP. Price/Mix Increased pricing on retail and non-retail tissue and paperboard Volume Lower tissue shipments, partially offset by higher paperboard shipments TAD Expansion EBITDA contribution from TAD Expansion Wood Fiber Lower wood prices External Pulp Higher pulp prices CPD Transition Costs Higher internal transportation and changeover costs Chemicals Price increases for polyethylene and chemicals Packaging Supplies Price increases for corrugated boxes and poly wrapping Wages and Benefits Increased headcount, wage increases and benefit costs Maintenance Outage Scheduled Idaho outage SG&A Lower corporate expenses 4
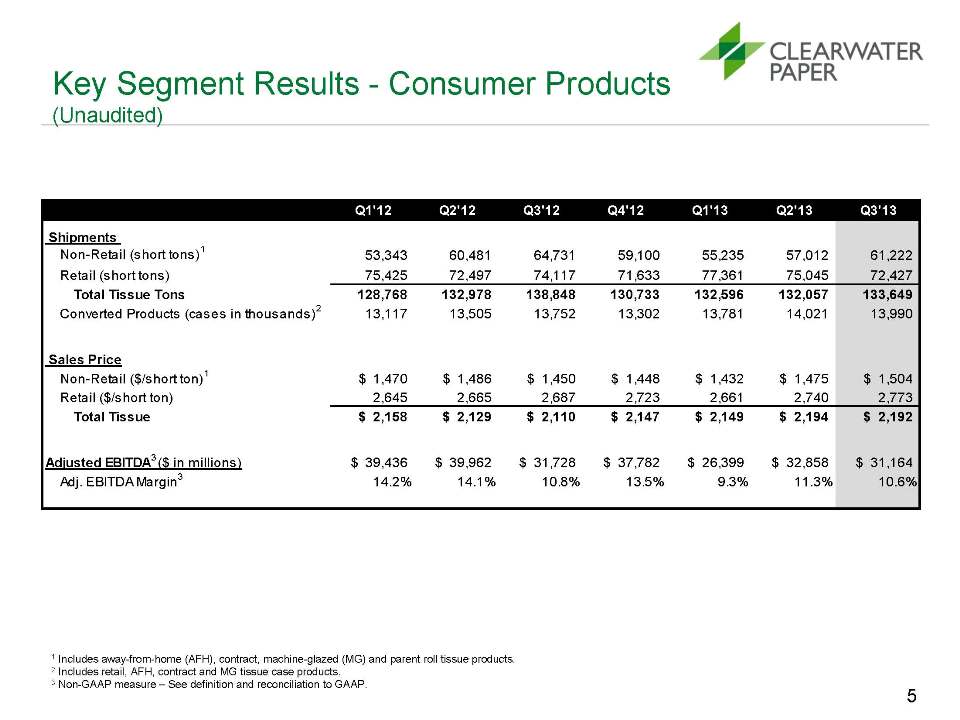
Key Segment Results - Consumer Products (Unaudited) 5 1 Includes away-from-home (AFH), contract, machine-glazed (MG) and parent roll tissue products. 2 Includes retail, AFH, contract and MG tissue case products. 3 Non-GAAP measure – See definition and reconciliation to GAAP. Q1'12Q2'12Q3'12Q4'12Q1'13Q2'13Q3'13 Shipments Non-Retail (short tons)153,343 60,481 64,731 59,100 55,235 57,012 61,222 Retail (short tons) 75,425 72,497 74,117 71,633 77,361 75,045 72,427 Total Tissue Tons128,768 132,978 138,848 130,733 132,596 132,057 133,649 Converted Products (cases in thousands)213,117 13,505 13,752 13,302 13,781 14,021 13,990 Sales PriceNon-Retail ($/short ton)1$ 1,470$ 1,486$ 1,450$ 1,448$ 1,432$ 1,475$ 1,504Retail ($/short ton) 2,645 2,665 2,687 2,723 2,661 2,740 2,773 Total Tissue$ 2,158$ 2,129$ 2,110$ 2,147$ 2,149$ 2,194$ 2,192Adjusted EBITDA3 ($ in millions)$ 39,436$ 39,962$ 31,728$ 37,782$ 26,399$ 32,858$ 31,164Adj. EBITDA Margin314.2%14.1%10.8%13.5%9.3%11.3%10.6%
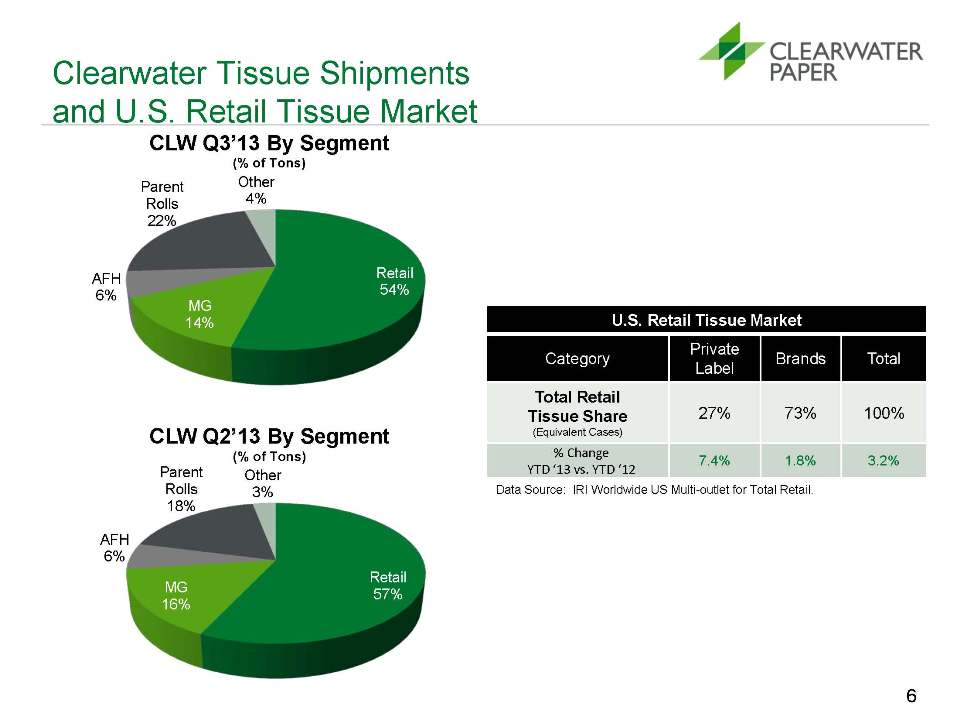
Retail 57% MG 16% AFH 6% Parent Rolls 18% Other 3% CLW Q2’13 By Segment (% of Tons) Clearwater Tissue Shipments and U.S. Retail Tissue Market Retail 54% MG 14% AFH 6% Parent Rolls 22% Other 4% CLW Q3’13 By Segment (% of Tons) U.S. Retail Tissue Market Category Private Label Brands Total Total Retail Tissue Share (Equivalent Cases) 27% 73% 100% % Change YTD ‘13 vs. YTD ‘12 7.4% 1.8% 3.2% Data Source: IRI Worldwide US Multi-outlet for Total Retail. 6
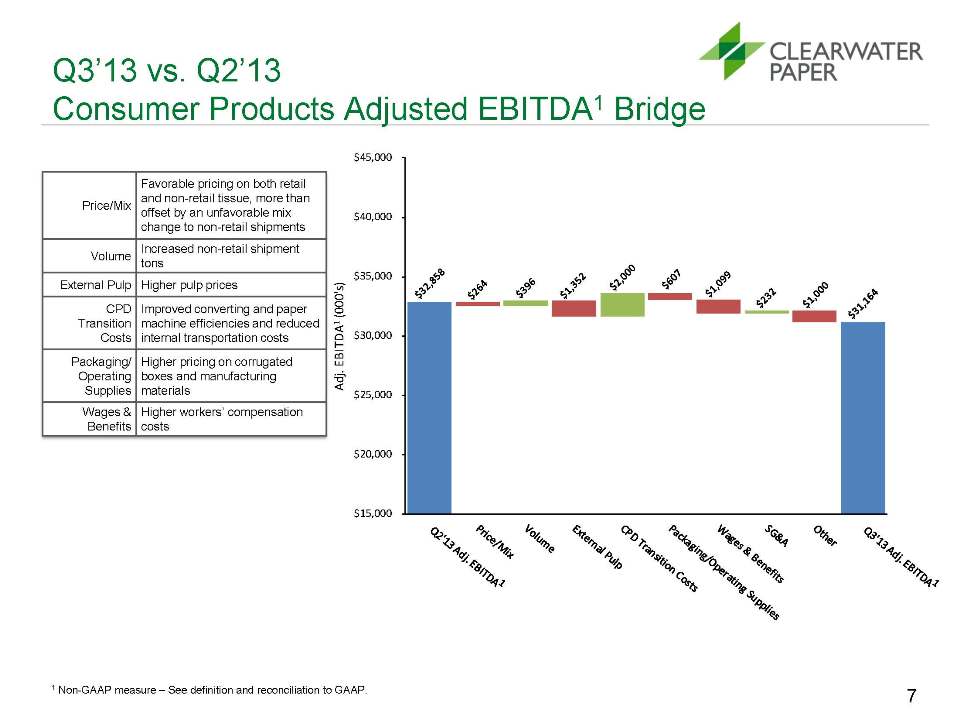
Current Quarter vs Prior Quarter $15,000 $20,000 $25,000 $30,000 $35,000 $40,000 $45,000Adj. EBITDA1(000's)Q3’13 vs. Q2’13 Consumer Products Adjusted EBITDA1 Bridge 1 Non-GAAP measure – See definition and reconciliation to GAAP. Price/Mix Favorable pricing on both retail and non-retail tissue, more than offset by an unfavorable mix change to non-retail shipments Volume Increased non-retail shipment tons External Pulp Higher pulp prices CPD Transition Costs Improved converting and paper machine efficiencies and reduced internal transportation costs Packaging/ Operating Supplies Higher pricing on corrugated boxes and manufacturing materials Wages & Benefits Higher workers’ compensation costs 7
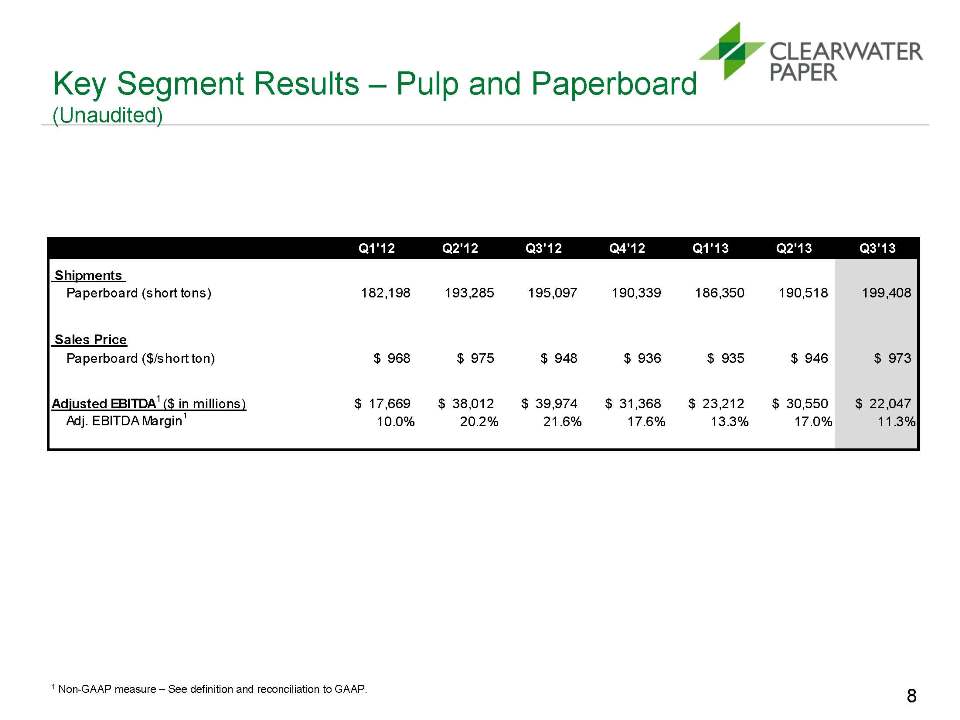
Key Segment Results – Pulp and Paperboard (Unaudited) 1 Non-GAAP measure – See definition and reconciliation to GAAP. Q1'12Q2'12Q3'12Q4'12Q1'13Q2'13Q3'13 Shipments Paperboard (short tons) 182,198 193,285 195,097 190,339 186,350 190,518 199,408 Sales Price Paperboard ($/short ton)$ 968$ 975$ 948$ 936$ 935$ 946$ 973Adjusted EBITDA1 ($ in millions)$ 17,669$ 38,012$ 39,974$ 31,368$ 23,212$ 30,550$ 22,047Adj. EBITDA Margin110.0%20.2%21.6%17.6%13.3%17.0%11.3% 8
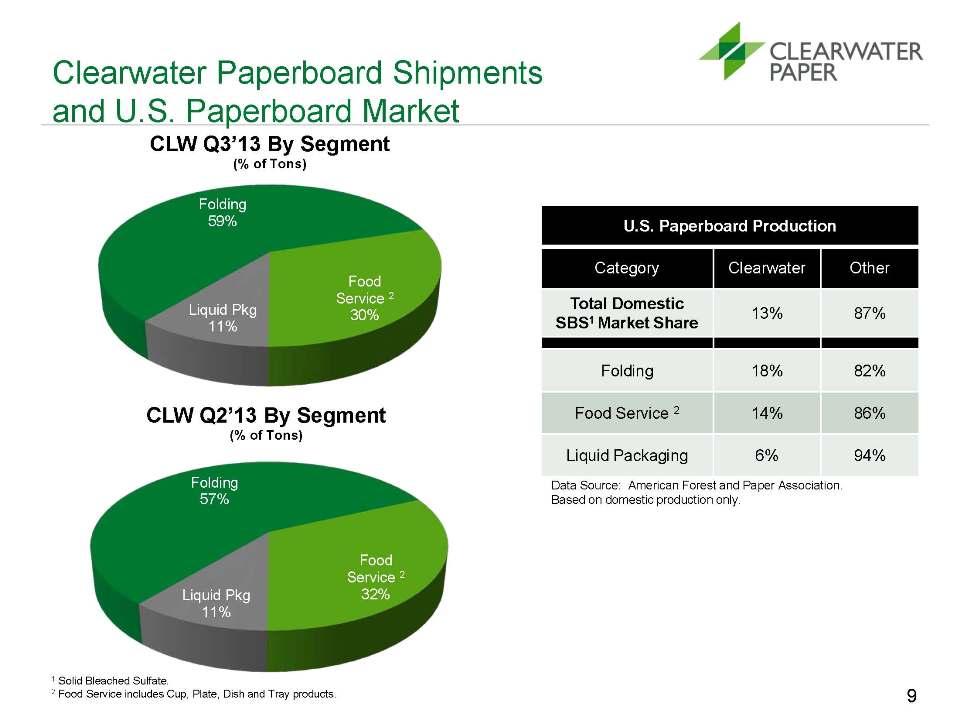
Clearwater Paperboard Shipments and U.S. Paperboard Market U.S. Paperboard Production Category Clearwater Other Total Domestic SBS1 Market Share 13% 87% Folding 18% 82% Food Service 2 14% 86% Liquid Packaging 6% 94% Data Source: American Forest and Paper Association. Based on domestic production only. Folding 59% Food Service 2 30% Liquid Pkg 11% CLW Q3’13 By Segment (% of Tons) Folding 57% Food Service 2 32% Liquid Pkg 11% CLW Q2’13 By Segment (% of Tons) 1 Solid Bleached Sulfate. 2 Food Service includes Cup, Plate, Dish and Tray products. 9
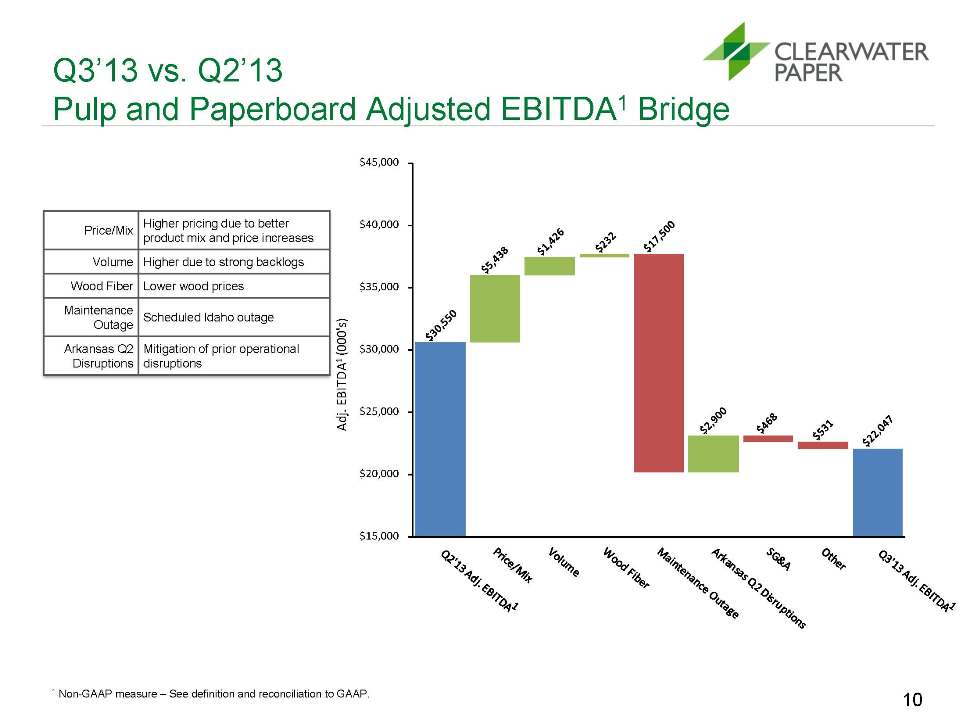
Current Quarter vs Prior Quarter $15,000 $20,000 $25,000 $30,000 $35,000 $40,000 $45,000Adj. EBITDA1(000's)Q3’13 vs. Q2’13 Pulp and Paperboard Adjusted EBITDA1 Bridge 1 Non-GAAP measure – See definition and reconciliation to GAAP. Price/Mix Higher pricing due to better product mix and price increases Volume Higher due to seasonality Wood Fiber Lower wood prices Maintenance Outage Scheduled Idaho outage Arkansas Q2 Disruptions Mitigation of prior operational disruptions 10
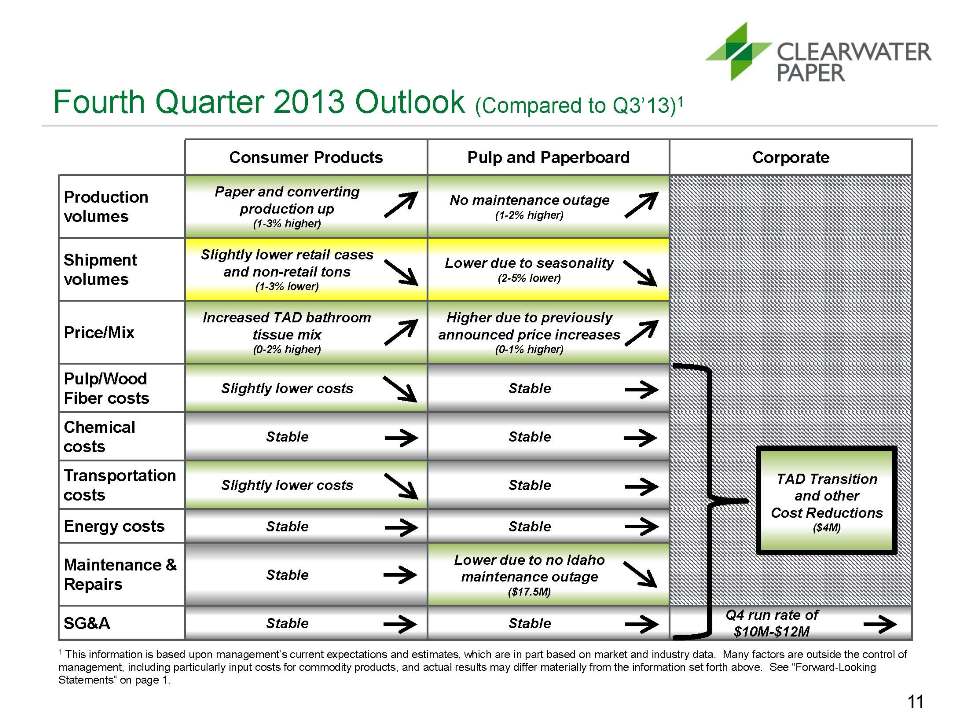
Fourth Quarter 2013 Outlook (Compared to Q3’13)1 Consumer Products Pulp and Paperboard Corporate Production volumes Paper and converting production up (1-3% higher) No maintenance outage (1-2% higher) Shipment volumes Slightly lower retail cases and non-retail tons (1-3% lower) Lower due to seasonality (3-5% lower) Price/Mix Increased TAD bathroom tissue mix (0-2% higher) Higher due to previously announced price increases (0-1% higher) Pulp/Wood Fiber costs Slightly lower costs Stable Chemical costs Stable Stable Transportation costs Slightly lower costs Stable Energy costs Stable Stable Maintenance & Repairs Stable Lower due to no Idaho maintenance outage ($17.5M) SG&A Stable Stable Q4 run rate of $10M-$12M 1 This information is based upon management’s current expectations and estimates, which are in part based on market and industry data. Many factors are outside the control of management, including particularly input costs for commodity products, and actual results may differ materially from the information set forth above. See “Forward-Looking Statements” on page 1. TAD Transition and other Cost Reductions ($4M) 11
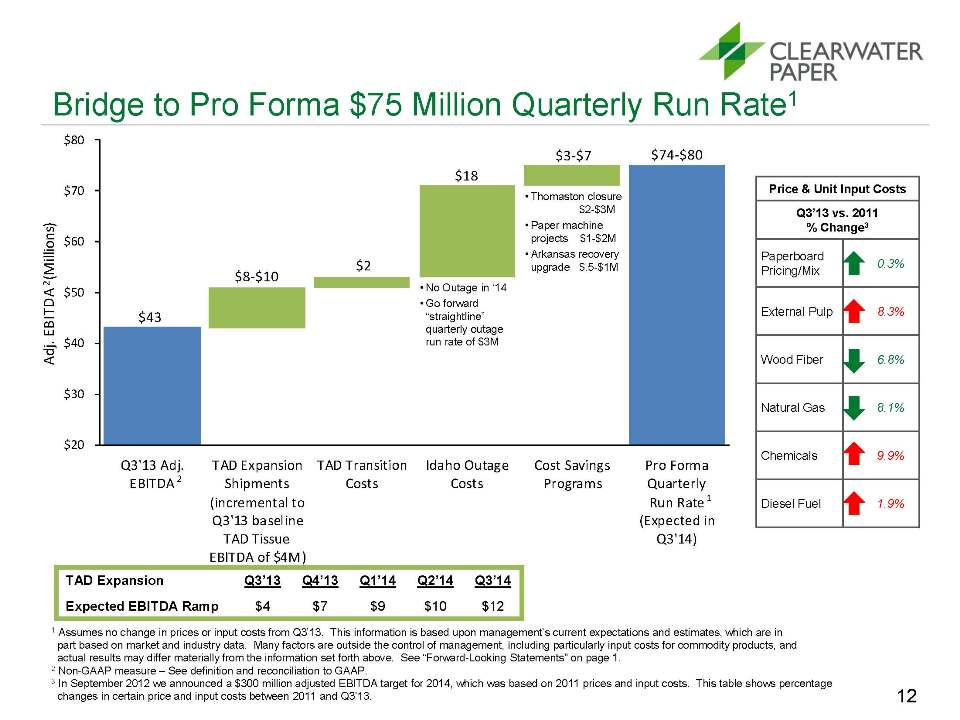
$43 $8-$10$2$18$3-$7$74-$80 $20 $30 $40 $50 $60 $70 $80Q3'13 Adj.EBITDATAD ExpansionShipments(incremental toQ3'13 baselineTAD TissueEBITDA of $4M)TAD TransitionCostsIdaho OutageCostsCost SavingsProgramsPro FormaQuarterlyRun Rate(Expected inQ3'14)Adj. EBITDA 2(Millions)21Bridge to Pro Forma $75 Million Quarterly Run Rate1 1 Assumes no change in prices or input costs from Q3’13. This information is based upon management’s current expectations and estimates, which are in part based on market and industry data. Many factors are outside the control of management, including particularly input costs for commodity products, and actual results may differ materially from the information set forth above. See “Forward-Looking Statements” on page 1. 2 Non-GAAP measure – See definition and reconciliation to GAAP. 3 In September 2012 we announced a $300 million adjusted EBITDA target for 2014, which was based on 2011 prices and input costs. This table shows percentage changes in certain price and input costs between 2011 and Q3’13. Price & Unit Input Costs Q3’13 vs. 2011 % Change3 Paperboard Pricing/Mix 0.3% External Pulp 8.3% Wood Fiber 6.8% Natural Gas 8.1% Chemicals 9.9% Diesel Fuel 1.9% •Thomaston closure $2-$3M •Paper machine projects $1-$2M •Arkansas recovery upgrade $.5-$1M TAD Expansion Q3’13 Q4’13 Q1’14 Q2’14 Q3’14 Expected EBITDA Ramp $4 $7 $9 $10 $12 •No Outage in ‘14 •Go forward “straightline” quarterly outage run rate of $3M 12
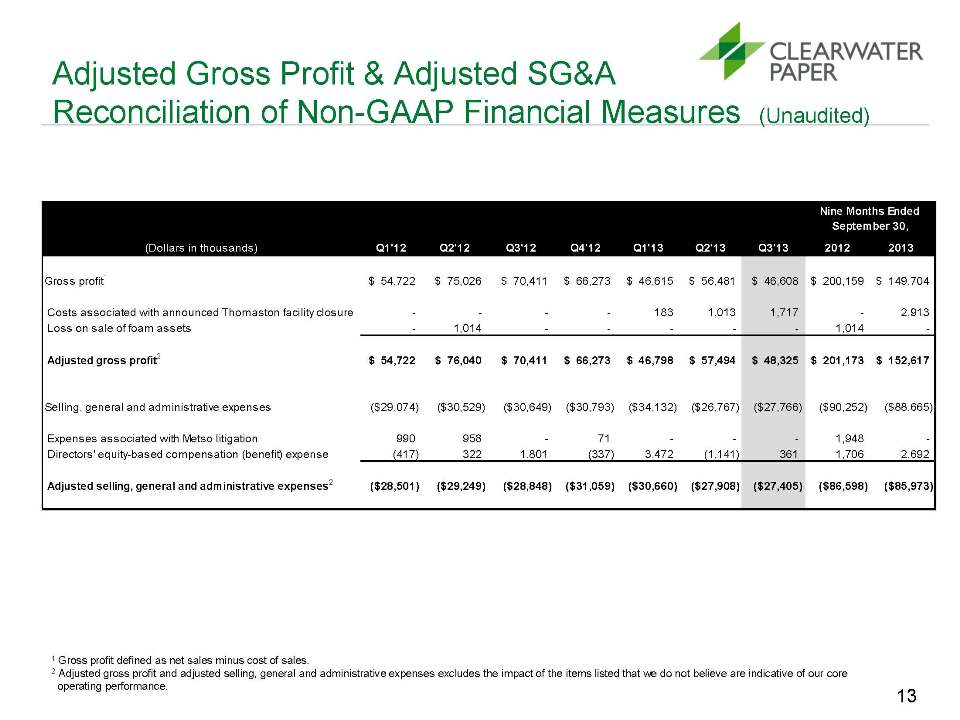
Adjusted Gross Profit & Adjusted SG&A Reconciliation of Non-GAAP Financial Measures (Unaudited) 1 Gross profit defined as net sales minus cost of sales. 2 Adjusted gross profit and adjusted selling, general and administrative expenses excludes the impact of the items listed that we do not believe are indicative of our core operating performance. (Dollars in thousands) Q1'12Q2'12Q3'12Q4'12Q1'13Q2'13Q3'1320122013Gross profit 1 $ 54,722$ 75,026$ 70,411$ 66,273$ 46,615$ 56,481$ 46,608$ 200,159$ 149,704 Costs associated with announced Thomaston facility closure- - - - 183 1,013 1,717 - 2,913 Loss on sale of foam assets- 1,014 - - - - - 1,014 - Adjusted gross profit2$ 54,722$ 76,040$ 70,411$ 66,273$ 46,798$ 57,494$ 48,325$ 201,173$ 152,617Selling, general and administrative expenses($29,074)($30,529)($30,649)($30,793)($34,132)($26,767)($27,766)($90,252)($88,665) Expenses associated with Metso litigation990 958 - 71 - - - 1,948 - Directors' equity-based compensation (benefit) expense(417) 322 1,801 (337) 3,472 (1,141) 361 1,706 2,692 Adjusted selling, general and administrative expenses2($28,501)($29,249)($28,848)($31,059)($30,660)($27,908)($27,405)($86,598)($85,973)Nine Months Ended September 30, 13
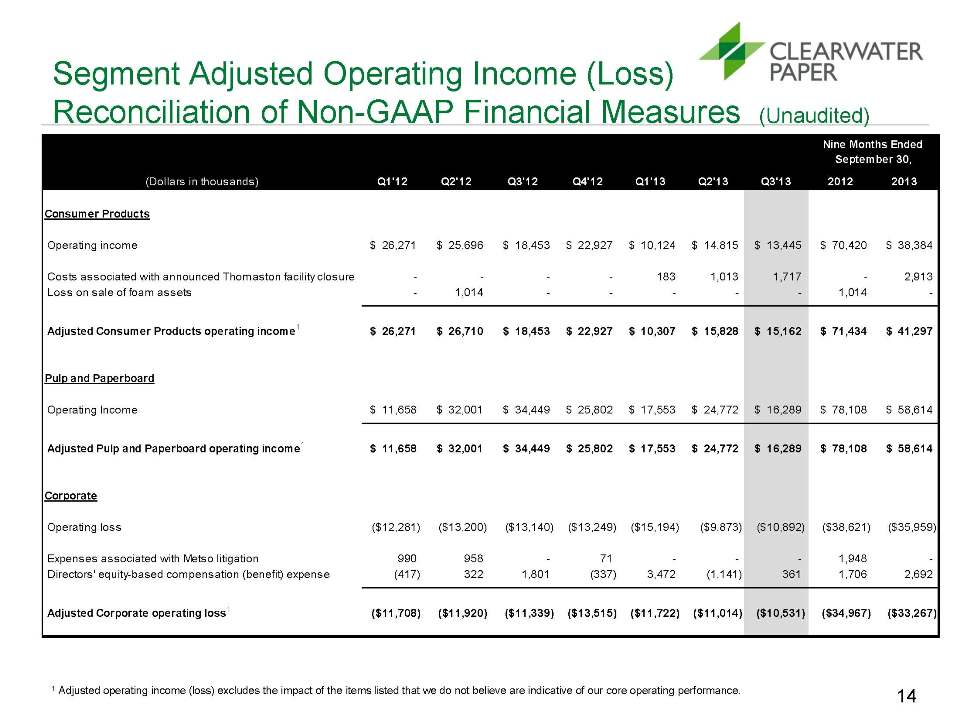
Segment Adjusted Operating Income (Loss) Reconciliation of Non-GAAP Financial Measures (Unaudited) 1 Adjusted operating income (loss) excludes the impact of the items listed that we do not believe are indicative of our core operating performance. (Dollars in thousands)Q1'12Q2'12Q3'12Q4'12Q1'13Q2'13Q3'1320122013Consumer Products Operating income$ 26,271$ 25,696$ 18,453$ 22,927$ 10,124$ 14,815$ 13,445$ 70,420$ 38,384 Costs associated with announced Thomaston facility closure- - - - 183 1,013 1,717 - 2,913 Loss on sale of foam assets- 1,014 - - - - - 1,014 - Adjusted Consumer Products operating income1$ 26,271$ 26,710$ 18,453$ 22,927$ 10,307$ 15,828$ 15,162$ 71,434$ 41,297Pulp and Paperboard Operating Income$ 11,658$ 32,001$ 34,449$ 25,802$ 17,553$ 24,772$ 16,289$ 78,108$ 58,614 Adjusted Pulp and Paperboard operating income1$ 11,658$ 32,001$ 34,449$ 25,802$ 17,553$ 24,772$ 16,289$ 78,108$ 58,614Corporate Operating loss($12,281)($13,200)($13,140)($13,249)($15,194)($9,873)($10,892)($38,621)($35,959) Expenses associated with Metso litigation990 958 - 71 - - - 1,948 - Directors' equity-based compensation (benefit) expense(417) 322 1,801 (337) 3,472 (1,141) 361 1,706 2,692 Adjusted Corporate operating loss1($11,708)($11,920)($11,339)($13,515)($11,722)($11,014)($10,531)($34,967)($33,267)Nine Months Ended September 30, 14
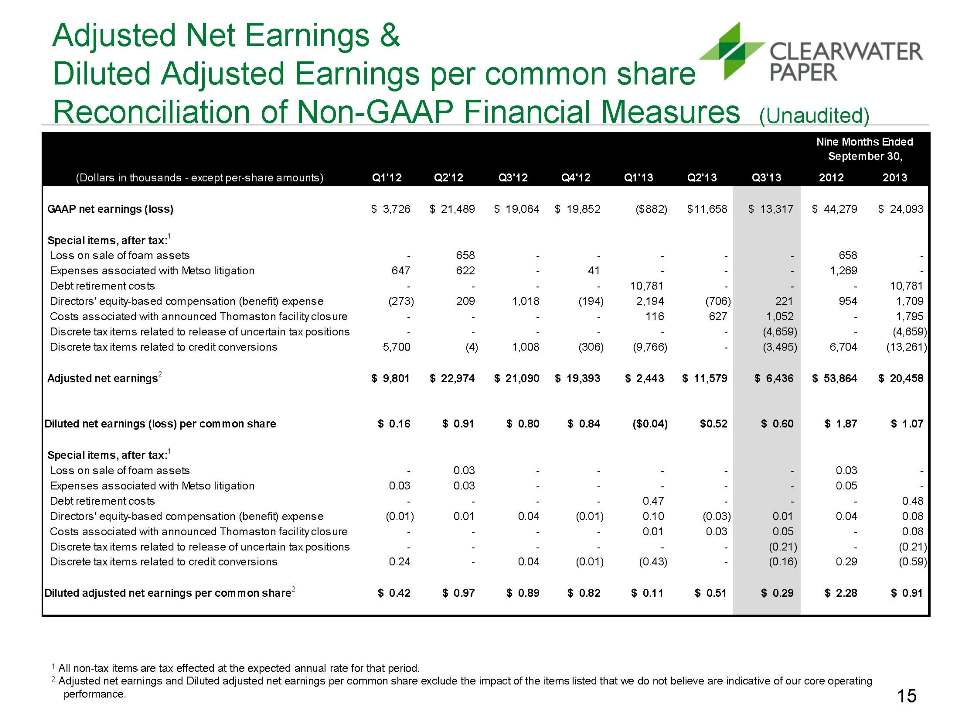
Adjusted Net Earnings & Diluted Adjusted Earnings per common share Reconciliation of Non-GAAP Financial Measures (Unaudited) 1 All non-tax items are tax effected at the expected annual rate for that period. 2 Adjusted net earnings and Diluted adjusted net earnings per common share exclude the impact of the items listed that we do not believe are indicative of our core operating performance. (Dollars in thousands - except per-share amounts)Q1'12Q2'12Q3'12Q4'12Q1'13Q2'13Q3'1320122013 GAAP net earnings (loss)$ 3,726$ 21,489$ 19,064$ 19,852($882)$11,658$ 13,317$ 44,279$ 24,093 Special items, after tax:1 Loss on sale of foam assets- 658 - - - - - 658 - Expenses associated with Metso litigation647 622 - 41 - - - 1,269 - Debt retirement costs- - - - 10,781 - - - 10,781 Directors' equity-based compensation (benefit) expense(273) 209 1,018 (194) 2,194 (706) 221 954 1,709 Costs associated with announced Thomaston facility closure- - - - 116 627 1,052 - 1,795 Discrete tax items related to release of uncertain tax positions- - - - - - (4,659) - (4,659) Discrete tax items related to credit conversions5,700 (4) 1,008 (306) (9,766) - (3,495) 6,704 (13,261) Adjusted net earnings2$ 9,801$ 22,974$ 21,090$ 19,393$ 2,443$ 11,579$ 6,436$ 53,864$ 20,458Diluted net earnings (loss) per common share$ 0.16$ 0.91$ 0.80$ 0.84($0.04)$0.52$ 0.60$ 1.87$ 1.07 Special items, after tax:1 Loss on sale of foam assets- 0.03 - - - - - 0.03 - Expenses associated with Metso litigation0.03 0.03 - - - - - 0.05 - Debt retirement costs- - - - 0.47 - - - 0.48 Directors' equity-based compensation (benefit) expense(0.01) 0.01 0.04 (0.01) 0.10 (0.03) 0.01 0.04 0.08 Costs associated with announced Thomaston facility closure- - - - 0.01 0.03 0.05 - 0.08 Discrete tax items related to release of uncertain tax positions- - - - - - (0.21) - (0.21) Discrete tax items related to credit conversions0.24 - 0.04 (0.01) (0.43) - (0.16) 0.29 (0.59) Diluted adjusted net earnings per common share2$ 0.42$ 0.97$ 0.89$ 0.82$ 0.11$ 0.51$ 0.29$ 2.28$ 0.91Nine Months Ended September 30, 15
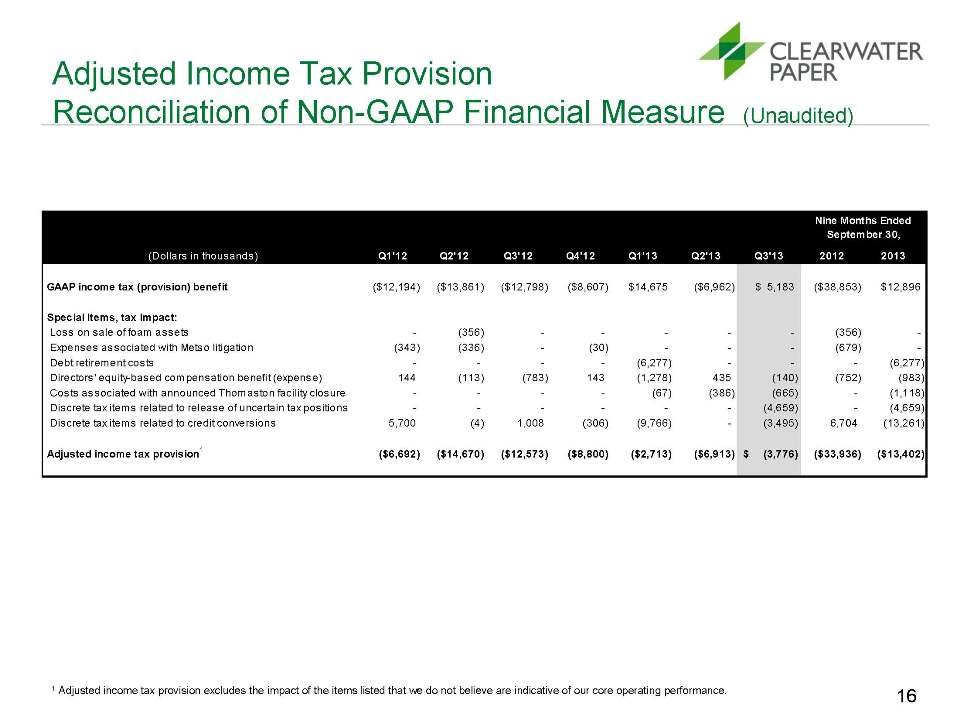
Adjusted Income Tax Provision Reconciliation of Non-GAAP Financial Measure (Unaudited) 1 Adjusted income tax provision excludes the impact of the items listed that we do not believe are indicative of our core operating performance. (Dollars in thousands)Q1'12Q2'12Q3'12Q4'12Q1'13Q2'13Q3'1320122013 GAAP income tax (provision) benefit($12,194)($13,861)($12,798)($8,607)$14,675($6,962)$ 5,183($38,853)$12,896 Special items, tax impact: Loss on sale of foam assets- (356) - - - - - (356) - Expenses associated with Metso litigation(343) (336) - (30) - - - (679) - Debt retirement costs- - - - (6,277) - - - (6,277) Directors' equity-based compensation benefit (expense)144 (113) (783) 143 (1,278) 435 (140) (752) (983) Costs associated with announced Thomaston facility closure- - - - (67) (386) (665) - (1,118) Discrete tax items related to release of uncertain tax positions- - - - - - (4,659) - (4,659) Discrete tax items related to credit conversions5,700 (4) 1,008 (306) (9,766) - (3,495) 6,704 (13,261) Adjusted income tax provision1($6,692)($14,670)($12,573)($8,800)($2,713)($6,913)(3,776)$ ($33,936)($13,402)Nine Months Ended September 30, 16
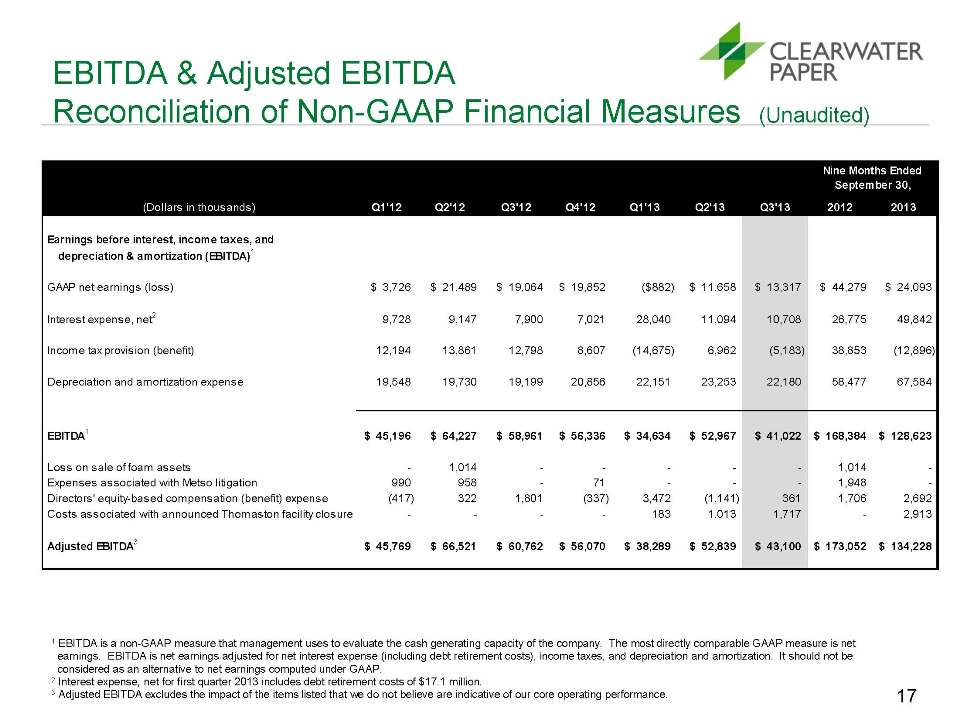
EBITDA & Adjusted EBITDA Reconciliation of Non-GAAP Financial Measures (Unaudited) 1 EBITDA is a non-GAAP measure that management uses to evaluate the cash generating capacity of the company. The most directly comparable GAAP measure is net earnings. EBITDA is net earnings adjusted for net interest expense (including debt retirement costs), income taxes, and depreciation and amortization. It should not be considered as an alternative to net earnings computed under GAAP. 2 Interest expense, net for first quarter 2013 includes debt retirement costs of $17.1 million. 3 Adjusted EBITDA excludes the impact of the items listed that we do not believe are indicative of our core operating performance. (Dollars in thousands)Q1'12Q2'12Q3'12Q4'12Q1'13Q2'13Q3'1320122013 Earnings before interest, income taxes, and depreciation & amortization (EBITDA)1 GAAP net earnings (loss)$ 3,726$ 21,489$ 19,064$ 19,852($882)$ 11,658$ 13,317$ 44,279$ 24,093 Interest expense, net29,7289,1477,9007,02128,04011,09410,70826,77549,842 Income tax provision (benefit)12,19413,86112,7988,607(14,675)6,962(5,183)38,853(12,896) Depreciation and amortization expense19,54819,73019,19920,85622,15123,25322,18058,47767,584 EBITDA1$ 45,196$ 64,227$ 58,961$ 56,336$ 34,634$ 52,967$ 41,022$ 168,384$ 128,623 Loss on sale of foam assets- 1,014 - - - - - 1,014 - Expenses associated with Metso litigation990 958 - 71 - - - 1,948 - Directors' equity-based compensation (benefit) expense(417) 322 1,801 (337) 3,472 (1,141) 361 1,706 2,692 Costs associated with announced Thomaston facility closure- - - - 183 1,013 1,717 - 2,913 Adjusted EBITDA3$ 45,769$ 66,521$ 60,762$ 56,070$ 38,289$ 52,839$ 43,100$ 173,052$ 134,228Nine Months Ended September 30, 17
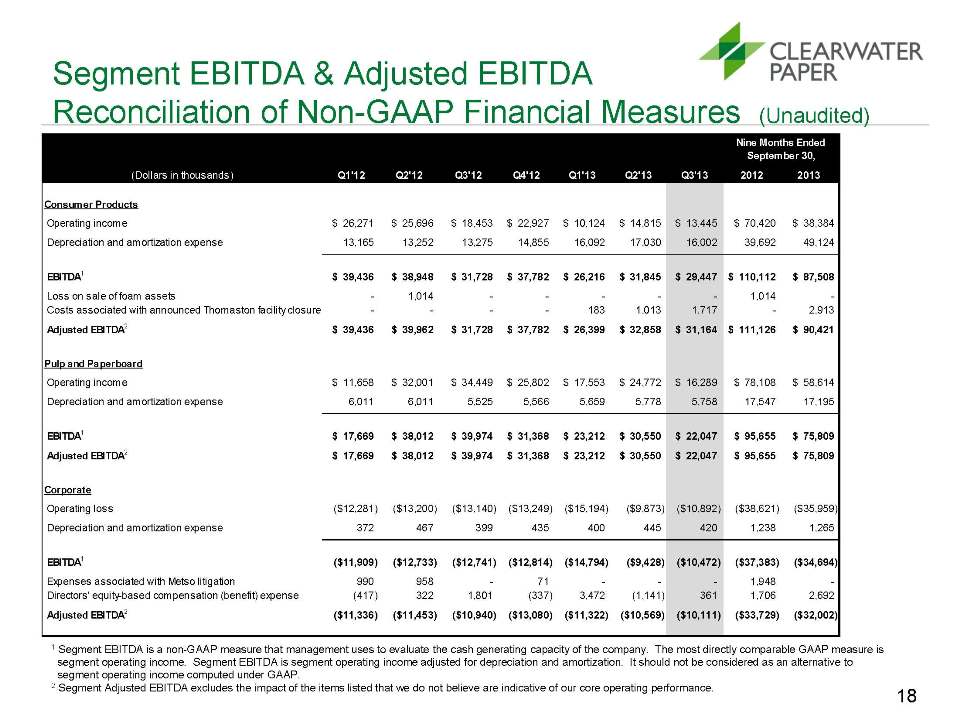
Segment EBITDA & Adjusted EBITDA Reconciliation of Non-GAAP Financial Measures (Unaudited) 1 Segment EBITDA is a non-GAAP measure that management uses to evaluate the cash generating capacity of the company. The most directly comparable GAAP measure is segment operating income. Segment EBITDA is segment operating income adjusted for depreciation and amortization. It should not be considered as an alternative to segment operating income computed under GAAP. 2 Segment Adjusted EBITDA excludes the impact of the items listed that we do not believe are indicative of our core operating performance. (Dollars in thousands)Q1'12Q2'12Q3'12Q4'12Q1'13Q2'13Q3'1320122013Consumer Products Operating income$ 26,271$ 25,696$ 18,453$ 22,927$ 10,124$ 14,815$ 13,445$ 70,420$ 38,384 Depreciation and amortization expense13,165 13,252 13,275 14,855 16,092 17,030 16,002 39,692 49,124 EBITDA1$ 39,436$ 38,948$ 31,728$ 37,782$ 26,216$ 31,845$ 29,447$ 110,112$ 87,508 Loss on sale of foam assets- 1,014 - - - - - 1,014 - Costs associated with announced Thomaston facility closure- - - - 183 1,013 1,717 - 2,913 Adjusted EBITDA2$ 39,436$ 39,962$ 31,728$ 37,782$ 26,399$ 32,858$ 31,164$ 111,126$ 90,421Pulp and Paperboard Operating income$ 11,658$ 32,001$ 34,449$ 25,802$ 17,553$ 24,772$ 16,289$ 78,108$ 58,614 Depreciation and amortization expense6,011 6,011 5,525 5,566 5,659 5,778 5,758 17,547 17,195 EBITDA1$ 17,669$ 38,012$ 39,974$ 31,368$ 23,212$ 30,550$ 22,047$ 95,655$ 75,809 Adjusted EBITDA2$ 17,669$ 38,012$ 39,974$ 31,368$ 23,212$ 30,550$ 22,047$ 95,655$ 75,809Corporate Operating loss($12,281)($13,200)($13,140)($13,249)($15,194)($9,873)($10,892)($38,621)($35,959) Depreciation and amortization expense372 467 399 435 400 445 420 1,238 1,265 EBITDA1($11,909)($12,733)($12,741)($12,814)($14,794)($9,428)($10,472)($37,383)($34,694) Expenses associated with Metso litigation990 958 - 71 - - - 1,948 - Directors' equity-based compensation (benefit) expense(417) 322 1,801 (337) 3,472 (1,141) 361 1,706 2,692 Adjusted EBITDA2($11,336)($11,453)($10,940)($13,080)($11,322)($10,569)($10,111)($33,729)($32,002)Nine Months Ended September 30, 18
For more information: www.clearwaterpaper.com 19