Exhibit 99.1
ANNUAL REPORT SANDSTORM GOLD ROYALTIES


Q4 |
2021 | |
· |
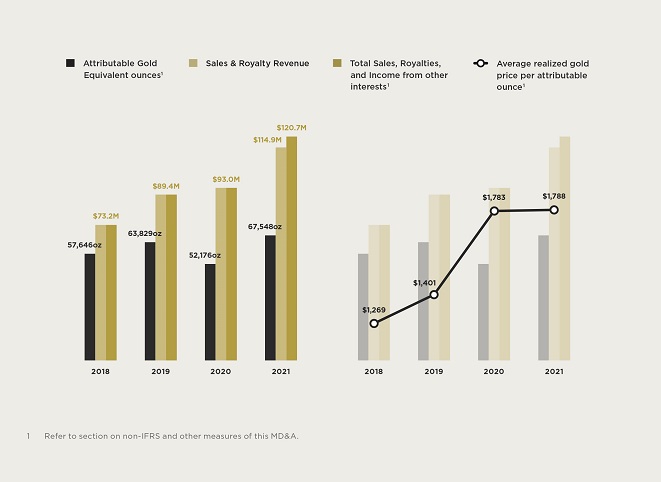
Net income for the three months and year ended December 31, 2021 was $7.4 million and $27.6 million, respectively, compared with net income of $10.5 million and $13.8 million for the comparable periods in 2020. Net income for the most recently completed year represented a record for the Company. |
· |
Attributable Gold Equivalent ounces 1 |
· |
Revenue for the three months and year ended December 31, 2021 was $29.8 million and $114.9 million, respectively, compared with $29.7 million and $93.0 million for the comparable periods in 2020. Revenue for the most recently completed year represented a record for the Company. |
· |
Total Sales, Royalties and Income from other interests 1 (as defined hereinafter) for the three months and year ended December 31, 2021 was $29.8 million and $120.7 million, respectively, compared with $29.7 million and $93.0 million for the comparable periods in 2020. Total Sales, Royalties and Income from other interests1 for the most recently completed year represented a record for the Company. |
· |
Cash flows from operating activities, excluding changes in non-cash working capital1 , for the three months and year ended December 31, 2021 were $22.1 million and $83.5 million, respectively, compared with $22.5 million and $68.3 million for the comparable periods in 2020. Cash flows from operating activities, excluding changes in non-cash working capital1 for the most recently completed year represented a record for the Company. |
· |
Cost of sales, excluding depletion, for the three months and year ended December 31, 2021 were $3.7 million and $16.8 million, respectively, compared with $3.9 million and $14.0 million for the comparable periods in 2020. |
· |
Average cash costs 1 |
· |
Cash operating margins 1 |
| 1 | Refer to section on non-IFRS and other measures of this MD&A. |
· |
In May 2021, the Company acquired a package of royalties for consideration of $7 million. The package includes 21 royalties on development, advanced exploration and exploration stage projects located in Nevada and Montana. |
· |
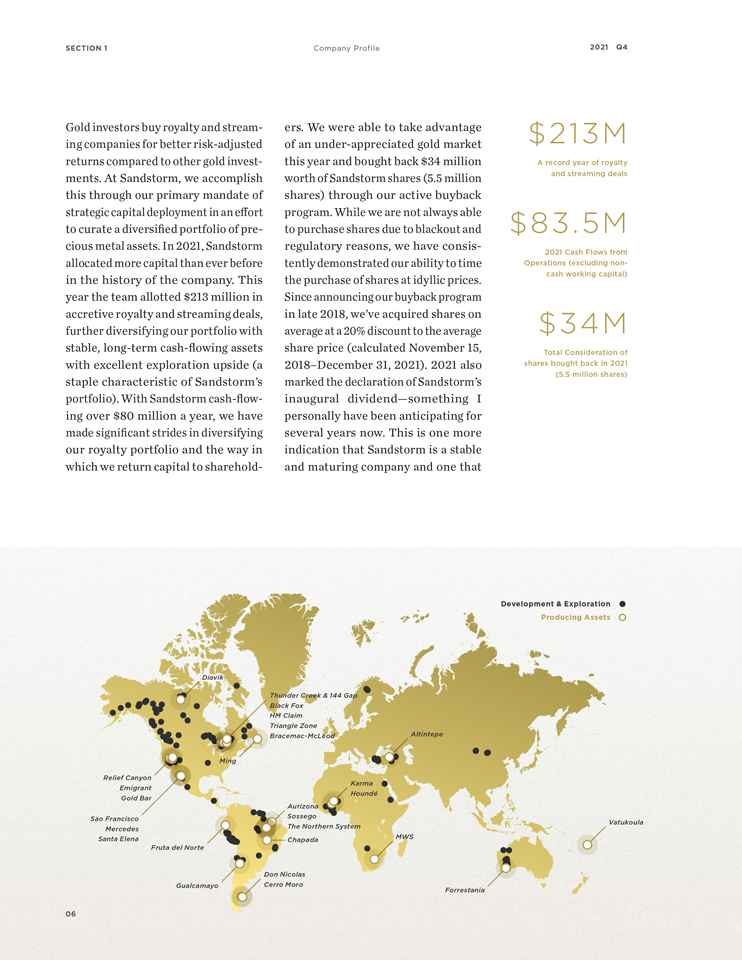
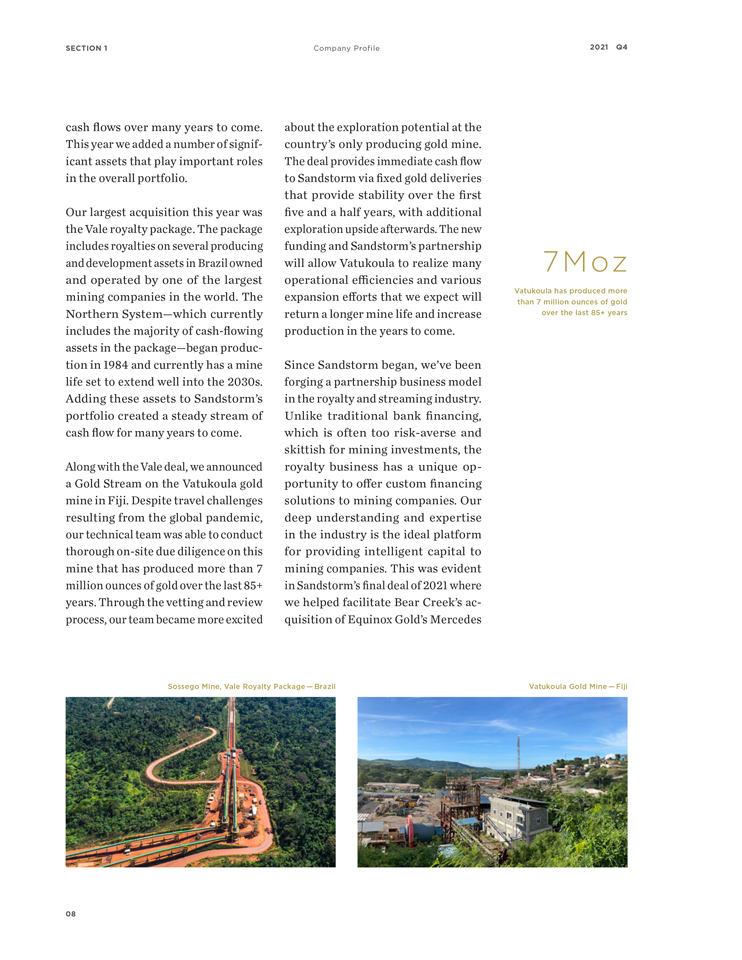
In June 2021, the Company acquired a diverse package of Vale Royalties which provide holders with life of mine net sales royalties on certain of Vale’s producing and exploration assets. The royalties provide exposure to several of Vale’s long-life, low-cost assets and are expected to contribute to Sandstorm’s portfolio for several decades. |
· |
In June 2021, the Company agreed to acquire a Gold Stream on the operating Vatukoula gold mine in Fiji in exchange for a $30 million upfront deposit. The stream entitles Sandstorm to purchase 25,920 ounces of gold over a 5.5-year period and thereafter 2.55%-2.9% of the gold produced from the mine for ongoing per ounce cash payments equal to 20% of the spot price of the gold. In addition to the Gold Stream, Sandstorm will also receive an effective 0.45% NSR on certain prospecting licenses. |
· |
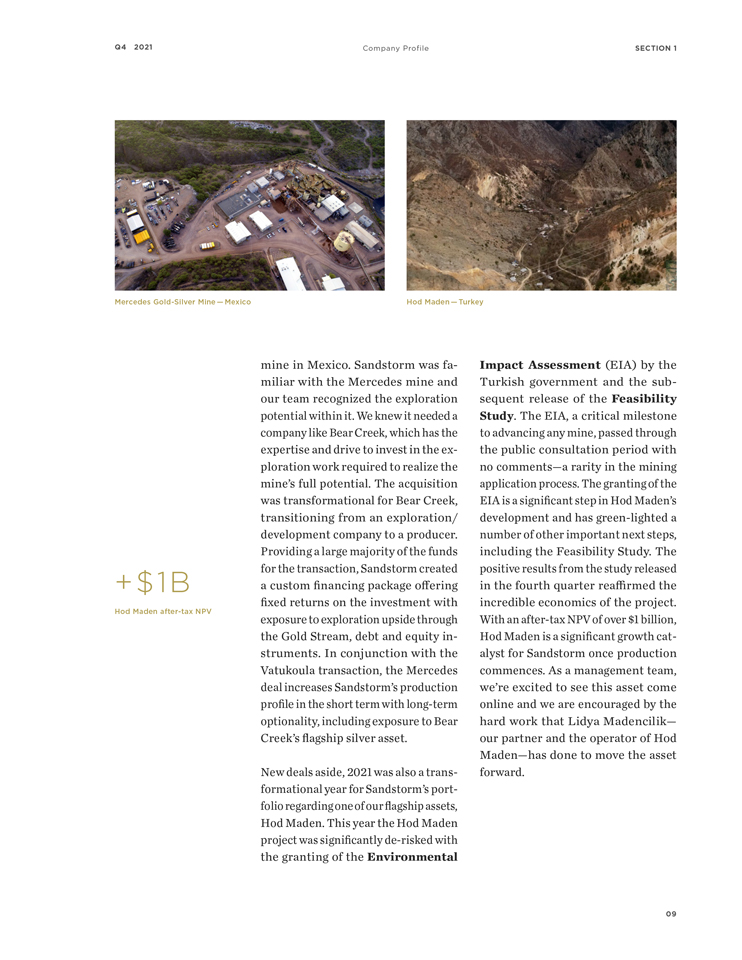
In December 2021, the Company announced a $60 million financing package with Bear Creek Mining to facilitate its acquisition of the producing Mercedes gold-silver mine in Mexico from Equinox Gold Corp. The financing package includes a $37.5 million Gold Stream and a $22.5 million convertible debenture. The transaction is expected to close by March 31, 2022 and gold deliveries to Sandstorm will commence immediately thereafter. |
· |
In October 2021, the Hod Maden project received the final approval of the Environmental Impact Assessment for the project from the Ministry of Environment and Urbanization of Turkey. The approval marks the next development phase and triggers several key catalysts including the application for the final permits and initiating long-lead construction items. |
· |
In November 2021, the Company announced the results of the Hod Maden Feasibility Study, for which Sandstorm holds a 30% interest. The study projects a pre-tax net present value (5% discount rate) of $1.3 billion and an internal rate of return of 41%. The study also outlines total production of more than 2.5 million gold equivalent ounces over a 13 year mine life and it is expected that gold will be produced at an all-in sustaining cost on a by-product basis of $334 per ounce1 |
· |
Subsequent to year end, the Company announced that it had reached an agreement with Royalty North Partners Ltd. to sell its 30% interest in Hod Maden and its equity interest in Entrée. In consideration, Sandstorm will receive a flagship Gold Stream on Hod Maden and a portion of debt and equity in the resulting New-Co. The transaction is subject to various closing conditions and is expected to close in the second half of 2022. With this transaction, Sandstorm intends to unlock additional value in Hod Maden through the re-rating of the asset as a Gold Stream in its portfolio and further repositions Sandstorm as a pure-play precious metals royalty and streaming company. |
| 1 | Refer to section on non-IFRS and other measures of this MD&A. |
· |
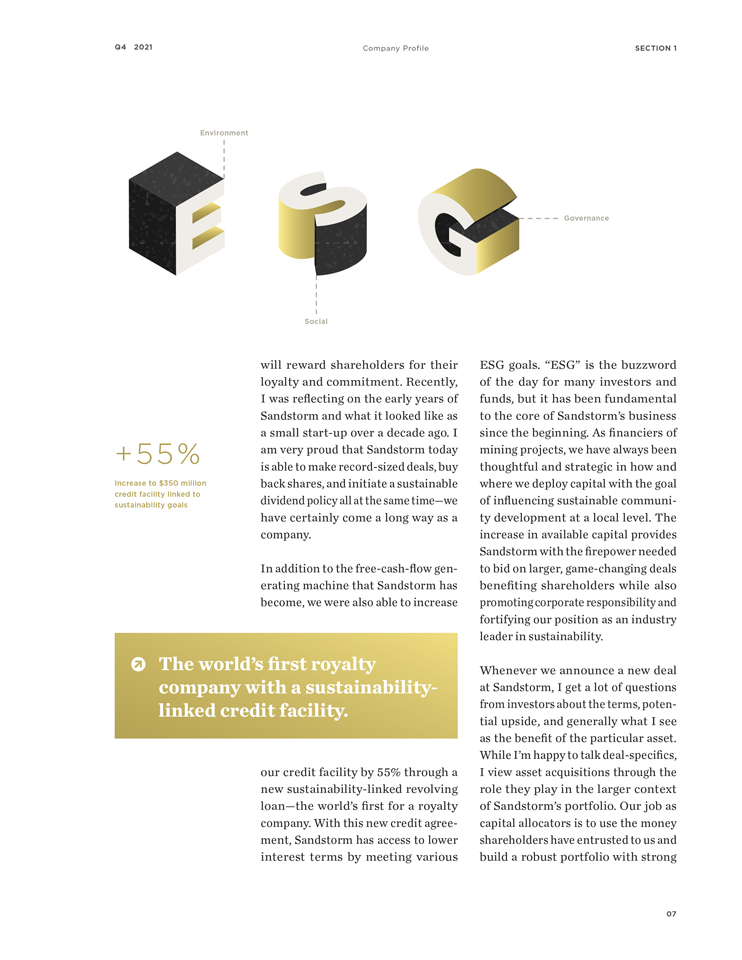
On October 6, 2021, Sandstorm amended its revolving credit agreement allowing the Company to borrow up to $350 million, and incorporated sustainability-linked performance targets to become the first royalty company to establish an Environment, Social, and Governance linked credit facility. The ESG Revolving Facility incorporates sustainability-linked incentive pricing terms that allow Sandstorm to reduce borrowing costs as the Company’s sustainability performance targets are met. The tenure of the facility is four years and is extendable by mutual consent of Sandstorm and the banking syndicate. |
· |
On December 15, 2021 Sandstorm declared its inaugural dividend of CAD$0.02 per share, paid on January 28, 2022 and each quarter thereafter, subject to annual increases. |
· |
During the year ended December 31, 2021 and under the Company’s normal course issuer bid, the Company purchased and cancelled approximately 5.5 million common shares for total consideration of $34.2 million. |
| 1 | Refer to section on non-IFRS and other measures of this MD&A. |
| i. | 4.2% of the copper produced (up to an annual maximum of 3.9 million pounds of copper) until the mine has delivered 39 million pounds of copper to Sandstorm; then |
| ii. | 3.0% of the copper produced until, on a cumulative basis, the mine has delivered 50 million pounds of copper to Sandstorm; then |
| iii. | 1.5% of the copper produced thereafter, for the life of the mine. |
· |
0.03% net sales royalty on the Sossego copper-gold mine; and |
· |
0.06% net sales royalty on copper and gold and a 0.03% net sales royalty on all other minerals from certain assets. |
· |
0.05% net sales royalty on iron ore sales from the Northern System; and |
· |
0.05% net sales royalty on iron ore sales from a portion of the Southeastern System (subject to certain thresholds described below). |
· |
0.03% of net sales proceeds in the event of an underlying asset sale on certain assets. |
| 1 | Refer to section on non-IFRS and other measures of this MD&A. |
In $000s (except for per share and per ounce amounts) |
Dec. 31, 2021 |
Dec. 31, 2020 |
Dec. 31, 2019 |
|||||||||
| Total revenue |
$ | 114,860 | $ | 93,025 | $ | 89,434 | ||||||
| Attributable Gold Equivalent ounces 1 |
67,548 | 52,176 | 63,829 | |||||||||
| Sales |
$ | 71,722 | $ | 58,660 | $ | 63,602 | ||||||
| Royalty revenue |
43,138 | 34,365 | 25,832 | |||||||||
| Average realized gold price per attributable ounce 1 |
1,788 | 1,783 | 1,401 | |||||||||
| Average cash cost per attributable ounce 1 |
249 | 269 | 286 | |||||||||
| Cash flows from operating activities |
81,139 | 65,616 | 57,339 | |||||||||
| Net income |
27,622 | 13,817 | 16,397 | |||||||||
| Basic income per share |
0.14 | 0.07 | 0.09 | |||||||||
| Diluted income per share |
0.14 | 0.07 | 0.09 | |||||||||
| Total assets |
620,858 | 649,921 | 623,175 | |||||||||
| Total long-term liabilities |
20,873 | 8,345 | 48,414 | |||||||||
| 1 | Refer to section on non-IFRS and other measures of this MD&A. |
| In $000s (except for ounces sold) |
Product |
Attributable Gold Equivalent ounces |
Sales and royalty revenues |
Cost of sales excluding depletion |
Depletion expense |
Stream, Royalty and Other Interests Impairments |
Gain on Vale Royalties financial instrument |
Income (loss) before taxes |
Cash flows from operating activities |
|||||||||||||||||||||||||||
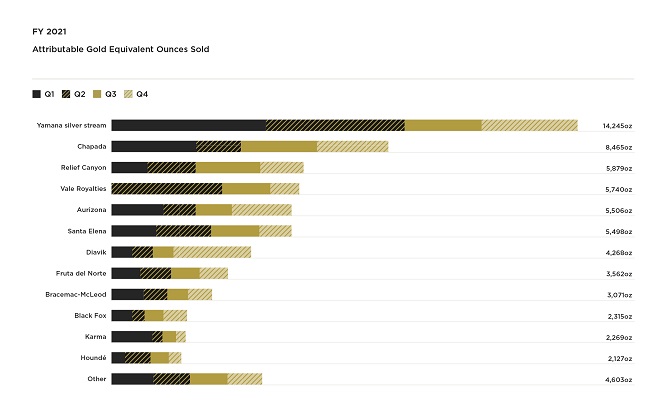
| Aurizona |
Gold | 5,506 | $ | 9,844 | $ | - | $ | 815 | $ | - | $ | - | $ | 9,029 | $ | 9,444 | ||||||||||||||||||||
| Black Fox |
Gold | 2,315 | 4,154 | 1,309 | 1,888 | - | - | 957 | 2,845 | |||||||||||||||||||||||||||
| Bracemac-McLeod 1 |
Various | 3,071 | 5,487 | - | 1,545 | - | - | 3,942 | 4,995 | |||||||||||||||||||||||||||
| Chapada |
Copper | 8,465 | 15,118 | 4,541 | 2,963 | - | - | 7,614 | 10,577 | |||||||||||||||||||||||||||
| Diavik |
Diamonds | 4,268 | 7,647 | - | 3,372 | - | - | 4,275 | 7,097 | |||||||||||||||||||||||||||
| Fruta del Norte |
Gold | 3,562 | 6,367 | - | 2,304 | - | - | 4,063 | 4,465 | |||||||||||||||||||||||||||
| Houndé |
Gold | 2,127 | 3,803 | - | 1,610 | - | - | 2,193 | 3,802 | |||||||||||||||||||||||||||
| Karma |
Gold | 2,269 | 4,065 | 824 | 1,935 | - | - | 1,306 | 3,241 | |||||||||||||||||||||||||||
| Relief Canyon |
Gold | 5,879 | 10,499 | - | 4,711 | - | - | 5,788 | 10,499 | |||||||||||||||||||||||||||
| Santa Elena |
Gold | 5,498 | 9,786 | 2,568 | 280 | - | - | 6,938 | 7,357 | |||||||||||||||||||||||||||
| Vale Royalties |
Iron Ore | 5,740 | 4,398 | - | 1,444 | - | (5,887 | ) | 8,841 | 198 | ||||||||||||||||||||||||||
| Yamana silver stream |
Silver | 14,245 | 25,460 | 7,603 | 10,415 | - | - | 7,442 | 17,857 | |||||||||||||||||||||||||||
| Other 2 |
Various | 4,603 | 8,232 | - | 2,422 | 408 | - | 5,402 | 8,658 | |||||||||||||||||||||||||||
| Corporate |
- | - | - | - | - | - | (22,937 | ) | (9,896 | ) | ||||||||||||||||||||||||||
| Consolidated |
67,548 |
$ |
114,860 |
$ |
16,845 |
$ |
35,704 |
$ |
408 |
$ |
(5,887 |
) |
$ |
44,853 |
$ |
81,139 |
||||||||||||||||||||
| 1 | Royalty revenue from Bracemac-McLeod consists of $2.8 million from copper and $2.7 million from zinc. |
| 2 | Includes royalty revenue from gold of $7.6 million and other base metals of $0.6 million. |
| In $000s (except for ounces sold) |
Product |
Attributable Gold Equivalent ounces |
Sales and royalty revenues |
Cost of sales excluding depletion |
Depletion expense |
Stream, Royalty and Other Interests Impairments |
Other |
Income (loss) before taxes |
Cash flows from operating activities |
|||||||||||||||||||||||||||
| Aurizona |
Gold | 4,958 | $ | 8,850 | $ | - | $ | 1,067 | $ | - | $ | - | $ | 7,783 | $ | 7,950 | ||||||||||||||||||||
| Black Fox |
Gold | 2,137 | 3,693 | 1,194 | 1,014 | - | - | 1,485 | 2,500 | |||||||||||||||||||||||||||
| Bracemac-McLeod 1 |
Various | 1,634 | 2,946 | - | 1,485 | - | - | 1,461 | 3,234 | |||||||||||||||||||||||||||
| Chapada |
Copper | 5,585 | 9,904 | 3,021 | 2,914 | - | - | 3,969 | 6,883 | |||||||||||||||||||||||||||
| Diavik |
Diamonds | 1,489 | 2,716 | - | 2,085 | 7,862 | 392 | (7,623 | ) | 3,075 | ||||||||||||||||||||||||||
| Fruta del Norte |
Gold | 1,815 | 3,302 | - | 1,256 | - | - | 2,046 | 1,408 | |||||||||||||||||||||||||||
| Houndé |
Gold | 4,874 | 8,740 | - | 3,816 | - | - | 4,924 | 6,633 | |||||||||||||||||||||||||||
| Karma |
Gold | 4,584 | 8,184 | 1,619 | 3,843 | - | - | 2,722 | 6,438 | |||||||||||||||||||||||||||
| Relief Canyon |
Gold | 3,819 | 7,096 | - | 2,820 | - | - | 4,276 | 7,096 | |||||||||||||||||||||||||||
| Santa Elena |
Gold | 5,526 | 9,749 | 2,552 | 312 | - | - | 6,885 | 7,100 | |||||||||||||||||||||||||||
| Yamana silver stream |
Silver | 10,912 | 19,199 | 5,660 | 10,119 | - | - | 3,420 | 13,540 | |||||||||||||||||||||||||||
| Other 2 |
Various | 4,843 | 8,646 | - | 2,393 | 1,015 | - | 5,238 | 7,553 | |||||||||||||||||||||||||||
| Corporate |
- | - | - | - | - | 135 | (12,310 | ) | (7,794 | ) | ||||||||||||||||||||||||||
| Consolidated |
52,176 |
$ |
93,025 |
$ |
14,046 |
$ |
33,124 |
$ |
8,877 |
$ |
527 |
$ |
24,276 |
$ |
65,616 |
|||||||||||||||||||||
| 1 | Royalty revenue from Bracemac-McLeod consists of $1.4 million from copper and $1.5 million from zinc. |
| 2 | Includes royalty revenue from gold of $8.1 million and other base metals of $0.5 million. |
In $000s (except for per share and per ounce amounts) |
Dec. 31, 2021 |
Sep. 30, 2021 |
Jun. 30, 2021 |
Mar. 31, 2021 |
||||||||||||
| Total revenue |
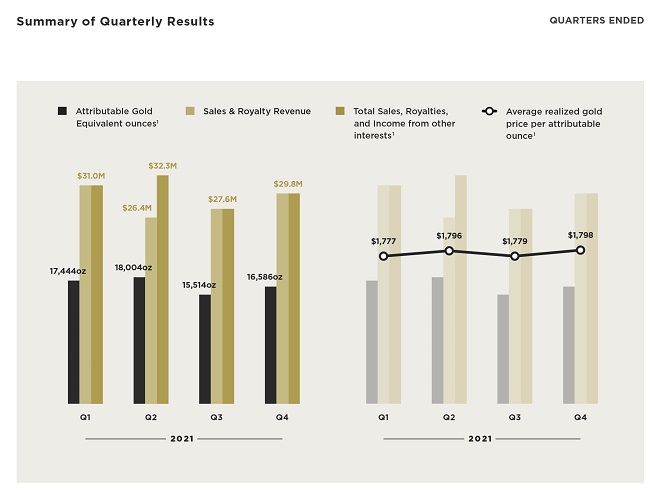
$ | 29,821 | $ | 27,596 | $ | 26,446 | $ | 30,997 | ||||||||
| Attributable Gold Equivalent ounces 1 |
16,586 | 15,514 | 18,004 | 17,444 | ||||||||||||
| Sales |
$ | 15,772 | $ | 16,879 | $ | 17,487 | $ | 21,584 | ||||||||
| Royalty revenue |
14,049 | 10,717 | 8,959 | 9,413 | ||||||||||||
| Average realized gold price per attributable ounce 1 |
1,798 | 1,779 | 1,796 | 1,777 | ||||||||||||
| Average cash cost per attributable ounce 1 |
224 | 238 | 227 | 307 | ||||||||||||
| Cash flows from operating activities |
19,505 | 17,914 | 19,998 | 23,722 | ||||||||||||
| Net income |
7,395 | 6,622 | 8,636 | 4,969 | ||||||||||||
| Basic income per share |
0.04 | 0.03 | 0.04 | 0.03 | ||||||||||||
| Diluted income per share |
0.04 | 0.03 | 0.04 | 0.03 | ||||||||||||
| Total assets |
620,858 | 640,920 | 648,741 | 638,659 | ||||||||||||
| Total long-term liabilities |
20,873 | 17,425 | 14,342 | 10,723 | ||||||||||||
In $000s (except for per share and per ounce amounts) |
Dec. 31, 2020 |
Sep. 30, 2020 |
Jun. 30, 2020 |
Mar. 31, 2020 |
||||||||||||
| Total revenue |
$ | 29,696 | $ | 23,267 | $ | 18,730 | $ | 21,332 | ||||||||
| Attributable Gold Equivalent ounces 1 |
15,795 | 12,068 | 10,920 | 13,393 | ||||||||||||
| Sales |
$ | 17,560 | $ | 14,187 | $ | 12,580 | $ | 14,333 | ||||||||
| Royalty revenue |
12,136 | 9,080 | 6,150 | 6,999 | ||||||||||||
| Average realized gold price per attributable ounce 1 |
1,880 | 1,928 | 1,715 | 1,593 | ||||||||||||
| Average cash cost per attributable ounce 1 |
248 | 258 | 257 | 314 | ||||||||||||
| Cash flows from operating activities |
19,806 | 18,085 | 12,351 | 15,374 | ||||||||||||
| Net income (loss) |
10,504 | 6,518 | 7,137 | (10,342 | ) | |||||||||||
| Basic income (loss) per share |
0.05 | 0.03 | 0.04 | (0.06 | ) | |||||||||||
| Diluted income (loss) per share |
0.05 | 0.03 | 0.04 | (0.06 | ) | |||||||||||
| Total assets |
649,921 | 608,748 | 607,471 | 576,316 | ||||||||||||
| Total long-term liabilities |
8,345 | 3,638 | 3,096 | 53,221 | ||||||||||||
| 1 | Refer to section on non-IFRS and other measures of this MD&A. |
| 1 | Refer to section on non-IFRS and other measures of this MD&A. |
In $000s (except for ounces sold) |
Product |
Attributable Gold Equivalent ounces |
Sales and royalty revenues |
Cost of sales excluding depletion |
Depletion expense |
Income (loss) before taxes |
Cash flows from operating activities |
|||||||||||||||||||
| Aurizona |
Gold | 1,833 | $ | 3,297 | $ | - | $ | 188 | $ | 3,109 | $ | 2,347 | ||||||||||||||
| Black Fox |
Gold | 730 | 1,321 | 414 | 595 | 312 | 907 | |||||||||||||||||||
| Bracemac-McLeod 1 |
Various | 727 | 1,307 | - | 454 | 853 | 1,261 | |||||||||||||||||||
| Chapada |
Copper | 2,183 | 3,924 | 1,179 | 747 | 1,998 | 2,745 | |||||||||||||||||||
| Diavik |
Diamonds | 2,366 | 4,254 | - | 639 | 3,615 | 4,184 | |||||||||||||||||||
| Fruta del Norte |
Gold | 872 | 1,567 | - | 569 | 998 | 1,152 | |||||||||||||||||||
| Houndé |
Gold | 376 | 675 | - | 264 | 411 | 94 | |||||||||||||||||||
| Karma |
Gold | 299 | 538 | 107 | 256 | 175 | 431 | |||||||||||||||||||
| Relief Canyon |
Gold | 1,334 | 2,388 | - | 1,130 | 1,258 | 2,388 | |||||||||||||||||||
| Santa Elena |
Gold | 986 | 1,774 | 461 | 50 | 1,263 | 1,810 | |||||||||||||||||||
| Vale Royalties |
Iron Ore | 890 | 1,600 | - | 666 | 934 | 198 | |||||||||||||||||||
| Yamana silver stream |
Silver | 2,930 | 5,268 | 1,546 | 2,323 | 1,399 | 3,722 | |||||||||||||||||||
| Other |
Gold | 1,060 | 1,908 | - | 472 | 1,436 | 1,907 | |||||||||||||||||||
| Corporate |
- | - | - | - | (6,164 | ) | (3,641 | ) | ||||||||||||||||||
| Consolidated |
16,586 |
$ |
29,821 |
$ |
3,707 |
$ |
8,353 |
$ |
11,597 |
$ |
19,505 |
|||||||||||||||
| 1 | Royalty revenue from Bracemac-McLeod consists of $0.7 million from copper and $0.6 million from zinc. |
In $000s (except for ounces sold) |
Product |
Attributable Gold Equivalent ounces |
Sales and royalty revenues |
Cost of sales excluding depletion |
Depletion expense |
Income (loss) before taxes |
Cash flows from operating activities |
|||||||||||||||||||
| Aurizona |
Gold | 1,445 | $ | 2,716 | $ | - | $ | 226 | $ | 2,490 | $ | 2,516 | ||||||||||||||
| Black Fox |
Gold | 555 | 1,037 | 312 | 263 | 462 | 727 | |||||||||||||||||||
| Bracemac-McLeod 1 |
Various | 454 | 853 | - | 394 | 459 | 1,123 | |||||||||||||||||||
| Chapada |
Copper | 1,550 | 2,914 | 875 | 778 | 1,261 | 2,039 | |||||||||||||||||||
| Diavik |
Diamonds | 612 | 1,149 | - | 12 | 1,137 | 1,000 | |||||||||||||||||||
| Fruta del Norte |
Gold | 1,040 | 1,955 | - | 648 | 1,307 | 680 | |||||||||||||||||||
| Houndé |
Gold | 1,580 | 2,970 | - | 1,058 | 1,912 | 2,231 | |||||||||||||||||||
| Karma |
Gold | 834 | 1,566 | 304 | 698 | 564 | 1,104 | |||||||||||||||||||
| Relief Canyon |
Gold | 1,667 | 3,152 | - | 1,238 | 1,914 | 3,152 | |||||||||||||||||||
| Santa Elena |
Gold | 1,080 | 2,025 | 500 | 61 | 1,464 | 1,445 | |||||||||||||||||||
| Yamana silver stream |
Silver | 3,405 | 6,401 | 1,931 | 2,715 | 1,755 | 4,471 | |||||||||||||||||||
| Other 2 |
Various | 1,573 | 2,958 | - | 438 | 2,520 | 2,085 | |||||||||||||||||||
| Corporate |
- | - | - | - | (1,331 | ) | (2,767 | ) | ||||||||||||||||||
| Consolidated |
15,795 |
$ |
29,696 |
$ |
3,922 |
$ |
8,529 |
$ |
15,914 |
$ |
19,806 |
|||||||||||||||
| 1 | Royalty revenue from Bracemac-McLeod consists of $0.5 million from copper and $0.4 million from zinc. |
| 2 | Includes royalty revenue from gold of $2.9 million and other base metals of $0.1 million. |
· |
A $3.1 million decrease in the gains recognized on the revaluation of the Company’s investments; whereby, a loss of $0.2 million was recognized by the Company during the three months ended December 31, 2021; while during the three months ended December 31, 2020 the Company recognized a gain of $2.9 million mostly driven by an increase in the fair value of the Americas Gold convertible debenture. |
· |
A $3.1 million increase in revenue attributable to the Diavik mine largely due to diamond price increases, the receipt of previously unrecognized royalty payments and the timing of sales; |
· |
A $1.6 million increase in revenue attributable to the Vale Royalties, which were purchased in June 2021; and |
· |
A $1.0 million increase in revenue attributable to the Chapada copper stream primarily due to an increase in the average realized selling price of copper which increased from an average of $2.96 per pound during the three months ended December 31, 2020 to an average of $4.16 per pound during the equivalent period in 2021; |
· |
A $2.3 million decrease in revenue attributable to the Houndé Mine largely driven by a 76% decrease in the number of Attributable Gold Equivalent ounces sold. The decrease is primarily due to mine sequencing whereby Endeavour is currently mining areas of the Houndé Mine not subject to the Company’s royalty; |
· |
A $1.1 million decrease in revenue attributable to the Yamana silver stream primarily due to a 15% decrease in the number of silver ounces sold, as well as a decrease in the average realized selling price of silver which decreased from an average of $23.83 per ounce during the three months ended December 31, 2020 to an average of $23.05 per ounce during the equivalent period in 2021; and |
· |
A $1.0 million decrease in revenue attributable to the Karma Mine largely driven by an 64% decrease in the number of Attributable Gold Equivalent Ounces sold. The decrease is primarily due to the conclusion of the five-year fixed delivery period in accordance with the terms of the Gold Stream in the first quarter of 2021, reducing Sandstorm’s Gold Stream entitlement to 1.625% of production. In contrast, in the fourth quarter of 2020, Sandstorm’s entitlement was 1,250 ounces per quarter. |
· |
An $8.5 million decrease in non-cash impairment charges; whereby, the Company recorded a $0.4 million impairment related to certain royalties within the Company’s Other segment during the year ended December 31, 2021; while for the comparable period in 2020 the Company recorded an impairment of $8.9 million related to the Company’s Diavik royalty and certain other royalties within the Company’s Other segment; and |
· |
A $5.9 million gain on the revaluation of the Company’s financial instrument related to the Vale Royalties which was both entered into and disposed of during the year ended December 31, 2021; |
· |
An increase in tax expense of $6.8 million primarily as a result of the increase in net income; |
· |
A $5.5 million decrease in the gains recognized on the revaluation of the Company’s investments; whereby, a loss of $1.7 million was recognized by the Company during the year ended December 31, 2021, primarily driven by the change in fair value of the Americas Gold convertible; while during the year ended December 31, 2020 the Company recognized a gain of $3.8 million primarily driven by the change in fair value of the Company’s Equinox warrants; |
· |
A $2.8 million increase in cost of sales, excluding depletion partly due to an increase in Attributable Gold Equivalent ounces sold; and |
· |
A $2.6 million increase in depletion expense also partly due to an increase in Attributable Gold Equivalent ounces sold. |
· |
A $6.3 million increase in revenue attributable to the Yamana silver stream primarily due to an increase in the average realized selling price of silver which increased from an average of $19.18 per ounce during the year ended December 31, 2020 to an average of $24.84 per ounce during the equivalent period in 2021; |
· |
A $5.2 million increase in revenue attributable to the Chapada copper stream primarily due to an increase in the average realized selling price of copper which increased from an average of $2.73 per pound during the year ended December 31, 2020 to an average of $4.04 per pound during the equivalent period in 2021; |
· |
A $4.9 million increase in royalty revenue attributable to the Diavik mine largely due to diamond price increases and the timing of sales; |
· |
A $4.4 million increase in revenue attributable to the Vale Royalties, which was acquired in June 2021; |
· |
A $3.4 million increase in sales revenue attributable to the Relief Canyon Gold Stream which commenced making fixed deliveries to Sandstorm in May 2020; |
· |
A $3.1 million increase in revenue attributable to the Fruta del Norte Mine largely driven by a 96% increase in the Attributable Gold Equivalent ounces sold. The increase in ounces is attributable to the fact that during the year |
| ended December 31, 2020, production at Fruta del Norte was impacted by a temporary suspension of operations due to concerns over the spread of COVID-19 as well as the initial ramp up to commercial production; whereas in the comparable period in 2021, the mine was operating with fewer COVID-19 related disruptions and with the benefit of optimization efforts undertaken in 2021 by Lundin Gold; and |
· |
A $2.5 million increase in royalty revenue attributable to the Bracemac-McLeod mine largely due to commodity price increases; |
· |
A $4.9 million decrease in revenue attributable to the Houndé Mine largely driven by a 56% decrease in the number of Attributable Gold Equivalent ounces sold. The decrease is primarily due to mine sequencing whereby Endeavour is currently mining areas of the Houndé mine not subject to the Company’s royalty; and |
· |
A $4.1 million decrease in revenue attributable to the Karma Mine largely driven by a 51% decrease in the number of gold ounces sold. The decrease is primarily due to the conclusion of the five-year fixed delivery period in accordance with the terms of the Gold Stream in the first quarter of 2021, reducing Sandstorm’s Gold Stream entitlement to 1.625% of production. In contrast, during the year ended December 31, 2020, Sandstorm’s entitlement was 1,250 ounces per quarter. |
· |
An $8.9 million non-cash impairment charge relating to the Company’s Diavik royalty and certain other royalties within its Other segment was recognized during the three months ended March 31, 2020. |
· |
A $5.9 million gain on the revaluation of the Company’s financial instrument related to the Vale Royalties which was both entered into and disposed of during the three months ended June 30, 2021. |
· |
A $2.4 million non-cash impairment charge relating to the Company’s Diavik royalty was recognized during the three months ended December 31, 2019. |
· |
The Company recognized gains and losses with respect to the revaluation of its investments, which were primarily driven by changes in the fair value of the Equinox and Americas Gold convertible debentures. These gains/losses were recognized as follows: |
◾ |
During the three months ended December 31, 2021, a loss of $0.2 million was recognized; |
◾ |
During the three months ended September 30, 2021, a gain of $0.2 million was recognized; |
◾ |
During the three months ended June 30, 2021, a gain of $0.1 million was recognized; |
◾ |
During the three months ended March 31, 2021, a loss of $1.8 million was recognized; |
◾ |
During the three months ended December 31, 2020, a gain of $2.9 million was recognized; |
◾ |
During the three months ended September 30, 2020, a gain of $1.7 million was recognized; |
◾ |
During the three months ended June 30, 2020, a gain of $5.1 million was recognized; and |
◾ |
During the three months ended March 31, 2020, a loss of $5.9 million was recognized. |
· |
With the exception of 2020, Attributable Gold Equivalent ounces had seen an overall increase as a result of the acquisition of various assets including the Vale Royalty acquisition during the three months ended June 30, 2021, the Houndé royalty acquisition during the three months ended March 31, 2018, the Teck Resources Limited royalty package which consists of 52 royalties and was purchased during the three months ended March 31, 2016 and the Yamana silver stream and Chapada copper stream which were acquired in the three months ended December 31, 2015. In 2020, Attributable Gold Equivalent ounces decreased as a result of COVID-19 related temporary suspensions at the mines from which Sandstorm receives royalty revenue or deliveries under its Streams. |
| i. | Total Sales, Royalties and Income from Other Interests is a new non-IFRS measure in the year and is calculated by taking total revenue which includes Sales and Royalty Revenue, and adding contractual income relating to royalties, streams and other interests excluding gains and losses on dispositions. The Company presents Total Sales, Royalties and Income from other interests as it believes that certain investors use this information to evaluate the Company’s performance in comparison to other streaming and royalty companies in the precious metals mining industry. Figure 1.1 |
Figure 1.1 |
||||||||||||||||
In $000s |
3 Months Ended Dec. 31, 2021 |
3 Months Ended Dec. 31, 2020 |
Year Ended Dec. 31, 2021 |
Year Ended Dec. 31, 2020 |
||||||||||||
| Total Revenue |
$ | 29,821 | $ | 29,696 | $ | 114,860 | $ | 93,025 | ||||||||
| Add: |
||||||||||||||||
| Gain on revaluation of Vale Royalties financial instrument 1 |
- | - | 5,887 | - | ||||||||||||
| Equals: |
||||||||||||||||
| Total Sales, Royalties, and Income from other interests |
$ |
29,821 |
$ |
29,696 |
$ |
120,747 |
$ |
93,025 |
||||||||
| 1 | During the year ended December 31, 2021, the Company entered into and disposed of certain derivative financial instruments relating to the market value of the Vale Royalties, resulting in fair value gains of $5.9 million recognized within net income. |
| ii. | Average cash cost per Attributable Gold Equivalent ounce is calculated by dividing the Company’s cost of sales, excluding depletion by the number of Attributable Gold Equivalent ounces. The Company presents average cash cost per Attributable Gold Equivalent ounce as it believes that certain investors use this information to evaluate the Company’s performance in comparison to other streaming and royalty companies in the precious metals mining industry who present results on a similar basis. Figure 1.2 |
Figure 1.2 |
||||||||||||||||
In $000s (except for ounces and per ounce amounts) |
3 Months Ended Dec. 31, 2021 |
3 Months Ended Dec. 31, 2020 |
Year Ended Dec. 31, 2021 |
Year Ended Dec. 31, 2020 |
||||||||||||
| Cost of Sales, excluding depletion 1 |
$ | 3,707 | $ | 3,922 | $ | 16,845 | $ | 14,046 | ||||||||
| Divided by: |
||||||||||||||||
| Total Attributable Gold Equivalent ounces 2 |
16,586 | 15,795 | 67,548 | 52,176 | ||||||||||||
| Equals: |
||||||||||||||||
| Average cash cost (per Attributable Gold Equivalent ounce) |
$ |
224 |
$ |
248 |
$ |
249 |
$ |
269 |
||||||||
| 1 | Cost of Sales, excluding depletion, includes cash payments made for Gold Equivalent ounces associated with commodity streams. |
| 2 | The Company’s royalty and other commodity stream revenue, including adjustments for contractual income relating to those interests (see item i above), is converted to an Attributable Gold Equivalent ounce basis by dividing the royalty and other commodity revenue, including adjustments for contractual income relating to those interests, for that period by the average realized gold price per ounce from the Company’s Gold Streams for the same respective period. These Attributable Gold Equivalent ounces, when combined with the gold ounces sold from the Company’s Gold Streams, equal total Attributable Gold Equivalent ounces. |
| iii. | Average realized gold price per Attributable Gold Equivalent ounce is calculated by dividing the Company’s Total Sales, Royalties, and Income from other interests (described further in item i above) by the number of Attributable Gold Equivalent ounces. The Company presents average realized gold price per Attributable Gold Equivalent ounce as it believes that certain investors use this information to evaluate the Company’s performance in comparison to other streaming and royalty companies in the precious metals mining industry that present results on a similar basis. Figure 1.3 |
Figure 1.3 |
||||||||||||||||
In $000s (except for ounces and per ounce amounts) |
3 Months Ended Dec. 31, 2021 |
3 Months Ended Dec. 31, 2020 |
Year Ended Dec. 31, 2021 |
Year Ended Dec. 31, 2020 |
||||||||||||
| Total Sales, Royalties, and Income from other interests 1 |
$ | 29,821 | $ | 29,696 | $ | 120,747 | $ | 93,025 | ||||||||
| Divided by: |
||||||||||||||||
| Total Attributable Gold Equivalent ounces |
16,586 | 15,795 | 67,548 | 52,176 | ||||||||||||
| Equals: |
||||||||||||||||
| Average realized gold price (per Attributable Gold Equivalent ounce) |
$ |
1,798 |
$ |
1,880 |
$ |
1,788 |
$ |
1,783 |
||||||||
| 1 | Prior to June 30, 2021, average realized gold price was calculated by dividing Total Revenue, rather than Total Sales, Royalties and Income from other interests, by Total Attributable Gold Equivalent ounces. The change in the measure did not result in a change to prior periods. |
| iv. | Cash operating margin is calculated by subtracting the average cash cost per Attributable Gold Equivalent ounce from the average realized gold price per Attributable Gold Equivalent ounce. The Company presents cash operating margin as it believes that certain investors use this information to evaluate the Company’s performance in comparison to other streaming and royalty companies in the precious metals mining industry that present results on a similar basis. |
| v. | Cash flows from operating activities excluding changes in non-cash working capital is calculated by adding back the decrease or subtracting the increase in changes in non-cash working capital to or from cash provided by (used in) operating activities. The Company presents cash flows from operating activities excluding changes in non-cash working capital as it believes that certain investors use this information to evaluate the Company’s performance in comparison to other streaming and royalty companies in the precious metals mining industry that present results on a similar basis. Figure 1.4 non-cash working capital. |
Figure 1.4 |
||||||||||||||||
In $000s |
3 Months Ended Dec. 31, 2021 |
3 Months Ended Dec. 31, 2020 |
Year Ended Dec. 31, 2021 |
Year Ended Dec. 31, 2020 |
||||||||||||
| Cash flows from operating activities |
$ | 19,505 | $ | 19,806 | $ | 81,139 | $ | 65,616 | ||||||||
| Add: |
||||||||||||||||
| Changes in non-cash working capital |
2,586 | 2,725 | 2,341 | 2,722 | ||||||||||||
| Equals: |
||||||||||||||||
| Cash flows from operating activities excluding changes in non-cash working capital |
$ |
22,091 |
$ |
22,531 |
$ |
83,480 |
$ |
68,338 |
||||||||
| vi. | The Company has also used the non-IFRS measure of all-in sustaining cost per gold ounce on a by-product basis. With respect to the Hod Maden project, all-in sustaining cost per gold ounce on a by-product basis is calculated by deducting copper revenue from the summation of certain costs (operating costs, royalties, treatment, refining & transport costs, sustaining capital, G&A, and other costs). The resulting figure is then divided by the payable gold ounces produced. The Company presents all-in sustaining cost per gold ounce on a by-product basis as it believes that certain investors use this information to evaluate the Company’s performance in comparison to other companies in the precious metals mining industry that present results on a similar basis. The calculation of the measure is shown below. |
Stream |
% of Life of Mine Gold or Relevant Commodity 5,6,7,8,9,10 |
Per Ounce Cash Payment: lesser of amount below and the then prevailing market price of commodity (unless otherwise noted) 1, 2, 3,4 | ||
| Black Fox |
8% | $577 | ||
| Chapada |
4.2% | 30% of copper spot price | ||
| Entrée |
5.62% on Hugo North Extension and 4.26% on Heruga | $220 | ||
| Karma |
1.625% | 20% of gold spot price | ||
| Relief Canyon |
32,022 ounces over 5.5 years and 4% thereafter | Varies | ||
| Santa Elena |
20% | $468 | ||
| Vatukoula |
25,920 ounces over 5.5 years and 2.9% thereafter | 20% of gold spot price | ||
| Yamana silver stream |
20% | 30% of silver spot price | ||
| 1 | Subject to an annual inflationary adjustment. |
| 2 | For the Relief Canyon stream, after receipt of 32,022 gold ounces (the cost of which is nil), the Company is entitled to purchase 4.0% of the gold and silver produced from the Relief Canyon Mine for ongoing per ounce cash payments equal to 30%–65% of the spot price of gold or silver, with the range dependent on the concession’s existing royalty obligations. |
| 3 | For the Entrée Gold Stream, after approximately 8.6 million ounces of gold have been produced from the joint venture property, the price increases to $500 per gold ounce. |
| 4 | For the Entrée silver stream, percentage of life of mine is 5.62% on Hugo North Extension and 4.26% on Heruga which the Company can purchase for the lesser of the prevailing market price and $5 per ounce of silver until 40.3 million ounces of silver have been produced from the entire joint venture property. Thereafter, the purchase price will increase to the lesser of the prevailing market price and $10 per ounce of silver. |
| 5 | For the Entrée Gold and silver stream, percentage of life of mine is 5.62% on Hugo North Extension and 4.26% on Heruga if the minerals produced are contained below 560 metres in depth. |
| 6 | For the Entrée Gold and silver stream, percentage of life of mine is 8.43% on Hugo North Extension and 6.39% on Heruga if the minerals produced are contained above 560 metres in depth. |
| 7 | For the Entrée copper stream, the Company has committed to purchase an amount equal to 0.42% of the copper produced from the Hugo North Extension and Heruga deposits. If the minerals produced are contained above 560 metres in depth, then the commitment increases to 0.62% for both the Hugo North Extension and Heruga deposits. Sandstorm will make ongoing per pound cash payments equal to the lesser of $0.50 and the then prevailing market price of copper, until 9.1 billion pounds of copper have been produced from the entire joint venture property. Thereafter, the ongoing per pound payments will increase to the lesser of $1.10 and the then prevailing market price of copper. |
| 8 | For the Chapada copper stream, the Company has committed to purchase an amount equal to 4.2% of the copper produced (up to an annual maximum of 3.9 million pounds of copper) until the mine has delivered 39 million pounds of copper to Sandstorm; then 3.0% of the copper produced until, on a cumulative basis, the mine has delivered 50 million pounds of copper to Sandstorm; then 1.5% of the copper produced thereafter, for the life of the mine. |
| 9 | Under the terms of the Yamana silver stream, Sandstorm has agreed to purchase an amount of silver from Cerro Moro equal to 20% of the silver produced (up to an annual maximum of 1.2 million ounces of silver), until Yamana has delivered to Sandstorm 7.0 million ounces of silver; then 9.0% of the silver produced thereafter. |
| 10 | Under the terms of the Vatukoula stream, after receipt of 25,920 gold ounces (the cost of which is 20% of the spot price), the Company is entitled to purchase 2.9% for the first 100,000 ounces of gold produced in a calendar year, and 2.55% for the volume of production above 100,000 ounces. |
Year of expiry |
Number outstanding |
Vested |
Exercise price per share (range) (CAD) 1 |
Weighted average exercise price per share (CAD) 1 | ||||
| 2022 |
760,582 | 760,582 | 5.50–15.00 | 5.53 | ||||
| 2023 |
3,118,332 | 3,118,332 | 5.92 | 5.92 | ||||
| 2024 |
1,427,000 | 951,338 | 8.89 | 8.89 | ||||
| 2025 |
2,812,000 | 937,340 | 9.43 | 9.43 | ||||
| 2026 |
2,968,000 | - | 7.18 | - | ||||
11,085,914 |
5,767,592 |
6.93 | ||||||
1 |
Weighted average exercise price of options that are exercisable. |
In $000s |
Year Ended December 31, 2021 |
Year Ended December 31, 2020 |
||||||
| Salaries and benefits |
$ | 2,588 | $ | 1,561 | ||||
| Share-based payments |
4,368 | 4,068 | ||||||
| Total key management compensation expense |
$ |
6,956 |
$ |
5,629 |
||||
· |
Maintaining records, that in reasonable detail, accurately and fairly reflect our transactions and dispositions of the assets of the Company; |
· |
Providing reasonable assurance that transactions are recorded as necessary for preparation of the consolidated financial statements in accordance with IFRS; |
· |
Providing reasonable assurance that receipts and expenditures are made in accordance with authorizations of management and the directors of the Company; and |
· |
Providing reasonable assurance that unauthorized acquisition, use or disposition of Company assets that could have a material effect on the Company’s consolidated financial statements would be prevented or detected on a timely basis. |
“Nolan Watson” |
“Erfan Kazemi” | |
| President & Chief Executive Officer |
Chief Financial Officer | |
February 17, 2022 |
||
Q4 |
2021 | |
Consolidated Statements of Financial Position |
Expressed in U.S. Dollars ($000s) |
— ASSETS |
Note |
December 31, 2021 |
December 31, 2020 |
|||||||
| Current |
||||||||||
| Cash and cash equivalents |
$ |
$ |
||||||||
| Trade and other receivables |
||||||||||
| Other current assets |
||||||||||
| Short-term investments |
7 |
|||||||||
$ |
$ |
|||||||||
| Non-Current |
|
|
|
|
|
|
|
|
|
|
| Stream, royalty and other interests |
5 |
$ |
$ |
|||||||
| Hod Maden and other investments in associates |
6 |
|||||||||
| Investments |
7 |
|||||||||
| Other long-term assets |
||||||||||
| Total assets |
$ |
$ |
||||||||
| — LIABILITIES |
||||||||||
| Current |
||||||||||
| Trade and other payables |
$ |
$ |
||||||||
| Non-Current |
||||||||||
| Deferred income tax liabilities |
10 |
$ |
$ |
|||||||
| Lease liabilities and other |
||||||||||
$ |
$ |
|||||||||
| — EQUITY |
||||||||||
| Share capital |
9 |
$ |
$ |
|||||||
| Reserves |
||||||||||
| Retained earnings |
||||||||||
| Accumulated other comprehensive loss |
( |
) |
( |
) | ||||||
$ |
$ |
|||||||||
| Total liabilities and equity |
$ |
$ |
||||||||
Consolidated Statements of Income (Loss) |
Expressed in U.S. Dollars ($000s) Except for per share amounts |
|||||||||
Note |
Year Ended December 31, 2021 |
Year Ended December 31, 2020 |
||||||||
| Sales |
15 | $ | $ | |||||||
| Royalty revenue |
15 | |||||||||
$ |
$ |
|||||||||
| |
|
|
|
|
|
|
|
|
|
|
| Cost of sales, excluding depletion |
15 | $ | $ | |||||||
| Depletion |
15 | |||||||||
| Total cost of sales |
$ |
$ |
||||||||
| Gross profit |
$ |
$ |
||||||||
| Expenses and other (income) |
||||||||||
| Administration expenses 1 |
11 | $ | $ | |||||||
| Project evaluation 1 |
11 |
|||||||||
| Gain on revaluation of Vale Royalties financial instrument |
7 | ( |
- | |||||||
| Loss (gain) on revaluation of investments |
7 | ( |
||||||||
| Finance expense |
||||||||||
| Finance income |
( |
( |
||||||||
| Other |
||||||||||
| Stream, royalty and other interests impairments |
5 | |||||||||
| Foreign exchange loss |
||||||||||
| Income before taxes |
$ |
$ |
||||||||
| Current income tax expense |
10 | $ | $ | |||||||
| Deferred income tax expense |
10 | |||||||||
$ |
$ |
|||||||||
| Net income for the year |
$ |
$ |
||||||||
| Basic earnings per share |
$ | $ | ||||||||
| Diluted earnings per share |
$ | $ | ||||||||
| |
|
|
|
|
|
|
|
|
|
|
| Weighted average number of common shares outstanding |
||||||||||
| Basic |
9 (d) | |||||||||
| Diluted |
9 (d) | |||||||||
| 1. Equity settled share-based compensation (a non-cash item) is included in administration expenses and project evaluation |
$ | $ | ||||||||
Consolidated Statements of Comprehensive Income (Loss) |
Expressed in U.S. Dollars ($000s) |
|||||||||
Note |
Year Ended December 31, 2021 |
Year Ended December 31, 2020 |
||||||||
Net income for the year |
$ |
$ |
||||||||
Other Comprehensive Loss for the Year |
||||||||||
Items that may subsequently be reclassified to net income: |
||||||||||
Currency translation differences |
$ |
( |
$ |
( |
||||||
Items that will not subsequently be reclassified to net income: |
||||||||||
(Loss) gain on FVTOCI investments |
7 |
( |
||||||||
Tax recovery (expense) on FVTOCI investments |
( |
|||||||||
Total other comprehensive loss for the year |
$ |
( |
$ |
( |
||||||
Total comprehensive (loss) income for the year |
$ |
( |
$ |
|||||||
Consolidated Statements of Cash Flow |
Expressed in U.S. Dollars ($000s) |
|||||||||||
Cash flow from (used in): |
Note |
Year Ended December 31, 2021 |
Year Ended December 31, 2020 |
|||||||||
| — OPERATING ACTIVITIES |
||||||||||||
| Net income for the year |
|
|
$ |
$ |
||||||||
| |
||||||||||||
| Items not affecting cash: |
|
|
||||||||||
| |
||||||||||||
| Depletion and depreciation |
|
|
$ |
$ |
||||||||
| |
||||||||||||
| Deferred income tax expense |
|
|
||||||||||
| |
||||||||||||
| Share-based payments |
|
|
||||||||||
| |
||||||||||||
| Gain on revaluation of Vale Royalties financial instrument |
|
7 |
|
( |
- |
|||||||
| |
||||||||||||
| Loss (gain) on revaluation of investments |
|
|
( |
|||||||||
| |
||||||||||||
| Stream, royalty and other interests impairments |
|
5 |
|
|
||||||||
| |
||||||||||||
| Interest expense and financing amortization |
|
|
||||||||||
| |
||||||||||||
| Unrealized foreign exchange loss |
|
|
||||||||||
| |
||||||||||||
| Other |
|
|
||||||||||
| |
||||||||||||
| Changes in non-cash working capital |
|
12 |
|
( |
( |
|||||||
| |
||||||||||||
| |
|
$ |
$ |
|||||||||
| |
||||||||||||
| |
|
|
||||||||||
| |
||||||||||||
| — INVESTING ACTIVITIES |
|
|
||||||||||
| |
||||||||||||
| Acquisition of stream, royalty, and other interests |
|
5 |
|
$ |
( |
$ |
( |
|||||
| |
||||||||||||
| Proceeds from disposal of investments and other |
|
|
||||||||||
| |
||||||||||||
| Acquisition of investments and other assets |
|
|
( |
( |
||||||||
| |
||||||||||||
| Investment in Hod Maden interest |
|
6 |
|
( |
( |
|||||||
| |
||||||||||||
| |
|
$ |
( |
$ |
||||||||
| |
||||||||||||
| |
|
|
||||||||||
| |
||||||||||||
| — FINANCING ACTIVITIES |
|
|
||||||||||
| |
||||||||||||
| Redemption of common shares (normal course issuer bid) |
|
9 (a ) |
|
$ |
( |
$ |
( |
|||||
| |
||||||||||||
| Interest paid |
|
|
( |
( |
||||||||
| |
||||||||||||
| Proceeds on exercise of warrants, options and other |
|
|
||||||||||
| |
||||||||||||
| Bank debt drawn |
|
|
||||||||||
| |
||||||||||||
| Bank debt repaid |
|
|
( |
|||||||||
| |
||||||||||||
| |
|
$ |
( |
$ |
||||||||
| |
|
|
|
|
|
|
|
|
|
|
|
|
| Effect of exchange rate changes on cash and cash equivalents |
|
|
$ |
( |
$ |
( |
||||||
| |
||||||||||||
| |
|
|
||||||||||
| |
||||||||||||
| Net (decrease) increase in cash and cash equivalents |
|
|
$ |
( |
$ |
|||||||
| |
||||||||||||
| Cash and cash equivalents — beginning of the year |
|
|
||||||||||
| |
||||||||||||
| Cash and cash equivalents — end of the year |
|
|
$ |
$ |
||||||||
1 |
Supplemental cash flow information (note 12) |
Consolidated Statements of Changes in Equity |
Expressed in U.S. Dollars ($000s) |
SHARE CAPITAL |
RESERVES |
|||||||||||||||||||||||||||||||
Note |
Number |
Amount |
Share Options and Restricted Share Rights |
Share Purchase Warrants |
Retained Earnings (Deficit) |
Accumulated Other Comprehensive Loss |
Total |
|||||||||||||||||||||||||
At January 1, 2020 |
$ |
$ |
$ |
$ |
( |
$ |
( |
$ |
||||||||||||||||||||||||
Options exercised |
9 (b) |
( |
- |
- |
- |
|||||||||||||||||||||||||||
Warrants exercised and expired |
- |
( |
- |
- |
||||||||||||||||||||||||||||
Vesting of restricted share rights |
( |
- |
- |
- |
- |
|||||||||||||||||||||||||||
Acquisition and cancellation of common shares (normal course issuer bid) |
( |
( |
- |
- |
- |
- |
( |
|||||||||||||||||||||||||
Share-based payments |
- |
- |
- |
- |
- |
|||||||||||||||||||||||||||
Share issuance costs |
- |
( |
- |
- |
- |
( |
||||||||||||||||||||||||||
Total comprehensive income (loss) |
- |
- |
- |
- |
( |
|||||||||||||||||||||||||||
At December 31, 2020 |
$ |
$ |
$ |
- |
$ |
$ |
( |
$ |
||||||||||||||||||||||||
Options exercised |
9 (b) |
( |
- |
- |
- |
|||||||||||||||||||||||||||
Vesting of restricted share rights |
( |
- |
- |
- |
- |
|||||||||||||||||||||||||||
Acquisition and cancellation of common shares (normal course issuer bid) |
9 (a) |
( |
( |
- |
- |
- |
- |
( |
||||||||||||||||||||||||
Share-based payments |
- |
- |
- |
- |
- |
|||||||||||||||||||||||||||
Share issuance costs |
- |
( |
- |
- |
- |
- |
( |
|||||||||||||||||||||||||
Dividends declared |
- |
- |
- |
- |
( |
( |
||||||||||||||||||||||||||
Total comprehensive income (loss) |
- |
- |
- |
- |
( |
( |
||||||||||||||||||||||||||
At December 31, 2021 |
$ |
$ |
$ |
- |
$ |
$ |
( |
$ |
||||||||||||||||||||||||
A. |
Statement of Compliance |
B. |
Basis of Presentation |
C. |
Principles of Consolidation |
D. |
Business Combinations |
E. |
Investments in Associates |
F. |
Goodwill |
G. |
Stream, Royalty and Other Interests |
H. |
Impairment of Stream, Royalty and Other Interests |
I. |
Exploration Assets |
J. |
Revenue Recognition |
K. |
Foreign Currency Translation |
L. |
Financial Instruments |
M. |
Inventory |
N. |
Cash and Cash Equivalents |
O. |
Income Taxes |
P. |
Share Capital and Share Purchase Warrants |
Q. |
Earnings Per Share |
R. |
Share Based Payments |
S. |
Related Party Transactions |
T. |
Segment Reporting |
U. |
Leases |
3 |
– Key Sources of Estimation Uncertainty and Critical Accounting Judgments |
A. |
Attributable Reserve and Resource Estimates |
B. |
Investments |
· |
The purpose and design of the investee entity. |
· |
The ability to exercise power, through substantive rights, over the activities of the investee entity that significantly affect its returns. |
· |
The size of the Company’s equity ownership and voting rights, including potential voting rights. |
· |
The size and dispersion of other voting interests, including the existence of voting blocks. |
· |
Other investments in or relationships with the investee entity including, but not limited to, current or possible board representation, royalty and/or stream investments, loans and other types of financial support, material transactions with the investee entity, interchange of managerial personnel or consulting positions. |
· |
Other relevant and pertinent factors. |
C. |
Income Taxes |
D. |
Impairment of Assets |
E. |
Accounting for Acquisition of Assets and Stream, Royalty and Other Interests |
F. |
Functional Currency |
G. |
COVID-19 Estimation Uncertainty |
4 |
– Financial Instruments |
A. |
Capital Risk Management |
B. |
Fair Value Estimation |
In $000s |
Total |
Quoted prices in active markets for identical assets (Level 1) |
Significant other observable inputs (Level 2) |
Significant unobservable inputs (Level 3) |
||||||||||||
| Long-term investments |
||||||||||||||||
| Common shares held |
$ |
$ |
$ |
$ |
||||||||||||
| Warrants and other |
||||||||||||||||
| Convertible debt |
||||||||||||||||
$ |
$ |
$ |
$ |
|||||||||||||
As at December 31, 2020: |
| |||||||||||||||
In $000s |
Total |
Quoted prices in active markets for identical assets (Level 1) |
Significant other observable inputs (Level 2) |
Significant unobservable inputs (Level 3) |
||||||||||||
| Short-term investments |
||||||||||||||||
| Convertible debt |
$ |
$ |
$ |
$ |
||||||||||||
| Long-term investments |
||||||||||||||||
| Common shares held |
$ |
$ |
$ |
$ |
||||||||||||
| Warrants and other |
||||||||||||||||
| Convertible debt |
||||||||||||||||
$ |
$ |
$ |
$ |
|||||||||||||
C. |
Credit Risk |
D. |
Currency Risk |
E. |
Liquidity Risk |
F. |
Other Price Risk |
5 |
– Stream, Royalty and Other Interests |
A. |
Carrying Amount |
COST |
ACCUMULATED DEPLETION |
|||||||||||||||||||||||||||||||||||
In $000s |
Opening |
Net Additions (Disposals) |
Ending |
Opening |
Depletion 1 |
Depletion in Ending Inventory |
Impairment |
Ending |
Carrying Amount |
|||||||||||||||||||||||||||
Aurizona, Brazil |
$ | $ | $ | $ | $ | $ | $ | $ | $ | |||||||||||||||||||||||||||
Black Fox, Canada |
||||||||||||||||||||||||||||||||||||
Bracemac-McLeod, Canada |
||||||||||||||||||||||||||||||||||||
Chapada, Brazil |
||||||||||||||||||||||||||||||||||||
Diavik, Canada |
||||||||||||||||||||||||||||||||||||
Fruta del Norte, Ecuador |
||||||||||||||||||||||||||||||||||||
Hod Maden, Turkey |
||||||||||||||||||||||||||||||||||||
Houndé, Burkina Faso |
||||||||||||||||||||||||||||||||||||
Hugo North Extension and Heruga, Mongolia |
||||||||||||||||||||||||||||||||||||
Karma, Burkina Faso |
||||||||||||||||||||||||||||||||||||
Relief Canyon, United States |
||||||||||||||||||||||||||||||||||||
Santa Elena, Mexico |
||||||||||||||||||||||||||||||||||||
Vale Royalties, Brazil |
||||||||||||||||||||||||||||||||||||
Vatukoula, Fiji |
||||||||||||||||||||||||||||||||||||
Yamana silver stream, Argentina |
||||||||||||||||||||||||||||||||||||
Other 2 |
||||||||||||||||||||||||||||||||||||
Total 3 |
$ |
$ |
$ |
$ |
$ |
$ |
$ |
$ |
$ |
|||||||||||||||||||||||||||
| 1 | Depletion during the period in the Consolidated Statements of Income (loss) of $ |
| 2 | Includes Mt. Hamilton, Prairie Creek, Gualcamayo, Emigrant Springs, Mine Waste Solutions, Thunder Creek, Hackett River, Lobo-Marte, Agi Dagi & Kirazli, HM Claim, Ming, and others. |
| 3 | Stream, Royalty and Other Interests includes non-depletable assets of $ |
COST |
ACCUMULATED DEPLETION |
|||||||||||||||||||||||||||||||||||
In $000s |
Opening |
Net Additions (Disposals) |
Ending |
Opening |
Depletion |
Depletion in Ending Inventory |
Impairment |
Ending |
Carrying Amount |
|||||||||||||||||||||||||||
Aurizona, Brazil |
$ | $ | $ | $ | $ | $ | $ | $ | $ | |||||||||||||||||||||||||||
Black Fox, Canada |
||||||||||||||||||||||||||||||||||||
Bracemac-McLeod, Canada |
||||||||||||||||||||||||||||||||||||
Chapada, Brazil |
||||||||||||||||||||||||||||||||||||
Diavik, Canada |
||||||||||||||||||||||||||||||||||||
Fruta del Norte, Ecuador |
||||||||||||||||||||||||||||||||||||
Hod Maden, Turkey |
||||||||||||||||||||||||||||||||||||
Houndé, Burkina Faso |
||||||||||||||||||||||||||||||||||||
Hugo North Extension and Heruga, Mongolia |
||||||||||||||||||||||||||||||||||||
Karma, Burkina Faso |
||||||||||||||||||||||||||||||||||||
Relief Canyon, United States |
||||||||||||||||||||||||||||||||||||
Santa Elena, Mexico |
||||||||||||||||||||||||||||||||||||
Yamana silver stream, Argentina |
||||||||||||||||||||||||||||||||||||
Other 1 |
||||||||||||||||||||||||||||||||||||
Total 2 |
$ |
$ |
$ |
$ |
$ |
$ |
$ |
$ |
$ |
|||||||||||||||||||||||||||
| 1 | Includes Mt. Hamilton, Prairie Creek, Gualcamayo, Emigrant Springs, Mine Waste Solutions, Thunder Creek, Hackett River, Lobo-Marte, Agi Dagi & Kirazli, HM Claim, Ming, and others. |
| 2 | Stream, Royalty and Other Interests includes non-depletable assets of $ |
B. |
Significant Acquisitions |
· |
· |
· |
· |
· |
C. |
Impairment |
In $000s |
As at December 31, 2021 |
As at December 31, 2020 |
||||||
Hod Maden interest |
$ |
$ |
||||||
Entrée Resources Ltd. |
||||||||
$ |
$ |
|||||||
A. |
Hod Maden Interest |
In $000s |
Year Ended December 31, 2021 |
Year Ended December 31, 2020 |
||||||
Beginning of Year |
$ |
$ |
||||||
Company’s share of net loss of associate |
( |
) |
( |
) | ||||
Capital investment |
||||||||
Currency translation adjustments |
( |
) |
( |
) | ||||
End of Year |
$ |
$ |
||||||
In $000s |
Year Ended December 31, 2021 |
Year Ended December 31, 2020 |
||||||
Administration expenses |
$ | ( |
) |
$ | ( |
) | ||
Other income |
||||||||
Total net loss |
$ |
( |
) |
$ |
( |
) | ||
Company’s share of net loss of associate |
$ |
( |
) |
$ |
( |
) | ||
In $000s |
As at December 31, 2021 |
As at December 31, 2020 |
||||||
Current Assets |
$ | $ | ||||||
Non-current Assets |
||||||||
Total Assets |
$ | $ |
||||||
Current Liabilities |
||||||||
Non-current Liabilities |
||||||||
Total Liabilities |
$ |
$ |
||||||
Net Assets |
$ |
$ |
||||||
Company’s share of net assets of associate |
$ | $ | ||||||
Adjustments for differences in accounting policies and other |
||||||||
Carrying amount of investment in associate |
$ |
$ |
||||||
B. |
Entrée Resources Ltd. |
In $000s |
Year Ended December 31, 2021 |
Year Ended December 31, 2020 1 |
||||||
Beginning of Year |
$ | $ | ||||||
Acquisition of investment in associate |
||||||||
Additions |
- | |||||||
Company’s share of net loss of associate |
( |
) |
( |
) | ||||
Currency translation adjustments |
( |
) | - | |||||
End of Year |
$ |
$ |
||||||
1 |
Information is for the reconstructed period November 20, 2020 to December 31, 2020. |
In $000s |
Year Ended December 31, 2021 |
Year Ended December 31, 2020 1 |
||||||
Administration expenses |
$ | ( |
) |
$ | ( |
) | ||
Other (expense) income |
( |
) | ( |
) | ||||
Total net loss |
$ |
( |
) | $ |
( |
) | ||
Company’s share of net loss of associate |
$ |
( |
) | $ |
( |
) | ||
1 |
Information is for the reconstructed period November 20, 2020 to December 31, 2020. |
In $000s |
As at December 31, 2021 |
As at December 31, 2020 |
||||||
Current Assets |
$ | $ | ||||||
Non-current Assets |
||||||||
Total Assets |
$ |
$ |
||||||
Current Liabilities |
||||||||
Non-current Liabilities |
||||||||
Total Liabilities |
$ |
$ |
||||||
Net Assets |
$ |
$ |
||||||
Company’s share of net assets of associate |
$ |
$ |
||||||
In $000s |
Jan. 1, 2021 |
Additions |
Disposals |
Fair Value Adjustment |
Dec. 31, 2021 |
|||||||||||||||
Short-term investments |
||||||||||||||||||||
Convertible debt instruments 1 |
$ | $ | $ | ( |
) | $ | ( |
) | $ | |||||||||||
Total short-term investments |
$ |
$ |
$ |
( |
) | $ |
( |
) | $ |
|||||||||||
Non-current investments |
||||||||||||||||||||
Common shares 2 |
$ | $ | $ | ( |
) | $ | ( |
) | $ | |||||||||||
Vale Royalties financial instrument |
( |
) | ||||||||||||||||||
Warrants and other 1 |
( |
) | ||||||||||||||||||
Convertible debt instruments 1 |
( |
) | ( |
) | ||||||||||||||||
Total non-current investments |
$ |
$ |
$ |
( |
) | $ |
( |
) | $ |
|||||||||||
Total investments |
$ |
$ |
$ |
( |
) | $ |
( |
) | $ |
|||||||||||
1 |
Fair value adjustment recorded within net income for the year. |
2 |
Fair value adjustment recorded within Other Comprehensive Income (loss) for the year. |
In $000s |
Jan. 1, 2020 |
Additions |
Disposals |
Transfers |
Fair Value Adjustment |
Dec. 31, 2020 |
||||||||||||||||||
Short-term investments |
||||||||||||||||||||||||
Convertible debt instruments 1 |
$ |
$ |
$ |
( |
) | $ |
$ |
$ |
||||||||||||||||
Total short-term investments |
$ |
$ |
$ |
( |
) | $ |
$ |
$ |
||||||||||||||||
Non-current investments |
||||||||||||||||||||||||
Common shares 2 |
$ |
$ |
$ |
( |
) | $ |
( |
) | $ |
$ |
||||||||||||||
Warrants and other 1 |
( |
) | ||||||||||||||||||||||
Convertible debt instruments 1 |
( |
) | ||||||||||||||||||||||
Total non-current investments |
$ |
$ |
$ |
( |
) |
$ |
( |
) |
$ |
$ |
||||||||||||||
Total investments |
$ |
$ |
$ |
( |
) |
$ |
( |
) |
$ |
$ |
||||||||||||||
| 1 | Fair value adjustment recorded within net income (loss) for the year. |
| 2 | Fair value adjustment recorded within Other Comprehensive Income (loss) for the year. |
A. |
Authorized Share Capital |
B. |
Stock Options of the Company |
Number of options |
Weighted average exercise price per share (CAD) 1 |
|||||||
Options outstanding at December 31, 2019 |
||||||||
Granted |
||||||||
Exercised |
( |
) | ( |
) | ||||
Options outstanding at December 31, 2020 |
||||||||
Granted |
||||||||
Exercised |
( |
) |
( |
) | ||||
Options outstanding at December 31, 2021 |
||||||||
| 1 | For options exercisable in British Pounds Sterling (“GBP”), exercise price is translated to Canadian Dollars (“CAD”) using the period end exchange rate. |
Year of expiry |
Number outstanding |
Vested |
Exercise price per share (range) (CAD) 1 |
Weighted average exercise price per share (CAD) 1, 2 | ||||
1 |
For options exercisable in GBP, exercise price is translated to CAD using the period end exchange rate. |
2 |
Weighted average exercise price of options that are exercisable. |
C. |
Restricted Share Rights |
D. |
Diluted Earnings Per Share |
In $000s (except for shares and per share amounts) |
Year Ended December 31, 2021 |
Year Ended December 31, 2020 |
||||||
Net income for the year |
$ |
$ |
||||||
Basic weighted average number of shares |
||||||||
Basic earnings per share |
$ |
$ |
||||||
Effect of dilutive securities |
||||||||
Stock options |
||||||||
Warrants |
||||||||
Restricted share rights |
||||||||
Diluted weighted average number of common shares |
||||||||
Diluted earnings per share |
$ |
$ |
||||||
Year Ended December 31, 2021 |
Year Ended December 31, 2020 |
|||||||
Stock options |
||||||||
10 – |
Income Taxes |
In $000s |
Year Ended December 31, 2021 |
Year Ended December 31, 2020 |
||||||
Income before income taxes |
$ |
$ |
||||||
| Canadian federal and provincial income tax rates |
||||||||
Income tax expense based on the above rates |
$ |
$ |
||||||
Increase (decrease) due to: |
||||||||
Non-deductible expenses and permanent differences |
$ |
$ |
||||||
Non-taxable portion of capital gain or loss |
( |
|||||||
Withholding taxes |
||||||||
Change in unrecognized temporary differences and other |
||||||||
Income tax expense |
$ |
$ |
||||||
In $000s |
As at December 31, 2021 |
As at December 31, 2020 |
||||||
Deferred Income Tax Liabilities |
||||||||
Non-capital losses |
$ |
$ |
||||||
Investments and other |
( |
|||||||
Stream, royalty and other interests |
( |
( |
||||||
Total deferred income tax liabilities |
$ |
( |
$ |
( |
||||
In $000s |
Year Ended December 31, 2021 |
Year Ended December 31, 2020 |
||||||
Balance, beginning of the year |
$ |
( |
) |
$ |
||||
Recognized in net income (loss) for the year |
( |
) |
( |
) | ||||
Recognized in equity |
||||||||
Recognized in other comprehensive income (loss) for the year |
( |
) | ||||||
Balance, end of year |
$ |
( |
) | $ |
( |
) | ||
In $000s |
Location |
Amount |
Expiration |
|||||||
Non-capital loss carry-forwards |
Canada |
$ |
||||||||
In $000s |
Year Ended December 31, 2021 |
Year Ended December 31, 2020 |
||||||
Corporate administration |
$ |
$ |
||||||
Employee benefits and salaries |
||||||||
Professional fees |
||||||||
Administration expenses before share-based compensation |
$ |
$ |
||||||
Equity settled share-based compensation (a non-cash expense) |
||||||||
Total administration expenses |
$ |
$ |
||||||
12 – |
Supplemental Cash Flow Information |
In $000s |
Year Ended December 31, 2021 |
Year Ended December 31, 2020 |
||||||
Change in non-cash working capital: |
||||||||
Trade receivables and other |
$ |
( |
) |
$ |
( |
) | ||
Trade and other payables |
( |
) | ||||||
Net (decrease) increase in cash |
$ |
( |
) |
$ |
( |
) | ||
Common shares received on conversion of convertible debentures |
$ |
$ |
||||||
In $000s |
Year Ended December 31, 2021 |
Year Ended December 31, 2020 |
||||||
Salaries and benefits |
$ |
$ |
||||||
Share-based payments |
||||||||
Total key management compensation expense |
$ |
$ |
||||||
14 – |
Commitments and Contingencies |
Stream |
% of Life of Mine Gold or Relevant Commodity 5,6,7,8,9,10 |
Per Ounce Cash Payment: lesser of amount below and the then prevailing market price of commodity (unless otherwise noted) 1,2,3,4 | ||
Black Fox |
$ | |||
Chapada |
||||
Entrée |
$ | |||
Karma |
||||
Relief Canyon |
Varies | |||
Santa Elena |
$ | |||
Vatukoula |
||||
Yamana silver stream |
||||
| 1 | Subject to an annual inflationary adjustment. |
| 2 | For the Relief Canyon stream, after receipt of |
| 3 | For the Entrée Gold Stream, after approximately 8.6 million ounces of gold have been produced fr o m the joint venture property, the price increases to $ |
| 4 | For the Entrée silver stream, percentage of life of mine is |
| 5 | For the Entrée Gold and silver stream, percentage of life of mine is 5.62% on Hugo North Extension and 4.26% on Heruga if the minerals produced are contained below 560 metres in depth. |
| 6 | For the Entrée Gold and silver stream, percentage of life of mine is |
| 7 | For the Entrée copper stream, the Company has committed to purchase an amount equal to |
| 8 | For the Chapada copper stream, the Company has committed to purchase an amount equal to |
| 9 | Under the terms of the Yamana silver stream, Sandstorm has agreed to purchase an amount of silver from Cerro Moro equal to |
10 |
Under the terms of the Vatukoula stream, after receipt of |
In $000s |
Product |
Sales |
Royalty revenue |
Cost of sales excluding depletion |
Depletion |
Stream, royalty and other interests impairments |
Gain on revaluation of Vale Royalties financial instrument |
Income (loss) before taxes |
Cash flows from operating activities |
|||||||||||||||||||||||||||
| Aurizona, Brazil |
Gold |
$ |
$ |
$ |
$ |
$ |
$ |
$ |
$ |
|||||||||||||||||||||||||||
| Black Fox, Canada |
Gold |
|||||||||||||||||||||||||||||||||||
| Bracemac-McLeod, Canada 1 |
Various |
|||||||||||||||||||||||||||||||||||
| Chapada, Brazil |
Copper |
|||||||||||||||||||||||||||||||||||
| Diavik, Canada |
Diamonds |
|||||||||||||||||||||||||||||||||||
| Fruta del Norte, Ecuador |
Gold |
|||||||||||||||||||||||||||||||||||
| Houndé, Burkina Faso |
Gold |
|||||||||||||||||||||||||||||||||||
| Karma, Burkina Faso |
Gold |
|||||||||||||||||||||||||||||||||||
| Relief Canyon, United States |
Gold |
|||||||||||||||||||||||||||||||||||
| Santa Elena, Mexico |
Gold |
|||||||||||||||||||||||||||||||||||
| Vale Royalties, Brazil |
Iron Ore |
( |
) |
|||||||||||||||||||||||||||||||||
| Yamana silver stream, Argentina |
Silver |
|||||||||||||||||||||||||||||||||||
| Other 2 |
Various |
|||||||||||||||||||||||||||||||||||
| Total Segments |
$ |
$ |
$ |
$ |
$ |
$ |
( |
) |
$ |
$ |
||||||||||||||||||||||||||
| Corporate: |
||||||||||||||||||||||||||||||||||||
| Administration & Project evaluation expenses |
$ |
$ |
$ |
$ |
$ |
$ |
$ |
( |
) |
$ |
( |
) | ||||||||||||||||||||||||
| Foreign exchange loss |
( |
) |
||||||||||||||||||||||||||||||||||
| Loss on revaluation of investments |
( |
) |
||||||||||||||||||||||||||||||||||
| Finance (expense) income, net |
( |
) |
||||||||||||||||||||||||||||||||||
| Other |
( |
) |
||||||||||||||||||||||||||||||||||
| Total Corporate |
$ |
$ |
$ |
$ |
$ |
$ |
$ |
( |
) | $ |
( |
) | ||||||||||||||||||||||||
| Consolidated |
$ |
$ |
$ |
$ |
$ |
$ |
( |
) |
$ |
$ |
||||||||||||||||||||||||||
| 1 | Royalty revenue from Bracemac-McLeod consists of $ |
| 2 | Where a stream and royalty interest represents less than |
In $000s |
Product |
Sales |
Royalty revenue |
Cost of sales excluding depletion |
Depletion |
Stream, royalty and other interests impairments |
Other |
Income (loss) before taxes |
Cash flows from operating activities |
|||||||||||||||||||||||||||
| Aurizona, Brazil |
Gold |
$ |
$ |
$ |
$ |
$ |
$ |
$ |
$ |
|||||||||||||||||||||||||||
| Black Fox, Canada |
Gold |
|||||||||||||||||||||||||||||||||||
| Bracemac-McLeod, Canada 1 |
Various |
|||||||||||||||||||||||||||||||||||
| Chapada, Brazil |
Copper |
|||||||||||||||||||||||||||||||||||
| Diavik, Canada |
Diamonds |
( |
) |
|||||||||||||||||||||||||||||||||
| Fruta del Norte, Ecuador |
Gold |
|||||||||||||||||||||||||||||||||||
| Houndé, Burkina Faso |
Gold |
|||||||||||||||||||||||||||||||||||
| Karma, Burkina Faso |
Gold |
|||||||||||||||||||||||||||||||||||
| Relief Canyon, United States |
Gold |
|||||||||||||||||||||||||||||||||||
| Santa Elena, Mexico |
Gold |
|||||||||||||||||||||||||||||||||||
| Yamana silver stream, Argentina |
Silver |
|||||||||||||||||||||||||||||||||||
| Other 2 |
Various |
|||||||||||||||||||||||||||||||||||
| Total Segments |
$ |
$ |
$ |
$ |
$ |
$ |
$ |
$ |
||||||||||||||||||||||||||||
| Corporate: |
||||||||||||||||||||||||||||||||||||
| Administration & Project evaluation expenses |
$ |
$ |
$ |
$ |
$ |
$ |
$ |
( |
) |
$ |
( |
) | ||||||||||||||||||||||||
| Foreign exchange loss |
( |
) |
||||||||||||||||||||||||||||||||||
| Gain on revaluation of investments |
||||||||||||||||||||||||||||||||||||
| Finance (expense) income, net |
( |
) |
||||||||||||||||||||||||||||||||||
| Other |
( |
) |
( |
) | ||||||||||||||||||||||||||||||||
| Total Corporate |
$ |
$ |
$ |
$ |
$ |
$ |
$ |
( |
) |
$ |
( |
) | ||||||||||||||||||||||||
| Consolidated |
$ |
$ |
$ |
$ |
$ |
$ |
$ |
$ |
||||||||||||||||||||||||||||
| 1 | Royalty revenue from Bracemac-McLeod consists of $ |
| 2 | Where a stream and royalty interest represents less than |
In $000s |
December 31, 2021 |
December 31, 2020 |
||||||
Aurizona |
$ |
$ |
||||||
Black Fox |
||||||||
Bracemac-McLeod |
||||||||
Chapada |
||||||||
Diavik |
||||||||
Fruta del Norte |
||||||||
Hod Maden 1 |
||||||||
Houndé |
||||||||
Hugo North Extension and Heruga 2 |
||||||||
Karma |
||||||||
Relief Canyon |
||||||||
Santa Elena |
||||||||
Vale Royalties |
||||||||
Vatukoula |
- |
|||||||
Yamana silver stream |
||||||||
Other 3 |
||||||||
Total Segments |
$ |
$ |
||||||
Corporate: |
||||||||
Cash and cash equivalents |
$ |
$ |
||||||
Investments |
||||||||
Other assets |
||||||||
Total Corporate |
$ |
$ |
||||||
Consolidated |
$ |
$ |
||||||
| 1 | Includes royalty interest of $ |
| 2 | Includes stream interest of $stream interest of $ |
| 3 | Where a stream and royalty interest represents less than 10% of the Company’s sales, gross margin or aggregate asset book value and represents an interest on gold, silver or other metal, the interest has been summarized under Other. Includes Mt. Hamilton, Prairie Creek, Gualcamayo, Emigrant Springs, Mine Waste Solutions, Thunder Creek, Hackett River, Lobo-Marte, Agi Dagi & Kirazli, HM Claim, Triangle Zone, Ming, and others. |
In $000s |
December 31, 2021 1 |
December 31, 2020 1 |
||||||
North America |
||||||||
Canada |
$ |
$ |
||||||
USA |
||||||||
Mexico |
||||||||
South & Central America |
||||||||
Argentina |
$ |
$ |
||||||
Brazil |
||||||||
Ecuador |
||||||||
French Guiana |
||||||||
Chile |
||||||||
Africa |
||||||||
Burkina Faso |
$ |
$ |
||||||
South Africa |
||||||||
Other |
||||||||
Turkey |
$ |
$ |
||||||
Mongolia |
||||||||
Fiji |
- |
|||||||
Australia |
||||||||
Other |
||||||||
Consolidated |
$ |
$ |
||||||
1 |
Includes Stream, royalty and other interests (note 5) and Investment in associate (note 6). |