
Technologies Corporation
TABLE OF CONTENTS
UNITED STATES
SECURITIES AND EXCHANGE COMMISSION
Washington, D.C. 20549
FORM
(Mark One)
ANNUAL REPORT PURSUANT TO SECTION 13 OR 15(d) OF THE SECURITIES EXCHANGE ACT OF 1934 |
For the fiscal year ended
OR
TRANSITION REPORT PURSUANT TO SECTION 13 OR 15(d) OF THE SECURITIES EXCHANGE ACT OF 1934 |
For the transition period from ______________ to _______________
Commission file number
(Exact name of registrant as specified in its charter)
|
|
|
(Address of principal executive offices)
(Zip Code)
(
(Registrant’s telephone number, including area code)
Securities registered pursuant to Section 12(b) of the Act:
Title of each class |
| Trading Symbol(s) |
| Name of each exchange on |
| The |
Indicate by check mark if the registrant is a well-known seasoned issuer, as defined in Rule 405 of the Securities Act. Yes ◻
Indicate by check mark if the registrant is not required to file reports pursuant to Section 13 or Section 15(d) of the Act. Yes ◻
Indicate by check mark whether the registrant (1) has filed all reports required to be filed by Section 13 or 15(d) of the Securities Exchange Act of 1934 during the preceding 12 months (or for such shorter period that the registrant was required to file such reports); and (2) has been subject to such filing requirements for the past 90 days.
Indicate by check mark whether the registrant has submitted electronically every Interactive Data File required to be submitted pursuant to Rule 405 of Regulation S-T (§ 232.405 of this chapter) during the preceding 12 months (or for such shorter period that the registrant was required to submit such files).
Indicate by check mark whether the registrant is a large accelerated filer, an accelerated filer, a non-accelerated filer, a smaller reporting company or an emerging growth company. See the definitions of “large accelerated filer,” “accelerated filer,” “smaller reporting company,” and “emerging growth company” in Rule 12b-2 of the Exchange Act.
Large accelerated filer |
| Accelerated filer |
| Smaller reporting company | |
|
| Emerging growth company |
If an emerging growth company, indicate by check mark if the registrant has elected not to use the extended transition period for complying with any new or revised financial accounting standards provided pursuant to Section 13(a) of the Exchange Act. ◻
Indicate by check mark whether the registrant has filed a report on and attestation to its management's assessment of the effectiveness of its internal control over financial reporting under Section 404(b) of the Sarbanes-Oxley Act (15 U.S.C. 7262(b)) by the registered public accounting firm that prepared or issued its audit report.
Indicate by check mark whether the issuer is a shell company (as defined in Rule 12b-2 of the Exchange Act).Yes
State the aggregate market value of the voting and non-voting common equity held by non-affiliates computed by reference to the price at which the common equity was last sold, or the average bid and asked price of such common equity, as of the last business day of the registrant’s most recently completed second fiscal quarter.
As of June 30, 2021, the aggregate market value of the voting and non-voting common equity held by non-affiliates of the Registrant, computed by reference to the last sale price of the common equity was $
Indicate the number of shares outstanding of each of the registrant’s classes of common stock, as of the latest practicable date.
As of March 29, 2022, the registrant has
DOCUMENTS INCORPORATED BY REFERENCE
Portions of the registrant’s proxy statement for the 2022 Annual Meeting of Shareholders are incorporated herein by reference in Part III of this Annual Report on Form 10-K to the extent stated herein. Such proxy statement will be filed with the Securities and Exchange Commission within 120 days of the registrant’s fiscal year ended December 31, 2021.
Technologies Corporation
TABLE OF CONTENTS
SPECIAL NOTE REGARDING FORWARD-LOOKING STATEMENTS AND OTHER INFORMATION
CONTAINED IN THIS REPORT
This Annual Report on Form 10-K contains forward-looking statements within the meaning of the Private Securities Litigation Reform Act of 1995 and the provisions of Section 27A of the Securities Act of 1933, as amended, and Section 21E of the Securities Exchange Act of 1934, as amended. Forward-looking statements give our current expectations or forecasts of future events. You can identify these statements by the fact that they do not relate strictly to historical or current facts. You can find many (but not all) of these statements by looking for words such as “approximates,” “believes,” “hopes,” “expects,” “anticipates,” “estimates,” “projects,” “intends,” “plans,” “would,” “should,” “could,” “may,” “will” or other similar expressions in this report. In particular, these include statements relating to future actions; prospective products, applications, customers and technologies; future performance or results of any products; anticipated expenses; and future financial results. These forward-looking statements are subject to certain risks and uncertainties that could cause actual results to differ materially from our historical experience and our present expectations or projections. Factors that could cause actual results to differ materially from those discussed in the forward-looking statements include, but are not limited to:
| ● | our limited cash, history of losses, and our expectation that we will continue to experience operating losses and negative cash flows in the near future; |
| ● | our ability to successfully develop and implement our technologies and achieve profitability; |
| ● | our limited operating history; |
| ● | changes in government regulations that could substantially reduce, or even eliminate, the need for our technology; |
| ● | emerging competition and rapidly advancing technology in our industry that may outpace our technology; |
| ● | customer demand for the products and services we develop; |
| ● | the impact of competitive or alternative products, technologies and pricing; |
| ● | our ability to manufacture any products we design; |
| ● | general economic conditions and events and the impact they may have on us and our potential customers; |
| ● | our doing business in China and related risks with respect to intellectual property protection, currency exchange, contract enforcement and rules on foreign investment; |
| ● | the impact of a cybersecurity incident or other technology disruption; |
| ● | our ability to protect our intellectual property; |
| ● | our ability to obtain adequate financing in the future; |
| ● | our ability to retain and hire personnel with the experience and talent to develop our products and business; |
| ● | our ability to obtain adequate financing in the future to support our operations; |
| ● | the financial and operational impacts of the coronavirus pandemic on our business and results of operations, including impacts on our day-to-day operations, collaborative arrangements, revenue and marketing efforts and suppliers; |
| ● | our success at managing the risks involved in the foregoing items; and |
| ● | other factors discussed in this report. |
Forward-looking statements may appear throughout this report, including without limitation, the following sections: Item 1“Business,” Item 1A “Risk Factors,” and Item 7 “Management’s Discussion and Analysis of Financial Condition and Results of Operations.” The forward-looking statements are based upon management’s beliefs and assumptions and are made as of the date of this report. We undertake no obligation to publicly update or revise any forward-looking statements included in this report. You should not place undue reliance on these forward-looking statements.
Unless otherwise stated or the context otherwise requires, the terms “ClearSign,” “we,” “us,” “our” and the “Company” refer to ClearSign Technologies Corporation and its subsidiary, ClearSign Asia Limited.
1
PART I
ITEM 1: BUSINESS
Introduction
We design and develop technologies that have been shown to significantly improve key performance characteristics of industrial combustion systems, including emission and operational performance, energy efficiency, safety and overall cost-effectiveness. We believe that our patented ClearSign Core™ technology can enhance the performance of combustion systems in a broad range of markets, including the energy (upstream oil production and down-stream refining), institutional, commercial and industrial boiler, chemical, and petrochemical industries. Our ClearSign Core technology, which is our primary technology, uses either a porous ceramic structure or metal flame holder device held at a distance from the injection planes of a burner to significantly reduce flame length and achieve low emissions without the need for external flue gas recirculation, selective catalytic reduction, or high excess air systems. To date, our operations have been funded primarily through sales of our equity securities. We have earned nominal revenue since inception in 2008.
Our combustion technology has been successfully deployed in commercial projects such as down-stream refining, upstream oil production and industrial boiler installations. These applications include both our process burner and boiler burner technologies. Our process burner technology is able to operate in high-intensity multiple burner industrial applications at sites that are required to meet low air pollutant emissions. Our boiler burner technology, which has been proven to achieve ground-breaking low air pollutant emissions, has been deployed in the US and is currently undergoing commercialization in China.
We believe that combustion equipment utilizing ClearSign Core technology is more effective and cost-efficient than current industry-standard air pollution control technologies, which reduce NOx down to the levels required by new emission regulations. NOx is a regulated greenhouse gas pollutant comprised of nitrogen oxide and nitrogen dioxide. These current technologies include selective catalytic reduction devices (SCRs), low- and ultra-low NOx burners, external flue gas recirculation systems and other similar technologies. Such air pollution control systems are widely used in places within our current target markets such as in petroleum refining and petrochemical process heaters, large-scale once through steam generators (OTSGs), enclosed flares, institutional commercial and industrial boilers and other similar equipment. We believe that our ClearSign Core technology can provide value to our customers not only by helping them meet current and possible future legislative mandates to reduce pollutant emissions, but also by improving operating efficiency and increasing overall return on investment.
Based on the operating data we have obtained from our installed products, burners utilizing ClearSign Core technology can provide increased heat transfer efficiency as compared to standard burner designs. This is consistent with the physics of heat transfer and the mechanisms by which the technology functions. The reported increased heat transfer efficiency may potentially result in cost savings in the low to mid-single digit percentage range for burners employing our technology. We believe that these potential costs savings could produce an extremely attractive pay-back period for an investment in ClearSign Core technology-based burners. In addition, because the flame volumes in heaters utilizing ClearSign Core technology are typically small, heaters using our technology are expected to operate at a lower cost, have increased productivity, and require less maintenance and downtime compared to heaters that operate with enlarged flames produced by traditional low NOx burners. The flames in a ClearSign Core system are established from a predominantly premixed stream of fuel, combustion air and flue gasses stabilized on a downstream structure that promotes turbulence and ignition with minimal “bulking up”. In comparison, flames resulting from the traditional legacy process of slow mixing of the fuel and air, and dilutive inert flue gasses have a much larger size. With a lower volume flame in a ClearSign Core system, surfaces in the heater or boiler experience less touching by the flame and it is anticipated that our systems can virtually eliminate flame impingement. Our technology also enables burners to function better in tightly spaced heaters compared to the flames of traditional low NOx burners. Most importantly, using our technology has the potential to decrease process downtime required during installation compared to retrofits utilizing the legacy technology of SCRs or flue gas recirculation systems.
We are also designing and commercializing a range of sensing products called the ClearSign EyeTM for two potential markets. The primary addressable market is similar to that of our ClearSign Core technology, although not limited to regions requiring emissions reduction. The flame sensing products are applicable to all installed burners that use a pilot for ignition, including in markets and regions beyond those where reducing emissions is a high priority. Like our burner technology, our burner sensing technology is being developed to provide convenient replacement and retrofit solutions for existing equipment as well as for inclusion in newly built equipment. We expect our flame sensing technology products to replace existing flame sensing technology.
2
The secondary potential market for our sensing technology is outside of the typical combustion industry and includes transportation industries. While use of this fundamental technology in applications intended for transportation markets is proven, the development and refinement of specific products, obtaining the certifications required for commercial deployment and establishing an efficient manufacturing source and channels to market will take some time, and we cannot assure that these goals will be achieved. We believe that the opportunities for application of our sensing technology in the transportation market are global and of great value, but it will also take longer to commercialize products targeted for this market for the reasons stated above.
Overall, our sensing technologies could provide future diversification as well as the opportunity for continued business expansion and growth beyond the maturation of our combustion-related businesses.
Corporate History
We were incorporated in the State of Washington on January 23, 2008. The address of our corporate headquarters is 8023 East 63rd Place, Suite 101, Tulsa, OK and our telephone number is (206) 673-4848. Our website can be accessed at www.clearsign.com. The information contained on our website is not a part of this report. We currently operate in the United States, People’s Republic of China and Hong Kong.
Our Industry
The combustion and emissions control systems markets are significant, both with respect to the wide array of industries in which the systems are used and the amount of capital spent installing and upgrading the systems. Combustion systems are used to provide heat for many different industrial and commercial processes, including boilers, petrochemical process heaters, and waste disposal systems. In order to maximize energy efficiency while keeping pace with regulatory guidelines for air pollution emissions, operators of combustion systems are continually installing, maintaining, and upgrading a variety of costly process control, air pollution control and monitoring systems. Although we believe that there are many potential markets for our ClearSign Core technology, to date we have limited the introduction of this technology to petroleum refining process heaters, energy infrastructure process heaters, boilers for steam and hot water generation, boilers for building heating systems, and enclosed flares.
Our initial target markets centers on the energy sector, including downstream oil refineries through the use of process heaters and boilers as well as upstream crude oil production through the use of Once Through Steam Generator (OTSGs) and wellhead enclosed flares. In recent years, the energy sector has been significantly affected by the volatile market price of crude oil and marginal economic growth. Crude oil prices stabilized during 2016 and 2017 and enjoyed appreciation with the general post 2016 upswing in certain commodities and improved economic outlook. Prices plunged with the economic uncertainties that emerged from the pandemic in the spring of 2020 but stabilized through the summer and returned to pricing that is close to the five-year average by the end of 2020 and has now experienced increased prices during 2021. While oil price levels and volatility impact the planning of capital expenditure in the oil processing industry, based upon our experience and feedback from current and prospective customers, we believe that the value, and anticipated demand for our technology continues to be validated notwithstanding energy sector market conditions. This validation is grounded in our technology’s ability to cost-effectively lower emissions to meet new air pollution requirements, and potentially deliver operational efficiencies by increasing overall throughput for a more attractive return on investment.
We believe operators in our domestic target markets are under pressure to meet current and proposed federal, state and local pollution emissions standards. The standards applicable to our target markets have been developed over the past 50 years with broad political input. Due to the localized effects of poor air quality, we expect these standards to continue to become more stringent regardless of political leadership. As an illustration, air pollution emission standards are most stringent in the states of California and Texas, which historically have had leadership from different political parties. We believe this to be the case in the U.S. and worldwide in most major developed and developing countries. As a result, these standards are a significant driver for our development and sales efforts. We believe that our ClearSign Core technology can provide a unique, cost-effective pollution control solution for operators in comparison to all known competing products.
In the US, emissions standards largely emanate from the Clean Air Act, which is administered by the Environmental Protection Agency (EPA) and regulates six common criteria air pollutants, including ground-level ozone. These regulations are enforced by state and local air quality districts as part of their compliance plans. As a precursor to ground-level ozone, NOx is a pollutant that is regulated by local air quality districts in order to achieve the EPA limits. The 8-hour ground-level ozone regulations
3
have been reduced from 80 parts per billion (ppb) in 1997, to 75 ppb in 2008, and 70 ppb in 2015, with the requirement of realizing these levels approximately 20 years following the year of legislation.
We have noted that local air quality districts designated by the EPA as “severe non-attainment zones” in California and Texas have undertaken a review of their air pollutant emissions regulations. These reviews are ongoing, in most regions, but two important regions have recently amended their local regulations to improve air quality. In December of 2020, the San Joaquin Valley region of California revised its regulations to require significant reductions in target NOx emissions from boilers, steam generators and process heaters. The greater Los Angeles area also revised its regulations in November of 2021. Under these revised regulations, it abandoned a decades old cap and trade system and instituted a new command and control system that regulates each individual emissions source. It also substantially reduced target emissions for process heaters, boilers and other similar equipment in accordance with a new and comprehensive Best Available Retrofit Control Technology (BARCT) analysis.
In addition, new regulations are starting to be adopted with respect to the NOx emissions of enclosed ground flares, which historically have not been viewed as a source of NOx emissions or subject to the same level of regulation. We believe that our ClearSign Core technology is well-suited to address the challenges faced by oil producers and other industries in complying with current and predicted future local air emission standards. There are multiple ClearSign Core flare applications now operational in California with NOx emissions below the levels required by new regulations.
In addition, we believe that current emissions standards in Europe, the Middle East, parts of Asia and Canada will continue to become stricter as these jurisdictions seek to achieve cleaner air. Existing and new emissions standards in such jurisdictions may create additional market opportunities for us. To date, we have one installation operating in the refinery of a major global oil refiner in Europe.
The current environmental impetus to reduce CO2 emissions has created an interest in burner technology that can use hydrogen as a fuel source. Because hydrogen burns at a higher temperature than most other fuel gasses, it tends to create more NOx emissions. ClearSign Core burners have demonstrated the ability to burn fuels with up to 80% hydrogen while still controlling NOx emissions to meet required regulatory levels. We believe that we can extend the capability of our ClearSign Core technology to burn “pure” hydrogen fuel.
Our Proprietary Technology
ClearSign Core Burner Technology
The name “ClearSign Core” was adopted to describe the inclusion of ClearSign’s burner technology in the products of original equipment burner manufacturers (OEM). Including our technology in OEM burner products enables us to leverage our technology by providing OEMs with the ability to offer a new product range with our technologies’ unique capabilities and distinctively differentiated product performance in combination with their global manufacturing, order fulfillment and service capabilities.
Our ClearSign Core burner technology consists of an industrial burner body and a downstream flame stabilizing structure made of either porous ceramic or metal. When the unreacted mixture of gaseous fuel and air is directed at the flame stabilizing structure, the mixture ignites and the flame forms either within or immediately downstream from the structure itself. Because the fuel and air have more time to become a homogeneous mixture, NOx-forming hot spots and chemistry typically produced by such hot spots is reduced. In addition, the mixing and combustion propagating from the flame-stabilizing structure results in a dramatically shorter flame. The ability to modify the flame stabilizing structure enables a high level of control over the flame shape for optimization in a wide range of different applications. For example, we believe our ClearSign Core products, without any external fans or associated power, can significantly reduce the harmful emission of NOx to levels of 5 ppm or below, depending on the application, while improving system efficiency. The shorter flame in a ClearSign Core product can also potentially allow a furnace to operate at a higher capacity. We believe that heaters using the ClearSign Core will be able to remain in operation for an extended time before the need for maintenance as its flame structure and heat transfer profile minimize the possibility of flame impingement, reduce the likelihood of carbon deposits forming on the inside surfaces of the process tubes (coking) and reduce the likelihood of process tube failure all while operating with enhanced thermal efficiency.
4
ClearSign Core Plug & Play Burners
Our ClearSign Core Plug & Play burners provide a simplified, pre-engineered and standardized direct burner replacement for traditional refinery process heaters. We believe that this product minimizes the customized engineering associated with retrofits and lends itself to mass production. The product was designed to enable quick and easy installation while operating in a multi-burner heater or furnace, rather than shutting it down. We believe that the simplicity of the actions required to retrofit refinery process heaters with the ClearSign Core Plug & Play, and the potential ability to install the ClearSign Core Plug & Play while the remaining burner system is operational, will potentially contribute to demand for our ClearSign Core Plug & Play burners.
ClearSign Core Boiler Burner Technology
Our ClearSign Core technology for boiler burners is essentially the same as our technology for process burners but with different component details. Boiler burners have a different orientation and internal chamber dimensions, operate with a relatively high combustion air pressure, and, in the case of small fire tube boiler burners, have a lower fuel gas pressure. Our go to market strategy of incorporating the ClearSign Core technology into a typical OEM process burner is the same as for our boiler burners.
ClearSign Core Flaring Burners
Our ClearSign Core flaring technology incorporates the same mechanisms as our burner technology, namely directing the fuel gas (typically waste gas), into an air stream with that air and gas mixture forming a flame stabilized downstream on a flame stabilizing structure. This technology has been configured into standard modular designs that can be used individually, or in combination, to provide a flare product with extremely low NOx emissions. We have designed standardized flare configurations with standard firing capacities that can be combined in varying quantities to produce flares with different firing rates.
ClearSign Eye™ Flame Sensor
The ClearSign Eye™ flame sensor is an electrical flame sensor for industrial applications. Unlike flame rods, the ClearSign Eye sensing electrodes do not need to make contact with the flame. We are continuing to pursue “first adopter” installation opportunities for this patent pending sensing technology. We have multiple options open to us as channels to market one of which includes manufacturing the sensors ourselves as an OEM and selling them to customers either directly or indirectly through intermediaries. We believe our sensing technology is valuable because it potentially provides a very reliable alternative or replacement technology for critical industrial burner safety equipment. The currently available flame sensors are unreliable and require frequent maintenance. Our flame sensors can potentially be used with other combustion equipment such as flares, thermal oxidizer burners and boiler burners.
Our sensing technology can detect the capacitance of a flame while being physically outside of the flame envelope. As a result, our sensors can be easily retrofitted into existing burner technology. In addition, because the entire sensor probe can be positioned in a cool region, the ClearSign Eye can be manufactured with electrodes that have an optimized shape to provide the most robust signal and using processes and materials that provide an extremely long functional life.
Development of Our Technology
To date, we have deployed our ClearSign Core technology through retrofits and replacements of existing burners and complete replacement units in the case of our Plug & Play and boiler burner products. Retrofits often involve engineering around an existing burner architecture that can complicate the ClearSign Core burner installation, whereas replacements are more straightforward and more amenable to being sold and installed by third parties, enabling more expansive channels to market. This is especially the case after the introduction of our Plug & Play technology in February 2017 and the simplified control and operation of this technology enabled by the inclusion of a new start up and flame initiation system in April 2019. Because of this, we have focused the development of our technology to provide designs that can be included into our prospective customers’ equipment as self-contained modules or assemblies rather than projects involving the re-engineering of existing burner systems. In this form, we believe that the ClearSign Core burner technology is ideally suited for installation into new heaters and burner replacements, including heater and furnaces requiring large quantities of burners. In addition, this strategy also provides for simple new burner installations, or burner replacements to reduce emissions in boilers ranging from small fire tube boilers to large water tube boilers. We have also developed the ClearSign Core flare technology into similar repeatable forms to aid its inclusion in standard industry installations on a commercial scale with multiple installations now operational in California.
5
For simplification and marketing, we have adopted the term “ClearSign Core” to refer to the inclusion of our standardized proprietary combustion technology into a variety of combustion equipment types including, but not limited to, process heater burners, boiler burners, burners for thermal oxidizers and flares. Earlier ClearSign technology-based heater retrofits, in which a continuous ceramic “wall” was suspended above the existing burners, also continue to operate, and are referred to as “Duplex” technology. Although the combustion controlling principles of both the “ClearSign Core” and “Duplex” technologies are the same, ClearSign Core products have standardized technology and we believe they are easier to use and have a different channel to market.
ClearSign Core burners currently operate in multiple boilers, heaters and flares and meet new compliance standards enacted by California air authority. We also have products in commercial use in Europe and certified for sale in the Chinese boiler market. As noted above, our principal technologies have been developed into standardized designs. Our business development activities are now focused on developing customer acceptance and adoption within what we believe are the most efficient channels to market. The industries using our technology take a conservative approach to adopting new technology and place significant reliance on references from existing customers when selecting new equipment. A major focus of our current business development activities is to make early sales and build our reference list in both the process burner and boiler industries. We also seek to provide comprehensive technical support to our sales efforts as well as demonstrate our technology and products in operation. We are currently able to demonstrate our products while operating in rental boilers, industrial scale process burner test furnaces, and at customer locations when permissible.
ClearSign Core Technology Product Applications
To date, we have deployed our ClearSign Core technology through the retrofit or replacement of existing burners. As noted above, retrofits often involve engineering around an existing burner architecture that can complicate the installation. This was the case with the old “Duplex” technology, which we no longer promote although we continue servicing installed units. Our replacement products have become more attractive since the 2017 introduction our Plug & Play technology and the 2019 introduction of our start up and flame initiation system, which simplifies the control and operation of our products. By developing our ClearSign Core technology into a replacement product, we have been able to standardize our designs and simplify inventory. In addition, by removing the need to individually engineer every application, we have enabled collaboration with other commercial equipment suppliers to incorporate our ClearSign Core technology into their standard product lines. We believe that this further development of our products has greatly increased our ability to collaborate with partners to extend our potential market reach and the resources we make available to our prospective customers.
Process Heaters in the Oil Refining, Petrochemical and Gas Processing Industries
To date, we have retrofitted four process heaters with our new ClearSign Core burners for major global oil refineries and at refineries owned by Fortune 500 companies. Sites include three locations in California and one in Europe. The ClearSign Core “Plug & Play” design provides a more simplified, pre-engineered and standardized direct burner replacement for traditional refinery process heaters that we believe can be mass produced and reduce the need for the customized engineering associated with typical retrofits. The ClearSign Core “Plug & Play” design (including the boiler burner version) is our most developed burner product. It operates essentially in the same way as a standard burner, including fitting into a heater and integrating with existing control systems. We believe that this product is suitable for licensing as well as potential manufacturing arrangements with OEMs that have established manufacturing and distribution capabilities. At this time, we have a collaboration agreement in place with Zeeco Inc., which is one of the world’s largest combustion equipment manufacturers (“Zeeco”). The selling and marketing of our process burners pursuant to this agreement, however, is contingent on the successful completion of a comprehensive product performance and validation test.
In 2021, we received our first international purchase order for a ClearSign Core refining process heater from a global supermajor refining company. This marked the second order we received from a global supermajor. This international order was installed in 2021 and successfully placed it into full operation by the customer in January 2022. We also received in 2021 a purchase order from a national Fortune 500 refiner. This order marks the first phase of a multi-phase opportunity to supply sixteen burners to retrofit two heaters in a Midwest refinery. In addition, we fulfilled a multi-burner order for a Fortune 500 infrastructure company that continues to consistently meet all performance requirements including compliance with the California site’s air quality permit.
As we seek to expand the markets into which we can sell our products, we plan to continue extending the range of ClearSign Core Plug & Play products to enable the replacement of other burner shapes and configurations, as well as for use in alternate process applications.
6
Industrial Commercial Boilers
Boilers are used in many industrial applications, and smaller scale commercial and residential applications, to generate steam and hot water. A large number of boiler manufacturers produce many styles of boiler equipment for these different applications. In our target markets, boilers exist in two different industry-standard forms: water tube, which tend to be larger and in which the water or steam flows through a series of tubes that surround the capacity in which the flame forms; or fire tube in which the flame is formed inside a large tube that passes through the outer vessel holding the water.
We are currently actively working on commercial boiler applications for fire tube and water tube boilers. For fire tube products, we have recently developed our own prototype burner replacement product that is similar in concept to our ClearSign Core Plug & Play device for process heaters. This fire tube boiler product has achieved excellent results after being tested in a typical commercial fire tube boiler produced by one of the industry’s largest suppliers in the USA. We have a collaboration agreement in place with California Boiler to sell, deliver, install and service fire tube boiler burners in the USA. This collaboration has enabled us to access larger sizes of fire tube boilers in order to verify the function of a full size range of fire tube boiler burners. If the testing is successful in China, our goal will be to sell the boiler burner technology into the very large Chinese market through our Chinese subsidiary in collaboration with strategic partners in China. Water tube boilers are larger and more varied in their designs and verification projects are ongoing. We anticipate being able to make continued progress during 2022 with respect to testing and installing this equipment, although progress has been delayed with respect to fire tube and water tube boilers in China by the effects of the SARS-COV-2 virus (coronavirus or COVID-19).
Our “Core” boiler burner technology has been developed to enable it to be used in a complete range of consistently designed sizes ranging from small fire tube boilers up to large industrial water tube boilers. These boiler burners have achieved excellent results, including meeting the most stringent new California NOx regulations, in standard commercial boilers. We demonstrated the operation of our small fire tube burner for Chinese officials, who subsequently certified it for sale in China. We plan to seek certification of larger fire tube and water tube boiler burners with our collaborative partner Jiangsu Shuang Liang Boiler Co. Ltd, which is a subsidiary of China's Shuang Liang Group Co. Ltd and one of China's top 500 enterprises. We anticipate making continued progress during 2022 both demonstrating and commercializing this equipment, although our progress may continue to be delayed by the effects of the SARS-COV-2 virus (coronavirus or COVID-19). Water tube boiler burners are particularly important in China because the government-run heating districts that provide heat in the northern regions of China utilize thousands of them. Successfully testing and certifying our products in China will enable us to sell our boiler burner technology into this very large market through our Chinese subsidiary in collaboration with our strategic partners in China.
Wellhead Enclosed Flares
Based upon discussions with local regulators and the examination of regulatory reports, we believe that certain regions are targeting enclosed flare emissions for increased future regulation. California, for example, has already added new low NOx emissions regulations for flares. We have adapted the ClearSign Core technology to suit this application. Our collaboration agreement with the field engineering and servicing company California Boiler includes flare sales and installation. To date, we have five flare units installed and operating in California resulting from this collaboration agreement.
OTSGs for the Enhanced Oil Recovery Industry
We have successfully installed our Duplex technology in three OTSG projects in the enhanced oil recovery industry in California. We believe that these successful installations are gaining acceptance by the Southern California regulatory authorities and, as a result, market acceptance as well. Field data reported by our customers indicates significant efficiency improvements resulting from the installation of the ClearSign technology. We believe our new standardized boiler burner range of products is also well suited to this application.
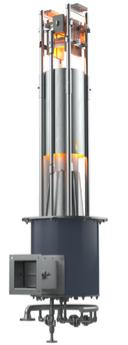
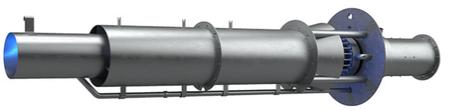
Technical Components of our ClearSign Core Technology
Our ClearSign Core burner technology consists of an industrial burner exterior body with our ClearSign Core technology in the interior. With our patented technology, the ClearSign Core replaces the traditional burner internal elements that control flame structure and formation, including the gas tips, flame stabilization device and refractory tile. Our ClearSign Core technology consists of a series of gas tips arranged inside the combustion air stream at the point it passes the boundary into a heater. Some distance
7
downstream is a primary or ignition device followed by a ceramic or metal flame stabilizing structure. Between the injection point of the fuel gas, and the primary or ignition device, is a support structure and mixing tube or tubes that optimize the flow of the fuel and air mixture onto the primary or ignition device and the flame stabilizing device. When the unreacted mix of gaseous fuel and air is directed at the flame stabilizing structure, the mixture ignites and burns within or immediately downstream of the structure. Because the fuel, air and any entrained flue gas have more time to mix in the ClearSign Core, the homogeneous mixture greatly reduces hot spots that are typically produced with existing technology and form NOx. The premixing of the fuel and combustion air in combination with the accelerated ignition and flame formation created by the downstream flame stabilization device also results in a dramatically shorter flame. In addition, NOx is greatly reduced, often to levels of 5ppm or below, depending on the specific application, without any external fans or associated power, thereby minimizing harmful emissions while improving system efficiency. A shorter flame also allows for consistent operation of a furnace at a higher capacity. As noted above, we believe the heat transfer profile of ClearSign’s burner technology both increases a heater’s and boiler’s productivity and operational run time and reduces heater maintenance costs by: (i) enhancing thermal efficiency, (ii) reducing the probability of flame impingement and the likelihood that carbon deposits form on the inside surfaces of heater process tubes (coking), and (iii) reducing the likelihood of heater process tube failures.
Refinery and Petrochemical
Heater Technology
Boiler Technology
ClearSign Core Performance
We currently have ClearSign Core burners operating in multiple boilers, heaters and flares. These operating burners meet new compliance standards enacted by California air authority. We also have products in commercial use in Europe and that are certified for sale in the Chinese boiler market. Our principal technologies have been developed into standardized designs and our business development activities are now focused on developing customer acceptance and adoption, and efficient channels to market. The industries using our technology take a conservative approach to adopting new technology and place significant reliance on references from existing customers when selecting new equipment. A major focus of our current business development activities is to make early sales and build our reference list. We also seek to provide comprehensive technical support to our sales efforts as well as demonstrate our technology and products in operation. Currently, we have the ability to demonstrate our products in rental boilers, industrial scale process burner test furnaces, and, where permissible, in operational installations at customer locations.
8
Our Target Markets
Our ClearSign Core products compete in the combustion and emissions control markets. These industries are highly competitive and currently dominated by companies that have comparatively more established products and substantially greater infrastructure, customer support networks, and financial resources. Based on testing and completed field installations to date, however, we believe that our ClearSign Core technology provides a unique and powerful combination of an overall cost-effective installation, energy efficiency, operational performance, and significantly reduced emissions. Further, we believe that our technology is well-suited to create substantial synergistic value by incorporating it into mainstream commercial offerings of the market incumbents as a “ClearSign Core”, thus leveraging the ClearSign technology and the established breadth and capabilities of collaborating companies.
We are targeting the following segments of the combustion market for adoption of our ClearSign Core technology:
| ● | institutional, commercial and industrial boilers; |
| ● | refinery, energy infrastructure and petrochemical process heaters; |
| ● | enclosed flares; and |
| ● | enhanced oil recovery steam generators |
In each of these segments, we are marketing solutions that include our ClearSign Core technology which we believe could simultaneously improve productivity, operational efficiency and pollution control.
Our target markets are greatly affected by air emission regulations and economic conditions. Accordingly, we prioritize our activities in target market segments geographically based on the needs of the local industries and the current and anticipated future requirements imposed by local environmental regulation. Details regarding the localized effect of environmental regulation in the United States are described in the section of this report titled “Our Industry.” In general, our immediate regional opportunities are in the West and Gulf Coasts of the United States and the regions of Northern China with high populations and cooler environments. In these areas of China, district heating is a large source of fossil fuel consumption, and reducing atmospheric pollution is a high priority of both the national and local governments.
Competition, Barriers to Entry and Go to Market Strategy
The industry in which we operate is global in scope and populated by large, established suppliers of burners and post-combustion air pollution control systems. These suppliers possess resources that are substantially greater than ours. Worldwide, suppliers of burners and air pollution control equipment include but are not limited to companies such as Callidus, Eclipse and Maxon (all three are subsidiaries of Honeywell), John Zink Hamworthy Combustion (a subsidiary of Koch Industries and including Coen), General Electric, Haldor Topsøe, Hitachi, Linde, Zeeco, Fives Group, Cleaver Brooks, Power Flame (a subsidiary of Aztec Inc.), and others.
These companies provide systems that include low and ultra-low NOx burners, selective and non-selective catalytic reduction systems, and other pollution control technologies. They are well-established and their combustion and emissions control systems are based mostly on mature, well-understood and proven technologies. As a result of the relatively slow pace of developing and adopting innovation, we believe the technology and products currently being offered by our large competitors have become commoditized with differentiation between suppliers most often based on price. These industry characteristics provide both an opportunity and a barrier to more nimble, disruptive companies.
From a customer's perspective, installation of legacy air pollution control technologies is viewed as a method of avoiding fines, as a cost of doing business, and as a means to operate within current and anticipated future regulatory requirements.
Unlike most other kinds of capital equipment that provide an economic return through enhanced productivity or efficiency, we believe customers of traditional emissions control equipment do not expect any positive return on emissions control investments other than the ability to continue to operate or avoid fines. We believe the ClearSign Core suite of products are further differentiated from its competitors because they give prospective customers the unique opportunity to greatly reduce capital investment and to realize a return on investment through increased efficiency and/or increased productivity.
9
As indicated above, we are seeking to develop our business in the combustion and emissions control market and to establish ourselves in a highly competitive industry among companies that have substantial financial resources, a well-developed infrastructure and established products. Our business development strategy seeks to obtain recognition of our technology’s value while minimizing the challenges inherent in this market including the strengths of the other market participants.
Major barriers faced by a new equipment manufacturer seeking to enter this market include:
1. | Developing engineering, order fulfillment and customer service staff: Especially in the refining and petrochemical industries, customers require specialist support throughout the life cycle of the combustion equipment including with order execution when purchasing. Recruiting and developing sufficient staff with the special skills necessary to provide the level of service required by customers in this market would take time and result in a significant ongoing overhead cost. |
2. | Developing operational infrastructure: Again, especially in the refining and petrochemical industries, customers require thorough quality assurance procedures, including demonstration of an item from their order, to prove that it meets performance guarantees. This requires, among other things, having access to a test furnace. Developing such an operation would require significant investment and ongoing costs. |
3. | Conservative customers: Our customers are very careful and methodical about adopting a new technology or product because of the complexity of their infrastructures, the cost of downtime in any part of a processing plant and the potential safety hazards of their operations. |
4. | Profit opportunity: There is very little differentiation between the products offered by the established burner equipment providers, which results in thin profit margins for the sale of new or replacement burners. A significant portion of a company’s profit results from the sales of replacement parts and equipment upgrades. Any new entrant without a differentiating technology will not have this established source of significant and immediate profit. |
We developed our “go to market” strategy for the ClearSign Core combustion business considering our strengths and weaknesses. The most important weaknesses are related to the barriers to entry identified above. We are a small company with limited financial resources and do not have the infrastructure to meet the requirements of our sophisticated target global customers without significant investment and increase in operational costs. Although we have highly skilled and experienced employees, we do not have the manpower to provide comprehensive service and customer support ourselves. We believe that it is in the best interests of the Company and our shareholders to develop our business utilizing an “asset light” model. Accordingly, we seek to collaborate with strategic partners to the extent possible to sell our products and maximize the profitability of those sales.
Our strengths include our technology, which has been developed to provide a standard set of “core” components that can be incorporated into any generic OEM burner body. These components enable unique performance that minimizes emissions and controls flame size. Our strengths also include the market opportunity potentially created by new and anticipated environmental emissions control regulations. These regulations will potentially require combustion performance that either exceeds the technology available from the incumbent equipment manufacturers or requires retrofitting existing equipment with a post-combustion clean up apparatus. Installing clean-up apparatus is very expensive especially for small to mid-sized heaters. We believe that the incumbent burner OEM product development approaches are, and will continue to be, incremental in nature, and are unlikely to pose a significant threat to the value provided by ClearSign Core technology in the foreseeable future.
Our business has been, and continues to be, developed with the goal of combining our technology with the infrastructure and resources of major OEM equipment manufacturers. Through such collaborative arrangements, OEM burner manufacturers can reap the benefits of adding truly differentiated and unique product lines to their offerings and ClearSign can overcome the barrier to market of needing to build capital and operating expense-intensive infrastructure and hiring a large specialist staff. In addition, we believe that having orders fulfilled by a well-known and trusted supplier will reduce the risk, as perceived by prospective customers, of dealing with a small company and aid in the adoption of our technology.
Our business plan contemplates forming collaborative partnerships with major OEM equipment manufacturers. At this time, we have demonstrated that our technology has commercial viability by generating interest from OEMs and end users. We expect that developing strategically chosen collaborative partnerships will result in supplying ClearSign Core technology to major global customers in large quantities together with the attendant engineering, quality control, customer support and project management services required by these sophisticated customers. We also believe that our collaborative partnerships will enable our OEM partners
10
to offer a unique product in the marketplace and provide both parties with a potentially significant commercial opportunity. Forming such alliances is expected to dramatically accelerate the global sales and market adoption of our technology. As announced in June 2019, we already have an agreement in place with Zeeco, who is one of the world’s largest burner manufacturers, to globally manufacture ClearSign Core process burners. The selling and marketing of our process burners pursuant to this agreement, however, is contingent on the successful completion of a comprehensive product performance and validation test. In addition, we have a collaborative agreement with California Boiler to sell and produce both fire tube boiler burner and flare products. We are also pursuing various licensing types of arrangements for other market verticals and ClearSign Core applications.
Pricing Strategy. We believe that the unique capabilities of our technology improve combustion equipment performance and provide significant economic value to our customers compared to the next best alternative solutions available. As a result, we expect that products containing ClearSign Core technology will sell at prices based on the value they offer rather than pursuant to standard competitive pricing that our competitors are forced to use in these mature markets.
Sensing Products. We are currently seeking first adopters to install our flame sensors for field demonstration. Although we have not yet completed the product launch of our sensing products and subsequent commercialization, we have obtained clear and consistent customer feedback guiding its first application. The target market for this technology is potentially every burner with a pilot on which flame sensors are deployed, providing a global and very high-volume opportunity. This market is not limited by emissions mandates or the type or manufacturer of the burners. The product has value for retrofit applications, where it is applied to existing burners, and for new burners, where it can be installed in burners by OEMs.
We are assessing the possibility of manufacturing the sensing products ourselves as well as partnering with one or more established OEM suppliers. Demonstration units have been manufactured and we are currently planning to manufacture the sensor ourselves for the foreseeable future. We are also exploring alternative paths to monetize the technology.
The fundamental technology for the sensors envisioned for transport applications is the same as for the flame sensors, but the application and form of the final product will be very different. We have received notable interest in this product from a major global customer giving us the confidence that there is a potential market for this technology, which is therefore worthy of future investment. This sensor product is in the very early stages of development and would be deployed in a highly regulated environment requiring a thorough product development process. The interest we have received to date, however, suggests that this could potentially be a significant future business opportunity for ClearSign.
Research and Development Program
The experience and industry contacts of our management team, board of directors, and consultants, along with potential customers in the petroleum, petrochemical, and industrial steam applications industries inform our research and development program. Field evaluation agreements, research agreements, and memoranda of understanding with potential development partners, customers and research institutions support this process. Our research and development activities make use of employees and consultants who are experts in the areas of industrial combustion, statistical experimental design, gas turbines, fluid mechanics and heat transfer.
With the maturation of our ClearSign Core technology, our development process has transitioned from research to commercialization. This has included optimizing the technology to perform in a manner readily adoptable by our prospective customers and easy to incorporate into the burner structures of our collaborative alliance partners. This later phase of development is influenced by customer feedback, product and component standardization, design for manufacture and inventory management simplification, both with respect to the manufacture of and lifetime support for our products.
Our technology and products for flame sensing applications have been proven at bench scale in our laboratory and at full scale in “first article” form. This product is currently in the commercialization phase. As discussed above, we also have another form of our sensing technology that we believe can indicate the potential flammability of a hydrocarbon gas and air mixture, which can have great and varied application in other industries such as transport. This product is in an earlier form and is currently undergoing validation and optimization of its intended role in this very different application.
11
Intellectual Property Protection
We have generated inventions that we believe to be patentable subject matter and for which we have been seeking protection through patent application filings. As of December 31, 2021, we have 113 active patent grants and another 29 patents pending with Patent Offices in the United States, China, and various European countries. We maintain an active review process to monitor for new inventions across the globe that threaten our intellectual property protection.
We cannot predict when our patent applications may result in issued patents, if at all. Further, we may modify a patent application in the future as we develop additional information. As a result, we may create additional patent applications from an existing application, consolidate existing patent applications, abandon applications, or otherwise modify applications based upon our judgment in order to protect our intellectual property in a reasonably cost-efficient manner.
Government Regulation
Government regulation, particularly with respect to the environment, is likely to play an important role in shaping our product mix and offerings. In addition, field implementation of our technologies requires permits from various local, state and federal agencies that regulate mechanical and electrical infrastructure and fire and air pollution control.
We believe that we offer major advances in emissions reductions and efficiency improvements. We also believe that emissions regulations could require a reduction in pollutants such as NOx thereby potentially enhancing market demand for our technology upon implementation of any such regulations. Possible legislation related to greenhouse gases, boiler Maximum Available Control Technology (MACT) rules, or other general reductions in required pollutant levels globally, especially in the U.S. and China, could bolster our ability to meet our business objectives. Although the timing of any such regulations is uncertain, the general trend over the last decades continues to be government-mandated reduction for all criteria pollutants. Ultimately, it may be possible for our technology to achieve BARCT [and/or MACT] designation. We believe that the availability of our technology alone may accelerate the government’s willingness to adopt more stringent environmental regulations. Further, we believe efficiency improvements, combined with the elimination of flame impingement, could generate market demand regardless of the existing regulatory framework because the potential efficiency, productivity and savings gains from our products could result in the adoption of our technology.
At this time, we believe that the current U.S. administration supports “green initiatives,” and we are not aware of any current or proposed federal, state or local environmental compliance regulations that would have a material detrimental effect on our business objectives. We do not anticipate any major expenditures to be required in order for our technology to comply with any environmental protection statutes. Concurrently the Chinese government has enacted notable tightening of allowable emissions levels, particularly for NOx emissions, and we anticipate this trend will continue in the future.
Human Capital
As of December 31, 2021, we had 12 full-time employees, and no part-time employees. Our employees are not covered by collective bargaining agreements, and we believe our relationship with our employees is good.
ITEM 1A: RISK FACTORS
We are subject to various risks that may materially harm our business, prospects, financial condition and results of operations. An investment in our common stock is speculative and involves a high degree of risk. In evaluating an investment in shares of our common stock, you should carefully consider the risks described below, together with the other information included in this report.
The risks described below are not the only risks we face. If any of the events described in the following risk factors actually occurs, or if additional risks and uncertainties later materialize that are not presently known to us or that we currently deem immaterial, then our business, prospects, results of operations and financial condition could be materially adversely affected. In that event, the trading price of our common stock could decline, and you may lose all or part of your investment in our shares. The risks discussed below include forward-looking statements, and our actual results may differ substantially from those discussed in these forward-looking statements.
12
Risks Related to Our Business
We are a company with a limited operating history and our future profitability is uncertain. We anticipate future losses and negative cash flows and we may never be profitable.
We are a company with a limited operating history and limited revenues to date. We have incurred losses since our inception and expect to experience operating losses and negative cash flows for the foreseeable future. As of December 31, 2021, we had a total accumulated deficit of approximately $82.8 million. We anticipate our losses will continue to increase from current levels because we expect to incur additional costs and expenses related to commercialization activities, product development, consulting costs, marketing and other promotional activities. In addition, we expect to continue incurring costs related to human capital development and strategic partnership development. We may never generate significant revenue and we may never be profitable.
If we do not receive additional financing when and as needed in the future, we may not be able to continue our development and commercialization efforts and our business may fail.
Our business is capital-intensive and requires capital investments in order for it to develop. Our cash on hand will likely not be sufficient to meet all of our future needs because our target customers are, in general, slow to adopt new technologies, and we anticipate that we will require substantial additional funds in excess of our current financial resources for research, development and commercialization of our technology, to obtain and maintain patents and other intellectual property rights in our technology, and for working capital and other purposes, the timing and amount of which are difficult to ascertain. Until our technology generates revenues sufficient to support our operations, we plan to obtain the necessary working capital for operations through the sale of our securities, but we may not be able to obtain financing in amounts sufficient to fund our business plans. If we cannot obtain additional funding when and as needed, our business might fail.
Market acceptance of our technology and business is difficult to predict. If our technology does not achieve market acceptance, our business could fail.
If we are unable to effectively demonstrate our technology in a timely fashion, gain recognition in our market segments, and develop a critical level of successful sales and product installations, we may not be able to successfully achieve sales revenue and our results of operations and financial condition would then suffer. Our ability to achieve future revenue will depend significantly upon achieving a critical mass of market awareness and sales to potential customers of our products. While we plan to achieve this awareness over time, there can be no assurance that awareness of our Company and technology will develop in a manner or pace that is necessary for us to achieve acceptance and profitability in the near term.
Further, we cannot predict the rate of adoption or acceptance of our technology by potential customers. While we have demonstrated our technology, this does not guarantee the industrial combustion market will accept it, nor can we control the rate at which such acceptance may be achieved. In certain of our market segments, there is a well-established channel with a limited number of companies engaged in reselling to our target customers. Failure to achieve productive relations with a sufficient number of these prospective partners may impede adoption of our technology. Additionally, some potential customers in our target industries are historically risk-averse and have been slow to adopt new technologies. If our technology is not widely adopted in the industrial combustion market, we may not earn enough by selling or licensing our technology to support our operations, recover our research and development costs or become profitable and our business could fail.
Our efforts may never demonstrate the feasibility of our product.
Our research and development efforts remain subject to all of the risks associated with the development of new products based on emerging and innovative technologies, including without limitation unanticipated technical or other problems, our ability to scale our technology to large industrial applications, conditions in the field during installation and the possible insufficiency of funds for completing development of these products. Technical problems, including those specific to customer site implementation, may result in delays and cause us to incur additional expenses that would increase our losses. If we cannot complete, or if we experience significant delays in completing, research and development of our technology for use in potential commercial applications, particularly after incurring significant expenditures, our business may fail.
13
Changes to environmental regulations could make our technology less desirable.
The negative environmental impacts of industrial activity have given rise to significant environmental regulation in industrialized countries. These regulations are important incentives in the adoption of technologies like ours. To the extent that environmental regulations in the United States and in other industrialized countries are modified in the future, or even relaxed, our technology may not produce the results required, or may even be unnecessary, to comply with the modified regulations. If federal, state or local regulatory agencies relax the clean air regulations our technologies are designed to address, our business and results of operations could be materially adversely affected.
We may fail to adequately protect our proprietary technology, which would allow our competitors to take advantage of our research and development efforts.
Our long-term success largely depends on our ability to market our technology. We rely on a combination of patents, trade secrets and other intellectual property laws, confidentiality and security procedures and contractual provisions to establish and protect our proprietary rights in our technology, products and processes. If we fail to obtain or maintain these protections, we may not be able to prevent third parties from using our proprietary technologies. Our pending or future patent applications may not result in issued patents. In addition, any patents issued to us, or that may be issued to us in the future, may not contain claims sufficiently broad enough to protect us against third parties with similar technologies or products or from third parties infringing such patents or misappropriating our trade secrets or provide us with any competitive advantage. In addition, effective patent and other intellectual property protection may be unenforceable or limited in foreign countries. If a third party initiates litigation regarding the validity of our patents and is successful, a court could revoke our patents or limit the scope of coverage for those patents.
We also rely upon trade secrets, proprietary know-how and continuing technological innovation to remain competitive. We protect this information with reasonable security measures, including the use of confidentiality and invention assignment agreements with our employees and consultants and confidentiality agreements with strategic customers and partners. It is possible that these agreements may not be sufficient or that these individuals or companies may breach these agreements and that any remedies for a breach will be insufficient to allow us to recover our costs and damages. Furthermore, our trade secrets, know-how and other technology may otherwise become known or be independently discovered by our competitors.
We may incur substantial costs as a result of litigation or other proceedings relating to patent and other intellectual property rights.
A third party may sue us for infringing its intellectual property rights. Likewise, we may need to resort to litigation to enforce our patent rights or to determine the scope and validity of third-party intellectual property rights. The cost to us of any litigation or other proceeding relating to intellectual property rights, even if resolved in our favor, could be substantial, and the litigation would divert our efforts from our business activities. Some of our competitors may be able to sustain the costs of complex patent litigation more effectively than we can because they have substantially greater resources. If we do not prevail in this type of litigation, we may be required to pay monetary damages and/or expenses; stop commercial activities relating to our products; obtain one or more licenses in order to secure the rights to continue the manufacturing or marketing of our products; or attempt to compete in the market with substantially similar products. Uncertainties resulting from the initiation and continuation of any litigation could limit our ability to continue some of our operations.
A cybersecurity incident or other technology disruptions could negatively impact our business and our relationships with customers.
We use computers in substantially all aspects of our business operations. We also use mobile devices and other online activities to connect with our employees, consultants, suppliers and customers. Such uses give rise to cybersecurity risks, including security breaches, espionage, system disruption, theft, the compromise of trade secrets and inadvertent release of information. Our business involves the storage and transmission of sensitive and/or confidential information and intellectual property, including customers’ and suppliers’ information, private information about employees and financial and strategic information about us. If we fail to assess and identify cybersecurity risks associated with our operations, we may become increasingly vulnerable to such risks. Additionally, while we have implemented measures to prevent security breaches and cyber incidents, our preventative measures and incident response efforts may not be entirely effective. The theft, destruction, loss, misappropriation, or release of sensitive and/or confidential information or intellectual property, or interference with our information technology systems, could result in business
14
disruption, negative publicity, brand damage, violation of privacy laws, loss of customers, potential liability and competitive disadvantage all of which could have a material adverse effect on our business, financial condition or results of operations.
We cannot guarantee that any collaborative business research and development partnership we enter into will be successful.
Collaborative arrangements involve risks that participating parties may disagree on business decisions and strategies. These disagreements could result in delays, additional costs, risks of litigation, and failure of the development of our technology within the combustion market segment. Success of any collaborative arrangements we enter into will depend, in part, on whether those with whom we collaborate fulfill their contractual obligations satisfactorily. If a party with whom we collaborate fails to perform its contractual obligations satisfactorily, we may be unable to make the additional investments or provide the added services that would be required to compensate for that failure. If we are unable to adequately address any such performance issues, our reputation may be materially adversely affected and we may be exposed to legal liability. Our inability to successfully maintain collaborative relationships, once we enter into them, or to enter into new collaborative arrangements, could have a material adverse effect on our results of operations.
If we are unable to keep up with rapid technological changes, our products may become obsolete.
The market for alternative environmental products is characterized by significant and rapid technological change and innovation. Although we intend to employ our technological capabilities to create innovative products and solutions that are practical and competitive in today’s marketplace, future research and discoveries by others may make our products and solutions less attractive or even obsolete compared to other alternatives that may emerge.
Our technology for some industrial applications has not been safety tested yet.
There is inherent danger in dealing with the combustion process. There is additional danger in modifying this process in ways that are new and have only been implemented on a limited basis at a commercial scale. Although we have not yet encountered any areas of risk in the development or testing of our products beyond those already inherent in the combustion process or those particular to an industrial site, we may be exposed to liabilities should an industrial accident occur during development, testing, or operation in our laboratory or during field implementation of our technology.
We depend on approval from various local, state and federal agencies to implement and operate our technology. There is no assurance that these agencies will approve our technology.
Our technology includes enhancement of the combustion process to reduce certain emissions at a lower cost of operation than current air pollution control devices. Field implementation of our technology will therefore require permits from various local, state and federal agencies that regulate mechanical and electrical infrastructure and fire and air pollution control. Our technology may be subject to heightened scrutiny since it will be new to these governing bodies. As such, there may be delays or rejections in applications of portions of or all of our technology in the individual jurisdictions involved.
We are uncertain of our profit margins and whether such profit margins, if achieved, will be able to sustain our business.
We have not fully developed all of our products and those products that have been developed have experienced limited sales. As a result, we cannot reliably predict our profit margins. Our operating costs could increase significantly compared to those we currently anticipate due to unanticipated results from the commercialization process, application of our technology to unique or difficult processes, regulatory requirements and particular field implementations. Further, we envision our pricing to be highly dependent on the benefits that our customers believe they will achieve using our products. Accordingly, we cannot predict whether or when we will achieve profitability, and if achieved, the amount of such profit margins.
Many of our potential competitors have greater resources, and it may be difficult to compete against them.
The combustion industry is characterized by intense competition. Many of our potential competitors have better name recognition and substantially greater financial, technical, manufacturing, marketing, personnel and/or research capabilities than we do. Although at this time we do not believe that any of our potential competitors have technology similar to ours, we are aware certain potential competitors are attempting to develop similar products. Many firms in the combustion industry have made and continue to make substantial investments in improving their technologies and manufacturing processes. In addition, they may be able to price their
15
products below the marginal cost of production in an attempt to establish, retain or increase market share. Because of these circumstances, it may be difficult for us to compete successfully in the combustion market.
The loss of the services of our key management and personnel or the failure to attract additional key personnel could adversely affect our ability to operate our business.
A loss of one or more of our current officers or key employees could severely and negatively impact our operations. We have no present intention to obtain key-man life insurance on any of our executive officers or management. Additionally, competition for highly skilled technical, managerial and other personnel is intense. As our business develops, we might not be able to attract, hire, train, retain and motivate the highly skilled executives and employees we need to be successful. If we fail to attract and retain the necessary technical and managerial personnel, our business will suffer and might fail.
There are many risks we are exposed to by doing business in China.
We are exposed to risks of doing business in China. As a result, the economic, political, legal and social conditions in China could have a material adverse effect on our business. In addition, the legal system in China has inherent uncertainties that may limit the legal protections available in the event of any claims or disputes that we may have with third parties, including our ability to protect the intellectual property we use in China. As China’s legal system is still evolving, the interpretation of many laws, regulations and rules is not always uniform and enforcement of these laws, regulations and rules involve uncertainties, which may limit the remedies available in the event of any claims or disputes with third parties. Some of the other risks related to doing business in China include:
| ● | the Chinese government exerts substantial influence over the manner in which we must conduct our business activities; |
| ● | restrictions on currency exchange may limit our ability to receive and use our cash effectively; |
| ● | the Chinese government may favor local businesses and make it more difficult for foreign businesses to operate in China on an equal footing, or in general; |
| ● | there are uncertainties related to the enforcement of contracts with certain parties; and |
| ● | more restrictive rules on foreign investment could adversely affect our ability to expand our operations in China. |
As a result of our anticipated growing operations in China, these risks could have a material adverse effect on our business, results of operations and financial condition.
Furthermore, our operations in China have been impacted by COVID 19, which has resulted in the limitation of flights in and out of China, quarantines, and travel restrictions on the local work force and personnel from our U.S. offices. As a result, the Company has experienced delays in the completion of boiler burner demonstration projects during 2020 and 2021. The disruptions resulting from the coronavirus outbreak could have a negative impact on our financial condition, results of operations and business relationships.
Finally, the U.S. Foreign Corrupt Practices Act and similar foreign anti-corruption laws generally prohibit companies and their intermediaries from making improper payments or providing anything of value to improperly influence foreign government officials for the purpose of obtaining or retaining business or obtaining an unfair advantage. While we make every attempt to comply with these laws, our operations outside the United States may increase the risk of violating such laws. Violations of these laws may result in severe criminal or civil sanctions, could disrupt our business and result in a material adverse effect on our reputation, business and results of operations or financial condition.
Our business and operations have been and may continue to be adversely affected by the recent coronavirus outbreak.
Our operations in China have been impacted by the severity of the pandemic, which has prevented our USA based employees, other than our President of ClearSign Asia, from visiting the country. The ClearSign Asia President entered China by adhering to the strict quarantine requirements imposed by China for US travelers. This caused some delay in the progress on our product development and product demonstrations there.
In addition to our own work, the work of our partners and suppliers has been, and continues to be affected. The resulting delays to the delivery of materials and services, has resulted in delays to our projects. As a result of such delays, our business and operations have been and may continue to be adversely affected.
16
We cannot provide assurance that rising inflation will not adversely affect our operations.
The impact of inflation on our operating results has been moderate in recent years, reflecting generally lower rates of inflation in the economy. While inflation has not had a material impact upon operating results, there is no assurance that our business will not be affected by inflation in the future.
Due to the nature of our business and products, we may be liable for damages based on product liability and other tort and warranty claims.
We face an inherent risk of exposure to claims in the event that the failure, use or misuse of our products results, or is alleged to result, in death, bodily injury, property damage, or economic loss.
We cannot provide assurance that global supply-chain constraints will not adversely affect our commercialization efforts.
The impact of the global supply-chain constraints has been moderate for our company, reflecting generally reasonable lead-time commitments from our suppliers and strategic partners. While these constraints have not had a material impact to-date, we can provide no assurance that our business will not be affected by in the future.
Risks Related to Owning Our Securities
The public market for our securities is volatile. This may affect not only the ability of our investors to sell their securities, but the price at which they can sell their securities.
We completed the initial public offering of our common stock in April 2012. Since that time, our common stock (CLIR: NASDAQ) has traded as low as $0.35 per share and as high as $11.75 per share based upon daily closing prices, and day-to-day trading has been volatile at times. This volatility may continue or increase in the future. The market price for the securities may be significantly affected by factors such as progress in the development of our technology, agreements with research facilities or co-development partners, commercialization of our technology, variations in quarterly and yearly operating results, general trends in the alternative energy industry, and changes in state or federal regulations affecting us and our industry. Furthermore, in recent years the stock market has experienced extreme price and volume fluctuations that are unrelated or disproportionate to the operating performance of the affected companies, such as the market reactions to internet marketed ‘short squeezes’ or the coronavirus outbreak. Such broad market fluctuations may adversely affect the market price of our securities.
We have the right to issue shares of preferred stock. If we were to issue preferred stock, it is likely to have rights, preferences and privileges that may adversely affect our common stock or other securities.
We are authorized to issue 2.0 million shares of “blank check” preferred stock, with such rights, preferences and privileges as may be determined from time-to-time by our board of directors. Our board of directors is empowered, without shareholder approval, to issue preferred stock in one or more series, and to fix for any series the dividend rights, dissolution or liquidation preferences, redemption prices, conversion rights, voting rights, and other rights, preferences and privileges for the preferred stock. No shares of preferred stock are presently issued and outstanding and we have no immediate plans to issue shares of preferred stock. The issuance of shares of preferred stock, depending on the rights, preferences and privileges attributable to the preferred stock, could adversely reduce the voting rights and powers of the common stock and the portion of our assets allocated for distribution to common stockholders in a liquidation event, and could also result in dilution in the book value per share of our common stock. The preferred stock could also be utilized, under certain circumstances, as a method for raising additional capital or discouraging, delaying or preventing a change in control of the Company, to the detriment of our shareholders. We cannot assure you that we will not, under certain circumstances, issue shares of our preferred stock.
We may be required to raise additional capital by issuing new securities, which may have terms or rights superior to those of our shares of common stock, which could adversely affect the market price of our shares of common stock and our business.
We will require additional financing to fund research, development and commercialization of our technology, to obtain and maintain patents and other intellectual property rights in our technology, and for working capital and other purposes. We may not be
17
able to obtain financing on favorable terms, if at all. If we raise additional funds by issuing equity securities, the percentage ownership of our then-current shareholders will be reduced. Further, we may have to offer new investors in our equity securities rights that are superior to the holders of common stock, which could adversely affect the market price and the voting power of shares of our common stock. If we raise additional funds by issuing debt securities, the holders of these debt securities would similarly have some rights senior to those of the holders of shares of common stock, and the terms of these debt securities could impose restrictions on operations and create a significant interest expense for us which could have a materially adverse effect on our business and results of operations.
We have not paid dividends in the past and have no immediate plans to pay dividends.
We plan to reinvest all of our earnings, to the extent we have earnings, in order to continue to develop our products, to market our products, to cover operating costs and to otherwise become and remain competitive. We do not plan to pay any cash dividends with respect to our securities in the foreseeable future. We cannot assure you that we would, at any time, generate sufficient surplus cash that would be available for distribution to the holders of our common stock as a dividend.
We have a significant number of options and restricted stock units outstanding and we may issue additional awards in the future to employees, officers, directors, independent contractors and agents. Sales of the underlying shares of common stock could adversely affect the market price of our common stock.
As of December 31, 2021, we had outstanding options for the purchase of 2,964 thousand shares of common stock and 112 thousand shares of outstanding restricted stock units (“RSUs”). Under the ClearSign Technologies Corporation 2021 Equity Incentive Plan and the ClearSign Technologies Corporation 2013 Consultant Stock Plan (collectively, the “Plans”), we have the ability to grant awards of shares, RSU’s or options to purchase shares of our common stock to employees, officers, directors, independent contractors and agents. Furthermore, the Company operates under an Employee Incentive Plan that provides for increases in the number of awards based on the terms outlined in the Plan. Certain holders may sell these shares in the public markets from time to time, without limitations on the timing, amount or method of sale. If our stock price rises, the holders may exercise their options and RSUs and sell a large number of shares. This could cause the market price of our common stock to decline.
We have incurred and will incur significant costs as a result of being a public company that reports to the Securities and Exchange Commission and our management is required to devote substantial time to meet compliance obligations.
As a public company reporting to the Securities and Exchange Commission, we incur significant legal, accounting, investor relations, printing, board compensation, and other expenses that we did not incur as a private company. These costs totaled 1.3 million in 2021. We are subject to the reporting requirements of the Securities Exchange Act of 1934 and the Sarbanes-Oxley Act of 2002 (with the exception of the requirement of auditor attestation of internal control over financial reporting from which we are currently excluded as a non-accelerated filer company), as well as rules subsequently implemented by the Commission that impose significant requirements on public companies, including requiring establishment and maintenance of effective disclosure and financial controls and changes in corporate governance practices. In addition, there are significant corporate governance and executive compensation-related provisions in the Dodd-Frank Wall Street Reform and Protection Act that as we grow could increase our legal and financial compliance costs, make some activities more difficult, time-consuming or costly and may also place undue strain on our personnel, systems and resources. Our management and other personnel continually devote a substantial amount of time to these compliance initiatives. Furthermore, these rules and regulations may make it more difficult and more expensive for us to obtain director and officer liability insurance, and we may be required to accept reduced policy limits and coverage or incur substantially higher costs to obtain the same or similar coverage. As a result, it may be more difficult for us to attract and retain qualified people to serve on our board of directors, our board committees or as executive officers.
Our charter documents and Washington State law may inhibit a takeover that shareholders consider favorable.
Provisions of our articles of Incorporation and bylaws and applicable provisions of the state of Washington law may delay or discourage transactions involving an actual or potential change in our control or change in our management, including transactions in which shareholders might otherwise receive a premium for their shares, or transactions that our shareholders might otherwise deem to be in their best interests. The provisions in our articles of incorporation and bylaws:
| ● | authorize our board of directors to issue preferred stock without shareholder approval and to designate the rights, preferences and privileges of each class; if issued, such preferred stock would increase the number of outstanding shares of our capital stock and could include terms that may deter an acquisition of us; |
18
| ● | limit who may call shareholder meetings; |
| ● | do not provide for cumulative voting rights; and |
| ● | provide that all vacancies may be filled by the affirmative vote of a majority of directors then in office, even if less than a quorum, unless the vacant office is to be held by a director elected by the holders of one or more classes or series of shares entitled to vote thereon, in which case the vacancy can be filled only by the vote of the holders of such class or series. |
In addition, Chapter 23B.19 of the state of Washington Revised Code generally limits our ability to engage in any business combination with a person who beneficially owns 10% or more of our outstanding voting stock unless certain conditions are satisfied. This restriction lasts for a period of five years following the share acquisition. These provisions may have the effect of entrenching our management team and may deprive you of the opportunity to sell your shares to potential acquirers at a premium over prevailing prices. This potential inability to obtain a control premium could reduce the price of our common stock or other securities.
ITEM 1B: UNRESOLVED STAFF COMMENTS.
None.
ITEM 2: PROPERTIES.
Our principal office is located at 8023 East 63rd Place, Suite 101 Tulsa, Oklahoma with satellite offices located in Seattle and Beijing, China. The Board of Directors unanimously approved moving the principal office from Seattle to Tulsa as of January 1, 2022. At our principal office in Tulsa, we lease 3,922 square feet of office space, under a lease which expires in September 2027. Monthly minimum rent is approximately $5 thousand with an annual 2.0% increase. The Company also leases 9,200 square feet of office space located in Seattle, Washington and 1,019 square feet in Beijing, China. The minimum monthly rent for our Seattle location is approximately $14 thousand with an annual 2.5% increase. The term of the Seattle lease is set to expire in May 2023, and the company does not intend to renew this lease. The term of the Beijing lease began in November 2018 and expired in November 2020. It was renewed for an additional 18 months through May 2022, and is being treated as a short term lease. The monthly minimum rent for our Beijing location is approximately $5 thousand (30,000RMB).
ITEM 3: LEGAL PROCEEDINGS.
From time to time we may become involved in various lawsuits and legal proceedings which arise in the ordinary course of business. Litigation is subject to inherent uncertainties and an adverse result in any such matter may harm our business. As of the date of this report, we are not a party to any material pending legal proceedings.
ITEM 4: MINE SAFETY DISCLOSURES.
Not applicable.
19
PART II
ITEM 5: MARKET FOR REGISTRANT’S COMMON EQUITY, RELATED STOCKHOLDER MATTERS AND ISSUER PURCHASES OF EQUITY SECURITIES.
Our common stock is listed on the Nasdaq Capital Market under the symbol “CLIR”.
According to our transfer agent, as of March 15, 2022, we had 285 shareholders of record. This number does not include an indeterminate number of holders whose shares are held by brokers in street name. Our stock transfer agent is VStock Transfer, LLC, 18 Lafayette Place, Woodmere, NY 11598.
Recent Issuances of Unregistered Securities
On December 31, 2021, we issued 3.8 thousand shares of common stock, having a per share value of $1.93, the closing price of our common stock on November 19, 2021, the date of grant, from our 2013 Consultant Stock Plan to our investor relations firm, Firm IR Group, LLC, for services provided in the three months ended December 31, 2021. We relied on Section 4(a)(2) of the Securities Act of 1933, as amended, and Regulation D promulgated thereunder to issue the stock.
Equity Compensation Plan Information
See Item 12, Security Ownership of Certain Beneficial Owners and Management and Related Stockholder Matters, for information about our equity compensation plans.
ITEM 6: [RESERVED]
ITEM 7: MANAGEMENT’S DISCUSSION AND ANALYSIS OF FINANCIAL CONDITION AND RESULTS OF OPERATIONS.
The following discussion and analysis of our financial condition and results of operations should be read in conjunction with the audited consolidated financial statements and related notes included elsewhere in this Annual Report on Form 10-K. In addition to historical information, this discussion and analysis here and throughout this Form 10-K contains forward-looking statements that involve risks, uncertainties and assumptions. Our actual results may differ materially from those anticipated in these forward-looking statements due to a number of factors, including but not limited to, the risks described in the section titled “Risk Factors”.
OVERVIEW
We design and develop technologies for the purpose of improving key performance characteristics of combustion systems, including emission and operational performance, energy efficiency and overall cost-effectiveness. Our ClearSign Core technology is currently installed in limited commercial applications. We have generated nominal revenues from operations to date to meet operating expenses.
We have incurred losses since inception totaling $82.8 million and we expect to experience operating losses and negative cash flow for the foreseeable future. We have historically financed our operations primarily through issuances of equity securities. Since inception, we have raised approximately $84.0 million in gross proceeds through the sale of our equity securities. We may need to raise additional capital in the future, however, the significant volatility in the capital markets may negatively affect our ability to raise this additional capital.
It is not possible at this time to estimate the full impact that the coronavirus pandemic will have on our business or on our potential customers, suppliers or other business partners. However, the continued spread of the coronavirus, the measures taken by the governments of affected countries, actions taken to protect employees, the limitations placed on travel and border crossings, and the impact of the pandemic on various business activities in affected countries could adversely impact our operational results and financial condition.
20
In order to generate meaningful revenues, our technologies must gain market recognition and acceptance to develop sufficient recurring sales. In addition, management believes that the successful growth and operation of our business is dependent upon our ability to obtain adequate sources of funding through co-development agreements, strategic partnering agreements, or equity or debt financing to adequately support commercialization of our research and development efforts, protect intellectual property, form relationships with strategic partners and provide for working capital and general corporate purposes. There can be no assurance that we will be successful in achieving our long-term plans, or that such plans, if consummated, will result in profitable operations or enable us to continue in the long-term as a going concern.
Our costs include employee salaries and benefits, compensation paid to consultants, materials and supplies for prototype development and manufacture, costs associated with development activities including materials, sub-contractors, travel and administration, legal and accounting expenses, sales and marketing costs, general and administrative expenses, and other costs associated with an early stage, publicly-traded technology company. As of December 31, 2021, we have 12 full-time employees. Because using third party expertise and resources is more efficient than maintaining full time resources, we also expect to incur consulting expenses related to technology development and some administrative, sales and legal functions commensurate with our current levels.
The amount that we spend for any specific purpose may vary significantly, and could depend on a number of factors including, but not limited to, the pace of progress of our commercialization and development efforts, actual needs with respect to product testing, development and research, market conditions, and changes in or revisions to our sales and marketing strategies.
Research, development, and commercial acceptance of new technologies are, by their nature, unpredictable. Although we undertake development and commercialization efforts with reasonable diligence, there can be no assurance that the net proceeds from our securities offerings will be sufficient to enable us to develop our technology to the extent needed to create future sales to sustain operations. If the net proceeds from these offerings are insufficient for this purpose, we will consider other options to continue our path to commercialization, including, but not limited to, additional financing through follow-on equity offerings, debt financing, co-development agreements, sale or licensing of developed intellectual property, or other alternatives.
We cannot assure that our technologies will be accepted, that we will ever earn revenues sufficient to support our operations, or that we will ever be profitable. Furthermore, we have no committed source of financing and we cannot assure that we will be able to raise money as and when we need it to continue our operations. If we cannot raise funds as and when we need them, we may be required to scale back our development and deployment plans by reducing expenditures for employees, consultants, business development and marketing efforts or to otherwise severely curtail, or even to cease, our operations.
Critical Accounting Policies
The following discussion and analysis of financial condition and results of operations is based upon our financial statements, which have been prepared in conformity with accounting principles generally accepted in the United States of America. Certain accounting policies and estimates are particularly important to the understanding of our financial position and results of operations and require the application of significant judgment by our management or can be materially affected by changes from period to period in economic factors or conditions that are outside of our control. As a result, they are subject to an inherent degree of uncertainty. In applying these policies, our management uses their judgment to determine the appropriate assumptions to be used in the determination of certain estimates. Those estimates are based on our historical operations, our future business plans and projected financial results, the terms of existing contracts, our observance of trends in the industry, information provided by our customers and information available from other outside sources, as appropriate. See Note 2 to our audited consolidated financial statements included elsewhere in this report for a more complete description of our significant accounting policies.
Revenue Recognition and Cost of Goods Sold. The Company recognizes revenue and related cost of goods sold in accordance with FASB ASC 606 Revenue from Contracts with Customers (ASC 606). Revenues and cost of goods sold are recognized once the goods or services are delivered to the customer’s control or non-refundable performance obligations are satisfied. The Company’s contracts with customers generally have performance obligations and a schedule of non-refundable cancellation obligations. The contracts generally will be fully performed upon delivery of certain drawings or equipment. Revenue related to the contracts is recognized following the completion of non-refundable performance obligations as defined in the contract.
The Company’s contracts generally include progress payments from customers upon completion of defined milestones. As these payments are received, they are offset against accumulated project costs and recorded as either contract assets or contract
21
liabilities. Upon completion of the performance obligations and collectability is determined, revenue can be recorded. For any contract in connection with which the Company is expected to incur costs in excess of the contact price, the Company accrues the estimated loss in full in the period such determination is made.
Impairment of Long-Lived Assets
The Company tests long-lived assets, consisting of fixed assets, patents, and other intangible assets, for impairment whenever events or changes in circumstances indicate that the carrying amount of an asset may not be recoverable through the estimated undiscounted cash flows expected from the use and eventual disposition of the assets. In the event an asset in not fully recoverable a loss is recognized based on the amount by which the carrying amount exceeds the fair value of the long-lived assets. Fair value is determined based on the present value of estimated expected cash flows using a discount rate commensurate with the risks involved, quoted market prices, or appraised values depending upon the nature of the assets. Losses on long-lived assets to be disposed of is determined in a similar manner, except those fair values are reduced for the cost of disposal.
Product Warranties
The Company warrants all installed products against defects in materials and workmanship, and shortcomings in performance compared to contractual guarantees for a period specified in each contract. Accruals for product warranties are based on expected warranty experience and current product performance trends which are recorded as a component of cost of sales at the time revenue is recognized. The warranty liabilities are reduced by material and labor costs during the warranty period in the periods in which the costs are incurred. The Company periodically assesses the adequacy of our recorded warranty liabilities and adjusts the amounts as necessary, and such adjustments could be material if estimates differ significantly from actual warranty expense. The warranty liabilities are included in accounts payable and accrued liabilities in the unaudited condensed consolidated balance sheets.
Research and Development
The cost of research and development is expensed as incurred. Research and development costs consist of salaries, benefits, share based compensation, consumables, and consulting fees, including costs to develop and test prototype equipment and parts. Research and Development costs have been offset by funds received from strategic partners in cost sharing, collaborative projects. During the year ended December 31, 2021, the Company received $50 thousand from such arrangements and during the year ended December 31, 2020, the Company received $40 thousand to partially fund specific engineering activity relating to the development of burners for a Super Major and $50 thousand to partially fund the engineering and installation of a product for an air quality demonstration project. Since these funds were provided without expectation of reciprocation, other than the notification of research results, the funds received were offset against the related research and development costs incurred.
Stock-Based Compensation
The costs of all employee stock options, as well as other equity-based compensation arrangements, are reflected in the condensed consolidated financial statements based on the estimated fair value of the awards on the grant date. That cost is recognized over the period during which an employee is required to provide service in exchange for the award, or in the case of performance options, expense is recognized upon completion of a milestone as defined in the grant agreement. Stock-based compensation for stock grants to non-employees is determined as the fair value of the consideration received or the fair value of equity instruments issued, whichever is more reliably measured.
Fair Value of Financial Instruments
The Company's financial instruments primarily consist of cash and cash equivalents, accounts payable, accrued expenses and short-term investments in government securities. As of the balance sheet date, the estimated fair values of the financial instruments were not materially different from their carrying values as presented on the balance sheets. This is primarily attributed to the short maturities of these instruments.
Results of Operations
Comparison of the Years Ended December 31, 2021 and 2020
Highlights of our annual financial performance are as follows:
22
For the Year Ended | ||||||||||||
December 31, | ||||||||||||
(in thousands, except per share data) | 2021 |
| 2020 | $ Change | % Change | |||||||
Revenues | $ | 607 | $ | — | $ | 607 | N/A | |||||
Cost of goods sold | 1,059 | 279 | $ | 780 | (279.6) | % | ||||||
Gross Loss | (452) | (279) | $ | (173) | (62.0) | % | ||||||
Operating Expenses | 7,693 | 6,653 | $ | 1,040 | (15.6) | % | ||||||
Other income | 253 | 46 | $ | 207 | 450.0 | % | ||||||
Net loss | $ | (7,892) | $ | (6,886) | $ | (1,006) | (14.6) | % | ||||
Basic and diluted net income per common share | $ | (0.25) | $ | (0.25) | $ | — | — | % | ||||
Sales and Gross Loss
Consolidated revenues for the 2021 year totaled $607 thousand, whereas no sales were reported in 2020. Revenues in 2021 include $499 thousand from contracts related to process burners, boiler burners and installation services. Current year demand for our products and services came from a range of customers and geographies, such as a United States infrastructure company, a European refinery owned by a global energy company, and a Chinese boiler burner rental company. An additional $108 thousand in sales were recorded from two prior year projects where constraints relating to collectability were eliminated in the current year.
Gross loss increased by $173 thousand, or 62.0% compared with 2020. In 2021, gross loss was unfavorably impacted by contract losses reported in costs of goods sold, which amounted to $762 thousand. These contract losses were incurred by refinery projects with most of the loss derived from our ExxonMobil project. The ExxonMobil loss was caused by rigorous product testing and product development costs. In contrast, gross loss was favorably impacted by expired product warranties reducing costs of goods sold by $86 thousand. During the year ended December 31, 2020, gross loss was unfavorably impacted by contract losses of $450 thousand, offset by favorable warranty expirations of $171 thousand.
In September of 2021, the Company received verbal notification from ExxonMobil that our project at their Baytown, Texas refinery would be placed on hold. At that time, we were fully prepared for a formal witness acceptance test by ExxonMobil, which would have allowed their staff to move into the final phases of the project. ExxonMobil noted their engineers had insufficient time to meet their targeted 2022 refinery turnaround. ClearSign and ExxonMobil are continuing to discuss contractual obligations related to the Baytown project.
Operating Expenses
Operating expenses consist of research and development (R&D) and general and administrative (G&A) expenses, which are addressed separately below.
R&D expenses increased by $651 thousand or approximately 32.1% to $2,680 thousand for the year ended December 31, 2021, as compared to $2,029 thousand during the year ended December 31, 2020. In 2021, we incurred additional costs year over year of approximately $315 thousand for product development. A majority of this spend related to boiler burner product lines that were developed in collaboration with our strategic partners California Boiler and Zeeco. As a result, ClearSign developed a 125 horsepower (hp) and 500hp fire tube boiler burner along with a 2400hp water tube boiler burner. Furthermore, we assessed our patent and trademark intangible assets to ensure that our ongoing intellectual property investments protect future anticipated cash returns. The assessment was a two-phased approach with the first phase focused on product alignment, and the second phase focused on a risk, reward cost benefit analysis. As a result of these assessments, we recognized a $385 thousand non-cash impairment charges, and an additional $50 thousand in accelerated amortization. These R&D cost increases were offset by approximately $50 thousand for year over year net savings in human capital costs.
R&D expenditures were lower in the year ended December 31, 2020, due to reduced laboratory and customer fieldwork costs, coupled with zero costs for non-cash impairment charges.
23
G&A expenses increased by $389 thousand or approximately 8.4% to $5,013 thousand during the year ended December 31, 2021, as compared to $4,624 thousand during the year ended December 31, 2020. In 2021, we incurred additional costs year over year of approximately $380 thousand for accounting and audit costs. Most of these costs related to temporary professional staff and recruitment, to reinforce the finance and accounting function after the death of our CFO in July 2021. The Company accrued $32 thousand for an estimated renovation liability to exit the Seattle lease at the end of its term. These G&A cost increases were offset by approximately $45 thousand for year over year net savings in human capital costs.
G&A expenditures were lower in the year ended December 31, 2020, due to lower costs related to professional services and travel expenses due in large part to the impact of the COVID 19 pandemic.
Other income
Other income for the year ended December 31, 2021 reflects a $251 thousand gain on forgiveness of a Paycheck Protection Program ("PPP") loan and accrued interest under the 2020 CARES Act. We received notification of the loan forgiveness during the second quarter of 2021. Other income of $44 thousand for the year ended December 31, 2020 resulted from a non-recurring sale of spare materials and parts for an installation site on a previously completed contract.
Net Loss
Net loss for the year ended December 31, 2021, was $7,892 thousand compared to $6,886 thousand for the year ended December 31, 2020, or an approximate 14.6% increase. The $1,006 thousand increase in net loss during the year ended December 31, 2021 is primarily attributable to the testing and engineering costs incurred during extensive development of the process burner technology under the initiative of the ExxonMobil technology validation project, as well as costs attributable to product development and commercialization efforts for our fire tube and water boiler burners. These cost increases were offset by year over year revenue increases for product deliveries and installation services.
Liquidity and Capital Resources
At December 31, 2021, our cash and cash equivalent balance totaled $7,607 thousand compared to $8,824 thousand at December 31, 2020, a decrease of $1,217 thousand.
At December 31, 2021, our current assets were in excess of current liabilities resulting in working capital of $7,293 thousand as compared to $8,302 thousand at December 31, 2020.
Based on our current plans, we have sufficient funds to continue operating our business at current levels for at least 12 months from the date of issuance of this report. In order to continue business operations beyond that point, we currently anticipate that we will need to raise additional capital. Our development and general administrative costs are ongoing, and we expect to require additional funding to meet these expenses. To that end we may undertake offerings of our securities, debt financing, selling or licensing intellectual property, or other alternatives. We filed a Form S-3 shelf registration statement with the Securities and Exchange Commission on June 27, 2019 that was declared effective on July 12, 2019. The registration statement allows us to offer common stock, preferred stock, warrants, subscription rights, debt securities and units from time to time as market conditions permit to fund the ongoing operations of the Company. Until the growth of revenue increases to a level that covers operating expenses it is the Company’s plan to continue to fund operations in this manner, although, as noted above, the significant volatility in the capital markets may negatively affect our ability to do so.
During the year ended December 31, 2021, working capital has been funded with approximately $5,309 thousand in net proceeds from the ATM offering of 1,093 thousand shares of our common stock, offset with operating expenses. Additionally, we received $385 thousand from the exercise of option awards and warrants. Subsequent to the year ended December 31, 2021, the Company raised an additional $602 thousand in net proceeds from the ATM by issuing 496 thousand shares, prior to the close of business on March 29, 2022.
During the year ended December 31, 2020, we raised $6,053 thousand in net proceeds from the sale of our equity securities and received $126 thousand from the exercise of option awards.
Operating activities for the year ended December 30, 2021, resulted in cash outflows of $6,707 thousand, primarily due to the loss for the period of $7,892 thousand, offset with non-cash expenses of $1,206 thousand.
24
Operating activities for the year ended December 31, 2020, resulted in cash outflows of $ 5,964 thousand primarily due to the loss for the period of $6,886 thousand, offset with non-cash expenses of $1,027 thousand.
Investing activities for the year ended December 31, 2021, resulted in cash outflows of $213 thousand in disbursements for fixed and intangible assets, compared to cash outflows of $194 thousand for the year ended December 31, 2020.
Financing activities for the year ended December 31, 2021, include $5,309 thousand in net proceeds from the sale of 1,093 thousand shares of our common stock through our ATM program at an average price of $5.03 per share and $385 thousand from the exercise of option awards and warrants.
Financing activities for the year ended December 31, 2020, include proceeds from a $6,053 thousand private equity offering, $251 thousand from a PPP loan funding and $126 thousand in proceeds from the exercise of stock options.
Off-Balance Sheet Transactions
We do not have any off-balance sheet transactions.
ITEM 7A: QUANTITATIVE AND QUALITATIVE DISCLOSURES ABOUT MARKET RISK
As a smaller reporting company, we are not required to provide this information.
ITEM 8: CONSOLIDATED FINANCIAL STATEMENTS AND SUPPLEMENTARY DATA
25
ClearSign Technologies Corporation
INDEX TO CONSOLIDATED FINANCIAL STATEMENTS
|
| Page |
ANNUAL FINANCIAL INFORMATION |
|
|
|
|
|
Report of Independent Registered Public Accounting Firm (PCAOB ID |
| F-1 |
Report of Independent Registered Public Accounting Firm (PCAOB ID | F-3 | |
| F-4 | |
| F-5 | |
Consolidated Statements of Stockholders’ Equity for the years ended December 31, 2021 and 2020 |
| F-6 |
Consolidated Statements of Cash Flows for the years ended December 31, 2021 and 2020 |
| F-7 |
| F-8 |
REPORT OF INDEPENDENT REGISTERED PUBLIC ACCOUNTING FIRM
To the Board of Directors and Stockholders of
ClearSign Technologies Corporation and Subsidiary
Opinion on the Financial Statements
We have audited the accompanying consolidated balance sheets of ClearSign Technologies Corporation and subsidiary (the "Company") as of December 31, 2021, and the related consolidated statements of operations and comprehensive loss, stockholders’ equity, and cash flows, for the year ended December 31, 2021, and the related notes (collectively referred to as the "consolidated financial statements"). In our opinion, the consolidated financial statements present fairly, in all material respects, the financial position of the Company as of December 31, 2021, and the results of its operations and its cash flows for the year ended December 31, 2021, in conformity with accounting principles generally accepted in the United States of America.
Basis for Opinion
These consolidated financial statements are the responsibility of the Company's management. Our responsibility is to express an opinion on the Company's consolidated financial statements based on our audit. We are a public accounting firm registered with the Public Company Accounting Oversight Board (United States) ("PCAOB") and are required to be independent with respect to the Company in accordance with the U.S. federal securities laws and the applicable rules and regulations of the Securities and Exchange Commission and the PCAOB.
We conducted our audits in accordance with the standards of the PCAOB. Those standards require that we plan and perform the audit to obtain reasonable assurance about whether the consolidated financial statements are free of material misstatement, whether due to error or fraud. The Company is not required to have, nor were we engaged to perform an audit of its internal control over financial reporting. As part of our audits, we are required to obtain an understanding of internal control over financial reporting but not for the purpose of expressing an opinion on the effectiveness of the Company’s internal control over financial reporting. Accordingly, we express no such opinion.
Our audit included performing procedures to assess the risks of material misstatement of the consolidated financial statements, whether due to error or fraud, and performing procedures that respond to those risks. Such procedures included examining, on a test basis, evidence regarding the amounts and disclosures in the consolidated financial statements. Our audit also included evaluating the accounting principles used and significant estimates made by management, as well as evaluating the overall presentation of the consolidated financial statements. We believe that our audit provides a reasonable basis for our opinion.
Critical Audit Matter
The critical audit matter communicated below is a matter arising from the current period audit of the consolidated financial statements that was communicated or required to be communicated to the audit committee and that: (1) relates to accounts or disclosures that are material to the consolidated financial statements and (2) involved our especially challenging, subjective, or complex judgments. The communication of this critical audit matter does not alter in any way our opinion on the consolidated financial statements, taken as a whole, and we are not, by communicating the critical audit matter below, providing a separate opinion on the critical audit matter or on the account or disclosures to which it relates.
Patents and Other Intangible Assets Impairment Assessment
As described in Notes 2 and 4 to the consolidated financial statements, the Company’s patents and other intangible assets balance was $0.8 million as of December 31, 2021, which primarily consists of patents and trademarks. Patent and other intangible assets are tested for impairment whenever events or changes in circumstances indicate that the carrying value of an asset may not be recoverable.
F-1
We identified the carrying value of intangible assets as a critical audit matter. The methods and underlying assumptions in an impairment analysis involve high levels of management estimates and judgment, which in turn led to a high degree of auditor judgment and subjectivity in performing procedures and evaluating audit evidence.
The following are the primary procedures we performed to address this critical audit matter. We reviewed current and previous operating conditions for indications of impairment. We reviewed patent committee and board minutes and news for indications of impairment. We reviewed documents from current and potential future customers for evidence of future recoverability.
/s/
March 31, 2022
We have served as the Company's auditor since 2011.
F-2
To the Board of Directors and Stockholders of
ClearSign Technologies Corporation and Subsidiary
Opinions on the Financial Statements
We have audited the accompanying consolidated balance sheet of ClearSign Technologies Corporation and subsidiary (the "Company") as of December 31, 2020, and the related consolidated statements of operations, equity, and cash flows, for the year ended December 31, 2020, and the related notes (collectively referred to as the "consolidated financial statements"). In our opinion, the consolidated financial statements present fairly, in all material respects, the financial position of the Company as of December 31, 2020, and the results of its operations and its cash flows for year ended December 31, 2020 in conformity with accounting principles generally accepted in the United States of America.
Basis for Opinion
These consolidated financial statements are the responsibility of the Company's management. Our responsibility is to express an opinion on the Company's consolidated financial statements based on our audit. We are a public accounting firm registered with the Public Company Accounting Oversight Board (United States) ("PCAOB") and are required to be independent with respect to the Company in accordance with the U.S. federal securities laws and the applicable rules and regulations of the Securities and Exchange Commission and the PCAOB.
We conducted our audits in accordance with the standards of the PCAOB. Those standards require that we plan and perform the audit to obtain reasonable assurance about whether the consolidated financial statements are free of material misstatement, whether due to error or fraud. The Company is not required to have, nor were we engaged to perform an audit of its internal control over financial reporting. As part of our audits, we are required to obtain an understanding of internal control over financial reporting but not for the purpose of expressing an opinion on the effectiveness of the Company’s internal control over financial reporting. Accordingly, we express no such opinion.
Our audit included performing procedures to assess the risks of material misstatement of the consolidated financial statements, whether due to error or fraud, and performing procedures that respond to those risks. Such procedures included examining, on a test basis, evidence regarding the amounts and disclosures in the consolidated financial statements. Our audit also included evaluating the accounting principles used and significant estimates made by management, as well as evaluating the overall presentation of the consolidated financial statements. We believe that our audit provides a reasonable basis for our opinion.
Liquidity
As more fully described in Note 1 to the consolidated financial statements as of and for the year ended December 31, 2020, the Company has incurred significant operating losses and negative operating cash flows since its inception. The Company’s continued operations are dependent upon its ability to raise additional funds through equity or debt financing and attain profitable operations. Additionally, the outbreak of COVID-19 has caused significant disruptions to the global financial markets which could impact the Company’s operations and its ability to raise additional capital.
/s/
March 31, 2021
F-3
ClearSign Technologies Corporation
Consolidated Balance Sheets
(in thousands, except share and per share data) | December 31, | |||||
| 2021 |
| 2020 | |||
ASSETS | ||||||
Current Assets: |
|
|
|
| ||
Cash and cash equivalents | $ | | $ | | ||
Accounts Receivable, net | | — | ||||
Contract assets |
| |
| | ||
Prepaid expenses and other assets |
| |
| | ||
Total current assets |
| |
| | ||
Fixed assets, net |
| |
| | ||
Patents and other intangible assets, net |
| |
| | ||
Other assets |
| |
| | ||
Total Assets | $ | | $ | | ||
LIABILITIES AND EQUITY |
|
|
|
| ||
Current Liabilities: |
|
|
|
| ||
Accounts payable and accrued liabilities | $ | | $ | | ||
Current portion of lease liabilities |
| |
| | ||
Accrued compensation and related taxes |
| |
| | ||
Contract liabilities | | | ||||
Total current liabilities |
| |
| | ||
Long Term Liabilities: |
|
| ||||
Long term lease liabilities |
| |
| | ||
Payroll protection program loan | — | | ||||
Total liabilities |
| |
| | ||
Commitments and contingencies |
|
| ||||
Stockholders’ Equity: |
|
|
|
| ||
Preferred stock, $ |
|
| ||||
Common stock, $ |
| |
| | ||
Additional paid-in capital |
| |
| | ||
Accumulated other comprehensive income | | — | ||||
Accumulated deficit |
| ( |
| ( | ||
Total ClearSign Technologies Corporation stockholders' equity | | | ||||
Noncontrolling Interest | — | | ||||
Total equity |
| |
| | ||
Total Liabilities and Equity | $ | | $ | | ||
The accompanying notes are an integral part of these consolidated financial statements.
F-4
ClearSign Technologies Corporation
Consolidated Statements of Operations and Comprehensive Loss
(in thousands, except share and per share data) | For the Year Ended | |||||
December 31, | ||||||
| 2021 |
| 2020 | |||
Revenues | $ | | $ | | ||
Cost of goods sold |
| |
| | ||
Gross Loss |
| ( |
| ( | ||
Operating expenses: | ||||||
Research and development, net of grants |
| |
| | ||
General and administrative |
| |
| | ||
Total operating expenses |
| |
| | ||
Loss from operations |
| ( |
| ( | ||
Other income | ||||||
Other income, net | | | ||||
Interest income |
| |
| | ||
Net loss | ( | ( | ||||
Net loss attributed to non-controlling interest |
| |
| | ||
Net loss attributed to ClearSign Technologies Corporation common stockholders | $ | ( | $ | ( | ||
Net loss per share - basic and fully diluted | $ | ( | $ | ( | ||
Weighted average number of shares outstanding - basic and fully diluted |
| |
| | ||
Comprehensive loss | ||||||
Net loss | $ | ( | $ | ( | ||
Change in foreign currency translation | | — | ||||
Comprehensive loss | $ | ( | $ | ( | ||
The accompanying notes are an integral part of these condensed consolidated financial statements.
F-5
ClearSign Technologies Corporation
Condensed Consolidated Statements of Stockholders’ Equity
For the Years Ended December 31,2021 and 2020
Total ClearSign | |||||||||||||||||||||||
Other | Technologies Corp. | ||||||||||||||||||||||
(in thousands) | Common Stock | Additional | Comprehensive | Accumulated | Stockholders’ | Noncontrolling | |||||||||||||||||
| Shares |
| Amount |
| Paid-In Capital |
| Income |
| Deficit |
| Equity |
| Interest |
| Total Equity | ||||||||
Balances at December 31, 2020 |
| | $ | | $ | | $ | — | $ | ( | $ | | $ | | $ | | |||||||
Shares issued through use of At The Market issuance ($ | | — | | — | | | | | |||||||||||||||
Exercised Options ($ | | — | | — | | | | | |||||||||||||||
Exercised Options ($ | | — | | — | | | | | |||||||||||||||
Exercised Options ($ | | — | — | — | | | | | |||||||||||||||
Exercised Options ($ | | — | | — | | | | | |||||||||||||||
Exercised Options ($ | | — | | — | | | | | |||||||||||||||
Exercised Options ($ | | — | | — | | | | | |||||||||||||||
Exercised Options ($ | | — | — | — | | | | | |||||||||||||||
Exercised Options ($ | | — | | — | | | | | |||||||||||||||
Exercised Warrants ($ | | — | | — | | | | | |||||||||||||||
Shares issued for services ($ | | — | | — | | | | | |||||||||||||||
Shares issued for services ($ |
| |
| — |
| | — |
| | | |
| | ||||||||||
Fair value of stock options issued in payment of accrued compensation |
| |
| — |
| | — |
| | | |
| | ||||||||||
Fair value of stock options issued for board service |
| — |
| — |
| | — |
| | | | | |||||||||||
Share based compensation |
| — |
| — |
| | — |
| | | |
| | ||||||||||
Foreign-Exchange Translation Adjustment | — | — | — | | | | | | |||||||||||||||
Net loss |
| — |
| — |
| — | — |
| ( | ( | ( |
| ( | ||||||||||
Balances at December 31, 2021 |
| | $ | | $ | | $ | | $ | ( | $ | | $ | | $ | | |||||||
Total ClearSign | |||||||||||||||||||||||
Other | Technologies Corp. | ||||||||||||||||||||||
Common Stock | Additional | Comprehensive | Accumulated | Stockholders’ | Noncontrolling | ||||||||||||||||||
| Shares |
| Amount |
| Paid-In Capital |
| Income |
| Deficit |
| Equity |
| Interest |
| Total Equity | ||||||||
Balances at December 31, 2019 |
| | $ | | $ | | $ | — | $ | ( | $ | | $ | | $ | | |||||||
— | — | — | — | ||||||||||||||||||||
Secondary Offering ($ | | — | | — | — | | — | | |||||||||||||||
Shares issued for services ($ | | — | | — | — | | — | | |||||||||||||||
Shares issued for services ($ | |
| — |
| | — |
| — | | — |
| | |||||||||||
Exercised Options ($ | | — | | — | — | | — | | |||||||||||||||
Exercised Options ($ | | — | | — | — | | — | | |||||||||||||||
Exercised Options ($ | | — | | — | — | | — | | |||||||||||||||
Exercised Options ($ | | — | | — | — | | — | | |||||||||||||||
Fair value of stock options issued in payment of accrued compensation |
| — |
| — |
| | — |
| — | | — |
| | ||||||||||
Share based compensation |
| — |
| — |
| | — |
| — | | — |
| | ||||||||||
Fair value of stock options issued for board service |
| — |
| — |
| | — |
| — | | — | | |||||||||||
Net loss |
| — |
| — |
| — | — |
| ( | ( | ( |
| ( | ||||||||||
Balances at December 31, 2020 | | $ | | $ | | $ | — | $ | ( | $ | | $ | | $ | | ||||||||
The accompanying notes are an integral part of these condensed consolidated financial statements.
F-6
ClearSign Technologies Corporation
Condensed Consolidated Statements of Cash Flows
(in thousands) | For the Years Ended December 31, | |||||
| 2021 |
| 2020 | |||
Cash flows from operating activities: | ||||||
Net loss | $ | ( | $ | ( | ||
Adjustments to reconcile net loss to net cash used in operating activities: |
|
|
|
| ||
Common stock issued for services |
| |
| | ||
Share-based compensation |
| |
| | ||
Depreciation and amortization |
| |
| | ||
Abandonment and impairment |
| |
| — | ||
Gain on forgiveness of Payroll Protection Program Loan and interest | ( | — | ||||
Change in operating assets and liabilities: |
|
|
|
| ||
Contract assets |
| |
| ( | ||
Accounts receivable |
| ( |
| — | ||
Prepaid expenses and other assets |
| |
| ( | ||
Accounts payable and accrued liabilities |
| ( |
| ( | ||
Accrued compensation and related taxes |
| |
| | ||
Contract liabilities | ( | | ||||
Net cash used in operating activities |
| ( |
| ( | ||
Cash flows from investing activities: |
|
|
|
| ||
Acquisition of fixed assets |
| ( |
| ( | ||
Disbursements for patents and other intangible assets |
| ( |
| ( | ||
Net cash used in investing activities |
| ( |
| ( | ||
Cash flows from financing activities: |
|
|
|
| ||
Proceeds from issuance of common stock, net of offering costs |
| |
| | ||
Proceeds from exercise of stock options | | | ||||
Proceeds from Payroll Protection Program loan | — | | ||||
Net cash provided by financing activities |
| |
| | ||
Effect of exchange rate changes on cash and cash equivalents | — | |||||
Cash and cash equivalents: | ||||||
Net increase (decrease) cash and cash equivalents |
| ( |
| | ||
Cash and cash equivalents, beginning of year |
| |
| | ||
Cash and cash equivalents, end of year | $ | | $ | | ||
Supplemental disclosure of cash flow information: | ||||||
Officer and employee stock awards for prior year accrued compensation | $ | $ | ||||
The accompanying notes are an integral part of these condensed consolidated financial statements.
F-7
ClearSign Technologies Corporation
Notes to Consolidated Financial Statements
Note 1 – Organization and Description of Business
ClearSign Technologies Corporation (“ClearSign” or the “Company”) designs and develops products and technologies that have been shown to significantly improve key performance characteristics of industrial and commercial systems, including operational performance, energy efficiency, emission reduction, safety, and overall cost-effectiveness. Our patented technologies are designed to be embedded in established OEM products as ClearSign Core™ and ClearSign Eye™ and other sensing configurations in order to enhance the performance of combustion systems and fuel safety systems in a broad range of markets. These markets include, the energy (upstream oil production and down-stream refining), commercial/industrial boiler, chemical, petrochemical, transport and power industries. The Company’s primary technology is its ClearSign Core technology, which achieves very low emissions without the need of external flue gas recirculation, selective catalytic reduction, or higher excess air operation. The Company is headquartered in Seattle, Washington and was incorporated in the State of Washington in 2008. On July 28, 2017, the Company incorporated a subsidiary, ClearSign Asia Limited, in Hong Kong to represent the Company’s business and technological interests throughout Asia. Through ClearSign Asia Limited, the Company has established a Wholly Foreign Owned Enterprise (WFOE) in China – ClearSign Combustion (Beijing) Environmental Technologies Co., LTD.
Unless otherwise stated or the context otherwise requires, the terms ClearSign and the Company refer to ClearSign Technologies Corporation and its subsidiary, ClearSign Asia Limited.
Liquidity
The Company's financial statements have been presented on the basis that it is a going concern, which contemplates the realization of assets and satisfaction of liabilities in the normal course of business. The Company’s technologies are currently in field development, but with nominal fully operational commercial installations, and have generated nominal revenues from operations to date to meet operating expenses. In order to generate meaningful revenues, the technologies must be fully developed, gain market recognition and acceptance, and develop a critical level of successful sales and product installations.
The Company has historically financed its operations primarily through issuances of equity securities including $
During the year ended December 31, 2020, the Company completed stock offerings on August 24 and September 30, 2020, where it received $
The Company has incurred losses since its inception totaling $
Note 2 – Summary of Significant Accounting Policies
Basis of Presentation
The accompanying consolidated financial statements include the accounts of ClearSign and its subsidiary. Intercompany balances and transactions have been eliminated in consolidation. In the opinion of management, these consolidated financial statements reflect all normal recurring and other adjustments necessary for a fair presentation.
F-8
Use of Estimates
The preparation of consolidated financial statements in conformity with accounting principles generally accepted in the United States of America requires management to make certain estimates and assumptions that affect the reported amounts of assets and liabilities and the disclosure of contingent assets and liabilities at the date of the financial statements and the reported amounts of revenues and expenses during the reporting period. Actual results could differ from those estimates.
Revenue Recognition and Cost of Sales
The Company recognizes revenue and related cost of goods sold in accordance with Financial Accounting Standards Board (FASB) Accounting Standards Codification 606 Revenue from Contracts with Customers (ASC 606). When applying ASC 606, the Company performs the following five steps: (i) identify the contract(s) with a customer; (ii) identify the promises and performance obligations in the contract; (iii) determine the transaction price; (iv) allocate the transaction price to the performance obligations in the contract; and (v) recognize revenue when (or as) the performance obligations are satisfied. Revenues and cost of goods sold are recognized once the goods or services are delivered to the customer’s control or non-refundable performance obligations are satisfied. The Company’s contracts with customers generally have performance obligations and a schedule of non-refundable cancellation obligations. The contracts generally will be fully performed upon delivery of certain drawings or equipment. Revenue related to the contracts is recognized following the completion of non-refundable performance obligations as defined in the contract.
The Company’s contracts generally include progress payments from the customer upon completion of defined milestones. As these payments are received, they are offset against accumulated project costs and recorded as either contract assets or contract liabilities. Upon completion of the performance obligations and collectability is determined, revenue is recorded. For any contract that is expected to incur costs in excess of the contract price, the Company accrues the estimated loss in full in the period such determination is made.
Contract Acquisition Costs and Practical Expedients
For contracts that have a duration of less than
Product Warranties
The Company warrants all installed products against defects in materials and workmanship for a period specified in each contract by replacing failed parts. Accruals for product warranties are based on historical or expected warranty experience and current product performance trends and are recorded as a component of cost of sales at the time revenue is recognized. The warranty liabilities are reduced by material and labor costs used to replace parts over the warranty period in the periods in which the costs are incurred. The Company periodically assesses the adequacy of its recorded warranty liabilities and adjusts the amounts as necessary, and such adjustments could be material in the future if estimates differ significantly from actual warranty expense. The warranty liabilities are included in accrued liabilities in the balance sheets.
Cash and Cash Equivalents
Cash and cash equivalents consist of cash on deposit and high-quality, short-term money market instruments with an original maturity of three months or less. Cash equivalents, which consist of short-term US treasury bills, are based on quoted market prices, a Level 1 fair value measure.
Accounts Receivable and Allowance for Doubtful Accounts
Accounts receivables are recorded at the contractual invoiced amount. An allowance for doubtful accounts is established, as necessary, based on past experience and management’s judgment. The determination of the collectability of amounts due from customers require the Company to make judgments regarding future events and trends. Allowances for doubtful accounts are determined based on assessing the Company’s portfolio on an individual customer and on an overall basis. This process consists of a review of historical collection experience, current aging status of the customer accounts, and the financial condition of the Company’s customers. Based
F-9
on a review of these factors, the Company may establish or adjust the allowance for specific customers and the accounts receivable portfolio as a whole.
Fixed Assets and Leases
Fixed assets are recorded at cost. Leases are recorded in accordance with FASB ASC 842, Leases. For those leases with a term greater than one year, the Company recognizes a right-of-use asset and a lease liability measured at the present value of the lease payments at the time of the lease inception or modification. Lease costs are recognized in the income statement over the lease term on a straight-line basis. Leases with a term of 1 year or less are considered short term leases with rent expense recognized over the lease term. Depreciation is computed using the straight-line method over the estimated useful lives of the respective lease assets. Leasehold improvements are depreciated over the life of the lease or their useful life, whichever is shorter. All other fixed assets are depreciated over to
Patents and Trademarks
Third-party expenses related to patents and trademarks are recorded at cost, less accumulated amortization. Amortization is computed using the straight-line method over the estimated useful lives of the assets once they are awarded. Patent application costs are deferred pending the outcome of patent and trademark applications. Costs associated with unsuccessful patent applications and abandoned intellectual property are expensed when determined to have no continuing value in current business activity. We evaluate the recoverability of the carrying values of intangible assets on a recurring basis.
Impairment of Long-Lived Assets
The Company tests long-lived assets, consisting of fixed assets, patents, and other intangible assets, for impairment whenever events or changes in circumstances indicate that the carrying amount of an asset may not be recoverable through the estimated undiscounted cash flows expected from the use and eventual disposition of the assets. In the event an asset is not fully recoverable a loss is recognized based on the amount by which the carrying amount exceeds the fair value of the long-lived assets. Fair value is determined based on the present value of estimated expected cash flows using a discount rate commensurate with the risks involved, quoted market prices, or appraised values depending upon the nature of the assets. Losses on long-lived assets to be disposed of is determined in a similar manner, except those fair values are reduced for the cost of disposal.
Fair Value of Financial Instruments
Fair value is the price that would be received to sell an asset or paid to transfer a liability in an orderly transaction between market participants at the measurement date. Assets and liabilities measured at fair value are categorized based on whether or not the inputs are observable in the market and the degree that the inputs are observable. The categorization of financial assets and liabilities within the valuation hierarchy is based upon the lowest level of input that is significant to the fair value measurement. The three levels of inputs used to establish fair value are the following:
| ● | Level 1 – Quoted prices in active markets for identical assets or liabilities. |
| ● | Level 2 – Inputs other than Level 1 that are observable, either directly or indirectly, such as quoted prices for similar assets or liabilities, quoted prices in markets that are not active, or other inputs that are observable or can be corroborated by observable market data for substantially the full term of the assets or liabilities; and |
| ● | Level 3 – Unobservable inputs that are supported by little or no market activity and that are significant to the fair value of the assets or liabilities. |
The Company’s financial instruments primarily consist of cash equivalents, accounts receivable, accounts payable, accrued expenses and note payable. As of the balance sheet dates, the estimated fair values of the financial instruments were not materially different from their carrying values as presented on the balance sheets. This is primarily attributable to the short-term maturities of these instruments.
The Company did not identify any other non-recurring assets and liabilities that are required to be presented in the balance sheets at fair value.
F-10
Research and Development
The cost of research and development is expensed as incurred. Research and development costs consist of salaries, benefits, share based compensation, consumables, and consulting fees, including costs to develop and test prototype equipment and parts. Research and development costs have been offset by funds received from strategic partners in cost sharing, collaborative projects. During the year ended December 31, 2021, the Company received $
Income Taxes
The Company accounts for income taxes using an asset and liability approach which allows for the recognition and measurement of deferred tax assets based upon the likelihood of realization of tax benefits in future years. Under the asset and liability approach, deferred taxes are provided for the net tax effects of temporary differences between the carrying amounts of assets and liabilities for financial reporting purposes and the amounts used for income tax purposes. A valuation allowance is provided for deferred tax assets if it is more likely than not the Company would not be able to realize their benefits, or that future deductibility is uncertain. Tax benefits are recognized only if it is more likely than not that the tax benefits will be utilized in the foreseeable future.
Stock-Based Compensation
The costs of all employee stock options, as well as other equity-based compensation arrangements, are reflected in the consolidated financial statements based on the estimated fair value of the awards on the grant date. That cost is recognized over the period during which an employee is required to provide service in exchange for the award, or in the case of performance options, expense is recognized upon completion of a milestone as defined in the grant agreement. Stock-based compensation for stock grants to non-employees is determined as the fair value of the consideration received or the fair value of equity instruments issued, whichever is more reliably measured.
Foreign Operations
The accompanying consolidated financial statements as of December 31, 2021 and 2020 include assets amounting to approximately $
Foreign Currency
The functional currency of ClearSign Asia Limited is the U.S. dollar. The Company remeasures the transactions denominated in Chinese Yuan at the average exchange rate in effect during the period. At the end of each reporting period, the Company remeasures ClearSign Asia Limited’s monetary assets and liabilities to the U.S. dollar using exchange rates in effect at the end of the reporting period. The Company remeasures its non-monetary assets and liabilities at historical exchange rates. The Company records gains and losses related to remeasurement in other income, net in the consolidated statements of operations. Foreign currency exchange gain (loss) has not been significant in any period presented and the Company has not undertaken any hedging transactions related to foreign currency exposure.
Noncontrolling Interest
The subsidiary of the Company has a minority shareholder representing an ownership interest of
F-11
Net Loss per Common Share
Basic loss per share is computed by dividing loss available to common stockholders by the weighted-average number of common shares outstanding. Diluted loss per share is computed similar to basic loss per share except that the denominator is increased to include additional common shares available upon exercise of stock options and warrants using the treasury stock method, except for periods for which no common share equivalents are included because their effect would be anti-dilutive. At December 31, 2021 and 2020, potentially dilutive shares outstanding amounted to
Recently Issued Accounting Pronouncements
In June 2017, the FASB issued ASU 2016-13, Financial Instruments (Topic 326) Measurement of Credit Losses on Financial Instruments, which requires the measurement and recognition of expected credit losses for financial assets held at amortized cost. The standard replaces the existing incurred loss impairment model with an expected loss methodology, which will result in more timely recognition of credit losses. ASU 2016-13, and related amendments, are effective for fiscal years beginning after December 15, 2022. The Company has not completed its assessment of the standard but does not expect the adoption to have a material impact on its financial statements.
In November 2021, the FASB issued ASU 2021-10, Government Assistance (Topic 832): Disclosures by Business Entities about Government Assistance, which outlines disclosure requirements for entities that receive assistance from a government body. ASU 2021-10, and related amendments, are affective for annual reports beginning after December 15, 2021. The Company does not expect the adoption to have a material impact on its financial statements.
Note 3 – Fixed Assets and Operating Leases
Fixed Assets
December 31, | ||||||
(in thousands) |
| 2021 |
| 2020 | ||
Machinery and equipment | $ | | $ | | ||
Office furniture and equipment |
| |
| | ||
Leasehold improvements |
| |
| | ||
| | |||||
Less: Accumulated depreciation and amortization |
| ( |
| ( | ||
Construction in progress | — | | ||||
| | |||||
Operating lease ROU assets | | | ||||
Total | $ | | $ | | ||
Depreciation expense for the years ended December 31, 2021 and 2020 totaled $
Operating Leases
The Company leases office space in Seattle Washington, Tulsa Oklahoma and Beijing China. The Beijing lease is treated as a short-term lease. The monthly rent for the Beijing lease is approximately $
The Seattle and Tulsa leases are classified as operating leases, with remaining terms ranging from to
The Seattle and Tulsa leases contain fixed annual lease payments that increase annually, which is customary for long-term lease agreements. Lease payments increase annually by factors that range between
F-12
Supplemental balance sheet information related to operating leases is as follows:
December 31, | |||||||
(in thousands) | 2021 | 2020 | |||||
$ | | $ | | ||||
Lease Liabilities: | |||||||
Current lease liabilities | $ | | $ | | |||
Long term lease liabilities | | | |||||
Total lease liabilities | $ | | $ | | |||
Operating lease costs | $ | | $ | | |||
Weighted average remaining lease term (in years): | |||||||
Weighted average discount rate: | % | ||||||
Supplemental cash flow information related to leases is as follows: | |||||||
For the Year Ended | |||||||
2021 | 2020 | ||||||
Cash paid for amounts included in the measurement of lease liabilities: | |||||||
Operating cash flows from operating leases | $ | | $ | | |||
Non-cash impact of new leases and lease modifications | |||||||
New operating lease liabilities | | — | |||||
Impairment of ROU assets | | — | |||||
Minimum future payments under the Company’s lease liabilities at December 31, 2021 are as follows:
| Discounted |
| Payments | |||
lease | due under | |||||
(in thousands) | liability | lease | ||||
payments | agreements | |||||
2022 |
| $ | |
| $ | |
2023 |
| |
| | ||
2024 | | | ||||
2025 | | | ||||
2026 | | | ||||
Thereafter | | | ||||
Total | $ | | $ | | ||
At December 31, 2021, $
F-13
Note 4 – Patents and Other Intangible Assets
Patents and other intangible assets are summarized as follows:
December 31, | ||||||
(in thousands) |
| 2021 |
| 2020 | ||
Patents | ||||||
Patents pending | $ | | $ | | ||
Issued patents |
| |
| | ||
| |
| | |||
Trademarks |
|
| ||||
Trademarks pending |
| |
| | ||
Registered trademarks |
| |
| | ||
| |
| | |||
Other |
| |
| | ||
| |
| | |||
Accumulated amortization |
| ( |
| ( | ||
$ | | $ | | |||
Future amortization expense associated with awarded patents and registered trademarks as of December 31, 2021 is as follows:
(in thousands) | |||
2022 |
| $ | |
2023 |
| | |
2024 |
| | |
2025 |
| | |
2026 |
| | |
Thereafter |
| | |
$ | |
The amortization life for patents ranges between to
During the year ended December 31, 2021, and 2020, the Company assessed its patent and trademark assets. The Company also evaluated its strategic approach to the pursuit and protection of its intellectual property. It is the intent of the Company to continue to define the scope of pursuing intellectual property protection to be more aligned with core technology critical to the design of product offerings.
The Company identified certain assets where the intellectual property was not directly related to the core technology within current products or was loosely affiliated with the core technology. Based on the results of the assessment, the Company impaired $
Note 5 – Revenue, Contract Assets and Contract Liabilities
The Company recognized $
F-14
During the years ended December 31, 2021 and 2020, the Company recognized cost of goods sold of $
Cost of sales during the year ended December 31, 2021 consisted of $
During the year ended December 31, 2020, the Company recognized cost of goods sold of $
In September of 2021, the Company received verbal notification from ExxonMobil to put on hold the testing of its ClearSign CoreTM process burners to be installed at the Baytown, Texas refinery because there was insufficient time for ExxonMobil to engineer their inclusion during the targeted 2022 refinery turnaround.
The Company had contract assets of $
Note 6 – Product Warranties
A summary of the Company’s warranty liability activity, which is included in accrued liabilities in the accompanying balance sheets as of December 31, 2021 and 2020, is as follows:
December 31, | ||||||
(in thousands) |
| 2021 |
| 2020 | ||
Warranty liability, beginning of year | $ | | $ | | ||
Accruals |
| — |
| | ||
Payments |
| ( |
| — | ||
Adjustments and other |
| ( |
| ( | ||
Warranty liability, end of year | $ | — | $ | | ||
Note 7 - Income Taxes
The Company is subject to taxation in the United States of America (“U.S.”) and files tax returns in the U.S. federal jurisdiction and several state jurisdictions.
Through December 31, 2021, the Company incurred net operating losses for federal tax purposes of approximately $
A reconciliation of the expected tax computed at the statutory federal income tax rate to the provision for income taxes is as follows:
| 2021 |
| 2020 | |||
Expected tax benefit at | $ | ( | $ | ( | ||
Change in valuation allowance |
| |
| | ||
Other |
| |
| | ||
Provision for income taxes | $ | | $ | | ||
F-15
Due primarily to the net operating loss carryforwards, the Company has a net deferred tax asset at December 31, 2021 of $
Significant components of the deferred tax assets (liabilities), are approximately as follows:
| 2021 |
| 2020 | |||
Net operating loss carry forwards | $ | | $ | | ||
Accrued liabilities |
| |
| | ||
Stock compensation |
| |
| | ||
Depreciation |
| |
| ( | ||
Prepaid expenses |
| |
| | ||
Other |
| ( |
| ( | ||
Deferred tax assets, net |
| |
| | ||
Valuation allowance |
| ( |
| ( | ||
Net deferred tax asset | $ | | $ | | ||
Although the Company is not under examination, all tax years for which the Company incurred a net operating loss are subject to examination by United States tax authorities to the extent of the loss carried forward.
The Company’s practice is to recognize interest and penalties related to income tax matters in income tax expense. As of December 31, 2021, and 2020, there were
Note 8 – Equity
Common Stock and Preferred Stock
The Company is authorized to issue
In July 2018, the Company completed a private equity offering and executed a Stock Purchase Agreement with clirSPV, LLC which permits participation in future capital raising transactions (Participation Right) on the same terms as other investors participating in such transactions. The Participation Right will expire on December 31, 2023. In no event may the Participation Right be exercised to the extent it would cause clirSPV, LLC or any of its affiliates to beneficially own
In August 2020, the Company completed an offering of common stock whereby approximately
In September 2020, the Company completed a sale of common stock to clirSPV, LLC under the 2018 Stock Purchase Agreement described above (Participation Right) whereby approximately
During the year ended December 31, 2021, the Company issued common stock pursuant to an At-The-Market Offering Sales Agreement, dated December 23, 2020, with Virtu Americas LLC, as sales agent pursuant to which it may sell shares of common stock with an aggregate offering price of up to $
F-16
Issuance of Shares of Subsidiary to Noncontrolling Interest
In December 2019, the Company issued shares of its subsidiary representing a
Equity Incentive Plans
On June 17, 2021, (the Effective Date) the Company's shareholders approved and the Company adopted the ClearSign Technologies Corporation 2021 Equity Incentive Plan (2021 Plan) which permits the Company to grant Incentive Stock Options, Non-statutory Stock Options, Stock Appreciation Rights, Restricted Stock, Restricted Stock Units, Performance Units, and Performance Shares, to eligible participants, which includes employees, directors and consultants. The Compensation Committee of the Board of Directors is authorized to administer the 2021 Plan.
The 2021 Plan provides for an annual increase in available shares equal to the lessor of (i)
Ending balances of the Plans are as follows:
December 31, | ||||
(in thousands) |
| 2021 |
| 2020 |
Outstanding options and restricted stock units |
| |
| |
Reserved but unissued shares under the Plans | | | ||
Total authorized shares under the Plans |
| |
| |
Stock Options
Under the terms of the 2021 Plan, incentive stock options and nonstatutory stock options must have an exercise price at or above the fair market value on the date of the grant. At the time of grant, the Company will determine the period within which the option may be exercised and will specify any conditions that must be satisfied before the option vests and may be exercised. The Company estimates the fair value of stock options on the date of grant using the Black-Scholes option-pricing model.
As permitted by SAB 107, management utilized the simplified approach to estimate the expected term of the options, which represents the period of time that options granted are expected to be outstanding. Expected volatility has been determined through the Company’s historical stock price volatility. The Company has not made an estimate of forfeitures at the time of the grant, but rather accounts for forfeitures at the time they occur. The risk-free rate for periods within the expected life of the option is based on the U.S. Treasury yield in effect at the time of grant. The Company has never declared or paid dividends and has no plans to do so in the foreseeable future.
F-17
The following weighted-average assumptions were utilized in the calculation of the fair value of stock options:
December 31, | |||||
2021 | 2020 | ||||
Expected life |
|
| |||
Weighted average volatility | | % | | % | |
Weighted average risk-free interest rate | | % | | % | |
Expected dividend rate | | % | | % | |
A summary of the Company’s stock option activity and changes is as follows:
December 31, | ||||||||||||||
2021 | 2020 | |||||||||||||
Weighted | Weighted | |||||||||||||
Average | Average | |||||||||||||
Options to | Weighted | Remaining | Options to | Weighted | Remaining | |||||||||
Purchase | Average | Contractual | Purchase | Average | Contractual | |||||||||
Common | Exercise | Life (in | Common | Exercise | Life (in | |||||||||
(in thousands) |
| Stock |
| Price |
| years) |
| Stock |
| Price |
| years) | ||
Outstanding at January 1 |
| | $ | |
|
| | $ | |
| ||||
Granted |
| | $ | |
|
| | $ | |
| ||||
Exercised |
| ( | $ | |
| — |
| ( | $ | |
| — | ||
Forfeited/Expired/Exchanged |
| ( | $ | |
| — |
| ( | $ | |
| — | ||
Outstanding at December 31 |
| | $ | |
|
| | $ | |
| ||||
Exercisable at December 31 |
| | $ | |
|
| | $ | |
| ||||
The estimated aggregate pretax intrinsic value of the Company’s outstanding vested stock options at December 31, 2021 is $
At December 31, 2021, there was $
Restricted Stock Units
On July 28, 2021, the Company approved compensation for board service to be paid to its independent directors in restricted stock units (“RSUs”) under the 2021 Plan. Such compensation was earned on a quarterly basis commencing with services performed in the second quarter of 2021 and continuing through the end of 2021. The target value of compensation was approved at $
The vesting criteria of the RSU grants are contingent upon the occurrence of one of four future events which the Company cannot predict or control. Accordingly, stock based compensation has not been recognized for services performed during the year ended December 31, 2021 in accordance with FASB Accounting Standards Codification, Topic 718, Compensation-Stock Compensation (ASC 718). During the year ended December 31, 2021, the Company issued
Consultant Stock Plan
The 2013 Consultant Stock Plan (the Consultant Plan) provides for the granting of shares of common stock to consultants who provide services related to capital raising, investor relations, and making a market in or promoting the Company’s securities. The Company’s officers, employees, and board members are not entitled to receive grants from the Consultant Plan. The Compensation Committee of the Board of Directors is authorized to administer the Consultant Plan and establish the grant terms. The Consultant Plan provides for
F-18
quarterly increases in the available number of authorized shares equal to the lesser of
The Company granted
The Company granted
The Company granted
The Consultant Plan expense, reflected as general and administrative expense, for the years ended December 31, 2021 and 2020 was $
December 31, | ||||
(in thousands) |
| 2021 |
| 2020 |
Reserved but unissued shares January 1 | | | ||
Increases in the number of authorized shares | | | ||
Grants | ( | ( | ||
Reserved but unissued shares December 31 | | | ||
Inducement Stock Options
Pursuant to the rules of The Nasdaq Stock Market, and in compliance with those rules, the Company may issue equity awards, including stock options, as an inducement to an individual to accept employment with the Company. Inducement awards need not be approved by the Company's shareholders. During the year ended December 31, 2019, the Company granted
Warrants
A summary of warrant activity and related information is as follows:
December 31, | ||||||||||
2021 | 2020 | |||||||||
|
| Weighted |
|
| Weighted | |||||
Average | Average | |||||||||
Exercise | Exercise | |||||||||
(in thousands) | Warrants | Price | Warrants | Price | ||||||
Outstanding at January 1 |
| | $ | |
| | $ | | ||
Granted |
| — |
| — |
| — | — | |||
Exercised |
| ( |
| |
| |
| — | ||
Forfeited/Expired |
| ( | |
| — | — | ||||
Outstanding at December 31 |
| — | $ | — |
| | $ | | ||
There were
F-19
Note 9 – Retirement Plan
The Company has a defined contribution retirement plan covering all of its employees whereby the Company matches employee contributions up to
Note 10 – The Paycheck Protection Program (PPP) Loan
On May 8, 2020, the Company obtained a loan in the amount of $
Note 11 – Commitments and Contingencies
Litigation
From time to time the Company may become involved in various lawsuits and legal proceedings which arise in the ordinary course of business. Litigation is subject to inherent uncertainties and an adverse result in any such matter may harm the Company’s business. As of the date of this report, the Company is not a party to any material pending legal proceedings or claims that the Company believes will have a material adverse effect on the business, financial condition or operating results.
Investigation
On July 10, 2020, the Company received a letter from the Financial Industry Regulatory Authority (“FINRA”) notifying the Company that FINRA was investigating trading in the Company’s securities surrounding the June 15, 2020 announcement that the Company had received a purchase order from ExxonMobil. On April 1, 2021 the Company received a letter from FINRA stating that it had concluded its investigation without any findings.
Indemnification Agreements
The Company maintains indemnification agreements with our directors and officers that may require the Company to indemnify these individuals against liabilities that arise by reason of their status or service as directors or officers, except as prohibited by law.
F-20
Note 12 – Quarterly Results (unaudited)
Quarterly results for the years ended December 31, 2021 and 2020 are as follows:
(in thousands, except per share data) | First | Second | Third | Fourth | ||||||||
For the year ended December 31, 2021 |
| Quarter |
| Quarter |
| Quarter |
| Quarter | ||||
Revenue | $ | | $ | — | $ | | $ | | ||||
Gross Profit (Loss) | $ | | $ | ( | $ | ( | $ | | ||||
Operating Expense | $ | | $ | | $ | | $ | | ||||
Net loss attributed to common stockholders | $ | ( | $ | ( | $ | ( | $ | ( | ||||
Net Loss per share - basic and fully diluted | $ | ( | $ | ( | $ | ( | $ | ( | ||||
For the year ended December 31, 2020 | ||||||||||||
Revenue | $ | | $ | | $ | | $ | | ||||
Gross Profit (Loss) | $ | — | $ | | $ | ( | $ | ( | ||||
Operating Expense | $ | | $ | | $ | | $ | | ||||
Net loss attributed to common stockholders | $ | ( | $ | ( | $ | ( | $ | ( | ||||
Net Loss per share - basic and fully diluted | $ | ( | $ | ( | $ | ( | $ | ( | ||||
Note 13 – Subsequent Events
The Company evaluates subsequent events and transactions that occur after the balance sheet date up to date that the financial statements are issued. Subsequent to the year ended December 31, 2021, the Company raised an additional $
Other than events described in these consolidated financial statements, the Company did not identify any other subsequent events that would have required adjustment or disclosure to the financial statements.
F-21
ITEM 9: CHANGES IN AND DISAGREEMENTS WITH ACCOUNTANTS ON ACCOUNTING AND FINANCIAL DISCLOSURE
None.
ITEM 9A: CONTROLS AND PROCEDURES
Evaluation of Disclosure Controls and Procedures
We maintain disclosure controls and procedures (as defined in Rules 13a-15(e) and 15d-15(e) under the Exchange Act that are designed to reasonably ensure that information required to be disclosed in our reports filed under the Exchange Act, is recorded, processed, summarized and reported within the time periods specified in the Securities and Exchange Commission’s rules and forms, and that such information is accumulated and communicated to our management, including our principal executive officer and principal accounting and financial officer, as appropriate, to allow timely decisions regarding required disclosure.
We carried out an evaluation under the supervision and with the participation of management, including our Chief Executive Officer (principal executive officer) and our Vice President and Controller (principal accounting and financial officer), of the effectiveness of the design and operation of our disclosure controls and procedures as of December 31, 2021, the end of the period covered by this Annual Report on Form 10-K. Based upon the evaluation of our disclosure controls and procedures as of December 31, 2021, our Chief Executive Officer (principal executive officer) and our Vice President and Controller (principal accounting and financial officer) concluded that, as of such date, our disclosure controls and procedures were effective at the reasonable assurance level.
Management’s Report on Internal Control over Financial Reporting
Our Chief Executive Officer (principal executive officer) and our Vice President and Controller (principal accounting and financial officer) are responsible for establishing and maintaining internal control over financial reporting. Internal control over financial reporting is defined in Rule 13a-15(f) and 15d-15(f) promulgated under the Act as a process designed by, or under the supervision of, our principal executive and principal financial officers and effected by our board of directors, management and other personnel, to provide reasonable assurance regarding the reliability of financial reporting and the preparation of financial statements for external purposes in accordance with generally accepted accounting principles and includes those policies and procedures that:
· | pertain to the maintenance of records that in reasonable detail accurately and fairly reflect the transactions and dispositions of our assets; |
· | provide reasonable assurance that transactions are recorded as necessary to permit preparation of financial statements in accordance with generally accepted accounting principles, and that our receipts and expenditures are being made only in accordance with authorizations of management and our directors; and |
· | provide reasonable assurance regarding prevention or timely detection of unauthorized acquisition, use or disposition of our assets that could have a material effect on the financial statements. |
Because of its inherent limitations, our internal control over financial reporting may not prevent or detect misstatements. Therefore, even those systems determined to be effective can provide only reasonable assurance with respect to financial statement preparation and presentation. Projections of any evaluation of effectiveness to future periods are subject to the risk that controls may become inadequate because of changes in conditions, or that the degree of compliance with the policies or procedures may deteriorate.
Our management assessed the effectiveness of our internal control over financial reporting as of December 31, 2021. In making this assessment, management used the criteria set forth by the Committee of Sponsoring Organizations of the Treadway Commission (COSO) in Internal Control – Integrated Framework (2013 Framework). Based on this assessment, our management, with the participation of our Chief Executive Officer (principal executive officer) and our Vice President and Controller (principal accounting and financial officer), has concluded that, as of December 31, 2021, our internal control over financial reporting was effective based on those criteria.
26
Changes in Internal Control over Financial Reporting
During the fourth quarter of 2021, we implemented balance sheet reconciliation control procedures which address a previously identified material weakness related to our ability to record transactions in the accounting records and preparation of financial statements that are in compliance with accounting principles generally accepted in the United States of America, which resulted in numerous adjustments that were recorded after the close of the Company’s books of record and preparation of the financial statements for the purposes of the Company’s Quarterly Report for the period ended June 30, 2021. During the fourth quarter of fiscal year 2021, we successfully completed the testing necessary to conclude that the material weakness has been remediated.
Except as noted above, there have been no changes in the Company’s internal control over financial reporting that have materially affected, or that are reasonably likely to materially affect, the Company’s internal control over financial reporting.
ITEM 9B: OTHER INFORMATION
None.
ITEM 9C: DISCLOSURE REGARDING FOREIGN JURISDICTIONS THAT PREVENT INSPECTIONS
Not applicable
PART III
ITEM 10: DIRECTORS, EXECUTIVE OFFICERS AND CORPORATE GOVERNANCE
Incorporated by reference from our Proxy Statement for our 2022 Annual Meeting of Stockholders to be filed with the SEC within 120 days after the end of the year ended December 31, 2021.
Code of Business Conduct and Ethics
The Company has adopted a Code of Business Conduct and Ethics that applies to all ClearSign employees and directors. The Code of Business Conduct and Ethics is posted on the Company’s website at www.clearsign.com. We will post any amendments to or waivers from the Code of Business Conduct and Ethics at that location. We have also adopted Governance Guidelines for the Board of Directors and a written committee charter for each of our Audit Committee and Compensation Committee.
ITEM 11: EXECUTIVE COMPENSATION
Incorporated by reference from our Proxy Statement for our 2022 Annual Meeting of Stockholders to be filed with the SEC within 120 days after the end of the year ended December 31, 2021.
ITEM 12: SECURITY OWNERSHIP OF CERTAIN BENEFICIAL OWNERS AND MANAGEMENT AND RELATED SHAREHOLDER MATTERS
Incorporated by reference from our Proxy Statement for our 2022 Annual Meeting of Stockholders to be filed with the SEC within 120 days after the end of the year ended December 31, 2021.
ITEM 13: CERTAIN RELATIONSHIPS AND RELATED TRANSACTIONS, AND DIRECTOR INDEPENDENCE
Incorporated by reference from our Proxy Statement for our 2022 Annual Meeting of Stockholders to be filed with the SEC within 120 days after the end of the year ended December 31, 2021.
ITEM 14: PRINCIPAL ACCOUNTANT FEES AND SERVICES
Incorporated by reference from our Proxy Statement for our 2022 Annual Meeting of Stockholders to be filed with the SEC within 120 days after the end of the year ended December 31, 2021.
27
PART IV
ITEM 15: EXHIBITS, FINANCIAL STATEMENT SCHEDULES
15(a) (1) Consolidated Financial Statements
The financial statements filed as part of this report are listed and indexed in the Index to Consolidated Financial Statements included at Item 8. Financial statement schedules have been omitted because they are not applicable, or the required information has been included elsewhere in this report.
15(a) (2) Financial Statement Schedules
Not applicable.
15 (a) (3) Exhibits
The exhibits filed as part of this Annual Report on Form 10-K are listed in the Exhibit Table below. The Company has identified in the Exhibit Table each management contract and compensation plan filed as an exhibit to this Annual Report on Form 10-K in response to Item 15(a) (3) of Form 10-K.
28
23.2 | Consent of Gumbiner Savett Inc., Independent Registered Public Accounting Firm* | |
31.1 | ||
31.2 | ||
32.1 | ||
101INS | Inline XBRL Instance Document* | |
101.SCH | Inline XBRL Taxonomy Extension Schema* | |
101.CAL | Inline XBRL Taxonomy Extension Calculation Linkbase* | |
101.DEF | Inline XBRL Taxonomy Extension Definition Linkbase* | |
101.LAB | Inline XBRL Taxonomy Extension Label Linkbase* | |
101.PRE | Inline XBRL Taxonomy Extension Presentation Linkbase* | |
104 | Cover Page Interactive Data File (formatted as inline XBRL and contained in Exhibit 101)* |
*Filed herewith.
**Furnished herewith.
+Agreement with management or compensatory plan or arrangement
(1) | Incorporated by reference from the registrant’s Form 10-Q for the quarter ended September 30, 2019 filed with the Securities and Exchange Commission on November 13, 2019. |
(2) | Incorporated by reference from the registrant’s registration statement on Form S-1, as amended, file number 333-177946, originally filed with the Securities and Exchange Commission on November 14, 2011. |
(3) | Incorporated by reference from the registrant’s Current Report on Form 8-K filed with the Securities and Exchange Commission on June 12, 2019. |
(4) | Incorporated by reference from the registrant’s Annual Report on Form 10-K filed with the Securities and Exchange Commission on February 26, 2015. |
(5) | Incorporated by reference from the registrant’s Quarterly Report on Form 10-Q for the quarter ended March 31, 2013, filed with the Securities and Exchange Commission on May 6, 2013. |
(6) | Incorporated by reference from the registrant’s Annual Report on Form 10-K filed with the Securities and Exchange Commission on March 11, 2014. |
(7) | Incorporated by reference from the registrant’s Annual Report on Form 10-K filed with the Securities and Exchange Commission on March 12, 2019. |
(8) | Incorporated by reference from the registrant’s Current Report on Form 8-K filed with the Securities and Exchange Commission on January 10, 2019. |
(9) | Incorporated by reference from the registrant’s Current Report on Form 8-K filed with the Securities and Exchange Commission on August 28, 2019. |
(10) | Incorporated by reference from the registrant’s Current Report on Form 8-K filed with the Securities and Exchange Commission on January 30, 2019. |
(11) | Incorporated by reference from the registrant’s Current Report on Form 8-K filed with the Securities and Exchange Commission on July 17, 2018. |
(12) | Incorporated by by reference from the registrant’s Annual Report on Form 10-K for the year ended December 31, 2019, filed with the Securities and Exchange Commission on March 30, 2020 |
(13) Incorporated by reference from the registrant’s Current Report on Form 8-K filed with the Securities and Exchange
Commission on December 23, 2020.
(14) Incorporated herein by reference from Appendix A to the registrant’s Proxy Statement on Schedule 14A, filed with the
Securities and Exchange Commission on May 7, 2021.
(15) | Incorporated by reference from the registrant’s Quarterly Report on Form 10-Q for the quarter ended June 30, 2020, filed with the Securities and Exchange Commission on August 20, 2021. |
(16) Incorporated by by reference from the registrant’s Quarterly Report on Form 10-Q for the quarter ended September 30, 2021,
filed with the Securities and Exchange Commission on November 12, 2021.
29
SIGNATURES
Pursuant to the requirements of Section 13 or 15(d) of the Securities Exchange Act of 1934, the registrant has duly caused this report to be signed on its behalf by the undersigned, thereunto duly authorized.
| CLEARSIGN TECHNOLOGIES CORPORATION |
| ||
Date: March 31, 2022 | By: | /s/ Colin J. Deller | ||
Colin J. Deller | ||||
Chief Executive Officer | ||||
Date: March 31, 2022 | By: | /s/ Brent Hinds | ||
Brent Hinds | ||||
Vice President and Controller | ||||
Pursuant to the requirements of the Securities Exchange Act of 1934, this report has been signed below by the following persons on behalf of the registrant and in the capacities and on the dates indicated.
Date: March 31, 2022 |
| /s/ Colin J. Deller |
|
Colin J. Deller | |||
Chief Executive Officer and Director | |||
(Principal Executive Officer) | |||
Date: March 31, 2022 | /s/ Brent Hinds | ||
Brent Hinds | |||
Vice President and Controller | |||
(Principal Financial and Accounting Officer) | |||
Date: March 31, 2022 | /s/ Robert T. Hoffman Sr. | ||
Robert T. Hoffman Sr., Director | |||
Date: March 31, 2022 | /s/ Judith S. Schrecker | ||
Judith S. Schrecker, Director | |||
Date: March 31, 2022 | /s/ Susanne L. Meline | ||
Susanne L. Meline, Director | |||
Date: March 31, 2022 | /s/ Bruce A. Pate | ||
Bruce A. Pate, Director |
31