UNITED STATES
SECURITIES AND EXCHANGE COMMISSION
WASHINGTON, D.C. 20549
_________________
FORM 10-K
_________________
x ANNUAL REPORT PURSUANT TO SECTION 13 OR 15(d) OF THE SECURITIES EXCHANGE ACT OF 1934
For the fiscal year ended December 31, 2015
o TRANSITION REPORT PURSUANT TO SECTION 13 OR 15(d) OF THE SECURITIES EXCHANGE ACT OF 1934
For the transition period from to
Commission File Number 001-37468
_________________
AppFolio, Inc.
(Exact name of registrant as specified in its charter)
_________________
Delaware | 26-0359894 | |
(State of incorporation or organization) | (I.R.S. Employer Identification No.) | |
50 Castilian Drive Goleta, California | 93117 | |
(Address of principal executive offices) | (Zip Code) | |
(805) 364-6093
Registrant’s telephone number, including area code
Securities registered pursuant to Section 12(b) of the Exchange Act:
Title of each class | Name of exchange on which registered | |
Class A common stock, par value $0.0001 per share | The NASDAQ Stock Market LLC | |
Securities registered pursuant to Section 12(g) of the Exchange Act:
None
_________________
Indicate by check mark if the registrant is a well-known seasoned issuer, as defined in Rule 405 of the Securities Act. YES o NO x
Indicate by check mark if the registrant is not required to file reports pursuant to Section 13 or Section 15(d) of Act. YES o NO x
Indicate by check mark whether the registrant (1) has filed all reports required to be filed by Section 13 or 15(d) of the Exchange Act during the preceding 12 months (or for such shorter period that the registrant was required to file such reports) and (2) has been subject to such filing requirements for the past 90 days. YES x NO o
Indicate by check mark whether the registrant has submitted electronically and posted on its corporate Web site, if any, every Interactive Data File required to be submitted and posted pursuant to Rule 405 of Regulation S-T (§ 232.405 of this chapter) during the preceding 12 months (or for such shorter period that the registrant was required to submit and post such files). YES x NO o
Indicate by check mark if disclosure of delinquent filers pursuant to Item 405 of Regulation S-K(§ 229.405 of this chapter) is not contained herein, and will not be contained, to the best of registrant’s knowledge, in definitive proxy or information statements incorporated by reference in Part III of this Form 10-K or any amendment to this Form 10-K. x
Indicate by check mark whether the registrant is a large accelerated filer, an accelerated filer, a non-accelerated filer, or a smaller reporting company. See the definitions of “large accelerated filer,” “accelerated filer” and “smaller reporting company” in Rule 12b-2 of the Exchange Act. (Check one):
Large accelerated filer | ¨ | Accelerated filer | ¨ | ||
Non-accelerated filer | x (Do not check if a smaller reporting company) | Smaller reporting company | ¨ | ||
Indicate by check mark whether the registrant is a shell company (as defined in Rule 12b-2 of the Exchange Act). YES o NO x
The aggregate market value of the voting and non-voting common equity held by non-affiliates of the registrant, based on the closing price of the registrant’s Class A common stock on June 30, 2015 (the last business day of the registrant’s mostly recently completed second fiscal quarter), as reported on the NASDAQ Global Market on such date, was approximately $151.1 million. Shares of the registrant’s Class A common stock and Class B common stock held by each executive officer, director and holder of 10% or more of the registrant’s outstanding Class A common stock and Class B common stock have been excluded from this calculation as such persons may be deemed to be affiliates. This calculation does not reflect a determination that these persons are affiliates of the registrant for any other purpose.
As of February 19, 2016, the number of shares of the registrant’s Class A common stock outstanding was 10,086,318 and the number of shares of the registrant’s Class B common stock outstanding was 23,485,197.
DOCUMENTS INCORPORATED BY REFERENCE
Portions of the registrant’s definitive Proxy Statement for the 2016 Annual Meeting of Stockholders (the “Proxy Statement”), to be filed with the Securities and Exchange Commission (the “SEC”) pursuant to Regulation 14A not later than 120 days after the end of the fiscal year covered by this Annual Report on Form 10-K (the “Annual Report”), are incorporated by reference in Part III, Items 10-14 of this Annual Report. Except for the portions of the Proxy Statement specifically incorporated by reference in this Annual Report, the Proxy Statement shall not be deemed to be filed as part hereof.
________________________________________________________________________________________________________________________________________________________________________________________________________________________________________________________________
________________________________________________________________________________________________________________________________________________________________________________________________________________________________________________________________
APPFOLIO, INC.
ANNUAL REPORT ON FORM 10-K
FOR THE FISCAL YEAR ENDED DECEMBER 31, 2015
TABLE OF CONTENTS
Section | Page No. | ||
Item 1. | |||
Item 1A. | |||
Item 1B. | |||
Item 2. | |||
Item 3. | |||
Item 4. | |||
Item 5. | |||
Item 6. | |||
Item 7. | |||
Item 7A. | |||
Item 8. | |||
Item 9. | |||
Item 9A. | |||
Item 9B. | |||
Item 10. | |||
Item 11. | |||
Item 12. | |||
Item 13. | |||
Item 14. | |||
Item 15. | |||
CAUTIONARY NOTE REGARDING FORWARD-LOOKING STATEMENTS
This Annual Report on Form 10-K for the fiscal year ended December 31, 2015, or Annual Report, includes “forward-looking statements” within the meaning of Section 27A of the Securities Act of 1933, as amended, or the Securities Act, and Section 21E of the Securities Exchange Act of 1934, as amended, or the Exchange Act, which statements are subject to considerable risks and uncertainties. Forward-looking statements include all statements that are not statements of historical facts contained in this Annual Report and can be identified by words such as “anticipates,” “believes,” “seeks,” “estimates,” “expects,” “intends,” “may,” “plans,” “potential,” “predicts, “projects,” “should,” “could,” “will,” “would” or similar expressions and the negatives of those expressions. In particular, forward looking statements contained in this Annual Report relate to, among other things, our future or assumed financial condition, results of operations, business forecasts and plans, strategic plans and objectives, product development plans, recent accounting pronouncements and capital needs and financing plans. We caution you that the foregoing list may not include all of the forward-looking statements made in this Annual Report.
Forward-looking statements represent our management’s current beliefs and assumptions based on information currently available. Forward-looking statements involve numerous known and unknown risks, uncertainties and other factors that may cause our actual results, performance or achievements to be materially different from any future results, performance or achievements expressed or implied by the forward-looking statements. We discuss these risks and uncertainties in greater detail in the section entitled “Risk Factors” in Part I, Item 1A of this Annual Report, as well as in our other filings with the Securities and Exchange Commission, or SEC. You should read this Annual Report, and the other documents that we have filed with the SEC, with the understanding that our actual future results may be materially different from the results expressed or implied by these forward-looking statements.
Moreover, we operate in an evolving environment. New risks and uncertainties emerge from time to time and it is not possible for our management to predict all risks and uncertainties, nor can we assess the impact of all factors on our business or the extent to which any factor, or combination of factors, may cause actual future results to be materially different from those expressed or implied by any forward-looking statements.
Except as required by applicable law or the rules of the NASDAQ Stock Market, we assume no obligation to update any forward-looking statements publicly, or to update the reasons actual results could differ materially from those anticipated in these forward-looking statements, even if new information becomes available in the future.
We qualify all of our forward-looking statements by these cautionary statements.
1
PART I
ITEM 1. | BUSINESS |
Unless otherwise stated in this Annual Report, references to "AppFolio," "we," "us," and "our" refer to AppFolio, Inc. and its consolidated subsidiaries.
Overview
We are a provider of industry-specific, cloud-based software solutions for small and medium-sized businesses, or SMBs, in the property management and legal industries. We initially chose to enter the market for property management because it met our criteria for selecting industries that cloud-based solutions are ideally suited to address, including the prevalence of unique workflows and relationships among multiple industry participants. We launched our first product, AppFolio Property Manager, or APM, a property management solution, in 2008. In 2012, after completing our market validation process, we decided to enter the legal market. We expedited our time-to-market by acquiring MyCase, a legal practice and case management solution, and we leveraged our AppFolio Business System, including our experience gained in the property management vertical, to advance our software solution in the legal vertical.
Our platform is designed to be the system of record to automate essential business processes and the system of engagement to enhance business interactions between our customers and their clients and vendors. Our mobile-optimized software solutions have a user-friendly interface across multiple devices, enabling our customers to work at any time and from anywhere. Our property management software provides small and medium-sized property managers with an end-to-end solution to their business needs, enabling them to manage properties quickly and easily in a single, integrated environment. Our legal software provides solo practitioners and small law firms with a streamlined practice and case management solution, allowing them to manage their practices and case load within a flexible system. We also offer optional, but often mission-critical, Value+ services, such as our professionally designed websites and electronic payment services, which are seamlessly built into our core solutions.
SMBs face numerous issues that divert limited time and resources away from serving their clients and growing their businesses. The business activities of SMBs are complex and their day-to-day operations are often managed through inefficient manual processes and disparate software systems. The lack of automation and integrated technology places a significant administrative burden on these businesses, particularly in industries that involve unique workflows, relationships among multiple industry participants, significant data inputs, and compliance or regulatory requirements. While larger enterprises and consumers have been experiencing a transformational shift into the digital age, the legacy systems currently used by many SMBs are lagging behind in terms of technological sophistication and ease of use. In particular, many small and medium-sized property managers are still running their businesses using spreadsheets and a variety of point solutions that are not web-optimized while much of the real estate market has moved online. Similarly, solo practitioners and small law firms continue to be plagued by manual processes and outdated software despite the broader legal industry’s increased comfort with cloud-based solutions.
We have custom-tailored our business to enable us to revolutionize the way that SMBs grow and compete. We refer to our approach to addressing similar, fundamental business needs of SMBs across our targeted verticals as our AppFolio Business System. At the center of our AppFolio Business System is a common technology platform, which provides functionality across our software solutions in our targeted verticals. We apply a disciplined approach of using market validation to select and develop new core functionality and Value+ services for our existing markets and to identify the most suitable adjacent markets and new verticals to pursue. Based on the results of our market validation process, we strive to deploy exceptional cloud-based technology designed to improve the efficiency and productivity of businesses. We use in-bound marketing, participation at customer and industry events, and in-app messaging to educate new and existing customers on how our software solutions can transform their businesses. Based on the foundation created by our marketing activities, our sales team quickly builds relationships with potential customers, assesses their business challenges and demonstrates the benefits of our core functionality and Value+ services. We partner with our customers to navigate their digital transformation by streamlining the on-boarding process and providing ongoing advice on best practices. We continuously expand our core functionality and add new Value+ services based on feedback from our customers, which is collected across our organization and used by our research and product development team to release frequent updates to our software solutions. Our customer-centric culture fosters long-term relationships with our customers and helps to facilitate their business success.
Our core solutions address common business functions and interactions of SMBs in our targeted verticals by providing key functionality, including accounting, document management, real-time interactive search, data analytics and communication options. We currently offer APM for property managers and MyCase for law firms. APM is a comprehensive solution for the operational requirements of small and medium-sized property managers, including activities such as posting and tracking tenant vacancies, handling the entire leasing process electronically, administering maintenance and repairs with their vendor networks, managing accounting and reporting to property owners. MyCase is a flexible practice and case management solution for solo
2
practitioners and small law firms, providing time tracking, billing and payments, client communication, coordination with other lawyers and support staff, legal document management and assembly, and general office administration. As MyCase is in an earlier stage of development than APM, we are continuing to expand its core functionality.
In addition to our core solutions, we offer a range of optional, but often mission-critical, Value+ services. Our Value+ services are available on an as-needed basis and enable our customers to adapt our platform to their specific operational requirements. Today, we offer certain Value+ services to both our property manager and law firm customers, namely, professionally designed websites and electronic payment services. In addition, we offer the following Value+ services to our property manager customers: resident screening; tenant liability insurance; and our contact center to resolve or route incoming maintenance requests. Over time, we anticipate offering similar and additional Value+ services across our targeted verticals. In April 2015, we expanded the services offered to our property manager customers, giving them the ability to better spend, track and optimize their marketing investments through our acquisition of RentLinx, a software platform that allows customers to advertise rental houses and apartments online. Through our disciplined market validation approach and ongoing investment in product development, we continuously update our software solutions through new and innovative core functionality and Value+ services, as well as assess opportunities in adjacent markets and new verticals.
For the years ended December 31, 2015, 2014 and 2013, our revenue was $75.0 million, $47.7 million and $26.5 million, respectively, representing year-over-year growth of 57% when comparing 2015 to 2014, and year-over-year growth of 80% when comparing 2014 to 2013. As a result of the substantial increase in headcount, as well as other investments to expand our research and product development, customer service, and sales and marketing, and maintain and expand our technology infrastructure and operational support, we incurred net losses of $15.7 million, $8.6 million and $7.3 million for the years ended December 31, 2015, 2014 and 2013, respectively. We have invested, and intend to continue to invest, heavily in our business to capitalize on our market opportunity.
Our AppFolio Business System
We refer to our approach to addressing the specific needs of SMBs across our targeted verticals as our AppFolio Business System. Our AppFolio Business System has been developed to find, evaluate and serve verticals in which we can deliver a transformative, easy-to-use software solution that can handle the key operational requirements of SMBs at a low overall cost of ownership.
Key elements of our AppFolio Business System include:
Disciplined Market Validation Process. Since our founding, we have worked closely with our customers, partners and other industry participants to inform our product roadmap. We have consistently applied a disciplined market validation process to select and develop new core functionality and Value+ services, and to identify the most suitable adjacent markets and new verticals to target. This approach facilitates faster and more focused product development, with higher confidence that our software solutions will rapidly find market acceptance within our targeted verticals.
AppFolio Technology Platform. At the center of our AppFolio Business System is our modern, cloud-based technology platform, which encompasses a wide variety of reusable core functionality and Value+ services that can be leveraged to provide continuous updates across our software solutions in our targeted verticals. The functionality of our platform has been developed with a view to improving business efficiency and productivity for SMBs. |
Innovative Marketing Approach. We believe a key element of our AppFolio Business System is efficiently creating and delivering industry-specific content and educating SMBs in our targeted verticals to build our market presence. Our go-to-market strategy across our targeted verticals leverages in-bound marketing techniques, including content marketing, search engine optimization, or SEO and search engine marketing or SEM, and industry thought leadership, including our participation at customer and industry events, which are used by our sales development team to further nurture potential sales leads. We also use in-app messaging to remind existing customers of our Value+ services at natural points in their workflow, making it easy for our customers to increase usage and find out about new Value+ services.
Efficient Sales Process. Based on the foundation created by our marketing programs and sales development team, we are able to quickly build relationships with potential customers, assess their business challenges and demonstrate the benefits of our core functionality. Following on-boarding of our core solution, our sales team identifies specific Value+ services that enable our customers to further streamline and grow their businesses. Our transparent pricing model is designed to simplify the sales process by pricing subscriptions in a uniform manner based on the size of our customers’ businesses.
3
Customer Service as a Partnership. Our customer service team partners with our customers to assist them with on-boarding and help ensure they are optimally using our software solution early in their relationship with us. We believe this process is critical to our customers’ success and plays an important role in customer retention. We also provide ongoing training and support, and regularly provide advice on best practices. Our customer service is an essential component of our AppFolio Business System, serving to deepen our relationships with our customers, maximize the value of our software solutions for their businesses, and encourage word-of-mouth referrals from satisfied customers. |
Customer Feedback Loop. We are committed to listening to and understanding our customers based on proactive customer dialogue and feedback about our software solutions. This provides valuable insight into the operations of SMBs in our targeted verticals. Our product management team routinely engages with our customer service and sales and marketing organizations, as well as our customers, partners and other industry participants, to provide guidance to our engineering team. Our agile, team-based engineering approach and continual integration of customer feedback allows us to release frequent updates to our software solutions quickly and seamlessly. |
These components of our AppFolio Business System strengthen our brands and customer loyalty, often resulting in customer promotion and feedback that we leverage in developing, marketing and selling our software solutions across our targeted verticals.
Our Solutions
We provide SMBs with cloud-based business management software solutions that are designed and developed with our customers’ industry-specific business needs in mind.
All-in-One System. Our core solutions have been designed and developed to suit the specific workflows of SMBs in our targeted verticals. We believe that, by focusing on specific industries, we are better able to provide our customers with broad functionality that meets their key business needs and eliminates their need for a myriad of disparate point solutions. Our vision for each vertical software solution includes fully integrated functionality that provides a single system of record to automate routine processes and a system of engagement to optimize business interactions among our customers and their clients and vendors. |
Essential Value+ Services. Our software solutions include optional, but often mission-critical, Value+ services that our customers can adopt to enhance our core solutions. These services range from upfront professional website design to ongoing high-volume transactional services, such as electronic payment services, in addition to industry-specific services, such as resident screening, for our property manager customers. |
Modern Cloud-Based Solutions. We have designed and developed our software solutions on a modern cloud-based platform, allowing for rapid and cost-effective deployment of our enterprise-class software solutions and frequent updates to help ensure our software solutions incorporate the latest technological advances and adapt to industry trends.
Built for Any Device, Anytime, Anywhere. We recognize that SMBs handle multiple responsibilities that require them to be available 24/7, and they demand flexible software solutions that are compatible with the laptops, tablets and smartphones they already own to allow them to work at any time and from anywhere. Our software solutions are designed to enable users to move seamlessly from one device to another, to run on multiple operating systems and to launch in a variety of browsers.
User-Friendly Interface. We invest significant time and resources in streamlining and rationalizing our functionality to enable an intuitive and user-friendly customer experience. Our users are often able to benefit immediately from our software solutions with little to no training. We designed our interface to resemble the social media applications our customers already use, making it easy to transition their businesses to our platform because of a preexisting familiarity.
Ever-Evolving Functionality. We direct our investment in research and product development based on our market validation findings and customer feedback loop, which inform the development of new core functionality and Value+ services that are directly relevant to our customers’ businesses and foster best practices based on deep industry knowledge. |
Vertical Data Analytics. As a vertical cloud-based solution provider, we are uniquely positioned to capture data across our customer base, forming a new source of industry-specific business data. Our customers benefit from data analytics in the form of business performance management through a wide variety of customizable reports and business optimization through aggregated benchmarking data, which provides visibility across their industries. |
4
Benefits of Our Solutions
Benefits to Our SMB Customers. Our cloud-based business management software solutions enable our customers to eliminate manual processes and collapse a myriad of point solutions into a single system of record and system of engagement, all at a lower cost than an inflexible on-premise software product. Our software solutions facilitate the automation of recurring transactions to improve efficiency, vertical data analytics to provide visibility, and seamless communication, which combine to produce tangible time savings, reduced expenses and increased revenue. |
Benefits to Clients of SMBs. Our software solutions help ensure clients of SMBs experience high quality, professional service, improved responsiveness and easy access to useful information. Clients of SMBs are able to interact with the owners and managers of SMBs through our intuitive, consumer-like interfaces and to complete a variety of tasks online.
Benefits to Vendors of SMBs. Our software solutions enable vendors of SMBs to streamline transactions with the owners and managers of SMBs by automating processes and facilitating communications.
AppFolio Technology Platform
We have developed a common technology platform that enables us to create business management software solutions for SMBs within our targeted verticals. Our suite of applications integrated within our core solution spans many of our customers’ most critical business needs by providing the system of record and the system of engagement. In conjunction with our core solution, we offer a number of Value+ services. Our Value+ services currently consist of website services, electronic payment services, background and credit checks, insurance services and contact center services. We have built our platform using a modern cloud-based architecture. Our software solutions are designed to run on any device and are compatible with any operating system. As a result, our customers' data is available at any time and from any location.
Products - AppFolio Property Manager
Core Functionality
Our property management software solution provides small and medium-sized property managers (including both third-party managers and owner-operators) with a multi-faceted solution for their operational requirements. We built APM from the ground up based on our analysis of the industry and input directly from property managers. APM includes the following core functionality:
Powerful Accounting Software. APM provides integrated accounting software specifically designed for property managers, including accounts payable, accounts receivable, trust accounting, Form 1099 creation, check printing, automatic bank reconciliation and Ratio Utility Billing to calculate a resident’s share of monthly utility costs based on predetermined allocations. |
Data-Driven Management. Unlimited storage allows all data to be centralized in APM, making it available to property managers on-demand through our dynamic search capabilities. APM also allows property managers to better understand and track their business performance through property-level budgets and many customizable reports covering accounting details, property details, and resident and vendor information.
Effective Online Marketing. Our tenant vacancy tracking software capitalizes on property data centralized in APM to streamline the listing process. In just a few clicks, property managers can manage listings on their own websites and make automatic feeds available to a wide variety of third-party listing sites, dramatically increasing the visibility of listings. Our core functionality also improves the quality of listings by allowing property managers to embed YouTube videos and use our professionally formatted HTML code for listings on third-party websites. All vacancy listings and tasks are then consolidated in real time to reflect the status of a property manager’s current vacancies, with detailed metrics showing how vacancy rates are affected by changes in rent or marketing. |
Seamless End-to-End Lease Processing. APM provides a mobile-friendly online leasing solution that allows prospective residents to complete online rental applications from the vacancy listings and upload photographs of their drivers licenses and other important documents. If approved, the property manager can generate a lease agreement pre-populated with the applicant’s data that can be electronically signed by the new resident in real time. Our online lease template can be customized to create multiple lease agreements for different property types and requirements, including forms required by applicable law. We also recently introduced a lease renewal workflow, which automatically incorporates designated increases in rent into the relevant documentation. |
Streamlined Resident Communications. Mass emailing capability and text messaging functionality in APM streamline communications and social interactions with residents. Our messaging center facilitates a range of communications from move-in and move-out instructions to invitations to resident events, as well as short, time-sensitive |
5
communications, such as maintenance alerts and late rent reminders. Our messaging center allows property managers to personalize communications and interact with property owners and vendors.
Accessible Property Owner Reporting. APM enables property managers to post to private and secure online owner portals. These postings typically include owner statements, completed work orders and other reports to which owners have on-demand access. Our owner statements are designed to be easy to read and user friendly, providing a helpful overview of transactions affecting the property in the past month, and facilitating better service by property managers to their clients. |
Transparent Property Maintenance. APM’s built-in property maintenance software facilitates electronic work orders to vendors, for both one-time and recurring tasks, which are organized in real time to provide a snapshot of all past and in-progress work orders. Residents can access tenant portals to submit online maintenance requests, which automatically create work orders upon acceptance by the property manager. This allows property managers to expedite response times, track and edit the status of repairs, and ensure that property issues are addressed in a timely manner.
Convenient Payments to Owners and Vendors. As an alternative to cash or checks, APM enables property managers to make payments to owners and vendors faster and more securely by depositing funds directly into their bank accounts. Like our other payment solutions, this functionality is built into APM so that payments are automatically entered into our accounting software. |
Property Inspection on Any Device. Built-in property inspections functionality allows property managers to perform and manage on-site property inspections remotely on their preferred mobile device. Property managers can make notes directly in the application (or use their phone’s speech-to-text functionality) and upload related photographs as they walk through the property. APM then generates an inspection report in a fraction of the time it would take to type up handwritten notes and allows property managers to create work orders from flagged inspection items.
Optimized Rent Comparison. RentMatch, our rent comparison tool, quickly analyzes the rental price and characteristics of any given unit and uses data analytics to compare them to actual rental prices of units of similar size and bedroom count in the same geographical area, presenting the results in a user-friendly report.
Variable Functionality for Different Property Types. APM allows property managers to manage single- and multi-family residences, student housing, commercial property or mixed real estate portfolios, as well as optional rentable items such as parking spaces or storage. We are continually adding new core functionality, including rent-by-the-bed for student housing and the ability to allocate common area maintenance charges. |
Value+ Services
Our Value+ services enable property managers to activate certain optional, but often mission-critical, functionality that is seamlessly built into APM and designed to improve the user experience in a number of significant ways.
Professionally Designed Websites. We collaborate with our customers to deliver and maintain websites that showcase modern and mobile-optimized designs, with unique sites customized for individual properties, including image galleries and floor plans. Our websites are fully integrated with APM’s functionality, including vacancy postings, payment options, owner portals and maintenance requests. Property managers can track and analyze site traffic and lead generation and identify prospects by evaluating the guest cards on vacancy postings that are filled in by prospective residents. |
Electronic Payment Services. Our payments platform provides prospective and current residents with a number of convenient and secure payment options. Prospective residents can pay rental application fees through our secure online rental applications. APM supports ACH payment processing (e-Check) and credit or debit card payments of security deposits and rent through our secure online tenant portals. As a more secure alternative to cash and money orders, residents can make regular or last-minute Electronic Cash Payments at any 7-Eleven and ACE Cash Express location. |
Instant Background and Credit Checks. APM offers instant background screening and credit checks for use during the rental application process. Instead of manually entering or faxing information to third-party service providers, APM allows property managers to simply press a “Screen Now” button upon receipt of a new online rental application and receive an easy-to-read report summarizing the results of a credit check and nationwide eviction and criminal records search. Customers also gain access to, and have the option to contribute to, Experian RentBureau rental payment history data, updated every 24 hours, to identify the highest quality residents and reduce the risk of bad debts.
Reliable Insurance Coverage. Property managers are increasingly requiring residents to carry tenant liability insurance to reduce the hassle and expense associated with resident-caused damage. APM facilitates enrollment of residents in a simple, easy-to-understand tenant liability insurance program, and allows property managers to link this service to lease signings and renewals and easily track resident compliance. Our tenant liability insurance program seeks to
6
provide residents with a cost-effective, integrated solution that provides property managers with a competitive advantage when marketing their services to owners.
24/7 Maintenance Contact Center. APM’s contact center is manned 24 hours a day, 7 days a week, by professionally trained agents. These agents can act as an extension of the property manager’s office to resolve or route incoming maintenance requests. Our answering service is designed to work seamlessly with APM’s property maintenance software. APM agents are equipped to enter non-emergency work orders directly into APM for the property manager’s approval and dispatch vendors immediately in case of an emergency. |
Products - MyCase
Core Functionality
Our legal software solution is designed to assist solo practitioners and small law firms with administering their practice and managing their case load. We acquired MyCase in 2012 and are continuing to expand its functionality by leveraging our AppFolio Business System, including our experience gained in the property management vertical, to advance our software solution in the legal vertical. MyCase includes the following core functionality:
On-the-Go Time Tracking. MyCase allows attorneys to enter billable hours on their preferred mobile device, automatically linking time entries to the appropriate case or matter. Lawyers are able to handle multiple court appearances, meetings and other interactions without having to recreate their days after the fact. MyCase can also be used to track non-billable entries to monitor the performance and efficiency of flat-fee arrangements and contributions to pro bono work.
Flexible Legal Billing Software. MyCase’s legal billing software can be used to generate detailed trust account balances and a wide variety of reports to track productivity and other firm metrics. It can also quickly pull unbilled time and expenses or flat fee balances into a professionally formatted invoice, which can be customized with the law firm’s logo. Attorneys can use our Payment Plan Generator to easily define a payment schedule for a client with flexible due dates and balances. Our QuickBooks integration functionality provides a one-way sync of detailed accounting data into QuickBooks, ensuring consistency across accounting software. |
Secure Client Portals. MyCase’s integrated client portals provide clients with on-demand access to a variety of information, including sensitive and privileged communications, with the knowledge that such correspondence is private and secure and better protected than messages sent over unsecure email. Our client portals have a modern interface similar to that of social networking sites, with real-time activity streams to provide an overview of recent developments, and a comment stream associated with uploaded items shared with clients, who get automatic notifications of updates.
Automated Organizational Tasks. MyCase offers broad functionality to facilitate better organization of cases and matters, including centralized contacts, tasks, calendars and reminders accessible by the entire firm. Our workflow software allows lawyers to automate processes for routine tasks tailored to the type of case or matter. Calendars and reminders are synchronized in real time across all devices to assist the entire team with time management, and colleagues and clients receive notifications when calendar events are added. Practitioners can also link calendar events to the applicable case or matter to track associated billable hours. |
Robust Document Management and Collaborative Assembly. MyCase provides a robust legal document management system, which, together with our unlimited storage and drag-and-drop upload tool, allows law firms to organize correspondence and other documentation in a searchable, centralized firm library. Our cloud-based platform allows colleagues to collaborate in drafting new documents, which can be assembled quickly and easily by capitalizing on our customizable templates.
Value+ Services
We currently offer two optional, but frequently essential, services to our law firm customers.
Professionally Designed Websites. Our professionally designed websites are fully integrated with MyCase so that practitioners and their clients can easily login to the site to access case and matter information, communicate and manage bills. Our websites are geared towards improving the effectiveness of law firm marketing and building a mobile presence. We work with our law firm customers to build their brand by tailoring website content, providing professional images, creating a logo and purchasing their unique domain.
7
Electronic Payment Services. MyCase enables practitioners to accept credit or debit cards in their offices or over the phone and pay only normal merchant processing fees. In addition, by linking operating and trust accounts, practitioners can accept online payment of retainers and other amounts directly into these accounts.
Our Customers
As of December 31, 2015, we had 8,218 property manager customers and 6,145 law firm customers. Our property manager customers include third-party managers and owner-operators, managing single- and multi-family residences, commercial property and student housing, as well as mixed real estate portfolios. Our property manager customers typically manage portfolios ranging from 20 to 3,000 units. Our customers in the legal vertical are generally solo practitioners and small law firms with less than 20 lawyers. No customer represented more than 10% of our total revenue for our fiscal year ended December 31, 2015.
Our Culture and Employees
We believe our people are at the heart of our success and our customers’ success. We endeavor to attract and hire the most talented employees and provide a challenging and rewarding environment to motivate and bring out the best in them. We believe our ability to create and grow our company culture provides us with a significant competitive advantage by stimulating strong teams capable of executing our strategic plans and encouraging innovation. We subscribe to six core values, which capture the culture of our organization:
▪ | Simpler Is Better |
▪ | Great, Innovative Products Are Key To A Great Business |
▪ | Great People Make A Great Company |
▪ | Listening To Customers Is In Our DNA |
▪ | Small, Focused Teams, Keep Us Agile |
▪ | We Do The Right Thing Because It’s Good For Business |
As of December 31, 2015, we had 573 employees. We also hire temporary employees and consultants. We consider our relations with our employees to be good. None of our employees are represented by a labor union or covered by a collective bargaining agreement.
Technology and Operations
Data Security and Availability
We use Ruby-on-Rails as our web application framework for both APM and MyCase. Our software solutions run on a combination of both public and private cloud infrastructure, consisting of both our own servers and Amazon’s Elastic Compute Cloud, or EC2, platform. Our servers are located in state-of-the-art data centers operated by third-party service providers. Physical security at these facilities includes a variety of access controls, including electronic keycards, pin codes, biometric hand scans and mantraps, and policing by high resolution, motion sensitive video surveillance. These facilities provide redundant power and a system of heating, ventilating and air conditioning, as well as fire-threat detection and suppression. We utilize a system of redundant routers, switches, server clusters and back-up systems to help ensure high availability. Amazon is widely recognized for operating state-of-the-art, highly available data centers.
With respect to Internet security, sensitive data, such as passwords, Social Security and tax identification numbers, are encrypted before being written to disk. In addition, all network connections are encrypted. Data is backed up using Amazon’s Simple Storage Service, or S3, providing high durability, and we also perform regular backups of all customer data. We evaluate our Internet security regularly, including through third-party penetration testing.
In addition, our software solutions allow our customers to define roles that provide different levels of access to users, allowing them to view and modify specific items depending on their role. Supervisors can distribute work to on-site staff in a secure and controlled environment, while leadership retains visibility across the entire system.
8
Research and Product Development
We entrust product design, development and testing to our team of engineers, who coordinate closely with our product management team to launch new core functionality and Value+ services. Our engineers are organized in smaller groups to foster agility and continued innovation in responding to the evolving needs of our customers. We leverage a collaborative, team-based and test-driven approach to engineering to release new code frequently. We believe that it is easier for our customers to adjust to these continuous updates to our software solutions, which incrementally change and improve their user experience, than it is to adapt to infrequent, but more drastic, upgrades of legacy on-premise software.
We rely heavily on input from our customers in developing products that meet their needs and anticipate developments in their respective industries. Our product management team leads our research and market validation efforts and provides guidance to management and our engineering team based on our collective domain expertise and in-depth knowledge and understanding of our customers. As a result, our product management team engages regularly with customers, partners and other industry participants, as well as our customer service and sales and marketing organizations. Our product management team manages our development projects generally and serves to align separate functions within the company with a single strategic vision.
Our research and product development expenses were $9.6 million, $6.5 million and $5.1 million for the years ended December 31, 2015, 2014 and 2013, respectively.
Sales and Marketing
We leverage a modern marketing approach along with marketing automation technology to build brand recognition and our reputation as an industry leader in our targeted verticals.
We participate in and drive industry thought leadership and education with both online and offline activities. We attend, host and present at a number of industry events and support educational opportunities in the form of trade shows, conferences and webinars across the United States. We host informational lunches and networking opportunities in key cities in the form of “Meet Ups,” which bring together existing and prospective customers. Our online user forums facilitate discussions with other industry participants and serve as a resource for tips on using our platform and best practices. We also make a number of valuable educational resources available for free through our industry partners and on our industry websites, such as PropertyManager.com and our blogs.
We use a variety of in-bound marketing techniques to promote our software solutions, including content marketing, SEO, SEM, social media and advanced digital advertising tactics. Our sales development team acts in partnership with our in-bound marketing efforts to reach potential customers, generate additional sales opportunities and speed the time from evaluation to close. We offer free trials of both APM and MyCase. Our sales representatives can then assist prospective property manager customers as they evaluate APM, while prospective law firm customers generally sign up for a 30-day free trial on a self-service basis (with additional support from a live sales development representative as needed).
Our sales team works closely with our marketing organization to find and acquire new customers as well as expand adoption and use by existing customers. We have a metrics-driven sales culture with a focus on early indicators that lead to strong pipeline creation. We leverage technology and specialization of resources along with an emphasis on continued training and development to maximize the productivity and speed the ramp time for each sales representative. Our interactive sales methodology allows the sales team to quickly build relationships, assess the customer’s business challenges, and demonstrate the benefits of our core functionality and Value+ services.
Throughout the customer relationship, we continue to promote adoption and usage of our Value+ services in a variety of channels, including email, webinars, training, sales outreach and within our software solution via in-app messaging. While APM and MyCase customers are using our core solutions, in-app messaging puts additional Value+ services right in their workflow. This makes it easy for customers to find out about additional Value+ services in an unobtrusive manner and begin to adopt those services that are useful to their business. Our Value+ sales team then works in tandem with our marketing organization to further increase adoption and usage of our Value+ services.
Customer Service
Our success is based on long-term customer retention, not a one-time sale, and we partner with our customers throughout the life of the customer relationship to help them navigate their digital transformation. We design our software solutions to be simple and easy-easy to switch to, set up, use and manage. We offer unlimited training and support across our software solutions
9
at no extra charge. We pride ourselves on being customer-centric and strive to educate our customers on the additional core functionality and Value+ services they can use to improve business efficiency and productivity.
Our on-boarding team strives to ensure that customers are prepared to run their businesses on our platform and provide the best on-boarding experience in the industry. Based on our assistance with data migration, we are able to provide valuable insights into data integrity and work diligently with our customers to help resolve any issues in their underlying business processes. We also assist our customers with the configuration of our platform for particular property types or cases. We provide a dedicated team throughout the on-boarding process and ongoing planning thereafter, including compliance with best practices. Our Value+ team also includes a number of employees focused on guiding our customers through the adoption of our Value+ services.
Our software solutions are designed to be intuitive so that our customers can learn to use them in a matter of hours, as opposed to days or weeks. Nevertheless, we provide a variety of training options to assist with this process. Our instructors offer several live-streamed training courses each week, and also make available recorded training courses, which can be accessed on demand. Our training is designed to provide product overviews for those in the process of converting to our software solutions, as well as in-depth, step-by-step instructions and ongoing education for those seeking to leverage greater functionality.
Our cloud-based platform allows us to fix issues quickly and to continuously improve our customers’ experience through ongoing updates to our software solutions. However, when issues and questions do arise, we strive to ensure that a real person is available to respond to a customer’s concerns quickly and intelligently.
Throughout the customer relationship, our customer loyalty team proactively engages with our customers to facilitate our customers’ success. Similarly, our Value+ team includes employees focused exclusively on expanding Value+ service adoption and usage by new and existing customers and providing expertise with respect to related services.
Competition
The overall market for business management software is global, highly competitive and continually evolving in response to changes in technology, operational requirements, laws and regulations. While we focus on providing software solutions to SMBs in our targeted verticals, we compete with other vertical cloud-based solution providers that serve companies of all sizes and horizontal cloud-based solution providers that offer broad solutions across multiple verticals.
In the property management vertical, our competitors include established vertical software vendors, such as RealPage and Yardi. In the property management vertical, we also compete with cloud-based solution providers whose services are geared toward individual landlords with smaller portfolios than those of our targeted customers. In the legal vertical, our competitors include established vertical software vendors, such as Thompson-Reuters, LexisNexis, and Clio.
We also see competition from numerous cloud-based solution providers that focus almost exclusively on one or more point solutions. For example, in the property management vertical, we compete with listing services, tenant screening applications and specialists in lease forms. In the legal vertical, we compete with time tracking, legal billing and payment services. Continued consolidation among cloud-based solution providers could lead to significantly increased competition.
We believe the principal competitive factors in our market include the following:
▪ease of deployment and use of software solutions and applications;
▪total cost of ownership;
▪data security and availability;
▪breadth and depth of functionality in software solutions and applications;
▪nature and extent of mobile interface;
▪level of customer satisfaction;
▪size of customer base and level of user adoption and usage;
▪brand awareness and reputation;
▪ability to innovate and respond to customer needs rapidly;
▪
▪domain expertise with respect to our targeted verticals; and
▪ability to leverage a common technology platform and business strategy.
10
We believe that we compete favorably on the basis of these factors and that the domain expertise required for developing, marketing and selling successful software solutions in the property management and legal verticals may hinder new entrants that are unable to invest the necessary resources to develop and deploy software solutions with the same level of functionality as ours.
Intellectual Property
We rely on a combination of patents, copyrights, trademarks, trade secrets, confidentiality procedures and contractual restrictions to establish and protect our proprietary rights in our core solutions and Value+ services. As of January 31, 2016, we had ten issued U.S. patents that directly relate to our technology that expire between 2026 and 2033, and we had two pending patent applications in the United States. We intend to pursue additional patent protection to the extent we believe it would be beneficial and cost effective.
We registered “AppFolio,” "MyCase" and "RentLinx" and certain other marks as trademarks in the United States and several other jurisdictions. We also filed trademark applications in the United States and certain other jurisdictions and will pursue additional trademark registrations to the extent we believe it would be beneficial and cost effective. We are the registered holder of a variety of domestic and international domain names that include “appfolioinc.com,” “appfolio.com,” “mycase.com,” “propertymanager.com” and similar variations. We also license software from third parties for use in our solutions, including open source software and other software available on standard commercial terms.
We control access to our proprietary technology by entering into confidentiality and invention assignment agreements with our employees and contractors and confidentiality agreements with third parties. Despite our precautions, it may be possible for unauthorized third parties to copy our software solutions and use information that we regard as proprietary to create products and services that compete with ours.
Corporate Information
We were formed in 2006 as a Delaware limited liability company and converted to a Delaware corporation in 2007. Our principal executive offices are located at 50 Castilian Drive, Goleta, California 93117, and our telephone number is (805) 364-6093. Our corporate website is www.appfolioinc.com. The information contained on or accessed through our website does not constitute part of, and is not incorporated by reference into this Annual Report. References to our website address in this Annual Report are inactive textual references only.
“AppFolio,” “MyCase,” "RentLinx," the AppFolio logo, the MyCase logo, and other trademarks and trade names of AppFolio, MyCase and RentLinx appearing in this Annual Report are our property. All other trademarks or trade names appearing in this report are the property of their respective owners. Solely for convenience, the trademarks and trade names in this report are referred to without the ® and ™ symbols. We do not intend our use or display of the trademarks, trade names or service marks of other parties to imply a relationship with, or endorsement or sponsorship of us by, such other parties.
Available Information
We file annual reports on Form 10-K, quarterly reports on Form 10-Q, current reports on Form 8-K, as well as amendments to those reports pursuant to Sections 13(a) and 15(d) of the Exchange Act. We also file proxy statements and information statements pursuant to Section 14 of the Exchange Act. The public may obtain these filings at the SEC’s Public Reference Room at 100 F Street, NE, Washington, DC 20549 or by calling the SEC at 1-800-SEC-0330. The SEC also maintains a website at www.sec.gov that contains the reports, proxy and information statements, and other information that we file with or furnish to the SEC electronically. Copies of the reports on Form 10-K, Form 10-Q, and Form 8-K, as well as the amendments to those reports, may also be obtained, free of charge, electronically through our corporate website at www.appfolioinc.com as soon as reasonably practical after we file such material with, or furnish it to, the SEC.
11
ITEM 1A. RISK FACTORS
An investment in our Class A common stock involves risks. You should carefully consider the risks and uncertainties described below, together with all of the other information in this Annual Report, as well as in our other public filings with the SEC, before making an investment decision. If any of the following risks are realized, our business, financial condition, operating results and prospects could be materially and adversely affected. In that case, the trading price of our Class A common stock may decline, and you could lose all or part of your investment. Furthermore, additional risks and uncertainties of which we are currently unaware, or which we currently consider to be immaterial, could have a material adverse effect on our business.
Risks Related to Our Business and Our Industry
If we are unable to enter new verticals, or if our software solution for any new vertical fails to achieve market acceptance, our operating results could be adversely affected and we may be required to reconsider our growth strategy.
Our growth strategy is dependent, in part, on leveraging our AppFolio Business System, including our common technology platform, to expand into new verticals. However, we may be unable to identify new verticals that meet our criteria for selecting industries that cloud-based solutions are ideally suited to address. In addition, our market validation process may not support entry into selected verticals due to our perception of the overall market opportunity or of the willingness of market participants within those verticals to adopt our software solutions. Further, instead of pursuing new verticals, we may prefer for various reasons to pursue alternative growth strategies, such as entry into markets that are adjacent to the markets in which we currently participate within our existing verticals, or the development of additional products or services for our existing markets.
Even if we choose to enter new verticals, our market validation process does not guarantee our success in any particular vertical. We may be unable to develop a software solution for a new vertical in time to take advantage of the identified market opportunity, and any delay in our time-to-market could expose us to additional competition or other factors that could impede our success. In addition, any software solution we develop for a new vertical may not provide the functionality required by potential customers and, as a result, may not achieve widespread market acceptance within the new vertical. To the extent we choose to enter new verticals, we may invest significant resources to develop and expand the functionality of our software solutions to meet the needs of customers in those verticals, which investments will occur in advance of our realization of revenue from them. If we elect not to enter new verticals in the future, or if we choose to enter new verticals and do so without achieving market acceptance for our software solutions, our reputation could be harmed, our operating results could be adversely affected, and we may be required to reconsider our growth strategy.
In addition, while we expedited our entry into the legal vertical through the acquisition of MyCase in 2012, our practice and case management solution is in an earlier stage of development than APM, our property management solution, and we are in the process of expanding the core functionality and Value+ services associated with our legal software. We face significant competition in the legal market from both vertical software vendors and cloud-based solution providers that offer one or more point solutions. There can be no assurance that we will be able to achieve market acceptance for our legal software at or near the levels achieved by our property management software. The success of our vertical market strategy depends, in part, on our ability to continue to significantly increase the number of our law firm customers and the revenue derived from them, and our failure to achieve these objectives could have an adverse impact on our operating results.
We have a limited operating history and have incurred significant operating losses. As a result of continuing investments across our organization to grow our business, we do not expect to be profitable for the foreseeable future.
We were formed in 2006 and launched our first product, APM, in 2008. We expedited our entry into the legal vertical through the acquisition of MyCase in 2012. As a result, we have a limited operating history and limited experience selling our software solutions, especially within the legal vertical. These and other factors combine to make it more difficult for us to accurately forecast our future operating results, which in turn makes it more difficult for us to prepare accurate budgets and implement strategic plans. We expect that this uncertainty will continue to exist in our business for the foreseeable future, and will be exacerbated to the extent we introduce new functionality, or enter adjacent markets or new verticals.
We have incurred net losses in each fiscal period since our formation. We incurred net losses of $15.7 million, $8.6 million and $7.3 million for the years ended December 31, 2015, 2014 and 2013, respectively. These losses reflect the substantial investments we have made across our organization to develop our software solutions and capitalize on our market opportunity. In order to implement our business strategy, we intend to continue to make substantial investments in, among other things:
▪ | our research and product development organization to enhance the ease of use and functionality of our software solutions by adding new core functionality, Value+ services and other improvements to address the evolving needs |
12
of our customers, as well as to develop new products for adjacent markets and new verticals;
▪ | our customer service organization to deepen our relationships with our customers, assist our customers in achieving success through the use of our software solutions, and promote customer retention; |
▪ | our sales and marketing organization, including expansion of our direct sales organization and marketing programs, to increase the size of our customer base, increase adoption and utilization of Value+ services by our new and existing customers, and enter adjacent markets and new verticals; |
▪ | maintaining and expanding our technology infrastructure and operational support, including data center operations, to promote the security and availability of our software solutions, and support our growth |
▪ | our general and administrative functions, including hiring additional finance, IT, human resources and administrative personnel, to support our growth and assist us in achieving and maintaining compliance with public company reporting and compliance obligations; and |
▪ | the expansion of our existing facilities, including leasing and building out additional office space, to support our growth and strategic expansion. |
As a result of our continuing investments to grow our business in these and other areas, we expect our expenses to increase significantly, and we do not expect to be profitable for the foreseeable future. Even if we are successful in growing our customer base, and increasing revenue from new and existing customers, we may not be able to generate additional revenue in amounts that are sufficient to cover our expenses. We may incur significant losses in a particular period for a number of reasons, and may experience fluctuations in our operating results from period to period, including as a result of the other risks and uncertainties described elsewhere in this Annual Report. We cannot assure you that we will achieve profitability in the near term or that, if we do become profitable, we will sustain profitability over any particular period of time. Any additional operating losses will have a negative impact on our stockholders’ equity.
We manage our business towards the achievement of long-term growth, which may not be consistent with the short-term expectations of some investors, and may cause significant fluctuations in our quarterly results.
We plan to continue to manage our business towards the achievement of long-term growth that we believe will positively impact long-term stockholder value, and not towards the realization of short-term financial or business metrics, or short-term stockholder value. If opportunities arise that might cause us to sacrifice our performance with respect to short-term financial or business metrics, but that we believe are in the best interests of our stockholders, we will take those opportunities.
We focus on growing our customer base by launching new and innovative core functionality and Value+ services to address our customers’ evolving business needs, developing new products for adjacent markets and additional verticals, and improving the experience of our users across our targeted verticals. We prioritize product innovation and user experience over short-term financial or business metrics. We will make product decisions that reduce our short-term operating results if we believe that these decisions are consistent with our strategic objective to achieve long-term growth. These decisions may not be consistent with the short-term expectations of some investors, and may cause significant fluctuations in our operating results from period to period. In addition, notwithstanding our intention to make strategic decisions that positively impact long-term stockholder value, the decisions we make may not produce the long-term benefits we expect.
Our executive officers, directors and principal stockholders control a majority of the combined voting power of our outstanding capital stock. As a result, they are able to exercise significant influence and control over the establishment and implementation of our future business plans and strategic objectives, as well as control all matters submitted to our stockholders for approval. These persons may manage our business in ways with which you disagree and which may be adverse to your interests.
Actual or perceived security vulnerabilities in our software solutions, breaches of our security controls or other unauthorized access to our customers’ data could result in liability or reputational harm to us, or cause us to lose customers, any of which could harm our business and operating results.
In providing our software solutions, we store and transmit large amounts of our customers’ data, including sensitive and proprietary data. Our software solutions are typically the system of record and system of engagement for all or a portion of our customers’ businesses, and the data processed through our software solutions is critical to their businesses. Cyber-attacks and other malicious Internet-based activity continue on a regular basis as evidenced by the recent targeting of a number of media and technology companies. As our business grows, the number of users of our software solutions, as well as the amount of information we store, is increasing, and our brands are becoming more widely recognized. We believe these factors combine to make us an even greater target for this type of malicious activity. Techniques used to sabotage, or to obtain unauthorized access to, systems
13
or networks change frequently and generally are not recognized until launched against a target. Therefore, we may be unable to anticipate these techniques, react in a timely manner, or implement adequate preventive measures which may expose us to a risk of loss, litigation and potential liability. In addition, some of our third-party partners also collect information from transactions with our customers, and these third parties are subject to similar threats of cyber-attacks and other malicious Internet-based activity.
If our security measures, or the security measures of our third-party partners, are breached as a result of negligence, wrongdoing or malicious activity on the part of our employees, our partners’ employees, our customers’ employees, or any third party, or as a result of any error, product defect or otherwise, and this results in the disruption of the confidentiality, availability or integrity of our customers’ data, we could incur liability to our customers and to individuals or organizations whose information was being stored by our customers, as well as fines from payment processing networks, and regulatory action by governmental bodies. If we experience a widespread security breach, we cannot be certain that our insurance coverage will be sufficient to compensate us for liabilities actually incurred or that insurance will continue to be available to us on reasonable terms, or at all. In addition, any breaches of our security controls or other unauthorized access to our customers’ data could result in reputational damage, adversely affect our ability to attract new customers and cause existing customers to reduce or discontinue the use of our software solutions, all of which could harm our business and operating results. Furthermore, the perception by our current or potential customers that our software solutions could be vulnerable to security breaches, even in the absence of a particular problem or threat, could reduce market acceptance of our software solutions and cause us to lose customers.
Service outages and other performance problems associated with our technology infrastructure could harm our reputation, adversely affect our ability to attract new customers and cause us to lose existing customers.
We have experienced significant growth in the number of users and the amount of data that our technology infrastructure supports, and we expect this growth to continue. We seek to maintain sufficient excess capacity in our technology infrastructure to meet the needs of all of our customers, including to facilitate the expansion of existing customer deployments and the provisioning of new customer deployments. In addition, we need to properly manage our technology infrastructure in order to support version control, changes in hardware and software parameters, and the evolution of our software solutions. However, the provision of new hosting infrastructure requires significant lead-time.
We have experienced, and may in the future experience, website disruptions, service outages and other performance problems with our technology infrastructure. These problems may be caused by a variety of factors, including infrastructure changes, power or network outages, fire, flood or other natural disasters affecting our data centers, human or software errors, viruses, security breaches, fraud or other malicious activity, spikes in customer usage and denial of service issues. In some instances, we may not be able to identify the cause or causes of these service outages and performance problems within an acceptable period of time. If our technology infrastructure fails to keep pace with the increased number of users and amount of data, or if we are unable to avoid service outages and performance problems, or to resolve them quickly, it could adversely affect our ability to attract new customers, result in the loss of existing customers and harm our reputation, all of which could adversely affect our business and operating results.
Errors, defects or other disruptions in our software solutions could harm our reputation, cause us to lose customers, and result in significant expenditures to correct the problem.
Our customers use our software solutions to manage critical aspects of their businesses, and any errors, defects or other disruptions in the performance of our software solutions may result in loss of or damage to our customers’ data and disruption to our customers’ businesses, which could harm our reputation. We provide continuous updates to our software solutions and, while our software updates undergo extensive testing prior to their release, these updates may contain undetected errors when first introduced. In the past, we have discovered errors, failures, vulnerabilities and bugs in our software updates after they have been released, and similar problems may arise in the future. Real or perceived errors, failures, vulnerabilities or bugs in our software solutions could result in negative publicity, reputational harm loss of customers, delay in market acceptance of our software solutions, loss of competitive position, withholding or delay of payment to us, claims by customers for losses sustained by them and potential litigation. In any such event, we may be required to expend additional resources in order to help correct the problem or, in order to address customer service or reputational concerns, we may choose to expend additional resources to take corrective action even where not required. The costs incurred in correcting any material errors, defects or other disruptions could be substantial and there may not be any corresponding increase in revenue to offset these costs. In addition, we may not carry insurance sufficient to compensate us for any losses that may result from claims arising from errors, defects or other disruptions in our software solutions.
We face a number of risks in our payment processing business that could adversely affect our business or operating results.
In connection with our electronic payment services, we process payments and subsequently submit these payments to our customers after varying clearing times established by us. These payments are settled through our sponsoring clearing bank
14
and, in the case of electronic funds transfers, or EFT, through our Originating Depository Financial Institutions, or ODFIs, pursuant to agreements with one or more national banking institutions that we may contract with from time to time. Our electronic payment services subject us to a number of risks, including, but not limited to:
▪ | liability for customer costs related to disputed or fraudulent transactions if those costs exceed the amount of the customer reserves we have during the clearing period or after payments have been settled to our customers; |
▪ | electronic processing limits on the amounts that any single ODFI, or collectively all of our ODFIs, will underwrite; |
▪ | reliance on sponsoring clearing banks, card payment processors and other electronic payment partners to process electronic transactions; |
▪ | failure by us, our partners or our customers to adhere to applicable laws, regulations and standards that may legally or contractually apply to the provision of electronic payment services; |
▪ | continually evolving and developing laws and regulations governing money transmission and anti-money laundering, the application or interpretation of which is not clear in some jurisdictions; |
▪ | incidences of fraud, a security breach, an error, defect, failure, vulnerability or bug in our electronic payments platform, or our failure to comply with required external audit standards; and |
▪ | our inability to increase our fees at times when our electronic payment partners increase their transaction processing fees. |
If any of these risks related to our electronic payment services were to materialize, our business or operating results could be negatively affected. Although we attempt to structure and adapt our electronic payment services to comply with complex and evolving laws, regulations and standards, our underwriting efforts do not guarantee compliance. In the event that we are found to be in violation of our legal or contractual requirements, we may be subject to monetary fines or penalties, cease and desist orders, mandatory product changes, or other liabilities that could have an adverse effect on our operating results.
Additionally, with respect to the processing of EFTs, we are exposed to financial risk. EFTs between our customer and another user may be returned for various reasons such as insufficient funds or stop payment orders. These returns are charged back to the customer by us. However, if we or our sponsoring clearing bank is unable to collect such amounts from the customer’s account (such as if the customer is illegitimate, or if the customer refuses or is unable to reimburse us for the amounts charged back), we bear the risk of loss for the amount of the transfer. While we have not experienced material losses resulting from amounts charged back in the past, there can be no assurance that we will not experience these types of significant losses in the future.
Evolution and expansion of our electronic payment services may subject us to additional risks and regulatory requirements.
The evolution and expansion of our electronic payment services may subject us to additional risks and regulatory requirements, including laws and regulations governing money transmission and anti-money laundering. These requirements vary throughout the markets in which we operate, and several jurisdictions lack clarity in the application and interpretation of these rules. Our efforts to comply with these rules could require significant management time and effort, as well as significant expenditures, and will not guarantee our compliance with all regulatory requirements, especially given that the applicable regulatory frameworks are constantly changing and subject to evolving interpretation. While we maintain a compliance program focused on applicable laws and regulations throughout our applicable industries, there is no guarantee that we will not be subject to fines, penalties or other regulatory actions in one or more jurisdictions, or be required to adjust our business practices to accommodate future regulatory requirements.
Our quarterly results may fluctuate significantly and period-to-period comparisons of our results may not be meaningful.
Our quarterly results, including the levels of our revenue, costs and operating expenses, and operating margins, may fluctuate significantly in the future, and period-to-period comparisons of our results may not be meaningful. Accordingly, the results of any one quarter should not be relied upon as an indication of our future performance. In addition, our quarterly results may not fully reflect the underlying performance of our business.
Factors that may cause fluctuations in our quarterly results include, but are not limited to:
▪ | our ability to retain our existing customers, and to expand adoption and utilization of our core solutions and Value+ services by our existing customers; |
▪ | our ability to attract new customers, the type of customers we are able to attract, the size and needs of their businesses, and the cost of acquiring these customers; |
15
▪ | the mix of our core solutions and Value+ services sold during the period; |
▪ | the timing and impact of security breaches, service outages or other performance problems with our technology infrastructure and software solutions; |
▪ | variations in the timing of sales of our core solutions and Value+ services as a result of trends impacting the verticals in which we sell our software solutions; |
▪ | the timing and market acceptance of new core functionality, Value+ services and other products introduced by us and our competitors; |
▪ | changes in our pricing policies or those of our competitors; |
▪ | the timing of our recognition of revenue; |
▪ | our ability to convert customers who start their accounts on a free trial into paying subscribers; |
▪ | the amount and timing of costs and operating expenses related to the maintenance and expansion of our business, infrastructure and operations; |
▪ | the amount and timing of costs and operating expenses associated with assessing or entering adjacent markets or new verticals; |
▪ | the amount and timing of costs and operating expenses related to the development or acquisition of businesses, services, technologies or intellectual property rights, and potential future charges for impairment of goodwill from these acquisitions; |
▪ | the timing and costs associated with legal or regulatory actions; |
▪ | changes in the competitive dynamics of our industry, including consolidation among competitors, strategic partners or customers; |
▪ | loss of our executive officers or other key employees; |
▪ | industry conditions and trends that are specific to the verticals in which we sell or intend to sell our software solutions; and |
▪ | general economic and market conditions. |
Fluctuations in quarterly results may negatively impact the value of our Class A common stock, regardless of whether they impact or reflect the overall performance of our business. If our quarterly results fall below the expectations of investors or any securities analysts who follow our stock, or below any guidance we may provide, the price of our Class A common stock could decline substantially.
Business management software for SMBs is a relatively new and developing market and, if the market is smaller than we estimate or develops more slowly than we expect, our operating results could be adversely affected.
We currently provide cloud-based business management software for SMBs in the property management and legal industries and, as part of our business strategy, we will assess entry into new verticals. While the overall market for cloud-based business management software is rapidly growing, it is not as mature as the market for legacy on-premise software applications. In addition, when compared to larger enterprises, SMBs have not historically purchased enterprise resource planning or other enterprise-wide software systems to manage their businesses due to the cost and complexity of implementing such systems, which generally did not address their industry-specific needs. Furthermore, a number of widely adopted cloud-based solutions have not traditionally targeted SMBs. As a result, many SMBs still run their businesses using manual processes and disparate software systems that are not web-optimized, while others may have invested substantial resources to integrate a variety of point solutions into their organizations to address one or more specific business needs and, therefore, may be reluctant to migrate to a vertical cloud-based solution designed to apply to their entire business. Because we derive, and expect to continue to derive, substantially all of our revenue from sales of our cloud-based business management software to SMBs in our targeted verticals, our success will depend, to a substantial extent, on the widespread adoption by SMBs in these verticals of cloud computing in general and of cloud-based business management software in particular.
The market for industry-specific, cloud-based business management software for SMBs, both generally, and specifically within the property management and legal industries, is evolving and, in comparison to the overall market for cloud-based solutions,
16
is relatively small. The continued expansion of this market depends on numerous factors, including:
▪ | the cost and perceived value associated with cloud-based business management software relative to on-premise software applications and disparate point solutions; |
▪ | the ability of cloud-based solution providers to offer SMBs the functionality they need to operate and grow their businesses; |
▪ | the willingness of SMBs to transition from their existing software systems, or otherwise alter their existing businesses practices, to migrate their businesses to a vertical cloud-based business management software solution; and |
▪ | the ability of cloud-based solution providers to address security, privacy, availability and other concerns. |
If cloud-based business management software does not achieve widespread market acceptance among SMBs, our revenue may increase at a slower rate than we expect and may even decline, which could adversely affect our operating results. In addition, it is difficult to estimate the rate at which SMBs will be willing to transition to vertical cloud-based business management software in any particular period, which makes it difficult to estimate the overall size and growth rate of the market for cloud-based business management software for SMBs at any given point in time or to forecast growth in our revenue or market share.
Our estimates of market opportunity are subject to significant uncertainty and, even if the markets in which we compete meet or exceed our size estimates, we could fail to increase our revenue or market share.
Market opportunity estimates are subject to significant uncertainty and are based on assumptions and estimates, including our internal analysis and industry experience. Assessing the market for industry-specific, cloud-based business management software for SMBs is particularly difficult due to a number of factors, including limited available information and rapid evolution of the market. If we had made different assumptions or estimates, our estimates of market opportunity could be materially different.
In addition, even if the markets in which we compete meet or exceed our size estimates, our business could fail to grow in line with our forecasts, or at all, and we could fail to increase our revenue or market share. Our growth, and our ability to serve a significant portion of our target markets, will depend on many factors, including our success in executing our business strategy, which is subject to many risks and uncertainties, including the other risks and uncertainties described elsewhere in this Annual Report.
If we are unable to introduce successful enhancements, including new and innovative core functionality and Value+ services for our existing markets and verticals, or new products for adjacent markets or additional verticals, our operating results could be adversely affected.
The software industry in general, and in our targeted verticals in particular, is characterized by rapid technological advances, changing industry standards, evolving customer requirements and intense competition. Our ability to attract new customers, increase revenue from our existing customers, and expand into adjacent markets or new verticals depends, in part, on our ability to enhance the functionality of our existing software solutions by introducing new and innovative core functionality and Value+ services that keep pace with technological developments, and provide functionality that addresses the evolving business needs of our customers. In addition, our growth over the long term depends, in part, on our ability to introduce new products for adjacent markets and additional verticals that we identify through our market validation process. Market acceptance of our current and future software solutions will depend on numerous factors, including:
▪ | the unique functionality of our software solutions and the extent to which our software solutions meet the business needs of our customers; |
▪ | the perceived benefits and security of our cloud-based business management software solutions relative to on-premise software applications or other competitive products; |
▪ | the pricing of our software solutions relative to competitive products; |
▪ | perceptions about the security, privacy and availability of our software solutions relative to competitive products; |
▪ | time-to-market of the updates and enhancements to our core functionality, Value+ services and new products; and |
▪ | perceptions about the quality and responsiveness of our customer service organization. |
If we are unable to successfully enhance the functionality of our existing software solutions, including our core solutions and Value+ services, and develop new products that gain market acceptance in adjacent markets and additional verticals, our
17
revenue may increase at a slower rate than we expect and may even decline, which could adversely affect our operating results.
Our business depends substantially on existing customers renewing their subscriptions with us and expanding their use of our Value+ services, and a decline in customer renewal rates, or failure to convince existing customers to adopt and utilize our Value+ services, could adversely impact our operating results.
In order for us to maintain or increase our revenue and improve our operating results, it is important that our existing customers continue to pay subscription fees for the use of our core solutions, as well as increase their adoption and utilization of our Value+ services. Our customers have no obligation to renew their subscriptions with us upon expiration of their subscription periods, which range from one month to one year. We cannot assure you that our customers will renew their subscriptions with us. In addition, our customers that start their accounts using a 30-day free trial have no obligation to begin a paid subscription. Furthermore, although a significant portion of our revenue growth has historically resulted from the adoption and utilization of our Value+ services by our existing customers, we cannot assure you that our existing customers will continue to broaden their adoption and utilization of our Value+ services, or use our Value+ services at all. If our existing customers do not renew their subscriptions and increase their adoption and utilization of our existing or newly developed Value+ services, our revenue may increase at a slower rate than we expect and may even decline, which could adversely impact our operating results.
Word-of-mouth referrals represent a significant source of new customers for us and provide us with an opportunity to cost-effectively market and sell our software solutions. The loss of our existing customers, could have a significant impact on our reputation in our targeted verticals and our ability to acquire new customers cost-effectively. A reduction in the number of our existing customers, even if offset by an increase in new customers, could have the impact of reducing our revenue and operating margins.
In an effort to retain our customers and to expand our customers’ adoption and utilization of our Value+ services, we may choose to use increasingly costly sales and marketing efforts. In addition, we may make significant investments in research and product development to introduce Value+ services that ultimately are not broadly adopted by our customers. In either of those cases, we could incur significantly increased costs without a corresponding increase in revenue. Furthermore, we may fail to identify Value+ services that our customers need for their businesses, in which case we could miss opportunities to increase our revenue.
We expect to continue to derive a significant portion of our revenue from our property manager customers, and factors resulting in a loss of these customers could adversely affect our operating results.
Historically, more than 90% of our revenue has been derived from APM, our property management solution, and we expect that our property manager customers will continue to account for a significant portion of our revenue for the foreseeable future. The businesses of our property manager customers are typically significantly larger than those of our law firm customers. In addition, our property management solution has been available for longer, is more established within its vertical with a larger customer base, and currently offers a greater number of Value+ services. We could lose property manager customers as a result of numerous factors, including:
▪ | the expiration or termination of subscription agreements; |
▪ | the introduction of competitive products or technologies; |
▪ | changes in pricing policies by us or our competitors; |
▪ | acquisitions or consolidations within the property management industry; |
▪ | bankruptcies or other financial difficulties facing our customers; and |
▪ | conditions or trends that are specific to the property management industry such as the economic factors that impact the rental market. |
The loss of a significant number of our property manager customers, or the loss of even a small number of our larger property manager customers, could cause our revenue to increase at a slower rate than we expect or even decline. In addition, even if we are able to retain our property manager customers, we may be unable to grow revenue from these property manager customers by increasing their adoption and utilization of our Value+ services. Furthermore, even if we continue to experience significant growth in our customer base within the legal vertical, it may be insufficient to offset slower growth or a decline in the property management business. Any of these outcomes could adversely affect our operating results.
18
Our growth depends in part on the success of our strategic relationships with third parties and if we are unsuccessful in establishing or maintaining these relationships, our ability to compete in the market place or grow our revenue could be impaired.
In order to grow our business, we anticipate that we will continue to depend on our relationships with third parties, including our data center operators, electronic payment partners and other third parties that support delivery of our software solutions. Identifying partners, negotiating agreements and maintaining relationships requires significant time and resources. Our competitors may be more effective than us in cost-effectively building relationships with third parties that enhance their products and services, allow them to provide more competitive pricing, or offer other benefits to their customers. In addition, acquisitions of our partners by our competitors could result in a decrease in the number of current and potential strategic partners willing to establish or maintain relationships with us, and could increase the price at which products or services are available to us. If we are unsuccessful in establishing or maintaining our relationships with third parties, our ability to compete in the marketplace or to grow our revenue could be impaired, which could negatively impact our operating results. Even if we are successful, we cannot assure you that these relationships will result in increased customer adoption and usage of our software solutions or improved operating results. Furthermore, if our partners fail to perform as expected, we may be subjected to litigation, our reputation may be harmed, and our business and operating results could be adversely affected.
We depend on data centers and computing infrastructure operated by third parties and any disruption in these operations could adversely affect our operating results.
We currently serve our customers through a combination of our own servers located in third-party data center facilities, and servers and data centers operated by Amazon. While we control and have access to our own servers and the other components of our network that are located in our third-party data centers, we do not control the operation of any of these third-party data center facilities. The owners of our data center facilities have no obligation to renew their agreements with us on commercially reasonable terms, or at all. If we are unable to renew these agreements on commercially reasonable terms, or if one of our third-party data center operators is acquired, we may be required to transfer our servers and other infrastructure to new data center facilities, and we may incur significant costs and possible service interruptions in connection with doing so.
Problems faced by our third-party data center operators, or with any of the service providers with whom we or they contract, could adversely affect the experience of our customers. Our third-party data center operators could decide to close their facilities without adequate notice. In addition, any financial difficulties, such as bankruptcy, faced by our third-party data center operators, or any of the service providers with whom we or they contract, may have negative effects on our business. Additionally, if our data centers are unable to keep up with our growing needs for capacity or any spikes in customer demand, it could have an adverse effect on our business. Any changes in third-party service levels at our data centers could result in loss of or damage to our customers’ stored information and service interruptions, which could hurt our reputation. These issues could also cause us to lose customers, harm our ability to attract new customers, and subject us to potential liability, any of which could adversely affect our operating results.
Our systems are not fully redundant, and we have not yet implemented a complete disaster recovery plan or business continuity plan. Although the redundancies we do have in place will permit us to respond, at least to some degree, to service outages, our third-party data centers are vulnerable in the event of failure. We do not yet have adequate structure or systems in place to recover from a data center’s severe impairment or total destruction, and recovery from the total destruction or severe impairment of any of our third-party data centers could be difficult and may not be possible at all.
We use third-party service providers for important payment processing and reporting functions and their failure to fulfill their contractual obligations could harm our reputation, disrupt our business and adversely affect our operating results.
We use payment processing organizations and other service providers to enable us to provide electronic payment services to our customers, including EFT, and access to various reporting tools, such as background and credit checks. As a result, we have significantly less control over these payment processing and reporting functions than if we were to maintain and operate them ourselves. In some cases, functions necessary to our business are performed on proprietary third-party systems and software to which we have no access. We also generally do not have long-term contracts with these organizations and service providers. In addition, some of these organizations and service providers compete with us by directly or indirectly selling payment processing or reporting services to customers. The failure of these organizations and service providers to renew their contracts with us or to fulfill their contractual obligations could harm our reputation, result in significant disruptions to our business, and adversely affect our operating results.
19
Our platform must integrate with a variety of devices, operating systems and browsers that are developed by others, and if we are unable to ensure that our software solutions interoperate with such devices, operating systems and browsers, our software solutions may become less competitive, and our operating results may be harmed.
We offer our software solutions across a variety of operating systems and through the Internet. We are dependent on the interoperability of our platform with third-party devices, desktop and mobile operating systems, as well as web browsers that we do not control. Any changes in such devices, systems or web browsers that degrade the functionality of our software solutions or give preferential treatment to competitive services could adversely affect adoption and usage of our software solutions. In addition, in order to deliver high quality software solutions, we will need to continuously enhance and modify our functionality to keep pace with changes in Internet-related hardware, mobile operating systems such as iOS and Android, browsers and other software, communication, network and database technologies. We may not be successful in developing enhancements and modifications that operate effectively with these devices, operating systems, web browsers and other technologies or in bringing them to market in a timely manner. Furthermore, uncertainties regarding the timing or nature of new network platforms or technologies, and modifications to existing platforms or technologies, could increase our research and product development expense. In the event that it is difficult for our customers to access and use our software solutions, our software solutions may become less competitive, and our operating results could be adversely affected.
The markets in which we participate are intensely competitive and, if we do not compete effectively, our business could be harmed.
The overall market for business management software is global, highly competitive and continually evolving in response to a number of factors, including changes in technology, operational requirements, and laws and regulations. Although earlier in its development, the market for cloud-based business management software is also highly competitive and subject to similar market factors.
While we focus on providing industry-specific, cloud-based business management software solutions to SMBs in our targeted verticals, we compete with other vertical cloud-based solution providers that serve companies of all sizes, as well as with horizontal cloud-based solution providers that provide broad cloud-based solutions across multiple verticals. Our competitors include established vertical software vendors, as well as newer entrants in the market. We also face competition from numerous cloud-based solution providers that focus almost exclusively on one or more point solutions. Continued consolidation among cloud-based providers could lead to significantly increased competition.
Although the domain expertise required to successfully develop, market and sell cloud-based business management software solutions in the property management and legal verticals may hinder new entrants that are unable to invest the necessary resources to develop and deploy cloud-based solutions with the same level of functionality as ours, many of our competitors and potential competitors are larger and have greater name recognition, longer operating histories, and significantly greater resources than we do. As a result, our competitors may be able to respond more quickly and effectively to new or changing opportunities, technologies, operational requirements and industry standards. Some of these competitors may have more established customer relationships or strategic partnerships with third parties that enhance their products and services. Other competitors may offer products or services that address one or a number of business functions on a standalone basis at lower prices or bundled as part of a broader product sale, or with greater depth than our software solutions. In addition, our current and potential competitors may develop, market and sell new technologies with comparable functionality to our software solutions, which could cause us to lose customers, slow the rate of growth of new customers and cause us to decrease our prices in order to remain competitive. For all of these reasons, we may not be able to compete effectively against our current and future competitors, which could harm our business.
Pricing pressure may cause us to change our pricing model, which could hurt our renewal rates and our ability to attract new customers, which could adversely affect our operating results.
As the markets for our existing software solutions mature, or as current and future competitors introduce new products or services that compete with ours, we may experience pricing pressure and be unable to renew our subscription agreements with existing customers or attract new customers at prices that are consistent with our current pricing model and operating budget. If this were to occur, it is possible that we would have to change our pricing model, offer pricing incentives, or generally reduce our prices. In addition, our customers are SMBs, which are typically more price sensitive than larger enterprises. Changes to our pricing model could harm our customer retention rates and our ability to attract new customers, which could adversely affect our operating results.
If we lose key members of our management team, our business may be harmed.
Our success and future growth depend, in part, upon the continued services of our executive officers and other key employees. From time to time, there may be changes in our executive officers or other key employees resulting from the hiring
20
or departure of these personnel, which may disrupt our business. Our executive officers and other key employees are generally employed on an at-will basis, which means that these personnel could terminate their employment with us at any time. Additionally, the equity awards held by many of our executive officers and other key employees are close to fully vested, and these employees may not have sufficient financial incentive to stay with us. The loss of one or more of our executive officers or other key employees, or the failure by our executive team to work effectively with our employees and lead our company, could have an adverse effect on our business.
Our corporate culture has contributed to our success and, if we cannot maintain this culture as we grow, we could lose the passion, creativity, teamwork, focus and innovation fostered by our culture.
We believe that our culture has been and will continue to be a key contributor to our success. If we do not continue to develop our corporate culture or maintain our core values as we grow and evolve, we may be unable to foster the passion, creativity, teamwork, focus and innovation we believe we need to support our growth. Any failure to preserve our culture could negatively affect our ability to recruit and retain personnel and to effectively focus on and pursue our strategic objectives. Moreover, liquidity available to our employee security holders could lead to disparities of wealth among our employees, which could adversely impact relations among employees and our culture in general. As we grow and mature as a public company, we may find it difficult to maintain our corporate culture.
We expect to experience rapid growth and, if we fail to manage our growth effectively, it could adversely affect our operating results and preclude us from achieving our strategic objectives.
We have experienced significant growth since our formation in 2006, and we anticipate that we will continue to experience growth and expansion of our operations. For example, since our incorporation, we have significantly increased the number of employees across our organization, introduced new Value+ services, and entered a new vertical with the acquisition of MyCase. This growth in the size, complexity and diversity of our business has placed, and we expect that our growth will continue to place, a significant strain on our management, administrative, operational and financial resources, as well as our company culture. Our future success will depend, in part, on our ability to manage this growth effectively. To manage the expected growth of our operations and personnel, we will need to continue to develop and improve our operational and financial controls and our reporting systems and procedures, and to nurture and build on our company culture. Failure to effectively manage growth could adversely impact our business, including by resulting in errors or delays in deploying new core functionality to our customers, delays or difficulties in introducing new Value+ services or other products, declines in the quality or responsiveness of our customer service organization, increases in costs and operating expenses, and other operational difficulties. If any of these risks actually occurs, it could harm our reputation, adversely affect our operating results, and preclude us from achieving our strategic objectives.
We depend on highly skilled personnel and, if we are unable to retain or hire additional qualified personnel, we may not be able to achieve our strategic objectives.
To execute our growth plan and achieve our strategic objectives, we must continue to attract and retain highly qualified and motivated personnel across our organization. In particular, in order to continue to enhance our software solutions, add new and innovative core functionality and Value+ services, as well as develop new products, it will be critical for us to increase the size of our research and product development organization, including hiring highly skilled engineers with experience in designing, developing and testing cloud-based software solutions. Competition for software engineers is intense within our industry and there continues to be upward pressure on the compensation paid to these professionals. In addition, in order for us to achieve broader market acceptance of our software solutions, grow our customer base, and pursue adjacent markets and new verticals, we will need to continue to significantly increase the size of our sales and marketing organization. Identifying and recruiting qualified sales personnel and training them in the use of our platform requires significant time and expense, and it can be particularly difficult to retain these personnel.
Many of the companies with which we compete for experienced personnel have greater name recognition and financial resources than we have. If we hire employees from competitors or other companies, their former employers may attempt to assert that we or these employees have breached their legal obligations, resulting in a diversion of our time and resources. In addition, our headquarters are located in Santa Barbara, California, which is not generally recognized as a prominent commercial center, and it is challenging to attract qualified professionals due to our geographic location. As a result, we may have difficulty hiring and retaining suitably skilled personnel with the qualifications and motivation to expand our business. If we are unable to attract and retain the personnel necessary to execute our growth plan, we may be unable to achieve our strategic objectives and our operating results may suffer.
In addition, prospective and existing employees often consider the value of the equity awards they receive in connection with their employment. If the perceived value of our equity awards declines, or if the price of our Class A common stock experiences significant volatility, it may adversely affect our ability to recruit and retain highly skilled employees. If we fail to attract new personnel or to retain and motivate our current personnel, we may not be able to achieve our strategic objectives.
21
We have acquired, and may in the future acquire, other companies or technologies, which could divert our management’s attention, result in additional dilution to our stockholders and otherwise disrupt our operations.
We have acquired, and may in the future acquire, other companies or technologies to complement or expand our software solutions, optimize our technical capabilities, enhance our ability to compete in our targeted verticals, provide an opportunity to expand into an adjacent market or new vertical, or otherwise offer growth or strategic opportunities. For example, in 2012, we acquired MyCase and, in April 2015, we acquired RentLinx. The pursuit of acquisitions may divert the attention of management and cause us to incur various expenses in identifying, investigating and pursuing suitable acquisitions, whether or not they are consummated.
We have limited experience acquiring other businesses. We may not be able to integrate acquired assets, technologies, personnel and operations successfully or achieve the anticipated synergies or other benefits from the acquired business due to a number of risks associated with acquisitions, including:
▪ | incurrence of acquisition-related costs; |
▪ | difficulties integrating the assets, technologies, personnel or operations of the acquired business in a cost-effective manner, or inability to do so; |
▪ | difficulties and additional expenses associated with supporting legacy products and services of the acquired business; |
▪ | difficulties converting the customers of the acquired business to our software solutions and contract terms; |
▪ | diversion of management’s attention from our business to address acquisition and integration challenges; |
▪ | adverse effects on our existing business relationships with customers and strategic partners as a result of the acquisition; |
▪ | cultural challenges associated with integrating employees from the acquired organization into our company; |
▪ | the loss of key employees; |
▪ | use of resources that are needed in other parts of our business; |
▪ | use of substantial portions of our available cash to consummate the acquisition; and |
▪ | unanticipated costs or liabilities associated with the acquisition. |
If an acquired business fails to meet our expectations in terms of its contribution to our overall business strategy, or if the costs of acquiring or integrating the acquired business exceed our estimates, our business, operating results and financial condition may suffer. In addition, acquisitions could also result in dilutive issuances of equity securities or the incurrence of debt, which could impose restrictions on our ability to operate our business and adversely affect our operating results. Furthermore, a significant portion of the purchase price of companies we may acquire could be allocated to goodwill and other intangible assets, which must be assessed for impairment. In the future, if our acquisitions do not yield expected returns, we may be required to take charges to our operating results based on this impairment assessment process, which could adversely affect our operating results.
If our property manager customers stop requiring residents to provide proof of tenant liability insurance, if insurance premiums decline or if the insureds experience greater than expected losses, our operating results could be harmed.
We generate revenue by offering tenant liability insurance through a wholly owned subsidiary. Some of our property manager customers require residents to provide proof of tenant liability insurance and offer to enroll residents in their tenant liability insurance policy as additional insureds. If demand for rental housing declines, or if our property manager customers believe that it may decline, these customers may reduce their rental rates and stop requiring residents to provide proof of tenant liability insurance in order to reduce the overall cost of renting and make their rental offerings more competitive. If our property manager customers stop requiring residents to provide proof of tenant liability insurance or elect to enroll residents in insurance programs offered by competing providers, or if insurance premiums otherwise decline, our revenues from insurance services could be adversely affected.
Additionally, our tenant liability insurance policies are underwritten by us, and we are required by our insurance partner to maintain a reserve to cover potential claims under the policies. While our policies have a limit of $100,000 per occurrence, there is no limit on the dollar amount of claims that could be made against us in any particular period or in the aggregate. In the event that claims by the insureds increase unexpectedly, our reserve may not be sufficient to cover our resultant liability under the policies. To the extent we are required to pay out amounts to insureds that are significantly higher than our current reserves, it
22
could have a material adverse effect on our operating results.
Our tenant liability insurance business is subject to state governmental regulation, which could limit the growth of our insurance business and impose additional costs on us.
Our wholly owned subsidiary holds a license from the State of Hawaii Insurance Division of the Department of Commerce and Consumer Affairs and our third-party service providers maintain licenses with a number of other individual state departments of insurance. Collectively, we are subject to state governmental regulation and supervision in connection with the operation of our tenant liability insurance business. This state governmental supervision could limit the growth of our insurance business by increasing the costs of regulatory compliance, limiting or restricting the products or services we provide or the methods by which we provide them, and subjecting us to the possibility of regulatory actions or proceedings. Our continued ability to maintain these insurance licenses in the jurisdictions in which we are licensed depends on our compliance with the rules and regulations promulgated from time to time by the regulatory authorities in each of these jurisdictions. Furthermore, state insurance departments conduct periodic examinations, audits and investigations of the affairs of insurance companies, any of which could result in the expenditure of significant management time or financial resources.
In all jurisdictions, the applicable laws and regulations are subject to amendment or interpretation by regulatory authorities. Generally, such authorities are vested with relatively broad discretion to grant, renew and revoke licenses and approvals and to implement and interpret rules and regulations. Accordingly, we may be precluded or temporarily suspended from carrying on some or all of the activities of our insurance business or otherwise be fined or penalized in a given jurisdiction. No assurances can be given that our insurance business can continue to be conducted in any given jurisdiction as it has been conducted in the past or that we will be able to expand our insurance business in the future.
All of our revenues are generated by sales to customers in our targeted verticals, and factors that adversely affect the applicable industry could also adversely affect us.
Currently, all of our sales are to customers in the property management and legal industries. Demand for our software solutions could be affected by factors that are unique to and adversely affect our targeted verticals. In particular, the property management and legal industries are highly regulated, subject to intense competition and impacted by changes in general economic and market conditions. For example, changes in applicable laws and regulations could significantly impact the software functionality demanded by our customers and require us to expend significant resources to ensure our software solutions continue to meet their evolving needs. In addition, other industry-specific factors, such as industry consolidation or the introduction of competing technology, could lead to a significant reduction in the number of customers that use our software solutions within a particular vertical or the Value+ services demanded by these customers. Further, if the rental housing or legal markets decline, our customers may decide not to renew their subscriptions or they may cease using our Value+ services in order to reduce costs to remain competitive. As a result, our ability to generate revenue from our property manager and law firm customers could be adversely affected by specific factors that affect the property management or legal industries.
Our software solutions address functions within the heavily regulated property management and legal industries, and our customers’ failure to comply with applicable laws and regulations could subject us to litigation.
We sell our software solutions to customers within the property management and legal industries. Our customers use our software solutions for business activities that are subject to a number of laws and regulations, including state and local real property laws and legal ethics rules. Any failure by our customers to comply with laws and regulations applicable to their businesses, could result in fines, penalties or claims for substantial damages against our customers. To the extent our customers believe that our software solutions or our customer service organization caused or contributed to such failures, our customers may make claims for damages against us, regardless of whether we are responsible for the failure. As a result, we may be subject to lawsuits that, even if unsuccessful, could divert our resources and our management’s attention and adversely affect our business, and our insurance coverage may not be sufficient to cover such claims against us.
If we are unable to deliver effective customer service, it could harm our relationships with our existing customers and adversely affect our ability to attract new customers.
Our business depends, in part, on our ability to satisfy our customers, both by providing software solutions that address their business needs, and by providing on-boarding services and ongoing customer service, which contributes to retaining customers and increasing adoption and utilization of our Value+ services by our existing customers. Once our software solutions are deployed, our customers depend on our customer service organization to resolve technical issues relating to their use of our solutions. We may be unable to respond quickly to accommodate short-term increases in customer demand for support services or may otherwise encounter a customer issue that is difficult to resolve. If a customer is not satisfied with the quality or responsiveness of our customer service, we could incur additional costs to address the situation. As we do not separately charge our customers for support services, increased demand for our support services would increase costs without corresponding revenue, which could adversely
23
affect our operating results. In addition, regardless of the quality or responsiveness of our customer service efforts, a customer that is not satisfied with an outcome may choose to terminate, or to not renew, their relationship with us.
Our sales process is highly dependent on the ease of use of our software solutions, our reputation and positive recommendations from our existing customers. Any failure to maintain high-quality or responsive customer service, or a market perception that we do not maintain high-quality or responsive customer service, could harm our reputation, cause us to lose customers and adversely impact our ability to sell our software solutions to prospective customers.
If we are unable to maintain and promote our brands, or to do so in a cost-effective manner, our ability to maintain and expand our customer base will be impaired, and our operating results could be adversely affected.
We believe that maintaining and promoting our brands is critical to achieving widespread awareness and acceptance of our software solutions, and maintaining and expanding our customer base. We also believe that the importance of brand recognition will increase as competition in our targeted verticals increases. If we do not continue to build awareness of our brands, we could be placed at a competitive disadvantage as compared to companies whose brands are, or become, more recognizable than ours. Maintaining and promoting our brands will depend, in part, on our ability to continue to provide new and innovative core functionality and Value+ services and best-in-class customer service, as well as the effectiveness of our sales and marketing efforts. If we fail to deliver products and functionality that address our customers’ business needs, or if we fail to meet our customers’ expectations for customer service, it could weaken our brands and harm our reputation. Additionally, the actions of third parties may affect our brands and reputation if customers do not have a positive experience using the services of our third-party partners that support our software solutions. Maintaining and enhancing our brands may require us to make substantial investments, and these investments may not result in commensurate increases in our revenue. If we fail to successfully maintain and promote our brands, or if make investments that are not offset by increased revenue, our operating results could be adversely affected.
If we are unable to increase sales of our software solutions to larger customers while mitigating the risks associated with serving such customers, our business and operating results may suffer.
While we plan to continue to market and sell our software solutions to SMBs, our growth strategy is dependent, in part, upon increasing sales of our software solutions to larger customers within the SMB market. Sales to larger customers may involve risks that are not present, or are present to a lesser extent, in sales to smaller businesses. As we seek to increase our sales to larger customers, we may invest considerably greater amounts of time and financial resources in our sales and marketing efforts. In addition, we may face longer sales cycles and experience less predictability and greater competition in completing some of our sales than we have in selling our software solutions to smaller businesses. Although we generally have not configured our software solutions or negotiated our pricing for specific customers, which has historically resulted in reduced upfront selling costs, our ability to successfully sell our software solutions to larger customers may be dependent, in part, on our ability to develop functionality, or to implement pricing policies, that are unique to particular customers. It may also be dependent on our ability to attract and retain sales personnel with experience selling to larger organizations. Also, because security breaches or other performance problems with respect to larger customers may result in greater economic harm to these customers and more adverse publicity, there is increased financial and reputational risk associated with serving such customers. If we are unable to increase sales of our software solutions to larger customers, while mitigating the risks associated with serving such customers, our business and operating results may suffer.
Because we recognize revenue from subscriptions for our software solutions over the terms of the subscription agreements, downturns or upturns in new business may not be immediately reflected in our operating results.
We recognize revenue from customers ratably over the terms of their subscription agreements, which range from one month to one year. As a result, some of the revenue we report in each period is derived from the recognition of deferred revenue relating to subscription agreements entered into during previous periods. Consequently, a decline in new or renewed subscriptions in any one period may not be reflected in our revenue results for that period. However, any such decline will negatively affect our revenue in future quarters. Our subscription model also makes it difficult for us to rapidly increase our revenue through additional sales in any period, as revenue from new customers must be recognized over the applicable subscription period. Accordingly, the effect of downturns or upturns in our sales and the market acceptance of our software solutions, and potential changes in our customer retention rates, may not be apparent in our operating results until future periods.
24
Because our invoicing is generally for periods less than one year, we do not have significant deferred revenue and our growth is therefore heavily dependent on subscription sales and renewals in the current year.
Our growth is heavily dependent on subscription sales and renewals in the current year. We offer our core solutions and Value+ subscription services to customers pursuant to subscription agreements with relatively short terms ranging from one month to one year. We generally invoice our customers for subscription services in monthly, quarterly or annual installments, typically in advance of the subscription period. As a result, we do not have significant deferred revenue because invoicing is generally for periods less than one year. We do not currently intend to extend the terms of our subscription agreements, or to invoice our customers less frequently, and we expect that we will continue to depend on current-year sales and renewals to drive our growth.
Failure to protect our intellectual property rights could impair our ability to protect our proprietary technology and our brands which could harm our business.
We currently rely on patent, trademark, copyright and trade secret laws, trade secret protection and confidentiality or license agreements with our employees, customers, partners and others to protect our intellectual property rights. Our success and ability to compete depend, in part, on our ability to protect our intellectual property, including our proprietary technology and our brands. If we are unable to protect our proprietary rights adequately, our competitors could use the intellectual property we have developed to enhance their own products and services, which could harm our business.
In order to monitor and protect our intellectual property rights, we may be required to spend significant resources. Litigation brought to protect and enforce our intellectual property rights could be costly, time-consuming and distracting to management and could result in the impairment or loss of portions of our intellectual property, or require us to pay costly royalties. Furthermore, our efforts to enforce our intellectual property rights may be met with defenses, counterclaims and countersuits attacking the validity and enforceability of our intellectual property rights. Accordingly, we may not be able to prevent third parties from infringing upon or misappropriating our intellectual property. Our failure to secure, protect and enforce our intellectual property rights could adversely affect our business and operating results.
We may be sued by third parties for alleged infringement of their proprietary rights, which could cause us to incur significant expenses and require us to pay substantial damages.
There is considerable patent, trademark, copyright, trade secret and other intellectual property development activity in our industry. Our success depends, in part, on our not infringing upon the intellectual property rights of others. Our competitors, as well as a number of other entities and individuals, may own or claim to own intellectual property relating to our technology or software solutions. From time to time, our competitors or other third parties may claim that we are infringing upon their intellectual property rights. However, we may be unaware of the intellectual property rights that others may claim cover some or all of our technology or software solutions. Any claims or litigation, regardless of merit, could cause us to incur significant expenses and, if successfully asserted against us, could require that we pay substantial damages, settlement costs or ongoing royalty payments, require that we comply with other unfavorable license and other terms, or prevent us from offering our software solutions in their current form. Even if the claims do not result in litigation or are resolved in our favor, these claims, and the time and resources necessary to resolve them, could divert the attention of our management and key personnel from our business operations and harm our operating results.
Our software solutions contain open source software, which may pose particular risks to our proprietary source code, and could have a negative impact on our business and operating results.
We use open source software in our software solutions and expect to continue to do so in the future. The terms of many open source licenses to which we are subject have not been interpreted by U.S. or foreign courts, and there is a risk that open source licenses could be construed in a manner that imposes unanticipated conditions, restrictions or costs on our ability to provide or distribute our software solutions. Additionally, we may from time to time face claims from third parties alleging ownership of, or demanding release of, the open source software or derivative works that we developed using such software, which could include our proprietary source code, or otherwise seeking to enforce the terms of the applicable open source license. These claims could result in litigation, which could be costly for us to defend, and could require us to make our source code freely available, purchase a costly license or cease offering the implicated core functionality and Value+ services unless and until we can re-engineer them to avoid infringement. This re-engineering process could require significant additional research and product development resources, and we may not be able to complete it successfully or in a timely manner. In addition to risks related to license requirements, usage of certain open source software can lead to greater risks than use of third-party commercial software, as open source licensors generally do not provide warranties or controls on the origin of software. These risks could be difficult to eliminate or manage, and could have a negative impact on our business and operating results.
25
Changes in laws and regulations related to the Internet or changes in the Internet infrastructure itself may diminish the demand for our software solutions, and could have a negative impact on our business.
The future success of our business depends upon the continued use of the Internet as a primary medium for commerce, communication and business services. Federal, state or foreign government bodies or agencies have in the past adopted, and may in the future adopt, laws or regulations affecting the use of the Internet as a commercial medium. Changes in these laws or regulations could require us to modify our software solutions in order to comply with these changes. In addition, government agencies or private organizations may begin to impose taxes, fees or other charges for accessing the Internet, or for the commerce conducted via the Internet. These laws or charges could limit the growth of Internet-related commerce or communications generally, result in reductions in the demand for Internet-based business services such as ours, and cause us to incur significant expenses.
The use of the Internet in general could be adversely affected by delays in the development or adoption of new standards and protocols to handle increased demands of Internet activity, accessibility, reliability, security, cost, ease of use and quality of service. In addition, the use of the Internet as a medium for commerce, communication and business services may have been, and may continue to be, adversely affected by concerns regarding network outages, software errors, viruses, security breaches, fraud or other malicious activity. If the use of the Internet is adversely affected by these issues, demand for our software solutions could suffer.
Privacy and data security laws and regulations could impose additional costs on us and reduce the demand for our software solutions.
Our customers store and transmit a significant amount of personal or identifying information through our technology platform. Privacy and data security have become significant issues in the United States and in other jurisdictions where we may offer our software solutions. The regulatory framework relating to privacy and data security issues worldwide is rapidly evolving and is likely to remain uncertain for the foreseeable future. Federal, state and foreign government bodies and agencies have in the past adopted, or may in the future adopt, laws and regulations regarding the collection, use, processing, storage and disclosure of personal or identifying information obtained from customers and other individuals. In addition to government regulation, privacy advocates and industry groups may propose various self-regulatory standards that may legally or contractually apply to our business. Because the interpretation and application of many privacy and data security laws, regulations and applicable industry standards are uncertain, it is possible that these laws, regulations and standards may be interpreted and applied in a manner inconsistent with our existing privacy and data management practices. As we expand into new jurisdictions or verticals, we will need to understand and comply with various new requirements applicable in those jurisdictions or verticals.
To the extent applicable to our business or the businesses of our customers, these laws, regulations and industry standards could have negative effects on our business, including by increasing our costs and operating expenses, and delaying or impeding our deployment of new core functionality, or Value+ services. Compliance with these laws, regulations and industry standards requires significant management time and attention, and failure to comply could result in negative publicity, subject us to fines or penalties, or result in demands that we modify or cease existing business practices. In addition, the costs of compliance with, and other burdens imposed by, such laws, regulations and industry standards may adversely affect our customers’ ability or desire to collect, use, process and store personal information using our software solutions, which could reduce overall demand for them. Even the perception of privacy and data security concerns, whether or not valid, may inhibit market acceptance of our software solutions in certain verticals. Furthermore, privacy and data security concerns may cause our customers’ clients, vendors, employees and other industry participants to resist providing the personal information necessary to allow our customers to use our applications effectively. Any of these outcomes could adversely affect our business and operating results.
26
We may require additional capital to support our operations or the growth of our business, and we cannot be certain that this capital will be available on favorable terms when required, or at all.
We may need additional capital to grow our business and meet our strategic objectives. Our ability to obtain additional capital, if and when required, will depend on numerous factors, including investor and lender demand, our historical and forecasted financial and operating performance, our market position, and the overall condition of the capital markets. We cannot guarantee that additional financing will be available to us on favorable terms when required, or at all. In addition, if we raise additional funds through the issuance of equity securities, those securities may have powers, preferences or rights senior to the rights of our Class A common stock, and our existing stockholders may experience dilution. If we raise additional funds through the issuance of debt securities, we may incur interest expense or other costs to service the indebtedness, or we may be required to encumber certain assets, which could negatively impact our operating results. Furthermore, if we are unable to obtain adequate financing or financing on terms satisfactory to us when we require it, our ability to continue to support the growth of our business and the achievement of our strategic objectives could be significantly impaired and our operating results may be harmed.
Financing agreements we are party to or may become party to may contain operating and financial covenants that restrict our business and financing activities. Failure to comply with these covenants, or other restrictions, could result in default under these agreements.
Our existing credit agreement, with Wells Fargo, which we refer to as the Credit Agreement, contains certain operating and financial restrictions and covenants, including limitations on dividends, dispositions, mergers or consolidations, incurrence of indebtedness and liens, and other corporate activities. These restrictions and covenants, as well as those contained in any future financing agreements that we may enter into, may restrict our ability to finance our operations, and to engage in, expand or otherwise pursue our business activities and strategic objectives. Our ability to comply with these covenants may be affected by events beyond our control, and breaches of these covenants could result in a default under our existing Credit Agreement and any future financial agreements that we may enter into. If not waived, defaults could cause our outstanding indebtedness under the Credit Agreement and any future financing agreements that we may enter into to become immediately due and payable.
Because our long-term growth strategy involves expansion of our sales to customers outside the United States, our business will be susceptible to the risks associated with international operations.
A component of our growth strategy involves the expansion of our international operations and worldwide customer base. To date, we have realized an immaterial amount of revenue from customers outside the United States. Operating in international markets will require significant resources and management attention and will subject us to regulatory, economic, geographic and political risks that are different from those in the United States. Because of our limited experience with international operations and significant differences between the United States and international markets, our international expansion efforts may not be successful in creating demand for our software solutions outside of the United States or in effectively selling our software solutions in any international markets we may enter. If we invest substantial time and resources to expand our international operations and are unable to do so successfully, our business and operating results could suffer.
We will incur significant costs and devote substantial management time as a result of operating as a public company.
As a public company, we are subject to certain requirements under the Securities Act, the Exchange Act, the Sarbanes-Oxley Act, the Dodd-Frank Wall Street Reform and Consumer Protection Act and the related rules and regulations of the SEC. We are also subject to the listing standards of The NASDAQ Stock Market. Compliance with these rules and regulations makes certain activities more difficult, time consuming and costly, and places significant strain on our personnel, systems and resources. In particular, we have incurred additional costs as a result of hiring additional accounting and financial personnel with appropriate public company experience and technical knowledge. We cannot predict with certainty the amount of additional costs we may incur as a result of being a public company or the timing of such costs, which will have the impact of increasing our general and administrative expense. In addition, as a public company, it is more expensive for us to obtain director and officer liability insurance, and in the future we may be required to accept reduced coverage or incur substantially higher costs to obtain coverage. This could make it more difficult for us to attract and retain qualified people to serve on our board of directors or as executive officers.
27
We have previously identified certain material weaknesses in our internal control over financial reporting that, if not corrected, could have resulted in material misstatements to our financial statements.
In connection with the audit of our consolidated financial statements as of and for the year ended December 31, 2014, our independent registered public accounting firm identified material weaknesses in our internal control over financial reporting. A material weakness is a deficiency, or combination of deficiencies, in internal control over financial reporting such that there is a reasonable possibility that a material misstatement of our annual or interim financial statements would not be prevented or detected on a timely basis. The material weakness identified was because we had not designed or maintained an effective control environment with sufficient personnel with an appropriate level of accounting and financial reporting expertise with respect to the accounting for non-routine, complex transactions. This lack of an effective control environment contributed to a material weakness in our accounting policies and procedures designed to address the accounting for unusual or complex transactions. These material weaknesses resulted in audit adjustments in our 2014 financial statements and a revision to our 2012 and 2013 financial statements.
During the first quarter of 2015, we commenced measures to remediate these material weaknesses, and remediation has been completed as of December 31, 2015. However, completion of remediation does not provide assurance that our remediated controls will continue to operate properly or that our financial statements will not contain material errors. There may be undetected material weaknesses in our internal control over financial reporting, as a result of which we may not detect financial statement errors on a timely basis. Moreover, in the future we may engage in business transactions, such as acquisitions or reorganizations, or implement new accounting standards, or adopt other changes to our business processes, any of which could require us to develop and implement new controls or to modify existing controls, which, could negatively affect our internal control over financial reporting and result in material weaknesses.
We continue to develop our internal controls, processes and reporting systems in an effort to maintain the effectiveness of our internal control over financial reporting, and we expect to incur ongoing costs in this effort. However, we may not be successful in developing and maintaining adequate internal controls, which may undermine our ability to provide accurate, timely and reliable reports on our financial and operating results.
Neither we nor our independent registered public accounting firm has performed or was required to perform an evaluation of our internal control over financial reporting in accordance with Section 404 of the Sarbanes-Oxley Act. While we have begun the process of evaluating the design and operation of our internal control over financial reporting and implementing additional processes and controls, we are in the early phases and have not completed our implementation. During the course of our evaluation and implementation, we may identify additional control deficiencies, which could give rise to other material weaknesses, in addition to the material weaknesses described above. The material weaknesses described above or any newly identified material weakness could prevent us from detecting a material error in our financial statements.
If we fail maintain an effective system of internal control over financial reporting, our ability to produce timely and accurate financial statements or comply with applicable regulations could be impaired.
In connection with the audit of our consolidated financial statements for the fiscal year 2014, our independent registered public accounting firm identified material weaknesses in our internal control over financial reporting. In fiscal year 2015, we remediated these material weaknesses by, among other things, hiring additional qualified personnel and designing and implementing new procedures and controls. Although we believe we have remediated the foregoing material weaknesses, we may in the future, experience one or more material weaknesses.
In the event we experience a material weakness in our internal control over financial reporting in the future, we may not detect errors on a timely basis and our financial statements may be materially misstated. Ineffective internal control over financial reporting, failure to comply with the requirements of Section 404 of the Sarbanes-Oxley Act in a timely manner and the inability to express an opinion as to the effectiveness of our internal control over financial reporting could cause investors to lose confidence in our reported financials and other information, which could have a negative effect on the market price of our Class A common stock. Additionally, it could lead to an investigation by the SEC, NASDAQ or other regulatory authorities, which could require the expenditure of additional financial and management resources.
As a public company, we are required to comply with the SEC’s rules and regulations implementing Sections 302 and 404 of the Sarbanes-Oxley Act, which require management to certify financial and other information in our quarterly and annual reports and provide an annual management report on the effectiveness of our internal control over financial reporting. Though we are required to disclose changes made in our internal controls and procedures on a quarterly basis, Section 404 of the Sarbanes-Oxley Act requires that we evaluate and determine the effectiveness of our internal control over financial reporting commencing with the Form 10-K we will file with respect to fiscal year 2016 by providing a management report on internal control over financial reporting. Pursuant to the JOBS Act, our independent registered public accounting firm will not be required to attest to the
28
effectiveness of our internal control over financial reporting until the later of the Form 10-K we file with respect to the fiscal year 2016 or the date we are no longer an emerging growth company.
We are an emerging growth company and our decision to comply with certain reduced reporting and disclosure requirements could make our Class A common stock less attractive to investors.
We qualify as an emerging growth company under the JOBS Act. An emerging growth company may take advantage of specified reduced reporting requirements and may be relieved of other significant requirements that are otherwise generally applicable to public companies. These provisions include:
▪ | an exemption from compliance with the auditor attestation requirement on the effectiveness of our internal control over financial reporting; |
▪ | an exemption from compliance with any requirement that the Public Company Accounting Oversight Board may adopt regarding mandatory audit firm rotation or a supplement to the auditor’s report providing additional information about the audit and the financial statements; |
▪ | reduced disclosure about our executive compensation arrangements; and |
▪ | exemptions from the requirements to obtain a non-binding advisory vote on executive compensation or stockholder approval of any golden parachute arrangements. |
We have irrevocably elected to opt out of the extended transition period for complying with new or revised accounting standards pursuant to Section 107(b) of the JOBS Act. However, in this Annual Report, we are taking advantage of the other exemptions discussed above. Accordingly, the information that we provide to our stockholders may be different from the information you receive from other public companies in which you have invested. If some investors find our Class A common stock less attractive as a result of our reliance on these exemptions, there may be a less active trading market for our Class A common stock, the market price of our Class A common stock may be more volatile, and the trading price of our Class A common stock may be lower than that of comparable companies.
Our ability to use our net operating loss carryforwards and certain other tax attributes may be limited.
As of December 31, 2015, we had U.S. federal net operating loss carryforwards of approximately $74.2 million and state net operating loss carryforwards of approximately $47.2 million, which begin to expire in 2027 and 2017, respectively. As of December 31, 2015, we had U.S. federal credit carryforwards of approximately $2.8 million and state credit carryforwards of approximately $2.9 million. The federal credit carryforwards begin to expire in 2027 and the state credits carry forward indefinitely. Under Section 382 of the Internal Revenue Code of 1986, as amended, or the Code, if a corporation undergoes an “ownership change,” the corporation’s ability to use its pre-change net operating loss carryforwards and other pre-change tax attributes, such as research tax credits, to offset its post-change income and taxes may be limited. In general, an “ownership change” occurs if there is a cumulative change in our ownership by “5% shareholders” that exceeds 50 percentage points over a rolling three-year period. Similar rules may apply under state tax laws. It is possible that our existing net operating loss and/or credit carryforwards may be subject to limitations arising from previous ownership changes, and future issuances of our stock could cause an ownership change. Furthermore, our ability to utilize net operating loss and/or credit carryforwards of companies that we have acquired or may acquire in the future may be subject to limitations. Any such limitations on our ability to use our net operating loss carryforwards and other tax assets could adversely impact our business, financial condition and operating results.
Tax laws or regulations could be enacted or changed and existing tax laws or regulations could be applied to us or to our customers in a manner that could increase the costs of our software solutions and adversely impact our operating results.
The application of federal, state, local and foreign tax laws to services provided electronically is continuously evolving. New income, sales, use or other tax laws, statutes, rules, regulations or ordinances could be enacted or amended at any time, possibly with retroactive effect, and could be applied solely or disproportionately to services provided over the Internet. These enactments or amendments could adversely affect our sales activity due to the inherent cost increase the taxes would represent and ultimately result in a negative impact on our operating results.
In addition, existing tax laws, statutes, rules, regulations or ordinances could be interpreted, modified or applied adversely to us, possibly with retroactive effect, which could require us or our customers to pay additional tax amounts, as well as require us or our customers to pay fines or penalties, as well as interest on past amounts. If we are unsuccessful in collecting such taxes due from our customers, we could be held liable for such costs, thereby adversely impacting our operating results.
29
We may be subject to additional tax liabilities.
We are subject to income, sales, use, value added and other taxes in the United States and other jurisdictions in which we conduct business, and such laws and rates vary by jurisdiction. Certain jurisdictions in which we do not collect sales, use, value added or other taxes on our sales may assert that such taxes are applicable, which could result in tax assessments, penalties and interest, and we may be required to pay or collect such taxes in the future. If we receive an adverse determination as a result of an audit or related litigation, or we unilaterally determine that we have misinterpreted provisions of the tax regulations to which we are subject, there could be a material effect on our tax provision, net income or cash flows in the period or periods for which that determination is made.
Adverse economic conditions may negatively impact our business.
The growth of our business depends on the overall demand for business management software and on the economic health of our existing and prospective customers. Future economic changes could negatively impact the U.S. and global economy, which could cause customers to reduce or delay their information technology spending, or resist migrating from their existing software to our software solutions. This could in turn reduce demand for our software solutions and result in a loss of customers, reductions in subscription duration and value, slower adoption of new technologies, increased price competition, longer sales cycles and increased sales and marketing expenditures. Any of these events could have an adverse effect on our business and operating results.
Our reported financial results may be adversely affected by changes in accounting principles generally accepted in the United States.
Generally accepted accounting principles in the United States, or GAAP, are subject to interpretation by the Financial Accounting Standards Board, or FASB, the SEC and various bodies formed to promulgate and interpret appropriate accounting principles. A change in these principles or interpretations could have a significant impact on our reported financial results, and could affect the reporting of transactions completed before the announcement of a change.
Risks Related to Our Class A Common Stock
The market price of our Class A common stock may be volatile or may decline regardless of our operating performance, which could result in substantial losses for our stockholders.
Prior to the completion of our initial public offering in June 2015, there was no public market for shares of our Class A common stock. We cannot assure you that an active trading market for our Class A common stock will develop, or if developed, that any market will be sustained. The market price of our Class A common stock has been, and is likely to continue to be, highly volatile and fluctuations in the price of our Class A common stock could cause you to lose all or part of your investment. For example, since the completion of our initial public offering, the closing price of a share of our Class A common stock on the NASDAQ Global Market has fluctuated between $12.00 and $19.64.
There are numerous factors that could cause fluctuations in the market price of our Class A common stock, including:
▪ | price and volume fluctuations in the overall stock market from time to time; |
▪ | volatility in the market prices and trading volumes of securities issued by software companies; |
▪ | changes in operating performance and stock market valuations of other software companies generally, and of companies that sell cloud-based solutions within our targeted verticals in particular; |
▪ | sales of shares of our Class A common stock by us or our stockholders, or perceptions that such sales may occur; |
▪ | failure of securities analysts to maintain coverage of us, changes in financial estimates by securities analysts who follow us, or our failure to meet these estimates or the expectations of investors; |
▪ | the guidance we may provide to the public, any changes in that guidance, and our performance relative to that guidance; |
▪ | announcements by us or our competitors of new products or services; |
▪ | the public’s reaction to our press releases, filings with the SEC and other public announcements; |
30
▪ | rumors and market speculation involving us or other software companies; |
▪ | actual or anticipated changes in our operating results or fluctuations in our operating results; |
▪ | actual or anticipated developments in our business, our competitors’ businesses or the competitive landscape generally; |
▪ | litigation involving us, our industry or both, or investigations by regulators into our operations or those of our competitors; |
▪ | developments or disputes concerning our intellectual property or other proprietary rights; |
▪ | announced or completed acquisitions of businesses or technologies by us or our competitors; |
▪ | new laws or regulations or new interpretations of existing laws or regulations applicable to our business; |
▪ | changes in accounting standards, policies, guidelines, interpretations or principles; |
▪ | changes in our management; and |
▪ | general economic conditions and trends, including slow or negative growth of our markets. |
In addition, in the past, following periods of volatility in the overall market and the market price of a particular company’s securities, securities class action litigation has often been instituted against these companies. This litigation, if instituted against us, could result in substantial costs and a diversion of our management’s attention and adversely affect the price of our Class A common stock.
The dual class structure of our common stock has the effect of concentrating voting control with a limited number of stockholders, including our executive officers, directors and principal stockholders, which will limit your ability to influence corporate matters.
Our Class B common stock has 10 votes per share, and our Class A common stock has one vote per share. As of February 19, 2016, the holders of the outstanding shares of our Class B common stock, including our executive officers, directors, and principal stockholders, collectively hold approximately 95.9% of the combined voting power of our outstanding capital stock. Because of the 10-to-1 voting ratio between our Class B common stock and Class A common stock, the holders of our Class B common stock collectively control a majority of the combined voting power of our outstanding capital stock and therefore are able to exercise significant influence and control over the establishment and implementation of our future business plans and strategic objectives, as well as to control all matters submitted to our stockholders for approval. These persons may manage our business in ways with which you disagree and which may be adverse to your interests. This concentrated control may also have the effect of delaying, deterring or preventing a change-in-control transaction, depriving our stockholders of an opportunity to receive a premium for their capital stock or negatively affecting the market price of our Class A common stock.
Transfers by holders of our Class B common stock will generally result in those shares converting to Class A common stock, subject to limited exceptions. The conversion of our Class B common stock to Class A common stock will have the effect, over time, of increasing the relative voting power of the holders of our Class B common stock who retain their shares over the long term.
Anti-takeover provisions contained in our amended and restated certificate of incorporation and amended and restated bylaws, as well as provisions of Delaware law, could impair a takeover attempt.
Our amended and restated certificate of incorporation and our amended and restated bylaws contain provisions that could have the effect of rendering more difficult hostile takeovers, change-in-control transactions or changes in our board of directors or management. Among other things, these provisions:
▪ | authorize the issuance of preferred stock with powers, preferences and rights that may be senior to our common stock, which can be created and issued by our board of directors without prior stockholder approval; |
▪ | provide for the adoption of a staggered board of directors whereby the board is divided into three classes, each of which has a different three-year term; |
▪ | provide that the number of directors will be fixed by the board; |
31
▪ | prohibit our stockholders from filling board vacancies; |
▪ | provide for the removal of a director only for cause and then only by the affirmative vote of the holders of a majority of the combined voting power of our outstanding capital stock; |
▪ | prohibit stockholders from calling special stockholder meetings; |
▪ | prohibit stockholders from acting by written consent without holding a meeting of stockholders; |
▪ | require the vote of at least two-thirds of the combined voting power of our outstanding capital stock to approve amendments to our certificate of incorporation or bylaws; |
▪ | require advance written notice of stockholder proposals and director nominations; |
▪ | provide for a dual-class common stock structure, as discussed above; and |
▪ | require the approval of the holders of at least a majority of the outstanding shares of our Class B common stock, voting as a separate class, prior to consummating a change-in-control transaction. |
As a Delaware corporation, we are also subject to provisions of Delaware law, including Section 203 of the Delaware General Corporation Law, or DGCL, which may delay, deter or prevent a change-in-control transaction. Section 203 imposes certain restrictions on mergers, business combinations and other transactions between us and holders of 15% or more of our common stock.
Any provision of Delaware law, our amended and restated certificate of incorporation, or our amended and restated bylaws, that has the effect of rendering more difficult, delaying, deterring or preventing a change-in-control transaction could limit the opportunity for our stockholders to receive a premium for their shares of our capital stock, and could also affect the price that some investors are willing to pay for our Class A common stock.
Future sales of shares of our Class A common stock, or the perception that these sales could occur, could depress the market price of our Class A common stock.
Sales of a substantial number of shares of our Class A common stock in the public market, or the perception that these sales might occur, could cause the market price of our Class A common stock to decline or make it more difficult for you to sell your Class A common stock at a time and price that you deem appropriate, and could impair our ability to raise capital through the sale of additional equity securities. We are unable to predict the effect that sales, or the perception that our shares may be available for sale, will have on the prevailing market price of our Class A common stock.
In addition, as of December 31, 2015, we had an aggregate of 1.2 million options outstanding that, if fully exercised, would result in the issuance of additional shares of Class A common stock or Class B common stock, as applicable. Our Class B common stock converts into Class A common stock on a one-for-one basis. As of December 31, 2015, we had 17,000 restricted stock units outstanding which, if fully vested and settled in shares, would result in the issuance of additional shares of Class A common stock. All of the shares of Class A common stock issuable upon the exercise of options (or upon conversion of shares of Class B common stock issued upon the exercise of options), or upon the vesting and settlement of restricted stock units, have been registered for public resale under the Securities Act. Accordingly, these shares will be able to be freely sold in the public market upon issuance.
Certain holders of our Class A common stock and Class B common stock have rights, subject to certain conditions, to require us to file registration statements for the public resale of such shares (in the case of Class B common stock, the Class A common stock issuable upon conversion of such shares) or to include such shares in registration statements that we may file for us or other stockholders. Any sales of securities by these stockholders could have a material adverse effect on the market price of our Class A common stock.
If securities or industry analysts do not publish or cease publishing research or reports about us, our business, our market or our competitors, or if they adversely change their recommendations regarding our Class A common stock, the market price and trading volume of our Class A common stock could decline.
The trading market for our Class A common stock is influenced, to some extent, by the research and reports that securities or industry analysts publish about us, our business, our market or our competitors. If any of the analysts who cover us adversely change their recommendations regarding our Class A common stock or provide more favorable recommendations about our
32
competitors, the market price of our Class A common stock may decline. If any of the analysts who cover us were to cease coverage of us or fail to publish reports on us regularly, visibility of our company in the financial markets could decrease, which in turn could cause the market price or trading volume of our Class A common stock to decline.
We do not expect to declare any dividends in the foreseeable future.
We have never declared or paid any cash dividends on our existing common stock. We do not anticipate declaring or paying any cash dividends to holders of our Class A common stock in the foreseeable future and intend to retain all future earnings for the growth of our business. In addition, the terms of our Credit Agreement restrict our ability to pay dividends. Consequently, investors may need to rely on sales of our Class A common stock after price appreciation, which may never occur, as the only way to realize any future gains on their investment. Investors should not purchase our Class A common stock with the expectation of receiving cash dividends.
ITEM 1B. UNRESOLVED STAFF COMMENTS
None.
ITEM 2. | PROPERTIES |
Our corporate headquarters is located in two adjacent buildings in Santa Barbara, California. The lease on the first building covers approximately 43,300 square feet and expires in February 2018. The lease on the second building covers approximately 26,500 square feet and expires in November 2020.
We also lease space in San Diego, California, Richardson, Texas and Dallas, Texas under leases that expire at various times between 2016 and 2022.
We intend to procure additional space as we add employees and expand our operations geographically. We believe our current facilities are adequate for our current needs and that, should it be needed, suitable additional or alternative space will be available to us to accommodate any such expansion of our operations.
We lease all of our facilities and do not own any real property.
ITEM 3. | LEGAL PROCEEDINGS |
From time to time, we are involved in various legal proceedings arising from, and subject to claims incident to, the normal course of our business activities. Although the results of such legal proceedings and claims cannot be predicted with certainty, we believe we are not currently a party to any legal proceedings which, if determined adversely to us would, individually or taken together, have a material adverse effect on our business, operating results, financial condition or cash flows. However, regardless of the outcome, legal proceedings can have an adverse impact on us as a result of defense and settlement costs, diversion of management resources and other factors.
ITEM 4. MINE SAFETY DISCLOSURES
Not applicable.
33
PART II
ITEM 5. | MARKET FOR REGISTRANT'S COMMON EQUITY, RELATED STOCKHOLDER MATTERS AND ISSUER PURCHASES OF EQUITY SECURITIES |
Market Information for our Class A Common Stock
Our Class A common stock began trading publicly on the Nasdaq Global Market under the symbol "APPF" on June 26, 2015. Prior to that date, there was no public trading market for our Class A common stock. The following table sets forth the high and low sales price per share of our Class A common stock as reported on the Nasdaq Global Market for the periods indicated:
High | Low | ||||||
Year ended December 31, 2015: | |||||||
Second quarter (from June 26, 2015) | $ | 14.87 | $ | 12.11 | |||
Third quarter | $ | 18.48 | $ | 13.50 | |||
Fourth quarter | $ | 19.93 | $ | 14.51 | |||
Holders of Record
As of February 19, 2016, there were 42 holders of record of our Class A common stock and 242 holders of record of our Class B common stock. Because many of our shares of Class A common stock are held by brokers and other institutions on behalf of stockholders, we are unable to estimate the total number of stockholders represented by these record holders.
Dividend Policy
We have never declared or paid any cash dividends on our capital stock. We have no plans to declare or pay any dividends on our capital stock in the foreseeable future and intend to retain all future earnings, if any, generated by our operations for the growth of our business. Any future decision to declare or pay dividends will be made by our board of directors in its sole discretion and will depend upon our financial condition, results of operations, capital requirements, general economic conditions and other factors that our board of directors deems relevant at the time of its decision. Investors should not purchase our Class A common stock with the expectation of receiving cash dividends.
In addition, the terms of our Credit Agreement may restrict our ability to pay dividends.
34
Stock Performance Graph
The following performance graph compares the cumulative total return on our Class A common stock with that of the S&P 500 Index and the S&P Information Technology Index. This chart assumes $100 was invested at the close of market on June 26, 2015, which was our initial trading day, in our Class A common stock, the S&P 500 Index and the S&P Information Technology Index, and assumes the reinvestment of any dividends. The stock price performance reflected in the performance graph is not necessarily indicative of future stock performance.
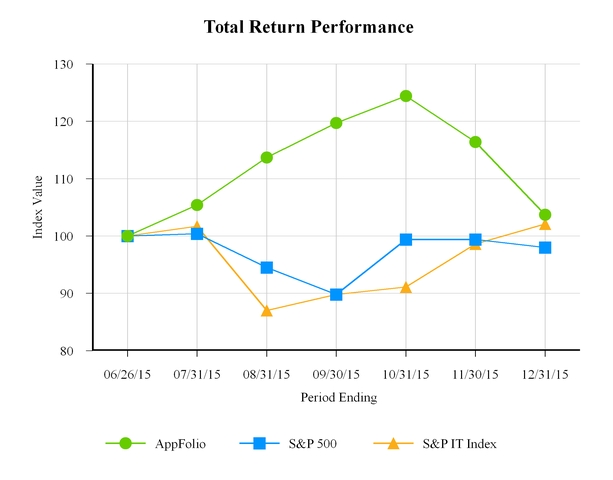
This performance graph shall not be deemed “filed” for purposes of Section 18 of the Exchange Act or incorporated by reference into any of our other filings under the Securities Act or the Exchange Act, except as shall be expressly set forth by specific reference in such filing.
Unregistered Sales of Equity Securities
None.
Use of Proceeds
On June 30, 2015, we closed our initial public offering or IPO, of 6,200,000 shares of our Class A common stock, at a price to the public of $12.00 per share. The offer and sale of all of the shares in the IPO were registered under the Securities Act pursuant to a Registration Statement on Form S-1 (File No. 333-204262), which was declared effective by the SEC on June 25, 2015. The aggregate offering price for shares sold in the IPO was approximately $74.4 million. We received net proceeds of approximately $65.1 million after deducting underwriting discounts and commissions of $5.2 million and other offering expenses of approximately $4.1 million.
35
On July 8, 2015, in connection with the exercise of an overallotment option granted to the underwriters, we sold 930,000 additional shares of our Class A common stock to the underwriters at the public offering price of $12.00 per share, resulting in an additional $10.4 million in net proceeds to us, after deducting underwriting discounts and commissions of $0.8 million. As a result, the aggregate net proceeds to us from the sale of shares in the IPO were approximately $75.4 million.
There has been no material change in the planned use of net proceeds from the IPO as described in our final prospectus filed with the SEC on June 26, 2015 pursuant to Rule 424(b)(4) under the Securities Act.
36
ITEM 6. SELECTED FINANCIAL DATA
The following tables provide our historical selected consolidated financial data for the periods indicated. We have derived the selected Consolidated Statements of Operations data for the fiscal years ended December 31, 2015, 2014 and 2013 and the selected Consolidated Balance Sheet data as of December 31, 2015 and 2014 from our audited Consolidated Financial Statements included elsewhere in this Annual Report. We have derived the selected Consolidated Statements of Operations data for the fiscal year ended December 31, 2012 and the selected Consolidated Balance Sheet data as of December 31, 2013 and 2012 from our audited Consolidated Financial Statements, which are not included in this Annual Report. Our historical results are not necessarily indicative of the results we expect in the future.
The following historical selected consolidated financial data should be read in conjunction with, and are qualified in their entirety by reference to, the section entitled “Management’s Discussion and Analysis of Financial Condition and Results of Operations” and our Consolidated Financial Statements and the related notes included elsewhere in this Annual Report.
Year Ended December 31, | |||||||||||||||
2015 | 2014 | 2013 | 2012 | ||||||||||||
(in thousands, except per share data) | |||||||||||||||
Consolidated Statements of Operations Data: | |||||||||||||||
Revenue | $ | 74,977 | $ | 47,671 | $ | 26,542 | $ | 12,706 | |||||||
Costs and operating expenses: | |||||||||||||||
Cost of revenue (exclusive of depreciation and amortization)(1) | 33,903 | 22,555 | 13,616 | 8,211 | |||||||||||
Sales and marketing(1) | 26,076 | 16,876 | 10,337 | 8,001 | |||||||||||
Research and product development(1) | 9,554 | 6,505 | 5,057 | 4,067 | |||||||||||
General and administrative(1) | 14,343 | 6,489 | 2,286 | 2,736 | |||||||||||
Depreciation and amortization | 6,104 | 3,805 | 2,850 | 2,079 | |||||||||||
Total costs and operating expenses | 89,980 | 56,230 | 34,146 | 25,094 | |||||||||||
Loss from operations | (15,003 | ) | (8,559 | ) | (7,604 | ) | (12,388 | ) | |||||||
Other income (expense), net | 5 | (121 | ) | 287 | — | ||||||||||
Interest income (expense), net | (595 | ) | 59 | 12 | 72 | ||||||||||
Loss before income taxes | (15,593 | ) | (8,621 | ) | (7,305 | ) | (12,316 | ) | |||||||
Provision for income taxes | 75 | — | — | — | |||||||||||
Net loss | $ | (15,668 | ) | $ | (8,621 | ) | $ | (7,305 | ) | $ | (12,316 | ) | |||
Net loss per share, basic and diluted | (0.73 | ) | (0.98 | ) | (0.87 | ) | (1.52 | ) | |||||||
Weighted average common shares outstanding, basic and diluted | 21,336 | 8,757 | 8,437 | 8,104 | |||||||||||
(1) Includes stock-based compensation expense as follows (in thousands): | |||||||||||||||
37
Year Ended December 31, | |||||||||||||||
2015 | 2014 | 2013 | 2012 | ||||||||||||
(in thousands, except per share data) | |||||||||||||||
Costs and operating expenses: | |||||||||||||||
Cost of revenue (exclusive of depreciation and amortization) | $ | 124 | $ | 68 | $ | 63 | $ | 49 | |||||||
Sales and marketing | 115 | 48 | 39 | 41 | |||||||||||
Research and product development | 41 | 19 | 49 | 48 | |||||||||||
General and administrative | 727 | 757 | 96 | 110 | |||||||||||
Total stock-based compensation expense | $ | 1,007 | $ | 892 | $ | 247 | $ | 248 | |||||||
December 31, | |||||||||||||||
2015 | 2014 | 2013 | 2012 | ||||||||||||
(in thousands, except per share data) | |||||||||||||||
Consolidated Balance Sheet Data: | |||||||||||||||
Cash and cash equivalents | $ | 12,063 | $ | 5,412 | $ | 11,269 | $ | 3,943 | |||||||
Total assets | 90,481 | 25,434 | 27,707 | 22,109 | |||||||||||
Deferred revenue | 4,953 | 3,780 | 2,943 | 2,289 | |||||||||||
Convertible preferred stock | — | 63,166 | 63,166 | 51,288 | |||||||||||
Total stockholders’ equity (deficit) | 72,697 | (51,467 | ) | (43,959 | ) | (36,984 | ) | ||||||||
ITEM 7. | MANAGEMENT'S DISCUSSION AND ANALYSIS OF FINANCIAL CONDITION AND RESULTS OF OPERATIONS |
The following discussion and analysis of our financial condition and results of operations should be read together with our Consolidated Financial Statements and the related notes included elsewhere in this Annual Report. This discussion and analysis contains forward-looking statements that are based on our current expectations and reflect our plans, estimates and anticipated future financial performance. These statements involve numerous risks and uncertainties. Our actual results may differ materially from those expressed or implied by these forward-looking statements as a result of many factors, including those set forth in the section entitled “Risk Factors” included elsewhere in this Annual Report.
Overview
AppFolio is a provider of industry-specific, cloud-based software solutions for SMBs in the property management and legal industries. We were formed in 2006 with a vision to revolutionize the way that small and medium-sized businesses grow and compete.
Our platform is designed to be the system of record to automate essential business processes and the system of engagement to enhance business interactions between our customers and their clients and vendors. Our mobile-optimized software solutions have a user-friendly interface across multiple devices, enabling our customers to work at any time and from anywhere. Our property management software provides small and medium-sized property managers with an end-to-end solution to their business needs, enabling them to manage properties quickly and easily in a single, integrated environment. Our legal software provides solo practitioners and small law firms with a streamlined practice and case management solution, allowing them to manage their practices and case load seamlessly within a flexible system. We also offer optional, but often mission-critical, Value+ services, such as our professionally designed websites and electronic payment services, which are seamlessly built into our core solutions.
We launched our first product, APM, a property management solution, in 2008. Recognizing that our customers would benefit from additional mission-critical services that they can purchase as needed, we launched our first Value+ service in 2009 by offering website design and hosting services to our property manager customers. Our websites give our customers a professional online presence and serve as the hub for our system of engagement. In 2010, we commenced the roll out of our electronic payments platform with the introduction of ACH payment processing and, in 2011, we launched resident screening as additional Value+ services. In 2012, we introduced our tenant liability insurance program as a further Value+ service. Also in 2012, after completing our market validation process, we decided to enter the legal market. We expedited our time-to-market by acquiring MyCase, a
38
legal practice and case management solution, and we leveraged our AppFolio Business System, including our experience gained in the property management vertical, to advance our software solution in the legal vertical. In 2013, we extended our website design and hosting services to our law firm customers and expanded our electronic payments platform by allowing residents to pay rent by Electronic Cash Payment and credit or debit card. In 2014, we launched an additional Value+ service for our property manager customers with our contact center to resolve or route incoming maintenance requests. In April 2015, we expanded the services offered to our property manager customers, giving them the ability to better spend, track and optimize their marketing investments through our acquisition of RentLinx, a software platform that allows customers to advertise rental houses and apartments online. Through our disciplined market validation approach and ongoing investment in product development, we continuously update our software solutions through new and innovative core functionality and Value+ services, as well as assess opportunities in adjacent markets and new verticals.
We have focused on growing our revenue by increasing the size of our customer base, retaining customers and increasing the adoption and utilization of our Value+ services by new and existing customers. We have achieved significant customer growth in a relatively short period of time. We define our customer base as the number of customers subscribing to our core solutions, exclusive of free trials, as identified by a unique customer identification code. Customers acquired through the RentLinx acquisition are included in our customer count only if they have a subscription to our core solution.
Customer count is summarized in the table below:
As of December 31, | 2015 to 2014 | 2014 to 2013 | ||||||||||||
2015 | 2014 | 2013 | % Change | % Change | ||||||||||
Property manager | 8,218 | 5,885 | 3,993 | 40 | % | 47 | % | |||||||
Law firm | 6,145 | 3,663 | 1,744 | 68 | % | 110 | % | |||||||
We have invested in growth in a disciplined manner across our organization. As a result, our costs and operating expenses have increased significantly in absolute dollars primarily due to our significant growth in employees and personnel-related costs. For example, we increased our employee headcount from 377 employees as of December 31, 2014 to 573 employees as of December 31, 2015, representing a period-over-period increase of 52%. We intend to continue to invest across our organization. These investments to grow our business will continue to increase our costs and operating expenses on an absolute basis. Many of these investments will occur in advance of our realization of revenue or any other benefit and will make it difficult to determine if we are allocating our resources efficiently. We expect cost of revenue, research and product development expense, sales and marketing expense, and general and administrative expense to decrease as a percentage of revenue over the long term as revenue increases and we gain additional operating leverage in our business. As a result of this increased operating leverage, we expect our operating margins will improve over the long term.
To date, we have experienced rapid revenue growth due to our investments in research and product development, sales and marketing, customer service and support, and infrastructure. During the fiscal year ended December 31, 2015, we have derived more than 90% of our revenue from our property management solution, as it has been available for a longer period of time, is more established within its vertical with a larger customer base, and currently offers a greater number of Value+ services.
We have managed, and plan to continue to manage, our business towards the achievement of long-term growth that we believe will positively impact long-term stockholder value, and not towards the realization of short-term financial or business metrics, or short-term stockholder value.
Key Components of Results of Operations
Revenue
We charge our customers on a subscription basis for our core solutions and many of our Value+ services. Our subscription fees are designed to scale to the size of our customers’ businesses. We recognize subscription revenue ratably over the terms of the subscription agreements, which range from one month to one year. We generally invoice our customers for subscription services in monthly, quarterly or annual installments, typically in advance of the subscription period. As a result, we do not have significant deferred revenue because our invoicing is generally for periods less than one year. Revenue from subscription services is impacted by the change in the number and type of our customers, the size and needs of our customers’ businesses, our customer renewal rates, and the level of adoption of our Value+ subscription services by new and existing customers.
39
We also charge our customers usage-based fees for using certain Value+ services, although fees for electronic payment processing are generally paid by the clients of our customers. Usage-based fees are charged on a flat fee per transaction basis with no minimum usage commitments. We recognize revenue for usage-based services in the period the service is rendered. We generally invoice our customers for usage-based services on a monthly basis for services rendered in the preceding month. Revenue from usage-based services is impacted by the change in the number and type of our customers, the size and needs of our customers’ businesses, and the level of adoption and utilization of our Value+ usage-based services by new and existing customers.
We also offer our customers assistance with on-boarding our core solutions, as well as website design services. These services are generally purchased as part of a subscription agreement, and are typically performed within the first several months of the arrangement. We recognize revenue for these other services upon completion of the related service. We generally invoice our customers for other services in advance of the services being completed.
In April 2015, we acquired RentLinx which primarily generates revenue by providing online services that allow customers to advertise rental houses and apartments. Revenue related to RentLinx is currently being recorded under other services. In the future, we expect to offer these services as Value+ services to our customer base at which time we will classify this revenue as Value+.
Costs and Operating Expenses
Cost of Revenue. Cost of revenue consists of personnel-related costs (including salaries, incentive-based compensation, benefits, and stock-based compensation) for our employees focused on customer service and the support of our operations, platform infrastructure costs (such as data center operations and hosting-related costs), fees paid to third-party service providers, payment processing fees, and allocated shared costs. We typically allocate shared costs across our organization based on headcount within the applicable part of our organization. Cost of revenue excludes amortization of capitalized software development costs and acquired technology. We intend to continue to invest in customer service and support, and the expansion of our technology infrastructure, as we grow the number of our customers and roll out additional Value+ services.
Sales and Marketing. Sales and marketing expense consists of personnel-related costs (including salaries, sales commissions, incentive-based compensation, benefits, and stock-based compensation) for our employees focused on sales and marketing, costs associated with sales and marketing activities, and allocated shared costs. Marketing activities include advertising, online lead generation, lead nurturing, customer and industry events, industry-related content creation and collateral creation. Sales commissions and other incremental costs to acquire customers and grow adoption and utilization of our Value+ services by new and existing customers are expensed as incurred. We focus our sales and marketing efforts on generating awareness of our software solutions, creating sales leads, establishing and promoting our brands, and cultivating an educated community of successful and vocal customers. We intend to continue to invest in sales and marketing to increase the size of our customer base and increase the adoption and utilization of Value+ services by our new and existing customers.
Research and Product Development. Research and product development expense consists of personnel-related costs (including salaries, incentive-based compensation, benefits, and stock-based compensation) for our employees focused on research and product development, fees for third-party development resources, and allocated shared costs. Our research and product development efforts are focused on enhancing the ease of use and functionality of our existing software solutions by adding new core functionality, Value+ services and other improvements, as well as developing new products. We capitalize the portion of our software development costs that meets the criteria for capitalization. Amortization of software development costs is included in depreciation and amortization expense. We intend to continue to invest in research and product development as we continue to introduce new core functionality, roll out new Value+ services, develop new products, and expand into adjacent markets and new verticals.
General and Administrative. General and administrative expense consists of personnel-related costs (including salaries, incentive-based compensation, benefits, and stock-based compensation) for employees in our executive, finance, information technology, or IT, human resources and administrative organizations. In addition, general and administrative expense includes fees for third-party professional services (including consulting, legal and audit services), other corporate expenses, and allocated shared costs. We intend to incur incremental costs associated with supporting the growth of our business, both in terms of increased headcount and to meet the increased reporting requirements and compliance obligations associated with our transition to, and operation as, a public company. Such costs will include increases in our finance, IT, human resources and administrative personnel, additional consulting, legal and audit fees, insurance costs, board of directors’ compensation, the cost of achieving and maintaining compliance with Section 404 of the Sarbanes-Oxley Act of 2002, or the Sarbanes-Oxley Act, and other costs associated with being a public company.
40
Depreciation and Amortization. Depreciation and amortization expense includes depreciation of property and equipment, amortization of capitalized software development costs and amortization of intangible assets. We depreciate or amortize property and equipment, software development costs and intangible assets over their expected useful lives on a straight-line basis, which approximates the pattern in which the economic benefits of the assets are consumed. Accounting guidance for internal-use software costs requires that we capitalize and then amortize qualifying internal-use software costs, rather than expense costs as incurred, which has the impact of shifting these expenses to a future period and reducing the impact of these costs on our financial results in the current period. As we continue to invest in our research and product development organization and the development or acquisition of new technology, we expect to have increased capitalized software development costs and incremental amortization.
Interest Income (Expense). Interest expense includes interest paid on outstanding borrowings under our Credit Agreement. Interest income includes interest earned on investment securities, amortization and accretion of the premium and discounts paid from the purchase of investment securities, notes receivable and on cash deposited within our bank accounts.
Results of Operations for the Year Ended December 31, 2015, 2014, and 2013
Revenue
Year Ended December 31, | 2014 to 2015 % Change | 2013 to 2014 % Change | |||||||||||||||
2015 | 2014 | 2013 | |||||||||||||||
(dollars in thousands) | |||||||||||||||||
Core solutions | $ | 32,119 | $ | 22,406 | $ | 14,413 | 43 | % | 55 | % | |||||||
Value+ services | 37,998 | 22,525 | 10,134 | 69 | % | 122 | % | ||||||||||
Other | 4,860 | 2,740 | 1,995 | 77 | % | 37 | % | ||||||||||
Total revenues | $ | 74,977 | $ | 47,671 | $ | 26,542 | 57 | % | 80 | % | |||||||
Fiscal 2015 Compared to Fiscal 2014
Revenue increased $27.3 million, or 57%, in 2015 compared to 2014, reflecting mainly increased revenue from our property manager customers. The overall increase was primarily a result of an increase in revenue from Value+ services from $22.5 million to $38.0 million, or 69%, mainly driven by increased usage of our electronic payments platform, screening services and tenant liability insurance programs by a larger customer base. The increase was also the result of an increase in revenue from our core solutions of $9.7 million, or 43%, driven by growth in the number of our customers and strong customer renewal rates. The increase in other revenue of $2.1 million, or 77%, in other revenue from $2.7 million to $4.9 million was primarily the result of an increase in fees for website design fees and incremental revenue gained from the acquisition of RentLinx.
Fiscal 2014 Compared to Fiscal 2013
Revenue increased $21.1 million, or 80%, in 2014 compared to 2013, reflecting mainly increased revenue from our property manager customers. The overall increase was primarily a result of an increase in revenue from our core solutions from $14.4 million to $22.4 million, or 56%, driven by growth in the number of our customers and strong customer renewal rates, and an increase in revenue from our Value+ services from $10.1 million to $22.5 million, or 123%, primarily attributable to the expansion of our electronic payments platform at the end of 2013 to allow residents to pay rent by credit or debit card.
In each of 2015, 2014 and 2013, we derived more than 90% of our revenue from our property manager customers.
41
Cost of Revenue (Exclusive of Depreciation and Amortization)
Year Ended December 31, | 2014 to 2015 % Change | 2013 to 2014 % Change | |||||||||||||||
2015 | 2014 | 2013 | |||||||||||||||
(dollars in thousands) | |||||||||||||||||
Cost of revenue (exclusive of depreciation and amortization) | $ | 33,903 | $ | 22,555 | $ | 13,616 | 50 | % | 66 | % | |||||||
Percentage of revenue | 45 | % | 47 | % | 51 | % | |||||||||||
Fiscal 2015 Compared to Fiscal 2014
Cost of revenue (exclusive of depreciation and amortization) increased $11.3 million, or 50%, in 2015 compared to 2014. The increase was primarily a result of an increase in third-party costs of $5.4 million incurred to support the delivery of our software solutions, an increase in personnel-related costs of $4.5 million, and an increase in allocated and other costs of $1.4 million. The increase in third-party costs primarily relates to increased expenditures associated with increased adoption and utilization of certain Value+ services by our new and existing customers as evidenced by the 69% increase in revenue from Value+ services for the same period described above. The increase in personnel-related costs was primarily due to a substantial increase in headcount within our customer service and support organization to support the increased usage of Value+ services. The increase in allocated and other costs primarily relates to an increase in overhead costs, such as facility and IT costs, as we continued to expand our operations to support our growth.
Fiscal 2014 Compared to Fiscal 2013
Cost of revenue (exclusive of depreciation and amortization) increased $8.9 million, or 66%, in 2014 compared to 2013. The increase was primarily a result of an increase in third-party costs of $4.6 million incurred to support the delivery of our software solutions, an increase in personnel-related costs of $2.9 million, and an increase in allocated costs of $0.8 million. The increase in third-party costs, personnel-related services and allocated costs for 2014 compared to 2013 occurred for the same reasons described in the discussion above.
Sales and Marketing
Year Ended December 31, | 2014 to 2015 % Change | 2013 to 2014 % Change | |||||||||||||||
2015 | 2014 | 2013 | |||||||||||||||
(dollars in thousands) | |||||||||||||||||
Sales and marketing | $ | 26,076 | $ | 16,876 | $ | 10,337 | 55 | % | 63 | % | |||||||
Percentage of revenue | 35 | % | 35 | % | 39 | % | |||||||||||
Fiscal 2015 Compared to Fiscal 2014
Sales and marketing expense increased $9.2 million, or 55%, in 2015 compared to 2014. The increase was primarily the result of an increase in personnel-related costs of $5.6 million, an increase in marketing program costs of $2.5 million primarily associated with online advertising, and an increase in other operating costs of $1.0 million. The increase in personnel-related costs was primarily due to an increase in headcount within our sales and marketing organization, an increase in sales commissions due to our revenue growth, and other incentive-based compensation. The increase in marketing program costs was primarily due to an expansion of online lead generation marketing programs to acquire new customers and marketing programs designed to expand adoption and utilization of our Value+ services by new and existing customers. The increase in other operating costs primarily relates to an increase in overhead costs, such as facility and IT costs, as we continued to expand our operations to support our growth.
42
Fiscal 2014 Compared to Fiscal 2013
Sales and marketing expense increased $6.5 million, or 63%, in 2014 compared to 2013. The increase was primarily a result of an increase in personnel-related costs of $3.4 million, an increase in marketing program costs of $2.0 million, and an increase in allocated costs of $0.7 million. The increase in personnel-related costs, marketing program costs and other operating costs for 2014 compared to 2013 occurred for the same reasons described in the discussion above.
Research and Product Development
Year Ended December 31, | 2014 to 2015 % Change | 2013 to 2014 % Change | |||||||||||||||
2015 | 2014 | 2013 | |||||||||||||||
(dollars in thousands) | |||||||||||||||||
Research and product development | $ | 9,554 | $ | 6,505 | $ | 5,057 | 47 | % | 29 | % | |||||||
Percentage of revenue | 13 | % | 14 | % | 19 | % | |||||||||||
Fiscal 2015 Compared to Fiscal 2014
Research and product development expense increased $3.0 million, or 47%, in 2015 compared to 2014. The increase was primarily the result of an increase in personnel-related costs net of capitalized software development costs of $2.1 million, and an increase in other operating costs of $1.0 million. The increase in personnel-related and other operating costs in 2015 occurred primarily due to an increase in headcount. The increase in other operating costs was mostly attributable to increased overhead costs such as facility and IT costs as well as other allocated costs from increased headcount and travel expenses.
Fiscal 2014 Compared to Fiscal 2013
Research and product development expense increased $1.4 million, or 29%, in 2014 compared to 2013. The increase was primarily a result of an increase in personnel-related costs, net of capitalized software development costs of $0.9 million, and an increase in allocated costs of $0.3 million. The increase in personnel-related costs was primarily due to a substantial increase in headcount within our research and product development organization. The increase in allocated costs primarily relates to an increase in overhead costs, such as facility and IT costs, as we continued to expand our operations to support our growth.
General and Administrative
Year Ended December 31, | 2014 to 2015 % Change | 2013 to 2014 % Change | |||||||||||||||
2015 | 2014 | 2013 | |||||||||||||||
(dollars in thousands) | |||||||||||||||||
General and administrative | $ | 14,343 | $ | 6,489 | $ | 2,286 | 121 | % | 184 | % | |||||||
Percentage of revenue | 19 | % | 14 | % | 9 | % | |||||||||||
Fiscal 2015 Compared to Fiscal 2014
General and administrative expense increased $7.9 million, or 121%, in 2015 compared to 2014. The increase was primarily the result of an increase in allocated and other operating expenses of $4.6 million and personnel-related costs of $3.2 million. The increase in other operating expenses was mostly attributable to an increase in professional fees in connection with our IPO and becoming a public company of $3.1 million, a payment to a third-party service provider to expedite our transition to a new third-party partner of $0.6 million, legal fees of $0.3 million associated with our acquisition of RentLinx, and an increase in overhead costs, such as facility and IT costs, as we continued to expand our operations to support our growth. The increase in personnel-related costs was primarily due to a substantial increase in headcount within our finance, IT and administrative organizations and includes incremental compensation we agreed to pay to certain RentLinx personnel subject to their continued employment with us.
43
Fiscal 2014 Compared to Fiscal 2013
General and administrative expense increased $4.2 million, or 184%, in 2014 compared to 2013. The increase was primarily a result of an increase in personnel-related costs of $2.6 million, and an increase in other costs of $1.6 million. The increase in personnel-related costs was primarily due to one-time cash bonuses plus applicable tax withholdings, an increase in stock-based compensation, and a substantial increase in headcount within our finance, IT and administrative organizations. The increase in other costs primarily relates to an increase in overhead costs, such as facility and IT costs, as we continued to expand our operations to support our growth.
Depreciation and Amortization
Year Ended December 31, | 2014 to 2015 % Change | 2013 to 2014 % Change | |||||||||||||||
2015 | 2014 | 2013 | |||||||||||||||
(dollars in thousands) | |||||||||||||||||
Depreciation and amortization | $ | 6,104 | $ | 3,805 | $ | 2,850 | 60 | % | 34 | % | |||||||
Percentage of revenue | 8 | % | 8 | % | 11 | % | |||||||||||
Fiscal 2015 Compared to Fiscal 2014
Depreciation and amortization expense increased $2.3 million, or 60%, in 2015 compared to 2014. The increase was primarily due to increased amortization expense of $1.5 million associated with higher capitalized software development balances, increased depreciation expense of $0.4 million related to capital purchases and increased amortization of intangible assets of $0.4 million from the acquisition of RentLinx.
Fiscal 2014 Compared to Fiscal 2013
Depreciation and amortization expense increased $1.0 million, or 34%, in 2014 compared to 2013. The increase was primarily due to increased amortization expense of $0.5 million associated with higher capitalized software development costs and increased depreciation expense of $0.4 million related to capital purchases.
Interest Income (expense), net
Year Ended December 31, | 2014 to 2015 % Change | 2013 to 2014 % Change | |||||||||||||||
2015 | 2014 | 2013 | |||||||||||||||
(dollars in thousands) | |||||||||||||||||
Interest income (expense) | $ | (595 | ) | $ | 59 | $ | 12 | (1,108 | )% | 392 | % | ||||||
Percentage of revenue | (1 | )% | — | % | — | % | |||||||||||
Fiscal 2015 Compared to Fiscal 2014
Interest expense, net increased by $0.7 million in 2015 compared to 2014. The increase is primarily attributable to the interest expense recognized from the write-off of deferred financing costs associated with the repayment of our term loan in 2015 and interest expense incurred for the Credit Agreement. The interest expense was offset by $0.2 million of interest income from our investment securities.
Fiscal 2014 Compared to Fiscal 2013
Interest income increased by $47,000 in 2014 compared to 2013. The increase is primarily attributable to the interest income from the note receivable we hold related to our disposition of SecureDocs in December 2013. For additional information refer to Note 12, Business Disposition of our Consolidated Financial Statements.
44
Provision for Income Taxes
Year Ended December 31, | 2014 to 2015 % Change | 2013 to 2014 % Change | ||||||||||||||
2015 | 2014 | 2013 | ||||||||||||||
(dollars in thousands) | ||||||||||||||||
Provision for income taxes | $ | 75 | $ | — | $ | — | N/A | — | % | |||||||
Percentage of revenue | — | % | — | % | — | % | ||||||||||
Fiscal 2015 compared to Fiscal 2014
The provision for income taxes for 2015 of $75,000 is related to minimum state taxes and the amortization of tax deductible goodwill from the purchase of RentLinx in 2015 that is not an available source of income to realize the deferred tax asset.
45
Quarterly Results of Operations
The following table sets forth selected unaudited quarterly consolidated statements of operations data for each of the eight quarters in the period ended December 31, 2015. We have prepared the unaudited quarterly consolidated statements of operations data on a basis consistent with the audited annual Consolidated Financial Statements included elsewhere in this Annual Report. In the opinion of management, the financial information in this table reflects all adjustments, consisting of normal and recurring adjustments, necessary for the fair statement of this data. This information should be read in conjunction with the Consolidated Financial Statements and related notes included elsewhere in this Annual Report. The results of historical periods are not necessarily indicative of the results for any future period.
Quarter Ended | |||||||||||||||||||||||||||||||
2015 | 2014 | ||||||||||||||||||||||||||||||
December 31, | September 30, | June 30, | March 31, | December 31, | September 30, | June 30, | March 31, | ||||||||||||||||||||||||
(in thousands) | |||||||||||||||||||||||||||||||
Consolidated Statements of Operations Data: | |||||||||||||||||||||||||||||||
Revenue | $ | 20,399 | $ | 20,305 | $ | 18,425 | $ | 15,848 | $ | 13,219 | $ | 13,024 | $ | 11,594 | $ | 9,834 | |||||||||||||||
Costs and operating expenses: | |||||||||||||||||||||||||||||||
Cost of revenue (exclusive of depreciation and amortization)(1) | 9,465 | 9,264 | 8,109 | 7,065 | 6,443 | 5,979 | 5,447 | 4,686 | |||||||||||||||||||||||
Sales and marketing(1) | 7,100 | 7,028 | 6,239 | 5,709 | 5,357 | 4,312 | 3,717 | 3,490 | |||||||||||||||||||||||
Research and product development(1) | 2,594 | 2,797 | 2,154 | 2,009 | 1,946 | 1,838 | 1,576 | 1,145 | |||||||||||||||||||||||
General and administrative(1) | 3,356 | 3,888 | 3,707 | 3,392 | 2,925 | 1,180 | 1,485 | 899 | |||||||||||||||||||||||
Depreciation and amortization | 1,852 | 1,638 | 1,431 | 1,183 | 1,114 | 988 | 886 | 817 | |||||||||||||||||||||||
Total costs and operating expenses | 24,367 | 24,615 | 21,640 | 19,358 | 17,785 | 14,297 | 13,111 | 11,037 | |||||||||||||||||||||||
Operating loss | (3,968 | ) | (4,310 | ) | (3,215 | ) | (3,510 | ) | (4,566 | ) | (1,273 | ) | (1,517 | ) | (1,203 | ) | |||||||||||||||
Other income (expense), net | 13 | (1 | ) | (5 | ) | (2 | ) | (18 | ) | (6 | ) | (29 | ) | (68 | ) | ||||||||||||||||
Interest income (expense), net | 106 | (426 | ) | (243 | ) | (32 | ) | 11 | 11 | 11 | 26 | ||||||||||||||||||||
Loss before income taxes | (3,849 | ) | (4,737 | ) | (3,463 | ) | (3,544 | ) | (4,573 | ) | (1,268 | ) | (1,535 | ) | (1,245 | ) | |||||||||||||||
Provision for income taxes | 41 | 23 | (63 | ) | 74 | — | — | — | — | ||||||||||||||||||||||
Net loss | $ | (3,890 | ) | $ | (4,760 | ) | $ | (3,400 | ) | $ | (3,618 | ) | $ | (4,573 | ) | $ | (1,268 | ) | $ | (1,535 | ) | $ | (1,245 | ) | |||||||
Net loss per share, basic and diluted | $ | (0.12 | ) | $ | (0.14 | ) | $ | (0.36 | ) | $ | (0.41 | ) | $ | (0.52 | ) | $ | (0.14 | ) | $ | (0.18 | ) | $ | (0.14 | ) | |||||||
(1) Includes stock-based compensation expense as follows (in thousands):
Quarter Ended | |||||||||||||||||||||||||||||||
2015 | 2014 | ||||||||||||||||||||||||||||||
December 31, | September 30, | June 30, | March 31, | December 31, | September 30, | June 30, | March 31, | ||||||||||||||||||||||||
(in thousands) | |||||||||||||||||||||||||||||||
Cost of revenue (exclusive of depreciation and amortization) | $ | 38 | $ | 35 | $ | 27 | $ | 24 | $ | 19 | $ | 17 | $ | 16 | $ | 16 | |||||||||||||||
Sales and marketing | 31 | 33 | 28 | 23 | 16 | 12 | 10 | 10 | |||||||||||||||||||||||
Research and product development | 19 | 10 | 7 | 5 | 2 | 3 | 7 | 7 | |||||||||||||||||||||||
General and administrative | 296 | 200 | 150 | 81 | 698 | 26 | 17 | 16 | |||||||||||||||||||||||
Total stock-based compensation expense | $ | 384 | $ | 278 | $ | 212 | $ | 133 | $ | 735 | $ | 58 | $ | 50 | $ | 49 | |||||||||||||||
46
The following table sets forth selected consolidated statements of operations data for the specified periods as a percentage of our revenue for those periods.
Quarter Ended | |||||||||||||||||||||||
2015 | 2014 | ||||||||||||||||||||||
December 31, | September 30, | June 30, | March 31, | December 31, | September 30, | June 30, | March 31, | ||||||||||||||||
(in thousands) | |||||||||||||||||||||||
Consolidated Statements of Operations Data: | |||||||||||||||||||||||
Revenue | 100 | % | 100 | % | 100 | % | 100 | % | 100 | % | 100 | % | 100 | % | 100 | % | |||||||
Costs and operating expenses: | |||||||||||||||||||||||
Cost of revenue (exclusive of depreciation and amortization) | 46 | % | 46 | % | 44 | % | 45 | % | 49 | % | 46 | % | 47 | % | 48 | % | |||||||
Sales and marketing | 35 | % | 35 | % | 34 | % | 36 | % | 41 | % | 33 | % | 32 | % | 35 | % | |||||||
Research and product development | 13 | % | 14 | % | 12 | % | 13 | % | 15 | % | 14 | % | 14 | % | 12 | % | |||||||
General and administrative | 16 | % | 19 | % | 20 | % | 21 | % | 22 | % | 9 | % | 13 | % | 9 | % | |||||||
Depreciation and amortization | 9 | % | 8 | % | 8 | % | 7 | % | 8 | % | 8 | % | 8 | % | 8 | % | |||||||
Total costs and operating expenses | 119 | % | 121 | % | 117 | % | 122 | % | 135 | % | 110 | % | 113 | % | 112 | % | |||||||
Operating loss | (19 | )% | (21 | )% | (17 | )% | (22 | )% | (35 | )% | (10 | )% | (13 | )% | (12 | )% | |||||||
Other expense, net | — | % | — | % | — | % | — | % | — | % | — | % | — | % | (1 | )% | |||||||
Interest income (expense), net | 1 | % | (2 | )% | (1 | )% | — | % | — | % | — | % | — | % | — | % | |||||||
Loss before income taxes | (19 | )% | (23 | )% | (19 | )% | (22 | )% | (35 | )% | (10 | )% | (13 | )% | (13 | )% | |||||||
Provision for income taxes | — | % | — | % | — | % | — | % | — | % | — | % | — | % | — | % | |||||||
Net loss | (19 | )% | (23 | )% | (18 | )% | (23 | )% | (35 | )% | (10 | )% | (13 | )% | (13 | )% | |||||||
Quarterly Revenue and Cost Trends
Our revenue has increased quarter over quarter, reflecting mainly increased revenue from our property manager customers. The overall increase was primarily a result of a quarter-over-quarter increase in the number of our customers and strong customer renewal rates, and an increase in revenue from our Value+ services primarily attributable to the expansion of our electronic payments platform and screening services. We experience some seasonality in our revenue, primarily with respect to our screening services for our property manager customers. Our property manager customers process fewer applications for new tenants during the fourth quarter holiday season; therefore, revenue associated with our screening services typically declines in the fourth quarter of the year. As a result of this seasonal decline in revenue from our screening services, we experienced sequential revenue growth in the fourth quarter of each year at a rate lower than we experienced in other quarters.
Our quarter-over-quarter total costs and operating expenses as a percentage of revenue for each quarter during 2015 remained consistent and scaled with the growth in our business.
Our quarter-over-quarter total costs and operating expenses as a percentage of revenue for each quarter during 2014 remained consistent and scaled with the growth in our business, except for the second and fourth quarters of 2014. During the second quarter of 2014, we experienced an increase in general and administrative expense primarily due to a change in the fair value of contingent consideration and an increase in professional fees. During the fourth quarter of 2014, we experienced an increase in sales and marketing expense primarily due to a substantial increase in headcount within our sales and marketing organization. Additionally, during the fourth quarter of 2014, we experienced an increase in general and administrative expense primarily due to one-time cash bonuses plus applicable tax withholdings, and an increase in stock-based compensation.
47
Liquidity and Capital Resources
Cash and Cash Equivalents
As of December 31, 2015, 2014 and 2013, our principal sources of liquidity were cash and cash equivalents and investment securities, which had an aggregate balance of $56.7 million, $5.4 million and $11.3 million, respectively. In addition, we have a $25.0 million revolving line of credit under which we had an immaterial amount outstanding as of December 31, 2015. Historically, we have financed our operations primarily through private placements of equity securities in the form of convertible preferred stock, debt financing, and cash generated from our operations.
In June 2015, we completed our IPO, resulting in net proceeds of $65.1 million. In July 2015, we sold additional shares to the underwriters, upon their exercise in full of the option we granted them in connection with the IPO resulting in an additional $10.4 million in net proceeds. As a result, the aggregate net proceeds to us from the sale of shares in the IPO, were approximately $75.4 million. This increase in net proceeds resulted in a commensurate increase in our working capital balance as of the closing date. During the third quarter of 2015, we used a portion of the net proceeds to purchase $52.0 million of investment securities, which mature at various times over the next three years.
Working Capital
As of December 31, 2015, 2014 and 2013, we had working capital of $10.6 million, compared to a working capital deficit of $5.7 million as of December 31, 2014 and working capital of $6.9 million as of December 31, 2013. The increase in our working capital was primarily due to an increase in our cash balance and an increase in the current portion of investment securities, each as a result of the net proceeds of the IPO, offset by increases in our accrued employee expenses, accrued expenses and deferred revenue from the continued growth of our business and decreases in our prepaid expenses, current asses and accounts receivable.
Credit Agreement
In October 2015, we amended our Credit Agreement with Wells Fargo. The Credit Agreement provides for a $25.0 millon revolving line of credit, which we refer to as the New Revolving Facility. Subject to customary terms and conditions, we can seek to increase the amount of the credit line by up to $10.0 million, in the form of revolving commitments or term loan debt, although the lenders are under no obligations to make additional amounts available to us. Borrowings bear interest at a fluctuating rate per annum equal to, at our option, (i) a base rate equal to the highest of (a) the federal funds rate plus 1/2 of 1%, (b) London Interbank Offered Rate, or LIBOR, for a one-month interest period plus 1% and (c) the rate of interest in effect for such day as publicly announced from time to time by Wells Fargo as its prime rate, in each case plus an applicable margin of 1.5%, or (ii) LIBOR for the applicable interest period plus an applicable margin of 2.5%. As of December 31, 2015, we had an immaterial amount outstanding under the New Revolving Facility. For additional information regarding our Credit Agreement refer to Note 8, Long-term Debt of our Consolidated Financial Statements.
Liquidity Requirements
We believe that our existing cash and cash equivalents, and our investment securities, together with available borrowings under the New Revolving Facility and cash generated from ongoing operations, will be sufficient to meet our working capital and capital expenditure requirements for at least the next 12 months.
Capital Requirements
Our future capital requirements will depend on many factors, including the continued market acceptance of our software solutions, the change in the number of our customers, the adoption and utilization of our Value+ services by new and existing customers, the timing and extent of the introduction of new core functionality and Value+ services in our existing markets and verticals, the timing and extent of our expansion into adjacent markets or new verticals and the timing and extent of our investments across our organization. In addition, we may in the future enter into arrangements to acquire or invest in complementary businesses, services, technologies or intellectual property rights, although we have no present plans with respect to any acquisitions or investments.
We may be required to seek additional equity or debt financing in order to meet these future capital requirements. If we are unable to raise additional capital when desired, or on terms that are acceptable to us, our business, operating results and financial condition could be adversely affected.
48
Cash Flows
The following table summarizes our cash flows for the periods indicated (in thousands):
Years Ended December 31, | ||||||||||||
2015 | 2014 | 2013 | ||||||||||
Net cash (used in) provided by operating activities | $ | (6,844 | ) | $ | 475 | $ | (4,370 | ) | ||||
Net cash used in investing activities | (59,367 | ) | (6,476 | ) | (265 | ) | ||||||
Net cash provided by financing activities | 72,862 | 144 | 11,961 | |||||||||
Net increase (decrease) in cash and cash equivalents | $ | 6,651 | $ | (5,857 | ) | $ | 7,326 | |||||
Cash (Used in) Provided by Operating Activities
Our primary source of operating cash inflows is cash collected from our customers in connection with their use of our core solutions and Value+ services. Our primary uses of cash from operating activities are for personnel-related expenditures and third-party costs incurred to support the delivery of our software solutions.
For the year ended December 31, 2015, cash used in operating activities was $6.8 million resulting from our net loss of $15.7 million, adjusted by non-cash charges of $6.8 million and a net increase in our operating assets and liabilities of $2.1 million. The net increase in our non-cash charges was primarily the result of an increase of $6.1 million of depreciation and amortization of our property and equipment and capitalized software and $1.0 million of stock-based compensation. The net increase in our operating assets and liabilities was mostly attributable to an increase of $1.9 million in accrued employee expenses related to an overall increase in personnel-related costs, a $1.2 million increase in deferred revenue in line with our increased revenues and a $1.1 million increase in accrued expenses mostly attributed to payment processing fees driven by growth in our Value+ services. The increase in our operating assets and liabilities was offset by an increase in our prepaid expenses and current assets of $1.9 million, and an increase in accounts receivable of $0.7 million in conjunction with our growth and expansion during 2015.
For the year ended December 31, 2014, cash provided by operating activities was $0.5 million resulting from our net loss of $8.6 million, adjusted by non-cash charges of $4.9 million and a net increase of $4.2 million in our operating assets and liabilities. The net increase in our operating assets and liabilities was primarily the result of a $1.8 million increase in accounts payable, a $1.1 million increase in accrued employee expenses related to an overall increase in personnel-related costs, a $1.0 million increase in accrued expenses due to an overall increase in expenditures associated with the growth of our business, and a $0.8 million increase in deferred revenue as a result of increased subscription sales, offset by a $0.4 million decrease in accounts receivable as a result of improved collections.
For the year ended December 31, 2013, cash used in operating activities was $4.4 million resulting from our net loss of $7.3 million, adjusted by non-cash charges of $1.5 million and a net increase of $1.4 million in our operating assets and liabilities. The net increase in our operating assets and liabilities was primarily the result of a $1.2 million increase in accrued employee expenses related to an overall increase in personnel-related costs, a $0.8 million increase in deferred revenue as a result of increased subscription sales, and a $0.3 million increase in accrued expenses due to an overall increase in expenditures associated with the growth of our business, offset by a $0.5 million decrease in accounts receivable as a result of improved collections.
Cash Used in Investing Activities
Cash used in and provided by investing activities is generally comprised of purchases, maturities and sales of investment securities, additions to capitalized software development, cash paid for business acquisitions and purchases and dispositions of capital expenditures.
For the year ended December 31, 2015, investing activities used $59.4 million in cash primarily as a result of $74.2 million of investment securities purchased offset by $19.3 million of maturities and $11.0 million of sales of investment securities. In addition, we had an increase in capitalized software development costs of $7.7 million for the continued investment in our software development, an increase in capital expenditures of $3.7 million to purchase property and equipment for the continued growth and expansion of our business. We also used $4.0 million of cash for the acquisition of RentLinx.
49
For the year ended December 31, 2014, investing activities used $6.5 million in cash primarily as a result of an increase in capitalized software development costs of $4.6 million, and an increase in capital expenditures of $1.9 million to purchase property and equipment.
For the year ended December 31, 2013, investing activities used $0.3 million in cash primarily as a result of an increase in capitalized software development costs of $2.4 million, and an increase in capital expenditures of $1.3 million to purchase property and equipment, offset by maturities of investments in marketable securities of $3.4 million.
Cash Provided by Financing Activities
Cash provided by and used in financing activities was mostly attributable to the net proceeds from the IPO and includes issuance and payments of debt and the receipt of cash from the exercise of stock options and the issuance of restricted stock.
For the year ended December 31, 2015, financing activities provided $72.9 million in cash primarily as a result of net proceeds from the IPO in the amount of $75.4 million, offset by a $2.4 million earnout payment relating to our acquisition of MyCase.
For the year ended December 31, 2014, financing activities provided $0.1 million in cash primarily as a result of proceeds from the exercise of stock options.
For the year ended December 31, 2013, financing activities provided $12.0 million in cash primarily as a result of proceeds from the sale of convertible preferred stock, net of issuance costs, and the exercise of stock options.
Contractual Obligations and Other Commitments
Our principal commitments consist of contractual obligations under our capital and operating leases for office space. The following table summarizes our contractual obligations and other commitments as of December 31, 2015:
Payments Due by Period | |||||||||||||||||||
Total | Less than 1 year | 1 to 3 years | 3 to 5 years | More than 5 years | |||||||||||||||
(in thousands) | |||||||||||||||||||
Capital lease obligations | $ | 31 | $ | 31 | $ | — | $ | — | $ | — | |||||||||
Operating lease obligations | 7,365 | 1,758 | 2,913 | 2,021 | 673 | ||||||||||||||
$ | 7,396 | $ | 1,789 | $ | 2,913 | $ | 2,021 | $ | 673 | ||||||||||
At December 31, 2015, liabilities for unrecognized tax benefits of $2.9 million were not included in our contractual obligations in the table above because, due to their nature, there is a high degree of uncertainty regarding the timing of future cash outflows and other events that would extinguish these liabilities.
In January 2016, we signed a new lease for 14,478 square feet that will replace our existing office in San Diego. The aggregate annual payments under the new lease will be approximately $0.4 million and are subject to annual increases over the lease term, which expires in February 2021.
For additional information regarding our contractual obligations, commitments and indemnification arrangements refer to Note 9, Commitments and Contingencies of our Consolidated Financial Statements.
Off-Balance Sheet Arrangements
As of December 31, 2015, we did not have any relationships with unconsolidated organizations or financial partnerships, such as structured finance or special purpose entities that have been established for the purpose of facilitating off-balance sheet arrangements or for other purposes.
50
Critical Accounting Policies and Estimates
Our financial statements and the related notes included elsewhere in this prospectus are prepared in accordance with GAAP. The preparation of our financial statements requires us to make estimates and assumptions that affect the reported amounts of assets, liabilities, revenue, costs and operating expenses, provision for income taxes and related disclosures. We base our estimates on historical experience and on various other assumptions that we believe to be reasonable under the circumstances. However, actual results could differ significantly from the estimates made by our management. We evaluate our estimates and assumptions on an ongoing basis. To the extent that there are material differences between these estimates and actual results, our future financial statement presentation, financial condition, results of operations and cash flows will be affected.
We believe that the following critical accounting policies involve a greater degree of judgment or complexity than our other accounting policies. Accordingly, these are the policies we believe are the most critical to a full understanding and evaluation of our Consolidated Financial Statements. For additional information, refer to Note 2, Summary of Significant Accounting Policies of our Consolidated Financial Statements.
Revenue Recognition
We charge our customers on a subscription basis for our core solutions and many of our Value+ services. Our subscription fees are designed to scale to the size of our customers’ businesses. Our core solutions refer to the base subscriptions for our cloud-based property management and legal software solutions. Value+ services recognized on a subscription basis include website hosting, insurance and contact center services. Subscription fees for our core solutions are charged on a per-unit per-month basis for our property management software solution and on a per-user per-month basis for our legal software solution. Website hosting fees are charged based on the number of websites hosted per month. Insurance and contact center fees are charged on a per-unit per-month basis. We recognize subscription revenue ratably over the terms of the subscription agreements, which range from one month to one year. We offer customers a free-trial period to try our software. Revenue is not recognized until the free-trial period is complete and the customer has entered into a subscription agreement with us. We generally invoice our customers for subscription services in monthly, quarterly or annual installments, typically in advance of the subscription period. As a result, we do not have significant deferred revenue because our invoicing is generally for periods less than one year.
We also charge our customers usage-based fees for using certain Value+ services, although fees for electronic payment processing are generally paid by the clients of our customers. Usage-based services include background and credit checks and electronic payment services. Usage-based fees are charged on a flat fee per transaction basis with no minimum usage commitments. We recognize revenue for usage-based services in the period the service is rendered. We generally invoice our customers for usage-based services on a monthly basis for services rendered in the preceding month.
We also offer our customers assistance with on-boarding our core solutions, as well as website design services. These services are generally purchased as part of a subscription agreement, and are typically performed within the first several months of the arrangement. We recognize revenue for these one-time services upon completion of the related service. We generally invoice our customers for one-time services in advance of the services being completed.
We recognize revenue when (i) there is persuasive evidence of an arrangement, (ii) our software solutions have been made available or delivered, or services have been performed, (iii) the amount of fees is fixed or determinable, and (iv) collectability is reasonably assured. Evidence of an arrangement generally consists of either a signed customer contract or an online click-through agreement. We consider that delivery of a solution or website has commenced once we provide the customer with access to use the solution or website. Fees are fixed based on rates specified in the subscription agreements, which do not provide for any refunds or adjustments. If collectability is not considered reasonably assured, revenue is deferred until the fees are collected. Some of our subscription agreements contain minimum cancellation fees in the event that the customer cancels the subscription early.
As customers do not have the right to the underlying software code for our software solutions, our revenue arrangements are outside the scope of software revenue recognition guidance.
Multiple-Deliverable Arrangements
The majority of customer arrangements include multiple deliverables. We therefore recognize revenue in accordance with ASU 2009-13, Revenue Recognition (Topic 605)-Multiple-Deliverable Revenue Arrangements-a Consensus of the Emerging Issues Task Force, or ASU 2009-13.
For multiple-deliverable arrangements, we first assess whether each deliverable has value to the customer on a standalone basis. We have determined that the subscription services related to our core solutions have value on a standalone basis because,
51
once access is provided, they are fully functional and do not require additional development, modification or customization. Subscription services related to website hosting, insurance services and contact center services have value on a standalone basis as the services are sold separately by other vendors and not essential to the functionality of the other deliverables. Usage-based services have value to the customer on a standalone basis as they are sold separately by other vendors and are not essential to the functionality of the other deliverables. The usage-based services are typically entered into subsequent to the initial customer arrangement. In multiple-deliverable arrangements that contain usage-based services, the customer has the option to purchase the services on an ad hoc basis, and payments are made when the services are rendered. The one-time services to assist our customers with on-boarding our core solutions, as well as website design services, have value on a standalone basis as these services do not require highly specialized or skilled individuals to perform them, are not essential to the functionality of our software solutions and may be performed by the customer or another vendor.
Based on the standalone value of the deliverables, and since our customers do not have a general right of return, we allocate revenue among the separate non-contingent deliverables in a multiple-deliverable arrangement under the relative selling price method using the selling price hierarchy established in ASU 2009-13. Usage-based services are not included in the relative revenue allocation at the inception of the arrangement as they are contingent on the customer’s use of the applicable Value+ service. Usage-based services do not contain any significant incremental discounts. The ASU 2009-13 selling price hierarchy requires the selling price of each deliverable in a multiple-deliverable arrangement to be based on, in descending order, (i) vendor-specific objective evidence of fair value, or VSOE, (ii) third-party evidence of fair value, or TPE, or (iii) management’s best estimate of the selling price, or BESP.
For our core solutions, we have established VSOE based on our consistent historical pricing and discounting practices for customer renewals where the customer only subscribes to our core solutions. In establishing VSOE, the substantial majority of the selling prices for our core solutions fall within a reasonably narrow pricing range.
For our Value+ services and services relating to on-boarding our core solutions, as well as website design services, we were not able to determine VSOE because they are not sold by us separately from other deliverables. In addition, we considered whether TPE existed for these services and determined TPE existed for our website hosting based on prices charged by other companies selling similar services separately. For our remaining services, the selling prices of other deliverables are based on BESP. The determination of BESP requires us to make significant judgments and estimates. We consider numerous factors, including the nature of the deliverables themselves, the market conditions and competitive landscape for the sale, internal costs, and our published pricing and discounting practices. We maintain pricing transparency and adhere to our published price lists in selling these services to our customers. We update our estimates of BESP on an ongoing basis as events and circumstances may require.
After the contract value is allocated to each non-contingent deliverable in a multiple-deliverable arrangement based on the relative selling price, revenue is recognized for each deliverable based on the pattern in which the revenue is earned. For subscriptions services, revenue is recognized on a straight-line basis over the subscription period. For usage-based services, revenue is recognized as the services are rendered. For one-time services, revenue is recognized upon completion of the related services.
We record amounts collected from our customers in advance of recognizing revenue as deferred revenue. Deferred revenue that will be recognized as revenue within one year from the respective balance sheet date is recorded as current deferred revenue and the remaining portion, if any, is recorded as noncurrent.
Internal-Use Software
We account for the costs of computer software obtained or developed for internal use in accordance with Accounting Standards Codification, or ASC, 350, Intangibles-Goodwill and Other, or ASC 350. These include costs incurred in connection with the development of our internal-use software solutions when (i) the preliminary project stage is completed, (ii) management has authorized further funding for the completion of the project and (iii) it is probable that the project will be completed and perform as intended. These capitalized costs include personnel and related expenses for employees who are directly associated with and who devote time to internal-use software projects and, when material, interest costs incurred during the development. Capitalization of these costs ceases once the project is substantially complete and the software is ready for its intended purpose. Costs incurred for significant upgrades and enhancements to our software solutions are also capitalized. Costs incurred for post-configuration training, maintenance and minor modifications or enhancements are expensed as incurred. Capitalized software development costs are amortized using the straight-line method over an estimated useful life of three years. We do not transfer ownership of our software, or lease our software, to third parties.
52
Business Combinations
The results of a business acquired in a business combination are included in our consolidated financial statements from the date of acquisition. We allocate the purchase price, including the fair value of contingent consideration, to the identifiable assets and liabilities of the acquired business at their acquisition date fair values. The excess of the purchase price over the amount allocated to the identifiable assets and liabilities, if any, is recorded as goodwill.
Determining the fair value of assets acquired and liabilities assumed requires management to make significant judgments and estimates, including the selection of valuation methodologies, estimates of future revenue and cash flows, discount rates and selection of comparable companies.
When we issue awards to an acquired company’s stockholders, we evaluate whether the awards are contingent consideration or compensation for post-acquisition services. The evaluation includes, among other things, whether the vesting of the awards is contingent on the continued employment of the selling stockholder beyond the acquisition date. If continued employment is required for vesting, the awards are treated as compensation for post-acquisition services and recognized as an expense over the requisite service period.
Acquisition-related transaction costs are not included as a component of consideration transferred, but are accounted for as an expense in the period in which the costs are incurred.
ASC 350 provides that an entity has the option to first assess qualitative factors to determine whether the existence of events or circumstances leads to a determination that it is more likely than not that the fair value of a reporting unit is less than its carrying amount. If, after assessing the totality of events or circumstances, an entity determines it is not more likely than not that the fair value of a reporting unit is less than its carrying amount, then additional impairment testing is not required. However, if an entity concludes otherwise, then it is required to perform the first of a two-step impairment test.
The first step involves comparing the estimated fair value of a reporting unit with its book value, including goodwill. If the estimated fair value exceeds book value, goodwill is considered not to be impaired and no additional steps are necessary. If, however, the fair value of the reporting unit is less than book value, then the carrying amount of the goodwill is compared with its implied fair value. The estimate of implied fair value of goodwill may require valuations of certain internally generated and unrecognized intangible assets. If the carrying amount of goodwill exceeds the implied fair value of that goodwill, an impairment loss is recognized in an amount equal to the excess.
We have one reporting unit and we test for goodwill impairment annually during the fourth quarter of the calendar year. At December 31, 2015, we determined our goodwill was not impaired as the fair value of our reporting unit significantly exceeded its carrying value.
Stock-Based Compensation
We account for stock-based compensation awards granted to employees and directors by recording compensation expense based on the awards’ grant-date estimated fair value, in accordance with ASC 718, Compensation-Stock Compensation, or ASC 718. We estimate the fair value of restricted stock awards and restricted stock units ("RSUs") based on the fair value of our common stock on the date of grant. We estimate the fair value of stock options using the Black-Scholes option-pricing model. Determining the fair value of stock option awards under this model requires highly subjective assumptions, including the fair value of the underlying common stock, the risk-free interest rate, the expected term of the award, the expected volatility of the price of our common stock for periods prior to our IPO, and the expected dividend yield of our common stock. These estimates involve inherent uncertainties and the application of management’s judgment. If we had made different assumptions, our stock-based compensation expense could have been materially different.
Stock Options
These assumptions and estimates are as follows:
Fair Value of Common Stock
Prior to our IPO, there was no public market for our common stock and our board of directors determined the fair value of our common stock at the time of the grant of stock options and restricted stock awards by considering a number of objective and subjective factors, including our actual operating and financial performance, market conditions and performance of comparable publicly traded companies, developments and milestones in our company, the likelihood of achieving a liquidity event and transactions involving our convertible preferred stock, among other factors. The fair value of the underlying common stock was determined by our board of directors in accordance with applicable elements of the practice aid issued by the American Institute
53
of Certified Public Accountants Valuation of Privately Held Company Equity Securities Issued as Compensation. In valuing our common stock at various dates, our board of directors determined our equity value generally using the income approach and the market comparable approach valuation methods. Once we determined our equity value, we used an option pricing method or the Probability Weighted Expected Return Method to allocate the equity value to preferred stock and common stock. Application of these approaches and methods involves the use of estimates, judgments and assumptions, such as future revenue, expenses and cash flows, selections of comparable companies, probabilities and timing of exit events, and other factors.
Since our IPO in June 2015, the fair value of our common stock is based on the closing price of our common stock, as quoted on the NASDAQ Global Market, on the date of grant.
Our board of directors grants stock options with exercise prices equal to the fair value of our common stock on the date of grant.
Risk-Free Interest Rate
The risk free interest rate assumption is based upon observed interest rates on United States government securities appropriate for the expected term of the stock option.
Expected Term
Given we do not have sufficient exercise history to develop reasonable expectations about future exercise patterns and post-vesting employment termination behavior, we determine the expected term using the simplified method, which is calculated as the midpoint of the stock option vesting term and the expiration date of the stock option.
Expected Volatility
We determine the expected volatility based on the historical average volatilities of publicly traded industry peers. We intend to continue to consistently apply this methodology using the same or similar public companies until a sufficient amount of historical information regarding the volatility of our own common stock price becomes available, unless circumstances change such that the identified companies are no longer similar to us, in which case, more suitable companies whose stock prices are publicly available would be utilized in the calculation.
Expected Dividend Yield
We have not paid and do not anticipate paying any cash dividends in the foreseeable future and, therefore, we use an expected dividend yield of zero.
The following table summarizes information relating to our stock options granted in the years ended December 31, 2015, 2014 and 2013:
Year Ended December 31, | ||||||||||||
2015 | 2014 | 2013 | ||||||||||
Stock options granted (in thousands) | 359 | 702 | 126 | |||||||||
Weighted average exercise price per share | $ | 9.53 | $ | 4.60 | $ | 1.80 | ||||||
Weighted average grant-date fair value per share | $ | 6.89 | $ | 2.20 | $ | 0.88 | ||||||
Weighted average Black-Scholes model assumptions: | ||||||||||||
Risk-free interest rate | 1.58 | % | 1.86 | % | 1.24 | % | ||||||
Expected term (in years) | 6.2 | 6.2 | 6.0 | |||||||||
Expected volatility | 46 | % | 48 | % | 51 | % | ||||||
Expected dividend yield | — | — | — | |||||||||
In addition to the assumptions used in the Black-Scholes option-pricing model, we also estimate a forfeiture rate to calculate our stock-based compensation expense for our awards. The forfeiture rate is based on an analysis of actual forfeitures. We will continue to evaluate the appropriateness of the forfeiture rate based on actual forfeiture experience, analysis of employee turnover, and other factors. Changes in the estimated forfeiture rate can have a significant impact on our stock-based compensation expense as the cumulative effect of adjusting the rate is recognized in the period the estimated forfeiture rate is changed. If a revised forfeiture rate is higher than the previously estimated forfeiture rate, an adjustment is made that will result in a decrease to our stock-based compensation expense recognized in our consolidated financial statements. If a revised forfeiture rate is lower than
54
the previously estimated forfeiture rate, an adjustment is made that will result in an increase to our stock-based compensation expense recognized in our consolidated financial statements.
Restricted Stock Units
In 2015, we began granting RSUs with a total fixed dollar amount. The vesting of RSUs is in equal tranches over four annual periods. On the first day of each vesting period, the number of shares to be issued is determined by dividing the fixed dollar amount of the portion of the RSUs that vest in that tranche by the closing price of our Class A common stock on the vesting date. The fixed monetary amount is recognized as expense on a straight-line basis over the vesting period. The shares underlying the RSU grants are not issued and outstanding until the applicable vesting date.
Income Taxes
We account for income taxes in accordance with ASC 740, Income Taxes, or ASC 740. ASC 740 requires the recognition of deferred tax assets and liabilities for the expected future tax consequences of temporary differences between the carrying amounts and the tax bases of assets and liabilities. Deferred income tax assets and liabilities are measured using enacted tax rates expected to apply to taxable income in the years in which those temporary differences are expected to be recovered or settled. The effect of a change in tax rates on deferred tax assets and liabilities is recognized in the consolidated statements of operations in the period that includes the enactment date. A valuation allowance is recorded when it is more likely than not that some of the deferred tax assets will not be realized.
We recognize the tax benefit from an uncertain tax position only if it is more likely than not that the tax position will be sustained on examination by the taxing authorities, based on the technical merits of the position. The tax benefits recognized in our consolidated financial statements from such positions are then measured based on the largest benefit that has a greater than 50% likelihood of being realized. We recognize interest and penalties accrued with respect to uncertain tax positions, if any, in our provision for income taxes in the consolidated statements of operations.
Recent Accounting Pronouncements
For information regarding recent accounting pronouncements, refer to Note 2, Summary of Significant Accounting Policies of our Consolidated Financial Statements.
ITEM 7A. QUALITATIVE AND QUANTITATIVE DISCLOSURE ABOUT MARKET RISK
Interest Rate Risk
At December 31, 2015, we had cash and cash equivalents of $12.1 million consisting of bank deposits and money market funds and $44.7 million of investment securities which are comprised of fixed rate debt securities and certificates of deposit. We did not purchase these investments for trading or speculative purposes and have not used any derivative financial instruments to manage our interest rate risk exposure.
In September 2015, we began investing in corporate debt securities, agency securities and certificate of deposits which we collectively refer to as investment securities. The primary objectives of investing the investment securities is to support our liquidity and capital needs. Our investment securities are exposed to market risk due to interest rate fluctuations. While fluctuations in interest rates do not impact our interest income from our investment securities as all of these securities have fixed interest rates, changes in interest rates may impact the fair value of the investment securities. Since our investment securities are held as available for sale, all changes in fair value impact our other comprehensive income unless an investment security is considered impaired in which case changes in fair value are reported in other expense. As of December 31, 2015, a hypothetical 100 basis point decrease in interest rates would have resulted in an approximate increase in fair value or unrealized gain of $0.7 million and a hypothetical 100 basis point decrease in interest rates would have resulted in an approximate decrease in fair value or unrealized loss of $0.7 million. This estimate is based on a sensitivity model which measures an instant change in interest rates by 1% or 100 basis points at December 31, 2015.
The borrowings under our Credit Agreement are at variable interest rates and our capital lease obligations are at fixed rates, however both have an immaterial balance at December 31, 2015.
Inflation Risk
We have not been exposed to, nor do we anticipate being exposed to, material risks due to changes in inflation rates.
55
ITEM 8. FINANCIAL STATEMENTS AND SUPPLEMENTRY DATA
INDEX TO CONSOLIDATED FINANCIAL STATEMENTS
Page | |
56
REPORT OF INDEPENDENT REGISTERED PUBLIC ACCOUNTING FIRM
To the Board of Directors and Stockholders of AppFolio, Inc.
In our opinion, the consolidated financial statements listed in the accompanying index present fairly, in all material respects, the financial position of AppFolio, Inc. and its subsidiaries at December 31, 2015 and 2014, and the results of their operations and their cash flows for each of the three years in the period ended December 31, 2015 in conformity with accounting principles generally accepted in the United States of America. These financial statements are the responsibility of the Company's management. Our responsibility is to express an opinion on these financial statements based on our audits. We conducted our audits of these statements in accordance with the standards of the Public Company Accounting Oversight Board (United States). Those standards require that we plan and perform the audit to obtain reasonable assurance about whether the financial statements are free of material misstatement. An audit includes examining, on a test basis, evidence supporting the amounts and disclosures in the financial statements, assessing the accounting principles used and significant estimates made by management, and evaluating the overall financial statement presentation. We believe that our audits provide a reasonable basis for our opinion.
/s/ PricewaterhouseCoopers LLP
Los Angeles, California
February 29, 2016
57
APPFOLIO, INC.
CONSOLIDATED BALANCE SHEETS
(in thousands, except par values)
December 31, | ||||||||
2015 | 2014 | |||||||
Assets | ||||||||
Current assets | ||||||||
Cash and cash equivalents | $ | 12,063 | $ | 5,412 | ||||
Investment securities—current | 10,235 | — | ||||||
Accounts receivable, net | 2,048 | 1,191 | ||||||
Prepaid expenses and other current assets | 3,160 | 1,204 | ||||||
Total current assets | 27,506 | 7,807 | ||||||
Investment securities—noncurrent | 34,417 | — | ||||||
Property and equipment, net | 6,107 | 2,623 | ||||||
Capitalized software, net | 10,022 | 5,509 | ||||||
Goodwill | 6,737 | 4,998 | ||||||
Intangible assets, net | 4,516 | 3,615 | ||||||
Other assets | 1,176 | 882 | ||||||
Total assets | $ | 90,481 | $ | 25,434 | ||||
Liabilities, Convertible Preferred Stock and Stockholders’ Equity (Deficit) | ||||||||
Current liabilities | ||||||||
Accounts payable | $ | 2,369 | $ | 2,088 | ||||
Accrued employee expenses | 5,159 | 3,150 | ||||||
Accrued expenses | 3,340 | 1,721 | ||||||
Deferred revenue | 4,953 | 3,772 | ||||||
Other current liabilities | 1,084 | 2,797 | ||||||
Total current liabilities | 16,905 | 13,528 | ||||||
Deferred revenue | — | 8 | ||||||
Other liabilities | 879 | 199 | ||||||
Total liabilities | 17,784 | 13,735 | ||||||
Commitments and contingencies (Note 9) | ||||||||
Convertible preferred stock, Series A, B, B-1, B-2 and B-3, $0.0001 par value, 68,027 shares authorized, issued and outstanding as of December 31, 2014. Liquidation preference of $62,020 as of December 31, 2014. | — | 63,166 | ||||||
Stockholders’ equity (deficit): | ||||||||
Preferred stock, $0.0001 par value, 25,000 authorized and no shares issued and outstanding as of December 31, 2015 | — | — | ||||||
Class A common stock, $0.0001 par value, 250,000 shares authorized as of December 31, 2015; 9,005 shares issued and outstanding as of December 31, 2015 | 1 | — | ||||||
Class B common stock, $0.0001 par value, 50,000 shares authorized as of December 31, 2015; 24,541 and 9,042 shares issued and outstanding as of December 31, 2015 and December 31, 2014, respectively; | 3 | 1 | ||||||
Additional paid-in capital | 141,528 | 1,546 | ||||||
Accumulated other comprehensive loss | (153 | ) | — | |||||
Accumulated deficit | (68,682 | ) | (53,014 | ) | ||||
Total stockholders’ equity (deficit) | 72,697 | (51,467 | ) | |||||
Total liabilities, convertible preferred stock and stockholders’ equity (deficit) | $ | 90,481 | $ | 25,434 | ||||
The accompanying notes to the Consolidated Financial Statements are an integral part of these statements.
58
APPFOLIO, INC.
CONSOLIDATED STATEMENTS OF OPERATIONS
(in thousands, except per share amounts)
Year Ended December 31, | |||||||||||
2015 | 2014 | 2013 | |||||||||
Revenue | $ | 74,977 | $ | 47,671 | $ | 26,542 | |||||
Costs and operating expenses: | |||||||||||
Cost of revenue (exclusive of depreciation and amortization) | 33,903 | 22,555 | 13,616 | ||||||||
Sales and marketing | 26,076 | 16,876 | 10,337 | ||||||||
Research and product development | 9,554 | 6,505 | 5,057 | ||||||||
General and administrative | 14,343 | 6,489 | 2,286 | ||||||||
Depreciation and amortization | 6,104 | 3,805 | 2,850 | ||||||||
Total costs and operating expenses | 89,980 | 56,230 | 34,146 | ||||||||
Loss from operations | (15,003 | ) | (8,559 | ) | (7,604 | ) | |||||
Other income (expense), net | 5 | (121 | ) | 287 | |||||||
Interest income (expense), net | (595 | ) | 59 | 12 | |||||||
Loss before provision for income taxes | (15,593 | ) | (8,621 | ) | (7,305 | ) | |||||
Provision for income taxes | 75 | — | — | ||||||||
Net loss | $ | (15,668 | ) | $ | (8,621 | ) | $ | (7,305 | ) | ||
Net loss per share, basic and diluted | (0.73 | ) | (0.98 | ) | (0.87 | ) | |||||
Weighted average common shares outstanding, basic and diluted | 21,336 | 8,757 | 8,437 | ||||||||
The accompanying notes to the Consolidated Financial Statements are an integral part of these statements.
59
APPFOLIO, INC.
CONSOLIDATED STATEMENTS OF COMPREHENSIVE LOSS
(in thousands)
Year Ended December 31, | |||||||||||
2015 | 2014 | 2013 | |||||||||
Net loss | $ | (15,668 | ) | $ | (8,621 | ) | $ | (7,305 | ) | ||
Other comprehensive loss: | |||||||||||
Changes in unrealized losses on investment securities | (153 | ) | — | — | |||||||
Comprehensive loss | $ | (15,821 | ) | $ | (8,621 | ) | $ | (7,305 | ) | ||
The accompanying notes to the Consolidated Financial Statements are an integral part of these statements.
60
APPFOLIO, INC.
CONSOLIDATED STATEMENTS OF CONVERTIBLE
PREFERRED STOCK AND STOCKHOLDERS' EQUITY (DEFICIT)
(in thousands)
Accumulated | |||||||||||||||||||||||||||||||||||||
Additional | Other | ||||||||||||||||||||||||||||||||||||
Convertible | Common Stock | Common Stock | Paid-in | Comprehensive | Accumulated | ||||||||||||||||||||||||||||||||
Preferred Stock | Class A | Class B | Capital | Loss | Deficit | Total | |||||||||||||||||||||||||||||||
Shares | Amount | Shares | Amount | Shares | Amount | ||||||||||||||||||||||||||||||||
Balance December 31, 2012 | 61,950 | $ | 51,288 | — | $ | — | 8,540 | $ | 1 | $ | 103 | $ | — | $ | (37,088 | ) | $ | (36,984 | ) | ||||||||||||||||||
Issuance of restricted stock | — | — | — | — | 224 | — | — | — | — | — | |||||||||||||||||||||||||||
Exercise of stock options | — | — | — | — | 120 | — | 83 | — | — | 83 | |||||||||||||||||||||||||||
Forfeiture of restricted stock | — | — | — | — | (13 | ) | — | — | — | — | — | ||||||||||||||||||||||||||
Issuance of preferred stock, net of issuance cost | 6,077 | 11,878 | — | — | — | — | — | — | — | — | |||||||||||||||||||||||||||
Stock-based compensation | — | — | — | — | — | — | 247 | — | — | 247 | |||||||||||||||||||||||||||
Net loss | — | — | — | — | — | — | — | — | (7,305 | ) | (7,305 | ) | |||||||||||||||||||||||||
Balance December 31, 2013 | 68,027 | 63,166 | — | — | 8,871 | 1 | 433 | — | (44,393 | ) | (43,959 | ) | |||||||||||||||||||||||||
Exercise of stock options | — | — | — | — | 171 | — | 168 | — | 168 | ||||||||||||||||||||||||||||
Stock-based compensation | — | — | — | — | — | — | 945 | — | 945 | ||||||||||||||||||||||||||||
Net loss | — | — | — | — | — | — | — | (8,621 | ) | (8,621 | ) | ||||||||||||||||||||||||||
Balance at December 31, 2014 | 68,027 | 63,166 | — | — | 9,042 | 1 | 1,546 | — | (53,014 | ) | (51,467 | ) | |||||||||||||||||||||||||
Exercise of stock options | — | — | 2 | — | 315 | 357 | — | — | 357 | ||||||||||||||||||||||||||||
Stock-based compensation | — | — | — | — | — | — | 1,103 | — | — | 1,103 | |||||||||||||||||||||||||||
Conversion of convertible preferred stock in connection with initial public offering | (68,027 | ) | (63,166 | ) | — | — | 17,007 | 2 | 63,164 | — | — | 63,166 | |||||||||||||||||||||||||
Issuance of common stock in connection with initial public offering, net of offering costs | — | — | 7,130 | 1 | — | — | 75,358 | — | — | 75,359 | |||||||||||||||||||||||||||
Conversion of Class B stock to Class A stock | — | — | 1,848 | — | (1,848 | ) | — | — | — | — | — | ||||||||||||||||||||||||||
Issuance of restricted stock | — | — | 25 | — | 25 | — | — | — | — | — | |||||||||||||||||||||||||||
Unrealized loss on investment securities | — | — | — | — | — | — | — | (153 | ) | — | (153 | ) | |||||||||||||||||||||||||
Net loss | — | — | — | — | — | — | — | — | (15,668 | ) | (15,668 | ) | |||||||||||||||||||||||||
Balance at December 31, 2015 | — | — | 9,005 | $ | 1 | 24,541 | $ | 3 | $ | 141,528 | $ | (153 | ) | $ | (68,682 | ) | $ | 72,697 | |||||||||||||||||||
The accompanying notes to the Consolidated Financial Statements are an integral part of these statements.
61
APPFOLIO, INC.
CONSOLIDATED STATEMENTS OF CASH FLOWS
(in thousands)
Year Ended December 31, | |||||||||||
2015 | 2014 | 2013 | |||||||||
Cash from operating activities | |||||||||||
Net loss | $ | (15,668 | ) | $ | (8,621 | ) | $ | (7,305 | ) | ||
Adjustments to reconcile net loss to net cash provided by (used in) operating activities: | |||||||||||
Depreciation and amortization | 6,104 | 3,805 | 2,850 | ||||||||
Purchased investment premium, net of amortization | (865 | ) | — | — | |||||||
Amortization of deferred financing costs | 456 | — | — | ||||||||
Loss on disposal of property, equipment and intangibles | 67 | 116 | 47 | ||||||||
Stock-based compensation | 1,007 | 892 | 247 | ||||||||
Gain on sale to SecureDocs | — | — | (271 | ) | |||||||
Change in fair value of contingent consideration | — | 26 | (1,337 | ) | |||||||
Loss on equity-method investment | — | 19 | — | ||||||||
Changes in operating assets and liabilities, net of business acquisition: | |||||||||||
Accounts receivable | (746 | ) | (401 | ) | (490 | ) | |||||
Prepaid expenses and other current assets | (1,893 | ) | (549 | ) | (423 | ) | |||||
Other assets | (56 | ) | (5 | ) | 60 | ||||||
Accounts payable | (439 | ) | 1,831 | (146 | ) | ||||||
Accrued employee expenses | 1,887 | 1,088 | 1,168 | ||||||||
Accrued expenses | 1,135 | 1,011 | 308 | ||||||||
Deferred revenue | 1,173 | 837 | 766 | ||||||||
Other liabilities | 994 | 426 | 156 | ||||||||
Net cash (used in) provided by operating activities | (6,844 | ) | 475 | (4,370 | ) | ||||||
Cash from investing activities | |||||||||||
Purchases of property and equipment | (3,694 | ) | (1,878 | ) | (1,260 | ) | |||||
Additions to capitalized software | (7,677 | ) | (4,567 | ) | (2,370 | ) | |||||
Purchases of investment securities | (74,176 | ) | — | — | |||||||
Sales of investment securities | 10,977 | — | — | ||||||||
Maturities of investment securities | 19,259 | — | 3,423 | ||||||||
Cash paid in business acquisition, net of cash acquired | (4,039 | ) | — | — | |||||||
Purchases of intangible assets | (17 | ) | (31 | ) | (58 | ) | |||||
Net cash used in investing activities | (59,367 | ) | (6,476 | ) | (265 | ) | |||||
Cash from financing activities | |||||||||||
Proceeds from stock option exercises | 357 | 168 | 83 | ||||||||
Proceeds from issuance of restricted stock | 141 | — | — | ||||||||
Proceeds from issuance of options | 208 | — | — | ||||||||
Principal payments under capital lease obligations | (27 | ) | (24 | ) | — | ||||||
Proceeds from issuance of convertible preferred stock, net of issuance costs | — | — | 11,878 | ||||||||
Proceeds from initial public offering, net of underwriting discounts and commissions | 79,570 | — | — | ||||||||
Payments of initial public offering costs | (4,213 | ) | — | — | |||||||
Payment of contingent consideration | (2,429 | ) | — | — | |||||||
Proceeds from issuance of debt | 10,253 | — | — | ||||||||
Principal payments on debt | (10,241 | ) | — | — | |||||||
Payment of debt issuance costs | (757 | ) | — | — | |||||||
Net cash provided by financing activities | 72,862 | 144 | 11,961 | ||||||||
62
APPFOLIO, INC. | |||||||||||
CONSOLIDATED STATEMENTS OF CASH FLOWS | |||||||||||
(in thousands) | |||||||||||
Year Ended December 31, | |||||||||||
2015 | 2014 | 2013 | |||||||||
Net cash increase (decrease) in cash and cash equivalents | 6,651 | (5,857 | ) | 7,326 | |||||||
Cash and cash equivalents | |||||||||||
Beginning of period | 5,412 | 11,269 | 3,943 | ||||||||
End of period | $ | 12,063 | $ | 5,412 | $ | 11,269 | |||||
Supplemental disclosure of cash flow Information | |||||||||||
Cash paid for interest | $ | 797 | $ | — | $ | — | |||||
Cash paid for taxes | 91 | — | — | ||||||||
Noncash investing and financing activities | |||||||||||
Purchases of property and equipment included in accounts payable and accrued expenses | $ | 1,220 | $ | 46 | $ | 6 | |||||
Additions of capitalized software included in accrued employee expenses | 290 | — | — | ||||||||
Stock-based compensation capitalized for software development | 166 | 53 | — | ||||||||
Assets acquired under capital lease | — | — | 82 | ||||||||
Notes and equity method investment received in exchange for property and intangible assets | — | — | 360 | ||||||||
Conversion of convertible preferred stock into common stock in connection with initial public offering | 63,166 | — | — | ||||||||
The accompanying notes to the Consolidated Financial Statements are an integral part of these statements.
63
APPFOLIO, INC.
NOTES TO CONSOLIDATED AUDITED FINANCIAL STATEMENTS
1. Nature of Business
Overview
AppFolio, Inc. (“we” or “AppFolio”) provides industry-specific, cloud-based software solutions for small and medium-sized businesses (“SMBs”) in the property management and legal industries. Our platform is designed to be the system of record to automate essential business processes and the system of engagement to enhance business interactions between our customers and their clients and vendors. Our mobile-optimized software solutions have a user-friendly interface across multiple devices, enabling our customers to work at any time and from anywhere. Our property management software provides small and medium-sized property managers with an end-to-end solution to their business needs, enabling them to manage properties quickly and easily in a single, integrated environment. Our legal software provides solo practitioners and small law firms with a streamlined practice and case management solution, allowing them to manage their practices and case load within a flexible system. We also offer optional, but often mission-critical, Value+ services, such as our professionally designed websites and electronic payment services, which are seamlessly built into our core solutions.
Recent Events
▪ | On June 30, 2015, we completed an initial public offering ("IPO") of our Class A common stock, refer to Note 10, Stockholders' Equity (Deficit) for additional information. |
▪ | On June 4, 2015, we effected a one for four reverse stock split of our common and convertible preferred stock, refer to Note 10, Stockholders' Equity (Deficit) for additional information. |
▪ | On April 1, 2015, we completed the acquisition of RentLinx. LLC ("RentLinx"), refer to Note 3, Acquisition of RentLinx. |
2. Summary of Significant Accounting Policies
Basis of Presentation and Significant Accounting Policies
The accompanying Consolidated Financial Statements were prepared in accordance with accounting principles generally accepted in the United States of America (“GAAP”).
Principles of Consolidation
The accompanying Consolidated Financial Statements include the operations of AppFolio, Inc. and its wholly owned subsidiaries. All intercompany balances and transactions have been eliminated in consolidation.
Our investment in SecureDocs, Inc. (“SecureDocs”) is accounted for under the equity method of accounting as we have the ability to exert significant influence, but do not control and are not the primary beneficiary of the entity. Our proportional share of earnings or losses of SecureDocs is included in other income (expense), net in the consolidated statements of operations. Our investment in SecureDocs and our share of its losses are not material individually or in the aggregate to our financial position, results of operations or cash flows for any period presented.
Use of Estimates
The preparation of financial statements in conformity with GAAP requires management to make estimates and assumptions that affect the reported amounts of assets and liabilities and the disclosure of contingent assets and liabilities at the dates of the financial statements, and the reported amounts of revenues and expenses during the reporting period. Actual results could differ materially from those estimates. On an ongoing basis, management evaluates its estimates based on historical data and experience, as well as various other factors that management believes to be reasonable under the circumstances, the results of which form the basis for making judgments about the carrying value of assets and liabilities that are not readily apparent from other sources.
64
Segment Information
Our chief operating decision maker (“CODM”) reviews financial information presented on an aggregated and consolidated basis, together with revenue information for our core solutions, Value+ and other service offerings, principally to make decisions about how to allocate resources and to measure our performance. Management has determined that it has one operating segment.
Concentrations of Credit Risk
Financial instruments that potentially subject us to credit risk consist principally of cash, accounts receivable, investment securities and notes receivable. At times, we maintain cash balances at financial institutions in excess of amounts insured by United States government agencies or payable by the United States government directly. We place our cash with high credit, quality financial institutions. We invest in investment securities with a minimum rating of A by Standard & Poor's and A-1 by Moody's and regularly monitor our investment security portfolio for changes in credit ratings.
Concentrations of credit risk with respect to accounts receivable and revenue are limited due to a large, diverse customer base. No individual customer represented more than 10% of accounts receivable or revenue as of and for the years ended December 31, 2015, 2014 and 2013, respectively.
Fair Value Measurements
Fair value is defined as the exchange price that would be received for an asset or paid to transfer a liability (an exit price) in the principal or most advantageous market for the asset or liability in an orderly transaction between market participants on the measurement date.
Valuation techniques used to measure fair value must maximize the use of observable inputs and minimize the use of unobservable inputs. Accounting Standard Codification (“ASC”) 820, Fair Value Measurements and Disclosures (“ASC 820”), describes a fair value hierarchy based on three levels of inputs, of which the first two are considered observable and the last unobservable, that may be used to measure fair value, which are the following:
Level 1-Quoted prices in active markets for identical assets or liabilities or funds.
Level 2-Inputs other than Level 1 that are observable, either directly or indirectly, such as quoted prices for similar assets or liabilities; quoted prices in markets that are not active; or other inputs that are observable or can be corroborated by observable market data for substantially the full term of the assets or liabilities.
Level 3-Unobservable inputs that are supported by little or no market activity and that are significant to the fair value of the assets or liabilities. |
Cash and Cash Equivalents and Restricted Cash
We consider all highly liquid investments, readily convertible to cash, and which have a remaining maturity date of three months or less at the date of purchase, to be cash equivalents. Cash and cash equivalents are recorded at fair value and consist primarily of bank deposits and money market funds.
Restricted cash of $0.4 million as of December 31, 2015 and 2014, respectively is comprised of certificates of deposits relating to collateral requirements for customer automated clearing house (“ACH”) and credit card chargebacks and minimum collateral requirements for our insurance services, which are recorded in other long term assets.
Investment Securities
During 2015, we began investing a portion of the net proceeds from the IPO in investment securities. Our investment securities currently consist of corporate bonds, U.S. government agency securities (referred to as "Agency Securities") and certificates of deposit. We classify investment securities as available-for-sale at the time of purchase and reevaluate such classification as of each balance sheet date. All investments are recorded at estimated fair value. Unrealized gains and losses for available-for-sale securities are included in accumulated other comprehensive income (loss), a component of stockholders’ equity. We classify our investments as current when the period of time between the reporting date and the contractual maturity is twelve months or less and as noncurrent when the period of time between the reporting date and the contractual maturity is more than twelve months.
We evaluate our investments to assess whether those with unrealized loss positions are other than temporarily impaired. We consider impairments to be other than temporary if they are related to deterioration in credit risk or if it is likely we will sell
65
the securities before the recovery of their cost basis. Declines in value judged to be other than temporary are determined based on the specific identification method and are reported in other income (expense), net in the Consolidated Statements of Operations.
For additional information regarding the investment securities, refer to Note 4, Investment Securities and Fair Value Measurements.
Accounts Receivable
Accounts receivable are recorded at the invoiced amount, net of allowance for doubtful accounts. The allowance for doubtful accounts is based on historical loss experience, the number of days that receivables are past due, and an evaluation of the potential risk of loss associated with delinquent accounts. Accounts receivable considered uncollectable are charged against the allowance for doubtful accounts when identified. We do not have any off-balance sheet credit exposure related to our customers. As of December 31, 2015, 2014 and 2013, our allowance for doubtful accounts was not material.
Property and Equipment
Property and equipment is stated at cost, less accumulated depreciation. Depreciation is calculated using the straight-line method over the estimated useful lives of assets. The estimated useful lives of our property and equipment are as follows:
Asset Type | Depreciation Period | |
Data center and computer equipment | 3 years | |
Furniture and fixtures | 7 years | |
Office equipment | 2 to 5 years | |
Leasehold improvements | Shorter of remaining life of lease or asset life | |
Repair and maintenance costs are expensed as incurred. Renewals and improvements are capitalized. Assets disposed of or retired are removed from the cost and accumulated depreciation accounts and any resulting gain or loss is reflected in our results of operations.
Leases
Leases are evaluated and classified as either operating or capital leases. All of our office space leases are operating leases and we have one immaterial equipment capital lease which will expire in less than one year.
Rent expense under operating leases is recognized on a straight-line basis over the lease term. The difference between recognized rent expense and the rent payment amount is recorded as an increase or decrease in deferred rent liability. If the lease has tenant allowances from the lessor for certain improvements made to the leased property, these allowances are capitalized as leasehold improvements. Tenant allowances and rent holidays in lease agreements are recognized as a deferred rent credit, which is amortized on a straight-line basis over the lease term as a reduction of rent expense.
Internal-Use Software
We account for the costs of computer software obtained or developed for internal use in accordance with ASC 350, Intangibles-Goodwill and Other (“ASC 350”). These include costs incurred in connection with the development of our internal-use software solutions when (i) the preliminary project stage is completed, (ii) management has authorized further funding for the completion of the project and (iii) it is probable that the project will be completed and performed as intended. These capitalized costs include personnel and related expenses for employees who are directly associated with and who devote time to internal-use software projects and, when material, interest costs incurred during the development. Capitalization of these costs ceases once the project is substantially complete and the software is ready for its intended purpose. Costs incurred for significant upgrades and enhancements to our software solutions are also capitalized. Costs incurred for post-configuration training, maintenance and minor modifications or enhancements are expensed as incurred. Capitalized software development costs are amortized using the straight-line method over an estimated useful life of three years. We do not transfer ownership of our software, or lease our software, to third parties.
Intangible Assets
Intangible assets primarily consist of customer and partner relationships, acquired technology, trademarks, domain names and patents, which are recorded at cost, less accumulated amortization. We determine the appropriate useful life of our intangible
66
assets by performing an analysis of expected cash flows of the acquired assets. Intangible assets are amortized over their estimated useful lives using the straight-line method, which approximates the pattern in which the economic benefits are consumed.
The weighted average estimated useful lives of our intangible assets are as follows:
Intangible Asset Type | Weighted Average Useful Life | |
Customer relationships | 5.0 | |
Technology | 6.0 | |
Trademarks | 9.0 | |
Partner relationships | 3.0 | |
Non-compete agreements | 3.0 | |
Domain names | 5.0 | |
Patents | 5.0 | |
Impairment of Long-Lived Assets
We assess the recoverability of our long-lived assets when events or changes in circumstances indicate that the carrying value of an asset may not be recoverable. Such events or changes in circumstances may include a significant adverse change in the extent or manner in which a long-lived asset is being used, a significant adverse change in legal factors or in the business climate that could affect the value of a long-lived asset, an accumulation of costs significantly in excess of the amount originally expected for the acquisition or development of a long-lived asset, current or future operating or cash flow losses that demonstrate continuing losses associated with the use of a long-lived asset, or a current expectation that, more likely than not, a long-lived asset will be sold or otherwise disposed of significantly before the end of its previously estimated useful life. Impairment testing is performed at an asset level that represents the lowest level for which identifiable cash flows are largely independent of the cash flows of other assets and liabilities. We assess recoverability of long-lived assets by determining whether the carrying value of an asset can be recovered through projected undiscounted cash flows over its remaining life. If the carrying value of an asset exceeds the forecasted undiscounted cash flows, an impairment loss is recognized, measured as the amount by which the carrying value exceeds estimated fair value. An impairment loss is charged to operations in the period in which management determines such impairment. There were no impairment charges related to the identified long-lived assets for the years ended December 31, 2015, 2014 and 2013.
Business Combinations
The results of a business acquired in a business combination are included in our consolidated financial statements from the date of acquisition. We allocate the purchase price, including the fair value of contingent consideration, to the identifiable assets and liabilities of the acquired business at their acquisition date fair values. The excess of the purchase price over the amount allocated to the identifiable assets and liabilities, if any, is recorded as goodwill.
Determining the fair value of assets acquired and liabilities assumed requires management to make significant judgments and estimates, including the selection of valuation methodologies, estimates of future revenue and cash flows, discount rates and selection of comparable companies.
When we issue awards to an acquired company’s stockholders, we evaluate whether the awards are contingent consideration or compensation for post-acquisition services. The evaluation includes, among other things, whether the vesting of the awards is contingent on the continued employment of the selling stockholder beyond the acquisition date. If continued employment is required for vesting, the awards are treated as compensation for post-acquisition services and recognized as an expense over the requisite service period.
Acquisition-related transaction costs are not included as a component of consideration transferred, but are accounted for as an expense in the period in which the costs are incurred.
Goodwill
Goodwill represents the excess of the purchase price over the fair value of net assets acquired in a business combination. We test goodwill for impairment in accordance with the provisions of ASC 350. Goodwill is tested for impairment at least annually at the reporting unit level or whenever events or changes in circumstances indicate that goodwill might be impaired. Events or changes in circumstances which could trigger an impairment review include a significant adverse change in legal factors or in the
67
business climate, unanticipated competition, loss of key personnel, significant changes in the use of the acquired assets or our strategy, significant negative industry or economic trends, or significant underperformance relative to expected historical or projected future results of operations.
ASC 350 provides that an entity has the option to first assess qualitative factors to determine whether the existence of events or circumstances leads to a determination that it is more likely than not that the fair value of a reporting unit is less than its carrying amount. If, after assessing the totality of events or circumstances, an entity determines it is not more likely than not that the fair value of a reporting unit is less than its carrying amount, then additional impairment testing is not required. However, if an entity concludes otherwise, then it is required to perform the first of a two-step impairment test.
The first step involves comparing the estimated fair value of a reporting unit with its book value, including goodwill. If the estimated fair value exceeds book value, goodwill is considered not to be impaired and no additional steps are necessary. If, however, the fair value of the reporting unit is less than book value, then the carrying amount of the goodwill is compared with its implied fair value. The estimate of implied fair value of goodwill may require valuations of certain internally generated and unrecognized intangible assets. If the carrying amount of goodwill exceeds the implied fair value of that goodwill, an impairment loss is recognized in an amount equal to the excess.
We have one reporting unit and we test for goodwill impairment annually during the fourth quarter of the calendar year. At December 31, 2015, we determined our goodwill was not impaired as the fair value of our reporting unit significantly exceeded its carrying value.
Revenue Recognition
We charge our customers on a subscription basis for our core solutions and many of our Value+ services. Our subscription fees are designed to scale to the size of our customers’ businesses. Our core solutions refer to the base subscriptions for our cloud-based property management and legal software solutions. Value+ services recognized on a subscription basis include website hosting, insurance and contact center services. Subscription fees for our core solutions are charged on a per-unit per-month basis for our property management software solution and on a per-user per-month basis for our legal software solution. Website hosting fees are charged based on the number of websites hosted per month. Insurance and contact center fees are charged on a per-unit per-month basis. We recognize subscription revenue ratably over the terms of the subscription agreements, which range from one month to one year. We offer customers a free-trial period to try our software. Revenue is not recognized until the free-trial period is complete and the customer has entered into a subscription agreement with us. We generally invoice our customers for subscription services in monthly, quarterly or annual installments, typically in advance of the subscription period. As a result, we do not have significant amount of long-term deferred revenue because our invoicing is generally for periods less than one year.
We also charge our customers usage-based fees for using certain Value+ services, although fees for electronic payment processing are generally paid by the clients of our customers. Usage-based services include background and credit checks and electronic payment services. Usage-based fees are charged on a flat fee per transaction basis with no minimum usage commitments. We recognize revenue for usage-based services in the period the service is rendered. We generally invoice our customers for usage-based services on a monthly basis for services rendered in the preceding month.
We also offer our customers assistance with on-boarding our core solutions, as well as website design services. These services are generally purchased as part of a subscription agreement, and are typically performed within the first several months of the arrangement. We recognize revenue for these one-time services upon completion of the related service. We generally invoice our customers for one-time services in advance of the services being completed.
We recognize revenue when (i) there is persuasive evidence of an arrangement, (ii) our software solutions have been made available or delivered, or services have been performed, (iii) the amount of fees is fixed or determinable, and (iv) collectability is reasonably assured. Evidence of an arrangement generally consists of either a signed customer contract or an online click-through agreement. We consider that delivery of a solution or website has commenced once we provide the customer with access to use the solution or website. Fees are fixed based on rates specified in the subscription agreements, which do not provide for any refunds or adjustments. If collectability is not considered reasonably assured, revenue is deferred until the fees are collected. Some of our subscription agreements contain minimum cancellation fees in the event that the customer cancels the subscription early.
As customers do not have the right to the underlying software code for our software solutions, our revenue arrangements are outside the scope of software revenue recognition guidance.
68
Multiple-Deliverable Arrangements
The majority of customer arrangements include multiple deliverables. We therefore recognize revenue in accordance with Accounting Standards Update (“ASU”) 2009-13, Revenue Recognition (Topic 605)-Multiple-Deliverable Revenue Arrangements-a Consensus of the Emerging Issues Task Force (“ASU 2009-13”).
For multiple-deliverable arrangements, we first assess whether each deliverable has value to the customer on a standalone basis. We have determined that the subscription services related to our core solutions have value on a standalone basis because, once access is provided, they are fully functional and do not require additional development, modification or customization. Subscription services related to website hosting, insurance services and contact center services have value on a standalone basis as the services are sold separately by other vendors and are not essential to the functionality of the other deliverables. Usage-based services have value to the customer on a standalone basis as they are sold separately by other vendors and are not essential to the functionality of the other deliverables. The usage-based services are typically entered into subsequent to the initial customer arrangement. In multiple-deliverable arrangements that contain usage-based services, the customer has the option to purchase the services on an ad hoc basis, and payments are made when the services are rendered. The one-time services to assist our customers with on-boarding our core solutions, as well as website design services, have value on a standalone basis as these services do not require highly specialized or skilled individuals to perform them, are not essential to the functionality of our software solutions and may be performed by the customer or another vendor.
Based on the standalone value of the deliverables, and since our customers do not have a general right of return, we allocate revenue among the separate non-contingent deliverables in a multiple-deliverable arrangement under the relative selling price method using the selling price hierarchy established in ASU 2009-13. Usage-based services are not included in the relative revenue allocation at the inception of the arrangement as they are contingent on the customer’s use of the applicable Value+ service. Usage-based services do not contain any significant incremental discounts. The ASU 2009-13 selling price hierarchy requires the selling price of each deliverable in a multiple-deliverable arrangement to be based on, in descending order, (i) vendor-specific objective evidence of fair value (“VSOE”), (ii) third-party evidence of fair value (“TPE”), or (iii) management’s best estimate of the selling price (“BESP”).
For our core solutions, we have established VSOE based on our consistent historical pricing and discounting practices for customer renewals where the customer only subscribes to our core solutions. In establishing VSOE, the substantial majority of the selling prices for our core solutions fall within a reasonably narrow pricing range.
For our Value+ services and services relating to on-boarding our core solutions, as well as website design services, we were not able to determine VSOE because they are not sold by us separately from other deliverables. In addition, we considered whether TPE existed for these services and determined TPE existed for our website hosting based on prices charged by other companies selling similar services separately. For our remaining services, the selling prices of other deliverables are based on BESP. The determination of BESP requires us to make significant judgments and estimates. We consider numerous factors, including the nature of the deliverables themselves, the market conditions and competitive landscape for the sale, internal costs, and our published pricing and discounting practices. We maintain pricing transparency and adhere to our published price lists in selling these services to our customers. We update our estimates of BESP on an ongoing basis as events and circumstances may require.
After the contract value is allocated to each non-contingent deliverable in a multiple-deliverable arrangement based on the relative selling price, revenue is recognized for each deliverable based on the pattern in which the revenue is earned. For subscription services, revenue is recognized on a straight-line basis over the subscription period. For usage-based services, revenue is recognized as the services are rendered. For one-time services, revenue is recognized upon completion of the related services.
We record amounts collected from our customers in advance of recognizing revenue as deferred revenue. Deferred revenue that will be recognized as revenue within one year from the respective balance sheet date is recorded as current deferred revenue and the remaining portion, if any, is recorded as noncurrent.
Cost of Revenue
Cost of revenue consists of personnel-related costs (including salaries, incentive-based compensation, benefits, and stock-based compensation) for our employees focused on customer service and the support of our operations, platform infrastructure costs (such as data center operations and hosting-related costs), fees paid to third-party service providers, payment processing fees, and allocated shared costs. We typically allocate shared costs across our organization based on headcount within the applicable part of our organization. Cost of revenue excludes depreciation of property and equipment, and amortization of capitalized software development costs and intangible assets.
69
Sales and Marketing
Sales and marketing expense consists of personnel-related costs (including salaries, sales commissions, incentive-based compensation, benefits, and stock-based compensation) for our employees focused on sales and marketing, costs associated with sales and marketing activities, and allocated shared costs. Marketing activities include advertising, online lead generation, lead nurturing, customer and industry events, industry-related content creation and collateral creation. Sales commissions and other incremental costs to acquire customers and grow adoption and utilization of our Value+ services by new and existing customers are expensed as incurred. We focus our sales and marketing efforts on generating awareness of our software solutions, creating sales leads, establishing and promoting our brands, and cultivating an educated community of successful and vocal customers. Advertising expenses were $3.6 million, $2.1 million and $1.3 million for the years ended December 31, 2015, 2014 and 2013, respectively, and are expensed as incurred.
Research and Product Development
Research and product development expense consists of personnel-related costs (including salaries, incentive-based compensation, benefits, and stock-based compensation) for our employees focused on research and product development, fees for third-party development resources, and allocated shared costs. Our research and product development efforts are focused on enhancing the ease of use and functionality of our existing software solutions by adding new core functionality, Value+ services and other improvements, as well as developing new products. We capitalize the portion of our software development costs that meets the criteria for capitalization. Amortization of software development costs is included in depreciation and amortization expense.
General and Administrative
General and administrative expense consists of personnel-related costs (including salaries, incentive-based compensation, benefits, and stock-based compensation) for employees in our executive, finance, information technology, or IT, human resources and administrative organizations. In addition, general and administrative expense includes fees for third-party professional services (including consulting, legal and audit services), other corporate expenses, and allocated shared costs.
Depreciation and Amortization
Depreciation and amortization expense includes depreciation of property and equipment, amortization of capitalized software development costs and amortization of intangible assets. We depreciate or amortize property and equipment, software development costs and intangible assets over their expected useful lives on a straight-line basis, which approximates the pattern in which the economic benefits of the assets are consumed.
Stock-Based Compensation
We account for stock-based compensation awards granted to employees and directors by recording compensation expense based on the awards’ grant-date estimated fair value, in accordance with ASC 718, Compensation-Stock Compensation (“ASC 718”). We estimate the fair value of restricted stock awards and restricted stock units ("RSU") based on the fair value of our common stock on the date of grant. We estimate the fair value of stock options using the Black-Scholes option-pricing model. Determining the fair value of stock options under this model requires highly subjective assumptions, including the fair value of the underlying common stock, the risk-free interest rate, the expected term of the award, the expected volatility of the price of our common stock, and the expected dividend yield of our common stock. These estimates involve inherent uncertainties and the application of management’s judgment. If we had made different assumptions, our stock-based compensation expense could have been materially different.
These assumptions and estimates are as follows:
Fair Value of Common Stock
Prior to our IPO, there was no public market for our common stock and our board of directors determined the fair value of our common stock at the time of the grant of stock options and restricted stock awards by considering a number of objective and subjective factors, including our actual operating and financial performance, market conditions and performance of comparable publicly traded companies, developments and milestones in our company, the likelihood of achieving a liquidity event and transactions involving our convertible preferred stock, among other factors. The fair value of the underlying common stock was determined by our board of directors in accordance with applicable elements of the practice aid issued by the American Institute of Certified Public Accountants Valuation of Privately Held Company Equity Securities Issued as Compensation. In valuing our common stock at various dates, our board of directors determined our equity value generally using the income approach and the
70
market comparable approach valuation methods. Once we determined our equity value, we used an option pricing method or the Probability Weighted Expected Return Method to allocate the equity value to preferred stock and common stock. Application of these approaches and methods involves the use of estimates, judgments and assumptions, such as future revenue, expenses and cash flows, selections of comparable companies, probabilities and timing of exit events, and other factors.
Since our IPO in June 2015, the fair value of our common stock is based on the closing price of our common stock, as quoted on the NASDAQ Global Market, on the date of grant.
Our board of directors grants stock options with exercise prices equal to the fair value of our common stock on the date of grant.
Risk-Free Interest Rate
The risk free interest rate assumption is based upon observed interest rates on United States government securities appropriate for the expected term of the stock option.
Expected Term
Given we do not have sufficient exercise history to develop reasonable expectations about future exercise patterns and post-vesting employment termination behavior, we determine the expected term using the simplified method, which is calculated as the midpoint of the stock option vesting term and the expiration date of the stock option.
Expected Volatility
We determine the expected volatility based on the historical average volatilities of publicly traded industry peers. We intend to continue to consistently apply this methodology using the same or similar public companies until a sufficient amount of historical information regarding the volatility of our own common stock price becomes available, unless circumstances change such that the identified companies are no longer similar to us, in which case, more suitable companies whose stock prices are publicly available would be utilized in the calculation.
Expected Dividend Yield
We have not paid and do not anticipate paying any cash dividends in the foreseeable future and, therefore, we use an expected dividend yield of zero.
In addition to the assumptions used in the Black-Scholes option-pricing model, we also estimate a forfeiture rate to calculate our stock-based compensation expense for our awards. The forfeiture rate is based on an analysis of actual forfeitures. We will continue to evaluate the appropriateness of the forfeiture rate based on actual forfeiture experience, analysis of employee turnover, and other factors. Changes in the estimated forfeiture rate can have a significant impact on our stock-based compensation expense as the cumulative effect of adjusting the rate is recognized in the period the estimated forfeiture rate is changed. If a revised forfeiture rate is higher than the previously estimated forfeiture rate, an adjustment is made that will result in a decrease to our stock-based compensation expense recognized in our consolidated financial statements. If a revised forfeiture rate is lower than the previously estimated forfeiture rate, an adjustment is made that will result in an increase to our stock-based compensation expense recognized in our consolidated financial statements.
Restricted Stock Units
In September 2015, we began granting restricted stock units ("RSUs") with a total fixed dollar amount. The vesting of RSUs is in equal tranches over four annual periods. On the first day of each vesting period, the number of shares to be issued is determined by dividing the fixed dollar amount of the portion of the RSUs that vest in that tranche by the closing price of our Class A common stock on the vesting date. The fixed monetary amount is recognized as expense on a straight-line basis over the vesting period. The shares underlying the RSU grants are not issued and outstanding until the applicable vesting date.
Income Taxes
We account for income taxes in accordance with ASC 740, Income Taxes (“ASC 740”). ASC 740 requires the recognition of deferred tax assets and liabilities for the expected future tax consequences of temporary differences between the carrying amounts and the tax bases of assets and liabilities. Deferred income tax assets and liabilities are measured using enacted tax rates expected to apply to taxable income in the years in which those temporary differences are expected to be recovered or settled. The effect of a change in tax rates on deferred tax assets and liabilities is recognized in the consolidated statements of operations in the period that includes the enactment date. A valuation allowance is recorded when it is more likely than not that some of the deferred tax assets will not be realized.
71
We recognize the tax benefit from an uncertain tax position only if it is more likely than not that the tax position will be sustained on examination by the taxing authorities, based on the technical merits of the position. The tax benefits recognized in our consolidated financial statements from such positions are then measured based on the largest benefit that has a greater than 50% likelihood of being realized. We recognize interest and penalties accrued with respect to uncertain tax positions, if any, in our provision for income taxes in the consolidated statements of operations.
Net Loss per Share
The following table presents a reconciliation of our weighted average number of Class A and Class B common shares used to compute net loss per share (in thousands):
Year Ended December 31, | ||||||||
2015 | 2014 | 2013 | ||||||
Weighted average shares outstanding | 21,486 | 8,998 | 8,807 | |||||
Less: Weighted average unvested restricted shares subject to repurchase | 150 | 241 | 370 | |||||
Weighted average number of shares used to compute basic and diluted net loss per share | 21,336 | 8,757 | 8,437 | |||||
Because we reported net losses for all periods presented, all potentially dilutive common stock equivalents are antidilutive for those periods and have been excluded from the calculation of net loss per share. The diluted net loss per a common share were the same for Class A and Class B common shares because they are entitled to the same liquidation and dividend rights.
The following table presents the number of anti-dilutive shares excluded from the calculation of diluted net loss per share as of December 31, 2015 and 2014 (in thousands):
December 31, | ||||||
2015 | 2014 | |||||
Options to purchase common stock | 1,171 | 1,217 | ||||
Conversion of convertible preferred stock | — | 17,007 | ||||
Unvested restricted stock awards | 120 | 173 | ||||
Unvested restricted stock units | 17 | — | ||||
Contingent restricted stock units (1) | 49 | — | ||||
Total shares excluded from net loss per share attributable to common stockholders | 1,357 | 18,397 | ||||
(1) The reported shares are based on a fixed price RSU commitment for which the number of shares has not been determined at the grant date. The shares disclosed in the table above are based on the closing price of our stock at December 31, 2015 divided by the future fixed price commitment to issue shares in the future. For additional information regarding the RSUs granted refer to Note 11, Stock-Based Compensation.
Recent Accounting Pronouncements
Under the Jumpstart our Business Startups Act (the “JOBS Act”), we meet the definition of an emerging growth company. We have irrevocably elected to opt out of the extended transition period for complying with new or revised accounting standards pursuant to Section 107(b) of the JOBS Act.
In May 2014, the Financial Accounting Standards Board (“FASB”) issued ASU No. 2014-09, Revenue from Contracts with Customers (“ASU 2014-09”), which requires an entity to recognize the amount of revenue to which it expects to be entitled for the transfer of promised goods or services to customers. ASU 2014-09 will replace most existing revenue recognition guidance in GAAP when it becomes effective. ASU 2014-09 is effective on January 1, 2018. Early adoption is permitted as of January 1, 2017. The standard permits the use of either a retrospective or cumulative effect transition method. We have not determined which transition method we will adopt, nor have we determined the effect of this guidance on our financial condition, results of operations, cash flows or disclosures.
In April 2015, the FASB issued ASU No. 2015-03, Interest— Imputation of Interest—Simplifying the Presentation of Debt Issuance Costs (“ASU 2015-03”), which requires an entity to record debt issuance costs in the balance sheet as a direct deduction of a recognized debt liability. ASU 2015-03 is effective for accounting periods beginning after December 15, 2015;
72
however, early adoption is permitted. During the year ended December 31, 2015, we elected to adopt this guidance. The impact of the early adoption of this guidance was to record $0.4 million of third-party debt financing costs as a reduction in the outstanding amount of our prior term loan from Wells Fargo Bank, N.A. (“Wells Fargo”) in March 2015. The adoption of this guidance did not impact prior period financial statements as we had no debt outstanding. For additional information regarding the prior term loan with Wells Fargo, refer to Note 8, Long-term Debt.
In May 2015, the FASB issued ASU 2015-09, Financial Services-Insurance (Topic 944): Disclosures about Short-Duration Contracts ("ASU 2015-09"), requires insurance entities to disclose for annual reporting periods information about the liability for unpaid claims and claim adjustment expenses. ASU 2015-09 is effective for public business entities for annual periods beginning after December 15, 2015, and interim periods within annual periods beginning after December 15, 2016. Early adoption is permitted. Management is assessing this guidance's impact to our disclosures within our financial statements as the guidance is disclosure related.
In August 2015, the FASB issued ASU 2015-15, Interest - Imputation of Interest (Subtopic 835-30) - Presentation and Subsequent Measurement of Debt Issuance Costs Associated with Line of Credit Arrangements (Amendments to SEC Paragraphs Pursuant to Staff Announcement at June 18, 2015 EITF Meeting) (“ASU 2015-15”), which simplifies the presentation of debt issuance costs for line of credit arrangements since ASU 2015-03 did not address line of credit arrangements. ASU 2015-15 provides an update to ASU 2015-03 and allows for the debt issuance costs for line of credit arrangements to be classified as an asset. At December 31, 2015, we had an asset of $0.3 million remaining on our balance sheet for debt issuance costs associated with our line of credit with Wells Fargo.
In September 2015, the FASB issued Accounting Standard Update (“ASU”) No. 2015-16, Business Combinations (Topic 805): Simplifying the Accounting for Measurement-Period Adjustments (“ASU 2015-16”). The amendments in ASU 2015-16 require that an acquirer recognize adjustments to estimated amounts that are identified during the measurement period in the reporting period in which the adjustment amounts are determined. The amendments require that the acquirer record, in the same period’s financial statements, the effect on earnings of changes in depreciation, amortization, or other income effects, if any, as a result of the change to the estimated amounts, calculated as if the accounting had been completed at the acquisition date. This ASU is effective for fiscal years beginning after December 15, 2015, including interim periods within those fiscal years and should be applied prospectively to adjustments to provisional amounts that occur after the effective date of this Update with earlier application permitted for financial statements that have not been issued. Management will apply this guidance should we have a measurement-period adjustment for the acquisition that occurred in April 2015.
In November 2015, the FASB issued ASU No. 2015-17, Income Taxes (Topic 740): Balance Sheet Classification of Deferred Taxes. The amendments in ASU 2015-17 eliminates the current requirement for organizations to present deferred tax liabilities and assets as current and noncurrent in a classified balance sheet. Instead, organizations will be required to classify all deferred tax assets and liabilities as noncurrent. This ASU is effective for public business entities for financial statements issued for annual periods beginning after December 15, 2016, and interim periods within those annual periods. The amendments may be applied prospectively to all deferred tax liabilities and assets or retrospectively to all periods presented. If an entity applies the guidance retrospectively, the entity should disclose in the first interim and first annual period of change the nature of and reason for the change in accounting principle and quantitative information about the effects of the accounting change on prior periods. At December 31, 2015, we early adopted ASU 2015-17 and classified all of our deferred tax assets and liabilities as noncurrent, prospectively. The adoption of ASU 2015-17 did not impact our 2014 Consolidated Balance Sheet since we had a full valuation on our deferred tax assets and liabilities.
In February of 2016, the FASB issued ASU No. 2016-02, "Leases (Topic 842)" ("ASU 2016-02"). Under ASU 2016-02, an entity will be required to recognize right-of-use assets and lease liabilities on its balance sheet and disclose key information about leasing arrangements. ASU 2016-02 offers specific accounting guidance for a lessee, a lessor and sale and leaseback transactions. Lessees and lessors are required to disclose qualitative and quantitative information about leasing arrangements to enable a user of the financial statements to assess the amount, timing and uncertainty of cash flows arising from leases. For public companies, ASU 2016-02 is effective for annual reporting periods beginning after December 15, 2018, including interim periods within that reporting period, and requires a modified retrospective adoption, with early adoption permitted. The Company will adopt this guidance beginning with its first quarter ending March 31, 2019. We are in the process of evaluating the future impact of ASU 2016-02 on its consolidated financial position, results of operations and cash flows.
73
3. Acquisition of RentLinx
On April 1, 2015, we completed the acquisition of all of the membership interests of RentLinx, LLC (“RentLinx”), a San Diego, California-based company focused on developing a software platform that allows customers to advertise rental houses and apartments online. We acquired RentLinx to expand the Value+ services offered to our property manager customers, giving them the ability to better spend, track and optimize their marketing investments.
We paid the sellers $4.1 million, of which $0.5 million was placed into escrow to cover potential indemnification claims relating to breaches of representations, warranties and covenants. We also agreed to pay an additional amount of approximately $1.1 million to certain individuals subject to their continued employment with us, which was recorded as an expense over the service period and was paid in October 2015. All transaction costs were expensed in the period incurred and were approximately $0.3 million.
The goodwill related to our RentLinx acquisition is attributable to synergies expected from the acquisition and assembled workforce. The goodwill is deductible for income tax purposes.
The following table summarizes the purchase price allocation (in thousands):
Amount | Estimated Useful Life | ||||
Net current assets | $ | 114 | |||
Intangible assets: | |||||
Developed technology | 810 | 6 years | |||
Partner relationships | 680 | 3 years | |||
Customer and website relationships | 560 | 5 years | |||
Other intangible assets | 170 | 3 years | |||
Goodwill | 1,739 | Indefinite | |||
Purchase consideration, paid in cash | $ | 4,073 | |||
We are not providing pro forma and current period financial information for this acquisition as it is not material to our Consolidated Financial Statements.
4. Investment Securities and Fair Value Measurements
Investment Securities
Investment securities classified as available-for-sale consist of the following at December 31, 2015 (in thousands):
December 31, 2015 | |||||||||||||||
Amortized Cost | Gross Unrealized Gains | Gross Unrealized Losses | Estimated Fair Value | ||||||||||||
Corporate bonds | $ | 30,568 | $ | — | $ | (126 | ) | $ | 30,442 | ||||||
Agency securities | 8,012 | — | (12 | ) | 8,000 | ||||||||||
Certificates of deposit | $ | 6,225 | $ | — | $ | (15 | ) | 6,210 | |||||||
Total available-for-sale investment securities | $ | 44,805 | $ | — | $ | (153 | ) | $ | 44,652 | ||||||
We did not have investment securities at December 31, 2014. We had certain investment securities in an unrealized loss position at December 31, 2015, and we have held these securities for less than six months. These unrealized loss positions are considered temporary and there were no impairments considered "other-than-temporary" as it is more likely than not we will hold the securities until maturity or a recovery of the cost basis.
74
At December 31, 2015, the contractual maturities of our investments did not exceed 36 months. The fair values of available-for-sale investments, by remaining contractual maturity, are as follows (in thousands):
December 31, 2015 | |||||||
Amortized Cost | Estimated Fair Value | ||||||
Due in 1 year or less | $ | 10,249 | $ | 10,235 | |||
Due after 1 year through 3 years | 34,557 | 34,417 | |||||
Total available-for-sale investment securities | $ | 44,806 | $ | 44,652 | |||
During the year ended December 31, 2015, we had sales and maturities of (in thousands):
Year Ended December 31, 2015 | |||||||||||||||
Gross Realized Gains | Gross Realized Losses | Gross Proceeds from Sales | Gross Proceeds from Maturities | ||||||||||||
Corporate bonds | $ | 21 | — | $ | 3,977 | 17,259 | |||||||||
Agency securities | — | (2 | ) | 7,000 | 2,000 | ||||||||||
$ | 21 | $ | (2 | ) | $ | 10,977 | $ | 19,259 | |||||||
For the year ended December 31, 2015, we received interest income net of the amortization and accretion of the premium and discount of $217,000.
Fair Value Measurements
The following table summarizes our financial assets and liabilities measured at fair value on a recurring basis as of December 31, 2015 and 2014 by level within the fair value hierarchy. Financial assets and financial liabilities are classified in their entirety based on the lowest level of input that is significant to the fair value measurement (in thousands):
December 31, 2015 | |||||||||||||||
Level 1 | Level 2 | Level 3 | Total Fair Value | ||||||||||||
Cash equivalents: | |||||||||||||||
Money market funds | $ | 7,102 | $ | — | $ | — | $ | 7,102 | |||||||
Available-for-sale - investment securities: | |||||||||||||||
Corporate bonds | — | 30,442 | — | 30,442 | |||||||||||
Agency securities | — | 8,000 | — | 8,000 | |||||||||||
Certificates of deposit | 6,210 | — | — | 6,210 | |||||||||||
Total Assets | $ | 13,312 | $ | 38,442 | $ | — | $ | 51,754 | |||||||
December 31, 2014 | |||||||||||||||
Level 1 | Level 2 | Level 3 | Total Fair Value | ||||||||||||
Cash equivalents: | |||||||||||||||
Money market funds | $ | 3,696 | $ | — | $ | — | $ | 3,696 | |||||||
Total Assets | $ | 3,696 | $ | — | $ | — | $ | 3,696 | |||||||
Contingent consideration | $ | — | $ | — | $ | 2,429 | $ | 2,429 | |||||||
Total Liabilities | $ | — | $ | — | $ | 2,429 | $ | 2,429 | |||||||
75
Cash Equivalents
As of December 31, 2015 and 2014, cash equivalents include cash invested in money market funds. Market prices are based on market prices for identical assets.
Available-for-Sale - Investment Securities
The fair value of our investment securities is based on pricing determined using inputs other than quoted prices that are observable either directly or indirectly such as yield curve, volatility factors, credit spreads, default rates, loss severity, current market and contractual prices for the underlying instruments or debt, broker and dealer quotes, as well as other relevant economic measures.
Contingent Consideration
Contingent consideration payable in connection with acquisitions is measured at fair value each period and is based on significant inputs not observable in the market, which represents a Level 3 measurement within the fair value hierarchy. The valuation of contingent consideration uses assumptions we believe would be made by a market participant. We assessed these estimates on an on-going basis as additional data impacting the assumptions become available. Changes in the fair value of contingent consideration related to updated assumptions and estimates were recognized within general and administrative expense in the Consolidated Statements of Operations. We determined the fair value of the contingent consideration using the probability weighted discounted cash flow method. The significant inputs used in the fair value measurement of contingent consideration were the probability of achieving revenue thresholds and determining discount rates.
The following table summarizes the changes in contingent consideration liability (in thousands):
Year Ended December 31, | ||||||||||||
2015 | 2014 | 2013 | ||||||||||
Fair value, at beginning of period | $ | 2,429 | $ | 2,403 | $ | 3,740 | ||||||
Change in fair value recorded in general and administrative expenses | — | 26 | (1,337 | ) | ||||||||
Payment of contingent consideration | (2,429 | ) | — | — | ||||||||
Fair value, at end of period | $ | — | $ | 2,429 | $ | 2,403 | ||||||
The contingent consideration liability was recorded in other current liabilities on the accompanying Consolidated Balance Sheets as of December 31, 2014. On May 6, 2015, we paid the final earn-out payment in the amount of $2.4 million.
There were no changes to our valuation techniques used to measure asset and liability fair values on a recurring basis during the years ended December 31, 2015, 2014 and 2013.
The carrying amounts of cash equivalents, restricted cash, accounts receivable, accounts payable and accrued liabilities approximate fair value because of the short maturity of these items. The carrying value of our SecureDocs’ note receivable approximates its fair value based on a discounted cash flow analysis and is a level 3 measurement.
Certain assets, including goodwill and intangible assets, are also subject to measurement at fair value on a non-recurring basis if they are deemed to be impaired as a result of an impairment review. For the year ended December 31, 2015, no impairments were identified on those assets required to be measured at fair value on a non-recurring basis.
76
5. Property and Equipment
Property and equipment consists of the following as of December 31, 2015 and 2014 (in thousands):
December 31, | ||||||||
2015 | 2014 | |||||||
Data center and computer equipment | $ | 3,923 | $ | 2,871 | ||||
Furniture and fixtures | 1,723 | 1,158 | ||||||
Office equipment | 434 | 215 | ||||||
Leasehold improvements | 878 | 333 | ||||||
Construction in process | 2,315 | — | ||||||
Gross property and equipment | 9,273 | 4,577 | ||||||
Less: Accumulated depreciation | (3,166 | ) | (1,954 | ) | ||||
Total property and equipment, net | $ | 6,107 | $ | 2,623 | ||||
Depreciation expense for property and equipment totaled $1.4 million, $0.9 million, and $0.5 million for the years ended December 31, 2015, 2014 and 2013, respectively.
As of December 31, 2015 and 2014, capital leases are included in property and equipment with a cost basis of $82,000. Accumulated depreciation on property and equipment under capital leases as of December 31, 2015 and 2014 was $57,000 and $21,000, respectively.
6. Internal-Use Software Development Costs
Internal-use software development costs were as follows (in thousands):
December 31, | ||||||||
2015 | 2014 | |||||||
Internal use software development costs, gross | $ | 21,894 | $ | 13,931 | ||||
Less: Accumulated amortization | (11,872 | ) | (8,422 | ) | ||||
Internal use software development costs, net | $ | 10,022 | $ | 5,509 | ||||
Capitalized software development costs were $8.0 million, $4.6 million and $2.4 million for the years ended December 31, 2015, 2014 and 2013, respectively. Amortization expense with respect to software development costs totaled $3.5 million, $2.0 million and $1.5 million for the years ended December 31, 2015, 2014, and 2013, respectively.
Future amortization expense with respect to capitalized software development costs as of December 31, 2015 is estimated as follows (in thousands):
Years Ending December 31, | ||||
2016 | $ | 4,688 | ||
2017 | 3,605 | |||
2018 | 1,723 | |||
2019 | 6 | |||
Total amortization expense | $ | 10,022 | ||
77
7. Goodwill and Intangible Assets
Goodwill activity for the year ended December 31, 2015 is as follows (in thousands):
Goodwill as of December 31, 2014 | $ | 4,998 | |
Addition: | |||
Acquisition of RentLinx | 1,739 | ||
Goodwill as of December 31, 2015 | $ | 6,737 | |
Intangible assets consisted of the following as of December 31, 2015 and 2014 (in thousands, except years):
December 31, 2015 | ||||||||||||||
Gross Carrying Value | Accumulated Amortization | Net Carrying Value | Weighted Average Useful Life in Years | |||||||||||
Customer relationships | $ | 790 | $ | (234 | ) | $ | 556 | 5.0 | ||||||
Technology | 4,811 | (2,268 | ) | 2,543 | 6.0 | |||||||||
Trademarks | 930 | (293 | ) | 637 | 9.0 | |||||||||
Partner relationships | 680 | (170 | ) | 510 | 3.0 | |||||||||
Non-compete agreements | 40 | (10 | ) | 30 | 3.0 | |||||||||
Domain names | 274 | (199 | ) | 75 | 5.0 | |||||||||
Patents | 286 | (121 | ) | 165 | 5.0 | |||||||||
$ | 7,811 | $ | (3,295 | ) | $ | 4,516 | 5.9 | |||||||
December 31, 2014 | ||||||||||||||
Gross Carrying Value | Accumulated Amortization | Net Carrying Value | Weighted Average Useful Life in Years | |||||||||||
Customer relationships | $ | 230 | $ | (104 | ) | $ | 126 | 5.0 | ||||||
Technology | 4,000 | (1,500 | ) | 2,500 | 6.0 | |||||||||
Trademarks | 800 | (180 | ) | 620 | 10.0 | |||||||||
Domain names | 287 | (161 | ) | 126 | 5.0 | |||||||||
Patents | 324 | (81 | ) | 243 | 5.0 | |||||||||
$ | 5,641 | $ | (2,026 | ) | $ | 3,615 | 6.4 | |||||||
A summary of the activity within our intangible assets since December 31, 2014 is as follows (in thousands):
Intangible assets, net at December 31, 2014 | $ | 3,615 | ||
Additions from the acquisition of RentLinx (Note 3): | 2,220 | |||
Other additions | 17 | |||
Dispositions | (60 | ) | ||
Amortization | (1,276 | ) | ||
Intangible assets, net at December 31, 2015 | $ | 4,516 | ||
78
Amortization expense totaled $1.3 million, $0.9 million and $0.9 million for the twelve months ended December 31, 2015, 2014 and 2013, respectively. Amortization expense for each of the five fiscal years through December 31, 2020 and thereafter is estimated as follows (in thousands):
Years Ending December 31, | ||||
2016 | $ | 1,415 | ||
2017 | 1,383 | |||
2018 | 928 | |||
2019 | 352 | |||
2020 | 259 | |||
Thereafter | 179 | |||
Total amortization expense | $ | 4,516 | ||
8. Long-term Debt
Credit Agreement
On March 16, 2015, we entered into a credit facility (the “Credit Facility”) comprised of a $10.0 million term loan (the “Term Loan”), and a $2.5 million revolving line of credit (the “Revolving Facility”) with Wells Fargo. In March 2015, we borrowed $10.0 million under the Term Loan.
On July 16, 2015, we made an optional prepayment in full of the Term Loan and we became obligated to pay the related $0.2 million prepayment premium. Wells Fargo agreed with us that the prepayment premium would not be payable until the earlier of September 1, 2015 (which was subsequently extended to October 9, 2015) and the date we terminated the Revolving Facility in full (the earliest of those dates being referred to as the “Due Date”). Wells Fargo further agreed with us that if we entered into an amended revolving credit facility with them by October 9, 2015, and we agreed to pay them a closing fee of at least $0.1 million in connection with the new credit facility before the Due Date, they would waive the $0.2 million prepayment premium.
On October 9, 2015, we entered into Amendment Number One to Credit Agreement, which amended the terms of that certain Credit Agreement, dated March 16, 2015, entered into by and among us, Wells Fargo, as administrative agent, and the lenders that are parties thereto (as amended, the “Credit Agreement”).
Under the terms of the Credit Agreement, the lenders made available to us a $25.0 million revolving line of credit (the “New Revolving Facility”). Subject to customary terms and conditions, we can seek to increase the principal amount of indebtedness available under the Credit Agreement by up to $10.0 million, in the form of revolving commitments or term loan debt, although the lenders are under no obligation to make additional amounts available to us. Borrowings under the Revolving Facility are subject to the satisfaction of customary conditions.
Borrowings under the New Revolving Facility bear interest at a fluctuating rate per annum equal to, at our option, (i) a base rate equal to the highest of (a) the federal funds rate plus 1/2 of 1%, (b) the London Interbank Offered Rate (“LIBOR”) for a one-month interest period plus 1% and (c) the rate of interest in effect for such day as publicly announced from time to time by Wells Fargo as its prime rate, in each case plus an applicable margin of 1.5%, or (ii) LIBOR for the applicable interest period plus an applicable margin of 2.5%. Interest is due and payable monthly. We are also required to pay a commitment fee equal to 0.25% per annum of the unused portion of the New Revolving Facility if revolver usage is above $10.0 million, or 0.375% per annum of the unused portion of the New Revolving Facility if revolver usage is less than or equal to $10.0 million.
The New Revolving Facility matures on October 9, 2020. However, we can make payments on, and cancel in full, the New Revolving Facility at any time without premium or penalty.
The Credit Agreement contains customary affirmative, negative and financial covenants. The affirmative covenants require us to, among other things, disclose financial and other information to the lenders, maintain its business and properties, and maintain adequate insurance. The negative covenants restrict us from, among other things, incurring additional indebtedness, prepaying certain types of indebtedness, encumbering or disposing of its assets, making fundamental changes to its corporate structure, and making certain dividends and distributions. The financial covenants require us to maintain liquidity of not less than
79
$12.5 million and, to the extent liquidity is determined to be below $25.0 million, to comply with a maximum senior leverage ratio. At December 31, 2015, we were in compliance with the affirmative and financial covenants of the Credit Agreement.
As of December 31, 2015, there was an outstanding balance of $12,000 under the Credit Agreement.
Debt Financing Costs
Debt financing costs are deferred and amortized, using the effective interest method for costs related to the Term Loan and the straight-line method for costs related to the Revolving Facility. We incurred fees to Wells Fargo attributable to the Term Loan of $0.3 million and other third-party debt financing costs of $0.1 million, which were recorded as a reduction of the carrying amount of the Term Loan. Amortization of such costs is included in interest expense. When the Term Loan was repaid prior to the maturity date, the unamortized debt financing costs related to the Term Loan of $0.4 million were expensed as interest expense. Total interest expense for the year ended December 31, 2015 was $0.8 million.
In conjunction with the amendment to our Credit Agreement for the New Revolving Facility, we incurred costs to process the amendment and we capitalized additional costs of $0.2 million. These additional costs were added to the unamortized debt financing costs from the original Revolving Facility of $0.1 million and are amortized using a straight-line method over the term of the Revolving Facility's commitment. The total unamortized debt financing costs for the amended Revolving Facility of $0.3 million were recorded within Other assets at December 31, 2015.
9. Commitments and Contingencies
Lease Obligations
As of December 31, 2015, we had operating lease obligations of approximately $7.4 million through 2022. A summary of our future minimum payments for obligations under non-cancellable operating leases were as follows (in thousands):
Years Ending December 31, | |||
2016 | $ | 1,758 | |
2017 | 1,784 | ||
2018 | 1,129 | ||
2019 | 1,019 | ||
2020 | 1,002 | ||
Thereafter | 673 | ||
Total lease commitments | $ | 7,365 | |
We recorded rent expense of $1.2 million, $1.0 million and $0.8 million for the twelve months ended December 31, 2015, 2014 and 2013, respectively.
In January 2016, we signed a new lease for 14,478 square feet that will replace our existing office in San Diego. The aggregate annual payments under the new lease will be approximately $0.4 million and are subject to annual increases over the lease term, which expires in February 2021, approximately.
In February 2016, we signed an amendment to our existing lease at 90 Castilian Drive in Santa Barbara, California which increased the square footage leased by approximately 9,449 square feet. With this amendment, our total leased square feet at this location increased to 35,949. The aggregate annual lease payments under this lease increased our annual commitments by approximately, $164,000, and are subject to annual increases over the term of the lease, which expires in November 2020.
80
Insurance
We have a wholly owned subsidiary, Terra Mar Insurance Company, Inc. (“Terra Mar”), which was established to provide our customers with the option to purchase tenant liability insurance. If our customers choose to use our insurance services, they are issued an insurance policy underwritten by our third-party service provider. The policy has a limit of $100,000 per incident for each insured residence. We have entered into a reinsurance agreement with our third-party service provider and, as a result, we assume a 100% quota share of the tenant liability insurance provided to our customers through our third-party service provider. Included in cost of revenue we accrue for reported claims and an estimate of losses incurred but not reported by our property manager customers, as we bear the risk related to claims. Our liability for reported claims and incurred but not reported claims as of December 31, 2015 and 2014 was $0.5 million and $0.3 million, respectively, and is included in other current liabilities on the Consolidated Balance Sheets.
Included in other current assets as of December 31, 2015 and 2014 are $1.0 million and $0.6 million, respectively, of deposits held with a third party related to requirements to maintain collateral for our insurance services.
Litigation
From time to time, we may become subject to legal proceedings, claims and litigation arising in the ordinary course of business. We are not currently a party to any legal proceedings, nor are we aware of any pending or threatened litigation, that would have a material adverse effect on our business, operating results, cash flows or financial condition should such litigation be resolved unfavorably.
In May 2015, we paid the final earn-out payment relating to the acquisition of MyCase, Inc. of $2.4 million. On May 26, 2015, we received a letter from counsel for a former shareholder of MyCase alleging that we failed to make commercially reasonable efforts to cause the maximum earn-out of $6.6 million to be earned. This amount represents the maximum earn-out that could potentially have been earned by all former MyCase shareholders. The former shareholder also stated that he intends to pursue punitive damages. We believe the allegations are without merit and we plan to vigorously defend against them. Based on information currently available, we have determined that a loss is not probable, and the amount of any possible loss or range of possible loss is not reasonably estimable and we have therefore not established a reserve or a range of possible loss.
Indemnification
In the ordinary course of business, we may provide indemnification of varying scope and terms to customers, investors, directors and officers with respect to certain matters, including, but not limited to, losses arising out of our breach of any applicable agreements, services to be provided by us, or intellectual property infringement claims made by third parties. These indemnification provisions may survive termination of the underlying agreement and the maximum potential amount of future payments we could be required to make under these indemnification provisions may not be subject to maximum loss clauses. The maximum potential amount of future payments we could be required to make under these indemnification provisions is indeterminable. We have never paid a material claim, nor have we been sued in connection with these indemnification arrangements. As of December 31, 2015 and 2014, we had not accrued a liability for these indemnification arrangements because we have determined that the likelihood of incurring a payment obligation, if any, in connection with these indemnification arrangements is not probable or reasonably possible and the amount or range of amounts of any such liability is not reasonably estimable.
10. Stockholders’ Equity (Deficit)
Amended and Restated Certificate of Incorporation
Upon the effectiveness of the Amended and Restated Certificate of Incorporation of the Company on June 25, 2015, the number of shares of capital stock that is authorized to be issued was increased to 325,000,000 shares, of which 250,000,000 shares are Class A common stock, 50,000,000 shares are Class B common stock and 25,000,000 are undesignated preferred stock. The Class A common stock, Class B common stock and preferred stock have a par value of $0.0001 per share.
At December 31, 2015, there were 9,005,000 of Class A common shares outstanding, 24,541,000 of Class B shares outstanding and no preferred shares outstanding.
Class A Common Stock and Class B Common Stock
Except for voting rights, or as otherwise required by applicable law, the shares of our Class A common stock and Class B common stock have the same powers, preferences and rights and rank equally, share ratably and are identical in all respects as to all matters. The rights and preferences are as follows:
81
Dividend Rights. Subject to preferences that may apply to any shares of preferred stock outstanding at the time, the holders of outstanding shares of our Class A common stock and Class B common stock are entitled to receive dividends out of funds legally available at the times and in the amounts that our board of directors may determine.
Voting Rights. The holders of our Class A common stock are entitled to one vote per share, and holders of our Class B common stock are entitled to 10 votes per share. The holders of our Class A common stock and Class B common stock will vote together as a single class on all matters submitted to a vote of our stockholders, unless otherwise required by Delaware law or our amended and restated certificate of incorporation. Delaware law could require either holders of our Class A common stock or holders of our Class B common stock to vote separately. In addition, our amended and restated certificate of incorporation requires the approval of the holders of at least a majority of the outstanding shares of our Class B common stock, voting as a separate class to approve a change-in-control transaction.
Conversion. Each share of our Class B common stock is convertible at any time at the option of the holder into one share of our Class A common stock. In addition, each share of our Class B common stock will convert into one share of our Class A common stock upon any transfer, whether or not for value, except for certain transfers described in our amended and restated certificate of incorporation, including, without limitation, (i) a transfer by a partnership or limited liability company that was a registered holder of our Class B common stock at the “effective time,” as defined in our amended and restated certificate of incorporation, to a partner or member thereof at the effective time or (ii) a transfer to a “qualified recipient,” as defined in our amended and restated certificate of incorporation.
All the outstanding shares of our Class B common stock will convert automatically into shares of our Class A common stock upon the date when the number of outstanding shares of our Class B common stock represents less than 10% of all outstanding shares of our Class A common stock and Class B common stock. Once converted into our Class A common stock, our Class B common stock may not be reissued.
Right to Receive Liquidation Distributions. Upon our dissolution, liquidation or winding-up, the assets legally available for distribution to our stockholders are distributable ratably among the holders of our Class A common stock and Class B common stock, subject to prior satisfaction of all outstanding debt and liabilities and the preferential rights and payment of liquidation preferences, if any, on any outstanding shares of preferred stock.
Reverse Stock Split
On June 4, 2015, we effected a one-for-four reverse split of our common stock and a proportional adjustment to the conversion ratio of our convertible preferred stock. The par value and the number of authorized shares of our common stock and convertible preferred stock were not adjusted as a result of the reverse split. All share, per share and related information presented in these Consolidated Financial Statements and accompanying notes has been retroactively adjusted, where applicable, to reflect the impact of the reverse stock split, including an adjustment to the preferred stock conversion ratio.
Initial Public Offering - Class A Common Stock
On June 30, 2015, we completed an initial public offering (“IPO”) of our Class A common stock. In connection with the offering, we sold 6,200,000 shares of common stock at $12.00 per share for aggregate net proceeds of $65.1 million after underwriting discounts and commissions and offering expenses. Upon the closing of the offering, all shares of our convertible preferred stock and common stock held prior to the offering were converted into shares of Class B common stock.
On July 8, 2015, in connection with the exercise of an overallotment option granted to the underwriters, we sold 930,000 additional shares of our Class A common stock to the underwriters at the public offering price of $12.00 per share, resulting in an additional $10.4 million in net proceeds, after deducting underwriting discounts and commissions. As a result, the aggregate net proceeds to us from the sale of shares in the IPO were approximately $75.4 million.
Preferred Stock
Effective upon the filing of our amended and restated certificate of incorporation in June 2015, no shares of preferred stock were outstanding because all outstanding shares of our convertible preferred stock converted into our Class B common stock.
Pursuant to the terms of our amended and restated certificate of incorporation, our board of directors will be authorized, subject to limitations prescribed by Delaware law, to issue up to 25,000,000 shares of our preferred stock in one or more series, to establish from time to time the number of shares to be included in each series, and to fix the designation, powers, preferences and rights of the shares of each series and any of its qualifications, limitations or restrictions, in each case without further action by our stockholders. The number of authorized shares of any series of preferred stock may be increased or decreased, but not
82
below the number of shares of that series then outstanding, by the affirmative vote of the holders of a majority of the voting power of our outstanding capital stock entitled to vote thereon, or such other vote as may be required by the certificate of designation establishing the series.
Convertible Preferred Stock Prior to IPO
Up until our IPO, we had authorized preferred stock consists of Series A convertible preferred stock (“Series A”), Series B convertible preferred stock (“Series B”), Series B-1 convertible preferred stock (“Series B-1”), Series B-2 convertible preferred stock (“Series B-2”) and Series B-3 convertible preferred stock (“Series B-3”) (collectively the “preferred stock prior to IPO”).
Each preferred stockholder was entitled to the number of votes equal to the number of shares of common stock into which each preferred share was convertible at the time of such vote. The preferred stock was also entitled to receive non-cumulative dividends, when and if declared by our board of directors. No dividends were declared by our board of directors. In the event of a liquidation, the preferred stock was entitled to receive prior to payment of any amounts to the common stockholders the greater of (i) the original issuance price plus any declared but unpaid dividends or (ii) such amount per share as would have been payable had all shares of preferred stock been converted into common stock immediately prior to such liquidation, dissolution or winding up. The preferred stock was convertible into common stock at the option of the holder or automatically upon a qualified initial public offering. The preferred stock automatically converted to Class B common upon the Company's initial public offering.
The liquidation preference provisions of the convertible preferred stock prior to IPO are considered contingent redemption provisions because there are certain elements that were not solely within our control, such as a change in control. Accordingly, we presented the convertible preferred stock prior to IPO within the mezzanine portion of the consolidated balance sheets.
11. Stock-Based Compensation
Stock Options
2015 Stock Incentive Plan
In conjunction with our IPO, our board of directors and stockholders adopted the 2015 Stock Incentive Plan or "2015 Plan." We have reserved an aggregate of 2,000,000 shares of our Class A common stock for issuance under the 2015 Plan. The number of shares reserved for issuance will increase automatically on January 1 of each calendar year beginning in 2016 and continuing through 2025 by the lesser of (i) the number of shares of our Class A common stock subject to awards granted under the 2015 Plan during the preceding calendar year, or (ii) the number of shares of our Class A common stock determined by our board of directors. The number of shares of our Class A common stock is also subject to adjustment in the event of a recapitalization, stock split, reclassification, stock dividend or other change in our capitalization. The 2015 Plan authorizes the award of stock options, stock appreciation rights ("SARs"), restricted stock awards ("RSAs"), restricted stock units ("RSUs"), performance awards and stock bonuses. The 2015 Plan provides for the grant of awards to our employees, directors, consultants and independent contractors, subject to certain exceptions. Under the 2015 Plan, stock options, RSAs and RSUs have been issued during 2015.
Stock options may vest based on the passage of time or the achievement of performance conditions in the discretion of our compensation committee. Our compensation committee may provide for stock options to be exercised only as they vest or to be immediately exercisable with any shares issued on exercise being subject to our right of repurchase that lapses as the shares vest. The maximum term of stock options granted under the 2015 Plan is 10 years. We have not issued any stock option grants with performance conditions.
RSUs represent the right on the part of the holder to receive shares of our Class A common stock at a specified date in the future, subject to forfeiture of that right due to termination of employment. If an RSU has not been forfeited, then, on the specified date, we will deliver to the holder of the RSU shares of our Class A common stock, cash or a combination of cash and shares of our Class A common stock.
2007 Stock Incentive Plan
On February 14, 2007, our board of directors adopted the 2007 Stock Incentive Plan (the “2007 Plan”) as an amendment and restatement to an original 2006 Equity Incentive Plan and was most recently amended in July 2014. Under the 2007 Plan, the number of shares of our common stock to be granted or subject to options or rights may not exceed 4.3 million. The 2007 Plan was administered by our board of directors, which determines the terms and conditions of each grant. Employees, officers, directors and consultants are eligible to receive stock options and stock awards under the 2007 Plan. The aggregate number of shares available under the 2007 Plan and the number of shares subject to outstanding options automatically adjusts for any changes in the outstanding common stock by reason of any recapitalization, spin-off, reorganization, reclassification, stock dividend, stock
83
split, reverse stock split, or similar transaction. The exercise price of incentive stock options may not be less than the fair value of our common stock at the date of grant. The exercise price of incentive stock options granted to individuals that own greater than 10% of our voting stock may not be less than 110% of the fair value of our common stock at the date of grant. The term of each stock option cannot exceed ten years. Our board of directors will determine the vesting terms of all stock options. Generally, our board of directors has granted options with vesting terms of four years and contractual terms of ten years.
A summary of our stock option activity for the year ended December 31, 2015 is as follows (number of shares in thousands):
Number of Shares | Weighted Average Exercise Price per Share | Weighted Average Remaining Contractual Life in Years | |||||||
Options outstanding as of December 31, 2014 | 1,217 | $ | 3.12 | 8.2 | |||||
Options granted | 359 | 9.53 | |||||||
Options exercised | (317 | ) | 1.78 | ||||||
Options cancelled/forfeited | (88 | ) | 5.04 | ||||||
Options outstanding as of December 31, 2015 | 1,171 | $ | 5.30 | 8.0 | |||||
As of December 31, 2015: | |||||||||
Options vested or expected to vest | 1,100 | $ | 5.20 | 8.0 | |||||
Options exercisable (1) | 469 | $ | 3.12 | 6.8 | |||||
(1) Included in the options exercisable are 101,000 shares which have an early exercise option. The weighted average exercise price of these options are $5.64 per share and the weighted average contractual life in years are 9.1 years.
The fair value of stock options granted is estimated on the date of grant using the Black-Scholes option-pricing model. Our stock-based compensation expense for stock options for the years ended December 31, 2015, 2014 and 2013 was $723,000, $141,000 and $84,000, respectively.
The following table summarizes information relating to our stock options granted during the years ended December 31, 2015, 2014 and 2013:
Year Ended December 31, | ||||||||||||
2015 | 2014 | 2013 | ||||||||||
Stock options granted (in thousands) | 359 | 702 | 126 | |||||||||
Weighted average exercise price per share | $ | 9.53 | $ | 4.60 | $ | 1.80 | ||||||
Weighted average grant-date fair value per share | $ | 6.89 | $ | 2.20 | $ | 0.88 | ||||||
Weighted average Black-Scholes model assumptions: | ||||||||||||
Risk-free interest rate | 1.58 | % | 1.86 | % | 1.24 | % | ||||||
Expected term (in years) | 6.2 | 6.2 | 6.0 | |||||||||
Expected volatility | 46 | % | 48 | % | 51 | % | ||||||
Expected dividend yield | — | — | — | |||||||||
As of December 31, 2015, the total remaining stock-based compensation expense for unvested stock options was $2.6 million, which is expected to be recognized over a weighted average period of 3.2 years.
The total intrinsic value of options exercised in 2015, 2014 and 2013 was $3.1 million, $0.4 million and $0.2 million, respectively. This intrinsic value represents the difference between the fair market value of our common stock on the date of exercise and the exercise price of each option. Based on the fair value of our common stock as of December 31, 2015, the total intrinsic value of all outstanding options was $11.0 million. The total intrinsic value of exercisable options as of December 31, 2015 was $5.4 million. The total intrinsic value of options vested and expected to vest as of December 31, 2015 was $10.5 million.
84
There were no excess tax benefits realized for the tax deductions from stock options exercised during the years ended December 31, 2015, 2014 and 2013.
Restricted Stock Awards
A summary of activity in connection with our restricted stock awards for the year ended December 31, 2015 is as follows (number of shares in thousands):
Number of Shares | Weighted- Average Grant Date Fair Value per Share | ||||||
Unvested as of December 31, 2014 | 173 | $ | 1.64 | ||||
Granted | 50 | 8.78 | |||||
Vested | (103 | ) | 1.56 | ||||
Forfeited | — | — | |||||
Unvested as of December 31, 2015 | 120 | $ | 4.68 | ||||
We have the right to repurchase any unvested restricted stock granted upon termination of employment. Restricted stock vests over a four-year period for employees and over a one-year period for non-employee directors. For the years ended December 31, 2015, 2014 and 2013, we recognized stock-based compensation expense for restricted stock awards of $381,000, $804,000 and $163,000, respectively. The fair value of the shares vested during 2015 was $160,000.
As of December 31, 2015, the total remaining stock-based compensation expense for unvested restricted stock awards was $0.4 million, which is expected to be recognized over a weighted average period of 1.5 years.
Certain key employees, including officers, purchased shares of restricted stock in exchange for promissory notes in our favor, bearing interest at rates ranging from 0.87% to 5.09% per annum. The principal amounts of certain notes were automatically forgiven under the terms of the notes over the vesting period of the restricted stock, provided the employee continued providing services to us through the forgiveness dates. For accounting purposes, these notes were considered non-substantive and the notes were not reflected in our Consolidated Financial Statements. Other notes were considered nonrecourse notes, as the notes were in substance collateralized only by the shares of our common stock underlying the restricted stock awards. The notes were considered stock options for accounting purposes, and were not recorded in the consolidated balance sheets. Total notes receivable as of December 31, 2013 were $1.1 million. In 2014, the nonrecourse notes were in substance forgiven as we paid a bonus plus applicable tax withholdings to the employees and the employees used the bonus to repay the notes in full. The forgiveness of the nonrecourse notes during the year ended December 31, 2014 was considered a modification to the underlying terms of the stock options, which resulted in additional stock-based compensation expense of $0.7 million, which was recorded in the year ended December 31, 2014, and $0.1 million, which will be recorded over the remaining vesting period of the restricted stock awards. As of December 31, 2015 and 2014, no employee notes were outstanding.
Restricted Stock Units
During 2015, we began granting restricted stock units ("RSUs") with a total fixed monetary amount of $970,000 that vest in equal tranches over four annual periods. On the first day of each vesting period, the number of shares to be issued in respect of the RSUs is determined by dividing the value of the portion of the RSUs that vest in that tranche by the closing price of our Class A common stock on the vesting date. The shares underlying this grant are not issued and outstanding until the applicable vesting date.
During 2015, 17,000 shares of RSUs were awarded with a weighted average grant date fair value of $15.45 per a share. Of the 17,000 shares awarded, we expect 16,000 shares to vest.
We recognized stock-based compensation expense for these RSUs of $70,000 for the year ended December 31, 2015. As of December 31, 2015, the total remaining stock-based compensation expense for these RSUs was $0.9 million, which is expected to be recognized over a weighted average period of 3.7 years.
85
12. Business Disposition
In December 2013, we sold and licensed certain assets of our secure data room product to SecureDocs, a newly formed C-corporation led by our former employees. As consideration, we received a (i) 20% nondilutive common stock interest in SecureDocs, (ii) $2.0 million promissory note payable upon the earlier of (a) a sale of SecureDocs, (b) the ninth anniversary of the transaction, or (c) bankruptcy, insolvency or other liquidation or dissolution of SecureDocs, and (iii) the right of first refusal to purchase SecureDocs in the event that an offer to purchase SecureDocs is made by a third party.
The disposition of this business was accounted for as a change in interest due to our loss of control over SecureDocs. We derecognized the carrying value of the SecureDocs’ net assets and liabilities of $0.1 million and recognized the fair value of the consideration received of approximately $0.4 million resulting in a gain of $0.3 million, which is included in other income (expense), net in the consolidated statements of operations. The fair value of the consideration received was estimated using a discounted cash flow analysis. At December 31, 2015, the note receivable of $0.3 million (net of allowance of $1.7 million) was reflected in Other assets in our Consolidated Balance Sheets and the carrying value of the equity-method investment in SecureDocs is $0.
13. Income Taxes
For the year ended December 31, 2015, we recorded income tax expense of $75,000 associated with state minimum taxes and the amortization of tax deductible goodwill that is not an available source of income to realize the deferred tax asset. We had no provision for income taxes for the years ended December 31, 2014 and 2013, because we have incurred losses and maintain a full valuation allowance against our net deferred tax assets.
Our effective tax rate differs from the U.S. Federal statutory rate of 34% primarily because our losses have been offset by a valuation allowance due to uncertainty as to the realization of those losses. Set forth below is a reconciliation of the components that caused our provision for income taxes to differ from amounts computed by applying the U.S. Federal statutory rate of 34% for the years ended December 31, 2015, 2014 and 2013:
Year Ended December 31, | ||||||||
2015 | 2014 | 2013 | ||||||
Income tax benefit at the statutory rate | 34 | % | 34 | % | 34 | % | ||
Change in contingent consideration | — | — | 6 | |||||
Permanent differences | (3 | ) | (1 | ) | (2 | ) | ||
Change in valuation allowance | (35 | ) | (37 | ) | (43 | ) | ||
Research and development credits | 3 | 4 | 5 | |||||
Provision for income taxes | (1 | )% | — | % | — | % | ||
86
The components of deferred tax assets (liabilities) were as follows (in thousands):
December 31, | |||||||
2015 | 2014 | ||||||
Deferred income tax assets: | |||||||
Net operating loss carryforwards | $ | 29,178 | $ | 22,579 | |||
Research and development tax credits | 2,867 | 2,014 | |||||
Other | 1,030 | 708 | |||||
Gross deferred tax assets | 33,075 | 25,301 | |||||
Valuation allowance | (25,926 | ) | (19,900 | ) | |||
Deferred tax assets, net of valuation allowance | 7,149 | 5,401 | |||||
Deferred tax liabilities: | |||||||
Property, equipment and software | (4,208 | ) | (2,351 | ) | |||
Intangible assets | (804 | ) | (1,282 | ) | |||
State taxes | (1,742 | ) | (1,450 | ) | |||
Other | (427 | ) | (318 | ) | |||
Total deferred tax liabilities | (7,181 | ) | (5,401 | ) | |||
Total net deferred tax assets (liabilities) | $ | (32 | ) | $ | — | ||
As of December 31, 2015, we had federal net operating losses of $74.2 million, which will begin to expire in 2027. As of December 31, 2015, we had state net operating losses of $47.2 million, which will begin to expire in 2017. As of December 31, 2015, we also had federal and state research and development credit carryforwards of $2.8 million and $2.9 million, respectively. The federal credit carryforwards will begin to expire in 2027, while the state credit carry forwards will begin to expire in 2035.
The Internal Revenue Code of 1986, as amended (“IRC”), imposes substantial restrictions on the utilization of net operating losses and other tax attributes in the event of an “ownership change” of a corporation. Accordingly, a company’s ability to use pre-change net operating loss and research tax credits may be limited as prescribed under IRC Section 382. Events which may cause limitation in the amount of the net operating losses and credits that we utilize in any one year include, but are not limited to, a cumulative ownership change of more than 50% over a three-year period. Due to the effects of historical equity issuances and the current year IPO, utilization of our net operating losses may be limited pursuant to IRC Section 382. The IRC Section 382 limitation is not expected to have a material effect on our financial statements.
Management assesses the available positive and negative evidence to estimate if sufficient future taxable income will be generated to use the existing deferred tax assets. A significant piece of objective negative evidence evaluated was the cumulative loss incurred through December 31, 2015. Such objective evidence limits the ability to consider other subjective positive evidence such as its future income projections. On the basis of this evaluation, as of December 31, 2015, a valuation allowance of $25.9 million has been recorded since it is more likely than not that the deferred tax assets will not be realized.
The change in the valuation allowance for the years ended December 31, 2015, 2014 and 2013 was as follows (in thousands):
Year Ended December 31, | |||||||||||
2015 | 2014 | 2013 | |||||||||
Valuation allowance, at beginning of year | $ | 19,900 | $ | 16,358 | $ | 12,809 | |||||
Increase in valuation allowance | 6,026 | 3,542 | 3,549 | ||||||||
Valuation allowance, at end of year | $ | 25,926 | $ | 19,900 | $ | 16,358 | |||||
87
The following is a reconciliation of the total amounts of unrecognized tax benefits (in thousands):
Year Ended December 31, | |||||||||||
2015 | 2014 | 2013 | |||||||||
Unrecognized tax benefit beginning of year | $ | 2,014 | $ | 1,600 | $ | 936 | |||||
Decreases-tax positions in prior year | — | (278 | ) | — | |||||||
Increases-tax positions in current year | 853 | 692 | 664 | ||||||||
Unrecognized tax benefit end of year | $ | 2,867 | $ | 2,014 | $ | 1,600 | |||||
The unrecognized tax benefits are recorded as a reduction to the deferred tax assets. Since there is a full valuation allowance recorded against the deferred tax assets, the recognition of previously unrecognized tax benefits on uncertain positions would result in no impact to the effective tax rate.
As of December 31, 2015 and 2014, we had no accrued interest and penalties related to uncertain income tax positions. We do not anticipate that the amount of unrecognized tax benefits will significantly increase or decrease within the next 12 months.
We are subject to taxation in the United States and various states. Due to the presence of net operating loss carryforwards, the years ended December 31, 2012 through 2015 remain open to examination by the Internal Revenue Service (“IRS”) and the years ended December 31, 2011 through 2015 remain open to examination by state taxing authorities. We are not currently under audit by any taxing authorities.
14. Revenue and Other Information
Our chief operating decision maker reviews separate revenue information for our core solutions, Value+ and other service offerings as a measure of growth in the number of our customers and growth in the adoption and utilization of our core solutions and Value+ services by new and existing customers. The following table presents our revenue categories for the years ended December 31, 2015, 2014 and 2013 (in thousands):
Year Ended December 31, | ||||||||||||
2015 | 2014 | 2013 | ||||||||||
Core solutions | $ | 32,119 | $ | 22,406 | $ | 14,413 | ||||||
Value+ services | 37,998 | 22,525 | 10,134 | |||||||||
Other | 4,860 | 2,740 | 1,995 | |||||||||
Total revenues | $ | 74,977 | $ | 47,671 | $ | 26,542 | ||||||
Value+ services presented in the table above include subscriptions to website hosting services and contact center services. Other services included above are for one-time services related to on-boarding our core solutions, website design services and revenue related to RentLinx online marketing services.
Our revenue is generated primarily from U.S. customers. All of our property and equipment is located in the U.S.
15. Retirement Plans
We have a 401(k) retirement and savings plan made available to all employees. The 401(k) plan allows each participant to contribute up to an amount not to exceed an annual statutory maximum. We may, at our discretion, make matching contributions to the 401(k) plan. We are responsible for the administrative costs of the 401(k) plan. We have not made any contributions to the 401(k) plan since inception.
16. Subsequent Events
On January 25, 2016, we signed a new lease for offices located in San Diego, California and on February 25, 2016, we signed an amendment to our existing lease in Santa Barbara, California. For additional information regarding these lease amendments, refer to Note 9, Commitments and Contingencies.
88
ITEM 9. | CHANGES IN AND DISAGREEMENTS WITH ACCOUNTANTS ON ACCOUNTING AND FINANCIAL DISCLOSURE |
None.
ITEM 9A. CONTROLS AND PROCEDURES
Evaluation of Disclosure Controls and Procedures
Our management, with the participation of our principal executive officer and principal financial officer, evaluated the effectiveness of our disclosure controls and procedures as of December 31, 2015, the last day of the period covered by this Annual Report. The term “disclosure controls and procedures,” as defined in Rules 13a-15(e) and 15d-15(e) under the Exchange Act, means controls and other procedures of a company that are designed to provide reasonable assurance that information required to be disclosed by a company in the reports that it files or submits under the Exchange Act is recorded, processed, summarized and reported, within the time periods specified in the SEC’s rules and forms. Disclosure controls and procedures include, without limitation, controls and other procedures designed to provide reasonable assurance that information required to be disclosed by a company in the reports that it files or submits under the Exchange Act is recorded, processed, summarized and reported within the time period specified by the SEC’s rules and forms and that such information is accumulated and communicated to the company’s management, including its principal executive officer and principal financial officer, as appropriate, to allow timely decisions regarding required disclosure. Based on the evaluation, our principal executive officer and principal financial officer have concluded that, as of December 31, 2015, our disclosure controls and procedures were effective at the reasonable assurance level.
Limitations on the Effectiveness of Controls and Procedures
In designing and evaluating our disclosure controls and procedures, management recognizes that any controls and procedures, no matter how well designed and operated, can provide only reasonable, not absolute, assurance of achieving the desired control objectives. In addition, the design of disclosure controls and procedures must reflect the fact that there are resource constraints and that management is required to apply judgment in evaluating the benefits of possible controls and procedures relative to their costs. The design of any disclosure controls and procedures also is based in part upon certain assumptions about the likelihood of future events, and there can be no assurance that any design will succeed in achieving it stated goals under all potential future conditions.
Management’s Annual Report on Internal Control over Financial Reporting
This Annual Report does not include a report of management’s assessment regarding internal control over financial reporting or an attestation report of our independent registered public accounting firm due to a transition period established by SEC rules and regulations for newly public companies.
Changes in Internal Control over Financial Reporting
There were no changes in our internal control over financial reporting identified in connection with the evaluation required by Rules 13(a)-15(d) and 15d-15(d) under the Exchange Act that occurred during the quarter ended December 31, 2015 that have materially affected, or are reasonably likely to materially affect, our internal control over financial reporting.
Remediation of Previously Identified Material Weaknesses in Internal Control over Financial Reporting
In connection with the audit of our consolidated financial statements as of and for the year ended December 31, 2014, our independent registered public accounting firm identified material weaknesses in our internal control over financial reporting. A material weakness is a deficiency, or a combination of deficiencies, in internal control over financial reporting such that there is a reasonable possibility that a material misstatement of our financial statements will not be prevented or detected on a timely basis. The material weaknesses identified related to our failure to design or maintain an effective control environment with sufficient personnel with an appropriate level of accounting and financial reporting expertise with respect to the accounting for non-routine, complex transactions, which contributed to a material weakness in our accounting policies and procedures designed to address the accounting for unusual or complex transactions.
89
In response to the identified material weaknesses, we took a number of actions to improve our internal control over financial reporting during the year ended December 31, 2015, including the following:
1. | We hired additional personnel in our accounting and finance department with extensive knowledge in accounting and financial reporting, a majority of which are Certified Public Accountants with experience addressing unusual, complex and non-routine transactions. |
2. | We organized and implemented a Disclosure Committee to review the Company’s transactions each quarter with key management and operational personnel which includes the review and discussion of unusual, complex and non-routine transactions. |
Management believes that these and other actions taken during the year ended December 31, 2015 have been fully implemented and are operating effectively. As a result, we have concluded that our remediation efforts have been successful, and that the previously identified material weaknesses in our internal controls have been remediated. However, while these material weaknesses have been remediated, we continue to seek improvements to enhance our control environment, and to strengthen our internal controls to provide reasonable assurance that our financial statements continue to be fairly stated in all material respects.
ITEM 9B. OTHER INFORMATION
Execution of Second Amendment to Lease Agreement
On February 25, 2016, we entered into a Second Amendment to Lease, or the Lease Amendment, with Nassau Land Company, L.P., which amends the terms of that certain Multi-Tenant Industrial Lease, or the Lease, originally entered into by and between the parties on February 17, 2015 pursuant to which the Company leases office space in the building located at 90 Castilian Drive in Santa Barbara, California.
Pursuant to the Lease Amendment, the Company has exercised a portion of its expansion right under the Lease and, in doing so, has agreed to lease an additional 9,449 square feet of office space within the same building, which is separate from but adjacent to its corporate headquarters in Santa Barbara, California. As a result, the Lease now covers an aggregate of approximately 35,939 square feet of office space. The aggregate annual payments under the Lease will now be approximately $625,300, and are subject to annual increases over the term of the Lease as described therein. The Lease Amendment does not change any other material provisions of the Lease, including the term of the Lease, which expires in November 2020.
The Lease Amendment does not impact the terms of that certain Multi-Tenant Industrial Lease entered into by the parties on April 1, 2011, which covers the lease of the Company’s corporate headquarters located at 50 Castilian Drive in Santa Barbara, California
The foregoing summary of the Lease Amendment is qualified in its entirety by reference to the full text of the Lease Amendment, which is filed as Exhibit 10.4 to this Annual Report.
90
PART III
ITEM 10. DIRECTORS, EXECUTIVE OFFICERS AND CORPORATE GOVERNANCE
The information required by this item will be included in the Proxy Statement, which will be filed with the SEC not later than 120 days after the end of our fiscal year ended December 31, 2015, and is incorporated herein by reference.
ITEM 11. EXECUTIVE COMPENSATION
The information required by this item will be included in the Proxy Statement and is incorporated herein by reference.
ITEM 12. | SECURITY OWNERSHIP OF CERTAIN BENEFICIAL OWNERS AND MANAGEMENT AND RELATED STOCKHOLDERS MATTERS |
The information required by this item will be included in the Proxy Statement and is incorporated herein by reference.
ITEM 13. | CERTAIN RELATIONSHIPS AND RELATED TRANSACTIONS, AND DIRECTOR INDEPENDENCE |
The information required by this item will be included in the Proxy Statement and is incorporated herein by reference.
ITEM 14. PRINCIPAL ACCOUNTING FEES AND SERVICES
The information required by this item will be included in the Proxy Statement and is incorporated herein by reference.
91
PART IV
ITEM 15. EXHIBITS AND FINANCIAL STATEMENTS SCHEDULES
The following documents are filed as part of this Annual Report:
1. | Consolidated Financial Statements |
Our consolidated financial statements are listed in the “Index to Consolidated Financial Statements” under Part II, Item 8, of this Annual Report.
2. | Financial Statement Schedules |
All financial statement schedules have been omitted because they are not required or are not applicable, or the required information is shown in our consolidated financial statements or the notes thereto.
3. | Exhibits |
The documents listed in the Exhibit Index of this Annual Report are filed, furnished or incorporated by reference with this Annual Report, in each case as indicated therein.
92
SIGNATURES
Pursuant to the requirements of Section 13 or 15(d) of the Securities Exchange Act of 1934, as amended, the registrant has duly caused this Annual Report to be signed on its behalf by the undersigned thereunto duly authorized.
AppFolio, Inc. | ||||
Date: | February 29, 2016 | By: | /s/ Ida Kane | |
Ida Kane | ||||
Chief Financial Officer | ||||
(Principal Financial and Accounting Officer) | ||||
93
POWER OF ATTORNEY
KNOW ALL PERSONS BY THESE PRESENTS, that each individual whose signature appears below hereby constitutes and appoints Brian Donahoo and Ida Kane, and each or either of them, acting individually, as his or her true and lawful attorney-in-fact and agent, with full power of substitution and resubstitution for him or her and in his or her name, place and stead, in any and all capacities, to sign any and all amendments to this Annual Report, and to file the same, with all exhibits thereto and other documents in connection therewith, with the SEC, granting unto said attorney-in-fact and agent, and each of them, full power and authority to do and perform each and every act and thing requisite and necessary to be done in connection therewith, as fully for all intents and purposes as he or she might or could do in person, hereby ratifying and confirming all that said attorney-in-fact and agent, or any of them, or their or his or her substitutes, may lawfully do or cause to be done or by virtue hereof.
Pursuant to the requirements of the Exchange Act, as amended, this Annual Report has been signed below by the following persons on behalf of the registrant and in the capacities and on the dates indicated.
SIGNATURE | TITLE | DATE | ||
/s/ Brian Donahoo | President, Chief Executive Officer and Director (Principal Executive Officer) | February 29, 2016 | ||
Brian Donahoo | ||||
/s/ Ida Kane | Chief Financial Officer (Principal Financial and Accounting Officer) | February 29, 2016 | ||
Ida Kane | ||||
/s/ Andreas von Blottnitz | Chairman of the Board | February 29, 2016 | ||
Andreas von Blottnitz | ||||
/s/ Timothy Bliss | Director | February 29, 2016 | ||
Timothy Bliss | ||||
/s/ Janet Kerr | Director | February 29, 2016 | ||
Janet Kerr | ||||
/s/ James Peters | Director | February 29, 2016 | ||
James Peters | ||||
/s/ William Rauth | Director | February 29, 2016 | ||
William Rauth | ||||
/s/ Klaus Schauser | Chief Strategist and Director | February 29, 2016 | ||
Klaus Schauser | ||||
EXHIBIT INDEX
Incorporated by Reference | ||||||||||||
Exhibit Number | Exhibit Description | Form | File No. | Exhibit | Filing Date | Filed Herewith | ||||||
3.1 | Amended and Restated Certificate of Incorporation of the registrant as currently in effect. | 10-Q | 001-37468 | 3.1 | 8/6/2015 | |||||||
3.2 | Amended and Restated Bylaws of the registrant as currently in effect. | 10-Q | 001-37468 | 3.2 | 8/6/2015 | |||||||
4.1 | Specimen Certificate for Class A Common Stock. | S-1/A | 333-204262 | 4.1 | 6/4/2015 | |||||||
4.2 | Amended and Restated Investor Rights Agreement, by and among the registrant and the investors named therein, dated November 26, 2013. | S-1/A | 333-204262 | 4.2 | 6/4/2015 | |||||||
10.1 | Multi-Tenant Industrial Lease, by and between the registrant and Nassau Land Company, L.P., dated April 1, 2011, as amended. | S-1/A | 333-204262 | 10.1 | 6/4/2015 | |||||||
10.2 | Multi-Tenant Industrial Lease, by and between the registrant and Nassau Land Company, L.P., dated February 17, 2015. | S-1/A | 333-204262 | 10.2 | 6/4/2015 | |||||||
10.3 | First Amendment to Lease, by and between the registrant and Nassau Land Company, L.P., dated October 5, 2015. | 10-Q | 001-37468 | 10.2 | 11/9/2015 | |||||||
10.4 | Second Amendment to Lease, by and between the registrant and Nassau Land Company, L.P., dated February 25, 2016. | X | ||||||||||
10.5# | 2007 Stock Incentive Plan, as amended, and related form agreements. | S-1/A | 333-204262 | 10.3 | 6/4/2015 | |||||||
10.6# | 2015 Stock Incentive Plan and related form agreements. | S-1/A | 333-204262 | 10.4 | 6/4/2015 | |||||||
10.7# | 2015 Employee Stock Purchase Plan. | S-1/A | 333-204262 | 10.5 | 6/4/2015 | |||||||
10.8 | Form of Indemnification Agreement by and between the registrant and each of its executive officers and directors. | S-1 | 333-204262 | 10.6 | 5/18/2015 | |||||||
10.9 | Credit Agreement, by and among the registrant, Wells Fargo Bank, N.A., as administrative agent, and the lenders that are parties thereto, dated March 16, 2015. | S-1 | 333-204262 | 10.7 | 5/18/2015 | |||||||
10.10 | Amendment Number One to Credit Agreement, by and among the registrant, Wells Fargo Bank, N.A., as administrative agent, and the lenders that are parties thereto, dated October 9, 2015. | 10-Q | 001-37468 | 10.1 | 11/9/2015 | |||||||
21.1 | Subsidiaries of the registrant. | X | ||||||||||
23.1 | Consent of independent registered public accounting firm. | X | ||||||||||
24.1 | Power of Attorney (included on the signature page of this report). | X | ||||||||||
31.1 | Certification of Chief Executive Officer pursuant to Rule 13a-14(a) or Rule 15d-14(a) promulgated under the Securities Exchange Act of 1934, as amended. | X | ||||||||||
Incorporated by Reference | ||||||||||||
Exhibit Number | Exhibit Description | Form | File No. | Exhibit | Filing Date | Filed Herewith | ||||||
31.2 | Certification of Chief Financial Officer pursuant to Rule 13a-14(a) or Rule 15d-14(a) promulgated under the Securities Exchange Act of 1934, as amended. | X | ||||||||||
32.1* | Certifications of Chief Executive Officer and Chief Financial Officer, pursuant to 18 U.S.C. Section 1350, as adopted pursuant to Section 906 of the Sarbanes-Oxley Act of 2002. | X | ||||||||||
101.INS | XBRL Instance Document. | X | ||||||||||
101.SCH | XBRL Taxonomy Extension Schema Document. | X | ||||||||||
101.CAL | XBRL Taxonomy Extension Calculation Linkbase Document. | X | ||||||||||
101.DEF | XBRL Taxonomy Extension Definition Linkbase Document. | X | ||||||||||
101.LAB | XBRL Taxonomy Extension Label Linkbase Document. | X | ||||||||||
101.PRE | XBRL Taxonomy Extension Presentation Linkbase Document. | X | ||||||||||
# | Indicates a management contract or compensatory plan or arrangement |
* | The certifications attached as Exhibit 32.1 accompany this Annual Report pursuant to 18 U.S.C. Section 1350, as adopted pursuant to Section 906 of the Sarbanes-Oxley Act of 2002, and shall not be deemed “filed” by the registrant for purposes of Section 18 of the Exchange Act and are not to be incorporated by reference into any of the registrant’s filings under the Securities Act or the Exchange Act, irrespective of any general incorporation language contained in any such filing. |