UNITED STATES
SECURITIES AND EXCHANGE COMMISSION
WASHINGTON, D.C. 20549
FORM 10-K
(Mark One)
|
x
|
ANNUAL REPORT PURSUANT TO SECTION 13 OR 15(D) OF THE SECURITIES EXCHANGE ACT OF 1934
|
For the fiscal year ended December 31, 2012
or
|
o
|
TRANSITION REPORT UNDER SECTION 13 OR 15(D) OF THE SECURITIES EXCHANGE ACT OF 1934
|
For the transition period from to
Commission file number: 001-35520
GIGOPTIX, INC.
(Exact name of registrant as specified in its charter)
|
Delaware
|
26-2439072
|
|
|
(State or Other Jurisdiction of Incorporation or Organization)
|
(I.R.S. Employer Identification No.)
|
130 Baytech Drive
San Jose, CA 95134
Registrant’s telephone number: (408-522-3100)
Securities registered pursuant to Section 12(b) of the Exchange Act:
|
Title of each class
|
|
Name of each exchange on which registered
|
|
Common Stock ($0.001 par value)
|
|
NYSE MKT
|
Securities registered pursuant to Section 12(g) of the Exchange Act: None
Indicate by check mark if the registrant is a well-known seasoned issuer, as defined in Rule 405 of the Securities Act. Yes ¨ No x
Indicated by check mark if the registrant is not required to file reports pursuant to Section 13 or Section 15(d) of the Act. Yes o No x
Indicate by check mark whether the registrant (1) has filed all reports required to be filed by Section 13 or 15(d) of the Securities Exchange Act of 1934 during the preceding 12 months (or for such shorter period that the registrant was required to file such reports), and (2) has been subject to such filing requirements for the past 90 days. Yes x No ¨
Indicate by check mark whether the registrant has submitted electronically and posted on its corporate Web site, if any, every Interactive Data File required to be submitted and posted pursuant to Rule 405 of Regulation S-T (§ 232.405 of this chapter) during the preceding 12 months (or for such shorter period that the registrant was required to submit and post such files). Yes x No ¨
Indicate by check mark if disclosure of delinquent filers pursuant to Item 405 of Regulation S-K is not contained herein, and will not be contained, to the best of registrant’s knowledge, in definitive proxy or information statements or any amendment to this Form 10-K. x
Indicate by check mark whether the registrant is a large accelerated filer, an accelerated filer, a non-accelerated filer, or a smaller reporting company. See the definitions of “large accelerated filer,” “accelerated filer” and “smaller reporting company” in Rule 12b-2 of the Exchange Act. (Check one):
|
Large accelerated filer
|
o |
Accelerated filer
|
o |
|
Non-accelerated filer
|
o (Do not check if a smaller reporting company)
|
Smaller reporting Company
|
x |
Indicate by check mark whether the registrant is a shell company (as defined in Rule 12b-2 of the Exchange Act). Yes ¨ No x
The aggregate value of the registrant’s common stock held by non-affiliates as of July 1, 2012, the last business day of the registrant’s most recently completed second fiscal quarter was approximately $58.0 million.
The number of shares of common stock outstanding as of March 8, 2013, the most recent practicable date prior to the filing of this Annual Report on Form 10-K, was 22,329,758 shares.
GIGOPTIX, INC.
ANNUAL REPORT ON FORM 10-K
FOR FISCAL YEAR ENDED DECEMBER 31, 2012
TABLE OF CONTENTS
|
|
|
|
PAGE NO
|
|
SPECIAL NOTE REGARDING FORWARD-LOOKING STATEMENTS
|
|
||
|
|
|
|
|
|
PART I
|
|
||
|
|
|
|
|
|
|
ITEM 1
|
6
|
|
|
|
ITEM 1A
|
19
|
|
|
|
ITEM 2
|
34
|
|
|
|
ITEM 3
|
34
|
|
|
|
ITEM 4
|
35
|
|
|
|
|
|
|
|
PART II
|
|
||
|
|
|
|
|
|
|
ITEM 5
|
36
|
|
|
|
ITEM 6
|
38
|
|
|
ITEM 7
|
MANAGEMENT’S DISCUSSION AND ANALYSIS OF FINANCIAL CONDITION AND RESULTS OF OPERATIONS |
38
|
|
|
|
ITEM 8
|
50
|
|
|
|
ITEM 9
|
86
|
|
|
|
ITEM 9A
|
86
|
|
|
|
ITEM 9B
|
87
|
|
|
|
|
|
|
|
PART III
|
|
||
|
|
|
|
|
|
|
ITEM 10
|
87
|
|
|
|
ITEM 11
|
90
|
|
|
|
ITEM 12
|
99
|
|
|
|
ITEM 13
|
100
|
|
|
|
ITEM 14
|
101
|
|
|
|
|
|
|
|
PART IV
|
|
||
|
|
|
|
|
|
|
ITEM 15
|
102
|
|
|
103
|
|||
-----------------------------------------------------------------
References in this Annual Report on Form 10-K to “we,” “us,” “our,” “GigOptix,” “GIG” and “GGOX” mean GigOptix, Inc. and all entities owned or controlled by GigOptix, Inc.
-----------------------------------------------------------------
All brand names, trademarks and trade names referred to in this report are the property of their respective holders.
SPECIAL NOTE REGARDING FORWARD-LOOKING STATEMENTS
This Annual Report on Form 10-K and the documents incorporated herein by reference include “forward-looking statements” within the meaning and protections of Section 27A of the Securities Act of 1933, as amended, or the Securities Act, and Section 21E of the Securities Exchange Act of 1934, as amended, or the Exchange Act. Forward-looking statements include statements with respect to our beliefs, plans, objectives, goals, expectations, anticipations, assumptions, estimates, intentions, and future performance, and involve known and unknown risks, uncertainties and other factors, which may be beyond our control, and which may cause our actual results, performance or achievements to be materially different from future results, performance or achievements expressed or implied by such forward-looking statements.
All statements other than statements of historical fact are statements that could be forward-looking statements. You can identify these forward-looking statements through our use of words such as “may,” “will,” “anticipate,” “assume,” “should,” “indicate,” “would,” “believe,” “contemplate,” “expect,” “estimate,” “continue,” “plan,” “project,” “could,” “intend,” “target” and other similar words and expressions of the future. These forward-looking statements may not be realized due to a variety of factors, including, without limitation:
|
|
·
|
we have a history of incurring losses;
|
|
|
·
|
our ability to remain competitive in the markets we serve;
|
|
|
·
|
the effects of future economic, business and market conditions;
|
|
|
·
|
consolidation in the industry we serve;
|
|
|
·
|
our ability to obtain additional funding in the future;
|
|
|
·
|
our ability to continue to develop, manufacture and market innovative products and services that meet customer requirements for performance and reliability;
|
|
|
·
|
our ability to establish and maintain effective internal controls over our financial reporting;
|
|
|
·
|
risks relating to the transaction of business internationally;
|
|
|
·
|
our failure to realize anticipated benefits from acquisitions or the possibility that such acquisitions could adversely affect us, and risks relating to the prospects for future acquisitions;
|
|
|
·
|
the loss of key employees and the ability to retain and attract key personnel, including technical and managerial personnel;
|
|
|
·
|
quarterly and annual fluctuations in results of operations;
|
|
|
·
|
investments in research and development;
|
|
|
·
|
protection and enforcement or our intellectual property rights and proprietary technologies;
|
|
|
·
|
costs associated with current and potential intellectual property infringement claims asserted by a third party and asserted by us against a third party;
|
|
|
·
|
our exposure to product liability claims resulting from the use of our products;
|
|
|
·
|
the loss of one or more of our significant customers, or the diminished demand for our products;
|
|
|
·
|
the loss of one or more of our critical vendors, particularly sole source suppliers of key components and wafers;
|
|
|
·
|
our dependence on contract manufacturing and outsourced supply chain, as well as the costs of materials;
|
|
|
·
|
our reliance on third parties to provide services for the operation of our business;
|
|
|
·
|
the effects of war, terrorism, natural disasters or other catastrophic events;
|
|
|
·
|
our success at managing the risks involved in the foregoing items; and
|
|
|
·
|
other risks and uncertainties, including those listed under the heading “Risk Factors” herein.
|
The forward-looking statements are based upon management’s beliefs and assumptions and are made as of the date of this Annual Report on Form 10-K. We undertake no obligation to publicly update or revise any forward-looking statements included or incorporated by reference in this Annual Report on Form 10-K or to update the reasons why actual results could differ from those contained in such statements, whether as a result of new information, future events or otherwise, except to the extent required by federal securities laws. These forward looking statements are found at various places throughout this Annual Report on Form 10-K. Any investor should consider all risks and uncertainties disclosed in our filings with the Securities and Exchange Commission, or the SEC, described below under the heading “Where You Can Find More Information,” all of which is accessible on the SEC’s website at www.sec.gov.
PART I
|
ITEM 1.
|
BUSINESS
|
Overview
We are a leading fabless supplier of semiconductor components that enable high speed information streaming over network infrastructures. Our business is made up of two product lines, our High-Speed Communications products and our Industrial products.
Through our High-Speed Communications product line we offer a broad portfolio of high performance optical and wireless components to telecommunication (telecom) and data communication (datacom) customers, including i) mixed signal radio frequency integrated circuits (RFIC), including 40G and 100G laser and optical modulator drivers and trans-impedance amplifiers (TIA) for telecom, datacom, and consumer electronic fiber-optic applications; ii) power amplifiers and transceivers for microwave and millimeter monolithic microwave integrated circuit (MMIC) wireless applications including 73 Ghz and 83 GHz power amplifiers and transceiver chips; iii) thin film polymer on silicon (TFPS) optical modulators for 40G and 100G fiber-optic telecom; and iv) integrated systems in a package (SIP) solutions for both fiber-optic and wireless applications.
Through our Industrial product line, we offer a wide range of digital and mixed-signal application specific integrated circuit (ASIC) solutions for industrial, military, avionics, medical and communications markets.
We focus on the specification, design, development and sale of analog semiconductor integrated circuits (ICs), multi-chip module (MCM) solutions, polymer modulators, and digital and mixed signal application specific integrated circuits (ASICs), as well as wireless communications MMICs and modules. We believe we are an industry leader in the fast growing market for electronic solutions that enable high-bandwidth optical connections found in telecom, datacom and storage systems, and, increasingly, in consumer electronics and computing systems.
Since inception, we have expanded our customer base with the acquisition and integration of five businesses with complementary products and customers. In so doing, we have expanded our product line from a few leading 10 gigabit per second (Gbps) ultra-long haul electronic modulator drivers at our inception in July 2007 to a line of over 150 products today that include: drivers, receivers and modulators for 10 to 400Gbps optical applications; power amplifiers, filters and attenuators spanning up to 86GHz wireless applications; and custom ASICs spanning 0.6um to 65nm technology nodes. Our direct sales force is based in 3 countries and is supported by a significant number of channel representatives and distributors that sell our products throughout North America, Europe, Japan and Asia.
Industry Background
High-Speed Communication Product Line
Over the past several years, communications networks have undergone significant challenges as network operators pursue more profitable service offerings while reducing operating costs. The growing demand for bandwidth due to the explosion of data, voice and video across networks by enterprises and consumers has driven service providers to continuously add higher speed access such as Wi-Fi, 3G, 4G long term evolution (LTE), digital subscriber line (DSL), cable and fiber to the destination X (FTTx), as well as converging their separate voice and data networks into a single IP-based high capacity integrated network to more easily manage and provision these services. High bandwidth applications such as music downloading, video streaming, social networks, on-line gaming, cloud services and internet protocol television (IPTV) are challenging network service providers to supply increasing bandwidth to their customers and results in increased network utilization across the entire core and edge of wire-line, wireless and cable networks. Additionally, enterprises and institutions are managing their rapidly escalating demand for data and bandwidth and are upgrading and deploying higher speed local, storage and wide area networks (LANs, SANs and WANs, respectively). U.S. Defense and Homeland Security efforts also add to the demand for bandwidth, as vast amounts of data are generated through sophisticated surveillance and defense network applications that are transferred via a myriad of terrestrial and satellite communication channels. The U.S. government and its contractors are incorporating optical and high frequency wireless and satellite communications technologies into their systems and infrastructure to address these challenges.
Optical and wireless networking technologies support higher speeds and added features, and offer greater interoperability to accommodate higher bandwidth requirements at lower cost. Leading network systems vendors are producing optical systems for carriers increasingly based on 40Gbps, 100Gbps and soon to be available 400Gbps speeds including multi-service switches, dense wave division multiplexing (DWDM) transport terminals, access multiplexers, routers, Ethernet switches and other networking systems. Moreover, these network system vendors now also offer wireless communication systems to address mobile access and backhaul demands with increased bandwidths capable of more than 1Gbps. Mirroring the convergence of telecom and datacom networks, these systems vendors are increasingly addressing both telecom and datacom applications and are also looking to integrate their network equipment offerings into a single product. Faced with the technological and cost challenges of building fully integrated systems that can handle data, voice and video, original equipment manufacturers (OEMs) are re-focusing on core competencies of software and systems integration, and relying on outside module and component suppliers for the design, development and supply of critical electro–optic and wireless products that perform the critical transmit and receive functions. In addition, the carriers are increasing their demand from the OEMs to also provide systems that enable the streaming of high speed information through their entire network which includes both optical and wireless equipment.
Industrial Product Line
Through our Industrial product line, we are a supplier of custom ASICs. Customers choose our custom ASICs for a number of reasons, including: to differentiate their products, to reduce cost or power consumption by using one custom IC, or to replace more costly and energy inefficient programmable devices such as field programmable gate arrays (FPGAs).
A custom ASIC makes sense where the merchant market of standard products does not make a standard product that adequately serves a customer’s particular purpose or application. Many large semiconductor companies offer custom services for high volume customers. However, there is a large market for the next tier of applications where a custom chip is needed but the volumes are smaller and not served by the traditional ASIC suppliers. Similarly, there is a market for the continuous supply of components to customers facing end-of-life situations for ASICs and FPGAs once supported by other vendors. This next tier is seeking a fast turn-around from design to production ready components, access to large libraries of pre-validated intellectual property (IP) portfolios, expertise with FPGA conversions and a wide array of ASIC solutions including structured ASICs, custom structured ASICs, and standard cells.
Challenges Faced by our Customers
High-Speed Communication Product Line
The performance requirements of communications applications and the technical challenges associated with the datacom and telecom markets present difficult obstacles to service providers and equipment designers that serve those markets. The core challenges of processing and transmitting high quality broadband streams include:
|
|
·
|
Performance: Network system manufacturers require faster, higher performance components and systems due to the increasing demands for more bandwidth by network operators. These devices need to interoperate seamlessly with the other components that perform transmit and receive functions while running in some cases at extreme temperatures in a wide variety of operating environments.
|
|
|
·
|
Power consumption: The increase in transmission speeds inherently leads to higher power consumption by the electronic components being used. This in turn leads to thermal management challenges due to greater densities being demanded by customers. For instance, in data centers, there is a significant investment required to cool the facility.
|
|
|
·
|
Size: Customers need to maximize the utilization of their central office space, tower space and rack size and therefore demand small solution footprints to maximize port density. The optical industry has responded by migrating from large line-cards to smaller 300 pin transponders and pluggable transceivers resulting in more than a 60x reduction in size for 10G communication components since 1999. This in turn puts severe size constraints on electronic, optical and radio frequency (RF) component suppliers to maintain the pace of size reduction roadmaps without compromising on performance. Similarly, the cellular backhaul segment has migrated from split mount systems to full outdoor units to minimize the equipment footprint at a cell site.
|
|
|
·
|
Cost: There are significant price pressures within the communication markets to reduce component and system costs. End users continually demand more bandwidth and features yet expect to pay similar prices for this increased data usage. To support this, the market is driven to increase the efficiency of network operators’ capital investments to be able to support exponentially increasing bandwidths with arithmetically increasing user revenues.
|
|
|
·
|
Complexity: Communication bandwidth increases are no longer being derived solely by driving the physical channel faster due to the inherent physical limitations of the media. Recent bandwidth gains in both the optical and wireless markets are being derived by utilizing complex signaling algorithms that encode more information per signal transition. This increasing technological complexity within communication systems and components, coupled with the increasing pace of innovation and required cost reductions, have led customers to concentrate their supply chain on a smaller number of module and component suppliers on whom they can rely to invest in new innovative products and provide them with more comprehensive product portfolios, deeper product expertise and the ability to support future roadmaps.
|
|
|
·
|
Manufacturing: The optical and millimeter wave wireless industries predominantly utilize discrete components to implement in their systems. Many of these components are manufactured by different vendors and these discrete solutions lead to manufacturing inefficiencies and yield reductions. Integration has been a key enabler in the historical success of the silicon IC technology to reduce complexity and cost, enable the improvement of system performance, reduce system size and cost by increasing the functionality that can be implemented on one device and thereby decreasing the component count required to implement a system.
|
|
|
·
|
Interoperability: In order to enable the ever increasing demands of power consumption reduction, size reduction and cost reduction, optical and wireless transceivers need to be designed with a higher level of device integration.
|
Industrial Product Line
The demands of lower volume custom ASIC customers present a unique set of requirements to the supplier of the ASIC and the associated design services. We believe the key requirements for a successful design and supply of lower volume custom ASICs include:
|
|
·
|
Experience: The demands of a custom ASIC design require a dedicated and experienced design team with the ability to execute on designs ranging from simple to complex, while assisting the customer with design assessment, product review and recommendations on the best solution.
|
|
|
·
|
Access to IP portfolios and design libraries: With requirements ranging from industrial, to military and avionics, to medical, to communications, customers require a design team to have access to large design libraries over several families as well as pre-validated IP portfolios with many IP cores while utilizing industry standard design tools.
|
|
|
·
|
Speed of Design: Given the time to market constraints of certain customers and the impending end-of-life of parts for other customers, speed is a critical demand for customers that require custom ASIC chips. These customers generally require a fast turnaround time with competitive non-recurring engineering (NRE) charges. The speed and price demands require an efficient design team with a strong record of first-pass silicon success.
|
Our Solutions
High-Speed Communication Product Line
We offer a comprehensive portfolio of 10Gbps, 40Gbps and 100Gbps electro-optical products and we are one of the first companies in the developing market for 400Gbps products. We provide bundled solutions that combined multiple products, such as modulators and drivers. We also offer a comprehensive portfolio of MMIC products to support E-band wireless communication and defense markets. We combine high performance analog and mixed signal design skills, with experience in integrated systems, interoperability, power management and size optimization. We believe customers choose to work with us for several reasons including:
Superior Performance: We believe that our performance advantage is derived from industry leading MMICs, drivers, receivers, modulators and superior packaging integration and module design capabilities. Our core III-V and silicon semiconductor, as well as TFPS technology expertise allows us to design products that often exceed the current performance, power, size, temperature and reliability requirements of our customers.
Broad Product Line: We have a comprehensive portfolio of products for telecom, datacom, consumer electronics, defense and industrial applications designed for optical speeds from 3Gbps to over 400Gbps and for wireless frequencies up to 86GHz. Our products support a wide range of data rates, protocols, transmission distances and industry standards. This wide product offering allows us to serve as a “one-stop shop” to our customers in offering a comprehensive product arsenal, as well as allowing us to reduce costs as we leverage existing design building-blocks into new applications. Our portfolio consists of the following product ranges:
|
|
·
|
Laser and modulator drivers for 10Gbps, 40Gbps, 100Gbps and 400Gbps applications;
|
|
|
·
|
Receiver amplifiers or Trans-impedance Amplifiers for 10Gbps, 40Gbps, 100Gbps and 400Gbps applications;
|
|
|
·
|
Vertical-cavity surface-emitting laser (VCSEL) driver & receiver chipsets for 14 and 12 channel parallel optics applications from 3Gbps to 28Gbps/channel;
|
|
|
·
|
Electro-optic modulators based on our proprietary TFPS technology suitable for 40Gbps and 100Gbps modulation schemes;
|
|
|
·
|
Wideband MMIC Amplifiers with flat gain response;
|
|
|
·
|
High Frequency MMIC Power Amplifiers with high gain and output power; and
|
|
|
·
|
High Frequency Passive Attenuators and Filters in small form factors with excellent performance
|
Power Consumption and Size Reduction: Our designs and enabling technologies utilize efficient circuit techniques and material technology to reduce energy usage without compromising performance. Our designs also typically have smaller footprints than competing designs enabling an overall smaller transponder design.
Cost Reduction: We are a material-agnostic design house and are skilled in designing and utilizing a number of packaging and semiconductor process technologies such as indium phosphide, gallium arsenide, silicon germanium and complementary metal-oxide semiconductor (CMOS) silicon. This portfolio of enabling technologies provides the flexibility to optimize the cost/performance of our products to the challenge at hand. For instance, our new portfolio of 10G, 40G and 100G TIAs were designed using silicon germanium and this enables lower overall production costs compared with competing TIA solutions using indium phosphide. This coupled with the ability to integrate more complex logic functions into the TIA designs offer compelling value to our customers. By providing a broad portfolio of products to our customers we are able to achieve production efficiencies and thus offer attractive pricing.
Integration: Our vision is to leverage our broad portfolio of products integrating optical modulators monolithically in close proximity and/or onto our semiconductor chips. The close coupling of optical and electronic components will realize the maximum performance at high speeds while ensuring the smallest size, potentially lower costs, and improved interoperability performance. We believe that our step-wise approach to this goal is aligned to deliver more integrated products and bundled solutions along the innovation path starting with bundling at the system level, progressing to the package level and ultimately on to the chip level.
Partnership: Through a deep understanding both of the system level challenges faced by our customers developing optical transponders and wireless transceivers and of the capabilities of our technology, we are able to suggest and implement new system partitioning concepts to ease manufacturing, increase yields and reduce power and cost. For example, through the addition of certain design recommendations, we have been able to guide our customers to simplify system manufacturing using what we believe are novel designs.
Technology Leadership and Innovation: Our products are built on a foundation of semiconductor and electro-optic polymer technologies supported by over 20 years of innovation and research and development experience that has resulted in more than 100 patents awarded and patent applications pending worldwide. Our technology innovation extends from the design of ultra-high speed semiconductor integrated circuits, monolithic microwave integrated circuit design, multi-chip modules, electro-optic thin-film polymer materials, and optical modulator design. These areas of competence include signal integrity, thermal modeling, power consumption, integration of multiple ICs into sub-system multi-chip module components, and molecular science of electro-optic polymers. Our many years of experience allow us to design high-performance solutions. For this reason we were selected as a partner to a Tier 1 equipment supplier to develop 100Gbps modulator drivers for the first commercially available 100Gbps system that was launched in 2010. Our high performance wideband amplifiers are utilized in a number of mission critical military applications. We conduct our research both independently and in cooperation with customers. We are committed to conduct fundamental research into the integration of electronic and electro-optic (EO) components using semiconductor and EO polymers as a source of differentiation.
Horizontal Business Model: We deploy a fabless semiconductor device horizontal business model as opposed to a vertical integration model since it is our mission to serve broad customer base in the optical and wireless communications and defense markets with the best in class components. We believe this will be driven by the system vendor end customers’ desire for continuous price reduction with increasing volumes and will be enabled by the growth of capable component suppliers such as GigOptix as well as the availability of high quality electronics contract manufacturers (ECMs). We cultivate a “Virtual Vertical” model, which is based on strong relationships with our customers, ECMs and other component vendors in the supply chain with aligned objectives. We enable flattening by simplifying the supply chain for faster and more efficient development and delivery of products to the marketplace which results in more attractive prices.
Industrial Product Line
We are a leading digital and mixed signal ASIC company with unique technology that allows our customers to reduce their costs, development cycles and risks associated with complex system-on-chip (SoC) and ASIC designs. We bring over 20 years of experience to the ASIC market, offering value added services designing ASICs and taking these designs to volume production by integrating digital and mixed signal IP and using world renowned third party foundries.
Experience: Our team of ASIC designers has a depth and breadth of experience that goes back over 20 years. We believe our experience and proprietary structured ASIC technology give us an advantage when working with customers looking for quick design turns with unique and difficult issues. We are able to assist the customer with design assessment, product review and recommendations on the best solution that fits their requirements.
Broad Product Line: We have access to a comprehensive library of pre-validated IP portfolios, expertise with FPGA conversions that allow us to offer a wide array of ASIC solutions including:
|
|
·
|
Structured ASIC;
|
|
|
·
|
Custom Structured ASIC;
|
|
|
·
|
Optical ASIC;
|
|
|
·
|
Mixed Signal ASIC; and
|
|
|
·
|
Standard Cell ASIC
|
Growth Strategy
Our objective is to be the leading provider of high performance electronic and electro-optic components for the optically and wirelessly connected digital world to enable the end to end high speed information streaming on the network, growing through both organic and strategic means. Elements of our strategy include the following:
Focus on High Growth Market Opportunities. We will continue to focus our product development resources on high growth market segments both within the markets we currently serve as well as in new markets that utilize our core technologies. We will continue to invest substantially in high performance products for 40Gbps, 100Gbps and emerging 400Gbps optical applications. We will also focus on emerging high speed wireless point-to-point E-band communications enabled by our millimeter 71GHz to 86GHz MMIC solutions. We believe that high growth opportunities exist even within more established communications segments by virtue of introducing innovative device and system architectures as well as business models to disrupt the established players and value chain relationships. Outside of telecom and datacom, we are able to leverage the same designs re-characterized for RF systems for use in defense applications such as phased array radar and super-computers and in certain emerging areas of the consumer electronics market.
Grow Our Customer Base. We intend to continue to broaden our strategic relationship with certain key customers (our “Lighthouse” customers) by maximizing design wins across their product lines. We intend to continue to leverage the approved vendor status we have with these key customers to qualify our products into additional optical and wireless systems, a process that is accelerated when we have already been qualified in a customer’s systems. We have added technical support staff to better serve key customers, markets and regions. We also intend to add to our number of strategic relationships by selectively targeting certain customers with whom we are not yet a strategic vendor. We will expand our development efforts with these customers through initiatives including providing specialized sales and support resources, holding technology forums to align our product development effort and implementing custom manufacturing linkages.
Engage Customers Early in their Product Planning Cycle. By engaging our customers early in their system design process, we gain critical information regarding their system requirements and objectives that influence our component design. Our sales force, product marketing teams and development engineers engage regularly with our customers to understand their product development plans. Additionally, for our Lighthouse customers, we hold periodic technology forums and audits so that the product development teams of these customers can interact directly with our research and development teams. Likewise, our early involvement in their system development processes also enables us to influence standards and introduce differentiated products early to market. Moreover, we believe that this interaction between ourselves and our customers provides us a competitive advantage, valuable insight and a close customer relationship that grows over each generation of products introduced by our customers.
Partner for Innovation. Over the past few years, we have successfully partnered with lead “Lighthouse” customers, contract manufacturers and government agencies on research and development in both our electronic components and electro-optics polymer materials. We see this as a core element of our strategy both to support the investment required to maintain our innovation as well as aligning our research and development with the future needs of industry and defense markets. In order to maintain our position at the forefront of next generation optical modules and components, we intend to continue our relationships with government agencies and defense companies. We have aligned with our partners on the long term objectives of research and development related to the integration of semiconductor and thin-film polymer modulators to address terra scale computing and communications for defense and commercial markets and we have defined multiyear projects to develop and bring these technologies to reality. Similarly we partner with leading commercial customers on the development of products required in the one to two year time horizon, often sharing the investment. We believe that this again gives us the assurance of alignment to the market needs when considering the sometimes significant investment in a new development.
Strategic Acquisitions. To augment our organic growth strategy, we actively pursue acquisitions that provide an efficient alternative to in-house development of technology, products or revenue. The synergies we search for include efficient extension of our product offering to strengthen our market position, enhance our technology base, increase our revenue base, and expand our customer base in selected markets to provide cross selling opportunities or to enhance our geographic or market segment presence. We continuously evaluate potential acquisitions against the above criteria. Our process aims to conduct a swift integration to quickly eliminate duplicate and redundant costs to provide accretive performance within one to two quarters.
Technology and Research and Development
We utilize proprietary technology at many levels within our product development, ranging from the basic materials research that created the innovative materials we use in our TFPS modulators to sophisticated design concepts, integration and optimization techniques we use to design our components. We are committed to conducting fundamental research in thin-film polymer materials and manufacturing technologies. In addition, we have a proven record of successfully productizing this research and bringing it to market in a swift and seamless manner. Our technology is protected by our patent portfolio and trade secrets developed in deployments with our extensive customer base. Our leading technologies include our fundamental and unique TFPS technology for optical modulation and extend through ultra-broadband MMIC design, MCM design, innovative ultra-low power laser driver and receiver IC design in silicon germanium, high speed analog and RF IC design, mixed signal IC design, and Structured and Hybrid ASIC infrastructure. In particular, the following technologies are central to our business:
High Speed Analog Semiconductor Design & Development. One of our core competences is circuit design for optimal signal integrity performance in high power applications. We use a variety of semiconductor processes to implement our designs including III-V processes such as indium phosphide and gallium arsenide for higher power applications such as long reach telecom transponders. We also have expertise in low power designs in silicon germanium and CMOS silicon for use in short reach datacom and optical interconnect applications and in circuit design to reduce electrical cross-talk in dense multi-channel designs.
Electro-Optic TFPS Material. Our unique, patent-protected technology is used to lithographically form a Mach-Zehnder modulator using standard silicon production technology processes and our proprietary thin-film polymeric materials. Optical modulators are commonly used as high performance switches to control optical signals to modulate a light stream with a digital data stream. Our technology can support bandwidths of up to 200GHz, while the current generation of material optimized for production is used in 40Gbps and 100Gbps optical modulators, which are competitive with leading 40Gbps and 100Gbps modulators in the market. The technology has several ground-breaking characteristics as follows: it provides the largest bandwidth and fastest switching of any available technology and is effectively limited by the bandwidth of the digital control circuit up to 200Gbps bit/second rate; it is suitable for lithographic implementation of an existing semiconductor production line such as CMOS which facilitates both lower cost manufacturing of on-chip modulators and arrays and close proximity to the digital circuits for optimal performance; it suits itself for integration in small form factor transponder boxes such as C form factor pluggable (CFP) and CFP2; and it has lower power consumption than other potential alternatives. All of these unique advantages make the material attractive for telecom, defense and super-computing applications.
Our research and development plans are driven by customer and partner input obtained by our sales and marketing teams, through our participation in various standards bodies, and by our long-term technology and product strategies. We review research and development priorities on a regular basis and advise key customers of our progress to achieve better alignment in our product and technology planning. For new components research and development is conducted in close collaboration with our contract manufacturing partners to shorten the time to market and optimize the manufacturability of the products.
Products
Our business is made up of two product lines, our High-Speed Communications products and our Industrial products. Through our product lines we offer a broad array of solutions over a number of industries. Through our High-Speed Communications product line we design and market products that amplify electrical signals during both the transmission (amplifiers and optical drivers) and reception (TIAs) of optical signals as well as modulate optical signals in the transmission of data. We have a comprehensive product portfolio for these markets, particularly at data rates that exceed 40Gbps. The primary target market and application for our products include optical interface modules such as line-cards, transponders and transceivers within telecom and datacom switches and routers, high speed wireless point-to-point millimeter wave systems and defense systems. Our products are critical blocks used in telecom and datacom optical communication networks ranging from long haul to short reach systems where the conversion of data from the electrical domain to the optical domain occurs. Our optical drivers amplify the input digital data stream that is used to directly modulate the laser or to drive an external modulator that acts as a precise shutter to switch on and off the light that creates the optical data stream. At the other end of the optical fiber, our sensitive receiver TIAs detect and amplify the small currents generated by photo-diodes converting the received light into an electrical current. The TIAs amplify the small current signals into a larger voltage signal that can be read by the electronics and processors in the network servers. We supply an optimized component for each type of laser, modulator and photo-diode depending upon the speed, reach and required cost. Generally, the shorter the reach is, the higher the volume, the less demanding the product specifications and the greater the pressure to reduce costs. We implement our products in a number of process technologies and have been at the forefront of extracting optimal performance from each technology to be able to address each market segment’s individual requirements in a cost effective manner. Our microwave and millimeter wave amplifiers amplify small signal radio signals into more powerful signals that can be transmitted over long distances to establish high throughput data connections or enable radar based applications. In some instances, we provide NRE design services for certain custom designs of our high-speed communication components. This NRE work is included in revenues, generally on a percentage of completion basis.
Through our Industrial product line we offer complex ASIC solutions and design work that are used in a number of applications such as defense and test and measurement applications to enable the high speed processing of complex signals.
Our product portfolio is designed to cover the broad range of solutions needed in these different areas and includes the product lines described below from five product groups that are included in our two product lines:
High-Speed Communication Product Line
GX Series - The GigOptix GX Series of products services both the telecom and datacom markets with a broad portfolio of drivers and transimpedence amplifiers that address 10Gbps, 40Gbps and 100Gbps speeds over distances that range from 100 meters to 10,000 kilometers. The GX Series devices are used in FiberChannel, Ethernet, SONET/SDH components and those based upon the OIF standards.
HX Series - The GigOptix HX Series of products service the high performance computing (HPC), datacom and consumer markets with a portfolio of parallel VCSEL drivers and TIAs that address 3Gbps, 5Gbps,10Gbps, 14Gbps, 16Gbps and 25Gbps channel speeds over 1-300 meter distances in 4 and 12 channel configurations. The HX Series devices are used in proprietary HPC formats, Infiniband, Ethernet and optical HDMI components.
LX Series - The GigOptix LX Series of products service the 40Gbps and 100Gbps telecom market for high performance Mach-Zehnder modulators. The LX Series devices are based on our proprietary TFPS EO material technology. The technology provides what we believe are significant advantages over competing technologies such as indium phosphide (InP) and lithium niobate (LiNbO3) in areas such as bandwidth, size and power consumption. We are now in the process of using our new TFPS technology to enable 100G DP-QPSK devices such as our LX8240 modulator chip, in integrated small form factor transceivers that we believe will be considered as a key building block in next generation telecom systems.
EX Series - The GigOptix EX Series of products leverages the high performance products acquired in the Endwave acquisition in addition to the die and design techniques developed for the GX Series telecom and datacom drivers for related defense and instrumentation applications, as well as, the transceiver chip technology that was licensed from IBM. We differentiate ourselves in the defense and instrumentation markets by providing high power, high frequency amplifiers for the E-Band market and high gain, broadband devices that exhibit minimal ripple across the frequency spectrum of the device to ensure optimum performance. Moreover, most of our devices have only a single rail supply which both simplifies the board design and improves reliability of the system. For instance, we provide the single rail supply iT2008 high power 26GHz amplifier with a saturated output power of 1W and 1dB of ripple. This device’s performance and ease of use power up sequence has led to extensive use in military radar and satellite communication systems.
Industrial Product Line
CX Series - The GigOptix CX Series of products offer a broad portfolio of distinct paths to digital and analog mixed signal ASICs with the capability of supporting designs of up to 10M gates and more in technologies ranging from 0.6µ through 65nm. The CX Series uses our proprietary technology in Structured and Custom Structured ASICs to enable a generic ASIC solution that can be customized for a customer using only a few metal mask layers. This ensures fast turnaround times with significant cost advantages for customers over both FPGA and dedicated ASIC implementations. The CX Series also offers value-added ASIC services including integrating proven digital and mixed signal IP into designs and taking customers designs from RTL or gate-level net list definitions to volume production with major third party foundries. The CX Series has a significant customer base in the industrial, military and avionics, medical and communication markets.
Customers
We have a global customer base in the telecom, datacom, defense and industrial electronics markets. Our customers include many of the leading network system vendors worldwide. During 2012, we sold to major customers including Alcatel-Lucent and other “Tier-One” equipment vendors in the United States, Europe and Asia, as well as leading industrial, aerospace and defense companies. The number of leading network systems vendors which supply the global telecom and datacom market is concentrated, and so, in turn, is our customer base. Our customers in the industrial and commercial markets consist of a broader range of companies that design and manufacture electro-optics and high speed information management products. These include medical, industrial, test and measurement, scientific systems, printing engines for high-speed laser printers and defense and aerospace applications.
In fiscal year 2012, two customers, Alcatel-Lucent and National Instruments Hungary KFT accounted for 22% and 12%, respectively, of our total revenues. In fiscal year 2011, Alcatel-Lucent accounted for 10% of our total revenues. During fiscal year 2012 and 2011, no other customer accounted for more than 10% of our total revenues.
Of our total revenues in 2012, 42%, 31% and 26% was generated by customers located in Europe, North America and Asia, respectively, compared with 27%, 43% and 29%, respectively, for the year ended December 31, 2011. For the years ended December 31, 2012 and 2011, 2% of our revenue was contributed by our government contracts and 98% was contributed by product revenue.
Manufacturing
During 2011, we received an ISO 9002 certification. Our foundry and contract manufacturing partners are located in China, Japan, the Philippines, Taiwan, Thailand and the United States. Certain of our contract manufacturing partners that assemble or produce modules are strategically located close to our customers’ contract manufacturing facilities to shorten lead times and enhance flexibility.
We follow established new product introduction (NPI) processes that help to ensure product reliability and manufacturability by controlling when new products move from the sampling stage to mass production. We have stringent quality control processes in place for both internal and contract manufacturing. We utilize manufacturing planning systems to coordinate procurement and manufacturing to our customers’ forecasts. These processes and systems help us closely coordinate with our customers, support their purchasing needs and product release plans, and streamline our supply chain.
Electronic components: Integrated circuits and multi-chip modules: For our ICs and MCMs, we use an outsourced contract manufacturing model. We have a clean-room equipped prototype manufacturing and testing facility in our San Jose location which is used to optimize manufacturing and test procedures to achieve internal yield and quality requirements before transferring volume production to our contract manufacturing partners. We develop long-term relationships with strategic contract manufacturing partners to reduce assembly costs and provide greater manufacturing flexibility. The manufacture of some products such as certain low volume, high complexity or customized multi-chip modules may remain in-house during the full production stage to speed time to market and bypass manufacturing transfer costs.
For our less complex packaged chips and bare die products, we typically move new product designs directly to contract manufacturing partners. These products fit easily in a standard fabless semiconductor production flow and ramp up to greater volumes in mass production.
TFPS EO components: Four chemical synthesis labs within our Bothell, Washington facility are capable of delivering EO polymer and claddings in batch volumes. Polymer manufacturing and development are supported by a characterization and test lab equipped with equipment for measuring molecular and material properties.
Wafer fabrication is supported within the 1,400 square foot class 100 clean-room equipped with standard semiconductor processing. Wafer dicing, cleaning, and facet polishing is supported in the “back end” processing lab outside of the clean-room. Our Bothell facility’s production capabilities are large enough to support volume production. Chip level screening and testing are also performed in Bothell. We also utilize Sanmina SCI located in Shenzhen, China to support volume packaging.
Sales, Marketing and Technical Support
High-Speed Communication Product Line
In the communications market, we primarily sell our products through our direct sales force supported by a network of manufacturer representatives and distributors. Our sales force works closely with our field application engineers, product marketing and sales operations teams in an integrated approach to address a customer’s current and future needs. We assign account managers for each strategic customer account to provide a clear interface for our customers, with some account managers responsible for multiple customers. The support provided by our field application engineers is critical in the product qualification stage. Optical transceiver modules and point-to-point (PtP) microwave and millimeter wireless backhaul transceivers are complex products that are subject to rigorous qualification procedures of both the product and the supplier and these procedures differ from customer to customer. Also, many customers have custom requirements in order to differentiate their products and meet design constraints. Our product marketing teams interface with our customers’ product development staff to address customization requests, collect market intelligence to define future product development, and represent us in pertinent standards bodies.
For our key “Lighthouse” customers, we hold periodic technology forums for their product development teams to interact directly with our research and development teams. These forums provide us insight into our customers’ longer term needs while helping our customers to adjust their plans to the product advances we can deliver. Also, our customers are increasingly utilizing contract manufacturers while retaining design and key component qualification activities. As this trend matures, we continually upgrade our sales operations and manufacturing support to maximize our efficiency, flexibility and coordination with our customers.
Industrial Product Line
In the industrial market, we sell directly to key strategic Lighthouse customers and also sell through a network of manufacturing representatives and distributors to address the broad range of applications and industries in which our products are used. The sales effort is managed by an internal sales team and supported by dedicated field application engineering and product marketing staff. Through our customer interactions, we believe that we continually increase our knowledge of each application’s requirements and utilize this information to improve our sales effectiveness and guide product development.
Since inception, we have actively communicated the GigOptix brand worldwide through participation at trade shows and industry conferences, publication of research papers, bylined articles in trade media, advertisements in trade publications and interactive media, interactions with industry press and analysts, press releases and our company website, as well as through print and electronic sales material.
Competition
The market for high speed semiconductor and electro-optic devices is characterized by price competition, rapid technological change, short product life cycles, and global competition. While no one company competes against us in all of our product areas, or offers the breadth of our product portfolio, our competitors range from large, international companies offering a wide range of products to smaller companies specializing in narrow markets. Due to the increasing demands for high-speed, high-frequency components, we expect competition to increase the entry of:
|
|
·
|
new competitors into our target markets from existing semiconductor and electro-optical modulator suppliers, and
|
|
|
·
|
the internal operations of some companies producing products similar to ours for their own requirements.
|
Because some of our competitors are large public companies with longer operating histories and greater financial, technical, marketing and other resources than we do, these companies have the ability to devote greater resources to the development, promotion, sale and support of their products. For example, in the telecom and datacom markets, some of our competitors have deep relationships with prospective customers, related to a wider portfolio of products they are selling beyond high speed communication devices. Other competitors may also have preferential access to certain network systems vendors, or offer competitive products that may have better performance measures than our products. Moreover, competitors that have large market capitalizations or cash reserves may be better positioned than we are to acquire other companies in order to gain new technologies or products that may compete with our product lines. Any of these factors could give our competitors a strategic advantage. Therefore, although we believe we currently compete favorably with our competitors, we cannot be certain that we will be able to compete successfully against either current or new competitors in the future.
We believe the principal competitive factors impacting all of our products are:
|
|
·
|
product performance including size, speed, functionality, operating temperature range, power consumption and reliability;
|
|
|
·
|
price to performance characteristics;
|
|
|
·
|
delivery performance and lead times;
|
|
|
·
|
time to market;
|
|
|
·
|
breadth of product solutions;
|
|
|
·
|
strong customer relationships;
|
|
|
·
|
sales, technical and post-sales service and support;
|
|
|
·
|
technical partnership in early stage of product development;
|
|
|
·
|
sales channels; and
|
|
|
·
|
ability to drive standards and comply with new industry MSAs.
|
High-Speed Communication Product Line
GX Products - In the telecom and datacom segments, we compete with TriQuint, Rohm, InPhi, Semtech, Vitesse and M/A-Com. We compete with TriQuint predominantly in the 10Gbps, 40Gbps and 100Gbps Mach Zehnder modulator driver space; Rohm predominantly in the 10Gbps EML driver space; InPhi predominately in the TIA spaces and the 40Gbps driver space; Semtech predominately in the datacom space; Vitesse in the 10Gbps TIA receiver space, and M/A-Com predominately in the telecom drivers and TIA space.
HX Products - In the market for physical medium dependent (PMD) ICs we compete with Avago, Emcore, Tyco Electronics (formerly Zarlink) and IPtronics. Avago, Emcore and Tyco Electronics are vertically integrated transceiver module manufacturers with in-house PMD ICs designs. In addition to these companies, IPtronics also competes in this space and is a venture-funded startup specializing in parallel optical interconnect with a family of devices at 10Gbps and is a direct competitor.
LX Products - We compete with JDSU, Oclaro, Sumitomo and Fujitsu that supply lithium niobate (LiNbO3) modulators for the long haul/Metro market and more recently JDSU, Sumitomo, Emcore and Oclaro that supply indium phosphide (InP) modulators for the Metro market. We expect that our TFPS modulators will be competitive with lithium niobate and indium phosphide products at the 40Gbps and 100Gbps applications in terms of pricing and operating performance and will provide significant performance advantages in areas such as size, bandwidth and power consumption in future small form factor integrated transceivers.
EX Products - Our MMICs compete in the microwave and millimeter wave radio markets, an industry that is intensely competitive. We compete with Hittite and Sumitomo that supply E-Band millimeter wave amplifiers, filters and attenuators. Our wideband amplifiers and limiters offer high performance with gain flatness and low noise figures. We compete with TriQuint, Hittite, RFMD, Northrop Grumman (for internal use) and M/A-Com in this product area.
Industrial Product Line
CX Products - Our ASICs compete in the custom integrated circuit industry, an industry that is intensely competitive. In the low to medium volume market, the primary competitors include FPGA manufacturers like Xilinx, Altera, Lattice Semiconductor and Actel Corporation. In the medium to high volume market, there are over 30 companies competing in this market. Companies that we compete with most often include On -Semiconductor, eSilicon, Open Silicon, Faraday, Toshiba and eASIC.
We believe that important competitive factors specific to the custom integrated circuit industry include: Product pricing, time-to-market, product performance, reliability and quality, power consumption, availability and functionality of predefined IP cores, inventory management, access to leading-edge process technology, track record of successful product execution and achieving first time working silicon, ability to provide excellent applications support and customer service, ability to offer a broad range of ASIC solutions to retain existing customers, and compliance with ITAR.
Patents and Other Intellectual Property Rights
We rely on patent, trademark, copyright and trade secret laws and internal controls and procedures to protect our technology. We believe that a robust technology portfolio that is assessed and refreshed periodically is an essential element of our business strategy. We believe that our success will depend in part on our ability to:
|
|
·
|
Obtain patent and other proprietary protection for the materials, processes and device designs that we develop;
|
|
|
·
|
Enforce and defend patents and other rights in technology, once obtained;
|
|
|
·
|
Operate without infringing the patents and proprietary rights of third parties; and
|
|
|
·
|
Preserve our company’s trade secrets.
|
As of December 31, 2012, we and our subsidiaries have been issued 113 patents and have 13 patent applications pending. Patents have been issued in various countries with the main concentrations in the United States. Our patent portfolio covers a broad range of intellectual property including semiconductor design and manufacturing, device packaging, module design and manufacturing, electrical circuit design, thin film polymer technology, modulator design and manufacturing. We follow well-established procedures for patenting intellectual property. The portfolio also represents a balanced compilation of intellectual property that has been filed by the various companies we have acquired, and hence protects all of our product lines. We also license patented technology from IBM, Northrop Grumman Corporation and the University of Washington. Many of the pending and issued U.S. patents have one or more corresponding international or foreign patents or applications. Our existing significant U.S. patents will expire between August 2021 and November 2028.
We take extensive measures to protect our intellectual property rights and information. For example, every employee enters into a confidential information, non-competition and invention assignment agreement with us when they join and are reminded of their responsibilities when they leave. We also enter into and enforce a confidential information and invention assignment agreement with contractors.
We have patents and patents pending covering technologies relating to:
Polymers
|
|
·
|
Optical polymers’ design and synthesis;
|
|
|
·
|
Production of polymers in commercial quantities;
|
|
|
·
|
Materials characterization and testing methods; and
|
|
|
·
|
Devices, designs and processes relating to polymers.
|
Integration for Small Form Factor Transponders
|
|
·
|
Monolithically integrated TFPS modulator chips with tunable lasers and drivers
|
High-Speed Integrated Circuits
|
|
·
|
Circuit topology to achieve ultra-large frequency bandwidth;
|
|
|
·
|
Efficient voltage control circuit for broadband high voltage drivers; and
|
|
|
·
|
Control circuit to stabilize over temperature gain control functionality.
|
RF Millimeter wave circuits
|
|
·
|
Waveguide transition;
|
|
|
·
|
Component interconnect; and
|
|
|
·
|
Impedance compensating circuits.
|
RF Communication systems
|
|
·
|
Impedance compensating circuits;
|
|
|
·
|
Sectorized communication system;
|
|
|
·
|
Sectorized multi-function communication system; and
|
|
|
·
|
Wireless point to multi-point communication.
|
ASICs
|
|
·
|
Wireless point to multi-point communication;
|
|
|
·
|
Customizable integrated circuit devices;
|
|
|
·
|
Single metal programmability in a customizable integrated circuit device;
|
|
|
·
|
Configurable cell for customizable logic array device;
|
|
|
·
|
In-Circuit device, system and method to parallelize design and verification; and
|
|
|
·
|
Method of developing application specific integrated circuit devices.
|
Although we believe our patent portfolio is a valuable asset, the discoveries or technologies covered by the patents, patent applications or licenses may not have commercial value. Issued patents may not provide commercially meaningful protection against competitors. Other parties may be able to design around our issued patents or independently develop technology having effects similar or identical to our patented technology. The scope of our patents and patent applications is subject to uncertainty and competitors or other parties may obtain similar patents of uncertain scope. Other parties may discover uses for polymers or technology different from the uses covered in our patents or patent applications and these other uses may be separately patentable. Other parties may have patents covering the composition of polymers for which we have patents or patent applications covering only methods of use of these polymers.
Third parties may infringe the patents that we own or license, or claim that our potential products or related technologies infringe their patents. Any patent infringement claims that might be brought by or against our company may cause us to incur significant expenses, divert the attention of our management and key personnel from other business concerns and, if successfully asserted against us, require us to pay substantial damages. In addition, a patent infringement suit against our company could force us to stop or delay developing, manufacturing or selling potential products that are claimed to infringe a patent covering a third party’s intellectual property.
We periodically evaluate our patent portfolio based on our assessment of the value of the patents and the cost of maintaining such patents, and may choose from time to time to let various patents lapse, terminate or be sold.
Employees
As of December 31, 2012, we had 84 full-time employees, including 37 engineers, electrical and chemical; 27 employees in manufacturing, operations, and quality, 10 employees in global sales and marketing and 10 employees in general and administrative. In addition, we have a number of contractors.
Environmental
Our operations involve the use, generation and disposal of hazardous substances and are regulated under international, federal, state and local laws governing health and safety and the environment. We believe that our products and operations at our facilities comply in all material respects with applicable environmental laws and worker health and safety laws; however, the risk of environmental liabilities cannot be completely eliminated.
Government Regulations
We are subject to federal, state and local laws and regulations relating to the generation, handling, treatment, storage and disposal of certain toxic or hazardous materials and waste products that we use or generate in our operations. We regularly assess our compliance with environmental laws and management of environmental matters, and we believe that our products and operations at our facilities comply in all material respects with applicable environmental laws.
We are also subject to federal procurement regulations associated with U.S. government contracts. Violations of these regulations can result in civil, criminal or administrative proceedings involving fines, compensatory and punitive damages, restitution and forfeitures as well as suspensions or prohibitions from entering into government contracts. The reporting and appropriateness of costs and expenses under government contracts are subject to extensive regulation and audit by the Defense Contract Audit Agency, an agency of the U.S. Department of Defense. The contracts and subcontracts to which we are a party are also subject to potential profit and cost limitations and standard provisions that allow the U.S. government to terminate such contracts at its convenience. We are entitled to reimbursement of our allowable costs and to an allowance for earned profit if the contracts are terminated by the U.S. government for convenience.
Sales of our products and services internationally may be subject to the policies and approval of the U.S. Department of State and Department of Defense. Any international sales may also be subject to United States and foreign government regulations and procurement policies, including regulations relating to import-export control such as ITAR, investments, exchange controls and repatriation of earnings.
Where You Can Find More Information
Our Annual Reports on Form 10-K, Quarterly Reports on Form 10-Q, Current Reports on Form 8-K and amendments to those reports filed or furnished pursuant to Section 13(a) or 15(d) of the Securities Exchange Act of 1934, as amended, are available free of charge as soon as possible after we electronically file them with, or furnish them to, the SEC. You can access our filings with the SEC by visiting our website. The information on our website is not, and shall not be deemed to be, a part of this Annual Report on Form 10-K or incorporated into any other filings we make with the SEC. Additionally, the Annual Reports on Form 10-K, Quarterly Reports on Form 10-Q, Current Reports on Form 8-K and amendments to those reports filed or furnished pursuant to Section 13(a) or 15(d) of the Securities Exchange Act of 1934, as amended by our predecessor registrant Lumera are available at www.sec.gov.
You can also read and copy any document that we file, including this Annual Report on Form 10-K, at the SEC’s Public Reference Room at 100 F Street, N.E., Washington, D.C. 20549. Call the SEC at 1-800-SEC-0330 for information on the operation of the Public Reference Room. In addition, the SEC maintains an Internet site at www.sec.gov that contains reports, proxy and information statements, and other information regarding issuers that file electronically with the SEC. You can electronically access our SEC filings there.
|
ITEM 1A.
|
RISK FACTORS
|
You should carefully consider the risks described below as well as the other information contained in this Form 10-K before making an investment decision. In addition to the risks described below, there may be additional risks and uncertainties not currently known to us or that we currently deem to be immaterial that may become material risks. Any of these risks could materially affect our businesses, financial condition or results of operations. In such case, you may lose all or part of your original investment.
We have incurred substantial operating losses in the past and we may not be able to achieve profitability in the future.
We have incurred negative losses since inception. For the years ended December 31, 2012 and 2011, we incurred net losses of $7.0 million and $14.1 million, respectively, and cash outflows from operations of $2.0 million and $4.9 million, respectively. As of December 31, 2012 and 2011, we had an accumulated deficit of $94.5 million and $87.5 million, respectively. If our revenue does not grow to offset these current expenses, we may not be profitable. In fact, in future quarters we may not have any revenue growth and our revenues could decline. Furthermore, if our operating expenses exceed expectations, financial performance will be adversely affected and we may continue to incur significant losses in the future.
We may require additional capital to continue to fund our operations. If we need but do not obtain additional capital, we may be required to substantially limit operations.
We may not generate sufficient cash from our operations to finance our anticipated operations for the foreseeable future from such operations. We could require additional financing sooner than expected if we have poor financial results, including unanticipated expenses, or an unanticipated drop in projected revenues. Such financing may be unavailable when needed or may not be available on acceptable terms. If we raise additional funds by issuing equity or convertible debt securities, the percentage ownership of our current stockholders will be reduced, and these securities may have rights superior to those of its common stock. If adequate funds are not available to satisfy either short-term or long-term capital requirements, or if planned revenues are not generated, we may be required to limit our operations substantially. These limitations of operations may include a possible sale or shutdown of portions of our business, reductions in capital expenditures and reductions in staff and discretionary costs.
We have incurred net losses since inception. As of December 31, 2012, we had an accumulated deficit of $94.5 million. We have incurred significant losses since inception, attributable to our efforts to design and commercialize our products. We have managed our liquidity during this time through a series of cost reduction initiatives and through increasing our line of credit with our bank. We had $10.1 million in cash and cash equivalents December 31, 2012. However, while we have additional cash available, our ability to continue as a going concern may be dependent on many events outside of our direct control, including, among other things, obtaining additional financing either privately or through public markets, should this be necessary, and customers purchasing our products in substantially higher volumes.
We could suffer unrecoverable losses on our customers’ accounts receivable, which would adversely affect our financial results.
Our operating cash flows are dependent on the continued collection of receivables. Our accounts receivable as of December 31, 2012 decreased by $569,000 or 10% compared to the balance at December 31, 2011. We could suffer additional accounting losses as well as a reduction in liquidity if a customer is unable or refuses to pay. A significant increase in uncollectible accounts would have an adverse impact on our business, liquidity and financial results.
Restrictive covenants under our credit facility with Silicon Valley Bank may adversely affect our operations.
Our loan and security agreement with Silicon Valley Bank contains a number of restrictive covenants that will impose significant operating and financial restrictions on our ability to, without prior written approval from Silicon Valley Bank:
|
|
·
|
Merge or consolidate, or permit any of our subsidiaries to merge or consolidate, with or into any other business organization, or acquire, or permit any of our subsidiaries to acquire, all or substantially all of the capital stock or property of another person or company;
|
|
|
·
|
Sell, lease, or otherwise transfer, or permit any of our subsidiaries to sell, lease or otherwise transfer, all or any part of our business or property, except in the ordinary course of business or in connection with certain indebtedness or investments permitted under the loan and security agreement;
|
|
|
·
|
Create, incur, or assume any indebtedness, other than certain indebtedness permitted under the loan and security agreement with Silicon Valley Bank;
|
|
|
·
|
Pay any dividends (except in the form of our equity securities) or make any distributions or payment on, or redeem, retire or repurchase any capital stock; and
|
|
|
·
|
Make any investment, other than certain investments permitted under the loan and security agreement.
|
While in January 2013, we paid off the remaining balance on this line of credit, if we make future borrowings, a failure to comply with the covenants contained in our loan and security agreement could result in an event of default under the agreement that, if not cured or waived, could result in the acceleration of the indebtedness and have a material adverse effect on our business, financial condition and results of operations.
We face intense competition and expect competition to increase in the future, which could have an adverse effect on our revenue, revenue growth rate, if any, and market share.
The global semiconductor market in general is highly competitive. We compete in different target markets to various degrees on the basis of a number of principal competitive factors, including our products’ performance, features and functionality, energy efficiency, size, ease of system design, customer support, products, reputation, reliability and price, as well as on the basis of our customer support, the quality of our product roadmap and our reputation. We expect competition to increase and intensify as more and larger semiconductor companies as well as the internal resources of large, integrated original equipment manufacturers, or OEMs, enter our markets. Increased competition could result in price pressure, reduced profitability and loss of market share, any of which could materially and adversely affect our business, revenue, revenue growth rates and operating results.
Our competitors range from large, international companies offering a wide range of semiconductor products to smaller companies specializing in narrow markets and internal engineering groups within device manufacturers, some of which may be our customers. Our primary competitors include TriQuint, Vitesse, Oki, Inphi, M/A-Com, Semtech and Gennum. We expect competition in the markets in which we participate to increase in the future as existing competitors improve or expand their product offerings. In addition, we believe that a number of other public and private companies are in the process of developing competing products for digital television and other broadband communication applications. Because our products often are “building block” semiconductors which provide functions that in some cases can be integrated into more complex integrated circuits, we also face competition from manufacturers of integrated circuits, some of which may be existing customers that develop their own integrated circuit products.
Our ability to compete successfully depends on elements both within and outside of our control, including industry and general economic trends. During past periods of downturns in our industry, competition in the markets in which we operate intensified as manufacturers of semiconductors reduced prices in order to combat production overcapacity and high inventory levels. Many of our competitors have substantially greater financial and other resources with which to withstand similar adverse economic or market conditions in the future. Moreover, the competitive landscape is changing as a result of consolidation within our industry as some of our competitors have merged with or been acquired by other competitors, and other competitors have begun to collaborate with each other. These developments may materially and adversely affect our current and future target markets and our ability to compete successfully in those markets.
We derive a significant portion of our revenue from a small number of customers and the loss of one or more of these key customers, the diminished demand for our products from a key customer, or the failure to obtain certifications from a key customer or its distribution channel could significantly reduce our revenue and profits.
A relatively small number of customers account for a significant portion of our revenue in any particular period. One or more of our key customers may discontinue operations as a result of consolidation, liquidation or otherwise, or reduce significantly its business with us due to the current economic conditions. Reductions, delays and cancellation of orders from our key customers or the loss of one or more key customers could significantly further reduce our revenue and profits. There is no assurance that our current customers will continue to place orders with us, that orders by existing customers will continue at current or historical levels or that we will be able to obtain orders from new customers.
In fiscal year 2012, two customers, Alcatel-Lucent and National Instruments Hungary KFT accounted for 22% and 12%, respectively, of our total revenues. In fiscal year 2011, Alcatel-Lucent accounted for 10% of our total revenues. During fiscal year 2012 and 2011, no other customer accounted for more than 10% of our total revenues.
Average selling prices of our products could decrease rapidly, which could have a material adverse effect on our revenue and gross margins.
We may experience substantial period-to-period fluctuations in future operating results due to the erosion of our average selling prices. From time to time, we have reduced the average unit price of our products in anticipation of competitive pricing pressures, new product introductions by us or our competitors and for other reasons. We expect that we will have to do so again in the future. If we are unable to offset any reductions in our average selling prices by increasing our sales volumes or introducing new products with higher operating margins, our revenue and gross margins will suffer. To maintain our gross margins, we must develop and introduce new products and product enhancements on a timely basis and continually reduce our and our customers’ costs. Failure to do so would cause our revenue and gross margins to decline.
If we fail to develop and introduce new or enhanced products on a timely basis, our ability to attract and retain customers could be impaired and our competitive position could be harmed.
We operate in a dynamic environment characterized by rapidly changing technologies and industry standards and technological obsolescence. To compete successfully, we must design, develop, market and sell new or enhanced products that provide increasingly higher levels of performance and reliability and meet the cost expectations of our customers. The introduction of new products by our competitors, the market acceptance of products based on new or alternative technologies, or the emergence of new industry standards could render our existing or future products obsolete. Our failure to anticipate or timely develop new or enhanced products or technologies in response to technological shifts could result in decreased revenue. In particular, we may experience difficulties with product design, manufacturing, marketing or certification that could delay or prevent our development, introduction or marketing of new or enhanced products. If we fail to introduce new or enhanced products that meet the needs of our customers or penetrate new markets in a timely fashion, we will lose market share and our operating results will be adversely affected.
Our business is subject to foreign currency risk.
Sales to customers located outside of the United States comprised 72% and 59% of GigOptix’s revenue for the years ended December 31, 2012 and 2011, respectively. In addition, we have a two subsidiaries overseas (Switzerland and Germany) that record their operating expenses in a foreign currency. Since sales of our products have been denominated to date primarily in U.S. dollars, increases in the value of the U.S. dollar could increase the price of our products so that they become relatively more expensive to customers in the local currency of a particular country, leading to a reduction in sales and profitability in that country. Future international activity may result in increased foreign currency denominated sales. Gains and losses on the conversion to U.S. dollars of accounts receivable, accounts payable and other monetary assets and liabilities arising from international operations may contribute to fluctuations in GigOptix’ results of operations. We currently do not have hedging or other programs in place to protect against adverse changes in the value of the U.S. dollar as compared to other currencies to minimize potential adverse effects.
We rely on a limited number of third parties to manufacture, assemble and test our products, and the failure to manage our relationships with our third-party contractors successfully could adversely affect our ability to market and sell our products.
In addition to our in-house manufacturing facilities, we operate an outsourced manufacturing business model that utilizes third-party foundry and assembly and test capabilities. As a result, we rely on third-party foundry wafer fabrication and assembly and test capacity, including sole sourcing, for many components or products. Currently, our semiconductor devices are manufactured by foundries operated by IBM, WIN, TriQuint, UMC, Globalfoundries, SEI, Tower, and NGST. We also use third-party contractors for our assembly and test operations, including HANA Microelectronics Co., Ltd., or HANA, Bourns, Spel, ASE, SCI Sanmina, and Fabrinet.
Relying on third party manufacturing, assembly and testing presents significant risks to us, including the following:
|
|
·
|
failure by us, or our customers or their end customers to qualify a selected supplier;
|
|
|
·
|
capacity shortages during periods of high demand;
|
|
|
·
|
reduced control over delivery schedules and quality;
|
|
|
·
|
shortages of materials and potential lack of adequate capacity during periods of excess demand;
|
|
|
·
|
misappropriation of our intellectual property;
|
|
|
·
|
limited warranties on wafers or products supplied to us;
|
|
|
·
|
potential increases in prices;
|
|
|
·
|
inadequate manufacturing yields and excessive costs;
|
|
|
·
|
difficulties selecting and integrating new subcontractors; and
|
|
|
·
|
potential instability in countries where third-party manufacturers are located.
|
The ability and willingness of our third-party contractors to perform is largely outside our control. If one or more of our contract manufacturers or other outsourcers fails to perform its obligations in a timely manner or at satisfactory quality levels, our ability to bring products to market and our reputation could suffer. For example, in the event that manufacturing capacity is reduced or eliminated at one or more facilities, we could have difficulties fulfilling our customer orders and our net revenue could decline. In addition, if these third parties fail to deliver quality products and components on time and at reasonable prices, we could have difficulties fulfilling our customer orders, our net revenue could decline and our business, financial condition and results of operations would be adversely affected.
The loss of our relationship with any third-party semiconductor foundry without adequate notice would adversely impact our ability to fill customer orders and could damage our customer relationships.
The loss of our relationship with or access to any of the semiconductor foundries we currently use for the fabrication of custom designed components and any resulting delay or reduction in the supply to us of semiconductor devices, would severely impact our ability to fulfill customer orders and could damage our relationships with our customers. For example, we may not be successful in forming alternative supply arrangements that provide us with a sufficient supply of gallium arsenide devices. Gallium arsenide devices are used in many of the products we manufacture. Because there are a limited number of semiconductor foundries that use the gallium arsenide process technologies we select for our products and that have sufficient capacity to meet our needs, using alternative or additional semiconductor foundries would require an extensive qualification process that could prevent or delay product shipments and revenues. We estimate that it may take up to six months to shift production of a given semiconductor circuit design to a new foundry.
We do not have any long-term supply contracts with our contract manufacturers or suppliers, and any disruption in our supply of products or materials could have a material adverse effect on our business, revenue and operating results.
We currently do not have long-term supply contracts with any of our third-party vendors. We make substantially all of our purchases on a purchase order basis, and our contract manufacturers are not required to supply us products for any specific period or in any specific quantity. We expect that it would take approximately nine to twelve months to transition performance of our foundry or assembly services to new providers. Such a transition would likely require a qualification process by our customers or their end customers. We generally place orders for products with some of our suppliers approximately four to five months prior to the anticipated delivery date, with order volumes based on our forecasts of demand from our customers. Accordingly, if we inaccurately forecast demand for our products, we may be unable to obtain adequate and cost-effective foundry or assembly capacity from our third-party contractors to meet our customers’ delivery requirements, or we may accumulate excess inventories. Our third-party contractors have not provided any assurance to us that adequate capacity will be available to us within the time required to meet additional demand for our products.
Because of the shortages of some materials and components and our dependence on single source suppliers and custom components for our products for the optical communications, wireless and ASIC markets, we may be unable to obtain an adequate supply of materials and components of sufficient quality in a timely fashion, or may be required to pay higher prices or to purchase components of lesser quality.
Many of our products for the optical communications, wireless and ASIC markets are customized and must be qualified with our customers. This means that we cannot change suppliers, materials and components used in our products easily without the risks and delays associated with requalification. Accordingly, while a number of the components we use in our products are made by multiple suppliers, we may effectively have single source suppliers for many of these materials components. Further, we have recently experienced extended lead times for some components.
In addition, we currently purchase a number of materials and components, some from single source suppliers, including, but not limited to:
|
|
·
|
semiconductor wafers;
|
|
|
·
|
semiconductor devices;
|
|
|
·
|
application-specific monolithic microwave integrated circuits;
|
|
|
·
|
voltage regulators;
|
|
|
·
|
passive components;
|
|
|
·
|
unusual or low usage components;
|
|
|
·
|
surface mount components compliant with the EU’s Restriction of Hazardous Substances, or RoHS, Directive;
|
|
|
·
|
packages, housings and custom metal parts;
|
|
|
·
|
high-frequency circuit boards
|
|
|
·
|
custom connectors; and
|
|
|
·
|
chemicals and compounds
|
Any delay or interruption in the supply of these or other components could impair our ability to manufacture and deliver these products, harm our reputation and cause a reduction in our revenues. In addition, any increase in the cost of the components that we use in these products could make these products less competitive and lower our margins. In the past, our predecessor, Endwave, suffered from shortages of and quality issues with various components. These shortages and quality issues adversely impacted Endwave’s product revenues and could reappear in the future for us. Our single source suppliers could enter into exclusive agreements with or be acquired by one of our competitors, increase their prices, refuse to sell their products to us, discontinue products or go out of business. Even to the extent alternative suppliers are available to us and their components are qualified with our customers on a timely basis, identifying them and entering into arrangements with them may be difficult and time consuming, and they may not meet our quality standards. We may not be able to obtain sufficient quantities of required components on the same or substantially the same terms.
Our business, financial condition and operating results would be harmed if we do not achieve anticipated revenues.
In response to anticipated long lead times to obtain inventory and materials from outside contract manufacturers, suppliers and foundries, we may need to order materials in advance of anticipated customer demand. This advance ordering may result in excess inventory levels or unanticipated inventory write-downs if expected orders fail to materialize, or other factors render our products less marketable. If we are forced to hold excess inventory or incur unanticipated inventory write-downs, our financial condition and operating results could be materially harmed.
Our expense levels are relatively fixed and are based on our expectations of future revenue. We have a limited ability to reduce expenses quickly in response to any revenue shortfalls. Changes to production volumes and impact of overhead absorption may result in a decline in our financial condition or liquidity.
Our strategy of growth through acquisition could harm our business.
It is our intent to continue to grow through strategic acquisitions. Successful integration of newly acquired target companies may place a significant burden on our management and internal resources. The diversion of management’s attention and any difficulties encountered in the transition and integration processes could harm our business, financial condition and operating results. In addition, we may be unable to execute our acquisition strategy, resulting in under-utilized resources and a failure to achieve anticipated growth. Our operating results and financial condition will be adversely affected if we are unable to achieve or achieve on a timely basis cost revenue opportunities from any future acquisitions, or incur unforeseen costs and expenses or experience unexpected operating difficulties from the integration of acquired businesses.
Our customers require our products and our third-party contractors to undergo a lengthy and expensive qualification process which does not assure product sales.
Prior to purchasing our products, our customers require that both our products and our third-party contractors undergo extensive qualification processes, which involve testing of the products in the customer’s system and rigorous reliability testing. This qualification process may continue for six months or more. However, qualification of a product by a customer does not assure any sales of the product to that customer. Even after successful qualification and sales of a product to a customer, a subsequent revision to the product, changes in our customer’s manufacturing process or our selection of a new supplier may require a new qualification process, which may result in delays and in us holding excess or obsolete inventory. After our products are qualified, it can take an additional six months or more before the customer commences volume production of components or devices that incorporate our products. Despite these uncertainties, we devote substantial resources, including design, engineering, sales, marketing and management efforts, to qualifying our products with customers in anticipation of sales. If we are unsuccessful or delayed in qualifying any of our products with a customer, sales of this product to the customer may be precluded or delayed, which may impede our growth and cause our business to suffer.
We are subject to order and shipment uncertainties, and differences between our estimates of customer demand and product mix and our actual results could negatively affect our inventory levels, sales and operating results.
Our revenue is generated on the basis of purchase orders with our customers rather than long-term purchase commitments. In addition, our customers can cancel purchase orders or defer the shipments of our products under certain circumstances. Our products are manufactured using a silicon foundry according to our estimates of customer demand, which requires us to make separate demand forecast assumptions for every customer, each of which may introduce significant variability into our aggregate estimate. We have limited visibility into future customer demand and the product mix that our customers will require, which could adversely affect our revenue forecasts and operating margins. Moreover, because our target markets are relatively new, many of our customers have difficulty accurately forecasting their product requirements and estimating the timing of their new product introductions, which ultimately affects their demand for our products. In addition, the rapid pace of innovation in our industry could render significant portions of our inventory obsolete. Excess or obsolete inventory levels could result in unexpected expenses or increases in our reserves that could adversely affect our business, operating results and financial condition. Conversely, if we were to underestimate customer demand or if sufficient manufacturing capacity were unavailable, we could forego revenue opportunities, potentially lose market share and damage our customer relationships. In addition, any significant future cancellations or deferrals of product orders or the return of previously sold products due to manufacturing defects could materially and adversely impact our profit margins, increase our write-offs due to product obsolescence and restrict our ability to fund our operations.
Winning business is subject to lengthy competitive selection processes that require us to incur significant expenditures. Even if we begin a product design, a customer may decide to cancel or change its product plans, which could cause us to generate no revenue from a product and adversely affect our results of operations.
The selection process for obtaining new business typically is lengthy and can require us to incur significant design and development expenditures and dedicate scarce engineering resources in pursuit of a single customer opportunity. We may not win the competitive selection process and may never generate any revenue despite incurring significant design and development expenditures. These risks are exacerbated by the fact that some of our customers’ products likely will have short life cycles. Failure to obtain business in a new product design could prevent us from offering an entire generation of a product, even though this has not occurred to date. This could cause us to lose revenue and require us to write off obsolete inventory, and could weaken our position in future competitive selection processes.
After securing new business, we may experience delays in generating revenue from our products as a result of the lengthy development cycle typically required. Our customers generally take a considerable amount of time to evaluate our products. The typical time from early engagement by our sales force to actual product introduction could run from 12 to 24 months. The delays inherent in these lengthy sales cycles increase the risk that a customer will decide to cancel, curtail, reduce or delay its product plans, causing us to lose anticipated sales. In addition, any delay or cancellation of a customer’s plans could materially and adversely affect our financial results, as we may have incurred significant expense and generated no revenue. Finally, our customers’ failure to successfully market and sell their products could reduce demand for our products and materially and adversely affect our business, financial condition and results of operations. If we were unable to generate revenue after incurring substantial expenses to develop any of our products, our business would suffer.
Many of our products will have long sales cycles, which may cause us to expend resources without an acceptable financial return and which makes it difficult to plan our expenses and forecast our revenue.
Many of our products will have long sales cycles that involve numerous steps, including initial customer contacts, specification writing, engineering design, prototype fabrication, pilot testing, regulatory approvals (if needed), sales and marketing and commercial manufacture. During this time, we may expend substantial financial resources and management time and effort without any assurance that product sales will result. The anticipated long sales cycle for some of our products makes it difficult to predict the quarter in which sales may occur. Delays in sales may cause us to expend resources without an acceptable financial return and make it difficult to plan expenses and forecast revenues.
We are subject to the cyclical nature of the semiconductor industry.
The semiconductor industry is highly cyclical and is characterized by constant and rapid technological change, rapid product obsolescence and price erosion, evolving standards, short product life cycles and wide fluctuations in product supply and demand. The industry experienced a significant downturn during the recent global recession. These downturns have been characterized by diminished product demand, production overcapacity, and high inventory levels and accelerated erosion of average selling prices. The recent downturn and any future downturns could have a material adverse effect on our business and operating results. Furthermore, any upturn in the semiconductor industry could result in increased competition for access to third-party foundry and assembly capacity. We are dependent on the availability of this capacity to manufacture and assemble our products, and our third-party manufacturers have not provided assurances that adequate capacity will be available to us in the future.
A large proportion of our products are directed at the telecom and networking markets, which continue to be subject to overcapacity and seasonality.
The technology equipment industry is cyclical and has experienced significant and extended downturns in the past, often in connection with, or in anticipation of, maturing product cycles, and capital spending cycles and declines in general economic conditions. The cyclical nature of these markets has led to significant imbalances in demand, inventory levels and production capacity. It has also accelerated the decrease of average selling prices per unit. We may experience periodic fluctuations in our financial results because of these or other industry-wide conditions. Developments that adversely affect the telecom or networking markets, including delays in traffic growth and changes in U.S. government regulation, could halt our efforts to generate revenue or cause revenue growth to be slower than anticipated from sales of electro-optic modulators, semiconductors and related products. Reduced spending and technology investment by telecom companies may make it more difficult for our products to gain market acceptance. Our potential customers may be less willing to purchase new technology such as our technology or invest in new technology development when they have reduced capital expenditure budgets.
The spending cuts imposed by the Budget Control Act of 2011 (“BCA”) could impact our operating results and profit.
The U.S. government continues to focus on developing and implementing spending, tax, and other initiatives to stimulate the economy, create jobs, and reduce the deficit. One of these initiatives, the BCA, imposed greater constraints around government spending. In an attempt to balance decisions regarding defense, homeland security, and other federal spending priorities, the BCA immediately imposed spending caps that contain approximately $487 billion in reductions to the Department of Defense base budgets over the next ten years (2012 to 2021). Additionally, the BCA triggered an automatic sequestration process, effective March 1, 2013, unless modified by the enactment of new law. The sequestration process imposes additional cuts of approximately $50 billion per year to the currently proposed Department of Defense budgets for each fiscal year beginning with 2013 and continuing through 2021.
Although we cannot predict where these cuts will be made or how long they may last, we believe our portfolio of product offerings are well positioned and will not be materially impacted by the Department of Defense budget cuts. However, the possibility remains that any Department of Defense budget cuts could have an impact on sales of our products which can be used downstream in military applications, and thus, the revenues which we derive from such sales.
Our future success depends in large part on the continued service of our key senior management, design engineering, sales, marketing, and technical personnel and our ability to identify, hire and retain additional, qualified personnel.
Our future success depends to a significant extent upon the continued service of our senior management personnel, including our Chief Executive Officer, Dr. Avi Katz and our Chief Technical Officer, Andrea Betti-Berutto. We do not maintain key person life insurance on any of our executive officers. The loss of key senior executives could have a material adverse effect on our business. There is intense competition for qualified personnel in the semiconductor and polymer industries, and we may not be able to continue to attract and retain engineers or other qualified personnel necessary for the development of our business, or to replace engineers or other qualified personnel who may leave our employment in the future. There may be significant costs associated with recruiting, hiring and retaining personnel. Periods of contraction in our business may inhibit our ability to attract and retain our personnel. Loss of the services of, or failure to recruit, key design engineers or other technical and management personnel could be significantly detrimental to our product development or other aspects of our business.
We are subject to the risks frequently experienced by small public companies.
The likelihood of our success must be considered in light of the risks frequently encountered by small public companies, especially those formed to develop and market new technologies. These risks include our potential inability to:
|
|
·
|
establish product sales and marketing capabilities;
|
|
|
·
|
establish and maintain markets for our potential products;
|
|
|
·
|
identify, attract, retain and motivate qualified personnel;
|
|
|
·
|
continue to develop and upgrade our technologies to keep pace with changes in technology and the growth of markets using semiconductors and polymer materials;
|
|
|
·
|
develop expanded product production facilities and outside contractor relationships;
|
|
|
·
|
maintain our reputation and build trust with customers;
|
|
|
·
|
improve existing and implement new transaction processing, operational and financial systems;
|
|
|
·
|
scale up from small pilot or prototype quantities to large quantities of product on a consistent basis;
|
|
|
·
|
contract for or develop the internal skills needed to master large volume production of our products; and
|
|
|
·
|
fund the capital expenditures required to develop volume production due to the limits of available financial resources.
|
Our future growth will suffer if we do not achieve sufficient market acceptance of our products.
Our success depends, in part, upon our ability to maintain and gain market acceptance of our products. To be accepted, these products must meet the quality, technical performance and price requirements of our customers and potential customers. The optical communications industry is currently fragmented with many competitors developing different technologies. Some of these technologies may not gain market acceptance. Our products, including products based on polymer materials, may not be accepted by OEMs and systems integrators of optical communications networks and consumer electronics. In addition, even if we achieve some degree of market acceptance for our potential products in one industry, we may not achieve market acceptance in other industries for which we are developing products, which market acceptance is critical to meeting our financial targets.
Many of our current products, particularly those based on polymer technology, are either in the final stages of development or are being tested by potential customers. We cannot be assured that our development efforts or customer tests will be successful or that they will result in actual material sales, or that such products will be commercially viable.
Achieving market acceptance for our products will require marketing efforts and the expenditure of financial and other resources to create product awareness and demand by customers. It will also require the ability to provide excellent customer service. We may be unable to offer products that compete effectively due to our limited resources and operating history. Also, certain large corporations may be predisposed against doing business with a company of our limited size and operating history. Failure to achieve broad acceptance of our products by customers and to compete effectively would harm our operating results.
Successful commercialization of current and future products will require us to maintain a high level of technical expertise.
Technology in our target markets is undergoing rapid change. To succeed in these target markets, we will have to establish and maintain a leadership position in the technology supporting those markets. Accordingly, our success will depend on our ability to:
|
|
·
|
accurately predict the needs of target customers and develop, in a timely manner, the technology required to support those needs;
|
|
|
·
|
provide products that are not only technologically sophisticated but are also available at a price acceptable to customers and competitive with comparable products;
|
|
|
·
|
establish and effectively defend our intellectual property; and
|
|
|
·
|
enter into relationships with other companies that have developed complementary technology into which our products may be integrated.
|
We cannot be certain that we will be able to achieve any of these objectives.
The failure to compete successfully could harm our business.
We face competitive pressures from a variety of companies in our target markets. The telecom, datacom and consumer opto-electronics markets are highly competitive and we expect that domestic and international competition will increase in these markets, due in part to deregulation, rapid technological advances, price erosion, changing customer preferences and evolving industry standards. Increased competition could result in significant price competition, reduced revenues or lower profit margins. Many of our competitors and potential competitors have or may have substantially greater research and product development capabilities, financial, scientific, marketing, and manufacturing and human resources, name recognition and experience than we do. As a result, these competitors may:
|
|
·
|
succeed in developing products that are equal to or superior to our products or that will achieve greater market acceptance than our products;
|
|
|
·
|
devote greater resources to developing, marketing or selling their products;
|
|
|
·
|
respond more quickly to new or emerging technologies or scientific advances and changes in customer requirements, which could render our technologies or potential products obsolete;
|
|
|
·
|
introduce products that make the continued development of our potential products uneconomical;
|
|
|
·
|
obtain patents that block or otherwise inhibit our ability to develop and commercialize potential products;
|
|
|
·
|
withstand price competition more successfully than us;
|
|
|
·
|
establish cooperative relationships among themselves or with third parties that enhance their ability to address the needs of prospective customers better than us; and
|
|
|
·
|
take advantage of acquisitions or other opportunities more readily than us.
|
Competitors may offer enhancements to existing products, or offer new products based on new technologies, industry standards or customer requirements that are available to customers on a much more timely basis than comparable products from our company or that have the potential to replace or provide lower cost alternatives to our products. The introduction of enhancements or new products by competitors could render our existing and future products obsolete or unmarketable. Each of these factors could have a material adverse effect on our company’s business, financial condition and results of operations.
We may be unable to obtain effective intellectual property protection for our trade secrets, potential products and technology.
Any intellectual property that we have or may acquire, license or develop in the future may not provide meaningful competitive advantages. Our patents and patent applications, including those we license, may be challenged by competitors, and the rights granted under such patents or patent applications may not provide meaningful proprietary protection. For example, there are patents held by third parties that relate to polymer materials and electro-optic devices. These patents could be used as a basis to challenge the validity or limit the scope of our patents or patent applications. A successful challenge to the validity or limitation of the scope of our patents or patent applications could limit our ability to commercialize the technology and, consequently, reduce revenues.
Moreover, competitors may infringe our patents or those that we license, or successfully avoid these patents through design innovation. To combat infringement or unauthorized use, we may need to resort to litigation, which can be expensive and time-consuming and may not succeed in protecting our proprietary rights. In addition, in an infringement proceeding, a court may decide that our patents or other intellectual property rights are not valid or are unenforceable, or may refuse to stop the other party from using the intellectual property at issue on the grounds that it is non-infringing. Policing unauthorized use of our intellectual property is difficult and expensive, and we may not be able to, or have the resources to, prevent misappropriation of our proprietary rights, particularly in countries where the laws may not protect these rights as fully as the laws of the United States.
We also rely on the law of trade secrets to protect unpatented technology and know-how. We try to protect this technology and know-how by limiting access to those employees, contractors and strategic partners with a need to know this information and by entering into confidentiality agreements with these parties. Any of these parties could breach the agreements and disclose our trade secrets or confidential information to competitors, or such competitors might learn of the information in other ways. Disclosure of any trade secret not protected by a patent could materially harm our business.
We may be subject to patent infringement claims, which could result in substantial costs and liability and prevent us from commercializing potential products.
Third parties may claim that our potential products or related technologies infringe their patents. Any patent infringement claims brought against us may cause us to incur significant expenses, divert the attention of management and key personnel from other business concerns and, if successfully asserted, require us to pay substantial damages. In addition, as a result of a patent infringement suit, we may be forced to stop or delay developing, manufacturing or selling potential products that are claimed to infringe a patent covering a third party’s intellectual property unless that party grants us rights to use its intellectual property. We may be unable to obtain these rights on acceptable terms, if at all. Even if we are able to obtain rights to a third party’s patented intellectual property, these rights may be non-exclusive, and therefore competitors may obtain access to the same intellectual property. Ultimately, we may be unable to commercialize our potential products or may have to cease some business operations as a result of patent infringement claims, which could severely harm our business.
If our potential products infringe the intellectual property rights of others, we may be required to indemnify customers for any damages they suffer. Third parties may assert infringement claims against our current or potential customers. These claims may require us to initiate or defend protracted and costly litigation on behalf of customers, regardless of the merits of these claims. If any of these claims succeed, we may be forced to pay damages on behalf of these customers or may be required to obtain licenses for the products they use. If we cannot obtain all necessary licenses on commercially reasonable terms, we may be unable to continue selling such products.
The technology that we license from various third parties may be subject to government rights and retained rights of the originating research institution.
We license technology from various companies or research institutions, such as the University of Washington. Many of these partners and licensors have obligations to government agencies or universities. Under their agreements, a government agency or university may obtain certain rights over the technology that we have developed and licensed, including the right to require that a compulsory license be granted to one or more third parties selected by the government agency.
In addition, our partners often retain certain rights under their licensing agreements, including the right to use the technology for noncommercial academic and research use, to publish general scientific findings from research related to the technology, and to make customary scientific and scholarly disclosures of information relating to the technology. It is difficult to monitor whether such partners limit their use of the technology to these uses, and we could incur substantial expenses to enforce our rights to this licensed technology in the event of misuse.
If we fail to develop and maintain the quality of our manufacturing processes, our operating results would be harmed.
The manufacture of our products is a multi-stage process that requires the use of high-quality materials and advanced manufacturing technologies. With respect to our polymer-based products, polymer-related device development and manufacturing must occur in a highly controlled, clean room environment to minimize particles and other yield- and quality-limiting contaminants. In spite of stringent quality controls, weaknesses in process control or minute impurities in materials may cause a substantial percentage of a product in a lot to be defective. If we are unable to develop and continue to improve on our manufacturing processes or to maintain stringent quality controls, or if contamination problems arise, our operating results would be harmed.
The complexity of our products may lead to errors, defects and bugs, which could result in the necessity to redesign products and could negatively impact our reputation with customers.
Products as complex as ours may contain errors, defects and bugs when first introduced or as new versions are released. Delivery of products with production defects, reliability, quality or compatibility problems could significantly delay or hinder market acceptance of our products or result in a costly recall and could damage our reputation and adversely affect our ability to retain existing customers and to attract new customers. In particular, certain products are customized or designed for integration into specific network systems. If our products experience defects, we may need to undertake a redesign of the product, a process that may result in significant additional expenses.
We may also be required to make significant expenditures of capital and resources to resolve such problems. There is no assurance that problems will not be found in new products after commencement of commercial production, despite testing by us, our suppliers and our customers.
Our products may contain component, manufacturing or design defects or may not meet our customers’ performance criteria, which could cause us to incur significant repair expenses, harm our customer relationships and industry reputation, and reduce our revenues and profitability.
Endwave experienced manufacturing quality problems with its products prior to our acquisition of Endwave. As a result of these problems, Endwave replaced components in some products, or replaced the product, in accordance with its product warranties. We may have similar problems in the future. Our product warranties typically last twelve to thirty months. As a result of component, manufacturing or design defects, we may be required to repair or replace a substantial number of products under our product warranties, incurring significant expenses as a result. Further, our customers may discover latent defects in our products that were not apparent when the warranty period expired. These latent defects may cause us to incur significant repair or replacement expenses beyond the normal warranty period. In addition, any component, manufacturing or design defect could cause us to lose customers or revenues or damage our customer relationships and industry reputation.
We could be exposed to significant product liability claims that could be time-consuming and costly and impair our ability to obtain and maintain insurance coverage.
We may be subject to product liability claims if any of our products are alleged to be defective or harmful. Product liability claims or other claims related to our potential products, regardless of their outcome, could require us to spend significant time and money in litigation, divert management’s time and attention from other business concerns, require us to pay significant damages, harm our reputation or hinder acceptance of our products. Any successful product liability claim may prevent us from obtaining adequate product liability insurance in the future on commercially reasonable terms. Any inability to obtain sufficient insurance coverage at an acceptable cost or otherwise to protect against potential product liability claims could impair our ability to commercialize our products. In addition, certain of our products are sold under warranties. The failure of our products to meet the standards set forth in such warranties could result in significant expenses to us.
If we fail to effectively manage our growth, and effectively transition from our focus on research and development activities to commercially successful products, our business could suffer.
Failure to manage growth of operations could harm our business. To date, a large number of our activities and resources have been directed at the research and development of our technologies and development of potential related products. The transition from a focus on research and development to being a vendor of products requires effective planning and management. Additionally, growth arising from the expected synergies from future acquisitions will require effective planning and management. Future expansion will be expensive and will likely strain management and other resources.
In order to effectively manage growth, we must:
|
|
·
|
continue to develop an effective planning and management process to implement our business strategy;
|
|
|
·
|
hire, train and integrate new personnel in all areas of our business; and
|
|
|
·
|
expand our facilities and increase capital investments.
|
There is no assurance that we will be able to accomplish these tasks effectively or otherwise effectively manage our growth.
The industry and markets in which we compete are subject to consolidation, which may result in stronger competitors, fewer customers and reduced demand.
There has been industry consolidation among communications IC companies, network equipment companies and telecom companies in the past. This consolidation is expected to continue as companies attempt to strengthen or hold their positions in evolving markets. Consolidation may result in stronger competitors, fewer customers and reduced demand, which in turn could have a material adverse effect on our business, operating results, and financial condition.
Our operating results are subject to fluctuations because we have international sales.
International sales account for a large portion of our revenue and may account for an increasing portion of future revenue. The revenue derived from international sales may be subject to certain risks, including:
|
|
·
|
foreign currency exchange fluctuations;
|
|
|
·
|
changes in regulatory requirements;
|
|
|
·
|
tariffs and other barriers;
|
|
|
·
|
timing and availability of export licenses;
|
|
|
·
|
political and economic instability;
|
|
|
·
|
difficulties in accounts receivable collections;
|
|
|
·
|
difficulties in staffing and managing foreign operations;
|
|
|
·
|
difficulties in managing distributors;
|
|
|
·
|
difficulties in obtaining governmental approvals for communications and other products;
|
|
|
·
|
reduced or uncertain protection for intellectual property rights in some countries;
|
|
|
·
|
longer payment cycles to collect accounts receivable in some countries;
|
|
|
·
|
the burden of complying with a wide variety of complex foreign laws and treaties; and
|
|
|
·
|
potentially adverse tax consequences.
|
We are subject to regulatory compliance related to our operations.
We are subject to various U.S. governmental regulations related to occupational safety and health, labor and business practices. Failure to comply with current or future regulations could result in the imposition of substantial fines, suspension of production, alterations of our production processes, cessation of operations, or other actions, which could harm our business.
New regulations related to “conflict minerals” may force us to incur additional expenses, may result in damage to our business reputation and may adversely impact our ability to conduct our business.
In August 2012, under the Dodd-Frank Wall Street Reform and Consumer Protection Act of 2010, the SEC adopted new requirements for companies that use certain minerals and derivative metals (referred to as “conflict minerals,” regardless of their actual country of origin) in their products. Some of these metals are commonly used in electronic equipment and devices, including our products. These new requirements will require companies to investigate, disclose and report whether or not such metals originated from the Democratic Republic of Congo or adjoining countries. We have a complex supply chain for the components and parts used in each of our products. We have numerous foreign suppliers, many of whom are not obligated by the new law to investigate their own supply chains. As a result, we may incur significant costs to comply with the diligence and disclosure requirements, including costs related to determining the source of any of the relevant metals used in our products. In addition, because our supply chain is complex, we may not be able to sufficiently verify the origin of all the relevant metals used in our products through the due diligence procedures we implement, which may harm our business reputation. We may have customers who will need to know our conflict mineral status to satisfy their own SEC reporting obligations (if any), and as a result we may also face difficulties in satisfying customers if they require that we prove or certify that our products are “conflict free.” Key components and parts that can be shown to be “conflict free” may not be available to us in sufficient quantity, or at all, or may only be available at significantly higher cost to us. If we are not able to meet customer requirements, customers may choose to disqualify us as a supplier. Any of these outcomes could adversely impact our business, financial condition or operating results.
Although the SEC has provided temporary relief for products deemed to be “DRC Conflict Undeterminable” if we are unable to determine whether the minerals in our products originated from a covered country or were used to finance or benefit armed groups in the covered countries for a temporary two year period, or in the case of smaller reporting companies such as GigOptix for a period of four years, we will still be required to file a Conflict Minerals Report and include certain disclosures similar to those required for “Not DRC Conflict Free” products, but we will not be required to obtain an audit of that report. We will nonetheless be required to disclose the steps we have taken or intend to take to mitigate the risk that the conflict minerals in our products are benefitting armed groups in the covered countries. This additional reporting and compliance burden may increase our expenses and costs related to our supply chain and disclosure requirements.
We may incur a liability arising from our use of hazardous materials.
Our business and facilities are subject to a number of federal, state and local laws and regulations relating to the generation, handling, treatment, storage and disposal of certain toxic or hazardous materials and waste products that are used or generated in our operations. Many of these environmental laws and regulations subject current or previous owners or occupiers of land to liability for the costs of investigation, removal or remediation of hazardous materials. In addition, these laws and regulations typically impose liability regardless of whether the owner or occupier knew of, or were responsible for, the presence of any hazardous materials and regardless of whether the actions that led to their presence were taken in compliance with the law. Our domestic facilities use various chemicals in manufacturing processes that may be toxic and covered by various environmental controls. These hazardous materials may be stored on site. The waste created by use of these materials is transported off-site by an unaffiliated waste hauler. Many environmental laws and regulations require generators of waste to take remedial actions at an off-site disposal location even if the disposal was conducted lawfully. The requirements of these laws and regulations are complex, change frequently and could become more stringent in the future. Failure to comply with current or future environmental laws and regulations could result in the imposition of substantial fines, suspension of production, alteration of production processes, cessation of operations or other actions, which could severely harm our business.
Government regulation of the communications industry could limit the growth of the markets that we serve or could require costly alterations of our current or future products.
The markets that we serve are highly regulated. Communications service providers must obtain regulatory approvals to operate broadband wireless access networks within specified licensed bands of the frequency spectrum. Further, the Federal Communications Commission and foreign regulatory agencies have adopted regulations that impose stringent RF emissions standards on the communications industry that could limit the growth of the markets that we serve or could require costly alterations of our current or future products.
We may be unable to export some of our potential products or technology to other countries, convey information about our technology to citizens of other countries or sell certain products commercially, if the products or technology are subject to U.S. export or other regulations.
We are developing certain products that we believe the U.S. government and other governments may be interested in using for military and information gathering or antiterrorism activities. U.S. government export regulations may restrict us from selling or exporting these potential products into other countries, exporting our technology to those countries, conveying information about our technology to citizens of other countries or selling these potential products to commercial customers. We may be unable to obtain export licenses for products or technology if necessary. We currently cannot assess whether national security concerns would affect our potential products and, if so, what procedures and policies we would have to adopt to comply with applicable existing or future regulations.
We are subject to risks associated with the imposition of legislation and regulations relating to the import or export of high technology products. We cannot predict whether quotas, duties, taxes or other charges or restrictions upon the importation or exportation of our products will be implemented by the United States or other countries.
Various laws and regulations potentially affect the import and export of our products, including export control, tax and customs laws. Furthermore, some customer purchase orders and agreements are governed by foreign laws, which may differ significantly from laws in the United States. As a result, our ability to enforce our rights under such agreements may be limited compared with our ability to enforce our rights under agreements governed by laws in the United States.
There may be a limited public market for our common shares, and the ability of our stockholders to dispose of their common shares may be limited.
Our common shares are traded on the New York Stock Exchange. We cannot foresee the degree of liquidity that will be associated with our common shares. A holder of our common shares may not be able to liquidate his, her or its investment in a short time period or at the market prices that currently exist at the time the holder decides to sell. The market price for our common stock may fluctuate in the future, and such volatility may bear no relation to our performance.
Substantial future sales of our common stock in the public market could cause our stock price to fall.
The sale of our outstanding common stock or shares issuable upon exercise of options or warrants, or the perception that such sales could occur, could cause the market price of our common stock to decline. As of March 8, 2013, we had approximately 22,329,758 shares of common stock outstanding, options to purchase 10,033,291 shares of our common stock and warrants to purchase approximately 1,810,595 shares of our common stock outstanding. These shares of common stock, including shares of common stock issued upon exercise of options and warrants, have either been registered under the Securities Act, and as such are freely tradable without further restriction, or are otherwise freely tradable without restriction (subject to the requirements of Rule 144 under the Securities Act), unless the shares are purchased by “affiliates” as that term is defined in Rule 144 under the Securities Act. Any shares purchased by an affiliate may not be resold except pursuant to an effective registration statement or an applicable exemption from registration, including an exemption under Rule 144 of the Securities Act. We may issue additional shares of our common stock in the future in private placements, public offerings or to finance mergers or acquisitions.
The exercise of options and warrants and other issuances of shares of common stock or securities convertible into common stock will dilute your interest.
As of March 8, 2013, there were outstanding options to purchase an aggregate of 10,033,291 shares of our common stock at a weighted-average exercise price of $2.42 per share, of which options to purchase 5,257,627 shares at a weighted-average exercise price of $2.32 per share were exercisable as of such date. As of March 8, 2013, there were warrants outstanding to purchase 1,810,595 shares of our common stock, at a weighted average exercise price of $3.75 per share. The exercise of options and warrants at prices below the market price of our common stock could adversely affect the price of shares of our common stock. Additional dilution may result from the issuance of shares of our capital stock in connection with acquisitions or in connection with other financing efforts.
Any issuance of our common stock that is not made solely to then-existing stockholders proportionate to their interests, such as in the case of a stock dividend or stock split, will result in dilution to each stockholder by reducing his, her or its percentage ownership of the total outstanding shares. Moreover, if we issue options or warrants to purchase our common stock in the future and those options or warrants are exercised, or if we issue restricted stock, stockholders may experience further dilution.
In addition, certain warrants to purchase shares of our common stock currently contain an exercise price above the current market price for the common stock (these warrants are known as “above-market” warrants). As a result, these warrants may not be exercised prior to their expiration and we may not realize any proceeds from their exercise.
Our stockholder rights plan may deter or adversely affect an attempt to acquire us or otherwise prevent a change in control
On December 16, 2011 (the “Adoption Date”), we adopted a rights agreement that may have the effect of deterring, delaying, or preventing a change in control. Under the rights plan, we issued a dividend of one preferred share purchase right for each share of our common stock held by stockholders of record as of January 6, 2012, and we will issue one preferred stock purchase right to each share of common stock issued by us between January 6, 2012 and the earlier of either the rights’ exercisability or the expiration of the rights agreement. Each right entitles stockholders to purchase one one-thousandth of our Series A Junior Preferred Stock.
In general, the exercisability of the rights to purchase preferred stock will be triggered if any person or group, including persons knowingly acting in concert to affect our control, is or becomes a beneficial owner of 10% or more of the outstanding shares of our common stock after the Adoption Date. Stockholders or beneficial ownership groups who owned 10% or more of the outstanding shares of our common stock on or before the Adoption Date will not trigger the preferred share purchase rights unless they acquire an additional 1% or more of the outstanding shares of our common stock. Each right entitles a holder with the right upon exercise to purchase one one-thousandth of a share of preferred stock at an exercise price that is currently set at $8.50 per right, subject to purchase price adjustments as set forth in the rights agreement. Each share of preferred stock has voting rights equal to one thousand shares of common stock. In the event that exercisability of the rights is triggered, each right held by an acquiring person or group would become void. As a result, upon triggering of exercisability of the rights, there would be significant dilution in the ownership interest of the acquiring person or group, making it difficult or unattractive for the acquiring person or group to pursue an acquisition of us. These rights expire in December of 2014, unless earlier redeemed or exchanged by us.
Our quarter-to-quarter performance may vary substantially, and this variance, as well as general market conditions, may cause our stock price to fluctuate greatly and potentially expose us to litigation.
The revenues for our product lines and our quarterly operating results may vary significantly based on many factors, including:
|
|
·
|
additions of new customers;
|
|
|
·
|
fluctuating demand for our products and technologies;
|
|
|
·
|
announcements or implementation by competitors of technological innovations or new products;
|
|
|
·
|
the status of particular development programs and the timing of performance under specific development agreements;
|
|
|
·
|
timing and amounts relating to the expansion of operations;
|
|
|
·
|
costs related to possible future acquisitions of technologies or businesses;
|
|
|
·
|
communications, information technology and semiconductor industry conditions;
|
|
|
·
|
fluctuations in the timing and amount of customer requests for product shipments;
|
|
|
·
|
the reduction, rescheduling or cancellation of orders by customers, including as a result of slowing demand for our products or our customers’ products;
|
|
|
·
|
changes in the mix of products that our customers buy;
|
|
|
·
|
competitive pressures on selling prices;
|
|
|
·
|
the ability of our customers to obtain components from their other suppliers;
|
|
|
·
|
fluctuations in manufacturing output, yields or other problems or delays in the fabrication, assembly, testing or delivery of our products or our customers’ products; and
|
|
|
·
|
increases in the costs of products or discontinuance of products by suppliers.
|
We base our current and future expense estimates, in large part, on estimates of future revenue, which is difficult to predict. We expect to continue to make significant operating and capital expenditures in the area of research and development and to invest in and expand production, sales, marketing and administrative systems and processes. We may be unable to, or may elect not to, adjust spending quickly enough to offset any unexpected revenue shortfall. If our increased expenses are not accompanied by increased revenue in the same quarter, our quarterly operating results would be harmed.
In future quarters, our results of operations may fall below the expectations of investors and the trading price of our common stock may decline as a consequence. We believe that quarter-to-quarter comparisons of our operating results will not be a good indication of future performance and should not be relied upon to predict the future performance of our stock price. In the past, companies that have experienced volatility in the market price of their stock have often been subject to securities class action litigation. We may be the target of this type of litigation in the future. Securities litigation could result in substantial costs and divert our attention from other business concerns, which could seriously harm our business.
Provisions in our amended and restated certificate of incorporation and amended and restated bylaws may prevent takeover attempts that could be beneficial to our stockholders.
Provisions of our certificate of incorporation and bylaws could discourage a takeover of our company even if a change of control would be beneficial to the interests of our stockholders. These charter provisions include the following:
|
|
·
|
a requirement that our board of directors be divided into three classes, with approximately one-third of the directors to be elected each year; and
|
|
|
·
|
supermajority voting requirements (two-thirds of outstanding shares) applicable to the approval of any merger or other change of control transaction that is not approved by our continuing directors. The continuing directors are all of the directors as of the effective time of a merger or who are elected to the board upon the recommendation of a majority of the continuing directors.
|
We have never paid dividends on our capital stock, and we do not anticipate paying cash dividends for the foreseeable future.
We have never declared or paid cash dividends on our capital stock. We do not anticipate paying any cash dividends on our common stock for the foreseeable future. We currently intend to retain all available funds and future earnings, if any, to fund the development and growth of our business. As a result, capital appreciation, if any, of our common stock will be our stockholders’ sole source of potential gain for the foreseeable future.
|
ITEM 2.
|
PROPERTIES
|
Our principal properties as of December 31, 2012 are set forth below:
|
Location
|
Square
Feet
|
Principal Use
|
Ownership
|
Lease Expiration
|
|
Palo Alto, California
|
13,457
|
Subleasing
|
Lease
|
December 31, 2013
|
|
Zurich, Switzerland
|
2,724
|
Research and Development, Operations
|
Lease
|
12-month notice on either March 31 or Sept 30
|
|
Bothell, Washington
|
11,666
|
Research and Development, Operations
|
Lease
|
March 31, 2014
|
|
San Jose, California
|
32,805
|
Administration, Sales, Marketing, Research and Development, Operations
|
Lease
|
February 28, 2017
|
On October 6, 2011, GigOptix’ Palo Alto landlord agreed to an early lease termination for one of the two Palo Alto facilities leases. Costs that we agreed to pay to terminate the lease prior to its expiration have been included in restructuring expense in the statement of operations for the year ended December 31, 2011. The liability associated with the lease that has not been terminated is included in other current liabilities in the consolidated balance sheet at December 31, 2012. See additional discussion in Note 9 – Restructuring to our consolidated financial statements included in Part II, Item 8 below.
We believe our existing facilities are adequate to meet our current needs and we can renew our existing leases or obtain alternate space on terms that would not have a material impact on our financial results.
|
ITEM 3.
|
LEGAL PROCEEDINGS
|
From time to time, we may become involved in legal proceedings, claims and litigation arising in the ordinary course of business. When we believe a loss is probable and can be reasonably estimated, we accrue the estimated loss in our consolidated financial statements. Where the outcome of these matters is not determinable, we do not make a provision in our financial statements until the loss, if any, is probable and can be reasonably estimated or the outcome becomes known.
Advantech Advanced Microwave Technologies Inc. (“Advantech”)
On October 31, 2008, Endwave filed a complaint with the Canadian Superior Court in Montreal, Quebec alleging that Advantech, the parent company of Allgon Microwave Corporation AB, or Allgon, had breached its contractual obligations with Endwave and owes Endwave $994,500 for amounts outstanding under a note receivable and for purchased inventory and authorized finished goods purchase orders. By virtue of the acquisition of Endwave, we have assumed this litigation. The case was tried before a Judge in February 2013, and the court has ruled against Endwave. We have not decided whether to appeal the Judge's ruling.
Optomai, Inc. and M/A-COM Technology Solutions, Inc.
On April 25, 2011, we initiated a lawsuit in the Superior Court of Santa Clara County, California, against five former employees of GigOptix, including our former Vice President of Sales and two design engineers, who left in 2009 and 2010 to launch a competing company, Optomai, Inc., which was formed in October 2009 while four of the five were still employed by GigOptix. At GigOptix, the former employees were responsible for the development and promotion of products for 40G and 100G fiber optic networks, among other products. Only a few months after four of the five employees had left our company, in April 2010, their new company, Optomai, Inc., began marketing such products which were developed using GigOptix files which were copied. On the day in April 2011 that GigOptix filed the lawsuit, M/A-COM Technology Solutions, Inc. (MACOM) announced that it had acquired Optomai and we subsequently added M/A-COM to the suit as a defendant. In January 2013, we dismissed from the lawsuit without prejudice two of the employees, and we have maintained the claims against the former Vice President of Sales and two design engineers, as well as the two corporate defendants. In the lawsuit, GigOptix’ seeks damages and injunctive relief for misappropriation of confidential information and trade secrets and breach of the contractual and legal obligations to GigOptix of the former employees including while still employed by GigOptix. GigOptix has been engaged in discovery, which includes forensic work and damages discovery. GigOptix is continuing to move the case towards a trial on its claims against the defendants, which the court has scheduled for a two-week jury trial starting August 26, 2013.
National Instruments Corporation (“National Instruments”)
On October 4, 2011, National Instruments filed a complaint against ChipX and GigOptix in the District Court of Travis County, state of Texas, pertaining to two sales contracts to which National Instruments was a purchaser of products sold by ChipX. GigOptix is not a party to either contract. Prior to the filing of the complaint, the parties had been in discussions regarding the pricing of the products sold under these contracts, the number of products to be sold, and the length of time during which the products would be sold. National Instruments’ complaint sought a declaration that it was not in material breach of one of the contracts, as ChipX had asserted, that ChipX could not modify the prices in the contracts, that National Instruments could purchase products sold under one of the contracts directly from a supplier, and that GigOptix was not entitled to any damages from National Instruments as it is not a party to the contracts. The complaint also sought unspecified damages for alleged breach of contract by ChipX. ChipX and GigOptix never responded to the complaint, or filed a cross-complaint against National Instruments. The parties have now settled the matter. Pursuant to the terms of the settlement, National Instruments has paid ChipX $500,000 to license rights from ChipX which will enable National Instruments to manufacture the products sold under one of the contracts, National Instruments will make one last purchase in the amount of $3,500,000 of such products from ChipX which was fulfilled during 2012, and National Instruments shall have the right to purchase products sold under the other contract directly from the supplier in exchange for a royalty which the supplier will pay to ChipX.
|
ITEM 4.
|
MINE SAFETY PROCEDURES
|
Not Applicable
PART II
|
ITEM 5.
|
MARKET FOR REGISTRANT’S COMMON EQUITY, RELATED STOCKHOLDER MATTERS AND ISSUER PURCHASES OF EQUITY SECURITIES
|
Our common stock is traded on the NYSE MKT under the symbol “GIG” starting from April 25, 2012. Prior to that time, our common stock traded on the OTC Bulletin Board under the symbol “GGOX” beginning on December 10, 2008. There was no public market for its common stock prior to December 10, 2008. The following table sets forth the low and high sale price of our common stock, based on the last daily sale, in each of our last eight fiscal quarters as quoted on the NYSE and OTC.
|
Price per Share of Common Stock
|
||||||||
|
High
|
Low
|
|||||||
|
Fiscal 2012 quarter ended:
|
||||||||
|
4/1/2012
|
$ | 2.85 | $ | 1.58 | ||||
|
7/1/2012
|
$ | 3.05 | $ | 2.16 | ||||
|
9/30/2012
|
$ | 2.65 | $ | 1.87 | ||||
|
12/31/2012
|
$ | 2.10 | $ | 1.56 | ||||
|
Fiscal 2011 quarter ended:
|
||||||||
|
4/3/2011
|
$ | 3.75 | $ | 2.49 | ||||
|
7/3/2011
|
$ | 2.75 | $ | 2.00 | ||||
|
10/2/2011
|
$ | 2.40 | $ | 1.65 | ||||
|
12/31/2011
|
$ | 1.90 | $ | 1.33 | ||||
Also, on March 8, 2013, the most recent practicable date prior to the filing of this Annual Report on Form 10-K, we had approximately 62 stockholders of record and the last reported sale price of our common stock on the NYSE MKT was $1.12 per share.
We have never declared or paid cash dividends on our common stock. We currently anticipate that we will retain any future earnings to fund our operations and do not anticipate paying dividends on the common stock in the foreseeable future.
On March 23, 2012, the Company announced the commencement of a modified Dutch auction tender offer to purchase up to $2.0 million in value of the Company’s common stock, $0.001 par value per share, at a price not greater than $3.10 nor less than $2.85 per share.
On May 22, 2012, the Company completed its modified Dutch auction tender offer and repurchased 701,754 shares of its common stock, at a price of $2.85 per share and at a total cost of $2.2 million, which included $209,000 for investment banking, registration and other transaction costs. The repurchased shares are included as treasury shares in the consolidated balance sheet as of December 31, 2012.
Equity Compensation Plan Information
The following table reflects information for our equity compensation plans as of December 31, 2012.
Equity Compensation Plan Information
| (a) | (b) | (c) | ||||||||||
|
Plan Category
|
Number of securities
to be issued upon
exercise of
outstanding options,
warrants and RSU
|
Weighted-average
exercise price of
outstanding options,
warrants and RSU
|
Number of securities
remaining available for
future issuance under
equity compensation plan
(excluding securities
reflected in column (a))
|
|||||||||
|
Equity compensation plans approved by security holders*
|
12,030,229 | $ | 2.56 | 3,085,195 | ||||||||
|
Equity compensation plans not approved by security holders
|
79,800 | $ | 6.08 | - | ||||||||
| 12,110,029 | $ | 2.58 | 3,085,195 | |||||||||
|
*
|
The terms of our 2008 Equity Incentive Plan provide for an annual increase in the number of shares of our common stock authorized under the plan, effective as of the first day of each subsequent fiscal year, pursuant to the terms and conditions underlined in the plan. On January 1, 2012, the number of additional shares available for issuance under our 2008 Equity Incentive Plan was automatically increased by 1,077,287 shares. On January 1, 2013, the number of additional shares available for issuance under our 2008 Equity Incentive Plan was automatically increased by 1,110,288 shares.
|
Performance Measurement Comparison
The graph below shows the cumulative total stockholder return of an investment of $100 (and the reinvestment of any dividends thereafter) on December 11, 2008 in (i) our common stock, (ii) the NASDAQ Stock Market Index (U.S. Companies) and (ii) the NASDAQ Telecommunications Index. Our stock price performance shown in the graph below is not indicative of future stock price performance.
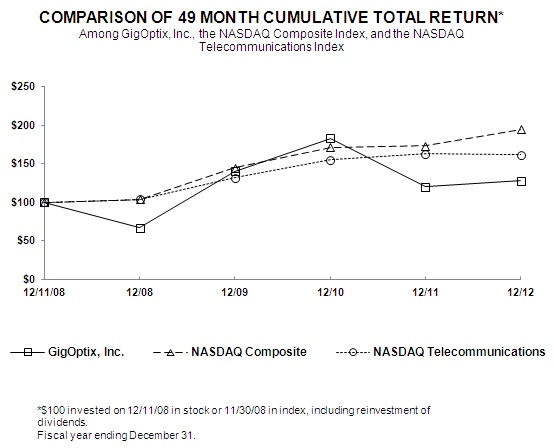
|
12/11/08
|
12/31/2008
|
12/31/09
|
12/31/10
|
12/31/11
|
12/31/12
|
|
|
GigOptix, Inc.
|
100.00
|
66.67
|
140.00
|
183.33
|
120.00
|
128.00
|
|
NASDAQ Composite
|
100.00
|
103.93
|
144.79
|
171.32
|
173.62
|
195.02
|
|
NASDAQ Telecommunications
|
100.00
|
103.86
|
131.62
|
155.22
|
162.87
|
161.65
|
|
ITEM 6.
|
SELECTED CONSOLIDATED FINANCIAL DATA
|
Not applicable.
|
ITEM 7.
|
MANAGEMENT’S DISCUSSION AND ANALYSIS OF FINANCIAL CONDITION AND RESULTS OF OPERATIONS
|
You should read the following discussion and analysis in conjunction with our consolidated financial statements and the related notes included elsewhere in this Annual Report on Form 10-K. This discussion and analysis contains forward-looking statements that involve risks, uncertainties, and assumptions. Our actual results may differ materially from those anticipated in these forward-looking statements as a result of certain factors, including, but not limited to, those set forth under “Risk Factors” in Item 1A of this Annual Report on Form 10-K and our consolidated financial statements and related notes appearing elsewhere in this Annual Report on Form 10-K,including Note 1—Organization and Basis of Presentation, to such consolidated financial statements and elsewhere as set forth in this Annual Report on Form 10-K. We assume no obligation to update the forward-looking statements or such risk factors. Please see “Special Note Regarding Forward- Looking Statements” above.
Overview
We are a leading fabless supplier of semiconductor components that enable high speed information streaming over network infrastructures. Our business is made up of two product lines, our High-Speed Communications products and our Industrial products.
Through our High-Speed Communications product line we offer a broad portfolio of high performance optical and wireless components to telecommunication (telecom) and data communication (datacom) customers, including i) mixed signal radio frequency integrated circuits (RFIC), including 40G and 100G laser and optical modulator drivers and trans-impedance amplifiers (TIA) for telecom, datacom, and consumer electronic fiber-optic applications; ii) power amplifiers and transceivers for microwave and millimeter monolithic microwave integrated circuit (MMIC) wireless applications including 73 Ghz and 83 GHz power amplifiers and transceiver chips; iii) thin film polymer on silicon (TFPS) optical modulators for 40G and 100G fiber-optic telecom; and iv) integrated systems in a package (SIP) solutions for both fiber-optic and wireless applications.
Through our Industrial product line, we offer a wide range of digital and mixed-signal application specific integrated circuit (ASIC) solutions for industrial, military, avionics, medical and communications markets.
We focus on the specification, design, development and sale of analog semiconductor integrated circuits (ICs), multi-chip module (MCM) solutions, polymer modulators, and digital and mixed signal application specific integrated circuits (ASICs), as well as wireless communications MMICs and modules. We believe we are an industry leader in the fast growing market for electronic solutions that enable high-bandwidth optical connections found in telecom, datacom and storage systems, and, increasingly, in consumer electronics and computing systems.
Since inception, we have expanded our customer base with the acquisition and integration of five businesses with complementary products and customers. In so doing, we have expanded our product line from a few leading 10 gigabit per second (Gbps) ultra-long haul electronic modulator drivers at our inception in July 2007 to a line of over 150 products today that include: drivers, receivers and modulators for 10 to 400Gbps optical applications; power amplifiers, filters and attenuators spanning up to 86GHz wireless applications; and custom ASICs spanning 0.6um to 65nm technology nodes. Our direct sales force is based in 3 countries and is supported by a significant number of channel representatives and distributors that are selling our products throughout North America, Europe, Japan and Asia.
The following sets forth our recent corporate and product milestones:
|
|
·
|
In June 2011, GigOptix, Inc. acquired Endwave Corporation.
|
|
|
·
|
On April 25, 2012, GigOptix, Inc. began trading on the NYSE MKT exchange under the symbol “GIG”.
|
We have incurred negative cash flows from operations since inception. For the years ended December 31, 2012 and 2011, we incurred net losses of $7.0 million and $14.1 million respectively, and cash outflows from operations of $2.0 million and $4.9 million respectively. As of December 31, 2012 and 2011, we had an accumulated deficit of $94.5 million and $87.5 million, respectively.
Our fiscal year ends on December 31. The consolidated financial statements include our accounts and the accounts of our wholly owned subsidiaries. All significant intercompany accounts and transactions have been eliminated.
Our total revenues by product line are set forth in the following table (in thousands):
|
|
2012
|
2011
|
||||||
|
Optics
|
$ | 18,024 | $ | 11,298 | ||||
|
RF
|
3,283 | 4,990 | ||||||
|
High-Speed Communications
|
21,307 | 16,288 | ||||||
|
Industrial (ASIC)
|
14,549 | 15,352 | ||||||
|
Government
|
878 | 628 | ||||||
|
Total revenue
|
$ | 36,734 | $ | 32,268 | ||||
We market and sell our products in Asia, North America, Europe and other locations through our direct sales force, distributors and sales representatives. The percentage of our sales shipped outside the United States was approximately 72% and 59% in fiscal 2012 and fiscal 2011, respectively. We measure sales location by the shipping destination, even if the customer is headquartered in the U.S. We anticipate that sales to international customers will continue to represent a significant percentage of our net sales.
Our sales are generally made by purchase orders. Since industry practice allows customers to reschedule or cancel orders on relatively short notice, backlog may not be a good indicator of our future sales. Cancellations of customer orders or changes in product specifications could result in the loss of anticipated sales without allowing us sufficient time to reduce our inventory and operating expenses.
Since a significant portion of our revenue is from the telecom and datacom markets, our business may be subject to seasonality, with increased revenues in the third and fourth calendar quarters of each year, when customers place orders to meet year-end demand. However, due to the complex nature of the markets we serve and the broad fluctuations in economic conditions in the U.S. and other countries, it is difficult for us to assess the impact of seasonal factors on our business.
We are subject to the risks of conducting business internationally, including economic conditions in Asia, particularly Taiwan, Japan and China, changes in trade policy and regulatory requirements, duties, tariffs and other trade barriers and restrictions, the burdens of complying with foreign laws and, possibly, political instability. Most of our foundries and all of our assembly and test subcontractors are located in Asia. Although our international sales are largely denominated in U.S. dollars, we have foreign operations where expenses are generally denominated in the local currency. Such transactions expose us to the risk of exchange rate fluctuations. We monitor our exposure to foreign currency fluctuations, but have not adopted any hedging strategies to date. There can be no assurance that exchange rate fluctuations will not harm our business and operating results in the future.
Due to the continued uncertain economic conditions, in the markets which we serve, our current or potential customers may delay or reduce purchases of our products, which would adversely affect our revenues and harm our business and financial results. We expect our business to be adversely impacted by any future downturn in the U.S. or global economies. In the past, industry downturns have resulted in reduced demand and declining average selling prices for our products which adversely affected our business. We expect to continue to experience these adverse business conditions in the event of further downturns.
Critical Accounting Policies and Estimates
Management’s Discussion and Analysis of Financial Condition and Results of Operations discuss our consolidated financial statements, which have been prepared in accordance with accounting principles generally accepted in the United States of America (U.S. GAAP). The preparation of these financial statements requires management to make estimates and assumptions that affect the reported amounts of assets and liabilities at the date of the financial statements and the reported amounts of revenues and expenses during the reporting period. On an ongoing basis, management evaluates its estimates and judgments, including those related to product returns, bad debts, inventories, asset impairments, deferred tax assets, accrued warranty reserves, restructuring costs, contingencies and litigation. Management bases its estimates and judgments on historical experience and on various other factors that are believed to be reasonable under the circumstances, the results of which form the basis for making judgments about the carrying values of assets and liabilities that are not readily apparent from other sources. Actual results may differ from these estimates under different assumptions or conditions.
Management believes the following critical accounting policies, among others, affect our more significant judgments and estimates used in the preparation of our consolidated financial statements.
An accounting policy is deemed to be critical if it requires an accounting estimate to be made based on assumptions about matters that are highly uncertain at the time the estimate is made, and if different estimates that reasonably could have been used or changes in the accounting estimate that are reasonably likely to occur could materially change the financial statements. We also have other key accounting policies that are less subjective, and therefore, their application would not have a material impact on our reported results of operations. The following is a discussion of our critical accounting policies, as well as the estimates and judgments involved.
Revenue Recognition
Revenue from sales of optical modulator drivers and receivers, multi-chip modules (MCMs), ASICs and other products is recognized when persuasive evidence of a sales arrangement exists, transfer of title occurs, the sales price is fixed or determinable and collection of the resulting receivable is reasonably assured. Revenue for product shipments is recognized upon delivery of the product to the customer. Provisions are made for sales returns and warranties at the time revenue is recorded.
Customer purchase orders are generally used to determine the existence of an arrangement. Transfer of title and risk of ownership occur based on defined terms in customer purchase orders, and generally pass to the customer upon shipment, at which point goods are delivered to a carrier. There are no formal customer acceptance terms or further obligations, outside of our standard product warranty. We assess whether the sales price is fixed or determinable based on the payment terms associated with the transaction. Collectibility is assessed based primarily on the credit worthiness of the customer as determined through ongoing credit evaluations of the customer’s financial condition, as well as consideration of the customer’s payment history.
Revenue generated from engineering product development projects is recorded as revenue in accordance with accounting guidance for contract accounting, generally using the percentage of completion method measured on an engineering effort incurred basis. Changes in contract performance, contract conditions, and estimated profitability, including those arising from contract penalty provisions and final contract settlements, may result in revisions to costs and revenues and are recognized in the period in which the revisions are determined. The costs incurred under the engineering product development contracts are expensed as incurred and generally are included in research and development expense. As of December 31, 2012, we maintained a reserve of $191,000 associated with a change in estimated rates under which we could bill for the work we performed under various government contracts during fiscal 2008 through fiscal 2011.
We sell some products to distributors at the price listed in its price book for that distributor. Certain distribution agreements provide for semi-annual stock rotation privileges of 5% of net sales for the previous six-month period. The contractual stock rotation applies only to shipments at our listed book price. At the time of sale we record a sales reserve for stock rotations approved by management. We offset the sales reserve against revenues, producing the net revenue amount reported in the consolidated statements of operations. Each month we adjust the sales reserve for the estimated stock rotation privilege anticipated to be utilized by the distributors. When the distributors pay our invoices, they may claim debits stock rotations when appropriate. Once claimed, we process the requests against the prior authorizations and reduce the reserve previously established for that customer.
The revenue we record for sales to our distributors is net of estimated provisions for these programs. When determining this net revenue, we must make significant judgments and estimates. We base our estimates on historical experience rates, inventory levels in the distribution channel, current trends and other related factors. However, because of the inherent nature of estimates, there is a risk that there could be significant differences between actual amounts and our estimates. Our financial condition and operating results depend on its ability to make reliable estimates and we believe that such estimates are reasonable. The reserve for stock rotations was $65,000 as of December 31, 2012 and is recorded in other current liabilities on our consolidated balance sheet.
We record transaction-based taxes including, but not limited to, sales, use, value added, and excise taxes, on a net basis in our consolidated statements of operations.
Allowance for Doubtful Accounts
We make ongoing assumptions relating to the collectibility of our accounts receivable in our calculation of the allowance for doubtful accounts. In determining the amount of the allowance, we make judgments about the creditworthiness of customers based on ongoing credit evaluations and assess current economic trends affecting our customers that might impact the level of credit losses in the future and result in different rates of bad debts than previously seen. We also consider our historical level of credit losses. At December 31, 2012 and 2011, our doubtful account allowances were $337,000 and $357,000, respectively.
Inventories
Inventories are stated at the lower of standard cost (determined on a first in, first out basis) or market (net realizable value). Cost includes labor, material and overhead costs. Determining fair market value of inventories involves numerous judgments, including projecting average selling prices and sales volumes for future periods and costs to complete products in work in process inventories. As a result of this analysis, when fair market values are below our costs, we record a charge to cost of revenue in advance of when the inventory is scrapped or sold.
We evaluate our ending inventories for excess quantities and obsolescence on a quarterly basis. This evaluation includes analysis of historical and forecasted sales quantities by product. Inventories on hand in excess of forecasted demand are written down. In addition, we write off inventories that are considered obsolete. Obsolescence is determined from several factors, including competitiveness of product offerings, market conditions and product life cycles when determining obsolescence. Increases to the provision for excess and obsolete inventory are charged to cost of revenue. At the point of the loss recognition, a new, lower-cost basis for that inventory is established, and subsequent changes in facts and circumstances do not result in the restoration or increase in that newly established cost basis. If this lower-cost inventory is subsequently sold, the related provision is matched to the movement of related product inventory, which may result in lower costs and higher gross margins for those products.
Our inventories include high-technology parts that may be subject to rapid technological obsolescence and which are sold in a highly competitive industry. If actual product demand or selling prices are less favorable than we estimate, we may be required to take additional inventory write-downs.
Long-Lived Assets and Intangible Assets
Long-lived assets include equipment, furniture and fixtures, licenses, leasehold improvements, semiconductor masks used in production and intangible assets. When events or changes in circumstances indicate that the carrying amount of long-lived assets may not be recoverable, we test for recoverability based on an estimate of undiscounted cash flows as compared to the asset’s carrying amount. If the carrying value exceeds the estimated future cash flows, the asset is considered to be impaired. The amount of impairment is measured as the difference between the carrying amount and the fair value of the impaired asset. Factors we consider important that could trigger an impairment review include continued operating losses, significant negative industry trends, significant underutilization of the assets and significant changes in the way we plan to use the assets. In addition, we must use our judgment in determining the groups of assets for which impairment tests are separately performed.
The estimation of future cash flows involves numerous assumptions, which require our judgment, including, but not limited to, future use of the assets for our operations versus sale or disposal of the assets, future-selling prices for our products and future production and sales volumes.
Goodwill
Goodwill is recorded when the purchase price of an acquisition exceeds the fair value of the net purchased tangible and intangible assets acquired and is carried at cost. Goodwill is not amortized, but is reviewed annually for impairment. We perform our annual goodwill impairment analysis in the fourth quarter of each year or more frequently if we believe indicators of impairment exist. Factors that we consider important which could trigger an impairment review include the following:
|
|
·
|
significant underperformance relative to historical or projected future operating results;
|
|
|
·
|
significant adverse change in the extent or manner in which a long-lived asset is being used or in its physical condition;
|
|
|
·
|
significant negative industry or economic trends; and
|
|
|
·
|
significant decline in the Company’s market capitalization.
|
The performance of the test involves a two-step process. The first step requires a comparison of the fair value of the reporting unit to its net book value, including goodwill. The fair value of the reporting units is determined based on a weighting of income and market approaches. Under the income approach, we calculate the fair value of a reporting unit based on the present value of estimated future cash flows. Under the market approach, we estimate the fair value based on market multiples of revenue or earnings for comparable companies. Determining the fair value of a reporting unit is judgmental in nature and involves the use of significant estimates and assumptions. These estimates and assumptions include revenue growth rates and operating margins used to calculate projected future cash flows, risk-adjusted discount rates, and future economic and market conditions and determination of appropriate market comparables. We base these fair value estimates on reasonable assumptions but that are unpredictable and inherently uncertain. Actual future results may differ from those estimates. A potential impairment exists if the fair value of the reporting unit is lower than its net book value. The second step of the process is only performed if a potential impairment exists, and it involves determining the difference between the fair values of the reporting unit’s net assets, other than goodwill, and the fair value of the reporting unit, and, if the difference is less than the net book value of goodwill, an impairment charge is recorded. In the event that we determine that the value of goodwill has become impaired, it will record a charge for the amount of impairment during the fiscal quarter in which the determination is made. We operate in one reporting unit. We conducted our 2012 annual goodwill impairment analysis in the fourth quarter of 2012 and no goodwill impairment was indicated.
Income Taxes
As part of the process of preparing our consolidated financial statements, we are required to estimate our income taxes in each of the jurisdictions in which we operate. This process involves estimating our current tax exposure and assessing temporary differences resulting from differing treatment of items, such as deferred revenues, for tax and accounting purposes. These differences result in deferred tax assets and liabilities. We then assess the likelihood that our deferred tax assets will be recovered from future taxable income and to the extent we establish a valuation allowance or increase this allowance in a period; we will include an additional tax provision in our consolidated statement of operations.
We consider many factors when evaluating and estimating our tax positions and tax benefits, which may require periodic adjustments and which may not accurately anticipate actual outcomes. The first step is to evaluate the tax position for recognition by determining if the weight of available evidence indicates that it is more likely than not that the position will be sustained on audit, including resolution of related appeals or litigation processes, if any. The second step is to measure the tax benefit as the largest amount that is more than 50% likely of being realized upon ultimate settlement. Whether the more-likely-than-not recognition threshold is met for a tax position is a matter of judgment based on the individual facts and circumstances of that position evaluated in light of all available evidence.
Stock-based Compensation
Stock-based compensation is measured at the date of grant, based on the fair value of the award. For options, we amortize the compensation costs on a straight-line basis over the requisite service period of the option, which is generally the option vesting term of four years. For restricted stock units (RSUs), we amortize the compensation costs on a straight-line basis over the requisite service period of the restricted stock unit grant, which is generally the vesting term of one year. The benefits of tax deductions in excess of recognized compensation expense must be reported as a financing cash flow, rather than as an operating cash flow. This may reduce future net cash flows from operations and increase future net financing cash flows. All of our stock compensation is accounted for as an equity instrument. We estimate the fair value of stock options granted using a Black-Scholes option-pricing model. This model requires the input of highly subjective assumptions, along with certain policy elections, including the options’ expected life and the price volatility of our underlying stock. Actual volatility, expected lives, interest rates and forfeitures may be different from our assumptions, which would result in an actual value of the options being different from estimated.
From time to time we also issue stock option grants to directors and employees which have a market condition. In such cases stock options will vest only if the average price of our stock is at or exceeds a certain price threshold during a specific, previously defined period of time. To the extent that the market condition is not met, the options do not vest and are cancelled. In these cases, we cannot use the Black-Scholes option-pricing model; we must use a binomial model. We engage a third party valuation firm to support management’s valuation of these options using Monte Carlo simulation techniques that incorporate assumptions as provided by management for the expected holding period, risk-free interest rate, stock price volatility and dividend yield. Compensation expense is recognized until such time as the market condition is either met or not met. Certain stock options granted on March 17, 2010 were classified as option grants having a market condition.
We also issue stock options which have company specific financial performance criteria. In this case, we make a determination regarding the probability of the performance criteria being achieved and use a Black-Scholes option-pricing model to value the options incorporating assumptions for the expected holding period, risk-free interest rate, stock price volatility and dividend yield. Compensation expense is recognized over the vesting period, if it is probable that the performance criteria will be met. If the performance criteria are not met, the expense is reversed. Certain stock options granted on October 27, 2010 were classified as option grants having a performance condition.
Expected Term—Our expected term used in the Black-Scholes option-pricing model represents the period that our stock options are expected to be outstanding and is derived from the historical expected terms of “guideline” companies selected based on similar industry and product focus.
Expected Volatility—Our expected volatility used in the Black-Scholes option-pricing model is derived from a combination of historical and implied volatility of “guideline” companies selected based on similar industry and product focus.
Expected Dividend—We have never paid dividends and currently do not intend to do so, and accordingly, the dividend yield percentage is zero for all periods.
Risk-Free Interest Rate—We base the risk-free interest rate used in the Black-Scholes option-pricing model on the implied yield currently available on U.S. Treasury constant maturities issued with a term equivalent to the expected term of the option.
We make an estimate of expected forfeitures and recognize compensation costs only for those equity awards expected to vest. When estimating forfeitures, we consider voluntary termination behavior as well as an analysis of actual option forfeitures.
For RSUs, stock-based compensation is based on the fair value of our common stock at the grant date. The fair value of RSUs granted is the product of the number of shares granted and the grant date fair value of our common stock. RSUs are converted into shares of our common stock upon vesting on a one-for-one basis. Typically, vesting of RSUs is subject to the employee's continuing service. RSUs generally vest over a period of 1 year and are expensed ratably on a straight-line basis over their respective vesting period net of estimated forfeitures.
Recent Accounting Pronouncements
In May 2011, the Financial Accounting Standards Board (“FASB”) issued a new accounting standard update, which amends the fair value measurement guidance and includes some enhanced disclosure requirements. The most significant change in disclosures is an expansion of the information required for Level 3 measurements based on unobservable inputs. The standard is effective for fiscal years beginning after December 15, 2011. We adopted this update in the first quarter of 2012 and it did not have a material impact on our consolidated financial statements.
In June 2011, the FASB issued an amendment to an existing accounting standard which requires companies to present net income and other comprehensive income in one continuous statement or in two separate, but consecutive, statements. In addition, in December 2011, the FASB issued an amendment to an existing accounting standard which defers the requirement to present components of reclassifications of other comprehensive income on the face of the income statement. We adopted this standard in the first quarter of 2012 and it did not have a material impact on our consolidated financial statements.
In September 2011, the FASB issued a revised accounting standard, which is intended to reduce the cost and complexity of the annual goodwill impairment test by providing entities an option to perform a qualitative assessment to determine whether further impairment testing is necessary. Specifically, an entity has the option to first assess qualitative factors to determine whether it is necessary to perform the current two-step test. If an entity believes, as a result of its qualitative assessment, that it is more-likely than-not that the fair value of a reporting unit is less than its carrying amount, the quantitative impairment test is required. Otherwise, no further testing is required. This standard is effective for annual and interim goodwill impairment tests performed for fiscal years beginning after December 15, 2011. We adopted this standard in the first quarter of 2012 and it did not have a material impact on our consolidated financial statements.
In July 2012, the FASB issued an accounting standards update which allows an entity to first assess qualitative factors to determine whether it is more likely than not that the fair value of an indefinite-lived intangible asset is less than its carrying value. An entity is not required to determine the fair value of the indefinite-lived intangible unless the entity determines, based on the qualitative assessment, that it is more likely than not that its fair value is less than the carrying value. This standard is effective for annual and interim impairment tests performed for fiscal years beginning after September 15, 2012 and early adoption is permitted. We do not expect the adoption will have a material impact on our consolidated financial statements.
Results of Operations
Year Ended December 31, 2012 Compared to Year Ended December 31, 2011
The following table sets forth our consolidated results of operations for the fiscal years ended December 31, 2012 and 2011, and the year-over-year increase (decrease) in our results, expressed both in dollar amounts (thousands) and as a percentage of total revenues, except where indicated:
|
Years Ended December 31,
|
||||||||||||||||||||||||
|
2012
|
2011
|
|||||||||||||||||||||||
|
Amount
(in thousands)
|
% of
Revenue
|
Amount
(in thousands)
|
% of
Revenue
|
Change
(in thousands)
|
%
Change
|
|||||||||||||||||||
|
Revenue
|
||||||||||||||||||||||||
|
Product
|
$ | 35,856 | 98 | % | $ | 31,640 | 98 | % | $ | 4,216 | 13 | % | ||||||||||||
|
Government contract
|
878 | 2 | % | 628 | 2 | % | 250 | 40 | % | |||||||||||||||
|
Total revenue
|
36,734 | 100 | % | 32,268 | 100 | % | 4,466 | 14 | % | |||||||||||||||
|
Cost of revenue
|
||||||||||||||||||||||||
|
Product
|
16,941 | 46 | % | 15,475 | 48 | % | 1,466 | 9 | % | |||||||||||||||
|
Government contract
|
- | 0 | % | 180 | 1 | % | (180 | ) | -100 | % | ||||||||||||||
|
Impairment of long-lived asset
|
- | 0 | % | 373 | 1 | % | (373 | ) | -100 | % | ||||||||||||||
|
Total cost of revenue
|
16,941 | 46 | % | 16,028 | 50 | % | 913 | 6 | % | |||||||||||||||
|
Gross profit
|
19,793 | 54 | % | 16,240 | 50 | % | 3,553 | 22 | % | |||||||||||||||
|
Research and development expense
|
13,516 | 37 | % | 12,262 | 38 | % | 1,254 | 10 | % | |||||||||||||||
|
Selling, general and administrative expense
|
11,709 | 32 | % | 10,487 | 32 | % | 1,222 | 12 | % | |||||||||||||||
|
Restructuring expense
|
93 | 0 | % | 3,709 | 11 | % | (3,616 | ) | -97 | % | ||||||||||||||
|
Merger-related expense
|
- | 0 | % | 1,959 | 6 | % | (1,959 | ) | -100 | % | ||||||||||||||
|
Special litigation-related expense
|
1,351 | 4 | % | 493 | 2 | % | 858 | 174 | % | |||||||||||||||
|
Shareholder settlement expense
|
- | 0 | % | 1,064 | 3 | % | (1,064 | ) | -100 | % | ||||||||||||||
|
Total operating expenses
|
26,669 | 73 | % | 29,974 | 93 | % | (3,305 | ) | -11 | % | ||||||||||||||
|
Loss from operations
|
(6,876 | ) | -19 | % | (13,734 | ) | -43 | % | 6,858 | 50 | % | |||||||||||||
|
Interest expense, net
|
(267 | ) | -1 | % | (347 | ) | -1 | % | 80 | 23 | % | |||||||||||||
|
Other income (expense), net
|
220 | 1 | % | (3 | ) | 0 | % | 223 | 7433 | % | ||||||||||||||
|
Net loss before provision for income taxes
|
(6,923 | ) | -19 | % | (14,084 | ) | -44 | % | 7,161 | 51 | % | |||||||||||||
|
Provision for income taxes
|
81 | 0 | % | 56 | 0 | % | 25 | 45 | % | |||||||||||||||
|
Net loss
|
$ | (7,004 | ) | -19 | % | $ | (14,140 | ) | -44 | % | $ | 7,136 | 50 | % | ||||||||||
Revenue
|
Years Ended December 31,
|
||||||||
|
2012
|
2011
|
|||||||
|
(in thousands)
|
||||||||
|
Product
|
$ | 35,856 | $ | 31,640 | ||||
|
Government contract
|
878 | 628 | ||||||
|
Total revenue
|
$ | 36,734 | $ | 32,268 | ||||
|
Increase period over period
|
$ | 4,466 | ||||||
|
Percentage increase, period over period
|
14 | % | ||||||
Total revenue for the year ended December 31, 2012 was $36.7 million, an increase of $4.5 million or 14%, compared with $32.3 million for the year ended December 31, 2011. The increase in total revenue was primarily due to increased revenue from our optics products including increased sales of our 40Gbps and 100Gbps optical components. The increase from our optics products was partially offset by decreases in our RF products due to the end-of-life of certain low margin transceiver products and decreases in our industrial products due to the end-of-life of certain low margin ASIC products.
Gross Profit and Cost of Revenue
|
Years Ended December 31,
|
||||||||
|
2012
|
2011
|
|||||||
|
(in thousands)
|
||||||||
|
Product
|
$ | 16,941 | $ | 15,475 | ||||
|
Government contract
|
- | 180 | ||||||
|
Impairment of long-lived asset
|
- | 373 | ||||||
|
Total cost of revenue
|
$ | 16,941 | $ | 16,028 | ||||
|
Gross profit
|
$ | 19,793 | $ | 16,240 | ||||
|
Gross margin
|
54 | % | 50 | % | ||||
|
Increase period over period
|
3,553 | |||||||
|
Percentage increase, period over period
|
22 | % | ||||||
Gross profit consists of revenue less cost of revenue. Cost of revenue consists primarily of the costs to manufacture saleable chips, including outsourced wafer fabrication and testing; costs of direct materials; equipment depreciation; costs associated with procurement, production control, quality assurance and manufacturing engineering; fees paid to our offshore manufacturing vendors; reserves for potential excess or obsolete material; costs related to stock-based compensation; accrued costs associated with potential warranty returns; impairment of long-lived assets and amortization of certain identified intangible assets. Amortization expense of identified intangible assets, namely existing technology, is presented within cost of revenue, as the intangible assets were determined to be directly attributable to revenue generating activities.
Gross profit for the year ended December 31, 2012 was $19.8 million, or a gross margin of 54%, compared to a gross profit of $16.2 million, or a gross margin of 50%, for the year ended December 31, 2011. The increase in gross margin is primarily due to a change in product mix towards certain higher margin products, and away from certain low margin RF transceivers and ASIC products, an increase in higher margin government contract revenue in 2012 and the $373,000 impairment of a long-lived asset for production mask during 2011.
Research and Development Expense
|
Years Ended December 31,
|
||||||||
|
2012
|
2011
|
|||||||
|
(in thousands)
|
||||||||
|
Research and development expense
|
$ | 13,516 | $ | 12,262 | ||||
|
Percentage of revenue
|
37 | % | 38 | % | ||||
|
Increase period over period
|
$ | 1,254 | ||||||
|
Percentage increase, period over period
|
10 | % | ||||||
Research and development expenses are expensed as incurred. Research and development expense consists primarily of salaries and related expenses for research and development personnel, consulting and engineering design, non-capitalized tools and equipment, engineering related semiconductor masks, depreciation for equipment, engineering expenses paid to outside technology development suppliers, allocated facilities costs and expenses related to stock based compensation.
Research and development expense for the year ended December 31, 2012 was $13.5 million compared to $12.3 million for the year ended December 31, 2011, an increase of $1.3 million or 10%. Research and development costs increased in absolute dollars compared to 2011 primarily due to a $1.0 million increase in personnel related expenses, a $579,000 increase in stock-based compensation related expenses and a $154,000 increase in outside services partially offset by a $650,000 decrease in project related expenses.
In 2013, we expect research and development expense to increase moderately in absolute dollars from 2012.
Selling, General and Administrative Expense
|
Years Ended December 31,
|
||||||||
|
2012
|
2011
|
|||||||
|
(in thousands)
|
||||||||
|
Selling, general and administrative expense
|
$ | 11,709 | $ | 10,487 | ||||
|
Percentage of revenue
|
32 | % | 32 | % | ||||
|
Increase period over period
|
$ | 1,222 | ||||||
|
Percentage increase, period over period
|
12 | % | ||||||
Selling, general and administrative expenses consist primarily of salaries and related expenses for executive, accounting, finance, sales, marketing and administration personnel, professional fees, allocated facilities costs, promotional activities and expenses related to stock-based compensation.
Selling, general and administrative expense for the year ended December 31, 2012 was $11.7 million compared to $10.5 million for the year ended December 31, 2011, an increase of $1.2 million or 12%. Selling, general and administrative costs increased in absolute dollars compared to 2011 primarily due to a $1.2 million increase in stock compensation expense.
In 2013, we expect selling, general and administrative expense to be slightly lower in absolute dollars compared with 2012.
Restructuring Expense
|
Years Ended December 31,
|
||||||||
|
2012
|
2011
|
|||||||
|
(in thousands)
|
||||||||
|
Restructuring expense
|
$ | 93 | $ | 3,709 | ||||
|
Percentage of revenue
|
0 | % | 11 | % | ||||
|
Decrease period over period
|
$ | (3,616 | ) | |||||
|
Percentage decrease, period over period
|
-97 | % | ||||||
During 2012, we recorded a restructuring expense of $93,000 that is the result of $207,000 of severance related expense including severance payments, benefits, payroll taxes, expenses associated with the acceleration of stock options, and other costs associated with the restructuring activities we undertook to reduce our expenses during the first quarter of 2012 offset by a $74,000 benefit from the sublet of our Palo Alto facility, as we were able to sublet the property at a higher lease rate than we originally estimated, and a $40,000 benefit due to lower than anticipated restructuring charges related to the Endwave merger during the second quarter of 2012.
During 2011, we recorded restructuring expense of $3.7 million that is primarily the result of $769,000 of expense associated with vacating our previous headquarter facilities in Palo Alto, California for which we have facilities lease obligations through December 2013 and $3.1 million in restructuring expense booked in relation to the acquisition of Endwave.
Merger-related Expense
During 2011, we incurred $2.0 million of expenses in connection with our June 2011 acquisition of Endwave Corporation. The amounts primarily consist of employee retention compensation of $745,000 in connection with the completion of the merger and $1.2 million of attorney, accounting and investment banking fees.
Special Litigation-related Expense
During 2012, we incurred special litigation-related expenses of $1.4 million due to legal fees associated with the M/A-Com (“Optomai”) case, which is discussed in the Item 3. Legal Proceeding section.
During 2011, we incurred special litigation-related expenses of $493,000 which was primarily due to $400,000 of legal fees associated with the Optomai case and $94,000 due to the settlement of fees with two of our vendors.
Shareholder Settlement Expense
On April 8, 2011, GigOptix and the trustees for the DBSI Estate Litigation Trust and the DBSI Liquidating Trust (together “DBSI”) reached an agreement to settle a claim by DBSI against GigOptix. As part of the settlement, GigOptix issued warrants to DBSI for 1 million shares of common stock. During 2011, we recognized $1.1 million of expense in connection with the issuance of these warrants.
Interest Expense, Net, and Other Income (Expense), Net
|
Years Ended December 31,
|
||||||||
|
|
2012
|
2011
|
||||||
|
(in thousands)
|
||||||||
|
Interest expense, net
|
$ | (267 | ) | $ | (347 | ) | ||
|
Other income (expense), net
|
220 | (3 | ) | |||||
|
Total
|
$ | (47 | ) | $ | (350 | ) | ||
Interest expense, net and other income (expense), net consist primarily of gains and losses related to foreign currency transactions, gains and gains related for property and equipment disposals, interest on line of credit, interest on capital leases and amortization of loan fees in connection with our Silicon Valley Bank line of credit and loan.
Interest expense, net for the year ended December 31, 2012 was $267,000 compared to $347,000 for the year ended December 31, 2011. Interest expense, net decreased in absolute dollars compared to 2011 primarily due to less interest on capital leases and amortization of loan fees.
Other income (expense), net for the year ended December 31, 2012 was income of $220,000 which primarily consisted of $163,000 gain on the sale of property and equipment and $41,000 for foreign exchange transaction gains. Other income (expense), net for the year ended December 31, 2011 was an expense of $3,000.
Provision for Income Taxes
|
Years Ended December 31,
|
||||||||
|
2012
|
2011
|
|||||||
|
(in thousands)
|
||||||||
|
Provision for income taxes
|
$ | 81 | $ | 56 | ||||
|
Increase period over period
|
$ | 25 | ||||||
|
Percentage increase, period over period
|
45 | % | ||||||
Income tax expense was $81,000 and $56,000 in the years ended December 31, 2012 and 2011, respectively, and our effective tax rate was approximately 1% for those periods. The income tax provision for the years ended December 31, 2012 and 2011 were due primarily to state taxes, United States withholding taxes and foreign taxes due. We have incurred book losses in all tax jurisdictions and have a full valuation allowance against such losses.
Liquidity and Capital Resources
On December 9, 2011, we entered into an amended and restated loan and security agreement (the “Loan Agreement”) with Silicon Valley Bank (“SVB”). Pursuant to the Loan Agreement, we are entitled to borrow from SVB up to $6.0 million, based on 80% of eligible accounts receivable subject to limits based on the our eligible accounts as determined by SVB. Interest on extensions of credit is equal to the prime rate of Wall Street Journal (“WSJ”) Prime, plus 0.75%, with a minimum interest rate of 4.00%. The Loan Agreement will expire on December 9, 2013.
The Loan Agreement with SVB is secured by all of our assets, including all accounts, equipment, inventory, receivables, and general intangibles. The Loan Agreement contains certain restrictive covenants that will impose significant operating and financial restrictions on our operations, including, but not limited to restrictions that limit our ability to:
|
|
·
|
Sell, lease, or otherwise transfer, or permit any of our subsidiaries to sell, lease or otherwise transfer, all or any part of our business or property, except in the ordinary course of business or in connection with certain indebtedness or investments permitted under the amended and restated loan agreement;
|
|
·
|
Merge or consolidate, or permit any of our subsidiaries to merge or consolidate, with or into any other business organization, or acquire, or permit any of our subsidiaries to acquire, all or substantially all of the capital stock or property of another person;
|
|
|
·
|
Create, incur, assume or be liable for any indebtedness, other than certain indebtedness permitted under the amended and restated loan and security agreement;
|
|
·
|
Pay any dividends or make any distribution or payment on, or redeem, retire, or repurchase, any capital stock; and
|
|
·
|
Make any investment, other than certain investments permitted under the amended and restated loan and security agreement.
|
The Loan Agreement contained a covenant that required that on the last day of every month, the ratio of our cash, cash equivalents and accounts receivable (together, “Quick Assets”) to our current liabilities which matured within the following year (including obligations to SVB) (“Current Liabilities”), be 1.5 to 1.00. As of July 1, 2012, we were in violation of this covenant. This violation was cured by the July 3, 2012 repayment of the amount borrowed from SVB, and on August 23, 2012, we entered into a Default Waiver and First Amendment to the Loan Agreement with SVB in which SVB agreed to waive the July 1, 2012, default by us for violation of the covenant for the measurement period ended June 30, 2012 and which amended the Loan Agreement as follows: For measuring periods from July 1, 2012, to December 31, 2012, the covenant for the Adjusted Quick Ratio (defined as the ratio of Quick Assets to Current Liabilities, but excluding up to $1.2 million of accrued liabilities) was lowered to 1.35 to 1.00 (from the previous 1.50 to 1.00 prior to the amendment with no exclusion for accrued liabilities). For measuring periods after January 1, 2013, the Adjusted Quick Ratio is 1.50 to 1.00. As of December 31, 2012, we were in compliance with our covenants.
The amount outstanding on the line of credit as of December 31, 2012 was $3.6 million.
Cash and cash equivalents and cash flow data for the periods presented were as follows (in thousands):
|
As of the years ended
December 31,
|
||||||||
|
2012
|
2011
|
|||||||
|
Cash and cash equivalents
|
$ | 10,147 | $ | 15,788 | ||||
|
Years ended December 31,
|
||||||||
| 2012 | 2011 | |||||||
|
Net cash used in operating activities
|
$ | (1,976 | ) | $ | (4,857 | ) | ||
|
Net cash provided by (used in) investing activities
|
$ | (1,496 | ) | $ | 15,960 | |||
|
Net cash provided by (used in) financing activities
|
$ | (2,097 | ) | $ | 140 | |||
Operating Activities
Operating activities used cash of $2.0 million in the year ended December 31, 2012. This resulted from a net loss of $7.0 million and we experienced cash usage for working capital for a decrease in other current liabilities of $2.8 million, an increase in inventories of $1.6 million and an increase in prepaid and other current assets of $0.4 million. These uses were partially offset by the following non-cash expenses: stock based compensation of $5.1 million and depreciation and amortization of $4.1 million.
Operating activities used cash of $4.9 million in the year ended December 31, 2011. This resulted from a net loss of $14.1 million and we experienced cash usage for working capital for an increase in inventories of $0.6 million, an increase in other assets of $0.4 million, an increase in prepaid and other current assets of $0.3 million, a decrease in accrued compensation of $0.3 million, and a decrease in accounts payable and other current liabilities of $0.6 million. These uses were partially offset by the following non-cash expenses: depreciation and amortization of $3.4 million, stock based compensation of $2.9 million, non-cash litigation settlement of $1.1 million, non-cash restructuring expense of $1.0 million and the write-down of certain fixed assets of $0.4 million.
Investing Activities
Net cash used in investing activities for year ended December 31, 2012 was $1.5 million and consisted of $2.0 million of purchases of fixed assets partially offset by $0.4 million proceeds from sale and maturity of investments.
Net cash provided by investing activities for year ended December 31, 2011 was $16.0 million and consisted of $9.5 million proceeds from sale and maturity of investments, the receipt of $8.8 million as a result of the acquisition of Endwave and a $103,000 reduction in restricted cash, partially offset by $2.5 million of purchases of fixed assets.
Financing Activities
Net cash used in financing activities during the year ended December 31, 2012 was $2.1 million and consisted primarily of $19.2 million of proceeds from our line of credit facilities with Silicon Valley Bank, a $18.6 million repayment of the line of credit, $2.2 million of treasury stock repurchases from our modified Dutch auction tender offer, $0.5 million of taxes paid related to net share settlement of equity awards, $0.4 million of proceeds from issuance of stock and $0.4 million for capital lease payments.
Net cash provided by financing activities during the year ended December 31, 2011 was $140,000 and consisted primarily of $9.7 million of proceeds from our line of credit facilities with Silicon Valley Bank, a $9.7 million repayment of the line of credit, a $0.7 million proceeds from issuance of stock, a $0.3 million repayment of capital lease and a $0.2 million repayment of a short-term loan.
On June 12, 2012, we filed a shelf registration statement on Form S-3 with the Securities and Exchange Commission (“SEC”). This shelf registration statement allows us to offer, issue or sell from time to time, together or separately, (i) senior or subordinated debt securities, which may be convertible into shares of our common stock, preferred stock or other securities; (ii) shares of our common stock; (iii) shares of our preferred stock, which we may issue in one or more series; or (iv) warrants to purchase our equity or debt securities or other securities. The total offering price of the securities will not exceed $20 million in the aggregate. The shelf registration became effective on June 25, 2012. We do not currently have any commitments to sell securities pursuant to this registration statement. Future offerings thereunder, if any, will be made only by means of a written prospectus or other permitted documents. At that time, we will file a prospectus supplement with the SEC outlining the type of securities, amounts, prices, use of proceeds and other terms.
We have incurred negative cash flows from operations since inception. For the years ended December 31, 2012 and 2011, we incurred net losses of $7.0 million and $14.1 million, respectively, and cash outflows from operations of $2.0 million and $4.9 million respectively. As of December 31, 2012 and 2011, we had an accumulated deficit of $94.5 million and $87.5 million, respectively. We have incurred significant losses since inception, attributable to our efforts to design and commercialize our products. We have managed our liquidity during this time through a series of cost reduction initiatives and through increasing our line of credit with our bank. Our ability to continue as a going concern is dependent on many events outside of our direct control, including, among other things; obtaining additional financing either privately or through public markets and consumers’ purchasing our products in substantially higher volumes. During 2011, we purchased Endwave Corporation and received $18.8 million in cash, cash equivalents and short term investments as a result of this acquisition which allowed us to stabilize our cash position. We have used that cash to substantially reduce our outstanding accounts payable and accrued expenses balances. In addition, we have access to a line of credit with Silicon Valley Bank which enables us to borrow up to $6.0 million based on 80% of eligible invoiced amounts to customers. Based on these events and factors we believe our existing cash and cash equivalents, along with the funds available through Silicon Valley Bank, will be sufficient to meet our working capital and capital expenditure needs over the next 12 months.
Material Commitments
The following table summarizes our future cash obligations for current debt, operating leases, and capital leases, in thousands of dollars, as of December 31, 2012:
|
Contractual Obligations
|
Total
|
Less than One Year
|
One to
Three
Years
|
More than
Three
Years
|
||||||||||||
|
Current debt obligation
|
$ | 3,600 | $ | 3,600 | $ | - | $ | - | ||||||||
|
Operating lease obligations
|
2,860 | 1,594 | 870 | 396 | ||||||||||||
|
Capital lease obligations
|
706 | 400 | 306 | - | ||||||||||||
|
Total
|
$ | 7,166 | $ | 5,594 | $ | 1,176 | $ | 396 | ||||||||
In addition to the future cash obligations above, GigOptix did not have any material commitments for capital expenditures as of December 31, 2012.
Impact of Inflation and Changing Prices on Net Sales, Revenue and Incom
Inflation and changing prices have not had a material impact on the materials used in our production process during the periods and at balance sheet dates presented in this report.
Off-Balance Sheet Arrangements
GigOptix does not use off-balance-sheet arrangements with unconsolidated entities, nor does it use other forms of off-balance-sheet arrangements such as special purpose entities and research and development arrangements. Accordingly, GigOptix is not exposed to any financing or other risks that could arise if it had such relationships.
|
ITEM 8.
|
FINANCIAL STATEMENTS AND SUPPLEMENTARY DATA
|
INDEX TO CONSOLIDATED FINANCIAL STATEMENTS
|
Report of Independent Registered Public Accounting Firm
|
51
|
|
|
|
|
Report of Independent Registered Public Accounting Firm
|
52
|
|
Financial Statements:
|
|
|
|
|
|
Consolidated Balance Sheets—December 31, 2012 and 2011
|
53
|
|
|
|
|
Consolidated Statements of Operations—Years Ended December 31, 2012 and 2011
|
54
|
|
|
|
|
Consolidated Statements of Comprehensive Loss—Years Ended December 31, 2012 and 2011
|
55
|
|
|
|
|
Consolidated Statements of Stockholders’ Equity—Years Ended December 31, 2012 and 2011
|
56
|
|
Consolidated Statements of Cash Flows—Years Ended December 31, 2012 and 2011
|
57
|
|
|
|
|
Notes to Consolidated Financial Statements
|
58
|
REPORT OF INDEPENDENT REGISTERED PUBLIC ACCOUNTING FIRM
The Board of Directors and Stockholders
GigOptix, Inc.
We have audited the accompanying consolidated balance sheet of GigOptix, Inc. (a Delaware corporation) and its subsidiaries (the “Company”) as of December 31, 2012, and the related consolidated statements of operations, comprehensive loss, stockholders’ equity and cash flows for the year ended December 31, 2012. These financial statements are the responsibility of the Company’s management. Our responsibility is to express an opinion on these financial statements based on our audit.
We conducted our audit in accordance with the standards of the Public Company Accounting Oversight Board (United States). Those standards require that we plan and perform the audit to obtain reasonable assurance about whether the financial statements are free of material misstatement. The Company is not required to have, nor have we been engaged to perform an audit of its internal control over financial reporting. Our audit included consideration of internal control over financial reporting as a basis for designing audit procedures that are appropriate in the circumstances, but not for the purpose of expressing an opinion on the effectiveness of the Company’s internal control over financial reporting. Accordingly, we express no such opinion. An audit also includes examining, on a test basis, evidence supporting the amounts and disclosures in the financial statements, assessing the accounting principles used and significant estimates made by management, as well as evaluating the overall financial statement presentation. We believe that our audit provides a reasonable basis for our opinion.
In our opinion, the consolidated financial statements referred to above present fairly, in all material respects, the financial position of GigOptix, Inc. and its subsidiaries as of December 31, 2012, and the results of their operations and their cash flows for the year ended December 31, 2012 in conformity with accounting principles generally accepted in the United States of America.
|
/s// BURR PILGER MAYER, INC.
|
|
|
San Jose, California
|
|
|
March 25, 2013
|
REPORT OF INDEPENDENT REGISTERED PUBLIC ACCOUNTING FIRM
The Board of Directors and Stockholders
GigOptix, Inc.
We have audited the accompanying consolidated balance sheet of GigOptix, Inc. (a Delaware corporation) and subsidiaries (the “Company”) as of December 31, 2011, and the related consolidated statements of operations, comprehensive loss, stockholders’ equity and cash flows for the year ended December 31, 2011. These financial statements are the responsibility of the Company’s management. Our responsibility is to express an opinion on these financial statements based on our audit.
We conducted our audit in accordance with the standards of the Public Company Accounting Oversight Board (United States). Those standards require that we plan and perform the audit to obtain reasonable assurance about whether the financial statements are free of material misstatement. The Company is not required to have, nor were we engaged to perform an audit of its internal control over financial reporting. Our audit included consideration of internal control over financial reporting as a basis for designing audit procedures that are appropriate in the circumstances, but not for the purpose of expressing an opinion on the effectiveness of the Company’s internal control over financial reporting. Accordingly, we express no such opinion. An audit also includes examining, on a test basis, evidence supporting the amounts and disclosures in the financial statements, assessing the accounting principles used and significant estimates made by management, as well as evaluating the overall financial statement presentation. We believe that our audit provides a reasonable basis for our opinion.
In our opinion, the consolidated financial statements referred to above present fairly, in all material respects, the financial position of GigOptix, Inc. and subsidiaries as of December 31, 2011, and the results of their operations and their cash flows for the year ended December 31, 2011 in conformity with accounting principles generally accepted in the United States of America.
|
/S/ GRANT THORNTON LLP
|
|
|
San Francisco, California
|
|
|
March 27, 2012
|
GIGOPTIX, INC.
CONSOLIDATED BALANCE SHEETS
(In thousands, except share and per share amounts)
|
December 31,
|
||||||||
|
2012
|
2011
|
|||||||
|
ASSETS
|
|
|||||||
|
Current assets:
|
||||||||
|
Cash and cash equivalents
|
$ | 10,147 | $ | 15,788 | ||||
|
Short-term investments
|
- | 400 | ||||||
|
Accounts receivable, net
|
5,056 | 5,625 | ||||||
|
Inventories
|
4,111 | 2,220 | ||||||
|
Prepaid and other current assets
|
295 | 298 | ||||||
|
Total current assets
|
19,609 | 24,331 | ||||||
|
Property and equipment, net
|
4,579 | 4,488 | ||||||
|
Intangible assets, net
|
4,270 | 5,281 | ||||||
|
Goodwill
|
9,860 | 9,860 | ||||||
|
Restricted cash
|
282 | 255 | ||||||
|
Other assets
|
228 | 309 | ||||||
|
Total assets
|
$ | 38,828 | $ | 44,524 | ||||
|
LIABILITIES AND STOCKHOLDERS’ EQUITY
|
||||||||
|
Current liabilities:
|
||||||||
|
Accounts payable
|
$ | 3,174 | $ | 3,183 | ||||
|
Accrued compensation
|
846 | 832 | ||||||
|
Line of credit
|
3,600 | 3,000 | ||||||
|
Other current liabilities
|
3,080 | 4,850 | ||||||
|
Total current liabilities
|
10,700 | 11,865 | ||||||
|
Capital lease, noncurrent
|
281 | 746 | ||||||
|
Pension liabilities
|
252 | 65 | ||||||
|
Deferred rent, noncurrent
|
233 | 95 | ||||||
|
Other long term liabilities
|
362 | 439 | ||||||
|
Total liabilities
|
11,828 | 13,210 | ||||||
|
Commitments and contingencies (Note 13)
|
||||||||
|
Stockholders’ equity:
|
||||||||
|
Preferred stock, $0.001 par value; 1,000,000 shares authorized; no shares issued and outstanding as of December 31, 2012 and 2011
|
- | - | ||||||
|
Common stock, $0.001 par value; 50,000,000 shares authorized as of December 31, 2012 and 2011; 22,205,746 and 21,545,713 shares issued and outstanding as of December 31, 2012 and 2011, respectively
|
22 | 22 | ||||||
|
Additional paid-in capital
|
123,386 | 118,362 | ||||||
|
Treasury stock, at cost; 701,754 and zero shares as of December 31, 2012 and 2011, respectively
|
(2,209 | ) | - | |||||
|
Accumulated other comprehensive income
|
298 | 423 | ||||||
|
Accumulated deficit
|
(94,497 | ) | (87,493 | ) | ||||
|
Total stockholders’ equity
|
27,000 | 31,314 | ||||||
|
Total liabilities and stockholders’ equity
|
$ | 38,828 | $ | 44,524 | ||||
See accompanying Notes to Consolidated Financial Statements
GIGOPTIX, INC.
CONSOLIDATED STATEMENTS OF OPERATIONS
(In thousands, except per share amounts)
|
Years Ended December 31,
|
||||||||
|
2012
|
2011
|
|||||||
|
Revenue
|
||||||||
|
Product
|
$ | 35,856 | $ | 31,640 | ||||
|
Government contract
|
878 | 628 | ||||||
|
Total revenue
|
36,734 | 32,268 | ||||||
|
Cost of revenue
|
||||||||
|
Product
|
16,941 | 15,475 | ||||||
|
Government contract
|
- | 180 | ||||||
|
Impairment of long-lived asset
|
- | 373 | ||||||
|
Total cost of revenue
|
16,941 | 16,028 | ||||||
|
Gross profit
|
19,793 | 16,240 | ||||||
|
Research and development expense
|
13,516 | 12,262 | ||||||
|
Selling, general and administrative expense
|
11,709 | 10,487 | ||||||
|
Restructuring expense
|
93 | 3,709 | ||||||
|
Merger-related expense
|
- | 1,959 | ||||||
|
Special litigation-related expense
|
1,351 | 493 | ||||||
|
Shareholder settlement expense
|
- | 1,064 | ||||||
|
Total operating expenses
|
26,669 | 29,974 | ||||||
|
Loss from operations
|
(6,876 | ) | (13,734 | ) | ||||
|
Interest expense, net
|
(267 | ) | (347 | ) | ||||
|
Other income (expense), net
|
220 | (3 | ) | |||||
|
Net loss before provision for income taxes
|
(6,923 | ) | (14,084 | ) | ||||
|
Provision for income taxes
|
81 | 56 | ||||||
|
Net loss
|
$ | (7,004 | ) | $ | (14,140 | ) | ||
|
Net loss per share—basic and diluted
|
$ | (0.33 | ) | $ | (0.82 | ) | ||
|
Weighted average number of shares used in per share calculations - basic and diluted
|
21,444 | 17,279 | ||||||
See accompanying Notes to Consolidated Financial Statements
GIGOPTIX, INC.
CONSOLIDATED STATEMENTS OF COMPREHENSIVE LOSS
(In thousands)
|
Years Ended December 31,
|
||||||||
|
2012
|
2011
|
|||||||
|
Net loss
|
$ | (7,004 | ) | $ | (14,140 | ) | ||
|
Other comprehensive income (loss), net of tax
|
||||||||
|
Foreign currency translation adjustment
|
(16 | ) | 100 | |||||
|
Change in pension liability in connection with actuarial gain (loss)
|
(109 | ) | 145 | |||||
|
Other comprehensive income (loss), net of tax
|
(125 | ) | 245 | |||||
|
Comprehensive loss
|
$ | (7,129 | ) | $ | (13,895 | ) | ||
GIGOPTIX, INC.
CONSOLIDATED STATEMENTS OF STOCKHOLDERS’ EQUITY
(In thousands, except share amounts)
For each of the two years in the period ended December 31, 2012
|
Common Stock
|
Treasury Stock
|
Additional Paid-in Capital
|
Accumulated Deficit
|
Accumulated Other Comprehensive Income
|
Total Shareholders' Equity
|
|||||||||||||||||||||||||||
|
Shares
|
Amount
|
Shares
|
Amount
|
|||||||||||||||||||||||||||||
|
Balance at December 31, 2010
|
12,210,264 | $ | 12 | - | $ | - | $ | 88,553 | $ | (73,353 | ) | $ | 178 | $ | 15,390 | |||||||||||||||||
|
Stock-based compensation
|
- | - | - | - | 2,922 | - | - | 2,922 | ||||||||||||||||||||||||
|
Issuance of common stock in connection with exercise of options
|
91,140 | - | - | - | 172 | - | - | 172 | ||||||||||||||||||||||||
|
Issuance of common stock in connection with exercise of warrants
|
115,807 | - | - | - | 479 | - | - | 479 | ||||||||||||||||||||||||
|
Issuance of common stock warrants
|
- | - | - | - | 1,064 | 1,064 | ||||||||||||||||||||||||||
|
Issuance of common stock in connection with the Endwave acquisition, net of withholding
|
9,128,502 | 10 | - | - | 24,191 | - | - | 24,201 | ||||||||||||||||||||||||
|
Expenses paid as a capital contribution
|
- | - | - | - | 981 | - | - | 981 | ||||||||||||||||||||||||
|
Foreign currency translation adjustment, net of tax
|
- | - | - | - | - | - | 100 | 100 | ||||||||||||||||||||||||
|
Change in pension liability in connection with actuarial gain, net of tax
|
- | - | - | - | - | 145 | 145 | |||||||||||||||||||||||||
|
Net loss
|
- | - | - | - | - | (14,140 | ) | - | (14,140 | ) | ||||||||||||||||||||||
|
Balance at December 31, 2011
|
21,545,713 | 22 | - | - | 118,362 | (87,493 | ) | 423 | 31,314 | |||||||||||||||||||||||
|
Stock-based compensation
|
- | - | - | - | 5,087 | - | - | 5,087 | ||||||||||||||||||||||||
|
Issuance of common stock in connection with exercise of options
|
230,466 | - | - | - | 400 | - | - | 400 | ||||||||||||||||||||||||
|
Issuance of common stock in connection with exercise of warrants
|
14,158 | - | - | - | - | - | - | - | ||||||||||||||||||||||||
|
Issuance of restricted stock to employees, net of taxes paid related to net share settlement of equity awards
|
415,409 | - | - | - | (463 | ) | - | - | (463 | ) | ||||||||||||||||||||||
|
Purchase of treasury stock, including direct issuance costs
|
701,754 | (2,209 | ) | - | - | - | (2,209 | ) | ||||||||||||||||||||||||
|
Foreign currency translation adjustment, net of tax
|
- | - | - | - | - | - | (16 | ) | (16 | ) | ||||||||||||||||||||||
|
Change in pension liability in connection with actuarial loss, net of tax
|
- | - | - | - | - | - | (109 | ) | (109 | ) | ||||||||||||||||||||||
|
Net loss
|
- | - | - | - | - | (7,004 | ) | - | (7,004 | ) | ||||||||||||||||||||||
|
Balance at December 31, 2012
|
22,205,746 | $ | 22 | 701,754 | $ | (2,209 | ) | $ | 123,386 | $ | (94,497 | ) | $ | 298 | $ | 27,000 | ||||||||||||||||
See accompanying Notes to Consolidated Financial Statements
GIGOPTIX, INC.
CONSOLIDATED STATEMENTS OF CASH FLOWS
(In thousands)
|
Years ended December 31,
|
||||||||
|
2012
|
2011
|
|||||||
|
Cash flows from operating activities:
|
||||||||
|
Net loss
|
$ | (7,004 | ) | $ | (14,140 | ) | ||
|
Adjustments to reconcile net loss to net cash used in operating activities:
|
||||||||
|
Depreciation and amortization
|
4,085 | 3,448 | ||||||
|
Stock-based compensation
|
5,087 | 2,922 | ||||||
|
Change in fair value of warrants
|
3 | (21 | ) | |||||
|
Non-cash litigation settlement
|
- | 1,064 | ||||||
|
Write-down of property and equipment
|
- | 373 | ||||||
|
Non-cash restructuring expense (benefits)
|
(114 | ) | 981 | |||||
|
Amortization of investments
|
- | 39 | ||||||
|
Gain on sale of property and equipment
|
(163 | ) | - | |||||
|
Changes in operating assets and liabilities, net of acquisition:
|
||||||||
|
Accounts receivable, net
|
569 | 96 | ||||||
|
Inventories
|
(1,606 | ) | 632 | |||||
|
Prepaid and other current assets
|
(385 | ) | 274 | |||||
|
Other assets
|
80 | 418 | ||||||
|
Accounts payable
|
46 | (400 | ) | |||||
|
Accrued compensation
|
14 | (314 | ) | |||||
|
Other current liabilities
|
(2,760 | ) | (214 | ) | ||||
|
Other long-term liabilities
|
172 | (15 | ) | |||||
|
Net cash used in operating activities
|
(1,976 | ) | (4,857 | ) | ||||
|
Cash flows from investing activities:
|
||||||||
|
Proceeds from sale and maturity of investments
|
400 | 9,505 | ||||||
|
Purchases of property and equipment
|
(1,961 | ) | (2,473 | ) | ||||
|
Proceeds from sale of property and equipment
|
90 | - | ||||||
|
Net cash received in the acquisition of Endwave
|
- | 8,825 | ||||||
|
Change in restricted cash
|
(25 | ) | 103 | |||||
|
Net cash provided by (used in) investing activities
|
(1,496 | ) | 15,960 | |||||
|
Cash flows from financing activities:
|
||||||||
|
Proceeds from issuance of stock
|
400 | 651 | ||||||
|
Taxes paid related to net share settlement of equity awards
|
(463 | ) | - | |||||
|
Proceeds from line of credit
|
19,171 | 9,654 | ||||||
|
Repayment of line of credit
|
(18,571 | ) | (9,653 | ) | ||||
|
Repayment of short-term loan
|
- | (227 | ) | |||||
|
Repayment of capital lease
|
(425 | ) | (285 | ) | ||||
|
Purchases of treasury stock, including direct issuance costs
|
(2,209 | ) | - | |||||
|
Net cash provided by (used in) financing activities
|
(2,097 | ) | 140 | |||||
|
Effect of exchange rates on cash and cash equivalents
|
(72 | ) | 43 | |||||
|
Net increase (decrease) in cash and cash equivalents
|
(5,641 | ) | 11,286 | |||||
|
Cash and cash equivalents at beginning of period
|
15,788 | 4,502 | ||||||
|
Cash and cash equivalents at end of period
|
$ | 10,147 | $ | 15,788 | ||||
|
Supplemental disclosure of cash flow information
|
||||||||
|
Interest paid
|
$ | 267 | $ | 340 | ||||
|
Property, plant and equipment acquired under capital lease
|
$ | - | $ | 277 | ||||
|
Non-cash financing activities:
|
||||||||
|
Fair value of 9,128,502 shares of common stock issued in acquisition
|
$ | - | $ | 24,201 | ||||
See accompanying Notes to Consolidated Financial Statements
GIGOPTIX, INC.
NOTES TO CONSOLIDATED FINANCIAL STATEMENTS
NOTE 1—ORGANIZATION AND BASIS OF PRESENTATION
Organization
GigOptix Inc. (“GigOptix” or the “Company”) is a leading fabless supplier of semiconductor components that enable high speed information streaming over network infrastructures. The business is made up of two product lines: High-Speed Communications products and Industrial products.
The High-Speed Communications product line offers a broad portfolio of high performance optical and wireless components to telecommunication (telecom) and data communication (datacom) customers, including i) mixed signal radio frequency integrated circuits (RFIC), including 40G and 100G laser and optical modulator drivers and trans-impedance amplifiers (TIA) for telecom, datacom, and consumer electronic fiber-optic applications; ii) power amplifiers and transceivers for microwave and millimeter monolithic microwave integrated circuit (MMIC) wireless applications including 73 Ghz and 83 GHz power amplifiers and transceiver chips; iii) thin film polymer on silicon (TFPS) optical modulators for 40G and 100G fiber-optic telecom; and iv) integrated systems in a package (SIP) solutions for both fiber-optic and wireless applications.
The Industrial product line offers a wide range of digital and mixed-signal application specific integrated circuit (ASIC) solutions for industrial, military, avionics, medical and communications markets.
GigOptix, Inc., the successor to GigOptix LLC, was formed as a Delaware corporation in March 2008 in order to facilitate a combination between GigOptix LLC and Lumera Corporation (“Lumera”). Before the combination, GigOptix LLC acquired the assets of iTerra Communications LLC in July 2007 (“iTerra”) and Helix Semiconductors AG (“Helix”) in January 2008. On November 9, 2009, GigOptix acquired ChipX, Incorporated (“ChipX”). As a result of the acquisitions, Helix, Lumera and ChipX all became wholly owned subsidiaries of GigOptix.
On June 17, 2011, GigOptix completed its acquisition of Endwave Corporation (“Endwave”) pursuant to the terms of the Agreement and Plan of Merger, dated as of February 4, 2011 (the “Merger Agreement”) and Endwave became a wholly owned subsidiary of GigOptix at that time. Pursuant to the terms of the Merger Agreement, upon the consummation of the merger, each outstanding share of Endwave common stock converted into the right to receive approximately 0.908 shares of GigOptix common stock. GigOptix issued a total of 9,128,502 shares of its common stock in the merger, which represented approximately 42.45% of GigOptix’ outstanding common stock. The foregoing amounts take into account reductions in the number of shares issued to employees and directors of Endwave for any applicable withholding requirements for federal, state and other taxes. More specifically, 9,060,740 shares of GigOptix common stock were issued to the holders of Endwave common stock, 46,081 shares of GigOptix common stock were issued to holders of Endwave restricted stock units, and 21,681 shares of GigOptix common stock were issued to the holders of options to purchase Endwave common stock with an exercise price less than $2.08, the Endwave closing price as reported on the Nasdaq Global Market on June 16, 2011 (the trading day immediately prior to the effective time of the merger (the “Effective Date”)). The total expenses in connection with the Endwave transaction, which were approximately $2.0 million, were comprised of legal, accounting and banking fees.
Reclassifications
Certain prior year amounts in the consolidated financial statements and the notes thereto have been reclassified where necessary to conform to the current year presentation. These reclassifications did not affect the prior period total assets, total liabilities, stockholders’ equity, net loss or net cash used in operating activities.
Basis of Presentation
The Company’s fiscal year ends on December 31. The consolidated financial statements include the accounts of the Company and its wholly owned subsidiaries. All significant intercompany accounts and transactions have been eliminated. Endwave’s results of operations and cash flows for the period from June 18, 2011 through December 31, 2011 are included in the consolidated statement of operations for the year ended December 31, 2011 and the consolidated statement of cash flows for the year ended December 31, 2011.
Use of Estimates
The preparation of consolidated financial statements in conformity with accounting principles generally accepted in the United States (“US GAAP”) requires management to make estimates, judgments and assumptions that affect the reported amount of assets, liabilities, revenues and expenses and related disclosures of contingent assets and liabilities. On an on-going basis, the Company evaluates its estimates, including those related to allowances for doubtful accounts, reserves for stock rotation rights, warranty accrual, inventory write-downs, valuation of long-lived assets, including property and equipment and identified intangible assets and goodwill, valuation of deferred taxes and contingencies. In addition, the Company uses assumptions when employing the Black-Scholes option valuation model to calculate the fair value of stock options granted; and assumptions when employing the Monte Carlo simulation to estimate the carrying value of its warrant liability. The Company bases its estimates of the carrying value of certain assets and liabilities on historical experience and on various other assumptions that are believed to be reasonable under the circumstances, when these carrying values are not readily available from other sources. Actual results could differ from these estimates.
Certain Significant Risks and Uncertainties
The Company operates in a dynamic industry and, accordingly, its business can be affected by a variety of factors. For example, changes in any of the following areas could have a negative effect in terms of its future financial position, results of operations or cash flows: a downturn in the overall semiconductor industry or communications semiconductor market; regulatory changes; fundamental changes in the technology underlying telecom products or incorporated in customers’ products; market acceptance of its products under development; litigation or other claims against the Company; litigation or other claims made by the Company; the hiring, training and retention of key employees; integration of businesses acquired; successful and timely completion of product development efforts; and new product introductions by competitors.
Fair Value of Financial Instruments
The Company’s financial instruments consist primarily of cash and cash equivalents, marketable securities, accounts receivable, accounts payable, and other accrued liabilities. The Company regularly reviews its investment portfolio to identify and evaluate investments that have indications of possible impairment. Factors considered in determining whether a loss is temporary include: the length of time and extent to which fair value has been lower than the cost basis; the financial condition, credit quality and near-term prospects of the investee; and whether it is more likely than not that the Company will be required to sell the security prior to any anticipated recovery in fair value. When there is no readily available market data, fair value estimates may be made by the Company, which may not necessarily represent the amounts that could be realized in a current or future sale of these assets.
Revenue Recognition
Revenue from sales of optical modulator drivers and receivers, multi-chip modulators, and other products is recognized when persuasive evidence of a sales arrangement exists, transfer of title occurs, the sales price is fixed or determinable and collection of the resulting receivable is reasonably assured. Provisions are made for warranties at the time revenue is recorded. See Note 13—Commitments and Contingencies for further detail related to the warranty provision.
Customer purchase orders are generally used to determine the existence of an arrangement. Transfer of title and risk of ownership occur based on defined terms in customer purchase orders, and generally pass to the customer upon shipment, at which point goods are delivered to a carrier. There are no formal customer acceptance terms or further obligations, outside of its standard product warranty. The Company assesses whether the sales price is fixed or determinable based on the payment terms associated with the transaction. Collectibility is assessed based primarily on the credit worthiness of the customer as determined through ongoing credit evaluations of the customer’s financial condition, as well as consideration of the customer’s payment history.
Revenue generated from engineering product development projects is recorded in accordance with accounting guidance for contract accounting, generally using the percentage of completion method measured on a cost-incurred basis. Changes in contract performance, contract conditions, and estimated profitability, including those arising from contract penalty provisions and final contract settlements, may result in revisions to costs and revenues and are recognized in the period in which the revisions are determined. The costs incurred under the engineering product development contracts are expensed as incurred and generally are included in research and development expense. As of December 31, 2012, the Company maintained a reserve of $191,000 associated with a change in estimated rates under which it could bill for the work it performed under various government contracts during fiscal 2008 - 2011.
The Company sells some products to distributors at the price listed in its price book for that distributor. The Company's distribution agreements provide for semi-annual stock rotation privileges of 5% of net sales for the previous six-month period. The contractual stock rotation applies only to shipments at the Company's listed book price. At the time of sale the Company records a sales reserve for stock rotations approved by management. The Company offsets the sales reserve against revenues, producing the net revenue amount reported in the consolidated statements of operations. Each month the Company adjusts the sales reserve for the estimated stock rotation privilege anticipated to be utilized by the distributors. When the distributors pay the Company's invoices, they may claim debits stock rotations when appropriate. Once claimed, the Company processes the requests against the prior authorizations and reduces the reserve previously established for that customer.
The revenue the Company records for sales to its distributors is net of estimated provisions for these programs. When determining this net revenue, the Company must make significant judgments and estimates. The Company bases its estimates on historical experience rates, inventory levels in the distribution channel, current trends and other related factors. However, because of the inherent nature of estimates, there is a risk that there could be significant differences between actual amounts and the Company's estimates. The Company's financial condition and operating results depend on its ability to make reliable estimates and the Company believes that such estimates are reasonable. The reserve for stock rotations was $65,000 as of December 31, 2012 and is recorded in other current liabilities on the consolidated balance sheets.
The Company records transaction-based taxes including, but not limited to, sales, use, value added, and excise taxes, on a net basis in its consolidated statements of operations.
Accounts Receivable and Allowance for Doubtful Accounts
Accounts receivable are recorded at the invoiced amount and are not interest bearing. The Company maintains an allowance for doubtful accounts for estimated losses resulting from the inability of its customers to make required payments. The Company makes ongoing assumptions relating to the collectibility of its accounts receivable in its calculation of the allowance for doubtful accounts. In determining the amount of the allowance, the Company makes judgments about the creditworthiness of customers based on ongoing credit evaluations and assesses current economic trends affecting its customers that might impact the level of credit losses in the future and result in different rates of bad debts than previously seen. The Company also considers its historical level of credit losses. At December 31, 2012, the Company’s accounts receivable balance was $5.1 million, which was net of an allowance for doubtful accounts of $337,000. At December 31, 2011, the Company’s accounts receivable balance was $5.6 million, which was net of an allowance for doubtful accounts of $357,000.
Cash and Cash Equivalents
The Company considers all highly liquid investments with an original maturity of 90 days or less at the date of purchase to be cash equivalents. Cash and cash equivalents are maintained at various financial institutions.
Concentration of Credit Risk
Financial instruments that potentially subject the Company to significant concentrations of credit risk consist primarily of cash, cash equivalents, short-term investments and accounts receivable. The Company maintains cash, cash equivalents and short-term investments with various financial institutions that management believes to be of high credit quality. At any time, amounts held at any single financial institution may exceed federally insured limits. The Company believes that the concentration of credit risk in its accounts receivable is substantially mitigated by its credit evaluation process, relatively short collection terms and the high level of credit worthiness of its customers. The Company performs ongoing credit evaluations of its customers’ financial condition and limit the amount of credit extended when deemed necessary but generally requires no collateral.
As of December 31, 2012, one customer accounted for 31% of total accounts receivable. As of December 31, 2011, two customers accounted for 23% and 10% of total accounts receivable.
For the year ended December 31, 2012, two customers accounted for 22% and 12% of total revenue. For the year ended December 31, 2011, one customer accounted for 10% of total revenue.
Concentration of Supply Risk
The Company relies on third parties to manufacture its products, and depends on them for the supply and quality of its products. Quality or performance failures of the Company’s products or changes in its manufacturers’ financial or business condition could disrupt the Company’s ability to supply quality products to its customers and thereby have a material and adverse effect on its business and operating results. Some of the components and technologies used in the Company’s products are purchased and licensed from a single source or a limited number of sources. The loss of any of these suppliers may cause the Company to incur additional transition costs, result in delays in the manufacturing and delivery of its products, or cause it to carry excess or obsolete inventory or redesign its products. The Company relies on a third party for the fulfillment of its customer orders, and the failure of this third party to perform could have an adverse effect upon the Company’s reputation and its ability to distribute its products, which could adversely affect the Company’s business.
Inventories
Inventories are stated at the lower of standard cost determined on a first-in, first-out basis or market (net realizable value). Cost includes labor, material and overhead costs. Determining fair market value of inventories involves numerous judgments, including projecting average selling prices and sales volumes for future periods and costs to complete products in work in process inventories. As a result of this analysis, when fair market values are below costs, the Company records a charge to cost of revenue in advance of when the inventory is scrapped or sold.
The Company evaluates its ending inventories for excess quantities and obsolescence on a quarterly basis. This evaluation includes analysis of historical and forecasted sales levels by product against inventories on-hand. Inventories on-hand in excess of forecasted demand is reviewed by management to determine if a write-down is required. In addition, the Company writes-off inventories that are considered obsolete. Obsolescence is determined from several factors, including competitiveness of product offerings, market conditions and product life cycles when determining obsolescence. Excess and obsolete inventories are charged to cost of revenue and a new, lower-cost basis for that inventory is established.
The Company’s inventories include high-technology parts that may be subject to rapid technological obsolescence and which are sold in a highly competitive industry. If actual product demand or selling prices are less favorable than forecasted amounts, the Company may be required to take additional inventory write-downs.
Property and Equipment
Property and equipment, including leasehold improvements, are recorded at cost and depreciated using the straight-line method over their estimated useful lives, ranging from two to ten years. Leasehold improvements and assets acquired under capital leases are depreciated over the lesser of their estimated useful lives or the remaining lease term of the respective assets. Repairs and maintenance costs are charged to expenses as incurred.
Long-lived Assets
Long-lived assets include equipment, furniture and fixtures, licenses, leasehold improvements, semiconductor masks used in production and intangible assets. When events or changes in circumstances indicate that the carrying amount of long-lived assets may not be recoverable, the Company tests for recoverability by comparing the estimate of undiscounted cash flows to be generated by the assets against the assets’ carrying amount. If the carrying value exceeds the estimated future cash flows, the assets are considered to be impaired. The amount of impairment equals the difference between the carrying amount of the assets and their fair value. Factors the Company considers important that could trigger an impairment review include continued operating losses, significant negative industry trends, significant underutilization of the assets and significant changes in how it plans to use the assets.
During the fourth quarter of 2011, the Company recorded an impairment charge of $373,000 for a long-lived asset which was recorded in cost of revenue.
Intangible assets are amortized on a straight-line basis over their estimated economic lives of three to seven years for existing technology, acquired in business combinations; five to sixteen years for patents acquired in business combinations, based on the term of the patent or the estimated useful life, whichever is shorter; one year for order backlog, acquired in business combinations; ten years for trade name, acquired in business combinations; and three to eight years for customer relationships, acquired in business combinations.
Goodwill
Goodwill is recorded when the purchase price of an acquisition exceeds the fair value of the net purchased tangible and intangible assets acquired and is carried at cost. Goodwill is not amortized, but is reviewed annually for impairment. The Company performs its annual goodwill impairment analysis in the fourth quarter of each year or more frequently if it believes indicators of impairment exist. Factors that it considers important which could trigger an impairment review include the following:
|
|
·
|
significant underperformance relative to historical or projected future operating results;
|
|
|
·
|
significant adverse change in the extent or manner in which a long-lived asset is being used or in its physical condition;
|
|
|
·
|
significant negative industry or economic trends; and
|
|
|
·
|
significant decline in the Company’s market capitalization.
|
The performance of the test involves a two-step process. The first step requires a comparison of the fair value of the reporting unit to its net book value, including goodwill. The fair value of the reporting units is determined based on a weighting of income and market approaches. Under the income approach, the Company calculates the fair value of a reporting unit based on the present value of estimated future cash flows. Under the market approach, the Company estimates the fair value based on market multiples of revenue or earnings for comparable companies. Determining the fair value of a reporting unit is judgmental in nature and involves the use of significant estimates and assumptions. These estimates and assumptions include revenue growth rates and operating margins used to calculate projected future cash flows, risk-adjusted discount rates, and future economic and market conditions and determination of appropriate market comparables. The Company bases these fair value estimates on reasonable assumptions but that are unpredictable and inherently uncertain. Actual future results may differ from those estimates. A potential impairment exists if the fair value of the reporting unit is lower than its net book value. The second step of the process is only performed if a potential impairment exists, and it involves determining the difference between the fair values of the reporting unit’s net assets, other than goodwill, and the fair value of the reporting unit, and, if the difference is less than the net book value of goodwill, an impairment charge is recorded. In the event that the Company determines that the value of goodwill has become impaired, it will record a charge for the amount of impairment during the fiscal quarter in which the determination is made. The Company operates in one reporting unit. The Company conducted its 2012 annual goodwill impairment analysis in the fourth quarter of 2012 and no goodwill impairment was indicated.
Restricted Cash
Restricted cash consists of $151,000 in satisfaction of the letter of credit provisions of the Company’s Bothell, Washington facility lease which has a lease term ending the first quarter of 2014, $56,000 held in an escrow account related to its facility lease in Zurich, Switzerland, for which it is management’s expectation to continue to renew this lease beyond the current year and $75,000 with Silicon Valley Bank to secure its credit card, which increased from $50,000 in 2011. Restricted cash is held in interest-bearing cash accounts and is classified as long term.
Pension Liabilities
The Company maintains a defined benefit pension plan covering minimum requirements according to Swiss law for its Zurich, Switzerland employees. The Company recognizes the funded status of its defined benefit pension plan on its consolidated balance sheets and changes in the funded status are reflected in accumulated other comprehensive income, net of tax, a component of stockholders’ equity.
Net periodic pension costs are calculated based upon a number of actuarial assumptions, including a discount rate for plan obligations, assumed rate of return on pension plan assets and assumed rate of compensation increases for plan employees. All of these assumptions are based upon management’s judgment, considering all known trends and uncertainties. Actual results that differ from these assumptions would impact the future expense recognition and cash funding requirements of its pension plans.
Foreign Currency
The financial position and results of operations of the Company’s foreign subsidiaries are measured using the local currency as their functional currency. Accordingly, all assets and liabilities for these subsidiaries are translated into U.S. dollars at the current exchange rates as of the respective balance sheet date. Revenue and expense items are translated at the average exchange rates prevailing during the period. Cumulative gains and losses from the translation of these subsidiaries’ financial statements are reported as a separate component of accumulated other comprehensive income, net of tax, a component of stockholders’ equity. The Company records foreign currency transaction gains and losses, realized and unrealized, in other income (expense), net in the consolidated statements of operations. The Company recorded approximately $41,000 of net transaction gain in 2012 and $39,000 of net transaction loss in 2011.
Product Warranty
The Company’s products are generally subject to a one year warranty, which provides for the repair, rework or replacement of products (at its option) that fail to perform within stated specification. The Company provides for the estimated cost to repair or replace the product at the time of sale. The warranty accrual is estimated based on historical claims and assumes that it will replace products subject to claims.
Shipping Costs
The Company charges shipping costs to cost of revenue as incurred.
Research and Development Expense
Research and development expenses are expensed as incurred. Research and development costs consist primarily of non-capitalized semiconductor mask expenses, consulting and outside services, non-capitalized tools and equipment, equipment depreciation and employee compensation, which consists of salaries, benefits and stock-based compensation.
Advertising Expense
Advertising costs are expensed as incurred. Advertising expenses, which are recorded in selling, general and administrative expenses, were approximately $66,000 and $20,000 for the years ended December 31, 2012 and 2011, respectively.
Stock-Based Compensation
Stock-based compensation is measured at the date of grant, based on the fair value of the award. For options, the Company amortizes the compensation costs on a straight-line basis over the requisite service period of the option, which is generally the option vesting term of four years. For restricted stock units, the Company amortizes the compensation costs on a straight-line basis over the requisite service period of the restricted stock grant, which is generally the vesting term of one year. The benefits of tax deductions in excess of recognized compensation expense must be reported as a financing cash flow, rather than as an operating cash flow. This may reduce future net cash flows from operations and increase future net financing cash flows. All of the stock compensation is accounted for as an equity instrument.
For restricted stock units, stock-based compensation is based on the fair value of the Company’s common stock at the grant date.
Stock-based compensation expense is measured at grant date, based on the estimated fair value of the awards ultimately expected to vest and is recognized as an expense, on a straight-line basis, over the requisite service period. The Company uses the Black-Scholes option-pricing model to measure the fair value of its stock-based awards utilizing various assumptions with respect to expected holding period, risk-free interest rates, stock price volatility and dividend yield.
Management estimates expected forfeitures and it records the stock compensation expense only for those equity awards expected to vest. When estimating forfeitures, the Company considers voluntary termination behavior as well as an analysis of actual option forfeitures. Forfeitures are required to be estimated at the time of grant and revised if necessary in subsequent periods if actual forfeitures or vesting differ from those estimates. Such revisions could have a material effect on its operating results. The assumptions the Company uses in the valuation model are based on subjective future expectations combined with management judgment. If any of the assumptions used in the Black-Scholes option-pricing model changes significantly, stock-based compensation for future awards may differ materially compared to the awards granted previously.
From time to time the Company issues stock option grants to directors and employees that have a market condition. In such cases stock options will vest only if the average price of its stock is at or exceeds a certain price threshold during a specific, previously defined period of time. To the extent that the market condition is not met, the options do not vest and are cancelled. For options with market condition, the Company cannot use the Black-Scholes option-pricing model; it must use another model. The Company engages a third party valuation firm to support management’s valuation of these options using Monte Carlo simulation techniques that incorporate assumptions as provided by management for the expected holding period, risk-free interest rate, stock price volatility and dividend yield. Compensation expense is recognized over the vesting period. Certain stock options granted on March 17, 2010 were classified as option grants having a market condition.
The Company also issues stock options which have Company specific financial performance criteria. In this case, it makes a determination regarding the probability of the performance criteria being achieved and use a Black-Scholes option-pricing model to value the options incorporating assumptions as provided by management for the expected holding period, risk-free interest rate, stock price volatility and dividend yield. Compensation expense is recognized if it is probable that the performance criteria will be met. Certain stock options granted on October 27, 2010 were classified as option grants having a performance condition. As of December 31, 2012, the Company did not have any performance grants outstanding.
The fair value of restricted stock units (“RSUs”) granted is the product of the number of shares granted and the grant date fair value of the Company’s common stock. RSUs are converted into shares of the Company’s common stock upon vesting on a one-for-one basis. Typically, vesting of RSUs is subject to the employee's continuing service to the Company. RSUs generally vest over a period of 1 year and are expensed ratably on a straight-line basis over their respective vesting period net of estimated forfeitures.
Warrants
Warrants issued as equity awards are recorded based on the estimated fair value of the awards at the grant date. The Company uses the Black-Scholes option-pricing model to measure the fair value of its equity warrant awards utilizing various assumptions with respect to expected holding period, risk-free interest rates, stock price volatility and dividend yield.
Warrants with certain features, including down-round protection, are recorded as liability awards. These warrants are valued using a Monte Carlo simulation which requires various assumptions with respect to expected holding period, risk-free interest rates, stock price volatility and dividend yield. The warrants are recorded as a liability each reporting period, and the change in the fair value of the liability is recorded as other income (expense), net until the warrant is exercised or cancelled.
Net Loss per Share
Basic net loss per share is computed using the weighted average number of common shares outstanding. The number of shares used in the computation of diluted net loss per share is the same as those used for the computation of basic net loss per share as the inclusion of dilutive securities would be anti-dilutive because the Company is in a loss position for the periods presented.
Income Taxes
The provision for income taxes is determined using the asset and liability approach of accounting for income taxes. Under this approach, deferred taxes represent the future tax consequences expected to occur when the reported amounts of assets and liabilities are recovered or paid. The provision for income taxes represents income taxes paid or payable for the current year plus the change in deferred taxes during the year. Deferred taxes result from differences between the financial and tax basis of the Company’s assets and liabilities and are adjusted for changes in tax rates and tax laws when changes are enacted. Valuation allowances are recorded to reduce deferred tax assets when it is more likely than not that a tax benefit will not be realized.
The calculation of tax liabilities involves dealing with uncertainties in the application of complex global tax regulations. The Company recognizes potential liabilities for anticipated tax audit issues in the U.S. and other tax jurisdictions based on its estimate of whether, and the extent to which, additional taxes will be due. If payment of these amounts ultimately proves to be unnecessary, the reversal of the liabilities would result in tax benefits being recognized in the period when it determines the liabilities are no longer necessary. If the estimate of tax liabilities proves to be less than the ultimate assessment, a further charge to expense would result.
Comprehensive Income (Loss)
Comprehensive income (loss) is comprised of two components: net loss and other comprehensive income (loss). Other comprehensive income (loss) refers to revenues, expenses, gains and losses that under U.S. GAAP are recorded as an element of stockholders’ equity, but are excluded from net loss. Accumulated other comprehensive income in the accompanying consolidated balance sheets includes foreign currency translation adjustments arising from the consolidation of the Company’s foreign subsidiaries and its pension liabilities. Comprehensive income (loss) is presented net of income tax and their tax impact is immaterial.
The components of accumulated other comprehensive income (loss) were as follows (in thousands):
|
December 31,
|
||||||||
|
2012
|
2011
|
|||||||
|
Accumulated comprehensive income:
|
||||||||
|
Foreign currency translation adjustment, net of tax
|
$ | 262 | $ | 278 | ||||
|
Change in pension liability in connection with actuarial gain, net of tax
|
36 | 145 | ||||||
|
Total
|
$ | 298 | $ | 423 | ||||
NOTE 2—BALANCE SHEET COMPONENTS
Accounts receivable, net, consisted of the following, as of (in thousands):
|
December 31,
|
||||||||
|
2012
|
2011
|
|||||||
|
Billed accounts receivable
|
$ | 5,137 | $ | 5,503 | ||||
|
Unbilled accounts receivable
|
256 | 479 | ||||||
|
Allowance for doubtful accounts
|
(337 | ) | (357 | ) | ||||
| $ | 5,056 | $ | 5,625 | |||||
Short-term investments consisted of the following, as of (in thousands):
|
|
|
December 31, 2011
|
|
|||||||||||||
|
|
|
Amortized
Cost
|
|
|
Gross Unrealized Gains
|
|
|
Gross Unrealized Losses
|
|
|
Fair Value
|
|
||||
|
|
|
|
|
|
|
|
|
|
|
|
|
|
||||
|
United States Government agency debt
|
|
$
|
400
|
|
|
$
|
-
|
|
|
$
|
-
|
|
|
$
|
400
|
|
|
|
|
$
|
400
|
|
|
$
|
-
|
|
|
$
|
-
|
|
|
$
|
400
|
|
At December 31, 2012, the Company did not have any short-term or long-term investments. At December 31, 2011, the Company had $400,000 of short-term investments with maturities of less than one year and no long-term investments. Realized gains and losses were insignificant for the years ended December 31, 2012 and 2011.
Property and equipment, net consisted of the following, as of (in thousands, except depreciable life):
|
Life
|
December 31,
|
|||||||||||
|
(In years)
|
2012
|
2011
|
||||||||||
|
Network and laboratory equipment
|
3 – 5 | $ | 10,654 | $ | 8,839 | |||||||
|
Computer software and equipment
|
2 – 3 | 3,747 | 3,125 | |||||||||
|
Furniture and fixtures
|
3 –10 | 176 | 169 | |||||||||
|
Office equipment
|
3 – 5 | 106 | 106 | |||||||||
|
Leasehold improvements
|
1 – 5 | 378 | 179 | |||||||||
|
Construction-in-progress
|
— | 236 | 389 | |||||||||
| 15,297 | 12,807 | |||||||||||
|
Accumulated depreciation and amortization
|
(10,718 | ) | (8,319 | ) | ||||||||
|
Property and equipment, net
|
$ | 4,579 | $ | 4,488 | ||||||||
Depreciation and amortization expense related to property and equipment was $2.7 million and $2.3 million for the years ended December 31, 2012 and 2011, respectively.
In addition to the property and equipment above, the Company has prepaid licenses. For the years ended December 31, 2012 and 2011, amortization related to these prepaid licenses was $388,000 and $491,000, respectively.
Inventories consisted of the following, as of (in thousands):
|
December 31,
|
||||||||
|
2012
|
2011
|
|||||||
|
Raw materials
|
$ | 2,290 | $ | 1,334 | ||||
|
Work in process
|
687 | 237 | ||||||
|
Finished goods
|
1,134 | 649 | ||||||
| $ | 4,111 | $ | 2,220 | |||||
Other current liabilities consisted of the following, as of (in thousands):
|
December 31, 2012
|
December 31, 2011
|
|||||||
|
Amounts billed to the U.S. government in excess of approved rates
|
$ | 191 | $ | 1,154 | ||||
|
Warranty liability
|
612 | 296 | ||||||
|
Customer deposits
|
432 | 523 | ||||||
|
Capital lease obligation, current portion
|
324 | 436 | ||||||
|
Restructuring liabilities, current portion
|
168 | 458 | ||||||
|
Other
|
1,353 | 1,983 | ||||||
| $ | 3,080 | $ | 4,850 | |||||
NOTE 3—FAIR VALUE MEASUREMENTS
The following table summarizes the Company’s financial assets and liabilities measured at fair value on a recurring basis as of December 31, 2012 and 2011 (in thousands):
| Fair Value Measurements Using | ||||||||||||||||
|
Carrying Value
|
Quoted
Prices in
Active
Markets for
Identical
Assets
(Level 1)
|
Significant Other
Observable Inputs
(Level 2)
|
Significant
Unobservable Inputs
(Level 3)
|
|||||||||||||
|
December 31, 2012:
|
||||||||||||||||
|
Assets:
|
||||||||||||||||
|
Cash equivalents:
|
||||||||||||||||
|
Money market funds
|
$ | 2,856 | $ | 2,856 | $ | - | $ | - | ||||||||
| $ | 2,856 | $ | 2,856 | $ | - | $ | - | |||||||||
|
Current liabilities:
|
||||||||||||||||
|
Liability warrants
|
$ | 24 | $ | - | $ | - | $ | 24 | ||||||||
|
December 31, 2011:
|
||||||||||||||||
|
Assets:
|
||||||||||||||||
|
Cash equivalents:
|
||||||||||||||||
|
Money market funds
|
$ | 9,199 | $ | 9,199 | $ | - | $ | - | ||||||||
|
Short-term investments:
|
||||||||||||||||
|
United States government agencies
|
400 | - | 400 | - | ||||||||||||
| $ | 9,599 | $ | 9,199 | $ | 400 | $ | - | |||||||||
|
Current liabilities:
|
||||||||||||||||
|
Liability warrants
|
$ | 21 | $ | - | $ | - | $ | 21 | ||||||||
The Company’s financial assets and liabilities are valued using market prices on active markets (“Level 1”), less active markets (“Level 2”) and unobservable markets (“Level 3”). Level 1 instrument valuations are obtained from real-time quotes for transactions in active exchange markets involving identical assets. Level 2 instrument valuations are obtained from readily-available pricing sources for comparable instruments. Level 3 instruments are valued using unobservable market values in which there is little or no market data, and which require the Company to apply judgment to determine the fair value.
As of December 31, 2012 and 2011, the Company did not have any significant transfers of investments between Level 1, Level 2, and Level 3.
The amounts reported as cash and cash equivalents, accounts receivable, accounts payable, accrued compensation and other current liabilities approximate fair value due to their short-term maturities. The fair value for the Company’s investments in marketable debt securities is estimated based on quoted market prices. The carrying value of the Company’s line of credit and capital lease obligations approximates fair value and is based upon borrowing rates currently available to the Company for loans and capital leases with similar terms.
Liability Warrants
In connection with a November 2009 loan and security agreement with Bridge Bank and a January 2010 secured line of credit facility with Agility Capital, the Company issued warrants to both Bridge Bank and Agility Capital. Certain provisions in the warrant agreements provided for down-round protection if the Company raised equity capital at a per share price which was less than the per share price of the warrants. Such down-round protection also requires the Company to classify the value of the warrants as a liability on the issuance date and then record changes in the fair value through the consolidated statements of operations for each reporting period until the warrants are either exercised or cancelled. The fair value of the liability is recalculated and adjusted each quarter with the differences being charged to other income (expense), net on the consolidated statements of operations. The fair value of these warrants was determined using a Monte Carlo simulation, which requires the use of significant unobservable market values. As a result, these warrants are classified as Level 3 financial instruments. On July 7, 2010, the Company raised additional equity through an offering of 2,760,000 shares at $1.75 per share, thus triggering the down-round protection and adjustment of the number of warrants in each warrant agreement.
The fair value of the warrants was estimated using the following assumptions:
|
As of December 31, 2012
|
As of December 31, 2011
|
|||||||
|
Stock price
|
$ | 1.92 | $ | 1.80 | ||||
|
Strike price
|
$ | 3.32 | $ | 3.32 | ||||
|
Expected life
|
4.55 years
|
5.55 years
|
||||||
|
Risk-free interest rate
|
0.62 | % | 1.21 | % | ||||
|
Volatility
|
85 | % | 75 | % | ||||
|
Fair value per share
|
$ | 1.03 | $ | 0.93 | ||||
The following table summarizes the warrants subject to liability accounting as of December 31, 2012 and 2011 (in thousands, except share and per share amounts) (see also Note 7 – Stockholders' Equity):
|
Year Ended December 31, 2012
|
Year Ended December 31, 2011
|
||||||||||||||||||||||||||||||||||||||
|
Holder
|
Original
Warrants
|
Adjusted
Warrants
|
Grant
Date
|
Expiration
Date
|
Price per Share
|
Fair Value
December
31, 2012
|
Fair Value
December
31, 2011
|
Exercise
of
Warrants
|
Change in
Fair
Value
|
Exercise
of
Warrants
|
Change in
Fair
Value
|
Related Agreement
|
|||||||||||||||||||||||||||
|
Bridge Bank
|
20,000 | 22,671 |
4/7/2010
|
7/7/2017
|
$ | 3.32 | $ | 24 | $ | 21 | - | $ | 3 | - | $ | (21 | ) |
Credit Agreement
|
|||||||||||||||||||||
|
Bridge Bank
|
59,773 | 114,286 |
11/12/2009
|
11/12/2016
|
$ | 1.75 | - | - | - | - | (240,000 | ) | - |
Credit Agreement
|
|||||||||||||||||||||||||
|
Agility Capital
|
71,429 | 85,714 |
1/29/2010
|
1/29/2017
|
$ | 1.75 | - | - | - | - | (180,000 | ) | - |
Secured Credit Facility
|
|||||||||||||||||||||||||
|
Agility Capital
|
25,000 | 28,571 |
4/5/2010
|
4/5/2017
|
$ | 1.75 | - | - | - | - | (60,000 | ) | - |
Secured Credit Facility
|
|||||||||||||||||||||||||
| 176,202 | 251,242 | $ | 24 | $ | 21 | - | $ | 3 | (480,000 | ) | $ | (21 | ) | ||||||||||||||||||||||||||
The change in the fair value of level 3 liabilities is as follows (in thousands):
|
Fair value at December 31, 2010
|
$ | 522 | ||
|
Exercise of warrants
|
(480 | ) | ||
|
Change in fair value
|
(21 | ) | ||
|
Fair value at December 31, 2011
|
21 | |||
|
Exercise of warrants
|
- | |||
|
Change in fair value
|
3 | |||
|
Fair value at December 31, 2012
|
$ | 24 |
The warrant liability is included in other current liabilities on the consolidated balance sheets.
Intangible assets consist of the following (in thousands):
|
As of the year ended December 31, 2012
|
As of the year ended December 31, 2011
|
|||||||||||||||||||||||
|
Gross
|
Accumulated Amortization
|
Net
|
Gross
|
Accumulated Amortization
|
Net
|
|||||||||||||||||||
|
Customer relationships
|
$ | 3,277 | $ | (1,274 | ) | $ | 2,003 | $ | 3,277 | $ | (852 | ) | $ | 2,425 | ||||||||||
|
Existing technology
|
3,783 | (2,065 | ) | 1,718 | 3,783 | (1,657 | ) | 2,126 | ||||||||||||||||
|
Order backlog
|
732 | (732 | ) | - | 732 | (732 | ) | - | ||||||||||||||||
|
Patents
|
457 | (321 | ) | 136 | 457 | (239 | ) | 218 | ||||||||||||||||
|
Trade name
|
659 | (246 | ) | 413 | 659 | (147 | ) | 512 | ||||||||||||||||
|
Total
|
$ | 8,908 | $ | (4,638 | ) | $ | 4,270 | $ | 8,908 | $ | (3,627 | ) | $ | 5,281 | ||||||||||
The amounts shown above include items that GigOptix acquired in its purchase of Endwave in June 2011. The acquired intangibles from the purchase of Endwave are comprised of the following (in thousands):
|
|
Amount
|
|
|
Life, in Years
|
|
|||
|
Customer relationships
|
|
$
|
720
|
|
|
|
6
|
|
|
Existing technology
|
|
|
1,455
|
|
|
|
6
|
|
|
Order backlog
|
|
|
273
|
|
|
|
0.3
|
|
|
Trade name
|
|
|
83
|
|
|
|
2
|
|
|
Total
|
|
$
|
2,531
|
|
|
|
|
|
During the year ended December 31, 2012 and 2011, amortization of intangible assets was as follows (in thousands):
|
December 31, 2012
|
December 31, 2011
|
|||||||
|
Cost of revenue
|
$ | 489 | $ | 655 | ||||
|
Selling, general and administrative expense
|
522 | 456 | ||||||
| $ | 1,011 | $ | 1,111 | |||||
Estimated future amortization expense related to intangible assets as of December 31, 2012 is as follows (in thousands):
|
Years ending December 31,
|
|
|||
|
2013
|
$ | 983 | ||
|
2014
|
893 | |||
|
2015
|
893 | |||
|
2016
|
869 | |||
|
2017
|
632 | |||
|
Total
|
$ | 4,270 | ||
The Company performs a review of the carrying value of its intangible assets, if circumstances warrant. In its review, it compares the gross, undiscounted cash flows expected to be generated by the underlying assets against the carrying value of those assets. To the extent such cash flows do not exceed the carrying value of the underlying asset; it will record an impairment charge. During the fourth quarter of 2012, the Company performed an impairment analysis and did not find any indicators of impairment for its intangibles.
As of December, 2012, the Company had $9.9 million of goodwill in connection with the acquisitions of ChipX and Endwave. In addition to its annual review, the Company also performs a review of the carrying value of its intangible assets if the Company believes that indicators of impairment exist. During the fourth quarter of 2012, there were no factors which indicated impairment. The Company did not record impairment on any intangibles, including goodwill, for the year ended December 31, 2012. In addition, the Company did not record an impairment of goodwill for the year ended December 31, 2011.
NOTE 5—BUSINESS COMBINATIONS
Acquisition of Endwave Corporation
On June 17, 2011, the Company completed its acquisition of Endwave Corporation (the “Merger”). With the acquisition of Endwave, GigOptix obtained $18.8 million of cash and short-term investments, and a pipeline of new products that are currently in development. Pursuant to the Merger Agreement the Merger Sub merged with and into Endwave, the separate corporate existence of Merger Sub ceased and Endwave became the surviving corporation and a wholly owned subsidiary of GigOptix.
Upon the consummation of the Merger, each outstanding share of Endwave common stock converted into the right to receive approximately 0.908 shares of GigOptix common stock. 9,106,821 shares of GigOptix common stock were issued to the holders of Endwave common stock and restricted stock units, and 21,681 shares of GigOptix common stock were issued to the holders of options to purchase Endwave common stock with an exercise price less than $2.08, the Endwave closing price as reported on the Nasdaq Global Market on June 16, 2011 (the trading day immediately prior to the effective time of the Merger (the “Effective Date”)). GigOptix issued 9,128,502 shares of its common stock in the Merger, it represented approximately 42.45% of GigOptix’ outstanding common stock. The foregoing amounts take into account reductions in the number of shares issued to employees and directors of Endwave for any applicable withholding requirements for federal, state and other taxes. Endwave stockholders will receive cash for any fractional share of GigOptix common stock that they would otherwise receive in the Merger.
The transaction was accounted for under the purchase method of accounting and, accordingly, the results of operations are included in the accompanying consolidated statement of operations subsequent to June 17, 2011.
The net tangible assets acquired and liabilities assumed in the acquisition were recorded at fair value. The Company determined the valuation of the identifiable intangible assets using future revenue assumptions and through established valuation techniques.
The fair values of identifiable intangible assets related to customer relationships, order backlog, existing technology and trade name were determined under the income approach. The customer relationships were valued using the excess earnings and cost savings methods under the income approach. The order backlog was valued using the excess earnings method under the income approach. The existing technology and trade name were valued using the relief from royalty method under the income approach. The fair value of the intangibles is management’s best estimate.
Goodwill represents the excess of the purchase price over the fair value of the net tangible and identifiable intangible assets acquired and represents the future economic benefits arising from other assets acquired that could not be individually identified and separately recognized. The goodwill arising from the transaction with Endwave primarily consisted of the synergies expected from the merger with Endwave.
The purchase consideration for the merger of approximately $24.2 million consisted of the fair value of 9,128,502 shares of GigOptix common stock issued to Endwave’s stockholders, at a per share price of $2.65, which reflects the closing price of the Company’s common stock as of June 17, 2011.
The total purchase price of $24.2 million was allocated to the tangible and identifiable intangible assets acquired and liabilities assumed based on their estimated fair values at the date of acquisition as follows (in thousands):
|
Tangible assets acquired:
|
|
|
|
|
|
Cash and cash equivalents
|
|
$
|
8,824
|
|
|
Short-term investments
|
|
|
9,946
|
|
|
Accounts receivable
|
|
|
334
|
|
|
Inventory
|
|
|
1,228
|
|
|
Other current assets
|
|
|
159
|
|
|
Property, plant and equipment
|
|
|
967
|
|
|
Other assets
|
|
|
73
|
|
|
Liabilities assumed:
|
|
|
|
|
|
Accounts payable
|
|
|
(702
|
)
|
|
Accrued compensation
|
|
|
(415
|
)
|
|
Accrued warranty
|
|
|
(496
|
)
|
|
Accrued restructuring
|
|
|
(468
|
)
|
|
Other current liabilities
|
|
|
(120
|
)
|
|
Other long-term liabilities
|
|
|
(124
|
)
|
|
|
|
|
|
|
|
Identifiable intangible assets acquired:
|
|
|
|
|
|
Customer relationships
|
|
|
720
|
|
|
Customer backlog
|
|
|
273
|
|
|
Developed technology
|
|
|
1,455
|
|
|
Trade name
|
|
|
83
|
|
|
Goodwill acquired:
|
|
|
|
|
|
Goodwill
|
|
|
2,453
|
|
|
Total purchase price
|
|
$
|
24,190
|
|
Pro forma financial information (unaudited)
The following table presents the unaudited pro forma financial information for the combined entity of GigOptix and Endwave, as if the acquisition had occurred at the beginning of fiscal 2011 after giving effect to certain purchase accounting adjustments (in thousands, except per share amounts):
|
Years ended December 31,
|
||||
|
2011
|
||||
|
Net revenue
|
$ | 34,682 | ||
|
Net loss
|
$ | (24,720 | ) | |
|
Net loss per share - basic and diluted
|
$ | (1.43 | ) | |
The proforma net loss and net loss per share for the year ended December 31, 2011 include nonrecurring amounts of $3.7 million for restructuring and $2.0 million for merger-related expenses.
NOTE 6—CREDIT FACILITIES
On December 9, 2011, the Company entered into an amended and restated loan and security agreement (“Loan Agreement”) with Silicon Valley Bank (“SVB”). Pursuant to the Loan Agreement, the Company is entitled to borrow from SVB up to $6.0 million, based on 80% of eligible accounts receivable subject to limits based on the Company’s eligible accounts as determined by SVB. Interest on extensions of credit is equal to the prime rate of Wall Street Journal (“WSJ”) Prime, plus 0.75%, with a minimum interest rate of 4.00%. The Loan Agreement will expire on December 9, 2013.
The Loan Agreement with SVB is secured by all of the Company’s assets, including all accounts, equipment, inventory, receivables, and general intangibles. The Loan Agreement contains certain restrictive covenants that will impose significant operating and financial restrictions on its operations, including, but not limited to restrictions that limit its ability to:
|
|
·
|
Sell, lease, or otherwise transfer, or permit any of its subsidiaries to sell, lease or otherwise transfer, all or any part of its business or property, except in the ordinary course of business or in connection with certain indebtedness or investments permitted under the amended and restated loan agreement;
|
|
|
·
|
Merge or consolidate, or permit any of its subsidiaries to merge or consolidate, with or into any other business organization, or acquire, or permit any of its subsidiaries to acquire, all or substantially all of the capital stock or property of another person;
|
|
|
·
|
Create, incur, assume or be liable for any indebtedness, other than certain indebtedness permitted under the amended and restated loan and security agreement;
|
|
|
·
|
Pay any dividends or make any distribution or payment on, or redeem, retire, or repurchase, any capital stock; and
|
|
|
·
|
Make any investment, other than certain investments permitted under the amended and restated loan and security agreement.
|
The Loan Agreement contained a covenant that required that on the last day of every month, the ratio of the Company’s cash, cash equivalents and accounts receivable (together, “Quick Assets”) to the Company’s current liabilities which matured within the following year (including obligations to SVB) (“Current Liabilities”), be 1.5 to 1.00. As of July 1, 2012, the Company was in violation of this covenant. This violation was cured by the July 3, 2012 repayment of the amount borrowed from SVB, and on August 23, 2012, the Company entered into a Default Waiver and First Amendment to the Loan Agreement with SVB in which SVB agreed to waive the July 1, 2012, default by the Company for violation of the covenant for the measurement period ended June 30, 2012 and which amended the Loan Agreement as follows: For measuring periods from July 1, 2012, to December 31, 2012, the covenant for the Adjusted Quick Ratio (defined as the ratio of Quick Assets to Current Liabilities, but excluding up to $1,200,000 of accrued liabilities) was lowered to 1.35 to 1.00 (from the previous 1.50 to 1.00 prior to the amendment with no exclusion for accrued liabilities). For measuring periods after January 1, 2013, the Adjusted Quick Ratio is 1.50 to 1.00. As of December 31, 2012, the Company was in compliance with its covenants.
The amount outstanding on the line of credit as of December 31, 2012 was $3.6 million. As of December 31, 2012, the Company had $2.4 million unused under its line of credit. On January 2, 2013, the Company repaid the entire $3.6 million to SVB.
NOTE 7—STOCKHOLDERS’ EQUITY
Modified Dutch Auction Tender Offer
On March 23, 2012, the Company announced the commencement of a modified Dutch auction tender offer to purchase up to $2.0 million in value of the Company’s common stock, $0.001 par value per share, at a price not greater than $3.10 nor less than $2.85 per share.
On May 22, 2012, the Company completed its modified Dutch auction tender offer and repurchased 701,754 shares of its common stock, at a price of $2.85 per share and at a total cost of $2.2 million, which included $209,000 for investment banking, registration and other transaction costs. The repurchased shares are included as treasury shares in the consolidated balance sheet as of December 31, 2012.
Common and Preferred Stock
In December 2008, the Company’s stockholders approved an amendment to the Certificate of Incorporation to authorize 50,000,000 shares of common stock of par value $0.001. In addition, the Company is authorized to issue 1,000,000 shares of preferred stock of $0.001 par value of which 300,000 shares have been designated Series A Junior Preferred Stock with powers, preferences and rights as set forth in the certificate of designation dated December 16, 2011; the remainder of the shares of preferred stock are undesignated, for which the Board of Directors is authorized to fix the designation, powers, preferences and rights. As of December 31, 2012 and 2011, there were no shares of preferred stock issued or outstanding.
On December 16, 2011 (the “Adoption Date”), the Company adopted a rights agreement that may have the effect of deterring, delaying, or preventing a change in control. Under the rights plan, the Company issued a dividend of one preferred share purchase right for each share of common stock held by stockholders of record as of January 6, 2012, and the Company will issue one preferred stock purchase right to each share of common stock issued between January 6, 2012 and the earlier of either the rights’ exercisability or the expiration of the rights agreement. Each right entitles stockholders to purchase one one-thousandth of the Company’s Series A Junior Preferred Stock.
In general, the exercisability of the rights to purchase preferred stock will be triggered if any person or group, including persons knowingly acting in concert to affect the control of the Company, is or becomes a beneficial owner of 10% or more of the outstanding shares of the Company’s common stock after the Adoption Date. Stockholders or beneficial ownership groups who owned 10% or more of the outstanding shares of common stock of the Company on or before the Adoption Date will not trigger the preferred share purchase rights unless they acquire an additional 1% or more of the outstanding shares of the Company’s common stock. Each right entitles a holder with the right upon exercise to purchase one one-thousandth of a share of preferred stock at an exercise price that is currently set at $8.50 per right, subject to purchase price adjustments as set forth in the rights agreement. Each share of preferred stock has voting rights equal to one thousand shares of common stock. In the event that exercisability of the rights is triggered, each right held by an acquiring person or group would become void. As a result, upon triggering of exercisability of the rights, there would be significant dilution in the ownership interest of the acquiring person or group, making it difficult or unattractive for the acquiring person or group to pursue an acquisition of the Company. These rights expire in December of 2014, unless earlier redeemed or exchanged by the Company.
During the third quarter of fiscal 2010 the Company raised equity by selling an additional 2,760,000 shares to the public at a per share price of $1.75 resulting in gross proceeds of $4.8 million. During the 2010 stock offering, the Company issued additional warrants to purchase common stock due to the anti-dilution provisions for the warrants that had been previously issued. For the 59,773 warrants originally issued to Bridge Bank, due to the anti-dilution provision, an additional 54,513 warrants were issued for a total of 114,286 warrants with an average exercise price of $1.75. On April 7, 2011, all of those warrants were exercised for 48,496 shares of common stock. For the 20,000 warrants originally issued to Bridge Bank, due to the anti-dilution provision, an additional 2,671 warrants were issued for a total of 22,671 warrants with an average exercise price of $3.22. As of December 31, 2012 and 2011, the 22,671 warrants were still outstanding.
During the second quarter of fiscal 2011 GigOptix issued a total of 9,128,502 shares of its common stock in connection with the acquisition of Endwave.
Warrants
As of December 31, 2012, the Company had a total of 1,810,595 warrants to purchase common stock outstanding under all warrant arrangements. During 2012, 137,500 warrants were exercised that resulted in the issuance of 14,158 shares of common stock. Many of the warrants have anti-dilution provisions which adjust the number of warrants available to the holder such as, but not limited to, stock dividends, stock splits, and certain reclassifications, exchanges, combinations or substitutions. These provisions are specific to each warrant agreement.
Under the terms of the Lumera Merger Agreement, upon completion of the merger with Lumera, existing members of GigOptix LLC became the owners of approximately 50% of the outstanding securities, including equity awards and warrants, of the Company. In December 2008, in connection with maintaining the 50% stock ownership, the Company issued warrants to purchase 79,800 shares of common stock to our executives. The warrants were immediately exercisable at the date of grant at an exercise price of $6.08 per share. The estimated fair value of these warrants was approximately $39,000, determined at the date of grant, using the following assumptions: risk free interest rate of 1.55%, volatility of 75%, contractual life of five years, and dividend yield of zero. The fair value of these warrants was expensed in fiscal year 2008. At December 31, 2012, all of these warrants remained outstanding. In addition, the Company issued warrants to purchase 660,473 shares of common stock to one of the members of GigOptix LLC, Stellar Technologies LLC, as follows: 51,278 shares at $17.54 per share; 55,050 shares at $29.27 per share; 128,736 shares at $39.20 per share; 16,391 shares at $70.47 per share; 181,318 shares at $59.92 per share; 22,500 shares at $24.00 per share; and 205,200 shares at $6.08 per share. Such warrants were immediately exercisable at the date of grant and without any exchange of consideration. These warrants issued to Stellar Technologies LLC became property of the DBSI bankruptcy estate in conjunction with the bankruptcy of the parent of Stellar Technologies LLC, and, as discussed below, were all cancelled on April 8, 2011 in exchange for two new warrants for a total of 1 million shares of common stock.
In December 2008, the Company issued 361,866 shares of common stock and 217,120 warrants to purchase common stock to a private investor for consideration of $1.0 million. The warrants were immediately exercisable at the date of grant at an exercise price of $4.87 per share, subject to adjustment upon certain events. The warrants expired on December 4, 2011. The estimated fair value of the warrants was approximately $69,000, determined as the date of purchase, using the following assumptions: risk free interest rate of 1.11%, volatility of 75%, contractual life of three years, and dividend yield of zero. The Company assessed the classification of the warrants in accordance with accounting guidance on derivative financial instruments, and determined that, due to their terms, they qualified for equity classification.
In November 2009, the Company issued 25,000 warrants to purchase common stock to an investor relations advisor, Alliance Advisors LLC, with an exercise price of $1.75 per share. The warrants have a five – year life from the date of issuance. The estimated fair value of these warrants was approximately $48,000, determined at the date of grant, using the following assumptions: risk free interest rate of 1.55%, volatility of 75%, contractual life of five years, and dividend yield of zero. The fair value of these warrants was expensed within sales, general and administrative expense in fiscal year 2009. As of December 31, 2012, all of these warrants remained outstanding.
In December 2009, the Company completed a private equity offering (the “Offering”) of units pursuant to securities purchase agreements by and between the Company and the purchasers listed therein. Pursuant to the Offering, the Company issued a total of 392,500 shares of common stock, $0.001 par value per share and 392,500 warrants to purchase shares of common stock at an exercise price of $2.50 per share, exercisable commencing six months from the closing date of the Offering and terminating four years from the closing date of the Offering. The total gross proceeds the Company received from this Offering were $785,000. 162,500 shares and 162,500 warrants purchased by certain investors in this Offering were granted piggyback registration rights and preemptive rights with respect to certain future offerings of equity securities by the Company. These preemptive rights terminate in the event the Company conducts a follow-on public offering, which occurred on July 1, 2010, and the shares underlying the securities were registered on a Registration Statement on Form S-1 declared effective by the Securities and Exchange Commission on July 2, 2010. In addition, the Company incurred legal expenses of $19,000 and compensated Sandgrain Securities Inc., as placement agent (the “Placement Agent”), for assisting in the sale of the units by paying them commissions in the amount of $26,000, and issuing them 13,000 shares of common stock and warrants to purchase 13,000 shares of the Company’s common stock exercisable at $2.50 per share, exercisable commencing six months from the closing date of the Offering and terminating four years from the closing date of the Offering. The securities issued to the Placement Agent also have piggyback registration rights and preemptive rights with respect to certain future offerings of equity securities by the Company. These preemptive rights terminate in the event the Company conducts a follow-on public offering, which occurred on July 1, 2010, and the shares underlying the securities were registered on a Registration Statement on Form S-1 declared effective by the Securities and Exchange Commission on July 2, 2010. During 2012, 137,500 of these warrants were exercised that resulted in 14,158 shares of common stock issued. As of December 31, 2012, 246,500 of these warrants remained outstanding.
In connection with obtaining a line of credit in November 2009 as described in Note 6—Credit Facilities, the Company issued warrants to purchase 59,773 shares of its common stock with an exercise price of $3.35 per share. In addition, as partial consideration for the waiver of certain events of default that arose under the line of credit, the Company issued a warrant dated April 7, 2010 to purchase 20,000 shares of the Company’s common stock with an exercise price of $3.65 per share. These warrants have a seven-year life from the date of issuance, and, as of December 31, 2012, 22,671 of these warrants remained outstanding. The fair value of the warrants issued was determined using a Monte Carlo simulation which requires the use of significant unobservable inputs to generate the fair value. As a result, these warrants are classified as level 3 financial instruments.
In connection with obtaining a line of credit that was terminated in 2009, the Company issued 4,125 warrants to purchase common stock with an exercise price of $0.73 per share. The warrants have a ten-year life from the date of issuance. As of December 31, 2012, these warrants were outstanding. The fair value of the warrants issued was insignificant.
In connection with the merger with Lumera, the Company issued warrants to purchase approximately 488,818 shares of common stock with exercise price range from $6.08 to $70.40. The estimated fair value of the warrants was determined as of December 9, 2008, the date the merger was completed, using the following assumptions: risk free interest rate of 1.61%, volatility of 75%, contractual life of five years, and dividend yield of zero. The fair value of the warrants was $173,000 and was included in the Lumera purchase price consideration. As of December 31, 2012, 307,499 of these warrants remained outstanding.
On April 23, 2010, in connection with a loan and security agreement with SVB, the Company granted Silicon Valley Bank (i) a warrant to purchase 125,000 shares of its common stock at an exercise price equal to $4.00 per share (the "Warrant"), and (ii) a warrant to purchase a second tranche of up to 100,000 shares of its common stock which shall vest 15,000 shares per month incrementally beginning September 1, 2010 (although the last monthly incremental vesting amount shall be 10,000 shares) at an exercise price equal to the closing market price on each date of vesting (the "Second Tranche Warrant"). In the event that either the Company closes an equity investment of at least $4.0 million or the Company has been EBITDA positive for the preceding three months, then vesting shall cease, and all unvested shares under the Second Tranche Warrant shall lapse. In July 2010, the Company satisfied the requirements of closing an equity investment of at least $4.0 million and the Second Tranche Warrant expired. The Warrant includes anti-dilution provisions and "piggy-back" registration rights permitting registration in a future public offering by the Company. The shares underlying the Warrant were registered on a Registration Statement on Form S-1 declared effective by the Securities and Exchange Commission on July 2, 2010. The Warrant may either be (i) converted, on a cashless, net settlement basis, based on the fair market value as determined pursuant to the terms of the Warrant, or (ii) exercised by delivering a duly executed notice of exercise. The Warrant has a term of seven years; the fair value of the Warrant has been determined using a Black-Scholes option-pricing model. The Warrant has a fair value of $357,000 and is being amortized over a two year period. The Company recorded expense of $50,000 and $190,000 during the years ended December 31, 2012 and 2011. The Warrant was fully amortized as of December 31, 2012. 125,000 of these warrants remained outstanding, as of December 31, 2012.
On April 8, 2011, the Company and the trustees for the DBSI Estate Litigation Trust and the DBSI Liquidating Trust (together “DBSI”) reached an agreement to settle a claim by DBSI against the Company. As part of the settlement, the Company in April 2011 issued two warrants for a total of 1 million shares of its common stock, and DBSI surrendered to the Company for cancellation all of DBSI’s previously outstanding warrants to purchase 660,473 shares of the Company’s common stock. These new warrants became exercisable on October 8, 2011. One of the two new warrants, for 500,000 shares of common stock, has a term of three years and an exercise price of $2.60 per share, and the other warrant, also for 500,000 shares of common stock, has a term of four years and an exercise price of $3.00 per share. The new warrants may be exercised on a cashless exercise basis. During 2011, the Company recognized $1.1 million of expense in connection with the issuance of these warrants. As of December 31, 2012, a total of 1,000,000 warrants to purchase common stock were outstanding related to the DBSI settlement.
Equity Incentive Plan
As of December 31, 2012 and 2011, there were 10,100,429 options and 8,495,725 options outstanding under all stock option plans. As of December 31, 2012, there were 199,005 restricted stock units outstanding under the 2008 Equity Incentive Plan. The Company did not grant any restricted stock units during 2011.
2008 Equity Incentive Plan
In December 2008, the Company adopted the 2008 Equity Incentive Plan (the “2008 Plan”) for directors, employees, consultants and advisors to the Company or its affiliates. Under the 2008 Plan, 2,500,000 shares of common stock were reserved for issuance upon the completion of a merger with Lumera Corporation (“Lumera”) on December 9, 2008. On January 1 of each year, starting in 2009, the aggregate number of shares reserved for issuance under the 2008 Plan increase automatically by the lesser of (i) 5% of the number of shares of common stock outstanding as of the Company’s immediately preceding fiscal year, or (ii) a number of shares determined by the Board of Directors. The maximum number of shares of common stock to be granted is up to 21,000,000 shares. Forfeited options or awards generally become available for future awards. As of December 31, 2012, the stockholders had approved 13,910,965 shares for future issuance. On January 1, 2012, there was an automatic increase of 1,077,286 shares. As of December 31, 2012, 9,807,431 options to purchase common stock and restricted stock units were outstanding and 3,085,195 shares are authorized for future issuance under the 2008 equity incentive plan.
Under the 2008 Plan, the exercise price of a stock option is at least 100% of the stock’s fair market value on the date of grant, and if an ISO is granted to a 10% stockholder at least 110% of the stock’s fair market value on the date of grant. Vesting periods for awards are recommended by the CEO and generally provide for stock options to vest over a four-year period, with a one year vesting cliff of 25%, and have a maximum life of ten years from the date of grant. The Company has also issued restricted stock units which generally vest over a one-year period.
2007 Equity Incentive Plan
In August 2007, GigOptix LLC adopted the GigOptix LLC Equity Incentive Plan (the "2007 Plan"). The 2007 Plan provided for grants of options to purchase membership units, membership awards and restricted membership units to employees, officers and non-employee directors, and upon the completion of the merger with Lumera were converted into grants of up to 632,500 shares of stock. Vesting periods are determined by the Board of Directors and generally provide for stock options to vest over a four-year period and expire ten years from date of grant. Vesting for certain shares of restricted stock is contingent upon both service and performance criteria. The 2007 Plan was terminated upon the completion of merger with Lumera on December 9, 2008 and the remaining 864 stock options not granted under the 2007 Plan were cancelled. No shares of the Company’s common stock remain available for issuance of new grants under the 2007 Plan other than for satisfying exercises of stock options granted under this plan prior to its termination. As of December 31, 2012, no shares of common stock have been reserved for issuance for new grants under the 2007 Plan and options to purchase a total of 415,870 shares of common stock and 4,125 warrants to purchase common stock were outstanding.
Lumera 2000 and 2004 Stock Option Plan
In December 2008, in connection with the merger with Lumera, the Company assumed the existing Lumera 2000 Equity Incentive Plan and the Lumera 2004 Stock Option Plan (the “Lumera Plan”). All unvested options granted under the Lumera Plan were assumed by the Company as part of the merger. All contractual terms of the assumed options remain the same, except for the converted number of shares and exercise price based on merger conversion ratio of 0.125. As of December 31, 2012, no additional options can be granted under the Lumera Plan, and options to purchase a total of 76,133 shares of common stock were outstanding.
Stock-based Compensation Expense
The following table summarizes the Company’s stock-based compensation expense for fiscal years 2012 and 2011 (in thousands):
|
Years ended December 31,
|
||||||||
|
2012
|
2011
|
|||||||
|
Cost of revenue
|
$ | 230 | $ | 50 | ||||
|
Research and development expense
|
1,579 | 1,000 | ||||||
|
Selling, general and administrative expense
|
3,146 | 1,872 | ||||||
|
Restructuring expense
|
132 | - | ||||||
| $ | 5,087 | $ | 2,922 | |||||
As of December 31, 2012, included in the $5.1 million of stock-based compensation expense is $132,000 in restructuring expense to accelerate the vesting of stock options (see Note 9 - Restructuring).
During the years ended December 31, 2012 and 2011, the Company granted options to purchase 2,771,533 and 3,683,428 shares of common stock, respectively, with an estimated total grant-date fair value of $4.8 million and $5.9 million, respectively.
During the years ended December 31, 2012, the Company granted 829,269 restricted stock units with a grant-date fair value of $2.3 million or $2.78 per share. The Company did not grant any restricted stock units during the year ended December 31, 2011.
As of December 31, 2012, the total compensation cost not yet recognized in connection with unvested stock options and restricted stock units under the Company’s equity compensation plans was approximately $6.7 million and $0.3 million, respectively. Unrecognized compensation will be amortized on a straight-line basis over a weighted-average period of approximately 2.53 years for stock options and approximately 0.16 years for restricted stock units.
The Company generally estimates the fair value of stock options granted using a Black-Scholes option-pricing model. This model requires the input of highly subjective assumptions, including the options expected life and the price volatility of the Company’s underlying stock. Actual volatility, expected lives, interest rates and forfeitures may be different from the Company’s assumptions, which would result in an actual value of the options being different from estimated. This fair value of stock option grants is amortized on a straight-line basis over the requisite service period of the awards, which is generally the vesting period.
The majority of the stock options that the Company grants to its employees provide for vesting over a specified period of time, normally a four-year period, with no other conditions to vesting. However, the Company may also grant stock options for which vesting occurs not only on the basis of elapsed time, but also on the basis of specified company performance criteria being satisfied. In this case, the Company makes a determination regarding the probability of the performance criteria being achieved and uses a Black-Scholes option-pricing model to value the options incorporating management’s assumptions for the expected holding period, risk-free interest rate, stock price volatility and dividend yield. Compensation expense is recognized ratably over the vesting period, if it is expected that the performance criteria will be met.
The fair value of the Company’s stock options granted to employees was estimated using the following weighted-average assumptions:
Expected Term—Expected term used in the Black-Scholes option-pricing model represents the period that the Company’s stock options are expected to be outstanding and is measured using the technique described in SEC Staff Accounting Bulletin No. 107.
Expected Volatility—Expected volatility used in the Black-Scholes option-pricing model is derived from a combination of historical and implied volatility of guideline companies selected based on similar industry and product focus. Forfeitures are estimated at the time of grant and are revised, if necessary, in subsequent periods if actual forfeitures differ from those estimates.
Expected Dividend—The Company has never paid dividends and currently does not intend to do so, and accordingly, the dividend yield percentage is zero for all periods.
Risk-Free Interest Rate—The Company bases the risk-free interest rate used in the Black-Scholes valuation method on the implied yield currently available on U.S. Treasury constant maturities issued with a term equivalent to the expected term of the option.
Stock Options with Market Conditions Granted March 17, 2010
From time to time the Company issues stock option grants to directors and employees that have a market condition. In such cases stock options will vest only if the average price of the Company’s stock is at or exceeds a certain price threshold during a specific, previously defined period of time. To the extent that the market condition is not met, the options do not vest and are cancelled. In these cases, the Company cannot use the Black-Scholes option-pricing model; instead, a binomial model must be used. For certain stock options, the Company utilizes the Monte Carlo simulation technique, which incorporates assumptions for the expected holding period, risk-free interest rate, stock price volatility and dividend yield. Compensation expense is recognized ratably until such time as the market condition is satisfied. Certain stock options granted on March 17, 2010 were classified as option grants having a market condition. On March 17, 2010, the Company granted 2,382,000 options, of which 1,181,000 vest on the basis of market conditions and the remaining 1,201,000 vest over a four-year period. The entire grant was comprised of 2,292,000 options to employees and consultants and 90,000 options to board members at an exercise price of $1.95, which was the closing price of the Company’s shares on the date of grant approval.
Below is the vesting schedule for the stock options with market conditions.
472,400 shares, less the shares cancelled for the terminated employees, vested on April 1, 2011 as the result of the average share price during March 2011 being $3.01, which exceeded the $2.50 March 2011 average price per share requirement. The fair value per share of these options was $1.05, at the grant date, and the total expense associated with these options was $496,000. These options were amortized over one year.
472,400 shares, less the shares cancelled for the terminated employees, were cancelled on April 1, 2012. Although the average share price during March 2012 was below the specified price of $3.50, the Company recognized the expense because there was a market condition. The fair value per share of these options was $1.01, at the grant date, and the total expense associated with these options was $477,000. These options were amortized over two years
236,200 shares, less the shares cancelled for the terminated employees, will vest on April 1, 2013 if the average share price during March 2013 is at or above $5.00. The fair value per share of these options was $1.01, at the grant date, and the total expense associated with these options is $239,000. These options are being amortized over three years.
For all of the stock options with market conditions granted on March 17, 2010, the amount of expense recognized for the years ended December 31, 2012 and 2011 was as follows (in thousands):
|
Years ended December 31,
|
||||||
|
2012
|
2011
|
|||||
| $ | 81 | $ | 396 | |||
Stock Option and Restricted Stock Unit Activity
The following is a summary of option activity for the Company’s equity incentive plans, including both the 2008 Plan and other prior plans for which there are outstanding options but no new grants since the 2008 Plan was adopted:
| Years Ended December 31, | ||||||||||||||||||||||||||||||||
|
2012
|
2011
|
|||||||||||||||||||||||||||||||
|
Options
|
Weighted-
average Exercise
Price
|
Weighted-average
Remaining
Contractual Term,
in Years
|
Aggregate Intrinsic Value, in Thousands
|
Options
|
Weighted-
average Exercise
Price
|
Weighted-average
Remaining
Contractual Term,
in Years
|
Aggregate Intrinsic Value, in Thousands
|
|||||||||||||||||||||||||
|
Outstanding, beginning of year
|
8,495,725 | $ | 2.58 | 6,024,201 | $ | 2.61 | ||||||||||||||||||||||||||
|
Granted
|
2,771,533 | $ | 2.64 | 3,683,428 | $ | 2.50 | ||||||||||||||||||||||||||
|
Exercised
|
(230,466 | ) | $ | 1.73 | $ | 178 | (91,140 | ) | $ | 1.30 | $ | 105 | ||||||||||||||||||||
|
Forfeited/Expired
|
(936,363 | ) | $ | 4.65 | (1,120,764 | ) | $ | 2.89 | ||||||||||||||||||||||||
|
Balance, end of year
|
10,100,429 | $ | 2.42 | 7.81 | $ | 1,874 | 8,495,725 | $ | 2.58 | 8.25 | $ | 1,685 | ||||||||||||||||||||
|
Vested and exercisable and expected to vest, end of year
|
9,512,994 | $ | 2.43 | 7.77 | $ | 1,868 | 8,434,869 | $ | 2.59 | 8.25 | $ | 1,652 | ||||||||||||||||||||
|
Vested and exercisable, end of year
|
5,004,706 | $ | 2.32 | 6.92 | $ | 1,809 | 3,257,197 | $ | 3.01 | 7.28 | $ | 1,373 | ||||||||||||||||||||
The weighted-average grant-date fair value of options granted during 2012 and 2011 was $1.74 and $1.87 per share. The aggregate intrinsic value reflects the difference between the exercise price of the underlying stock options and the Company’s closing share price of $1.92 as of December 31, 2012.
The following table summarizes information about options granted and outstanding under the Company’s equity incentive plans as of December 31, 2012:
|
Options Outstanding
|
Options Exercisable
|
||||||||||||||||||||
|
Number of Shares
Outstanding
|
Weighted-average
Remaining
Contractual Life
(in years)
|
Weighted-average Exercise
Price
|
Exercisable
|
Weighted-average Exercise Price
|
|||||||||||||||||
| $ 0.73 – $1.83 | 2,229,969 | 6.06 | $ | 1.08 | 2,020,284 | $ | 1.02 | ||||||||||||||
| $ 1.86 – $2.40 | 2,310,596 | 7.64 | $ | 2.13 | 1,365,487 | $ | 2.12 | ||||||||||||||
| $ 2.50 – $2.70 | 5,166,136 | 8.74 | $ | 2.63 | 1,320,301 | $ | 2.58 | ||||||||||||||
| $ 3.03 – $18.16 | 331,750 | 7.15 | $ | 4.06 | 236,656 | $ | 4.36 | ||||||||||||||
| $18.18 – $57.44 | 61,978 | 3.68 | $ | 35.60 | 61,978 | $ | 35.60 | ||||||||||||||
| $ 0.73 – $57.44 | 10,100,429 | 7.81 | $ | 2.42 | 5,004,706 | $ | 2.32 | ||||||||||||||
Restricted stock units are converted into shares of the Company’s common stock upon vesting on a one-for-one basis. Typically, vesting of restricted stock units is subject to the employee’s continuing service to the Company. Restricted stock units generally vest over a period of 1 year and are expensed ratably on a straight line basis over their respective vesting period net of estimated forfeitures. The fair value of the restricted stock units granted is the product of the number of shares granted and the grant date fair value of the Company’s common stock.
The following is a summary of restricted stock unit activity for the indicated periods:
|
Number of Shares
|
Weighted-A
verage Grant
Date Fair Value
|
Weighted-average Remaining Contractual Term, Years | Aggregate
Intrinsic
Value
|
|||||||||||||
|
(In thousands)
|
||||||||||||||||
|
Outstanding, December 31, 2011
|
- | $ | - | |||||||||||||
|
Granted
|
829,269 | 2.78 | ||||||||||||||
|
Released
|
(607,206 | ) | 2.78 | |||||||||||||
|
Forfeited/expired
|
(23,058 | ) | 2.75 | |||||||||||||
|
Outstanding, December 31, 2012
|
199,005 | $ | 2.78 | 0.16 | $ | 382 | ||||||||||
The majority of the restricted stock units that vested in the year ended December 31, 2012 were net-share settled such that the Company withheld shares with value equivalent to the employees’ minimum statutory obligation for the applicable income and other employment taxes, and remitted the cash to the appropriate taxing authorities. The total shares withheld were based on the value of the RSUs on their vesting date as determined by the Company’s closing stock price. These net-share settlements had the effect of share repurchases by the Company as they reduced and retired the number of shares that would have otherwise been issued as a result of the vesting and did not represent an expense to the Company. For the year ended December 31, 2012, 607,206 shares of restricted stock units vested with an intrinsic value of approximately $0.2 million. The Company withheld 191,797 shares to satisfy approximately $0.5 million of employees’ minimum tax obligation on the vested restricted stock units.
NOTE 8—BENEFIT PLANS
In connection with the Company’s Swiss subsidiary, the Company maintains a pension plan covering minimum requirements according to Swiss law. It has set up the occupational benefits by means of an affiliation to a collective foundation, the Swisscanto Collective Foundation.
Funding Policy
The Company’s practice is to fund the pension plan in an amount at least sufficient to meet the minimum requirements of Swiss law.
Benefit Obligations and Plan Assets
The following tables summarize changes in the benefit obligation, the plan assets and the funded status of the pension benefit plan as well as the components of net periodic benefit costs, including key assumptions (in thousands).
|
Years ended December 31,
|
||||||||
|
2012
|
2011
|
|||||||
|
Change in projected benefit obligation:
|
||||||||
|
Beginning benefit obligation
|
$ | 450 | $ | 731 | ||||
|
Service cost
|
35 | 45 | ||||||
|
Interest cost
|
10 | 16 | ||||||
|
Plan participants contributions
|
14 | 27 | ||||||
|
Foreign exchange adjustments
|
19 | 19 | ||||||
|
Actuarial loss (gain)
|
77 | (118 | ) | |||||
|
Transfer in/(out)
|
87 | (270 | ) | |||||
|
Ending benefit obligation
|
$ | 692 | $ | 450 | ||||
|
Change in plan assets:
|
||||||||
|
Beginning fair value of plan assets
|
$ | 385 | $ | 520 | ||||
|
Employer contributions
|
14 | 27 | ||||||
|
Plan participants' contributions
|
14 | 27 | ||||||
|
Foreign exchange adjustments
|
12 | 9 | ||||||
|
Expected return on plan assets
|
(72 | ) | 72 | |||||
|
Transfer in/(out)
|
87 | (270 | ) | |||||
|
Ending fair value of plan assets
|
$ | 440 | $ | 385 | ||||
|
Benefits paid
|
$ | - | $ | - | ||||
The following table summarizes the funding status as of December 31, 2012 and 2011 (in thousands):
|
December 31, 2012
|
December 31, 2011
|
|||||||
|
Projected benefit obligation
|
$ | (692 | ) | $ | (450 | ) | ||
|
Fair value of plan assets
|
440 | 385 | ||||||
|
Funded status of the plan at the end of the year, recorded as a long-term liability
|
$ | (252 | ) | $ | (65 | ) | ||
The total net periodic benefit cost for the year ending December 31, 2013 is expected to be approximately $46,000.
The amount that will be amortized from accumulated other comprehensive income, net of tax, into net periodic benefit cost in 2013 is $0. The following are the components of estimated net periodic benefit cost in 2013:
|
Year Ending December 31, 2013
|
||||
|
Service cost (net)
|
$ | 41,179 | ||
|
Interest cost
|
12,824 | |||
|
Expected return on plan assets
|
(8,286 | ) | ||
|
Amortization:
|
||||
|
Actuarial (gain)/loss
|
- | |||
|
Net periodic benefit cost
|
$ | 45,717 | ||
Assumptions
Weighted average assumptions used to determine benefit obligations as of December 31, 2012 for the plan were a discount rate of 1.90%, a rate of compensation increase of 2.00%, and an expected return on assets of 1.90%. The GigOptix-Helix Plan is reinsured with the Helvetia Swiss Life Insurance Company via the Swisscanto Collective Foundation. The expected return on assets is derived as follows: Swiss pension law requires that the insurance company pay an interest rate of at least 1.5% per annum on old-age savings accounts. In addition to the mandatory rate, the Company expects 0.4% of surplus sharing from the insurance company.
Weighted average assumptions used to determine costs for the plan as of December 31, 2011 were a discount rate of 2.50%, rate of compensation increase of 1.50%, and expected return on assets of 2.50%.
Net Periodic Benefit Cost
The net periodic benefit cost for the plan included the following components (in thousands):
|
Year Ended December 31, 2012
|
Year Ended December 31, 2011
|
|||||||
|
Service cost (net)
|
$ | 35 | $ | 45 | ||||
|
Interest cost
|
10 | 16 | ||||||
|
Net periodic benefit cost
|
$ | 45 | $ | 61 | ||||
Plan Assets
The benefits are fully insured. There are no retirees and the plan assets are equal to the sum of the old-age savings and of various other accounts within the affiliation contract.
The allocation of the assets of the plan at the measurement dates were in cash, bonds, stocks, mutual funds, hedge funds, and commodities. The Company is required by Swiss law to contribute to retirement funds for the employees of its Swiss subsidiary. Funds are managed by third parties according to statutory guidelines. Cash equivalents may be valued using quoted prices in markets that are not active, resulting in a Level 2 fair value measurement within the hierarchy set forth in the accounting guidance for fair value measurements.
Contributions
The Company anticipates contributions to the plan of approximately $14,000 in the year ending December 31, 2013. Actual contributions may differ from expected contributions due to various factors, including performance of plan assets, interest rates and potential legislative changes. The Company is not able to estimate expected contributions beyond fiscal year 2013.
Estimated Future Benefit Payments
The Company does not expect benefit payments through 2022.
Israel Severance Plan liability
Under Israeli law, the Company is required to make severance payments to its retired or dismissed Israeli employees and Israeli employees leaving its employment in certain other circumstances. The Company’s severance pay liability to its Israeli employees is calculated based on the salary of each employee multiplied by the number of years of such employee’s employment and is presented in its balance sheet in long-term liabilities, as if it was payable at each balance sheet date on an undiscounted basis. This liability is partially funded by the purchase of insurance policies in the name of the employees. The surrender value of the insurance policies of $9,000 is presented in long-term assets. Severance pay expense for the year ended December 31, 2012 was $0. At December 31, 2012, accrued severance liability and severance assets were $20,000 and $9,000, respectively.
GigOptix 401(k) Plan
The Company has a 401(k) retirement plan which was adopted by GigOptix, LLC as of January 4, 2008. In December 2011, the GigOptix 401k plan merged into the Endwave 401k plan. This plan is intended to be a qualified retirement plan under the Internal Revenue Code. It is a defined contribution as opposed to a defined benefit plan. The Company made $28,000 matching contributions during fiscal 2012, but did not make matching contributions to employees’ accounts during fiscal 2011.
NOTE 9—RESTRUCTURING
During the first of quarter of 2012, the Company undertook restructuring activities to reduce its expenses. The components of the restructuring charge included severance, benefits, payroll taxes, expenses associated with the acceleration of stock options, and other costs associated with employee terminations. The net charge for these restructuring activities was $207,000.
In July 2011, the Company vacated its headquarters facilities in Palo Alto, California and relocated to Endwave’s facilities in San Jose, California. The Company has lease obligations through December 2013 for the Palo Alto facilities. In connection with vacating the Palo Alto facilities, the Company recognized $769,000 of restructuring expenses in July 2011. During the second quarter of 2012, the Company sublet the Palo Alto facility to a third-party, and as a result, recorded a restructuring benefit of $74,000. In addition, during the second quarter of 2012, the Company recorded a benefit of $40,000 due to lower than expected restructuring expenses originally booked as part of the restructuring undertaken by the Company in relation to its acquisition of Endwave.
For the year ended December 31, 2011, the Company recorded restructuring expense of $3.9 million that was the result of the $769,000 noted above, as well as $3.1 million which represented certain restructuring expenses incurred and booked by Endwave in anticipation of the acquisition and prior to the close of the transaction. Of the total $3.1 million of restructuring expense incurred by Endwave prior to the close of the transaction, $2.1 million remained in restructuring liabilities at the close of the merger and $1.0 million had been paid out prior to the close of the transaction. Of the total $3.1 million, $2.8 million included severance, benefits, payroll taxes, expenses associated with the acceleration of stock options and other costs associated with employee terminations and $290,000 included facilities related expenses.
The following is a summary of the restructuring activity (in thousands):
|
Year ending December 31,
|
||||||||
|
2012
|
2011
|
|||||||
|
Beginning balance
|
$ | 696 | $ | 62 | ||||
|
Charges
|
207 | 3,880 | ||||||
|
Restructuring liabilities assumed
|
- | 468 | ||||||
|
Uses and adjustments
|
(735 | ) | (2,733 | ) | ||||
|
Expenses paid by Endwave
|
- | (981 | ) | |||||
|
Ending balance
|
$ | 168 | $ | 696 | ||||
As of December 31, 2012, the Company had $168,000 in accrued restructuring, which was all included in other current liabilities. The accrued restructuring included $9,000 for the Endwave restructuring which is expected to be paid out by the second quarter of 2013 and $159,000 for the Palo Alto facilities restructuring which is expected to be paid out by the fourth quarter of 2013.
As of December 31, 2011, the Company had $696,000 in accrued restructuring, $458,000 of accrued restructuring, current which was included in other current liabilities and $238,000 in accrued restructuring, non-current which was included in other long term liabilities.
NOTE 10—INCOME TAXES
The components of net loss before provision for income taxes are as follows (in thousands):
|
Years ended December 31,
|
||||||||
|
2012
|
2011
|
|||||||
|
United States
|
$ | (6,156 | ) | $ | (14,203 | ) | ||
|
International
|
(767 | ) | 119 | |||||
|
Net loss before provision for income taxes
|
$ | (6,923 | ) | $ | (14,084 | ) | ||
Components of provision for income taxes are as follows (in thousands):
|
Years ended December 31,
|
||||||||
|
2012
|
2011
|
|||||||
|
Current
|
||||||||
|
United States
|
$ | 115 | $ | 54 | ||||
|
International
|
- | - | ||||||
|
State
|
2 | 2 | ||||||
|
Total
|
117 | 56 | ||||||
|
Deferred
|
||||||||
|
United States
|
(36 | ) | - | |||||
|
International
|
- | - | ||||||
|
Total
|
(36 | ) | - | |||||
|
Provision for income taxes
|
$ | 81 | $ | 56 | ||||
Provision for income taxes differs from the amount computed by applying the statutory United States federal income tax rate to loss before taxes as follows:
|
Years ended December 31,
|
||||||||||
|
2012
|
2011
|
|||||||||
|
Income tax at the federal statutory rate
|
(34.00 | ) | % | (34.00 | ) | % | ||||
|
State tax net of federal benefit
|
0.02 | % | 0.01 | % | ||||||
|
Foreign tax rate differential
|
4.19 | % | 0.00 | % | ||||||
|
Permanent items and other
|
1.67 | % | 0.38 | % | ||||||
|
Losses not benefited
|
29.29 | % | 34.00 | % | ||||||
|
Effective tax rate
|
1.17 | % | 0.39 | % | ||||||
The components of the net deferred tax assets and liabilities are as follows (in thousands):
|
December 31,
|
||||||||
|
2012
|
2011
|
|||||||
|
Deferred tax asset (liability), net
|
||||||||
|
Net operating losses
|
$ | 21,530 | $ | 19,251 | ||||
|
Tax credits
|
3,022 | 3,992 | ||||||
|
Accrued and reserves
|
2,139 | 3,510 | ||||||
|
Fixed assets
|
847 | 345 | ||||||
|
Other
|
1,506 | 3,444 | ||||||
|
Total deferred tax asset
|
29,044 | 30,542 | ||||||
|
Valuation allowance
|
(27,898 | ) | (29,343 | ) | ||||
|
Net deferred tax asset
|
$ | 1,146 | $ | 1,199 | ||||
|
Intangible assets
|
(1,146 | ) | (1,199 | ) | ||||
|
Deferred tax liability
|
(1,146 | ) | (1,199 | ) | ||||
|
Net deferred tax asset (liability)
|
$ | - | $ | - | ||||
The Company has a full valuation allowance on deferred tax assets in excess of deferred tax liabilities. Because of its limited operating history and cumulative losses, management believes it is more likely than not that the remaining deferred tax assets will not be realized.
The Company’s valuation allowance decreased by approximately $1.4 million during the year ended December 31, 2012 and increased by approximately $10.8 million during the year ended December 31, 2011.
The Company has approximately $48.3 million of federal net operating losses carryforwards and $25 million of state net operating loss carryforwards at December 31, 2012. The federal and state net operating losses expire starting in 2012 through year 2032. The Company has approximately $3.6 million of federal research and development tax credit (R&D credit) carry forwards and $2.3 million of California R&D credit carry forwards at December 31, 2012. The federal R&D credit carry forwards begin to expire in 2029 while the California R&D credits are not subject to a carry forward limitation. Utilization of a portion of the net operating losses and credit carry forwards are subject to an annual limitation due to the ownership change provision of the Internal Revenue Code of 1986, as amended and similar state provisions. The annual limitation may result in the expiration of net operating losses and credits before utilization. The Company also has approximately $13.8 million of net operating loss carry forwards in Israel related to its acquisition of ChipX which can be carried forward indefinitely.
Any interest and penalties incurred on the settlement of outstanding tax positions would be recorded as a component of income tax expense. The Company recorded $7,000 of interest and penalty expenses as of December 31, 2012.
The Company’s unrecognized tax benefits at December 31, 2012 relate to various domestic and foreign jurisdictions. As of December 31, 2012, the Company had total gross unrecognized tax benefits of $2.5 million, which if recognized would affect the effective tax rate. As of December 31, 2012, the amount of long-term income taxes payable for unrecognized tax benefits, including accrued interest, was $331,000. The Company does not anticipate any significant changes to its unrecognized tax benefits within the next 12 months.
A reconciliation of the beginning and ending amount of unrecognized tax benefits is as follows (in thousands):
|
Total
|
||||
|
Balance at December 31, 2010
|
$ | 1,644 | ||
|
Increases related to current year tax positions
|
318 | |||
|
Increases related to prior year tax positions
|
103 | |||
|
Balance at December 31, 2011
|
2,065 | |||
|
Increases related to current year tax positions
|
364 | |||
|
Increases related to prior year tax positions
|
99 | |||
|
Decreases related to prior year tax positions
|
(5 | ) | ||
|
Balance at December 31, 2012
|
$ | 2,523 | ||
The Company files tax returns as prescribed by the tax laws of the jurisdictions it operates which include U.S. federal, U.S. state and foreign tax returns. The Company’s major tax jurisdictions are the U.S., California, Switzerland, and Israel. The Company’s fiscal years through 2012 remain subject to examination by the tax authorities for U.S. federal, state, and foreign tax purposes.
NOTE 11—NET LOSS PER SHARE
The following table sets forth the calculation of basic and diluted net loss per common share (in thousands, except per share amounts):
|
Years ended December 31,
|
||||||||
|
2012
|
2011
|
|||||||
|
Net loss
|
$ | (7,004 | ) | $ | (14,140 | ) | ||
|
Shares used in computation:
|
||||||||
|
Weighted average shares outstanding - basic and diluted
|
21,444 | 17,279 | ||||||
|
Net loss per share - basic and diluted
|
$ | (0.33 | ) | $ | (0.82 | ) | ||
The following table summarizes total securities outstanding which were not included in the calculation of diluted net loss per share because to do so would have been anti-dilutive:
|
December 31,
|
||||||||
|
2012
|
2011
|
|||||||
|
Stock options and restricted stock units
|
10,299,434 | 8,495,725 | ||||||
|
Common stock warrants
|
1,810,595 | 1,948,095 | ||||||
|
Total
|
12,110,029 | 10,443,820 | ||||||
NOTE 12—SEGMENT AND GEOGRAPHIC INFORMATION
The Company has determined that it operates as a single operating and reportable segment. The following tables reflect the results of the Company’s reportable segment consistent with the management system used by the Company’s Chief Executive Officer, the chief operating decision maker.
The following table summarizes revenue by geographic region (in thousands):
|
Years ended December 31,
|
||||||||
|
2012
|
2011
|
|||||||
|
North America
|
$ | 11,298 | $ | 13,997 | ||||
|
Asia
|
9,731 | 9,362 | ||||||
|
Europe
|
15,458 | 8,746 | ||||||
|
Other
|
247 | 163 | ||||||
| $ | 36,734 | $ | 32,268 | |||||
The Company determines geographic location of its revenue based upon the destination of shipments of its products.
During fiscal year 2012, the United States, Italy, Hungary, and Japan accounted for 28%, 21%, 12%, and 11% of revenue, respectively. During fiscal year 2011, the United States, Japan, Hong Kong, and Italy accounted for 41%, 13%, 11%, and 10% of revenue, respectively. No other countries accounted for more than 10% of the Company’s consolidated revenue during the periods presented.
The following table summarizes revenue by product line (in thousands):
|
Years ended December 31,
|
||||||||
|
2012
|
2011
|
|||||||
|
Optics
|
$ | 18,024 | $ | 11,298 | ||||
|
RF
|
3,283 | 4,990 | ||||||
|
High-Speed Communications
|
21,307 | 16,288 | ||||||
|
Industrial (ASIC)
|
14,549 | 15,352 | ||||||
|
Government
|
878 | 628 | ||||||
|
Total revenue
|
$ | 36,734 | $ | 32,268 | ||||
The following table summarizes long-lived assets by country (in thousands):
|
December 31,
|
||||||||
|
2012
|
2011
|
|||||||
|
United States
|
$ | 2,595 | $ | 3,431 | ||||
|
Switzerland
|
1,984 | 1,057 | ||||||
| $ | 4,579 | $ | 4,488 | |||||
Long-lived assets, comprising property and equipment, are reported based on the location of the assets.
NOTE 13—COMMITMENTS AND CONTINGENCIES
Commitments
Leases
The Company leases its domestic and foreign sales offices under non-cancelable operating leases. These leases contain various expiration dates and renewal options. The Company also leases certain software licenses under operating leases. Total rental expense for 2012 and 2011 was $575,000 and $700,000, respectively. During the second quarter of 2012, the Company sublet the Palo Alto facility, and as a result, recorded a restructuring benefit of $74,000.
Aggregate non-cancelable future minimum lease payments under capital and operating leases are as follows (in thousands):
|
Capital Leases
|
Operating Leases | |||||||||||||||
|
Years ending December 31,
|
Minmum lease payments
|
Minmum
lease
payments
|
Sublease payments
|
Net lease payments
|
||||||||||||
|
2013
|
$ | 400 | $ | 1,844 | $ | (250 | ) | $ | 1,594 | |||||||
|
2014
|
306 | 550 | - | 550 | ||||||||||||
|
2015
|
- | 320 | - | 320 | ||||||||||||
|
2016
|
- | 339 | - | 339 | ||||||||||||
|
2017
|
- | 57 | - | 57 | ||||||||||||
|
Total minimum lease payments
|
706 | $ | 3,110 | $ | (250 | ) | $ | 2,860 | ||||||||
|
Less: Amount representing interest
|
(101 | ) | ||||||||||||||
|
Total capital lease obligations
|
605 | |||||||||||||||
|
Less: current portion
|
(324 | ) | ||||||||||||||
|
Long-term portion of capital lease obligations
|
$ | 281 | ||||||||||||||
The gross and net book value of the fixed assets purchased under capital lease was as follows (in thousands):
|
As of the years December 31,
|
||||||||
|
2012
|
2011
|
|||||||
|
Acquired cost
|
$ | 1,653 | $ | 1,945 | ||||
|
Accumulated amortization
|
(1,047 | ) | (768 | ) | ||||
|
Net book value
|
$ | 606 | $ | 1,177 | ||||
The amortization of computer software acquired under capital lease is included in depreciation expense.
Contingencies
Tax Contingencies
The Company’s income tax calculations are based on application of the respective U.S. Federal, state or foreign tax law. Its tax filings, however, are subject to audit by the respective tax authorities. Accordingly, the Company recognizes tax liabilities based upon its estimate of whether, and the extent to which, additional taxes will be due.
Legal Contingencies
From time to time, the Company may become involved in legal proceedings, claims and litigation arising in the ordinary course of business. When it believes a loss is probable and can be reasonably estimated, it accrues the estimated loss in its consolidated financial statements. Where the outcome of these matters is not determinable, it do not make a provision in its financial statements until the loss, if any, is probable and can be reasonable estimated or the outcome becomes known.
Product Warranties
The Company’s products typically carry a standard warranty period of approximately one year. The Company records a liability based on estimates of the costs that may be incurred under its warranty obligations and charges to the cost of product revenue the amount of such costs at the time revenues are recognized. The warranty obligation is affected by product failure rates, material usage and service delivery costs incurred in correcting a product failure. The estimates of anticipated rates of warranty claims and costs per claim are primarily based on historical information and future forecasts.
The table below summarizes the movement in the warranty accrual, which is included as a component of other current liabilities, for the years ended December 31, 2012 and 2011 (in thousands):
|
December 31,
|
||||||||
|
2012
|
2011
|
|||||||
|
Balance at January 1
|
$ | 296 | $ | 143 | ||||
|
Warranties accrued
|
1,328 | 198 | ||||||
|
Warranties assumed with the Endwave merger
|
- | 496 | ||||||
|
Warranties settled or reversed
|
(1,012 | ) | (541 | ) | ||||
|
Balance at December 31
|
$ | 612 | $ | 296 | ||||
NOTE 14—RECENT ACCOUNTING PRONOUNCEMENTS
In May 2011, the Financial Accounting Standards Board (“FASB”) issued a new accounting standard update, which amends the fair value measurement guidance and includes some enhanced disclosure requirements. The most significant change in disclosures is an expansion of the information required for Level 3 measurements based on unobservable inputs. The standard is effective for fiscal years beginning after December 15, 2011. The Company adopted this update in the first quarter of 2012 and it did not have a material impact on the Company’s consolidated financial statements.
In June 2011, the FASB issued an amendment to an existing accounting standard which requires companies to present net income and other comprehensive income in one continuous statement or in two separate, but consecutive, statements. In addition, in December 2011, the FASB issued an amendment to an existing accounting standard which defers the requirement to present components of reclassifications of other comprehensive income on the face of the income statement. The Company adopted this standard in the first quarter of 2012 and it did not have a material impact on the Company’s consolidated financial statements.
In September 2011, the FASB issued a revised accounting standard, which is intended to reduce the cost and complexity of the annual goodwill impairment test by providing entities an option to perform a qualitative assessment to determine whether further impairment testing is necessary. Specifically, an entity has the option to first assess qualitative factors to determine whether it is necessary to perform the current two-step test. If an entity believes, as a result of its qualitative assessment, that it is more-likely than-not that the fair value of a reporting unit is less than its carrying amount, the quantitative impairment test is required. Otherwise, no further testing is required. This standard is effective for annual and interim goodwill impairment tests performed for fiscal years beginning after December 15, 2011. The Company adopted this standard in the first quarter of 2012 and it did not have a material impact on the Company’s consolidated financial statements.
In July 2012, the FASB issued an accounting standards update which allows an entity to first assess qualitative factors to determine whether it is more likely than not that the fair value of an indefinite-lived intangible asset is less than its carrying value. An entity is not required to determine the fair value of the indefinite-lived intangible unless the entity determines, based on the qualitative assessment, that it is more likely than not that its fair value is less than the carrying value. This standard is effective for annual and interim impairment tests performed for fiscal years beginning after September 15, 2012 and early adoption is permitted. The Company does not expect the adoption will have a material impact on the Company’s consolidated financial statements.
NOTE 15—SUBSEQUENT EVENTS
Restructuring
During the first of quarter of 2013, the Company undertook restructuring activities to reduce its expenses. The components of the restructuring charge included approximately $700,000 of non-cash expenses associated with the acceleration of stock options and restricted stock units and approximately $300,000 of cash expenses for severance, benefits and payroll taxes and other costs associated with employee terminations.
GigOptix Gmbh
In March 2013, the Company established a German subsidiary, GigOptix GmbH. The subsidiary will be engaged in research and development for the Company’s high-speed communication product line including electro-optical products.
|
ITEM 9.
|
CHANGES IN AND DISAGREEMENTS WITH ACCOUNTANTS ON ACCOUNTING AND FINANCIAL DISCLOSURE
|
None.
|
ITEM 9A.
|
CONTROLS AND PROCEDURES
|
Evaluation of Disclosure Controls and Procedures
We maintain “disclosure controls and procedures,” as such term is defined in Rule 13a-15(e) under the Securities Exchange Act of 1934 (the “Exchange Act”), that are designed to ensure that information required to be disclosed by us in reports that we file or submit under the Exchange Act is recorded, processed, summarized, and reported within the time periods specified in Securities and Exchange Commission rules and forms, and that such information is accumulated and communicated to our management, including our Chief Executive Officer and Chief Financial Officer, as appropriate, to allow timely decisions regarding required disclosure.
Our management is responsible for establishing and maintaining our disclosure controls and procedures. Our Chief Executive Officer (“CEO”) and Chief Financial Officer (“CFO”) have evaluated the effectiveness of our disclosure controls and procedures as of December 31, 2012. Our CEO and CFO have concluded that our disclosure controls and procedures were effective as of that date because the material weaknesses described below were remediated in 2012. Notwithstanding the prior existence of material weaknesses described below, which were remediated in 2012, our management performed additional analyses, reconciliations and other post-closing procedures and has concluded that our consolidated financial statements for the periods covered by and included in this Annual Report on Form 10-K are fairly stated in all material respects in accordance with generally accepted accounting principles in the United States.
Management’s Report on Internal Control over Financial Reporting
Our management is responsible for establishing and maintaining adequate internal control over financial reporting as defined in Rule 13a-15(f) and 15d-15(f) of the Exchange Act. Because of its inherent limitations, internal control over financial reporting may not prevent or detect misstatements. Also, projections of any evaluation of effectiveness to future periods are subject to the risk that controls may become inadequate because of changes in conditions, or that the degree of compliance with the policies or procedures may deteriorate.
Internal control over financial reporting includes those policies and procedures that (i) pertain to the maintenance of records that in reasonable detail accurately and fairly reflect the transactions and dispositions of our assets; (ii) provide reasonable assurance that transactions are recorded as necessary to permit preparation of financial statements in accordance with generally accepted accounting principles, and that our receipts and expenditures are being made only in accordance with authorizations of our management and directors; and (iii) provide reasonable assurance regarding prevention or timely detection of unauthorized acquisition, use or disposition of our assets that could have a material effect on the financial statements.
During 2012, management remediated the following material weaknesses which were reported as of December 31, 2011. A material weakness is a deficiency, or a combination of deficiencies, in internal control over financial reporting, such that there is a reasonable possibility that a material misstatement of the company’s annual or interim financial statements will not be prevented or detected on a timely basis.
|
|
·
|
We did not maintain effective procedures and controls surrounding the accounting for business combinations. Specifically, we incorrectly accounted in 2011 for certain restructuring expenses associated with our acquisition of Endwave Corporation which led to the restatement of our second and third quarter quarterly reports on Form 10-Q. Accordingly, we have determined this control deficiency constituted a material weakness which was remediated in 2012.
|
|
|
·
|
We did not maintain experienced personnel with an appropriate level of accounting knowledge and training in the application of generally accepted accounting principles associated with inventory and cost of revenue. This deficiency resulted in several audit adjustments to our consolidated financial statements for 2011. Accordingly, we have determined this control deficiency constituted a material weakness which was remediated in 2012.
|
The remediation measures implemented are discussed in the Changes in Internal Control over Financial Reporting section.
As a smaller reporting company, pursuant to the rules of the SEC, this Annual Report on Form 10-K does not include an attestation report of the Company’s independent registered public accounting firm.
Changes in Internal Control over Financial Reporting
During 2012, we implemented the following remediation measures.
|
|
·
|
As part of future acquisitions and significant transactions, we will review our accounting of the transactions internally based on generally accepted accounting principles as well as the most recent authoritative guidance. In addition, we will seek external advisors with a full understanding of the appropriate accounting treatment for significant and infrequent transactions we experience in the future; and
|
|
|
·
|
We have hired another senior accountant with a CPA certification and engaged a senior cost accounting consultant. Our staff, including those recently hired, are working with our operations and finance team to institute, maintain and adhere to appropriate policies and procedures associated with inventory and cost of revenue.
|
|
ITEM 9B.
|
OTHER INFORMATION
|
None.
PART III
|
Item 10.
|
Directors, Executive Officers and Corporate Governance
|
Directors and Executive Officers
The table below sets forth information regarding the members of our board of directors and non-director executive officers as of March 1, 2013. Our certificate of incorporation divides the board of directors into three classes with overlapping three-year terms. One class is elected each year at the annual meeting of stockholders, and the classes are to be as nearly equal in number as possible. Each director shall hold office until his or her successor is duly qualified. Our board of directors and executive officers are as follows:
|
Name
|
|
Age
|
|
Position
|
|
Director
Since
|
|
Dr. Avi Katz
|
|
54
|
|
Chairman of the Board of Directors, Chief Executive Officer and President
|
|
2008
|
|
Curt Sacks
|
|
42
|
|
Senior Vice President and Chief Financial Officer
|
|
|
|
Andrea Betti-Berutto
|
|
47
|
|
Senior Vice President and Chief Technical Officer
|
|
|
|
Joseph J. Lazzara
|
|
61
|
|
Director
|
|
2011
|
|
John J. Mikulsky
|
|
67
|
|
Director
|
|
2011
|
|
Neil J. Miotto
|
|
66
|
|
Director
|
|
2008
|
|
David T. Mitchell
|
|
70
|
|
Director
|
|
2012
|
|
Frank Schneider
|
|
70
|
|
Director
|
|
2010
|
|
Kimberly D.C. Trapp
|
|
54
|
|
Director
|
|
2008
|
Dr. Avi Katz served as Chief Executive Officer, President, and Chairman of the Board of Directors of GigOptix LLC and GigOptix Inc. since he co-founded the companies in July 2007. Dr. Katz also served as a board member, Chief Executive Officer and President of iTerra Communications LLC, the predecessor to GigOptix LLC, from April 2007 until October 2007. Dr. Katz also serves as the Chairman of the board of directors of GigOptix-Helix AG, GigOptix Israel Ltd., Lumera Inc. and Endwave Corporation. From April 2006 to April 2007, he was the Corporate Development executive with Symphony Services Corp., and a Managing Partner and Chairman of APU-Global, a technology consulting company, which he founded in 2005. Dr. Katz was the Chief Executive Officer, President and a board member of Intransa, Inc., from 2003 to 2005, and was the Chief Executive Officer, President and a board member of Equator Technologies, Inc., from 2000 to 2003. He holds numerous U.S. and international patents, has published about 300 technical papers and is the editor of a number of technical books. Dr. Katz received his Ph.D. in materials engineering and a B.S. in engineering from Technion-IIT, Israel, and is a graduate of the Israeli Naval Academy. As our co-founder, and the CEO since the inception, Dr. Katz has the benefit of understanding our complete history. This background, together with his extensive executive experience and exceptional technical skills, make Dr. Katz uniquely qualified to serve on our Board of Directors.
Curt P. Sacks has served as our Senior Vice President and Chief Financial Officer since June 2011. He served as Endwave Corporation’s Chief Financial Officer since June 2009. Prior to that, he served as Vice President of Finance and Corporate Controller of Endwave since February 2006. He joined Endwave in 2004 as Corporate Controller, after serving in this capacity for two successive companies—first, for Com21, Inc., a manufacturer of system solutions for the broadband access market; and next with Finisar, Inc., a manufacturer of high-speed communication equipment for data and storage. Prior to 1998, Mr. Sacks worked in corporate finance at 3Com Corporation and as an auditor for Deloitte & Touche LLP. Mr. Sacks is a C.P.A. (inactive) in California with a B.A. in business-economics from the University of California, Los Angeles.
Andrea Betti-Berutto is our Senior Vice President and Chief Technical Officer and has served as our Chief Technical Officer since the inception of GigOptix LLC in July 2007. Mr. Betti-Berutto was a co-founder of GigOptix LLC’s predecessor company, iTerra Communications, LLC, where he served in a variety of capacities from 2000 until July 2007. He also co-founded GigOptix LLC in July 2008. He has more than 16 years of experience in the design of Integrated Circuits (IC) and multichip modules for microwave, millimeter-wave, and RF applications. He is the author of several publications in technical journals in the area of power amplifiers, high-speed ICs, and broadband design for lightwave applications. Mr. Betti-Berutto received his M.S. degree in electrical engineering from the University of Rome “La Sapienza”.
Joseph J. Lazzara has served on our board of directors since June 2011. He had previously served as a director of Endwave Corporation since February 2004. From September 2006 to March 2008, Mr. Lazzara served as the Vice Chairman and a director of Omron Scientific Technologies, Inc., a manufacturer of factory automation sensors and machine safeguarding products. Until the acquisition by Omron Corporation in September, 2006, Mr. Lazzara served as President and Chief Executive Officer of Scientific Technologies, Inc. (NASDAQ:STIZ) between 1993 and 2006, as the President between 1989 and 1993, and as the Treasurer and a director of Scientific Technologies between 1984 and 2006. Mr. Lazzara also served as a Vice President of Scientific Technologies between September 1984 and June 1989. From 2006, Mr. Lazzara also served as the Vice Chairman and Director of Automation Products Group, Inc., a privately held manufacturer of automation sensors. He also served as Treasurer and a director of Scientific Technologies’ parent company, Scientific Technology Incorporation, from 1981 and 2006. Prior to 1981, Mr. Lazzara was employed by Hewlett-Packard Company, a global technology solutions provider, in Process and Engineering Management. Mr. Lazzara received a B.S. in engineering from Purdue University and an M.B.A. from Santa Clara University. We believe that Mr. Lazzara’s extensive business expertise, both as the Chief Executive Officer and Board Member of a publicly traded company as well as his technical background qualify him to serve on our board of directors.
John J. Mikulsky has served on our board of directors since June 2011. He had previously served as Endwave Corporation’s President and Chief Executive Officer since December 1, 2009. From August 2005 until November 2009, Mr. Mikulsky served as Endwave Corporation’s Chief Operating Officer and Executive Vice President. From May 2001 until August 2005, Mr. Mikulsky served as Endwave Corporation’s Chief Marketing Officer and Executive Vice President, Marketing and Business Development. From May 1996 until April 2001, Mr. Mikulsky served as Endwave Corporation’s Vice President of Product Development. From 1993 until 1996, Mr. Mikulsky worked as a Technology Manager for Balazs Analytical Laboratory, a provider of analytical services to the semiconductor and disk drive industries. Prior to 1993, Mr. Mikulsky worked at Raychem Corporation, most recently as a Division Manager for its Electronic Systems Division. Mr. Mikulsky holds a B.S. in electrical engineering from Marquette University, an M.S. in electrical engineering from Stanford University and an S.M. in management from the Sloan School at the Massachusetts Institute of Technology. We believe Mr. Mikulsky’s extensive industry knowledge and experience, including his years of experience at Endwave Corporation in both technical and leadership roles, qualify him to serve on our board of directors.
Neil J. Miotto has served on our board of directors since December 2008. He is a retired assurance partner of KPMG LLP, where he was a partner for twenty-seven years until his retirement in September 2006. While at KPMG, Mr. Miotto also served as an SEC reviewing partner. He is a member of American Institute of Certified Public Accountants. He holds a Bachelor of Business Administration degree from Baruch College, of The City University of New York. Mr. Miotto is a member of the Board of Directors of Micrel Inc., where he serves as chairman of the Audit Committee. Mr. Miotto brings extensive financial risk assessment and financial reporting experience to our board of directors. We believe that Mr. Miotto’s extensive experience with public companies and financial accounting matters makes him well qualified to be on our board of directors.
David T. Mitchell has served on our board of directors since June of 2012. He is the founder and Chief Executive Officer and Chairman of the Board of Directors of Fabrinet since its inception in 2000. Mr. Mitchell also served as Fabrinet’s President from 2000 to January 2011. In 1979, Mr. Mitchell co-founded Seagate Technology, a disk drive manufacturing company. Mr. Mitchell served as the president of Seagate Technology from 1983 to 1991. From 1992 to 1995, Mr. Mitchell served as the chief operating officer of Conner Peripherals, a disk drive manufacturing company. From 1995 to 1998, Mr. Mitchell served as the chief executive officer of JTS Corp., a mobile disk drive manufacturing company. During his tenure in the data storage industry, Mr. Mitchell established manufacturing operations in Singapore, Thailand, Malaysia, the PRC and India. Mr. Mitchell earned a Bachelor of Science degree in economics from Montana State University. Mr. Mitchell brings extensive knowledge and understanding of the optical business particularly in relation to manufacturing and operations, as well as more than 30 years of experience in an array of executive management roles within the semiconductor and optoelectronics industry that qualify him to serve on our board of directors.
Frank W. Schneider joined our board of directors in June 2010. From October 2003 to January 2006, Mr. Schneider served as President and Chief Executive Officer of ION Systems, Inc., a privately-held manufacturer of electrostatic management systems. In January 2006, ION Systems was acquired by MKS Instruments, Inc., where Mr. Schneider served as Vice President and General Manager until his retirement in 2009. Prior to these roles, Mr. Schneider was the President and Chief Executive Officer of GHz Technology, Inc., until its merger with Advanced Power Technology, Inc. Subsequent to the merger, Mr. Schneider served as the Chief Operating Officer for the Radio Frequency business unit of that company. Mr. Schneider also serves on the board of directors of Micrel, Incorporated where he serves as a member of the Audit and Compensation Committees, and has served as a member of the advisory board of Neomagic, Inc. and held various management and executive positions with Sharp Electronics Corporation, Philips Semiconductor and Corning Electronics. Mr. Schneider serves as a member of the Compensation Committee of our board of directors. He holds a B.S. in Electrical Engineering from West Virginia University and an M.B.A. from Northwestern University’s Kellogg School of Business. We believe Mr. Schneider is well qualified to serve on our board of directors due to his leadership skills and industry experience, which he has demonstrated through more than 40 years of management and experience in the semiconductor, electronic component and systems industries.
Kimberly D.C. Trapp has served on our board of directors since December 2008. She previously served as a director of Lumera Corporation from October 2006 and a director of GigOptix LLC from October 2007 until the merger of the two companies in December 2008. From 2003 to 2010, she was the Industry Liaison Officer for the Center of Optical Technologies at Lehigh University, which advances the research and application of optical and electro-optic technologies. Under her leadership, the Center added more than 45 industry liaison members and joint partners, obtained more than $95 million in funding, and in 2007, opened The Smith Family Laboratory for Optical Technologies. Prior to joining Lehigh University, Ms. Trapp spent 23 years in the telecom industry, her last position being Director of Marketing and Business Operations for the Agere Systems Inc. Optoelectronics Business Unit. Ms. Trapp received her B.S. degree in chemistry from Purdue University, her M.S. degree in inorganic chemistry from Fairleigh Dickinson University, and completed a corporate sponsored MBA program. From her industry and academic experience of more than 30 years, Ms. Trapp brings a tremendous amount of technical expertise, especially in the area of optical and electro-optic technologies, that we believe makes her uniquely qualified to sit on our board of directors.
Section 16(a) Beneficial Ownership Reporting Compliance
Based solely upon a review of Forms 3, 4 and 5 furnished to us and written representations that no other reports were required, we believe that each of our directors, executive officers and beneficial owners of greater than 10% of our common stock complied during fiscal year 2012 with the reporting requirements of Section 16(a) of the Exchange Act.
Code of Ethics
We have adopted a Code of Business Ethics and Conduct that applies to our directors, executive officers and employees. We will disclose any future amendments to, or waivers from, the Code of Business Ethics and Conduct on our website http://www.gigoptix.com within four business days following the date of the amendment or waiver. We will provide to any person, without charge, a copy of Code of Business Ethics and Conduct upon written request to:
GigOptix, Inc.
130 Baytech Drive
San Jose, California 95134
Attn: Investor Relations
Audit Committee
We have a separately designated standing Audit Committee, which has been established in accordance with Section 3(a)(58)(A) of the Securities Exchange Act of 1934, as amended (the “Exchange Act”). The Audit Committee is comprised of not less than three nor more than four directors, each of whom is independent as determined by the Board of Directors and as defined by Rule 10A-3(b)(1) under the Exchange Act and Section 803(a)(2) of the NYSE MKT Company Guide. The Board of Directors has also determined that Mr. Miotto is an “audit committee financial expert” as defined in SEC rules and Section 803(b)(2)(iii) of the NYSE MKT Company Guide. This designation does not impose on Mr. Miotto any duties, obligations or liabilities that are greater than is generally imposed on him as a member of our Audit Committee or our Board of Directors. The current members of the Audit Committee are Mr. Miotto (who serves as chairman of the committee), Mr. Lazzara and Ms. Trapp.
The Audit Committee is responsible for monitoring and overseeing: (i) our accounting and financial reporting processes; (ii) the preparation and integrity of our financial statements; (iii) our compliance with financial statement and regulatory requirements; (iv) the performance of our internal finance and accounting personnel and our independent registered accounting firm and (v) the qualification and independence of our independent registered public accounting firm.
The Audit Committee has the authority to retain legal, accounting or other experts that it deems necessary to carry out its duties. It also has the authority to determine the compensation of such advisors, as well as that of our independent registered accounting firm, and to determine appropriate funding needs for ordinary administrative expenses that are necessary or appropriate for carrying out its duties.
|
Item 11.
|
Executive Compensation
|
COMPENSATION OF EXECUTIVE OFFICERS
Our primary objectives with respect to executive compensation are to attract and retain the best possible executive talent, to link annual compensation (cash and stock-based) and long-term stock-based compensation to achievement of measurable corporate goals and individual performance, and to align executives’ incentives with stockholder value creation. To achieve these objectives, we have implemented and maintain compensation plans that tie a portion of executives’ overall compensation to our financial performance and common stock price. Overall, the total compensation opportunity is intended to create an executive compensation program that is competitive with comparably-sized companies where we are based, as it is these companies with whom we compete most vigorously for executive and technical talent.
Compensation Committee
Our Compensation Committee approves, administers and interprets our named executive officer compensation and benefit policies and plans. Our Compensation Committee is appointed by our Board of Directors, and consists entirely of independent directors who are “outside directors” for purposes of Section 162(m) of the Internal Revenue Code and “non-employee directors” for purposes of Rule 16b-3 under the Exchange Act. The members of the Compensation Committee are Mr. Schneider (who serves as chairman of the committee), Mr. Lazzara and Mr. Miotto, each of whom has been determined by the Board of Directors to be independent.
Our Compensation Committee has primary responsibility for ensuring that our executive compensation and benefit program is consistent with our compensation philosophy and is responsible for determining the executive compensation packages offered to our named executive officers. The responsibilities of the Compensation Committee, as stated in its charter, include the following:
|
|
●
|
Review and approve goals and objectives relevant to CEO and other executive officer compensation, evaluate the CEO’s and other executive officers’ performance in light of these corporate goals and objectives, and set CEO and other executive officer compensation levels consistent with its evaluation and the company philosophy;
|
|
|
●
|
Approve the salaries, bonus and other compensation for all executive officers, provided that as to the CEO, the committee will recommend appropriate salary, bonus and other compensation to the Board for approval;
|
|
|
●
|
Adopt, administer, amend or terminate compensation plans applicable to any class of employees of the Company and/or any subsidiary of the Company, and review and make recommendations concerning long-term incentive compensation plans, including the use of stock options and other equity-based plans; and
|
|
|
●
|
Undertake all further actions and discharge all further responsibilities imposed upon the Committee from time to time by the Board, the federal securities laws or the rules and regulations of the SEC.
|
Our Compensation Committee plays an integral role in setting the named executive officer compensation each year. Generally, during the fourth quarter of each year and leading up to the adoption by the Board of the annual operating plan for the following year, the Compensation Committee meets to discuss recent data and current trends in equity ownership programs for comparable companies. During such meeting, an independent compensation consultant engaged by the committee provides a report to the Compensation Committee regarding this information. Generally, in the first quarter or the early part of the following year, our Compensation Committee holds a regular meeting in which our Chief Executive Officer and Chief Financial Officer review with the Compensation Committee GigOptix’ financial and business performance for the prior year and management’s business outlook and operating plan for the current year as adopted by the Board at the end of the prior year. In reviewing the prior year’s performance, the Compensation Committee compares our performance to the financial and operational goals set for such year and any management by objectives targets set for such year. In this meeting, the Chief Executive Officer also reviews with the Compensation Committee his assessment of the individual performance of each named executive officer, including his own performance, according to a variety of qualitative performance criteria and salary and bonus trends. Taking into account the information conveyed and discussed at these meetings and the recommendations of our Chief Executive Officer and the independent compensation consultant engaged by the committee, the Compensation Committee then determines, subject in some cases to ratification by the full Board of Directors:
|
|
●
|
The amount and type of any bonus compensation to be awarded to each named executive officer in respect of the prior year’s performance;
|
|
|
●
|
Whether to raise, lower or maintain the named executive officer’s base salary for the current year; and
|
|
|
●
|
Option grants and restricted stock units, if any, to be awarded to each named executive officer.
|
Each element of our named executive compensation system is described in more detail below.
Comparable Company Comparisons
Each year, the Compensation Committee reviews the named executive officer compensation programs and amounts at comparable companies. GigOptix’ total cash compensation packages are designed to be near the median of total target cash compensation among comparable companies for median performance by comparable executives. Our equity compensation program is designed to provide a percentage ownership of GigOptix that is relatively comparable to the median percentage ownership among these comparable companies. However, the individual elements of our executive program (base salary, annual incentive compensation, equity compensation and benefits) may vary from group medians as the Compensation Committee or the Board of Directors deems appropriate. In addition, we may reduce cash compensation and award RSUs vesting over the course of the following year to make up for such cash compensation reduction.
Each year, we engage an independent outside firm which specializes in executive compensation. During 2011 and 2012, we engaged Compensia. For this purpose, for 2012, the Compensation Committee looked at companies with less than $50 million in annual revenues as described by the Proprietary 2012 Executive Compensation Survey published by Compensia as well as peer company proxy filings. We believe those two data sources are appropriate for benchmarking executive compensation because: the companies surveyed are similar in size, both in terms of revenues and market capitalization, to GigOpitx; are primarily located in the same geographic market as GigOptix; GigOptix competes with many of the surveyed companies for executive and technical talent; and companies in the indices are selected independently by Compensia. We do not benchmark our executive compensation solely against companies in our industry because few of our competitors are close to our size. Most of our competitors are very large, diversified companies or very small, privately-held companies. Rather, we focus on the companies with whom we compete most vigorously for executive and technical talent.
Elements of Named Executive Officer Compensation
Our named executive officer compensation consists of base salary, annual cash incentive, equity plan participation and customary broad-based employee benefits. Consistent with our pay for performance philosophy, we believe that we can better motivate the named executive officers to enhance stockholder return if a portion of their compensation is “at risk”— that is, contingent upon the achievement of performance objectives and overall strong company performance. The mix of base salary, annual bonus opportunity based on achievement of objectives and anticipated long-term stock-based compensation incentive (in the form of appreciation in shares underlying stock options and restricted stock units) varies depending on the officer’s position level. Long-term stock-based compensation has always been a significant component of the named executive officer compensation, as we believe that best aligns our named executive officers’ interests with that of our stockholders. An annual bonus opportunity may also form a significant component of the named executive compensation; however, as explained in more detail below, it was not a component of the named executive compensation in 2012 and is not likely to form a significant component of the named executive officer compensation in 2013.
Base Salary: Base salaries for our named executive officers are established based on the scope of their responsibilities, taking into account market compensation paid by comparable companies for equivalent positions. Base salaries are reviewed on an annual basis and any increases are similar in scope to our overall corporate salary increase, if any. For comparison purposes, we have utilized compensation survey data from Compensia and the peer company proxy filings. Our philosophy is to target the named executive officer base salaries near the median range of salaries for executives in equivalent positions at comparable companies. We believe targeting the named executive officer salaries near the median relative to comparable companies reflects our best efforts to ensure we are neither overpaying nor underpaying our named executive officers.
Annual Cash Incentive: Our employment contracts with our named executive officers provide them with an opportunity to receive annual cash incentive compensation consisting of the possibility of receipt of a cash bonus award, payable once per year. Any such cash bonus would be dependent, in part, upon attaining stated corporate objectives for the prior fiscal year. Our goal with bonuses to our named executive officers is to reward executives in a manner that is commensurate with the level of achievement of certain financial and strategic goals that we believe, if attained, result in greater long-term stockholder value. The Board of Directors approves these financial and strategic goals on an annual basis. These financial and strategic goals typically have a one-year time horizon. For both the years 2011 and 2012, the Board of Directors determined that the objectives necessary to make awards of cash incentive compensation had not been met, due to the difficult economic environment and its impact on GigOptix’s financial performance. Therefore, there were no payment of 2011 and 2012 annual cash bonuses paid for our Chief Executive Officer or our other named executive officers.
Warrants, Stock Options and Restricted Stock Units: We believe that stock ownership is an important factor in aligning corporate and individual goals. Therefore, we utilize stock options and, beginning in 2012, restricted stock units, to encourage long-term performance, with excellent corporate performance (as manifested in our common stock price) and extended officer tenure producing potentially significant value. Upon joining GigOptix, the named executive officers have received an initial stock option grant. This grant has been based on relevant industry comparisons, including data from Compensia, and was intended to be commensurate with the experience level and scope of responsibilities of the incoming executive officer. In addition, all named executive officers receive annual option grants, and beginning in 2010, restricted stock unit grants. On an annual basis, the Compensation Committee, reviews with the Board the percentage ownership of GigOptix held by employees, and compares that to the employee ownership of comparable companies. The Compensation Committee uses this metric because it is easy to measure and compare to comparable companies. Based on its review, the Compensation Committee approves an annual grant.
All option and restricted stock unit grants are approved by both the Compensation Committee and the Board at GigOptix’s regular quarterly Board of Directors meeting. The exercise price for option awards is determined as the closing price on the day prior to grant. As permitted under U.S. generally accepted accounting principles, GigOptix has historically determined fair market value under its stock option plans based upon the closing market price as reported by the NYSE MKT for the day of the grant.
Other Benefits: Named executive officers are eligible to participate in all of our employee benefit plans, such as medical, dental, group life, disability, and accidental death and dismemberment insurance and our 401(k) plan. During 2011 and 2012, we made group life insurance payments as reflected in the Summary Compensation Table below. We do not maintain any pension plan, retirement benefit or deferred compensation arrangements other than our 401(k) plan.
The table below sets forth the compensation earned by our Chief Executive Officer and our two other most highly compensated executive officers for the fiscal years ended December 31, 2012 and 2011 whose compensation exceeded $100,000. These individuals are collectively referred to as our named executive officers.
Summary Compensation Table
|
Name and Principal Position
|
Year
|
Salary
|
Bonus
|
RSU's
|
Option
|
All Other
|
Total
|
||||||||||||||||||
|
Awards(1)
|
Compensation
|
||||||||||||||||||||||||
|
(a)
|
(a)
|
||||||||||||||||||||||||
|
Dr. Avi Katz
|
2012
|
$ | 404,250 | $ | - | $ | 617,968 | $ | 956,481 | $ | 1,198 | $ | 1,979,897 | ||||||||||||
|
Chairman of the Board of Directors, Chief Executive Officer and President
|
2011
|
$ | 370,731 | $ | 410,000 | $ | - | $ | 1,351,611 | $ | 978 | $ | 2,133,320 | ||||||||||||
|
Andrea Betti-Berutto
|
2012
|
$ | 250,842 | $ | - | $ | 174,051 | $ | 358,681 | $ | 343 | $ | 783,918 | ||||||||||||
|
Senior Vice President and Chief Technology Officer
|
2011
|
$ | 231,207 | $ | 40,000 | $ | - | $ | 378,563 | $ | 296 | $ | 650,066 | ||||||||||||
|
Curt Sacks (2)
|
2012
|
$ | 250,842 | $ | 110,000 | $ | 139,940 | $ | 358,681 | $ | 234 | $ | 859,697 | ||||||||||||
|
Senior Vice President and Chief Financial Officer
|
2011
|
$ | 150,877 | $ | - | $ | - | $ | 561,085 | $ | 103 | $ | 712,065 | ||||||||||||
|
(1)
|
The amounts in column (a) represent the aggregate grant date fair value computed in accordance with FASB ASC Topic 718. Assumptions used in the calculation of these amounts are included in Note 7-Stockholders’ Equity, to our audited financial statements for the fiscal year ended December 31, 2012 and 2011 included in this Form 10-K.
|
|
(2)
|
Curt Sacks, our current Chief Financial Officer, joined the company on June 17, 2011.
|
Narrative Disclosure to Summary Compensation Table
The Summary Compensation Table sets forth the aggregate compensation earned by each of our named executive officers in 2012 and 2011.
The components of executive compensation consist of base salary, annual bonus incentives, equity plan participation and customary broad-based employee benefits, as set forth in more detail above. Annual cash or stock-based compensation bonuses are awarded in the discretion of the Compensation Committee of the Board of Directors after a review and evaluation of each executive officer’s performance during the year. Equity grants generally consist of stock options and restricted stock units and are intended to serve respectively as long-term compensation and short-term awards in lieu of higher cash payouts. The Compensation Committee may also authorize special compensation awards in the form of cash or equity grants to recognize extraordinary efforts or results.
Equity awards such as options and restricted stock units are generally granted pursuant to the GigOptix, Inc. 2008 Equity Incentive Plan. Option grants to our executive officers generally vest as to 25% of the underlying award on the one-year anniversary of the grant date and monthly thereafter for a period of three years. However, certain options grants to our executive officers vest in accordance with certain performance goals being achieved, as discussed in more detail below in the vesting schedules for such option grant. In the case of stock options, the exercise price is set at 100% of the fair market value of the underlying common stock on the date of grant. Restricted stock unit grants vest quarterly over the period of a year. Upon vesting, a restricted stock unit is converted to an actual share of stock.
We have entered into an employment agreement with each of our executive officers, which governs the terms of employment as well as provides for certain payments upon termination of employment. The employment agreements for the named executive officers are discussed in more detail below under the caption “Employment Arrangements with Named Executive Officers.”
Outstanding Equity Awards at Fiscal Year-End (2012)
|
Option Awards
|
||||||||||||||||||
|
Name and Principal Position
|
Grant
Date
|
Number of Securities Underlying Unexercised Options (#) Exercisable
|
Number of Securities Underlying Unexercised Options (#) Unexercisable
|
Exercise
Price
($)
|
Option
Expiration
Date
|
Number of
Securities
Underlying
Unvested
Restricted
Stock Units
(#) Unvested
|
||||||||||||
|
Dr. Avi Katz
|
8/1/07
|
166,606 | - | $ | 0.73 |
8/1/17
|
||||||||||||
|
Chief Executive Officer and President
|
11/6/08
|
37,048 | - | $ | 6.08 |
7/16/13
|
||||||||||||
|
12/17/08
|
581,338 | - | $ | 1.10 |
12/17/18
|
|||||||||||||
|
3/19/09
|
72,901 | 4,863 | $ | 0.95 |
3/19/19
|
|||||||||||||
|
11/9/09
|
100,200 | 29,800 | $ | 3.50 |
11/9/19
|
|||||||||||||
|
3/17/10
|
260,659 | 120,241 | $ | 1.95 |
3/17/20
|
|||||||||||||
|
10/27/10
|
192,778 | 155,567 | $ | 2.40 |
10/27/20
|
|||||||||||||
|
2/3/11
|
185,791 | 219,573 | $ | 2.50 |
2/3/21
|
|||||||||||||
|
6/17/11
|
284,079 | 140,133 | $ | 2.65 |
6/17/21
|
|||||||||||||
|
3/27/12
|
- | 537,500 | $ | 2.70 |
3/27/22
|
|||||||||||||
|
3/27/12
|
- | - | $ | - |
3/27/22
|
39,744 | ||||||||||||
|
5/3/12
|
- | - | $ | - |
5/3/22
|
15,574 | ||||||||||||
|
Andrea Betti-Berutto
|
8/1/07
|
112,612 | - | $ | 0.73 |
8/1/17
|
||||||||||||
|
Senior Vice President and Chief Technology Officer
|
11/6/08
|
22,900 | - | $ | 6.08 |
7/16/13
|
||||||||||||
|
12/17/08
|
238,913 | - | $ | 1.10 |
12/17/18
|
|||||||||||||
|
3/19/09
|
33,789 | 2,236 | $ | 0.95 |
3/19/19
|
|||||||||||||
|
11/9/09
|
29,277 | 8,734 | $ | 3.50 |
11/9/19
|
|||||||||||||
|
3/17/10
|
82,276 | 36,724 | $ | 1.95 |
3/17/20
|
|||||||||||||
|
10/27/10
|
77,218 | 62,336 | $ | 2.40 |
10/27/20
|
|||||||||||||
|
2/3/11
|
64,756 | 76,531 | $ | 2.50 |
2/3/21
|
|||||||||||||
|
6/17/11
|
32,892 | 54,821 | $ | 2.65 |
6/17/21
|
|||||||||||||
|
3/27/12
|
- | 201,563 | $ | 2.70 |
3/27/22
|
|||||||||||||
|
3/27/12
|
- | - | $ | - |
3/27/22
|
9,865 | ||||||||||||
|
5/3/12
|
- | - | $ | - |
5/3/22
|
5,573 | ||||||||||||
|
Curt Sacks
|
6/17/11
|
123,750 | 206,250 | $ | 2.65 |
6/17/21
|
||||||||||||
|
Senior Vice President and Chief Financial Officer
|
3/27/12
|
- | 201,563 | $ | 2.70 |
3/27/22
|
||||||||||||
|
3/27/12
|
- | - | $ | - |
3/27/22
|
9,865 | ||||||||||||
|
5/3/12
|
- | - | $ | - |
5/3/22
|
2,757 | ||||||||||||
|
Grant Date
|
Vesting Schedule for Dr. Katz
|
|
|
5/3/12
|
The grant of 62,296 restricted stock units vested as to 25% of the underlying award on the following dates 5/10/2012, 8/10/2012, 11/09/2012, and 3/1/2013.
|
|
|
3/27/12
|
The grant of 537,500 stock options vested as to 25% of the underlying award on the first anniversary of the grant date and as to 1/36 of the underlying award every month thereafter for three years.
|
|
|
3/27/12
|
The grant of 158,967 restricted stock units vested as to 25% of the underlying award on the following dates 5/10/2012, 8/10/2012, 11/09/2012, and 3/1/2013.
|
|
|
6/17/11
|
In total Dr. Katz was granted 424,212 options on 6/17/11. 100,000 of the options were vested on the day of grant. An additional 100,000 options vested on the six month anniversary of the day of grant. The remaining 224,212 options will be vested as to 25% of the underlying award on the first anniversary of the grant date and as to 1/36 of the underlying award every month thereafter for three years.
|
|
|
2/3/11
|
The grant of 405,364 stock options vested as to 25% of the underlying award on the first anniversary of the grant date and as to 1/36 of the underlying award every month thereafter for three years.
|
|
|
10/27/10
|
The vesting of 116,115 shares of the grant of 348,344 stock options was subject to our meeting certain financial goals for the first two quarters of 2011. As the Board of directors determined that the underlying goals were satisfied, 29,029 shares of the underlying award were vested on July 27, 2011, and an additional 87,086 shares are to be vested on a monthly basis thereafter over a 39 month period; in addition 58,057 shares of the underlying award vested on October 27, 2011, and the remaining 174,172 shares of the stock options will vest on a monthly basis thereafter over a 36 month period.
|
|
|
3/17/10
|
In total Dr. Katz was granted 503,000 options on 3/17/10. 203,000 stock options vests as to 25% of the underlying award on the first anniversary of the grant date and as to 1/36 of the remaining options every month thereafter for three years. An additional 121,100 options were vested on April 1, 2011 as the average closing price of the Company’s common stock during March 2011 was greater than $2.50; 122,100 options were cancelled on April 1, 2012 because the average closing price of the Company’s common stock during March 2012 was below $3.50; and an additional 56,800 options will vest on April 1, 2013 if the average closing price of the Company’s common stock during March 2013 is equal to or greater than $5.00; if not, then these options will be cancelled.
|
|
|
11/9/09
|
The grant of 130,000 stock options vested as to 25% of the underlying award on the first anniversary of the grant date and as to 1/36 of the underlying award every month thereafter for three years.
|
|
|
3/19/09
|
The grant of 77,764 stock options vested as to 25% of the underlying award on the first anniversary of the grant date and as to 1/36 of the underlying award every month thereafter for three years.
|
|
|
12/17/08
|
Grant of 581,338 stock options vests as to 25% of the underlying award on the one year anniversary of the grant date and as to 1/36 of the underlying award every month thereafter for three years.
|
|
|
11/6/08
|
Warrant to purchase 37,048 shares was fully vested as of the grant date.
|
|
|
8/1/07
|
The grant of 137,500 stock options vested as to 25% of the underlying award on the first anniversary of the grant date and as to 1/36 of the underlying award every month thereafter for three years, and then 50% of the unvested options were fully vested upon the closing of the GigOptix LLC merger with Lumera Corporation and the other 50% will be vested on 12/31/2009. The grant of 10,313 stock options, which was to vest upon the schedule closing of a financing event, fully vested upon the closing of the GigOptix LLC merger with Lumera Corporation. The grants of 27,500 stock options and 6,875 stock options were fully vested on the grant date.
|
|
Grant Date
|
Vesting Schedule for Mr. Betti-Berutto
|
|
|
5/3/12
|
The grant of 22,283 restricted stock units vested as to 25% of the underlying award on the following dates 5/10/2012, 8/10/2012, 11/09/2012, and 3/1/2013.
|
|
|
3/27/12
|
The grant of 201,563 stock options vested as to 25% of the underlying award on the first anniversary of the grant date and as to 1/36 of the underlying award every month thereafter for three years.
|
|
|
3/27/12
|
The grant of 39,457 restricted stock units vested as to 25% of the underlying award on the following dates 5/10/2012, 8/10/2012, 11/09/2012, and 3/1/2013.
|
|
|
6/17/2011
|
The grant of 87,713 stock options will be vested as to 25% of the underlying award on the first anniversary of the grant date and as to 1/36 of the underlying award every month thereafter for three years.
|
|
|
2/3/2011
|
The grant of 141,287 stock options vested as to 25% of the underlying award on the first anniversary of the grant date and as to 1/36 of the underlying award every month thereafter for three years.
|
|
|
10/27/10
|
The vesting of 46,518 shares of the grant of 139,554 stock options was subject to our meeting certain financial goals for the first two quarters of 2011. As the Board of directors determined that the underlying goals were satisfied, 11,630 shares of the underlying award were vested on July 27, 2011, and an additional 34,888 shares will vest on a monthly basis thereafter over a 39 month period; in addition 23,259 shares of the underlying award vested on October 27, 2011, and the remaining 69,777 shares of the stock options will vest on a monthly basis thereafter over a 36 month period.
|
|
|
3/17/10
|
In total Mr. Betti-Berutto was granted 162,000 options on 3/17/10. 61,500 stock options vested as to 25% of the underlying award on the first anniversary of the grant date and as to 1/36 of the remaining options every month thereafter for three years. An additional 40,000 options were vested on April 1, 2011 as the average closing price of the Company’s common stock during March 2011 was greater than $2.50; 43,000 options were cancelled on April 1, 2012 because the average closing price of the Company’s common stock during March 2012 was below $3.50; and an additional 17,500 options will vest on April 1, 2013 if the average closing price of the Company’s common stock during March 2013 is equal to or greater than $5.00; if not, then these options will be cancelled.
|
|
|
11/9/09
|
The grant of 38,011 stock options vested as to 25% of the underlying award on the one year anniversary of the grant date and as to 1/36 of the underlying award every month thereafter for three years.
|
|
|
3/19/09
|
The grant of 36,025 stock options vested as to 25% of the underlying award on the one year anniversary of the grant date and as to 1/36 of the underlying award every month thereafter for three years.
|
|
|
12/16/08
|
The grant of 238,913 stock options vested as to 25% of the underlying award on the one year anniversary of the grant date and as to 1/36 of the underlying award every month thereafter for three years.
|
|
|
11/6/08
|
Warrant to purchase 22,900 shares was fully vested as of the grant date.
|
|
|
8/1/07
|
The grant of 68,200 stock options vested as to 25% of the underlying award on the first anniversary of the grant date and as to 1/36 of the underlying award every month thereafter for three years, and then 50% of the unvested option were fully vested upon the closing of the GigOptix LLC merger with Lumera Corporation and the other 50% vested on 12/31/2009. The grant of 44,412 stock options was fully vested on the grant date.
|
|
Grant Date
|
Vesting Schedule for Mr. Sacks
|
|
|
5/3/12
|
The grant of 11,025 restricted stock units vested as to 25% of the underlying award on the following dates 5/10/2012, 8/10/2012, 11/09/2012, and 3/1/2013.
|
|
|
3/27/12
|
The grant of 201,563 stock options vested as to 25% of the underlying award on the first anniversary of the grant date and as to 1/36 of the underlying award every month thereafter for three years.
|
|
|
3/27/12
|
The grant of 39,457 restricted stock units vested as to 25% of the underlying award on the following dates 5/10/2012, 8/10/2012, 11/09/2012, and 3/1/2013.
|
|
|
6/17/11
|
The grant of 330,000 stock options vested as to 25% of the underlying award on the first anniversary of the grant date and as to 1/36 of the underlying award every month thereafter for three years.
|
Employment Arrangements with Named Executive Officers
We do not have deferred compensation plans, pension plans or other similar arrangements or plans for our executive officers, except a tax-qualified 401(k) Plan, which is available generally to all of our employees.
On March 27, 2012 and August 10, 2012 the Board of Directors, upon recommendation of the Compensation Committee, approved an amendment to the Employment Agreement of Dr. Katz, our Chief Executive Officer. The agreement establishes his annual salary, bonuses and eligibility for health benefits, among other provisions and clarifies the severance which he is entitled to receive in the event that his employment with the Company is terminated without “cause” or he resigns for “good reason” (as those terms are defined in his Employment Agreement). Dr. Katz would be entitled to receive a pro-rated annual bonus plus severance in installments over a six month period, in an amount of up to six months of his respective annual base salary then in effect and a lump sum payment equal to thirty months of his annual base salary following the initial six month period plus the vesting of all outstanding, unvested awards. In the event that such termination occurs within twelve months following a Change of Control (as such term is defined in his Employment Agreements), then Dr. Katz will be entitled to a pro-rated annual bonus plus lump sum severance amount equal to three years’ worth of his annual base salary plus average annual bonuses, the vesting of all outstanding, unvested awards and a potential tax equalization payment or gross-up payment which would place Dr. Katz in the same after-tax position as if any excise tax penalty did not apply. Existing restrictions on competition and solicitation of customers and employees of the Company as conditions to receipt of severance have not been amended.
On March 27, 2012 and August 10, 2012 the Board of Directors, upon recommendation of the Compensation Committee, approved an amendment to the Employment Agreements of Mr. Sacks, our Chief Financial Officer, and Mr. Betti-Berutto, our Chief Technical Officer. The agreements establish their annual salary, bonuses and eligibility for health benefits, among other provisions and clarify the severance which either is entitled to receive in the event that his employment with the Company is terminated without “cause” or either resigns for “good reason” (as those terms are defined in his Employment Agreement). Messrs. Sacks and Betti-Berutto would be entitled to receive a pro-rated annual bonus plus severance in installments over a six month period, in an amount of up to six months of their respective annual base salary then in effect and a lump sum payment equal to six months of their respective annual base salary following the initial six month period plus the vesting of all outstanding, unvested awards. In the event that such termination occurs within twelve months following a Change of Control (as such term is defined in their respective Employment Agreements), then Messrs. Sacks and Betti-Berutto will be entitled to a pro-rated annual bonus plus lump sum severance amount equal to one year worth of their respective annual base salary plus average annual bonuses, the vesting of all outstanding, unvested awards and a potential tax equalization payment or gross-up payment which would place the executives in the same after-tax position as if any excise tax penalty did not apply.
The GigOptix, Inc. 2008 Equity Incentive Plan contains certain provisions for change in control transactions. In the event of a Covered Transaction (as defined in the plan), the outstanding awards must either be assumed or substituted by the successor company or will be fully accelerated prior to the closing of the Covered Transaction.
Director Compensation
The following table sets forth the compensation earned for services performed for us as a director by each member of our board of directors, other than any directors who are also our named executive officers, during the fiscal year ended December 31, 2012.
|
2012 Director Compensation Table
|
||||||||||||||||
|
Fees Earned or
Paid in Cash
|
Restricted Stock
Units
|
Option Awards
|
Total
|
|||||||||||||
|
Name
|
(1) | |||||||||||||||
|
Kimberly D.C. Trapp
|
$ | 9,000 | $ | 41,328 | $ | 44,488 | $ | 94,815 | ||||||||
|
Neil J. Miotto
|
$ | 27,000 | $ | 48,941 | $ | 53,385 | $ | 129,326 | ||||||||
|
John J. Mikulsky
|
$ | 9,000 | $ | 36,706 | $ | 44,488 | $ | 90,194 | ||||||||
|
Frank Schneider
|
$ | 9,000 | $ | 47,168 | $ | 53,385 | $ | 109,553 | ||||||||
|
Joseph J. Lazzara
|
$ | 9,000 | $ | 36,706 | $ | 44,488 | $ | 90,194 | ||||||||
|
David T. Mitchell
|
$ | 3,000 | $ | - | $ | 74,380 | $ | 77,380 | ||||||||
|
(1)
|
The amounts represent the aggregate grant date fair value computed in accordance with FASB ASC Topic 718. Assumptions used in the calculation of these amounts are included in Note 7-Stockholders’ Equity , to our audited financial statements for the fiscal year ended December 31, 2012 included in this Annual Report on Form 10-K.
|
As of December 31, 2012, each current director, other than directors who are also our named executive officers, held the following outstanding options and restricted stock unit awards:
|
Name
|
Aggregate
Number of
Shares
Underlying
Stock Options
(#)
|
Aggregate
Number of
Shares
Underlying Restricted Stock Units (#)
|
||
|
Joseph J. Lazzara
|
65,000
|
5,094
|
||
|
John J. Mikulsky
|
65,000
|
5,094
|
||
|
Neil J. Miotto
|
218,600
|
6,791
|
||
|
David T. Mitchell
|
50,000
|
-
|
||
|
Frank Schneider
|
167,500
|
6,542
|
||
|
Kimberly D.C. Trapp
|
191,822
|
4,689
|
|
Item 12.
|
Security Ownership Of Certain Beneficial Owners And Management And Related Stockholder Matters.
|
SECURITY OWNERSHIP OF CERTAIN BENEFICIAL OWNERS AND MANAGEMENT
The following table sets forth information regarding the beneficial ownership of our common stock as of March 1, 2013 by:
|
|
·
|
each person known by us to be the beneficial owner of more than 5% of our outstanding shares of common stock;
|
|
|
·
|
each of our named executive officers and directors; and
|
|
|
·
|
all of our current executive officers and current directors, as a group.
|
Beneficial ownership is determined in accordance with the rules of the Securities and Exchange Commission. Applicable percentages are based on 22,329,758 shares of our common stock outstanding as of March 8, 2013, adjusted as required by such rules. As provided by such rules, shares of our common stock issuable pursuant to options to purchase or other rights to acquire shares of common stock that are exercisable within 60 days of March 8, 2013 are deemed to be both beneficially owned by the person holding such options and outstanding for the purpose of computing ownership of such person, but are not treated as outstanding for the purpose of computing the ownership of any other person. Except as indicated by footnote, to our knowledge, the persons named in the table have sole voting and investment power with respect to all shares of common stock shown as beneficially owned by them. The information contained in the following table is not necessarily indicative of beneficial ownership for any other purpose and the inclusion of any shares in the table does not constitute an admission of beneficial ownership of those shares.
|
Beneficial Ownership of Our
Common Stock as of March 8,
2013
Common Stock (1)
|
||||
|
5% Stockholders
|
Shares
|
Percent of
Class
|
||
|
ACT Capital Management LLLP (3)
|
1,793,000
|
8.0%
|
||
|
DBSI Liquidating Trust (2)
|
1,575,520
|
6.8%
|
||
|
Named Executive Officers and Directors
|
||||
|
Dr. Avi Katz (4)
|
2,277,531
|
9.3%
|
||
|
Andrea Betti-Berutto (4)
|
842,944
|
*
|
||
|
Curt Sacks (4)
|
253,096
|
*
|
||
|
Neil J. Miotto (4)
|
194,101
|
*
|
||
|
Frank Schneider (4)
|
164,334
|
*
|
||
|
John J. Mikulsky (4)
|
143,581
|
*
|
||
|
Kimberly D.C. Trapp (4)
|
132,881
|
*
|
||
|
Joseph J. Lazzara (4)
|
56,119
|
*
|
||
|
David T. Mitchell (4)
|
-
|
*
|
||
|
All current directors and executive officers 9 persons
|
4,064,587
|
15.6%
|
||
|
*
|
Represents less than 1% of our outstanding common stock.
|
|
(1)
|
Unless otherwise indicated, each person’s address is c/o GigOptix, Inc., 130 Baytech Drive, San Jose, California 95134.
|
|
(2)
|
According to a Schedule 13G filed with the SEC on January 23, 2013 Conrad Myers, Liquidating Trustee (the “Trustee”) of the DBSI Liquidating Trust (the “Trust”), is acting under the terms and conditions of the DBSI Liquidating Trust Agreement and Declaration of Trust dated October 29, 2010, by and among DBSI Consolidated Debtors, as substantively consolidated debtors and debtors in possession under the “Second Amended Joint Chapter 11 Plan of Liquidation filed by the Chapter 11 Trustee and the Official Committee of Unsecured Creditors” (the “Plan of Liquidation”), confirmed by Order dated October 29, 2010 in the Chapter 11 Cases In re DBSI, Inc. et al., Case No. 08-12687 (PJW), the United States Bankruptcy Court, District of Delaware. Pursuant to the Plan of Liquidation, the Trust now holds 575,520 shares of our common stock and warrants that are currently exercisable with respect to 1,000,000 shares of our common stock. The Trustee disclaims beneficial ownership of such shares and warrants. The address for the Trust and the Trustee is 6327 SW Capitol Hwy, PMB 221, and Portland, Oregon 97239.
|
|
(3)
|
The information as to ACT Capital Management LLLP is derived from a Schedule 13G filed with the SEC on January 29, 2013. Amir L. Ecker and Carol G. Frankenfield are the General Partners of ACT Capital Management, LLLP. Investment decisions made on behalf of ACT Capital Management, LLLP are made primarily by its General Partners. The principal business address is 2 Radnor Corporate Center, Suite 111, Radnor, PA 19087.
|
|
(4)
|
Includes options to purchase shares of common stock exercisable within 60 days of March 8, 2013 as follows: 2,179,683 for Dr. Katz; 791,434 for Mr. Betti-Berutto; 205,839 for Mr. Sacks; 127,149 for Ms. Trapp; 146,004 for Mr. Miotto, 25,103 for Mr. Mikulsky, 104,708 for Mr. Schneider; 25,103 for Mr. Lazzara; and 0 for Mr. Mitchell. Also includes warrants to purchase shares of common stock exercisable within 60 days of March 8, 2013 as follows: 22,900 for Mr. Betti-Berutto and 37,048 for Dr. Katz.
|
|
(5)
|
Includes shares held by the following individuals as of March 8, 2013: Dr. Avi Katz, Andrea Betti-Berutto, Curt Sacks, Kimberly D.C. Trapp, Neil J. Miotto, John J. Mikulsky, Frank Schneider, Joseph J. Lazzara, and David T. Mitchell.
|
|
(6)
|
Mr. Mitchell was appointed to our Board of Directors effective June 25, 2012.
|
|
(7)
|
Dr. Katz exceeded 5% beneficial ownership of our common stock on August 18, 2011, as reported in his Schedule 13D filed on August 19, 2011, and as amended in his Schedule 13D/A filed on January 28, 2013.
|
|
Item 13.
|
Certain Relationships and Related Transactions, and Director Independence
|
Director Independence
The Board of Directors has determined that Mr. Lazzara, Mr. Miotto, Mr. Schneider, Mr. Mitchell and Ms. Trapp are “independent” directors.
The Company uses the independence standards set forth by Section 803(a)(2) of the NYSE MKT Company Guide. In reviewing the independence of our directors against these standards, we consider relationships and transactions between each director and members of the director’s family with us and our affiliates. Each member of our two standing committees, the Audit Committee and the Compensation Committee, is independent as defined by Section 803(a)(2) of the NYSE MKT Company Guide, and each member of our Audit Committee is also independent as defined by Rule 10A-3(b)(1) under the Exchange Act.
|
Item 14.
|
Principal Accounting Fees and Services
|
The following table sets forth the aggregate fees billed or to be billed by Burr Pilger Mayer, Inc. for auditing and other services provided to GigOptix for the fiscal year 2012 and by Grant Thornton, LLP for auditing and other services provided to GigOptix for the fiscal year 2012 and 2011.
|
Burr Pilger Mayer, Inc.
|
Grant Thornton, LLP
|
|||||||||||||||
|
2012
|
2011
|
2012
|
2011
|
|||||||||||||
|
Audit Fees (1)
|
$ | 202,668 | $ | - | $ | 61,629 | $ | 308,087 | ||||||||
|
Audit-Related Fees (2)
|
$ | 14,190 | $ | - | $ | - | $ | 218,800 | ||||||||
|
Tax Fees (3)
|
$ | - | $ | - | $ | - | $ | - | ||||||||
|
(1)
|
Audit fees include fees for professional services rendered by our principal accountant for the audit of our annual financial statements, review of financial statements included in our Forms 10-Q and other services normally provided by accountants in connection with statutory and regulatory filings or engagements for those fiscal years. Included in audit fees for 2011 is $29,400 related to services rendered by Grant Thornton, LLP in connection with the Dutch Auction Tender Offer and filing of form S-8.
|
|
(2)
|
Audit-related fees include fees for professional services rendered by Burr Pilger Mayer, Inc. related to the audit of the Endwave 401(k) Plan and by Grant Thornton, LLP related to due diligence services and associated regulatory filings in connection with our acquisition of Endwave Corporation in 2011.
|
|
(3)
|
Fees for tax services relate to tax return preparation and other compliance services.
|
In considering the nature of the services provided by the independent registered public accounting firm, the Audit Committee determined that such services are compatible with the provision of independent audit services. The Audit Committee discussed these services with the independent registered public accounting firm and our management to determine that they are permitted under the rules and regulations concerning auditors’ independence promulgated by the Securities and Exchange Commission, as well as the American Institute of Certified Public Accountants.
Audit Committee Pre-Approval of Audit and Permissible Non-Audit Services of Independent Registered Public Accounting Firm
The Audit Committee pre-approves all audit services and all permitted non-audit services by the independent registered public accounting firm. The Audit Committee evaluates whether our use of the independent registered public accounting firm for permitted non-audit services is compatible with maintaining the independence of the independent registered public accounting firm. The Audit Committee’s policies prohibit us from engaging the independent registered public accounting firm to provide any services relating to bookkeeping or other services related to accounting records or financial statements, financial information systems design and implementation, appraisal or valuation services, fairness opinions or contribution-in-kind reports, actuarial services, or internal audit outsourcing services unless it is reasonable to conclude that the results of these services will not be subject to audit procedures. The Audit Committee’s policies prohibit us from engaging the independent registered public accounting firm to provide any services relating to any management function, expert services not related to the audit, legal services, broker-dealer, investment adviser, or investment banking services or human resource consulting. The Audit Committee approved in advance all fees for services provided by our independent registered public accounting firm, Grant Thornton LLP and Burr Pilger Mayer, Inc., for the year ended December 31, 2012 and 2011 and has concluded that the provision of these services is compatible with the accountants’ independence.
|
ITEM 15.
|
EXHIBITS AND FINANCIAL STATEMENT SCHEDULES
|
a) Documents filed as part of the report
(1) Financial Statements
Consolidated Balance Sheets – December 31, 2012 and 2011
Consolidated Statement of Operations – Years Ended December 31, 2012 and 2011
Consolidated Statements of Stockholders’ Equity– Years Ended December 31, 2012 and 2011
Consolidated Statements of Cash Flows for the Years Ended December 31, 2012 and 2011
(2) Financial Statement schedules have been omitted since they are either not required, not applicable, or the information is otherwise included.
(3) Exhibits
SIGNATURES
Pursuant to the requirements of Section 13 or 15(d) of the Securities Exchange Act of 1934, the registrant has duly caused this report to be signed on its behalf by the undersigned, thereunto duly authorized.
|
GigOptix, Inc.
|
||
|
|
|
|
|
By:
|
/S/ DR. AVI S. KATZ
|
|
|
|
Dr. Avi S. Katz, Chief
|
|
| Executive | ||
| Officer and Chairman of the | ||
| Board | ||
Date: March 25, 2013
KNOW ALL PERSONS BY THESE PRESENTS, that each person whose signature appears below hereby constitutes and appoints Dr. Avishay S. Katz, as his true and lawful attorney-in-fact and agent, with power to act with full power of substitution and resubstitution, to do any and all acts and things and to execute any and all instruments which said attorney and agent may deem necessary or desirable to enable the registrant to comply with the U.S. Securities Exchange Act of 1934, as amended, and any rules, regulations and requirements of the U.S. Securities and Exchange Commission thereunder in connection with the registrant’s Annual Report on Form 10-K for the fiscal year ended December 31, 2011 (the “Annual Report”), including specifically, but without limiting the generality of the foregoing, power and authority to sign the name of the registrant and the name of the undersigned, individually and in his capacity as a director or officer of the registrant, to the Annual Report as filed with the U.S. Securities and Exchange Commission, to any and all amendments thereto, and to any and all instruments or documents filed as part thereof or in connection therewith; and each of the undersigned hereby ratifies and confirms all that said attorney and agent shall do or cause to be done by virtue hereof.
Pursuant to the requirements of the Securities Exchange Act of 1934, this report has been signed by the following persons on behalf of the registrant and in the capacities and on the dates indicated.
|
NAME
|
|
TITLE
|
|
DATE
|
|
|
|
|
|
|
|
/S/ DR. AVI S. KATZ
|
|
Chief Executive Officer and Chairman of the Board
|
|
March 25, 2013
|
|
Dr. Avi S. Katz
|
|
(Principal Executive Officer)
|
|
|
|
|
|
|
|
|
|
/S/ CURT SACKS
|
|
Chief Financial Officer
|
|
March 25, 2013
|
|
Curt Sacks
|
|
(Principal Financial and Principal Accounting Officer)
|
|
|
|
/S/ JOSEPH J. LAZZARA
|
|
Director
|
|
March 25, 2013
|
|
Joseph J. Lazzara
|
|
|
|
|
|
|
|
|
|
|
|
/S/ JOHN J. MIKULSKY
|
|
Director
|
|
March 25, 2013
|
|
John J. Mikulsky
|
|
|
|
|
|
/S/ NEIL J. MIOTTO
|
|
Director
|
|
March 25, 2013
|
|
Neil J. Miotto
|
|
|
|
|
|
/S/ DAVID T. MITCHELL
|
|
Director
|
|
March 25, 2013
|
|
David T. Mitchell
|
|
|
|
|
|
/S/ FRANK W. SCHNEIDER
|
|
Director
|
|
March 25, 2013
|
|
Frank Schneider
|
|
|
|
|
|
|
|
|
|
|
|
/S/ KIMBERLY D.C. TRAPP
|
|
Director
|
|
March 25, 2013
|
|
Kimberly D.C. Trapp
|
|
|
|
|
EXHIBIT INDEX
|
Exhibit
Number
|
|
Description
|
|
|
|
|
|
2.1
|
|
Agreement and Plan of Merger, dated as of November 9, 2009, among GigOptix, Inc., Ahoy Acquisition Corporation and ChipX, Incorporated. Filed previously with the Registrant’s Current Report on Form 8-K filed on November 10, 2009.
|
|
|
|
|
|
2.2
|
|
Agreement and Plan of Merger, dated as of February 4, 2011, among GigOptix, Inc., Aerie Acquisition Corporation and Endwave Corporation. Filed previously with the Registrant’s Current Report on Form 8-K filed on February 7, 2011.
|
|
|
|
|
|
3.1
|
|
Form of Amended and Restated Certificate of Incorporation of the Registrant. Filed previously with the Registrant’s Registration Statement on Form S-4 filed on September 8, 2008, SEC File No. 333-153362.
|
|
|
|
|
|
3.2
|
|
Amended and Restated Bylaws of the Registrant. Filed previously with the Registrant’s Current Report on Form 8-K filed on June 4, 2009.
|
|
|
|
|
|
3.3
|
|
Certificate of Designation of Series A Junior Preferred Stock. Filed previously with the Registrant’s Registration Statement on Form 8-A filed on December 2011, SEC File No. 000-54572.
|
|
|
|
|
|
4.1
|
|
Form of Certificate representing the Common Stock, par value $0.001 per share, of the Registrant. Filed previously with the Registrant’s Amendment No. 2 to Registration Statement on Form S-4 filed on October 24, 2008, SEC File No. 333-153362.
|
|
|
|
|
|
4.2
|
|
Form of Warrant in connection with the Loan and Security Agreement, dated as of November 12, 2009, by and between GigOptix, Inc. and Bridge Bank, N.A. Filed previously with the Registrant’s Annual Report on Form 10-K for the fiscal year ended December 31, 2009, filed on March 31, 2010.
|
|
|
|
|
|
4.3
|
|
Warrant issued by GigOptix, Inc. to Bridge Bank, N.A. on April 7, 2010 in connection with the Loan and Security Agreement. Filed previously with the Registrant’s Annual Report on Form 10-K for the fiscal year ended December 31, 2010, filed on March 3, 2011.
|
|
|
|
|
|
4.4
|
|
Warrant for 500,000 shares of GigOptix common stock at $2.60 per share, dated April 8, 2011 between GigOptix, Inc. and the DBSI Liquidating Trust. Filed previously with the Registrant’s Current Report on Form 8-K filed on April 8, 2011.
|
|
|
|
|
|
4.5
|
|
Warrant for 500,000 shares of GigOptix common stock at $3.00 per share, dated April 8, 2011 between GigOptix, Inc. and the DBSI Liquidating Trust. Filed previously with the Registrant’s Current Report on Form 8-K filed on April 8, 2011.
|
|
|
|
|
|
4.6
|
|
Rights Agreement, dated as of December 16, 2011, between GigOptix, Inc. and American Stock Transfer & Trust Company, LLC, as Rights Agent, including the Summary of Rights as Exhibit A, the Form of Rights Certificate as Exhibit B and the Certificate of Designation of Series A Junior Preferred Stock as Exhibit C. Filed previously with the Registrant’s Registration Statement on Form 8-A filed on December 2011, SEC File No. 000-54572.
|
|
|
|
|
|
10.1
|
|
2000 Stock Option Plan of Lumera Corporation. Filed previously with Amendment No. 1 to Lumera Corporation’s Registration Statement on Form S-1 filed on June 24, 2004.
|
|
|
|
|
|
10.2
|
|
GigOptix, Inc. Amended and Restated 2008 Equity Incentive Plan. Filed previously as Appendix A to the Registrant's Proxy Statement on Schedule 14-A filed on September 29, 2011, SEC File No. 333-153362.
|
|
|
|
|
|
10.3
|
|
2004 Equity Incentive Plan of Lumera Corporation. Filed previously with Amendment No. 1 to Lumera Corporation’s Registration Statement on Form S-1 filed on June 24, 2004.
|
|
|
|
|
|
10.4
|
|
2007 GigOptix LLC Equity Incentive Plan. Filed previously with the Registrant’s Registration Statement on Form S-4 filed on September 8, 2008, SEC File No. 333-153362.
|
|
|
|
|
|
10.5
|
|
Lease Agreement, dated as of July 11, 2005, by and between S/I North Creek and Lumera Corporation for facilities located at 19910 North Creek Parkway, Bothell, WA. Filed previously with Lumera Corporation’s Current Report on Form 8-K filed on July 12, 2005.
|
|
10.6
|
|
Office Lease Agreement dated March 21, 2005 by and between EOP-Embarcadero Place, L.L.C. and iTerra Communications LLC for facilities located at 2400 Geng Road, Suite 100, Palo Alto, CA. Filed previously with the Registrant’s Amendment No. 2 to Registration Statement on Form S-4 filed on October 24, 2008, SEC File No. 333-153362.
|
|
|
|
|
|
10.7
|
|
First Amendment dated as of January 26, 2009 by and between EOP-Embarcadero Place, L.L.C. and the Company. Filed previously with Registrant’s Current Report on Form 8-K filed on January 21, 2008.
|
|
|
|
|
|
10.8
|
|
Exclusive Licensing Agreement effective October 20, 2000, by and between the University of Washington and Lumera Corporation. Filed previously with Lumera Corporation’s Registration Statement on Form S-1 filed on May 19, 2004.
|
|
|
|
|
|
10.9
|
|
License Agreement effective March 27, 2004, by and between Arizona Microsystems, L.L.C. and Lumera Corporation. Filed previously with Lumera Corporation’s Registration Statement on Form S-1 filed on May 19, 2004.
|
|
|
|
|
|
10.10
|
|
License Agreement dated August 31, 2007 by and between Digimimic S.r.l. and GigOptix LLC. Filed previously with the Registrant’s Registration Statement on Form S-4 filed on September 8, 2008, SEC File No. 333-153362.
|
|
|
|
|
|
10.11
|
|
Amendment to 2000 Stock Option Plan of Lumera Corporation. Filed previously with Amendment No. 1 to Lumera Corporation’s Registration Statement on Form S-1 filed on June 24, 2004.
|
|
|
|
|
|
10.12
|
|
Modulators Incorporating Polymers with Exceptionally High Electro-Optic Coefficients Development Agreement with the Defense Advanced Research Projects Agency dated June 30, 2006. Filed previously with Lumera Corporation’s Quarterly Report for the quarter ended June 30, 2006.
|
|
|
|
|
|
10.13
|
|
Form of Employment Agreement to be entered into between the Company and its executive officers. Filed previously with the Registrant’s 8-K filed on February 11, 2009.
|
|
|
|
|
|
10.14
|
|
Form of Incentive Stock Option Award Agreement. Filed previously with the Registrant’s Current Report on Form 8-K filed on March 17, 2009.
|
|
|
|
|
|
10.15
|
|
Form of Nonstatutory Stock Option Award Agreement. Filed previously with the Registrant’s Current Report on Form 8-K filed on March 17, 2009.
|
|
|
|
|
|
10.16
|
|
Third Amendment to Schnitzer North Creek Lease Agreement dated as of September 30, 2009. Filed previously with the Registrant’s Current Report on Form 8-K filed on October 5, 2009.
|
|
|
|
|
|
10.17
|
|
Loan and Security Agreement, dated as of November 12, 2009, by and among GigOptix, Inc., ChipX, Incorporated and Bridge Bank, N.A. Filed previously with the Registrant’s Current Report on Form 8-K filed on November 16, 2009.
|
|
|
|
|
|
10.18
|
|
Second Amendment to Lease Agreement, dated as of December 9, 2009, by and between GigOptix, Inc. and EOP-Embarcadero Place, L.L.C. Filed previously with the Registrant’s Current Report on Form 8-K filed on December 15, 2009.
|
|
|
|
|
|
10.19
|
|
Office Lease Agreement dated December 9, 2009 by and between GigOptix, Inc. and EOP-Embarcadero Place, L.L.P for headquarters located in Palo Alto, CA. Filed previously with the Registrant’s Current Report on Form 8-K filed on December 15, 2009.
|
|
|
|
|
|
10.20
|
|
Loan and Security Agreement, dated April 23, 2010 between GigOptix, Inc., ChipX, Incorporated and Silicon Valley Bank. Filed previously with the Registrant’s Current Report on Form 8-K filed on April 28, 2010.
|
|
|
|
|
|
10.21
|
|
Loan Agreement, dated January 29, 2010 between GigOptix, Inc., ChipX, Incorporated and Agility Capital, LLC. Filed previously with the Registrant’s Current Report on Form 10-K/A filed on June 6, 2010.
|
|
|
|
|
|
10.22
|
|
Registration Rights Agreement, dated June 30, 2010, by and between GigOptix, Inc. and James R. Zazzali, as trustee for the Chapter 11 debtors in the matter In re: DBSI, Inc., et al., Case No. 08-12687, pends in the United States Bankruptcy Court for the District of Delaware. Filed previously with the Registrant’s Annual Report on Form 10-K for the fiscal year ended December 31, 2010, filed on March 3, 2011.
|
|
10.23
|
Amendment to Registration Rights Agreement dated January 11, 2011, by and between GigOptix, Inc. and Conrad Myers, as Liquidating Trustee for the DBSI Liquidating Trust, as successor-in-interest to the Chapter 11 Debtors the matter In re: DBSI, Inc., et al., Case No. 08-12687, filed in the United States Bankruptcy Court for the District of Delaware. Filed previously with the Registrant’s Annual Report on Form 10-K for the fiscal year ended December 31, 2010, filed on March 3, 2011.
|
|
|
10.24
|
|
Settlement Agreement and Release, dated April 8, 2011 between Conrad Myers as Liquidating Trustee of the DBSI Liquidating Trust, James R. Zazzali as Trustee of the DBSI Estate Litigation Trust, GigOptix, Inc., GigOptix LLC and Joerg Wieland. Filed previously with the Registrant’s Current Report on Form 8-K filed on April 8, 2011.
|
|
|
|
|
|
10.25
|
|
Lease Agreement, by and between Legacy Partners I San Jose, LLC and Endwave Corporation, dated May 24, 2006, as amended by: (i) that certain First Amendment to Lease Agreement, by and between Legacy Partners I San Jose, LLC and Endwave Corporation, dated as of September 11, 2006; (ii) that certain Second Amendment to Lease Agreement, by and between Legacy Partners I San Jose, LLC and Endwave Corporation, dated as of December 6, 2006; (iii) that certain Third Amendment to Lease Agreement dated as of April 12, 2007, by and between Legacy Partners I San Jose, LLC and Endwave Corporation; and (iv) that certain Fourth Amendment to Lease Agreement dated as of June 17, 2011, by and between Legacy Partners I San Jose, LLC and GigOptix, Inc. Filed previously with the Registrant’s Current Report on Form 8-K filed on June 21, 2011.
|
|
|
|
|
|
10.26
|
|
Form of Indemnification Agreement. Filed previously with the Registrant’s Current Report on Form 8-K filed on June 21, 2011.
|
|
|
|
|
|
10.27
|
|
Agreement between Mr. Judson and GigOptix, Inc., dated as of November 21, 2011. Filed previously with the Registrant’s Current Report on Form 8-K filed on November 28, 2011.
|
|
|
|
|
|
10.28
|
|
Amended and Restated Loan and Security Agreement, dated December 9, 2011 between GigOptix, Inc., ChipX, Incorporated, Endwave Corporation and Silicon Valley Bank. Filed previously with the Registrant’s Current Report on Form 8-K filed December 13, 2011.
|
|
|
|
|
|
10.29*
|
|
Comprehensive Settlement Agreement and Mutual Release of Claims between GigOptix, Inc., ChipX, Incorporated and National Instruments Corporation, dated December 21, 2011.†
|
|
|
|
|
|
10.30*
|
|
Amendment No. 1 to Comprehensive Settlement Agreement and Mutual Release of Claims between GigOptix, Inc., ChipX, Incorporated and National Instruments Corporation, dated February 14, 2012.†
|
|
10.31
|
Form of Amendment of Award for Directors, dated as of March 27, 2012.
|
|
|
10.32
|
Amendment of Awards by and between GigOptix, Inc. and David T. (Tom) Mitchell, dated as of June 25, 2012. Filed previously with the Registrant’s Current Report on Form 8-K filed June 26, 2012.
|
|
|
10.33
|
Form of Restricted Stock Unite Notice of Grant and Agreement. Filed previously with the Registrant’s Current Report on Form 8-K filed March 28, 2012.
|
|
|
10.34
|
Amended and Restated Employment Agreement by and between GigOptix, Inc. and Dr. Avi S. Katz, dated as of August 10, 2012. Filed previously with the Registrant’s Current Report on Form 8-K filed August 15, 2012.
|
|
|
10.35
|
Amended and Restated Employment Agreement by and between GigOptix, Inc. and Curt P. Sacks, dated as of August 10, 2012. Filed previously with the Registrant’s Current Report on Form 8-K filed August 15, 2012.
|
|
|
10.36
|
Amended and Restated Employment Agreement by and between GigOptix, Inc. and Andrea Betti-Berutto, dated as of August 10, 2012. Filed previously with the Registrant’s Current Report on Form 8-K filed August 15, 2012.
|
|
|
10.37
|
Default Waiver and First Amendment dated August 23, 2012 to Amended and Restated Loan and Security Agreement, dated December 9, 2011, by and between Silicon Valley Bank and GigOptix, Inc., ChipX, Incorporated, and Endwave Corporation. Filed previously with the Registrant’s Current Report on Form 8-K filed August 27, 2012.
|
|
|
|
|
|
|
|
Subsidiaries of the registrant.
|
|
|
|
|
|
|
|
Consent of Burr Pilger Mayer, Inc. Independent Registered Public Accounting Firm.
|
|
|
Consent of Grant Thornton LLP, Independent Registered Public Accounting Firm
|
||
|
|
|
|
|
24.1*
|
|
Powers of Attorney (included on the signature pages hereto)
|
|
|
Chief Executive Officer certification pursuant to Rule 13a-14(a)/15d-14a of the Securities Exchange Act of 1934, as adopted pursuant to Section 302 of the Sarbanes-Oxley Act of 2002.
|
|
|
|
|
|
|
|
Chief Financial Officer certification pursuant to Rule 13a-14(a)/15d-14a of the Securities Exchange Act of 1934, as adopted pursuant to Section 302 of the Sarbanes-Oxley Act of 2002.
|
|
|
|
|
|
|
|
Chief Executive Officer certification pursuant to Rule 13a-14(b) or Rule 13d-14(b) and Section 1350, Chapter 63 of Title 18 United States Code (18 U.S.C. 1350) as adopted pursuant to Section 906 of Sarbanes-Oxley Act of 2002.
|
|
|
|
|
|
|
|
Chief Financial Officer certification pursuant to Rule 13a-14(b) or Rule 15d-14(b) and Section 1350, Chapter 63 of Title 18 United States Code (18 U.S.C. 1350) as adopted pursuant to Section 906 of Sarbanes-Oxley Act of 2002.
|
|
|
|
|
|
|
101.INS
|
|
Instance Document
|
|
|
|
|
|
101.SCH
|
|
XBRL Taxonomy Extension Schema Document
|
|
|
|
|
|
101.CAL
|
|
XBRL Taxonomy Extension Calculation Linkbase Document
|
|
|
|
|
|
101.DEF
|
|
XBRL Taxonomy Extension Definition Linkbase Document
|
|
|
|
|
|
101.LAB
|
|
XBRL Taxonomy Extension Label Linkbase Document
|
|
|
|
|
|
101.PRE
|
|
XBRL Taxonomy Extension Presentation Linkbase Document
|
|
*
|
Filed herewith
|
|
†
|
Portions of this exhibit have been omitted and filed separately with the Securities and Exchange Commission pursuant to a confidential treatment request under Rule 24b-2 of the Securities Exchange Act of 1934, as amended.
|
107