UNITED STATES
SECURITIES AND EXCHANGE COMMISSION
WASHINGTON, D.C. 20549
FORM 10-K
(Mark One)
|
☒ |
ANNUAL REPORT PURSUANT TO SECTION 13 OR 15(d) OF THE SECURITIES EXCHANGE ACT OF 1934 |
For the fiscal year ended December 31, 2017
OR
|
☐ |
TRANSITION REPORT PURSUANT TO SECTION 13 OR 15(d) OF THE SECURITIES EXCHANGE ACT OF 1934 |
For the transition period from _______ to _______
Commission file number 000-55774
BROADSTONE NET LEASE, INC.
(Exact name of registrant as specified in its charter)
|
Maryland |
26-1516177 |
|
(State or other jurisdiction of |
(I.R.S. Employer |
|
800 Clinton Square Rochester, New York |
14604 |
|
(Address of principal executive offices) |
(Zip Code) |
(585) 287-6500
(Registrant’s telephone number, including area code)
Securities registered pursuant to Section 12(b) of the Securities Exchange Act of 1934: None
Securities registered pursuant to Section 12(g) of the Securities Exchange Act of 1934: Common Stock, par value $0.001 per share
Indicate by check mark if the registrant is a well-known seasoned issuer, as defined in Rule 405 of the Securities Act. Yes ☐ No ☒
Indicate by check mark if the registrant is not required to file reports pursuant to Section 13 or Section 15(d) of the Act. Yes ☐ No ☒
Indicate by check mark whether the registrant (1) has filed all reports required to be filed by Section 13 or 15(d) of the Securities Exchange Act of 1934 during the preceding 12 months (or for such shorter period that the registrant was required to file such reports), and (2) has been subject to such filing requirements for the past 90 days. Yes ☒ No ☐
Indicate by check mark whether the registrant has submitted electronically and posted on its corporate Web site, if any, every Interactive Data File required to be submitted and posted pursuant to Rule 405 of Regulation S-T (§ 232.405 of this chapter) during the preceding 12 months (or for such shorter period that the registrant was required to submit and post such files). Yes ☒ No ☐
Indicate by check mark if disclosure of delinquent filers pursuant to Item 405 of Regulation S-K (§ 229.405 of this chapter) is not contained herein, and will not be contained, to the best of registrant’s knowledge, in definitive proxy or information statements incorporated by reference in Part III of this Form 10-K or any amendment to this Form 10-K. ☒
Indicate by check mark whether the registrant is a large accelerated filer, an accelerated filer, a non-accelerated filer, a smaller reporting company, or an emerging growth company. See the definitions of “large accelerated filer,” “accelerated filer,” “smaller reporting company,” and “emerging growth company” in Rule 12b-2 of the Exchange Act.
|
Large accelerated filer |
☐ |
|
Accelerated filer |
☐ |
|
Non-accelerated filer |
☒ |
(Do not check if a smaller reporting company) |
Smaller reporting company |
☐ |
|
Emerging growth company |
☒ |
|
|
|
If an emerging growth company, indicate by check mark if the registrant has elected not to use the extended transition period for complying with any new or revised financial accounting standards provided pursuant to Section 13(a) of the Exchange Act. ☒
Indicate by check mark whether the registrant is a shell company (as defined in Rule 12b-2 of the Act). Yes ☐ No ☒
There is no established market for the registrant’s shares of common stock. There were approximately 16,367,512 shares of common stock held by non-affiliates as of June 30, 2017, the last business day of the registrant’s most recently completed second fiscal quarter, for an aggregate market value of $1,309,400,960, assuming a market value of $80 per share, the offering price per share as of June 30, 2017, in the registrant’s ongoing private offering exclusive of any available discounts for certain categories of purchasers.
There were 19,377,844 shares of the Registrant’s common stock, $0.001 par value per share, outstanding as of March 1, 2018.
Documents Incorporated by Reference
Part III, Items 10, 11, 12, 13, and 14 of this annual report incorporate by reference certain specific portions of Broadstone Net Lease, Inc.’s definitive proxy statement for its 2018 Annual Meeting of Stockholders, which will be filed with the Securities and Exchange Commission no later than 120 days after the end of the registrant’s fiscal year. Only those portions of the proxy statement that are specifically incorporated by reference herein shall constitute a part of this annual report.
TABLE OF CONTENTS
|
|
|
|
|
Page |
|
|
|
|
|
|
|
|
|
2 |
||
|
|
|
|
|
|
|
|
|
PART I |
|
|
|
|
|
|
|
|
|
Item 1. |
|
|
3 |
|
|
|
|
|
|
|
|
Item 1A. |
|
|
18 |
|
|
|
|
|
|
|
|
Item 1B. |
|
|
36 |
|
|
|
|
|
|
|
|
Item 2. |
|
|
36 |
|
|
|
|
|
|
|
|
Item 3. |
|
|
36 |
|
|
|
|
|
|
|
|
Item 4. |
|
|
36 |
|
|
|
|
|
|
|
|
|
|
PART II |
|
|
|
|
|
|
|
|
|
Item 5. |
|
|
37 |
|
|
|
|
|
|
|
|
Item 6. |
|
|
46 |
|
|
|
|
|
|
|
|
Item 7. |
|
Management’s Discussion and Analysis of Financial Condition and Results of Operations |
|
47 |
|
|
|
|
|
|
|
Item 7A. |
|
|
67 |
|
|
|
|
|
|
|
|
Item 8. |
|
|
69 |
|
|
|
|
|
|
|
|
Item 9. |
|
Changes in and Disagreements with Accountants on Accounting and Financial Disclosure |
|
146 |
|
|
|
|
|
|
|
Item 9A. |
|
|
146 |
|
|
|
|
|
|
|
|
Item 9B. |
|
|
146 |
|
|
|
|
|
|
|
|
|
|
PART III |
|
|
|
|
|
|
|
|
|
Item 10. |
|
|
147 |
|
|
|
|
|
|
|
|
Item 11. |
|
|
147 |
|
|
|
|
|
|
|
|
Item 12. |
|
Security Ownership of Certain Beneficial Owners and Management and Related Stockholder Matters |
|
147 |
|
|
|
|
|
|
|
Item 13. |
|
Certain Relationships and Related Transactions, and Director Independence |
|
147 |
|
|
|
|
|
|
|
Item 14. |
|
|
153 |
|
|
|
|
|
|
|
|
|
|
PART IV |
|
|
|
|
|
|
|
|
|
Item 15. |
|
|
154 |
|
|
|
|
|
|
|
|
Item 16. |
|
|
154 |
|
1
Cautionary Note Regarding Forward-Looking Statements
Except where the context suggests otherwise, as used in this Form 10-K, the terms “we,” “us,” “our,” and “our company” refer to Broadstone Net Lease, Inc., a Maryland corporation, and, as required by context, Broadstone Net Lease, LLC, a New York limited liability company, which we refer to as our “Operating Company,” and to their respective subsidiaries.
This Annual Report on Form 10-K may contain forward-looking statements within the meaning of Section 21E of the Securities Exchange Act of 1934, as amended (the “Exchange Act”), regarding, among other things, our plans, strategies, and prospects, both business and financial. Forward-looking statements include, but are not limited to, statements that represent our beliefs concerning future operations, strategies, financial results or other developments. Forward-looking statements can be identified by the use of forward-looking terminology such as, but not limited to, “may,” “should,” “expect,” “anticipate,” “estimate,” “would be,” “intend,” “believe,” or “continue” or the negative or other variations of comparable terminology.
Forward-looking statements are inherently subject to risks, uncertainties, and assumptions. Because these forward-looking statements are based on estimates and assumptions that are subject to significant business, economic, and competitive uncertainties, many of which are beyond our control or are subject to change, actual results could be materially different. Although we believe that our plans, intentions, and expectations reflected in or suggested by these forward-looking statements are reasonable, we cannot assure you that we will achieve or realize these plans, intentions or expectations.
The following are some, but not all, of the assumptions, risks, uncertainties, and other factors that could cause our actual results to differ materially from those presented in our forward-looking statements:
|
|
• |
Our ability to generate cash flows sufficient to pay our dividends to stockholders or meet our debt service obligations. |
|
|
• |
Our ability to achieve our investment objectives and growth plans. |
|
|
• |
Our dependence upon the financial health and performance of our Manager and Asset Manager and their ability to retain or hire key personnel. |
|
|
• |
We may be subject to substantial third-party fees, in some instances to affiliated third parties. |
|
|
• |
Potential conflicts of interest because of our UPREIT structure (as defined below) and the relationship with our Manager and Asset Manager. |
|
|
• |
General business and economic conditions, fluctuating interest rates, and volatility and uncertainty in the credit markets and broader financial markets. |
|
|
• |
Competition in the acquisition and disposition of properties and in the leasing of our properties, which may impact our ability to acquire, dispose of, or lease properties on advantageous terms. |
|
|
• |
Risks associated with investing in real estate, including tenant, geographic, and industry concentrations with respect to our properties; bankruptcies or insolvencies of tenants or from tenant defaults generally; impairments in the value of our real estate assets; the illiquidity of our real estate investments; potential liability relating to environmental matters; and potential damages from natural disasters, acts of terrorism, or war. |
|
|
• |
Our access to capital and ability to borrow money in sufficient amounts and on favorable terms. |
|
|
• |
Our continued qualification as a real estate investment trust (“REIT”) for U.S. federal income tax purposes and compliance with REIT requirements, including the annual distribution requirements. |
|
|
• |
Changes in applicable laws, rules, and regulations, including the tax laws. |
Additional factors that may cause risks and uncertainties include those discussed in the Item 1. “Business,” Item 1A. “Risk Factors,” and Item 7. “Management’s Discussion and Analysis of Financial Condition and Results of Operations” in this Annual Report. Readers are cautioned not to place undue reliance on these forward-looking statements, which speak only as of the date this Form 10-K is filed with the Securities and Exchange Commission (the “SEC”). Except as required by law, we do not undertake any obligation to update or revise any forward-looking statements contained in this Form 10-K.
2
The Company
We are an externally managed real estate investment trust formed as a Maryland corporation in 2007 to acquire and hold single-tenant, commercial real estate properties throughout the United States that are leased to the properties’ operators under long-term net leases. Under a “net lease,” the tenant occupying the leased property (usually as a single tenant) does so in much the same manner as if the tenant were the owner of the property. There are various forms of net leases, most typically classified as triple-net or double-net. Triple-net leases typically require that the tenant pay all expenses associated with the property (e.g., real estate taxes, insurance, maintenance and repairs). Double net leases typically require that the tenant pay all operating expenses associated with the property (e.g., real estate taxes, insurance and maintenance), but exclude some or all major repairs (e.g., roof, structure and parking lot). Accordingly, the owner receives the rent “net” of these expenses, rendering the cash flow associated with the lease predictable for the term of the lease. Under a net lease, the tenant generally agrees to lease the property for a significant term and agrees that it will either have no ability or only limited ability to terminate the lease or abate rent prior to the expiration of the term of the lease as a result of real estate driven events such as casualty, condemnation or failure by the landlord to fulfill its obligations under the lease.
We focus on real estate that is operated by a single tenant where the real estate is an integral part of the tenant’s business. Our diversified portfolio of real estate includes retail properties, such as quick service and casual dining restaurants, healthcare facilities, industrial manufacturing facilities, warehouse and distribution centers, and corporate offices, among others. We target properties with credit-worthy tenants that look to engage in a long-term lease relationship. Through long-term leases, our tenants are able to retain operational control of their critical locations, while conserving their debt and equity capital to fund their fundamental business operations.
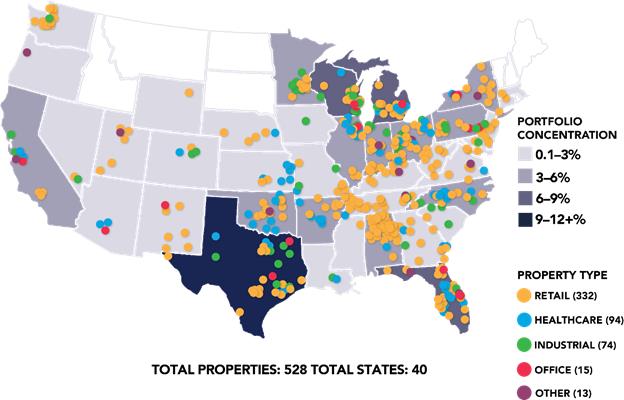
As of December 31, 2017, we owned a diversified portfolio of 528 individual net leased commercial properties located in 40 states comprising approximately 15.9 million rentable square feet of operational space. As of December 31, 2017, our properties were 100% leased to 134 different commercial tenants, with no single tenant accounting for more than 4% of our annual rental stream.
We elected to qualify as a REIT under the Internal Revenue Code of 1986, as amended (the “Internal Revenue Code”), beginning with our taxable year ended December 31, 2008. As a REIT, we are not subject to federal income tax to the extent that we meet certain requirements, including that we distribute at least 90% of our annual taxable income to our stockholders and satisfy other requirements based on the composition of our asset portfolio and sources of income.
We operate under the direction of our board of directors, which is responsible for the management and control of our affairs. Our board of directors has retained Broadstone Real Estate, LLC (the “Manager”), to provide certain property management services for our properties, and Broadstone Asset Management, LLC, a wholly owned subsidiary of the Manager (the “Asset Manager”), to manage our day-to-day affairs and implement our investment strategy, subject to our board of directors’ direction, oversight, and approval. The agreements governing the services provided by the Manager and the Asset Manager have been renewed through the year ended December 31, 2021, and will automatically renew for successive additional three-year terms thereafter, subject to earlier termination as detailed in the respective agreements (as further discussed in Item 13. “Certain Relationships and Related Transactions, and Director Independence” within this Form 10-K).
We conduct substantially all of our activities through, and all of our properties are held directly or indirectly by, the Operating Company. We are the sole managing member of the Operating Company and as of December 31, 2017, we owned approximately 92.4% of its issued and outstanding membership units, with the remaining 7.6% of its membership units held by persons who were issued membership units in exchange for their interests in properties acquired by the Operating Company.
3
As we conduct substantially all of our operations through the Operating Company, we are structured as what is referred to as an Umbrella Partnership Real Estate Investment Trust (“UPREIT”). The UPREIT structure allows a property owner to contribute their property to the Operating Company in exchange for membership units in the Operating Company and generally defer taxation of a resulting gain until the contributor later disposes of the membership units or the property is sold in a taxable transaction. The membership units of the Operating Company held by members of the Operating Company other than us are referred to herein and in our consolidated financial statements as “non-controlling interests,” “non-controlling membership units,” or “membership units,” and are convertible into shares of our common stock on a one-for-one basis, subject to certain restrictions. We allocate consolidated earnings to holders of our common stock and non-controlling membership unit holders of the Operating Company based on the weighted average number of shares of our common stock and non-controlling membership units outstanding during the year. Approximately 1.6 million non-controlling membership units were outstanding as of December 31, 2017. For the year ended December 31, 2017, the weighted average number of units outstanding was 1.5 million.
We commenced our ongoing private offering of shares of our common stock (our “private offering”) in 2007. The first closing of our private offering occurred on December 31, 2007, and we have conducted additional closings at least once every calendar quarter since then. Currently, we close sales of additional shares of our common stock monthly. We instituted a monthly cap on new and additional investments in our common stock beginning in November 2017. The cap does not apply to investments made pursuant to our distribution reinvestment plan or equity capital received in connection with UPREIT transactions. See Item 5. “Market for Registrant’s Common Equity, Related Stockholder Matters and Issuer Purchase of Equity Securities” of this Form 10-K for further information.
Our shares of common stock are sold by us at a price equal to a determined share value (the “Determined Share Value”), which is established quarterly by the committee of our board of directors comprised of our independent directors (“Independent Directors Committee”) based on the net asset value (“NAV”) of our portfolio, input from management and third-party consultants, and other such factors as the Independent Directors Committee may determine. Our determination of NAV applies valuation definitions and methodologies prescribed by the Accounting Standards Codification (“ASC”) 820, Fair Value Measurements and Disclosures, in order to fair value our net assets. Our net assets are primarily comprised of our investment in rental property and debt. See further discussion related to Determined Share Value in Item 5. “Market for Registrant’s Common Equity, Related Stockholder Matters and Issuer Purchases of Equity Securities” of this Form 10-K under the caption Determined Share Value. Shares of our common stock are currently being offered in our private offering at $81.00 per share, provided that the per share offering price may be adjusted quarterly by the Independent Directors Committee based on the Determined Share Value. For the year ended December 31, 2017, we issued 3.8 million shares of our common stock in our private offering, including 0.5 million shares of common stock issued pursuant to our Distribution Reinvestment Plan (“distribution reinvestment plan” or “DRIP”). Cash received for newly issued shares totaled $263.1 million and shares with a value of $40.2 million were issued pursuant to DRIP transactions. In addition, we issued 161,418 units in our Operating Company valued at $12.9 million during the year ended December 31, 2017, in exchange for properties contributed through UPREIT transactions. We intend to use substantially all of the net proceeds from our private offering, supplemented with additional borrowings, to continue to invest in additional net leased properties and for general corporate purposes. We conduct our private offering in reliance upon the exemption from registration under the Securities Act of 1933, as amended (the “Securities Act”), provided by Rule 506(c) of Regulation D promulgated under the Securities Act.
As of December 31, 2017, there were 18.9 million shares of our common stock issued and outstanding, and 1.6 million membership units in the Operating Company issued and outstanding.
2017 Highlights
|
|
• |
Increased total revenues to $181.6 million, representing growth of 27.1% compared to the year ended December 31, 2016. |
|
|
• |
Generated earnings per share on a GAAP basis (as defined below), including amounts attributable to non-controlling interests, of $3.21, representing an increase of $0.45 per diluted share compared to the year ended December 31, 2016. |
4
|
|
• |
Generated funds from operations (“FFO”), a non-GAAP financial measure, of $6.00 per diluted share. |
|
|
• |
Generated adjusted funds from operations (“AFFO”), a non-GAAP financial measure, of $5.38 per diluted share. |
|
|
• |
Increased our monthly distribution to stockholders from $0.41 per share at December 31, 2016, to $0.415 per share in February 2017. Subsequent to year end, our board of directors increased the distribution to $0.43 per share, commencing with the payment to be made in March 2017. |
|
|
• |
Increased the Determined Share Value from $77.00 per share at December 31, 2016, to $81.00 at December 31, 2017, representing a 5.2% increase. The Determined Share Value will remain in effect through April 30, 2018. |
|
|
• |
Closed 29 real estate acquisitions totaling $683.6 million, excluding capitalized acquisition expenses, adding 124 new properties with a weighted average initial cash capitalization rate of 7.2%. The properties acquired had a weighted average lease term of 15.0 years at the time of acquisition and weighted average annual rent increases of 1.8%. |
|
|
• |
Received $316.2 million in investments from new and existing stockholders, including property contributed in exchange for Operating Company membership units through UPREIT transactions, and had more than 2,600 stockholders as of the end of the year. |
|
|
• |
Continued to focus on optimizing our portfolio by selectively pruning and strategically disposing of 13 properties, representing approximately 2.9% of our portfolio value as of December 31, 2016, for $63.3 million in net proceeds. |
|
|
• |
Successfully enhanced and diversified our sources of debt capital. In April 2017, we issued $150.0 million of unsecured, fixed-rate, interest-only senior notes (“Senior Notes”) through a private placement. In June 2017, together with the Operating Company, we closed an $800.0 million unsecured credit facility, which includes an accordion feature that permits an increase in the facility up to a total of $1.0 billion. In November 2017, we expanded the credit facility to $880.0 million of available borrowing capacity. |
|
|
• |
Collected more than 99% of rents due during 2017 and maintained a 100% leased portfolio throughout the year. |
FFO and AFFO are performance measures that are not calculated in accordance with accounting principles generally accepted in the United States of America (“GAAP”). We present these non-GAAP measures as we believe certain investors and other users of our financial information use them as part of their evaluation of our historical operating performance. Please see our discussion in Item 7. “Management’s Discussion and Analysis of Financial Condition and Results of Operations” of this Form 10-K under the heading Net Income and Non-GAAP Measures (FFO and AFFO), which includes discussion of the definition, purpose, and use of these non-GAAP measures as well as a reconciliation of each to the most comparable GAAP measure.
Our Properties and Investment Objectives
We target acquisitions of fee simple interests in individual properties priced between $5 million and $75 million. Portfolios may be significantly larger, depending on balance sheet capacity and whether the portfolio is diversified or concentrated by tenant, geography, or brand. Our investment policy (“Investment Policy”) has three primary objectives that drive the investments we make:
|
|
• |
preserve, protect, and return capital to investors, |
|
|
• |
realize increased cash available for distributions and long-term capital appreciation from growth in the rental income and value of our properties, and |
|
|
• |
maximize the level of sustainable cash distributions to our investors. |
5
We primarily acquire freestanding, single-tenant commercial properties located in the United States either directly from our credit-worthy tenants in sale-leaseback transactions, where they sell us their properties and simultaneously lease them back through long-term, net leases, or through the purchase of properties already under a net lease (i.e., a lease assumption). Under either scenario, our properties are generally under lease and fully occupied at the time of acquisition. Our real estate portfolio as of December 31, 2017, is reflective of our Investment Policy, with a focus on properties in growth markets with at least ten years of lease term remaining. Throughout much of 2017, the Investment Policy required that the portfolio achieve financial returns on equity of greater than 10%, net of fees, provided that all acquisitions must have had a minimum remaining lease term of seven years and a minimum return on equity of 9.5%, unless approved by our Independent Directors Committee. As part of its regular review of our Investment Policy at its November 2017 meeting, the Independent Directors Committee approved an update to such policy to require a 9.5% minimum return on equity, net of fees, calculated based on the average return recognized across all acquisitions during a calendar year, with a minimum required return of 8.5%, net of fees, for any particular transaction. We believe the changes will allow us greater flexibility in deploying capital in investment opportunities that maximize the risk-adjusted return to our stockholders. Our criteria for selecting properties (“Property Selection Criteria”) is based on the following underwriting principles:
|
|
• |
fundamental value and characteristics of the underlying real estate, |
|
|
• |
creditworthiness of the tenant, and |
|
|
• |
transaction structure and pricing. |
We believe we can achieve an appropriate risk-adjusted return through these underwriting principles and conservatively project a property’s potential to generate targeted returns from current and future cash flows. We believe targeted returns are achieved through a combination of in-place income at the time of acquisition, rent growth, and a property’s potential for appreciation.
To achieve an appropriate risk-adjusted return, we maintain a diversified portfolio of real estate spread across multiple tenants, industries, and geographic locations. The following charts summarize our portfolio diversification by property type and geographic location as of December 31, 2017. The percentages below are calculated based on our contractual rental revenue over the next 12 months (“NTM Rent”) as of December 31, 2017, on a per property type basis divided by total NTM Rent. Late payments, non-payments, or other unscheduled payments are not considered in the calculation. NTM Rent includes the impact of contractual rent escalations.
6
Property Type, by % of NTM Rent

|
Property Type |
|
% NTM Rent |
|
|
|
Retail – casual dining |
|
|
11.8 |
% |
|
Retail – other |
|
|
11.7 |
% |
|
Retail – quick service restaurants (QSR) |
|
|
10.7 |
% |
|
Retail Total |
|
|
34.2 |
% |
|
Industrial – warehouse/distribution |
|
|
11.5 |
% |
|
Industrial – manufacturing |
|
|
10.5 |
% |
|
Industrial – flex |
|
|
5.7 |
% |
|
Industrial – other |
|
|
3.4 |
% |
|
Industrial Total |
|
|
31.1 |
% |
|
Healthcare – clinical |
|
|
11.8 |
% |
|
Healthcare – surgical |
|
|
5.0 |
% |
|
Healthcare – other |
|
|
4.4 |
% |
|
Healthcare Total |
|
|
21.2 |
% |
|
Office |
|
|
9.7 |
% |
|
Other |
|
|
3.8 |
% |
|
|
|
|
|
|
7
|
Top Tenant Industries |
|
|||
|
Industry |
|
% NTM Rent |
|
|
|
Restaurants |
|
|
22.5 |
% |
|
Healthcare Facilities |
|
|
18.4 |
% |
|
Home Furnishing Retail |
|
|
4.9 |
% |
|
Specialized Consumer Services |
|
|
4.9 |
% |
|
Packaged Foods & Meats |
|
|
4.6 |
% |
|
Auto Parts & Equipment |
|
|
4.5 |
% |
|
Healthcare Services |
|
|
2.8 |
% |
|
Industrial Conglomerates |
|
|
2.3 |
% |
|
Multi-line Insurance |
|
|
2.1 |
% |
|
Life Sciences Tools & Services |
|
|
2.0 |
% |
|
Distributors |
|
|
2.0 |
% |
|
Air Freight & Logistics |
|
|
1.9 |
% |
|
Industrial Machinery |
|
|
1.8 |
% |
|
Food Retail |
|
|
1.7 |
% |
|
Metal & Glass Containers |
|
|
1.6 |
% |
|
Top 15 Tenant Industries |
|
|
78.0 |
% |
|
Other (28 industries) |
|
|
22.0 |
% |
|
Total |
|
|
100.0 |
% |
Geographic Diversification, by % of NTM Rent
8
Substantially all of our leases are triple-net, meaning that our tenants are responsible for the maintenance, insurance, and property taxes associated with the properties they lease from us. At December 31, 2017, all of our properties are subject to leases. We do not currently engage in the development of real estate, which could cause a delay in timing between the funds used to invest in properties and the corresponding cash inflows from rental receipts. Our cash flows from operations are primarily generated through our real estate investment portfolio and the monthly lease payments under our long-term leases with our tenants.
To increase value to our stockholders, we strive to implement periodic rent escalations within our leases. As of December 31, 2017, nearly all of our leases had contractual rent escalations, with a 2.0% weighted average. A substantial majority of our leases have fixed annual rent increases, and the remaining leases have annual lease escalations based on increases in the Consumer Price Index (“CPI”), or periodic escalations over the term of the lease (e.g., a 10% increase every five years). These lease escalations mitigate exposure to fixed income streams in the case of an inflationary economic environment, and provide increased return in otherwise stable market conditions. Our focus on single-tenant, triple-net leases shifts certain risks to the tenant and shelters us from volatility in the cost of taxes, insurance, services, and maintenance of the property. An insignificant portion of our tenants have leases that are not fully triple-net, and, therefore, we bear responsibility for certain maintenance and structural component replacements (e.g., roof, structure, or parking lot) that may be required in the future, although the tenants are still required to pay all operating expenses associated with the property (e.g., real estate taxes, insurance and maintenance). In the limited circumstances where we cannot implement a triple-net lease, we attempt to limit our exposure through the use of warranties and other remedies that reduce the likelihood of a significant capital outlay during the term of the lease. We will also occasionally incur nominal property-level expenses that are not paid by our tenants. We do not currently anticipate making significant capital expenditures or incurring other significant property costs during the term of a property lease.
Due to the fact that all of our properties are leased to single tenants under long-term leases, we are not currently required to perform significant ongoing leasing activities on our properties. The leases for only three of our properties, representing less than 1% of our annual rental streams (calculated based on NTM Rent), will expire before 2020. As of December 31, 2017, the weighted average remaining term of our leases (calculated based on NTM Rent) was approximately 13.1 years, excluding renewal options, which are exercisable at the option of our tenants upon expiration of their initial lease term. Less than 5% of the properties in our portfolio are subject to leases without at least one renewal option. Furthermore, the weighted average lease term on the $683.6 million in properties acquired during the year ended December 31, 2017, was 15.0 years. More than 50% of our rental revenue is derived from leases that expire during 2030 and thereafter. As of December 31, 2017, no more than 10% of our rental revenue is derived from leases that expire in any single year in the decade between 2020 and 2030. The following chart sets forth our lease expirations based upon the terms of our leases in place as of December 31, 2017.
9
Lease Maturity Schedule, by % of NTM Rent

The following table presents the lease expirations by year, including the number of tenants and properties with leases expiring, the square footage covered by the leases expiring, the NTM Rent, and the percentage of NTM Rent for the leases expiring. Late payments, non-payments or other unscheduled payments are not considered in the NTM Rent amounts. NTM Rent includes the impact of contractual rent escalations. Amounts are in thousands, except the number of tenants and properties.
|
Year |
|
Number of Tenants |
|
|
Number of Properties |
|
|
Square Footage |
|
|
NTM Rent |
|
|
Percentage of NTM Rent |
|
|||||
|
2018 |
|
|
1 |
|
|
|
1 |
|
|
|
2 |
|
|
$ |
106 |
|
|
|
0.1 |
% |
|
2019 |
|
|
2 |
|
|
|
2 |
|
|
|
8 |
|
|
|
280 |
|
|
|
0.1 |
% |
|
2020 |
|
|
3 |
|
|
|
3 |
|
|
|
95 |
|
|
|
1,099 |
|
|
|
0.6 |
% |
|
2021 |
|
|
2 |
|
|
|
4 |
|
|
|
9 |
|
|
|
578 |
|
|
|
0.3 |
% |
|
2022 |
|
|
4 |
|
|
|
3 |
|
|
|
87 |
|
|
|
2,442 |
|
|
|
1.3 |
% |
|
2023 |
|
|
9 |
|
|
|
13 |
|
|
|
724 |
|
|
|
6,836 |
|
|
|
3.6 |
% |
|
2024 |
|
|
12 |
|
|
|
15 |
|
|
|
1,741 |
|
|
|
14,023 |
|
|
|
7.3 |
% |
|
2025 |
|
|
2 |
|
|
|
8 |
|
|
|
28 |
|
|
|
1,038 |
|
|
|
0.5 |
% |
|
2026 |
|
|
18 |
|
|
|
28 |
|
|
|
801 |
|
|
|
11,970 |
|
|
|
6.2 |
% |
|
2027 |
|
|
19 |
|
|
|
35 |
|
|
|
1,726 |
|
|
|
18,596 |
|
|
|
9.7 |
% |
|
2028 |
|
|
15 |
|
|
|
29 |
|
|
|
1,169 |
|
|
|
13,563 |
|
|
|
7.1 |
% |
|
2029 |
|
|
15 |
|
|
|
62 |
|
|
|
2,664 |
|
|
|
17,901 |
|
|
|
9.3 |
% |
|
2030 and thereafter |
|
|
73 |
|
|
|
325 |
|
|
|
6,874 |
|
|
|
103,945 |
|
|
|
53.9 |
% |
10
Our top tenants and brands at December 31, 2017, are listed in the tables below. The percentages are calculated based on our NTM Rent on a per property type basis divided by total NTM Rent. Late payments, non-payments or other unscheduled payments are not considered in the calculation. NTM Rent includes the impact of contractual rent escalations.
Top Ten Tenants, by % of NTM Rent
|
(1) |
Tenant’s properties include 22 Outback Steakhouse restaurants and two Carrabba’s Italian Grill restaurants. |
Top Ten Brands, by % of NTM Rent
|
Brand |
|
Property Type |
|
% NTM Rent |
|
|
Properties |
|
||
|
|
Industrial/Retail |
|
|
3.8 |
% |
|
|
27 |
|
|
|
Red Lobster |
|
Retail |
|
|
3.8 |
% |
|
|
25 |
|
|
Art Van Furniture |
|
Retail |
|
|
3.4 |
% |
|
|
9 |
|
|
Jack's Family Restaurants |
|
Retail |
|
|
3.0 |
% |
|
|
36 |
|
|
Taco Bell |
|
Retail |
|
|
2.7 |
% |
|
|
41 |
|
|
Wendy's |
|
Retail |
|
|
2.6 |
% |
|
|
35 |
|
|
Outback Steakhouse |
|
Retail |
|
|
2.4 |
% |
|
|
22 |
|
|
Big Tex Trailers |
|
Industrial/Retail/Office |
|
|
2.4 |
% |
|
|
17 |
|
|
Siemens |
|
Industrial |
|
|
2.3 |
% |
|
|
2 |
|
|
Nestle' |
|
Industrial |
|
|
2.2 |
% |
|
|
1 |
|
|
Total |
|
|
|
|
28.6 |
% |
|
|
215 |
|
|
All Other |
|
|
|
|
71.4 |
% |
|
|
313 |
|
|
(1) |
Brand includes two BEF Foods, Inc. properties and 25 Bob Evans Restaurants, LLC restaurants. |
11
Our Investment Policy generally requires us to seek diversification of our investments. The Independent Directors Committee approved certain updates to our Investment Policy following the regular annual review of the policy at the November 2017 meeting of our board of directors. Based on the NTM rent of the properties in the portfolio, determined as of the date of the prior quarter end, new investments may not cause us to exceed:
|
|
• |
5% in any single property; |
|
|
• |
8% leased to any single tenant or brand; |
|
|
• |
10% located in any single metropolitan statistical area; or |
|
|
• |
20% located in any single state. |
We may exceed these diversification targets from time to time with the approval of the Independent Directors Committee. To avoid undue risk concentrations in any single asset class or category, long-term asset allocation will be set with the following target percentages and within the following ranges, although these ranges may be temporarily waived by the Independent Directors Committee:
|
Asset Category |
|
Target |
|
|
Range |
|
|
Retail |
|
|
30 |
% |
|
15-45% |
|
Healthcare |
|
|
20 |
% |
|
15-45% |
|
Industrial |
|
|
25 |
% |
|
15-45% |
|
Office |
|
|
15 |
% |
|
10-20% |
|
Other |
|
|
10 |
% |
|
5-15% |
While the Independent Directors Committee establishes diversification thresholds to manage risk, the management team does not review discrete financial information at this level. Refer to our discussion regarding segment reporting under the caption Segment Reporting in Note 2, “Summary of Significant Accounting Policies” within the Notes to the Consolidated Financial Statements within Item 8. “Financial Statements and Supplementary Data” of this Form 10-K.
We do not currently engage in the development of real estate, but may do so in the future. Our Investment Policy provides the Asset Manager with the authority to make, on our behalf, any acquisition or sale of any property or group of related properties involving up to $50 million for any single or portfolio transaction, $75 million per cumulative tenant concentration, or $100 million per cumulative brand concentration, without approval of the Independent Directors Committee, provided that the transaction otherwise meets our Investment Policy and Property Selection Criteria, and any financing related to any such acquisition does not violate our Leverage Policy (as defined below), as established by the Independent Directors Committee from time to time. Our Investment Policy permits investments in properties that do not otherwise meet our Investment Policy or Property Selection Criteria with the approval of the Independent Directors Committee.
Underwriting Criteria
When evaluating a property acquisition, our underwriting guidelines require that we consider the condition of the property, the creditworthiness of the tenant, the strength of any personal or corporate guarantees, the tenant’s historic performance at the property or similar properties, the location of the property, the overall economic condition of the community in which the property is located, and the property’s potential for appreciation. We apply our credit underwriting guidelines prior to acquiring a property, periodically throughout the lease term, and when we are re-leasing properties in our portfolio. While we seek creditworthy tenants, we do not require them to be investment grade credit-rated. Our credit review process includes analyzing a tenant’s financial statements and other available information. When we obtain guarantees on our leases, we also analyze the creditworthiness of the guarantors. Depending on the circumstances, our process will include discussions with the tenant’s management team surrounding their business plan and strategy.
12
We evaluate the creditworthiness of our existing tenants on an ongoing basis through the use of regularly scheduled real estate portfolio reviews, reviewing updated tenant financial statements on a quarterly or annual basis, depending on the terms of the lease, analysis of updated tenant credit ratings, and our ongoing analysis of the economy and trends in the industries in which our tenants operate. Our portfolio review committee, which includes members of our senior management and our Manager’s portfolio management team, perform an in-depth review of each property in our portfolio at least once every 18 months. The review includes an analysis of the tenant’s recent financial statements, including key metrics such as rent coverage and leverage levels, among other applicable credit metrics, credit ratings, and economic considerations relevant to the tenant. The Manager’s asset management team also periodically reviews tenant financial statements and relevant credit performance metrics. Our credit monitoring procedures also include regular communications with tenants, who are required to communicate certain events to us under the terms of our leases, such as events of default and property damage. We believe our ongoing credit monitoring will enable us to identify material changes to a tenant’s credit quality in a timely basis and preserve our financial position. We have not identified any material changes to the credit quality of the tenants in our real estate portfolio as of December 31, 2017.
Leverage Policy
In March of 2016, Moody’s Investors Service (“Moody’s”) assigned the Operating Company an investment grade credit rating of Baa3 with a stable outlook. Moody’s re-affirmed the investment grade credit rating in March of 2017. The investment grade credit rating allowed us to take advantage of preferential borrowing margins on our outstanding debt, including the credit facility we entered into on June 23, 2017. The investment grade credit rating will also allow us more attractive access to the debt private placement markets. The rating is based on a number of factors, including an assessment of our financial strength, portfolio size and diversification, credit and operating metrics, corporate governance policies, and sustainability of cash flow and earnings. We are strongly committed to maintaining modest leverage, commensurate with our investment grade rating. While Moody’s utilizes other factors outside of our leverage ratio, our leverage policy (“Leverage Policy”) is to maintain a leverage ratio in the 35% to 45% range based on the market value of assets, recognizing that the actual leverage ratio will vary over time and there may be opportunistic reasons to exceed a 45% leverage ratio; provided, however, that we cannot exceed a 50% leverage ratio without the approval of the Independent Directors Committee.
We primarily utilize unsecured term and revolving debt to finance acquisitions, while obtaining mortgage loans and notes payable to a lesser degree. The mix of financing sources may change over time based on market conditions. The unsecured loans generally contain affirmative and negative covenants which are tested against our financial performance.
When utilized, mortgage loans and notes payable (“mortgage financing”) typically cover a single property or a group of related properties acquired from a single seller. The loans may be further secured by guarantees from us or the Operating Company, provided that we attempt to limit the use of guarantees to the extent possible. The Operating Company may assume debt when conducting a transaction or it may mortgage existing properties. As of December 31, 2017, 11 of our 528 properties were secured by mortgage financing, and the aggregate outstanding principal balance of mortgage loans and notes payable was approximately $68.5 million.
To reduce its exposure to variable-rate debt, the Operating Company enters into interest rate swap agreements to fix the rate of interest as a hedge against interest rate fluctuations. These interest rate hedges have staggered maturities to reduce the exposure to interest rate fluctuations in any one year, and generally extend up to 10 years. The interest rate swaps are applied against a pool of debt, which offers flexibility in maintaining our hedge designation concurrent with our ongoing capital markets activity. We attempt to limit our total exposure to floating-rate debt to be within a target of no more than 5% of the market value of total assets, measured at quarter end.
To reduce counterparty concentration risk with respect to our interest rate hedges, we diversify the institutions that serve as swap counterparties, and no more than 30% of the nominal value of our total hedged debt may be with any one institution, to be measured at the time we enter into an interest rate swap transaction and at quarter end.
13
During the year ended December 31, 2017, we added $150.0 million of unsecured, interest-only Senior Notes to our capital structure. The Senior Notes bear interest at a fixed rate of 4.84% per annum, with a 10-year maturity. We strategically use this channel of long-term, fixed-rate debt capital to help mitigate interest rate risk, lengthen our maturity profile, and diversify our sources of debt capital.
The Independent Directors Committee reviews our Leverage Policy at least annually; however, depending on market conditions and other factors, they may change our Leverage Policy from time to time.
As of December 31, 2017, our total outstanding indebtedness was $1,181.5 million and the ratio of our total indebtedness to the market value of our assets was approximately 41.6%.
Corporate Governance
We operate under the direction of our board of directors, which is responsible for the management and control of our affairs. Our board of directors has retained the Manager and the Asset Manager to manage our day-to-day affairs, to implement our investment strategy, and to provide certain property management services for our properties, with both subject to our board of directors’ direction, oversight, and approval. All of our officers are employees of the Manager.
Our board of directors is currently comprised of nine directors, six of whom are independent directors and serve on the Independent Directors Committee. The Independent Directors Committee reviews our relationship with, and the performance of, the Manager and the Asset Manager, and approves the terms of any affiliate transactions. In addition, the Independent Directors Committee is responsible for, among other things, approving our property and portfolio valuation policy, setting the Determined Share Value for our ongoing private offering, approving and setting our Investment Policy, Property Selection Criteria, and Leverage Policy, and approving acquisitions above certain thresholds or outside of the criteria set forth in our Investment Policy.
Management and Our Structure
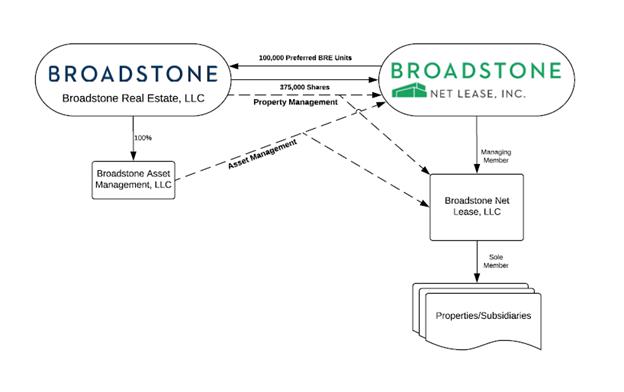
Pursuant to the terms of the asset management agreement among us, the Operating Company, and the Asset Manager (as amended, the “Asset Management Agreement”), the Asset Manager is responsible for, among other things, managing our day-to-day operations, establishing and monitoring acquisition and disposition strategies, overseeing all marketing communications and services related to our ongoing private offering, arranging mortgage and other financing, overseeing the acquisition of properties and their initial lease-up if they are not already subject to a net lease upon acquisition, providing support for the good faith valuation of our property portfolio and the setting of the Determined Share Value by the Independent Directors Committee, overseeing investor closings and transfers, arranging our annual stockholder meetings, and servicing and communicating with investors, including providing investment projections and reports. The Asset Manager also has the power pursuant to the Asset Management Agreement to designate two of the nine directors who serve on our board of directors. The Manager owns and controls the Asset Manager.
Pursuant to the property management agreement among us, the Operating Company, and the Manager (as amended, the “Property Management Agreement”), the Manager provides property management services to our properties, including management, rent collection, and re-leasing services. In June 2015, Trident BRE, LLC, an affiliate of Stone Point Capital LLC (“Trident BRE”), acquired through an equity investment an approximate 45.6% equity ownership interest in the Manager. As of December 31, 2017, the Manager is owned, on a fully diluted basis, (i) approximately 44.44% by Trident BRE, (ii) approximately 44.44% by Amy L. Tait, our Executive Chairman of the board of directors and Chief Investment Officer, Tait family trusts, and an investment entity for the families of Ms. Tait and the late Norman Leenhouts, one of our founders, and (iii) approximately 11.12% by employees of the Manager. The Manager is controlled by a four-person board of managers, two of whom are appointed by Trident BRE. In June 2015, in connection with Trident BRE’s investment in the Manager, (i) we acquired 100,000 convertible preferred interests in the Manager (the “Convertible Preferred BRE Units”), for $100 per Convertible Preferred BRE Unit, in exchange for the issuance to the Manager of 138,889 shares of our common stock, then valued at $72.00 per share, and (ii) the Manager purchased 510,416 shares of our common stock, for $72.00 per share. The Manager currently owns 375,000, or approximately 2.0%, of the issued and outstanding shares of our common stock. The Independent Directors Committee approved our investment in the Convertible Preferred BRE Units.
14
As of December 31, 2017, the Manager employed approximately 24 individuals fully-dedicated to our business and operations. Additionally, the Manager employed approximately 38 additional individuals who dedicate a significant portion of their time to our business and operations, in addition to various other tasks and responsibilities on behalf of the Manager and its affiliates.
For more information regarding the relationships among our company, Trident BRE, the Manager, and the Asset Manager and the fees we pay to the Manager and the Asset Manager pursuant to the Property Management Agreement and the Asset Management Agreement, see Item 13. “Certain Relationships and Related Transactions, and Director Independence” of this Form 10-K.
The chart below illustrates the relationships among our company, the Operating Company, the Manager, and the Asset Manager as of December 31, 2017.
Regulation
Our investments are subject to various federal, state, and local laws, ordinances, and regulations, including, among other things, zoning regulations, land use controls, and environmental controls relating to air and water quality, noise pollution, and indirect environmental impacts. We believe that we have all permits and approvals necessary under current law to operate our investments.
15
Emerging Growth Company Status
We are an emerging growth company, as defined in the Jumpstart Our Business Startups Act (the “JOBS Act”), and as such we are eligible to take advantage of certain exemptions from various reporting requirements that are applicable to other public companies that are not emerging growth companies, including, but not limited to, not being required to comply with the auditor attestation requirements of Section 404 of the Sarbanes-Oxley Act of 2002, reduced disclosure obligations regarding executive compensation in our periodic reports and proxy statements, and exemptions from the requirements of holding a nonbinding advisory vote on executive compensation and stockholder approval of any golden parachute payments not previously approved. A number of these exemptions are not currently relevant to us due to our external management structure, and in any event, we do not currently intend to take advantage of any of these exemptions.
In addition, Section 107 of the JOBS Act provides that an emerging growth company can use the extended transition period provided in Section 13(a) of the Exchange Act for complying with new or revised accounting standards. This permits an emerging growth company to delay the adoption of certain accounting standards until those standards would otherwise apply to private companies. We have irrevocably elected not to take advantage of this extended transition period and, as a result, we will adopt new or revised accounting standards on the relevant dates on which adoption of such standards is required for other public companies.
We will remain an emerging growth company until the earliest to occur of (1) the last day of the first fiscal year in which our annual gross revenues exceed $1 billion, (2) the date on which we become a “large accelerated filer” as defined in Rule 12b-2 under the Exchange Act, (3) the date on which we have issued more than $1 billion in non-convertible debt during the preceding three-year period, and (4) the end of the year in which the five-year anniversary of our initial public offering of our common stock occurs.
Competition
The commercial real estate market is highly competitive. We compete for tenants to occupy our properties in all of our markets with other owners and operators of commercial real estate. We compete based on a number of factors that include location, rental rates, security, suitability of the property’s design to prospective tenants’ needs, and the manner in which the property is operated and marketed. The number of competing properties in a particular market could have a material effect on our occupancy levels, rental rates and the operating expenses of certain of our properties.
In addition, we compete with other entities engaged in real estate investment activities to locate suitable properties to acquire and purchasers to buy our properties. These competitors include other REITs, specialty finance companies, savings and loan associations, sovereign wealth funds, banks, mortgage bankers, insurance companies, institutional investors, investment banking firms, lenders, governmental bodies, and other entities. Some of these competitors, including larger REITs, have substantially greater marketing and financial resources than we have. The relative size of their portfolios may allow them to absorb properties with lower returns and allow them to accept more risk on a given property than we can prudently manage, including risks with respect to the creditworthiness of tenants. In addition, these same entities may seek financing through similar channels to us. Competition from these REITs and other third party real estate investors may limit the number of suitable investment opportunities available to us. It also may result in higher prices, lower yields, and a narrower spread of yields over our borrowing costs, making it more difficult for us to acquire new investments on attractive terms.
Seasonality
Our investments are not materially impacted by seasonality.
Employees
We have no employees. Our officers are employees of our Manager or its affiliates and are not compensated by us for their service as our officers. The employees of our Manager and its affiliates manage our day-to-day operations and provide management, acquisition, advisory, and certain administrative services for us.
16
We have elected to be taxed as a REIT under the Internal Revenue Code and have operated as such commencing with the taxable year ended December 31, 2008. To qualify as a REIT, we must meet certain organizational and operational requirements, including a requirement to distribute at least 90% of our annual REIT taxable income to our stockholders, which is computed without regard to the dividends paid deduction and excluding net capital gain and does not necessarily equal net income as calculated in accordance with GAAP. As a REIT, we generally will not be subject to federal income tax to the extent we distribute qualifying dividends to our stockholders. If we fail to qualify as a REIT in any taxable year, we will be subject to federal income tax on our taxable income at regular corporate income tax rates and generally will not be permitted to qualify for treatment as a REIT for federal income tax purposes for the four taxable years following the year during which qualification is lost unless the Internal Revenue Service grants us relief under certain statutory provisions.
Financial Information about Industry Segments
We currently operate in a single reportable segment, which includes the acquisition, leasing, and ownership of net leased properties. Refer to the caption Segment Reporting in Note 2, “Summary of Significant Accounting Policies” within the Notes to the Consolidated Financial Statements within Item 8. “Financial Statements and Supplementary Data” of this Form 10-K.
Company Information
Our principal executive offices are located at 800 Clinton Square, Rochester, New York, 14604, and our telephone number is (585) 287-6500.
Our filings with the SEC, including our annual report on Form 10-K, quarterly reports on Form 10-Q, current reports on Form 8-K, and amendments to those reports, filed or furnished pursuant to Section 13(a) or 15(d) of the Securities Exchange Act of 1934, as well as our proxy statements, are accessible free of charge at http://investors.bnl.broadstone.com as soon as reasonably practicable after we electronically file such material with, or furnish it to, the SEC. You may read and copy any materials we file with the SEC at the SEC’s Public Reference Room at 100 F Street, NE, Washington, D.C. 20549, or you may access them through the EDGAR database at the SEC’s website at http://www.sec.gov.
We have adopted our Code of Ethics to ensure that our business is conducted in accordance with the highest moral, legal, and ethical standards by our officers and directors as well as the Manager, the Asset Manager, and the Manager’s employees. The Code of Ethics is available on our website, http://investors.bnl.broadstone.com, together with the charters of the Board’s Independent Directors Committee, Audit Committee, and Nominating and Corporate Governance Committee. Amendments to, and waivers granted to our directors and executive officers under our codes of ethics, if any, will be posted in this area of our website. Copies of these materials are available in print to any stockholder who requests them. Stockholders should direct such requests in writing to Investor Relations Department, Broadstone Net Lease, Inc., 800 Clinton Square, Rochester, New York 14604. Stockholders may also call 1-585-287-6500.
The information about our website and its content is for your convenience only. The content of our website is not deemed to be incorporated by reference in this report or filed with the SEC.
17
The following are some of the risks and uncertainties that could cause our actual results to differ materially from those presented in our forward-looking statements. You should consider carefully the risks described below and the other information in this Form 10-K, including our consolidated financial statements and the related notes. The risks and uncertainties described below are not the only ones we face but do represent those risks and uncertainties that we believe are material to us. Additional risks and uncertainties not presently known to us or that we currently deem immaterial may also harm our business.
General Investment Risks
We may not be able to make distributions to our stockholders at the times or in the amounts we expect, or at all.
We may not be able to continue to generate sufficient cash flow from our properties and from possible distributions on our Convertible Preferred BRE Units, if declared and paid, to permit us to make the distributions we expect. If we pay distributions from the proceeds of our securities offering or from borrowings, the amount of capital we ultimately invest may be reduced, which may reduce the value of an investment in us.
There is no public trading market for our common stock and we are not required to effectuate a liquidity event by a certain date or at all, and transfers of shares of our common stock are subject to a number of restrictions. As a result, it will be difficult for our stockholders to sell shares of our common stock and, if they are able to sell their shares, they are likely to sell them at a discount.
There is no current public market for our common stock, we do not expect that any such public market will develop in the future, and we have no obligation to list our shares on any public securities market or provide any other type of liquidity to our stockholders by a particular date, or at all. The shares of our common stock are not registered under the Securities Act or state securities laws and therefore cannot be resold unless they are subsequently registered under such laws or unless an exemption from registration is available. Although we have adopted our share redemption program pursuant to which our stockholders may request that we redeem shares of our common stock, it is subject to a number of restrictions. Accordingly, our investors should not expect to be able to sell their shares or otherwise liquidate their investment promptly, if at all, and there can be no assurance that the sales price of any shares which are sold would equal or exceed the price originally paid for the shares. Our investors must be prepared to bear the economic risk of holding their shares of our common stock for an indefinite period of time.
Our stockholders are limited in their ability to sell shares of our common stock pursuant to our share redemption program. Our stockholders may not be able to sell any of their shares of our common stock back to us, and if they do sell their shares, they may not receive the price they paid.
We have adopted a share redemption program to provide an opportunity for our stockholders to have shares of our common stock repurchased at a price equal to or at a discount from the current Determined Share Value in effect as of the date the shares are tendered for redemption, subject to a number of restrictions and limitations. No shares may be repurchased under our share redemption program until after the first anniversary of the date of purchase of such shares without approval from our Independent Directors Committee. Further, we are not obligated to repurchase shares of our common stock under the share redemption program. Notwithstanding the procedures outlined in the share redemption program, our board of directors or Independent Directors Committee may, in its sole discretion, reject any share redemption request made by any stockholder at any time. In addition, the share redemption program limits the number of shares that may be redeemed in any quarter. The total number of shares redeemed in any quarter pursuant to the share redemption program may not exceed (i) 1% of the total number of shares outstanding at the beginning of the applicable calendar year, plus (ii) 50% of the total number of any additional shares of our common stock issued during the prior calendar quarter pursuant to our DRIP; provided, however, that the total number of shares redeemed during any calendar year may not exceed 5% of the number of shares outstanding as of the first day of such calendar year. There is no fee in connection with a repurchase of shares pursuant to our share redemption program. Finally, our board of directors reserves the right to amend, suspend, or terminate the share redemption program at any time upon 30 days’ notice to our stockholders. As a result of the foregoing, a stockholder may not be able to sell any of its shares of our common stock back to us pursuant to our share redemption program. Moreover, if a stockholder does sell its shares of our common stock back to us pursuant to the share redemption program, the stockholder may not receive the same price it paid for any shares of our common stock being redeemed.
18
The Independent Directors Committee establishes the Determined Share Value on a quarterly basis. The Determined Share Value is not directly derived from any independent valuation, nor from the value of the existing property portfolio. Investors should use caution in using the Determined Share Value as the current value of shares of our common stock.
On a quarterly basis, the Independent Directors Committee establishes a Determined Share Value per share of our common stock, based on the net asset value of the portfolio, input from management and third-party consultants, and such other factors as the Independent Directors Committee may, in its sole discretion, determine, which we refer to as the Determined Share Value. See the caption Determined Share Value in Item 5. “Market for Registrant’s Common Equity, Related Stockholder Matters and Issuer Purchases of Equity Securities” within this Form 10-K for a complete discussion of the policies, procedures, and parties involved in calculating and reviewing the net asset value of the portfolio and setting the Determined Share Value. Shares of our common stock are offered in our ongoing private offering at a price per share equal to the current Determined Share Value and cash distributions can be reinvested in additional shares of our common stock pursuant to our distribution reinvestment plan at a price per share equal to 98% of the current Determined Share Value. In addition, shares of our common stock are redeemed by us pursuant to the terms of our share redemption program at a per share price equal to or at a discount to the current Determined Share Value. The Independent Directors Committee may, and currently does, engage consultants, appraisers, and other real estate or investment professionals to assist in their establishment of the Determined Share Value, but the Independent Directors Committee is not required to do so. As a result, the price of the shares of our common stock may not necessarily bear a direct relationship to our book or asset values or to any other established criteria for valuing issued or outstanding common stock and the actual value of an investor’s investment in shares of our common stock could be substantially less than what the stockholder may have paid to purchase the shares.
As with any valuation method, the methods used to determine the Determined Share Value are based upon a number of assumptions, estimates and judgments that may not be accurate or complete. Our assets are valued based upon appraisal standards and the values of our assets using these methods are not required to be a reflection of market value and will not necessarily result in a reflection of fair value under GAAP. Further, different parties using different property-specific and general real estate and capital market assumptions, estimates, judgments, and standards could derive different Determined Share Values, which could be significantly different from the Determined Share Values determined by the Independent Directors Committee. The Determined Share Value established as of any given time is not a direct representation or indication that, among other things, (i) a stockholder would be able to realize the full Determined Share Value if he or she attempts to sell their shares, (ii) a stockholder would ultimately realize distributions per share equal to the Determined Share Value upon liquidation of our assets and settlement of our liabilities or upon a sale of our company, (iii) shares of our common stock would trade at the Determined Share Value on a national securities exchange, (iv) a third party would offer the Determined Share Value in an arms-length transaction to purchase all or substantially all of our shares of common stock, or (v) the methodologies used to estimate the Determined Share Value would be acceptable to the requirements of any regulatory agency.
In order to qualify as a REIT, we retain the right to prohibit certain acquisitions and transfers of shares of our common stock, which limits our investors’ ability to purchase or sell shares.
We cannot maintain our qualification as a REIT if, among other requirements: (i) more than 50% of the value of our outstanding common stock is owned, directly or indirectly, by five or fewer stockholders during the last half of each taxable year, or (ii) fewer than 100 persons own our outstanding common stock during at least 335 days of a 12-month taxable year. In order to assist us in meeting certain REIT qualification requirements, our Articles of Incorporation restrict the direct or indirect ownership by one person or entity to no more than 9.8% of the value of our then outstanding shares of capital stock (which includes common stock and any preferred stock we may issue) and no more than 9.8% of the value or number of shares, whichever is more restrictive, of our then outstanding common stock unless exempted by our board of directors. We may, therefore, prohibit certain acquisitions and transfers of shares in an attempt to ensure our continued qualification as a REIT. These prohibitions may prevent our existing stockholders from acquiring additional shares, redeeming their shares, or selling their shares to others who may be deemed to, directly or indirectly, beneficially own our common stock.
19
Our success is dependent on the performance of our Manager and Asset Manager and any adverse change in their financial health could cause our operations to suffer.
Our ability to achieve our investment objectives and to pay distributions is dependent upon the performance of our Manager and Asset Manager and any adverse change in their financial health could cause our operations to suffer. Our Manager and Asset Manager are sensitive to trends in the general economy, as well as the commercial real estate and related markets. An economic downturn could result in reductions in overall transaction volume and size of sales and leasing activities, and would put downward pressure on our Manager’s and Asset Manager’s revenues and operating results. To the extent that any decline in revenues and operating results impacts the performance of our Manager or Asset Manager, our operating results could suffer.
Loss of key personnel of the Manager could delay or hinder our investment strategy, which could limit our ability to make distributions and decrease the value of an investment in us.
We are dependent upon the contributions of key personnel of the Manager. Our overall success and the achievement of our investment objectives depends upon the performance of our senior leadership team, each of whom is an employee of the Manager. We rely on our senior leadership team to, among other things, identify and consummate acquisitions, design and implement our financing strategies, manage our investments, and conduct our day-to-day operations. Members of our senior leadership team could choose to leave employment with the Manager for any number of reasons. We rely on the experience, efforts, and abilities of these individuals, each of whom would be difficult to replace. The loss of services of one or more members of our senior leadership team, or the Manager’s inability to attract and retain highly qualified personnel, could adversely affect our business, diminish our investment opportunities, and weaken our relationships with lenders, business partners, existing and prospective tenants, and industry participants, all of which could materially and adversely affect us.
In particular, Amy L. Tait and Christopher J. Czarnecki, our Executive Chairman of the board of directors and Chief Investment Officer and our Chief Executive Officer, respectively, and employees of the Manager, have significant real estate experience which would be difficult to replace. Each of Ms. Tait and Mr. Czarnecki has an employment agreement with the Manager which includes non-competition and non-solicitation covenants; however, these agreements could be amended by the Manager from time to time. Although the Manager has “key employee” life and disability insurance on each of Ms. Tait and Mr. Czarnecki, the proceeds of that insurance will be used as determined by the board of managers of the Manager, which consists of two appointees of the Manager’s management and two appointees of Trident BRE, and may be diverted to uses other than replacing the deceased or incapacitated executive. We may suffer direct, reputational, and other costs in the event of the loss of the services of either Ms. Tait or Mr. Czarnecki.
The Restated Management Contracts (as defined under the caption Asset Management Agreement in Item 13. “Certain Relationships and Related Transactions, and Director Independence” of this Form 10-K) include the concept of a Key Person Event (as defined below). Upon a Key Person Event, the Manager will have a period of 60 days to present to the Independent Directors Committee two individuals to serve as Chairman and Chief Executive Officer (or comparable executive positions with substantially the same responsibilities) of the Manager (such individuals, “Replacement Nominees”). Upon receipt of the Replacement Nominees, the Independent Directors Committee will have a period of up to six months (the “Review Period”) to consider the Replacement Nominees and to reasonably request additional information regarding the Replacement Nominees. If, prior to the expiration of the Review Period, (i) the Independent Directors Committee elects not to approve the Replacement Nominees and (ii) the Manager and the Independent Directors Committee have been unable, despite mutual good faith efforts, to agree upon suitable alternative individuals to appoint as the Chairman and Chief Executive Officer of the Manager, the Independent Directors Committee will have the right to terminate the Restated Management Contracts upon written notice to the Manager on or prior to the last day of the Review Period, with such termination effective 12 months from the date of such notice. The Restated Management Contracts define a “Key Person Event” as any event or circumstance which results in both of Ms. Tait and Mr. Czarnecki (or their respective successors and replacements, as approved by the Independent Directors Committee) no longer continuing to serve as the Chairman and Chief Executive Officer (or comparable executive positions), respectively, of the Manager for a continuous period of 60 days.
20
We pay substantial fees to our Manager and Asset Manager. These fees were not negotiated at arm’s length, may be higher than fees payable to unaffiliated third parties and may reduce cash available for investment.
We pay substantial fees to our Manager and Asset Manager. These fees were originally agreed to prior to the company accepting outside capital from investors other than our sponsors and were not negotiated at arm’s length, although the fees have since been reaffirmed by the Independent Directors Committee in connection with the approval of the Restated Management Agreements in December 2017. The fees could be in excess of amounts that we would otherwise pay to third parties for such services. In addition, the full offering price paid by our investors in our private offering will not be invested in properties. The proceeds are primarily used to acquire and operate our properties, but may also be used by us for general corporate purposes and to pay fees due to the Manager and the Asset Manager. As a result, stockholders will only receive a full return of their invested capital if: (1) we sell our assets or our company for a sufficient amount in excess of the original purchase price of our assets; (2) the market value of our company after we list our shares of common stock on a national securities exchange is substantially in excess of the original purchase price of our assets; or (3) they recoup their invested capital through the cash distributions we pay over the time they hold an investment in shares of our common stock.
We may not receive our expected cumulative preferred return on our investment in the Convertible Preferred BRE Units and, if we do not timely convert the Convertible Preferred BRE Units into common membership units of the Manager, we will not be entitled to a return in excess of our original investment in the Convertible Preferred BRE Units and cumulative preferred return.
The Convertible Preferred BRE Units we hold are entitled to distributions from the Manager equal to a cumulative 7.0% annual preferred return, payable prior to distributions paid to the holders of common membership units of the Manager, which preferred return increases annually by 0.25%. However, there can be no assurance that the board of managers of the Manager will declare and pay such distributions. The Convertible Preferred BRE Units are convertible, in whole and not in part, into common membership units of the Manager during the period from January 1, 2018 to December 31, 2019 (“conversion period”). If we do not elect to convert the Convertible Preferred BRE Units into common membership units of the Manager during the conversion period, we will be limited to a return of our original investment in the Convertible Preferred BRE Units and any unpaid cumulative preferred return payable on the Convertible Preferred BRE Units in the event of a liquidation of the Manager or if the Manager exercises its option to redeem the Convertible Preferred BRE Units after the conversion period.
As holder of the Convertible Preferred BRE Units, we have limited rights to approve or disapprove actions of the Manager.
We have limited rights to participate in the management of or control the Manager. The Convertible Preferred BRE Units have no voting rights, except for the limited right to approve, voting as a class, any amendment to the limited liability company agreement of the Manager which would materially and adversely affect the rights of the Convertible Preferred BRE Units or would create a series or type of membership interests senior to or on a parity with the Convertible Preferred BRE Units. As holder of the Convertible Preferred BRE Units, we do have the right to appoint one individual to attend, in an observer capacity, any meeting of the board of managers of the Manager and receive information provided to the managers of the Manager; however, such individual has no power to participate in the voting of the board of managers of the Manager or otherwise control the Manager.
A cybersecurity incident and other technology disruptions could negatively impact our business.
We, the Manager, and the Asset Manager, use technology in substantially all aspects of our business operations. Mobile devices, outside vendors, and other online activities are used to connect with our tenants, vendors, and employees of our affiliates. Our, the Manager’s, and the Asset Manager’s information technology (“IT”) networks and related systems are essential to the operation of our business and our ability to perform day-to-day operations. Our business involves the storage and transmission of numerous classes of sensitive and confidential information and intellectual property, including tenants’ information, private information about our stockholders and the Manager’s employees, and financial and strategic information about us. We face risks associated with security breaches, through cyber-attacks or cyber-intrusions over the internet, malware, computer viruses, attachments to e-mails, persons inside our organization or persons with access to systems inside our organization, and other significant disruptions of our IT networks and related systems. The risk of a security breach or disruption, particularly through cyber-attack or cyber-intrusion, including by computer hackers, foreign governments and cyber terrorists, has generally increased as the number, intensity, and sophistication of attempted attacks and intrusions
21
from around the world have increased. If we, the Manager, or the Asset Manager, fail to assess and identify cybersecurity risks associated with our operations, we may become increasingly vulnerable to such risks. Additionally, the measures we, the Manager, or the Asset Manager have implemented to prevent security breaches and cyber incidents may not be effective. The theft, destruction, loss, misappropriation, or release of sensitive or confidential information or intellectual property, or interference with or significant disruptions of our IT networks and related systems, or the technology systems of third parties on which we rely, could result in business disruption, negative publicity, brand damage, violation of privacy laws, loss of tenants, potential liability, and competitive disadvantage, any of which could result in a material adverse effect on our financial condition or results of operations.
A failure to maintain effective internal controls could have a material adverse effect on our business, financial condition, and results of operations.
Effective internal controls over financial reporting, disclosures, and operations are necessary for us to provide reliable financial reports and public disclosures, effectively prevent fraud, and operate successfully. If we cannot provide reliable financial reports and public disclosures or prevent fraud, our reputation and operating results would be harmed. Our internal controls over financial reporting and our operating internal controls may not prevent or detect financial misstatements or loss of assets because of inherent limitations, including the possibility of human error, management override of controls, or fraud. Effective internal controls can provide only reasonable assurance with respect to financial statement accuracy, public disclosures, and safeguarding of assets. Any failure of these internal controls, including any failure to implement required new or improved controls as a result of changes to our business or otherwise, or if we experience difficulties in their implementation, could result in decreased investor confidence in the accuracy and completeness of our financial reports and public disclosures, civil litigation, or investigations by the SEC or other regulatory authorities, which may adversely impact our business, financial condition, and results of operations and we could fail to meet our reporting obligations.
If we internalize our management functions, we could incur other significant costs associated with being self-managed.
Our board of directors may decide in the future to internalize our management functions. If we do so, we may elect to negotiate to acquire the Manager’s and the Asset Manager’s assets and hire the Manager’s personnel, each as related to the operation and management of our businesses. While we would no longer bear the costs of the various fees and expenses we expect to pay to the Manager and the Asset Manager under the Restated Management Contracts, our direct expenses would include additional general and administrative costs that are currently paid by the Manager and Asset Manager. In addition, we could be required to pay certain costs and contract termination fees in connection with our current management agreements with the Manager and the Asset Manager. For additional information regarding these termination fees, please see the caption titled Termination in Item 13. “Certain Relationships and Related Transactions, and Director Independence” of this Form 10-K. We would also be required to employ personnel and would be subject to potential liabilities commonly faced by employers, such as workers disability and compensation claims, potential labor disputes, and other employee-related liabilities and grievances as well as incur the compensation and benefits costs of our officers and other employees and consultants that are paid by the Manager and the Asset Manager. We cannot reasonably estimate the amount of fees to the Manager and the Asset Manager we would save or the costs we would incur if we became self-managed. If the expenses we assume as a result of an internalization are higher than the expenses we avoid paying to the Manager and the Asset Manager, our funds from operations would be lower as a result of the internalization than they otherwise would have been, potentially decreasing the amount of funds available to distribute to our stockholders.
Disruptions in the financial markets and deteriorating economic conditions could adversely impact our ability to implement our investment strategy and achieve our investment objectives.
The United States and global financial markets have experienced extreme volatility and disruption within the past decade. There was a widespread tightening in overall credit markets, devaluation of the assets underlying certain financial contracts, and increased borrowing by governmental entities. The turmoil in the capital markets resulted in constrained equity and debt capital available for investment in the real estate market, resulting in fewer buyers seeking to acquire properties, increases in capitalization rates, and lower property values. Recently, capital has been more available, and the overall economy has improved. However, the failure of a sustained economic
22
recovery or future disruptions in the financial markets and deteriorating economic conditions could impact the value of our investments in properties. In addition, if potential purchasers of properties have difficulty obtaining capital to finance property acquisitions, capitalization rates could increase, and property values could decrease. Current economic conditions greatly increase the risks of our investments. See Risks Related to Investments in Real Estate below.
We report FFO and AFFO, each of which is a non-GAAP financial measure.
We report FFO and AFFO, each of which is a non-GAAP financial measure, which we believe to be appropriate supplemental measures to reflect our operating performance.
Not all REITs necessarily calculate FFO and AFFO and other similar measures in the same way, and therefore comparisons of our disclosures of such measures with that of other REITs may not be meaningful. FFO and AFFO should not be considered as an alternative to net income as an indication of our performance, as an alternative to cash flows from operations as an indication of our liquidity, or indicative of funds available to fund our cash needs, including our ability to make distributions to our stockholders. FFO and AFFO should be reviewed in conjunction with GAAP measurements as an indication of our performance. We have provided a reconciliation of these measures to net income, which we believe to be the most comparable GAAP measure, in the caption Net Income and Non-GAAP Measures (FFO and AFFO) in Item 7. “Management’s Discussion and Analysis of Financial Condition and Results of Operations” of this Form 10-K.
Neither the SEC nor any other regulatory body has passed judgment on the acceptability of the adjustments that we use to calculate FFO and AFFO. In the future, the SEC or another regulatory body may decide to standardize the allowable adjustments across the REIT industry and in response to such standardization we may have to adjust our calculation and characterization of FFO and AFFO accordingly.
Risks Related to Our Organizational Structure
Maryland law and our organizational documents limit the rights of our stockholders to bring claims against our officers and directors.
Maryland law provides that a director of a Maryland corporation will not have any liability in that capacity if he or she performs his or her duties in accordance with the applicable standard of conduct. In addition, our Articles of Incorporation provide that, subject to the applicable limitations set forth therein or under Maryland law, no director or officer will be liable to us or our stockholders for monetary damages. Our Articles of Incorporation also provide that we will generally indemnify and advance expenses to our directors, our officers, and our Asset Manager and its affiliates for losses they may incur by reason of their service in those capacities subject to any limitations under Maryland law or in our Articles of Incorporation. Moreover, we have entered into separate indemnification agreements with each of our directors and executive officers. As a result, we and our stockholders may have more limited rights against these persons than might otherwise exist under common law, which could reduce our stockholders’ and our recovery against such persons. In addition, we may be obligated to fund the defense costs incurred by these persons in some cases, which would reduce the cash available for distributions. We have purchased insurance under a policy that insures both us and our officers and directors against exposure and liability normally insured against under such policies, including exposure on the indemnities described above.
The limit on the number of shares of our common stock a person may own may discourage a takeover or business combination that could otherwise result in a premium price to our stockholders.
Our Articles of Incorporation authorize our directors to take such actions as are necessary and desirable to preserve our qualification as a REIT. Our Articles of Incorporation restrict the direct or indirect ownership by one person or entity to no more than 9.8% of the value of our then outstanding shares of capital stock (which includes common stock and any preferred stock we may issue) and no more than 9.8% of the value or number of shares, whichever is more restrictive, of our then outstanding common stock unless exempted by our board of directors. This restriction may discourage a change of control of us and may deter individuals or entities from making tender offers for shares of our common stock on terms that might be financially attractive to stockholders or which may cause a change in our management. In addition to deterring potential transactions that may be favorable to our stockholders, these provisions may also decrease our stockholders’ ability to sell their shares of our common stock.
23
We may issue preferred stock or separate classes or series of common stock, the issuance of which could adversely affect the holders of our common stock.
Our Articles of Incorporation authorize us to issue up to 100,000,000 shares of stock, and our board of directors, without any action by our stockholders, may amend our Articles of Incorporation from time to time to increase or decrease the aggregate number of shares or the number of shares of any class or series of stock that we have authority to issue. Holders of shares of our common stock do not have preemptive rights to acquire any shares issued by us in the future.
In addition, our board of directors may classify or reclassify any unissued shares of our common stock or preferred stock and establish the preferences, rights and powers of any such stock. As a result, our board of directors could authorize the issuance of preferred stock or separate classes or series of common stock with terms and conditions that could have priority, with respect to distributions and amounts payable upon our liquidation, over the rights of our common stock. The issuance of shares of such preferred or separate classes or series of common stock could dilute the value of an investment in shares of our common stock. The issuance of shares of preferred stock or a separate class or series of common stock could also have the effect of delaying, discouraging, or preventing a change in control of us, including an extraordinary transaction (such as a merger, tender offer or sale of all or substantially all of our assets) that might provide a premium price for holders of our common stock.
The Independent Directors Committee may change our investment policies without stockholder approval, which could alter the nature of an investment in us.
The methods of implementing our investment policies and strategy may vary as new real estate development trends emerge, new investment techniques are developed, and market conditions evolve. Our investment policies, the methods for their implementation, and our other objectives, policies, and procedures may be altered by the Independent Directors Committee without the approval of our stockholders. As a result, the nature of an investment in us could change without the consent of our stockholders.
Our UPREIT structure may result in potential conflicts of interest with members in the Operating Company whose interests may not be aligned with those of our stockholders.
We use an UPREIT structure because a contribution of property directly to us, rather than the Operating Company, is generally a taxable transaction to the contributing property owner. In the UPREIT structure, a contributor of a property may transfer the property to the Operating Company in exchange for membership units and defer taxation of a gain until the contributor later disposes of or exchanges its membership units for shares of our common stock. We believe that using an UPREIT structure gives us an advantage in acquiring desired properties from persons who may not otherwise sell their properties because of unfavorable tax results.
We may issue membership units of the Operating Company in connection with certain transactions. Members in the Operating Company have the right to vote on certain amendments to the limited liability company agreement of the Operating Company, as well as on certain other matters. Persons holding such voting rights may exercise them in a manner that conflicts with the interests of our stockholders. As the managing member of the Operating Company, we are obligated to act in a manner that is in the best interest of all members of the Operating Company. Circumstances may arise in the future when the interests of members in the Operating Company may conflict with the interests of our stockholders. These conflicts may be resolved in a manner stockholders do not believe is in their best interest.
The value of an investment in our common stock may be reduced if we are required to register as an investment company under the Investment Company Act, and if we are subject to registration under the Investment Company Act, we will not be able to continue our business.
Neither we, the Operating Company, nor any of our subsidiaries intend to register as an investment company under the Investment Company Act. The Operating Company’s and subsidiaries’ investments in real estate will represent the substantial majority of our total asset mix. In order for us not to be subject to regulation under the Investment Company Act, we engage, through the Operating Company and our wholly and majority-owned subsidiaries, primarily in the business of buying real estate.
24
If we were obligated to register as an investment company, we would have to comply with a variety of substantive requirements under the Investment Company Act that impose, among other things:
|
|
• |
limitations on capital structure; |
|
|
• |
restrictions on specified investments; |
|
|
• |
prohibitions on transactions with affiliates; and |
|
|
• |
compliance with reporting, record keeping, voting, proxy disclosure, and other rules and regulations that would significantly change our operations and significantly increase our operating expenses. |
Section 3(a)(1)(A) of the Investment Company Act defines an investment company as any issuer that is or holds itself out as being engaged primarily, or proposes to engage primarily, in the business of investing, reinvesting, or trading in securities. Section 3(a)(1)(C) of the Investment Company Act defines an investment company as any issuer that is engaged or proposes to engage in the business of investing, reinvesting, owning, holding, or trading in securities and owns or proposes to acquire investment securities having a value exceeding 40% of the value of the issuer’s total assets (exclusive of U.S. government securities and cash items) on an unconsolidated basis, which we refer to as the 40% test. Excluded from the term “investment securities,” among other things, are U.S. government securities and securities issued by majority-owned subsidiaries that are not themselves investment companies and are not relying on the exception from the definition of investment company set forth in Section 3(c)(1) or Section 3(c)(7) of the Investment Company Act.
We expect that most of our assets will be held through wholly or majority-owned subsidiaries of the Operating Company. We believe that we, the Operating Company, and most of the subsidiaries of the Operating Company will not fall within either definition of investment company under Section 3(a)(1) of the Investment Company Act as we intend to invest primarily in real property, through our wholly or majority-owned subsidiaries, which we expect to have at least 60% of their assets in real property. As these subsidiaries would be investing either solely or primarily in real property, they would be outside of the definition of “investment company” under Section 3(a)(1) of the Investment Company Act. We are organized as a holding company that conducts its businesses primarily through the Operating Company, which in turn is a holding company conducting its business through its subsidiaries. Both we and the Operating Company intend to conduct our operations so that they comply with the 40% test. We will monitor our holdings to ensure continuing and ongoing compliance with this test. In addition, we believe that neither we nor the Operating Company will be considered an investment company under Section 3(a)(1)(A) of the Investment Company Act because neither we nor the Operating Company will engage primarily or hold itself out as being engaged primarily in the business of investing, reinvesting or trading in securities. Rather, through the Operating Company’s wholly owned or majority-owned subsidiaries, we and the Operating Company will be primarily engaged in the non-investment company businesses of these subsidiaries, namely the business of purchasing or otherwise acquiring real property.
To ensure that neither we nor any of our subsidiaries, including the Operating Company, are required to register as an investment company, each entity may be unable to sell assets that it would otherwise want to sell and may need to sell assets that it would otherwise wish to retain. In addition, we, the Operating Company or our subsidiaries may be required to acquire additional income- or loss-generating assets that we might not otherwise acquire or forego opportunities to acquire interests in companies that we would otherwise want to acquire. Although we, the Operating Company and our subsidiaries intend to monitor our portfolio periodically and prior to each acquisition and disposition, any of these entities may not be able to remain outside the definition of investment company or maintain an exclusion from the definition of investment company. If we, the Operating Company or our subsidiaries are required to register as an investment company but fail to do so, the unregistered entity would be prohibited from engaging in our business, and criminal and civil actions could be brought against such entity. In addition, the contracts of such entity would be unenforceable unless a court required enforcement, and a court could appoint a receiver to take control of the entity and liquidate its business.
25
Risks Related To Conflicts of Interest
The officers and employees of the Manager and its affiliates face competing demands relating to their time, which may cause our operating results to suffer.
The officers and employees of the Manager and the Asset Manager are not prohibited from raising money for, or managing, other investment entities, or from engaging in business activities and investments unrelated to us. As a result, these persons may have competing demands on their time and resources and they may face conflicts of interest in allocating their time between our business and these other activities. During times of intense activity in other programs and ventures, they may devote less time and fewer resources to our business than is necessary or appropriate. If this occurs, the returns on an investment in our company may suffer.
The Manager and Asset Manager currently sponsor and provide services to (a) Broadtree Residential, Inc., a private multifamily apartment REIT with approximately $145 million in investments in a portfolio of income-producing multifamily apartment communities as of December 31, 2017, and (b) Broadstone Real Estate Access Fund, Inc., a continuously offered, non-diversified, closed-end management investment company that is operated as an interval fund with approximately $31 million in investments as of December 31, 2017. As of December 31, 2017, the Manager employed approximately 38 individuals who dedicate time to Broadstone Net Lease, Inc., Broadtree Residential, Inc., and Broadstone Real Estate Access Fund, Inc. The Manager and Asset Manager may sponsor and provide services to additional entities in the future.
Our officers and certain of our directors face conflicts of interest related to the positions they hold with affiliated entities, which could hinder our ability to successfully implement our business strategy and to generate returns for our investors.
Our executive officers and affiliated directors are also officers and managers of, and in some cases equity investors in, our Manager and other affiliated entities. Most significantly, Amy L. Tait, our Executive Chairman of the board of directors and Chief Investment Officer, serves as an executive officer of the Manager, is a member of the Manager’s board of managers, and as of December 31, 2017, owns, together with Tait family trusts and an investment entity for the families of Ms. Tait and the late Norman Leenhouts, an approximately 44.44% equity ownership interest in the Manager; and Christopher J. Czarnecki, our Chief Executive Officer and a member of our board of directors, is an executive officer of the Manager and a member of the Manager’s board of managers. Mr. Czarnecki and our other executive officers also own membership interests in the Manager. All of our executive officers are officers of the Manager and, in certain circumstances, other affiliated entities.
As a result, these individuals owe fiduciary duties to the Manager and other affiliated entities, which may conflict with the duties that they owe to us and our stockholders. Their responsibilities to these other entities could result in actions or inactions that are detrimental to our business, which could harm the implementation of our business strategy and our investment and leasing opportunities. If we do not successfully implement our business strategy, we may be unable to generate cash needed to make distributions to our stockholders and to maintain or increase the value of our assets.
The Manager and the Asset Manager and their respective affiliates, including some of our directors and officers, face conflicts of interest relating to our compensation arrangements with the Manager and the Asset Manager, which could result in actions that are not in the best interests of our stockholders.
Pursuant to the Restated Management Contracts, the Asset Manager and the Manager receive substantial fees from us in return for their services. These compensation arrangements could influence the advice and services provided to us by the Asset Manager and the Manager and present potential conflicts of interest for the officers, employees, and equity owners of the Manager and Asset Manager who also serve as our directors and officers.
Pursuant to the Asset Management Agreement, the Asset Manager is entitled to receive substantial compensation regardless of our performance or the quality of the services provided to us. As a result, the Asset Manager’s interests may not be wholly aligned with those of our stockholders. Our Asset Manager could be motivated to raise equity above and beyond our ability to prudently deploy such capital into accretive investments in order to generate higher annual asset management fees. Further, the acquisition fees and disposition fees payable by us to the Asset Manager may incentivize the Asset Manager to recommend or pursue property acquisitions or dispositions that it would otherwise not recommend or pursue, or upon different terms than it would otherwise find acceptable, if it was not entitled to such fees.
26
Pursuant to the Property Management Agreement, the Manager is entitled to receive a property management fee based on the gross rentals payable by the tenants in our properties regardless of the properties’ quality, our overall financial performance, or the quality of the services provided to us by the Manager. As a result, our Manager’s interests may not be wholly aligned with those of our stockholders. The management fees paid to the Manager could also incentivize the Asset Manager to recommend or pursue property acquisitions that it would otherwise not recommend or pursue, or upon different terms than it would otherwise find acceptable, if the Manager was not entitled to such fees.
For additional information regarding these compensation arrangements, see Item 13. “Certain Relationships and Related Transactions, and Director Independence” of this Form 10-K.
The Asset Manager and Manager are entitled to significant termination fees in the event that we terminate the Asset Management Agreement or Property Management Agreement.
Pursuant to the Restated Management Contracts, in the event that we terminate the Asset Management Agreement or the Property Management Agreement other than for “cause” (as defined in the Asset Management Agreement and the Property Management Agreement), we are required to pay the Asset Manager or the Manager, as applicable, a significant termination fee. The termination fee payable pursuant to the Asset Management Agreement is equal to three times the asset management fee to which the Asset Manager was entitled during the 12-month period immediately preceding the date of the termination. The termination fee payable pursuant to the Property Management Agreement is equal to three times the property management fee to which the Manager was entitled during the 12-month period immediately preceding the date of the termination. In addition, the Asset Management Agreement provides that the Asset Manager is entitled to receive a disposition event fee equal to 1.0% of the aggregate consideration (as defined in the Asset Management Agreement) received in connection with the sale of our company. The existence of these fees may create conflicts of interest with respect to the termination of the Asset Management Agreement and the Property Management Agreement, or a sale of our company.
Trident BRE holds a significant ownership interest in the Manager, has the power to appoint two members of the board of managers of the Manager, and employs one of the non-independent members of our board of directors. Trident BRE’s interests may not be fully aligned with those of our other stockholders.
As of December 31, 2017, Trident BRE holds an approximate 44.44% equity ownership interest in the Manager, and has the power to appoint two of the four members of the board of managers of the Manager. In addition, Agha Khan, one of the two non-independent members of our board of directors designated by the Asset Manager, is an employee of Stone Point Capital LLC, an affiliate of Trident BRE. The other member of the board of managers of the Manager appointed by Trident BRE and Mr. Khan owe duties to Stone Point Capital LLC and Trident BRE and their affiliates in addition to their duties to the Manager and us, and may face conflicts of interests as a result. Trident BRE may influence the manner in which our Asset Manager (a wholly owned subsidiary of the Manager) seeks to acquire or dispose of properties or otherwise performs its duties under the Asset Management Agreement or cause the Manager or its affiliates to take on new activities unrelated to our business.
Risks Related to Investments in Real Estate
Our operating results are affected by economic and regulatory changes that impact the real estate market in general.
Our investments in real properties are subject to risks generally attributable to the ownership of real property, including:
|
|
• |
changes in global, national, regional, or local economic, demographic, or real estate market conditions; |
|
|
• |
changes in supply of or demand for similar properties in an area; |
|
|
• |
increased competition for real property investments targeted by our investment strategy; |
|
|
• |
bankruptcies, financial difficulties, or lease defaults by tenants; |
|
|
• |
changes in interest rates and availability of financing; |
27
|
|
• |
changes in the terms of available financing, including more conservative loan-to-value requirements and shorter debt maturities; |
|
|
• |
competition from other properties; |
|
|
• |
the inability or unwillingness of tenants to pay rent increases; |
|
|
• |
changes in government rules, regulations, and fiscal policies, including changes in tax, real estate, environmental, and zoning laws; |
|
|
• |
changes in the prices of fuel and energy consumption, cost of labor and material, and water and environmental restrictions, which may affect the businesses of tenants and their ability to meet their lease payments; |
|
|
• |
inability to lease properties upon termination of existing leases and renewal of leases at lower rental rates; |
|
|
• |
uninsured property liability and property damage or casualty losses; |
|
|
• |
unexpected expenditures for capital improvements, including requirements to bring properties into compliance with applicable federal, state and local laws; |
|
|
• |
physical or weather-related damage to properties; |
|
|
• |
the potential risk of functional obsolescence of properties over time; |
|
|
• |
acts of terrorism and war; and |
|
|
• |
acts of God and other factors beyond our control. |
All of these factors are beyond our control. Any negative changes in these factors could affect our ability to meet our obligations and make distributions to stockholders.
We are unable to predict future changes in global, national, regional, or local economic, demographic, or real estate market conditions. For example, a recession or rise in interest rates could make it more difficult for us to lease or dispose of properties and could make alternative interest-bearing and other investments more attractive and therefore potentially lower the relative value of the real estate assets we acquire. These conditions, or others we cannot predict, may adversely affect our results of operations and returns to our stockholders. In addition, the value of the properties we acquire may decrease following the date we acquire such properties due to the risks described above or any other unforeseen changes in market conditions. If the value of our properties decreases, we may be forced to dispose of our properties at a price lower than the price we paid to acquire our properties, which could adversely impact the results of our operations and our ability to make distributions and return capital to our investors.
We face competition for the purchase and financing of properties from entities with substantially more capital at their disposal that may cause us to have difficulty finding or maintaining properties that generate favorable returns.
We compete with many other entities engaged in real estate investment activities, including other REITs, specialty finance companies, savings and loan associations, sovereign wealth funds, banks, mortgage bankers, insurance companies, institutional investors, investment banking firms, lenders, governmental bodies, and other entities, many of which have greater resources than we do. Larger REITs may enjoy significant competitive advantages that result from, among other things, a lower cost of capital and enhanced operating efficiencies. Further, the rental rates that we are able to receive on the properties we purchase depend substantially upon the presence of competition from these other property purchasers and, to a certain extent, upon the availability of mortgage financing at similar rates that would allow a tenant to own its property. The availability of these alternative purchasers or sources of financing at lower rates has periodically caused competition for attractive properties and caused reduction in market rental rates, both of which could diminish returns to our investors.
28
A concentration of our investments in a certain state or geographic regions may leave our profitability vulnerable to a downturn or slowdown in state or region.
Our current Investment Policy provides that we may not invest more than 10% of the aggregate cost of our portfolio in properties located in any single metropolitan statistical area or more than 20% of the aggregate cost of our portfolio in properties located in any single state. However, if our Investment Policy was amended or for some other reason our investments became concentrated in a particular state or geographic region, and such state or geographic region experiences economic difficulty disproportionate to the nation as a whole, then the potential effects on our revenues, and as a result, our cash available for distribution to our stockholders, could be more pronounced than if we had more fully diversified our investments geographically.
A significant portion of our property portfolio’s annual base rent is concentrated in specific industry classifications, tenants and geographic locations.
As of December 31, 2017, approximately 22.8% of the NTM Rent from our property portfolio was generated by tenants in the healthcare industry and approximately 34.2% of the NTM Rent was generated by tenants in the retail industry, of which 22.5% was in the restaurant industry. In recent years a number of companies in the restaurant industry have declared bankruptcy, have gone out of business or have significantly reduced the number of their locations. In particular, we have experienced, and expect to continue to experience, challenges with some of our restaurant tenants, and have recorded immaterial asset impairments on certain assets as a result of increased credit losses.
The ongoing impacts of the disruption in the retail industry, particularly adverse changes in consumer spending and consumer preferences for particular goods, services, or store-based retailing could severely impact retail tenants’ ability to pay rent. Shifts from in-store to online shopping could increase due to changing consumer shopping patterns as well as the increase in consumer adoption and use of mobile electronic devices. This expansion of e-commerce could have an adverse impact on our retail tenants' ongoing viability.
Any economic difficulties or downturns which disproportionately impact such industries could negatively affect market rents, thereby reducing rents payable to us, and they may lead to increased vacancy rates at our properties and diminish our ability to attract and retain tenants. This in turn could have an adverse effect on our results of operations and ability to pay distributions.
We are dependent on our tenants for substantially all of our revenue and our success is materially dependent on the financial stability of our tenants.
Each of our existing properties is occupied by only one master tenant, and as a result our success is dependent on the financial stability of these tenants in the aggregate. Our tenants encounter significant macroeconomic, governmental, and competitive forces. Adverse changes in consumer spending or consumer preferences for particular goods, services, or store-based retailing could severely impact the ability of certain of our tenants to pay rent. The default or financial distress of a tenant on its lease payments may cause us to lose some of the anticipated revenue from the property. Vacancies in properties reduce our revenues, increase property expenses, and could decrease the value of each such vacant property. In the event of a material default under a lease, we may experience delays in enforcing our rights as landlord and may incur substantial costs in protecting our investment and possibly re-letting the property. If a lease is terminated, we cannot assure our investors that the property could be leased for the same amount of rent previously received or that we could sell the property without incurring a loss.
In addition, our ability to increase our revenues and operating income may depend on steady growth of demand for the products and services offered by our tenants. A significant decrease in demand for our tenants’ products and services for any reason could result in a reduction in tenant performance and consequently, adversely affect us.
If a tenant files for bankruptcy, we may be precluded from collecting all sums due to us.
If a tenant, or the guarantor of a lease of a tenant, commences, or has commenced against it, any legal or equitable proceeding under any bankruptcy, insolvency, receivership, or other debtor’s relief statute or law (collectively, a “bankruptcy proceeding”), we may be unable to collect all sums due to us under that tenant’s lease. Any or all of the lease obligations of our tenants, or any guarantor of our tenants, could be subject to a bankruptcy proceeding which may bar our efforts to collect pre-bankruptcy debts from these entities or their properties, unless
29
we are able to obtain an enabling order from the bankruptcy court. If our lease is rejected by a tenant in bankruptcy, we may only have a general unsecured claim against the tenant and may not be entitled to any further payments under the lease. A bankruptcy proceeding could hinder or delay our efforts to collect past due balances and ultimately preclude collection of these sums, resulting in a decrease or cessation of rental payments and reducing returns to our investors.
If we are delayed or unable to find suitable investments, we may not be able to achieve our investment objectives and our investors’ returns may be reduced.
We may experience difficulty in finding attractive properties resulting in a delay of investment of the proceeds from our ongoing offering in real estate and reducing our ability to make distributions and, thus, the returns to our investors. Our investors’ returns may be reduced to the extent we are delayed in our selection and acquisition of real estate properties. The proceeds of our ongoing private offering will generally be used to pay down existing advances under the Operating Company’s line of credit or invested at money market rates until such time as it is used to acquire a real estate property. Any proceeds from our ongoing private offering that are ultimately invested by the Operating Company at money market rates will likely produce less income than if such proceeds were immediately invested in real estate properties. As a result, our investors’ returns may be reduced to the extent we are delayed in our selection and acquisition of real estate properties.
Some properties may be suitable for only one use and may be costly to refurbish if a lease is terminated.
The properties we purchase may be designed for a particular type of tenant or tenant use. If a tenant of such property does not renew its occupancy or defaults on its lease, the property might not be marketable without substantial capital improvements. The cost of such improvements may reduce the amount of cash available for distributions to our investors. An attempt to lease or sell the property without such improvements could also result in a lower rent or selling price and may also reduce the amount of cash available for distributions to our investors.
Our real estate investments are illiquid.
Because real estate investments are relatively illiquid, our ability to adjust our portfolio promptly in response to economic or other conditions may be limited. Certain significant expenditures generally do not change in response to economic or other conditions, including: (i) debt service (if any), (ii) real estate taxes, and (iii) operating and maintenance costs. This combination of variable revenue and relatively fixed expenditures may result, under certain market conditions, in reduced earnings and could have an adverse effect on our financial condition.
We may experience difficulty in the sale of a property and could be forced to sell a property at a price that reduces the return to our investors.
The real estate market is affected by many factors that are out of our control, including the availability of financing, interest rates, and other factors, as well as supply and demand for real estate investments. As a result, we cannot predict whether we will be able to sell a property or whether such sale could be made at a favorable price or on terms acceptable to us. We also cannot predict the length of time which will be needed to identify a purchaser or to complete the sale of any property.
We can reinvest proceeds from sales of our properties in replacement properties without our investors’ approval.
We may, from time to time, sell a property and reinvest the proceeds in a replacement property rather than make a distribution to our investors. Our investors will not have a right to the cash received by the Operating Company from the sale of a property and must rely upon the ability of the Asset Manager to find replacement properties in which to reinvest the proceeds.
30
Long-term leases may not result in fair market lease rates over time; therefore, our income and our distributions to our stockholders could be lower than if we did not enter into long-term leases.
We generally lease our properties pursuant to long-term leases with terms of 10 or more years, often with extension options. Our long-term leases generally provide for rents to increase over time, due to fixed rent increases or increases based upon increases in the Consumer Price Index or financial metrics related to the tenant. However, if we do not accurately judge the potential for increases in market rental rates, we may set the terms of these long-term leases at levels such that even after contractual rental increases the rent under our long-term leases is less than then-current market rental rates. Further, we may have a limited ability to terminate those leases or to adjust the rent to then-prevailing market rates.
Certain provisions of our leases or loan agreements may be unenforceable.
Our rights and obligations with respect to the leases at our properties, mortgage loans, or other loans are governed by written agreements. A court could determine that one or more provisions of such an agreement are unenforceable, such as a particular remedy, a master lease covenant, a loan prepayment provision, or a provision governing our security interest in the underlying collateral of a borrower or lessee. We could be adversely impacted if this were to happen with respect to an asset or group of assets.
Our costs of compliance with governmental laws and regulations may reduce the investment return of our stockholders.
All real property and the operations conducted on real property are subject to numerous federal, state and local laws and regulations. We cannot predict what laws or regulations will be enacted in the future, how future laws or regulations will be administered or interpreted, or how future laws or regulations will affect us or our properties, including, but not limited to, environmental laws and regulations and the Americans with Disabilities Act of 1990. Compliance with new laws or regulations, or stricter interpretation of existing laws, may require us or our tenants to incur significant expenditures, impose significant liability, restrict or prohibit business activities, and could cause a material adverse effect on our results of operations.
Further, as a reporting company under the Exchange Act, we are required to comply with various reporting requirements, as well as additional laws, rules and regulations, including the Dodd-Frank Act and the Sarbanes-Oxley Act of 2002. Our efforts to comply with applicable laws and regulations are expected to involve significant, and potentially increasing, costs. In addition, these laws, rules, and regulations create new legal bases for administrative, civil, and criminal proceedings against us in case of non-compliance, thereby increasing our risk of liability and potential sanctions.
We may be subject to known or unknown environmental liabilities and hazardous materials on our properties.
There may be known or unknown environmental liabilities associated with properties we own or acquire in the future. Certain uses of some properties may also have a heightened risk of environmental liability because of the hazardous materials used in performing services on those properties, such as convenience stores with underground petroleum storage tanks or auto parts and auto service businesses using petroleum products, paint, machine solvents, and other hazardous materials. Some properties may contain asbestos or asbestos-containing materials, or may contain or may develop mold or other bio-contaminants. Asbestos-containing materials must be handled, managed, and removed in accordance with applicable governmental laws, rules and regulations. Mold and other bio-contaminants can produce airborne toxins, may cause a variety of health issues in individuals and must be remediated in accordance with applicable governmental laws, rules, and regulations.
The Asset Manager undertakes customary environmental diligence prior to our acquisition of any property. As a current or previous owner of a real estate property, however, we may be required to remove or remediate hazardous or toxic substances on, under, or in such property under various federal, state, and local environmental laws, ordinances, and regulations. These laws may impose liability whether or not the Operating Company knew of, or was responsible for, the presence of such hazardous or toxic substances. Our use and operation of a property may also be restricted by environmental laws or require certain expenditures. Failure to comply with environmental laws may result in sanctions by governmental agencies or liability to third parties. The cost of compliance or defense against claims from a contaminated property will likely affect our results of operations and ability to make distributions.
31
Although our leases generally require our tenants to operate in compliance with all applicable federal, state, and local environmental laws, ordinances, and regulations, and to indemnify us against any environmental liabilities arising from the tenants’ activities on the property, we could nevertheless be subject to liability, including strict liability, by virtue of our ownership interest. There also can be no assurance that our tenants, or the guarantor of a lease, could or would satisfy their indemnification obligations under their leases.
Natural disasters and other events beyond our control could impact our properties and operations and the insurance purchased for our properties might not be adequate to cover losses we incur.
Natural disasters or other catastrophic events (e.g., hurricanes, floods, earthquakes, or other types of natural disasters or wars or other acts of violence) may cause damage or disruption to our operations and damage to our properties. We own properties in regions that have historically been impacted by such natural disasters and it is probable such regions will continue to be impacted by such events. Although the Manager arranges for, or will require tenants to maintain, comprehensive insurance coverage on our properties, some catastrophic types of losses from such events may be either uninsurable or not economically insurable. If a disaster occurs, we could suffer a complete loss of capital invested in, and any profits expected from, the affected properties. If uninsured damages to a property occur or a loss exceeds policy limits and we do not have adequate cash to fund repairs, we may be forced to sell the property at a loss or to borrow capital to fund the repairs.
Risks Related to Debt Financing
Our business strategy relies on external financing and, as a result, we may be negatively affected by restrictions on additional borrowings and are subject to the risks associated with leverage, including our debt service obligations.
We use leverage so that we may make more investments than would otherwise be possible in order to maximize potential returns to stockholders. We have been gradually reducing our overall leverage over the past few years, particularly in light of the Operating Company’s receiving an investment grade credit rating, but we still maintain a significant amount of debt, and may increase our debt going forward. Our ability to achieve our investment objectives will be affected by our ability to borrow money in sufficient amounts and on favorable terms. In addition, we may be unable to obtain the degree of leverage we believe to be optimal, which may cause us to have less cash for distribution to stockholders than we would have with an optimal amount of leverage.
We have incurred, and intend to incur in the future, unsecured borrowings and mortgage indebtedness, which may increase our business risks, could hinder our ability to make distributions, and could decrease the value of an investment in our shares.
We have incurred, and plan to incur in the future, financing through unsecured borrowings under term loans and our revolving line of credit and mortgage loans secured by some or all of our real properties. In some cases, the mortgage loans we incur are guaranteed by us, the Operating Company, or both. We may also borrow funds if necessary to satisfy the requirement that we distribute to stockholders as dividends at least 90% of our annual REIT taxable income, or otherwise as is necessary or advisable to assure that we maintain our qualification as a REIT for federal income tax purposes. Our current Leverage Policy targets a leverage ratio equal to 35% to 45% of the approximate market value of our assets. The actual leverage ratio will vary over time but may not exceed 50% without the approval of the Independent Directors Committee. Depending on market conditions and other factors, the Independent Directors Committee may change our Leverage Policy from time to time in its discretion.
We may incur mortgage debt on a particular property, especially if we believe the property’s projected cash flow is sufficient to service the mortgage debt. If there is a shortfall in cash flow, however, then the amount available for distributions to our stockholders may be affected. In addition, incurring mortgage debt may increase the risk of loss since defaults on indebtedness secured by a property may result in foreclosure actions initiated by lenders and our loss of the property securing the loan that is in default. For tax purposes, a foreclosure of any of our properties would be treated as a sale of the property for a purchase price equal to the outstanding balance of the debt secured by the mortgage. If the outstanding balance of the debt secured by the mortgage exceeds our tax basis in the property, we would recognize taxable income on foreclosure but would not receive any of the proceeds. We may give full or partial guarantees to lenders to the Operating Company or its affiliates. If we give a guaranty on behalf of the Operating Company, we will be responsible to the lender for satisfaction of the debt if it is not paid by the Operating Company. If any mortgages contain cross-collateralization or cross-default provisions, there is a risk that more than one of our real properties may be affected by a default. If any of our properties are foreclosed upon due to a default, our results of operations and ability to pay distributions to our stockholders may be adversely affected.
32
Our line of credit and term loan agreements contain various covenants which, if not complied with, could accelerate our repayment obligations, thereby materially and adversely affecting our liquidity, financial condition, results of operations, and ability to pay distributions to stockholders.
We are subject to various financial and operational covenants and financial reporting requirements pursuant to the agreements we have entered into governing our line of credit, term loans and Senior Notes. These covenants require us to, among other things, maintain certain financial ratios, including leverage, fixed charge coverage, and debt service coverage, among others. As of December 31, 2017, we were in compliance with all of our loan covenants. Our continued compliance, however, with these covenants depends on many factors, and could be impacted by current or future economic conditions, and thus there are no assurances that we will continue to comply with these covenants. Failure to comply with these covenants would result in a default which, if we were unable to obtain a waiver from the lenders, could accelerate our repayment obligations and thereby have a material adverse impact on our liquidity, financial condition, results of operations and ability to pay distributions to stockholders.
Increases in interest rates could increase the amount of our debt payments and adversely affect our ability to make distributions to our stockholders.
We have a significant amount of debt. Although we believe we have effectively hedged the risk of interest rate increases through swaps and the issuance of fixed-rate debt, we will need to refinance our debt in the future. Accordingly, increases in interest rates would increase our interest costs, which could have a material adverse effect on our operating cash flow and ability to pay distributions. In addition, if we need to repay existing debt during periods of rising interest rates, we could be required to liquidate one or more of our properties at times which may not permit realization of the maximum or anticipated return on such investments.
An inability to refinance existing mortgage debt as it matures could impact distributions to our stockholders.
Since the mortgage loans secured by certain of our properties amortize over a period longer than their maturity, we will owe substantial amounts of principal on the maturity of such loans. If we cannot refinance these loans on favorable terms, more of our cash from operations may be required to service the loans, properties may have to be sold to fund principal repayments, or properties may be lost to foreclosure. This could adversely affect our results of operations and reduce cash available for distributions.
Failure to maintain our current credit rating could adversely affect our cost of capital, liquidity, and access to capital markets.
In March of 2016, Moody’s assigned the Operating Company an investment grade credit rating of Baa3 with a stable outlook, which was re-affirmed in March of 2017. As a result of receiving the investment grade credit rating, effective April 1, 2016, the interest rate pricing grids utilized to determine the spread we pay over LIBOR for our unsecured credit facilities changed from being dependent upon our leverage ratio, to being dependent upon our credit rating. The rating is based on a number of factors, including an assessment of our financial strength, portfolio size and diversification, credit and operating metrics, and sustainability of cash flow and earnings. If we are unable to maintain our current credit rating it could adversely affect our cost of capital, liquidity, and access to capital markets. Factors that could negatively impact our credit rating include, but are not limited to: a significant increase in our leverage on a sustained basis; a significant increase in secured debt levels; a significant decline in our unencumbered asset base; and a significant decline in our portfolio diversification.
Disruptions in the financial markets or deteriorating economic conditions could adversely affect our ability to obtain debt financing on attractive terms and impact our acquisitions and dispositions.
In periods when the capital and credit markets experience significant volatility, the amounts, sources, and cost of capital available to us may be adversely affected. We use external financing to refinance indebtedness as it matures and to partially fund our acquisitions. If sufficient sources of external financing are not available to us on cost effective terms, we could be forced to limit our planned business activities or take other actions to fund our business activities and repayment of debt such as selling assets or reducing our cash distributions. To the extent that we are able to, or choose to, access capital at a higher cost than we have experienced in recent years, our earnings and cash flows could be adversely affected. Uncertainty in the credit markets also could negatively impact our ability to make acquisitions, make it more difficult or impossible for us to sell properties, or may adversely affect the price we receive for properties that we do sell, as prospective buyers may experience increased costs of debt financing or difficulties in obtaining debt financing.
33
Failure to qualify as a REIT would reduce our net income and the investment return of our stockholders would be adversely affected.
If we fail to qualify as a REIT for any taxable year, we will be subject to federal income tax on our taxable income at corporate rates. In addition, we would generally be disqualified from treatment as a REIT for the four taxable years following the year of losing our REIT status. A loss of our REIT status would reduce distributions to our stockholders due to our additional tax liability. In addition, distributions to our stockholders would no longer qualify for the dividends-paid deduction, and we would no longer be required to make distributions. If this occurs, we may need to borrow funds or liquidate some of our properties in order to pay the applicable taxes.
Legislative, regulatory or administrative changes could adversely affect us or our stockholders.
Legislative, regulatory or administrative changes could be enacted or promulgated at any time, either prospectively or with retroactive effect, and may adversely affect us or our stockholders.
On December 22, 2017, the tax legislation commonly referred to as the Tax Cuts and Jobs Act was signed into law, generally applying in taxable years beginning after December 31, 2017. The Tax Cuts and Jobs Act makes significant changes to the U.S. federal income tax rules for taxation of individuals and corporations. In the case of individuals, the income tax brackets are adjusted, the top federal income rate is reduced to 37%, special rules reduce taxation of certain income earned through pass-through entities and reduce the top effective rate applicable to ordinary dividends from REITs to 29.6% (through a 20% deduction for ordinary REIT dividends received in combination with the 37% top rate) and various deductions are eliminated or limited, including limiting the deduction for state and local taxes to $10,000 per year. Most of the changes applicable to individuals are temporary and apply only to taxable years beginning after December 31, 2017, and before January 1, 2026. The corporate income tax rate is reduced to 21%. There are only minor changes to the REIT rules (other than the 20% deduction applicable to individuals for ordinary REIT dividends received).
While the changes in the Tax Cuts and Jobs Act generally appear to be favorable with respect to REITs, the extensive changes to non-REIT provisions in the Code may have unanticipated effects on us, our stockholders, or our tenants. Moreover, Congressional leaders have recognized that the process of adopting extensive tax legislation in a short amount of time without hearings and substantial time for review is likely to have led to drafting errors, issues needing clarification and unintended consequences that will have to be revisited in subsequent tax legislation. At this point, it is not clear if or when Congress will address these issues or when the IRS will issue administrative guidance on the changes made in the Tax Cuts and Jobs Act.
Our stockholders and prospective investors are urged to consult with their own tax advisors with respect to the Tax Cuts and Jobs Act and the status of other legislative, regulatory, or administrative developments and proposals and their potential effect on an investment in shares of our common stock.
Recharacterization of sale-leaseback transactions may cause us to lose our REIT status, which would reduce the investment return of our stockholders.
We may purchase properties and lease them back to the sellers of such properties. If the IRS were to challenge our characterization of such transaction as a “true-lease” and recharacterize the transaction as a financing transaction or loan for federal income tax purposes, deductions for depreciation and cost recovery relating to such property would be disallowed. If a sale-leaseback transaction is recharacterized, we may fail to satisfy the REIT qualification asset tests or income tests and, consequently, lose our REIT status. Alternatively, the amount of our REIT taxable income could be recalculated, which might also cause us to fail to meet the distribution requirements for a taxable year.
34
Our stockholders may have current tax liability on distributions based on an election to reinvest in our common stock.
A stockholder who participates in our distribution reinvestment plan will be deemed to have received, and for income tax purposes will be taxed on, the amount reinvested in shares of our common stock to the extent the amount reinvested was not a tax-free return of capital. As a result, unless a stockholder is a tax-exempt entity, the investor may have to use funds from other sources to pay the investor’s tax liability on the value of the shares of common stock received.
Even if we qualify as a REIT for federal income tax purposes, we may be subject to other tax liabilities that reduce our cash flow and our ability to make distributions to our stockholders.
Even if we remain qualified as a REIT for federal income tax purposes, we may still be subject to federal, state, and local taxes on our income or property. For example:
|
|
• |
In order to qualify as a REIT, we must distribute annually at least 90% of our REIT taxable income to our stockholders (which is determined without regard to the dividends-paid deduction and excludes net capital gain), and to the extent that we satisfy the distribution requirement but distribute less than 100% of our REIT taxable income, we will be subject to federal corporate income tax on the undistributed income. |
|
|
• |
We will be subject to a 4% nondeductible excise tax on the amount, if any, by which distributions we pay in any calendar year are less than the sum of 85% of our ordinary income, 95% of our capital gain net income, and 100% of our undistributed income from prior years. |
|
|
• |
If we have net income from the sale of foreclosure property that we hold or acquire primarily for sale to customers in the ordinary course of business or other non-qualifying income from foreclosure property, we must pay a tax on that income at the highest corporate income tax rate. |
|
|
• |
If we sell a property, other than foreclosure property, that we hold or acquire primarily for sale to customers in the ordinary course of business, our gain would be subject to the 100% “prohibited transaction” tax. |
|
|
• |
We may perform additional, non-customary services for tenants of our buildings through a taxable REIT subsidiary, including real estate or non-real estate related services; however, any earnings that exceed allowable limits related to such services are subject to federal and state income taxes. |
To maintain our REIT status, we may be forced to borrow funds during unfavorable market conditions to make distributions to our stockholders, which could increase our operating costs and decrease the value of our stockholders’ investment.
To qualify as a REIT, we must distribute to our stockholders each year 90% of our REIT taxable income (which is determined without regard to the dividends-paid deduction and excludes net capital gain). At times, we may not have sufficient funds to satisfy these distribution requirements and may need to borrow funds to maintain our REIT status and avoid the payment of income and excise taxes. These borrowing needs could result from (i) differences in timing between the actual receipt of cash and inclusion of income for federal income tax purposes; (ii) the effect of non-deductible capital expenditures; (iii) the creation of reserves; or (iv) required debt or amortization payments. We may need to borrow funds at times when market conditions are unfavorable. Such borrowings could increase our costs and reduce the value of our common stock.
To maintain our REIT status, we may be forced to forego otherwise attractive opportunities, which could delay or hinder our ability to meet our investment objectives and lower the return on an investment in us.
To qualify as a REIT, we must satisfy tests on an ongoing basis concerning, among other things, the sources of our income, nature of our assets, and the amounts we distribute to our stockholders. We may be required to make distributions to stockholders at times when it would be more advantageous to reinvest cash in our business or when we do not have funds readily available for distribution. Compliance with the REIT requirements may hinder our ability to operate solely on the basis of maximizing profits.
35
In certain circumstances, we may be liable for certain tax obligations of certain of the members of the Operating Company.
In certain circumstances, we may be liable for tax obligations of certain of the members of the Operating Company. In connection with certain UPREIT transactions, we have entered into tax protection agreements under which we have agreed to minimize the tax consequences to members of the Operating Company resulting from the sale or other disposition of our assets in taxable transactions, with specific exceptions and limitations. Pursuant to the tax protection agreements we have also agreed to ensure that such members of the Operating Company are allocated minimum amounts of the Operating Company’s indebtedness. If we fail to meet our obligations under the tax protection agreements, we may be required to reimburse those members of the Operating Company for the amount of the tax liabilities they incur, subject to certain limitations. We may enter into additional tax protection agreements in the future in connection with other UPREIT transactions. In order to limit our exposure to a tax obligation, our use of proceeds from any sales or dispositions of certain properties will be limited. In addition, the indemnification obligations may be significant.
New partnership audit rules could increase the tax liability borne by us in the event of a U.S. federal income tax audit of a subsidiary partnership.
New partnership audit rules apply to partnership taxable years beginning after December 31, 2017, and may alter who bears the liability in the event any subsidiary partnership is audited and an adjustment is assessed. Under the new rules, the partnership itself may be liable for a hypothetical increase in partner-level taxes (including interest and penalties) resulting from an adjustment of partnership tax items on audit, regardless of changes in the composition of the partners (or their relative ownership of the partnership) between the year under audit and the year of the adjustment. The new rules also include an elective alternative method under which the additional taxes resulting from the adjustment are assessed from the affected partners, subject to a higher rate of interest than otherwise would apply. Many questions remain as to how the new rules will apply, in particular with respect to partners that are REITs, and it is not clear at this time what effect these new rules will have on us. However, these rules could increase the U.S. federal income taxes, interest and penalties otherwise borne by us in the event of a U.S. federal income tax audit of a subsidiary partnership.
There are no unresolved staff comments.
Please refer to Item 1. “Business” of this Form 10-K for information concerning our properties.
We are subject to various legal proceedings and claims that arise in the ordinary course of our business. These matters are generally covered by insurance or are subject to our right to be indemnified by our tenants that we include in our leases. Management is not aware of any material pending legal proceedings to which we or any of our subsidiaries are a party or to which any of our property is subject, nor are we aware of any such legal proceedings contemplated by government agencies.
None
36
|
Item 5. |
Market for Registrant’s Common Equity, Related Stockholder Matters and Issuer Purchases of Equity Securities |
Market Information
There is no established public trading market for our shares of common stock and we do not expect a public trading market to develop. There are no issued or outstanding options or warrants to purchase our common stock. Each outstanding membership unit of the Operating Company is convertible into one share of our common stock, subject to certain conditions and limitations. As of March 1, 2018, there were 19,377,844 shares of our common stock issued and outstanding and 1,551,458 non-controlling membership units in the Operating Company issued and outstanding. We have not agreed to register for sale under the Securities Act any shares of our common stock. No shares of our common stock have been or are currently expected to be publicly offered by us.
Stockholders
As of March 1, 2018, there were 2,717 holders of shares of our common stock.
Determined Share Value
Our shares of common stock are sold by us in our ongoing private offering at a price equal to the Determined Share Value, which is established quarterly by the Independent Directors Committee based on the NAV of our portfolio, input from management and third-party consultants, and such other factors as the Independent Directors Committee may determine. The Independent Directors Committee bears sole responsibility for establishing the Determined Share Value. Our determination of NAV applies valuation definitions and methodologies prescribed by Accounting Standards Codification (ASC) 820, Fair Value Measurements and Disclosures, in order to fair value our net assets. Our net assets are primarily comprised of our investment in rental property and debt. Other assets and liabilities included in our net asset valuation include cash, interest rate swaps, and accounts payable, among others, and excludes intangible assets and liabilities. Members of our senior executive, portfolio management, accounting, and finance teams are responsible for performing the valuation process and computing the NAV. The Independent Directors Committee is responsible for overseeing the valuation process for the purpose of maintaining independence from conflicts of interest with the management group that determines NAV and who are employed by the Manager. To assist in assessing management’s calculation of the NAV and the valuation of the investment in rental property in the determination of the Determined Share Value by the Independent Directors Committee, we engage a third-party valuation specialist to provide: (i) a high-level/negative assurance review of management’s quarterly portfolio valuation and estimated NAV calculation, which currently occurs as of the end of each of the first, second, and fourth quarters of each calendar year, (ii) a review of individual property appraisals, which are completed for each property on a rolling two-year basis, and (iii) a full positive assurance valuation and review of the portfolio, which currently occurs during the third quarter of each calendar year. The third-party valuation specialist is not responsible for determining the NAV. The positive and negative assurance provided by the third-party valuation specialist has generally found that the NAVs used to establish the Determined Share Values by the Independent Directors Committee have been reasonable and within market parameters.
37
The Determined Share Value is reviewed and determined on a quarterly basis by the Independent Directors Committee. The Determined Share Value at any given point in time will be based on the NAV as of a historical balance sheet date. The following table presents our Determined Share Value for each of the past two years, together with the corresponding NAV as of the preceding quarter-end:
|
Period |
|
NAV as of |
|
Determined Share Value |
|
|
NAV per share |
|
||
|
February 1, 2018 – April 30, 2018 |
|
December 31, 2017 |
|
$ |
81.00 |
|
|
$ |
81.40 |
|
|
November 1, 2017 – January 31, 2018 |
|
September 30, 2017 |
|
$ |
81.00 |
|
|
$ |
80.55 |
|
|
August 1, 2017 – October 31, 2017 |
|
June 30, 2017 |
|
$ |
80.00 |
|
|
$ |
79.90 |
|
|
May 1, 2017 – July 31, 2017 |
|
March 31, 2017 |
|
$ |
80.00 |
|
|
$ |
79.90 |
|
|
February 1, 2017 – April 30, 2017 |
|
December 31, 2016 |
|
$ |
79.00 |
|
|
$ |
79.28 |
|
|
November 1, 2016 – January 31, 2017 |
|
September 30, 2016 |
|
$ |
77.00 |
|
|
$ |
77.40 |
|
|
August 1, 2016 – October 31, 2016 |
|
June 30, 2016 |
|
$ |
77.00 |
|
|
$ |
76.52 |
|
|
May 1, 2016 – July 31, 2016 |
|
March 31, 2016 |
|
$ |
74.00 |
|
|
$ |
73.30 |
|
|
February 1, 2016 – April 30, 2016 |
|
December 31, 2015 |
|
$ |
74.00 |
|
|
$ |
74.09 |
|
The Determined Share Value is applied to outstanding shares prospectively, and is used for purchases, distribution reinvestment, and redemptions. Adjustments to the NAV in arriving at the Determined Share Value are typically the result of the Independent Directors Committee’s understanding of current market conditions and review of assumptions used to value net assets by management in arriving at the NAV. The adjustments do not follow a systematic methodology, but instead allow the Independent Directors Committee to use judgment in determining whether temporary market fluctuations are indicative of changes in core real estate values.
The adjustments to NAV per share in arriving at the Determined Share Value for the periods presented above account for the inherent imprecision in the valuation estimates. In May of 2018, the Independent Directors Committee will review the NAV calculations as of March 31, 2018, and will assess whether adjustments to the current Determined Share Value of $81.00 are appropriate.
The fair value of our investment in rental property is performed using the market approach, whereby we assign an implied market capitalization rate to derive the property valuations. Individual property valuations are calculated by dividing the contractual rental payments over the next 12 months by the implied market capitalization rate. The market capitalization rate assumption reflects our analysis of what a market participant would be willing to pay for a property given the contractual monthly rental payments, third-party appraisals, and an analysis of a tenant’s creditworthiness, among other factors. We deem this methodology to be appropriate based on the triple-net nature of our leases, whereby the tenants are responsible for the maintenance, insurance, and property taxes associated with the properties they lease from us. The triple-net leases provide predictable cash flows, which we then apply against the market capitalization rates. This methodology is consistent with the valuation techniques used to determine the aggregate purchase price of acquisitions. As our acquisition targets are fully-occupied, single-tenant, net leased properties, we do not anticipate paying for material capital expenditures, and therefore, exclude such expenditures from our valuations.
The following table provides a breakdown of the major components of our estimated NAV and NAV per share amounts as of December 31, 2017, and 2016 (in thousands, except per share amounts):
|
NAV as of: |
|
December 31, 2017 |
|
|
December 31, 2016 |
|
||
|
Investment in rental property |
|
$ |
2,840,941 |
|
|
$ |
2,166,888 |
|
|
Debt |
|
|
(1,173,219 |
) |
|
|
(872,969 |
) |
|
Other assets and liabilities, net |
|
|
(2,256 |
) |
|
|
20,945 |
|
|
NAV |
|
$ |
1,665,466 |
|
|
$ |
1,314,864 |
|
|
Number of outstanding shares, including noncontrolling interests |
|
|
20,461 |
|
|
|
16,586 |
|
|
NAV per share |
|
$ |
81.40 |
|
|
$ |
79.28 |
|
38
The following table details the implied market capitalization rates (shown on a weighted average basis) used to value the investment in rental property, by property type, as of December 31, 2017 and 2016, supporting the Determined Share Value in effect for the periods of February 1, 2018 through April 30, 2018, and February 1, 2017 through April 30, 2017, respectively:
|
Market capitalization rates, as of: |
|
Retail |
|
|
Industrial |
|
|
Healthcare |
|
|
Office |
|
|
Other |
|
|
Portfolio Total |
|
||||||
|
December 31, 2017 |
|
|
6.38 |
% |
|
|
6.97 |
% |
|
|
6.94 |
% |
|
|
7.08 |
% |
|
|
7.26 |
% |
|
|
6.77 |
% |
|
December 31, 2016 |
|
|
6.23 |
% |
|
|
6.97 |
% |
|
|
6.83 |
% |
|
|
6.88 |
% |
|
|
7.48 |
% |
|
|
6.68 |
% |
While we believe our assumptions are reasonable, a change in these assumptions would impact the calculation of the value of our real estate investments. For example, assuming all other factors remain unchanged, an increase in the weighted average implied market capitalization rate used as of December 31, 2017, of 0.25% would result in a decrease in the fair value of our investment in rental property of 3.6%, and our NAV per share would have been $76.45. Conversely, a decrease in the weighted average implied capitalization rate used as of December 31, 2017, of 0.25% would result in an increase in the fair value of our investment in rental property of 3.8%, and our NAV per share would have been $86.73. Assuming all other factors remain unchanged, an increase in the weighted average implied market capitalization rate used as of December 31, 2016, of 0.25% would result in a decrease in the fair value of our investment in rental property of 3.8%, and our NAV per share would have been $74.55. Conversely, a decrease in the weighted average implied capitalization rate used as of December 31, 2016, of 0.25% would result in an increase in the fair value of our investment in rental property of 3.9%, and our NAV per share would have been $84.38.
Our methodology is based upon a number of estimates and assumptions that may not be accurate or complete. Different parties with different assumptions and estimates could derive a different Determined Share Value. Accordingly, we have disclosed the following risk factors relative to our Determined Share Value:
|
|
• |
There is no public trading market for our common stock and we are not required to effectuate a liquidity event by a certain date or at all, and transfers of shares of our common stock are subject to a number of restrictions. As a result, it will be difficult for our stockholders to sell shares of our common stock and, if they are able to sell their shares, they are likely to sell them at a discount and may not be able to realize the Determined Share Value upon such a sale. |
|
|
• |
Our stockholders are limited in their ability to sell shares of our common stock pursuant to our share redemption program. Our stockholders may not be able to sell any of their shares of our common stock back to us, and if they do sell their shares, they may not receive the price they paid. |
|
|
• |
The Independent Directors Committee establishes the Determined Share Value on a quarterly basis. The Determined Share Value is not directly derived from any independent valuation, nor from the value of the existing property portfolio. Investors should not assume that (i) an investor will ultimately realize distributions per share equal to the Determined Share Value upon liquidation of our assets or if our company were sold, (ii) shares of our common stock would trade at the Determined Share Value on a national securities exchange, or (iii) a third party would offer the Determined Share Value in an arms-length transaction to purchase all or substantially all of the shares of our common stock. |
Unregistered Sales of Equity Securities and Use of Proceeds
Sales of Common Stock and Issuance of Membership Units
We commenced our ongoing private offering of shares of our common stock in 2007. The first closing of our private offering occurred on December 31, 2007, and we have conducted additional closings at least once every calendar quarter since then. Currently, we close sales of additional shares of our common stock monthly. In November 2017, we instituted a monthly cap of $15.0 million on new and additional investments in our common stock. The cap does not apply to investments made pursuant to our distribution reinvestment plan, or to equity capital received in connection with UPREIT transactions. The cap was initially effective for the months of November 2017, December 2017, and January 2018. The same cap will be in place for the months of February 2018, March 2018, and April 2018. Shares of our common stock are currently being offered in our private offering at
39
$81.00 per share, provided that the per share offering price may be adjusted quarterly by our Independent Directors Committee based on the Determined Share Value, which is based on input from management and third-party consultants, and such other factors as our Independent Directors Committee may consider. We intend to use substantially all of the net proceeds from our private offering, supplemented with additional borrowings, to continue to invest in additional net leased properties. As of December 31, 2017, there were 18,909,257 shares of our common stock issued and outstanding, and 1,551,457 membership units in the Operating Company issued and outstanding. Each outstanding membership unit in the Operating Company is convertible on a one-for-one basis into shares of our common stock, subject to certain limitations.
The following table provides information regarding the sale of shares of our common stock pursuant to our ongoing private offering during the quarter ended December 31, 2017 (in thousands, except year and Determined Share Value amounts).
|
Month |
|
Year |
|
Common Shares Sold |
|
|
Determined Share Value – Common Shares(1) |
|
|
Total Proceeds – Common Shares Sold |
|
|
Common Shares DRIP |
|
|
Determined Share Value – DRIP(2) |
|
|
Total Proceeds – Common Share DRIP(3) |
|
|
Total Proceeds |
|
|||||||
|
October |
|
2017 |
|
|
186 |
|
|
$ |
80 |
|
|
$ |
14,826 |
|
|
|
46 |
|
|
|
78 |
|
|
$ |
3,618 |
|
|
$ |
18,444 |
|
|
November |
|
2017 |
|
|
185 |
|
|
|
81 |
|
|
|
15,000 |
|
|
|
47 |
|
|
|
78 |
|
|
|
3,717 |
|
|
|
18,717 |
|
|
December |
|
2017 |
|
|
158 |
|
|
|
81 |
|
|
|
12,715 |
|
|
|
48 |
|
|
|
79 |
|
|
|
3,787 |
|
|
|
16,502 |
|
|
TOTAL |
|
|
|
|
529 |
|
|
|
|
|
|
$ |
42,541 |
|
|
|
141 |
|
|
|
|
|
|
$ |
11,122 |
|
|
$ |
53,663 |
|
|
(1) |
Shares of our common stock are sold in our ongoing private offering at a price per share equal to the then-applicable Determined Share Value. |
|
(2) |
DRIP shares are purchased at a discounted price of 98% of the Determined Share Value. |
|
(3) |
For common shares reinvested under our DRIP there is no corresponding cash flow from the transaction. Refer to Note 14, “Equity” to the consolidated financial statements included in Item 8. “Financial Statements and Supplementary Data” of this Form 10-K for further discussion. |
None of the shares of our common stock set forth in the table above were registered under the Securities Act in reliance upon the exemption from registration under the Securities Act provided by Rule 506(c) under Regulation D promulgated under the Securities Act. All of the shares of our common stock set forth in the table above were sold to persons who represented to us in writing that they qualified as an “accredited investor” as such term is defined by Regulation D promulgated under the Securities Act, and provided us with additional documentation to assist us in verifying such person’s status as accredited investors.
In connection with property acquisitions that are structured as UPREIT transactions, the owner of a property will transfer its interest in the property to the Operating Company in exchange for membership units in the Operating Company. During October 2017, we issued 57,940 membership units in the Operating Company valued at $4.6 million in exchange for property valued at $10.0 million. In conjunction with this transaction, we assumed a mortgage with a principal balance of $5.2 million. There were no other membership unit issuances during the quarter ended December 31, 2017.
None of the membership units in the Operating Company were registered under the Securities Act in reliance upon the exemptions from registration under the Securities Act provided by Rule 506(c) under Regulation D promulgated under the Securities Act and Section 4(a)(2) of the Securities Act. All of the membership units in the Operating Company were sold to persons who represented to us in writing that they qualified as an “accredited investor,” as such term is defined by Regulation D promulgated under the Securities Act, and provided us with additional documentation to assist us in verifying such person’s status as accredited investors, including third-party verification as permitted under Regulation D.
40
In January 2017, we commenced a private offering of unsecured, fixed-rate, interest-only Senior Notes. The initial offering was for up to $100.0 million in Senior Notes, however, based on oversubscriptions and market demand, we elected to increase the offering and received commitments to purchase an aggregate principal amount of $150.0 million of the Senior Notes. In connection with the offering of the Senior Notes, on March 16, 2017, we and the Operating Company entered into a Note and Guaranty Agreement with each of the purchasers of the Senior Notes. The closing of the issuance of the Senior Notes occurred on April 18, 2017. The Senior Notes were issued by the Operating Company and were guaranteed by us and each of the Operating Company’s subsidiaries that guarantee our bank credit facility and term notes. The Senior Notes were issued at par, bear interest at a rate of 4.84% per annum (priced at 240 basis points above the 10-year U.S. Treasury yield at the time of pricing), and have a 10-year maturity, maturing on April 18, 2027.
The Senior Notes were not registered under the Securities Act in reliance upon the exemptions from registration provided by Section 4(a)(2) of the Securities Act. All of the Senior Notes were sold to persons who represented to us in writing that they qualified as an “accredited investor,” as such term is defined by Regulation D promulgated under the Securities Act.
Except as set forth above, we have not sold any securities which were not registered under the Securities Act during the previous three years.
Distribution and Distribution Reinvestment
Distributions are paid when and as declared by our board of directors. We commenced paying quarterly distributions in May 2008. We commenced paying monthly distributions in June 2014. Distribution payments are expected to be made approximately 15 days after the end of each month to stockholders of record on the record date, which is generally the next-to-the-last business day of the prior month. Subscribers making an investment at an end of month closing will begin to accrue dividends in the subsequent month and, if they are stockholders of record at the end of such month, they will receive initial distributions approximately 15 days after the subsequent month is complete.
We intend to make distributions sufficient to satisfy the requirements for qualification as a REIT for tax purposes. Generally, income distributed as dividends will not be taxable to us under the Internal Revenue Code if we distribute at least 90% of our REIT taxable income. Dividends will be declared at the discretion of our board of directors, but will be guided, in substantial part, by a desire to cause us to comply with the REIT qualification requirements.
At its February 9, 2018, meeting, our board of directors declared monthly distributions of $0.43 per share of our common stock and unit of membership interest in the Operating Company to be paid by us to our stockholders and members of the Operating Company (other than us) of record prior to the end of February, March, and April 2018:
|
Dividend Per Share/Unit |
|
|
Record Date |
|
Payment Date (on or before) |
|
|
$ |
0.43 |
|
|
February 27, 2018 |
|
March 15, 2018 |
|
$ |
0.43 |
|
|
March 28, 2018 |
|
April 13, 2018 |
|
$ |
0.43 |
|
|
April 27, 2018 |
|
May 15, 2018 |
Investors may purchase additional shares of our common stock by electing to reinvest their distributions through our distribution reinvestment plan. Pursuant to our distribution reinvestment plan, our stockholders and holders of membership units in the Operating Company (other than us), may elect to have cash distributions reinvested in additional shares of our common stock. Shares of our common stock acquired through our distribution reinvestment plan have the same rights and are subject to the same restrictions on transferability as all other shares of our common stock and are eligible for redemption pursuant to our share redemption program. Our distribution reinvestment plan is administered by the Asset Manager.
All of our stockholders and holders of membership units in the Operating Company that are accredited investors are eligible to participate in our distribution reinvestment plan. We may elect to deny an investor
41
participation in the distribution reinvestment plan if the investor resides in a jurisdiction or foreign country where, in our judgment, the burden or expense of compliance with applicable securities laws makes the investor’s participation impracticable or inadvisable. A stockholder or holder of membership units of the Operating Company may be required to cease participation in our distribution reinvestment plan if the investor no longer meets the suitability standards or cannot make the other investor representations set forth in the then-current subscription agreement with respect to our shares of common stock. Participants in the distribution reinvestment plan must agree to notify us promptly when they no longer meet these standards.
A stockholder or holder of membership units in the Operating Company may elect to participate in our distribution reinvestment plan by completing the appropriate portion of the subscription agreement or other approved enrollment form available from time to time from the Asset Manager. An investor’s participation in the distribution reinvestment plan will begin with the next distribution made after receipt of the investor’s enrollment form. Participants in our distribution reinvestment plan generally are required to have the full amount of their cash distributions with respect to all securities owned by them reinvested pursuant to our distribution reinvestment plan. However, the Asset Manager has the discretion, upon the request of a participant, to accommodate a participant’s request for less than all of the participant’s securities to be subject to participation in our distribution reinvestment plan. An investor may also change the number of shares participating in the dividend reinvestment at any time if the investor completes a new enrollment form or other form provided for that purpose.
Cash distributions will be reinvested in additional shares of common stock pursuant to our distribution reinvestment plan at a per share price equal to 98% of the Determined Share Value as of the applicable distribution date. Fractional shares may be issued pursuant to our distribution reinvestment plan.
If an investor elects to participate in our distribution reinvestment plan and is subject to federal income taxation, the investor will incur a tax liability on an amount equal to the fair value on the relevant distribution date of the shares of our common stock purchased with reinvested distributions, even though the investor has elected not to receive the distributions used to purchase those shares of common stock in cash. We will withhold estimated taxes on the amount of distributions or distributions paid if the investor fails to furnish a valid taxpayer identification number, fails to properly report distributions or fails to certify that the investor is not subject to withholding. Notwithstanding the foregoing, the tax consequences of participating in our distribution reinvestment plan will vary depending upon each participant’s particular circumstances, and all participants are urged to consult their own tax advisor regarding the specific tax consequences of participation.
Participation in our distribution reinvestment plan may be terminated by an investor at any time by providing us with written notice. For an investor’s termination to be effective for a particular distribution, we must have received a notice of termination at least 10 business days prior to the record date of the distribution period to which the distribution relates. Any transfer of an investor’s shares will effect a termination of the participation of those shares in the distribution reinvestment plan. We will terminate an investor’s participation to the extent that a reinvestment of an investor’s distributions in our shares would cause the investor to exceed the ownership limitations contained in our Articles of Incorporation.
We may amend our distribution reinvestment plan at any time upon written notice to each participant at least 10 days prior to the effective date of the amendment. We may terminate the distribution reinvestment plan upon written notice to each participant at least 30 days prior to the effective date of the termination.
42
The following table summarizes distributions paid in cash and pursuant to our DRIP for the years ended December 31, 2016, and 2017 (in thousands).
|
Month |
|
Year |
|
Cash Distribution - Common Stockholders |
|
|
Cash Distribution - Membership Units |
|
|
Distribution Paid Pursuant to DRIP on Common Stock (1) |
|
|
Distribution Paid Pursuant to DRIP on Membership Units (1) |
|
|
Total Amount of Distribution |
|
|||||
|
January |
|
2016 |
|
$ |
2,621 |
|
|
$ |
439 |
|
|
$ |
1,930 |
|
|
$ |
100 |
|
|
$ |
5,090 |
|
|
February |
|
2016 |
|
|
2,672 |
|
|
|
442 |
|
|
|
1,990 |
|
|
|
96 |
|
|
|
5,200 |
|
|
March |
|
2016 |
|
|
2,761 |
|
|
|
487 |
|
|
|
2,087 |
|
|
|
98 |
|
|
|
5,433 |
|
|
April |
|
2016 |
|
|
2,832 |
|
|
|
487 |
|
|
|
2,134 |
|
|
|
98 |
|
|
|
5,551 |
|
|
May |
|
2016 |
|
|
2,892 |
|
|
|
487 |
|
|
|
2,194 |
|
|
|
98 |
|
|
|
5,671 |
|
|
June |
|
2016 |
|
|
2,975 |
|
|
|
487 |
|
|
|
2,280 |
|
|
|
98 |
|
|
|
5,840 |
|
|
July |
|
2016 |
|
|
3,064 |
|
|
|
487 |
|
|
|
2,318 |
|
|
|
98 |
|
|
|
5,967 |
|
|
August |
|
2016 |
|
|
3,092 |
|
|
|
487 |
|
|
|
2,377 |
|
|
|
98 |
|
|
|
6,054 |
|
|
September |
|
2016 |
|
|
3,148 |
|
|
|
487 |
|
|
|
2,471 |
|
|
|
98 |
|
|
|
6,204 |
|
|
October |
|
2016 |
|
|
3,184 |
|
|
|
487 |
|
|
|
2,534 |
|
|
|
98 |
|
|
|
6,303 |
|
|
November |
|
2016 |
|
|
3,220 |
|
|
|
487 |
|
|
|
2,618 |
|
|
|
98 |
|
|
|
6,423 |
|
|
December |
|
2016 |
|
|
3,274 |
|
|
|
487 |
|
|
|
2,683 |
|
|
|
98 |
|
|
|
6,542 |
|
|
January |
|
2017 |
|
|
3,319 |
|
|
|
488 |
|
|
|
2,738 |
|
|
|
98 |
|
|
|
6,643 |
|
|
February |
|
2017 |
|
|
3,394 |
|
|
|
488 |
|
|
|
2,836 |
|
|
|
98 |
|
|
|
6,816 |
|
|
March |
|
2017 |
|
|
3,522 |
|
|
|
493 |
|
|
|
2,972 |
|
|
|
99 |
|
|
|
7,086 |
|
|
April |
|
2017 |
|
|
3,555 |
|
|
|
493 |
|
|
|
3,068 |
|
|
|
99 |
|
|
|
7,215 |
|
|
May |
|
2017 |
|
|
3,618 |
|
|
|
493 |
|
|
|
3,167 |
|
|
|
99 |
|
|
|
7,377 |
|
|
June |
|
2017 |
|
|
3,680 |
|
|
|
493 |
|
|
|
3,220 |
|
|
|
99 |
|
|
|
7,492 |
|
|
July |
|
2017 |
|
|
3,742 |
|
|
|
493 |
|
|
|
3,296 |
|
|
|
99 |
|
|
|
7,630 |
|
|
August |
|
2017 |
|
|
3,815 |
|
|
|
512 |
|
|
|
3,378 |
|
|
|
122 |
|
|
|
7,827 |
|
|
September |
|
2017 |
|
|
3,883 |
|
|
|
512 |
|
|
|
3,420 |
|
|
|
123 |
|
|
|
7,938 |
|
|
October |
|
2017 |
|
|
3,969 |
|
|
|
512 |
|
|
|
3,495 |
|
|
|
123 |
|
|
|
8,099 |
|
|
November |
|
2017 |
|
|
4,003 |
|
|
|
536 |
|
|
|
3,594 |
|
|
|
123 |
|
|
|
8,256 |
|
|
December |
|
2017 |
|
|
4,030 |
|
|
|
536 |
|
|
|
3,664 |
|
|
|
123 |
|
|
|
8,353 |
|
|
TOTAL |
|
|
|
$ |
80,265 |
|
|
$ |
11,800 |
|
|
$ |
66,464 |
|
|
$ |
2,481 |
|
|
$ |
161,010 |
|
|
(1) |
Distributions are paid in shares of common stock. |
The following table summarizes our distributions paid during the years ended December 31, 2017, and 2016, including the source of distributions and a comparison against FFO (in thousands).
|
|
|
For the years ended December 31, |
|
|||||
|
|
|
2017 |
|
|
2016 |
|
||
|
Distributions: |
|
|
|
|
|
|
|
|
|
Paid in cash |
|
$ |
51,884 |
|
|
$ |
42,662 |
|
|
Reinvested in shares |
|
|
38,848 |
|
|
|
27,616 |
|
|
Total Distributions |
|
$ |
90,732 |
|
|
$ |
70,278 |
|
|
Source of Distributions: |
|
|
|
|
|
|
|
|
|
Cash flow from operating activities |
|
$ |
90,732 |
|
|
$ |
67,189 |
|
|
Cash flow from investing activities |
|
|
— |
|
|
|
3,089 |
|
|
Cash flow from financing activities |
|
|
— |
|
|
|
— |
|
|
Total Sources of Distributions |
|
$ |
90,732 |
|
|
$ |
70,278 |
|
|
FFO |
|
$ |
111,430 |
|
|
$ |
80,664 |
|
43
For the year ended December 31, 2017, we paid distributions from our cash flow from operating activities. For the year ended December 31, 2016, we paid approximately $3.1 million in distributions funded through proceeds from the disposition of rental property, included in cash flow from investing activities in the Consolidated Statements of Cash Flows, with the remainder paid from cash flow from operating activities. Refer to Item 7. “Management’s Discussion and Analysis of Financial Condition and Results of Operations” of this Form 10-K under the caption Net Income and Non-GAAP Measures (FFO and AFFO) for further discussion of our FFO.
We intend to fund future distributions from cash generated by operations; however, we may fund distributions from the sale of assets, borrowings, or proceeds from the sale of our securities.
Repurchases of Equity Securities
We have adopted a share redemption program to provide an opportunity for our stockholders to have shares of our common stock repurchased, subject to certain restrictions and limitations, at a price equal to or at a discount from the current Determined Share Value in effect as of the date the shares are tendered for redemption. Cash used to fund share redemptions has historically been provided through a combination of cash generated by operations, the sale of assets, and borrowings. Additionally, we may use proceeds from the sale of our securities to fund redemption requests, although to date we have not done so. During the three months ended December 31, 2017, we fulfilled repurchase requests and repurchased shares of our common stock pursuant to our share redemption program as follows. We did not defer or reject any redemption requests during this period.
|
Period |
|
Total Number of Shares Requested to be Redeemed (1) |
|
|
Total Number of Shares Redeemed |
|
|
Average Price Paid Per Share (2) |
|
|
Approximate Dollar Value of Shares Available That May Yet Be Redeemed Under the Program |
|
||||
|
October 2017 |
|
|
— |
|
|
|
— |
|
|
$ |
— |
|
|
|
(3 |
) |
|
November 2017 |
|
|
— |
|
|
|
— |
|
|
$ |
— |
|
|
|
(3 |
) |
|
December 2017 |
|
|
57,060 |
|
|
|
57,060 |
|
|
$ |
80.86 |
|
|
|
(3 |
) |
|
(1) |
Repurchases of shares of our common stock pursuant to the share redemption program will be made quarterly, at the end of the quarter, upon written request to us delivered at least 10 calendar days prior to the last business day of the applicable calendar quarter, and the redemption price paid for redeemed shares will be paid in cash within three business days of the last business day of the applicable calendar quarter. |
|
(2) |
Shares held for more than 12 months, but less than five years, will be redeemed at a purchase price equal to 95% of the Determined Share Value in effect as of the last business day of the quarter in which the shares are timely tendered for redemption and shares held for five years or more will be redeemed at a purchase price equal to 100% of the Determined Share Value in effect as of the last business day of the quarter in which the shares are timely tendered for redemption, subject to certain exceptions as set forth in the share redemption program. |
|
(3) |
The total number of shares redeemed pursuant to the share redemption program in any quarter may not exceed (i) 1% of the total number of shares outstanding at the beginning of the applicable calendar year, plus (ii) 50% of the total number of any additional shares of our common stock issued during the prior calendar quarter pursuant to our DRIP; provided, however, that the total number of shares redeemed during any calendar year may not exceed 5% of the number of shares outstanding as of the first day of such calendar year. |
44
The following graph is a comparison of the cumulative total return of shares of our common stock, the Russell 2000, and the MCSI US REIT Index. The graph assumes that $100 was invested on December 31, 2012, in each of shares of our common stock, the Russell 2000 and the MCSI US REIT Index, and that all dividends were reinvested. There can be no assurance that the performance of our shares will continue in line with the same or similar trends depicted in the graph below. The MCSI US REIT Index is a free float-adjusted market capitalization index that is comprised of equity REITs. The index is based on MSCI USA Investable Market Index (IMI), its parent index, which captures large, mid, and small capitalization securities. While funds used in this benchmark typically target institutional investors and have characteristics that differ from us (including differing fees), we feel that the MCSI US REIT Index is an appropriate and accepted index for the purpose of evaluating returns on investments in direct real estate funds.

|
|
|
December 31, |
|
|||||||||||||||||||||
|
|
|
|
2012 |
|
|
|
2013 |
|
|
|
2014 |
|
|
|
2015 |
|
|
|
2016 |
|
|
|
2017 |
|
|
Broadstone Net Lease |
|
|
100.00 |
|
|
|
117.89 |
|
|
|
139.56 |
|
|
|
155.66 |
|
|
|
173.13 |
|
|
|
194.11 |
|
|
Russell 2000 |
|
|
100.00 |
|
|
|
138.82 |
|
|
|
145.62 |
|
|
|
139.19 |
|
|
|
168.85 |
|
|
|
193.58 |
|
|
MSCI US REIT Index |
|
|
100.00 |
|
|
|
102.47 |
|
|
|
133.60 |
|
|
|
136.97 |
|
|
|
148.75 |
|
|
|
156.29 |
|
The information in this “Performance Graph” section is not "soliciting material," is not deemed "filed" with the SEC, and is not to be incorporated by reference into any of our filings under the Securities Act or the Exchange Act, whether made before or after the date hereof and irrespective of any general incorporation language contained in such filing, except as shall be expressly set forth by specific reference in such filing.
45
The selected financial data as of and for the years ended December 31, 2017, 2016, 2015, 2014, and 2013 presented below should be read in conjunction with our consolidated financial statements and the related notes thereto contained in Item 8. “Financial Statements and Supplementary Data” and in Item 7. “Management’s Discussion and Analysis of Financial Condition and Results of Operations” in this Form 10-K. The selected financial data presented below has been derived from our audited consolidated financial statements.
Our results of operations for the periods presented below are not indicative of those expected in future periods.
|
|
|
As of December 31, |
|
|||||||||||||||||
|
(In thousands) |
|
2017 |
|
|
2016 |
|
|
2015 |
|
|
2014 |
|
|
2013 |
|
|||||
|
Balance Sheet Data |
|
|
|
|
|
|
|
|
|
|
|
|
|
|
|
|
|
|
|
|
|
Investment in rental property, net |
|
$ |
2,227,758 |
|
|
$ |
1,684,971 |
|
|
$ |
1,283,155 |
|
|
$ |
826,003 |
|
|
$ |
643,405 |
|
|
Total assets |
|
|
2,578,756 |
|
|
|
1,952,054 |
|
|
|
1,463,907 |
|
|
|
899,132 |
|
|
|
700,458 |
|
|
Mortgage and notes payable, net |
|
|
67,832 |
|
|
|
106,686 |
|
|
|
99,462 |
|
|
|
106,416 |
|
|
|
102,162 |
|
|
Unsecured term notes, net and revolver |
|
|
1,109,912 |
|
|
|
759,891 |
|
|
|
562,103 |
|
|
|
360,848 |
|
|
|
261,607 |
|
|
Total liabilities |
|
|
1,294,555 |
|
|
|
953,517 |
|
|
|
715,962 |
|
|
|
504,951 |
|
|
|
382,351 |
|
|
Total Broadstone Net Lease, Inc. stockholders’ equity |
|
|
1,186,825 |
|
|
|
911,788 |
|
|
|
670,163 |
|
|
|
366,059 |
|
|
|
289,706 |
|
|
Total equity |
|
$ |
1,284,201 |
|
|
$ |
998,537 |
|
|
$ |
747,945 |
|
|
$ |
394,181 |
|
|
$ |
318,107 |
|
|
|
|
For the Years Ended December 31, |
|
|||||||||||||||||
|
(In thousands, except per share amounts) |
|
2017 |
|
|
2016 |
|
|
2015 |
|
|
2014 |
|
|
2013 |
|
|||||
|
Operating Data |
|
|
|
|
|
|
|
|
|
|
|
|
|
|
|
|
|
|
|
|
|
Total revenues |
|
$ |
181,563 |
|
|
$ |
142,869 |
|
|
$ |
98,086 |
|
|
$ |
68,152 |
|
|
$ |
52,277 |
|
|
Total operating expenses |
|
|
(96,681 |
) |
|
|
(79,231 |
) |
|
|
(55,703 |
) |
|
|
(36,148 |
) |
|
|
(26,713 |
) |
|
Interest expense |
|
|
(34,751 |
) |
|
|
(29,963 |
) |
|
|
(22,605 |
) |
|
|
(18,058 |
) |
|
|
(13,665 |
) |
|
Net income |
|
$ |
59,555 |
|
|
$ |
40,268 |
|
|
$ |
20,890 |
|
|
$ |
17,163 |
|
|
$ |
17,617 |
|
|
Net Earnings per common share, basic and diluted |
|
$ |
3.21 |
|
|
$ |
2.76 |
|
|
$ |
2.15 |
|
|
$ |
2.59 |
|
|
$ |
3.37 |
|
|
Other Data |
|
|
|
|
|
|
|
|
|
|
|
|
|
|
|
|
|
|
|
|
|
Net cash provided by operating activities |
|
$ |
97,940 |
|
|
$ |
67,189 |
|
|
$ |
38,616 |
|
|
$ |
32,773 |
|
|
$ |
25,453 |
|
|
Net cash used in investing activities |
|
|
(611,111 |
) |
|
|
(471,954 |
) |
|
|
(480,469 |
) |
|
|
(198,575 |
) |
|
|
(151,292 |
) |
|
Net cash provided by financing activities |
|
|
500,891 |
|
|
|
399,350 |
|
|
|
464,775 |
|
|
|
156,899 |
|
|
|
125,891 |
|
|
Distributions declared |
|
|
92,768 |
|
|
|
76,955 |
|
|
|
45,271 |
|
|
|
34,574 |
|
|
|
20,343 |
|
|
Distributions declared per common share |
|
|
4.975 |
|
|
|
4.915 |
|
|
|
4.86 |
|
|
|
4.63 |
|
|
|
4.27 |
|
|
FFO(1) |
|
|
111,434 |
|
|
|
80,664 |
|
|
|
50,990 |
|
|
|
34,633 |
|
|
|
27,205 |
|
|
FFO per share, basic and diluted |
|
|
6.00 |
|
|
|
5.53 |
|
|
|
5.24 |
|
|
|
5.22 |
|
|
|
5.20 |
|
|
AFFO(1) |
|
|
99,952 |
|
|
|
78,780 |
|
|
|
52,273 |
|
|
|
33,956 |
|
|
|
26,592 |
|
|
AFFO per share, basic and diluted |
|
$ |
5.38 |
|
|
$ |
5.40 |
|
|
$ |
5.37 |
|
|
$ |
5.12 |
|
|
$ |
5.09 |
|
|
(1) |
Refer to Item 7. “Management’s Discussion and Analysis of Financial Condition and Results of Operations” under the caption Net Income and Non-GAAP Measures (FFO and AFFO) for further discussion of FFO and AFFO, including a reconciliation of net income to FFO and AFFO. |
46
The following Management’s Discussion and Analysis of Financial Condition and Results of Operations (“MD&A”) is intended to help the reader understand our results of operations and financial condition. This MD&A is provided as a supplement to, and should be read in conjunction with, our consolidated financial statements and the accompanying notes to the consolidated financial statements appearing in Item 8. “Financial Statements and Supplementary Data” in this Form 10-K.
Overview
We are a Maryland corporation formed on October 18, 2007, that elected to be taxed as a REIT commencing with the taxable year ended December 31, 2008. We focus on investing in income-producing, net leased commercial properties. We lease properties to retail, healthcare, industrial, office, and other commercial businesses under long-term lease agreements. Properties are generally leased on a triple-net basis such that tenants pay all operating expenses relating to the property during the lease term, including, but not limited to, property taxes, insurance, maintenance, repairs, and capital costs.
We seek to make investments in additional properties and manage our portfolio to preserve, protect, and return capital to investors; realize increased cash available for distributions and long-term capital appreciation from growth in the rental income and value of our properties; and maximize the level of sustainable cash distributions to our investors.
We conduct substantially all of our activities through, and all of our properties are held directly or indirectly by, the Operating Company. We are the sole managing member of the Operating Company and as of December 31, 2017, 2016, and 2015, we owned approximately 92.4%, 91.4%, and 89.6%, respectively, of its issued and outstanding membership units, with the remainder held by persons who were issued membership units in exchange for their interests in properties acquired by the Operating Company.
As of December 31, 2017, we owned a diversified portfolio of 528 individual net leased commercial properties located in 40 states comprising approximately 15.9 million rentable square feet of operational space. As of December 31, 2017, our properties were 100% leased to 134 different commercial tenants, with no single tenant accounting for more than 4% of our annual rental stream. We collected more than 99% of rents due during 2017. The weighted average remaining term of our leases, calculated based on our contractual NTM Rent as of December 31, 2017, was approximately 13.1 years, excluding renewal options, which are exercisable at the option of our tenants upon expiration of their base lease term.
Liquidity and Capital Resources
We acquire real estate with a combination of debt and equity capital and with cash from operations that is not otherwise distributed to our stockholders. Our focus is on maximizing the risk-adjusted return to our stockholders through an appropriate balance of debt and equity in our capital structure. Therefore, we attempt to maintain a conservative debt level on our balance sheet with appropriate interest and fixed charge coverage ratios. We target a leverage ratio with total debt equal to 35% to 45% of the approximate market value of our assets. We believe our current leverage model has allowed us to take advantage of the lower cost of debt while simultaneously strengthening our balance sheet, as evidenced by the investment grade credit rating the Operating Company received in March of 2016 and re-affirmed in March of 2017. The actual leverage ratio will vary over time but may not exceed 50% without the approval of the Independent Directors Committee. As of December 31, 2017 and 2016, the leverage ratio was approximately 41.6% and 40.5%, respectively, of the approximate market value of our assets. From a management perspective and in communications with the credit rating agencies, we also consider our leverage position as a multiple of Earnings Before Interest Taxes Depreciation and Amortization (“EBITDA”), a non-GAAP financial measure. EBITDA is a tool we use to measure leverage in the context of our cash flow expectations and projections. However, given the significance of our growth over the past two years, adding $683.6 million in investments during the year ended December 31, 2017, $518.8 million in investments during 2016, and $550.1 million in investments during 2015, coupled with our continued strategic growth initiatives, historical EBITDA may not provide investors with an adequate picture of the contractual cash in-flows associated with these investments. Our investments are typically made throughout the year (with a significant portion occurring in the second half of both 2017 and 2016), and therefore the full year, or “normalized,” cash flows will not be realized until subsequent years. Accordingly, we look at contractual, “normalized,” cash flows and EBITDA as an appropriate tool to manage our leverage profile. We utilize this analysis inclusive of our focus on debt-to-market value metrics.
47
Our equity capital for our real estate acquisition activity is provided from the proceeds of our ongoing private offering, including distributions reinvested through our DRIP. During the years ended December 31, 2017 and 2016, we raised $316.2 million and $290.9 million, respectively, in equity capital to be used in our acquisition activities, including distributions reinvested through our DRIP and properties exchanged for membership units in the Operating Company through Umbrella Partnership REIT (“UPREIT”) transactions. We seek to maintain an appropriate balance of debt and equity capital in our overall leverage policy, while maintaining a focus on increasing core value for existing stockholders (achieved via earnings growth and share appreciation). Our debt capital is provided through unsecured term notes, revolving debt facilities, and senior unsecured notes. We also, from time to time, obtain non-recourse mortgage financing from banks and insurance companies secured by mortgages on the corresponding specific property. Mortgages, however, are not a strategic focus of the active management of our leverage profile. Rather, we enter into mortgages and notes payable as ancillary business transactions on an as-needed basis, most often as the result of lease assumption transactions.
To reduce our exposure to variable-rate debt, the Operating Company enters into interest rate swap agreements to fix the rate of interest as a hedge against interest rate fluctuations. These interest rate hedges have staggered maturities up to 10 years in duration in order to reduce the exposure to interest rate fluctuations in any one year. The interest rate swaps are applied against a pool of debt, which offers flexibility in maintaining our hedge designation concurrent with our ongoing capital markets activity. We attempt to limit our total floating-rate debt exposure to no more than 5% of the approximate market value of assets, measured at quarter end. To reduce counterparty concentration risk with respect to the interest rate hedges, we diversify the institutions that serve as swap counterparties. No more than 30% of the nominal value of our total hedged debt may be with any one institution, to be measured at the time we enter into an interest rate swap transaction and at quarter end. We may deviate from these policies from time to time subject to the approval of the Independent Directors Committee. The interest rate swaps are considered cash flow hedges. Under these agreements, we receive monthly payments from the counterparties equal to the variable interest rates multiplied by the outstanding notional amounts. In turn, we pay the counterparties each month an amount equal to a fixed rate multiplied by the outstanding notional amounts. The intended net impact of these transactions is that we pay a fixed interest rate on our variable-rate borrowings.
We also mitigate interest rate risk by strategically adding long-term, fixed-rate debt to our capital structure. During the year ended December 31, 2017, we added $150.0 million of unsecured, fixed-rate, interest-only senior promissory notes (the “Senior Notes”) to our capital structure. The Senior Notes bear interest at a fixed rate of 4.84% per annum, with a 10-year maturity.
The availability of debt to finance commercial real estate can be impacted by economic and other factors that are beyond our control. We seek to reduce the risk that long-term debt capital may be unavailable to us by strengthening our balance sheet through our investments in real estate with credit-worthy tenants and lease guarantors, and maintaining an appropriate mix of debt and equity capitalization. Specifically, we recognized a 100% rent collection rate during the year ended December 31, 2016, and a greater than 99% rent collection rate during the year ended December 31, 2017. Additionally, Moody’s issued an investment grade credit rating of Baa3 to the Operating Company in March 2016, further evidencing our active management of a conservative capital structure. Moody’s re-affirmed the investment grade credit rating in March 2017. We have arranged our debt facilities to have multiple year terms in order to reduce the risk that short-term real estate financing would not be available to us in any given year. As we grow our real estate portfolio, we also intend to manage our debt maturities to reduce the risk that a significant amount of our debt will mature in any single year in the future. Refer to Contractual Obligations below for further details of the maturities on our contractual obligations, including long-term debt.
As of December 31, 2017, the historical cost basis of our real estate investment portfolio totaled $2.2 billion, consisting of investments in 528 properties with rent and interest due from our tenants aggregating $14.6 million per month on a straight-line basis and $13.1 million per month in cash inflows. During the year ended December 31, 2017, we closed 29 real estate acquisitions totaling $683.6 million, adding 124 new properties to our portfolio. The new properties will provide approximately $4.7 million in monthly rent on a straight-line basis. Substantially all of our cash from operations is generated by our real estate portfolio. As of December 31, 2016, the historical cost basis of our real estate investment portfolio totaled $1.7 billion, consisting of investments in 417 properties. During the year ended December 31, 2016, we closed 22 real estate acquisitions totaling $518.8 million, adding 88 new properties and a capital expansion on an existing property to our portfolio. The 2016 new properties provide approximately $3.4 million in monthly rent on a straight-line basis.
48
Our primary cash expenditures are the monthly interest payments we make on the debt we use to finance our real estate investment portfolio, asset management and property management fees of servicing the portfolio, acquisition expenses related to the growth of our portfolio, and the general and administrative expenses of operating our business. Since substantially all of our leases are triple-net, our tenants are generally responsible for the maintenance, insurance, and property taxes associated with the properties they lease from us. In certain circumstances, the terms of the lease require us to pay these expenses, however, in most cases we are reimbursed by the tenants. Accordingly, we do not currently anticipate making significant capital expenditures or incurring other significant property costs during the term of a property lease, unless we incur substantial vacancies. To the extent that we have vacant properties, we will incur certain costs to operate and maintain the properties, however, we do not currently expect these costs to be material. For the year ended December 31, 2017, we maintained a 100% leased portfolio, with the leases for only three of our properties, representing less than 1% of our annual rental streams (calculated based on NTM Rent), expiring before 2020.
We intend to continue to grow through additional real estate investments. To accomplish this objective, we must continue to identify real estate acquisitions that are consistent with our underwriting guidelines and raise additional future debt and equity capital. We have financed our acquisition of properties using equity investments as well as a combination of unsecured term, revolving debt, senior unsecured notes, and mortgage loans. The mix of financing sources may change over time based on market conditions and our liquidity needs. As of December 31, 2017, we have three outstanding unsecured term loans with an aggregate outstanding principal balance of $690.0 million, $150.0 million of Senior Notes, and a $425.0 million line of credit with $273.0 million of outstanding borrowings. As of December 31, 2016, we had three outstanding unsecured term loans with an aggregate outstanding principal balance of $660.0 million, and a $300.0 million line of credit with an outstanding balance of $102 million.
On April 18, 2017, the Operating Company closed the issuance of the Senior Notes with an aggregate principal amount of $150.0 million. Upon issuance, the Senior Notes were guaranteed by us and each of the Operating Company’s subsidiaries that guarantee our other unsecured credit facilities. The Senior Notes were issued at par, bear interest at a rate of 4.84% per annum (priced at 240 basis points above the 10-year U.S. Treasury yield at the time of pricing), and mature on April 18, 2027. We used the proceeds from the sale of the Senior Notes to pay down $115.0 million of the outstanding balance on our existing line of credit (the “Revolver”) at the time of closing and to fund other general corporate purposes, including acquisitions. The financial covenants associated with the Senior Notes are materially consistent with the covenant tables set forth below.
On June 23, 2017, together with the Operating Company, we closed on an $800.0 million unsecured credit facility (the “Credit Facility”). The Credit Facility contains an accordion feature that can increase the facility size up to a total of $1.0 billion of available capacity, and during the fourth quarter of 2017 was expanded to $880.0 million through the addition of two lenders. As of December 31, 2017, the facility was comprised of (i) a $425.0 million senior unsecured revolving credit facility (the “New Revolver”), (ii) a five-and-a-half-year, $265.0 million senior unsecured delayed draw term loan (the “5.5-Year Term Loan”), and (iii) a seven-year, $190.0 million senior unsecured delayed draw term loan (the “7-Year Term Loan”). The following table summarizes the amounts drawn and available to be drawn on the Credit Facility as of December 31, 2017 (in thousands).
|
Loan Tranche |
|
Amount Drawn |
|
|
Amount Available |
|
|
Total Capacity |
|
|
Maturity Date |
|||
|
|
$ |
273,000 |
|
|
$ |
152,000 |
|
|
$ |
425,000 |
|
|
January 21, 2022 |
|
|
5.5-Year Term Loan |
|
|
265,000 |
|
|
|
— |
|
|
|
265,000 |
|
|
January 23, 2023 |
|
7-Year Term Loan |
|
|
100,000 |
|
|
|
90,000 |
|
|
|
190,000 |
|
|
June 21, 2024 |
49
At closing, we borrowed $250.0 million under the 5.5-Year Term Loan and drew down $90.0 million on the New Revolver. We used the proceeds from these borrowings to pay off our $100.0 million term note (“Term Note 1”), our $185.0 million term note (“Term Note 2”), the outstanding balance of $5.0 million on our Revolver, and to pay down $50.0 million of the outstanding borrowings on our $375.0 term note (“2015 Unsecured Term Loan Agreement”). The $50.0 million payment on the $375.0 million term note was made via a one-time, non-pro rata payment provision included in our amended and restated 2015 Unsecured Term Loan Agreement, which was amended and restated simultaneously with the closing of the Credit Facility to align its terms with the Credit Facility. We did not draw down funds from the 7-Year Term Loan at closing. Prior to extension options, Term Note 1 and the Revolver were set to mature on June 27, 2017, and Term Note 2 was set to mature on October 11, 2018. Included in the terms of the Credit Facility and through our amendment and restatement of the 2015 Unsecured Term Loan Agreement, we removed the subsidiary guarantees supporting our term notes and Senior Notes.
The New Revolver matures on January 21, 2022, with one extension option for an additional five-month period through June 21, 2022, subject to certain conditions set forth in the Credit Facility, including payment of an extension fee equal to 0.0625% of the revolving commitments. The rate of interest payable on the New Revolver, at our option, is equal to LIBOR plus a margin. The margin for New Revolver borrowings is adjustable based upon the Operating Company’s credit rating and is between 0.825% and 1.55% per annum. Based on the Operating Company’s current investment grade credit rating of Baa3, the applicable margin for the New Revolver equals 1.2% per annum. Borrowings under the New Revolver are payable interest only during the term, with the principal amount due in full at maturity. Should the Operating Company lose its investment grade credit rating, the margin would be 1.55% until such time as the Operating Company regains its investment grade credit rating. The current margin on the New Revolver of 1.2% represents a 25-basis point reduction from the margin of 1.45% on the previous Revolver, prior to consideration of the applicable facility fee discussed below. The following table presents the margins on the New Revolver based on credit ratings from S&P or Moody’s.
|
Level |
|
Credit Rating (S&P/Moody’s) |
|
Applicable Margin for LIBOR Loans |
|
|
I |
|
A-/A3 or better |
|
0.83% |
|
|
II |
|
BBB+/Baa1 |
|
0.88% |
|
|
III |
|
BBB/Baa2 |
|
1.00% |
|
|
IV |
|
BBB-/Baa3 |
|
1.20% |
|
|
V |
|
Lower than BBB-/Baa3 |
|
1.55% |
|
An applicable facility fee is payable on the amount of the revolving commitments, as defined in the Credit Facility, based on the Operating Company’s credit rating. The initial applicable facility fee equals 0.25% per annum. The previous Revolver contained an unused commitment fee. The following table presents the applicable facility fee on the New Revolver based on credit ratings from S&P or Moody’s.
|
Level |
|
Credit Rating (S&P/Moody’s) |
|
Applicable Facility Fee |
|
|
I |
|
A-/A3 or better |
|
0.13% |
|
|
II |
|
BBB+/Baa1 |
|
0.15% |
|
|
III |
|
BBB/Baa2 |
|
0.20% |
|
|
IV |
|
BBB-/Baa3 |
|
0.25% |
|
|
V |
|
Lower than BBB-/Baa3 |
|
0.30% |
|
50
The 5.5-Year Term Loan matures on January 23, 2023, and was fully drawn as of December 31, 2017. Borrowings under the 5.5-Year Term Loan bear interest at variable rates based on LIBOR plus a margin ranging from 0.90% to 1.75% based on the Operating Company’s credit rating. Based on the Operating Company’s current investment grade credit rating of Baa3, the applicable margin under the 5.5-Year Term Loan equals 1.35% per annum. As compared to the applicable margin for Term Note 1 and Term Note 2 of 1.45% and 1.75%, respectively, the applicable margin of 1.35% on the 5.5-Year Term Loan represents a 10-basis point and 40 basis point reduction, respectively. Borrowings under the 5.5-Year Term Loan are payable interest only during the term, with the principal amount due in full at maturity. The following table presents the margins on the 5.5-Year Term Loan.
|
Level |
|
Credit Rating (S&P/Moody’s) |
|
Applicable Margin for LIBOR Loans |
|
|
I |
|
A-/A3 or better |
|
0.90% |
|
|
II |
|
BBB+/Baa1 |
|
0.95% |
|
|
III |
|
BBB/Baa2 |
|
1.10% |
|
|
IV |
|
BBB-/Baa3 |
|
1.35% |
|
|
V |
|
Lower than BBB-/Baa3 |
|
1.75% |
|
The 7-Year Term Loan matures on June 21, 2024. We are permitted to request up to three borrowings under the delayed draw feature of the 7-Year Term Loan, which may be drawn from June 23, 2017, to but excluding June 22, 2018. As of December 31, 2017, we have made one draw of $100.0 million upon the 7-Year Term Loan. The rate of interest payable on the 7-Year Term Loan is equal to LIBOR plus a margin. The margin for 7-Year Term Loan borrowings is adjustable based upon the Operating Company’s credit rating and is between 1.5% and 2.45% per annum. Based on the Operating Company’s current investment grade credit rating of Baa3, the initial margin under the 7-Year Term Loan equals 1.9% per annum. A ticking fee is payable on the amount of the commitments for the 7-Year Term Loan, as reduced by the amount of any term loans outstanding under the 7-Year Term Loan, equal to 0.25% per annum. Borrowings under the 7-Year Term Loan are payable interest only during the term, with the principal amount due in full at maturity. The following table presents the margins on the 7-Year Term Loan based on credit ratings from S&P or Moody’s.
|
Level |
|
Credit Rating (S&P/Moody’s) |
|
Applicable Margin for LIBOR Loans |
|
|
I |
|
A-/A3 or better |
|
1.50% |
|
|
II |
|
BBB+/Baa1 |
|
1.55% |
|
|
III |
|
BBB/Baa2 |
|
1.65% |
|
|
IV |
|
BBB-/Baa3 |
|
1.90% |
|
|
V |
|
Lower than BBB-/Baa3 |
|
2.45% |
|
51
The 2015 Unsecured Term Loan Agreement matures on February 6, 2019, was fully drawn as of December 31, 2017, and provides for two one-year extension options, at our option, subject to compliance with all covenants and the payment of a 0.10% fee. The 2015 Unsecured Term Loan Agreement contains an accordion feature that can increase the note size up to a total of $600 million. Borrowings under the 2015 Unsecured Term Loan Agreement originally bore interest at variable rates based on the one-month LIBOR plus a margin. Moody’s assignment of an investment grade credit rating to the Operating Company led to a margin of 1.40% on the 2015 Unsecured Term Loan Agreement, effective April 1, 2016. Should the Operating Company lose its investment grade credit rating, the margin would be 1.75% until such time as the Operating Company regains its investment grade credit rating. The following table presents the margins on the 2015 Unsecured Term Loan Agreement based on credit ratings from S&P or Moody’s.
|
Level |
|
Credit Rating (S&P/Moody’s) |
|
Applicable Margin for LIBOR Loans |
|
|
I |
|
A-/A3 or better |
|
0.90% |
|
|
II |
|
BBB+/Baa1 |
|
0.95% |
|
|
III |
|
BBB/Baa2 |
|
1.10% |
|
|
IV |
|
BBB-/Baa3 |
|
1.40% |
|
|
V |
|
Lower than BBB-/Baa3 |
|
1.75% |
|
The Operating Company achieved its investment grade credit rating based on our conservative leverage profile, diversified portfolio, and earnings stability based on the credit-worthiness of our tenants, which we intend to maintain concurrent with our growth objectives. Factors that could negatively impact our credit rating include, but are not limited to: a significant increase in our leverage on a sustained basis; a significant increase in secured debt levels; a significant decline in our unencumbered asset base; weakening of our corporate governance structure; and a significant decline in our portfolio diversification. We have aligned our strategic growth priorities with these factors, as we believe the favorable debt pricing and access to additional sources of debt capital resulting from the investment grade credit rating provides us with an advantageous cost of capital and risk-adjusted return on investment for our stockholders.
We intend to draw down on the 7-Year Term Loan as we acquire additional real estate as part of our strategic growth initiatives. Additionally, we intend to exercise the extension provisions of the New Revolver and the 2015 Unsecured Term Loan Agreement, refinance, or replace the existing borrowings as they become due. The extensions would delay the New Revolver’s maturities until June 2022, and the 2015 Unsecured Term Loan Agreement’s maturity until February 2021. We do not intend to make principal payments on these obligations in the foreseeable future, and plan to replace our existing credit facilities with new debt prior to maturity. Additionally, we may be required to increase our borrowing capacity to partially fund future acquisitions. We assess market conditions and the availability and pricing of debt on an ongoing basis, which are critical inputs in our strategic planning and decision-making process. While we believe the current market conditions provide our stockholders with an advantageous capitalization structure and risk-adjusted return, we believe our conservative capital structure is appropriate to absorb temporary market fluctuations. Significant adverse market conditions could impact the availability of debt to fund future acquisitions, our ability to recognize growth in earnings and return on investment for stockholders, and our ability to recast the debt facilities at cost-advantageous pricing points. In the event of such conditions, we would plan to revise our capitalization structure and strategic initiatives to maximize return on investment for stockholders. To the extent that we are unable to recast our debt facilities, our cash flows from operations will not be adequate to pay the principal amount of debt, and we may be forced to liquidate properties to satisfy our obligations.
52
We are subject to various covenants and financial reporting requirements pursuant to the loan agreements we have entered into. The table below summarizes the applicable financial covenants, which are substantially the same across each of our loan agreements. As of December 31, 2017, we were in compliance with all of our covenants. In the event of default, either through default on payments or breach of covenants, we may be restricted from paying dividends on our common stock above the annual 90% REIT taxable income distribution requirement. For each of the previous three years, we paid dividends out of our cash flows from operations in excess of the required distribution amounts.
|
Covenants |
|
Required |
|
Actual (as of December 31, 2017) |
|
|
|
Leverage Ratio(1) |
|
≤ 0.60 to 1.00 |
|
|
0.45 |
|
|
Secured Indebtedness Ratio(2) |
|
≤ 0.40 to 1.00 |
|
|
0.03 |
|
|
Unencumbered Coverage Ratio(3) |
|
≥ 1.75 to 1.00 |
|
|
5.33 |
|
|
Fixed Charge Coverage Ratio(4) |
|
≥ 1.50 to 1.00 |
|
|
3.13 |
|
|
Total Unsecured Indebtedness to Total Unencumbered Eligible Property Value(5) |
|
≤ 0.60 to 1.00 |
|
|
0.49 |
|
|
Dividends and Other Restricted Payments |
|
Only applicable in case of default |
|
Not Applicable |
|
|
|
(1) |
The leverage ratio is calculated as the ratio of total indebtedness to total market value. Total market value is computed as the net operating income for the most recently completed fiscal quarter on properties owned for four consecutive quarters at a capitalization rate of 7.50%, multiplied by four, plus the acquisition price of properties in the last four quarters, plus tangible assets comprised of current assets on a GAAP basis and notes receivable. |
|
(2) |
The secured indebtedness ratio is the ratio of secured indebtedness to total market value. The secured indebtedness represents outstanding mortgage borrowings. |
|
(3) |
The unencumbered coverage ratio is the ratio of adjusted EBITDA (as defined within the respective loan agreement) to interest expense for the most recent fiscal quarter. Adjusted EBITDA is calculated as net income adjusted for depreciation and amortization, interest, taxes, gain/loss on sale of properties, dividend income, gain/loss on debt extinguishment, straight-line rent adjustments, transaction costs expensed, amortization of intangibles, and interest rate swap ineffectiveness, if applicable. |
|
(4) |
The fixed charge coverage ratio is the ratio of adjusted EBITDA to fixed charges for the most recent fiscal quarter. Fixed charges are calculated as interest expense plus any principal payments on debt, excluding balloon payments, if applicable. |
|
(5) |
The ratio is calculated as the ratio of total unsecured indebtedness to unencumbered property value. Unsecured indebtedness represents the outstanding balances on the revolver, term notes and Senior Notes. Unencumbered eligible property value includes all real estate properties that are not secured by mortgages. |
We believe our leverage policy and capital structure provides us with several advantages, including the ability to:
|
|
• |
create a growing and diversified real estate portfolio with a flexible capital structure that allows for independent investing and financing decisions; |
|
|
• |
capitalize on competitive debt pricing; |
|
|
• |
add value to our stockholders through earnings growth on a growing pool of assets; and |
|
|
• |
issue unsecured debt having relatively limited negative financial covenants and maintain the distributions necessary to retain our tax-sheltered REIT status in the event of contractual default, which we believe increases our corporate flexibility. |
We do not anticipate utilizing mortgage loans or notes payable as a strategic priority in our capital structure to fund growth. When utilized, mortgage loans and notes payable typically correspond to a single property or a group of related properties acquired from a single seller. The loans may be further secured by guarantees from us or the Operating Company, although we attempt to limit the use of guarantees to the extent possible. The Operating Company may assume debt when conducting a transaction or it may mortgage existing properties. The maturities on our mortgages and notes payable are staggered from 2020 to 2034. As of December 31, 2017, and 2016, the aggregate principal balance of outstanding mortgage loans and notes payable approximated $68.5 million and $107.5 million, respectively.
53
As part of acquisitions closed during 2016, we entered into tenant improvement allowances totaling $10.5 million. During the year ended December 31, 2016, we made payments of $1.0 million under these allowances, resulting in a total tenant improvement allowance balance of $9.5 million at December 31, 2016, included in Accounts payable and other liabilities in the Consolidated Balance Sheets contained in Item 8. “Financial Statements and Supplementary Data” within this Form 10-K. During the year ended December 31, 2017, we entered into $2.8 million of additional tenant improvement allowances and paid $6.6 million towards the outstanding allowances. We expect to pay the remaining $5.7 million balance of tenant improvement allowances out of cash flows from operations or from additional borrowings.
As shown in the table below, net cash provided by operating activities increased by $30.8 million to $97.9 million during the year ended December 31, 2017, from $67.2 million for the year ended December 31, 2016. Additionally, net cash provided by operating activities increased by $28.6 million to $67.2 million for the year ended December 31, 2016. The increase in cash provided by operating activities is primarily due to the increase in the size of our real estate investment portfolio. Our real estate investing activities have grown in volume as we continue to identify and acquire income-producing, net leased commercial real estate, primarily through sale-leaseback transactions, as a result of increased access to debt and equity capital, and favorable investment opportunities. We funded real estate investment activity with a combination of cash from operations, proceeds from the issuance of unsecured debt obligations, and proceeds from the issuance of common stock. We paid cash dividends to our stockholders and non-controlling members of the Operating Company, including cash dividends paid through our DRIP, totaling $52.1 million, $42.7 million, and $27.2 for the years ended December 31, 2017, 2016 and 2015, respectively. Cash used to fund the increase in dividends between periods related primarily to the increase in cash provided by our operations. Cash and cash equivalents totaled $9.4 million, $21.6 million, and $27.0 million at December 31, 2017, December 31, 2016, and December 31, 2015, respectively.
|
|
|
For the years ended December 31, |
|
|||||||||
|
(in thousands) |
|
2017 |
|
|
2016 |
|
|
2015 |
|
|||
|
Net cash provided by operating activities |
|
$ |
97,940 |
|
|
$ |
67,189 |
|
|
$ |
38,616 |
|
|
Net cash used in investing activities |
|
|
(611,111 |
) |
|
|
(471,954 |
) |
|
|
(480,469 |
) |
|
Net cash provided by financing activities |
|
|
500,891 |
|
|
|
399,350 |
|
|
|
464,775 |
|
|
Increase (decrease) in cash and cash equivalents |
|
$ |
(12,280 |
) |
|
$ |
(5,415 |
) |
|
$ |
22,922 |
|
Management believes that the cash generated by our operations and our ongoing private offering, our cash and cash equivalents at December 31, 2017, our current borrowing capacity under our unsecured credit facility, and our access to long-term debt capital, including through the debt private placement market, will be sufficient to fund our operations for the foreseeable future and allow us to acquire the real estate to meet our strategic objectives.
Impact of Inflation
Our leases with tenants of our properties are long-term in nature, with a current weighted average remaining lease term of 13.1 years as of December 31, 2017. To mitigate the impact of inflation on our fixed revenue streams, we have implemented limited escalation clauses in our leases. As of December 31, 2017, nearly all of our leases had contractual lease escalations, with a weighted average of 2.0%. A substantial majority of our leases have fixed annual rent increases, and the remaining portion has annual lease escalations based on increases in the CPI, or periodic escalations over the term of the lease (e.g., a 10% increase every five years). These lease escalations mitigate the risk of fixed revenue streams in the case of an inflationary economic environment, and provide increased return in otherwise stable market conditions. As a majority of our portfolio has fixed lease escalations, there is a risk that inflation could be greater than the contractual rent increases.
54
Our focus on single-tenant, triple-net leases also shelters us from fluctuations in the cost of services and maintenance as a result of inflation. For an insignificant portion of our portfolio, we have leases that are not fully triple-net, and, therefore, we bear certain responsibilities for the maintenance and structural component replacements (e.g., roof, structure, or parking lot) that may be required in the future, although the tenants are still required to pay all operating expenses associated with the property (e.g., real estate taxes, insurance, and maintenance). Inflation and increased costs may have an adverse impact to our tenants and their creditworthiness if the increase in costs are greater than their increase in revenue. In the limited circumstances where we cannot implement a triple-net lease, we attempt to limit our exposure to inflation through the use of warranties and other remedies that reduce the likelihood of a significant capital outlay.
Off-Balance Sheet Arrangements
We have no off-balance sheet arrangements as of December 31, 2017, or December 31, 2016.
Contractual Obligations
The following table provides information with respect to our contractual commitments and obligations as of December 31, 2017 (in thousands).
|
Year of Maturity |
|
2015 Unsecured Term Loan Agreement(1) |
|
|
5.5-Year Term Loan |
|
|
7-Year Term Loan(2) |
|
|
New Revolver(3) |
|
|
Senior Notes |
|
|
Mortgages and Notes Payable |
|
|
Interest Expense(4) |
|
|
Tenant Improvement Allowances(5) |
|
|
Total |
|
|||||||||
|
2018 |
|
$ |
— |
|
|
$ |
— |
|
|
$ |
— |
|
|
$ |
— |
|
|
$ |
— |
|
|
$ |
3,127 |
|
|
$ |
42,520 |
|
|
$ |
5,669 |
|
|
$ |
51,316 |
|
|
2019 |
|
|
325,000 |
|
|
|
— |
|
|
|
— |
|
|
|
— |
|
|
|
— |
|
|
|
3,351 |
|
|
|
34,151 |
|
|
|
— |
|
|
|
362,502 |
|
|
2020 |
|
|
— |
|
|
|
— |
|
|
|
— |
|
|
|
— |
|
|
|
— |
|
|
|
8,777 |
|
|
|
32,705 |
|
|
|
— |
|
|
|
41,482 |
|
|
2021 |
|
|
— |
|
|
|
— |
|
|
|
— |
|
|
|
— |
|
|
|
— |
|
|
|
18,263 |
|
|
|
31,792 |
|
|
|
— |
|
|
|
50,055 |
|
|
2022 |
|
|
— |
|
|
|
— |
|
|
|
— |
|
|
|
273,000 |
|
|
|
— |
|
|
|
25,495 |
|
|
|
23,885 |
|
|
|
— |
|
|
|
322,380 |
|
|
Thereafter |
|
|
— |
|
|
|
265,000 |
|
|
|
100,000 |
|
|
|
— |
|
|
|
150,000 |
|
|
|
9,457 |
|
|
|
53,271 |
|
|
|
— |
|
|
|
577,728 |
|
|
Total |
|
$ |
325,000 |
|
|
$ |
265,000 |
|
|
$ |
100,000 |
|
|
$ |
273,000 |
|
|
$ |
150,000 |
|
|
$ |
68,470 |
|
|
$ |
218,324 |
|
|
$ |
5,669 |
|
|
$ |
1,405,463 |
|
|
(1) |
We may extend the 2015 Unsecured Term Loan Agreement twice, for a one-year period each time, subject to compliance with all covenants and the payment of 0.10% fee. |
|
(2) |
We may request up to two additional borrowings under the delayed draw feature of the 7-Year Term Loan up to but excluding June 22, 2018. |
|
(3) |
We may extend the New Revolver once, for a five-month period, subject to compliance with all covenants and the payment of an extension fee equal to 0.0625% of the revolving commitments. |
|
(4) |
Interest expense is projected based on the outstanding borrowings and interest rates in effect as of December 31, 2017. This amount includes the impact of interest rate swap agreements. See description of interest rate swaps in Item 7A. “Quantitative and Qualitative Disclosures About Market Risk” within this Form 10-K. |
|
(5) |
The tenant improvement allowance is included within the Accounts payable and other liabilities financial statement caption included within the Consolidated Balance Sheets within this Form 10-K. |
At December 31, 2017, and 2016, investment in rental property of $67.7 million and $164.5 million, respectively, was pledged as collateral against our mortgages and notes payable.
Additionally, as of December 31, 2017, we are a party to three separate Tax Protection Agreements (the “Agreements”) with the contributing members (the “Protected Members”) of three distinct UPREIT transactions conducted in November 2015, February 2016, and October 2017. The Agreements require us to pay monetary damages in the event of a sale, exchange, transfer, or other disposal of the contributed property in a taxable transaction that would cause a Protected Member to recognize a Protected Gain, as defined in the Agreements and subject to certain exceptions. In such an event, we will pay monetary damages to the Protected Members in the amount of the aggregate federal, state, and local income taxes incurred as a result of the income or gain allocated or recognized by the Protected Member as an outcome of the transaction, subject to certain caps and limitations contained in the Agreements. We are required to allocate to the Protected Members an amount of nonrecourse liabilities that is at least equal to the Minimum Liability Amount for each Protected Member, as defined in the Agreements. The Minimum Liability Amount and the associated allocation of nonrecourse liabilities are calculated in accordance with applicable tax regulations, are completed at the Operating Company level, and do not represent GAAP accounting. Therefore, there is no impact to the consolidated financial statements included in Item 8.
55
“Financial Statements and Supplementary Data” within this Form 10-K. If the nonrecourse liabilities allocated do not meet the requirement, we will pay monetary damages to the Protected Members in the amount of the aggregate federal, state, and local income taxes incurred as a result of the income or gain allocated or recognized by the Protected Member as an outcome to the default. The maximum aggregate amount we may be liable for under the Agreements is approximately $12.3 million. Based on information available, we do not believe that the events resulting in damages as detailed above have occurred or are likely to occur in the foreseeable future. Accordingly, we have excluded this commitment from the contractual commitments table above.
Results of Operations
Overview
As of December 31, 2017, our real estate investment portfolio had grown to a net book value of $2.2 billion, consisting of investments in 528 property locations in 40 states and leased to tenants in various industries. All of our real estate investment portfolio represents commercial real estate properties subject to long-term leases, and all of our owned properties were subject to a lease as of December 31, 2017. During the years ended December 31, 2017, 2016, and 2015, none of our leases expired, and all of our leasing activity related to our real estate acquisitions.
Revenues
|
|
|
Year Ended December 31, |
|
|
Increase/ (Decrease) |
|
|
Increase/ (Decrease) |
|
|||||||||||
|
(in thousands) |
|
2017 |
|
|
2016 |
|
|
2015 |
|
|
2017 vs 2016 |
|
|
2016 vs 2015 |
|
|||||
|
Revenues: |
|
|
|
|
|
|
|
|
|
|
|
|
|
|
|
|
|
|
|
|
|
Rental income from operating leases |
|
$ |
170,493 |
|
|
$ |
133,943 |
|
|
$ |
89,875 |
|
|
$ |
36,550 |
|
|
$ |
44,068 |
|
|
Earned income from direct financing leases |
|
|
4,141 |
|
|
|
4,544 |
|
|
|
4,075 |
|
|
|
(403 |
) |
|
|
469 |
|
|
Operating expenses reimbursed from tenants |
|
|
6,721 |
|
|
|
4,173 |
|
|
|
3,538 |
|
|
|
2,548 |
|
|
|
635 |
|
|
Other income from real estate transactions |
|
|
208 |
|
|
|
209 |
|
|
|
598 |
|
|
|
(1 |
) |
|
|
(389 |
) |
|
Total revenues |
|
$ |
181,563 |
|
|
$ |
142,869 |
|
|
$ |
98,086 |
|
|
$ |
38,694 |
|
|
$ |
44,783 |
|
2017 versus 2016
Total revenues increased by $38.7 million, or 27.1%, to $181.6 million for the year ended December 31, 2017, compared to $142.9 million for the year ended December 31, 2016. The growth in revenue year-over-year is primarily attributable to the growth in our real estate portfolio. During the year ended December 31, 2017, we closed 29 real estate acquisitions and acquired $683.6 million in real estate, excluding acquisition costs, comprised of 124 new properties.
Our real estate investments in new properties were made throughout the period, with a significant portion during the fourth quarter, and were not all outstanding for the entire period. During 2017, we recognized $17.3 million of the $56.1 million in annualized straight-line rental income from new properties acquired in 2017, with the remaining increase expected to be recognized in 2018. The increase in revenues from 2017 is also a result of the acquisitions made throughout 2016, in particular towards the second half of the year, whereby we recognized the full annualized straight-line rental revenues in 2017. In 2017, we recognized all of the $40.9 million in annualized straight-line rental income from properties acquired in 2016, compared with the $16.9 million we recognized in 2016. The increase in total revenues as a result of acquisitions made in 2017 and 2016 was partially offset by real estate disposals.
Of the $683.6 million and $518.8 million in acquisitions during 2017 and 2016, approximately $314.7 million and $295.8 million, respectively, related to sale-leaseback transactions.
The rental rates we receive on sale-leaseback transactions and lease assumptions on the various types of properties we target across the United States vary from transaction to transaction based on many factors, such as the terms of the lease, each property’s real estate fundamentals, and the market rents in the area. The initial contractual cash lease payments on acquisitions during 2017 represented a weighted average capitalization rate of 7.2%.
56
Total revenues increased by $44.8 million, or 45.7%, to $142.9 million for the year ended December 31, 2016, compared to $98.1 million for the year ended December 31, 2015. The growth in revenue year-over-year is primarily attributable to the growth in our real estate portfolio. During the year ended December 31, 2016, we closed 22 real estate acquisitions and acquired $518.8 million in real estate comprised of 88 new properties and improvements to one of our existing properties.
Our real estate investments in new properties were made throughout the period and were not all outstanding for the entire period. During 2016, we recognized $16.9 million of the $40.9 million in annualized straight-line rental income from new properties acquired in 2016, with the remaining increase recognized in 2017. The increase in revenues from 2015 is also a result of the acquisitions made throughout 2015, in particular towards the second-half of the year, whereby we recognized the full annualized straight-line rental revenues in 2016. In 2016, we recognized all of the $43.4 million in annualized straight-line rental income from properties acquired in 2015, compared with the $14.6 million we recognized in 2015. The increase in total revenues as a result of acquisitions made in 2016 and 2015 was partially offset by real estate disposals. The initial contractual cash lease payments on acquisitions during 2016 represented a weighted average capitalization rate of 6.8%. Additionally, as part of the acquisitions closed in 2016, we capitalized approximately $2.9 million in leasing fees, compared to $4.4 million in 2015. Of the $518.8 million and $550.1 million in acquisitions during 2016 and 2015, approximately $295.8 million and $441.1 million, respectively, related to sale-leaseback transactions.
Operating Expenses
|
|
|
Year Ended December 31, |
|
|
Increase/ (Decrease) |
|
|
Increase/ (Decrease) |
|
|||||||||||
|
(in thousands) |
|
2017 |
|
|
2016 |
|
|
2015 |
|
|
2017 vs 2016 |
|
|
2016 vs 2015 |
|
|||||
|
Operating expenses: |
|
|
|
|
|
|
|
|
|
|
|
|
|
|
|
|
|
|
|
|
|
Depreciation and amortization |
|
$ |
62,263 |
|
|
$ |
46,321 |
|
|
$ |
29,387 |
|
|
$ |
15,942 |
|
|
$ |
16,934 |
|
|
Asset management fees |
|
|
14,754 |
|
|
|
10,955 |
|
|
|
7,042 |
|
|
|
3,799 |
|
|
|
3,913 |
|
|
Property management fees |
|
|
4,988 |
|
|
|
3,939 |
|
|
|
2,697 |
|
|
|
1,049 |
|
|
|
1,242 |
|
|
Acquisition expenses |
|
|
— |
|
|
|
10,880 |
|
|
|
9,947 |
|
|
|
(10,880 |
) |
|
|
933 |
|
|
Property and operating expense |
|
|
6,505 |
|
|
|
3,900 |
|
|
|
3,384 |
|
|
|
2,605 |
|
|
|
516 |
|
|
General and administrative |
|
|
4,939 |
|
|
|
2,790 |
|
|
|
3,116 |
|
|
|
2,149 |
|
|
|
(326 |
) |
|
State and franchise tax |
|
|
624 |
|
|
|
446 |
|
|
|
130 |
|
|
|
178 |
|
|
|
316 |
|
|
Provision for impairment of investment in rental properties |
|
|
2,608 |
|
|
|
— |
|
|
|
— |
|
|
|
2,608 |
|
|
|
- |
|
|
Total operating expenses |
|
$ |
96,681 |
|
|
$ |
79,231 |
|
|
$ |
55,703 |
|
|
$ |
17,450 |
|
|
$ |
23,528 |
|
Depreciation and amortization – 2017 versus 2016
Depreciation and amortization increased by $16.0 million, or 34.4%, to $62.3 million for the year ended December 31, 2017, compared to $46.3 million for the year ended December 31, 2016, primarily as a result of the growth in our real estate portfolio. During the year ended December 31, 2017, we acquired $683.6 million in real estate comprised of 124 new properties. Our real estate investments were made throughout the period and were not all outstanding for the entire period; accordingly, only a portion of the increase in annualized depreciation is reflected in the full-year 2017 amounts. In addition, during the year ended December 31, 2017, we capitalized $12.3 million in acquisition expenses as the result of adopting FASB ASU 2017-01, Business Combinations (Topic 805): Clarifying the Definition of a Business (“ASU 2017-01”). The capitalized acquisition expenses are capitalized as part of the cost basis of the underlying assets acquired and are depreciated over the respective useful lives. For acquisitions made in 2016, we expensed acquisition costs as incurred. We adopted ASU 2017-01 and the respective accounting for acquisition expenses as of January 1, 2017, on a prospective basis, and therefore this new accounting standard does not impact acquisition costs previously expensed in 2016.
57
Depreciation and amortization – 2016 versus 2015
Depreciation and amortization increased by $16.9 million, or 57.6%, to $46.3 million for the year ended December 31, 2016, compared to $29.4 million for the year ended December 31, 2015, primarily as a result of the growth in our real estate portfolio. During the year ended December 31, 2016, we acquired $518.8 million in real estate comprised of 88 new properties and a capital expansion on an existing property. Our real estate investments were made throughout the period and were not all outstanding for the entire period; accordingly, only a portion of the increase in annualized depreciation is reflected in the full-year 2016 amounts.
Asset management fees – 2017 versus 2016
Asset management fees increased by $3.8 million, or 34.7%, to $14.8 million for the year ended December 31, 2017, compared to $11.0 million for the year ended December 31, 2016. The Asset Manager receives an annual asset management fee equal to 1.0% of the aggregate value of our equity on a fully diluted basis based on the Determined Share Value. The increase in asset management fees during 2017 is a result of an increase in the equity on a fully diluted basis and the increase in the Determined Share Value. During the year ended December 31, 2017, the Independent Directors Committee increased the Determined Share Value 5.2% from $77.00 per share as of December 31, 2016, to $81.00 per share as of December 31, 2017. Additionally, the weighted average number of shares of our common stock and noncontrolling membership units of the Operating Company outstanding increased as the result of continued equity capital investments. For the year ended December 31, 2017, the weighted average number of shares of our common stock and noncontrolling membership units of the Operating Company outstanding was 18.6 million compared to 14.6 million for the year ended December 31, 2016. The increase in equity capital was used to partially fund the continued growth in our real estate portfolio.
Asset management fees – 2016 versus 2015
Asset management fees increased by $4.0 million, or 55.6%, to $11.0 million for the year ended December 31, 2016, compared to $7.0 million for the year ended December 31, 2015. The Asset Manager receives an annual asset management fee equal to 1.0% of the aggregate value of our equity on a fully diluted basis based on the Determined Share Value. The increase in asset management fees during 2016 is a result of an increase in the equity on a fully diluted basis and the increase in the Determined Share Value. During the year ended December 31, 2016, the Independent Directors Committee increased the Determined Share Value 4.1% from $74.00 per share as of December 31, 2015, to $77.00 per share as of December 31, 2016. Additionally, the weighted average number of shares of our common stock and noncontrolling membership units of the Operating Company outstanding increased as the result of continued equity capital investments. For the year ended December 31, 2016, the weighted average number of shares of our common stock and noncontrolling membership units of the Operating Company outstanding was 14.6 million compared to 9.7 million for the year ended December 31, 2015. The increase in equity capital was used to partially fund the continued growth in our real estate portfolio.
Property Management Fees – 2017 versus 2016
Property management fees increased by $1.1 million, or 26.6%, to $5.0 million for the year ended December 31, 2017, compared to $3.9 million for the year ended December 31, 2016. The Manager is compensated for its property management services by receiving, as of the end of each month, a property management fee equal to 3% of gross cash rentals collected from the real estate portfolio for that month. The increase in property management fees is primarily attributable to the growth in our real estate portfolio. During the year ended December 31, 2017, we acquired $683.6 million in real estate comprised of 124 new properties from 29 separate acquisitions. Our real estate investments were made throughout the period and were not all outstanding for the entire period; accordingly, a portion of the increase in property management fees calculated based on the additional rental revenue from these acquisitions will be recognized in subsequent periods. Additionally, we recognized average annual rent increases of approximately 2.0% during 2017, contributing to growth in property management fees on properties owned in the prior year.
58
Property Management Fees – 2016 versus 2015
Property management fees increased by $1.2 million, or 46.1% to $3.9 million for the year ended December 31, 2016, compared to $2.7 million for the year ended December 31, 2015. The Manager is compensated for its property management services by receiving, as of the end of each month, a property management fee equal to 3% of gross cash rentals collected from the real estate portfolio for that month. The increase in property management fees is primarily attributable to the growth in our real estate portfolio. During the year ended December 31, 2016, we acquired $518.8 million in real estate comprised of 88 new properties and a capital expansion on an existing property from 22 separate acquisitions. Our real estate investments were made throughout the period and were not all outstanding for the entire period; accordingly, a portion of the increase in property management fees calculated based on the additional rental revenue from these acquisitions will be recognized in subsequent periods. Additionally, we recognized average annual rent increases of approximately 2.1% during 2016, contributing to growth in property management fees on properties owned in the prior year.
Acquisition Expenses – 2017 versus 2016
Acquisition expenses decreased to zero for the year ended December 31, 2017, compared to $10.9 million for the year ended December 31, 2016, reflecting the impact of our adopting the provisions of ASU 2017-01 prospectively as of January 1, 2017. As discussed above, subsequent to the adoption of the ASU, acquisition expenses are now capitalized as part of the cost basis of the underlying assets acquired; whereas previously they had been expensed. Under the terms of the Asset Management Agreement, we pay the Asset Manager an acquisition fee equal to 1% of the gross purchase price paid for each property we acquire (including properties contributed in exchange for membership units in the Operating Company).
As noted above, we capitalized $12.3 million in acquisition expenses in the year ended December 31, 2017. The $1.4 increase in acquisition expenses capitalized in 2017 compared to amounts expensed in 2016, relates to an increase in acquisition activity in the current year.
Acquisition Expenses – 2016 versus 2015
Acquisition expenses increased by $1.0 million, or 9.4%, to $10.9 million for the year ended December 31, 2016, compared to $9.9 million for the year ended December 31, 2015. Under the terms of the Asset Management Agreement, we pay the Asset Manager an acquisition fee equal to 1% of the gross purchase price paid for each property we acquire (including properties contributed in exchange for membership units in the Operating Company). The increase in acquisition expenses year-over-year is a result of increased legal expenses due to the increased complexity of acquisitions closed during 2016. The impact was slightly offset by a 5.7% decrease in acquisition activity from 2015 to 2016. During the year ended December 31, 2016, we acquired $518.8 million in real estate, as compared to $550.1 million for the year ended December 31, 2015.
Property and operating expense – 2017 versus 2016
Property and operating expense increased by $2.6 million, or 66.8%, to $6.5 million for the year ended December 31, 2017, compared to $3.9 million for the year ended December 31, 2016. The increase is attributable to the number of properties we own whereby we are responsible for engaging a third-party property manager to manage the respective ongoing property maintenance, along with real estate taxes associated with those properties. These expenses are paid by us and reimbursed by the tenant under the terms of the respective leases. There was a corresponding increase in the operating expenses reimbursed by tenants revenue balance.
General and administrative – 2017 versus 2016
General and administrative expenses increased by $2.1 million, or 77.0%, to $4.9 million for the year ended December 31, 2017, compared to $2.8 million for the year ended December 31, 2016. The increase is primarily related to increased fees for costs and services associated with becoming a public reporting entity in accordance with Section 12(g) of the Exchange Act during 2017.
59
Provision for impairment of investment in rental properties
For the year ended December 31, 2017, we recognized an asset impairment of $2.6 million on our investments in rental properties. We review long-lived assets to be held for possible impairment whenever events or changes in circumstances indicate that their carrying amounts may not be recoverable. If and when such events or changes in circumstances are present, an impairment exists to the extent the carrying value of the asset or asset group exceeds the sum of the undiscounted cash flows expected to result from the use of the asset or asset group and its eventual disposition. We recognized impairment on four properties whose carrying amounts we determined were not recoverable. In determining the fair value of the assets at the time of measurement, we utilized direct capitalization rates ranging from 7.25% to 12.00%, and a weighted average discount rate of 8.00%. We did not recognize asset impairments for the years ended December 31, 2016 or 2015.
Other income (loss)
|
|
|
Year Ended December 31, |
|
|
Increase/ (Decrease) |
|
|
Increase/ (Decrease) |
|
|||||||||||
|
(in thousands) |
|
2017 |
|
|
2016 |
|
|
2015 |
|
|
2017 vs 2016 |
|
|
2016 vs 2015 |
|
|||||
|
Other revenue (expenses) |
|
|
|
|
|
|
|
|
|
|
|
|
|
|
|
|
|
|
|
|
|
Preferred distribution income |
|
$ |
737 |
|
|
$ |
713 |
|
|
$ |
350 |
|
|
$ |
24 |
|
|
$ |
363 |
|
|
Interest income |
|
|
467 |
|
|
|
88 |
|
|
|
— |
|
|
|
379 |
|
|
|
88 |
|
|
Interest expense |
|
|
(34,751 |
) |
|
|
(29,963 |
) |
|
|
(22,605 |
) |
|
|
(4,788 |
) |
|
|
(7,358 |
) |
|
(Cost) gain of debt extinguishment |
|
|
(5,151 |
) |
|
|
(133 |
) |
|
|
1,213 |
|
|
|
(5,018 |
) |
|
|
(1,346 |
) |
|
Gain (loss) on sale of real estate |
|
|
12,992 |
|
|
|
5,925 |
|
|
|
(713 |
) |
|
|
7,067 |
|
|
|
6,638 |
|
|
Other gains |
|
|
379 |
|
|
|
— |
|
|
|
262 |
|
|
|
379 |
|
|
|
(262 |
) |
Interest Expense – 2017 versus 2016
Interest expense increased by $4.7 million to $34.7 million, or 16.0%, for the year ended December 31, 2017, compared to $30.0 million for the year ended December 31, 2016, due primarily to an increase in long-term borrowings used to partially fund the acquisition of properties for our growing real estate investment portfolio. The debt outstanding on our unsecured credit facilities, excluding capitalized debt issuance costs, increased from $762.0 million at December 31, 2016, to $1,113.0 million at December 31, 2017.
Interest Expense – 2016 versus 2015
Interest expense increased by $7.4 million, or 32.6%, to $30.0 million for the year ended December 31, 2016, compared to $22.6 million for the year ended December 31, 2015, due primarily to an increase in long-term borrowings used to partially fund the acquisition of properties for our growing real estate investment portfolio. The debt outstanding on our unsecured credit facilities, excluding capitalized debt issuance costs, increased from $565.0 million at December 31, 2015, to $762.0 million at December 31, 2016. The Operating Company’s receipt of an investment grade credit rating in March 2016 lowered the credit spread on two of our three credit facilities to 1.40% and 1.45%, effective April 1, 2016.
(Cost) gain of debt extinguishment
The (cost) gain of debt extinguishment represents the difference between the price paid to extinguish the debt compared to the carrying value of the debt, plus any unamortized debt acquisition costs at the time of extinguishment. To the extent that the price paid to extinguish the debt is greater than the carrying value of debt, we would recognize a loss on extinguishment. The loss would be increased by the amount of previously capitalized debt acquisition costs that remain unamortized at the time of extinguishment. To the extent that the price paid to extinguish the debt is less than the carrying value of debt, we would recognize a gain on extinguishment, netted by any unamortized debt acquisition costs. These amounts fluctuate period-over-period based on the variability in the interest rate environment, changes in financial institutions’ credit standards, and our activity in capital markets to manage our leverage position.
60
Cost of debt extinguishment increased by $5.0 million, to $5.2 million for the year ended December 31, 2017, compared to $0.2 million for the year ended December 31, 2016. The fluctuation is a direct result of the new credit facility that we closed on June 23, 2017, together with the corresponding extinguishment of the Revolver, Term Note 1, and Term Note 2.
Gain (loss) on sale of real estate
During the year ended December 31, 2017, we recognized a $13.0 million gain on the sale of real estate, compared to a gain of $5.9 million for the year ended December 31, 2016, and a loss of $0.7 million for the year ended December 31, 2015. During 2017, 2016, and 2015, we sold 13 properties, nine properties, and six properties, respectively. Our recognition of a gain or loss on the sale of real estate varies from transaction to transaction based on fluctuations in asset prices and demand in the real estate market.
Net Income and Non-GAAP Measures (FFO and AFFO)
Our reported results and net earnings per diluted share are presented in accordance with GAAP. We also disclose FFO and AFFO, each of which are non-GAAP measures. We believe the use of FFO and AFFO are useful to investors because they are widely accepted industry measures used by analysts and investors to compare the operating performance of REITs. FFO and AFFO should not be considered alternatives to net income as a performance measure or to cash flows from operations, as reported on our statement of cash flows, or as a liquidity measure and should be considered in addition to, and not in lieu of, GAAP financial measures.
We compute FFO in accordance with the standards established by the 2002 White Paper on FFO approved by the Board of Governors of the National Association of Real Estate Investment Trusts (“NAREIT”). NAREIT defines FFO as GAAP net income or loss adjusted to exclude net gains (losses) from sales of depreciated real estate assets, depreciation and amortization expense from real estate assets, and impairment charges related to previously depreciated real estate assets. To derive AFFO, we modify the NAREIT computation of FFO to include other adjustments to GAAP net income related to certain non-cash revenues and expenses, including straight-line rents, cost of debt extinguishments, acquisition expenses, amortization of lease intangibles, amortization of debt issuance costs, amortization of net mortgage premiums, (gain) loss on interest rate swaps and other non-cash interest expense, extraordinary items and other specified non-cash items. We believe that such items are not a result of normal operations and thus we believe excluding such items assists management and investors in distinguishing whether changes in our operations are due to growth or decline of operations at our properties or from other factors.
Our leases include cash rents that increase over the term of the lease to compensate us for anticipated increases in market rentals over time. Our leases do not include significant front-loading or back-loading of payments, or significant rent-free periods. Therefore, we find it useful to evaluate rent on a contractual basis as it allows for comparison of existing rental rates to market rental rates. Additionally, we exclude transaction costs associated with acquiring real estate subject to existing leases, including the amortization of lease intangibles, as well as acquisition expenses paid to our Asset Manager that are based on a percentage of the gross acquisition purchase price. We exclude these costs from AFFO because they are upfront expenses that are recognized in conjunction with an acquisition, and therefore, are not indicative of ongoing operational results of the portfolio. We believe excluding acquisition expenses provides investors a view of the performance of our portfolio over time. In connection with our adoption of ASU 2017-01, effective January 1, 2017, and on a prospective basis, we capitalize all asset acquisition expenses as part of the cost basis of the tangible and intangible assets acquired. Therefore, effective January 1, 2017, we will no longer adjust for acquisition expenses in our AFFO computation. We also exclude the amortization of debt issuance costs and net mortgage premiums as they are not indicative of ongoing operational results of the portfolio. We use AFFO as a measure of our performance when we formulate corporate goals.
FFO is used by management, investors, and analysts to facilitate meaningful comparisons of operating performance between periods and among our peers, primarily because it excludes the effect of real estate depreciation and amortization and net gains on sales, which are based on historical costs and implicitly assume that the value of real estate diminishes predictably over time, rather than fluctuating based on existing market conditions. We believe that AFFO is a useful supplemental measure for investors to consider because it will help them to better assess our operating performance without the distortions created by non-cash revenues or expenses. FFO and AFFO may not be comparable to similarly titled measures employed by other REITs, and comparisons of our FFO and AFFO with the same or similar measures disclosed by other REITs may not be meaningful.
61
Neither the SEC nor any other regulatory body has passed judgment on the acceptability of the adjustments that we use to calculate FFO and AFFO. In the future, the SEC, NAREIT or another regulatory body may decide to standardize the allowable adjustments across the REIT industry and in response to such standardization we may have to adjust our calculation and characterization of FFO and AFFO accordingly.
The following table presents our GAAP net income and non-GAAP FFO and AFFO for the years ended December 31, 2017, 2016, and 2015 in total and on a per share basis. Our measures of FFO and AFFO are computed on the basis of amounts attributable to both us and noncontrolling interests. As the noncontrolling interests share in our net income on a one-for-one basis, the basic and diluted per-share amounts are the same.
|
|
|
Year ended December 31, |
|
|
Increase/ Decrease |
|
|
Increase/ Decrease |
|
|||||||||||
|
(in thousands, except per share data) |
|
2017 |
|
|
2016 |
|
|
2015 |
|
|
2017 vs 2016 |
|
|
2016 vs 2015 |
|
|||||
|
Net income |
|
$ |
59,555 |
|
|
$ |
40,268 |
|
|
$ |
20,890 |
|
|
$ |
19,287 |
|
|
$ |
19,378 |
|
|
Net earnings per diluted share |
|
|
3.21 |
|
|
|
2.76 |
|
|
|
2.15 |
|
|
|
0.45 |
|
|
|
0.61 |
|
|
FFO |
|
|
111,434 |
|
|
|
80,664 |
|
|
|
50,990 |
|
|
|
30,770 |
|
|
|
29,674 |
|
|
FFO per diluted share |
|
|
6.00 |
|
|
|
5.53 |
|
|
|
5.24 |
|
|
|
0.47 |
|
|
|
0.29 |
|
|
AFFO |
|
|
99,952 |
|
|
|
78,780 |
|
|
|
52,273 |
|
|
|
21,172 |
|
|
|
26,507 |
|
|
AFFO per diluted share |
|
$ |
5.38 |
|
|
$ |
5.40 |
|
|
$ |
5.37 |
|
|
$ |
(0.02 |
) |
|
$ |
0.03 |
|
|
Diluted WASO |
|
|
18,567 |
|
|
|
14,597 |
|
|
|
9,736 |
|
|
|
|
|
|
|
|
|
Net income
Net income increased by $19.3 million, or 47.9%, to $59.6 million for the year ended December 31, 2017, compared to $40.3 million for the year ended December 31, 2016. Net earnings per diluted share increased $0.45 during the same period, to $3.21 per share. The increase is mainly attributable to our investments in real estate properties. During the year ended December 31, 2017, we closed 29 real estate acquisitions and acquired $683.6 million in real estate, excluding acquisition costs, comprised of 124 new properties. As discussed above, this investment activity resulted in increased revenues which was partially offset by increased depreciation and amortization expenses. In addition, during the year ended December 31, 2017, we sold 13 properties and recognized a $13.0 million gain on the sale of real estate, compared to a gain of $5.9 million related to the sale of nine properties for the year ended December 31, 2016. Net income also increased as a result of adopting the provisions of ASU 2017-01 prospectively as of January 1, 2017, which had the effect of our capitalizing acquisition costs that had been expensed in prior years. During the year ended December 31, 2017, we capitalized $12.3 million in acquisition expenses.
Partially offsetting these factors were a $5.0 million increase in costs of debt extinguishment and a $4.8 million increase in interest expense, both of which reflect the renegotiation of our long-term credit facilities and increased borrowing capacity, as well as the impact of a $2.6 million impairment charge taken during the year ended December 31, 2017. The increase in net income in the earnings per share computation was partially offset by a 4.0 million increase in the diluted weighted average number of shares of our common stock outstanding as a result of ongoing equity raises.
Net income increased by $19.4 million, or 92.8%, to $40.3 million for the year ended December 31, 2016, compared to $20.9 million for the year ended December 31, 2015. Net earnings per diluted share increased by $0.61 during the same period, to $2.76 per share. The increase in net income and earnings per share is attributable to accretive investments in real estate properties made during 2016, coupled with the annualized revenue streams from the real estate investments made in 2015. We added $518.8 million and $550.1 million in real estate investments during the years ended December 31, 2016 and 2015, respectively. As discussed above, in addition to increased revenues, the investment activity in the year ended December 31, 2016 also resulted in increased depreciation and amortization, and property management expenses associated with the newly acquired properties. In addition, during the year ended December 31, 2016, we sold nine properties and recognized a $5.9 million gain on the sale of real estate, compared to a loss of $0.7 million related to the sale of six properties for the year ended December 31, 2015.
62
Partially offsetting these factors was a $7.4 million increase in interest expense, reflecting increased borrowings during the year ended December 31, 2016, to partially fund our growing portfolio of real estate properties. The increase in net income in the earnings per share computation was partially offset by a 4.9 million increase in the diluted weighted average number of shares of our common stock outstanding as a result of ongoing equity raises.
FFO
FFO increased by $30.7 million, or 38.1% to $111.4 million for the year ended December 31, 2017, compared to $80.7 million for the year ended December 31, 2016. FFO per diluted share increased by $0.47 during the same period to $6.00 per share. As compared to the increase in net income, the increase in FFO is primarily driven by the increased revenue year over year as a result of growth in our real estate investment portfolio, as discussed for net income above. This growth also contributed to increased addbacks related to real estate depreciation and amortization as compared to the prior year. Additionally, we added back $2.6 million of asset impairment charges recognized during the year ended December 31, 2017, with no comparable charges in the prior year. These factors were partially offset by a larger deduction from net income in the year ended December 31, 2017, related to gains on the sale of real estate. The increase in FFO per diluted share was partially offset by an increase in the weighted average number of shares outstanding.
FFO increased by $29.7 million, or 58.2%, to $80.7 million for the year ended December 31, 2016, compared to $51.0 million for the year ended December 31, 2015. FFO per diluted share increased by $0.29 during the same period to $5.53 per share. As compared to the increase in net income, the increase in FFO is primarily driven by increased revenue and addbacks for real estate depreciation and amortization year-over-year as the result of growth in our real estate investment portfolio, as discussed above. Partially offsetting these positive effects was a $6.6 million increase in the deduction for the gain on sale of real estate. The increase in FFO per diluted share was partially offset by an increase in the weighted average number of shares outstanding.
AFFO increased $21.2 million, or 26.9% to $100.0 million for the year ended December 31, 2017, compared to $78.8 million for the year ended December 31, 2016. As compared to the increase in net income and FFO, the year-over-year growth in AFFO mainly resulted from the factors impacting the increase in FFO discussed above, combined with a $5.0 million increase in the addback related to cost of debt extinguishment, reflecting the renegotiation of our credit facilities during the year. These increases were somewhat offset by the lack of an addback in the current year for capitalized acquisition costs, compared to an addback of $10.9 million in the prior year, combined with a $3.3 million increase in the deduction for straight-line rent adjustments reflecting growth in our real estate investment portfolio.
The $0.02 decrease in AFFO per share largely reflects the impact of the timing difference between equity inflows, which result in a higher number of outstanding shares, and capital deployment in revenue producing properties. The $316.2 million in new equity inflows in 2017 were sourced ratably throughout the year, whereas our $683.6 million in acquisitions were weighted towards the second half of the year. In particular, we acquired $331.6 million of properties during the fourth quarter, with $305.9 million during December alone. The 2017 acquisitions will provide $56.1 million of GAAP straight-line revenues in their first full year in the portfolio, or $49.4 million on a cash basis after consideration of the straight-line rent adjustment. Due to the timing of acquisitions, we only recognized $17.3 million of straight-line revenues, or $14.8 million in cash revenues, associated with these properties in 2017. The incremental $38.8 million of straight-line revenues, or $34.6 million of cash revenues, will be recognized in 2018.
AFFO for the year ended December 31, 2016, increased $26.5 million, or 50.7% to $78.8 million, compared to $52.3 million for the year ended December 31, 2015. AFFO per diluted share increased by $0.03 during the same period to $5.40 per diluted share.
As compared to the increase in net income and FFO, the year-over-year growth in AFFO mainly resulted from the factors impacting the increase in FFO discussed above, as well as a $0.1 million addback related to cost of debt extinguishment, compared to a deduction of $1.2 million in the prior year. These increases were somewhat offset by a $6.3 million increase in the deduction from FFO for straight-line rent adjustments, and $0.9 increases in acquisition costs, both reflecting growth in our real estate investment portfolio.
63
Reconciliation of Non-GAAP Measures
The following is a reconciliation of net income to FFO and AFFO for the years ended December 31, 2017, 2016, and 2015. Also presented is information regarding the weighted average number of shares of our common stock and noncontrolling membership units of the Operating Company used for the diluted computation per share:
|
|
|
Year ended December 31, |
|
|||||||||
|
(in thousands, except per share data) |
|
2017 |
|
|
2016 |
|
|
2015 |
|
|||
|
Net income |
|
$ |
59,555 |
|
|
$ |
40,268 |
|
|
$ |
20,890 |
|
|
Real property depreciation and amortization |
|
|
62,263 |
|
|
|
46,321 |
|
|
|
29,387 |
|
|
(Gain) Loss on sale of real estate |
|
|
(12,992 |
) |
|
|
(5,925 |
) |
|
|
713 |
|
|
Provision for impairment on investment in rental properties |
|
|
2,608 |
|
|
|
— |
|
|
|
— |
|
|
FFO |
|
$ |
111,434 |
|
|
$ |
80,664 |
|
|
$ |
50,990 |
|
|
Capital improvements / reserves |
|
|
(196 |
) |
|
|
(194 |
) |
|
|
(195 |
) |
|
Straight line rent adjustment |
|
|
(17,132 |
) |
|
|
(13,847 |
) |
|
|
(7,593 |
) |
|
Cost (Gain) of debt extinguishment |
|
|
5,151 |
|
|
|
133 |
|
|
|
(1,213 |
) |
|
Other gains |
|
|
(379 |
) |
|
|
— |
|
|
|
(262 |
) |
|
Amortization of debt issuance costs |
|
|
1,795 |
|
|
|
1,817 |
|
|
|
1,372 |
|
|
Amortization of net mortgage premiums |
|
|
61 |
|
|
|
(191 |
) |
|
|
(191 |
) |
|
Gain on interest rate swaps and other non- cash interest expense |
|
|
(1,280 |
) |
|
|
— |
|
|
|
— |
|
|
Amortization of lease intangibles |
|
|
498 |
|
|
|
(482 |
) |
|
|
(582 |
) |
|
Acquisition expenses |
|
|
— |
|
|
|
10,880 |
|
|
|
9,947 |
|
|
AFFO |
|
$ |
99,952 |
|
|
$ |
78,780 |
|
|
$ |
52,273 |
|
|
Diluted WASO(1) |
|
|
18,567 |
|
|
|
14,597 |
|
|
|
9,736 |
|
|
Net earnings per share, basic and diluted |
|
|
3.21 |
|
|
|
2.76 |
|
|
|
2.15 |
|
|
FFO per diluted share |
|
|
6.00 |
|
|
|
5.53 |
|
|
|
5.24 |
|
|
AFFO per diluted share |
|
$ |
5.38 |
|
|
$ |
5.40 |
|
|
$ |
5.37 |
|
|
(1) |
Diluted weighted average number of shares of our common stock and membership units in the Operating Company outstanding (“WASO”), computed in accordance with GAAP. |
Critical Accounting Policies
The preparation of our consolidated financial statements in conformance with GAAP requires management to make estimates and assumptions that affect the reported amounts of assets, liabilities, revenues, and expenses as well as other disclosures in the financial statements. On an ongoing basis, management evaluates its estimates and assumptions; however, actual results may differ from these estimates and assumptions, which in turn could have a material impact on our financial statements. A summary of our significant accounting policies and procedures are included in Note 2, “Summary of Significant Accounting Policies”, contained in Item 8. “Financial Statements and Supplementary Data” included in this Form 10-K. Management believes the following critical accounting policies, among others, affect its more significant estimates and assumptions used in the preparation of our consolidated financial statements.
Investments in Rental Property
We record investments in rental property accounted for under operating leases at cost. We record investments in rental property accounted for under direct financing leases at their net investment (which at the inception of the lease generally represents the cost of the property).
64
We early adopted ASU 2017-01, Business Combinations (Topic 805): Clarifying the Definition of a Business (“ASU 2017-01”), on a prospective basis, effective January 1, 2017. The guidance changes the definition of a business to exclude acquisitions where substantially all of the fair value of the assets acquired are concentrated in a single identifiable asset or group of similar identifiable assets, and therefore are accounted for as asset acquisitions instead of business combinations. All of our 2017 acquisitions closed subsequent to the adoption of this guidance, and therefore during the year ended December 31, 2017, did not meet the definition of a business and accordingly were accounted for as asset acquisitions.
We allocate the purchase price of investments in rental property accounted for as an asset acquisition based on the relative fair value of the assets acquired and liabilities assumed. These generally include tangible assets, consisting of land and land improvements, buildings and other improvements, and equipment, and identifiable intangible assets and liabilities, including the value of in-place leases and acquired above-market and below-market leases. Acquisition costs incurred in connection with investments in real estate accounted for as asset acquisitions are capitalized and included with the allocated purchase price. The results of operations of acquired properties are included in the Consolidated Statements of Income and Comprehensive Income from the respective date of acquisition.
We allocate the purchase price of investments in rental property accounted for as a business combination based on the estimated fair value at the date of the acquisition of the assets acquired and liabilities assumed. These generally include tangible assets, consisting of land and land improvements, buildings and other improvements, and equipment, and identifiable intangible assets and liabilities, including the value of in-place leases and acquired above-market and below-market leases. Acquisition costs incurred in connection with investments in real estate accounted for as business combinations are expensed at the time of acquisition. The results of operations of acquired properties are included in the Consolidated Statements of Income and Comprehensive Income from the respective date of acquisition.
We use multiple sources to estimate fair value, including information obtained about each property as a result of our pre-acquisition due diligence and our marketing and leasing activities. Factors that impact our fair value determination include real estate market conditions, industry conditions that the tenant operates in, and characteristics of the real estate and/or real estate appraisals. Changes in any of these factors could impact the future purchase prices of our investments and the corresponding capitalization rates recognized. We do not believe the assumptions used to fair value the investments upon acquisition have a significant degree of estimation uncertainty.
We determine the fair value of tangible assets of an acquired property by valuing the property as if it were vacant. Management then allocates the as-if-vacant value to land and land improvements, buildings, and equipment based on the fair value of the assets.
The estimated fair value of acquired in-place leases equals the costs we would have had to incur to lease the properties to the occupancy level of the properties at the date of acquisition. Such costs include the fair value of leasing commissions and other operating costs that would have been incurred to lease the properties, had they been vacant, to their acquired occupancy level. We amortize acquired in-place leases as of the date of acquisition over the remaining initial non-cancellable terms of the respective leases to amortization expense.
We record acquired above-market and below-market lease values based on the present value (using an interest rate that reflects the risks associated with the lease acquired) of the differences between the contractual amounts to be paid pursuant to the in-place leases and management’s estimate of fair market value lease rates at the time of acquisition for the corresponding in-place leases. We amortize the capitalized above-market and below-market lease values as adjustments to rental revenue over the remaining term of the respective leases.
Should a tenant terminate its lease, we charge the unamortized portion of the in-place lease value to amortization expense and we charge the unamortized portion of above-market or below-market lease value to rental income.
Management estimates the fair value of assumed mortgages and notes payable based upon indications of then-current market pricing for similar types of debt with similar maturities. We record assumed mortgages and notes payable at their estimated fair value as of the assumption date, and the difference between the estimated fair value and the notes’ outstanding principal balance is amortized to interest expense over the remaining term of the debt.
65
We review long-lived assets to be held and used for possible impairment when events or changes in circumstances indicate that their carrying amounts may not be recoverable. If such events or changes in circumstances are present, an impairment exists to the extent the carrying value of the asset or asset group exceeds the sum of the undiscounted cash flows expected to result from the use of the asset or asset group and its eventual disposition. Such cash flows include factors such as expected future operating income, trends and prospects, as well as the effects of demand, competition, and other factors. An impairment loss is measured as the amount by which the carrying amount of the asset or asset group exceeds the fair value of the asset or asset group.
Inputs used in establishing fair value for impaired real estate assets generally fall within Level 3 of the fair value hierarchy, which are characterized as requiring significant judgment as little or no current market activity may be available for validation. The main indicator used to establish the classification of the inputs is current market condition, as derived through our use of published commercial real estate market information. We determine the valuation of impaired assets using generally accepted valuation techniques including discounted cash flow analysis, income capitalization, analysis of recent comparable sales transactions, actual sales negotiations and bona fide purchase offers received from third parties. Management may consider a single valuation technique or multiple valuation techniques, as appropriate, when estimating the fair value of its real estate.
During the year ended December 31, 2017, we recognized an impairment charge on real estate assets of $2.6 million, which resulted from non-payment of past due rental amounts and concerns over the tenant’s future viability. In determining the fair value of the real estate assets at the time of measurement, we utilized direct capitalization rates ranging from 7.25% to 12.00% and a weighted average discount rate of 8.00%, which are Level 3 inputs. We believe the uncertainty in the future cash flows was reflected in the significant capitalization rate, and the estimates were based on the information available at the time of impairment. We classified the impairment charge within earnings from operations in the Consolidated Statements of Income and Comprehensive Income included in this Form 10-K.
We did not recognize impairment charges during the years ended December 31, 2016 and 2015.
Revenue Recognition
At the inception of a new lease arrangement, including new leases that arise from amendments, management assesses the terms and conditions to determine the proper lease classification. A lease arrangement is classified as an operating lease if none of the following criteria are met: (i) ownership transfers to the lessee prior to or shortly after the end of the lease term, (ii) lessee has a bargain purchase option during or at the end of the lease term, (iii) the lease term is greater than or equal to 75% of the underlying property’s economic life, or (iv) the present value of the future minimum lease payments (excluding executory costs) is greater than or equal to 90% of the fair value of the leased property. If one or more of these criteria are met, and the minimum lease payments are determined to be reasonably predictable and collectible, the lease arrangement is generally accounted for as a direct financing lease. Revenue recognition methods for operating leases and direct financing leases are described below:
|
|
• |
Rental property accounted for under operating leases – Revenue is recognized as rents are earned on a straight-line basis over the non-cancelable terms of the related leases. In most cases, revenue recognition under operating leases begins when the lessee takes possession of, or controls, the physical use of the leased asset. Generally, this occurs on the lease commencement date. For leases that have fixed and measurable rent escalations, the difference between such rental income earned and the cash rent due under the provisions of the lease is recorded as accrued rental income. |
|
|
• |
Rental property accounted for under direct financing leases – management utilizes the direct finance method of accounting to record direct finance lease income. For a lease accounted for as a direct finance lease, the net investment in the direct finance lease represents receivables for the sum of future minimum lease payments and the estimated residual value of the leased property, less the unamortized unearned income. Unearned income is deferred and amortized into income over the lease terms so as to produce a constant periodic rate of return on our net investment in the leases. |
66
Derivative Instruments and Hedging
Management uses interest rate swap agreements to manage risks related to interest rate movements and the corresponding impact to interest expense on long-term debt. We report the interest rate swap agreements, designated and qualifying as cash flow hedges, at fair value. We record the gain or loss on the effective portion of the hedge initially as a component of other comprehensive income or loss and subsequently reclassify these amounts into earnings when we incur interest on the related debt and as the swap net settlements occur. If and when there is ineffectiveness realized on a swap agreement, management recognizes the ineffectiveness as a component of interest expense in the period incurred. Management documents its risk management strategy and hedge effectiveness at the inception of and during the term of each hedge. Our interest rate risk management strategy is intended to stabilize cash flow requirements by maintaining interest rate swap agreements to convert certain variable-rate debt to a fixed rate.
Impact of Recent Accounting Pronouncements
For information on the impact of recent accounting pronouncements on our business, see the captions Recently Adopted Accounting Standards and Other Recently Issued Accounting Standards in Note 2, “Summary of Significant Accounting Policies” of the Notes to the Consolidated Financial Statements included in Item 8. “Financial Statements and Supplementary Data” of this Form 10-K.
We are exposed to interest rate risk arising from changes in interest rates on the floating-rate indebtedness under our unsecured credit facilities and certain mortgages. Borrowings pursuant to our unsecured credit facilities and floating-rate mortgages bear interest at floating rates based on LIBOR plus the applicable margin. Accordingly, fluctuations in market interest rates may increase or decrease our interest expense which will in turn, increase or decrease our net income and cash flow.
We manage a portion of our interest rate risk by entering into interest rate swap agreements. Our interest rate risk management strategy is intended to stabilize cash flow requirements by maintaining interest rate swap agreements to convert certain variable-rate debt to a fixed rate. As of December 31, 2017, we had 29 interest rate swap agreements outstanding, with an aggregate notional amount of $795.2 million. Under these agreements, we receive monthly payments from the counterparties equal to the related variable interest rates multiplied by the outstanding notional amounts. In turn, we pay the counterparties each month an amount equal to a fixed interest rate multiplied by the related outstanding notional amounts. The intended net impact of these transactions is that we pay a fixed interest rate on our variable-rate borrowings. The interest rate swaps have been designated by us as effective cash flow hedges for accounting purposes and are reported at fair value. We assess, both at inception and on an ongoing basis, the effectiveness of our qualifying cash flow hedges. We have not entered, and do not intend to enter, into derivative or interest rate transactions for speculative purposes.
67
The following table summarizes the terms of the current swap agreements relating to our unsecured credit facilities. Several of the interest rate swap agreements set forth in the table below were entered into in conjunction with previous secured and unsecured borrowings that were retired and the swaps have since been reapplied in support of the current unsecured credit facilities.
|
(in thousands, except interest rates) |
|
|
|
|
|
|
|
|
|
|
|
|
|
|
|
|
|
|
|
|
|
|
|
|
|
|
|
|
|
|
|
|
|
|
|
Counterparty |
|
Maturity Date |
|
Fixed Rate |
|
|
Variable Rate Index |
|
Notional Amount |
|
|
Fair Value |
|
|||
|
Bank of America, N.A. |
|
November 2023 |
|
|
2.80 |
% |
|
LIBOR 1 month |
|
$ |
25,000 |
|
|
$ |
(863 |
) |
|
Bank of Montreal |
|
July 2024 |
|
|
1.16 |
% |
|
LIBOR 1 month |
|
|
40,000 |
|
|
|
2,503 |
|
|
Bank of Montreal |
|
January 2025 |
|
|
1.91 |
% |
|
LIBOR 1 month |
|
|
25,000 |
|
|
|
464 |
|
|
Bank of Montreal |
|
July 2025 |
|
|
2.32 |
% |
|
LIBOR 1 month |
|
|
25,000 |
|
|
|
(194 |
) |
|
Bank of Montreal |
|
January 2026 |
|
|
1.92 |
% |
|
LIBOR 1 month |
|
|
25,000 |
|
|
|
561 |
|
|
Bank of Montreal |
|
January 2026 |
|
|
2.05 |
% |
|
LIBOR 1 month |
|
|
40,000 |
|
|
|
520 |
|
|
Bank of Montreal |
|
December 2026 |
|
|
2.33 |
% |
|
LIBOR 1 month |
|
|
10,000 |
|
|
|
(63 |
) |
|
Bank of Montreal |
|
December 2027 |
|
|
2.37 |
% |
|
LIBOR 1 month |
|
|
25,000 |
|
|
|
(192 |
) |
|
Capital One, N.A. |
|
December 2021 |
|
|
1.05 |
% |
|
LIBOR 1 month |
|
|
15,000 |
|
|
|
607 |
|
|
Capital One, N.A. |
|
December 2024 |
|
|
1.58 |
% |
|
LIBOR 1 month |
|
|
15,000 |
|
|
|
603 |
|
|
Capital One, N.A. |
|
January 2026 |
|
|
2.08 |
% |
|
LIBOR 1 month |
|
|
35,000 |
|
|
|
399 |
|
|
Capital One, N.A. |
|
July 2026 |
|
|
1.32 |
% |
|
LIBOR 1 month |
|
|
35,000 |
|
|
|
2,565 |
|
|
Capital One, N.A. |
|
December 2027 |
|
|
2.37 |
% |
|
LIBOR 1 month |
|
|
25,000 |
|
|
|
(189 |
) |
|
M&T Bank |
|
August 2021 |
|
|
1.02 |
% |
|
LIBOR 1 month |
|
|
5,183 |
|
|
|
182 |
|
|
M&T Bank |
|
September 2022 |
|
|
2.83 |
% |
|
LIBOR 1 month |
|
|
25,000 |
|
|
|
(810 |
) |
|
M&T Bank |
|
November 2023 |
|
|
2.65 |
% |
|
LIBOR 1 month |
|
|
25,000 |
|
|
|
(686 |
) |
|
Regions Bank |
|
March 2018 |
|
|
1.77 |
% |
|
LIBOR 1 month |
|
|
25,000 |
|
|
|
(9 |
) |
|
Regions Bank |
|
March 2019 |
|
|
1.91 |
% |
|
LIBOR 3 month |
|
|
25,000 |
|
|
|
2 |
|
|
Regions Bank |
|
May 2020 |
|
|
2.12 |
% |
|
LIBOR 1 month |
|
|
50,000 |
|
|
|
(153 |
) |
|
Regions Bank |
|
March 2022 |
|
|
2.43 |
% |
|
LIBOR 3 month |
|
|
25,000 |
|
|
|
(254 |
) |
|
Regions Bank |
|
December 2023 |
|
|
1.18 |
% |
|
LIBOR 1 month |
|
|
25,000 |
|
|
|
1,402 |
|
|
SunTrust Bank |
|
April 2024 |
|
|
1.99 |
% |
|
LIBOR 1 month |
|
|
25,000 |
|
|
|
261 |
|
|
SunTrust Bank |
|
April 2025 |
|
|
2.20 |
% |
|
LIBOR 1 month |
|
|
25,000 |
|
|
|
— |
|
|
SunTrust Bank |
|
July 2025 |
|
|
1.99 |
% |
|
LIBOR 1 month |
|
|
25,000 |
|
|
|
386 |
|
|
SunTrust Bank |
|
December 2025 |
|
|
2.30 |
% |
|
LIBOR 1 month |
|
|
25,000 |
|
|
|
(138 |
) |
|
SunTrust Bank |
|
January 2026 |
|
|
1.93 |
% |
|
LIBOR 1 month |
|
|
25,000 |
|
|
|
553 |
|
|
Wells Fargo Bank, N.A. |
|
February 2021 |
|
|
2.39 |
% |
|
LIBOR 1 month |
|
|
35,000 |
|
|
|
(369 |
) |
|
Wells Fargo Bank, N.A. |
|
October 2024 |
|
|
2.72 |
% |
|
LIBOR 1 month |
|
|
15,000 |
|
|
|
(510 |
) |
|
Wells Fargo Bank, N.A. |
|
January 2028 |
|
|
2.37 |
% |
|
LIBOR 1 month |
|
|
75,000 |
|
|
|
(590 |
) |
|
|
|
|
|
|
|
|
|
|
|
$ |
795,183 |
|
|
$ |
5,988 |
|
With the exception of our interest rate swap transactions, we have not engaged in transactions in derivative financial instruments or derivative commodity instruments.
As of December 31, 2017, our financial instruments were not exposed to significant market risk due to foreign currency exchange risk.
68
Contents
|
|
70 |
|
|
|
|
|
|
|
72 |
|
|
|
|
|
|
|
73 |
|
|
|
|
|
|
|
74 |
|
|
|
|
|
|
|
75 |
|
|
|
|
|
|
|
76 |
|
|
|
|
|
|
Schedule III – Real Estate Assets and Accumulated Depreciation |
|
110 |
69
REPORT OF INDEPENDENT REGISTERED PUBLIC ACCOUNTING FIRM
To the stockholders and the Board of Directors of Broadstone Net Lease, Inc.
Opinion on the Financial Statements
We have audited the accompanying consolidated balance sheets of Broadstone Net Lease, Inc. and subsidiaries (the "Company") as of December 31, 2017 and 2016, the related consolidated statements of income and comprehensive income, stockholders' equity, and cash flows for each of the two years ended December 31, 2017, and the related notes and the schedule listed in the Index at Item 15 (collectively referred to as the “financial statements”). In our opinion, the financial statements present fairly, in all material respects, the financial position of the Company as of December 31, 2017 and 2016, and the results of its operations and its cash flows for each of the two years ended December 31, 2017, in conformity with accounting principles generally accepted in the United States of America.
Basis for Opinion
These financial statements are the responsibility of the Company's management. Our responsibility is to express an opinion on the Company’s financial statements based on our audits. We are a public accounting firm registered with the Public Company Accounting Oversight Board (United States) (PCAOB) and are required to be independent with respect to the Company in accordance with the U.S. federal securities laws and the applicable rules and regulations of the Securities and Exchange Commission and the PCAOB.
We conducted our audits in accordance with the standards of the PCAOB. Those standards require that we plan and perform the audit to obtain reasonable assurance about whether the financial statements are free of material misstatement, whether due to error or fraud. The Company is not required to have, nor were we engaged to perform, an audit of its internal control over financial reporting. As part of our audits, we are required to obtain an understanding of internal control over financial reporting, but not for the purpose of expressing an opinion on the effectiveness of the Company’s internal control over financial reporting. Accordingly, we express no such opinion.
Our audits included performing procedures to assess the risks of material misstatement of the financial statements, whether due to error or fraud, and performing procedures that respond to those risks. Such procedures include examining, on a test basis, evidence supporting the amounts and disclosures in the financial statements. Our audits also included evaluating the accounting principles used and significant estimates made by management, as well as evaluating the overall presentation of the financial statements. We believe that our audits provide a reasonable basis for our opinion.
/s/ Deloitte and Touche LLP
McLean, Virginia
March 15, 2018
We have served as the Company’s auditor since 2016.
70
Report of Independent Registered Public Accounting Firm
The Board of Directors and Stockholders of Broadstone Net Lease, Inc. and Subsidiaries
We have audited the accompanying consolidated statements of income and comprehensive income, stockholders’ equity and cash flows of Broadstone Net Lease, Inc. and Subsidiaries for the year ended December 31, 2015. Our audit also included the information for the year ended December 31, 2015 contained in the financial statement schedule listed in the Index at Item 15. These financial statements and schedule are the responsibility of the Company’s management. Our responsibility is to express an opinion on these financial statements and schedule based on our audit.
We conducted our audit in accordance with the standards of the Public Company Accounting Oversight Board (United States). Those standards require that we plan and perform the audit to obtain reasonable assurance about whether the financial statements are free of material misstatement. We were not engaged to perform an audit of the Company’s internal control over financial reporting. Our audit included consideration of internal control over financial reporting as a basis for designing audit procedures that are appropriate in the circumstances, but not for the purpose of expressing an opinion on the effectiveness of the Company’s internal control over financial reporting. Accordingly, we express no such opinion. An audit also includes examining, on a test basis, evidence supporting the amounts and disclosures in the financial statements, assessing the accounting principles used and significant estimates made by management, and evaluating the overall financial statement presentation. We believe that our audit provides a reasonable basis for our opinion.
In our opinion, the financial statements referred to above present fairly, in all material respects, the consolidated changes in stockholders’ equity, results of operations and cash flows of Broadstone Net Lease, Inc. and Subsidiaries for the year ended December 31, 2015, in conformity with U.S. generally accepted accounting principles. Also, in our opinion, the information contained in the related financial statement schedule for the year ended December 31, 2015, when considered in relation to the basic financial statements taken as a whole, presents fairly in all material respects the information set forth therein.
/s/ Ernst & Young LLP
Rochester, New York
April 24, 2017
71
Broadstone Net Lease, Inc. and Subsidiaries
(in thousands, except per share amounts)
|
|
|
December 31, |
|
|||||
|
|
|
2017 |
|
|
2016 |
|
||
|
Assets |
|
|
|
|
|
|
|
|
|
Accounted for using the operating method, net of accumulated depreciation |
|
$ |
2,186,141 |
|
|
$ |
1,637,700 |
|
|
Accounted for using the direct financing method |
|
|
41,617 |
|
|
|
47,271 |
|
|
Investment in rental property, net |
|
|
2,227,758 |
|
|
|
1,684,971 |
|
|
Cash and cash equivalents |
|
|
9,355 |
|
|
|
21,635 |
|
|
Restricted cash |
|
|
744 |
|
|
|
1,468 |
|
|
Accrued rental income |
|
|
52,018 |
|
|
|
36,577 |
|
|
Tenant and other receivables, net |
|
|
897 |
|
|
|
355 |
|
|
Tenant and capital reserves |
|
|
943 |
|
|
|
767 |
|
|
Prepaid expenses and other assets |
|
|
267 |
|
|
|
260 |
|
|
Notes receivable |
|
|
6,527 |
|
|
|
6,527 |
|
|
Investment in related party |
|
|
10,000 |
|
|
|
10,000 |
|
|
Interest rate swap, assets |
|
|
11,008 |
|
|
|
9,598 |
|
|
Intangible lease assets, net |
|
|
242,659 |
|
|
|
168,121 |
|
|
Debt issuance costs – unsecured revolver, net |
|
|
3,026 |
|
|
|
446 |
|
|
Leasing fees, net |
|
|
13,554 |
|
|
|
11,329 |
|
|
Total assets |
|
$ |
2,578,756 |
|
|
$ |
1,952,054 |
|
|
Liabilities and equity |
|
|
|
|
|
|
|
|
|
Unsecured revolver |
|
$ |
273,000 |
|
|
$ |
102,000 |
|
|
Mortgages and notes payable, net |
|
|
67,832 |
|
|
|
106,686 |
|
|
Unsecured term notes, net |
|
|
836,912 |
|
|
|
657,891 |
|
|
Interest rate swap, liabilities |
|
|
5,020 |
|
|
|
10,217 |
|
|
Accounts payable and other liabilities |
|
|
20,345 |
|
|
|
17,396 |
|
|
Due to related parties |
|
|
722 |
|
|
|
364 |
|
|
Tenant improvement allowances |
|
|
5,669 |
|
|
|
9,490 |
|
|
Accrued interest payable |
|
|
3,311 |
|
|
|
1,602 |
|
|
Intangible lease liabilities, net |
|
|
81,744 |
|
|
|
47,871 |
|
|
Total liabilities |
|
|
1,294,555 |
|
|
|
953,517 |
|
|
Commitments and contingencies (See Note 18) |
|
|
|
|
|
|
|
|
|
Equity |
|
|
|
|
|
|
|
|
|
Broadstone Net Lease, Inc. stockholders' equity: |
|
|
|
|
|
|
|
|
|
Preferred stock, $0.001 par value; 20,000 shares authorized, no shares issued or outstanding |
|
|
— |
|
|
|
— |
|
|
Common stock, $0.001 par value; 80,000 shares authorized, 18,909 and 15,158 shares issued and outstanding at December 31, 2017 and December 31, 2016, respectively |
|
|
19 |
|
|
|
15 |
|
|
Additional paid-in capital |
|
|
1,301,979 |
|
|
|
1,009,431 |
|
|
Subscriptions receivable |
|
|
(15 |
) |
|
|
(9,790 |
) |
|
Cumulative distributions in excess of retained earnings |
|
|
(120,280 |
) |
|
|
(89,960 |
) |
|
Accumulated other comprehensive income |
|
|
5,122 |
|
|
|
2,092 |
|
|
Total Broadstone Net Lease, Inc. stockholders’ equity |
|
|
1,186,825 |
|
|
|
911,788 |
|
|
Non-controlling interests |
|
|
97,376 |
|
|
|
86,749 |
|
|
Total equity |
|
|
1,284,201 |
|
|
|
998,537 |
|
|
Total liabilities and equity |
|
$ |
2,578,756 |
|
|
$ |
1,952,054 |
|
The accompanying notes are an integral part of these consolidated financial statements.
72
Broadstone Net Lease, Inc. and Subsidiaries
Consolidated Statements of Income and Comprehensive Income
(in thousands, except per share amounts)
|
|
|
For the years ended December 31, |
|
|||||||||
|
|
|
2017 |
|
|
2016 |
|
|
2015 |
|
|||
|
Revenues |
|
|
|
|
|
|
|
|
|
|
|
|
|
Rental income from operating leases |
|
$ |
170,493 |
|
|
$ |
133,943 |
|
|
$ |
89,875 |
|
|
Earned income from direct financing leases |
|
|
4,141 |
|
|
|
4,544 |
|
|
|
4,075 |
|
|
Operating expenses reimbursed from tenants |
|
|
6,721 |
|
|
|
4,173 |
|
|
|
3,538 |
|
|
Other income from real estate transactions |
|
|
208 |
|
|
|
209 |
|
|
|
598 |
|
|
Total revenues |
|
|
181,563 |
|
|
|
142,869 |
|
|
|
98,086 |
|
|
Operating expenses |
|
|
|
|
|
|
|
|
|
|
|
|
|
Depreciation and amortization |
|
|
62,263 |
|
|
|
46,321 |
|
|
|
29,387 |
|
|
Asset management fees |
|
|
14,754 |
|
|
|
10,955 |
|
|
|
7,042 |
|
|
Property management fees |
|
|
4,988 |
|
|
|
3,939 |
|
|
|
2,697 |
|
|
Acquisition expenses |
|
|
— |
|
|
|
10,880 |
|
|
|
9,947 |
|
|
Property and operating expense |
|
|
6,505 |
|
|
|
3,900 |
|
|
|
3,384 |
|
|
General and administrative |
|
|
4,939 |
|
|
|
2,790 |
|
|
|
3,116 |
|
|
State and franchise tax |
|
|
624 |
|
|
|
446 |
|
|
|
130 |
|
|
Provision for impairment of investment in rental properties |
|
|
2,608 |
|
|
|
— |
|
|
|
— |
|
|
Total operating expenses |
|
|
96,681 |
|
|
|
79,231 |
|
|
|
55,703 |
|
|
Operating income |
|
|
84,882 |
|
|
|
63,638 |
|
|
|
42,383 |
|
|
Other income (expenses) |
|
|
|
|
|
|
|
|
|
|
|
|
|
Preferred distribution income |
|
|
737 |
|
|
|
713 |
|
|
|
350 |
|
|
Interest income |
|
|
467 |
|
|
|
88 |
|
|
|
— |
|
|
Interest expense |
|
|
(34,751 |
) |
|
|
(29,963 |
) |
|
|
(22,605 |
) |
|
(Cost) gain of debt extinguishment |
|
|
(5,151 |
) |
|
|
(133 |
) |
|
|
1,213 |
|
|
Gain (loss) on sale of real estate |
|
|
12,992 |
|
|
|
5,925 |
|
|
|
(713 |
) |
|
Other gains |
|
|
379 |
|
|
|
— |
|
|
|
262 |
|
|
Net income |
|
|
59,555 |
|
|
|
40,268 |
|
|
|
20,890 |
|
|
Net income attributable to non-controlling interests |
|
|
(4,756 |
) |
|
|
(3,914 |
) |
|
|
(1,603 |
) |
|
Net income attributable to Broadstone Net Lease, Inc. |
|
$ |
54,799 |
|
|
$ |
36,354 |
|
|
$ |
19,287 |
|
|
Weighted average number of common shares outstanding |
|
|
|
|
|
|
|
|
|
|
|
|
|
Basic |
|
|
17,084 |
|
|
|
13,178 |
|
|
|
8,989 |
|
|
Diluted |
|
|
18,567 |
|
|
|
14,597 |
|
|
|
9,736 |
|
|
Net Earnings per common share |
|
|
|
|
|
|
|
|
|
|
|
|
|
Basic and diluted |
|
$ |
3.21 |
|
|
$ |
2.76 |
|
|
$ |
2.15 |
|
|
Comprehensive income |
|
|
|
|
|
|
|
|
|
|
|
|
|
Net income |
|
$ |
59,555 |
|
|
$ |
40,268 |
|
|
$ |
20,890 |
|
|
Other comprehensive income |
|
|
|
|
|
|
|
|
|
|
|
|
|
Change in fair value of interest rate swaps |
|
|
4,166 |
|
|
|
13,771 |
|
|
|
(3,362 |
) |
|
Realized loss on interest rate swaps |
|
|
(873 |
) |
|
|
— |
|
|
|
— |
|
|
Comprehensive income |
|
|
62,848 |
|
|
|
54,039 |
|
|
|
17,528 |
|
|
Comprehensive income attributable to non-controlling interests |
|
|
(5,019 |
) |
|
|
(5,253 |
) |
|
|
(1,345 |
) |
|
Comprehensive income attributable to Broadstone Net Lease, Inc. |
|
$ |
57,829 |
|
|
$ |
48,786 |
|
|
$ |
16,183 |
|
The accompanying notes are an integral part of these consolidated financial statements.
73
Broadstone Net Lease, Inc. and Subsidiaries
Consolidated Statements of Stockholders’ Equity
(in thousands, except per share amounts)
|
|
|
Common Stock |
|
|
Additional Paid-in Capital |
|
|
Subscriptions Receivable |
|
|
Cumulative Distributions in Excess of Retained Earnings |
|
|
Accumulated Other Comprehensive (Loss)/Income |
|
|
Non- controlling Interests |
|
|
Total |
|
|||||||
|
Balance, January 1, 2015 |
|
$ |
7 |
|
|
$ |
408,542 |
|
|
$ |
(907 |
) |
|
$ |
(34,347 |
) |
|
$ |
(7,236 |
) |
|
$ |
28,122 |
|
|
$ |
394,181 |
|
|
Net income |
|
|
— |
|
|
|
— |
|
|
|
— |
|
|
|
19,287 |
|
|
|
— |
|
|
|
1,603 |
|
|
|
20,890 |
|
|
Issuance of 4,535 shares of common stock |
|
|
4 |
|
|
|
330,390 |
|
|
|
(599 |
) |
|
|
— |
|
|
|
— |
|
|
|
— |
|
|
|
329,795 |
|
|
Other offering costs |
|
|
— |
|
|
|
(1,796 |
) |
|
|
— |
|
|
|
— |
|
|
|
— |
|
|
|
— |
|
|
|
(1,796 |
) |
|
Issuance of 793 membership units |
|
|
— |
|
|
|
— |
|
|
|
— |
|
|
|
— |
|
|
|
— |
|
|
|
57,583 |
|
|
|
57,583 |
|
|
Distributions declared ($0.390 per share January 2015, $0.405 per share February through December 2015) |
|
|
— |
|
|
|
— |
|
|
|
— |
|
|
|
(41,851 |
) |
|
|
— |
|
|
|
(3,420 |
) |
|
|
(45,271 |
) |
|
Change in fair value of interest rate swap agreements |
|
|
— |
|
|
|
— |
|
|
|
— |
|
|
|
— |
|
|
|
(3,104 |
) |
|
|
(258 |
) |
|
|
(3,362 |
) |
|
Redemption of 43 shares of common stock |
|
|
— |
|
|
|
(3,054 |
) |
|
|
— |
|
|
|
— |
|
|
|
— |
|
|
|
— |
|
|
|
(3,054 |
) |
|
Cancellation of 14 shares of common stock |
|
|
— |
|
|
|
(1,021 |
) |
|
|
— |
|
|
|
— |
|
|
|
— |
|
|
|
— |
|
|
|
(1,021 |
) |
|
Adjustment of non-controlling interests |
|
|
— |
|
|
|
5,848 |
|
|
|
— |
|
|
|
— |
|
|
|
— |
|
|
|
(5,848 |
) |
|
|
— |
|
|
Balance, December 31, 2015 |
|
|
11 |
|
|
|
738,909 |
|
|
|
(1,506 |
) |
|
|
(56,911 |
) |
|
|
(10,340 |
) |
|
|
77,782 |
|
|
|
747,945 |
|
|
Net income |
|
|
— |
|
|
|
— |
|
|
|
— |
|
|
|
36,354 |
|
|
|
— |
|
|
|
3,914 |
|
|
|
40,268 |
|
|
Issuance of 3,784 shares of common stock |
|
|
4 |
|
|
|
284,062 |
|
|
|
(8,284 |
) |
|
|
— |
|
|
|
— |
|
|
|
— |
|
|
|
275,782 |
|
|
Other offering costs |
|
|
— |
|
|
|
(1,310 |
) |
|
|
— |
|
|
|
— |
|
|
|
— |
|
|
|
— |
|
|
|
(1,310 |
) |
|
Issuance of 97 membership units |
|
|
— |
|
|
|
— |
|
|
|
— |
|
|
|
— |
|
|
|
— |
|
|
|
7,190 |
|
|
|
7,190 |
|
|
Distributions declared ($0.405 per share January and February 2016, $0.410 per share March through December 2016) |
|
|
— |
|
|
|
— |
|
|
|
— |
|
|
|
(69,403 |
) |
|
|
— |
|
|
|
(7,552 |
) |
|
|
(76,955 |
) |
|
Change in fair value of interest rate swap agreements |
|
|
— |
|
|
|
— |
|
|
|
— |
|
|
|
— |
|
|
|
12,432 |
|
|
|
1,339 |
|
|
|
13,771 |
|
|
Redemption of 109 shares of common stock |
|
|
— |
|
|
|
(8,154 |
) |
|
|
— |
|
|
|
— |
|
|
|
— |
|
|
|
— |
|
|
|
(8,154 |
) |
|
Adjustment of non-controlling interests |
|
|
— |
|
|
|
(4,076 |
) |
|
|
— |
|
|
|
— |
|
|
|
— |
|
|
|
4,076 |
|
|
|
— |
|
|
Balance, December 31, 2016 |
|
|
15 |
|
|
|
1,009,431 |
|
|
|
(9,790 |
) |
|
|
(89,960 |
) |
|
|
2,092 |
|
|
|
86,749 |
|
|
|
998,537 |
|
|
Net income |
|
|
— |
|
|
|
— |
|
|
|
— |
|
|
|
54,799 |
|
|
|
— |
|
|
|
4,756 |
|
|
|
59,555 |
|
|
Issuance of 3,833 shares of common stock |
|
|
4 |
|
|
|
303,711 |
|
|
|
9,775 |
|
|
|
— |
|
|
|
— |
|
|
|
— |
|
|
|
313,490 |
|
|
Other offering costs |
|
|
— |
|
|
|
(1,380 |
) |
|
|
— |
|
|
|
— |
|
|
|
— |
|
|
|
— |
|
|
|
(1,380 |
) |
|
Issuance of 161 membership units |
|
|
— |
|
|
|
— |
|
|
|
— |
|
|
|
— |
|
|
|
— |
|
|
|
12,913 |
|
|
|
12,913 |
|
|
Distributions declared ($0.410 per share January 2017, $0.415 per share February through December 2017) |
|
|
— |
|
|
|
— |
|
|
|
— |
|
|
|
(85,119 |
) |
|
|
— |
|
|
|
(7,649 |
) |
|
|
(92,768 |
) |
|
Change in fair value of interest rate swap agreements |
|
|
— |
|
|
|
— |
|
|
|
— |
|
|
|
— |
|
|
|
3,834 |
|
|
|
332 |
|
|
|
4,166 |
|
|
Realized loss on interest rate swap agreements |
|
|
— |
|
|
|
— |
|
|
|
— |
|
|
|
— |
|
|
|
(804 |
) |
|
|
(69 |
) |
|
|
(873 |
) |
|
Conversion of 37 membership units to 37 shares of common stock |
|
|
— |
|
|
|
2,986 |
|
|
|
— |
|
|
|
— |
|
|
|
— |
|
|
|
(2,986 |
) |
|
|
— |
|
|
Redemption of 119 shares of common stock |
|
|
— |
|
|
|
(9,439 |
) |
|
|
— |
|
|
|
— |
|
|
|
— |
|
|
|
— |
|
|
|
(9,439 |
) |
|
Adjustment of non-controlling interests |
|
|
— |
|
|
|
(3,330 |
) |
|
|
— |
|
|
|
— |
|
|
|
— |
|
|
|
3,330 |
|
|
|
— |
|
|
Balance, December 31, 2017 |
|
$ |
19 |
|
|
$ |
1,301,979 |
|
|
$ |
(15 |
) |
|
$ |
(120,280 |
) |
|
$ |
5,122 |
|
|
$ |
97,376 |
|
|
$ |
1,284,201 |
|
The accompanying notes to the consolidated financial statements are an integral part of these consolidated statements.
74
Broadstone Net Lease, Inc. and Subsidiaries
Consolidated Statements of Cash Flows
(in thousands)
|
|
|
For the years ended December 31, |
|
|||||||||
|
|
|
2017 |
|
|
2016 |
|
|
2015 |
|
|||
|
Operating activities |
|
|
|
|
|
|
|
|
|
|
|
|
|
Net income |
|
$ |
59,555 |
|
|
$ |
40,268 |
|
|
$ |
20,890 |
|
|
Adjustments to reconcile net income including non-controlling interest to net cash provided by operating activities: |
|
|
|
|
|
|
|
|
|
|
|
|
|
Depreciation and amortization including intangibles associated with investment in rental property |
|
|
62,759 |
|
|
|
45,839 |
|
|
|
28,819 |
|
|
Provision for impairment of investment in rental properties |
|
|
2,608 |
|
|
|
— |
|
|
|
— |
|
|
Amortization of debt issuance costs charged to interest expense |
|
|
1,893 |
|
|
|
1,626 |
|
|
|
1,181 |
|
|
Straight-line rent and financing lease adjustments |
|
|
(17,132 |
) |
|
|
(13,847 |
) |
|
|
(7,593 |
) |
|
Cost (gain) of debt extinguishment |
|
|
5,151 |
|
|
|
81 |
|
|
|
(1,213 |
) |
|
(Gain) loss on sale of real estate |
|
|
(12,992 |
) |
|
|
(5,925 |
) |
|
|
713 |
|
|
Settlement of interest rate swap, liability |
|
|
(1,965 |
) |
|
|
— |
|
|
|
— |
|
|
Leasing fees paid |
|
|
(3,339 |
) |
|
|
(2,932 |
) |
|
|
(4,411 |
) |
|
Other non-cash items |
|
|
(1,258 |
) |
|
|
405 |
|
|
|
35 |
|
|
Changes in assets and liabilities: |
|
|
|
|
|
|
|
|
|
|
|
|
|
Tenant and other receivables |
|
|
(542 |
) |
|
|
214 |
|
|
|
(1,280 |
) |
|
Prepaid expenses and other assets |
|
|
(8 |
) |
|
|
212 |
|
|
|
88 |
|
|
Accounts payable and other liabilities |
|
|
1,501 |
|
|
|
1,060 |
|
|
|
887 |
|
|
Accrued interest payable |
|
|
1,709 |
|
|
|
188 |
|
|
|
500 |
|
|
Net cash provided by operating activities |
|
|
97,940 |
|
|
|
67,189 |
|
|
|
38,616 |
|
|
Investing activities |
|
|
|
|
|
|
|
|
|
|
|
|
|
Acquisition of rental property accounted for using the operating method, net of mortgage assumed of $5,205 in 2017 and $0 in 2016 and 2015 |
|
|
(657,286 |
) |
|
|
(500,061 |
) |
|
|
(484,657 |
) |
|
Related party acquisition of rental property accounted for using the operating method, net of mortgage assumed of $6,721 in 2017 and $0 in 2016 and 2015 |
|
|
(7,531 |
) |
|
|
— |
|
|
|
— |
|
|
Acquisition of rental property accounted for using the direct financing method |
|
|
(3,546 |
) |
|
|
(544 |
) |
|
|
(7,189 |
) |
|
Capital expenditures and improvements |
|
|
(6,606 |
) |
|
|
(1,938 |
) |
|
|
(10,560 |
) |
|
Issuance of notes receivable |
|
|
— |
|
|
|
(2,827 |
) |
|
|
— |
|
|
Proceeds from disposition of rental property, net |
|
|
63,310 |
|
|
|
34,890 |
|
|
|
17,962 |
|
|
Increase in tenant and capital reserves |
|
|
(176 |
) |
|
|
(93 |
) |
|
|
(175 |
) |
|
Decrease (Increase) in restricted cash |
|
|
724 |
|
|
|
(1,381 |
) |
|
|
4,150 |
|
|
Net cash used in investing activities |
|
|
(611,111 |
) |
|
|
(471,954 |
) |
|
|
(480,469 |
) |
|
Financing activities |
|
|
|
|
|
|
|
|
|
|
|
|
|
Proceeds from issuance of common stock, net |
|
|
272,827 |
|
|
|
246,453 |
|
|
|
299,657 |
|
|
Redemptions of common stock |
|
|
(9,439 |
) |
|
|
(8,154 |
) |
|
|
(3,054 |
) |
|
Borrowings on mortgages, notes payable and unsecured term notes, net of mortgages assumed of $11,926 in 2017 and $0 in 2016 and 2015 |
|
|
515,000 |
|
|
|
114,000 |
|
|
|
280,000 |
|
|
Principal payments on mortgages, notes payable and unsecured term notes |
|
|
(386,080 |
) |
|
|
(11,387 |
) |
|
|
(5,712 |
) |
|
Borrowings on unsecured revolver |
|
|
494,000 |
|
|
|
308,500 |
|
|
|
332,000 |
|
|
Repayments on unsecured revolver |
|
|
(323,000 |
) |
|
|
(206,500 |
) |
|
|
(408,500 |
) |
|
Cash distributions paid to stockholders |
|
|
(44,540 |
) |
|
|
(35,731 |
) |
|
|
(23,805 |
) |
|
Cash distributions paid to non-controlling interests |
|
|
(7,574 |
) |
|
|
(6,967 |
) |
|
|
(3,421 |
) |
|
Debt issuance and extinguishment costs paid |
|
|
(10,303 |
) |
|
|
(864 |
) |
|
|
(2,390 |
) |
|
Net cash provided by financing activities |
|
|
500,891 |
|
|
|
399,350 |
|
|
|
464,775 |
|
|
Net (decrease) increase in cash and cash equivalents |
|
|
(12,280 |
) |
|
|
(5,415 |
) |
|
|
22,922 |
|
|
Cash and cash equivalents at beginning of year |
|
|
21,635 |
|
|
|
27,050 |
|
|
|
4,128 |
|
|
Cash and cash equivalents at end of year |
|
$ |
9,355 |
|
|
$ |
21,635 |
|
|
$ |
27,050 |
|
The accompanying notes are an integral part of these consolidated financial statements.
75
Broadstone Net Lease, Inc. and Subsidiaries
Notes to Consolidated Financial Statements (in thousands)
December 31, 2017, 2016 and 2015
1. Business Description
Broadstone Net Lease, Inc. (the “Corporation”) is a Maryland corporation formed on October 18, 2007, that elected to be taxed as a real estate investment trust (“REIT”) commencing with the taxable year ended December 31, 2008. The Corporation focuses on investing in income-producing, net leased commercial properties. The Corporation leases properties to retail, healthcare, industrial, office, and other commercial businesses under long-term lease agreements. Properties are generally leased on a triple-net basis such that tenants pay all operating expenses relating to the property, including, but not limited to, property taxes, insurance, maintenance, repairs, and capital costs, during the lease term. As of December 31, 2017, the Corporation owned a diversified portfolio of 528 individual net leased commercial properties located in 40 states throughout the continental United States.
Broadstone Net Lease, LLC (the “Operating Company”), is the entity through which the Corporation conducts its business and owns (either directly or through subsidiaries) all of the Corporation’s properties. At December 31, 2017, 2016 and 2015, the Corporation owned economic interests of 92.4%, 91.4% and 89.6%, respectively, in the Operating Company. The Corporation is also the sole managing member of the Operating Company, as disclosed in Note 12. The remaining interests in the Operating Company are held by members who acquired their interest by contributing property to the Operating Company in exchange for membership units of the Operating Company. As the Corporation conducts substantially all of its operations through the Operating Company, it is structured as what is referred to as an Umbrella Partnership Real Estate Investment Trust (“UPREIT”).
The Corporation operates under the direction of its board of directors (the “Board of Directors”), which is responsible for the management and control of the Company’s affairs. The Corporation is externally managed and its board of directors has retained the Corporation’s sponsor, Broadstone Real Estate, LLC (the “Manager”) and Broadstone Asset Management, LLC (the “Asset Manager”) to manage the Corporation’s day-to-day affairs, to implement the Corporation’s investment strategy and to provide certain property management services for the Corporation’s properties, subject to the Board of Directors’ direction, oversight, and approval. The Asset Manager is a wholly-owned subsidiary of the Manager and all of the Corporation’s officers are employees of the Manager. Accordingly, both the Manager and the Asset Manager are related parties of the Corporation. Refer to Note 3 for further discussion over related parties and related party transactions.
2. Summary of Significant Accounting Policies
Principles of Consolidation
The Consolidated Financial Statements include the accounts and operations of the Corporation, the Operating Company and its consolidated subsidiaries, all of which are wholly-owned by the Operating Company (collectively, the “Company”). All intercompany balances and transactions have been eliminated in consolidation.
To the extent the Corporation has a variable interest in entities that are not evaluated under the variable interest entity (“VIE”) model, the Corporation evaluates its interests using the voting interest entity model. The Corporation holds a 92.4% interest in the Operating Company at December 31, 2017, and is the sole managing member of the Operating Company, which gives the Corporation exclusive and complete responsibility for the day-to-day management, authority to make decisions, and control of the Operating Company. Based on consolidation guidance effective for the Corporation as of January 1, 2016, the Corporation concluded that the Operating Company is a VIE as the members in the Operating Company do not possess kick-out rights or substantive participating rights. Accordingly, the Corporation consolidates its interest in the Operating Company. However, as the Corporation holds the majority voting interest in the Operating Company, it qualifies for the exemption from providing certain disclosure requirements associated with investments in VIEs.
The portion of the Operating Company not owned by the Corporation is presented as non-controlling interests as of and during the periods presented.
76
The Consolidated Financial Statements have been prepared in accordance with generally accepted accounting principles in the United States (“GAAP”).
Use of Estimates
The preparation of consolidated financial statements in conformity with GAAP requires management to make certain estimates and assumptions that affect the reported amounts of assets and liabilities and disclosure of contingent assets and liabilities at the date of the Consolidated Financial Statements and the reported amounts of revenues and expenses during the reporting periods. Significant estimates include, but are not limited to the allocation of purchase price between investment in rental property and intangible assets acquired and liabilities assumed, the value of long-lived assets, the provision for impairment, the depreciable lives of rental property, the amortizable lives of intangible assets and liabilities, the allowance for doubtful accounts, the fair value of assumed debt and notes payables, the fair value of the Company’s interest rate swap agreements and the determination of any uncertain tax positions. Accordingly, actual results may differ from those estimates.
Investment in Rental Property
Rental property accounted for under operating leases is recorded at cost. Rental property accounted for under direct financing leases is recorded at its net investment (which at the inception of the lease generally represents the cost of the property).
The Company early adopted Financial Accounting Standards Board (“FASB”) Accounting Standards Update (“ASU”) 2017-01, Business Combinations (Topic 805): Clarifying the Definition of a Business (“ASU 2017-01”), on a prospective basis, effective January 1, 2017. The guidance changes the definition of a business to exclude acquisitions where substantially all of the fair value of the assets acquired are concentrated in a single identifiable asset or group of similar identifiable assets, and therefore are accounted for as asset acquisitions instead of business combinations. Refer to Recently Adopted Accounting Standards elsewhere within Note 2. All of the acquisitions closed subsequent to the adoption of this guidance, and therefore during the year ended December 31, 2017, did not meet the definition of a business and accordingly were accounted for as asset acquisitions.
The Company allocates the purchase price of investments in rental property accounted for as an asset acquisition based on the relative fair value of the assets acquired and liabilities assumed. These generally include tangible assets, consisting of land and land improvements, buildings and other improvements, and equipment, and identifiable intangible assets and liabilities, including the value of in-place leases and acquired above-market and below-market leases. Acquisition costs incurred in connection with investments in real estate accounted for as asset acquisitions are capitalized and included with the allocated purchase price. The results of operations of acquired properties are included in the Consolidated Statements of Income and Comprehensive Income from the respective date of acquisition.
The Company allocates the purchase price of investments in rental property accounted for as a business combination based on the estimated fair value at the date of the acquisition of the assets acquired and liabilities assumed. These generally include tangible assets, consisting of land and land improvements, buildings and other improvements, and equipment, and identifiable intangible assets and liabilities, including the value of in-place leases and acquired above-market and below-market leases. Acquisition costs incurred in connection with investments in real estate accounted for as business combinations are expensed at the time of acquisition. The results of operations of acquired properties are included in the Consolidated Statements of Income and Comprehensive Income from the respective date of acquisition.
Estimated fair value determinations are based on management’s judgment, which considers various factors including real estate market conditions, industry conditions that the tenant operates in, and characteristics of the real estate and/or real estate appraisals.
77
The estimated fair value of the tangible assets of an acquired property is determined by valuing the property as if it were vacant. The as-if-vacant value is then allocated to land and land improvements, buildings, and equipment based on comparable sales and other relevant information with respect to the property as estimated by management. Specifically, the “if vacant” value of buildings and equipment is calculated using an income approach. Assumptions used in the income approach to value the buildings include: capitalization and discount rates, lease-up time, market rents, make ready costs, land value, and land improvement value.
The estimated fair value of acquired in-place leases are the costs that the Company would have had to incur to lease the properties to the occupancy level of the properties at the date of acquisition. Such costs include the fair value of leasing commissions and other operating costs that would have been incurred to lease the properties, had they been vacant, to their acquired occupancy level. Acquired in-place leases as of the date of acquisition are amortized over the remaining non-cancellable lease terms of the respective leases to amortization expense.
Acquired above-market and below-market lease values are recorded based on the present value (using an interest rate that reflects the risks associated with the lease acquired) of the differences between the contractual amounts to be paid pursuant to the in-place leases and management’s estimate of fair market value lease rates at the time of acquisition for the corresponding in-place leases. The capitalized above-market and below-market lease values are amortized as adjustments to rental income over the remaining term of the respective leases.
Should a tenant terminate its lease, the unamortized portion of the in-place lease value is charged to amortization expense and the unamortized portion of above-market or below-market lease value is charged to rental income.
Management estimates the fair value of assumed mortgages and notes payable based upon indications of then-current market pricing for similar types of debt with similar maturities. Assumed mortgages and notes payable are initially recorded at their estimated fair value as of the assumption date, and the difference between such estimated fair value and the notes’ outstanding principal balance is amortized to interest expense over the remaining term of the debt.
Expenditures for significant betterments and improvements are capitalized. Maintenance and repairs are charged to expense when incurred. Construction and improvement costs incurred in connection with the development of new properties or the redevelopment of existing properties are capitalized. Real estate taxes, interest costs, and leasing and development costs incurred during construction periods are capitalized. Capitalization is based on qualified expenditures and interest rates. Capitalized real estate taxes, interest costs, and leasing and development costs are amortized over lives which are consistent with the related assets. There were no capitalized interest or real estate taxes during the years ended December 31, 2017, 2016, and 2015.
Long-lived Asset Impairment
The Company reviews long-lived assets to be held and used for possible impairment when events or changes in circumstances indicate that their carrying amounts may not be recoverable. If and when such events or changes in circumstances are present, an impairment exists to the extent the carrying value of the asset or asset group exceeds the sum of the undiscounted cash flows expected to result from the use of the asset or asset group and its eventual disposition. Such cash flows include factors such as expected future operating income, trends and prospects, as well as the effects of demand, competition, and other factors. An impairment loss is measured as the amount by which the carrying amount of the asset or asset group exceeds the fair value of the asset or asset group. A significant judgement is made as to if and when impairment should be taken. If our strategy, or one or more of the assumptions described above were to change in the future, an impairment may need to be recognized.
Inputs used in establishing fair value for impaired real estate assets generally fall within Level 3 of the fair value hierarchy, which are characterized as requiring significant judgment as little or no current market activity may be available for validation. The main indicator used to establish the classification of the inputs is current market condition, as derived through our use of published commercial real estate market information. The Company determines the valuation of impaired assets using generally accepted valuation techniques including discounted cash flow analysis, income capitalization, analysis of recent comparable sales transactions, actual sales negotiations and bona fide purchase offers received from third parties. Management may consider a single valuation technique or multiple valuation techniques, as appropriate, when estimating the fair value of its real estate.
78
During the year ended December 31, 2017, the Company recognized an impairment charge on real estate assets of $2,608 which resulted from non-payment of rental amounts and concerns over the tenant’s future viability. The amount of the impairment charge was based on our consideration of the factors detailed above. In determining the fair value of the assets at the time of measurement, we utilized capitalization rates ranging from 7.25% to 12.00%, and a weighted average discount rate of 8.00%.
The Company has reduced the carrying value of the impaired real estate assets to the estimated fair value at the measurement date of September 30, 2017, as detailed below:
|
|
|
|
|
|||||||||
|
(in thousands) |
|
Carrying Amount |
|
|
Allocation of Impairment |
|
|
Net Carrying Amount |
|
|||
|
Investments in rental property accounted for using the operating method, net of accumulated depreciation |
|
$ |
16,159 |
|
|
$ |
(2,401 |
) |
|
$ |
13,758 |
|
|
Intangible lease assets, net |
|
|
1,263 |
|
|
|
(204 |
) |
|
|
1,059 |
|
|
Leasing fees, net |
|
|
123 |
|
|
|
(16 |
) |
|
|
107 |
|
|
Intangible lease liabilities, net |
|
|
(101 |
) |
|
|
13 |
|
|
|
(88 |
) |
|
|
|
$ |
17,444 |
|
|
$ |
(2,608 |
) |
|
$ |
14,836 |
|
Investment in Related Party
Investment in related party relates to a non-voting, preferred unit investment in the Manager. Income on the Company’s investment is recognized based on the stated preferred rate of return. Such amounts are included as Preferred distribution income in the Consolidated Statements of Income and Comprehensive Income.
Sales of Real Estate
Real estate sales are recognized when all of the following criteria are met: (1) a sale is consummated, (2) the buyer has demonstrated an adequate commitment to pay for the property, (3) the Company’s receivable is not subject to future subordination, and (4) the Company has transferred the risks and rewards of ownership to the buyer and does not have continuing involvement. Unless all conditions are met, recognition of all or a portion of the profit is deferred. The Company accounts for discontinued operations if disposals of properties represent a strategic shift in operations. Those strategic shifts would need to have a major effect on the Company’s operations and financial results in order to meet the definition. For the years ended December 31, 2017, 2016, and 2015, the Company did not have property dispositions that qualified as discontinued operations.
Depreciation
Depreciation is computed using the straight-line method over the estimated useful lives of the related assets, which are as follows:
|
Land improvements |
|
15 years |
|
Buildings and other improvements |
|
39 years |
|
Equipment |
|
7 years |
Cash Equivalents
Cash equivalents consist of highly liquid investments with an original maturity at date of acquisition of three months or less, including money market funds. The Company estimates that the fair value of cash equivalents approximates the carrying value due to the relatively short maturity of these instruments.
79
Restricted cash includes escrow funds the Company maintains pursuant to the terms of certain mortgages and notes payable, and undistributed proceeds from the sale of properties under Section 1031 of the Internal Revenue Code.
Revenue Recognition
At the inception of a new lease arrangement, including new leases that arise from amendments, the Company assesses the terms and conditions to determine the proper lease classification. A lease arrangement is classified as an operating lease if none of the following criteria are met: (i) ownership transfers to the lessee prior to or shortly after the end of the lease term, (ii) lessee has a bargain purchase option during or at the end of the lease term, (iii) the lease term is greater than or equal to 75% of the underlying property’s estimated useful life, or (iv) the present value of the future minimum lease payments (excluding executory costs) is greater than or equal to 90% of the fair value of the leased property. If one or more of these criteria are met, and the minimum lease payments are determined to be reasonably predictable and collectible, the lease arrangement is generally accounted for as a direct financing lease. Consistent with FASB Accounting Standards Codification (“ASC”) ASC 840, Leases, if the fair value of the land component is 25% or more of the total fair value of the leased property, the land is considered separately from the building for purposes of applying the lease term and minimum lease payments criterion in (iii) and (iv) above.
Revenue recognition methods for operating leases and direct financing leases are described below:
Rental property accounted for under operating leases – Revenue is recognized as rents are earned on a straight-line basis over the non-cancelable terms of the related leases. In most cases, revenue recognition under operating leases begins when the lessee takes possession of, or controls, the physical use of the leased asset. Generally, this occurs on the lease commencement date. For leases that have fixed and measurable rent escalations, the difference between such rental income earned and the cash rent due under the provisions of the lease is recorded as Accrued rental income on the Consolidated Balance Sheets.
Rental property accounted for under direct financing leases – The Company utilizes the direct finance method of accounting to record direct financing lease income. For a lease accounted for as a direct financing lease, the net investment in the direct financing lease represents receivables for the sum of future minimum lease payments and the estimated residual value of the leased property, less the unamortized unearned income. Unearned income is deferred and amortized into income over the lease terms so as to produce a constant periodic rate of return on the Company’s net investment in the leases.
Rent Received in Advance, Tenant and Other Receivables and Allowance for Doubtful Accounts
Rent received in advance represents tenant payments received prior to its contractual due date and is included in Accounts payable and other liabilities on the Consolidated Balance Sheets. Rents received in advance were $8,585 and $7,566 at December 31, 2017 and 2016, respectively.
Management periodically reviews the sufficiency of the allowance for doubtful accounts, taking into consideration its historical losses and existing economic conditions, and makes adjustments to the allowance as it considers necessary. Uncollected tenant receivables are written off against the allowance when all possible means of collection have been exhausted. The following table summarizes the changes in the allowance for doubtful accounts:
|
|
|
December 31, |
|
|||||||||
|
(in thousands) |
|
2017 |
|
|
2016 |
|
|
2015 |
|
|||
|
Balance as of January 1 |
|
$ |
323 |
|
|
$ |
262 |
|
|
$ |
631 |
|
|
Provision for doubtful accounts |
|
|
419 |
|
|
|
67 |
|
|
|
647 |
|
|
Write-offs |
|
|
— |
|
|
|
(6 |
) |
|
|
(1,016 |
) |
|
Balance as of December 31 |
|
$ |
742 |
|
|
$ |
323 |
|
|
$ |
262 |
|
Notes Receivable
Balances in notes receivable represent interest-only loans to third parties secured by the real estate assets of the obligors. The Manager performs property management functions for each of the loan holders. Management evaluates the creditworthiness of each borrower prior to entering into loan agreements. Further, management
80
periodically reviews the notes receivable for collectability based on historical experience, continued review of creditworthiness, and other relevant factors. Based on these factors, management considers all notes receivable to be fully collectible at December 31, 2017 and 2016. Therefore, no allowance for doubtful notes receivable has been reflected in the Consolidated Financial Statements. Interest income on the notes receivable is recognized as it is earned in accordance with the applicable loan agreement and is included as a component of Other income (expenses) in the Consolidated Statements of Income and Comprehensive Income.
Tenant and Capital Reserves
The terms of one of the Company’s operating leases requires the establishment of a tenant and capital reserve. Under the tenant reserve requirement, amounts are deposited into an escrow account, to be used to fund certain costs to maintain the rental property. The balance of the tenant reserve was $627 and $480 at December 31, 2017 and 2016, respectively.
Under the capital reserve lease requirement, the tenant is required to pay additional amounts to fund capital improvements, replacements, and repairs made to the property. The balance of the capital reserve was $316 and $287 at December 31, 2017 and 2016, respectively. The Company has no obligation to fund capital improvements beyond these reserve balances.
Debt Issuance Costs
In April 2015, FASB issued Accounting Standards Update (“ASU”) 2015-03, Simplifying the Presentation of Debt Issuance Costs, which requires that debt issuance costs related to a recognized debt liability be presented in the balance sheet as a direct deduction from the carrying amount of the liability, consistent with debt discounts. The Company adopted the guidance in ASU 2015-03 during the year ended December 31, 2016, on a retrospective basis.
Debt issuance costs – Unsecured revolver – Debt issuance costs incurred in connection with the Company’s unsecured revolver have been deferred and are being amortized over the term of the loan commitment using the straight-line method, which approximates the effective interest method. In accordance with ASU 2015-15, Presentation and Subsequent Measurement of Debt Issuance Costs Associated with Line of Credit Arrangements, the Company has recorded debt issuance costs associated with the unsecured revolver as an asset on the Consolidated Balance Sheets. At December 31, 2017 and 2016, the Company had $3,431 and $2,386 of debt issuance costs, net of accumulated amortization of $405 and $1,940, respectively.
Debt issuance costs – Mortgage and notes payable – Debt issuance costs incurred in connection with the Company’s mortgages and notes payable have been deferred and are being amortized over the term of the respective loan commitment using the straight-line method, which approximates the effective interest method, and are recorded in Mortgage and notes payable, net on the Consolidated Balance Sheets. At December 31, 2017 and 2016, the Company had $1,040 and $1,291 of debt issuance costs, net of accumulated amortization of $402 and $453, respectively.
Debt issuance costs – Unsecured term notes – Debt issuance costs incurred in connection with the Company’s unsecured term notes have been deferred and are being amortized over the term of the respective loan commitment using the straight-line method, which approximates the effective interest method, and are recorded in Unsecured term notes, net on the Consolidated Balance Sheets. At December 31, 2017 and 2016, the Company had $4,788 and $3,641 of debt issuance costs, net of accumulated amortization of $1,700 and $1,532, respectively.
Leasing Fees
Leasing fees represent costs incurred to lease properties to tenants and are being amortized using the straight-line method over the term of the lease to which they relate, which range from 9 to 29 years.
Derivative Instruments
The Company uses interest rate swap agreements to manage risks related to interest rate movements. The interest rate swap agreements, designated and qualifying as cash flow hedges, are reported at fair value. The gain or loss on
81
the effective portion of the hedge initially is included as a component of other comprehensive income or loss and is subsequently reclassified into earnings when interest payments on the related debt are incurred and as the swap net settlements occur. If and when there is ineffectiveness realized on a swap agreement, the Company recognizes the ineffectiveness as a component of interest expense in the period incurred. The Company documents its risk management strategy and hedge effectiveness at the inception of and during the term of each hedge. The Company’s interest rate risk management strategy is intended to stabilize cash flow requirements by maintaining interest rate swap agreements to convert certain variable-rate debt to a fixed rate.
Property Loss and Insurance Recoveries
Property losses, whether full or partial, are accounted for using a combination of impairment, insurance, and revenue recognition guidance prescribed by GAAP. Upon incurring a loss event, the Company evaluates for asset impairment under ASC 350, Intangibles – Goodwill and Other, and ASC 360, Property, Plant, and Equipment. Under the terms of the Company’s lease agreements with tenants, a significant majority of which are triple-net whereby the tenants are responsible for insurance, taxes, and maintenance, among other property costs, the tenants are responsible for repairs and maintenance to the properties. The terms of the leases also require the tenants to continue making their monthly rental payments despite the property loss. To the extent that the assets are recoverable, determined utilizing undiscounted cash flows expected to result from the use of the asset or asset group and its eventual disposition, the Company accounts for a full or partial property loss as an acceleration of depreciation and evaluates whether all or a portion of the property loss can be offset by the recognition of insurance recoveries.
Under the terms of the lease agreements with tenants, in the case of full or partial loss to a property, the tenant has an obligation to restore/rebuild the premises as nearly as possible to its value, condition and character immediately prior to such event. To mitigate the risk of loss, the Company requires tenants to maintain general liability insurance policies on the replacement value of the properties. Based on these considerations, the Company follows the guidance in ASC 605-40, Classification of Insurance Recoveries, for the conversion of nonmonetary assets (i.e., the properties) to monetary assets (i.e., insurance recoveries or tenant recoveries). Under ASC 605-40, once probable of receipt, the Company recognizes an insurance/tenant recovery receivable in Tenant and other receivables, net, in the Consolidated Balance Sheets, with a corresponding offset to the accelerated depreciation recognized in the Consolidated Statements of Income and Comprehensive Income. If the insurance/tenant recovery is less than the amount of accelerated depreciation recognized, the Company will recognize a net loss in the Consolidated Statements of Income and Comprehensive Income. If the insurance/tenant recovery is greater than the amount of accelerated depreciation recognized, the Company will only recognize a recovery up to the amount of the accelerated depreciation, and will account for the excess as a gain contingency in accordance with ASC 450-30, Gain Contingencies. Gain contingencies are recognized when earned and realized, which typically will occur at the time of final settlement or when non-refundable cash advances are received.
Non-controlling Interests
Non-controlling interests represents the membership interests held in the Operating Company of 7.6%, 8.6%, and 10.4% at years ended December 31, 2017, 2016, and 2015, respectively, by third parties which are accounted for as a separate component of equity.
The Company periodically adjusts the carrying value of non-controlling interests to reflect their share of the book value of the Operating Company. Such adjustments are recorded to Additional paid-in capital as a reallocation of Non-controlling interests in the Consolidated Statements of Stockholders’ Equity.
82
The subscriptions receivable is related to shares issued to the Corporation’s stockholders for which the proceeds have not yet been received solely due to the fact of timing of transfers from the escrow agent holding the funds. The receivables have been fully collected during the following month after the balance sheet date of the Consolidated Financial Statements. In accordance with the Securities and Exchange Commission (“SEC”) Rule 5-02.30 of Regulation S-X, the Company records its subscriptions receivable as a deduction from Stockholder’s equity in the accompanying Consolidated Balance Sheets.
Segment Reporting
The Company currently operates in a single reportable segment, which includes the acquisition, leasing, and ownership of net leased properties. The Company’s chief operating decision maker, the Company’s executive committee, assesses, measures, and reviews the operating and financial results at the consolidated level for the entire portfolio and, therefore, each property or property type is not considered an individual operating segment. The Company does not evaluate the results of operations based on geography, size, or property type.
Fair Value Measurements
ASC 820, Fair Value Measurements and Disclosures defines fair value as the price that would be received for an asset or paid to transfer a liability (an exit price) in the principal or most advantageous market for the asset or liability in an orderly transaction between market participants on the measurement date. ASC 820 also establishes a three-tier fair value hierarchy, which prioritizes the inputs used in measuring fair value.
The standard describes three levels of inputs that may be used to measure fair value:
Level 1 – Quoted prices that are available in active markets for identical assets or liabilities. The types of financial instruments included in Level 1 are marketable, available-for-sale equity securities that are traded in an active exchange market.
Level 2 – Pricing inputs other than quoted prices in active markets, such as quoted prices for similar assets or liabilities; quoted prices in markets that are not active; or other inputs that are observable or can be corroborated by observable market data for substantially the full term of the assets or liabilities. Instruments included in this category are derivative contracts whose value is determined using a pricing model with inputs (such as yield curves and credit spreads) that are observable in the market or can be derived principally from or corroborated by observable market data.
Level 3 – Unobservable inputs that are supported by little or no market activity and that are significant to the fair value of the assets or liabilities. Level 3 includes assets and liabilities whose values are determined using pricing models, discounted cash flow methodologies, or similar techniques, as well as instruments for which the determination of fair value requires significant management judgment or estimation.
The balances of financial instruments measured at fair value on a recurring basis at December 31, 2017 and 2016 are as follows (see Note 11):
|
|
|
December 31, 2017 |
|
|||||||||||||
|
(in thousands) |
|
Total |
|
|
Level 1 |
|
|
Level 2 |
|
|
Level 3 |
|
||||
|
Interest rate swap, assets |
|
$ |
11,008 |
|
|
$ |
— |
|
|
$ |
11,008 |
|
|
$ |
— |
|
|
Interest rate swap, liabilities |
|
|
(5,020 |
) |
|
|
— |
|
|
|
(5,020 |
) |
|
|
— |
|
|
|
|
$ |
5,988 |
|
|
$ |
— |
|
|
$ |
5,988 |
|
|
$ |
— |
|
|
|
|
December 31, 2016 |
|
|||||||||||||
|
|
|
Total |
|
|
Level 1 |
|
|
Level 2 |
|
|
Level 3 |
|
||||
|
Interest rate swap, assets |
|
$ |
9,598 |
|
|
$ |
— |
|
|
$ |
9,598 |
|
|
$ |
— |
|
|
Interest rate swap, liabilities |
|
|
(10,217 |
) |
|
|
— |
|
|
|
(10,217 |
) |
|
|
— |
|
|
|
|
$ |
(619 |
) |
|
$ |
— |
|
|
$ |
(619 |
) |
|
$ |
— |
|
83
Interest rate swaps are derivative instruments that have no quoted readily available Level 1 inputs, and therefore are measured at fair value using inputs that are directly observable in active markets and are classified within Level 2 of the valuation hierarchy, using an income approach. Specifically, the fair value of the interest rate swaps is determined using a discounted cash flow analysis on the expected future cash flows of each instrument. This analysis utilizes observable market data including yield curves and implied volatilities to determine the market’s expectation of the future cash flows of the variable component. The fixed and variable components of the interest rate swaps are then discounted using calculated discount factors developed based on the London Interbank Offered Rate (“LIBOR”) swap rate and are aggregated to arrive at a single valuation for the period. The Company also incorporates credit valuation adjustments to appropriately reflect both its own nonperformance risk and the respective counterparty’s nonperformance risk in the fair value measurements. Although the Company has determined that the majority of the inputs used to value its interest rate swaps fall within Level 2 of the fair value hierarchy, the credit valuation adjustments associated with its interest rate swaps utilize Level 3 inputs, such as estimates of current credit spreads to evaluate the likelihood of default by itself and its counterparties. At December 31, 2017 and 2016, the Company has assessed the significance of the impact of the credit valuation adjustments on the overall valuation of its derivative positions and has determined that the credit valuation adjustments are not significant to the overall valuation. As a result, the Company has determined that its interest rate swap valuations in their entirety are appropriately classified within Level 2 of the fair value hierarchy.
The Company has estimated that the carrying amount reported on the Consolidated Balance Sheets for Cash and cash equivalents, Restricted cash, Tenant and other receivables, Notes receivable, and Accounts payable and other liabilities approximates their fair values due to their short-term nature.
The fair value of the Company’s debt was estimated using Level 2 and Level 3 inputs based on recent financing transactions, estimates of the fair value of the property that serves as collateral for such debt, historical risk premiums for loans of comparable quality, current LIBOR, US treasury obligation interest rates and on the discounted estimated future cash payments to be made on such debt. The discount rates estimated reflect the Company’s judgment as to the approximate current lending rates for loans or groups of loans with similar maturities and assumes that the debt is outstanding through maturity. Market information, as available, or present value techniques were utilized to estimate the amounts required to be disclosed. Since such amounts are estimates that are based on limited available market information for similar transactions and do not acknowledge transfer or other repayment restrictions that may exist on specific loans, it is unlikely that the estimated fair value of any such debt could be realized by immediate settlement of the obligation. The fair value of the Company’s Mortgage and notes payable, net, Unsecured term notes, net, and Unsecured revolver are estimated to be $1,177,197 and $873,026 at December 31, 2017 and 2016, respectively, as compared to the carrying amount of such debt of $1,181,470 and $869,524 on the Consolidated Balance Sheets at December 31, 2017 and 2016, respectively.
As disclosed under the Long-lived Asset Impairment Charges section of Note 2, the Company’s non-recurring fair value measurements for the year ended December 31, 2017 consisted of the fair value of impaired real estate assets that were determined using Level 3 inputs. The Company did not have any assets measured at fair value on a nonrecurring basis at December 31, 2016.
Income Taxes
The Company has made an election to be taxed as a REIT under Sections 856 through 860 of the Internal Revenue Code of 1986, (as amended, the “Code”), commencing with its taxable year ended December 31, 2008. The Company believes it is organized and operates in such a manner as to qualify for treatment as a REIT and intends to operate in the foreseeable future in such a manner so that it will remain qualified as a REIT for federal income tax purposes. Accordingly, the Company is not subject to federal corporate income tax to the extent its dividends paid equals or exceeds its adjusted taxable income, as defined in the Code.
The Company is subject to state and local income or franchise taxes in certain states in which some of its properties are located and records these taxes as state and franchise tax expense in the accompanying Consolidated Statements of Income and Comprehensive Income when due.
The Company is required to file income tax returns with federal and various state taxing authorities. As of December 31, 2017, the Company’s federal and state income tax returns remain subject to examination by the respective taxing authorities for the 2014 through 2017 tax years.
84
The Company recognizes and measures uncertain tax positions using a two-step approach. The first step is to evaluate the tax position for recognition by determining if the weight of available evidence indicates it is more-likely-than-not that the position will be sustained upon examination, including resolution of related appeals or litigation processes, if any. In making this assessment, the Company must assume that the taxing authority will examine the income tax position and have full knowledge of all relevant information. The second step is to measure the tax benefit as the largest amount that is more than 50% likely of being realized upon ultimate settlement. The Company considers many factors when evaluating and estimating tax positions and tax benefits, which may require periodic adjustments and which may or may not accurately forecast actual outcomes.
The Company has determined that it has no uncertain tax positions as of December 31, 2017 and 2016, or for the years ended December 31, 2017, 2016, and 2015, which include the tax status of the Company.
Interest and penalties related to income taxes are charged to tax expense during the year in which they are incurred.
On December 22, 2017, the U.S. government enacted comprehensive tax legislation commonly referred to as the Tax Cuts and Jobs Act (the “TCJA”). The TCJA makes broad and complex changes to the Code and establishes new tax laws that include, but are not limited to, the following: (i) a reduction of the U.S. federal corporate tax rate; (ii) the elimination of the corporate alternative minimum tax; (iii) a limitation on deductible interest expense in certain circumstances; (iv) limitations on the deductibility of certain executive compensation; and (v) limitations on the use of net operating loss deductions. The changes made to the Code as a result of the TCJA will be applicable to the Company’s tax filings for tax years beginning after December 31, 2017. The Company has performed an analysis relative to the enactment of the TCJA as of December 31, 2017, and has not identified any amounts required to be recorded or disclosed in the financial statements pursuant to ASC 740, Income Taxes. The Company’s analysis of the TCJA may be impacted by new legislation or regulations, or guidance from the Congressional Joint Committee Staff, Treasury, or the Internal Revenue Service.
Taxes Collected From Tenants and Remitted to Governmental Authorities
Substantially all of the Company’s leases are triple-net, which provide that the lessees are responsible for the payment of all property operating expenses, including property taxes, maintenance, and insurance. The Company records such expenses on a net basis. For the years ended December 31, 2017, 2016, and 2015, the Company’s tenants, pursuant to their lease obligations, have made direct payment for property taxes to the taxing authorities of approximately $19,700, $16,200 and $12,000, respectively.
In some situations, the Company may collect property taxes from its tenants and remit those taxes to governmental authorities. Taxes collected from tenants and remitted to governmental authorities are presented on a gross basis, where revenue of $2,877, $2,004 and $1,994 is included in Operating expenses reimbursed from tenants and expense of $2,899, $1,933 and $1,987 is included in Property and operating expenses in the accompanying Consolidated Statements of Income and Comprehensive Income for the years ended December 31, 2017, 2016, and 2015, respectively.
Recently Adopted Accounting Standards
In January 2017, the FASB issued ASU 2017-01 which changes the definition of a business to exclude acquisitions where substantially all of the fair value of the assets acquired are concentrated in a single identifiable asset or group of similar identifiable assets. Under ASU 2017-01, the Company expects that most of its investments in real estate will be considered asset acquisitions. While there are various differences between accounting for an asset acquisition and a business combination, the largest impact is the capitalization of acquisition expenses for asset acquisitions, which are expensed for business combinations. ASU 2017-01 is effective, on a prospective basis, for interim and annual periods beginning after January 1, 2019, with early adoption permitted. The Company adopted the guidance, effective January 1, 2017. As a result of the adoption, the Company capitalized $12,349 of acquisition costs in connection with investments in real estate closed during the year ended December 31, 2017, that qualified as asset acquisitions under the adopted guidance.
Other Recently Issued Accounting Standards
In August 2017, the FASB issued ASU 2017-12, Derivatives and Hedging (Topic 815): Targeted Improvements to Accounting for Hedging Activities. ASU 2017-12 amends the designation and measurement guidance for qualifying hedging transactions and the presentation of hedge results in an entity’s financial statements. The new guidance
85
removes the concept of separately measuring and reporting hedge ineffectiveness and requires a Company to present the earnings effect of the hedging instrument in the same income statement line item in which the earnings effect of the hedged item is reported. Disclosure requirements will be modified to include a tabular disclosure related to the effect of hedging instruments on the income statement and eliminate the requirement to disclose the ineffective portion of the change in fair value of such instruments. The new guidance is effective January 1, 2019, with early adoption permitted, and provides companies with a modified retrospective transition method. This adoption method will require a company to recognize the cumulative effect of initially applying the ASU as an adjustment to accumulated other comprehensive income with a corresponding adjustment to the opening balance of retained earnings as of the beginning of the fiscal year that an entity adopts the update. The amended presentation and disclosure guidance will be applied prospectively. The Company plans to early adopt ASU 2017-12 as of January 1, 2018, and does not expect adoption to have a material impact on its Consolidated Financial Statements and footnote disclosures.
In November 2016, the FASB issued ASU 2016-18, Statement of Cash Flows—Restricted Cash. ASU 2016-18 requires that the statement of cash flows explain the change during the period in the total of cash, cash equivalents, and amounts generally described as restricted cash or cash equivalents. Therefore, amounts generally described as restricted cash and equivalents should be included with cash and cash equivalents when reconciling the beginning and end of period total amounts on the statement of cash flows. Currently, there is no specific guidance to address how to classify or present these changes. ASU 2016-18 is effective, on a retrospective basis, for interim and annual periods beginning after December 15, 2017, with early adoption permitted. The Company currently reflects the change in restricted cash in its cash flows from investing activities. Upon adoption, these amounts will be included in the cash and cash equivalents balance when reconciling the beginning and end of period total amounts. For the years ended December 31, 2017, 2016 and 2015 the decrease (increase) in restricted cash included in cash flows from investing activities was $724, $(1,381) and $4,150, respectively.
In August 2016, the FASB issued ASU 2016-15, Classification of Certain Cash Receipts and Cash Payments. ASU 2016-15 provides classification guidance for eight specific topics, including but not limited to, debt extinguishment costs, contingent consideration payments made after a business combination, and distributions received from equity method investees. ASU 2016-18 is effective, on a retrospective basis, for interim and annual periods beginning after December 15, 2017, with early adoption permitted. The Company has assessed the impact of adopting ASU 2016-15, noting the classification of debt extinguishment costs in the Consolidated Statements of Cash Flows is applicable to the Company, however, will have no impact as the Company currently classifies these as cash flows used in financing activities.
In February 2016, the FASB issued ASU 2016-02, Leases (Topic 842), which supersedes the existing guidance for lease accounting, Leases (Topic 840) (“ASU 2016-02”). ASU 2016-02 requires lessees to recognize a right-of-use asset and a corresponding lease liability, initially measured at the present value of lease payments, for both operating and financing leases. For leases with a term of 12 months or less, lessees will be permitted to make an accounting policy election by class of underlying asset to not recognize lease liabilities and lease assets. The Company does not have any material leases where the Company is the lessee. Under the new pronouncement, lessor accounting will be largely unchanged from existing GAAP. However, there are certain changes, including 1) accounting for non-lease components of leases and 2) lease classification tests. In adopting the new guidance, companies are required to recognize and measure leases at the beginning of the earliest period presented using a modified retrospective approach. The amendments are effective January 1, 2019, with early adoption permitted. Upon adoption, the Company will record certain expenses paid directly by tenants that protect the Company’s interest in the properties, such as real estate taxes on a gross basis, where revenue and the corresponding expense will be recorded and presented in the Consolidated Statements of Income and Comprehensive Income. The Company currently records and presents these amounts on a net basis (see Taxes Collected From Tenants and Remitted to Government Authorities elsewhere in Note 2). The Company is continuing to evaluate the impact that adoption of this guidance will have on its Consolidated Financial Statements and footnote disclosures until the guidance becomes effective.
86
In May 2014, the FASB issued ASU 2014-09, Revenue from Contracts with Customers (Topic 606). ASU 2014-09 is a comprehensive new revenue recognition model requiring a company to recognize revenue to depict the transfer of goods or services to a customer at an amount reflecting the consideration it expects to receive in exchange for those goods or services. In adopting ASU 2014-09, companies may use either a full retrospective or a modified retrospective approach. Additionally, this guidance requires improved disclosures regarding the nature, amount, timing and uncertainty of revenue and cash flows arising from contracts with customers. In August 2015, the FASB issued ASU 2015-14, Revenue from Contracts with Customers (Topic 606): Deferral of the Effective Date, which defers the effective date of ASU 2014-09, for all entities by one year. With the deferral, ASU 2014-09 is effective January 1, 2018, with early adoption permitted beginning January 1, 2017. Once ASU 2016-02 is adopted, ASU 2014-09 may apply to non-lease components in the lease agreements. In January 2018, the FASB proposed amending Topic 842 to allow lessors the option to combine lease and non-lease components when certain criteria are met. The Company has completed its evaluation of the standard’s impact on the Company’s revenue streams and does not expect the adoption of this pronouncement to have a material effect on its Consolidated Financial Statements. The Company will adopt the guidance using the modified retrospective approach on January 1, 2018.
In February 2017, the FASB issued ASU 2017-05, Other Income – Gains and Losses from the Derecognition of Nonfinancial Assets. This new guidance is required to be adopted concurrently with the amendments in ASU 2014-09. The new pronouncement adds guidance for partial sales of nonfinancial assets, including real estate. In adopting ASU 2017-05, companies may use either a full retrospective or a modified retrospective approach. The Company currently recognizes revenue on sales of real estate at the time the asset is transferred (i.e., at the time of closing). Upon adoption of ASU 2014-09, and therefore ASU 2017-05, the Company will need to evaluate any separate contracts or performance obligations to determine proper timing of revenue recognition, as well as transaction price allocation. The Company has completed its evaluation of the standard’s impact and does not expect the adoption of this pronouncement to have a material effect on its Consolidated Financial Statements. The Company will adopt the guidance using the modified retrospective approach on January 1, 2018.
3. Related-Party Transactions
Property Management Agreement
The Corporation and the Operating Company have entered into a property management agreement (the Property Management Agreement) with the Manager, a related party in which certain directors of the Corporation have either a direct or indirect ownership interest. Under the terms of the Property Management Agreement, the Manager manages and coordinates certain aspects of the leasing of the Corporation’s rental property.
In exchange for services provided under the Property Management Agreement, the Manager is compensated as follows:
|
|
(a) |
3% of gross rentals collected each month from the rental property for property management services (other than one property, which has a separate agreement for 5% of gross rentals); and |
|
|
(b) |
Re-leasing fees for existing rental property equal to one month’s rent for a new lease with an existing tenant and two months’ rent for a new lease with a new tenant. |
87
In June 2015, the Property Management Agreement was amended to exclude the fees related to the coordination of acquisitions and sales of the Corporation’s rental property. These fees, as detailed below, and related activities were amended to be included within the Asset Management Agreement (as defined below).
|
|
(a) |
1% of the gross purchase price paid for each rental property acquired (other than acquisitions described in (b) below), including any property contributed in exchange for membership interests in the Operating Company; |
|
|
(b) |
2% of the gross purchase price paid for each rental property acquired in the event that the acquisition of a rental property requires a new lease (as opposed to the assumption of an existing lease), such as a sale-leaseback transaction; and |
|
|
(c) |
1% of the gross sale price received for each rental property disposition. |
In addition, the Manager may also provide, but is not obligated to provide, short-term financing to, or guarantees for, the Operating Company. In exchange for these services, the Manager is entitled to receive an interest rate of up to the prime rate plus 1.00% in exchange for any advances to the Operating Company, and 0.05% for guaranteeing recourse carve-outs on financing arrangements. No such advances or guarantees were made during years ended December 31, 2017, 2016, and 2015.
The initial term of the Property Management Agreement was effective through December 31, 2017, after which it automatically renews for successive one-year periods, unless either party provides written notice of termination in accordance with the Property Management Agreement. The Corporation’s Independent Directors Committee (“IDC”) has approved the renewal of the agreement through December 31, 2018. If the Corporation terminates the agreement prior to any renewal term or the Corporation’s IDC terminates the agreement within 30 days following a change in control of the Manager as defined, the Corporation will be subject to a termination fee equal to three times the Management Fees, as defined in the Property Management Agreement, to which the Manager was entitled during the 12-month period immediately preceding the date of such termination. Although not terminable as of December 31, 2017, if the Property Management Agreement had been terminated at December 31, 2017, subject to the conditions noted above, the termination fee would have been $14,965.
Asset Management Agreement
The Corporation and the Operating Company have entered into an asset management agreement (the “Asset Management Agreement”) with the Asset Manager, a single member LLC with the Manager as the single member, and therefore a related party in which certain directors of the Company have an indirect ownership interest. Under the terms of the Asset Management Agreement, the Asset Manager is responsible for, among other things, the Corporation’s acquisition, initial leasing, and disposition strategies, financing activities, and providing support to the Corporation’s IDC for its valuation functions and other duties. The Asset Manager also designates two individuals to serve on the Board of Directors of the Corporation.
Under the terms of the Asset Management Agreement, the Asset Manager receives an annual asset management fee equal to 1% of the aggregate value of common stock, based on the per share value as determined by the Corporation’s IDC each quarter, on a fully diluted basis as if all interests in the Operating Company had been converted into shares of common stock. Through December 31, 2017, compensation to the Asset Manager for any quarter was deferred in whole or in part at any time during a rolling 12-month period when cumulative distributions were below $3.50 per share. Any deferred compensation under the Asset Management Agreement would have accrued interest at the rate of 7% per annum until paid and would be paid from available funds after cumulative 12-month distributions equal $3.50. No compensation to the Asset Manager was deferred during the years ended December 31, 2017, 2016, and 2015. In addition, the Company pays the Asset Manager, or its designee, 0.5% of the proceeds from future equity closings as reimbursement for offering, marketing, and brokerage expenses. The Asset Manager has the responsibility to cover offering, marketing, and brokerage expenses associated with investor related matters of the Corporation and Operating Company.
88
In June 2015, the Asset Management Agreement was amended to include the following fees paid to the Asset Manager for services provided under the Agreement:
|
|
(a) |
1% of the gross purchase price paid for each rental property acquired (other than acquisitions described in (b) below), including any property contributed in exchange for membership interests in the Operating Company; |
|
|
(b) |
2% of the gross purchase price paid for each rental property acquired in the event that the acquisition of a rental property requires a new lease (as opposed to the assumption of an existing lease), such as a sale-leaseback transaction; and |
|
|
(c) |
1% of the gross sale price received for each rental property disposition. |
The initial term of the Asset Management Agreement was effective through December 31, 2017, after which it automatically renews for successive one-year periods, unless either party provides written notice of termination in accordance with the Asset Management Agreement. The IDC has approved the renewal of the agreement through December 31, 2018. If the Corporation terminates the agreement prior to any renewal term or the IDC terminates the agreement within thirty days following a change in control of the Asset Manager (as defined in the Asset Management Agreement), the Corporation will be required to pay to the Asset Manager a termination fee equal to three times the Asset Management Fee to which the Asset Manager was entitled during the 12-month period immediately preceding the date of such termination. Although not terminable as of December 31, 2017, if the Asset Management Agreement had been terminated at December 31, 2017, subject to the conditions noted above, the termination fee would have been $44,263.
Total fees incurred under the Property Management Agreement and Asset Management Agreement for the years ended December 31, 2017, 2016, and 2015 are as follows:
|
(in thousands) |
|
|
|
For the years ended December 31, |
|
|||||||||
|
Type of Fee |
|
Financial Statement Presentation |
|
2017 |
|
|
2016 |
|
|
2015 |
|
|||
|
Asset management fee |
|
Asset management fees |
|
$ |
14,754 |
|
|
$ |
10,955 |
|
|
$ |
7,042 |
|
|
Property management fee |
|
Property management fees |
|
|
4,988 |
|
|
|
3,939 |
|
|
|
2,697 |
|
|
Total management fee expense |
|
|
|
|
19,742 |
|
|
|
14,894 |
|
|
|
9,739 |
|
|
Marketing fee (offering costs) |
|
Additional paid-in capital |
|
|
1,380 |
|
|
|
1,310 |
|
|
|
1,796 |
|
|
Acquisition fee |
|
Capitalized as a component of assets acquired in 2017 (See Note 4) and included as acquisition expenses in 2016 and 2015 |
|
|
6,580 |
|
|
|
5,203 |
|
|
|
5,501 |
|
|
Leasing fee |
|
Leasing fees, net |
|
|
3,339 |
|
|
|
2,932 |
|
|
|
4,411 |
|
|
Disposition fee |
|
Gain (loss) on sale of real estate |
|
|
605 |
|
|
|
133 |
|
|
|
179 |
|
|
Total management fees |
|
|
|
$ |
31,646 |
|
|
$ |
24,472 |
|
|
$ |
21,626 |
|
Included in management fees are $722 and $364 of unpaid fees recorded in Due to related parties on the Consolidated Balance Sheets at December 31, 2017 and 2016, respectively. All fees related to the Property Management Agreement and the Asset Management Agreement are paid for in cash within the Company’s normal payment cycle for vendors.
89
On June 30, 2015, the Company issued 139 shares with a value of $10,000 to the Manager in exchange for 100 non-voting convertible preferred units, which represented a 6.4% ownership interest in the Manager at the time of the transaction. The Company has the right to convert the preferred units to non-voting common units between January 1, 2018 and December 31, 2019. Subsequent to the conversion period, the Manager has the option to redeem the convertible preferred units at their original value of $10,000, plus any accrued and unpaid preferred return. At December 31, 2017 and 2016, the carrying amount of the investment was $10,000. There is no market for the preferred units of the Manager and, accordingly, no quoted market price is available. The preferred units provide a stated preferred return of 7.0% with 0.25% increases every June 30th. Preferred distributions related to the investment in the Manager amounted to $737, $713 and $350 for the years ended December 31, 2017, 2016 and 2015, respectively.
Legal Services
The Company retains the legal services of Vaisey Nicholson & Nearpass, PLLC (“VNN”), formerly a related party. One former minority partner of VNN is an immediate family member to a member of the management of the Company and an indirect minority owner of the Manager. Beginning January 2017, the family member was no longer an owner or partner of VNN and therefore, prospectively, VNN is no longer deemed a related party. Legal services obtained from VNN are mainly for acquisition and disposition of real estate and related matters, as well as general counsel regarding property management and financing. The Company utilizes the services of other outside legal counsel as well. These fees are paid for in cash within the Company’s normal payment cycle for vendor payments. Included in these related party expenses are $350 of unpaid fees recorded in Accounts payable and other liabilities at December 31, 2016. The following table details the type of legal fees incurred from VNN as a related party for the years ended December 31:
|
(in thousands) |
|
|
|
December 31, |
|
|||||
|
Type of Fee |
|
Financial Statement Presentation |
|
2016 |
|
|
2015 |
|
||
|
Legal services – general |
|
General and administrative |
|
$ |
324 |
|
|
$ |
577 |
|
|
Organization costs |
|
General and administrative |
|
|
22 |
|
|
|
27 |
|
|
|
|
|
|
|
346 |
|
|
|
604 |
|
|
Finance related costs |
|
Debt issuance costs(a) |
|
|
122 |
|
|
|
31 |
|
|
Acquisition related fees |
|
Acquisition expenses |
|
|
2,520 |
|
|
|
2,383 |
|
|
Legal services - tenant related |
|
Property and operating expenses |
|
|
40 |
|
|
|
121 |
|
|
Property disposition related fees |
|
Gain (loss) on sale of real estate |
|
|
47 |
|
|
|
42 |
|
|
Total related party legal expenses |
|
|
|
$ |
3,075 |
|
|
$ |
3,181 |
|
|
(a) |
Amounts are recorded within Debt issuance costs – unsecured revolver, net, Mortgage and notes payable, net, and Unsecured term notes, net, on the accompanying Consolidated Balance Sheets. |
90
The Company closed on the following acquisitions during the year ended December 31, 2017:
|
(in thousands, except number of properties) |
|
|
|
|
|
|
|
|
|
|
|
|
Date |
|
Tenant Type |
|
Number of Properties |
|
|
Real Estate Acquisition Price |
|
|
||
|
January 18, 2017 |
|
Retail |
|
|
1 |
|
|
$ |
2,520 |
|
|
|
March 1, 2017 |
|
Retail |
|
|
9 |
|
|
|
87,196 |
|
|
|
April 28, 2017 |
|
Retail |
|
|
25 |
|
|
|
48,898 |
|
|
|
June 2, 2017 |
|
Healthcare |
|
|
2 |
|
|
|
13,300 |
|
|
|
June 15, 2017 |
|
Retail |
|
|
2 |
|
|
|
2,700 |
|
|
|
June 30, 2017 |
|
Industrial |
|
|
2 |
|
|
|
12,250 |
|
|
|
June 30, 2017 |
|
Healthcare |
|
|
7 |
|
|
|
25,989 |
|
|
|
July 7, 2017 |
|
Office |
|
|
1 |
|
|
|
32,210 |
|
|
|
August 4, 2017 |
|
Healthcare |
|
|
3 |
|
|
|
11,732 |
|
|
|
August 31, 2017 |
|
Healthcare |
|
|
3 |
|
|
|
16,700 |
|
|
|
August 31, 2017 |
|
Industrial |
|
|
2 |
|
|
|
6,148 |
|
|
|
September 13, 2017 |
|
Retail |
|
|
5 |
|
|
|
4,994 |
|
|
|
September 29, 2017 |
|
Industrial, Retail |
|
|
7 |
|
|
|
30,012 |
|
|
|
September 29, 2017 |
|
Industrial |
|
|
1 |
|
|
|
57,372 |
|
|
|
October 13, 2017 |
|
Healthcare |
|
|
1 |
|
|
|
10,000 |
|
(a) |
|
November 1, 2017 |
|
Other |
|
|
4 |
|
|
|
15,693 |
|
(b) (c) |
|
December 7, 2017 |
|
Office |
|
|
2 |
|
|
|
19,295 |
|
|
|
December 7, 2017 |
|
Healthcare |
|
|
1 |
|
|
|
5,095 |
|
|
|
December 7, 2017 |
|
Healthcare |
|
|
1 |
|
|
|
2,678 |
|
|
|
December 8, 2017 |
|
Industrial, Office |
|
|
3 |
|
|
|
74,200 |
|
|
|
December 14, 2017 |
|
Office |
|
|
1 |
|
|
|
24,500 |
|
|
|
December 18, 2017 |
|
Other |
|
|
1 |
|
|
|
22,585 |
|
|
|
December 22, 2017 |
|
Industrial |
|
|
2 |
|
|
|
19,000 |
|
|
|
December 22, 2017 |
|
Industrial |
|
|
1 |
|
|
|
21,037 |
|
|
|
December 27, 2017 |
|
Retail |
|
|
1 |
|
|
|
1,446 |
|
|
|
December 28, 2017 |
|
Industrial |
|
|
1 |
|
|
|
28,450 |
|
|
|
December 29, 2017 |
|
Retail |
|
|
9 |
|
|
|
28,224 |
|
|
|
December 29, 2017 |
|
Retail |
|
|
20 |
|
|
|
39,552 |
|
|
|
December 29, 2017 |
|
Healthcare |
|
|
6 |
|
|
|
19,868 |
|
|
|
|
|
|
|
|
124 |
|
|
$ |
683,644 |
|
(d) |
|
(b) |
The acquisition was conducted with a related party and approved by the IDC. The fees required under the Asset Management Agreement (see Note 3) were waived by the Asset Manager. |
|
(c) |
In conjunction with this acquisition, the Company assumed a mortgage with a principal balance of $6,721 with an interest rate of 3.65% and a maturity date of October 2026 (see Note 10). |
|
(d) |
Acquisition price does not include acquisition costs of $12,349 capitalized in accordance with the adoption of ASU 2017-01 (see Note 2). |
91
The Company closed on the following acquisitions during the year ended December 31, 2016:
|
(in thousands, except number of properties) |
|
|
|
|
|
|
|
|
|
|
|
Date |
|
Tenant Type |
|
Number of Properties |
|
|
Real Estate Acquisition Price |
|
||
|
January 25, 2016 |
|
Retail |
|
|
3 |
|
|
$ |
13,376 |
|
|
February 1, 2016 |
|
Retail |
|
|
1 |
|
|
|
27,000 |
|
|
March 24, 2016 |
|
Industrial |
|
|
1 |
|
|
|
15,650 |
|
|
April 7, 2016 |
|
Healthcare |
|
|
2 |
|
|
|
17,115 |
|
|
April 25, 2016 |
|
Office |
|
|
2 |
|
|
|
54,600 |
|
|
May 9, 2016 |
|
Retail |
|
|
5 |
|
|
|
42,390 |
|
|
May 12, 2016 |
|
Office |
|
|
1 |
|
|
|
4,500 |
|
|
May 20, 2016 |
|
Retail |
|
|
19 |
|
|
|
36,843 |
|
|
May 25, 2016 |
|
Healthcare |
|
(e) |
|
|
|
5,624 |
|
|
|
June 30, 2016 |
|
Retail |
|
|
7 |
|
|
|
28,477 |
|
|
July 15, 2016 |
|
Healthcare |
|
|
2 |
|
|
|
26,700 |
|
|
August 12, 2016 |
|
Other |
|
|
3 |
|
|
|
12,399 |
|
|
September 14, 2016 |
|
Office |
|
|
1 |
|
|
|
14,000 |
|
|
September 29, 2016 |
|
Retail |
|
|
24 |
|
|
|
82,338 |
|
|
October 3, 2016 |
|
Retail |
|
|
6 |
|
|
|
6,872 |
|
|
November 10, 2016 |
|
Office |
|
|
1 |
|
|
|
10,550 |
|
|
November 21, 2016 |
|
Retail |
|
|
2 |
|
|
|
7,597 |
|
|
November 29, 2016 |
|
Office |
|
|
4 |
|
|
|
15,177 |
|
|
December 19, 2016 |
|
Industrial |
|
|
1 |
|
|
|
23,050 |
|
|
December 23, 2016 |
|
Office |
|
|
1 |
|
|
|
43,517 |
|
|
December 30, 2016 |
|
Office |
|
|
1 |
|
|
|
15,550 |
|
|
December 30, 2016 |
|
Industrial |
|
|
1 |
|
|
|
15,487 |
|
|
|
|
|
|
|
88 |
|
|
$ |
518,812 |
|
|
(e) |
Acquisition of capital expansion on existing property. |
92
The Company closed on the following acquisitions during the year ended December 31, 2015:
|
(in thousands, except number of properties) |
|
|
|
|
|
|
|
|
|
|
|
Date |
|
Tenant Type |
|
Number of Properties |
|
|
Real Estate Acquisition Price |
|
||
|
January 6, 2015 |
|
Healthcare |
|
|
1 |
|
|
$ |
4,400 |
|
|
January 9, 2015 |
|
Industrial |
|
|
1 |
|
|
|
4,300 |
|
|
February 12, 2015 |
|
Office |
|
|
2 |
|
|
|
8,796 |
|
|
March 9, 2015 |
|
Retail |
|
|
1 |
|
|
|
3,563 |
|
|
March 12, 2015 |
|
Retail |
|
|
5 |
|
|
|
14,542 |
|
|
March 24, 2015 |
|
Industrial |
|
|
1 |
|
|
|
11,354 |
|
|
March 26, 2015 |
|
Industrial |
|
|
1 |
|
|
|
21,750 |
|
|
March 31, 2015 |
|
Industrial |
|
|
2 |
|
|
|
9,751 |
|
|
April 2, 2015 |
|
Industrial |
|
|
1 |
|
|
|
10,764 |
|
|
April 2, 2015 |
|
Retail, Industrial |
|
|
3 |
|
|
|
6,090 |
|
|
May 15, 2015 |
|
Healthcare |
|
|
5 |
|
|
|
17,125 |
|
|
June 19, 2015 |
|
Retail |
|
|
10 |
|
|
|
19,663 |
|
|
June 19, 2015 |
|
Retail |
|
|
1 |
|
|
|
2,259 |
|
|
June 24, 2015 |
|
Office |
|
|
2 |
|
|
|
33,300 |
|
|
June 26, 2015 |
|
Retail |
|
|
1 |
|
|
|
1,558 |
|
|
June 26, 2015 |
|
Industrial |
|
|
5 |
|
|
|
41,169 |
|
|
June 29, 2015 |
|
Office |
|
|
1 |
|
|
|
15,600 |
|
|
July 17, 2015 |
|
Land |
|
(f) |
|
|
|
702 |
|
|
|
September 15, 2015 |
|
Industrial |
|
|
1 |
|
|
|
12,720 |
|
|
September 25, 2015 |
|
Retail |
|
|
3 |
|
|
|
11,195 |
|
|
September 28, 2015 |
|
Industrial |
|
|
2 |
|
|
|
10,193 |
|
|
September 30, 2015 |
|
Retail |
|
|
1 |
|
|
|
4,030 |
|
|
October 5, 2015 |
|
Retail |
|
|
36 |
|
|
|
83,032 |
|
|
October 23, 2015 |
|
Industrial |
|
|
2 |
|
|
|
51,600 |
|
|
November 23, 2015 |
|
Healthcare |
|
|
1 |
|
|
|
56,600 |
|
|
December 8, 2015 |
|
Retail |
|
|
8 |
|
|
|
18,191 |
|
|
December 15, 2015 |
|
Industrial |
|
|
1 |
|
|
|
1,500 |
|
|
December 17, 2015 |
|
Retail |
|
|
15 |
|
|
|
62,468 |
|
|
December 30, 2015 |
|
Retail |
|
|
3 |
|
|
|
11,913 |
|
|
|
|
|
|
|
116 |
|
|
$ |
550,128 |
|
|
(f) |
Acquisition of land adjacent to existing property. |
93
The Company allocated the purchase price of these properties to the fair value of the assets acquired and liabilities assumed. The following table summarizes the purchase price allocation for acquisitions completed during the years ended December 31, 2017, 2016, and 2015.
|
|
|
December 31, |
|
|||||||||
|
(in thousands) |
|
2017 |
|
|
2016 |
|
|
2015 |
|
|||
|
Land |
|
$ |
67,945 |
|
|
$ |
70,938 |
|
|
$ |
48,060 |
|
|
Land improvements |
|
|
54,804 |
|
|
|
38,526 |
|
|
|
40,715 |
|
|
Buildings and other improvements |
|
|
508,541 |
|
|
|
358,058 |
|
|
|
391,528 |
|
|
Equipment |
|
|
7,671 |
|
|
|
— |
|
|
|
— |
|
|
Acquired in-place leases (g) |
|
|
77,073 |
|
|
|
52,867 |
|
|
|
58,874 |
|
|
Acquired above-market leases (h) |
|
|
14,905 |
|
|
|
19,420 |
|
|
|
15,108 |
|
|
Acquired below-market leases (i) |
|
|
(38,493 |
) |
|
|
(21,541 |
) |
|
|
(13,752 |
) |
|
Direct financing investments |
|
|
3,546 |
|
|
|
544 |
|
|
|
9,595 |
|
|
Mortgages payable, net |
|
|
(11,926 |
) |
|
|
— |
|
|
|
— |
|
|
Non-real estate liabilities |
|
|
(2,777 |
) |
|
|
(8,649 |
) |
|
|
(13,408 |
) |
|
|
|
$ |
681,289 |
|
|
$ |
510,163 |
|
|
$ |
536,720 |
|
|
(g) |
The weighted average amortization period for acquired in-place leases is 15 years, 17 years, and 18 years for acquisitions completed during the years ended December 31, 2017, 2016, and 2015, respectively. |
|
(h) |
The weighted average amortization period for acquired above-market leases is 17 years, 17 years, and 18 years for acquisitions completed during the years ended December 31, 2017, 2016, and 2015, respectively. |
|
(i) |
The weighted average amortization period for acquired below-market leases is 19 years, 17 years, and 18 years for acquisitions completed during the years ended December 31, 2017, 2016, and 2015, respectively. |
The above acquisitions were funded using a combination of available cash on hand and proceeds from the Company’s unsecured revolving line of credit and unsecured term notes. All of the acquisitions closed during the year ended December 31, 2017 qualified as asset acquisitions and, as such, acquisition costs were capitalized in accordance with ASU 2017-01. In conjunction with the acquisitions closed during the years ended December 31, 2016 and 2015, expenses of $10,880 and $9,947, respectively, were incurred and included in Acquisition expenses in the accompanying Consolidated Statements of Income and Comprehensive Income.
The Company recorded the following revenues and net income, excluding the impact of one-time acquisition expenses, in the Consolidated Statements of Income and Comprehensive Income related to properties acquired and accounted for as business combinations from the date of acquisition through December 31, 2016 and 2015:
|
|
|
December 31, |
|
|||||
|
(in thousands) |
|
2016 |
|
|
2015 |
|
||
|
Revenues |
|
$ |
17,088 |
|
|
$ |
15,752 |
|
|
Net income |
|
|
9,462 |
|
|
|
8,569 |
|
Condensed Pro Forma Financial Information (Unaudited)
The results of operations, excluding the impact of one-time acquisition costs of $10,880 and $9,947 for the years ended December 31, 2016 and 2015, respectively, of the acquisitions accounted for as business combinations, for which financial information was available, are included in the following unaudited pro forma financial information as if these acquisitions had been completed as of the beginning of the comparable prior annual period prior to the acquisition date. The following unaudited pro forma financial information is presented as if the 2016 acquisitions were completed as of January 1, 2015, and the 2015 acquisitions were completed as of January 1, 2014. Pro forma financial information is not presented for the 2017 acquisitions based on their qualification as asset acquisitions in accordance with ASU 2017-01. These pro forma results are for comparative purposes only and are not necessarily indicative of what the Company’s actual results of operations would have been had the acquisitions occurred at the beginning of the periods presented, nor are they necessarily indicative of future operating results.
94
The unaudited condensed pro forma financial information are as follows for the years ended December 31:
|
|
|
December 31, |
|
|||||
|
(in thousands) |
|
2016 |
|
|
2015 |
|
||
|
Revenues |
|
$ |
174,727 |
|
|
$ |
166,647 |
|
|
Net income |
|
|
69,504 |
|
|
|
69,780 |
|
5. Sale of Real Estate
The Company closed on the following sales of real estate, none of which qualified as discontinued operations, during the years ended December 31, 2017, 2016, and 2015.
|
|
|
For the years ended December 31, |
|
|||||||||
|
(in thousands, except number of properties) |
|
2017 |
|
|
2016 |
|
|
2015 |
|
|||
|
Number of properties disposed |
|
|
13 |
|
|
|
9 |
|
|
6 |
|
|
|
Aggregate sale price |
|
$ |
66,532 |
|
|
$ |
39,500 |
|
|
$ |
19,455 |
|
|
Aggregate carrying value |
|
|
50,339 |
|
|
|
32,665 |
|
|
|
18,672 |
|
|
Additional sales expenses |
|
|
3,201 |
|
|
|
910 |
|
|
|
1,496 |
|
|
Gain (loss) on sale of real estate |
|
|
12,992 |
|
|
|
5,925 |
|
|
|
(713 |
) |
The Company provided seller financing of $3,700 in connection with one of the 2016 sales (see Note 8).
6. Investment in Rental Property and Lease Arrangements
The Company generally leases its investment rental property to established tenants. At December 31, 2017, the Company had 513 real estate properties which were leased under leases that have been classified as operating leases and 15 that have been classified as direct financing leases. Of the 15 leases classified as direct financing leases, four include land portions which are accounted for as operating leases (see Revenue Recognition within Note 2). Substantially all leases have initial terms of 10 to 20 years and provide for minimum rentals as defined in ASC 840, Leases. In addition, the leases generally provide for limited increases in rent as a result of fixed increases, increases in the Consumer Price Index, or increases in the tenant’s sales volume. Generally, the tenant is also required to pay all property taxes and assessments, substantially maintain the interior and exterior of the building, and maintain property and liability insurance coverage. The leases also typically provide one or more multiple year renewal options subject to generally the same terms and conditions as the initial lease.
Investment in Rental Property – Accounted for Using the Operating Method
Rental property subject to non-cancelable operating leases with tenants are as follows at December 31, 2017 and 2016:
|
|
|
December 31, |
|
|||||
|
(in thousands) |
|
2017 |
|
|
2016 |
|
||
|
Land |
|
$ |
348,940 |
|
|
$ |
288,276 |
|
|
Land improvements |
|
|
211,674 |
|
|
|
162,341 |
|
|
Buildings |
|
|
1,754,796 |
|
|
|
1,283,322 |
|
|
Tenant improvements |
|
|
11,425 |
|
|
|
8,665 |
|
|
Equipment |
|
|
7,689 |
|
|
|
799 |
|
|
|
|
|
2,334,524 |
|
|
|
1,743,403 |
|
|
Less accumulated depreciation |
|
|
(148,383 |
) |
|
|
(105,703 |
) |
|
|
|
$ |
2,186,141 |
|
|
$ |
1,637,700 |
|
95
Depreciation expense on investment in rental property was $50,360, $37,976 and $25,038 for the years ended December 31, 2017, 2016, and 2015, respectively.
Estimated minimum future rental receipts required under non-cancelable operating leases with tenants at December 31, 2017 are as follows:
|
(in thousands) |
|
|
|
|
|
2018 |
|
$ |
188,519 |
|
|
2019 |
|
|
192,387 |
|
|
2020 |
|
|
195,455 |
|
|
2021 |
|
|
198,379 |
|
|
2022 |
|
|
200,765 |
|
|
Thereafter |
|
|
1,848,237 |
|
|
|
|
$ |
2,823,742 |
|
Since lease renewal periods are exercisable at the option of the tenant, the above amounts only include future minimum lease payments due during the initial lease terms. In addition, such amounts exclude any potential variable rent increases that are based on the Consumer Price Index or future contingent rents which may be received under the leases based on a percentage of the tenant’s gross sales.
Investment in Rental Property – Accounted for Using the Direct Financing Method
The Company’s net investment in direct financing leases is as follows as of December 31:
|
|
|
December 31, |
|
|||||
|
(in thousands) |
|
2017 |
|
|
2016 |
|
||
|
Minimum lease payments to be received |
|
$ |
77,889 |
|
|
$ |
90,447 |
|
|
Estimated unguaranteed residual values |
|
|
19,758 |
|
|
|
22,335 |
|
|
Less unearned revenue |
|
|
(56,030 |
) |
|
|
(65,511 |
) |
|
Net investment in direct financing leases |
|
$ |
41,617 |
|
|
$ |
47,271 |
|
Minimum future rental receipts required under non-cancelable direct financing leases with tenants at December 31, 2017 are as follows:
|
(in thousands) |
|
|
|
|
|
2018 |
|
$ |
3,857 |
|
|
2019 |
|
|
3,931 |
|
|
2020 |
|
|
4,037 |
|
|
2021 |
|
|
4,126 |
|
|
2022 |
|
|
4,211 |
|
|
Thereafter |
|
|
57,727 |
|
|
|
|
$ |
77,889 |
|
The above rental receipts do not include future minimum lease payments for renewal periods, potential variable Consumer Price Index rent increases or contingent rental payments that may become due in future periods.
96
7. Intangible Assets and Liabilities
The following is a summary of intangible assets and liabilities and related accumulated amortization at December 31:
|
(in thousands) |
|
December 31, |
|
|||||
|
|
|
2017 |
|
|
2016 |
|
||
|
Lease intangibles: |
|
|
|
|
|
|
|
|
|
Acquired above-market leases |
|
$ |
59,502 |
|
|
$ |
45,490 |
|
|
Less accumulated amortization |
|
|
(9,183 |
) |
|
|
(4,940 |
) |
|
Acquired above-market leases, net |
|
|
50,319 |
|
|
|
40,550 |
|
|
Acquired in-place leases |
|
|
216,858 |
|
|
|
141,676 |
|
|
Less accumulated amortization |
|
|
(24,518 |
) |
|
|
(14,105 |
) |
|
Acquired in-place leases, net |
|
|
192,340 |
|
|
|
127,571 |
|
|
Total intangible lease assets, net |
|
$ |
242,659 |
|
|
$ |
168,121 |
|
|
Acquired below-market leases |
|
$ |
91,667 |
|
|
$ |
54,062 |
|
|
Less accumulated amortization |
|
|
(9,923 |
) |
|
|
(6,191 |
) |
|
Intangible lease liabilities, net |
|
$ |
81,744 |
|
|
$ |
47,871 |
|
|
Leasing fees |
|
$ |
16,286 |
|
|
$ |
13,279 |
|
|
Less accumulated amortization |
|
|
(2,732 |
) |
|
|
(1,950 |
) |
|
Leasing fees, net |
|
$ |
13,554 |
|
|
$ |
11,329 |
|
Amortization expense was $11,903, $8,345 and $4,349 for acquired in-place leases and leasing fees for the years ended December 31, 2017, 2016, and 2015, respectively. Amortization of acquired above-market and below-market leases, net, was a (decrease) increase in rental income of $(496), $482 and $569 for the years ended December 31, 2017, 2016, and 2015, respectively.
Estimated future amortization of intangible assets and liabilities for at December 31, 2017 is as follows:
|
(in thousands) |
|
|
|
|
|
2018 |
|
$ |
16,009 |
|
|
2019 |
|
|
13,452 |
|
|
2020 |
|
|
13,321 |
|
|
2021 |
|
|
13,282 |
|
|
2022 |
|
|
13,136 |
|
|
Thereafter |
|
|
105,269 |
|
|
|
|
$ |
174,469 |
|
8. Notes Receivable
During 2016, the Company, as the lender, entered into two loan agreements in the amount of $3,700 and $2,827. The agreements call for interest-only payments at 7.00% and 6.35% per annum through maturity in February and November 2019, respectively. Each of the loans is collateralized by the real estate assets held by the obligors and represent first mortgage liens, on net leased commercial properties in Florida and Michigan, respectively. There were no prior liens on the properties at the time the notes were issued. As each of the loans is considered to be fully collectible, the carrying amount of the loans is equal to the face amount as of December 31, 2017 and 2016. Interest income earned on the notes receivable amounted to $445 and $77 for the years ended December 31, 2017 and 2016, respectively.
9. Unsecured Credit Agreements
2017 Unsecured Revolving Credit and Term Loan Agreement
On June 23, 2017, the Corporation and the Operating Company entered into an $800,000 unsecured Revolving Credit and Term Loan Agreement (“Credit Agreement”) with Manufacturers & Traders Trust Company (“M&T Bank”), as
97
Administrative Agent, four participating banks as Joint Lead Arrangers and Joint Bookrunners, four participating banks as Co-Syndication Agents, and four participating banks, as Co-Documentation Agents. The Credit Agreement consisted of a $400,000 senior unsecured revolving credit facility (“Revolver”), a $250,000 senior unsecured delayed draw term loan (“5.5-Year Term Loan”), and a $150,000 senior unsecured delayed draw term loan (“7-Year Term Loan”). The Credit Agreement provides an accordion feature for up to a total of $1,000,000 of borrowing capacity. The Revolver includes a $35,000 sublimit for swingline loans and $20,000 available for issuance of letters of credit. Proceeds from the Company’s borrowings under the Credit Agreement were used to repay the Company’s existing unsecured revolving credit facility and term notes with M&T and Regions Bank for $5,000 and $100,000, respectively, the Company’s existing unsecured term note with Regions Bank for $185,000, and $50,000 of the Company’s unsecured term note with SunTrust Bank.
On November 20, 2017, pursuant to the terms of a Consent and Agreement Regarding Commitment Increases and Additional Term Loans (the “Commitment Increase”) among the Company, the Operating Company, as the borrower, Manufacturers and Traders Trust Company, as Administrative Agent, and the original parties to the Credit Agreement, plus U.S. Bank National Association and Raymond James, N.A. as new lenders added pursuant to the Commitment Increase, the Operating Company obtained an additional $80,000 in credit commitments from the lenders, raising the total available borrowings under the Credit Agreement to $880,000. Except as amended by the Commitment Increase, all terms and conditions of the Credit Agreement remain the same as those in effect prior to the Commitment Increase. As amended by the Commitment Increase, the Credit Agreement consists of the $425,000 Revolver, the $265,000 5.5-Year Term Loan, and the $190,000 7-Year Term Loan.
The Revolver has an initial maturity date of January 2022 and provides for one five-month extension, at the election of the Company, subject to certain conditions set forth in the agreement and payment of a 0.0625% fee on the revolving commitments. Borrowings on the Revolver bear interest at variable rates based on LIBOR plus a margin based on the Operating Company’s investment grade credit rating ranging between 0.825% and 1.55% per annum. The initial applicable facility fee on the Revolver is 0.25% per annum. The 5.5-Year Term Loan provides for up to three delayed draws from inception through June 2018 at the request of the Company. Borrowings under the 5.5-Year Term Loan bear interest at variable rates based on LIBOR plus a margin based on the Operating Company’s credit rating ranging between 0.90% and 1.75% per annum through the maturity date of January 2023. The 7-Year Term Loan provides for up to three delayed draws from inception through June 2018 at the request of the Company. Borrowings under the 7-Year Term Loan bear interest at variable rates based on LIBOR plus a margin based on the Operating Company’s credit rating ranging between 1.50% and 2.45% through the maturity date of June 2024. Based on the Operating Company’s current credit rating of Baa3, the applicable margin under the Revolver, 5.5-Year Term Loan, and 7-Year Term Loan are 1.20%, 1.35% and 1.90%, respectively. The 5.5-Year Term Loan and 7-Year Term Loan are both subject to a fee of 0.25% per annum on the amount of the commitments, reduced by the amount of term loans outstanding under the applicable loan. The Company is subject to various financial and nonfinancial covenants under the Credit Agreement.
2015 Unsecured Term Loan Agreement
On June 23, 2017, the Company amended and restated the Term Loan Agreement by and among the Company, the Operating Company, as the borrower, SunTrust Bank, as Administrative Agent, and the lenders party thereto (as amended and restated, the “Restated Term Loan Agreement”). The Restated Term Loan Agreement amended certain terms, conditions, covenants, and other provisions to align them with those included in the Credit Agreement described above in addition to allowing a one-time, non-pro-rata $50,000 paydown on the loan. The Restated Term Loan Agreement has an initial maturity date of February 2019 and provides for two one-year extension options, at the election of the Company, subject to compliance with all covenants and the payment of a 0.01% fee. Borrowings under the Restated Term Loan Agreement bear interest at variable rates based on the one-month LIBOR plus a margin based on the Operating Company’s investment grade credit rating ranging between 0.90% and 1.75%. Based on the Operating Company’s current credit rating of Baa3, the applicable margin under the Restated Term Loan Agreement is 1.40%.
2017 Senior Notes
In January 2017, the Company commenced a private offering of unsecured, fixed-rate, interest-only senior promissory notes (“Senior Notes”). On March 16, 2017, the Company entered into a Note and Guaranty Agreement with each of the purchasers of the Senior Notes. On April 18, 2017, the Company closed the offering and issued the Senior Notes for an aggregate principal amount of $150,000. The Senior Notes were issued by the Operating Company and guaranteed by the Corporation. The Senior Notes were issued at par, bear interest at a rate of 4.84% per annum (priced at 240 basis points above the 10-year U.S. Treasury yield at the time of pricing), and have a 10-
98
year maturity, maturing on April 18, 2027. J.P. Morgan Securities, LLC and Wells Fargo Securities, LLC served as the joint placement agents.
The following table summarizes the Company’s unsecured credit agreements:
|
|
|
Outstanding Balance |
|
|
|
|
|
|
|
|||||
|
|
|
December 31, |
|
|
Interest |
|
|
Maturity |
||||||
|
(in thousands, except interest rates) |
|
2017 |
|
|
2016 |
|
|
Rate(d) |
|
|
Date |
|||
|
2015 Unsecured Term Loan Agreement(a) |
|
$ |
325,000 |
|
|
$ |
375,000 |
|
|
1-month LIBOR + 1.40% |
|
|
Feb. 2019 |
|
|
2017 Unsecured Revolving Credit and Term Loan Agreement(a) |
|
|
|
|
|
|
|
|
|
|
|
|
|
|
|
Revolver |
|
|
273,000 |
|
|
|
— |
|
|
1- and 3-month LIBOR + 1.20% (f) |
|
|
Jan. 2022 |
|
|
5.5-Year term loan |
|
|
265,000 |
|
|
|
— |
|
|
1-month LIBOR + 1.35% |
|
|
Jan. 2023 |
|
|
7-Year term loan |
|
|
100,000 |
|
|
|
— |
|
|
1-month LIBOR + 1.90% |
|
|
June 2024 |
|
|
|
|
|
638,000 |
|
|
|
— |
|
|
|
|
|
|
|
|
2017 Senior Notes(a) |
|
|
150,000 |
|
|
|
— |
|
|
4.84% |
|
|
Apr. 2027 |
|
|
2012 Unsecured Credit Agreement(a) |
|
|
|
|
|
|
|
|
|
|
|
|
|
|
|
Term note |
|
|
— |
|
|
|
50,000 |
|
|
3-month LIBOR + 1.45% |
|
|
June 2017 |
|
|
Term note |
|
|
— |
|
|
|
50,000 |
|
|
1-month LIBOR + 1.45% |
|
|
June 2017 |
|
|
Revolver(b) |
|
|
— |
|
|
|
102,000 |
|
|
1-month LIBOR + 1.45% |
|
|
June 2017 |
|
|
|
|
|
— |
|
|
|
202,000 |
|
|
|
|
|
|
|
|
2013 Unsecured Credit Agreement(a) |
|
|
— |
|
|
|
185,000 |
|
|
1-month LIBOR + 1.75% to 2.50%(e) |
|
|
Oct. 2018 |
|
|
Total |
|
|
1,113,000 |
|
|
|
762,000 |
|
|
|
|
|
|
|
|
Debt issuance costs, net(c) |
|
|
(3,088 |
) |
|
|
(2,109 |
) |
|
|
|
|
|
|
|
|
|
$ |
1,109,912 |
|
|
$ |
759,891 |
|
|
|
|
|
|
|
|
(a) |
The Company believes it was in compliance with all financial covenants for all periods presented. |
|
(b) |
At December 31, 2016, $273,200 of the revolving credit facility’s $300,000 capacity was available, due to a borrowing base limitation. |
|
(c) |
Amounts presented include debt issuance costs, net, related to the unsecured term notes only. |
|
(d) |
At December 31, 2017 and 2016, the one-month LIBOR rate was 1.37% and 0.62%, respectively. At December 31, 2016, the three-month LIBOR rate was 0.93%. |
|
(e) |
The margin was based on the Company’s overall leverage ratio and was 1.75% at December 31, 2016. |
|
(f) |
$223,000 of the balance is at one-month LIBOR plus 1.20% while the remaining $50,000 balance is at three-month LIBOR plus 1.20%. |
At December 31, 2017 and 2016, the weighted average interest rate on all outstanding borrowings was 3.03% and 2.14%, respectively.
Debt issuance costs of $1,794, $1,817 and $1,321 were amortized as a component of interest expense in the accompanying Consolidated Statements of Income and Comprehensive Income for the years ended December 31, 2017, 2016, and 2015, respectively.
99
For the year ended December 31, 2017, the Company paid $8,711 in debt issuance costs associated with the Senior Notes, the Credit Agreement, and the Restated Term Loan Agreement. For each separate debt instrument, on a lender by lender basis, in accordance with ASC 470-50, Debt Modifications and Extinguishment, the Company performed an assessment of whether the transaction was deemed to be new debt, a modification of existing debt, or an extinguishment of existing debt. Debt issuance costs are either deferred and amortized over the term of the associated debt or expensed as incurred. Based on this assessment, $5,810 of the debt issuance costs were related to new debt and therefore have been deferred and are being amortized over the term of the associated debt. The remaining $2,901 of debt issuance costs were associated with lenders whose commitments under the new agreements have been determined to be an extinguishment and such debt issuance costs were expensed as a component of the Cost of debt extinguishment in the accompanying Consolidated Statements of Income and Comprehensive Income for the year ended December 31, 2017. Additionally, $654 of unamortized debt issuance costs were expensed and included in cost of debt extinguishment in the accompanying Consolidated Statements of Income and Comprehensive Income for the year ended December 31, 2017.
10. Mortgages and Notes Payable
The Company’s mortgages and notes payable consist of the following at December 31, 2017 and December 31, 2016:
|
(in thousands, except interest rates) |
|
|
|
|
|
|
|
|
|
|
|
|
|
|
|
|
|
|
|||
|
|
|
|
|
|
Origination Date |
|
Maturity Date |
|
|
|
|
|
December 31, |
|
|
|
|||||
|
|
|
|
Lender |
|
(Month/Year) |
|
(Month/Year) |
|
Interest Rate |
|
|
2017 |
|
|
2016 |
|
|
|
|||
|
|
(1 |
) |
PNC Bank |
|
Oct-16 |
|
Nov-26 |
|
3.62% |
|
|
$ |
18,622 |
|
|
$ |
18,971 |
|
|
(b) (c) |
|
|
|
(2 |
) |
Sun Life |
|
Mar-12 |
|
Oct-21 |
|
5.13% |
|
|
|
11,670 |
|
|
|
12,036 |
|
|
(b) (i) |
|
|
|
(3 |
) |
Aegon |
|
Apr-12 |
|
Oct-23 |
|
6.38% |
|
|
|
9,168 |
|
|
|
9,804 |
|
|
(b) (j) |
|
|
|
(4 |
) |
Symetra Financial |
|
Nov-17 |
|
Oct-26 |
|
3.65% |
|
|
|
6,685 |
|
|
|
— |
|
|
(a) (b) (n) (o) |
|
|
|
(5 |
) |
Siemens Financial Services, Inc. |
|
Sep-10 |
|
Sep- 20 |
|
5.47% |
|
|
|
5,820 |
|
|
|
6,010 |
|
|
(a) (b) |
|
|
|
(6 |
) |
Legg Mason Mortgage Capital Corporation |
|
Aug-10 |
|
Aug-22 |
|
7.06% |
|
|
|
5,670 |
|
|
|
6,538 |
|
|
(b) (e) |
|
|
|
(7 |
) |
M&T Bank |
|
Oct-17 |
|
Aug-21 |
|
1-month LIBOR+3% |
|
|
|
5,183 |
|
|
|
— |
|
|
(b) (d) (l) (m) |
|
|
|
(8 |
) |
Standard Insurance Co. |
|
Apr-09 |
|
May-34 |
|
6.88% |
|
|
|
1,813 |
|
|
|
1,870 |
|
|
(b) (c) (h) |
|
|
|
(9 |
) |
Columbian Mutual Life Insurance Company |
|
Aug-10 |
|
Sep-25 |
|
7.00% |
|
|
|
1,500 |
|
|
|
1,538 |
|
|
(b) (c) (d) |
|
|
|
(10 |
) |
Symetra Financial |
|
Mar-11 |
|
Apr-31 |
|
6.34% |
|
|
|
1,008 |
|
|
|
1,036 |
|
|
(a) (b) |
|
|
|
(11 |
) |
Note holders |
|
Dec-08 |
|
Dec-23 |
|
6.25% |
|
|
|
750 |
|
|
|
750 |
|
|
(d) |
|
|
|
(12 |
) |
Standard Insurance Co. |
|
Jul-10 |
|
Aug-30 |
|
6.75% |
|
|
|
581 |
|
|
|
597 |
|
|
(b) (c) (d) (h) |
|
|
|
(13 |
) |
M&T Bank |
|
Dec-10 |
|
Apr-20 |
|
1-month LIBOR+1.90% |
|
|
|
— |
|
|
|
21,335 |
|
|
(b) (f) (g) |
|
|
|
(14 |
) |
Wells Fargo Bank, N.A. |
|
May-07 |
|
Jun-17 |
|
6.69% |
|
|
|
— |
|
|
|
1,694 |
|
|
(a) (b) |
|
|
|
(15 |
) |
Standard Insurance Co. |
|
May-09 |
|
Jun-34 |
|
6.88% |
|
|
|
— |
|
|
|
1,342 |
|
|
(b) (c) (h) |
|
|
|
(16 |
) |
Standard Insurance Co. |
|
Mar-10 |
|
Apr-31 |
|
7.00% |
|
|
|
— |
|
|
|
1,058 |
|
|
(b) (c) (d) (h) |
|
|
|
(17 |
) |
Standard Insurance Co. |
|
Mar-10 |
|
Apr-31 |
|
7.00% |
|
|
|
— |
|
|
|
844 |
|
|
(b) (c) (d) (h) |
|
|
|
(18 |
) |
Columbus Life Insurance |
|
Feb-13 |
|
Jan-26 |
|
4.65% |
|
|
|
— |
|
|
|
9,400 |
|
|
(b) (k) |
|
|
|
(19 |
) |
Athene Annuity & Life Co. |
|
Feb-12 |
|
Feb-17 |
|
3.76% |
|
|
|
— |
|
|
|
12,701 |
|
|
(b) |
|
|
|
|
|
|
|
|
|
|
|
|
|
|
|
|
68,470 |
|
|
|
107,524 |
|
|
|
|
|
|
|
Debt issuance costs, net |
|
|
|
|
|
|
|
|
|
|
(638 |
) |
|
|
(838 |
) |
|
|
|
|
|
|
|
|
|
|
|
|
|
|
|
|
$ |
67,832 |
|
|
$ |
106,686 |
|
|
|
|
(a) |
Non-recourse debt includes the indemnification/guaranty of the Corporation and/or Operating Company pertaining to fraud, environmental claims, insolvency and other matters. |
|
(b) |
Debt secured by related rental property and lease rents. |
|
(c) |
Debt secured by guaranty of the Operating Company. |
|
(d) |
Debt secured by guaranty of the Corporation. |
|
(e) |
Debt is guaranteed by a third party. |
|
(f) |
The Company entered into an interest rate swap agreement in connection with this mortgage note, as further described in Note 11. At the time the mortgage was paid in full, the related interest rate swap agreement was terminated. |
100
|
(h) |
The interest rate represents the initial interest rate on the respective notes. The interest rate will be adjusted at Standard Insurance’s discretion at certain times throughout the term of the note, ranging from 59 to 239 months, and the monthly installments will be adjusted accordingly. At the time Standard Insurance may adjust the interest rate for notes payable, the Company has the right to prepay the note without penalty. |
|
(i) |
Mortgage was assumed in March 2012 as part of an UPREIT transaction. The debt was recorded at fair value at the time of the assumption. |
|
(j) |
Mortgage was assumed in April 2012 as part of the acquisition of the related property. The debt was recorded at fair value at the time of the assumption. |
|
(k) |
Mortgage was assumed in December 2013 as part of the acquisition of the related property. The debt was recorded at fair value at the time of the assumption. |
|
(l) |
The Company entered into an interest rate swap agreement in connection with the mortgage note, as further described in Note 11. |
|
(m) |
Mortgage was assumed in October 2017 as part of an UPREIT transaction. The debt was recorded at fair value at the time of the assumption. |
|
(n) |
Mortgage was assumed in November 2017 as part of the acquisition of the related property. The debt was recorded at fair value at the time of the assumption. |
|
(o) |
The interest rate will be adjusted to the holder’s quoted 5-year commercial mortgage rate for similar size and quality. |
At December 31, 2017, investment in rental property of $67,720 is pledged as collateral against the Company’s mortgages and notes payable.
The Company extinguished seven, four and two mortgages totaling $48,108, $8,199, and $3,883 during the years ended December 31, 2017, 2016, and 2015, respectively. For the years ended December 31, 2017, 2016 and 2015 the cost (gain) of extinguishment for the mortgages was $1,596, $133 and $(1,213), respectively.
Estimated future principal payments to be made under the above mortgage and note payable agreements, and the Company’s unsecured credit agreements (see Note 9) at December 31, 2017 are as follows:
|
(in thousands) |
|
|
|
|
|
2018 |
|
$ |
3,127 |
|
|
2019 |
|
|
328,351 |
|
|
2020 |
|
|
8,777 |
|
|
2021 |
|
|
18,263 |
|
|
2022 |
|
|
298,495 |
|
|
Thereafter |
|
|
524,457 |
|
|
|
|
$ |
1,181,470 |
|
Certain of the Company’s mortgage and note payable agreements provide for prepayment fees and can be terminated under certain events of default as defined under the related agreements which are not reflected as part of the table above.
11. Interest Rate Swaps
Interest rate swaps were entered into with certain financial institutions in order to mitigate the impact of interest rate variability over the term of the related debt agreements. The interest rate swaps are considered cash flow hedges. In order to reduce counterparty concentration risk, the Company has a diversification policy for institutions that serve as swap counterparties. Under these agreements, the Company receives monthly payments from the counterparties on these interest rate swaps equal to the related variable interest rates multiplied by the outstanding notional amounts. Certain interest rate swaps amortize on a monthly basis. In turn, the Company pays the counterparties each month an amount equal to a fixed rate multiplied by the related outstanding notional amounts. The intended net impact of these transactions is that the Company pays a fixed interest rate on its variable-rate borrowings.
101
The following is a summary of the Company’s outstanding interest rate swap agreements:
|
|
|
|
|
|
|
|
|
|
|
|
|
|
|
|
|
|
|
|
|
|
|
|
|
|
|
|
|
|
|
|
|
|
|
|
|
|
Fair Value |
|
|
|||||
|
(in thousands, except interest rates) |
|
|
|
|
|
|
|
|
|
|
|
December 31, |
|
|
|||||||
|
Counterparty |
|
Maturity Date |
|
Fixed Rate |
|
|
Variable Rate Index |
|
Notional Amount |
|
|
2017 |
|
|
2016 |
|
|
||||
|
Bank of America, N.A. |
|
November 2023 |
|
|
2.80 |
% |
|
LIBOR 1 month |
|
$ |
25,000 |
|
|
$ |
(863 |
) |
|
$ |
(1,338 |
) |
|
|
Bank of Montreal |
|
July 2024 |
|
|
1.16 |
% |
|
LIBOR 1 month |
|
|
40,000 |
|
|
|
2,503 |
|
|
|
2,485 |
|
|
|
Bank of Montreal |
|
January 2025 |
|
|
1.91 |
% |
|
LIBOR 1 month |
|
|
25,000 |
|
|
|
464 |
|
|
|
299 |
|
|
|
Bank of Montreal |
|
July 2025 |
|
|
2.32 |
% |
|
LIBOR 1 month |
|
|
25,000 |
|
|
|
(194 |
) |
|
|
(433 |
) |
|
|
Bank of Montreal |
|
January 2026 |
|
|
1.92 |
% |
|
LIBOR 1 month |
|
|
25,000 |
|
|
|
561 |
|
|
|
437 |
|
|
|
Bank of Montreal |
|
January 2026 |
|
|
2.05 |
% |
|
LIBOR 1 month |
|
|
40,000 |
|
|
|
520 |
|
|
|
275 |
|
|
|
Bank of Montreal |
|
December 2026 |
|
|
2.33 |
% |
|
LIBOR 1 month |
|
|
10,000 |
|
|
|
(63 |
) |
|
|
(132 |
) |
|
|
Bank of Montreal |
|
December 2027 |
|
|
2.37 |
% |
|
LIBOR 1 month |
|
|
25,000 |
|
|
|
(192 |
) |
|
|
— |
|
|
|
Capital One, N.A. |
|
December 2021 |
|
|
1.05 |
% |
|
LIBOR 1 month |
|
|
15,000 |
|
|
|
607 |
|
|
|
552 |
|
|
|
Capital One, N.A. |
|
December 2024 |
|
|
1.58 |
% |
|
LIBOR 1 month |
|
|
15,000 |
|
|
|
603 |
|
|
|
565 |
|
|
|
Capital One, N.A. |
|
January 2026 |
|
|
2.08 |
% |
|
LIBOR 1 month |
|
|
35,000 |
|
|
|
399 |
|
|
|
216 |
|
|
|
Capital One, N.A. |
|
July 2026 |
|
|
1.32 |
% |
|
LIBOR 1 month |
|
|
35,000 |
|
|
|
2,565 |
|
|
|
2,667 |
|
|
|
Capital One, N.A. |
|
December 2027 |
|
|
2.37 |
% |
|
LIBOR 1 month |
|
|
25,000 |
|
|
|
(189 |
) |
|
|
— |
|
|
|
M&T Bank |
|
September 2017 |
|
|
1.09 |
% |
|
LIBOR 1 month |
|
|
25,000 |
|
|
|
— |
|
|
|
(37 |
) |
|
|
M&T Bank |
|
April 2020 |
|
|
4.91 |
% |
|
LIBOR 1 month |
|
|
21,335 |
|
|
|
— |
|
|
|
(2,266 |
) |
|
|
M&T Bank |
|
August 2021 |
|
|
1.02 |
% |
|
LIBOR 1 month |
|
|
5,183 |
|
|
|
182 |
|
|
|
— |
|
(a) |
|
M&T Bank |
|
September 2022 |
|
|
2.83 |
% |
|
LIBOR 1 month |
|
|
25,000 |
|
|
|
(810 |
) |
|
|
(993 |
) |
|
|
M&T Bank |
|
November 2023 |
|
|
2.65 |
% |
|
LIBOR 1 month |
|
|
25,000 |
|
|
|
(686 |
) |
|
|
(1,102 |
) |
|
|
Regions Bank |
|
March 2017 |
|
|
0.70 |
% |
|
LIBOR 1 month |
|
|
50,000 |
|
|
|
— |
|
|
|
6 |
|
|
|
Regions Bank |
|
March 2018 |
|
|
1.77 |
% |
|
LIBOR 1 month |
|
|
25,000 |
|
|
|
(9 |
) |
|
|
(179 |
) |
|
|
Regions Bank |
|
March 2019 |
|
|
1.91 |
% |
|
LIBOR 3 month |
|
|
25,000 |
|
|
|
2 |
|
|
|
(239 |
) |
|
|
Regions Bank |
|
May 2020 |
|
|
2.12 |
% |
|
LIBOR 1 month |
|
|
50,000 |
|
|
|
(153 |
) |
|
|
(940 |
) |
|
|
Regions Bank |
|
March 2022 |
|
|
2.43 |
% |
|
LIBOR 3 month |
|
|
25,000 |
|
|
|
(254 |
) |
|
|
(594 |
) |
|
|
Regions Bank |
|
December 2023 |
|
|
1.18 |
% |
|
LIBOR 1 month |
|
|
25,000 |
|
|
|
1,402 |
|
|
|
1,392 |
|
|
|
SunTrust Bank |
|
April 2024 |
|
|
1.99 |
% |
|
LIBOR 1 month |
|
|
25,000 |
|
|
|
261 |
|
|
|
47 |
|
|
|
SunTrust Bank |
|
April 2025 |
|
|
2.20 |
% |
|
LIBOR 1 month |
|
|
25,000 |
|
|
|
— |
|
|
|
(219 |
) |
|
|
SunTrust Bank |
|
July 2025 |
|
|
1.99 |
% |
|
LIBOR 1 month |
|
|
25,000 |
|
|
|
386 |
|
|
|
228 |
|
|
|
SunTrust Bank |
|
December 2025 |
|
|
2.30 |
% |
|
LIBOR 1 month |
|
|
25,000 |
|
|
|
(138 |
) |
|
|
— |
|
|
|
SunTrust Bank |
|
January 2026 |
|
|
1.93 |
% |
|
LIBOR 1 month |
|
|
25,000 |
|
|
|
553 |
|
|
|
429 |
|
|
|
Wells Fargo Bank, N.A. |
|
February 2021 |
|
|
2.39 |
% |
|
LIBOR 1 month |
|
|
35,000 |
|
|
|
(369 |
) |
|
|
(1,013 |
) |
|
|
Wells Fargo Bank, N.A. |
|
October 2024 |
|
|
2.72 |
% |
|
LIBOR 1 month |
|
|
15,000 |
|
|
|
(510 |
) |
|
|
(732 |
) |
|
|
Wells Fargo Bank, N.A. |
|
January 2028 |
|
|
2.37 |
% |
|
LIBOR 1 month |
|
|
75,000 |
|
|
|
(590 |
) |
|
|
— |
|
|
|
|
|
|
|
|
|
|
|
|
|
|
|
|
|
$ |
5,988 |
|
|
$ |
(619 |
) |
|
|
(a) |
Interest rate swap was assumed in October 2017 as part of an UPREIT transaction. |
102
The total loss recognized, and the location of the loss in the accompanying Consolidated Statements of Income and Comprehensive Income, from converting from variable rates to fixed rates under these agreements is as follows for the years ended December 31, 2017, 2016, and 2015:
|
|
|
Effective Portion |
|
|
Ineffective Portion |
|
||||||
|
(in thousands) |
|
Location of Loss Reclassified from Accumulated Other Comprehensive Income into Income |
|
Amount of Loss Reclassified from Accumulated Other Comprehensive Income into Income |
|
|
Location of Loss Recognized in Income on Derivatives |
|
Amount of Loss Recognized in Income on Derivatives |
|
||
|
Interest rate swaps |
|
|
|
|
|
|
|
|
|
|
|
|
|
2017 |
|
Interest expense |
|
$ |
5,099 |
|
|
Interest expense |
|
$ |
332 |
|
|
2016 |
|
Interest expense |
|
|
9,322 |
|
|
Interest expense |
|
|
— |
|
|
2015 |
|
Interest expense |
|
|
7,162 |
|
|
Interest expense |
|
|
— |
|
Amounts related to the interest rate swaps expected to be reclassified out of Accumulated other comprehensive income to Interest expense during 2018 are estimated to be $2,401. The Company is exposed to credit risk in the event of non-performance by the counterparties of the swaps. The Company minimizes this risk exposure by limiting counterparties to major banks who meet established credit and capital guidelines.
The fair value of the interest rate swaps at December 31, 2017 and 2016 are based on a valuation of the discounted future payments as provided by the counterparties, as disclosed in Note 2.
12. Non-Controlling Interests
Under the Company’s UPREIT structure, entities and individuals can contribute their properties in exchange for membership interests in the Operating Company. Properties contributed as part of UPREIT transactions were valued at $10,498, $7,190 and $57,583 during the years ended December 31, 2017, 2016, and 2015, respectively, which represents the estimated fair value of the properties contributed, less any assumed debt. The cumulative amount of UPREIT properties contributed, less assumed debt, amounted to $112,949, $102,451 and $95,261 through December 31, 2017, 2016 and 2015, respectively. In exchange for the properties contributed, 1,551, 1,427, and 1,330 non-controlling membership units were issued and outstanding, representing a 7.6%, 8.6% and 10.4% interest in the Operating Company at December 31, 2017, 2016 and 2015, respectively.
The Operating Company’s membership units are economically equivalent to the Corporation’s common stock and, subject to certain restrictions, are convertible into the Company’s common stock at the option of the respective unit holders on a one-to-one basis. The membership units are not redeemable for cash in any circumstance and are therefore considered to be permanent equity. Exchanges of membership units of the Operating Company held by non-controlling interest holders are recorded by reducing non-controlling interest on a historical cost basis with a corresponding increase in common stock and additional paid-in capital. There were 37 membership units exchanged for 37 shares of common stock for a value of $2,986 during 2017. There were no UPREIT units exchanged for common stock during 2016 and 2015.
Holders of the membership units in the Operating Company do not have voting rights at the Corporation level.
The Company recognized rental income related to properties contributed as part of UPREIT transactions in the amount of $13,153, $11,843 and $5,259 for the years ended December 31, 2017, 2016 and 2015, respectively.
103
13. Credit Risk Concentrations
The Company maintained bank balances that, at times, exceeded the federally insured limit during the years ended December 31, 2017, 2016 and 2015. The Company has not experienced losses relating to these deposits and management does not believe that the Company is exposed to any significant credit risk with respect to these amounts.
The Company’s rental property is managed by the Manager and the Asset Manager as described in Note 3. Management fees and acquisition expenses paid to the Manager and the Asset Manager represent 20%, 25% and 27% of total operating expenses for the years ended December 31, 2017, 2016, and 2015, respectively. The 2017 amount does not include acquisition costs paid to the Asset Manager as they were capitalized in accordance with ASU 2017-01 (see Note 2 and 3). The Company has mortgages and notes payable with four institutions that comprise 27%, 17%, 13% and 11% of total mortgages and notes payable at December 31, 2017. The Company had mortgages and notes payable with four institutions that comprised 20%, 18%, 12%, and 11% of total mortgages and notes payable at December 31, 2016. The Company had mortgages and notes payable with five institutions that comprised 22%, 13%, 13%, 11%, and 10% of total mortgages and notes payable at December 31, 2015. For the years ended December 31, 2017, 2016, and 2015, the Company had no individual tenants or common franchises that accounted for more than 10% of total revenues.
14. Equity
General
Pursuant to the Corporation’s Articles of Incorporation (the “Charter”), the Corporation is authorized to issue an aggregate of 100,000 shares of capital stock, consisting of 80,000 shares designated as common stock with a par value of $0.001 per share, and 20,000 shares designated as preferred stock with a par value of $0.001 per share (unrounded). The Board of Directors, without any action by the Corporation’s stockholders, may amend the Charter from time to time to increase or decrease the aggregate number of shares of capital stock or the number of shares of capital stock of any class or series that the Corporation has authority to issue.
Common Stock
The shares of the Corporation’s common stock entitle the holders to one vote per share on all matters upon which stockholders are entitled to vote, to receive dividends and other distributions as authorized by the Board of Directors in accordance with the Maryland General Corporation Law, and to all rights of a stockholder pursuant to the Maryland General Corporation Law. The common stock has no preferences or preemptive conversion or exchange rights.
Pursuant to the limited liability company agreement between the Corporation and the Operating Company, each outstanding membership unit of the Operating Company is convertible into one share of the Corporation’s common stock, subject to the terms and conditions set forth in the Operating Company’s operating agreement.
Preferred Stock
The Charter also provides the Board of Directors with the authority to issue one or more classes or series of preferred stock, and prior to the issuance of such shares of preferred stock, the Board of Directors shall have the power from time to time to classify or reclassify, in one or more series, any unissued shares and designate the preferences, rights and privileges of such shares of preferred stock. As of December 31, 2017 and 2016, no shares of the Corporation’s preferred stock were issued and outstanding.
Share Redemption Program
In 2009, the Board of Directors approved a share redemption program (“Share Redemption Program”) under which the Corporation may repurchase shares of its outstanding common stock after December 31, 2009. The Board of Directors approved and adopted an amended and restated Share Redemption Program effective as of June 28, 2017.
104
Under the Share Redemption Program, stockholders may request that the Corporation redeem shares after one year from the original investment date, subject to certain exceptions as set forth in the Share Redemption Program. Under the Share Redemption Program, the Corporation is not obligated to repurchase shares and, notwithstanding any other term of the Share Redemption Program, the Board of Directors or IDC may reject any share redemption request made by any stockholder at any time. Shares held for more than 12 months, but less than five years, will be redeemed at a purchase price equal to 95% of the current share value established from time to time by the IDC (the “Determined Share Value”), and shares held for five years or more will be redeemed at a purchase price equal to 100% of the current Determined Share Value, subject to certain exemptions as set forth in the Share Redemption Program.
Total shares redeemed pursuant to the Share Redemption Program in any quarter may not exceed 1% of the total number of shares outstanding at the beginning of the calendar year plus 50% of the total number of any additional shares issued during the prior calendar quarter under the Corporation’s Distribution Reinvestment Plan (“DRIP”), provided that the total number of shares redeemed during any calendar year may not exceed 5% of the number of shares outstanding as of the first day of such calendar year. The Board of Directors or the IDC may amend, suspend, or terminate the Share Redemption Program at any time upon 30 days’ notice to the Corporation’s stockholders.
The following table summarizes redemptions under the Share Redemption Program for the years ended December 31:
|
|
|
For the years ended December 31, |
|
|||||||||
|
(in thousands, except stockholders) |
|
2017 |
|
|
2016 |
|
|
2015 |
|
|||
|
Number of stockholders |
|
|
32 |
|
|
|
27 |
|
|
|
15 |
|
|
Number of shares |
|
|
119 |
|
|
|
109 |
|
|
|
43 |
|
|
Aggregate redemption price |
|
$ |
9,439 |
|
|
$ |
8,154 |
|
|
$ |
3,054 |
|
Distribution Reinvestment Plan
The Corporation has adopted the DRIP, pursuant to which the Corporation’s stockholders and holders of membership units in the Operating Company (other than the Corporation), may elect to have cash distributions reinvested in additional shares of the Corporation’s common stock. Cash distributions will be reinvested in additional shares of common stock pursuant to the DRIP at a per share price equal to 98% of the Determined Share Value as of the applicable distribution date. The Corporation may amend the DRIP at any time upon written notice to each participant at least 10 days prior to the effective date of the amendment. The Corporation may terminate the DRIP upon written notice to each participant at least 30 days prior to the effective date of the termination. At December 31, 2017, 2016 and 2015 a total of 1,592, 1,076 and 684, shares of common stock, respectively, have been issued under the DRIP.
105
The following table summarizes the components used in the calculation of basic and diluted earnings per share (EPS) for the years ended December 31:
|
(in thousands, except per share) |
|
For the years ended December 31, |
|
|||||||||
|
|
|
2017 |
|
|
2016 |
|
|
2015 |
|
|||
|
Basic earnings: |
|
|
|
|
|
|
|
|
|
|
|
|
|
Net earnings attributable to Broadstone Net Lease, Inc |
|
$ |
54,799 |
|
|
$ |
36,354 |
|
|
$ |
19,287 |
|
|
Diluted earnings: |
|
|
|
|
|
|
|
|
|
|
|
|
|
Net earnings attributable to Broadstone Net Lease, Inc |
|
$ |
54,799 |
|
|
$ |
36,354 |
|
|
$ |
19,287 |
|
|
Net earnings attributable to non-controlling interests |
|
|
4,756 |
|
|
|
3,914 |
|
|
|
1,603 |
|
|
|
|
$ |
59,555 |
|
|
$ |
40,268 |
|
|
$ |
20,890 |
|
|
Basic and diluted weighted average shares outstanding: |
|
|
|
|
|
|
|
|
|
|
|
|
|
Weighted average number of common shares outstanding used in basic earnings per share |
|
|
17,084 |
|
|
|
13,178 |
|
|
|
8,989 |
|
|
Effects of convertible membership units |
|
|
1,483 |
|
|
|
1,419 |
|
|
|
747 |
|
|
Weighted average number of common shares outstanding used in diluted earnings per share |
|
|
18,567 |
|
|
|
14,597 |
|
|
|
9,736 |
|
|
Basic and diluted net earnings per common share |
|
$ |
3.21 |
|
|
$ |
2.76 |
|
|
$ |
2.15 |
|
In the table above, outstanding membership units are included in the diluted earnings per share calculation. However, because such membership units would also require that the share of the Operating Company income attributable to such membership units also be added back to net income, there is no effect on EPS.
16. Income Taxes
For federal income tax purposes, distributions to stockholders are characterized as ordinary dividends, capital gain distributions, or return of capital distributions. Return of capital distributions will reduce stockholders’ basis in their shares, but not below zero. The portion of the distribution that exceeds the adjusted basis of the stock with be treated as gain from the sale or exchange of property. The following table shows the character of the distributions the Company paid on a percentage basis for the years ended December 31, 2017, 2016, and 2015:
|
Character of Distributions |
|
For the years ended December 31, |
|
|||||||||
|
|
|
2017 |
|
|
2016 |
|
|
2015 |
|
|||
|
Ordinary dividends |
|
|
51 |
% |
|
|
58 |
% |
|
|
51 |
% |
|
Capital gain distributions |
|
|
— |
% |
|
|
— |
% |
|
|
— |
% |
|
Return of capital distributions |
|
|
49 |
% |
|
|
42 |
% |
|
|
49 |
% |
|
|
|
|
100 |
% |
|
|
100 |
% |
|
|
100 |
% |
17. Supplemental Cash Flow Disclosures
Cash paid for interest was $32,429, $28,147 and $20,974 for the years ended December 31, 2017, 2016, and 2015, respectively. Cash paid for state income and franchise taxes was $655, $310 and $44 for the years ended December 31, 2017, 2016, and 2015, respectively.
The following are non-cash transactions and have been excluded from the accompanying Consolidated Statements of Cash Flows:
|
|
• |
During the years ended December 31, 2017, 2016, and 2015, the Company issued 499, 391, and 258 shares, respectively, of common stock with a value of approximately $38,848, $27,615, and $18,046, respectively, under the terms of the Distribution Reinvestment Plan (see Note 14). |
106
|
|
• |
During the year ended December 31, 2015, the Company issued 139 shares with a value of $10,000 to the Manager in exchange for 100 preferred units of the Manager (see Note 3). |
|
|
• |
During the years ended December 31, 2017, 2016, and 2015, the Company issued 161, 97, and 793 membership units, respectively, in exchange for property contributed in UPREIT transactions valued at $12,913, $7,190, and $57,583, respectively (see Note 12). |
|
|
• |
During the year ended December 31, 2016, the Company issued a note receivable for $3,700 in connection with the sale of real estate (see Note 8). |
|
|
• |
At December 31, 2017 and 2016, dividend amounts declared and accrued but not yet paid amounted to $8,449 and $6,643, respectively. |
|
|
• |
In connection with real estate transactions conducted during the years ended December 31, 2017 and 2016, the Company accepted tenant improvement allowances and credits for rent in advance of $2,777 and $1,730, and $8,649 and $2,367, respectively, in exchange for a reduction to the cash paid for the associated real estate assets. |
18. Commitments and Contingencies
From time to time, the Company is a party to various litigation matters incidental to the conduct of the Company’s business. While the resolution of such matters cannot be predicted with certainty, based on currently available information, the Company does not believe that the final outcome of any of these matters will have a material effect on its consolidated financial position, results of operations or liquidity.
In connection with ownership and operation of real estate, the Company may potentially be liable for cost and damages related to environmental matters. The Company is not aware of any non-compliance, liability, claim, or other environmental condition that would have a material effect on its consolidated financial position, results of operations or liquidity.
As part of acquisitions closed during 2017 and 2016, the Company assumed six separate lease agreements that provided for a total of $2,777 and $10,464, respectively, in tenant improvement allowances. During the years ended December 31, 2017 and 2016, payments of $6,598 and $974, respectively, have been made for work completed under these allowances, resulting in a total tenant improvement allowance of $5,669 and $9,490 at December 31, 2017 and 2016, respectively.
The Company is a party to three separate Tax Protection Agreements (Agreements) with the contributing members (Protected Members) of three distinct UPREIT transactions conducted in October 2017, February 2016, and November 2015. The Agreements require the Company to pay monetary damages in the event of a sale, exchange, transfer or other disposal of the contributed property in a taxable transaction that would cause a Protected Member to recognize a Protected Gain, as defined in the Agreements and subject to certain exceptions. In such an event, the Company will pay monetary damages to the Protected Members in the amount of the aggregate Federal, state and local income taxes incurred as a result of the income or gain allocated or recognized by the Protected Member as an outcome of the transaction, subject to certain caps and limitations contained in the Agreements. The Company is required to allocate to the Protected Members, an amount of nonrecourse liabilities that is at least equal to the Minimum Liability Amount for each Protected Member, as contained in the Agreements. The minimum liability amount and the associated allocation of nonrecourse liabilities are calculated in accordance with applicable tax regulations, are completed at the Operating Company level, and do not represent GAAP accounting. Therefore, there is no impact to the Consolidated Financial Statements. If the nonrecourse liabilities allocated do not meet the requirement, the Company will pay monetary damages to the Protected Members in the amount of the aggregate federal, state and local income taxes incurred as a result of the income or gain allocated or recognized by the Protected Member as an outcome to the default. The maximum aggregate amount the Company may be liable for under the Agreements is approximately $12,300. Based on information available, the Company does not believe that the events resulting in damages as detailed above have occurred.
107
Through February 28, 2018, the Company has raised $37,795 for a total of 469 shares through monthly equity closings, including dividend reinvestments. Through February 15, 2018, the Company has paid $16,961 in distributions, including dividend reinvestments.
On February 9, 2018, the Board of Directors declared a distribution of $0.43 per share on the Company’s common stock and approved a distribution of $0.43 per membership unit for monthly distributions through April 27, 2018. The distributions are payable on the 15th of the following month to stockholders and unit holders of record on the last day of the month. In addition, the Company’s IDC determined the share value for the Company’s common stock is $81.00 per share for subscription agreements received from February 1, 2018 through April 30, 2018.
Subsequent to December 31, 2017, the Operating Company paid off borrowings on the Revolver in the amount of $35,000.
Effective January 1, 2018, the Property Management Agreement (see Note 3) was amended to extend the recurring term of the agreement from one year to three years, clarify termination provisions and include a Termination Event concept, as defined in the amended Property Management Agreement, include a Key Person Event concept, as defined in the amended Property Management Agreement, and remove fee provisions relating to short-term financing or guarantees provided by the Manager to the Operating Company.
As amended, the Property Management Agreement will automatically renew on January 1, 2019 for three years ending December 31, 2021, subject to earlier termination per the amended Property Management Agreement. The amended Property Management Agreement provides that the Property Management Agreement can be terminated (i) immediately by the IDC for Cause, as defined in the amended Property Management Agreement, (ii) by the IDC, upon 30 days written notice to the Manager, in connection with a change in control, as defined in the amended Property Management Agreement , (iii) by the IDC, by providing the Manager with written notice of termination not less than one year prior to the last calendar day of any renewal term, (iv) by the Manager upon written notice to the Company not less than one year prior to the last calendar day of any renewal period, (v) automatically in the event of a Termination Event, and (vi) by the IDC upon a Key Person Event.
Effective January 1, 2018 the Asset Management Agreement (see Note 3) was amended to extend the recurring term of the agreement from one year to three years, provide for additional disposition fee provisions, and include a Disposition Event concept and a Key Person Event concept, each as defined in the amended Asset Management Agreement.
As amended, the Asset Management Agreement will automatically renew on January 1, 2019 for three years ending December 31, 2021, subject to earlier termination per the amended Asset Management Agreement. The amended Asset Management Agreement provides that the Asset Management Agreement can be terminated (i) immediately by the IDC for Cause, as defined in the amended Asset Management Agreement, (ii) by the IDC, upon 30 days written notice to the Asset Manager, in connection with a change in control, as defined in the amended Asset Management Agreement, (iii) by the IDC, by providing the Asset Manager with written notice of termination not less than one year prior to the last calendar day of any renewal term, (iv) by the Asset Manager upon written notice to the Company not less than one year prior to the last calendar day of any renewal period, (v) automatically in the event of a Disposition Event, as defined in the amended Asset Management Agreement, and (vi) by the IDC upon a Key Person Event, as defined in the amended Asset Management Agreement.
The amended Asset Management Agreement provides that, in the event of any Disposition Event, the Operating Company will pay the Asset Manager a fee (“Disposition Event Fee”) equal to 1.0% of the Aggregate Consideration, as defined in the amended Asset Management Agreement, received in connection with such Disposition Event. The amended Asset Management Agreement provides that no Disposition Event Fee will be paid solely in connection with a listing of the Company’s common stock or other equity securities of the Company on a securities market or exchange, and the Asset Manager will never be entitled to receive both disposition fees related to property sales (see Note 3) and a Disposition Event Fee in connection with the same Disposition Event.
108
20. Selected Quarterly Results (unaudited)
Presented below is a summary of the Company’s unaudited quarterly financial information for the years ended December 31, 2017 and 2016:
|
|
|
For the Quarter Ended |
|
|||||||||||||
|
(in thousands, except per share) |
|
March 31, 2017 |
|
|
June 30, 2017 |
|
|
September 30, 2017 |
|
|
December 31, 2017 |
|
||||
|
Total revenues |
|
$ |
42,185 |
|
|
$ |
43,671 |
|
|
$ |
46,235 |
|
|
$ |
49,472 |
|
|
Total operating expenses |
|
|
(21,544 |
) |
|
|
(22,026 |
) |
|
|
(26,827 |
) |
|
|
(26,284 |
) |
|
Operating income |
|
$ |
20,641 |
|
|
$ |
21,645 |
|
|
$ |
19,408 |
|
|
$ |
23,188 |
|
|
Net income |
|
$ |
13,747 |
|
|
$ |
15,992 |
|
|
$ |
12,990 |
|
|
$ |
16,826 |
|
|
Net income attributable to non-controlling interests |
|
|
(1,153 |
) |
|
|
(1,265 |
) |
|
|
(1,042 |
) |
|
|
(1,296 |
) |
|
Net income attributable to Broadstone Net Lease, Inc. |
|
$ |
12,594 |
|
|
$ |
14,727 |
|
|
$ |
11,948 |
|
|
$ |
15,530 |
|
|
Net earnings per common share basic and diluted |
|
$ |
0.81 |
|
|
$ |
0.89 |
|
|
$ |
0.68 |
|
|
$ |
0.84 |
|
|
Weighted average number of common shares outstanding |
|
|
|
|
|
|
|
|
|
|
|
|
|
|
|
|
|
Basic |
|
|
15,582 |
|
|
|
16,623 |
|
|
|
17,617 |
|
|
|
18,515 |
|
|
Diluted |
|
|
17,009 |
|
|
|
18,051 |
|
|
|
19,147 |
|
|
|
20,096 |
|
|
|
|
For the Quarter Ended |
|
|||||||||||||
|
(in thousands, except per share) |
|
March 31, 2016 |
|
|
June 30, 2016 |
|
|
September 30, 2016 |
|
|
December 31, 2016 |
|
||||
|
Total revenues |
|
$ |
31,587 |
|
|
$ |
34,823 |
|
|
$ |
37,010 |
|
|
$ |
39,449 |
|
|
Total operating expenses |
|
|
(16,115 |
) |
|
|
(21,056 |
) |
|
|
(20,133 |
) |
|
|
(21,927 |
) |
|
Operating income |
|
$ |
15,472 |
|
|
$ |
13,767 |
|
|
$ |
16,877 |
|
|
$ |
17,522 |
|
|
Net income |
|
$ |
5,701 |
|
|
$ |
5,356 |
|
|
$ |
15,417 |
|
|
$ |
13,794 |
|
|
Net income attributable to non-controlling interests |
|
|
(603 |
) |
|
|
(538 |
) |
|
|
(1,459 |
) |
|
|
(1,314 |
) |
|
Net income attributable to Broadstone Net Lease, Inc. |
|
$ |
5,098 |
|
|
$ |
4,818 |
|
|
$ |
13,958 |
|
|
$ |
12,480 |
|
|
Net earnings per common share basic and diluted |
|
$ |
0.43 |
|
|
$ |
0.38 |
|
|
$ |
1.02 |
|
|
$ |
0.86 |
|
|
Weighted average number of common shares outstanding |
|
|
|
|
|
|
|
|
|
|
|
|
|
|
|
|
|
Basic |
|
|
11,802 |
|
|
|
12,766 |
|
|
|
13,647 |
|
|
|
14,497 |
|
|
Diluted |
|
|
13,196 |
|
|
|
14,193 |
|
|
|
15,074 |
|
|
|
15,924 |
|
109
Broadstone Net Lease, Inc. and Subsidiaries
Schedule III – Real Estate Assets and Accumulated Depreciation
As of December 31, 2017
(in thousands)
|
|
|
|
|
|
|
Initial Costs to Company(A) |
|
|
Costs Capitalized Subsequent to Acquisition |
|
Gross Amount at Which Carried at Close of Period |
|
|
|
|
|
|
|
|
|
|
Life on Which |
||||||||||||||||||||||
|
Description |
|
Encumbrance |
|
|
Land |
|
|
Buildings and Improvements |
|
|
Land |
|
|
Improvements |
|
|
Carrying Costs |
|
Land |
|
|
Buildings and Improvements |
|
|
Total(B) |
|
|
Accumulated Depreciation |
|
|
Date of Construction |
|
Date Acquired |
|
Depreciation is Computed |
|||||||||
|
Industrial Properties: |
|
|
|
|
|
|
|
|
|
|
|
|
|
|
|
|
|
|
|
|
|
|
|
|
|
|
|
|
|
|
|
|
|
|
|
|
|
|
|
|
|
|
|
|
|
12940 Prosperity Avenue, Becker, MN |
|
$ |
750 |
|
|
$ |
921 |
|
|
$ |
4,540 |
|
|
$ |
— |
|
|
$ |
— |
|
|
|
|
$ |
921 |
|
|
$ |
4,540 |
|
|
$ |
5,461 |
|
|
$ |
1,267 |
|
|
2000 |
|
2008 |
|
15-39 years |
|
4401 South Orchard Street, Tacoma, WA |
|
|
— |
|
|
|
1,634 |
|
|
|
4,902 |
|
|
|
— |
|
|
|
— |
|
|
|
|
|
1,634 |
|
|
|
4,902 |
|
|
|
6,536 |
|
|
|
1,075 |
|
|
1977 |
|
2011 |
|
15-39 years |
|
2110 Summit Street, New Haven, IN |
|
|
— |
|
|
|
445 |
|
|
|
2,521 |
|
|
|
— |
|
|
|
— |
|
|
|
|
|
445 |
|
|
|
2,521 |
|
|
|
2,966 |
|
|
|
647 |
|
|
1960 |
|
2011 |
|
15-39 years |
|
10800 World Trade Blvd, Morrisville, NC |
|
|
— |
|
|
|
2,034 |
|
|
|
8,137 |
|
|
|
— |
|
|
|
— |
|
|
|
|
|
2,034 |
|
|
|
8,137 |
|
|
|
10,171 |
|
|
|
1,499 |
|
|
1999 |
|
2012 |
|
15-39 years |
|
800 Howerton Lane, Eureka, MO |
|
|
— |
|
|
|
2,328 |
|
|
|
9,311 |
|
|
|
— |
|
|
|
— |
|
|
|
|
|
2,328 |
|
|
|
9,311 |
|
|
|
11,639 |
|
|
|
2,342 |
|
|
1990 |
|
2012 |
|
15-39 years |
|
2001 T.W. Alexander Drive, Durham, NC |
|
|
11,670 |
|
|
|
3,000 |
|
|
|
17,531 |
|
|
|
— |
|
|
|
— |
|
|
|
|
|
3,000 |
|
|
|
17,531 |
|
|
|
20,531 |
|
|
|
3,437 |
|
|
2009 |
|
2012 |
|
15-39 years |
|
11050 WLY Bldg. P, Houston, TX |
|
|
— |
|
|
|
690 |
|
|
|
2,071 |
|
|
|
— |
|
|
|
— |
|
|
|
|
|
690 |
|
|
|
2,071 |
|
|
|
2,761 |
|
|
|
355 |
|
|
2007 |
|
2012 |
|
15-39 years |
|
11050 WLY Bldg. S, Houston, TX |
|
|
— |
|
|
|
704 |
|
|
|
2,113 |
|
|
|
— |
|
|
|
— |
|
|
|
|
|
704 |
|
|
|
2,113 |
|
|
|
2,817 |
|
|
|
348 |
|
|
2007 |
|
2012 |
|
15-39 years |
|
1120 Marvin A. Smith Road, Kilgore, TX |
|
|
— |
|
|
|
160 |
|
|
|
908 |
|
|
|
— |
|
|
|
— |
|
|
|
|
|
160 |
|
|
|
908 |
|
|
|
1,068 |
|
|
|
221 |
|
|
2008 |
|
2012 |
|
15-39 years |
|
1166 Commerce Blvd, American Canyon, CA |
|
|
9,168 |
|
|
|
2,378 |
|
|
|
26,144 |
|
|
|
— |
|
|
|
— |
|
|
|
|
|
2,378 |
|
|
|
26,144 |
|
|
|
28,522 |
|
|
|
4,479 |
|
|
2002 |
|
2012 |
|
15-39 years |
|
7700 New Carlisle Pike, Huber Heights, OH |
|
|
— |
|
|
|
583 |
|
|
|
1,748 |
|
|
|
— |
|
|
|
— |
|
|
|
|
|
583 |
|
|
|
1,748 |
|
|
|
2,331 |
|
|
|
420 |
|
|
1985 |
|
2012 |
|
15-39 years |
|
34000 Melinz Parkway, Eastlake, OH |
|
|
— |
|
|
|
854 |
|
|
|
2,562 |
|
|
|
— |
|
|
|
— |
|
|
|
|
|
854 |
|
|
|
2,562 |
|
|
|
3,416 |
|
|
|
526 |
|
|
1981 |
|
2012 |
|
15-39 years |
|
10550 S. Sam Houston Pkwy W, Houston, TX |
|
|
— |
|
|
|
3,250 |
|
|
|
9,751 |
|
|
|
— |
|
|
|
— |
|
|
|
|
|
3,250 |
|
|
|
9,751 |
|
|
|
13,001 |
|
|
|
1,489 |
|
|
2005 |
|
2012 |
|
15-39 years |
|
1800 N. Mason Road, Katy, TX |
|
|
— |
|
|
|
1,978 |
|
|
|
7,912 |
|
|
|
— |
|
|
|
— |
|
|
|
|
|
1,978 |
|
|
|
7,912 |
|
|
|
9,890 |
|
|
|
1,214 |
|
|
2012 |
|
2012 |
|
15-39 years |
110
|
|
|
|
|
|
|
Initial Costs to Company(A) |
|
|
Costs Capitalized Subsequent to Acquisition |
|
Gross Amount at Which Carried at Close of Period |
|
|
|
|
|
|
|
|
|
|
Life on Which |
||||||||||||||||||||||
|
Description |
|
Encumbrance |
|
|
Land |
|
|
Buildings and Improvements |
|
|
Land |
|
|
Improvements |
|
|
Carrying Costs |
|
Land |
|
|
Buildings and Improvements |
|
|
Total(B) |
|
|
Accumulated Depreciation |
|
|
Date of Construction |
|
Date Acquired |
|
Depreciation is Computed |
|||||||||
|
1400 13th Avenue, Union Grove, WI |
|
|
— |
|
|
|
239 |
|
|
|
957 |
|
|
|
— |
|
|
|
— |
|
|
|
|
|
239 |
|
|
|
957 |
|
|
|
1,196 |
|
|
|
140 |
|
|
1993 |
|
2012 |
|
15-39 years |
|
1525 11th Avenue, Union Grove, WI |
|
|
— |
|
|
|
347 |
|
|
|
1,386 |
|
|
|
— |
|
|
|
— |
|
|
|
|
|
347 |
|
|
|
1,386 |
|
|
|
1,733 |
|
|
|
195 |
|
|
1979 |
|
2012 |
|
15-39 years |
|
1550 Cedar Line Drive, Rock Hill, SC |
|
|
— |
|
|
|
796 |
|
|
|
3,184 |
|
|
|
— |
|
|
|
72 |
|
|
|
|
|
796 |
|
|
|
3,256 |
|
|
|
4,052 |
|
|
|
642 |
|
|
1999 |
|
2012 |
|
15-39 years |
|
1450 13th Avenue, Union Grove, WI |
|
|
— |
|
|
|
427 |
|
|
|
3,413 |
|
|
|
— |
|
|
|
— |
|
|
|
|
|
427 |
|
|
|
3,413 |
|
|
|
3,840 |
|
|
|
324 |
|
|
2014 |
|
2015 |
|
15-39 years |
|
1325 West Fernau Avenue, Oshkosh, WI |
|
|
— |
|
|
|
456 |
|
|
|
869 |
|
|
|
— |
|
|
|
— |
|
|
|
|
|
456 |
|
|
|
869 |
|
|
|
1,325 |
|
|
|
79 |
|
|
2007 |
|
2015 |
|
15-39 years |
|
2501 N. Barrington Road, Hoffman Estates, IL |
|
|
— |
|
|
|
12,253 |
|
|
|
23,456 |
|
|
|
— |
|
|
|
— |
|
|
|
|
|
12,253 |
|
|
|
23,456 |
|
|
|
35,709 |
|
|
|
3,581 |
|
|
1988 |
|
2013 |
|
15-39 years |
|
1985 E Laketon Avenue, Muskegon, MI |
|
|
— |
|
|
|
168 |
|
|
|
2,751 |
|
|
|
— |
|
|
|
13 |
|
|
|
|
|
168 |
|
|
|
2,764 |
|
|
|
2,932 |
|
|
|
376 |
|
|
1985 |
|
2013 |
|
15-39 years |
|
2121 Latimer Drive, Muskegon, MI |
|
|
— |
|
|
|
454 |
|
|
|
6,889 |
|
|
|
— |
|
|
|
3 |
|
|
|
|
|
454 |
|
|
|
6,892 |
|
|
|
7,346 |
|
|
|
962 |
|
|
2012 |
|
2013 |
|
15-39 years |
|
2281 Port City Blvd, Muskegon, MI |
|
|
— |
|
|
|
463 |
|
|
|
2,512 |
|
|
|
— |
|
|
|
23 |
|
|
|
|
|
463 |
|
|
|
2,535 |
|
|
|
2,998 |
|
|
|
372 |
|
|
1978 |
|
2013 |
|
15-39 years |
|
2350 Black Creek Drive, Muskegon, MI |
|
|
— |
|
|
|
257 |
|
|
|
655 |
|
|
|
— |
|
|
|
— |
|
|
|
|
|
257 |
|
|
|
655 |
|
|
|
912 |
|
|
|
104 |
|
|
2005 |
|
2013 |
|
15-39 years |
|
711 E Porter Road, Norton Shores, MI |
|
|
— |
|
|
|
198 |
|
|
|
2,932 |
|
|
|
— |
|
|
|
— |
|
|
|
|
|
198 |
|
|
|
2,932 |
|
|
|
3,130 |
|
|
|
318 |
|
|
2002 |
|
2014 |
|
15-39 years |
|
1081 King Street, Greenwich, CT |
|
|
— |
|
|
|
16,898 |
|
|
|
959 |
|
|
|
— |
|
|
|
— |
|
|
|
|
|
16,898 |
|
|
|
959 |
|
|
|
17,857 |
|
|
|
131 |
|
|
1967 |
|
2014 |
|
15-39 years |
|
1401 Madeline Lane, Elgin, IL |
|
|
— |
|
|
|
4,339 |
|
|
|
17,458 |
|
|
|
— |
|
|
|
— |
|
|
|
|
|
4,339 |
|
|
|
17,458 |
|
|
|
21,797 |
|
|
|
1,883 |
|
|
2009 |
|
2014 |
|
15-39 years |
|
550 Dean Lakes Road, Shakopee, MN |
|
|
— |
|
|
|
3,962 |
|
|
|
21,296 |
|
|
|
— |
|
|
|
— |
|
|
|
|
|
3,962 |
|
|
|
21,296 |
|
|
|
25,258 |
|
|
|
2,407 |
|
|
2014 |
|
2014 |
|
15-39 years |
111
|
|
|
|
|
|
|
Initial Costs to Company(A) |
|
|
Costs Capitalized Subsequent to Acquisition |
|
Gross Amount at Which Carried at Close of Period |
|
|
|
|
|
|
|
|
|
|
Life on Which |
||||||||||||||||||||||
|
Description |
|
Encumbrance |
|
|
Land |
|
|
Buildings and Improvements |
|
|
Land |
|
|
Improvements |
|
|
Carrying Costs |
|
Land |
|
|
Buildings and Improvements |
|
|
Total(B) |
|
|
Accumulated Depreciation |
|
|
Date of Construction |
|
Date Acquired |
|
Depreciation is Computed |
|||||||||
|
550 Canino Road, Houston, TX |
|
|
— |
|
|
|
1,242 |
|
|
|
2,698 |
|
|
|
— |
|
|
|
— |
|
|
|
|
|
1,242 |
|
|
|
2,698 |
|
|
|
3,940 |
|
|
|
351 |
|
|
1972 |
|
2014 |
|
15-39 years |
|
1210 Innovation Drive, Winona, MN |
|
|
— |
|
|
|
1,653 |
|
|
|
7,694 |
|
|
|
— |
|
|
|
— |
|
|
|
|
|
1,653 |
|
|
|
7,694 |
|
|
|
9,347 |
|
|
|
697 |
|
|
2008 |
|
2014 |
|
15-39 years |
|
965 East Mark Street, Winona, MN |
|
|
— |
|
|
|
804 |
|
|
|
4,412 |
|
|
|
— |
|
|
|
— |
|
|
|
|
|
804 |
|
|
|
4,412 |
|
|
|
5,216 |
|
|
|
390 |
|
|
2008 |
|
2014 |
|
15-39 years |
|
850 I-30 East, Mt. Pleasant, TX |
|
|
— |
|
|
|
1,785 |
|
|
|
5,540 |
|
|
|
— |
|
|
|
— |
|
|
|
|
|
1,785 |
|
|
|
5,540 |
|
|
|
7,325 |
|
|
|
558 |
|
|
1994 |
|
2014 |
|
15-39 years |
|
300 County Road, Madill, OK |
|
|
— |
|
|
|
1,395 |
|
|
|
5,796 |
|
|
|
— |
|
|
|
— |
|
|
|
|
|
1,395 |
|
|
|
5,796 |
|
|
|
7,191 |
|
|
|
558 |
|
|
1999 |
|
2014 |
|
15-39 years |
|
800 Industrial Road, Madill, OK |
|
|
— |
|
|
|
2,657 |
|
|
|
1,566 |
|
|
|
— |
|
|
|
1,001 |
|
|
|
|
|
2,657 |
|
|
|
2,567 |
|
|
|
5,224 |
|
|
|
163 |
|
|
1972 |
|
2014 |
|
15-39 years |
|
110 Pettijohn Road, Madill, OK |
|
|
— |
|
|
|
621 |
|
|
|
1,759 |
|
|
|
— |
|
|
|
— |
|
|
|
|
|
621 |
|
|
|
1,759 |
|
|
|
2,380 |
|
|
|
170 |
|
|
1977 |
|
2014 |
|
15-39 years |
|
20975 US Hwy 80 (Industrial), Willis Point, TX |
|
|
— |
|
|
|
3,102 |
|
|
|
2,420 |
|
|
|
— |
|
|
|
— |
|
|
|
|
|
3,102 |
|
|
|
2,420 |
|
|
|
5,522 |
|
|
|
288 |
|
|
2003 |
|
2014 |
|
15-39 years |
|
223 Rip Wiley Road, Fitzgerald, GA |
|
|
— |
|
|
|
1,939 |
|
|
|
3,316 |
|
|
|
— |
|
|
|
— |
|
|
|
|
|
1,939 |
|
|
|
3,316 |
|
|
|
5,255 |
|
|
|
362 |
|
|
1997 |
|
2014 |
|
15-39 years |
|
502 Midway Road, Cordele, GA |
|
|
— |
|
|
|
2,705 |
|
|
|
3,786 |
|
|
|
— |
|
|
|
— |
|
|
|
|
|
2,705 |
|
|
|
3,786 |
|
|
|
6,491 |
|
|
|
358 |
|
|
2000 |
|
2014 |
|
15-39 years |
|
103 Titan Road, Kingston, OK |
|
|
— |
|
|
|
1,857 |
|
|
|
1,692 |
|
|
|
— |
|
|
|
— |
|
|
|
|
|
1,857 |
|
|
|
1,692 |
|
|
|
3,549 |
|
|
|
191 |
|
|
2013 |
|
2014 |
|
15-39 years |
|
13300 West I-20 East, Odessa, TX |
|
|
— |
|
|
|
529 |
|
|
|
3,327 |
|
|
|
— |
|
|
|
— |
|
|
|
|
|
529 |
|
|
|
3,327 |
|
|
|
3,856 |
|
|
|
296 |
|
|
2012 |
|
2015 |
|
15-39 years |
|
6625 Dobbin Road, Columbia, MD |
|
|
— |
|
|
|
667 |
|
|
|
9,220 |
|
|
|
— |
|
|
|
— |
|
|
|
|
|
667 |
|
|
|
9,220 |
|
|
|
9,887 |
|
|
|
772 |
|
|
1984 |
|
2015 |
|
15-39 years |
|
N85 W12545 Westbrook Crossing, Menomonee Falls, WI |
|
|
— |
|
|
|
1,378 |
|
|
|
18,557 |
|
|
|
— |
|
|
|
— |
|
|
|
|
|
1,378 |
|
|
|
18,557 |
|
|
|
19,935 |
|
|
|
1,489 |
|
|
2001 |
|
2015 |
|
15-39 years |
|
10800 175th Avenue NW, Elk River, MN |
|
|
— |
|
|
|
763 |
|
|
|
4,937 |
|
|
|
— |
|
|
|
— |
|
|
|
|
|
763 |
|
|
|
4,937 |
|
|
|
5,700 |
|
|
|
469 |
|
|
2008 |
|
2015 |
|
15-39 years |
112
|
|
|
|
|
|
|
Initial Costs to Company(A) |
|
|
Costs Capitalized Subsequent to Acquisition |
|
Gross Amount at Which Carried at Close of Period |
|
|
|
|
|
|
|
|
|
|
Life on Which |
||||||||||||||||||||||
|
Description |
|
Encumbrance |
|
|
Land |
|
|
Buildings and Improvements |
|
|
Land |
|
|
Improvements |
|
|
Carrying Costs |
|
Land |
|
|
Buildings and Improvements |
|
|
Total(B) |
|
|
Accumulated Depreciation |
|
|
Date of Construction |
|
Date Acquired |
|
Depreciation is Computed |
|||||||||
|
11074 179th Avenue, Elk River, MN |
|
|
— |
|
|
|
477 |
|
|
|
2,517 |
|
|
|
— |
|
|
|
— |
|
|
|
|
|
477 |
|
|
|
2,517 |
|
|
|
2,994 |
|
|
|
239 |
|
|
2006 |
|
2015 |
|
15-39 years |
|
3401 St Johns Parkway, Sanford, FL |
|
|
— |
|
|
|
2,075 |
|
|
|
7,600 |
|
|
|
— |
|
|
|
— |
|
|
|
|
|
2,075 |
|
|
|
7,600 |
|
|
|
9,675 |
|
|
|
616 |
|
|
2002 |
|
2015 |
|
15-39 years |
|
1001 10th Avenue, Columbus, GA |
|
|
— |
|
|
|
615 |
|
|
|
9,942 |
|
|
|
— |
|
|
|
— |
|
|
|
|
|
615 |
|
|
|
9,942 |
|
|
|
10,557 |
|
|
|
708 |
|
|
1907 |
|
2015 |
|
15-39 years |
|
1761 Newport Road, Ephrata, PA |
|
|
— |
|
|
|
531 |
|
|
|
6,995 |
|
|
|
— |
|
|
|
— |
|
|
|
|
|
531 |
|
|
|
6,995 |
|
|
|
7,526 |
|
|
|
739 |
|
|
2000 |
|
2015 |
|
15-39 years |
|
1990 Hood Road, Greer, SC |
|
|
— |
|
|
|
607 |
|
|
|
2,502 |
|
|
|
— |
|
|
|
— |
|
|
|
|
|
607 |
|
|
|
2,502 |
|
|
|
3,109 |
|
|
|
220 |
|
|
1978 |
|
2015 |
|
15-39 years |
|
3502 Enterprise Avenue, Joplin, MO |
|
|
— |
|
|
|
831 |
|
|
|
9,600 |
|
|
|
— |
|
|
|
— |
|
|
|
|
|
831 |
|
|
|
9,600 |
|
|
|
10,431 |
|
|
|
743 |
|
|
1993 |
|
2015 |
|
15-39 years |
|
27815 Highway Blvd, Katy, TX |
|
|
— |
|
|
|
1,493 |
|
|
|
3,883 |
|
|
|
— |
|
|
|
— |
|
|
|
|
|
1,493 |
|
|
|
3,883 |
|
|
|
5,376 |
|
|
|
335 |
|
|
1996 |
|
2015 |
|
15-39 years |
|
2769 Rouse Road, Kinston, NC |
|
|
— |
|
|
|
1,017 |
|
|
|
10,418 |
|
|
|
— |
|
|
|
— |
|
|
|
|
|
1,017 |
|
|
|
10,418 |
|
|
|
11,435 |
|
|
|
775 |
|
|
1979 |
|
2015 |
|
15-39 years |
|
2300 State Highway 121, Euless, TX |
|
|
— |
|
|
|
1,487 |
|
|
|
3,051 |
|
|
|
— |
|
|
|
— |
|
|
|
|
|
1,487 |
|
|
|
3,051 |
|
|
|
4,538 |
|
|
|
237 |
|
|
1991 |
|
2015 |
|
15-39 years |
|
1500 N Bolton, Jacksonville, TX |
|
|
— |
|
|
|
1,221 |
|
|
|
3,316 |
|
|
|
— |
|
|
|
— |
|
|
|
|
|
1,221 |
|
|
|
3,316 |
|
|
|
4,537 |
|
|
|
235 |
|
|
1974 |
|
2015 |
|
15-39 years |
|
651 Commerce Parkway, Lima, OH |
|
|
— |
|
|
|
656 |
|
|
|
21,645 |
|
|
|
— |
|
|
|
— |
|
|
|
|
|
656 |
|
|
|
21,645 |
|
|
|
22,301 |
|
|
|
1,321 |
|
|
2009 |
|
2015 |
|
15-39 years |
|
1109 E. Industrial Drive, Sulphur Springs, TX |
|
|
— |
|
|
|
1,720 |
|
|
|
20,756 |
|
|
|
— |
|
|
|
— |
|
|
|
|
|
1,720 |
|
|
|
20,756 |
|
|
|
22,476 |
|
|
|
1,266 |
|
|
1989 |
|
2015 |
|
15-39 years |
|
6410 Ameriplex Drive, Portage, IN |
|
|
— |
|
|
|
1,181 |
|
|
|
13,130 |
|
|
|
— |
|
|
|
— |
|
|
|
|
|
1,181 |
|
|
|
13,130 |
|
|
|
14,311 |
|
|
|
897 |
|
|
2001 |
|
2016 |
|
15-39 years |
|
6200 Glenn Carlson Drive, St. Cloud, MN |
|
|
— |
|
|
|
565 |
|
|
|
20,420 |
|
|
|
— |
|
|
|
— |
|
|
|
|
|
565 |
|
|
|
20,420 |
|
|
|
20,985 |
|
|
|
736 |
|
|
1999 |
|
2016 |
|
15-39 years |
|
350 Alvin Drive, New Kensington, PA |
|
|
— |
|
|
|
907 |
|
|
|
13,058 |
|
|
|
— |
|
|
|
— |
|
|
|
|
|
907 |
|
|
|
13,058 |
|
|
|
13,965 |
|
|
|
412 |
|
|
2015 |
|
2016 |
|
15-39 years |
113
|
|
|
|
|
|
|
Initial Costs to Company(A) |
|
|
Costs Capitalized Subsequent to Acquisition |
|
Gross Amount at Which Carried at Close of Period |
|
|
|
|
|
|
|
|
|
|
Life on Which |
||||||||||||||||||||||
|
Description |
|
Encumbrance |
|
|
Land |
|
|
Buildings and Improvements |
|
|
Land |
|
|
Improvements |
|
|
Carrying Costs |
|
Land |
|
|
Buildings and Improvements |
|
|
Total(B) |
|
|
Accumulated Depreciation |
|
|
Date of Construction |
|
Date Acquired |
|
Depreciation is Computed |
|||||||||
|
5575 Logan Street, Denver, CO |
|
|
— |
|
|
|
1,105 |
|
|
|
8,076 |
|
|
|
— |
|
|
|
— |
|
|
|
|
|
1,105 |
|
|
|
8,076 |
|
|
|
9,181 |
|
|
|
135 |
|
|
1975 |
|
2017 |
|
15-39 years |
|
400 E. 56th Avenue, Denver, CO |
|
|
— |
|
|
|
252 |
|
|
|
1,658 |
|
|
|
— |
|
|
|
— |
|
|
|
|
|
252 |
|
|
|
1,658 |
|
|
|
1,910 |
|
|
|
29 |
|
|
1977 |
|
2017 |
|
15-39 years |
|
N116W18271 Morse Drive, Germantown, WI |
|
|
— |
|
|
|
612 |
|
|
|
2,062 |
|
|
|
— |
|
|
|
— |
|
|
|
|
|
612 |
|
|
|
2,062 |
|
|
|
2,674 |
|
|
|
23 |
|
|
1989 |
|
2017 |
|
15-39 years |
|
N118W18845 Bunsen Drive, Germantown, WI |
|
|
— |
|
|
|
575 |
|
|
|
2,086 |
|
|
|
— |
|
|
|
— |
|
|
|
|
|
575 |
|
|
|
2,086 |
|
|
|
2,661 |
|
|
|
23 |
|
|
2000 |
|
2017 |
|
15-39 years |
|
900 Challanger Drive, Green Bay, WI |
|
|
— |
|
|
|
406 |
|
|
|
7,032 |
|
|
|
— |
|
|
|
— |
|
|
|
|
|
406 |
|
|
|
7,032 |
|
|
|
7,438 |
|
|
|
78 |
|
|
1989 |
|
2017 |
|
15-39 years |
|
4618 Woodland Drive, Two Rivers, WI |
|
|
— |
|
|
|
445 |
|
|
|
1,885 |
|
|
|
— |
|
|
|
— |
|
|
|
|
|
445 |
|
|
|
1,885 |
|
|
|
2,330 |
|
|
|
26 |
|
|
1994 |
|
2017 |
|
15-39 years |
|
3838 & 3900 Freedom Road, Little Chute, WI |
|
|
— |
|
|
|
342 |
|
|
|
52,744 |
|
|
|
— |
|
|
|
— |
|
|
|
|
|
342 |
|
|
|
52,744 |
|
|
|
53,086 |
|
|
|
578 |
|
|
2017 |
|
2017 |
|
7-39 years |
|
4248 West Post Road, Las Vegas, NV |
|
|
— |
|
|
|
3,034 |
|
|
|
11,856 |
|
|
|
— |
|
|
|
— |
|
|
|
|
|
3,034 |
|
|
|
11,856 |
|
|
|
14,890 |
|
|
|
42 |
|
|
2017 |
|
2017 |
|
15-39 years |
|
30000 Industrial Drive, Walker, LA |
|
|
— |
|
|
|
4,646 |
|
|
|
30,310 |
|
|
|
— |
|
|
|
— |
|
|
|
|
|
4,646 |
|
|
|
30,310 |
|
|
|
34,956 |
|
|
|
116 |
|
|
2017 |
|
2017 |
|
15-39 years |
|
220 S. Noah Drive, Saxonburg, PA |
|
|
— |
|
|
|
1,048 |
|
|
|
7,545 |
|
|
|
— |
|
|
|
— |
|
|
|
|
|
1,048 |
|
|
|
7,545 |
|
|
|
8,593 |
|
|
|
30 |
|
|
2008 |
|
2017 |
|
15-39 years |
|
912 Pittsburgh Road, Butler, PA |
|
|
— |
|
|
|
1,885 |
|
|
|
6,294 |
|
|
|
— |
|
|
|
— |
|
|
|
|
|
1,885 |
|
|
|
6,294 |
|
|
|
8,179 |
|
|
|
27 |
|
|
1990 |
|
2017 |
|
15-39 years |
|
1701 Broad Street, Story City, IA |
|
|
— |
|
|
|
5,700 |
|
|
|
13,916 |
|
|
|
— |
|
|
|
— |
|
|
|
|
|
5,700 |
|
|
|
13,916 |
|
|
|
19,616 |
|
|
|
55 |
|
|
1997 |
|
2017 |
|
15-39 years |
|
30-32 Great Oaks Boulevard, San Jose, CA |
|
|
— |
|
|
|
9,489 |
|
|
|
18,617 |
|
|
|
— |
|
|
|
727 |
|
|
|
|
|
9,489 |
|
|
|
19,344 |
|
|
|
28,833 |
|
|
|
70 |
|
|
1983 |
|
2017 |
|
15-39 years |
|
Healthcare Properties: |
|
|
|
|
|
|
|
|
|
|
|
|
|
|
|
|
|
|
|
|
|
|
|
|
|
|
|
|
|
|
|
|
|
|
|
|
|
|
|
|
|
|
|
|
|
3420 Elvis Presley Boulevard, Memphis, TN |
|
|
— |
|
|
|
530 |
|
|
|
2,722 |
|
|
|
— |
|
|
|
— |
|
|
|
|
|
530 |
|
|
|
2,722 |
|
|
|
3,252 |
|
|
|
718 |
|
|
1993 |
|
2009 |
|
15-39 years |
114
|
|
|
|
|
|
|
Initial Costs to Company(A) |
|
|
Costs Capitalized Subsequent to Acquisition |
|
Gross Amount at Which Carried at Close of Period |
|
|
|
|
|
|
|
|
|
|
Life on Which |
||||||||||||||||||||||
|
Description |
|
Encumbrance |
|
|
Land |
|
|
Buildings and Improvements |
|
|
Land |
|
|
Improvements |
|
|
Carrying Costs |
|
Land |
|
|
Buildings and Improvements |
|
|
Total(B) |
|
|
Accumulated Depreciation |
|
|
Date of Construction |
|
Date Acquired |
|
Depreciation is Computed |
|||||||||
|
837 FM 1960 West, Houston, TX |
|
|
— |
|
|
|
1,076 |
|
|
|
3,226 |
|
|
|
— |
|
|
|
— |
|
|
|
|
|
1,076 |
|
|
|
3,226 |
|
|
|
4,302 |
|
|
|
633 |
|
|
2005 |
|
2011 |
|
15-39 years |
|
837 FM 1960 West, Houston, TX |
|
|
— |
|
|
|
540 |
|
|
|
1,647 |
|
|
|
— |
|
|
|
— |
|
|
|
|
|
540 |
|
|
|
1,647 |
|
|
|
2,187 |
|
|
|
387 |
|
|
2005 |
|
2011 |
|
15-39 years |
|
16519 South Route 59, Plainfield, IL |
|
|
— |
|
|
|
128 |
|
|
|
7,843 |
|
|
|
702 |
|
|
|
1,489 |
|
|
|
|
|
830 |
|
|
|
9,332 |
|
|
|
10,162 |
|
|
|
1,045 |
|
|
2012 |
|
2013 |
|
15-39 years |
|
9780 South Estrella Parkway, Goodyear, AZ |
|
|
— |
|
|
|
558 |
|
|
|
3,529 |
|
|
|
— |
|
|
|
— |
|
|
|
|
|
558 |
|
|
|
3,529 |
|
|
|
4,087 |
|
|
|
430 |
|
|
2013 |
|
2013 |
|
15-39 years |
|
22741 Professional Drive, Kingwood, TX |
|
|
— |
|
|
|
253 |
|
|
|
5,236 |
|
|
|
— |
|
|
|
— |
|
|
|
|
|
253 |
|
|
|
5,236 |
|
|
|
5,489 |
|
|
|
486 |
|
|
2009 |
|
2014 |
|
15-39 years |
|
4640 Loop 289, Lubbock, TX |
|
|
— |
|
|
|
1,616 |
|
|
|
6,195 |
|
|
|
— |
|
|
|
135 |
|
|
|
|
|
1,616 |
|
|
|
6,330 |
|
|
|
7,946 |
|
|
|
568 |
|
|
2001 |
|
2014 |
|
15-39 years |
|
3912 32nd Avenue, Hudsonville, MI |
|
|
— |
|
|
|
199 |
|
|
|
3,631 |
|
|
|
— |
|
|
|
— |
|
|
|
|
|
199 |
|
|
|
3,631 |
|
|
|
3,830 |
|
|
|
286 |
|
|
2007 |
|
2015 |
|
15-39 years |
|
5201 Northshore Drive, North Little Rock, AR |
|
|
— |
|
|
|
532 |
|
|
|
51,843 |
|
|
|
— |
|
|
|
— |
|
|
|
|
|
532 |
|
|
|
51,843 |
|
|
|
52,375 |
|
|
|
2,986 |
|
|
2005 |
|
2015 |
|
15-39 years |
|
1421 Oakdale Road, Modesto, CA |
|
|
— |
|
|
|
689 |
|
|
|
19,200 |
|
|
|
— |
|
|
|
— |
|
|
|
|
|
689 |
|
|
|
19,200 |
|
|
|
19,889 |
|
|
|
710 |
|
|
1984 |
|
2016 |
|
15-39 years |
|
1501 Oakdale Road, Modesto, CA |
|
|
— |
|
|
|
300 |
|
|
|
4,273 |
|
|
|
— |
|
|
|
— |
|
|
|
|
|
300 |
|
|
|
4,273 |
|
|
|
4,573 |
|
|
|
165 |
|
|
1984 |
|
2016 |
|
15-39 years |
|
570 West Lanier Avenue, Fayetteville, GA |
|
|
— |
|
|
|
865 |
|
|
|
4,901 |
|
|
|
— |
|
|
|
— |
|
|
|
|
|
865 |
|
|
|
4,901 |
|
|
|
5,766 |
|
|
|
1,289 |
|
|
1985 |
|
2008 |
|
15-39 years |
|
17323 Red Oak Drive, Houston, TX |
|
|
1,813 |
|
|
|
598 |
|
|
|
3,388 |
|
|
|
— |
|
|
|
— |
|
|
|
|
|
598 |
|
|
|
3,388 |
|
|
|
3,986 |
|
|
|
863 |
|
|
1980 |
|
2008 |
|
15-39 years |
|
3475 S. Alpine Road, Rockford, IL |
|
|
— |
|
|
|
216 |
|
|
|
1,225 |
|
|
|
— |
|
|
|
— |
|
|
|
|
|
216 |
|
|
|
1,225 |
|
|
|
1,441 |
|
|
|
339 |
|
|
1993 |
|
2008 |
|
15-39 years |
|
11475 N. 2nd Street, Machesny Prk., IL |
|
|
— |
|
|
|
218 |
|
|
|
1,237 |
|
|
|
— |
|
|
|
— |
|
|
|
|
|
218 |
|
|
|
1,237 |
|
|
|
1,455 |
|
|
|
363 |
|
|
1996 |
|
2008 |
|
15-39 years |
|
1000 E. Riverside Boulevard, Loves Park, IL |
|
|
581 |
|
|
|
190 |
|
|
|
890 |
|
|
|
— |
|
|
|
— |
|
|
|
|
|
190 |
|
|
|
890 |
|
|
|
1,080 |
|
|
|
243 |
|
|
1982 |
|
2010 |
|
15-39 years |
115
|
|
|
|
|
|
|
Initial Costs to Company(A) |
|
|
Costs Capitalized Subsequent to Acquisition |
|
Gross Amount at Which Carried at Close of Period |
|
|
|
|
|
|
|
|
|
|
Life on Which |
||||||||||||||||||||||
|
Description |
|
Encumbrance |
|
|
Land |
|
|
Buildings and Improvements |
|
|
Land |
|
|
Improvements |
|
|
Carrying Costs |
|
Land |
|
|
Buildings and Improvements |
|
|
Total(B) |
|
|
Accumulated Depreciation |
|
|
Date of Construction |
|
Date Acquired |
|
Depreciation is Computed |
|||||||||
|
91 Brighton Woods Road, Pooler, GA |
|
|
— |
|
|
|
272 |
|
|
|
1,089 |
|
|
|
— |
|
|
|
— |
|
|
|
|
|
272 |
|
|
|
1,089 |
|
|
|
1,361 |
|
|
|
272 |
|
|
1990 |
|
2009 |
|
15-39 years |
|
533 Stephenson Avenue, Savannah, GA |
|
|
— |
|
|
|
160 |
|
|
|
641 |
|
|
|
— |
|
|
|
— |
|
|
|
|
|
160 |
|
|
|
641 |
|
|
|
801 |
|
|
|
162 |
|
|
1986 |
|
2009 |
|
15-39 years |
|
206 E. Montgomery Crossroads, Savannah, GA |
|
|
— |
|
|
|
114 |
|
|
|
457 |
|
|
|
— |
|
|
|
— |
|
|
|
|
|
114 |
|
|
|
457 |
|
|
|
571 |
|
|
|
104 |
|
|
1978 |
|
2009 |
|
15-39 years |
|
206 Johnny Mercer Boulevard, Savannah, GA |
|
|
— |
|
|
|
148 |
|
|
|
590 |
|
|
|
— |
|
|
|
— |
|
|
|
|
|
148 |
|
|
|
590 |
|
|
|
738 |
|
|
|
162 |
|
|
1981 |
|
2009 |
|
15-39 years |
|
837 FM 1960 West, Houston, TX |
|
|
5,820 |
|
|
|
2,022 |
|
|
|
6,065 |
|
|
|
— |
|
|
|
— |
|
|
|
|
|
2,022 |
|
|
|
6,065 |
|
|
|
8,087 |
|
|
|
1,380 |
|
|
2002 |
|
2010 |
|
15-39 years |
|
5165 West 72nd Avenue, Westminster, CO |
|
|
1,008 |
|
|
|
426 |
|
|
|
1,277 |
|
|
|
— |
|
|
|
— |
|
|
|
|
|
426 |
|
|
|
1,277 |
|
|
|
1,703 |
|
|
|
250 |
|
|
1999 |
|
2010 |
|
15-39 years |
|
2655 Ridgeway Avenue, Greece, NY |
|
|
— |
|
|
|
1,391 |
|
|
|
30,442 |
|
|
|
— |
|
|
|
3,232 |
|
|
|
|
|
1,391 |
|
|
|
33,674 |
|
|
|
35,065 |
|
|
|
6,499 |
|
|
2011 |
|
2010 |
|
7-39 years |
|
3069 Grand Pavilion Drive, Tampa, FL |
|
|
— |
|
|
|
580 |
|
|
|
3,304 |
|
|
|
— |
|
|
|
— |
|
|
|
|
|
580 |
|
|
|
3,304 |
|
|
|
3,884 |
|
|
|
668 |
|
|
2002 |
|
2011 |
|
15-39 years |
|
4719 North Habana Avenue, Tampa, FL |
|
|
— |
|
|
|
790 |
|
|
|
4,021 |
|
|
|
— |
|
|
|
— |
|
|
|
|
|
790 |
|
|
|
4,021 |
|
|
|
4,811 |
|
|
|
788 |
|
|
1985 |
|
2011 |
|
15-39 years |
|
2324 Oak Myrtle Lane, Wesley Chapel, FL |
|
|
— |
|
|
|
340 |
|
|
|
2,862 |
|
|
|
— |
|
|
|
— |
|
|
|
|
|
340 |
|
|
|
2,862 |
|
|
|
3,202 |
|
|
|
568 |
|
|
2008 |
|
2011 |
|
15-39 years |
|
3350 Bell Shoals Road, Brandon, FL |
|
|
— |
|
|
|
310 |
|
|
|
1,971 |
|
|
|
— |
|
|
|
— |
|
|
|
|
|
310 |
|
|
|
1,971 |
|
|
|
2,281 |
|
|
|
389 |
|
|
1998 |
|
2011 |
|
15-39 years |
|
5316 West Plano Parkway, Plano, TX |
|
|
— |
|
|
|
965 |
|
|
|
2,895 |
|
|
|
— |
|
|
|
— |
|
|
|
|
|
965 |
|
|
|
2,895 |
|
|
|
3,860 |
|
|
|
560 |
|
|
2000 |
|
2011 |
|
15-39 years |
|
1430 Lonnie Abbot Avenue, Ada, OK |
|
|
— |
|
|
|
293 |
|
|
|
1,172 |
|
|
|
— |
|
|
|
— |
|
|
|
|
|
293 |
|
|
|
1,172 |
|
|
|
1,465 |
|
|
|
226 |
|
|
2011 |
|
2011 |
|
15-39 years |
|
9072 US Highway 70, Durant, OK |
|
|
— |
|
|
|
131 |
|
|
|
741 |
|
|
|
— |
|
|
|
— |
|
|
|
|
|
131 |
|
|
|
741 |
|
|
|
872 |
|
|
|
145 |
|
|
2004 |
|
2011 |
|
15-39 years |
|
1144 S.W. 104th St., Oklahoma City, OK |
|
|
— |
|
|
|
427 |
|
|
|
1,282 |
|
|
|
— |
|
|
|
— |
|
|
|
|
|
427 |
|
|
|
1,282 |
|
|
|
1,709 |
|
|
|
232 |
|
|
2001 |
|
2011 |
|
15-39 years |
116
|
|
|
|
|
|
|
Initial Costs to Company(A) |
|
|
Costs Capitalized Subsequent to Acquisition |
|
Gross Amount at Which Carried at Close of Period |
|
|
|
|
|
|
|
|
|
|
Life on Which |
||||||||||||||||||||||
|
Description |
|
Encumbrance |
|
|
Land |
|
|
Buildings and Improvements |
|
|
Land |
|
|
Improvements |
|
|
Carrying Costs |
|
Land |
|
|
Buildings and Improvements |
|
|
Total(B) |
|
|
Accumulated Depreciation |
|
|
Date of Construction |
|
Date Acquired |
|
Depreciation is Computed |
|||||||||
|
1011 East Taft Avenue, Sapulpa, OK |
|
|
— |
|
|
|
510 |
|
|
|
1,271 |
|
|
|
— |
|
|
|
— |
|
|
|
|
|
510 |
|
|
|
1,271 |
|
|
|
1,781 |
|
|
|
208 |
|
|
2011 |
|
2012 |
|
15-39 years |
|
6250 Rufe Snow Drive, Ft. Worth, TX |
|
|
— |
|
|
|
350 |
|
|
|
1,691 |
|
|
|
— |
|
|
|
— |
|
|
|
|
|
350 |
|
|
|
1,691 |
|
|
|
2,041 |
|
|
|
265 |
|
|
2007 |
|
2012 |
|
15-39 years |
|
1411 S. Rangeline Rd., Joplin, MO |
|
|
— |
|
|
|
341 |
|
|
|
1,370 |
|
|
|
— |
|
|
|
— |
|
|
|
|
|
341 |
|
|
|
1,370 |
|
|
|
1,711 |
|
|
|
206 |
|
|
2012 |
|
2012 |
|
15-39 years |
|
2111 NW Cashe Road, Lawton, OK |
|
|
— |
|
|
|
357 |
|
|
|
1,422 |
|
|
|
— |
|
|
|
— |
|
|
|
|
|
357 |
|
|
|
1,422 |
|
|
|
1,779 |
|
|
|
216 |
|
|
2012 |
|
2012 |
|
15-39 years |
|
611 S. George Nigh Expressway, McAlester, OK |
|
|
— |
|
|
|
413 |
|
|
|
1,669 |
|
|
|
— |
|
|
|
— |
|
|
|
|
|
413 |
|
|
|
1,669 |
|
|
|
2,082 |
|
|
|
252 |
|
|
2012 |
|
2012 |
|
15-39 years |
|
1333 E. Main Street, Weatherford, OK |
|
|
— |
|
|
|
357 |
|
|
|
1,419 |
|
|
|
— |
|
|
|
— |
|
|
|
|
|
357 |
|
|
|
1,419 |
|
|
|
1,776 |
|
|
|
223 |
|
|
2012 |
|
2012 |
|
15-39 years |
|
2203 W. University Drive, Denton, TX |
|
|
— |
|
|
|
785 |
|
|
|
1,680 |
|
|
|
— |
|
|
|
— |
|
|
|
|
|
785 |
|
|
|
1,680 |
|
|
|
2,465 |
|
|
|
217 |
|
|
2013 |
|
2013 |
|
15-39 years |
|
2197 12th Avenue NW, Ardmore, OK |
|
|
— |
|
|
|
575 |
|
|
|
1,400 |
|
|
|
— |
|
|
|
— |
|
|
|
|
|
575 |
|
|
|
1,400 |
|
|
|
1,975 |
|
|
|
185 |
|
|
2013 |
|
2013 |
|
15-39 years |
|
1443 N Rock Road, Wichita, KS |
|
|
— |
|
|
|
295 |
|
|
|
1,606 |
|
|
|
— |
|
|
|
— |
|
|
|
|
|
295 |
|
|
|
1,606 |
|
|
|
1,901 |
|
|
|
205 |
|
|
2013 |
|
2013 |
|
15-39 years |
|
1224 SE Washinton Road, Bartlesville, OK |
|
|
— |
|
|
|
505 |
|
|
|
1,629 |
|
|
|
— |
|
|
|
— |
|
|
|
|
|
505 |
|
|
|
1,629 |
|
|
|
2,134 |
|
|
|
213 |
|
|
2013 |
|
2013 |
|
15-39 years |
|
1700 & 1710 Wuesthoff Drive, Viera, FL |
|
|
— |
|
|
|
3,320 |
|
|
|
13,281 |
|
|
|
— |
|
|
|
— |
|
|
|
|
|
3,320 |
|
|
|
13,281 |
|
|
|
16,601 |
|
|
|
2,083 |
|
|
1993 |
|
2012 |
|
15-39 years |
|
4937 Clark Road, Sarasota, FL |
|
|
— |
|
|
|
1,290 |
|
|
|
4,899 |
|
|
|
— |
|
|
|
— |
|
|
|
|
|
1,290 |
|
|
|
4,899 |
|
|
|
6,189 |
|
|
|
703 |
|
|
2002 |
|
2013 |
|
15-39 years |
|
4947 Clark Road, Sarasota, FL |
|
|
— |
|
|
|
934 |
|
|
|
5,013 |
|
|
|
— |
|
|
|
— |
|
|
|
|
|
934 |
|
|
|
5,013 |
|
|
|
5,947 |
|
|
|
687 |
|
|
2002 |
|
2013 |
|
15-39 years |
|
865 S. Indiana Avenue, Englewood, FL |
|
|
— |
|
|
|
207 |
|
|
|
679 |
|
|
|
— |
|
|
|
— |
|
|
|
|
|
207 |
|
|
|
679 |
|
|
|
886 |
|
|
|
96 |
|
|
1985 |
|
2013 |
|
15-39 years |
|
1350 South Sunny Slope Road, Brookfield, WI |
|
|
— |
|
|
|
338 |
|
|
|
4,603 |
|
|
|
— |
|
|
|
— |
|
|
|
|
|
338 |
|
|
|
4,603 |
|
|
|
4,941 |
|
|
|
631 |
|
|
2005 |
|
2013 |
|
15-39 years |
117
|
|
|
|
|
|
|
Initial Costs to Company(A) |
|
|
Costs Capitalized Subsequent to Acquisition |
|
Gross Amount at Which Carried at Close of Period |
|
|
|
|
|
|
|
|
|
|
Life on Which |
||||||||||||||||||||||
|
Description |
|
Encumbrance |
|
|
Land |
|
|
Buildings and Improvements |
|
|
Land |
|
|
Improvements |
|
|
Carrying Costs |
|
Land |
|
|
Buildings and Improvements |
|
|
Total(B) |
|
|
Accumulated Depreciation |
|
|
Date of Construction |
|
Date Acquired |
|
Depreciation is Computed |
|||||||||
|
2315 East Moreland Blvd, Waukesha, WI |
|
|
— |
|
|
|
302 |
|
|
|
11,218 |
|
|
|
— |
|
|
|
— |
|
|
|
|
|
302 |
|
|
|
11,218 |
|
|
|
11,520 |
|
|
|
1,418 |
|
|
2005 |
|
2013 |
|
15-39 years |
|
4455 South 108th Street, Greenfield, WI |
|
|
— |
|
|
|
212 |
|
|
|
7,163 |
|
|
|
— |
|
|
|
— |
|
|
|
|
|
212 |
|
|
|
7,163 |
|
|
|
7,375 |
|
|
|
902 |
|
|
2011 |
|
2013 |
|
15-39 years |
|
21700 Intertech Drive, Brookfield, WI |
|
|
— |
|
|
|
331 |
|
|
|
7,542 |
|
|
|
— |
|
|
|
— |
|
|
|
|
|
331 |
|
|
|
7,542 |
|
|
|
7,873 |
|
|
|
982 |
|
|
2008 |
|
2013 |
|
15-39 years |
|
913 N. 25th Street, Richmond, VA |
|
|
— |
|
|
|
348 |
|
|
|
2,986 |
|
|
|
— |
|
|
|
— |
|
|
|
|
|
348 |
|
|
|
2,986 |
|
|
|
3,334 |
|
|
|
338 |
|
|
2011 |
|
2013 |
|
15-39 years |
|
2958 Dorchester Drive, Montgomery, AL |
|
|
— |
|
|
|
94 |
|
|
|
1,303 |
|
|
|
— |
|
|
|
— |
|
|
|
|
|
94 |
|
|
|
1,303 |
|
|
|
1,397 |
|
|
|
172 |
|
|
2013 |
|
2013 |
|
15-39 years |
|
301 N Sidney Avenue, Russellvillee, AR |
|
|
— |
|
|
|
1,232 |
|
|
|
4,752 |
|
|
|
— |
|
|
|
— |
|
|
|
|
|
1,232 |
|
|
|
4,752 |
|
|
|
5,984 |
|
|
|
494 |
|
|
2010 |
|
2014 |
|
15-39 years |
|
1900 Aldersgate Road, Little Rock, AR |
|
|
— |
|
|
|
1,866 |
|
|
|
5,294 |
|
|
|
— |
|
|
|
— |
|
|
|
|
|
1,866 |
|
|
|
5,294 |
|
|
|
7,160 |
|
|
|
566 |
|
|
2012 |
|
2014 |
|
15-39 years |
|
2740 College Avenue, Conway, AR |
|
|
— |
|
|
|
1,522 |
|
|
|
3,579 |
|
|
|
— |
|
|
|
5,624 |
|
|
|
|
|
1,522 |
|
|
|
9,203 |
|
|
|
10,725 |
|
|
|
569 |
|
|
2007 |
|
2014 |
|
15-39 years |
|
3020 Mallory Lane, Franklin, TN |
|
|
— |
|
|
|
252 |
|
|
|
2,933 |
|
|
|
— |
|
|
|
— |
|
|
|
|
|
252 |
|
|
|
2,933 |
|
|
|
3,185 |
|
|
|
233 |
|
|
2005 |
|
2015 |
|
15-39 years |
|
1050 Bonaventure Drive, Elk Grove Village, IL |
|
|
— |
|
|
|
766 |
|
|
|
3,728 |
|
|
|
— |
|
|
|
— |
|
|
|
|
|
766 |
|
|
|
3,728 |
|
|
|
4,494 |
|
|
|
335 |
|
|
1985 |
|
2015 |
|
15-39 years |
|
364 S Independence Blvd, Virginia Beach, VA |
|
|
— |
|
|
|
827 |
|
|
|
3,310 |
|
|
|
— |
|
|
|
— |
|
|
|
|
|
827 |
|
|
|
3,310 |
|
|
|
4,137 |
|
|
|
162 |
|
|
2008 |
|
2016 |
|
15-39 years |
|
3000 Busch Lake Blvd., Tampa, FL |
|
|
— |
|
|
|
42 |
|
|
|
6,945 |
|
|
|
— |
|
|
|
— |
|
|
|
|
|
42 |
|
|
|
6,945 |
|
|
|
6,987 |
|
|
|
200 |
|
|
1999 |
|
2016 |
|
39 years |
|
2910 Busch Lake Blvd., Tampa, FL |
|
|
— |
|
|
|
8 |
|
|
|
732 |
|
|
|
— |
|
|
|
— |
|
|
|
|
|
8 |
|
|
|
732 |
|
|
|
740 |
|
|
|
21 |
|
|
1999 |
|
2016 |
|
39 years |
|
2950 Busch Lake Blvd., Tampa, FL |
|
|
— |
|
|
|
33 |
|
|
|
2,094 |
|
|
|
— |
|
|
|
— |
|
|
|
|
|
33 |
|
|
|
2,094 |
|
|
|
2,127 |
|
|
|
60 |
|
|
2013 |
|
2016 |
|
39 years |
|
19311 State Highway 249, Houston, TX |
|
|
— |
|
|
|
405 |
|
|
|
2,586 |
|
|
|
— |
|
|
|
— |
|
|
|
|
|
405 |
|
|
|
2,586 |
|
|
|
2,991 |
|
|
|
80 |
|
|
2002 |
|
2016 |
|
15-39 years |
118
|
|
|
|
|
|
|
Initial Costs to Company(A) |
|
|
Costs Capitalized Subsequent to Acquisition |
|
Gross Amount at Which Carried at Close of Period |
|
|
|
|
|
|
|
|
|
|
Life on Which |
||||||||||||||||||||||
|
Description |
|
Encumbrance |
|
|
Land |
|
|
Buildings and Improvements |
|
|
Land |
|
|
Improvements |
|
|
Carrying Costs |
|
Land |
|
|
Buildings and Improvements |
|
|
Total(B) |
|
|
Accumulated Depreciation |
|
|
Date of Construction |
|
Date Acquired |
|
Depreciation is Computed |
|||||||||
|
17512 US Highway 441, Mt. Dora, FL |
|
|
— |
|
|
|
477 |
|
|
|
691 |
|
|
|
— |
|
|
|
— |
|
|
|
|
|
477 |
|
|
|
691 |
|
|
|
1,168 |
|
|
|
66 |
|
|
1987 |
|
2015 |
|
15-39 years |
|
17560 US Highway 441, Mt. Dora, FL |
|
|
— |
|
|
|
1,338 |
|
|
|
4,788 |
|
|
|
— |
|
|
|
— |
|
|
|
|
|
1,338 |
|
|
|
4,788 |
|
|
|
6,126 |
|
|
|
349 |
|
|
1988 |
|
2015 |
|
15-39 years |
|
17556 SE 109th Terrace Road, Summerfield, FL |
|
|
— |
|
|
|
295 |
|
|
|
2,146 |
|
|
|
— |
|
|
|
— |
|
|
|
|
|
295 |
|
|
|
2,146 |
|
|
|
2,441 |
|
|
|
157 |
|
|
2000 |
|
2015 |
|
15-39 years |
|
17560 SE 109th Terrace Road, Summerfield, FL |
|
|
— |
|
|
|
362 |
|
|
|
2,632 |
|
|
|
— |
|
|
|
— |
|
|
|
|
|
362 |
|
|
|
2,632 |
|
|
|
2,994 |
|
|
|
192 |
|
|
2008 |
|
2015 |
|
15-39 years |
|
600 North 14th Street, Leesburg, FL |
|
|
— |
|
|
|
402 |
|
|
|
1,869 |
|
|
|
— |
|
|
|
— |
|
|
|
|
|
402 |
|
|
|
1,869 |
|
|
|
2,271 |
|
|
|
145 |
|
|
1994 |
|
2015 |
|
15-39 years |
|
2420 W Baseline Road, Tempe, AZ |
|
|
— |
|
|
|
1,181 |
|
|
|
14,580 |
|
|
|
— |
|
|
|
— |
|
|
|
|
|
1,181 |
|
|
|
14,580 |
|
|
|
15,761 |
|
|
|
1,107 |
|
|
2006 |
|
2015 |
|
15-39 years |
|
621 Rose Street, Lincoln, NE |
|
|
— |
|
|
|
1,300 |
|
|
|
13,163 |
|
|
|
— |
|
|
|
— |
|
|
|
|
|
1,300 |
|
|
|
13,163 |
|
|
|
14,463 |
|
|
|
955 |
|
|
1973 |
|
2015 |
|
15-39 years |
|
300 E. Wilson Bridge Road, Worthington, OH |
|
|
— |
|
|
|
264 |
|
|
|
12,053 |
|
|
|
— |
|
|
|
— |
|
|
|
|
|
264 |
|
|
|
12,053 |
|
|
|
12,317 |
|
|
|
543 |
|
|
1979 |
|
2016 |
|
15-39 years |
|
9650 Mayflower Park Drive, Carmel, IN |
|
|
— |
|
|
|
243 |
|
|
|
3,519 |
|
|
|
— |
|
|
|
— |
|
|
|
|
|
243 |
|
|
|
3,519 |
|
|
|
3,762 |
|
|
|
212 |
|
|
2006 |
|
2016 |
|
15-39 years |
|
1321 Centerview Circle, Copley, OH |
|
|
— |
|
|
|
104 |
|
|
|
6,359 |
|
|
|
— |
|
|
|
— |
|
|
|
|
|
104 |
|
|
|
6,359 |
|
|
|
6,463 |
|
|
|
67 |
|
|
1996 |
|
2017 |
|
15-39 years |
|
14000 Keystone Parkway, Cleveland. OH |
|
|
— |
|
|
|
323 |
|
|
|
2,744 |
|
|
|
— |
|
|
|
— |
|
|
|
|
|
323 |
|
|
|
2,744 |
|
|
|
3,067 |
|
|
|
32 |
|
|
2007 |
|
2017 |
|
15-39 years |
|
2680 W. Libery St., Girard, OH |
|
|
— |
|
|
|
75 |
|
|
|
1,107 |
|
|
|
— |
|
|
|
— |
|
|
|
|
|
75 |
|
|
|
1,107 |
|
|
|
1,182 |
|
|
|
15 |
|
|
2003 |
|
2017 |
|
15-39 years |
|
2714 Springboro West Road, Moraine, OH |
|
|
— |
|
|
|
336 |
|
|
|
3,654 |
|
|
|
— |
|
|
|
— |
|
|
|
|
|
336 |
|
|
|
3,654 |
|
|
|
3,990 |
|
|
|
14 |
|
|
2017 |
|
2017 |
|
15-39 years |
|
1120 Welch Road, Commerce Township, MI |
|
|
— |
|
|
|
412 |
|
|
|
1,935 |
|
|
|
— |
|
|
|
— |
|
|
|
|
|
412 |
|
|
|
1,935 |
|
|
|
2,347 |
|
|
|
8 |
|
|
2007 |
|
2017 |
|
15-39 years |
|
33100 S. Gratiot Avenue, Clinton Township, MI |
|
|
— |
|
|
|
396 |
|
|
|
6,694 |
|
|
|
— |
|
|
|
35 |
|
|
|
|
|
396 |
|
|
|
6,729 |
|
|
|
7,125 |
|
|
|
126 |
|
|
2016 |
|
2017 |
|
15-39 years |
|
35184 Central City Pkwy, Westland, MI |
|
|
— |
|
|
|
394 |
|
|
|
6,106 |
|
|
|
— |
|
|
|
— |
|
|
|
|
|
394 |
|
|
|
6,106 |
|
|
|
6,500 |
|
|
|
110 |
|
|
1994 |
|
2017 |
|
15-39 years |
119
|
|
|
|
|
|
|
Initial Costs to Company(A) |
|
|
Costs Capitalized Subsequent to Acquisition |
|
Gross Amount at Which Carried at Close of Period |
|
|
|
|
|
|
|
|
|
|
Life on Which |
||||||||||||||||||||||
|
Description |
|
Encumbrance |
|
|
Land |
|
|
Buildings and Improvements |
|
|
Land |
|
|
Improvements |
|
|
Carrying Costs |
|
Land |
|
|
Buildings and Improvements |
|
|
Total(B) |
|
|
Accumulated Depreciation |
|
|
Date of Construction |
|
Date Acquired |
|
Depreciation is Computed |
|||||||||
|
232 Sharon Avenue NW, Lenoir, NC |
|
|
— |
|
|
|
150 |
|
|
|
3,622 |
|
|
|
— |
|
|
|
— |
|
|
|
|
|
150 |
|
|
|
3,622 |
|
|
|
3,772 |
|
|
|
64 |
|
|
2010 |
|
2017 |
|
15-39 years |
|
503 E. Parker Road, Morganton, NC |
|
|
— |
|
|
|
164 |
|
|
|
3,010 |
|
|
|
— |
|
|
|
— |
|
|
|
|
|
164 |
|
|
|
3,010 |
|
|
|
3,174 |
|
|
|
54 |
|
|
2000 |
|
2017 |
|
15-39 years |
|
841 Malcolm Boulevard, Rutherford College, NC |
|
|
— |
|
|
|
130 |
|
|
|
2,692 |
|
|
|
— |
|
|
|
— |
|
|
|
|
|
130 |
|
|
|
2,692 |
|
|
|
2,822 |
|
|
|
48 |
|
|
2007 |
|
2017 |
|
15-39 years |
|
2165 Medical Park Drive, Hickory, NC |
|
|
— |
|
|
|
473 |
|
|
|
4,991 |
|
|
|
— |
|
|
|
— |
|
|
|
|
|
473 |
|
|
|
4,991 |
|
|
|
5,464 |
|
|
|
94 |
|
|
2000 |
|
2017 |
|
15-39 years |
|
829 W 25th Street, Newton, NC |
|
|
— |
|
|
|
195 |
|
|
|
1,085 |
|
|
|
— |
|
|
|
— |
|
|
|
|
|
195 |
|
|
|
1,085 |
|
|
|
1,280 |
|
|
|
22 |
|
|
1994 |
|
2017 |
|
15-39 years |
|
1803 Forest Hills Road W., Wilson, NC |
|
|
— |
|
|
|
101 |
|
|
|
458 |
|
|
|
— |
|
|
|
— |
|
|
|
|
|
101 |
|
|
|
458 |
|
|
|
559 |
|
|
|
9 |
|
|
1998 |
|
2017 |
|
15-39 years |
|
232 Sharon Avenue NW, Lenoir, NC |
|
|
— |
|
|
|
547 |
|
|
|
6,214 |
|
|
|
— |
|
|
|
49 |
|
|
|
|
|
547 |
|
|
|
6,263 |
|
|
|
6,810 |
|
|
|
113 |
|
|
1993 |
|
2017 |
|
15-39 years |
|
10103 Metcalf Avenue, Overland Park, KS |
|
|
— |
|
|
|
456 |
|
|
|
3,789 |
|
|
|
— |
|
|
|
— |
|
|
|
|
|
456 |
|
|
|
3,789 |
|
|
|
4,245 |
|
|
|
40 |
|
|
2006 |
|
2017 |
|
15-39 years |
|
10183 Metcalf Avenue, Overland Park, KS |
|
|
— |
|
|
|
205 |
|
|
|
8,045 |
|
|
|
— |
|
|
|
— |
|
|
|
|
|
205 |
|
|
|
8,045 |
|
|
|
8,250 |
|
|
|
78 |
|
|
2016 |
|
2017 |
|
15-39 years |
|
10203 Metcalf Avenue, Overland Park, KS |
|
|
— |
|
|
|
571 |
|
|
|
3,715 |
|
|
|
— |
|
|
|
— |
|
|
|
|
|
571 |
|
|
|
3,715 |
|
|
|
4,286 |
|
|
|
47 |
|
|
1965 |
|
2017 |
|
15-39 years |
|
425 Centre View Boulevard, Crestview Hills, KY |
|
|
5,183 |
|
|
|
192 |
|
|
|
8,342 |
|
|
|
— |
|
|
|
— |
|
|
|
|
|
192 |
|
|
|
8,342 |
|
|
|
8,534 |
|
|
|
30 |
|
|
2005 |
|
2017 |
|
15-39 years |
|
2425 S. Rouse Avenue, Pittsburgh, KS |
|
|
— |
|
|
|
103 |
|
|
|
2,264 |
|
|
|
— |
|
|
|
— |
|
|
|
|
|
103 |
|
|
|
2,264 |
|
|
|
2,367 |
|
|
|
8 |
|
|
2016 |
|
2017 |
|
15-39 years |
|
17123 Commerce Centre Drive, Prairieville, LA |
|
|
— |
|
|
|
369 |
|
|
|
3,275 |
|
|
|
— |
|
|
|
— |
|
|
|
|
|
369 |
|
|
|
3,275 |
|
|
|
3,644 |
|
|
|
11 |
|
|
2016 |
|
2017 |
|
15-39 years |
|
2321 W. Morehead Street, Charlotte, NC |
|
|
— |
|
|
|
825 |
|
|
|
4,968 |
|
|
|
— |
|
|
|
— |
|
|
|
|
|
825 |
|
|
|
4,968 |
|
|
|
5,793 |
|
|
|
17 |
|
|
1989 |
|
2017 |
|
15-39 years |
|
10921 East St. South, Tulsa, OK |
|
|
— |
|
|
|
734 |
|
|
|
3,143 |
|
|
|
— |
|
|
|
— |
|
|
|
|
|
734 |
|
|
|
3,143 |
|
|
|
3,877 |
|
|
|
11 |
|
|
2016 |
|
2017 |
|
15-39 years |
|
1306 Lincoln Street, Rhinelander, WI |
|
|
— |
|
|
|
55 |
|
|
|
1,689 |
|
|
|
— |
|
|
|
— |
|
|
|
|
|
55 |
|
|
|
1,689 |
|
|
|
1,744 |
|
|
|
6 |
|
|
2013 |
|
2017 |
|
15-39 years |
120
|
|
|
|
|
|
|
Initial Costs to Company(A) |
|
|
Costs Capitalized Subsequent to Acquisition |
|
Gross Amount at Which Carried at Close of Period |
|
|
|
|
|
|
|
|
|
|
Life on Which |
||||||||||||||||||||||
|
Description |
|
Encumbrance |
|
|
Land |
|
|
Buildings and Improvements |
|
|
Land |
|
|
Improvements |
|
|
Carrying Costs |
|
Land |
|
|
Buildings and Improvements |
|
|
Total(B) |
|
|
Accumulated Depreciation |
|
|
Date of Construction |
|
Date Acquired |
|
Depreciation is Computed |
|||||||||
|
6450 Bannington Road, Charlotte, NC |
|
|
— |
|
|
|
534 |
|
|
|
1,101 |
|
|
|
— |
|
|
|
— |
|
|
|
|
|
534 |
|
|
|
1,101 |
|
|
|
1,635 |
|
|
|
6 |
|
|
1999 |
|
2017 |
|
15-39 years |
|
Other Properties: |
|
|
|
|
|
|
|
|
|
|
|
|
|
|
|
|
|
|
|
|
|
|
|
|
|
|
|
|
|
|
|
|
|
|
|
|
|
|
|
|
|
|
|
|
|
265 Thruway Park Drive, Rochester, NY |
|
|
5,670 |
|
|
|
589 |
|
|
|
9,872 |
|
|
|
— |
|
|
|
— |
|
|
|
|
|
589 |
|
|
|
9,872 |
|
|
|
10,461 |
|
|
|
2,131 |
|
|
2001 |
|
2010 |
|
15-39 years |
|
5815 Middlebrook Pike, Knoxville, TN |
|
|
— |
|
|
|
744 |
|
|
|
2,246 |
|
|
|
— |
|
|
|
— |
|
|
|
|
|
744 |
|
|
|
2,246 |
|
|
|
2,990 |
|
|
|
501 |
|
|
1975 |
|
2011 |
|
15-39 years |
|
6800 Spyglass Court, Viera, FL |
|
|
— |
|
|
|
809 |
|
|
|
3,235 |
|
|
|
— |
|
|
|
— |
|
|
|
|
|
809 |
|
|
|
3,235 |
|
|
|
4,044 |
|
|
|
567 |
|
|
1998 |
|
2012 |
|
15-39 years |
|
4500 S. Hamilton Road, Groveport, OH |
|
|
— |
|
|
|
710 |
|
|
|
5,087 |
|
|
|
— |
|
|
|
— |
|
|
|
|
|
710 |
|
|
|
5,087 |
|
|
|
5,797 |
|
|
|
630 |
|
|
1979 |
|
2014 |
|
15-39 years |
|
3217 South Decker Lake Drive, West Valley City, UT |
|
|
— |
|
|
|
1,336 |
|
|
|
5,822 |
|
|
|
— |
|
|
|
10,000 |
|
|
|
|
|
1,336 |
|
|
|
15,822 |
|
|
|
17,158 |
|
|
|
1,739 |
|
|
1998 |
|
2014 |
|
15-39 years |
|
2560 North Shadeland Avenue, Indianapolis, IN |
|
|
— |
|
|
|
1,086 |
|
|
|
18,552 |
|
|
|
— |
|
|
|
1,050 |
|
|
|
|
|
1,086 |
|
|
|
19,602 |
|
|
|
20,688 |
|
|
|
68 |
|
|
1995 |
|
2017 |
|
15-39 years |
|
408 S. 8th Street, San Jose, CA |
|
|
— |
|
|
|
914 |
|
|
|
2,704 |
|
|
|
— |
|
|
|
— |
|
|
|
|
|
914 |
|
|
|
2,704 |
|
|
|
3,618 |
|
|
|
138 |
|
|
1920 |
|
2016 |
|
15-27.5 years |
|
1411 Elm Avenue, Norman, OK |
|
|
— |
|
|
|
68 |
|
|
|
5,358 |
|
|
|
— |
|
|
|
— |
|
|
|
|
|
68 |
|
|
|
5,358 |
|
|
|
5,426 |
|
|
|
273 |
|
|
1965 |
|
2016 |
|
15-27.5 years |
|
2310 NW Harrison, Corvallis, OR |
|
|
— |
|
|
|
122 |
|
|
|
1,114 |
|
|
|
— |
|
|
|
— |
|
|
|
|
|
122 |
|
|
|
1,114 |
|
|
|
1,236 |
|
|
|
58 |
|
|
1939 |
|
2016 |
|
15-27.5 years |
|
17 Maple Street, Oneonta, NY |
|
|
— |
|
|
|
23 |
|
|
|
838 |
|
|
|
— |
|
|
|
— |
|
|
|
|
|
23 |
|
|
|
838 |
|
|
|
861 |
|
|
|
4 |
|
|
1893 |
|
2017 |
|
15-28 years |
|
368 Rose Street, Lexington, KY |
|
|
— |
|
|
|
28 |
|
|
|
2,605 |
|
|
|
— |
|
|
|
— |
|
|
|
|
|
28 |
|
|
|
2,605 |
|
|
|
2,633 |
|
|
|
12 |
|
|
1985 |
|
2017 |
|
15-28 years |
|
647 West Pensacola Street, Tallahassee, FL |
|
|
6,685 |
|
|
|
74 |
|
|
|
7,476 |
|
|
|
— |
|
|
|
— |
|
|
|
|
|
74 |
|
|
|
7,476 |
|
|
|
7,550 |
|
|
|
34 |
|
|
2015 |
|
2017 |
|
15-28 years |
|
805 Johnston Street, Greenville, NC |
|
|
— |
|
|
|
122 |
|
|
|
1,700 |
|
|
|
— |
|
|
|
— |
|
|
|
|
|
122 |
|
|
|
1,700 |
|
|
|
1,822 |
|
|
|
8 |
|
|
1923 |
|
2017 |
|
15-28 years |
121
|
|
|
|
|
|
|
Initial Costs to Company(A) |
|
|
Costs Capitalized Subsequent to Acquisition |
|
Gross Amount at Which Carried at Close of Period |
|
|
|
|
|
|
|
|
|
|
Life on Which |
||||||||||||||||||||||
|
Description |
|
Encumbrance |
|
|
Land |
|
|
Buildings and Improvements |
|
|
Land |
|
|
Improvements |
|
|
Carrying Costs |
|
Land |
|
|
Buildings and Improvements |
|
|
Total(B) |
|
|
Accumulated Depreciation |
|
|
Date of Construction |
|
Date Acquired |
|
Depreciation is Computed |
|||||||||
|
Office Properties: |
|
|
|
|
|
|
|
|
|
|
|
|
|
|
|
|
|
|
|
|
|
|
|
|
|
|
|
|
|
|
|
|
|
|
|
|
|
|
|
|
|
|
|
|
|
8060 Spyglass Hill Road, Viera, FL |
|
|
— |
|
|
|
700 |
|
|
|
2,800 |
|
|
|
— |
|
|
|
— |
|
|
|
|
|
700 |
|
|
|
2,800 |
|
|
|
3,500 |
|
|
|
532 |
|
|
1997 |
|
2012 |
|
15-39 years |
|
1440 13th Avenue, Union Grove, WI |
|
|
— |
|
|
|
85 |
|
|
|
340 |
|
|
|
— |
|
|
|
— |
|
|
|
|
|
85 |
|
|
|
340 |
|
|
|
425 |
|
|
|
49 |
|
|
1993 |
|
2012 |
|
15-39 years |
|
7777 Bluemound Road, Milwaukee, WI |
|
|
— |
|
|
|
668 |
|
|
|
5,650 |
|
|
|
— |
|
|
|
— |
|
|
|
|
|
668 |
|
|
|
5,650 |
|
|
|
6,318 |
|
|
|
490 |
|
|
1989 |
|
2014 |
|
15-39 years |
|
950 I-30 East, Mt. Pleasant, TX |
|
|
— |
|
|
|
2,214 |
|
|
|
3,717 |
|
|
|
— |
|
|
|
— |
|
|
|
|
|
2,214 |
|
|
|
3,717 |
|
|
|
5,931 |
|
|
|
434 |
|
|
2008 |
|
2014 |
|
15-39 years |
|
355 Maple Avenue, Harleysville, PA |
|
|
— |
|
|
|
3,513 |
|
|
|
24,767 |
|
|
|
— |
|
|
|
— |
|
|
|
|
|
3,513 |
|
|
|
24,767 |
|
|
|
28,280 |
|
|
|
1,341 |
|
|
1950 |
|
2016 |
|
15-39 years |
|
1000 Nationwide Drive, Harrisburg, PA |
|
|
— |
|
|
|
958 |
|
|
|
19,060 |
|
|
|
— |
|
|
|
— |
|
|
|
|
|
958 |
|
|
|
19,060 |
|
|
|
20,018 |
|
|
|
891 |
|
|
1976 |
|
2016 |
|
15-39 years |
|
1501 Mittel Blvd, Wood Dale, IL |
|
|
— |
|
|
|
2,806 |
|
|
|
8,726 |
|
|
|
— |
|
|
|
— |
|
|
|
|
|
2,806 |
|
|
|
8,726 |
|
|
|
11,532 |
|
|
|
381 |
|
|
1986 |
|
2016 |
|
15-39 years |
|
1804 McCarthy Blvd., Milpitas, CA |
|
|
— |
|
|
|
1,478 |
|
|
|
8,164 |
|
|
|
— |
|
|
|
— |
|
|
|
|
|
1,478 |
|
|
|
8,164 |
|
|
|
9,642 |
|
|
|
265 |
|
|
1982 |
|
2016 |
|
15-39 years |
|
5900 E. Ben White Blvd., Austin, TX |
|
|
— |
|
|
|
300 |
|
|
|
29,681 |
|
|
|
— |
|
|
|
8,649 |
|
|
|
|
|
300 |
|
|
|
38,330 |
|
|
|
38,630 |
|
|
|
982 |
|
|
1984 |
|
2016 |
|
15-39 years |
|
3011 S. Babcock St., Melbourne, FL |
|
|
— |
|
|
|
1,701 |
|
|
|
12,141 |
|
|
|
— |
|
|
|
— |
|
|
|
|
|
1,701 |
|
|
|
12,141 |
|
|
|
13,842 |
|
|
|
383 |
|
|
2012 |
|
2016 |
|
15-39 years |
|
99 Garnsey Road, Pittsford, NY |
|
|
— |
|
|
|
40 |
|
|
|
29,530 |
|
|
|
— |
|
|
|
1,000 |
|
|
|
|
|
40 |
|
|
|
30,530 |
|
|
|
30,570 |
|
|
|
334 |
|
|
1975 |
|
2017 |
|
15-39 years |
|
2160 S. Power Road, Mesa, AZ |
|
|
— |
|
|
|
785 |
|
|
|
5,034 |
|
|
|
— |
|
|
|
— |
|
|
|
|
|
785 |
|
|
|
5,034 |
|
|
|
5,819 |
|
|
|
18 |
|
|
1998 |
|
2017 |
|
15-39 years |
|
4400 Cutler Avenue, Albuquerque, NM |
|
|
— |
|
|
|
987 |
|
|
|
11,357 |
|
|
|
— |
|
|
|
— |
|
|
|
|
|
987 |
|
|
|
11,357 |
|
|
|
12,344 |
|
|
|
38 |
|
|
1996 |
|
2017 |
|
15-39 years |
|
9487 Regency Square Boulevard, Jacksonville, FL |
|
|
— |
|
|
|
1,251 |
|
|
|
19,784 |
|
|
|
— |
|
|
|
— |
|
|
|
|
|
1,251 |
|
|
|
19,784 |
|
|
|
21,035 |
|
|
|
66 |
|
|
1984 |
|
2017 |
|
15-39 years |
|
500 Kirts Boulevard, Troy, MI |
|
|
— |
|
|
|
1,665 |
|
|
|
19,798 |
|
|
|
— |
|
|
|
— |
|
|
|
|
|
1,665 |
|
|
|
19,798 |
|
|
|
21,463 |
|
|
|
69 |
|
|
1984 |
|
2017 |
|
15-39 years |
122
|
|
|
|
|
|
|
Initial Costs to Company(A) |
|
|
Costs Capitalized Subsequent to Acquisition |
|
Gross Amount at Which Carried at Close of Period |
|
|
|
|
|
|
|
|
|
|
Life on Which |
||||||||||||||||||||||
|
Description |
|
Encumbrance |
|
|
Land |
|
|
Buildings and Improvements |
|
|
Land |
|
|
Improvements |
|
|
Carrying Costs |
|
Land |
|
|
Buildings and Improvements |
|
|
Total(B) |
|
|
Accumulated Depreciation |
|
|
Date of Construction |
|
Date Acquired |
|
Depreciation is Computed |
|||||||||
|
Retail Properties: |
|
|
|
|
|
|
|
|
|
|
|
|
|
|
|
|
|
|
|
|
|
|
|
|
|
|
|
|
|
|
|
|
|
|
|
|
|
|
|
|
|
|
|
|
|
2013 Center Point Parkway, Birmingham, AL |
|
|
— |
|
|
|
300 |
|
|
|
1,122 |
|
|
|
— |
|
|
|
— |
|
|
|
|
|
300 |
|
|
|
1,122 |
|
|
|
1,422 |
|
|
|
367 |
|
|
2000 |
|
2006 |
|
15-39 years |
|
3104 Peach Orchard Rd, Augusta, GA |
|
|
— |
|
|
|
270 |
|
|
|
1,108 |
|
|
|
— |
|
|
|
— |
|
|
|
|
|
270 |
|
|
|
1,109 |
|
|
|
1,378 |
|
|
|
342 |
|
|
1992 |
|
2007 |
|
15-39 years |
|
2011 Airport Boulevard, Pensacola, FL |
|
|
— |
|
|
|
207 |
|
|
|
1,595 |
|
|
|
— |
|
|
|
— |
|
|
|
|
|
207 |
|
|
|
1,595 |
|
|
|
1,802 |
|
|
|
488 |
|
|
1998 |
|
2007 |
|
15-39 years |
|
3649 Phillips Highway, Jacksonville, FL |
|
|
— |
|
|
|
223 |
|
|
|
1,262 |
|
|
|
— |
|
|
|
— |
|
|
|
|
|
223 |
|
|
|
1,262 |
|
|
|
1,485 |
|
|
|
452 |
|
|
1987 |
|
2007 |
|
15-39 years |
|
9178 Chamberlayne Road, Mechanicsville, VA |
|
|
— |
|
|
|
288 |
|
|
|
1,633 |
|
|
|
— |
|
|
|
— |
|
|
|
|
|
288 |
|
|
|
1,633 |
|
|
|
1,921 |
|
|
|
476 |
|
|
1996 |
|
2007 |
|
15-39 years |
|
100 East Cloverleaf Drive, Emporia, VA |
|
|
— |
|
|
|
325 |
|
|
|
1,841 |
|
|
|
— |
|
|
|
— |
|
|
|
|
|
325 |
|
|
|
1,841 |
|
|
|
2,166 |
|
|
|
585 |
|
|
1993 |
|
2007 |
|
15-39 years |
|
20 Arthur Anderson Parkway, Sarasota, FL |
|
|
— |
|
|
|
553 |
|
|
|
3,131 |
|
|
|
— |
|
|
|
— |
|
|
|
|
|
553 |
|
|
|
3,131 |
|
|
|
3,684 |
|
|
|
865 |
|
|
1994 |
|
2008 |
|
15-39 years |
|
5055 J. Turner Butler Blvd., Jacksonville, FL |
|
|
1,500 |
|
|
|
673 |
|
|
|
2,691 |
|
|
|
— |
|
|
|
— |
|
|
|
|
|
673 |
|
|
|
2,691 |
|
|
|
3,364 |
|
|
|
689 |
|
|
1998 |
|
2009 |
|
15-39 years |
|
1530 South Mason Road, Katy, TX |
|
|
— |
|
|
|
500 |
|
|
|
648 |
|
|
|
— |
|
|
|
— |
|
|
|
|
|
500 |
|
|
|
648 |
|
|
|
1,148 |
|
|
|
179 |
|
|
1997 |
|
2009 |
|
15-39 years |
|
9827 West Main Street, La Porte, TX |
|
|
— |
|
|
|
250 |
|
|
|
1,151 |
|
|
|
— |
|
|
|
— |
|
|
|
|
|
250 |
|
|
|
1,151 |
|
|
|
1,401 |
|
|
|
305 |
|
|
1996 |
|
2009 |
|
15-39 years |
|
6601 Dalrock Road, Rowlett, TX |
|
|
— |
|
|
|
350 |
|
|
|
776 |
|
|
|
— |
|
|
|
— |
|
|
|
|
|
350 |
|
|
|
776 |
|
|
|
1,126 |
|
|
|
220 |
|
|
1995 |
|
2009 |
|
15-39 years |
|
1000 NW 24th Avenue, Norman, OK |
|
|
— |
|
|
|
280 |
|
|
|
1,049 |
|
|
|
— |
|
|
|
— |
|
|
|
|
|
280 |
|
|
|
1,049 |
|
|
|
1,329 |
|
|
|
256 |
|
|
1991 |
|
2009 |
|
15-39 years |
|
5901 West Reno Avenue, Oklahoma City, OK |
|
|
— |
|
|
|
540 |
|
|
|
517 |
|
|
|
— |
|
|
|
— |
|
|
|
|
|
540 |
|
|
|
517 |
|
|
|
1,057 |
|
|
|
166 |
|
|
2001 |
|
2009 |
|
15-39 years |
|
615 S. Main St., Ashland City, TN |
|
|
— |
|
|
|
59 |
|
|
|
973 |
|
|
|
— |
|
|
|
— |
|
|
|
|
|
59 |
|
|
|
973 |
|
|
|
1,032 |
|
|
|
32 |
|
|
1992 |
|
2016 |
|
15-39 years |
123
|
|
|
|
|
|
|
Initial Costs to Company(A) |
|
|
Costs Capitalized Subsequent to Acquisition |
|
Gross Amount at Which Carried at Close of Period |
|
|
|
|
|
|
|
|
|
|
Life on Which |
||||||||||||||||||||||
|
Description |
|
Encumbrance |
|
|
Land |
|
|
Buildings and Improvements |
|
|
Land |
|
|
Improvements |
|
|
Carrying Costs |
|
Land |
|
|
Buildings and Improvements |
|
|
Total(B) |
|
|
Accumulated Depreciation |
|
|
Date of Construction |
|
Date Acquired |
|
Depreciation is Computed |
|||||||||
|
1628 Main St., Cadiz, KY |
|
|
— |
|
|
|
77 |
|
|
|
1,048 |
|
|
|
— |
|
|
|
— |
|
|
|
|
|
77 |
|
|
|
1,048 |
|
|
|
1,125 |
|
|
|
36 |
|
|
1992 |
|
2016 |
|
15-39 years |
|
729 Highway 100, Centerville, TN |
|
|
— |
|
|
|
68 |
|
|
|
965 |
|
|
|
— |
|
|
|
— |
|
|
|
|
|
68 |
|
|
|
965 |
|
|
|
1,033 |
|
|
|
35 |
|
|
2006 |
|
2016 |
|
15-39 years |
|
106 Luyben Hills Road, Kingston Springs, TN |
|
|
— |
|
|
|
92 |
|
|
|
978 |
|
|
|
— |
|
|
|
— |
|
|
|
|
|
92 |
|
|
|
978 |
|
|
|
1,070 |
|
|
|
36 |
|
|
1998 |
|
2016 |
|
15-39 years |
|
3655 N. Mount Juliet Road, Mount Juliet, TN |
|
|
— |
|
|
|
76 |
|
|
|
995 |
|
|
|
— |
|
|
|
— |
|
|
|
|
|
76 |
|
|
|
995 |
|
|
|
1,071 |
|
|
|
35 |
|
|
1994 |
|
2016 |
|
15-39 years |
|
417 Highway 76, White House, TN |
|
|
— |
|
|
|
105 |
|
|
|
927 |
|
|
|
— |
|
|
|
— |
|
|
|
|
|
105 |
|
|
|
927 |
|
|
|
1,032 |
|
|
|
35 |
|
|
2003 |
|
2016 |
|
15-39 years |
|
1890 Perkins Road, Stillwater, OK |
|
|
— |
|
|
|
811 |
|
|
|
1,622 |
|
|
|
— |
|
|
|
— |
|
|
|
|
|
811 |
|
|
|
1,622 |
|
|
|
2,433 |
|
|
|
388 |
|
|
2008 |
|
2010 |
|
15-39 years |
|
833 Highway 62 E, Mountain Home, AR |
|
|
— |
|
|
|
338 |
|
|
|
1,016 |
|
|
|
— |
|
|
|
— |
|
|
|
|
|
338 |
|
|
|
1,016 |
|
|
|
1,354 |
|
|
|
236 |
|
|
1988 |
|
2010 |
|
15-39 years |
|
1102 S Saint Louis Street, Batesville, AR |
|
|
— |
|
|
|
214 |
|
|
|
1,055 |
|
|
|
— |
|
|
|
— |
|
|
|
|
|
214 |
|
|
|
1,055 |
|
|
|
1,269 |
|
|
|
256 |
|
|
1988 |
|
2010 |
|
15-39 years |
|
2525 W. Kings Highway, Paragould, AR |
|
|
— |
|
|
|
187 |
|
|
|
1,444 |
|
|
|
— |
|
|
|
— |
|
|
|
|
|
187 |
|
|
|
1,444 |
|
|
|
1,631 |
|
|
|
306 |
|
|
1990 |
|
2010 |
|
15-39 years |
|
2055 N. Washington Street, Forrest City, AR |
|
|
— |
|
|
|
84 |
|
|
|
941 |
|
|
|
— |
|
|
|
— |
|
|
|
|
|
84 |
|
|
|
941 |
|
|
|
1,025 |
|
|
|
229 |
|
|
1989 |
|
2010 |
|
15-39 years |
|
2730 Lake Road, Dyersburg, TN |
|
|
— |
|
|
|
276 |
|
|
|
1,250 |
|
|
|
— |
|
|
|
— |
|
|
|
|
|
276 |
|
|
|
1,250 |
|
|
|
1,526 |
|
|
|
276 |
|
|
1989 |
|
2010 |
|
15-39 years |
|
849 University Street, Martin, TN |
|
|
— |
|
|
|
152 |
|
|
|
858 |
|
|
|
— |
|
|
|
— |
|
|
|
|
|
152 |
|
|
|
858 |
|
|
|
1,010 |
|
|
|
212 |
|
|
1999 |
|
2010 |
|
15-39 years |
|
1400 Rutledge Lane, Union City, TN |
|
|
— |
|
|
|
72 |
|
|
|
806 |
|
|
|
— |
|
|
|
— |
|
|
|
|
|
72 |
|
|
|
806 |
|
|
|
878 |
|
|
|
190 |
|
|
1988 |
|
2010 |
|
15-39 years |
|
2625 Alexandria Pike, Highland Heights, KY |
|
|
— |
|
|
|
850 |
|
|
|
1,984 |
|
|
|
— |
|
|
|
— |
|
|
|
|
|
850 |
|
|
|
1,984 |
|
|
|
2,834 |
|
|
|
411 |
|
|
1985 |
|
2010 |
|
15-39 years |
|
801 North Olden St., Trenton, NJ |
|
|
— |
|
|
|
477 |
|
|
|
1,431 |
|
|
|
— |
|
|
|
— |
|
|
|
|
|
477 |
|
|
|
1,431 |
|
|
|
1,908 |
|
|
|
293 |
|
|
1991 |
|
2010 |
|
15-39 years |
124
|
|
|
|
|
|
|
Initial Costs to Company(A) |
|
|
Costs Capitalized Subsequent to Acquisition |
|
Gross Amount at Which Carried at Close of Period |
|
|
|
|
|
|
|
|
|
|
Life on Which |
||||||||||||||||||||||
|
Description |
|
Encumbrance |
|
|
Land |
|
|
Buildings and Improvements |
|
|
Land |
|
|
Improvements |
|
|
Carrying Costs |
|
Land |
|
|
Buildings and Improvements |
|
|
Total(B) |
|
|
Accumulated Depreciation |
|
|
Date of Construction |
|
Date Acquired |
|
Depreciation is Computed |
|||||||||
|
1500 Pennington Rd., Trenton, NJ |
|
|
— |
|
|
|
394 |
|
|
|
1,181 |
|
|
|
— |
|
|
|
— |
|
|
|
|
|
394 |
|
|
|
1,181 |
|
|
|
1,575 |
|
|
|
267 |
|
|
1985 |
|
2010 |
|
15-39 years |
|
610 W 4Th St, Covington, KY |
|
|
— |
|
|
|
582 |
|
|
|
1,358 |
|
|
|
— |
|
|
|
— |
|
|
|
|
|
582 |
|
|
|
1,358 |
|
|
|
1,940 |
|
|
|
280 |
|
|
1981 |
|
2010 |
|
15-39 years |
|
1830 Easton Road, Somerset, NJ |
|
|
— |
|
|
|
912 |
|
|
|
2,735 |
|
|
|
— |
|
|
|
— |
|
|
|
|
|
912 |
|
|
|
2,735 |
|
|
|
3,647 |
|
|
|
556 |
|
|
1992 |
|
2011 |
|
15-39 years |
|
5855 Blaine Avenue, Inver Grove Heights, MN |
|
|
— |
|
|
|
592 |
|
|
|
1,777 |
|
|
|
— |
|
|
|
— |
|
|
|
|
|
592 |
|
|
|
1,777 |
|
|
|
2,369 |
|
|
|
381 |
|
|
1997 |
|
2011 |
|
15-39 years |
|
14400 Weaver Lake Road, Maple Grove, MN |
|
|
— |
|
|
|
611 |
|
|
|
1,833 |
|
|
|
— |
|
|
|
— |
|
|
|
|
|
611 |
|
|
|
1,833 |
|
|
|
2,444 |
|
|
|
399 |
|
|
1996 |
|
2011 |
|
15-39 years |
|
1900 Adams Street, Mankato, MN |
|
|
— |
|
|
|
712 |
|
|
|
2,136 |
|
|
|
— |
|
|
|
— |
|
|
|
|
|
712 |
|
|
|
2,136 |
|
|
|
2,848 |
|
|
|
435 |
|
|
1994 |
|
2011 |
|
15-39 years |
|
1018 Meadowlands Drive, Saint Paul, MN |
|
|
— |
|
|
|
606 |
|
|
|
1,817 |
|
|
|
— |
|
|
|
— |
|
|
|
|
|
606 |
|
|
|
1,817 |
|
|
|
2,423 |
|
|
|
391 |
|
|
1994 |
|
2011 |
|
15-39 years |
|
2330 N. Highland Avenue, Jackson, TN |
|
|
— |
|
|
|
204 |
|
|
|
1,154 |
|
|
|
— |
|
|
|
— |
|
|
|
|
|
204 |
|
|
|
1,154 |
|
|
|
1,358 |
|
|
|
217 |
|
|
1999 |
|
2011 |
|
15-39 years |
|
477 East Main Street, Henderson, TN |
|
|
— |
|
|
|
141 |
|
|
|
800 |
|
|
|
— |
|
|
|
— |
|
|
|
|
|
141 |
|
|
|
800 |
|
|
|
941 |
|
|
|
143 |
|
|
1986 |
|
2012 |
|
15-39 years |
|
565 West Church Street, Lexington, TN |
|
|
— |
|
|
|
150 |
|
|
|
848 |
|
|
|
— |
|
|
|
— |
|
|
|
|
|
150 |
|
|
|
848 |
|
|
|
998 |
|
|
|
153 |
|
|
1995 |
|
2012 |
|
15-39 years |
|
2479 North Central Avenue, Humboldt, TN |
|
|
— |
|
|
|
118 |
|
|
|
669 |
|
|
|
— |
|
|
|
— |
|
|
|
|
|
118 |
|
|
|
669 |
|
|
|
787 |
|
|
|
134 |
|
|
1993 |
|
2012 |
|
15-39 years |
|
3645 N. Atlantic Ave, Cocoa Beach, FL |
|
|
— |
|
|
|
283 |
|
|
|
848 |
|
|
|
— |
|
|
|
— |
|
|
|
|
|
283 |
|
|
|
848 |
|
|
|
1,131 |
|
|
|
148 |
|
|
1992 |
|
2012 |
|
15-39 years |
|
3755 W. Lake Mary Blvd, Lake Mary, FL |
|
|
— |
|
|
|
422 |
|
|
|
1,265 |
|
|
|
— |
|
|
|
— |
|
|
|
|
|
422 |
|
|
|
1,265 |
|
|
|
1,687 |
|
|
|
207 |
|
|
1989 |
|
2012 |
|
15-39 years |
|
1860 State Road 44, New Smyrna Beach, FL |
|
|
— |
|
|
|
382 |
|
|
|
1,146 |
|
|
|
— |
|
|
|
— |
|
|
|
|
|
382 |
|
|
|
1,146 |
|
|
|
1,528 |
|
|
|
234 |
|
|
2008 |
|
2012 |
|
15-39 years |
|
10005 University Blvd, Orlando, FL |
|
|
— |
|
|
|
351 |
|
|
|
1,052 |
|
|
|
— |
|
|
|
— |
|
|
|
|
|
351 |
|
|
|
1,052 |
|
|
|
1,403 |
|
|
|
182 |
|
|
1990 |
|
2012 |
|
15-39 years |
125
|
|
|
|
|
|
|
Initial Costs to Company(A) |
|
|
Costs Capitalized Subsequent to Acquisition |
|
Gross Amount at Which Carried at Close of Period |
|
|
|
|
|
|
|
|
|
|
Life on Which |
||||||||||||||||||||||
|
Description |
|
Encumbrance |
|
|
Land |
|
|
Buildings and Improvements |
|
|
Land |
|
|
Improvements |
|
|
Carrying Costs |
|
Land |
|
|
Buildings and Improvements |
|
|
Total(B) |
|
|
Accumulated Depreciation |
|
|
Date of Construction |
|
Date Acquired |
|
Depreciation is Computed |
|||||||||
|
5400 N. Orange Blossom Trail, Orlando, FL |
|
|
— |
|
|
|
219 |
|
|
|
656 |
|
|
|
— |
|
|
|
— |
|
|
|
|
|
219 |
|
|
|
656 |
|
|
|
875 |
|
|
|
131 |
|
|
1996 |
|
2012 |
|
15-39 years |
|
302 Mall Blvd, Savannah, GA |
|
|
— |
|
|
|
390 |
|
|
|
1,170 |
|
|
|
— |
|
|
|
— |
|
|
|
|
|
390 |
|
|
|
1,170 |
|
|
|
1,560 |
|
|
|
206 |
|
|
2009 |
|
2012 |
|
15-39 years |
|
2631 Skidaway Road, Savannah, GA |
|
|
— |
|
|
|
376 |
|
|
|
1,129 |
|
|
|
— |
|
|
|
— |
|
|
|
|
|
376 |
|
|
|
1,129 |
|
|
|
1,505 |
|
|
|
193 |
|
|
2009 |
|
2012 |
|
15-39 years |
|
3615 Mundy Mill Rd, Oakwood, GA |
|
|
— |
|
|
|
400 |
|
|
|
1,199 |
|
|
|
— |
|
|
|
— |
|
|
|
|
|
400 |
|
|
|
1,199 |
|
|
|
1,599 |
|
|
|
208 |
|
|
2008 |
|
2012 |
|
15-39 years |
|
301 W. General Screven Way, Hinesville, GA |
|
|
— |
|
|
|
402 |
|
|
|
1,207 |
|
|
|
— |
|
|
|
— |
|
|
|
|
|
402 |
|
|
|
1,207 |
|
|
|
1,609 |
|
|
|
224 |
|
|
2008 |
|
2012 |
|
15-39 years |
|
113 Courthouse Road, Princeton, WV |
|
|
— |
|
|
|
269 |
|
|
|
1,524 |
|
|
|
— |
|
|
|
— |
|
|
|
|
|
269 |
|
|
|
1,524 |
|
|
|
1,793 |
|
|
|
241 |
|
|
1976 |
|
2012 |
|
15-39 years |
|
211 Meadowfield Lane, Princeton, WV |
|
|
— |
|
|
|
301 |
|
|
|
1,703 |
|
|
|
— |
|
|
|
— |
|
|
|
|
|
301 |
|
|
|
1,703 |
|
|
|
2,004 |
|
|
|
267 |
|
|
1991 |
|
2012 |
|
15-39 years |
|
283 Muskingum Drive, Marietta, OH |
|
|
— |
|
|
|
246 |
|
|
|
1,395 |
|
|
|
— |
|
|
|
— |
|
|
|
|
|
246 |
|
|
|
1,395 |
|
|
|
1,641 |
|
|
|
214 |
|
|
2007 |
|
2012 |
|
15-39 years |
|
550 E. Main Street, Pomeroy, OH |
|
|
— |
|
|
|
208 |
|
|
|
1,178 |
|
|
|
— |
|
|
|
— |
|
|
|
|
|
208 |
|
|
|
1,178 |
|
|
|
1,386 |
|
|
|
196 |
|
|
1997 |
|
2012 |
|
15-39 years |
|
1503 Harrison Avenue, Elkins, WV |
|
|
— |
|
|
|
452 |
|
|
|
1,355 |
|
|
|
— |
|
|
|
— |
|
|
|
|
|
452 |
|
|
|
1,355 |
|
|
|
1,807 |
|
|
|
213 |
|
|
1980 |
|
2012 |
|
15-39 years |
|
1610 N. Atherton Street, State College, PA |
|
|
— |
|
|
|
365 |
|
|
|
1,461 |
|
|
|
— |
|
|
|
— |
|
|
|
|
|
365 |
|
|
|
1,461 |
|
|
|
1,826 |
|
|
|
221 |
|
|
1976 |
|
2012 |
|
15-39 years |
|
811 Northside Drive, Summerville, WV |
|
|
|
|
|
|
109 |
|
|
|
2,366 |
|
|
|
— |
|
|
|
— |
|
|
|
|
|
109 |
|
|
|
2,366 |
|
|
|
2,475 |
|
|
|
59 |
|
|
1993 |
|
2017 |
|
15-39 years |
|
75 Tower Road, Oxford, AL |
|
|
— |
|
|
|
240 |
|
|
|
958 |
|
|
|
— |
|
|
|
— |
|
|
|
|
|
240 |
|
|
|
958 |
|
|
|
1,198 |
|
|
|
155 |
|
|
1999 |
|
2012 |
|
15-39 years |
|
150 Leon Smith Parkway, Oxford, AL |
|
|
— |
|
|
|
320 |
|
|
|
158 |
|
|
|
— |
|
|
|
1,000 |
|
|
|
|
|
320 |
|
|
|
1,158 |
|
|
|
1,478 |
|
|
|
54 |
|
|
2009 |
|
2012 |
|
15 years |
|
170 Vaughn Lane, Pell City, AL |
|
|
— |
|
|
|
237 |
|
|
|
1,340 |
|
|
|
— |
|
|
|
— |
|
|
|
|
|
237 |
|
|
|
1,340 |
|
|
|
1,577 |
|
|
|
199 |
|
|
2002 |
|
2012 |
|
15-39 years |
126
|
|
|
|
|
|
|
Initial Costs to Company(A) |
|
|
Costs Capitalized Subsequent to Acquisition |
|
Gross Amount at Which Carried at Close of Period |
|
|
|
|
|
|
|
|
|
|
Life on Which |
||||||||||||||||||||||
|
Description |
|
Encumbrance |
|
|
Land |
|
|
Buildings and Improvements |
|
|
Land |
|
|
Improvements |
|
|
Carrying Costs |
|
Land |
|
|
Buildings and Improvements |
|
|
Total(B) |
|
|
Accumulated Depreciation |
|
|
Date of Construction |
|
Date Acquired |
|
Depreciation is Computed |
|||||||||
|
204 15th Street E, Tuscaloosa, AL |
|
|
— |
|
|
|
449 |
|
|
|
1,796 |
|
|
|
— |
|
|
|
— |
|
|
|
|
|
449 |
|
|
|
1,796 |
|
|
|
2,245 |
|
|
|
268 |
|
|
2010 |
|
2012 |
|
15-39 years |
|
419 North Pelham Road, Jacksonville, AL |
|
|
— |
|
|
|
190 |
|
|
|
1,077 |
|
|
|
— |
|
|
|
— |
|
|
|
|
|
190 |
|
|
|
1,077 |
|
|
|
1,267 |
|
|
|
169 |
|
|
2000 |
|
2012 |
|
15-39 years |
|
4422 Old Birmingham Road, Tuscaloosa, AL |
|
|
— |
|
|
|
422 |
|
|
|
1,686 |
|
|
|
— |
|
|
|
— |
|
|
|
|
|
422 |
|
|
|
1,686 |
|
|
|
2,108 |
|
|
|
262 |
|
|
2001 |
|
2012 |
|
15-39 years |
|
1501 E. Hillsborough Ave., Tampa, FL |
|
|
— |
|
|
|
208 |
|
|
|
1,179 |
|
|
|
— |
|
|
|
— |
|
|
|
|
|
208 |
|
|
|
1,179 |
|
|
|
1,387 |
|
|
|
174 |
|
|
1980 |
|
2012 |
|
15-39 years |
|
6620 E. Dr. MLK Blvd, Tampa, FL |
|
|
— |
|
|
|
288 |
|
|
|
1,634 |
|
|
|
— |
|
|
|
— |
|
|
|
|
|
288 |
|
|
|
1,634 |
|
|
|
1,922 |
|
|
|
249 |
|
|
1987 |
|
2012 |
|
15-39 years |
|
5212 Brook Road, Richmond, VA |
|
|
— |
|
|
|
202 |
|
|
|
1,147 |
|
|
|
— |
|
|
|
— |
|
|
|
|
|
202 |
|
|
|
1,147 |
|
|
|
1,349 |
|
|
|
178 |
|
|
1984 |
|
2012 |
|
15-39 years |
|
153 East Swedesford Road, Exton, PA |
|
|
— |
|
|
|
470 |
|
|
|
1,882 |
|
|
|
— |
|
|
|
— |
|
|
|
|
|
470 |
|
|
|
1,882 |
|
|
|
2,352 |
|
|
|
299 |
|
|
1982 |
|
2012 |
|
15-39 years |
|
4507 Jefferson David Highway, Richmond, VA |
|
|
— |
|
|
|
133 |
|
|
|
755 |
|
|
|
— |
|
|
|
— |
|
|
|
|
|
133 |
|
|
|
755 |
|
|
|
888 |
|
|
|
128 |
|
|
1981 |
|
2012 |
|
15-39 years |
|
220 Lancaster Avenue, Paoli, PA |
|
|
— |
|
|
|
360 |
|
|
|
1,440 |
|
|
|
— |
|
|
|
— |
|
|
|
|
|
360 |
|
|
|
1,440 |
|
|
|
1,800 |
|
|
|
214 |
|
|
1982 |
|
2012 |
|
15-39 years |
|
4510 Challenger Avenue, Roanoke, VA |
|
|
— |
|
|
|
828 |
|
|
|
1,965 |
|
|
|
— |
|
|
|
— |
|
|
|
|
|
828 |
|
|
|
1,965 |
|
|
|
2,793 |
|
|
|
277 |
|
|
2006 |
|
2013 |
|
15-39 years |
|
706 MLK Jr. Blvd W, Seffner, FL |
|
|
— |
|
|
|
127 |
|
|
|
1,910 |
|
|
|
— |
|
|
|
— |
|
|
|
|
|
127 |
|
|
|
1,910 |
|
|
|
2,037 |
|
|
|
232 |
|
|
1992 |
|
2013 |
|
15-39 years |
|
6004 14th Street, Bradenton, FL |
|
|
— |
|
|
|
277 |
|
|
|
1,621 |
|
|
|
— |
|
|
|
— |
|
|
|
|
|
277 |
|
|
|
1,621 |
|
|
|
1,898 |
|
|
|
203 |
|
|
1996 |
|
2013 |
|
15-39 years |
|
7313 Gall Blvd, Zephyrhills, FL |
|
|
— |
|
|
|
127 |
|
|
|
1,696 |
|
|
|
— |
|
|
|
— |
|
|
|
|
|
127 |
|
|
|
1,696 |
|
|
|
1,823 |
|
|
|
213 |
|
|
1992 |
|
2013 |
|
15-39 years |
|
3600 4th Street North, Saint Petersburg, FL |
|
|
— |
|
|
|
233 |
|
|
|
1,440 |
|
|
|
— |
|
|
|
— |
|
|
|
|
|
233 |
|
|
|
1,440 |
|
|
|
1,673 |
|
|
|
177 |
|
|
1988 |
|
2013 |
|
15-39 years |
|
7620 W Hillsborough, Tampa, FL |
|
|
— |
|
|
|
189 |
|
|
|
1,234 |
|
|
|
— |
|
|
|
— |
|
|
|
|
|
189 |
|
|
|
1,234 |
|
|
|
1,423 |
|
|
|
163 |
|
|
1996 |
|
2013 |
|
15-39 years |
127
|
|
|
|
|
|
|
Initial Costs to Company(A) |
|
|
Costs Capitalized Subsequent to Acquisition |
|
Gross Amount at Which Carried at Close of Period |
|
|
|
|
|
|
|
|
|
|
|
|
|
|
Life on Which |
||||||||||||||||||||||
|
Description |
|
Encumbrance |
|
|
Land |
|
|
Buildings and Improvements |
|
|
Land |
|
|
Improvements |
|
|
Carrying Costs |
|
Land |
|
|
Buildings and Improvements |
|
|
Total(B) |
|
|
Accumulated Depreciation |
|
|
Date of Construction |
|
|
Date Acquired |
|
|
Depreciation is Computed |
|||||||||||
|
12816 US Highway 301, Dade City, FL |
|
|
— |
|
|
|
163 |
|
|
|
802 |
|
|
|
— |
|
|
|
— |
|
|
|
|
|
163 |
|
|
|
802 |
|
|
|
965 |
|
|
|
114 |
|
|
2008 |
|
|
2013 |
|
|
15-39 years |
||
|
5801 Stevens Road, White Marsh, MD |
|
|
— |
|
|
|
3,223 |
|
|
|
200 |
|
|
|
— |
|
|
|
— |
|
|
|
|
|
3,223 |
|
|
|
200 |
|
|
|
3,423 |
|
|
|
38 |
|
|
1986 |
|
|
2013 |
|
|
15-39 years |
||
|
8309 Quarry Road Manassas, VA |
|
|
— |
|
|
|
1,187 |
|
|
|
197 |
|
|
|
— |
|
|
|
— |
|
|
|
|
|
1,187 |
|
|
|
197 |
|
|
|
1,384 |
|
|
|
31 |
|
|
1986 |
|
|
2013 |
|
|
15-39 years |
||
|
580 Church Street, Morrisville, NC |
|
|
— |
|
|
|
235 |
|
|
|
46 |
|
|
|
— |
|
|
|
— |
|
|
|
|
|
235 |
|
|
|
46 |
|
|
|
281 |
|
|
|
9 |
|
|
1960 |
|
|
2013 |
|
|
15-39 years |
||
|
5191 Concord Road, Aston, PA |
|
|
— |
|
|
|
2,554 |
|
|
|
126 |
|
|
|
— |
|
|
|
— |
|
|
|
|
|
2,554 |
|
|
|
126 |
|
|
|
2,680 |
|
|
|
22 |
|
|
1984 |
|
|
2013 |
|
|
15-39 years |
||
|
11245 Mosteller Road, Sharonville, OH |
|
|
— |
|
|
|
1,001 |
|
|
|
173 |
|
|
|
— |
|
|
|
— |
|
|
|
|
|
1,001 |
|
|
|
173 |
|
|
|
1,174 |
|
|
|
38 |
|
|
1976 |
|
|
2013 |
|
|
15-39 years |
||
|
4877 Vulcan Avenue, Columbus, OH |
|
|
— |
|
|
|
757 |
|
|
|
77 |
|
|
|
— |
|
|
|
— |
|
|
|
|
|
757 |
|
|
|
77 |
|
|
|
834 |
|
|
|
14 |
|
|
1981 |
|
|
2013 |
|
|
15-39 years |
||
|
899 Marshall Phelps Road, Windsor, CT |
|
|
— |
|
|
|
1,887 |
|
|
|
204 |
|
|
|
— |
|
|
|
— |
|
|
|
|
|
1,887 |
|
|
|
204 |
|
|
|
2,091 |
|
|
|
45 |
|
|
1986 |
|
|
2013 |
|
|
15-39 years |
||
|
360 Bilmar Drive, Pittsburgh, PA |
|
|
— |
|
|
|
1,691 |
|
|
|
244 |
|
|
|
— |
|
|
|
— |
|
|
|
|
|
1,691 |
|
|
|
244 |
|
|
|
1,935 |
|
|
|
45 |
|
|
1989 |
|
|
2013 |
|
|
15-39 years |
||
|
438 Auto Vista Drive, Palmdale, CA |
|
|
— |
|
|
|
995 |
|
|
|
2,811 |
|
|
|
— |
|
|
|
— |
|
|
|
|
|
995 |
|
|
|
2,811 |
|
|
|
3,806 |
|
|
|
460 |
|
|
1991 |
|
|
2013 |
|
|
15-39 years |
||
|
38958 Carriage Way, Palmdale, CA |
|
|
— |
|
|
|
670 |
|
|
|
1,610 |
|
|
|
— |
|
|
|
— |
|
|
|
|
|
670 |
|
|
|
1,610 |
|
|
|
2,280 |
|
|
|
282 |
|
|
2006 |
|
|
2013 |
|
|
15-39 years |
||
|
39012 Carriage Way, Palmdale, CA |
|
|
— |
|
|
|
987 |
|
|
|
3,817 |
|
|
|
— |
|
|
|
— |
|
|
|
|
|
987 |
|
|
|
3,817 |
|
|
|
4,804 |
|
|
|
560 |
|
|
1991 |
|
|
2013 |
|
|
15-39 years |
||
|
185 E. New Circle Road, Lexington, KY |
|
|
— |
|
|
|
567 |
|
|
|
3,053 |
|
|
|
— |
|
|
|
— |
|
|
|
|
|
567 |
|
|
|
3,053 |
|
|
|
3,620 |
|
|
|
362 |
|
|
2002 |
|
|
2014 |
|
|
15-39 years |
||
|
301 South White Sands Blvd, Alamogordo, NM |
|
|
— |
|
|
|
22 |
|
|
|
2,117 |
|
|
|
— |
|
|
|
— |
|
|
|
|
|
22 |
|
|
|
2,117 |
|
|
|
2,139 |
|
|
|
232 |
|
|
1983 |
|
|
2014 |
|
|
15-39 years |
||
|
1101 N. Main Street, Roswell, NM |
|
|
— |
|
|
|
64 |
|
|
|
2,059 |
|
|
|
— |
|
|
|
— |
|
|
|
|
|
64 |
|
|
|
2,059 |
|
|
|
2,123 |
|
|
|
219 |
|
|
1990 |
|
|
2014 |
|
|
15-39 years |
||
|
1300 N. Moore Road, Moore, OK |
|
|
— |
|
|
|
64 |
|
|
|
1,249 |
|
|
|
— |
|
|
|
— |
|
|
|
|
|
64 |
|
|
|
1,249 |
|
|
|
1,313 |
|
|
|
143 |
|
|
|
1,975 |
|
|
|
2,014 |
|
|
15-39 years |
128
|
|
|
|
|
|
|
Initial Costs to Company(A) |
|
|
Costs Capitalized Subsequent to Acquisition |
|
Gross Amount at Which Carried at Close of Period |
|
|
|
|
|
|
|
|
|
|
Life on Which |
||||||||||||||||||||||
|
Description |
|
Encumbrance |
|
|
Land |
|
|
Buildings and Improvements |
|
|
Land |
|
|
Improvements |
|
|
Carrying Costs |
|
Land |
|
|
Buildings and Improvements |
|
|
Total(B) |
|
|
Accumulated Depreciation |
|
|
Date of Construction |
|
Date Acquired |
|
Depreciation is Computed |
|||||||||
|
4518 SE 29th Street, Del City, OK |
|
|
— |
|
|
|
40 |
|
|
|
1,370 |
|
|
|
— |
|
|
|
— |
|
|
|
|
|
40 |
|
|
|
1,370 |
|
|
|
1,410 |
|
|
|
150 |
|
|
1980 |
|
2014 |
|
15-39 years |
|
4500 S. Western Avenue, Oklahoma City, OK |
|
|
— |
|
|
|
105 |
|
|
|
1,150 |
|
|
|
— |
|
|
|
— |
|
|
|
|
|
105 |
|
|
|
1,150 |
|
|
|
1,255 |
|
|
|
124 |
|
|
1977 |
|
2014 |
|
15-39 years |
|
13606 N. Pennsylvania Avenue, Oklahoma City, OK |
|
|
— |
|
|
|
721 |
|
|
|
1,049 |
|
|
|
— |
|
|
|
— |
|
|
|
|
|
721 |
|
|
|
1,049 |
|
|
|
1,770 |
|
|
|
129 |
|
|
2003 |
|
2014 |
|
15-39 years |
|
901 E. State Highway 152, Mustang, OK |
|
|
— |
|
|
|
70 |
|
|
|
1,722 |
|
|
|
— |
|
|
|
— |
|
|
|
|
|
70 |
|
|
|
1,722 |
|
|
|
1,792 |
|
|
|
190 |
|
|
2004 |
|
2014 |
|
15-39 years |
|
1170 Garth Brooks Blvd, Yukon, OK |
|
|
— |
|
|
|
63 |
|
|
|
1,851 |
|
|
|
— |
|
|
|
— |
|
|
|
|
|
63 |
|
|
|
1,851 |
|
|
|
1,914 |
|
|
|
209 |
|
|
1994 |
|
2014 |
|
15-39 years |
|
3815 Southwest Loop 820, Fort Worth, TX |
|
|
— |
|
|
|
487 |
|
|
|
934 |
|
|
|
— |
|
|
|
— |
|
|
|
|
|
487 |
|
|
|
934 |
|
|
|
1,421 |
|
|
|
106 |
|
|
2003 |
|
2014 |
|
15-39 years |
|
823 South Second Avenue, Kearney, NE |
|
|
— |
|
|
|
113 |
|
|
|
1,242 |
|
|
|
— |
|
|
|
— |
|
|
|
|
|
113 |
|
|
|
1,242 |
|
|
|
1,355 |
|
|
|
140 |
|
|
1982 |
|
2014 |
|
15-39 years |
|
4001 Second Avenue, Kearney, NE |
|
|
— |
|
|
|
176 |
|
|
|
1,238 |
|
|
|
— |
|
|
|
— |
|
|
|
|
|
176 |
|
|
|
1,238 |
|
|
|
1,414 |
|
|
|
144 |
|
|
1991 |
|
2014 |
|
15-39 years |
|
3503 West State Street, Grand Island, NE |
|
|
— |
|
|
|
425 |
|
|
|
— |
|
|
|
— |
|
|
|
— |
|
|
|
|
|
425 |
|
|
|
— |
|
|
|
425 |
|
|
|
— |
|
|
1992 |
|
2014 |
|
- |
|
103 Pony Express Lane, Ogallala, NE |
|
|
— |
|
|
|
291 |
|
|
|
1,243 |
|
|
|
— |
|
|
|
— |
|
|
|
|
|
291 |
|
|
|
1,243 |
|
|
|
1,534 |
|
|
|
155 |
|
|
1986 |
|
2014 |
|
15-39 years |
|
500 S. George Nigh Expy, McAlester, OK |
|
|
— |
|
|
|
52 |
|
|
|
1,521 |
|
|
|
— |
|
|
|
— |
|
|
|
|
|
52 |
|
|
|
1,521 |
|
|
|
1,573 |
|
|
|
172 |
|
|
2006 |
|
2014 |
|
15-39 years |
|
3834 North Lincoln Blvd, Oklahoma City, OK |
|
|
— |
|
|
|
466 |
|
|
|
928 |
|
|
|
— |
|
|
|
— |
|
|
|
|
|
466 |
|
|
|
928 |
|
|
|
1,394 |
|
|
|
76 |
|
|
1970 |
|
2015 |
|
15-39 years |
|
6629 San Dario Avenue, Laredo, TX |
|
|
— |
|
|
|
425 |
|
|
|
2,476 |
|
|
|
— |
|
|
|
— |
|
|
|
|
|
425 |
|
|
|
2,476 |
|
|
|
2,901 |
|
|
|
258 |
|
|
2001 |
|
2014 |
|
15-39 years |
|
2424 W Ferguson Drive, Mt. Pleasant, TX |
|
|
— |
|
|
|
1,141 |
|
|
|
997 |
|
|
|
— |
|
|
|
— |
|
|
|
|
|
1,141 |
|
|
|
997 |
|
|
|
2,138 |
|
|
|
157 |
|
|
1972 |
|
2014 |
|
15-39 years |
|
200 Industrial Road, Madill, OK |
|
|
— |
|
|
|
739 |
|
|
|
714 |
|
|
|
— |
|
|
|
— |
|
|
|
|
|
739 |
|
|
|
714 |
|
|
|
1,453 |
|
|
|
67 |
|
|
1993 |
|
2014 |
|
15-39 years |
129
|
|
|
|
|
|
|
Initial Costs to Company(A) |
|
|
Costs Capitalized Subsequent to Acquisition |
|
Gross Amount at Which Carried at Close of Period |
|
|
|
|
|
|
|
|
|
|
Life on Which |
||||||||||||||||||||||
|
Description |
|
Encumbrance |
|
|
Land |
|
|
Buildings and Improvements |
|
|
Land |
|
|
Improvements |
|
|
Carrying Costs |
|
Land |
|
|
Buildings and Improvements |
|
|
Total(B) |
|
|
Accumulated Depreciation |
|
|
Date of Construction |
|
Date Acquired |
|
Depreciation is Computed |
|||||||||
|
3621 East Loop 820 S, Fort Worth, TX |
|
|
— |
|
|
|
1,142 |
|
|
|
554 |
|
|
|
— |
|
|
|
— |
|
|
|
|
|
1,142 |
|
|
|
554 |
|
|
|
1,696 |
|
|
|
67 |
|
|
1980 |
|
2014 |
|
15-39 years |
|
10111 N Walton Walker Blvd, Dallas, TX |
|
|
— |
|
|
|
454 |
|
|
|
449 |
|
|
|
— |
|
|
|
— |
|
|
|
|
|
454 |
|
|
|
449 |
|
|
|
903 |
|
|
|
62 |
|
|
1984 |
|
2014 |
|
15-39 years |
|
1801 E. Central Freeway, Wichita Falls, TX |
|
|
— |
|
|
|
674 |
|
|
|
186 |
|
|
|
— |
|
|
|
— |
|
|
|
|
|
674 |
|
|
|
186 |
|
|
|
860 |
|
|
|
25 |
|
|
1995 |
|
2014 |
|
15-39 years |
|
20260 I-35 South, Lytle, TX |
|
|
— |
|
|
|
97 |
|
|
|
815 |
|
|
|
— |
|
|
|
— |
|
|
|
|
|
97 |
|
|
|
815 |
|
|
|
912 |
|
|
|
72 |
|
|
2008 |
|
2015 |
|
15-39 years |
|
17902 US Hwy 59, New Caney, TX |
|
|
— |
|
|
|
37 |
|
|
|
875 |
|
|
|
— |
|
|
|
— |
|
|
|
|
|
37 |
|
|
|
875 |
|
|
|
912 |
|
|
|
69 |
|
|
1972 |
|
2015 |
|
15-39 years |
|
3441 Clemson Boulevard, Anderson, SC |
|
|
— |
|
|
|
140 |
|
|
|
2,164 |
|
|
|
— |
|
|
|
— |
|
|
|
|
|
140 |
|
|
|
2,164 |
|
|
|
2,304 |
|
|
|
173 |
|
|
2004 |
|
2015 |
|
15-39 years |
|
156 S River Road, St. George, UT |
|
|
— |
|
|
|
362 |
|
|
|
2,447 |
|
|
|
— |
|
|
|
— |
|
|
|
|
|
362 |
|
|
|
2,447 |
|
|
|
2,809 |
|
|
|
218 |
|
|
2000 |
|
2015 |
|
15-39 years |
|
1280 N 30 West, Tooele, UT |
|
|
— |
|
|
|
389 |
|
|
|
1,945 |
|
|
|
— |
|
|
|
— |
|
|
|
|
|
389 |
|
|
|
1,945 |
|
|
|
2,334 |
|
|
|
170 |
|
|
2000 |
|
2015 |
|
15-39 years |
|
1352 S Providence Center Drive, Cedar City, UT |
|
|
— |
|
|
|
333 |
|
|
|
2,544 |
|
|
|
— |
|
|
|
— |
|
|
|
|
|
333 |
|
|
|
2,544 |
|
|
|
2,877 |
|
|
|
234 |
|
|
2000 |
|
2015 |
|
15-39 years |
|
1622 N 1000 West, Layton, UT |
|
|
— |
|
|
|
303 |
|
|
|
3,034 |
|
|
|
— |
|
|
|
— |
|
|
|
|
|
303 |
|
|
|
3,034 |
|
|
|
3,337 |
|
|
|
250 |
|
|
1995 |
|
2015 |
|
15-39 years |
|
2175 W City Center Ct., West Valley City, UT |
|
|
— |
|
|
|
327 |
|
|
|
2,222 |
|
|
|
— |
|
|
|
— |
|
|
|
|
|
327 |
|
|
|
2,222 |
|
|
|
2,549 |
|
|
|
188 |
|
|
1998 |
|
2015 |
|
15-39 years |
|
17809 108th Avenue SE, Renton, WA |
|
|
— |
|
|
|
539 |
|
|
|
1,141 |
|
|
|
— |
|
|
|
— |
|
|
|
|
|
539 |
|
|
|
1,141 |
|
|
|
1,680 |
|
|
|
93 |
|
|
1986 |
|
2015 |
|
15-39 years |
|
10611 Pacific Avenue S, Tacoma, WA |
|
|
— |
|
|
|
807 |
|
|
|
643 |
|
|
|
— |
|
|
|
— |
|
|
|
|
|
807 |
|
|
|
643 |
|
|
|
1,450 |
|
|
|
66 |
|
|
1991 |
|
2015 |
|
15-39 years |
|
8401 S Tacoma Way, Tacoma, WA |
|
|
— |
|
|
|
562 |
|
|
|
897 |
|
|
|
— |
|
|
|
— |
|
|
|
|
|
562 |
|
|
|
897 |
|
|
|
1,459 |
|
|
|
76 |
|
|
1993 |
|
2015 |
|
15-39 years |
|
16350 West Valley Highway, Tukwila, WA |
|
|
— |
|
|
|
1,170 |
|
|
|
419 |
|
|
|
— |
|
|
|
— |
|
|
|
|
|
1,170 |
|
|
|
419 |
|
|
|
1,589 |
|
|
|
67 |
|
|
1993 |
|
2015 |
|
15-39 years |
130
|
|
|
|
|
|
|
Initial Costs to Company(A) |
|
|
Costs Capitalized Subsequent to Acquisition |
|
Gross Amount at Which Carried at Close of Period |
|
|
|
|
|
|
|
|
|
|
Life on Which |
||||||||||||||||||||||
|
Description |
|
Encumbrance |
|
|
Land |
|
|
Buildings and Improvements |
|
|
Land |
|
|
Improvements |
|
|
Carrying Costs |
|
Land |
|
|
Buildings and Improvements |
|
|
Total(B) |
|
|
Accumulated Depreciation |
|
|
Date of Construction |
|
Date Acquired |
|
Depreciation is Computed |
|||||||||
|
2031 SW Campus Drive, Federal Way, WA |
|
|
— |
|
|
|
334 |
|
|
|
1,088 |
|
|
|
— |
|
|
|
— |
|
|
|
|
|
334 |
|
|
|
1,088 |
|
|
|
1,422 |
|
|
|
81 |
|
|
1995 |
|
2015 |
|
15-39 years |
|
9511 Bridgeport Way, Lakewood, WA |
|
|
— |
|
|
|
1,372 |
|
|
|
878 |
|
|
|
— |
|
|
|
— |
|
|
|
|
|
1,372 |
|
|
|
878 |
|
|
|
2,250 |
|
|
|
87 |
|
|
1995 |
|
2015 |
|
15-39 years |
|
1308 S. Burlington Boulevard, Burlington, WA |
|
|
— |
|
|
|
178 |
|
|
|
1,982 |
|
|
|
— |
|
|
|
— |
|
|
|
|
|
178 |
|
|
|
1,982 |
|
|
|
2,160 |
|
|
|
148 |
|
|
2000 |
|
2015 |
|
15-39 years |
|
515 SW 128th Street, Everett, WA |
|
|
— |
|
|
|
175 |
|
|
|
1,473 |
|
|
|
— |
|
|
|
— |
|
|
|
|
|
175 |
|
|
|
1,473 |
|
|
|
1,648 |
|
|
|
118 |
|
|
1986 |
|
2015 |
|
15-39 years |
|
702 S Meridian, Puyallup, WA |
|
|
— |
|
|
|
622 |
|
|
|
— |
|
|
|
— |
|
|
|
— |
|
|
|
|
|
622 |
|
|
|
— |
|
|
|
622 |
|
|
|
— |
|
|
1994 |
|
2015 |
|
- |
|
1120 E. Wishkah Street, Aberdeen, WA |
|
|
— |
|
|
|
218 |
|
|
|
1,446 |
|
|
|
— |
|
|
|
— |
|
|
|
|
|
218 |
|
|
|
1,446 |
|
|
|
1,664 |
|
|
|
109 |
|
|
2006 |
|
2015 |
|
15-39 years |
|
2870 Florence Boulevard, Florence, AL |
|
|
— |
|
|
|
337 |
|
|
|
2,609 |
|
|
|
— |
|
|
|
— |
|
|
|
|
|
337 |
|
|
|
2,609 |
|
|
|
2,946 |
|
|
|
188 |
|
|
2011 |
|
2015 |
|
15-39 years |
|
945 Wimberly Drive SW, Decatur, AL |
|
|
— |
|
|
|
364 |
|
|
|
3,708 |
|
|
|
— |
|
|
|
— |
|
|
|
|
|
364 |
|
|
|
3,708 |
|
|
|
4,072 |
|
|
|
264 |
|
|
2014 |
|
2015 |
|
15-39 years |
|
3485 Tupelo Commons, Tupelo, MS |
|
|
— |
|
|
|
297 |
|
|
|
3,030 |
|
|
|
— |
|
|
|
— |
|
|
|
|
|
297 |
|
|
|
3,030 |
|
|
|
3,327 |
|
|
|
211 |
|
|
2012 |
|
2015 |
|
15-39 years |
|
2212 East Parkway, Russellvillee, AR |
|
|
— |
|
|
|
250 |
|
|
|
3,354 |
|
|
|
— |
|
|
|
— |
|
|
|
|
|
250 |
|
|
|
3,354 |
|
|
|
3,604 |
|
|
|
241 |
|
|
2014 |
|
2015 |
|
15-39 years |
|
431 East Main Street, Adamsville, TN |
|
|
— |
|
|
|
59 |
|
|
|
1,675 |
|
|
|
— |
|
|
|
— |
|
|
|
|
|
59 |
|
|
|
1,675 |
|
|
|
1,734 |
|
|
|
108 |
|
|
2005 |
|
2015 |
|
15-39 years |
|
5701 Veterans Memorial Drive, Adamsville, AL |
|
|
— |
|
|
|
123 |
|
|
|
1,924 |
|
|
|
— |
|
|
|
— |
|
|
|
|
|
123 |
|
|
|
1,924 |
|
|
|
2,047 |
|
|
|
130 |
|
|
1989 |
|
2015 |
|
15-39 years |
|
18 Big Valley Rd, Alexandria, AL |
|
|
— |
|
|
|
79 |
|
|
|
2,318 |
|
|
|
— |
|
|
|
— |
|
|
|
|
|
79 |
|
|
|
2,318 |
|
|
|
2,397 |
|
|
|
146 |
|
|
2004 |
|
2015 |
|
15-39 years |
|
36966 US Hwy 231, Ashville, AL |
|
|
— |
|
|
|
124 |
|
|
|
1,696 |
|
|
|
— |
|
|
|
— |
|
|
|
|
|
124 |
|
|
|
1,696 |
|
|
|
1,820 |
|
|
|
106 |
|
|
1999 |
|
2015 |
|
15-39 years |
|
307 US Hwy 31 North, Athens, AL |
|
|
— |
|
|
|
143 |
|
|
|
1,996 |
|
|
|
— |
|
|
|
— |
|
|
|
|
|
143 |
|
|
|
1,996 |
|
|
|
2,139 |
|
|
|
125 |
|
|
2007 |
|
2015 |
|
15-39 years |
131
|
|
|
|
|
|
|
Initial Costs to Company(A) |
|
|
Costs Capitalized Subsequent to Acquisition |
|
Gross Amount at Which Carried at Close of Period |
|
|
|
|
|
|
|
|
|
|
Life on Which |
||||||||||||||||||||||
|
Description |
|
Encumbrance |
|
|
Land |
|
|
Buildings and Improvements |
|
|
Land |
|
|
Improvements |
|
|
Carrying Costs |
|
Land |
|
|
Buildings and Improvements |
|
|
Total(B) |
|
|
Accumulated Depreciation |
|
|
Date of Construction |
|
Date Acquired |
|
Depreciation is Computed |
|||||||||
|
31128 1st Avenue NE, Carbon Hill, AL |
|
|
— |
|
|
|
54 |
|
|
|
1,634 |
|
|
|
— |
|
|
|
— |
|
|
|
|
|
54 |
|
|
|
1,634 |
|
|
|
1,688 |
|
|
|
105 |
|
|
1998 |
|
2015 |
|
15-39 years |
|
1190 North Park Street, Carrollton, GA |
|
|
— |
|
|
|
77 |
|
|
|
2,030 |
|
|
|
— |
|
|
|
— |
|
|
|
|
|
77 |
|
|
|
2,030 |
|
|
|
2,107 |
|
|
|
127 |
|
|
2008 |
|
2015 |
|
15-39 years |
|
55 Birmingham Road, Centreville, AL |
|
|
— |
|
|
|
140 |
|
|
|
2,251 |
|
|
|
— |
|
|
|
— |
|
|
|
|
|
140 |
|
|
|
2,251 |
|
|
|
2,391 |
|
|
|
136 |
|
|
2013 |
|
2015 |
|
15-39 years |
|
1414 Rainbow Drive, Gadsden, AL |
|
|
— |
|
|
|
42 |
|
|
|
2,571 |
|
|
|
— |
|
|
|
— |
|
|
|
|
|
42 |
|
|
|
2,571 |
|
|
|
2,613 |
|
|
|
157 |
|
|
1991 |
|
2015 |
|
15-39 years |
|
3180 Hwy 157, Cullman, AL |
|
|
— |
|
|
|
71 |
|
|
|
1,799 |
|
|
|
— |
|
|
|
— |
|
|
|
|
|
71 |
|
|
|
1,799 |
|
|
|
1,870 |
|
|
|
111 |
|
|
1997 |
|
2015 |
|
15-39 years |
|
1641 Main Street SW, Cullman, AL |
|
|
— |
|
|
|
79 |
|
|
|
1,949 |
|
|
|
— |
|
|
|
— |
|
|
|
|
|
79 |
|
|
|
1,949 |
|
|
|
2,028 |
|
|
|
126 |
|
|
2006 |
|
2015 |
|
15-39 years |
|
2181 Hwy 78 East, Dora, AL |
|
|
— |
|
|
|
18 |
|
|
|
2,280 |
|
|
|
— |
|
|
|
— |
|
|
|
|
|
18 |
|
|
|
2,280 |
|
|
|
2,298 |
|
|
|
131 |
|
|
1968 |
|
2015 |
|
15-39 years |
|
15266 Hwy 278, Double Springs, AL |
|
|
— |
|
|
|
306 |
|
|
|
1,752 |
|
|
|
— |
|
|
|
— |
|
|
|
|
|
306 |
|
|
|
1,752 |
|
|
|
2,058 |
|
|
|
114 |
|
|
1995 |
|
2015 |
|
15-39 years |
|
22714 AL Hwy 24, Moulton, AL |
|
|
— |
|
|
|
117 |
|
|
|
1,752 |
|
|
|
— |
|
|
|
— |
|
|
|
|
|
117 |
|
|
|
1,752 |
|
|
|
1,869 |
|
|
|
115 |
|
|
2003 |
|
2015 |
|
15-39 years |
|
14445 US Hwy 431, Guntersville, AL |
|
|
— |
|
|
|
382 |
|
|
|
2,020 |
|
|
|
— |
|
|
|
— |
|
|
|
|
|
382 |
|
|
|
2,020 |
|
|
|
2,402 |
|
|
|
134 |
|
|
2015 |
|
2015 |
|
15-39 years |
|
5320 Hwy 280 East, Harpersville, AL |
|
|
— |
|
|
|
48 |
|
|
|
2,645 |
|
|
|
— |
|
|
|
— |
|
|
|
|
|
48 |
|
|
|
2,645 |
|
|
|
2,693 |
|
|
|
156 |
|
|
1995 |
|
2015 |
|
15-39 years |
|
5888 Harvest Highway 53, Harvest, AL |
|
|
— |
|
|
|
163 |
|
|
|
2,060 |
|
|
|
— |
|
|
|
— |
|
|
|
|
|
163 |
|
|
|
2,060 |
|
|
|
2,223 |
|
|
|
132 |
|
|
2014 |
|
2015 |
|
15-39 years |
|
520 East Main Street, Henderson, TN |
|
|
— |
|
|
|
111 |
|
|
|
1,608 |
|
|
|
— |
|
|
|
— |
|
|
|
|
|
111 |
|
|
|
1,608 |
|
|
|
1,719 |
|
|
|
117 |
|
|
1987 |
|
2015 |
|
15-39 years |
|
145 Hughes Road, Madison, AL |
|
|
— |
|
|
|
209 |
|
|
|
1,958 |
|
|
|
— |
|
|
|
— |
|
|
|
|
|
209 |
|
|
|
1,958 |
|
|
|
2,167 |
|
|
|
129 |
|
|
2011 |
|
2015 |
|
15-39 years |
|
2119 North Locust Avenue, Lawrenceburg, TN |
|
|
— |
|
|
|
117 |
|
|
|
1,832 |
|
|
|
— |
|
|
|
— |
|
|
|
|
|
117 |
|
|
|
1,832 |
|
|
|
1,949 |
|
|
|
146 |
|
|
2014 |
|
2015 |
|
15-39 years |
132
|
|
|
|
|
|
|
Initial Costs to Company(A) |
|
|
Costs Capitalized Subsequent to Acquisition |
|
Gross Amount at Which Carried at Close of Period |
|
|
|
|
|
|
|
|
|
|
Life on Which |
||||||||||||||||||||||
|
Description |
|
Encumbrance |
|
|
Land |
|
|
Buildings and Improvements |
|
|
Land |
|
|
Improvements |
|
|
Carrying Costs |
|
Land |
|
|
Buildings and Improvements |
|
|
Total(B) |
|
|
Accumulated Depreciation |
|
|
Date of Construction |
|
Date Acquired |
|
Depreciation is Computed |
|||||||||
|
1032 North Main Street, Montevallo, AL |
|
|
— |
|
|
|
60 |
|
|
|
2,203 |
|
|
|
— |
|
|
|
— |
|
|
|
|
|
60 |
|
|
|
2,203 |
|
|
|
2,263 |
|
|
|
138 |
|
|
2009 |
|
2015 |
|
15-39 years |
|
3211 Woodward Avenue, Muscle Shoals, AL |
|
|
— |
|
|
|
44 |
|
|
|
2,019 |
|
|
|
— |
|
|
|
— |
|
|
|
|
|
44 |
|
|
|
2,019 |
|
|
|
2,063 |
|
|
|
117 |
|
|
1984 |
|
2015 |
|
15-39 years |
|
14045 US Hwy 411, Odenville, AL |
|
|
— |
|
|
|
100 |
|
|
|
1,652 |
|
|
|
— |
|
|
|
— |
|
|
|
|
|
100 |
|
|
|
1,652 |
|
|
|
1,752 |
|
|
|
115 |
|
|
2000 |
|
2015 |
|
15-39 years |
|
201 Hwy 278 Bypass East, Piedmont, AL |
|
|
— |
|
|
|
33 |
|
|
|
1,934 |
|
|
|
— |
|
|
|
— |
|
|
|
|
|
33 |
|
|
|
1,934 |
|
|
|
1,967 |
|
|
|
116 |
|
|
1981 |
|
2015 |
|
15-39 years |
|
503 1st Avenue East, Reform, AL |
|
|
— |
|
|
|
201 |
|
|
|
1,979 |
|
|
|
— |
|
|
|
— |
|
|
|
|
|
201 |
|
|
|
1,979 |
|
|
|
2,180 |
|
|
|
139 |
|
|
1992 |
|
2015 |
|
15-39 years |
|
4170 Hwy 431, Roanoke, AL |
|
|
— |
|
|
|
83 |
|
|
|
1,625 |
|
|
|
— |
|
|
|
— |
|
|
|
|
|
83 |
|
|
|
1,625 |
|
|
|
1,708 |
|
|
|
101 |
|
|
2006 |
|
2015 |
|
15-39 years |
|
700 Wayne Road, Savannah, TN |
|
|
— |
|
|
|
62 |
|
|
|
1,693 |
|
|
|
— |
|
|
|
— |
|
|
|
|
|
62 |
|
|
|
1,693 |
|
|
|
1,755 |
|
|
|
112 |
|
|
2012 |
|
2015 |
|
15-39 years |
|
1105 Montgomery Avenue, Sheffield, AL |
|
|
— |
|
|
|
43 |
|
|
|
1,730 |
|
|
|
— |
|
|
|
— |
|
|
|
|
|
43 |
|
|
|
1,730 |
|
|
|
1,773 |
|
|
|
102 |
|
|
1967 |
|
2015 |
|
15-39 years |
|
5271 Hwy 67 South, Somerville, AL |
|
|
— |
|
|
|
28 |
|
|
|
1,758 |
|
|
|
— |
|
|
|
— |
|
|
|
|
|
28 |
|
|
|
1,758 |
|
|
|
1,786 |
|
|
|
124 |
|
|
2001 |
|
2015 |
|
15-39 years |
|
444 Marietta Road, Springville, AL |
|
|
— |
|
|
|
31 |
|
|
|
1,994 |
|
|
|
— |
|
|
|
— |
|
|
|
|
|
31 |
|
|
|
1,994 |
|
|
|
2,025 |
|
|
|
120 |
|
|
1993 |
|
2015 |
|
15-39 years |
|
43023 US Hwy 72, Stevenson, AL |
|
|
— |
|
|
|
306 |
|
|
|
1,862 |
|
|
|
— |
|
|
|
— |
|
|
|
|
|
306 |
|
|
|
1,862 |
|
|
|
2,168 |
|
|
|
115 |
|
|
1985 |
|
2015 |
|
15-39 years |
|
1460 Gadsden Hwy, Trussville, AL |
|
|
— |
|
|
|
34 |
|
|
|
2,039 |
|
|
|
— |
|
|
|
— |
|
|
|
|
|
34 |
|
|
|
2,039 |
|
|
|
2,073 |
|
|
|
121 |
|
|
1992 |
|
2015 |
|
15-39 years |
|
485 Hwy 72 West, Tuscumbia, AL |
|
|
— |
|
|
|
117 |
|
|
|
1,831 |
|
|
|
— |
|
|
|
— |
|
|
|
|
|
117 |
|
|
|
1,831 |
|
|
|
1,948 |
|
|
|
122 |
|
|
2004 |
|
2015 |
|
15-39 years |
|
32 Village Lane, Wedowee, AL |
|
|
— |
|
|
|
92 |
|
|
|
1,454 |
|
|
|
— |
|
|
|
— |
|
|
|
|
|
92 |
|
|
|
1,454 |
|
|
|
1,546 |
|
|
|
88 |
|
|
2002 |
|
2015 |
|
15-39 years |
|
1421 Winchester Road NE, Huntsville, AL |
|
|
— |
|
|
|
133 |
|
|
|
2,029 |
|
|
|
— |
|
|
|
— |
|
|
|
|
|
133 |
|
|
|
2,029 |
|
|
|
2,162 |
|
|
|
125 |
|
|
2010 |
|
2015 |
|
15-39 years |
133
|
|
|
|
|
|
|
Initial Costs to Company(A) |
|
|
Costs Capitalized Subsequent to Acquisition |
|
Gross Amount at Which Carried at Close of Period |
|
|
|
|
|
|
|
|
|
|
Life on Which |
||||||||||||||||||||||
|
Description |
|
Encumbrance |
|
|
Land |
|
|
Buildings and Improvements |
|
|
Land |
|
|
Improvements |
|
|
Carrying Costs |
|
Land |
|
|
Buildings and Improvements |
|
|
Total(B) |
|
|
Accumulated Depreciation |
|
|
Date of Construction |
|
Date Acquired |
|
Depreciation is Computed |
|||||||||
|
900 Hansen Road, Ashwaubenon, WI |
|
|
— |
|
|
|
86 |
|
|
|
2,008 |
|
|
|
— |
|
|
|
— |
|
|
|
|
|
86 |
|
|
|
2,008 |
|
|
|
2,094 |
|
|
|
127 |
|
|
1994 |
|
2015 |
|
15-39 years |
|
1700 S. Koeller St., Oshkosh, WI |
|
|
— |
|
|
|
145 |
|
|
|
1,795 |
|
|
|
— |
|
|
|
— |
|
|
|
|
|
145 |
|
|
|
1,795 |
|
|
|
1,940 |
|
|
|
119 |
|
|
1996 |
|
2015 |
|
15-39 years |
|
2420 E. Mason St., Green Bay, WI |
|
|
— |
|
|
|
106 |
|
|
|
1,713 |
|
|
|
— |
|
|
|
— |
|
|
|
|
|
106 |
|
|
|
1,713 |
|
|
|
1,819 |
|
|
|
112 |
|
|
1996 |
|
2015 |
|
15-39 years |
|
2510 W. Washington St., West Bend, WI |
|
|
— |
|
|
|
113 |
|
|
|
1,704 |
|
|
|
— |
|
|
|
— |
|
|
|
|
|
113 |
|
|
|
1,704 |
|
|
|
1,817 |
|
|
|
111 |
|
|
1996 |
|
2015 |
|
15-39 years |
|
3040 E. College Ave., Appleton, WI |
|
|
— |
|
|
|
96 |
|
|
|
1,637 |
|
|
|
— |
|
|
|
— |
|
|
|
|
|
96 |
|
|
|
1,637 |
|
|
|
1,733 |
|
|
|
107 |
|
|
1996 |
|
2015 |
|
15-39 years |
|
3730 W. College Ave., Appleton, WI |
|
|
— |
|
|
|
95 |
|
|
|
2,478 |
|
|
|
— |
|
|
|
— |
|
|
|
|
|
95 |
|
|
|
2,478 |
|
|
|
2,573 |
|
|
|
153 |
|
|
1976 |
|
2015 |
|
15-39 years |
|
4435 Calumet Ave., Manitowoc, WI |
|
|
— |
|
|
|
106 |
|
|
|
1,714 |
|
|
|
— |
|
|
|
— |
|
|
|
|
|
106 |
|
|
|
1,714 |
|
|
|
1,820 |
|
|
|
113 |
|
|
1996 |
|
2015 |
|
15-39 years |
|
4745 Golf Road, Eau Claire, WI |
|
|
— |
|
|
|
137 |
|
|
|
2,245 |
|
|
|
— |
|
|
|
— |
|
|
|
|
|
137 |
|
|
|
2,245 |
|
|
|
2,382 |
|
|
|
149 |
|
|
1994 |
|
2015 |
|
15-39 years |
|
271 N Dupont Highway, Dover, DE |
|
|
— |
|
|
|
211 |
|
|
|
3,455 |
|
|
|
— |
|
|
|
— |
|
|
|
|
|
211 |
|
|
|
3,455 |
|
|
|
3,666 |
|
|
|
208 |
|
|
1991 |
|
2015 |
|
15-39 years |
|
302 N Interstate Drive, Norman, OK |
|
|
— |
|
|
|
232 |
|
|
|
3,733 |
|
|
|
— |
|
|
|
— |
|
|
|
|
|
232 |
|
|
|
3,733 |
|
|
|
3,965 |
|
|
|
227 |
|
|
1982 |
|
2015 |
|
15-39 years |
|
305 Merchants Rd, Knoxville, TN |
|
|
— |
|
|
|
151 |
|
|
|
2,775 |
|
|
|
— |
|
|
|
— |
|
|
|
|
|
151 |
|
|
|
2,775 |
|
|
|
2,926 |
|
|
|
182 |
|
|
1978 |
|
2015 |
|
15-39 years |
|
555 South West Street, Wichita, KS |
|
|
— |
|
|
|
468 |
|
|
|
3,475 |
|
|
|
— |
|
|
|
— |
|
|
|
|
|
468 |
|
|
|
3,475 |
|
|
|
3,943 |
|
|
|
212 |
|
|
1982 |
|
2015 |
|
15-39 years |
|
575 S Telshor Blvd, Las Cruces, NM |
|
|
— |
|
|
|
108 |
|
|
|
4,069 |
|
|
|
— |
|
|
|
— |
|
|
|
|
|
108 |
|
|
|
4,069 |
|
|
|
4,177 |
|
|
|
251 |
|
|
1991 |
|
2015 |
|
15-39 years |
|
1725 Rainbow Dr., Gadsden, AL |
|
|
— |
|
|
|
219 |
|
|
|
2,915 |
|
|
|
— |
|
|
|
— |
|
|
|
|
|
219 |
|
|
|
2,915 |
|
|
|
3,134 |
|
|
|
181 |
|
|
1981 |
|
2015 |
|
15-39 years |
|
2077 Riverside Drive, Macon, GA |
|
|
— |
|
|
|
258 |
|
|
|
3,235 |
|
|
|
— |
|
|
|
— |
|
|
|
|
|
258 |
|
|
|
3,235 |
|
|
|
3,493 |
|
|
|
195 |
|
|
1972 |
|
2015 |
|
15-39 years |
134
|
|
|
|
|
|
|
Initial Costs to Company(A) |
|
|
Costs Capitalized Subsequent to Acquisition |
|
Gross Amount at Which Carried at Close of Period |
|
|
|
|
|
|
|
|
|
|
Life on Which |
|
|||||||||||||||||||||||
|
Description |
|
Encumbrance |
|
|
Land |
|
|
Buildings and Improvements |
|
|
Land |
|
|
Improvements |
|
|
Carrying Costs |
|
Land |
|
|
Buildings and Improvements |
|
|
Total(B) |
|
|
Accumulated Depreciation |
|
|
Date of Construction |
|
Date Acquired |
|
Depreciation is Computed |
|
||||||||||
|
4455 Wadsworth Blvd, Wheat Ridge, CO |
|
|
— |
|
|
|
451 |
|
|
|
3,614 |
|
|
|
— |
|
|
|
— |
|
|
|
|
|
451 |
|
|
|
3,614 |
|
|
|
4,065 |
|
|
|
216 |
|
|
1974 |
|
2015 |
|
15-39 years |
|
|
|
6728 S Memorial Drive, Tulsa, OK |
|
|
— |
|
|
|
125 |
|
|
|
3,846 |
|
|
|
— |
|
|
|
— |
|
|
|
|
|
125 |
|
|
|
3,846 |
|
|
|
3,971 |
|
|
|
230 |
|
|
1987 |
|
2015 |
|
15-39 years |
|
|
|
8350 3rd Street North, Oakdale, MN |
|
|
— |
|
|
|
197 |
|
|
|
3,455 |
|
|
|
— |
|
|
|
— |
|
|
|
|
|
197 |
|
|
|
3,455 |
|
|
|
3,652 |
|
|
|
206 |
|
|
2006 |
|
2015 |
|
15-39 years |
|
|
|
9415 Pineville-Matthews Rd, Pineville, NC |
|
|
— |
|
|
|
74 |
|
|
|
3,587 |
|
|
|
— |
|
|
|
— |
|
|
|
|
|
74 |
|
|
|
3,587 |
|
|
|
3,661 |
|
|
|
221 |
|
|
1991 |
|
2015 |
|
15-39 years |
|
|
|
10520 Coors By-Pass NW, Albuquerque, NM |
|
|
— |
|
|
|
196 |
|
|
|
3,389 |
|
|
|
— |
|
|
|
— |
|
|
|
|
|
196 |
|
|
|
3,389 |
|
|
|
3,585 |
|
|
|
211 |
|
|
2002 |
|
2015 |
|
15-39 years |
|
|
|
12515 Elm Creek Blvd.,N., Maple Grove, MN |
|
|
— |
|
|
|
243 |
|
|
|
3,253 |
|
|
|
— |
|
|
|
— |
|
|
|
|
|
243 |
|
|
|
3,253 |
|
|
|
3,496 |
|
|
|
201 |
|
|
2001 |
|
2015 |
|
15-39 years |
|
|
|
670 NW Blue Parkway, Lee's Summit, MO |
|
|
— |
|
|
|
132 |
|
|
|
3,447 |
|
|
|
— |
|
|
|
— |
|
|
|
|
|
132 |
|
|
|
3,447 |
|
|
|
3,579 |
|
|
|
220 |
|
|
2010 |
|
2015 |
|
15-39 years |
|
|
|
1745 Old Fort Parkway, Murfreesboro, TN |
|
|
— |
|
|
|
247 |
|
|
|
2,747 |
|
|
|
— |
|
|
|
— |
|
|
|
|
|
247 |
|
|
|
2,747 |
|
|
|
2,994 |
|
|
|
181 |
|
|
1987 |
|
2015 |
|
15-39 years |
|
|
|
2550 Nicholasville Road, Lexington, KY |
|
|
— |
|
|
|
1,258 |
|
|
|
— |
|
|
|
— |
|
|
|
— |
|
|
|
|
|
1,258 |
|
|
|
— |
|
|
|
1,258 |
|
|
|
— |
|
|
1976 |
|
2015 |
|
|
— |
|
|
2950 Plainfield Road, Joliet, IL |
|
|
— |
|
|
|
686 |
|
|
|
3,072 |
|
|
|
— |
|
|
|
— |
|
|
|
|
|
686 |
|
|
|
3,072 |
|
|
|
3,758 |
|
|
|
202 |
|
|
1991 |
|
2015 |
|
15-39 years |
|
|
|
1814 Gallatin Pike N., Madison, TN |
|
|
— |
|
|
|
97 |
|
|
|
4,617 |
|
|
|
— |
|
|
|
— |
|
|
|
|
|
97 |
|
|
|
4,617 |
|
|
|
4,714 |
|
|
|
211 |
|
|
1972 |
|
2016 |
|
15-39 years |
|
|
|
7921 Dream St., Florence, KY |
|
|
— |
|
|
|
61 |
|
|
|
4,687 |
|
|
|
— |
|
|
|
— |
|
|
|
|
|
61 |
|
|
|
4,687 |
|
|
|
4,748 |
|
|
|
216 |
|
|
1977 |
|
2016 |
|
15-39 years |
|
|
|
2925 White Bear Ave., Maplewood, MN |
|
|
— |
|
|
|
315 |
|
|
|
1,551 |
|
|
|
— |
|
|
|
— |
|
|
|
|
|
315 |
|
|
|
1,551 |
|
|
|
1,866 |
|
|
|
95 |
|
|
1983 |
|
2016 |
|
15-39 years |
|
|
|
4450 Rodeo Road, Santa Fe, NM |
|
|
— |
|
|
|
121 |
|
|
|
2,979 |
|
|
|
— |
|
|
|
— |
|
|
|
|
|
121 |
|
|
|
2,979 |
|
|
|
3,100 |
|
|
|
136 |
|
|
1990 |
|
2016 |
|
15-39 years |
|
|
|
7750 Winchester Road, Memphis, TN |
|
|
— |
|
|
|
103 |
|
|
|
3,327 |
|
|
|
— |
|
|
|
— |
|
|
|
|
|
103 |
|
|
|
3,327 |
|
|
|
3,430 |
|
|
|
161 |
|
|
2008 |
|
2016 |
|
15-39 years |
|
|
135
|
|
|
|
|
|
|
Initial Costs to Company(A) |
|
|
Costs Capitalized Subsequent to Acquisition |
|
Gross Amount at Which Carried at Close of Period |
|
|
|
|
|
|
|
|
|
|
Life on Which |
|
|||||||||||||||||||||||
|
Description |
|
Encumbrance |
|
|
Land |
|
|
Buildings and Improvements |
|
|
Land |
|
|
Improvements |
|
|
Carrying Costs |
|
Land |
|
|
Buildings and Improvements |
|
|
Total(B) |
|
|
Accumulated Depreciation |
|
|
Date of Construction |
|
Date Acquired |
|
Depreciation is Computed |
|
||||||||||
|
2642 Stadium Blvd., Jonesboro, AR |
|
|
— |
|
|
|
324 |
|
|
|
3,383 |
|
|
|
— |
|
|
|
— |
|
|
|
|
|
324 |
|
|
|
3,383 |
|
|
|
3,707 |
|
|
|
161 |
|
|
2011 |
|
2016 |
|
15-39 years |
|
|
|
120 Creasy Lane S., Lafayette, IN |
|
|
— |
|
|
|
285 |
|
|
|
3,436 |
|
|
|
— |
|
|
|
— |
|
|
|
|
|
285 |
|
|
|
3,436 |
|
|
|
3,721 |
|
|
|
163 |
|
|
2012 |
|
2016 |
|
15-39 years |
|
|
|
45 Betten Court, Bridgeport, WV |
|
|
— |
|
|
|
88 |
|
|
|
4,074 |
|
|
|
— |
|
|
|
— |
|
|
|
|
|
88 |
|
|
|
4,074 |
|
|
|
4,162 |
|
|
|
218 |
|
|
2007 |
|
2016 |
|
15-39 years |
|
|
|
442 Fortman Drive, St. Mary's, OH |
|
|
— |
|
|
|
56 |
|
|
|
3,997 |
|
|
|
— |
|
|
|
— |
|
|
|
|
|
56 |
|
|
|
3,997 |
|
|
|
4,053 |
|
|
|
218 |
|
|
2011 |
|
2016 |
|
15-39 years |
|
|
|
2948 Allentown Road, Lima, OH |
|
|
— |
|
|
|
69 |
|
|
|
3,813 |
|
|
|
— |
|
|
|
— |
|
|
|
|
|
69 |
|
|
|
3,813 |
|
|
|
3,882 |
|
|
|
207 |
|
|
2009 |
|
2016 |
|
15-39 years |
|
|
|
45131 Columbia Place, Sterling, VA |
|
|
18,622 |
|
|
|
24,395 |
|
|
|
— |
|
|
|
— |
|
|
|
— |
|
|
|
|
|
24,395 |
|
|
|
— |
|
|
|
24,395 |
|
|
|
— |
|
|
2004 |
|
2016 |
|
|
— |
|
|
2400 North Interstate 35, Round Rock, TX |
|
|
— |
|
|
|
769 |
|
|
|
4,176 |
|
|
|
— |
|
|
|
— |
|
|
|
|
|
769 |
|
|
|
4,176 |
|
|
|
4,945 |
|
|
|
188 |
|
|
1984 |
|
2016 |
|
15-39 years |
|
|
|
2451 S. Capital of Texas Highway, Austin, TX |
|
|
— |
|
|
|
1,184 |
|
|
|
5,678 |
|
|
|
— |
|
|
|
— |
|
|
|
|
|
1,184 |
|
|
|
5,678 |
|
|
|
6,862 |
|
|
|
259 |
|
|
1998 |
|
2016 |
|
15-39 years |
|
|
|
7709 Ranch Road 620 N, Austin, TX |
|
|
— |
|
|
|
2,104 |
|
|
|
7,566 |
|
|
|
— |
|
|
|
— |
|
|
|
|
|
2,104 |
|
|
|
7,566 |
|
|
|
9,670 |
|
|
|
362 |
|
|
2006 |
|
2016 |
|
15-39 years |
|
|
|
11570 Research Boulevard, Austin, TX |
|
|
— |
|
|
|
4,190 |
|
|
|
7,829 |
|
|
|
— |
|
|
|
— |
|
|
|
|
|
4,190 |
|
|
|
7,829 |
|
|
|
12,019 |
|
|
|
358 |
|
|
1994 |
|
2016 |
|
15-39 years |
|
|
|
1724 W. Everly Brothers Blvd., Central City, KY |
|
|
— |
|
|
|
315 |
|
|
|
580 |
|
|
|
— |
|
|
|
— |
|
|
|
|
|
315 |
|
|
|
580 |
|
|
|
895 |
|
|
|
31 |
|
|
1978 |
|
2016 |
|
15-39 years |
|
|
|
814 Frederica Street, Owensboro, KY |
|
|
— |
|
|
|
177 |
|
|
|
615 |
|
|
|
— |
|
|
|
— |
|
|
|
|
|
177 |
|
|
|
615 |
|
|
|
792 |
|
|
|
28 |
|
|
1972 |
|
2016 |
|
15-39 years |
|
|
|
8000 State Road 66, Newburgh, IN |
|
|
— |
|
|
|
330 |
|
|
|
— |
|
|
|
— |
|
|
|
— |
|
|
|
|
|
330 |
|
|
|
— |
|
|
|
330 |
|
|
|
— |
|
|
1994 |
|
2016 |
|
|
— |
|
|
2015 E Malone Avenue, Sikeston, MO |
|
|
— |
|
|
|
205 |
|
|
|
2,235 |
|
|
|
— |
|
|
|
— |
|
|
|
|
|
205 |
|
|
|
2,235 |
|
|
|
2,440 |
|
|
|
106 |
|
|
1940 |
|
2016 |
|
15-39 years |
|
|
|
1000-1108 N Fares Ave., Evansville, IN |
|
|
— |
|
|
|
636 |
|
|
|
3,655 |
|
|
|
— |
|
|
|
— |
|
|
|
|
|
636 |
|
|
|
3,655 |
|
|
|
4,291 |
|
|
|
164 |
|
|
1949 |
|
2016 |
|
15-39 years |
|
|
136
|
|
|
|
|
|
|
Initial Costs to Company(A) |
|
|
Costs Capitalized Subsequent to Acquisition |
|
Gross Amount at Which Carried at Close of Period |
|
|
|
|
|
|
|
|
|
|
Life on Which |
||||||||||||||||||||||
|
Description |
|
Encumbrance |
|
|
Land |
|
|
Buildings and Improvements |
|
|
Land |
|
|
Improvements |
|
|
Carrying Costs |
|
Land |
|
|
Buildings and Improvements |
|
|
Total(B) |
|
|
Accumulated Depreciation |
|
|
Date of Construction |
|
Date Acquired |
|
Depreciation is Computed |
|||||||||
|
400-500 NW Fourth Street, Evansville, IN |
|
|
— |
|
|
|
244 |
|
|
|
2,375 |
|
|
|
— |
|
|
|
— |
|
|
|
|
|
244 |
|
|
|
2,375 |
|
|
|
2,619 |
|
|
|
104 |
|
|
1909 |
|
2016 |
|
15-39 years |
|
1200 Dufour Street, Marion, IL |
|
|
— |
|
|
|
314 |
|
|
|
2,089 |
|
|
|
— |
|
|
|
— |
|
|
|
|
|
314 |
|
|
|
2,089 |
|
|
|
2,403 |
|
|
|
94 |
|
|
1970 |
|
2016 |
|
15-39 years |
|
802 First Street, Kennett, MO |
|
|
— |
|
|
|
191 |
|
|
|
1,198 |
|
|
|
— |
|
|
|
— |
|
|
|
|
|
191 |
|
|
|
1,198 |
|
|
|
1,389 |
|
|
|
55 |
|
|
1970 |
|
2016 |
|
15-39 years |
|
2810 Westwood Blvd, Poplar Bluff, MO |
|
|
— |
|
|
|
149 |
|
|
|
1,794 |
|
|
|
— |
|
|
|
— |
|
|
|
|
|
149 |
|
|
|
1,794 |
|
|
|
1,943 |
|
|
|
86 |
|
|
1970 |
|
2016 |
|
15-39 years |
|
2000 Independence Street, Cape Girardeau, MO |
|
|
— |
|
|
|
76 |
|
|
|
542 |
|
|
|
— |
|
|
|
— |
|
|
|
|
|
76 |
|
|
|
542 |
|
|
|
618 |
|
|
|
28 |
|
|
1988 |
|
2016 |
|
15-39 years |
|
3480 Nash Road, Scott City, MO |
|
|
— |
|
|
|
260 |
|
|
|
3,052 |
|
|
|
— |
|
|
|
— |
|
|
|
|
|
260 |
|
|
|
3,052 |
|
|
|
3,312 |
|
|
|
139 |
|
|
1978 |
|
2016 |
|
15-39 years |
|
1400 Green Street, Henderson, KY |
|
|
— |
|
|
|
290 |
|
|
|
729 |
|
|
|
— |
|
|
|
— |
|
|
|
|
|
290 |
|
|
|
729 |
|
|
|
1,019 |
|
|
|
38 |
|
|
1973 |
|
2016 |
|
15-39 years |
|
1400 S. Division Street, Blytheville, AR |
|
|
— |
|
|
|
413 |
|
|
|
3,405 |
|
|
|
— |
|
|
|
— |
|
|
|
|
|
413 |
|
|
|
3,405 |
|
|
|
3,818 |
|
|
|
166 |
|
|
1966 |
|
2016 |
|
15-39 years |
|
600 N Jackson Street, Harrisburg, IL |
|
|
— |
|
|
|
131 |
|
|
|
839 |
|
|
|
— |
|
|
|
— |
|
|
|
|
|
131 |
|
|
|
839 |
|
|
|
970 |
|
|
|
37 |
|
|
1970 |
|
2016 |
|
15-39 years |
|
4121 Highway 31 East, Clarksville, IN |
|
|
— |
|
|
|
1,091 |
|
|
|
3,890 |
|
|
|
— |
|
|
|
— |
|
|
|
|
|
1,091 |
|
|
|
3,890 |
|
|
|
4,981 |
|
|
|
192 |
|
|
1961 |
|
2016 |
|
15-39 years |
|
1230 Alsop Lane, Owensboro, KY |
|
|
— |
|
|
|
499 |
|
|
|
734 |
|
|
|
— |
|
|
|
— |
|
|
|
|
|
499 |
|
|
|
734 |
|
|
|
1,233 |
|
|
|
36 |
|
|
1976 |
|
2016 |
|
15-39 years |
|
5911 Pearl Court, Evansville, IN |
|
|
— |
|
|
|
203 |
|
|
|
369 |
|
|
|
— |
|
|
|
— |
|
|
|
|
|
203 |
|
|
|
369 |
|
|
|
572 |
|
|
|
26 |
|
|
2001 |
|
2016 |
|
15-39 years |
|
12624 S Northgate Drive, Haubstadt, IN |
|
|
— |
|
|
|
379 |
|
|
|
1,349 |
|
|
|
— |
|
|
|
— |
|
|
|
|
|
379 |
|
|
|
1,349 |
|
|
|
1,728 |
|
|
|
73 |
|
|
2005 |
|
2016 |
|
15-39 years |
|
7695 S 1150 E, Otterbein, IN |
|
|
— |
|
|
|
177 |
|
|
|
1,385 |
|
|
|
— |
|
|
|
— |
|
|
|
|
|
177 |
|
|
|
1,385 |
|
|
|
1,562 |
|
|
|
79 |
|
|
1978 |
|
2016 |
|
15-39 years |
|
2925 Ross Clark Cr., Dothan, AL |
|
|
— |
|
|
|
539 |
|
|
|
2,551 |
|
|
|
— |
|
|
|
— |
|
|
|
|
|
539 |
|
|
|
2,551 |
|
|
|
3,090 |
|
|
|
102 |
|
|
1997 |
|
2016 |
|
15-39 years |
137
|
|
|
|
|
|
|
Initial Costs to Company(A) |
|
|
Costs Capitalized Subsequent to Acquisition |
|
Gross Amount at Which Carried at Close of Period |
|
|
|
|
|
|
|
|
|
|
Life on Which |
||||||||||||||||||||||
|
Description |
|
Encumbrance |
|
|
Land |
|
|
Buildings and Improvements |
|
|
Land |
|
|
Improvements |
|
|
Carrying Costs |
|
Land |
|
|
Buildings and Improvements |
|
|
Total(B) |
|
|
Accumulated Depreciation |
|
|
Date of Construction |
|
Date Acquired |
|
Depreciation is Computed |
|||||||||
|
1820 Raymond Diehl Rd., Tallahassee, FL |
|
|
— |
|
|
|
864 |
|
|
|
2,184 |
|
|
|
— |
|
|
|
— |
|
|
|
|
|
864 |
|
|
|
2,184 |
|
|
|
3,048 |
|
|
|
93 |
|
|
1995 |
|
2016 |
|
15-39 years |
|
995 N. Peachtree Parkway, Peachtree City, GA |
|
|
— |
|
|
|
476 |
|
|
|
2,590 |
|
|
|
— |
|
|
|
— |
|
|
|
|
|
476 |
|
|
|
2,590 |
|
|
|
3,066 |
|
|
|
107 |
|
|
1997 |
|
2016 |
|
15-39 years |
|
1824 Club House Drive, Valdosta, GA |
|
|
— |
|
|
|
524 |
|
|
|
2,504 |
|
|
|
— |
|
|
|
— |
|
|
|
|
|
524 |
|
|
|
2,504 |
|
|
|
3,028 |
|
|
|
104 |
|
|
1997 |
|
2016 |
|
15-39 years |
|
15608 S Harlem Avenue, Orland Park, IL |
|
|
— |
|
|
|
686 |
|
|
|
2,358 |
|
|
|
— |
|
|
|
— |
|
|
|
|
|
686 |
|
|
|
2,358 |
|
|
|
3,044 |
|
|
|
102 |
|
|
1994 |
|
2016 |
|
15-39 years |
|
6007 E. State Street, Rockford, IL |
|
|
— |
|
|
|
450 |
|
|
|
2,701 |
|
|
|
— |
|
|
|
— |
|
|
|
|
|
450 |
|
|
|
2,701 |
|
|
|
3,151 |
|
|
|
109 |
|
|
1996 |
|
2016 |
|
15-39 years |
|
3201 W 3rd St., Bloomington, IN |
|
|
— |
|
|
|
240 |
|
|
|
2,761 |
|
|
|
— |
|
|
|
— |
|
|
|
|
|
240 |
|
|
|
2,761 |
|
|
|
3,001 |
|
|
|
103 |
|
|
1994 |
|
2016 |
|
15-39 years |
|
3730 S. Reed Rd., Kokomo, IN |
|
|
— |
|
|
|
106 |
|
|
|
3,065 |
|
|
|
— |
|
|
|
— |
|
|
|
|
|
106 |
|
|
|
3,065 |
|
|
|
3,171 |
|
|
|
110 |
|
|
1995 |
|
2016 |
|
15-39 years |
|
6435 Dixie Hwy., Clarkston, MI |
|
|
— |
|
|
|
284 |
|
|
|
2,788 |
|
|
|
— |
|
|
|
— |
|
|
|
|
|
284 |
|
|
|
2,788 |
|
|
|
3,072 |
|
|
|
123 |
|
|
1997 |
|
2016 |
|
15-39 years |
|
1515 W. 14 Mile Rd., Madison Heights, MI |
|
|
— |
|
|
|
58 |
|
|
|
3,094 |
|
|
|
— |
|
|
|
— |
|
|
|
|
|
58 |
|
|
|
3,094 |
|
|
|
3,152 |
|
|
|
110 |
|
|
1995 |
|
2016 |
|
15-39 years |
|
7873 Conference Ctr Dr., Brighton, MI |
|
|
— |
|
|
|
102 |
|
|
|
2,920 |
|
|
|
— |
|
|
|
— |
|
|
|
|
|
102 |
|
|
|
2,920 |
|
|
|
3,022 |
|
|
|
121 |
|
|
1998 |
|
2016 |
|
15-39 years |
|
1501 Boardman Road, Jackson, MI |
|
|
— |
|
|
|
177 |
|
|
|
2,846 |
|
|
|
— |
|
|
|
— |
|
|
|
|
|
177 |
|
|
|
2,846 |
|
|
|
3,023 |
|
|
|
115 |
|
|
1996 |
|
2016 |
|
15-39 years |
|
250 Mitchelle Drive, Hendersonville, NC |
|
|
— |
|
|
|
165 |
|
|
|
2,928 |
|
|
|
— |
|
|
|
— |
|
|
|
|
|
165 |
|
|
|
2,928 |
|
|
|
3,093 |
|
|
|
125 |
|
|
2000 |
|
2016 |
|
15-39 years |
|
111 Howell Road, New Bern, NC |
|
|
— |
|
|
|
284 |
|
|
|
2,525 |
|
|
|
— |
|
|
|
— |
|
|
|
|
|
284 |
|
|
|
2,525 |
|
|
|
2,809 |
|
|
|
103 |
|
|
2000 |
|
2016 |
|
15-39 years |
|
2625 West Craig Rd., Las Vegas, NV |
|
|
— |
|
|
|
962 |
|
|
|
2,086 |
|
|
|
— |
|
|
|
— |
|
|
|
|
|
962 |
|
|
|
2,086 |
|
|
|
3,048 |
|
|
|
96 |
|
|
2002 |
|
2016 |
|
15-39 years |
|
230 Lake Drive East, Cherry Hill, NJ |
|
|
— |
|
|
|
791 |
|
|
|
2,340 |
|
|
|
— |
|
|
|
— |
|
|
|
|
|
791 |
|
|
|
2,340 |
|
|
|
3,131 |
|
|
|
101 |
|
|
1992 |
|
2016 |
|
15-39 years |
138
|
|
|
|
|
|
|
Initial Costs to Company(A) |
|
|
Costs Capitalized Subsequent to Acquisition |
|
Gross Amount at Which Carried at Close of Period |
|
|
|
|
|
|
|
|
|
|
Life on Which |
||||||||||||||||||||||
|
Description |
|
Encumbrance |
|
|
Land |
|
|
Buildings and Improvements |
|
|
Land |
|
|
Improvements |
|
|
Carrying Costs |
|
Land |
|
|
Buildings and Improvements |
|
|
Total(B) |
|
|
Accumulated Depreciation |
|
|
Date of Construction |
|
Date Acquired |
|
Depreciation is Computed |
|||||||||
|
3527 N. Union Deposit Road, Harrisburg, PA |
|
|
— |
|
|
|
735 |
|
|
|
2,340 |
|
|
|
— |
|
|
|
— |
|
|
|
|
|
735 |
|
|
|
2,340 |
|
|
|
3,075 |
|
|
|
97 |
|
|
1994 |
|
2016 |
|
15-39 years |
|
9395 McKnight Road, Pittsburgh, PA |
|
|
— |
|
|
|
363 |
|
|
|
3,488 |
|
|
|
— |
|
|
|
— |
|
|
|
|
|
363 |
|
|
|
3,488 |
|
|
|
3,851 |
|
|
|
139 |
|
|
1996 |
|
2016 |
|
15-39 years |
|
1550 I-10 South, Beaumont, TX |
|
|
— |
|
|
|
206 |
|
|
|
3,241 |
|
|
|
— |
|
|
|
— |
|
|
|
|
|
206 |
|
|
|
3,241 |
|
|
|
3,447 |
|
|
|
128 |
|
|
1996 |
|
2016 |
|
15-39 years |
|
1101 N. Beckley Ave., Desoto, TX |
|
|
— |
|
|
|
535 |
|
|
|
2,542 |
|
|
|
— |
|
|
|
— |
|
|
|
|
|
535 |
|
|
|
2,542 |
|
|
|
3,077 |
|
|
|
108 |
|
|
1999 |
|
2016 |
|
15-39 years |
|
2211 S. Stemmons Frwy., Lewisville, TX |
|
|
— |
|
|
|
299 |
|
|
|
2,786 |
|
|
|
— |
|
|
|
— |
|
|
|
|
|
299 |
|
|
|
2,786 |
|
|
|
3,085 |
|
|
|
105 |
|
|
1994 |
|
2016 |
|
15-39 years |
|
502 West Bay Area Blvd., Webster, TX |
|
|
— |
|
|
|
591 |
|
|
|
2,622 |
|
|
|
— |
|
|
|
— |
|
|
|
|
|
591 |
|
|
|
2,622 |
|
|
|
3,213 |
|
|
|
109 |
|
|
1995 |
|
2016 |
|
15-39 years |
|
261 University Boulevard, Harrisonburg, VA |
|
|
— |
|
|
|
444 |
|
|
|
2,645 |
|
|
|
— |
|
|
|
— |
|
|
|
|
|
444 |
|
|
|
2,645 |
|
|
|
3,089 |
|
|
|
113 |
|
|
1998 |
|
2016 |
|
15-39 years |
|
111 Hylton Lane, Beckley, WV |
|
|
— |
|
|
|
194 |
|
|
|
3,049 |
|
|
|
— |
|
|
|
— |
|
|
|
|
|
194 |
|
|
|
3,049 |
|
|
|
3,243 |
|
|
|
119 |
|
|
1997 |
|
2016 |
|
15-39 years |
|
1501 E. Washington Road, Ithaca, MI |
|
|
— |
|
|
|
739 |
|
|
|
2,669 |
|
|
|
— |
|
|
|
— |
|
|
|
|
|
739 |
|
|
|
2,669 |
|
|
|
3,408 |
|
|
|
106 |
|
|
2015 |
|
2016 |
|
15-39 years |
|
4005 Douglas Highway, Gillette, WY |
|
|
— |
|
|
|
366 |
|
|
|
3,447 |
|
|
|
— |
|
|
|
— |
|
|
|
|
|
366 |
|
|
|
3,447 |
|
|
|
3,813 |
|
|
|
130 |
|
|
2014 |
|
2016 |
|
15-39 years |
|
27775 Novi Rd., Novi, MI |
|
|
— |
|
|
|
201 |
|
|
|
12,681 |
|
|
|
— |
|
|
|
— |
|
|
|
|
|
201 |
|
|
|
12,681 |
|
|
|
12,882 |
|
|
|
316 |
|
|
1985 |
|
2017 |
|
15-39 years |
|
8748 West Saginaw Hwy, Lansing, MI |
|
|
— |
|
|
|
88 |
|
|
|
13,919 |
|
|
|
— |
|
|
|
3 |
|
|
|
|
|
88 |
|
|
|
13,922 |
|
|
|
14,010 |
|
|
|
334 |
|
|
1999 |
|
2017 |
|
15-39 years |
|
4577 Miller Road, Flint, MI |
|
|
— |
|
|
|
83 |
|
|
|
7,987 |
|
|
|
— |
|
|
|
— |
|
|
|
|
|
83 |
|
|
|
7,987 |
|
|
|
8,070 |
|
|
|
192 |
|
|
1977 |
|
2017 |
|
15-39 years |
|
33801 S. Gratiot Ave., Clinton Township, MI |
|
|
— |
|
|
|
358 |
|
|
|
9,551 |
|
|
|
— |
|
|
|
— |
|
|
|
|
|
358 |
|
|
|
9,551 |
|
|
|
9,909 |
|
|
|
231 |
|
|
1987 |
|
2017 |
|
15-39 years |
|
50400 Gratiot Ave., Chesterfield, MI |
|
|
— |
|
|
|
753 |
|
|
|
9,716 |
|
|
|
— |
|
|
|
— |
|
|
|
|
|
753 |
|
|
|
9,716 |
|
|
|
10,469 |
|
|
|
242 |
|
|
2003 |
|
2017 |
|
15-39 years |
139
|
|
|
|
|
|
|
Initial Costs to Company(A) |
|
|
Costs Capitalized Subsequent to Acquisition |
|
Gross Amount at Which Carried at Close of Period |
|
|
|
|
|
|
|
|
|
|
Life on Which |
||||||||||||||||||||||
|
Description |
|
Encumbrance |
|
|
Land |
|
|
Buildings and Improvements |
|
|
Land |
|
|
Improvements |
|
|
Carrying Costs |
|
Land |
|
|
Buildings and Improvements |
|
|
Total(B) |
|
|
Accumulated Depreciation |
|
|
Date of Construction |
|
Date Acquired |
|
Depreciation is Computed |
|||||||||
|
1775 Oak Hollow Dr., Traverse City, MI |
|
|
— |
|
|
|
106 |
|
|
|
8,468 |
|
|
|
— |
|
|
|
— |
|
|
|
|
|
106 |
|
|
|
8,468 |
|
|
|
8,574 |
|
|
|
204 |
|
|
1998 |
|
2017 |
|
15-39 years |
|
6340 East 14 Mile Road, Warren, MI |
|
|
— |
|
|
|
158 |
|
|
|
5,394 |
|
|
|
— |
|
|
|
— |
|
|
|
|
|
158 |
|
|
|
5,394 |
|
|
|
5,552 |
|
|
|
130 |
|
|
1991 |
|
2017 |
|
15-39 years |
|
4625 Wilson Ave. SW, Grandville, MI |
|
|
— |
|
|
|
339 |
|
|
|
4,368 |
|
|
|
— |
|
|
|
— |
|
|
|
|
|
339 |
|
|
|
4,368 |
|
|
|
4,707 |
|
|
|
108 |
|
|
2002 |
|
2017 |
|
15-39 years |
|
3500 28th St. SE, Grand Rapids, MI |
|
|
— |
|
|
|
68 |
|
|
|
1,038 |
|
|
|
— |
|
|
|
— |
|
|
|
|
|
68 |
|
|
|
1,038 |
|
|
|
1,106 |
|
|
|
27 |
|
|
2014 |
|
2017 |
|
15-39 years |
|
5641 S. Westnedge Avenue, Portage, MI |
|
|
— |
|
|
|
38 |
|
|
|
2,041 |
|
|
|
— |
|
|
|
— |
|
|
|
|
|
38 |
|
|
|
2,041 |
|
|
|
2,079 |
|
|
|
42 |
|
|
1981 |
|
2017 |
|
15-39 years |
|
13050 Brookpark Road Brook, Park, OH |
|
|
— |
|
|
|
180 |
|
|
|
1,875 |
|
|
|
— |
|
|
|
— |
|
|
|
|
|
180 |
|
|
|
1,875 |
|
|
|
2,055 |
|
|
|
37 |
|
|
2000 |
|
2017 |
|
15-39 years |
|
3023 South Second Street, Terre Haute, IN |
|
|
— |
|
|
|
207 |
|
|
|
1,860 |
|
|
|
— |
|
|
|
— |
|
|
|
|
|
207 |
|
|
|
1,860 |
|
|
|
2,067 |
|
|
|
36 |
|
|
1984 |
|
2017 |
|
15-39 years |
|
1 Mariner Court, Harmarville, PA |
|
|
— |
|
|
|
157 |
|
|
|
1,761 |
|
|
|
— |
|
|
|
— |
|
|
|
|
|
157 |
|
|
|
1,761 |
|
|
|
1,918 |
|
|
|
38 |
|
|
1984 |
|
2017 |
|
15-39 years |
|
7347 California Avenue, Youngstown, OH |
|
|
— |
|
|
|
72 |
|
|
|
1,945 |
|
|
|
— |
|
|
|
— |
|
|
|
|
|
72 |
|
|
|
1,945 |
|
|
|
2,017 |
|
|
|
38 |
|
|
1983 |
|
2017 |
|
15-39 years |
|
932 Sheraton Drive, Mars, PA |
|
|
— |
|
|
|
381 |
|
|
|
1,572 |
|
|
|
— |
|
|
|
— |
|
|
|
|
|
381 |
|
|
|
1,572 |
|
|
|
1,953 |
|
|
|
35 |
|
|
2004 |
|
2017 |
|
15-39 years |
|
4300 State Route 26 E., Lafayette, IN |
|
|
— |
|
|
|
125 |
|
|
|
1,793 |
|
|
|
— |
|
|
|
— |
|
|
|
|
|
125 |
|
|
|
1,793 |
|
|
|
1,918 |
|
|
|
34 |
|
|
1976 |
|
2017 |
|
15-39 years |
|
1776 McDonough Street, Joliet, IL |
|
|
— |
|
|
|
366 |
|
|
|
1,505 |
|
|
|
— |
|
|
|
— |
|
|
|
|
|
366 |
|
|
|
1,505 |
|
|
|
1,871 |
|
|
|
34 |
|
|
1983 |
|
2017 |
|
15-39 years |
|
4471 Eastgate Boulevard, Cincinnati, OH |
|
|
— |
|
|
|
638 |
|
|
|
1,515 |
|
|
|
— |
|
|
|
— |
|
|
|
|
|
638 |
|
|
|
1,515 |
|
|
|
2,153 |
|
|
|
33 |
|
|
1988 |
|
2017 |
|
15-39 years |
|
1301 South Columbus Pike, Delaware, OH |
|
|
— |
|
|
|
54 |
|
|
|
1,788 |
|
|
|
— |
|
|
|
— |
|
|
|
|
|
54 |
|
|
|
1,788 |
|
|
|
1,842 |
|
|
|
35 |
|
|
1987 |
|
2017 |
|
15-39 years |
|
151 Park Center, Wadsworth, OH |
|
|
— |
|
|
|
310 |
|
|
|
1,612 |
|
|
|
— |
|
|
|
— |
|
|
|
|
|
310 |
|
|
|
1,612 |
|
|
|
1,922 |
|
|
|
35 |
|
|
1989 |
|
2017 |
|
15-39 years |
140
|
|
|
|
|
|
|
Initial Costs to Company(A) |
|
|
Costs Capitalized Subsequent to Acquisition |
|
Gross Amount at Which Carried at Close of Period |
|
|
|
|
|
|
|
|
|
|
Life on Which |
||||||||||||||||||||||
|
Description |
|
Encumbrance |
|
|
Land |
|
|
Buildings and Improvements |
|
|
Land |
|
|
Improvements |
|
|
Carrying Costs |
|
Land |
|
|
Buildings and Improvements |
|
|
Total(B) |
|
|
Accumulated Depreciation |
|
|
Date of Construction |
|
Date Acquired |
|
Depreciation is Computed |
|||||||||
|
489 Orphanage Road, Fort Wright, KY |
|
|
— |
|
|
|
68 |
|
|
|
2,373 |
|
|
|
— |
|
|
|
9 |
|
|
|
|
|
68 |
|
|
|
2,382 |
|
|
|
2,450 |
|
|
|
47 |
|
|
1997 |
|
2017 |
|
15-39 years |
|
2449 Gilchrist Road, Akron, OH |
|
|
— |
|
|
|
134 |
|
|
|
1,605 |
|
|
|
— |
|
|
|
— |
|
|
|
|
|
134 |
|
|
|
1,605 |
|
|
|
1,739 |
|
|
|
41 |
|
|
1998 |
|
2017 |
|
15-39 years |
|
4424 Fairfax Drive, Mt. Vernon, IL |
|
|
— |
|
|
|
68 |
|
|
|
1,849 |
|
|
|
— |
|
|
|
— |
|
|
|
|
|
68 |
|
|
|
1,849 |
|
|
|
1,917 |
|
|
|
39 |
|
|
2001 |
|
2017 |
|
15-39 years |
|
241 Wal-Mart Way, Maysville, KY |
|
|
— |
|
|
|
37 |
|
|
|
1,889 |
|
|
|
— |
|
|
|
— |
|
|
|
|
|
37 |
|
|
|
1,889 |
|
|
|
1,926 |
|
|
|
38 |
|
|
2003 |
|
2017 |
|
15-39 years |
|
2896 Pike Street, Parkersburg, WV |
|
|
— |
|
|
|
280 |
|
|
|
1,631 |
|
|
|
— |
|
|
|
— |
|
|
|
|
|
280 |
|
|
|
1,631 |
|
|
|
1,911 |
|
|
|
34 |
|
|
2004 |
|
2017 |
|
15-39 years |
|
475 Gateway Boulevard, Chesterton, IN |
|
|
— |
|
|
|
343 |
|
|
|
1,613 |
|
|
|
— |
|
|
|
— |
|
|
|
|
|
343 |
|
|
|
1,613 |
|
|
|
1,956 |
|
|
|
34 |
|
|
2004 |
|
2017 |
|
15-39 years |
|
121 Kinetic Drive, Huntington, WV |
|
|
— |
|
|
|
344 |
|
|
|
1,575 |
|
|
|
— |
|
|
|
— |
|
|
|
|
|
344 |
|
|
|
1,575 |
|
|
|
1,919 |
|
|
|
32 |
|
|
2005 |
|
2017 |
|
15-39 years |
|
1799 St Rt 125, Amelia, OH |
|
|
— |
|
|
|
315 |
|
|
|
1,719 |
|
|
|
— |
|
|
|
— |
|
|
|
|
|
315 |
|
|
|
1,719 |
|
|
|
2,034 |
|
|
|
33 |
|
|
2006 |
|
2017 |
|
15-39 years |
|
2100 South Main St., Bellefontaine, OH |
|
|
— |
|
|
|
100 |
|
|
|
1,833 |
|
|
|
— |
|
|
|
— |
|
|
|
|
|
100 |
|
|
|
1,833 |
|
|
|
1,933 |
|
|
|
38 |
|
|
1994 |
|
2017 |
|
15-39 years |
|
12930 State Route 664, Logan, OH |
|
|
— |
|
|
|
153 |
|
|
|
1,880 |
|
|
|
— |
|
|
|
— |
|
|
|
|
|
153 |
|
|
|
1,880 |
|
|
|
2,033 |
|
|
|
42 |
|
|
2008 |
|
2017 |
|
15-39 years |
|
618 Ring Road, Harrison, OH |
|
|
— |
|
|
|
204 |
|
|
|
1,514 |
|
|
|
— |
|
|
|
— |
|
|
|
|
|
204 |
|
|
|
1,514 |
|
|
|
1,718 |
|
|
|
32 |
|
|
2014 |
|
2017 |
|
15-39 years |
|
1730 E. Wyandot Avenue, Upper Sandusky, OH |
|
|
— |
|
|
|
171 |
|
|
|
1,198 |
|
|
|
— |
|
|
|
— |
|
|
|
|
|
171 |
|
|
|
1,198 |
|
|
|
1,369 |
|
|
|
25 |
|
|
1994 |
|
2017 |
|
15-39 years |
|
6473 DeZavala Road, San Antonio, TX |
|
|
— |
|
|
|
300 |
|
|
|
1,277 |
|
|
|
— |
|
|
|
1 |
|
|
|
|
|
300 |
|
|
|
1,278 |
|
|
|
1,578 |
|
|
|
24 |
|
|
1998 |
|
2017 |
|
15-39 years |
|
16262 IH 35 N, Selma, TX |
|
|
— |
|
|
|
269 |
|
|
|
805 |
|
|
|
— |
|
|
|
— |
|
|
|
|
|
269 |
|
|
|
805 |
|
|
|
1,074 |
|
|
|
21 |
|
|
2013 |
|
2017 |
|
15-39 years |
|
981 Seven Oaks Drive, Linwood, NC |
|
|
— |
|
|
|
206 |
|
|
|
475 |
|
|
|
— |
|
|
|
— |
|
|
|
|
|
206 |
|
|
|
475 |
|
|
|
681 |
|
|
|
11 |
|
|
1997 |
|
2017 |
|
15-39 years |
141
|
|
|
|
|
|
|
Initial Costs to Company(A) |
|
|
Costs Capitalized Subsequent to Acquisition |
|
Gross Amount at Which Carried at Close of Period |
|
|
|
|
|
|
|
|
|
|
Life on Which |
||||||||||||||||||||||
|
Description |
|
Encumbrance |
|
|
Land |
|
|
Buildings and Improvements |
|
|
Land |
|
|
Improvements |
|
|
Carrying Costs |
|
Land |
|
|
Buildings and Improvements |
|
|
Total(B) |
|
|
Accumulated Depreciation |
|
|
Date of Construction |
|
Date Acquired |
|
Depreciation is Computed |
|||||||||
|
590 Valley Chili Road, Vinton, TX |
|
|
— |
|
|
|
469 |
|
|
|
384 |
|
|
|
— |
|
|
|
— |
|
|
|
|
|
469 |
|
|
|
384 |
|
|
|
853 |
|
|
|
8 |
|
|
2016 |
|
2017 |
|
15-39 years |
|
9541 152nd Ave. NE, Columbus, MN |
|
|
— |
|
|
|
406 |
|
|
|
944 |
|
|
|
— |
|
|
|
— |
|
|
|
|
|
406 |
|
|
|
944 |
|
|
|
1,350 |
|
|
|
13 |
|
|
1983 |
|
2017 |
|
15-39 years |
|
12101 Dixie Highway, Louisville, KY |
|
|
— |
|
|
|
370 |
|
|
|
240 |
|
|
|
— |
|
|
|
— |
|
|
|
|
|
370 |
|
|
|
240 |
|
|
|
610 |
|
|
|
5 |
|
|
2002 |
|
2017 |
|
15-39 years |
|
1320 Interstate Drive, Dunn, NC |
|
|
— |
|
|
|
199 |
|
|
|
659 |
|
|
|
— |
|
|
|
— |
|
|
|
|
|
199 |
|
|
|
659 |
|
|
|
858 |
|
|
|
10 |
|
|
2017 |
|
2017 |
|
15-39 years |
|
5680 S. Interstate Highway 35, San Marcos, TX |
|
|
— |
|
|
|
486 |
|
|
|
776 |
|
|
|
— |
|
|
|
— |
|
|
|
|
|
486 |
|
|
|
776 |
|
|
|
1,262 |
|
|
|
5 |
|
|
2017 |
|
2017 |
|
15-39 years |
|
1600 S. Koeller Street, Oshkosh, WI |
|
|
— |
|
|
|
134 |
|
|
|
5,372 |
|
|
|
— |
|
|
|
— |
|
|
|
|
|
134 |
|
|
|
5,372 |
|
|
|
5,506 |
|
|
|
57 |
|
|
1995 |
|
2017 |
|
15-39 years |
|
3640 Greenwing Drive, Sheboygan, WI |
|
|
— |
|
|
|
266 |
|
|
|
2,787 |
|
|
|
— |
|
|
|
— |
|
|
|
|
|
266 |
|
|
|
2,787 |
|
|
|
3,053 |
|
|
|
35 |
|
|
2002 |
|
2017 |
|
15-39 years |
|
615 N. Rolling Meadows Drive, Fond du Lac, WI |
|
|
— |
|
|
|
120 |
|
|
|
658 |
|
|
|
— |
|
|
|
— |
|
|
|
|
|
120 |
|
|
|
658 |
|
|
|
778 |
|
|
|
9 |
|
|
2006 |
|
2017 |
|
15-39 years |
|
800 Hansen Road, Green Bay, WI |
|
|
— |
|
|
|
398 |
|
|
|
9,087 |
|
|
|
— |
|
|
|
— |
|
|
|
|
|
398 |
|
|
|
9,087 |
|
|
|
9,485 |
|
|
|
96 |
|
|
1992 |
|
2017 |
|
15-39 years |
|
3911 Dewey Street, Manitowoc, WI |
|
|
— |
|
|
|
293 |
|
|
|
2,926 |
|
|
|
— |
|
|
|
— |
|
|
|
|
|
293 |
|
|
|
2,926 |
|
|
|
3,219 |
|
|
|
35 |
|
|
1993 |
|
2017 |
|
15-39 years |
|
3008 S. Congress Avenue, Boynton Beach, FL |
|
|
— |
|
|
|
960 |
|
|
|
2,803 |
|
|
|
— |
|
|
|
— |
|
|
|
|
|
960 |
|
|
|
2,803 |
|
|
|
3,763 |
|
|
|
22 |
|
|
2007 |
|
2017 |
|
7-39 years |
|
8714 Atlantic Boulevard, Jacksonville, FL |
|
|
— |
|
|
|
444 |
|
|
|
2,179 |
|
|
|
— |
|
|
|
— |
|
|
|
|
|
444 |
|
|
|
2,179 |
|
|
|
2,623 |
|
|
|
20 |
|
|
2008 |
|
2017 |
|
7-39 years |
|
9491 Baymeadows Road, Jacksonville, FL |
|
|
— |
|
|
|
319 |
|
|
|
2,191 |
|
|
|
— |
|
|
|
— |
|
|
|
|
|
319 |
|
|
|
2,191 |
|
|
|
2,510 |
|
|
|
14 |
|
|
1999 |
|
2017 |
|
7-39 years |
|
17551 NW 27th Avenue, Miami Gardens, FL |
|
|
— |
|
|
|
803 |
|
|
|
2,181 |
|
|
|
— |
|
|
|
— |
|
|
|
|
|
803 |
|
|
|
2,181 |
|
|
|
2,984 |
|
|
|
20 |
|
|
2009 |
|
2017 |
|
7-39 years |
|
580 Blanding Boulevard, Orange Park, FL |
|
|
— |
|
|
|
365 |
|
|
|
2,471 |
|
|
|
— |
|
|
|
— |
|
|
|
|
|
365 |
|
|
|
2,471 |
|
|
|
2,836 |
|
|
|
27 |
|
|
2006 |
|
2017 |
|
7-39 years |
142
|
|
|
|
|
|
|
Initial Costs to Company(A) |
|
|
Costs Capitalized Subsequent to Acquisition |
|
Gross Amount at Which Carried at Close of Period |
|
|
|
|
|
|
|
|
|
|
Life on Which |
||||||||||||||||||||||
|
Description |
|
Encumbrance |
|
|
Land |
|
|
Buildings and Improvements |
|
|
Land |
|
|
Improvements |
|
|
Carrying Costs |
|
Land |
|
|
Buildings and Improvements |
|
|
Total(B) |
|
|
Accumulated Depreciation |
|
|
Date of Construction |
|
Date Acquired |
|
Depreciation is Computed |
|||||||||
|
6155 US-90, Milton, FL |
|
|
— |
|
|
|
505 |
|
|
|
1,994 |
|
|
|
— |
|
|
|
— |
|
|
|
|
|
505 |
|
|
|
1,994 |
|
|
|
2,499 |
|
|
|
19 |
|
|
2005 |
|
2017 |
|
7-39 years |
|
700 N. Webb Road, Wichita, KS |
|
|
— |
|
|
|
488 |
|
|
|
2,135 |
|
|
|
— |
|
|
|
— |
|
|
|
|
|
488 |
|
|
|
2,135 |
|
|
|
2,623 |
|
|
|
19 |
|
|
2008 |
|
2017 |
|
7-39 years |
|
10220 E. 61st Street, Tulsa, OK |
|
|
— |
|
|
|
113 |
|
|
|
1,890 |
|
|
|
— |
|
|
|
— |
|
|
|
|
|
113 |
|
|
|
1,890 |
|
|
|
2,003 |
|
|
|
18 |
|
|
2008 |
|
2017 |
|
7-39 years |
|
220 S. Hall Road, Alcoa, TN |
|
|
— |
|
|
|
751 |
|
|
|
1,829 |
|
|
|
— |
|
|
|
— |
|
|
|
|
|
751 |
|
|
|
1,829 |
|
|
|
2,580 |
|
|
|
19 |
|
|
1993 |
|
2017 |
|
7-39 years |
|
21428 State Route 22, Hoosick Falls, NY |
|
|
— |
|
|
|
78 |
|
|
|
1,612 |
|
|
|
— |
|
|
|
— |
|
|
|
|
|
78 |
|
|
|
1,612 |
|
|
|
1,690 |
|
|
|
7 |
|
|
2012 |
|
2017 |
|
15-39 years |
|
6367 Route 9N, Hadley, NY |
|
|
— |
|
|
|
100 |
|
|
|
1,586 |
|
|
|
— |
|
|
|
— |
|
|
|
|
|
100 |
|
|
|
1,586 |
|
|
|
1,686 |
|
|
|
7 |
|
|
2014 |
|
2017 |
|
15-39 years |
|
29 Main Street, Cairo, NY |
|
|
— |
|
|
|
106 |
|
|
|
1,609 |
|
|
|
— |
|
|
|
— |
|
|
|
|
|
106 |
|
|
|
1,609 |
|
|
|
1,715 |
|
|
|
6 |
|
|
2014 |
|
2017 |
|
15-39 years |
|
9501 US Route 20, Bridgewater, NY |
|
|
— |
|
|
|
241 |
|
|
|
1,482 |
|
|
|
— |
|
|
|
— |
|
|
|
|
|
241 |
|
|
|
1,482 |
|
|
|
1,723 |
|
|
|
7 |
|
|
2014 |
|
2017 |
|
15-39 years |
|
3067 US Route 9, Valatie, NY |
|
|
— |
|
|
|
102 |
|
|
|
1,720 |
|
|
|
— |
|
|
|
— |
|
|
|
|
|
102 |
|
|
|
1,720 |
|
|
|
1,822 |
|
|
|
7 |
|
|
2014 |
|
2017 |
|
15-39 years |
|
3282 Route 209, Wurtsboro, NY |
|
|
— |
|
|
|
83 |
|
|
|
1,640 |
|
|
|
— |
|
|
|
— |
|
|
|
|
|
83 |
|
|
|
1,640 |
|
|
|
1,723 |
|
|
|
7 |
|
|
2014 |
|
2017 |
|
15-39 years |
|
5602 Route 11, Ellenburg Center, NY |
|
|
— |
|
|
|
133 |
|
|
|
1,595 |
|
|
|
— |
|
|
|
— |
|
|
|
|
|
133 |
|
|
|
1,595 |
|
|
|
1,728 |
|
|
|
7 |
|
|
2014 |
|
2017 |
|
15-39 years |
|
3838 Walworth-Marion Road, Marion, NY |
|
|
— |
|
|
|
149 |
|
|
|
1,457 |
|
|
|
— |
|
|
|
— |
|
|
|
|
|
149 |
|
|
|
1,457 |
|
|
|
1,606 |
|
|
|
6 |
|
|
2013 |
|
2017 |
|
15-39 years |
|
7754 St. Rt. 104, Oswego, NY |
|
|
— |
|
|
|
124 |
|
|
|
1,636 |
|
|
|
— |
|
|
|
— |
|
|
|
|
|
124 |
|
|
|
1,636 |
|
|
|
1,760 |
|
|
|
7 |
|
|
2015 |
|
2017 |
|
15-39 years |
|
1027 William Howard Taft Road, Cincinnati, OH |
|
|
— |
|
|
|
367 |
|
|
|
1,168 |
|
|
|
— |
|
|
|
— |
|
|
|
|
|
367 |
|
|
|
1,168 |
|
|
|
1,535 |
|
|
|
4 |
|
|
2014 |
|
2017 |
|
15-39 years |
|
5245 N. Dixie Drive, Dayton, OH |
|
|
— |
|
|
|
249 |
|
|
|
1,240 |
|
|
|
— |
|
|
|
— |
|
|
|
|
|
249 |
|
|
|
1,240 |
|
|
|
1,489 |
|
|
|
5 |
|
|
2013 |
|
2017 |
|
15-39 years |
143
|
|
|
|
|
|
|
Initial Costs to Company(A) |
|
|
Costs Capitalized Subsequent to Acquisition |
|
|
Gross Amount at Which Carried at Close of Period |
|
|
|
|
|
|
|
|
|
|
Life on Which |
|||||||||||||||||||||||
|
Description |
|
Encumbrance |
|
|
Land |
|
|
Buildings and Improvements |
|
|
Land |
|
|
Improvements |
|
|
Carrying Costs |
|
|
Land |
|
|
Buildings and Improvements |
|
|
Total(B) |
|
|
Accumulated Depreciation |
|
|
Date of Construction |
|
Date Acquired |
|
Depreciation is Computed |
||||||||||
|
324 W. Dayton Street, West Alexandria, OH |
|
|
— |
|
|
|
371 |
|
|
|
1,108 |
|
|
|
— |
|
|
|
— |
|
|
|
|
|
|
|
371 |
|
|
|
1,108 |
|
|
|
1,479 |
|
|
|
4 |
|
|
2011 |
|
2017 |
|
15-39 years |
|
670 North Main Street, Sheffield, MA |
|
|
— |
|
|
|
109 |
|
|
|
1,687 |
|
|
|
— |
|
|
|
— |
|
|
|
|
|
|
|
109 |
|
|
|
1,687 |
|
|
|
1,796 |
|
|
|
6 |
|
|
2015 |
|
2017 |
|
15-39 years |
|
104 S. Clark Road, Cedar Hill, TX |
|
|
— |
|
|
|
501 |
|
|
|
1,842 |
|
|
|
— |
|
|
|
— |
|
|
|
|
|
|
|
501 |
|
|
|
1,842 |
|
|
|
2,343 |
|
|
|
7 |
|
|
2015 |
|
2017 |
|
15-39 years |
|
1880 Pulaski Highway, Bear, DE |
|
|
— |
|
|
|
398 |
|
|
|
2,164 |
|
|
|
— |
|
|
|
— |
|
|
|
|
|
|
|
398 |
|
|
|
2,164 |
|
|
|
2,562 |
|
|
|
8 |
|
|
2017 |
|
2017 |
|
15-39 years |
|
6120 E Independence Boulevard, Charlotte, NC |
|
|
— |
|
|
|
1,148 |
|
|
|
1,789 |
|
|
|
— |
|
|
|
— |
|
|
|
|
|
|
|
1,148 |
|
|
|
1,789 |
|
|
|
2,937 |
|
|
|
7 |
|
|
2013 |
|
2017 |
|
15-39 years |
|
490 S. Illinois Avenue, Oak Ridge, TN |
|
|
— |
|
|
|
1,167 |
|
|
|
1,684 |
|
|
|
— |
|
|
|
— |
|
|
|
|
|
|
|
1,167 |
|
|
|
1,684 |
|
|
|
2,851 |
|
|
|
7 |
|
|
2013 |
|
2017 |
|
15-39 years |
|
2468 Alcoa Highway, Alcoa, TN |
|
|
— |
|
|
|
1,022 |
|
|
|
1,760 |
|
|
|
— |
|
|
|
— |
|
|
|
|
|
|
|
1,022 |
|
|
|
1,760 |
|
|
|
2,782 |
|
|
|
7 |
|
|
2015 |
|
2017 |
|
15-39 years |
|
1300 DuPont Parkway, Smyrna, DE |
|
|
— |
|
|
|
1,366 |
|
|
|
2,708 |
|
|
|
— |
|
|
|
— |
|
|
|
|
|
|
|
1,366 |
|
|
|
2,708 |
|
|
|
4,074 |
|
|
|
13 |
|
|
2016 |
|
2017 |
|
15-39 years |
|
5881 Bayshore Road, North Fort Myers, FL |
|
|
— |
|
|
|
1,002 |
|
|
|
3,361 |
|
|
|
— |
|
|
|
— |
|
|
|
|
|
|
|
1,002 |
|
|
|
3,361 |
|
|
|
4,363 |
|
|
|
13 |
|
|
2015 |
|
2017 |
|
15-39 years |
|
Acquisition costs in progress (C) |
|
|
— |
|
|
|
— |
|
|
|
44 |
|
|
|
— |
|
|
|
— |
|
|
|
— |
|
|
|
— |
|
|
|
44 |
|
|
|
44 |
|
|
|
— |
|
|
|
|
|
|
|
|
Total (D) |
|
$ |
68,470 |
|
|
$ |
348,238 |
|
|
$ |
1,951,469 |
|
|
$ |
702 |
|
|
$ |
34,115 |
|
|
$ |
— |
|
|
$ |
348,940 |
|
|
$ |
1,985,584 |
|
|
$ |
2,334,524 |
|
|
$ |
148,383 |
|
|
|
|
|
|
|
Notes:
|
|
(A) |
The initial cost to the Company represents the original purchase price of the property (see Note 4). |
|
|
(B) |
The aggregate cost of real estate owned as of December 31, 2017 for U.S. federal income tax purposes was approximately $2,500,000. |
|
|
(C) |
Acquisition costs in progress represents costs incurred during the year ended December 31, 2017 related to asset acquisitions expected to close during the year ended December 31, 2018. |
|
|
(D) |
This schedule excludes properties subject to leases that are classified as direct financing leases. |
144
Change in Total Real Estate Assets
|
|
|
For the Years Ended December 31, |
|
|||||||||
|
|
|
2017 |
|
|
2016 |
|
|
2015 |
|
|||
|
Balance, beginning of period |
|
$ |
1,743,403 |
|
|
$ |
1,306,515 |
|
|
$ |
833,238 |
|
|
Acquisitions and building improvements |
|
|
640,961 |
|
|
|
469,460 |
|
|
|
490,165 |
|
|
Dispositions |
|
|
(47,181 |
) |
|
|
(32,572 |
) |
|
|
(16,888 |
) |
|
Impairment |
|
|
(2,659 |
) |
|
|
— |
|
|
|
— |
|
|
Balance, end of period |
|
$ |
2,334,524 |
|
|
$ |
1,743,403 |
|
|
$ |
1,306,515 |
|
Change in Accumulated Depreciation
|
|
|
For the Years Ended December 31, |
|
|||||||||
|
|
|
2017 |
|
|
2016 |
|
|
2015 |
|
|||
|
Balance, beginning of period |
|
$ |
105,703 |
|
|
$ |
70,171 |
|
|
$ |
46,831 |
|
|
Depreciation expense |
|
|
49,832 |
|
|
|
37,976 |
|
|
|
23,820 |
|
|
Dispositions |
|
|
(6,942 |
) |
|
|
(2,444 |
) |
|
|
(480 |
) |
|
Impairment |
|
|
(210 |
) |
|
|
— |
|
|
|
— |
|
|
Balance, end of period |
|
$ |
148,383 |
|
|
$ |
105,703 |
|
|
$ |
70,171 |
|
145
None.
Evaluation of Disclosure Controls and Procedures
We maintain disclosure controls and procedures (as defined in Rules 13a-15(e) and 15d-15(e) of the Exchange Act), that are designed to ensure that information required to be disclosed in our Exchange Act reports is recorded, processed, summarized, and reported within the time periods specified in the SEC’s rules and forms, and that such information is accumulated and communicated to our management, including our Chief Executive Officer and Chief Financial Officer, as appropriate, to allow timely decisions regarding required disclosure. As of and for the year ended December 31, 2017, we carried out an evaluation of the effectiveness of the design and operation of our disclosure controls and procedures, under the supervision and with the participation of management, including our Chief Executive Officer and Chief Financial Officer. Based on the foregoing, our Chief Executive Officer and Chief Financial Officer concluded that our disclosure controls and procedures were effective and were operating at a reasonable assurance level.
Management's Report on Internal Control Over Financial Reporting
This annual report on Form 10-K does not include a report of management’s assessment regarding internal control over financial reporting or an attestation report of the Company’s registered public accounting firm due to a transition period established by rules of the SEC for newly public companies.
Changes in Internal Control Over Financial Reporting
There were no changes to our internal control over financial reporting during the quarter December 31, 2017, that have materially affected, or are reasonably likely to materially affect, our internal control over financial reporting.
None.
146
The information required by this Item will be set forth under the captions Information About Director Nominees, Executive Officers of the Company and Section 16(a) Beneficial Ownership Reporting Compliance in our definitive proxy statement for our 2018 Annual Meeting of Stockholders (the “Proxy Statement”), which will be filed with the SEC within 120 days following the end of our fiscal year, and are incorporated herein by reference.
The information required by this Item will be set forth under the captions Executive Compensation, Director Compensation, and Compensation Committee Interlocks and Insider Participation in the Proxy Statement and are incorporated herein by reference.
The information required by this Item will be set forth under the caption Security Ownership of Certain Beneficial Owners and Management in the Proxy Statement and is incorporated herein by reference.
Except as otherwise set forth and disclosed below, the information required by this Item will be set forth under the captions Director Independence and Related Party Transactions and Certain Relationships and Related Transactions in the Proxy Statement and is incorporated herein by reference.
On December 21, 2017, we entered into each of a Second Amended and Restated Asset Management Agreement (the “Asset Management Agreement”) and a Third Amended Property Management Agreement (the “Property Management Agreement” and, together with the Asset Management Agreement, the “Restated Management Contracts”) by and among us, the Operating Company, and the Asset Manager and the Property Manager, respectively. The terms of the Restated Management Contracts, which became effective January 1, 2018, are summarized below.
Relationship with the Asset Manager
Asset Management Agreement
The Asset Manager is a wholly owned subsidiary of the Manager. Pursuant to the subscription agreement executed by each of our stockholders, our stockholders have granted an irrevocable proxy to our Chief Financial Officer or Assistant Secretary to elect two individuals nominated by the Asset Manager for election to our board of directors.
Pursuant to the Asset Management Agreement, the Asset Manager manages our day-to-day operations and is responsible for, among other things, our acquisition, disposition and financing activities and providing support to our Independent Directors in connection with their valuation functions and other duties.
The Asset Management Agreement details the rights, powers and obligations of the Asset Manager and the services to be provided to us by the Asset Manager in managing our day-to-day activities. Pursuant to the Asset Management Agreement, the Asset Manager devotes sufficient resources to the performance of its duties. Services provided by the Asset Manager under the terms of the Asset Management Agreement include the following:
|
|
• |
supervising and managing the day-to-day operations of our company and the Operating Company; |
|
|
• |
assisting our board of directors in developing and monitoring our property acquisition and disposition strategies; |
|
|
• |
acquiring and disposing of properties, without prior approval of our board of directors, provided that such acquisitions or dispositions meet the criteria established by the Asset Management Agreement; |
147
|
|
• |
performing due diligence functions for all property acquisitions and dispositions and selecting and supervising all third parties necessary to assess the physical condition and other characteristics of properties, subject to any required review by our board of directors of such acquisitions; |
|
|
• |
coordinating the initial leasing of real properties at the time of acquisition to the extent acquired properties are not then subject to a lease, securing executed leases from qualified tenants and hiring all leasing agents; |
|
|
• |
arranging for financing and refinancing of properties and making any other changes in asset or capital structure of any of our properties; supervising and managing the day-to-day operations of our company and the Operating Company; |
|
|
• |
monitoring compliance with any loan covenants, including any required reports to lenders, under financing documents; |
|
|
• |
overseeing the Company’s compliance with its SEC reporting obligations; |
|
|
• |
maintaining such data and other information concerning the activities of the Company as shall be needed to timely prepare and file all periodic reports and other information required to be filed with the SEC and any other regulatory agency pursuant to applicable law; |
|
|
• |
the reinvestment or distribution of the proceeds from the sale of any property; |
|
|
• |
the maintenance of our books and records and preparing, or causing to be prepared, statements and other relevant information for distribution to our stockholders; |
|
|
• |
monitoring our operations and expenses, including the preparation and analysis of our operating budgets, capital budgets and leasing plans; |
|
|
• |
preparing or having prepared by third parties such property and portfolio appraisals and market equity valuations as the Asset Manager in its sole discretion deemed necessary or desirable to assist the Independent Directors Committee in establishing the Determined Share Value on a quarterly basis; |
|
|
• |
from time to time, or as requested by our board of directors, delivering reports regarding its performance of services pursuant to the Asset Management Agreement; |
|
|
• |
managing and coordinating distributions to our stockholders and the members of the Operating Company as declared by our board of directors; |
|
|
• |
at the request of our board of directors, facilitating investor communications and stockholder approvals, including our annual stockholders meeting; |
|
|
• |
conducting our securities offerings, including preparing and keeping current offering materials, soliciting potential investors, accepting subscriptions, and conducting closings; |
|
|
• |
selecting and engaging on our behalf such third parties as the Asset Manager deemed necessary to the proper performance of its obligations under the Asset Management Agreement; |
|
|
• |
nominating two individuals for election to our board of directors; |
|
|
• |
performing any other powers which may be assigned or delegated to the Asset Manager by our board of directors from time to time; and |
|
|
• |
taking all such other actions and doing all things necessary or desirable to carry out the foregoing services. |
148
Pursuant to our Investment Policy, the Asset Manager may make any acquisition or sale of any property or group of related properties involving up to $50.0 million for any single property or portfolio transaction, $75.0 million per cumulative tenant concentration, or $100.0 million per cumulative brand concentration, without approval of the Independent Directors Committee, provided that any such properties acquired otherwise met our Investment Policy and Property Selection Criteria, and any financing related to such acquisitions do not violate our Leverage Policy, as such are established by the Independent Directors Committee from time to time. Any property acquisitions or dispositions which do not satisfy the foregoing criteria require the prior approval of the Independent Directors Committee.
Fees Paid to our Asset Manager
Pursuant to the Asset Management Agreement, we pay the Asset Manager the fees described below.
|
|
• |
An asset management fee, payable quarterly in advance, equal to 0.25% of the aggregate Determined Share Value as of the last day of the preceding calendar quarter, on a fully diluted basis as if all membership units in the Operating Company had been converted into shares of Common Stock on the last day of the immediately preceding calendar quarter. For the period from December 31, 2007 through December 31, 2017, the asset management fee payment for any quarter will be deferred, in whole or in part, if at any time during a rolling 12-month period cumulative distributions to our stockholders are below $3.50 per share. Any deferred asset management fees could be deferred indefinitely, will accrue interest at the rate of 7% per annum until paid and will be paid only from “available cash” (as defined below) after our cumulative distributions from inception equal to $3.50 per share annually have been paid. “Available cash” includes working capital and cash flow from operations plus proceeds from debt and equity financings and property sales, provided that such payments or transactions would not result in us exceeding our Leverage Policy as established by the Independent Directors Committee. No asset management fees have been deferred to date. During the years ended December 31, 2017 and 2016, we paid our Asset Manager asset management fees of approximately $14.8 million and $11.0 million, respectively. |
|
|
• |
An acquisition fee equal to 1% of the gross purchase price paid for each property we acquired (including properties contributed in exchange for membership units in the Operating Company); provided, however, that in the event that our acquisition of a property requires a new lease (as opposed to taking an assignment of an existing lease), such as in the case of a sale-leaseback transaction, the Asset Manager is entitled to an acquisition fee equal to 2% of the purchase price as a result of the additional leasing services required. During the years ended December 31, 2017 and 2016, we paid our Asset Manager aggregate acquisition fees of approximately $9.9 million and $8.1 million, respectively, which was comprised of base acquisition fees of approximately $6.6 million and $5.2 million, respectively, and approximately $3.3 million and $2.9 million, respectively, in additional fees for sale-leasebacks and the additional leasing services provided in those transactions. |
|
|
• |
In exchange for disposition services provided in connection with the disposition of any individual property or properties, a property sale disposition fee equal to 1.0% of the gross sales price received by the Operating Company for any such disposed of property. |
|
|
• |
A disposition event fee equal to 1.0% of the Aggregate Consideration (as defined below) received in connection with the (i) acquisition by any person of direct or indirect beneficial ownership of all or substantially all of our outstanding common stock or outstanding ownership interests in the Operating Company; (ii) any merger, consolidation or other similar transaction in which the Company is merged with or into, or otherwise acquired by, another entity; or (iii) the direct or indirect sale of all or substantially all of the assets of the Company or the Operating Company (a “Disposition Event”). A disposition event fee will not, however, be paid in connection with a listing of the Company’s common stock or other equity securities of the Company on a securities market or exchange, and the Asset Manager will not be entitled to receive both property sale disposition fees and a disposition event fee in connection with a Disposition Event. The Asset Management Agreement defines “Aggregate Consideration” as, with respect to a Disposition Event, the aggregate consideration, including cash, assumed debt, and the value (as determined by the Independent Directors Committee) of any securities paid or issued to us or our stockholders in connection with such Disposition Event, net of (i) all fees and transaction expenses and (ii) the value of all cash held by us (and the Operating Company) as of the time of the Disposition Event. |
149
|
|
• |
In certain circumstances, upon the termination of the Asset Management Agreement, we will pay the Asset Manager a termination fee (as discussed below). |
The Asset Management Agreement is effective as of January 1, 2018 and will continue in effect until December 31, 2018, unless earlier terminated pursuant to its terms (as discussed below). On January 1, 2019, the Asset Management Agreement will automatically renew for successive additional three-year terms, subject to earlier termination (as discussed below).
Termination
The Asset Management Agreement provides that it may be terminated (i) immediately by the Independent Directors Committee for Cause (as defined below), (ii) by the Independent Directors Committee, upon 30 days written notice to the Asset Manager, in connection with a change in control of the Property Manager, (iii) by the Independent Directors Committee, by providing the Asset Manager with written notice of termination not less than one year prior to the last calendar day of any renewal term of the Asset Management Agreement (i.e., December 31st of the third fiscal year of any renewal term), and (iv) by Asset Manager upon written notice to the Company not less than one year prior to the last calendar day of any renewal term of the Asset Management Agreement. In addition, the Asset Management Agreement provides that it will automatically terminate in the event of a Disposition Event. The Asset Management Agreement defines “Cause” to include: (i) fraud, gross negligence or breach of fiduciary duty by the Asset Manager or its affiliates, (ii) willful misconduct by the Asset Manager or its affiliates which could reasonably be expected to materially adversely affect our good name, reputation or business, (iii) any material violation of the Asset Management Agreement by the Asset Manager that, after written notice thereof, is not cured within 30 days, (iv) the Asset Manager’s bankruptcy or insolvency, or (v) any affiliate of the Asset Manager being convicted of or pleading “guilty” or “no contest” to a felony in connection with the performance of the Asset Manager’s duties which could reasonably be expected to materially adversely affect our good name, reputation or business.
Key Person Event
The Asset Management Agreement provides that, upon a Key Person Event (as defined below), the Asset Manager will have a period of 60 days to present to the Independent Directors Committee two individuals to serve as Chairman and Chief Executive Officer (or comparable executive positions with substantially the same responsibilities) of the Property Manager (such individuals, “Replacement Nominees”). Upon receipt of the Replacement Nominees, the Independent Directors Committee will have a period of up to six months (the “Review Period”) to consider the Replacement Nominees and to reasonably request additional information regarding the Replacement Nominees. If, prior to the expiration of the Review Period, (i) the Independent Directors Committee elects not to approve the Replacement Nominees and (ii) the Asset Manager and the Independent Directors Committee have been unable, despite mutual good faith efforts, to agree upon suitable alternative individuals to appoint as the Chairman and Chief Executive Officer of the Property Manager, the Independent Directors Committee will have the right to terminate the Asset Management Agreement upon written notice to the Asset Manager on or prior to the last day of the Review Period, with such termination effective 12 months from the date of such notice.
150
The Asset Management Agreement defines a “Key Person Event” as any event or circumstance which results in both of Amy L. Tait, our Executive Chairman of the Board and Chief Investment Officer, and Christopher J. Czarnecki, our Chief Executive Officer and a member of our board of directors (or their respective successors and replacements, as approved by the Independent Directors Committee) no longer continuing to serve as the Chairman and Chief Executive Officer (or comparable executive positions), respectively, of the Property Manager for a continuous period of 60 days.
Termination Fees
The Asset Management Agreement provides that if the Asset Management Agreement is terminated (i) by the Independent Directors Committee in connection with a change of control of the Manager, or (ii) by the Independent Directors Committee by providing notice at least one year prior to the last calendar day of any renewal term, the Operating Company will pay the Asset Manager a fee equal to three times the asset management fee (as discussed above) to which the Asset Manager was entitled during the 12-month period immediately preceding the effective date of such termination (the “Termination Fee”).
The Termination Fee is also payable to the Asset Manager in the event that the Asset Management Agreement is terminated (i) by the Independent Directors Committee in connection with a Key Person Event (as discussed above) or (ii) automatically upon a Disposition Event.
All of our officers, including Ms. Tait and Mr. Czarnecki, are officers and employees of the Manager. The Manager manages our properties pursuant to the Property Management Agreement and is also the sole member of the Asset Manager. The Manager is managed by a four-person board of managers, two of which are appointed by Trident BRE and two of which are appointed by the management of the Manager. Ms. Tait and Mr. Czarnecki are each a member of the Manager’s board of managers. As the holder of the Convertible Preferred BRE Units, we are entitled to appoint an observer to attend meetings of the board of managers of the Manager. The currently appointed observer is Mr. James H. Watters, one of our Independent Directors.
Property Management Agreement
Services provided by the Manager under the terms of the Property Management Agreement include the following:
|
|
• |
performing all duties of the landlord relating to property operation, maintenance, and day-to-day management under all property leases, including monitoring our tenants’ compliance with the terms of their leases, ensuring property taxes are timely paid, and arranging for, or requiring our tenants to maintain, comprehensive insurance coverage on our properties; |
|
|
• |
performing any maintenance services required pursuant to a property’s lease or required pursuant to any agreement related to the financing of a property; |
|
|
• |
selecting or replacing vendors that provide goods or services to our properties, provided such selection or replacement is reasonably required within the ordinary course of the management, operation, maintenance and leasing of a property and the cost of such vendor is justified based upon market rates; |
|
|
• |
promptly forwarding to us upon receipt all notices of violation or other notices from any governmental authority or insurance company, and making such recommendations regarding compliance with such notices as is appropriate; |
|
|
• |
selecting and hiring employees and independent contractors to maintain, operate and lease our properties; |
|
|
• |
entering into and renewing contracts for electricity, gas, steam, landscaping, fuel, oil, maintenance and other services as are customarily furnished or rendered in connection with the operation of similar rental properties and pursuant to the terms of each property’s lease; |
151
|
|
• |
collecting all rent and other monies due from tenants and any sums otherwise due to us with respect to our properties in the ordinary course of business; |
|
|
• |
establishing and maintaining in accordance with the Property Management Agreement a separate checking account for funds relating to our properties; and |
|
|
• |
placing and removing, or causing to be placed and removed, such signs upon our properties as the Manager deems appropriate, subject, to the terms and conditions of the leases at our properties and to applicable law. |
Pursuant to the Property Management Agreement, we pay the Manager the fees described below.
|
|
• |
A monthly property management fee equal to 3% of the gross rentals collected each month from our properties (including all base rent, additional rent, and all other charges, fees and commissions paid for use pursuant to our properties’ leases). During the years ended December 31, 2017 and 2016, we paid our Manager property management fees of approximately $5.0 million and $3.9 million, respectively. |
|
|
• |
In connection with execution of new leases after the initial acquisition of a property, a re-leasing fee equal to one month’s rent if the lease is with an existing tenant, or two month’s rent if the tenant is new to the property (whether or not the Manager engaged a broker to lease the property on behalf of the Operating Company). During the years ended December 31, 2017 and 2016, we did not pay our Manager any re-leasing fees. |
|
|
• |
In certain circumstances, upon the termination of the Property Management Agreement, we will pay the Manager a termination fee (as discussed below). |
Term
The Property Management Agreement is effective as of January 1, 2018 and will continue in effect until December 31, 2018, unless earlier terminated pursuant to its terms (as discussed below). On January 1, 2019, the Property Management Agreement will automatically renew for successive additional three-year terms, subject to earlier termination (as discussed below).
Termination
The Property Management Agreement includes the concept of a Termination Event, which concept mirrors the Disposition Event concept in the Asset Management Agreement (as discussed above).
The Property Management Agreement may be terminated (i) immediately by the Independent Directors Committee for Cause (defined in the same manner as Cause is defined in the Asset Management Agreement), (ii) by the Independent Directors Committee, upon 30 days written notice to the Property Manager, in connection with a change in control of the Property Manager, (iii) by the Independent Directors Committee, by providing the Property Manager with written notice of termination not less than one year prior to the last calendar day of any renewal term of the Property Management Agreement, and (iv) by the Property Manager upon written notice to the Company not less than one year prior to the last calendar day of any renewal term of the Property Management Agreement. In addition, the Property Management Agreement provides that it will automatically terminate in the event of a Termination Event, which is defined in the same manner as a Disposition Event is defined in the Asset Management Agreement.
152
The Property Management Agreement includes the same Key Person Event concept and related termination rights of the Independent Directors Committee as are included in Asset Management Agreement (as discussed above).
The information required by this Item will be set forth under the caption Proposal No. 2 : Ratification of the Appointment of Independent Registered Public Accounting Firm in the Proxy Statement and is incorporated herein by reference.
153
Financial Statements
See Item 8. “Financial Statements and Supplementary Data” of this Form 10-K.
Financial Statement Schedules
See Item 8. “Financial Statements and Supplementary Data” of this Form 10-K. All other schedules are omitted because they are not applicable or because the required information is shown in the financial statements or the notes thereto.
None.
154
|
Exhibit No. |
|
Description |
|
|
|
|
|
3.1 |
|
|
|
|
|
|
|
3.2 |
|
|
|
|
|
|
|
4.1 |
|
|
|
|
|
|
|
4.2 |
|
|
|
|
|
|
|
4.3 |
|
|
|
|
|
|
|
10.1 |
|
|
|
|
|
|
|
10.2 |
|
|
|
|
|
|
|
10.3 |
|
|
|
|
|
|
|
10.4 |
|
|
|
|
|
|
|
10.5 |
|
|
|
|
|
|
|
10.6 |
|
|
|
|
|
|
|
10.7 |
|
|
|
|
|
|
|
10.8 |
|
|
|
|
|
|
155
|
Exhibit No. |
|
Description |
|
|
||
|
|
|
|
|
10.10 |
|
|
|
|
|
|
|
10.11 |
|
|
|
|
|
|
|
10.12 |
|
|
|
|
|
|
|
10.13 |
|
|
|
|
|
|
|
10.14 |
|
|
|
|
|
|
|
10.15 |
|
|
|
|
|
|
|
10.16 |
|
|
|
|
|
|
|
10.17 |
|
|
|
|
|
|
|
10.18 |
|
|
|
|
|
|
|
10.19 |
|
|
|
|
|
|
|
10.20 |
|
|
|
|
|
|
156
|
Exhibit No. |
|
Description |
|
|
||
|
|
|
|
|
10.22 |
|
|
|
|
|
|
|
10.23 |
|
|
|
|
|
|
|
10.24 |
|
|
|
|
|
|
|
10.25 |
|
|
|
|
|
|
|
10.26 |
|
|
|
|
|
|
|
10.27 |
|
|
|
|
|
|
|
10.28 |
|
|
|
|
|
|
|
10.29 |
|
|
|
|
|
|
|
10.30 |
|
|
|
|
|
|
|
10.31 |
|
|
|
|
|
|
|
10.32 |
|
|
|
|
|
|
|
21.1* |
|
|
|
|
|
|
157
|
Exhibit No. |
|
Description |
|
|
||
|
|
|
|
|
31.2* |
|
|
|
|
|
|
|
32.1*† |
|
|
|
|
|
|
|
32.2*† |
|
|
|
|
|
|
|
101.1 |
|
The following materials from the Company’s annual report on Form 10-K for the year ended December 31, 2017, formatted in Extensible Business Reporting Language: (i) Consolidated Balance Sheets, (ii) Consolidated Statements of Income, (iii) Consolidated Statements of Stockholders’ Equity, (iv) Consolidated Statements of Cash Flows, (v) Notes to Consolidated Financial Statements, and (vi) Schedule III Real Estate and Accumulated Depreciation. |
________________________
|
|
|
|
* |
Filed herewith. |
|
† |
In accordance with Item 601(b)(32) of Regulation S-K, this Exhibit is not deemed “filed” for purposes of Section 18 of the Exchange Act or otherwise subject to the liabilities of that section. Such certifications will not be deemed incorporated by reference into any filing under the Securities Act or the Exchange Act, except to the extent that the Registrant specifically incorporates it by reference. |
158
Pursuant to the requirements of Section 13 or 15(d) the Securities Exchange Act of 1934, the registrant has duly caused this report to be signed on its behalf by the undersigned, thereunto duly authorized.
|
|
|
BROADSTONE NET LEASE, INC. |
|
|
|
|
|
Date: March 15, 2018 |
|
/s/ Christopher J. Czarnecki |
|
|
|
Christopher J. Czarnecki |
|
|
|
Chief Executive Officer |
Pursuant to the requirements of the Securities Exchange Act of 1934, this report has been signed by the following persons on behalf of the registrant and in the capacities and on the dates indicated.
|
Date: March 15, 2018 |
|
/s/ Amy L. Tait |
|
|
|
Amy L. Tait |
|
|
|
Executive Chairman of the Board of Directors and Chief Investment Officer |
|
|
|
|
|
Date: March 15, 2018 |
|
/s/ Christopher J. Czarnecki |
|
|
|
Christopher J. Czarnecki |
|
|
|
Director, Chief Executive Officer (Principal Executive Officer) |
|
|
|
|
|
Date: March 15, 2018 |
|
/s/ Geoffrey H. Rosenberger |
|
|
|
Geoffrey H. Rosenberger |
|
|
|
Director |
|
|
|
|
|
Date: March 15, 2018 |
|
/s/ Laurie A. Hawkes |
|
|
|
Laurie A. Hawkes |
|
|
|
Director |
|
|
|
|
|
Date: March 15, 2018 |
|
/s/ David M. Jacobstein |
|
|
|
David M. Jacobstein |
|
|
|
Director |
|
|
|
|
|
Date: March 15, 2018 |
|
/s/ Agha S. Khan |
|
|
|
Agha S. Khan |
|
|
|
Director |
|
|
|
|
|
Date: March 15, 2018 |
|
/s/Thomas P. Lydon, Jr. |
|
|
|
Thomas P. Lydon, Jr. |
|
|
|
Director |
|
|
|
|
|
Date: March 15, 2018 |
|
/s/ Shekar Narasimhan |
|
|
|
Shekar Narasimhan |
|
|
|
Director |
|
|
|
|
|
Date: March 15, 2018 |
|
/s/ James H. Watters |
|
|
|
James H. Watters |
|
|
|
Director |
|
|
|
|
|
Date: March 15, 2018 |
|
/s/ Ryan M. Albano |
|
|
|
Ryan M. Albano |
|
|
|
Executive Vice President and Chief Financial Officer (Principal Financial Officer) |
|
|
|
|
|
Date: March 15, 2018 |
|
/s/ Timothy D. Dieffenbacher |
|
|
|
Timothy D. Dieffenbacher |
|
|
|
Senior Vice President and Chief Accounting Officer (Principal Accounting Officer) |
159