Table of Contents
The registrant is submitting this draft registration statement confidentially as an “emerging growth company” pursuant to Section 6(e) of the Securities Act of 1933, as amended.
As confidentially submitted with the Securities and Exchange Commission on January 10, 2020
Registration Statement No. 333-
UNITED STATES
SECURITIES AND EXCHANGE COMMISSION
Washington, D.C. 20549
FORM S-11
FOR REGISTRATION UNDER THE SECURITIES ACT OF 1933
OF SECURITIES OF CERTAIN REAL ESTATE COMPANIES
Broadstone Net Lease, Inc.
(Exact name of registrant as specified in its governing instruments)
800 Clinton Square
Rochester, New York 14604
(585) 287-6500
(Address, including Zip Code and Telephone Number, Including Area Code, of Registrant’s Principal Executive Offices)
Christopher J. Czarnecki
Chief Executive Officer and President
800 Clinton Square
Rochester, New York 14604
(585) 287-6500
(Name, Address, including Zip Code and Telephone Number, Including Area Code, of Agent for Service)
Copies to:
| Stuart A. Barr Fried, Frank, Harris, Shriver & Jacobson LLP 801 17th Street, NW Washington, DC 20006 (202) 639-7000 |
Kathleen L. Werner Jason D. Myers Clifford Chance US LLP 31 West 52nd Street New York, New York 10019 (212) 878-8000 |
Approximate date of commencement of proposed sale to the public:
As soon as practicable after this Registration Statement becomes effective.
If any of the securities being registered on this Form are to be offered on a delayed or continuous basis pursuant to Rule 415 under the Securities Act of 1933, check the following box: ☐
If this Form is filed to register additional securities for an offering pursuant to Rule 462(b) under the Securities Act, check the following box and list the Securities Act registration statement number of the earlier effective registration statement for the same offering. ☐
If this Form is a post-effective amendment filed pursuant to Rule 462(c) under the Securities Act, check the following box and list the Securities Act registration statement number of the earlier effective registration statement for the same offering. ☐
If this Form is a post-effective amendment filed pursuant to Rule 462(d) under the Securities Act, check the following box and list the Securities Act registration statement number of the earlier effective registration statement for the same offering. ☐
If delivery of the prospectus is expected to be made pursuant to Rule 434, check the following box. ☐
Indicate by check mark whether the registrant is a large accelerated filer, an accelerated filer, a non-accelerated filer, a smaller reporting company, or an emerging growth company. See the definitions of “large accelerated filer,” “accelerated filer,” “smaller reporting company” and “emerging growth company” in Rule 12b-2 of the Exchange Act.
| Large accelerated filer | ☐ | Accelerated filer | ☐ | |||
| Non-accelerated filer | ☒ | Smaller reporting company | ☐ | |||
| Emerging growth company | ☒ | |||||
If an emerging growth company, indicate by check mark if the registrant has elected not to use the extended transition period for complying with any new or revised financial accounting standards provided pursuant to Section 7(a)(2)(B) of the Securities Act ☒
CALCULATION OF REGISTRATION FEE
|
| ||||
| Title of Securities to be Registered | Proposed Maximum |
Amount of Registration Fee (3) | ||
| Class A Common Stock, $0.001 par value per share |
$ | $ | ||
| Common Stock, $0.001 par value per share (4) |
$ | $ | ||
|
| ||||
|
| ||||
| (1) | Estimated solely for the purpose of determining the registration fee in accordance with Rule 457(o) of the Securities Act of 1933, as amended. |
| (2) | Includes the offering price of Class A Common Stock that may be purchased by the underwriters upon the exercise of their option to purchase additional shares. |
| (3) | Calculated in accordance with Rule 457(o) under the Securities Act of 1933, as amended. |
| (4) | In accordance with Rule 457(i) under the Securities Act, this registration statement also registers shares of Common Stock that are issuable upon automatic conversion of Class A Common Stock registered hereby 180 days after the completion of the offering. Under Rule 457(i), no additional filing fee is payable with respect to the shares of Common Stock issuable upon conversion of the Class A Common Stock because no additional consideration will be received in connection with the automatic conversion. |
The registrant hereby amends this registration statement on such date or dates as may be necessary to delay its effective date until the registrant shall file a further amendment that specifically states that this registration statement shall thereafter become effective in accordance with Section 8(a) of the Securities Act of 1933, as amended, or until this registration statement shall become effective on such date as the Commission, acting pursuant to said Section 8(a), may determine.
Table of Contents
The information in this preliminary prospectus is not complete and may be changed. We may not sell these securities until the registration statement filed with the Securities and Exchange Commission is effective. This preliminary prospectus is not an offer to sell these securities and it is not soliciting an offer to buy these securities in any jurisdiction where the offer or sale is not permitted.
Subject to Completion, dated January 10, 2020
Shares

Class A Common Stock
Broadstone Net Lease, Inc.
Broadstone Net Lease, Inc., a Maryland corporation, is a real estate investment trust (“REIT”) that acquires, owns, and manages primarily single-tenant, commercial real estate properties that are net leased on a long-term basis to a diversified group of tenants.
We are offering shares of our Class A Common Stock, $0.001 par value per share (the “Class A Common Stock”). All of the shares of Class A Common Stock offered by this prospectus are being sold by us. This is our initial public offering, and no public market currently exists for our Class A Common Stock. We expect the initial public offering price of our Class A Common Stock to be between $ and $ per share.
We intend to apply to have our Class A Common Stock listed on the New York Stock Exchange under the symbol “BNL.”
We elected to qualify to be taxed as a REIT under the Internal Revenue Code of 1986, as amended (the “Code”), beginning with our taxable year ended December 31, 2008, and we believe we have been organized and operated in a manner that allowed us to qualify to be taxed as a REIT commencing with such year. We intend to continue to operate as a REIT in the future. Shares of our capital stock (including our Class A Common Stock) are subject to limitations on ownership and transfer that are primarily intended to assist us in maintaining our qualification as a REIT. Subject to certain exceptions, our Charter restricts the direct or indirect ownership by one person or entity to no more than 9.8% of the value of our then outstanding shares of capital stock and no more than 9.8% of the value or number of shares, whichever is more restrictive, of our then outstanding Common Stock (including our Class A Common Stock). See “Description of Stock—Restrictions on Ownership and Transfer” for a detailed description of the ownership and transfer restrictions applicable to our Common Stock (including our Class A Common Stock).
We are an “emerging growth company” under the U.S. federal securities laws and, as such, have elected to comply with certain reduced disclosure requirements in this prospectus and in future filings that we make with the Securities and Exchange Commission (the “SEC”). See “Prospectus Summary—Emerging Growth Company Status.”
Investing in our Class A Common Stock involves risks. See “Risk Factors” beginning on page 26 for factors you should consider before investing in our Class A Common Stock.
Neither the SEC nor any state securities commission has approved or disapproved of these securities or determined if this prospectus is truthful or complete. Any representation to the contrary is a criminal offense.
| Per Share | Total | |||||||
| Initial public offering price |
$ | $ | ||||||
| Underwriting discounts (1) |
$ | $ | ||||||
| Proceeds, before expenses, to us |
$ | $ | ||||||
| (1) | We refer you to “Underwriting” beginning on page 214 of this prospectus for additional information regarding underwriting compensation. |
To the extent that the underwriters sell more than shares of our Class A Common Stock, the underwriters have the option, exercisable within 30 days from the date of this prospectus, to purchase up to an additional shares from us at the initial public offering price less the underwriting discounts and commissions. The underwriters expect to deliver the shares of Class A Common Stock to purchasers on or about , 2020.
Joint Book-Running Managers
| J.P. Morgan | Goldman Sachs & Co. LLC |
Prospectus dated , 2020.
Table of Contents
[PROSPECTUS ART – TO BE INCLUDED IN A SUBSEQUENT SUBMISSION / AMENDMENT]
Table of Contents
| Page | ||||
| 1 | ||||
| 26 | ||||
| 59 | ||||
| 60 | ||||
| 61 | ||||
| 63 | ||||
| 65 | ||||
| SELECTED CONSOLIDATED HISTORICAL AND PRO FORMA FINANCIAL AND OTHER DATA |
67 | |||
| MANAGEMENT’S DISCUSSION AND ANALYSIS OF FINANCIAL CONDITION AND RESULTS OF OPERATIONS |
70 | |||
| 97 | ||||
| 108 | ||||
| 133 | ||||
| 143 | ||||
| 154 | ||||
| RECAPITALIZATION, INTERNALIZATION, AND STRUCTURE OF OUR COMPANY |
158 | |||
| 162 | ||||
| 164 | ||||
| 168 | ||||
| 175 | ||||
| 176 | ||||
| CERTAIN PROVISIONS OF MARYLAND LAW AND OF OUR CHARTER AND SECOND AMENDED AND RESTATED BYLAWS |
181 | |||
| 188 | ||||
| 190 | ||||
| 212 | ||||
| 214 | ||||
| 221 | ||||
| 221 | ||||
| 221 | ||||
We have not, and the underwriters have not, authorized anyone to provide you with information other than what is contained in this prospectus or in any free writing prospectus prepared by us. We are not, and the underwriters are not, making an offer to sell these securities in any jurisdiction where the offer or sale is not permitted. You should assume that the information appearing in this prospectus and any free writing prospectus prepared by us is accurate only as of their respective dates or on the date or dates which are specified in these documents. Our business, financial condition, liquidity, results of operations, and prospects may have changed since those dates.
We use market data and industry forecasts and projections throughout this prospectus and, in particular, in the sections entitled “Prospectus Summary,” “Market Opportunity,” and “Business and Properties.” We have obtained substantially all of this information from a market study prepared for us in connection with this offering by Rosen Consulting Group (“RCG”), a nationally recognized real estate consulting firm. Such information is included in this prospectus in reliance on RCG’s authority as an expert on such matters. Any forecasts prepared by RCG are based on data (including third party data), models, and experience of various professionals and are based on various assumptions, all of which are subject to change without notice. See “Experts.” In addition, we have obtained certain market and industry data from publicly available industry publications. These sources
i
Table of Contents
generally state that the information they provide has been obtained from sources believed to be reliable but that the accuracy and completeness of the information are not guaranteed. The forecasts and projections are based on industry surveys and the preparers’ experience in the industry, and there is no assurance that any of the projected amounts will be achieved. We have not independently verified this information.
Immediately prior to the closing of this offering, we will effect a recapitalization of our common stock, $0.001 par value per share (“Common Stock”), pursuant to which (i) we will establish a new class of Common Stock as “Class A Common Stock” for sale in this offering and (ii) we will effect a four-for-one stock split of our Common Stock that is outstanding immediately prior to the closing of this offering (the “REIT Recapitalization”). The Class A Common Stock sold in this offering will be listed on the NYSE as of the closing of this offering and will be freely tradeable. Each share of our Class A Common Stock will automatically convert into one share of our Common Stock 180 days after the completion of this offering (the “Class A Conversion”). Immediately following the Class A Conversion, all outstanding shares of our Common Stock, including those shares of Common Stock issued upon conversion of the Class A Common Stock, will be listed on the NYSE and will be freely tradeable. In connection with the REIT Recapitalization, Broadstone Net Lease, LLC, a New York limited liability company and our operating company (the “OP”), will effect a recapitalization of its membership units (“OP Units”), pursuant to which it will effect a four-for-one split of its outstanding OP Units (collectively, with the REIT Recapitalization, the “Recapitalization”). Unless the context requires otherwise, all information set forth herein assumes the completion of the Recapitalization. For further information on the Recapitalization, refer to the section entitled “Recapitalization, Internalization, and Structure of our Company—Recapitalization.”
Unless otherwise indicated, the information contained in this prospectus assumes (1) that the underwriters’ option to purchase additional shares is not exercised and (2) that the Class A Common Stock to be sold in this offering is sold at $ per share, which is the mid-point of the price range set forth on the front cover of this prospectus.
Certain Terms Used in This Prospectus
Unless the context otherwise requires, the following terms and phrases are used throughout this prospectus as described below:
| • | “2020 Equity Incentive Plan” means our 2020 Equity Incentive Plan that we expect to enter into concurrent with the closing of this offering; |
| • | “2020 Unsecured Term Loan” means our $300 million unsecured term loan by and among the Company, the OP, JPMorgan Chase Bank, N.A., and the other lenders party thereto, dated August 2, 2019; |
| • | “annualized base rent” or “ABR” means the cash rent due for the last month of the reporting period, adjusted to remove rent from properties sold during the month and to include a full month of contractual cash rent for properties acquired during the month, and annualized; |
| • | “BRE” means Broadstone Real Estate, LLC; |
| • | “Cash Cap Rate” represents the estimated rate of return to be generated on a real estate investment property, and was calculated at the time of investment based on the contractually specified cash base rent for the first full year after the date of the investment, divided by the purchase price for the property; |
| • | “CPI” means the Consumer Price Index for All Urban Consumers (CPI-U): U.S. City Average, All Items, as published by the U.S. Bureau of Labor Statistics, or other similar index which is a measure of the average change over time in the prices paid by urban consumers for a market basket of consumer goods and services; |
| • | “Founding Owners” means Amy Tait and certain affiliated members of her family; |
| • | “GAAP” means accounting principles generally accepted in the United States of America; |
| • | “gross asset value” means the undepreciated book value of an asset, which represents the fair value of the asset as of the date it was acquired, less any subsequent writedowns due to impairment charges; |
ii
Table of Contents
| • | “Industrial Portfolio Acquisition” refers to our acquisition of a portfolio of 23 industrial and office/flex assets on August 29, 2019; |
| • | “Internalization” means the proposed internalization of the external management team and functions currently performed for the Company by BRE, which is expected to close in the first quarter of 2020; |
| • | “MGCL” means the Maryland General Corporation Law; |
| • | “NYSE” means the New York Stock Exchange; |
| • | “occupancy” or a specified percentage of our portfolio that is “occupied” means the quotient of (1) the total square footage of our properties minus the square footage of our properties that are vacant and from which we are not receiving any rental payment, and (2) the total square footage of our properties as of a specified date; |
| • | “Registration Rights Agreement” means that certain Registration Rights Agreement among the Company, the Trident Owners, and the Founding Owners, which we expect to enter into upon closing of the proposed Internalization. |
| • | “rent coverage ratio” means the ratio of tenant-reported or, when unavailable, management’s estimate, based on tenant-reported financial information, of annual earnings before interest, taxes, depreciation, amortization, and cash rent attributable to the leased property (or properties, in the case of a master lease) to the annualized base rental obligation as of a specified date; |
| • | “Revolving Credit Facility” means our $600 million unsecured revolving credit facility, dated June 23, 2017, by and among the Company, the OP, Manufacturers and Traders Trust Company, and the other lenders party thereto, as amended from time to time, which we expect to increase to $ million concurrently with the completion of this offering; |
| • | “Trident Owners” means Trident BRE LLC and its affiliates, each of which is an affiliate of Stone Point Capital LLC; and |
| • | “we,” “our,” “us” “BNL,” and “Company” mean Broadstone Net Lease, Inc., a Maryland corporation, together with its consolidated subsidiaries, including the OP. |
iii
Table of Contents
The following summary highlights information contained elsewhere in this prospectus. This summary is not complete and does not contain all of the information that you should consider before investing in our Class A Common Stock. You should read the entire prospectus carefully, including the section entitled “Risk Factors,” as well as the financial statements and related notes included elsewhere in this prospectus, before making an investment decision.
Our Company
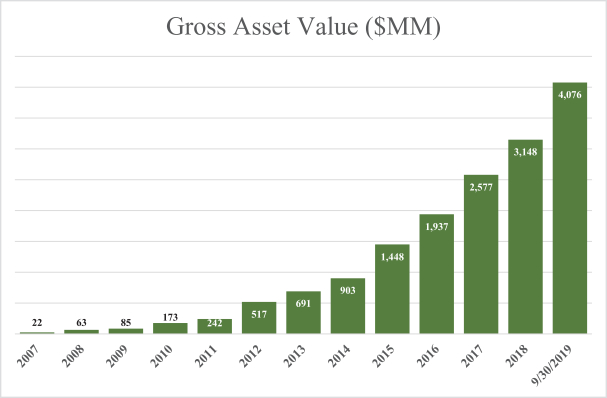
We are a REIT that acquires, owns, and manages primarily single-tenant commercial real estate properties that are net leased on a long-term basis to a diversified group of tenants. We utilize an investment strategy underpinned by strong fundamental credit analysis and prudent real estate underwriting. Since our inception in 2007, we have selectively invested more than $4.3 billion in net leased real estate across the industrial, healthcare, restaurant, office, and retail property types, and have scaled our portfolio to 661 properties in 42 U.S. states and one property in Canada, with an aggregate gross asset value of $4.1 billion.
We focus on investing in real estate that is operated by creditworthy single tenants in industries characterized by positive business drivers and trends, where the properties are an integral part of the tenants’ businesses and there are opportunities to secure long-term net leases. Through long-term net leases, our tenants are able to retain operational control of their strategically important locations, while allocating their debt and equity capital to fund their core business operations rather than real estate ownership.
| • | Diversified Portfolio. As of September 30, 2019, our portfolio comprised approximately 27.5 million rentable square feet of operational space, and was highly diversified based on property type, geography, tenant, and industry: |
| • | Property Type: We are focused primarily on industrial, healthcare, restaurant, office, and retail property types based on our extensive experience in and conviction around these sectors. Within these sectors, we have meaningful concentrations in manufacturing, distribution and warehouse, clinical, casual dining, quick service restaurant, corporate headquarters, food processing, flex/research and development, and cold storage. |
| • | Geographic Diversity: Our properties are located in 42 U.S. states and British Columbia, Canada, with no single geographic concentration exceeding 10.5% of our ABR. |
| • | Tenant and Industry Diversity: Our properties are occupied by approximately 187 different commercial tenants who operate 171 different brands that are diversified across 53 differing industries, with no single tenant accounting for more than 2.8% of our ABR. |
| • | Strong In-Place Leases with Significant Remaining Lease Term. Our portfolio is currently 99.8% leased based on rentable square footage with a weighted average remaining lease term of approximately 11.7 years, excluding renewal options. |
| • | Standard Contractual Base Rent Escalation. 97.9% of our leases have contractual rent escalations, with an annual ABR weighted average minimum increase of 2.1%. |
| • | Extensive Tenant Financial Reporting. 87.7% of our ABR is received from tenants that are required to provide us with specified financial information on a periodic basis and an additional 4.1% of our ABR is received from tenants that are public companies, required to file financial statements with the SEC, although they are not required to provide us with specified financial information under the terms of our lease. |
From our inception in 2007 through 2015, our portfolio grew to over 300 properties with a gross asset value of $1.4 billion. Growth further accelerated under the leadership of Christopher J. Czarnecki, our Chief Executive
1
Table of Contents
Officer since 2017, who joined us in 2009 and was instrumental in building our senior leadership team, developing our strategy and increasing our level of acquisition activity. Our team has acquired more than $500 million of net leased real estate every year since 2015, with acquisition activity of approximately $1.0 billion during 2019, and has grown our portfolio to 662 properties with a gross asset value of $4.1 billion as of September 30, 2019. In order to benefit from increasing economies of scale as we continue to grow, and as a part of our evolution toward entering the public markets, our board of directors made the decision to internalize our existing management team, which is expected to become effective in the first quarter of 2020. Upon closing of the Internalization, each member of our senior management team will become a full-time employee of BNL.
Our Competitive Strengths
We believe we possess the following competitive strengths that enable us to implement our business and growth strategies and distinguish our Company from other market participants, allowing us to compete effectively in the single-tenant, net lease market:
| • | Diversified Portfolio of High-Quality Properties that are Key to Tenant Operations. Our portfolio is diversified by property type, geography, tenant, and industry. Our portfolio is primarily focused in industrial, healthcare, restaurant, office, and retail property types, with approximately 187 tenants operating 171 different brands across 53 different industries. Our top ten tenants represented 19.5% of our portfolio ABR as of September 30, 2019, with no single tenant representing more than 2.8%. We focus on acquiring a diversified portfolio of properties that are strategically located or important to the tenant’s business. We believe that our highly diversified portfolio provides us with acquisition flexibility, positioning us for significant growth, and helps mitigate the risks inherent in a concentration |
2
Table of Contents
| in only one or a few property types, geographies, tenants, or industries, including risks presented by tenant bankruptcies, adverse industry trends, and economic downturns in a particular geographic area. |
| • | Scalable Net Lease Platform Well Positioned for Significant Growth. With approximately 65 employees upon closing of the Internalization who have extensive net lease expertise and significant experience managing our portfolio, our platform is highly scalable. We have developed leading institutional capabilities across origination, transaction negotiation and documentation, underwriting, financing, and property and asset management. Given our team and organizational structure upon closing of the Internalization, we expect that as our portfolio grows, we will experience limited increases in general and administrative expenses, such that those expenses will grow at a significantly slower rate than the overall portfolio and corresponding lease revenues. |
| • | Meaningful Value Creation and Risk Mitigation through Active Asset Management. Our asset and property management teams focus on creating value post-acquisition through active tenant engagement and risk monitoring and mitigation. Approximately 87.7% of our ABR is received from tenants that are required to periodically provide us with certain financial information and an additional 4.1% of our ABR is received from tenants that are public companies, which we believe enhances our ability to actively monitor our investments, negotiate lease renewals, and proactively manage our portfolio to protect stockholder value. |
| • | Strong Balance Sheet with Investment Grade Credit Rating. Upon completion of this offering, we expect to have pro forma total debt outstanding of $ million, approximately $ million of available borrowing capacity under our Revolving Credit Facility, approximately $ million of cash and cash equivalents, and a pro forma net debt to annualized adjusted EBITDAre ratio of approximately x. Our disciplined ownership and operation of our business is reflected in our investment grade credit rating from Moody’s Investors Service (“Moody’s”) of Baa3 with a stable outlook. We believe we are well positioned to grow our portfolio successfully while maintaining an attractive leverage profile. |
| • | Experienced and Innovative Senior Leadership Team with Proven Net Lease Track Record. Our senior management team has significant net lease real estate, public company, finance, and capital markets experience, including our Chief Executive Officer, Christopher J. Czarnecki, who has over 13 years of experience in the real estate industry and joined us in 2009. Our senior management team also has a strong track record working together and collectively managing our business, operations, and portfolio, having acquired $2.8 billion of net leased real estate since 2015. Our senior management team also has an extensive network of relationships in the net lease real estate business, as well as in the investment banking, real estate broker, financial advisory, and lending communities, which will continue to underpin the expansion of our platform. Our Chief Financial Officer, Ryan M. Albano, who joined us in 2013, has extensive experience in finance and real estate and has significantly contributed to our debt capital markets strategy, particularly since becoming our Chief Financial Officer in 2017, having executed more than $2 billion of debt transactions in that time. Our Chief Investment Officer, Sean T. Cutt, who joined us in 2012, has extensive experience in real estate and has led the sourcing, underwriting, and execution of our acquisitions and dispositions strategies since 2016. Our Chief Operating Officer, John D. Moragne, who joined us in 2016, has extensive experience in real estate and corporate operations, and was instrumental in leading our transition to a public reporting company in 2017. |
3
Table of Contents
Our Business and Growth Strategies
Our primary business objectives are to maximize cash flows, the value of our portfolio, and total returns to our stockholders through pursuit of the following business and growth strategies:
| • | Internal Growth through Long-Term Net Leases with Strong Contractual Rent Escalations. We seek to enter into long-term net leases that include strong rent escalations over the lease term. As of September 30, 2019, substantially all of our portfolio (based on ABR) was subject to net leases, our leases had a weighted average remaining lease term of approximately 11.7 years, excluding renewal options, and 97.9% of our leases had contractual rent escalations, with an annual ABR weighted average minimum increase of 2.1%. |
| • | Disciplined and Targeted Acquisition Growth While Maintaining Our Diversified Portfolio. We plan to continue our disciplined and targeted acquisition strategy to identify properties that are both individually compelling and contribute to our portfolio’s overall diversification based on property type, geography, tenant, and industry. We also are highly focused on growing our business where we can capture the best opportunities across different property types while maintaining the overall diversity of our portfolio. We believe our reputation, in-depth market knowledge, and extensive network of established relationships in the net lease industry will continue to provide us access to an ongoing pipeline of attractive investment opportunities. |
| • | Selectively Identify Attractive Adjacent Opportunities to Our Core Property Types. We have and will continue to seek attractive adjacent opportunities to our core property types in the net lease space, which have historically provided us the opportunity to earn higher relative returns. For example, in 2015, we began acquiring and structuring long-term net leases for laboratory facilities, veterinary clinics, and cold storage facilities prior to what we believe was the more general market acceptance of these asset types in the healthcare and industrial sectors. We intend to continue opportunistically employing this strategy where we believe we can generate appropriate risk-adjusted returns for our stockholders on a long-term basis. |
| • | Actively Manage Our Balance Sheet to Maximize Capital Efficiency. We seek to maintain a prudent balance between debt and equity financing and to maintain funding sources that lock in long-term investment spreads, limit interest rate sensitivity, and align with our lease terms. As of September 30, 2019, on a pro forma basis, we had $ of total debt outstanding, net debt of $ , ratio of net debt to annualized adjusted EBITDAre of x, $ million of available borrowing capacity under our Revolving Credit Facility, and $ of cash and cash equivalents. In the future, we will seek to maintain on a sustained basis a level of net debt that is generally less than six times our annualized adjusted EBITDAre. |
| • | Proactively Manage Our Portfolio. We believe our proactive approach to asset management and property management helps enhance the performance of our portfolio through risk mitigation strategies and opportunistic sales. We believe that our proactive approach to asset management enables our platform to identify and address any issues, including the determination to sell any of our properties where we believe the risk profile has changed and become misaligned with our then current risk-adjusted return objectives. Since 2015, we have sold 67 properties for an aggregate sales price of approximately $258.2 million, resulting in a 23.1% gain over book value and a 17.4% gain over original purchase price. |
Our Real Estate Investment Portfolio
To achieve an appropriate risk-adjusted return, we intend to maintain a diversified portfolio of real estate. The following discussion summarizes our portfolio diversification by property type, tenant, industry, and geographic location as of September 30, 2019. The percentages below are calculated based on our ABR as of September 30, 2019.
4
Table of Contents
As of September 30, 2019, our top ten tenants (based on ABR) represented only 19.5% of our ABR and included Art Van Furniture, Red Lobster, Jack’s Family Restaurants, Axcelis, Hensley, Outback Steakhouse, Krispy Kreme, BluePearl, Big Tex Trailer Manufacturing, and Siemens. For additional information regarding these tenants, including the number of properties each tenant leases from us, please see “Business and Properties—Our Real Estate Portfolio—Top 20 Tenants.”
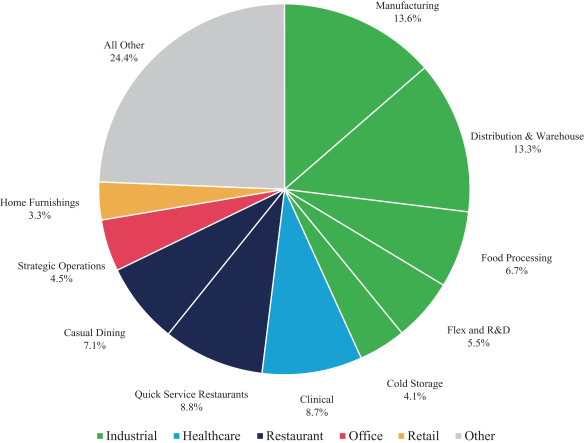
Diversification by Property Type. We are focused primarily on industrial, healthcare, restaurant, office, and retail property types based on our extensive experience in and conviction around these sectors. Within these sectors, we have meaningful concentrations in manufacturing, distribution and warehouse, clinical, casual dining, quick service restaurant, corporate headquarters, food processing, flex/research and development, and cold storage.
Top 10 Property Types
(based on ABR)
5
Table of Contents
| Property Type |
# Properties |
ABR ($‘000s) |
ABR as a % of Total Portfolio |
Square Feet (‘000s) |
SF as a % of Total Portfolio |
|||||||||||||||
| Industrial |
||||||||||||||||||||
| Manufacturing |
55 | $ | 39,876 | 13.6 | % | 7,531 | 27.4 | % | ||||||||||||
| Distribution & Warehouse |
32 | 38,933 | 13.3 | % | 6,989 | 25.5 | % | |||||||||||||
| Food Processing |
15 | 19,825 | 6.7 | % | 2,286 | 8.3 | % | |||||||||||||
| Flex and R&D |
7 | 16,173 | 5.5 | % | 1,457 | 5.3 | % | |||||||||||||
| Cold Storage |
4 | 12,156 | 4.1 | % | 933 | 3.4 | % | |||||||||||||
|
|
|
|
|
|
|
|
|
|
|
|||||||||||
| Industrial Total |
113 | 126,963 | 43.2 | % | 19,196 | 69.9 | % | |||||||||||||
| Healthcare |
||||||||||||||||||||
| Clinical |
51 | 25,659 | 8.7 | % | 1,103 | 4.0 | % | |||||||||||||
| Surgical |
16 | 9,486 | 3.2 | % | 369 | 1.3 | % | |||||||||||||
| Animal Health Services |
20 | 7,864 | 2.7 | % | 314 | 1.2 | % | |||||||||||||
| Life Science |
9 | 7,329 | 2.5 | % | 549 | 2.0 | % | |||||||||||||
| Healthcare Services |
30 | 7,069 | 2.4 | % | 270 | 1.0 | % | |||||||||||||
|
|
|
|
|
|
|
|
|
|
|
|||||||||||
| Healthcare Total |
126 | 57,407 | 19.5 | % | 2,605 | 9.5 | % | |||||||||||||
| Restaurant |
||||||||||||||||||||
| Quick Service Restaurants |
159 | 25,727 | 8.8 | % | 533 | 1.9 | % | |||||||||||||
| Casual Dining |
95 | 21,006 | 7.1 | % | 606 | 2.2 | % | |||||||||||||
|
|
|
|
|
|
|
|
|
|
|
|||||||||||
| Restaurant Total |
254 | 46,733 | 15.9 | % | 1,139 | 4.1 | % | |||||||||||||
| Office |
||||||||||||||||||||
| Strategic Operations |
7 | 13,265 | 4.5 | % | 1,021 | 3.7 | % | |||||||||||||
| Corporate Headquarters |
6 | 9,484 | 3.2 | % | 649 | 2.4 | % | |||||||||||||
| Call Center |
4 | 5,517 | 1.9 | % | 392 | 1.4 | % | |||||||||||||
|
|
|
|
|
|
|
|
|
|
|
|||||||||||
| Office Total |
17 | 28,266 | 9.6 | % | 2,062 | 7.5 | % | |||||||||||||
| Retail |
||||||||||||||||||||
| Home Furnishings |
15 | 9,784 | 3.3 | % | 860 | 3.2 | % | |||||||||||||
| Automotive |
57 | 9,530 | 3.3 | % | 747 | 2.7 | % | |||||||||||||
| General Merchandise |
64 | 8,775 | 3.0 | % | 692 | 2.5 | % | |||||||||||||
|
|
|
|
|
|
|
|
|
|
|
|||||||||||
| Retail Total |
136 | 28,089 | 9.6 | % | 2,299 | 8.4 | % | |||||||||||||
| Other Total |
16 | 6,367 | 2.2 | % | 173 | 0.6 | % | |||||||||||||
|
|
|
|
|
|
|
|
|
|
|
|||||||||||
| Total |
662 | $ | 293,825 | 100.0 | % | 27,474 | 100.0 | % | ||||||||||||
|
|
|
|
|
|
|
|
|
|
|
|||||||||||
Diversification by Tenant. Our properties are occupied by approximately 187 different commercial tenants, with no single tenant accounting for more than 2.8% of our ABR.
Diversification by Industry and Brand. Our properties were occupied by commercial tenants who operate 171 different brands that are diversified across 53 differing industries. Tenants operating in the industrial, healthcare, and restaurant industries provided 43.2%, 19.5%, and 15.9%, respectively, of our ABR.
Diversification by Geography. We have a diversified portfolio of 661 properties located in 42 states, including Texas, which represented 10.5% of our ABR, and one property located in British Columbia, Canada.
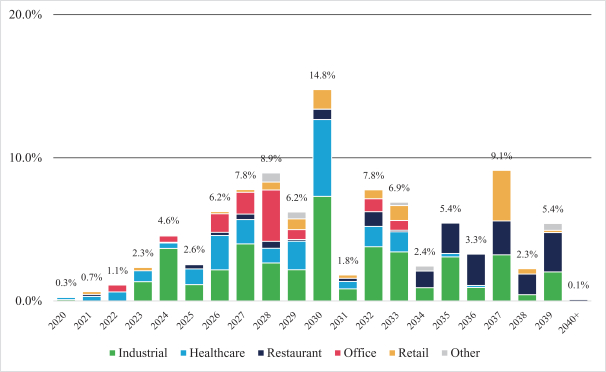
Lease Maturity
At September 30, 2019, 99.8% of our portfolio’s rentable square footage, representing all but four of our properties, is subject to a lease. As of September 30, 2019, the weighted average remaining term of our leases
6
Table of Contents
was approximately 11.7 years, excluding renewal options. More than 59% of our rental revenue is derived from leases that expire during 2030 and thereafter, and, as of September 30, 2019, no more than 9% of our rental revenue was derived from leases that expire in any single year in the next ten years. The following chart sets forth our lease expirations based upon the terms of our leases in place as of September 30, 2019.
Lease Expirations
| Expiration Year |
2020 | 2021 | 2022 | 2023 | 2024 | 2025 | 2026 | 2027 | 2028 | 2029 | 2030 | 2031 | 2032 | 2033 | 2034 | 2035 | 2036 | 2037 | 2038 | 2039 | 2040+ | |||||||||||||||||||||||||||||||||||||||||||||||||||||||||||||||
| # Properties |
3 | 11 | 4 | 13 | 14 | 21 | 34 | 32 | 36 | 61 | 83 | 17 | 46 | 46 | 34 | 48 | 30 | 55 | 32 | 36 | 2 | |||||||||||||||||||||||||||||||||||||||||||||||||||||||||||||||
| # Leases |
3 | 11 | 5 | 13 | 14 | 21 | 26 | 26 | 30 | 26 | 36 | 12 | 21 | 14 | 17 | 9 | 5 | 12 | 28 | 8 | 2 | |||||||||||||||||||||||||||||||||||||||||||||||||||||||||||||||
7
Table of Contents
Substantially all of our leases provide for periodic contractual rent escalations. As of September 30, 2019, leases contributing 97.9% of our ABR provided for increases in future annual base rent, generally ranging from 1.5% to 2.5% annually, with an ABR weighted average annual minimum increase equal to 2.1% of base rent. Generally, our rent escalators increase rent on specified dates by a fixed percentage. Our escalations provide us with a source of organic growth and a measure of inflation protection. Additional information on lease escalation frequency and weighted average annual escalation rates as of September 30, 2019 is displayed below.
| Lease Escalation Frequency |
% of ABR | Weighted Average Annual Minimum Increase (1) |
||||||
| Annually |
81.7 | % | 2.1 | % | ||||
| Every 2 years |
0.1 | % | 1.8 | % | ||||
| Every 3 years |
2.6 | % | 3.0 | % | ||||
| Every 4 years |
1.3 | % | 2.4 | % | ||||
| Every 5 years |
6.9 | % | 2.0 | % | ||||
| Other escalation frequencies |
5.3 | % | 1.8 | % | ||||
| Flat |
2.1 | % | N/A | |||||
|
|
|
|||||||
| Total/Weighted Average (2) |
100.0 | % | 2.1 | % | ||||
|
|
|
|||||||
| (1) | Represents the ABR weighted average annual minimum increase of the entire portfolio as if all escalations occurred annually. For leases where rent escalates by the greater of a stated fixed percentage or the change in CPI, we have assumed an escalation equal to the stated fixed percentage in the lease. As of September 30, 2019, leases contributing 10.4% of our ABR provide for rent increases equal to the lesser of a stated fixed percentage or the change in CPI. As any future increase in CPI is unknowable at this time, we have not included an increase in the rent pursuant to these leases in the weighted average annual minimum increase presented. |
| (2) | Weighted by ABR. |
8
Table of Contents
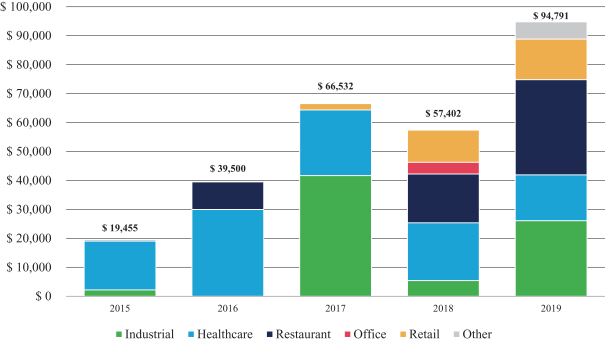
Historical Acquisitions and Dispositions
The below charts illustrate our annual acquisition and disposition activity since 2015. The acquisition dollar amounts are based on investment cost and the disposition dollar amounts reflect the sale prices of the properties sold:
Historical Acquisitions ($ in thousands)
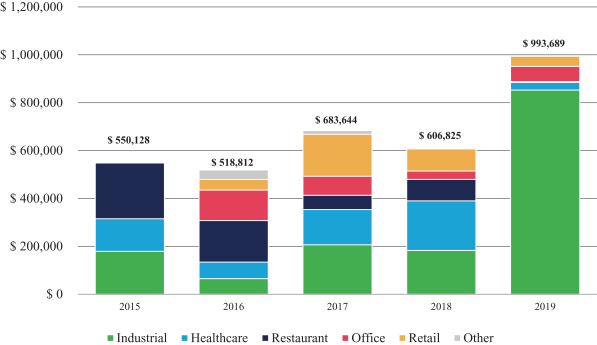
Historical Dispositions ($ in thousands)
9
Table of Contents
Market Opportunity
Outlook
Rosen Consulting Group (“RCG)” has a positive outlook on the net lease real estate market generally and on certain segments of property types, including industrial, healthcare, restaurant, office and retail for the following reasons:
| • | Net leases offer multiple benefits for property owners and tenants, including, for property owners, rental income stability, inflation mitigation and potential residual property value appreciation, and for tenants, the opportunity to monetize real properties and allocate capital more efficiently. |
| • | RCG estimates the total value of owner-occupied commercial real estate in the U.S. is in the $1.5 to $2.0 trillion range as of 2019. RCG believes that many of these owner-occupied properties could become net leased assets, increasing the size of the net lease market through sale-leaseback transactions. |
| • | RCG believes that the net lease market generally can increase in size and will accommodate a substantial increase in investment activity. |
Net Lease Real Estate Overview
The net lease market is characterized primarily by single-tenant properties occupied by tenants across a range of industries, including corporate headquarters, manufacturing and distribution facilities, quick service restaurants and healthcare. The structure of a net lease can result in passive and stable cash flows for the owner with the benefit of potential property value appreciation. Net leases are often executed for seven to 15 years or more. Lease agreements typically include tenant options to renew, further extending the life of a net lease beyond the initial term. Comparatively, multitenant real estate properties with gross leases typically have average lease terms between five and ten years with fewer options to extend. Within the lease term, net leases may feature rent escalations of a fixed percentage or in relation to an inflation measure such as the CPI. This allows a net lease investment to provide some mitigation against inflation pressures. As a result, net leases can offer stable, predictable and passive cash flows over time, similar to interest-bearing corporate bonds but with potential upside for appreciation in property values and inflation mitigation.
The structure of a net lease can be beneficial in several ways to lessees:
| • | Tenants are able to occupy and control locations for longer periods than a standard lease while preserving needed capital for core business operations. |
| • | Assists corporate tenants with expansion opportunities by foregoing capital-intensive ownership and property development alternatives. |
| • | Allows an owner-occupier to monetize real estate through a sale-leaseback transaction, which can provide capital for expansion opportunities, to retire debt or reinvest in the business platform. |
For property owners, there are multiple benefits of a net lease structure:
| • | A net lease offers greater rental income stability and predictability than traditional leases. The longer term and agreed upon rent escalations can create stable cash flows over an extended period of time. |
| • | The contractual rent increases, often at an annual frequency, can serve to hedge against rising inflation. With the tenant financially responsible for most expenses, the landlord is further insulated against potential surges in inflation. Furthermore, minimal operating expenses borne by the lessor combined with the net lease structure can translate to a more consistent and predictable rental income stream. |
10
Table of Contents
| • | Tenants with strong corporate financial metrics can minimize the vacancy risk to property owners of real estate assets. As net-leased locations are often critical to core businesses, tenants that occupy these mission-critical net-leased properties are likely to maintain lease payments even in the case of corporate reorganizations, bankruptcy filings or mergers. Should a net lease tenant relocate or go out of business, the real estate asset often holds residual value, which may be substantial, depending upon the characteristics and location of the property. |
| • | Even without a tenant and the recurring cash flow, the building may be repositioned to a single tenant or multitenant facility with the potential to secure a new cash flow stream. The underlying land also holds value regardless of the existing structure, particularly well-located sites in urban areas or within proximity to transportation infrastructure, business customers or consumers. |
| • | Finally, the long-term nature of the lease may offer some protection for property owners against economic volatility because short-term fluctuations in market-rate rents should not materially impact the in-place rental income from a net lease property. In both economic expansions and downturns, net lease rent growth exhibits less volatility than most other commercial real estate categories. During 2008 and 2009, one of the most severe economic downturns in modern times, rent growth for net-leased properties remained positive while average rent growth declined among other commercial property types. Economic cycles can often cause shifts in real estate occupancy and rental income, but the long-term lease structure of net lease real estate can often be more resistant to market downturns. |
The fragmented and evolving nature of ownership in the net lease market make it difficult to quantify the overall size of the net lease market. Net lease tenants constantly expand into new locations and owner-occupiers engage in sale-leaseback and other net lease transactions, adding to and removing properties from the universe of investable net lease real estate properties. RCG estimates the total value of owner-occupied real estate in the U.S. is in the $1.5 to $2.0 trillion range as of 2019. Many of these owner-occupied properties could become net leased assets, increasing the size of the net lease market through sale-leaseback transactions. This estimate is a small portion of the nearly 5.6 million commercial buildings encompassing more than 87 billion square feet in 2012, according to the Energy Information Administration, not to mention the millions of square feet built in the years since 2012. With this magnitude, there is considerable potential for the net lease market to expand as owner-occupiers sell properties to raise capital and corporations expand operations.
Net Lease Real Estate Investment Trends
In line with the challenge of measuring the size of the net lease market, assessing the volume of transactions in net lease real estate is similarly challenging. However, sales volume of single tenant properties can be a helpful proxy for net lease transactions as a large share of single tenant properties are net leased. During the five-year period from 2014 through 2018, single tenant investment sales reached $235.2 billion, or $47.0 billion on average each year.
The high level of investment interest from investors has continued to place pressure on cap rates for single tenant real estate assets. The average single tenant transactional cap rate remained near historical lows at 6.3% through November 2019, according to Real Capital Analytics. The average cap rates are based on properties throughout the country and contain tenants of varying credit ratings, as such, there is a range of cap rates. Generally, cap rates may be lower than the average for quality properties and properties with investment-grade tenants. The stable cap rate is a result of the inflow of investment capital into the sector.
Even as single tenant cap rates remained near historical lows, the spread to corporate and sovereign bonds remained wide. Through November 2019, the single tenant cap rate spread to 10-year Treasury bond yields was 449 basis points, compared with the average spread of 459 basis points since 2010. Even as bond yields moved lower, the average cap rate was stable, leading to widened spreads and potential opportunities for greater investment returns relative to a comparable investment class.
11
Table of Contents
Economic Overview of Selected Markets
Industrial. Economic growth drives the movement of materials and goods between producers, wholesalers, retailers, businesses and consumers. Growth in online sales activities continued to drive an increase in freight traffic in recent years. Online, or e-commerce, sales increased to $154.5 billion in the third quarter 2019, up from $37.4 billion in the third quarter of 2010, according to the Census Bureau. The Transportation Services Index for freight remained stable for much of 2019 and has grown from 98.5 in January 2009 to 138.6 in October 2019, according to the Bureau of Transportation Services.
In order to transport goods to stores, provide food to restaurants and bars, and ship items to consumers, retailers typically employ distribution activities from warehouse facilities located across the country. In particular, last mile delivery locations to consumers and businesses can be mission critical for distribution and logistics services. Additionally, consumer demand for fresh food continues to rise, driving demand growth for cold storage warehouse and distribution space close to farms and producers as well as in proximity to retailers, restaurants and consumers. The increase in consumer demand for organic food products also drives a further increase in demand for specialized storage and distribution facilities. The growing online grocery segment increases demand for cold storage in and around urban markets. The location of warehouses with proximity to consumers or storefronts and prime transportation infrastructure access are highly sought after by retailers and wholesalers.
Healthcare. The expansion of healthcare insurance coverage by public programs as well as through private employers with a greater share of the population employed, in part drove further increases in healthcare utilization and spending. Approximately 91.5% of the U.S. population had health insurance at some point in 2018, according to the Census Bureau. Demographic trends, including an aging population, extended life expectancy and a large wave of the millennial generation moving into life stages that tend to utilize health services at a greater rate, also provide a growing base of demand for healthcare services. In 2018, healthcare spending in the U.S. reached $3.6 trillion, an increase of 4.6% from the previous year, according to the U.S. Centers for Medicare & Medicaid Services. In addition to hospitals and medical insurers referring more patients to outpatient facilities, evolving consumer preferences for healthcare including increased utilization of preventative and alternative care accelerated demand for healthcare services physically detached from hospital system campuses. Many of these medical services benefit from long-term stability of their locations in order to best care for patients, and can be prime tenants for net leased real estate.
Restaurants. Dining out provides consumers with a social experience that cannot be replicated by eating meals at home. This type of experience can be resilient against online service expansion, including the rise of food delivery services. Spending on food services and drinking places increased to $65.2 billion for the month of November 2019, and more than $705 billion from January to November 2019, an increase of 4.3% from the same 11-month period in 2018, according to the Department of Commerce and Census Bureau. Consumer spending on eating out now exceeds spending in grocery stores, highlighting the growing consumer preference for enjoying meals and drinks outside of the home, including in casual dining, quick service restaurants, bars and fast food establishments. Consumer spending on dining establishments should continue to increase, driven by shifts in preferences and demographic factors. With more households residing in smaller living spaces, nearly 26 million households lived in multifamily unit buildings with five or greater units in 2018, an increase of 3% from the previous year, according to the Census Bureau, cooking at home or gathering friends and relatives for a meal may be challenging given the space constraints. Furthermore, as the millennial generation ages, much of the generation will transition into life stages typically characterized by rising incomes and elevated spending, which bodes well for restaurants and food and drink-related gathering places. The resiliency of dining establishments combined with positive consumer preferences should support further expansion of food service and drinking establishments, creating additional opportunities for net lease real estate investments.
12
Table of Contents
Office. Much of the private sector hiring during the current economic expansion was in office-using industries, including professional and business services, technology, and financial activities. Office-using employment increased to more than 32.2 million employees in November 2019, according to RCG calculations of Bureau of Labor Statistics data. From January 2015 to November 2019, nearly 3.0 million office-using jobs were created. The level of office-using employment is a highly correlated indicator to tenant demand for office space. The positive hiring trends should in turn be a positive indicator for office tenants and, in particular, mission-critical locations in net-leased properties.
Retail. Consumer spending, as measured by seasonally adjusted retail and food services sales, increased to nearly $528 billion in November 2019 and to more than $5.6 trillion in 2019 year-to-date through November 2019, an increase of 3.4% from the same period in 2018, according to the Census Bureau. While online sales have absorbed some sales from physical locations, most large retailers utilize omnichannel sales strategies to boost overall sales. Additionally, some retailers that began as online-only storefronts have opened physical locations in recent years.
Additionally, some retail segments, including specialized goods and service-oriented and experience-based businesses, may provide insulation against competition from online platforms. Furthermore, retailers selling large items that are difficult to ship, and/or that benefit from enabling customers to examine products prior to purchasing, are also somewhat internet-resilient. While there are challenges for some retailers, and online retailers now account for 11.2% of retail sales, according to the Census Bureau, internet-resilient goods and services retailers may continue to expand and provide additional tenant opportunities for net lease real estate.
Summary Risk Factors
You should carefully consider the matters discussed in the “Risk Factors” section beginning on page 26 of this prospectus for factors you should consider before investing in our Class A Common Stock, which will automatically convert into shares of our Common Stock 180 days after completion of this offering. Some of these risks include:
| • | Single-tenant leases involve significant risks of tenant default and tenant vacancies, which could materially and adversely affect us. |
| • | We have limited opportunities to increase rents under our long-term leases with tenants, which could impede our growth and materially and adversely affect us. |
| • | We may not be able to achieve growth through acquisitions at a rate that is comparable to our historical results, which could materially and adversely affect us. |
| • | We may not be able to effectively manage our growth and any failure to do so could materially and adversely affect us. |
| • | The departure of any of our current third-party manager’s key personnel with long-standing business relationships could materially and adversely affect us. |
| • | As of September 30, 2019, on a pro forma basis, we had approximately $ billion principal balance of indebtedness outstanding, which may expose us to the risk of default under our debt obligations. |
| • | Market conditions could adversely affect our ability to refinance existing indebtedness on acceptable terms or at all, which could materially and adversely affect us. |
| • | We are a holding company with no direct operations and rely on funds received from the OP to pay liabilities. |
| • | Failure to qualify as a REIT would materially and adversely affect us and the value of our Common Stock (including our Class A Common Stock). |
13
Table of Contents
| • | There has been no public market for our Common Stock (including our Class A Common Stock) prior to this offering and an active trading market for our Common Stock (including our Class A Common Stock) may not develop following this offering. |
| • | We may not be able to make distributions to our stockholders at the times or in the amounts we expect, or at all. |
Recapitalization, Internalization, and Structure of Our Company
Recapitalization
Immediately prior to the closing of this offering, we will effect the REIT Recapitalization, pursuant to which (i) we will establish a new class of Common Stock as “Class A Common Stock” for sale in this offering and (ii) we will effect a four-for-one stock split of our Common Stock that is outstanding immediately prior to the closing of this offering. The four-for-one stock split is intended to achieve a stock price that is consistent with market expectations for underwritten public offerings by REITs. In connection with the REIT Recapitalization, the OP will effect a recapitalization of its OP Units, pursuant to which it will effect a four-for-one split of its outstanding OP Units.
The terms of our Class A Common Stock are identical to the terms of our Common Stock, except that each share of our Class A Common Stock will automatically convert into one share of our Common Stock 180 days after completion of this offering. The automatic conversion feature of the Class A Common Stock is the only difference between the terms of the Class A Common Stock and the Common Stock. Additionally, prior to the Class A Conversion, the holders of Class A Common Stock, voting as a separate class, are required to approve any amendment to our Charter that will affect such holders differently than the holders of our Common Stock.
The Class A Common Stock will be immediately listed on the NYSE under the symbol “BNL” upon completion of this offering and will be freely tradeable. The Common Stock (then including the shares of Common Stock issued upon conversion of the Class A Common Stock) will be listed on the date that is 180 days after completion of this offering.
The Recapitalization will have the effect of increasing the total number of outstanding shares of our Common Stock. On , 2020, immediately prior to the stock split, we had approximately million shares of Common Stock outstanding. Upon completion of this offering, we expect to have an aggregate of approximately million shares of our Common Stock (including our Class A Common Stock) outstanding. Of this amount, approximately million shares will be Class A Common Stock (representing % of our total outstanding Common Stock (including our Class A Common Stock) and % of our Common Stock (including our Class A Common Stock) and OP Units on a fully diluted basis).
The Recapitalization will be effected on a pro rata basis with respect to all of our stockholders immediately prior to this offering. Accordingly, it will not affect any such stockholder’s proportionate ownership of our outstanding shares. The Recapitalization also will be effected on a pro rata basis with respect to all of the members of the OP immediately prior to this offering.
The terms of our Common Stock (including our Class A Common Stock) are described more fully under “Description of Our Capital Stock” in this prospectus.
Internalization
On November 11, 2019, we entered into a definitive agreement (the “Merger Agreement”) providing for the internalization of the external management functions currently performed for the Company and the OP by BRE
14
Table of Contents
or its affiliates. We expect the Internalization will close in the first quarter of 2020. In connection with the Internalization, the following transactions have occurred or are expected to occur:
| • | Pursuant to the Merger Agreement, we repurchased all of the outstanding shares of our Common Stock held by BRE at $85.00 per share for approximately $20 million on December 27, 2019. |
| • | We will acquire 100% of BRE through three mergers: |
| • | Our newly-formed corporate subsidiary merged into Trident BRE Holdings I, Inc. (“Blocker Corp 1”); |
| • | Another newly-formed corporate subsidiary of ours merged into Trident BRE Holdings II, Inc. (“Blocker Corp 2” and together with Blocker Corp 1, the “Blocker Corps”); |
| • | The Blocker Corps will contribute their interests in BRE to the OP in exchange for OP Units; and |
| • | BRE will merge into the OP. |
| • | As consideration in the three mergers, we will issue shares of our Common Stock, the OP will issue OP Units, the OP will pay $ in cash, and the OP will assume approximately $94 million of debt. We expect to refinance $60 million of the assumed indebtedness with a new loan that is guaranteed by the Founding Owners. The aggregate value of the Common Stock, OP Units, and cash to be issued upon consummation of the Mergers will be approximately $206 million. |
| • | Our current management team and corporate staff will become employed by a subsidiary of the OP, and we will become internally managed. We entered into employment agreements (the “Employment Agreements”) with our four named executive officers, to be effective upon completion of the Internalization. |
| • | We will enter into the Registration Rights Agreement and a tax protection agreement with the Founding Owners (the “Founding Owners’ Tax Protection Agreement”). |
| • | In connection with the Internalization, we may be required to pay $75 million of additional “earnout” consideration (payable in four tranches of $10 million, $15 million, $25 million, and $25 million, and in the same proportion of equity interests and cash as the initial payments) if certain milestones related to the 40-day dollar volume-weighted average price (“VWAP”) of our Class A Common Stock (or Common Stock after the Class A Conversion) are achieved during specified periods of time following the completion of this offering. The number of shares of Common Stock and OP Units potentially issuable as “earnout” consideration will be determined by dividing the dollar value of the payment by $85 (as adjusted to reflect any stock splits or recapitalizations, as applicable). |
See “Recapitalization, Internalization, and Structure of Our Company—Internalization” for a further discussion of the terms of the Internalization. The expected terms of the Employment Agreements are more fully described under “Executive Compensation— Narrative Disclosure—Executive Officer Employment Agreements.” The expected terms of the Registration Rights Agreement and the Founding Owners’ Tax Protection Agreement are more fully described under “Certain Relationships and Related Party Transactions.”
Consequences of the Recapitalization, the Internalization, and this Offering
Share amounts and percentages below assume that the underwriters’ option to purchase additional shares is not exercised. Upon completion of the Recapitalization, the Internalization, and this offering, and assuming the earnout consideration in the Internalization is paid in full:
| • | Purchasers of shares of our Class A Common Stock in this offering will own % of the outstanding shares of our Common Stock, including our Class A Common Stock (or % of our Common Stock, including our Class A Common Stock, and OP Units on a fully diluted basis). |
15
Table of Contents
| • | Our directors and officers will own shares of our Common Stock, representing % of the outstanding shares of our Common Stock, including our Class A Common Stock (or % of our Common Stock, including our Class A Common Stock, and OP Units on a fully diluted basis). |
| • | The Trident Owners will own shares of our Common Stock and OP Units, representing % of the outstanding shares of our Common Stock, including our Class A Common Stock, and OP Units on a fully diluted basis. |
| • | The Founding Owners will own shares of our Common Stock and OP Units, representing % of the outstanding shares of our Common Stock, including our Class A Common Stock, and OP Units on a fully diluted basis. |
| • | Our other continuing investors prior to this offering (i.e., the continuing investors other than our directors and officers and the Trident Owners) will own shares of our Common Stock, representing % of the outstanding shares of our Common Stock, including our Class A Common Stock (or % of our Common Stock, including our Class A Common Stock, and OP Units on a fully diluted basis). |
| • | The other existing OP Unit holders (i.e., the existing OP Unit holders other than the Founding Owners, the Trident Owners, the Blocker Corps, and us) will own OP Units, representing % of the outstanding OP Units and % of our Common Stock, including our Class A Common Stock, and OP Units on a fully diluted basis. |
| • | We will contribute the net proceeds from this offering to the OP in exchange for OP Units, and we will, directly or indirectly, own % of the outstanding OP Units ( % held directly by us and % held indirectly through the Blocker Corps). |
| • | The OP will use the net proceeds from this offering to repay borrowings under the 2020 Unsecured Term Loan and Revolving Credit Facility and for general business and working capital purposes, including potential future acquisitions. See “Use of Proceeds.” |
| • | As of September 30, 2019, the OP had approximately $ million of indebtedness outstanding, and we expect to increase the size of the Revolving Credit Facility, which will be available for general corporate purposes, including for funding future acquisitions. |
| • | We will adopt our 2020 Equity Incentive Plan to provide equity incentive opportunities to certain parties, including members of our board of directors and our management team and other employees. |
16
Table of Contents
The following chart sets forth information about our Company, the OP, and certain related parties upon completion of the Recapitalization, Internalization, and this offering, and assuming the earnout consideration in the Internalization is paid in full. Share amounts and percentages below assume that the underwriters’ option to purchase additional shares is not exercised.
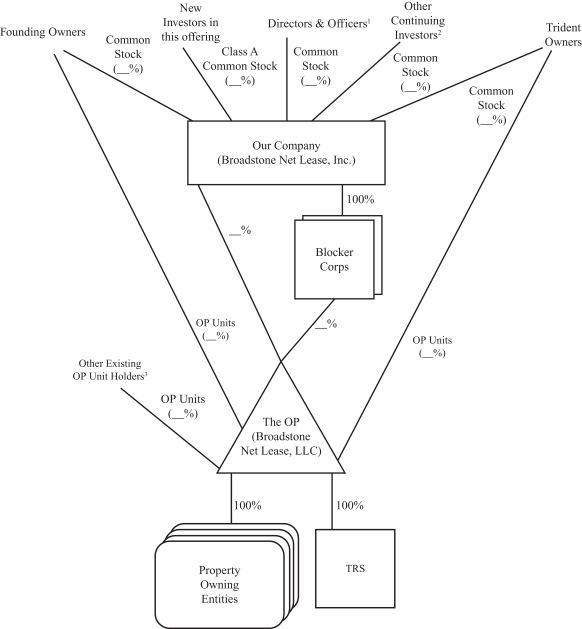
| (1) | Directors & Officers include Common Stock beneficially owned by Agha S. Khan (which is also included in the Common Stock owned by the Trident Owners). |
| (2) | Other Continuing Investors include the continuing investors other than Directors & Officers and Trident Owners. |
| (3) | Other Existing OP Unit Holders include the existing OP Unit holders other than Founding Owners, Trident Owners, Blocker Corps, and Our Company. |
17
Table of Contents
Distribution Policy
Following completion of this offering, we intend to make regular quarterly distributions to holders of our Common Stock (including our Class A Common Stock). Prior to this offering, we have paid distributions to holders of shares of our Common Stock on a monthly basis. We currently expect that the per share amount of our quarterly distributions on our Common Stock (including our Class A Common Stock) following completion of this offering will be , compared to the $1.32 paid in the aggregate on our Common Stock in the most recent quarter prior to this offering. For the period commencing upon the completion of this offering and ending on , 2020, we intend to make a pro rata distribution based on a distribution rate of $ per share for a full quarter. On an annualized basis, this would be $ per share, or an annualized distribution rate of approximately % based on the mid-point of the price range set forth on the front cover of this prospectus. We intend to maintain our initial distribution rate for the 12 months following the completion of this offering unless our results of operations, FFO, AFFO, liquidity, cash flows, financial condition, prospects, economic conditions, or other factors differ materially from the assumptions used in projecting our initial distribution rate. We do not intend to reduce the annualized distribution per share if the underwriters exercise their option to purchase additional shares.
Any distributions will be at the sole discretion of our board of directors, and their form, timing, and amount, if any, will depend upon a number of factors, including our actual and projected results of operations, FFO, AFFO, liquidity, cash flows and financial condition, the revenue we actually receive from our properties, our operating expenses, our debt service requirements, our capital expenditures, prohibitions and other limitations under our financing arrangements, our REIT taxable income, the annual REIT distribution requirements, applicable law, including restrictions on distributions under Maryland law, and such other factors as our board of directors deems relevant.
Restrictions on Ownership and Transfer of Our Capital Stock
Our Charter, subject to certain exceptions, authorizes our board of directors to take such actions as are necessary or appropriate to allow us to qualify and to preserve our status as a REIT. To assist us in preserving our status as a REIT, among other consequences, our Charter contains limitations on the ownership and transfer of shares of our stock which are intended to prohibit: (1) any person or entity from owning or acquiring, directly or indirectly, more than 9.8% of the value of the aggregate of our then outstanding capital stock or more than 9.8% of the value or number of shares, whichever is more restrictive, of the aggregate of our then outstanding Common Stock (including our Class A Common Stock) and (2) any transfer of or other event or transaction with respect to shares of capital stock that would result in the beneficial ownership of our outstanding shares of capital stock by fewer than 100 persons. In addition, our Charter includes provisions intended to prohibit any transfer of, or other event with respect to, shares of our capital stock that would result in us being “closely held” within the meaning of Section 856(h) of the Code or otherwise failing to qualify as a REIT (including, but not limited to, ownership that would result in us owning an interest in a tenant if the income derived by us from such tenant would cause us to fail to satisfy any of the gross income requirements of Section 856(c) of the Code). However, these ownership limits do not apply to a person or persons that our board of directors exempts (prospectively or retroactively) from the ownership limits upon receiving appropriate assurances from such person that our qualification as a REIT is not jeopardized.
The restrictions on ownership and transfer of our stock contained in our Charter will not apply if our board of directors determines that it is no longer in our best interests to attempt to, or continue to, qualify as a REIT or if our board of directors determines that compliance with any such restriction is no longer required in order for us to qualify as a REIT. The ownership limits may delay or impede a transaction or a change of control that might be in your best interest. See “Description of Our Capital Stock—Restrictions on Ownership and Transfer.”
18
Table of Contents
Tax Status
We elected to qualify to be taxed as a REIT under the Code beginning with our taxable year ended December 31, 2008. We believe that as of such date we have been organized and have operated in a manner to qualify for taxation as a REIT for U.S. federal income tax purposes. We intend to continue to be organized and operate in such a manner.
Implications of Being an Emerging Growth Company
We are an emerging growth company, as defined in the Jumpstart Our Business Startups Act, and as such we are eligible to take advantage of certain exemptions from various reporting requirements that are applicable to other public companies that are not emerging growth companies, including, but not limited to, not being required to comply with the auditor attestation requirements of Section 404 of the Sarbanes-Oxley, reduced disclosure obligations regarding executive compensation in our periodic reports and proxy statements, and exemptions from the requirements of holding a nonbinding advisory vote on executive compensation and stockholder approval of any golden parachute payments not previously approved. Although we have not made a determination whether to take advantage of any or all of these exemptions, we have irrevocably opted-out of the extended transition period afforded to emerging growth companies in Section 7(a)(2)(B) of the Securities Act for complying with new or revised accounting standards. As a result, we will comply with new or revised accounting standards on the same time frames as other public companies that are not emerging growth companies.
We expect to remain an “emerging growth company” until the earliest of (i) the last day of the first fiscal year in which our annual gross revenues exceed $1.07 billion (subject to adjustment for inflation), (ii) December 31 of the fiscal year that we become a “large accelerated filer” as defined in Rule 12b-2 under the Exchange Act, which would occur if the market value of our shares of Common Stock (including our Class A Common Stock) held by non-affiliates exceeds $700 million as of the last business day of our most recently completed second fiscal quarter and we have been publicly reporting for at least 12 months, (iii) the date on which we have issued more than $1.0 billion in non-convertible debt securities during the preceding 36-month period, or (iv) December 31 of the fiscal year following the fifth anniversary of this offering.
Corporate Information
We were formed in October 2007. Our principal executive offices are located at 800 Clinton Square, Rochester, New York, 14604, and our telephone number is (585) 287-6500.
19
Table of Contents
The Offering
| Class A Common Stock offered by us |
shares (or shares if the underwriters exercise in full their option to purchase additional shares) |
| Common Stock held by continuing investors |
shares (1) |
| Common Stock issuable pursuant to Internalization earnout after this offering |
shares (2) |
| Total Common Stock (including our Class A |
shares (or shares if the underwriters exercise in full their option to purchase additional shares of our Class A Common Stock) (3) |
| OP Units to be outstanding upon completion of this offering (excluding OP Units held directly or indirectly by us) |
OP Units (4) |
| OP Units issuable pursuant to the Internalization earnout after this offering |
OP Units (5) |
| Total Common Stock (including our Class A |
shares of Common Stock (including our Class A Common Stock) and OP Units (or shares of Common Stock (including our Class A Common Stock) and OP Units if the underwriters exercise in full their option to purchase additional shares of our Class A Common Stock) (6) |
| Class A Conversion |
The terms of the Class A Common Stock and the terms of the Common Stock are identical, except that each share of our Class A Common Stock will automatically convert into one share of our Common Stock 180 days after completion of this offering when the Common Stock is listed on the NYSE. The automatic conversion feature of the Class A Common Stock is the only difference between the terms of the Class A Common Stock and the Common Stock. Additionally, prior to the Class A Conversion, the holders of Class A Common Stock, voting as a separate class, are required to approve |
20
Table of Contents
| any amendment to our Charter that will affect such holders differently than the holders of our Common Stock. |
| Proposed NYSE symbol / Listing |
The Class A Common Stock will be immediately listed on the NYSE under the symbol “BNL” upon completion of this offering. The Common Stock (then including shares of Common Stock issued as a result of the Class A Conversion) will be listed on the date that is 180 days after completion of this offering. |
| Dividend Rights |
Prior to the Class A Conversion, our Class A Common Stock and Common Stock will share equally in any dividends authorized by our board of directors and declared by us. |
| Voting Rights |
Each share of Class A Common Stock and Common Stock will entitle its holder to one vote per share. The Class A Common Stock and Common Stock will vote together as a single class prior to the Class A Conversion, except that the holders of Class A Common Stock, voting as a separate class, are required to approve any amendment to our Charter that will affect such holders differently than the holders of our Common Stock. |
| Registration Rights Agreement |
Pursuant to the Registration Rights Agreement, we granted the Trident Owners, the Founding Owners, and their respective affiliates certain demand and piggyback registration rights. See “Certain Relationships and Related Party Transactions—Registration Rights Agreement.” |
| Use of proceeds |
We estimate that the net proceeds to us from this offering will be approximately $ million, or $ million if the underwriters exercise in full their option to purchase additional shares, after deducting underwriting discounts and commissions and other estimated expenses, in each case, based on an assumed initial public offering price of $ per share, which is the mid-point of the price range set forth on the front cover of this prospectus. We intend to contribute the net proceeds from this offering to the OP in exchange for OP Units. We expect the OP to use the net proceeds from this offering to repay borrowings under the 2020 Unsecured Term Loan and Revolving Credit Facility and for general business and working capital purposes, including potential future acquisitions. No acquisitions are probable as of the date of this prospectus. See “Use of Proceeds.” |
| Risk factors |
Investing in our Class A Common Stock involves risks. You should carefully read and consider the information set forth under the heading “Risk Factors” beginning on page 26 and other information included in this prospectus before investing in our Class A Common Stock. |
21
Table of Contents
| (1) | Includes (a) shares of Common Stock held by continuing investors (excluding shares expected to be issued in connection with the Internalization) and (b) shares of Common Stock expected to be issued in connection with the Internalization as base consideration. |
| (2) | Represents the maximum potential contingent consideration payable in the form of Common Stock in connection with the Internalization earnout. |
| (3) | Includes (a) shares of Class A Common Stock issued in this offering, (b) shares of Common Stock held by continuing investors (excluding shares expected to be issued in connection with the Internalization), and (c) shares of Common Stock expected to be issued in connection with the Internalization, which represents the base consideration and the maximum potential contingent consideration payable in the form of Common Stock in connection with the Internalization. Excludes shares of our Common Stock issuable in the future under our 2020 Equity Incentive Plan, as more fully described in “Executive Compensation—Material Terms of the 2020 Equity Incentive Plan.” |
| (4) | Includes (a) OP Units held by existing members of the OP and (b) OP Units expected to be issued in connection with the completion of the Internalization as base consideration. |
| (5) | Represents the maximum potential contingent consideration payable in the form of OP Units in connection with the Internalization earnout. |
| (6) | Includes (a) shares of Class A Common Stock issued in this offering, (b) shares of Common Stock held by continuing investors (excluding shares expected to be issued in connection with the Internalization), (c) shares of Common Stock and OP Units expected to be issued in connection with the Internalization, which represents the base consideration and the maximum potential contingent consideration payable in connection with the Internalization. Excludes shares of our Common Stock issuable in the future under our 2020 Equity Incentive Plan, as more fully described in “Executive Compensation—Material Terms of the 2020 Equity Incentive Plan.” |
22
Table of Contents
Summary Consolidated Historical and Pro Forma Financial and Other Data
Our historical consolidated balance sheet data as of December 31, 2018 and 2017 and consolidated results of operations for the years ended December 31, 2018, 2017, and 2016 have been derived from our audited historical consolidated financial statements included elsewhere in this prospectus. The financial information below also includes our unaudited condensed consolidated balance sheet data as of September 30, 2019 and our unaudited condensed consolidated results of operations for the nine months ended September 30, 2019 and September 30, 2018, which have been derived from our historical unaudited condensed consolidated financial statements included elsewhere in this prospectus. The condensed consolidated financial statements have been prepared in accordance with GAAP for interim financial information and Article 10 of the SEC Regulation S-X. The Company believes all adjustments necessary for a fair presentation have been included in these interim condensed consolidated financial statements (which include only normal recurring adjustments). Our historical consolidated financial data included below and set forth elsewhere in this prospectus are not necessarily indicative of our future performance.
Our unaudited summary pro forma consolidated operating and balance sheet data as of and for the nine months ended September 30, 2019 and for the year ended December 31, 2018, is presented (i) with respect to statements of operations data, giving effect to the Industrial Portfolio Acquisition; the Internalization, assuming the earnout consideration in the Internalization is paid in full; the Recapitalization; and the completion of this offering and the use of proceeds described herein, based on the mid-point of the price range set forth on the front cover of this prospectus, assuming each of the transactions was completed on January 1, 2018, and (ii) with respect to balance sheet data, giving effect to the Internalization, assuming the earnout consideration in the Internalization is paid in full; the Recapitalization; and the completion of this offering and the use of proceeds described herein, based on the mid-point of the price range set forth on the front cover of this prospectus, assuming that each of the transactions was completed on September 30, 2019, in each case, giving effect to the other adjustments described in the unaudited pro forma consolidated financial statements included elsewhere in this prospectus. The preparation of the unaudited pro forma consolidated financial statements requires management to make estimates and assumptions deemed appropriate. The unaudited pro forma consolidated financial statements are not intended to represent, or be indicative of what our actual financial position and results of operations would have been as of the date and for the period indicated, nor does it purport to represent our future financial position or results of operations.
23
Table of Contents
You should read the following summary financial and other data together with “Management’s Discussion and Analysis of Financial Condition and Results of Operations,” “Business and Properties,” and our consolidated financial statements and related notes appearing elsewhere in this prospectus.
| For the nine months ended September 30, |
For the years ended December 31, | |||||||||||||||||||||||||||
| (in thousands, except per share data) | 2019 (Pro forma) (Unaudited) |
2019 (Historical) (Unaudited) |
2018 (Historical) (Unaudited) |
2018 (Pro forma) |
2018 (Historical) |
2017 (Historical) |
2016 (Historical) |
|||||||||||||||||||||
| Operating Data |
||||||||||||||||||||||||||||
| Revenues |
||||||||||||||||||||||||||||
| Lease revenues |
$ | — | $ | 213,884 | $ | 174,385 | $ | — | $ | 237,479 | $ | 181,563 | $ | 142,869 | ||||||||||||||
|
|
|
|
|
|
|
|
|
|
|
|
|
|
|
|||||||||||||||
| Operating expenses |
||||||||||||||||||||||||||||
| Depreciation and amortization |
77,989 | 61,303 | 83,994 | 62,263 | 46,321 | |||||||||||||||||||||||
| Asset management fees |
16,048 | 13,119 | 18,173 | 14,754 | 10,955 | |||||||||||||||||||||||
| Property management fees |
5,918 | 4,792 | 6,529 | 4,988 | 3,939 | |||||||||||||||||||||||
| Acquisition expenses |
— | — | — | — | 10,880 | |||||||||||||||||||||||
| Property and operating expense |
11,497 | 7,926 | 11,157 | 6,505 | 3,900 | |||||||||||||||||||||||
| General and administrative |
3,807 | 4,451 | 6,162 | 4,939 | 2,790 | |||||||||||||||||||||||
| State, franchise and foreign tax |
1,153 | 811 | 857 | 624 | 446 | |||||||||||||||||||||||
| Provision for impairment of investment in rental properties |
3,452 | 2,061 | 2,061 | 2,608 | — | |||||||||||||||||||||||
|
|
|
|
|
|
|
|
|
|
|
|
|
|
|
|||||||||||||||
| Total operating expenses |
— | 119,864 | 94,463 | — | 128,933 | 96,681 | 79,231 | |||||||||||||||||||||
|
|
|
|
|
|
|
|
|
|
|
|
|
|
|
|||||||||||||||
| Other income (expenses) |
||||||||||||||||||||||||||||
| Preferred distribution income |
— | 440 | 440 | 737 | 713 | |||||||||||||||||||||||
| Interest income |
6 | 178 | 179 | 467 | 88 | |||||||||||||||||||||||
| Interest expense |
(51,025 | ) | (38,115 | ) | (52,855 | ) | (34,751 | ) | (29,963 | ) | ||||||||||||||||||
| (Cost) gain of debt extinguishment |
(1,176 | ) | (101 | ) | (101 | ) | (5,151 | ) | (133 | ) | ||||||||||||||||||
| Gain (loss) on sale of real estate |
16,772 | 9,620 | 10,496 | 12,992 | 5,925 | |||||||||||||||||||||||
| Gain on sale of investment in related party |
— | 8,500 | 8,500 | — | — | |||||||||||||||||||||||
| Internalization expenses |
(1,195 | ) | — | — | — | — | ||||||||||||||||||||||
| Other (losses) gains |
— | — | (100 | ) | 379 | — | ||||||||||||||||||||||
|
|
|
|
|
|
|
|
|
|
|
|
|
|
|
|||||||||||||||
| Net income |
— | 57,402 | 60,444 | — | 75,105 | 59,555 | 40,268 | |||||||||||||||||||||
|
|
|
|
|
|
|
|
|
|
|
|
|
|
|
|||||||||||||||
| Net income attributable to non-controlling interests |
(3,942 | ) | (4,631 | ) | (5,730 | ) | (4,756 | ) | (3,914 | ) | ||||||||||||||||||
|
|
|
|
|
|
|
|
|
|
|
|
|
|
|
|||||||||||||||
| Net income attributable to Broadstone Net Lease, Inc. |
$ | — | $ | 53,460 | $ | 55,813 | $ | — | $ | 69,375 | $ | 54,799 | $ | 36,354 | ||||||||||||||
|
|
|
|
|
|
|
|
|
|
|
|
|
|
|
|||||||||||||||
| Pro forma weighted average number of shares of Common Stock outstanding |
|
|||||||||||||||||||||||||||
| Basic |
||||||||||||||||||||||||||||
|
|
|
|||||||||||||||||||||||||||
| Diluted |
||||||||||||||||||||||||||||
|
|
|
|||||||||||||||||||||||||||
| Pro forma net earnings per share of Common Stock |
|
|||||||||||||||||||||||||||
| Basic |
||||||||||||||||||||||||||||
|
|
|
|||||||||||||||||||||||||||
| Diluted |
||||||||||||||||||||||||||||
|
|
|
|||||||||||||||||||||||||||
24
Table of Contents
| As of September 30, | As of December 31, | |||||||||||||||||||
| (in thousands) | 2019 (Pro forma) (Unaudited) |
2019 (Historical) (Unaudited) |
2018 (Historical) |
2017 (Historical) |
2016 (Historical) |
|||||||||||||||
| Balance Sheet Data |
||||||||||||||||||||
| Investment in rental property, at cost |
$ | 3,756,705 | $ | 2,890,735 | $ | 2,376,141 | $ | 1,790,674 | ||||||||||||
| Investment in rental property, net |
3,501,546 | 2,683,746 | 2,227,758 | 1,684,971 | ||||||||||||||||
| Cash and cash equivalents |
14,008 | 18,612 | 9,355 | 21,635 | ||||||||||||||||
| Total assets |
3,991,788 | 3,096,797 | 2,578,756 | 1,952,054 | ||||||||||||||||
| Unsecured revolver |
303,300 | 141,100 | 273,000 | 102,000 | ||||||||||||||||
| Mortgage and notes payable, net |
112,562 | 78,952 | 67,832 | 106,686 | ||||||||||||||||
| Revolver |
1,671,511 | 1,225,773 | 836,912 | 657,891 | ||||||||||||||||
| Total liabilities |
2,263,288 | 1,567,877 | 1,294,555 | 953,517 | ||||||||||||||||
| Total Broadstone Net Lease, Inc. stockholders’ equity |
1,623,362 | 1,417,099 | 1,186,825 | 911,788 | ||||||||||||||||
| Total equity |
1,728,500 | 1,528,920 | 1,284,201 | 998,537 | ||||||||||||||||
| For the nine months ended September 30, |
For the years ended December 31, | |||||||||||||||||||||||||||
| (in thousands, except per share data) |
2019 (Pro forma) (Unaudited) |
2019 (Historical) (Unaudited) |
2018 (Historical) (Unaudited) |
2018 (Pro forma) |
2018 (Historical) |
2017 (Historical) |
2016 (Historical) |
|||||||||||||||||||||
| Other Data |
||||||||||||||||||||||||||||
| Dividend declared |
$ | 100,097 | $ | 83,367 | $ | 112,969 | $ | 92,768 | $ | 76,955 | ||||||||||||||||||
| Dividends declared per share of Common Stock |
3.95 | 3.86 | 5.15 | 4.98 | 4.91 | |||||||||||||||||||||||
| FFO1 |
122,071 | 114,188 | 150,664 | 111,434 | 80,664 | |||||||||||||||||||||||
| AFFO1 |
107,625 | 91,513 | 124,065 | 99,952 | 78,780 | |||||||||||||||||||||||
| EBITDA1 |
186,416 | 159,862 | 211,954 | 156,569 | 116,552 | |||||||||||||||||||||||
| EBITDAre1 |
173,096 | 152,303 | 203,519 | 146,185 | 110,627 | |||||||||||||||||||||||
| As of September 30, | As of December 31, | |||||||||||||||||||
| (dollars in thousands) | 2019 (Pro forma) (Unaudited) |
2019 (Historical) (Unaudited) |
2018 (Historical) |
2017 (Historical) |
2016 (Historical) |
|||||||||||||||
| Net Debt 1 |
$ | 2,052,120 | $ | 1,431,562 | $ | 1,171,371 | $ | 846,421 | ||||||||||||
| Number of properties |
662 | 621 | 528 | 417 | ||||||||||||||||
| Occupancy at period end |
99.7 | % | 99.7 | % | 99.6 | % | 98.0 | % | ||||||||||||
| 1 | See “Management’s Discussion and Analysis of Financial Condition and Results of Operations—Non-GAAP Financial Measures” for definitions of these metrics and reconciliations of these metrics to the most directly comparable GAAP measures. |
25
Table of Contents
Investing in our Class A Common Stock involves a high degree of risk. Before making an investment decision, you should carefully consider the following risk factors, together with all of the other information included in this prospectus. If any of the risks discussed in this prospectus occur, our business, financial condition, liquidity, results of operations, prospects, and our ability to service our debt and make distributions to our stockholders could be materially and adversely affected (which we refer to collectively as “materially and adversely affecting us” or having “a material adverse effect on us” and comparable phrases). In that case, the trading price of our Class A Common Stock could decline significantly and you could lose all or part of your investment. Some statements in this prospectus, including statements in the following risk factors, constitute forward-looking statements. Please refer to the section in this prospectus entitled “Forward-Looking Statements.”
Risks Related to Our Business and Properties
Single-tenant leases involve significant risks of tenant default and tenant vacancies, which could materially and adversely affect us.
Our portfolio consists primarily of single-tenant net leased properties and we are dependent on our tenants for substantially all of our revenue. As a result, our success depends on the financial stability of our tenants. The ability of our tenants to meet their obligations to us, including their obligations to pay rent, maintain certain insurance coverage, pay real estate taxes, and maintain the properties in a manner so as not to jeopardize their operating licenses or regulatory status depends on the performance of their business and industry, as well as general market and economic conditions, which are outside of our control. At any given time, any tenant may experience a downturn in its business that may weaken its operating results or the overall financial condition of individual properties or its business as whole. As a result, a tenant may fail to make rental payments when due, decline to extend a lease upon its expiration, become insolvent, or declare bankruptcy. The financial failure of, or default in payment by, a single tenant under its lease is likely to cause a significant or complete reduction in our rental revenue from that property and a reduction in the value of the property. We may also experience difficulty or a significant delay in re-leasing or selling such property. The occurrence of one or more tenant defaults could materially and adversely affect us.
This risk is magnified in situations where we lease multiple properties to a single tenant under a master lease. As of September 30, 2019, master leases contributed approximately 35.9% of our overall ABR (our largest master lease by ABR related to 25 properties and contributed 2.5% of our ABR, and our smallest master lease by ABR related to two properties and contributed 0.1% of our ABR), 73.1% of our restaurant property ABR (167 of our 254 restaurant properties), and 67.0% of our retail property ABR (85 of our 136 properties). A tenant failure or default under a master lease could reduce or eliminate rental revenue from multiple properties and reduce the value of such properties. Although the master lease structure may be beneficial to us because it restricts the ability of tenants to remove individual underperforming assets, there is no guarantee that a tenant will not default in its obligations to us or decline to renew its master lease upon expiration. The default of a tenant that leases multiple properties from us or its decision not to renew its master lease upon expiration could materially and adversely affect us.
We have limited opportunities to increase rents under our long-term leases with tenants, which could impede our growth and materially and adversely affect us.
We typically lease our properties pursuant to long-term net leases with initial terms of 10 years or more that often have renewal options. As of September 30, 2019, the weighted average remaining term of our leases was approximately 11.7 years, excluding renewal options. Substantially all of our leases provide for periodic rent escalations, but these built-in increases may be less than what we otherwise could achieve in the market. Most of our leases contain rent escalators that increase rent at a fixed amount on fixed dates, which may be less than prevailing market rates over the lease duration. For those leases that contain rent escalators based on CPI
26
Table of Contents
changes, our rent increases during periods of low inflation or deflation may be less than what we otherwise could achieve in the market. As a result, the long-term nature of our leases could impede our growth and materially and adversely affect us.
We may not be able to achieve growth through acquisitions at a rate that is comparable to our historical results, which could materially and adversely affect us.
Our growth strategy depends significantly on acquiring new properties. Since 2015, our team has acquired more than $500 million of net leased real estate each year, with approximately $1 billion during 2019. Our ability to grow requires us to identify and complete acquisitions that meet our investment criteria. Changes in capitalization rates, interest rates, competition, or other factors may negatively impact our acquisition opportunities in the future. If we are unable to achieve growth through acquisitions at a rate that is comparable to our historical results, it could materially and adversely affect us.
We may not achieve the total returns we expect from our future acquisitions, which could materially and adversely affect us.
As we pursue our growth strategy, we may encounter increasingly difficult market conditions that place downward pressure on the total returns we can achieve on our investments. Accordingly, future acquisitions may have lower yield characteristics than past and present opportunities. To the extent that our future growth is achieved through acquisitions that yield lower returns, it could materially and adversely affect us. In addition, if we fund future acquisitions with equity issuances, the dilutive impact could outweigh the benefits of acquisitions that achieve lower returns, which could materially and adversely affect us.
We may not be able to obtain acquisition financing or obtain other capital from third-party sources on favorable terms or at all, which could materially and adversely affect our growth prospects and our business.
In order to qualify as a REIT, we are required under the Code, among other things, to distribute annually at least 90% of our REIT taxable income, determined without regard to the dividends paid deduction and excluding any net capital gain. In addition, we will be subject to income tax at the corporate rate to the extent that we distribute less than 100% of our REIT taxable income, determined without regard to the dividends paid deduction and including any net capital gain. Because of these distribution requirements, we may not be able to fund future capital needs, including any necessary acquisition financing, or repay debt obligations from operating cash flow. Consequently, we expect to rely, in part, on third-party sources to fund our capital needs. We may not be able to obtain the financing on favorable terms or at all. Our access to third-party sources of capital depends, in part, on:
| • | general market conditions; |
| • | the market’s perception of our growth potential; |
| • | our current debt levels; |
| • | our current and expected future earnings; |
| • | the performance of our portfolio; |
| • | our cash flow and cash distributions; and |
| • | the market price per share of our Common Stock (including our Class A Common Stock). |
If we cannot obtain capital from third-party sources, we may not be able to acquire properties when strategic opportunities exist, meet the capital and operating needs of our existing properties, or satisfy our debt service obligations, which could materially and adversely affect us.
27
Table of Contents
Our acquisition volume may not be consistent on a quarterly basis, which may not meet investors’ expectations and could negatively impact the value of our Common Stock (including our Class A Common Stock).
Our team has acquired more than $500 million of net leased real estate every year since 2015, with approximately $1 billion during 2019. However, our acquisition volume within each year has not always been consistent on a quarterly basis. For example, for the nine months ended September 30, 2019, we completed acquisitions totaling $993.7 million, but $735.7 million of that total represented a single portfolio acquisition that we completed in the third quarter. Similar to our experience in 2019, our acquisition volume following completion of this offering may not be consistent on a quarterly basis. As a result, our acquisition results that we report on a quarterly basis may not meet investors’ expectations and could negatively impact the value of our Common Stock (including our Class A Common Stock).
Any expansion into adjacent opportunities to our core property types may prove to be unsuccessful, which could harm our growth prospects and materially and adversely affect us.
We may seek to capture adjacent opportunities to our core property types in the net lease space. Adjacent property types may not provide us with the opportunity to earn higher returns relative to more traditional assets in our core property types. In order to be successful in capturing adjacent opportunities, we will be required to carefully analyze and develop selection criteria taking into account different competitive and operating conditions. As a result, pursuing adjacent opportunities inherently involves more risk. If we are unsuccessful in identifying compelling opportunities, it could harm our growth prospects and materially and adversely affect us.
We may not be able to effectively manage our growth and any failure to do so could materially and adversely affect us.
Since 2015, we have grown rapidly, acquiring a total of $2.8 billion of net leased real estate. Our growth strategy depends significantly on continued growth through acquisitions. Our future operating results will depend on our ability to effectively manage this growth. To accomplish this, we will need to:
| • | invest in enhanced operational systems that can scale as our portfolio grows in size; |
| • | attract, integrate, and retain operations personnel as our Company grows in complexity; and |
| • | identify and supervise a number of suitable third-parties to provide services to us. |
We cannot provide any assurance that we will be able to effectively manage our growth, which could materially and adversely affect us.
As we continue to acquire properties pursuant to our growth strategy, our portfolio may become less diversified which could materially and adversely affect us.
In pursuing our growth strategy, we may acquire properties that cause our portfolio to become less diversified. If our portfolio becomes less diverse, our business may become subject to greater risk, including tenant bankruptcies, adverse industry trends, and economic downturns in a particular geographic area. As a result, if any such risks of a less diversified portfolio are realized, we could be materially and adversely affected.
We face increasing competition for acquiring properties from both publicly-traded REITs and private equity investors that have greater resources than we do, which could materially and adversely affect us.
We are facing increasing competition from other entities engaged in real estate investment activities, including publicly-traded REITs, private and institutional real estate investors, sovereign wealth funds, banks, mortgage bankers, insurance companies, investment banking firms, lenders, specialty finance companies, and other entities. Some of our competitors are larger and may have considerable greater financial, technical, leasing,
28
Table of Contents
underwriting, marketing, and other resources than we do. Some competitors may have a lower cost of capital and access to funding sources that may not be available to us. In addition, other competitors may have higher risk tolerances or different risk assessments and may not be subject to the same operating constraints, including maintaining REIT status. This competition may result in fewer acquisitions, higher prices, lower yields, less desirable property types, and acceptance of greater risk. As a result, we cannot provide any assurance that we will be able to successfully execute our growth strategy. Any failure to grow through acquisitions as a result of the increasing competition we face could materially and adversely affect us.
We face significant competition for tenants, which could materially and adversely affect our occupancy, rental rates, results of operation, and business.
We compete with numerous developers, owners, and operators of properties, many of which own properties similar to ours in the same markets in which our properties are located. If our competitors offer space at rental rates below current market rates or below the rental rates we currently charge our tenants, we may lose existing or potential tenants and we may be pressured to reduce our rental rates or to offer more substantial rent abatements, tenant improvements, early termination rights, or below-market renewal options to retain tenants when our leases expire. Competition for tenants could decrease or prevent increases of the occupancy and rental rates of our properties, which could materially and adversely affect us.
The departure of any of our current third-party manager’s key personnel with long-standing business relationships could materially and adversely affect us.
Our success and our ability to manage anticipated future growth depend, in large part, upon the efforts of key personnel of current third-party manager, particularly our Chief Executive Officer, Christopher J. Czarnecki. Mr. Czarnecki has extensive market knowledge and relationships and exercises substantial influence over our operational, financing, acquisition, and disposition activity. If we lost his services, our network of external relationships and resources would be materially diminished.
Our current third-party manager’s senior management team has worked together and collectively managed our business, operations, and portfolio since 2015 and has a strong investment track record having acquired $2.8 billion of net leased real estate since 2015. Many of our current third-party manager’s other key executive personnel, particularly our current third-party manager’s senior management team, also have extensive experience and strong reputations in the real estate industry and have been instrumental in setting our strategic direction, operating our business, identifying, recruiting, and training key personnel, and arranging necessary financing. The departure of any member of our current third-party manager’s senior management team, or our inability to attract and retain highly qualified personnel, could adversely affect our business, diminish our investment opportunities, and weaken our relationships with lenders, business partners, existing and prospective tenants, and industry personnel, which could materially and adversely affect us.
Our portfolio is concentrated in certain states, particularly Texas and Illinois, and any adverse developments and economic downturns in these geographic markets could materially and adversely affect us.
As of September 30, 2019, approximately 33.6% of our ABR came from properties in our top five states: Texas (10.5%), Illinois (6.7%), Michigan (5.7%), Florida (5.5%), and Wisconsin (5.2%). These geographic concentrations could adversely affect our operating performance if conditions become less favorable in any of the states or markets within which we have a concentration of properties. We can provide no assurance that any of our markets will grow, not experience adverse developments, or that underlying real estate fundamentals will be favorable to owners and operators of industrial, healthcare, restaurant, office, and retail properties. A downturn in the economy in the states or regions in which we have a concentration of properties, or markets within such states or regions, or a slowdown in the demand for our tenants’ businesses caused by adverse economic, regulatory, or other conditions could adversely affect our tenants operating businesses in those states and impair their ability to pay rent to us, which, in turn could materially and adversely affect us.
29
Table of Contents
Our portfolio is also concentrated in certain property types and any adverse developments relating to one or more of these property types could materially and adversely affect us.
As of September 30, 2019, approximately 43.2% of our ABR came from industrial properties, 19.5% from healthcare properties, 15.9% from restaurant properties, 9.6% from office properties, and 9.6% from retail properties. Any adverse developments in one or more of these property types could materially and adversely affect us. For example, if our retail tenants suffer weakening demand for their goods, it could adversely affect their ability to meet their rent and other obligations under their leases with us. It also may be difficult and expensive to re-tenant a property designed for a particular property type with a new tenant that operates in an industry requiring a different property type. As a result, any adverse developments in one or more of our concentrated property types could materially and adversely affect us.
The decrease in demand for restaurant and retail space may materially and adversely affect us.
As of September 30, 2019, leases representing approximately 9.6% of our ABR were with tenants in the retail industries and 15.9% of our ABR were with tenants in the restaurant industry. In the future, we may acquire additional restaurant and retail properties. Accordingly, decreases in the demand for restaurant and/or retail spaces may have a greater adverse effect on us than if we had fewer investments in these industries. The market for restaurant and retail space has been, and could continue to be, adversely affected by weakness in the national, regional, and local economies, the adverse financial condition of some large restaurant and retail companies, the ongoing consolidation in the restaurant and retail industries, and the excess amount of restaurant and retail space in a number of markets. For example, in recent years a number of companies in the restaurant industry have declared bankruptcy, gone out of business, or significantly reduced the number of their locations. As a result, we have experienced, and expect to continue to experience, challenges with some of our restaurant tenants, and have recorded asset impairments, which were immaterial on a consolidated basis, on certain assets as a result of increased credit losses.
Similarly, the ongoing impacts of the disruption in the retail industry, particularly adverse changes in consumer spending and consumer preferences for particular goods, services, or store-based retailing could severely impact retail tenants’ ability to pay rent. Shifts from in-store to online shopping could increase due to changing consumer shopping patterns and the increase in consumer adoption and use of mobile electronic devices. Further, our assessment that certain businesses are insulated from such e-commerce pressure may prove to be incorrect. To the extent that these conditions continue in the retail and restaurant industries, they are likely to negatively affect market rents for such properties and could materially and adversely affect us.
A reduction in the willingness or ability of consumers to use their discretionary income in the businesses of our tenants and potential tenants could reduce the demand for our properties, which in turn could materially and adversely affect us.
A significant portion of our portfolio is leased to tenants operating businesses at our properties that rely on discretionary consumer spending. Restaurants (including quick service and casual and family dining) represent the largest industry in our portfolio. Art Van Furniture, Red Lobster Hospitality, Jack’s Family Restaurants, Outback Steakhouse, and Krispy Kreme are among the most significant tenants in our portfolio. The success of most of these businesses depends on the willingness of consumers to use discretionary income to purchase their products or services. A downturn in the economy could cause consumers to reduce their discretionary spending, which could have an adverse impact on our tenants’ ability to successfully manage their businesses and pay us amounts due under our lease agreements, thereby materially and adversely affecting us.
If one or more of our top 20 tenants, which together represented approximately 32.3% of our ABR as of September 30, 2019, suffers a downturn in their business, it could materially and adversely affect us.
As of September 30, 2019, our top 20 tenants together represented 32.3% of our ABR. Our largest tenant is Art Van Furniture, a home furnishings store, which leases 10 properties that in the aggregate represent
30
Table of Contents
approximately 2.8% of our ABR. Our top 20 tenants may experience a material business downturn weakening their financial position resulting in their failure to make timely rent payments and/or default under their leases. As a result, our revenue and cash flow could be materially and adversely affected.
We may be unable to renew leases, re-lease properties as leases expire, or lease vacant spaces on favorable terms or at all, which, in each case, could materially and adversely affect us.
Our results of operations depend on our ability to continue to successfully lease our properties, including renewing expiring leases, re-leasing properties as leases expire, leasing vacant space, optimizing our tenant mix, or leasing properties on more economically favorable terms. As of September 30, 2019, three leases representing approximately 0.3% of our ABR will expire during 2020. Current tenants may decline, or may not have the financial resources available, to renew current leases and we cannot assure you that leases that are renewed will have terms that are as economically favorable to us as the expiring lease terms. If tenants do not renew the leases as they expire, we cannot provide any assurance that we will be able to find new tenants or that our properties will be re-leased at rental rates equal to or above the current average rental rates or that substantial rent abatements, tenant improvement allowances, early termination rights, or below-market renewal options will not be required to attract new tenants. We may experience significant costs in connection with re-leasing a significant number of our properties, which could materially and adversely affect us. As of September 30, 2019, four of our properties, representing approximately 0.2% of our total rentable square footage, were unoccupied. We may experience difficulties in leasing this vacant space on favorable terms or at all. Any failure to renew leases, re-lease properties as leases expire, or lease vacant space could materially and adversely affect us.
Our business is subject to significant re-leasing risk, particularly for specialty properties that are suitable for only one use.
The loss of a tenant, either through lease expiration or tenant bankruptcy or insolvency, may require us to spend significant amounts of capital to renovate the property before it is suitable for a new tenant and cause us to incur significant costs. In particular, our specialty properties are designed for a particular type of tenant or tenant use. If tenants of specialty properties do not renew or default on their leases, we may not be able to re-lease properties without substantial capital improvements, which may be significant. Alternatively, we may not be able to re-lease or sell the property without such improvements, or may be required to reduce the rent or selling price significantly. This potential illiquidity may limit our ability to modify quickly our portfolio in response to changes in economic or other conditions, including tenant demand. Such occurrences could materially and adversely affect us.
We may experience a higher number of tenant defaults because we lease most of our properties to unrated tenants.
We depend on the ability of our tenants to meet their obligations to pay rent to us due under our lease for substantially all of our revenue. As of September 30, 2019, only approximately 16.1% of our ABR came from tenants who had an investment grade credit rating. A substantial majority of our properties are leased to unrated tenants whom we determine, through our internal underwriting and credit analysis, to be creditworthy. Our methods may not adequately assess the risk of an investment and, if our assessment of credit quality proves to be inaccurate, we may be subject to defaults and investors may view our cash flows as less stable. The ability of an unrated tenant to meet its rent and other obligations under its lease with us may be subject to greater risk than our tenants that have an investment grade rating. If one or more of our unrated tenants defaults, it could have a material adverse effect on us.
Our underwriting and risk-management procedures that we use to evaluate a tenant’s credit risk may be faulty, deficient, or otherwise fail to accurately reflect the risk of our investment, which could materially and adversely affect us.
Our underwriting and risk-management procedures that we use to evaluate a tenant’s credit risk may not be sufficient to identify tenant problems in a timely manner or at all. To evaluate tenant credit risk, we utilize a
31
Table of Contents
third-party model, S&P Capital IQ to help us determine a tenant’s implied credit rating when a public rating is not available. However, a rating from S&P Capital IQ is not the same as a published credit rating and lacks extensive company participation that is typically involved when a rating agency publishes a rating. Therefore, such rating may not be as indicative of creditworthiness as a rating published by a nationally recognized statistical rating organization. Tenant credit ratings, public or implied, however, are only one component of how we assess the risk of tenant insolvency. We also use our own internal estimate of the likelihood of an insolvency or default, based on the regularly monitored performance of our properties, our assessment of each tenant’s financial health, including profitability, liquidity, indebtedness, and leverage profile, and our assessment of the health and performance of the tenant’s particular industry. If our assessment of credit quality proves to be inaccurate, we may experience one or more tenant defaults, which could have a material adverse effect on us.
Any failure of one or more tenants to provide accurate or complete financial information could prevent us from identifying tenant problems that could materially and adversely affect us.
We rely on information from our tenants to determine a potential tenant’s credit risk as well as for on-going risk management. As of September 30, 2019, approximately 87.7% of our ABR comes from tenants that are required to periodically provide us with specified financial information and an additional 4.1% of our tenants (based on ABR) are public companies that are required to file financial statements with the SEC, although they are not required to provide us with specified financial information under the terms of our lease. Ratings or conclusions derived from both S&P Capital IQ and our internal teams rely on such information provided to us by our tenants and prospective tenants without independent verification on our part, and we must assume the appropriateness of estimates and judgments that were made by the party preparing the financial information. A tenant’s failure to provide appropriate information may interfere with our ability to accurately evaluate a potential tenant’s credit risk or determine an existing tenant’s default risk, the occurrence of either could materially and adversely affect us.
We could face potential adverse effects from the bankruptcies or insolvencies of our tenants.
If a tenant, or the guarantor of a lease of a tenant, commences, or has commenced against it, any legal or equitable proceeding under any bankruptcy, insolvency, receivership, or other debtor’s relief statute or law (collectively, a “bankruptcy proceeding”), we may be unable to collect all sums due to us under that tenant’s lease or be forced to “take back” a property as a result of a default or a rejection of a lease by a tenant in a bankruptcy proceeding. If a tenant becomes bankrupt or insolvent, federal law may prohibit us from evicting such tenant based solely upon such bankruptcy or insolvency. In addition, a bankrupt or insolvent tenant may be authorized to reject and terminate its lease or leases with us. Any claims against such bankrupt tenant for unpaid future rent would be subject to statutory limitations that would likely result in our receipt of rental revenues that are substantially less than the contractually specified rent we are owed under the lease or leases. Any or all of the lease obligations of our tenants, or any guarantor of our tenants, could be subject to a bankruptcy proceeding which may bar our efforts to collect pre-bankruptcy debts from these entities or their properties, unless we are able to obtain an enabling order from the bankruptcy court. If our lease is rejected by a tenant in bankruptcy, we may only have a general unsecured claim against the tenant and may not be entitled to any further payments under the lease. We may also be unable to re-lease a terminated or rejected space or to re-lease it on comparable or more favorable terms. A bankruptcy proceeding could hinder or delay our efforts to collect past due balances and ultimately preclude collection of these sums, resulting in a decrease or cessation of rental payments, which could materially and adversely affect us.
Some of our customers operate under franchise or license agreements, which, if terminated or not renewed prior to the expiration of their leases with us, would likely impair their ability to pay us rent.
As of September 30, 2019, 76.9% of our restaurant property tenants operated under franchise or license agreements. Generally, franchise agreements have terms that end earlier than the respective expiration dates of the related leases. In addition, a tenant’s rights as a franchisee or licensee typically may be terminated and the
32
Table of Contents
tenant may be precluded from competing with the franchisor or licensor upon termination. Usually, we have no notice or cure rights with respect to such a termination and have no rights to assignment of any such franchise agreement. This may have an adverse effect on our ability to mitigate losses arising from a default on any of our leases. A franchisor’s or licensor’s termination or refusal to renew a franchise or license agreement would likely have a material adverse effect on the ability of the tenant to make payments under its lease, which could materially and adversely affect us.
Security breaches and other technology disruptions could compromise our information systems and expose us to liability, which could materially and adversely affect us.
Information security risks generally have increased in recent years due to the increased technological sophistication and activities of perpetrators of cyber-attacks. Our business involves the storage and transmission of numerous classes of sensitive and confidential information and intellectual property, including tenants’ information, private information about our stockholders and our employees, and financial and strategic information about us. We face risks associated with security breaches through cyber-attacks or cyber-intrusions, malware, computer viruses, attachments to e-mails, persons inside our organization or persons with access to systems inside our organization, and other significant disruptions of our IT networks and related systems. The risk of a security breach or disruption, particularly through cyber-attack or cyber-intrusion, including by computer hackers, foreign governments, and cyber terrorists, has generally increased as the number, intensity, and sophistication of attempted attacks and intrusions from around the world have increased. If we fail to assess and identify cybersecurity risks associated with our operations, we may become increasingly vulnerable to such risks. Additionally, the measures we have implemented to prevent security breaches and cyber incidents may not be effective. The theft, destruction, loss, misappropriation, or release of sensitive or confidential information or intellectual property, or interference with or disruptions of our IT networks and related systems or the technology systems of third parties on which we rely, could result in business disruption, negative publicity, brand damage, violation of privacy laws, loss of tenants, potential liability, and competitive disadvantage. Any of the above risks could materially and adversely affect us.
Changes in accounting standards may materially and adversely affect us.
From time to time the Financial Accounting Standards Board (“FASB”), and the SEC, who create and interpret appropriate accounting standards, may change the financial accounting and reporting standards or their interpretation and application of these standards that will govern the preparation of our financial statements. These changes could materially and adversely affect our reported financial condition and results of operations. In some cases, we could be required to apply a new or revised standard retroactively, resulting in restating prior period financial statements. Similarly, these changes could materially and adversely affect our tenants’ reported financial condition or results of operations and affect their preferences regarding leasing real estate.
We may acquire properties or portfolios of properties through tax deferred contribution transactions, which could result in stockholder dilution and limit our ability to sell such assets.
In the future we may acquire properties or portfolios of properties through tax deferred contribution transactions in exchange for OP Units, which may result in stockholder dilution. This acquisition structure may have the effect of, among other things, reducing the amount of tax depreciation we could deduct over the tax life of the acquired properties, and may require that we agree to protect the contributors’ ability to defer recognition of taxable gain through restrictions on our ability to dispose of the acquired properties and/or the allocation of debt to the contributors to maintain their tax bases. As of September 30, 2019, we were party to tax protection agreements covering three properties. Based on values as of September 30, 2019, taxable sales of the applicable properties would trigger liability under the agreements of approximately $12.3 million. In addition, in connection with the Internalization, we expect to enter into the Founding Owners’ Tax Protection Agreement. See “Certain Relationships and Related Party Transactions—Tax Protection Agreement.” These restrictions could limit our ability to sell certain assets or the OP (or our interest in the OP) at a time, or on terms, that would be favorable absent such restrictions.
33
Table of Contents
Certain provisions of our leases or loan agreements may be unenforceable, which could materially and adversely affect us.
Our rights and obligations with respect to the leases at our properties, mortgage loans, or other loans are governed by written agreements. A court could determine that one or more provisions of such agreements are unenforceable, such as a particular remedy, a master lease covenant, a loan prepayment provision, or a provision governing our security interest in the underlying collateral of a borrower or lessee. We could be adversely impacted if this were to happen with respect to an asset or group of assets.
We may become subject to litigation, which could materially and adversely affect us.
In the future we may become subject to litigation, including, but not limited to, claims relating to our operations, past and future securities offerings, corporate transactions, and otherwise in the ordinary course of business. Some of these claims may result in significant defense costs and potentially significant judgments against us, some of which are not, or cannot be, insured against. We generally intend to vigorously defend ourselves. However, we cannot be certain of the ultimate outcomes of any claims that may arise in the future. Resolution of these types of matters against us may result in our having to pay significant fines, judgments, or settlements, which, if uninsured, or if the fines, judgments, and settlements exceed insured levels, could adversely impact our earnings and cash flows, thereby materially and adversely affecting us. Certain litigation or the resolution of certain litigation may affect the availability or cost of some of our insurance coverage, which could materially and adversely impact us, expose us to increased risks that would be uninsured, and materially and adversely impact our ability to attract directors and officers.
A failure to maintain effective internal controls could materially and adversely affect us.
Effective internal controls over financial reporting, disclosures, and operations are necessary for us to provide reliable financial reports and public disclosures, effectively prevent fraud, and operate successfully. If we cannot provide reliable financial reports and public disclosures or prevent fraud, our reputation and operating results would be harmed. Our internal controls over financial reporting and our operating internal controls may not prevent or detect financial misstatements or loss of assets because of inherent limitations, including the possibility of human error, management override of controls, or fraud. Effective internal controls can provide only reasonable assurance with respect to financial statement accuracy, public disclosures, and safeguarding of assets. Any failure of these internal controls, including any failure to implement required new or improved controls as a result of changes to our business or otherwise, or if we experience difficulties in their implementation, could result in decreased investor confidence in the accuracy and completeness of our financial reports and public disclosures, civil litigation, or investigations by the SEC or other regulatory authorities, and we could fail to meet our reporting obligations, which could materially and adversely affect us.
A limited number of our leases may require us to pay property-related expenses that are not the obligations of our tenants, which could materially and adversely affect us.
Under the terms of substantially all of our leases, our tenants are responsible for the payment or reimbursement of property expenses such as real estate taxes, insurance, maintenance, repairs, and capital costs in addition to satisfying their rent obligations. Under the provisions of a limited number of our existing leases and leases that we may enter into in the future with our tenants, however, we may be required to pay some or all of the expenses of the property, such as the costs of environmental liabilities, roof and structural repairs, real estate taxes, insurance, certain non-structural repairs, and maintenance. If our properties incur significant expenses that must be paid by us under the terms of our leases, our business, financial condition and results of operations may be adversely affected and the amount of cash available to meet expenses and to make distributions to our stockholders and unitholders may be reduced.
34
Table of Contents
The costs of environmental contamination or liabilities related to environmental laws may materially and adversely affect us.
There may be known or unknown environmental liabilities associated with properties we previously owned, currently own, or may acquire in the future. Under various federal, state, and local laws and regulations relating to the environment, as a current or former owner or operator of real property, we may be liable for costs and damages resulting from environmental matters, including the presence or discharge of hazardous or toxic substances, waste, or petroleum products at, on, in, under or migrating from such property, including costs to investigate or clean up such contamination and liability for personal injury, property damage, or harm to natural resources. Certain uses of some properties may have a heightened risk of environmental liability because of the hazardous materials used in performing services on those properties, such as industrial properties or auto parts and auto service businesses using petroleum products, paint, machine solvents, and other hazardous materials. We typically undertake customary environmental diligence prior to our acquisition of any property, including obtaining Phase I environmental site assessments. The Phase I environmental site assessments are limited in scope and therefore may not reveal all environmental conditions affecting a property. Therefore, there could be undiscovered environmental liabilities on the properties we own.
The known or potential presence of hazardous substances on a property may adversely affect our ability to sell, lease, or improve the property, or to borrow using the property as collateral. In addition, environmental laws may create liens on contaminated properties in favor of the government for damages and costs it incurs to address such contamination. Moreover, if contamination is discovered on our properties, environmental laws may impose restrictions on the manner in which they may be used or businesses may be operated, and these restrictions may require substantial expenditures.
Our environmental liabilities may include property and natural resources damage, personal injury, investigation, and clean-up costs, among other potential environmental liabilities. These costs could be substantial. Although we may obtain insurance for environmental liability for certain properties that are deemed to warrant coverage, our insurance may be insufficient to address any particular environmental situation and we may be unable to continue to obtain insurance for environmental matters, at a reasonable cost or at all, in the future. If our environmental liability insurance is inadequate, we may become subject to material losses for environmental liabilities. Our ability to receive the benefits of any environmental liability insurance policy will depend on the financial stability of our insurance company and the position it takes with respect to our insurance policies. If we were to become subject to significant environmental liabilities, we could be materially and adversely affected.
Although our leases generally require our tenants to operate in compliance with all applicable federal, state, and local environmental laws, ordinances, and regulations, and to indemnify us against any environmental liabilities arising from the tenants’ activities on the property, we could nevertheless be subject to liability, as a current or previous owner of real estate, including strict liability, by virtue of our ownership interest and may be required to remove or remediate hazardous or toxic substances on, under, or in a property. Further, there can be no assurance that our tenants, or the guarantor of a lease, could or would satisfy their indemnification obligations under their leases. We may face liability regardless of our knowledge of the contamination, the timing of the contamination, the cause of the contamination, or the party responsible for the contamination of the property. The cost of compliance or defense against claims from a contaminated property could materially and adversely affect us.
We could become subject to liability for asbestos-containing building materials in the buildings on our property, which could cause us to incur additional expenses.
Some of our properties may contain, or may have contained, asbestos-containing building materials. Environmental, health, and safety laws require that owners or operators of or employers in buildings with asbestos-containing materials (“ACM”) properly manage and maintain these materials, adequately inform or
35
Table of Contents
train those who may come into contact with ACM, and undertake special precautions, including removal or other abatement, in the event that ACM is disturbed during building maintenance, renovation, or demolition. These laws may impose fines and penalties on employers, building owners, or operators for failure to comply with these laws. In addition, third parties may seek recovery from employers, owners, or operators for personal injury associated with exposure to asbestos. If we become subject to any of these penalties or other liabilities as a result of ACM at one or more of our properties, it could have a material adverse effect on us.
Our properties may contain or develop harmful mold or suffer from other adverse conditions, which could lead to liability for adverse health effects and costs of remediation.
When excessive moisture accumulates in buildings or on building materials, mold growth may occur, particularly if the moisture problem remains undiscovered or is not addressed over a period of time. Some molds may produce airborne toxins or irritants. Indoor air quality issues also can stem from inadequate ventilation, chemical contamination from indoor or outdoor sources and other biological contaminants such as pollen, viruses, and bacteria. Indoor exposure to airborne toxins or irritants above certain levels can be alleged to cause a variety of adverse health effects and symptoms, including allergic or other reactions. As a result, the presence of significant mold or other airborne contaminants at any of our properties could require us to undertake a costly remediation program to contain or remove the mold or other airborne contaminants from the affected property or increase indoor ventilation. In addition, the presence of significant mold or other airborne contaminants could expose us to liability from our tenants, employees of our tenants, and others if property damage or personal injury occurs. Thus, conditions related to mold or other airborne contaminants could have a material adverse effect on us.
Risks Related to Investments in Real Estate
Our operating results are affected by economic and regulatory changes that impact the commercial real estate market in general.
Our core business is the ownership of commercial real estate that is net leased on a long-term basis to businesses in the industrial, healthcare, restaurant, office, and retail sectors. Accordingly, our performance is subject to risks generally attributable to the ownership of commercial real property, including:
| • | inability to collect rents from tenants due to financial hardship, including bankruptcy, financial difficulties, or lease defaults by tenants; |
| • | changes in global, national, regional, or local economic, demographic, or real estate market conditions in the markets in which we operate, including the supply and demand for single-tenant space in the industrial, healthcare, restaurant, office, and retail sectors; |
| • | increased competition for real property investments targeted by our investment strategy; |
| • | changes in consumer trends and preferences that affect the demand for products and services offered by our tenants; |
| • | inability to lease or sell properties upon expiration or termination of existing leases and renewal of leases at lower rental rates; |
| • | the subjectivity of real estate valuations and changes in such valuations over time; |
| • | the illiquid nature of real estate compared to most other financial assets; |
| • | changes in laws, government rules, regulations, and fiscal policies, including changes in tax, real estate, environmental, and zoning laws; |
| • | changes in interest rates and availability of financing, including changes in the terms of available financing such as more conservative loan-to-value requirements and shorter debt maturities; |
| • | unexpected expenditures relating to physical or weather-related damage to properties; |
36
Table of Contents
| • | the potential risk of functional obsolescence of properties over time; |
| • | acts of terrorism and war; |
| • | acts of God and other factors beyond our control; and |
| • | competition from other properties. |
The factors described above are out of our control, and we are unable to predict future changes in such factors. Any negative changes in these factors may cause the value of our real estate to decline, which could materially and adversely affect us.
Global market and economic conditions may materially and adversely affect us and the ability of our tenants to make rental payments to us pursuant to our leases.
Our results of operations are sensitive to changes in the overall economic conditions that impact our tenants’ financial condition and leasing practices. Adverse economic conditions such as high unemployment levels, interest rates, tax rates, and fuel and energy costs may have an impact on the results of operations and financial conditions of our tenants. During periods of economic slowdown, rising interest rates and declining demand for real estate may result in a general decline in rents or an increased incidence of defaults under existing leases. A lack of demand for rental space could adversely affect our ability to maintain our current tenants and gain new tenants, which may affect our growth and results of operations. Accordingly, a decline in economic conditions could materially and adversely affect us.
Our real estate investments are illiquid.
Because real estate investments are relatively illiquid, our ability to adjust our portfolio promptly in response to economic, financial, investment, or other conditions may be limited. Return of capital and realization of gains, if any, from an investment generally will occur upon disposition or refinancing of the underlying property. We may be unable to realize our investment objective by sale, other disposition, or refinancing at attractive prices within any given period of time, or may otherwise be unable to complete any exit strategy. In particular, these risks could arise from weakness in or even the lack of an established market for a property, changes in the financial condition or prospects of prospective purchasers, changes in national or international economic conditions, and changes in laws, regulations, or fiscal policies of the jurisdiction in which the property is located. Further, certain significant expenditures generally do not change in response to economic or other conditions, such as (i) debt service, (ii) real estate taxes, and (iii) operating and maintenance costs. The inability to dispose of a property at an acceptable price or at all, as well as the combination of variable revenue and relatively fixed expenditures may result, under certain market conditions, in reduced earnings and could have an adverse effect on our financial condition.
Inflation may materially and adversely affect us and our tenants.
Increased inflation could lead to interest rate increases that could have a negative impact on variable rate debt we currently have or that we may incur in the future. During times when inflation is greater than the increases in rent provided by many of our leases, rent increases will not keep up with the rate of inflation. Increased costs may have an adverse impact on our tenants if increases in their operating expenses exceed increases in revenue, which may adversely affect the tenants’ ability to pay rent owed to us, which in turn could materially and adversely affect us.
Natural disasters, terrorist attacks, other acts of violence or war, or other unexpected events could materially and adversely impact us.
Natural disasters, terrorist attacks, other acts of violence or war, or other catastrophic events (e.g., hurricanes, floods, earthquakes, or other types of natural disasters or wars or other acts of violence) could cause
37
Table of Contents
damage to our properties, materially interrupt our business operations (or those of our tenants), cause consumer confidence and spending to decrease, or result in increased volatility in the U.S. and worldwide financial markets and economy. Such occurrences also could result in or prolong an economic recession in the United States. We own properties in regions that have historically been impacted by natural disasters and it is probable such regions will continue to be impacted by such events. If a disaster occurs, we could suffer a complete loss of capital invested in, and any profits expected from, the affected properties. Any of these occurrences could materially and adversely affect us.
We face risks associated with climate change, which could materially and adversely impact us.
As a result of climate change, our properties in certain markets could experience increases in storm intensity, flooding, drought, wildfires, rising sea levels, and extreme temperatures. The potential physical impacts of climate change on our properties are uncertain and would be particular to the geographic circumstances in areas in which we own property. Over time, these conditions could result in volatile or decreased demand for certain of our properties or, in extreme cases, the inability of our tenants to operate the properties at all. Climate change may also have indirect effects on our business by increasing the cost of insurance (or making insurance unavailable), increasing the cost of energy at our properties, or requiring us to spend funds to repair and protect our properties against such risks. Moreover, compliance with new laws or regulations related to climate change, including compliance with “green” building codes or other laws or regulations relating to reduction of carbon footprints and/or greenhouse gas emissions, may require us to make improvements to our existing properties or increase taxes and fees assessed on us or our properties. Any of these occurrences could materially and adversely impact us.
Insurance on our properties may not adequately cover all losses and uninsured losses could materially and adversely affect us.
Our tenants are required to maintain comprehensive insurance coverage for the properties they lease from us pursuant to our net leases. Pursuant to such leases, our tenants are required to name us (and any of our lenders that have a mortgage on the property leased by the tenant) as additional insureds on their liability policies and additional named insured and/or loss payee (or mortgagee, in the case of our lenders) on their property policies. All tenants are required to maintain casualty coverage and most carry limits at 100% of replacement cost. Depending on the location of the property, losses of a catastrophic nature, such as those caused by earthquakes and floods, may be covered by insurance policies that are held by our tenant with limitations such as large deductibles or co-payments that a tenant may not be able to meet. In addition, losses of a catastrophic nature, such as those caused by wind/hail, hurricanes, terrorism, or acts of war, may be uninsurable or not economically insurable. In the event there is damage to our properties that is not covered by insurance and such properties are subject to recourse indebtedness, we will continue to be liable for the indebtedness, even if these properties are irreparably damaged. In addition, if uninsured damages to a property occur or a loss exceeds policy limits and we do not have adequate cash to fund repairs, we may be forced to sell the property at a loss or to borrow capital to fund the repairs.
Inflation, changes in building codes and ordinances, environmental considerations, and other factors, including terrorism or acts of war, may make any insurance proceeds we receive insufficient to repair or replace a property if it is damaged or destroyed. In that situation, the insurance proceeds received may not be adequate to restore our economic position with respect to the affected real property. Furthermore, in the event we experience a substantial or comprehensive loss of one of our properties, we may not be able to rebuild such property to its existing specifications without significant capital expenditures which may exceed any amounts received pursuant to insurance policies, as reconstruction or improvement of such a property would likely require significant upgrades to meet zoning and building code requirements. The loss of our capital investment in or anticipated future returns from our properties due to material uninsured losses could materially and adversely affect us.
38
Table of Contents
Our costs of compliance with laws and regulations may reduce the investment return of our stockholders.
All real property and the operations conducted on real property are subject to numerous federal, state, and local laws and regulations. We cannot predict what laws or regulations will be enacted in the future, how future laws or regulations will be administered or interpreted, or how future laws or regulations will affect us or our properties, including, but not limited to, environmental laws and regulations and the Americans with Disabilities Act (“ADA”). Compliance with new laws or regulations, or stricter interpretation of existing laws, may require us or our tenants to incur significant expenditures, impose significant liability, restrict or prohibit business activities, and could cause a material adverse effect on us.
Compliance with the ADA may require us to make unanticipated expenditures that materially and adversely affect us.
Our properties are subject to the ADA. Under the ADA, all public accommodations must meet federal requirements related to access and use by disabled persons. Compliance with the ADA requirements could require removal of access barriers and non-compliance could result in imposition of fines by the U.S. government or an award of damages to private litigants, or both. While our tenants are obligated by law to comply with the ADA and typically obligated under our leases to cover costs associated with compliance, if required changes involve greater expenditures than anticipated or if the changes must be made on a more accelerated basis than anticipated, the ability of our tenants to cover costs could be adversely affected. We could be required to expend our own funds to comply with the provisions of the ADA, which could materially and adversely affect us.
Compliance with fire, safety, environmental, and other regulations may require us to make unanticipated expenditures that materially and adversely affect us.
We are required to operate our properties in compliance with fire and safety regulations, building codes, environmental regulations, and other land use regulations, as they may be adopted by governmental agencies and bodies and become applicable to our properties. We may be required to make substantial capital expenditures to comply with those requirements and may be required to obtain approvals from various authorities with respect to our properties, including prior to acquiring a property or when undertaking improvements of any of our existing properties. There can be no assurance that existing laws and regulatory policies will not adversely affect us or the timing or cost of any future acquisitions or improvements, or that additional regulations will not be adopted that increase such delays or result in additional costs. Additionally, failure to comply with any of these requirements could result in the imposition of fines by governmental authorities or awards of damages to private litigants. While we intend to only acquire properties that we believe are currently in substantial compliance with all regulatory requirements, these requirements may change and new requirements may be imposed which would require significant unanticipated expenditures by us and could materially and adversely affect us.
Risks Related to Debt Financing
As of September 30, 2019, on a pro forma basis, we had approximately $ billion principal balance of indebtedness outstanding, which may expose us to the risk of default under our debt obligations.
As of September 30, 2019, on a pro forma basis, we had an approximately $ billion principal balance of indebtedness outstanding. We have incurred, and plan to incur in the future, financing through borrowings under term loans, senior notes, our Revolving Credit Facility, and mortgage loans secured by some or all of our properties. In some cases, the mortgage loans we incur are guaranteed by us, the OP, or both. We may also borrow funds if necessary to satisfy the requirement that we distribute to stockholders as dividends at least 90% of our annual REIT taxable income (computed without regard to the dividends paid deduction and our net capital gains), or otherwise as is necessary or advisable to assure that we maintain our qualification as a REIT for U.S. federal income tax purposes. Payments of principal and interest on borrowings may leave us with insufficient cash resources to meet our cash needs or make the distributions to our common stockholders currently
39
Table of Contents
contemplated or necessary to qualify as a REIT qualification. Our level of debt and the limitations imposed on us by our debt agreements could have significant adverse consequences, including the following:
| • | our cash flow may be insufficient to meet our required principal and interest payments; |
| • | cash interest expense and financial covenants relating to our indebtedness, including a covenant in our Revolving Credit Facility that restricts us from paying distributions if an event of default exists, other than distributions required to maintain our REIT status, may limit or eliminate our ability to make distributions to our common stockholders; |
| • | we may be unable to borrow additional funds as needed or on favorable terms, which could, among other things, adversely affect our ability to capitalize upon investment opportunities or meet operational needs; |
| • | we may be unable to refinance our indebtedness at maturity or the refinancing terms may be less favorable than the terms of our original indebtedness; |
| • | because a portion of our debt bears interest at variable rates, increases in interest rates could increase our interest expense; |
| • | we may be unable to hedge floating rate debt, counterparties may fail to honor their obligations under any hedge agreements we enter into, such agreements may not effectively hedge interest rate fluctuation risk, and, upon the expiration of any hedge agreements we enter into, we would be exposed to then-existing market rates of interest and future interest rate volatility; |
| • | we may be forced to dispose of properties, possibly on unfavorable terms or in violation of certain covenants to which we may be subject; |
| • | we may default on our obligations and the lenders or mortgagees may foreclose on our properties or our interests in the entities that own the properties that secure their loans and receive an assignment of rents and leases; |
| • | we may be restricted from accessing some of our excess cash flow after debt service if certain of our tenants fail to meet certain financial performance metric thresholds; |
| • | we may violate restrictive covenants in our loan documents, which would entitle the lenders to accelerate our debt obligations; and |
| • | our default under any loan with cross default provisions could result in a default on other indebtedness. |
The occurrence of any of these events could materially and adversely affect us. Furthermore, foreclosures could create taxable income without accompanying cash proceeds, which could hinder our ability to meet the REIT distribution requirements imposed by the Code.
Disruptions in the financial markets and deteriorating economic conditions could adversely affect our ability to obtain debt financing on commercially reasonable terms and adversely impact our ability to implement our investment strategy and achieve our investment objectives.
The United States and global financial markets have experienced significant volatility and disruption in the past. During the mid-2000’s, there was a widespread tightening in overall credit markets, devaluation of the assets underlying certain financial contracts, and increased borrowing by governmental entities. The turmoil in the capital markets resulted in constrained equity and debt capital available for investment in the real estate market, resulting in fewer buyers seeking to acquire properties, increases in capitalization rates, and lower property values. Recently, capital has been more available, and the overall economy has improved. However, the failure of a sustained economic recovery or future disruptions in the financial markets and deteriorating economic conditions could make financing terms for borrowers less attractive, and potentially result in the unavailability of various types of debt financing, as well as impact the value of our investments in properties. If
40
Table of Contents
sufficient sources of external financing are not available to us on cost effective terms, we could be forced to limit our planned business activities or take other actions to fund our business activities and repayment of debt such as selling assets or reducing our cash distributions. Uncertainty in the credit markets also could negatively impact our ability to make acquisitions, make it more difficult or impossible for us to sell properties, or may adversely affect the price we receive for properties that we do sell, as prospective buyers may experience increased costs of debt financing or difficulties in obtaining debt financing.
Market conditions could adversely affect our ability to refinance existing indebtedness on acceptable terms or at all, which could materially and adversely affect us.
We use external financing to refinance indebtedness as it matures and to partially fund our acquisitions. Credit markets may experience significant price volatility, displacement, and liquidity disruptions, including the bankruptcy, insolvency, or restructuring of certain financial institutions. As a result, we may be unable to fully refinance maturing indebtedness with new indebtedness, which could materially and adversely affect us. Furthermore, if prevailing interest rates or other factors at the time of refinancing result in higher interest rates upon refinancing, then the interest expense relating to that refinanced indebtedness would increase. Higher interest rates on newly incurred debt may negatively impact us as well. If interest rates increase, our interest costs and overall costs of capital will increase, which could materially and adversely affect us and our ability to make distributions to our stockholders.
We may incur mortgage debt on a particular property, which may subject us to certain risks, and the occurrence of any such risk could materially and adversely affect us.
We may incur mortgage debt on a particular property, especially if we believe the property’s projected cash flow is sufficient to service the mortgage debt. In addition, incurring mortgage debt may increase the risk of loss since defaults on indebtedness secured by a property may result in foreclosure actions initiated by lenders and our loss of the property securing the loan that is in default. For tax purposes, a foreclosure of any of our properties would be treated as a sale of the property for a purchase price equal to the outstanding balance of the debt secured by the mortgage. If the outstanding balance of the debt secured by the mortgage exceeds our tax basis in the property, we would recognize taxable income on foreclosure but would not receive any of the proceeds. We may give full or partial guarantees to lenders to the OP or its affiliates. If we give a guaranty on behalf of the OP, we will be responsible to the lender for satisfaction of the debt if it is not paid by the OP. If any mortgages contain cross-collateralization or cross-default provisions, there is a risk that more than one of our real properties may be affected by a default. If any of our properties are foreclosed upon due to a default, we could be materially and adversely affected.
An inability to refinance existing mortgage debt as it matures could materially and adversely affect us.
Since the mortgage loans secured by certain of our properties amortize over a period longer than their maturity, we will owe substantial amounts of principal on the maturity of such loans. If we cannot refinance these loans on favorable terms, more of our cash from operations may be required to service the loans, properties may have to be sold to fund principal repayments, or properties may be lost to foreclosure, which could materially and adversely affect us.
Failure to hedge effectively against interest rate changes may materially and adversely affect us.
To reduce our exposure to variable-rate debt, we enter into interest rate swap agreements to fix the rate of interest as a hedge against interest rate fluctuations on floating-rate debt. These arrangements involve risks and may not be effective in reducing our exposure to interest rate changes. In addition, the counterparties to any hedging arrangements we enter into may not honor their obligations. Failure to hedge effectively against changes in interest rates relating to the interest expense of our future floating-rate borrowings may materially and adversely affect us.
41
Table of Contents
Our Revolving Credit Facility and term loan agreements contain various covenants which, if not complied with, could accelerate our repayment obligations, thereby materially and adversely affecting us.
We are subject to various financial and operational covenants and financial reporting requirements pursuant to the agreements we have entered into governing our Revolving Credit Facility, term loans, and senior notes. These covenants require us to, among other things, maintain certain financial ratios, including leverage, fixed charge coverage, and debt service coverage, among others. As of September 30, 2019, we were in compliance with all of our loan covenants. Our continued compliance with these covenants depends on many factors and could be impacted by current or future economic conditions, and thus there are no assurances that we will continue to comply with these covenants. Failure to comply with these covenants would result in a default which, if we were unable to cure or obtain a waiver from the lenders, could accelerate our repayment obligations and thereby have a material and adverse impact on us.
Further, these covenants, as well as any additional covenants to which we may be subject in the future because of additional borrowings, could cause us to forego investment opportunities, reduce or eliminate distributions to our common stockholders, or obtain financing that is more expensive than financing we could obtain if we were not subject to the covenants. Additionally, these restrictions may adversely affect our operating and financial flexibility and may limit our ability to respond to changes in our business or competitive environment, all of which may materially and adversely affect us.
Failure to maintain our current credit rating could materially and adversely affect our cost of capital, liquidity, and access to capital markets.
The spread we pay over London Interbank Offered Rate (“LIBOR”) for our unsecured credit facilities is determined based upon our credit rating. In March 2016, Moody’s assigned the OP an investment grade credit rating of Baa3 with a stable outlook, which was re-affirmed most recently in August 2019. The rating is based on a number of factors, including an assessment of our financial strength, portfolio size and diversification, credit and operating metrics, and sustainability of cash flow and earnings. If we are unable to maintain our current credit rating it could adversely affect our cost of capital, liquidity, and access to capital markets. Factors that could negatively impact our credit rating include, but are not limited to: a significant increase in our leverage on a sustained basis; a significant increase in the proportion of secured debt levels; a significant decline in our unencumbered asset base; and a significant decline in our portfolio diversification.
We may be adversely affected by changes in LIBOR reporting practices or the method in which LIBOR is determined.
As of September 30, 2019, on a pro forma basis, we had approximately $ million of debt outstanding for which the interest rate was tied to LIBOR. Additionally, as of September 30, 2019, on a pro forma basis, we had entered into interest rate swaps totaling $ that fix the LIBOR component of our debt through various tenors. On July 27, 2017, the Financial Conduct Authority (the “FCA”) that regulates LIBOR announced its intention to cease sustaining LIBOR after 2021. It is not possible to predict the effect of the FCA’s announcement, and there is currently no definitive information regarding the future utilization of LIBOR, including any changes in the methods by which LIBOR is determined, the frequency in which LIBOR is determined and published, or any other reforms to the determination and publication of LIBOR, or a potential transition from LIBOR to a successor benchmark. As such, the potential effect of any such event on our cost of capital cannot yet be determined and any changes to benchmark interest rates could increase our financing costs, which could impact our results of operations and cash flows.
The Alternative Reference Rates Committee (“ARRC”) has identified the Secured Overnight Financing Rate (“SOFR”) as its preferred alternative rate for USD LIBOR in derivatives and other financial contracts. We are not able to predict whether LIBOR will cease to be available after 2021 or whether SOFR will replace LIBOR as the market benchmark. Any changes adopted by FCA or other governing bodies in the method used
42
Table of Contents
for determining LIBOR may result in a sudden or prolonged increase or decrease in reported LIBOR. If that were to occur, our interest payments could change. In addition, uncertainty about the extent and manner of future changes may result in interest rates and/or payments that are higher or lower than if LIBOR were to remain available in its current form.
We are monitoring and evaluating the related risks which arise in connection with transitioning contracts to a new alternative rate, including any resulting value transfer that may occur. While we expect LIBOR to be available in substantially its current form until the end of 2021, it is possible that it will become unavailable prior to that point. This could result, for example, if sufficient banks decline to make submissions to the LIBOR administrator. In that case, the risks associated with the transition to an alternative reference rate will be accelerated and magnified. We are in the process of reviewing our long-term debt agreements and interest rate swap contracts to identify those that do not contain fallback language to identify alternate interest rate indices that could be substituted for LIBOR should it be discontinued. All but one of our variable-rate term loan agreements contain such provisions. We plan to ensure that appropriate fallback language is included in future loan and swap contracts executed between now and 2021, and to amend existing contracts that extend beyond 2021 as necessary.
Risks Related to Our Organizational Structure
Our Charter contains provisions, including ownership and transfer restrictions, that may delay, discourage, or prevent a takeover or change of control transaction that could otherwise result in a premium price to our stockholders.
Our Charter contains various provisions that are intended to facilitate our qualification as a REIT. For example, our Charter restricts the direct or indirect ownership by one person or entity to no more than 9.8% of the value of our then outstanding shares of capital stock and no more than 9.8% of the value or number of shares, whichever is more restrictive, of our then outstanding Common Stock (including our Class A Common Stock) unless exempted by our board of directors. This restriction may discourage a change of control of us and may deter individuals or entities from making tender offers for shares of our Common Stock (including our Class A Common Stock) on terms that might be financially attractive to stockholders or which may cause a change in our management. In addition to deterring potential change of control transactions that may be favorable to our stockholders, these provisions may also decrease our stockholders’ ability to sell their shares of our Common Stock (including our Class A Common Stock). As a result, these charter provisions may negatively impact the market price of our Common Stock (including our Class A Common Stock).
We may issue preferred stock or separate classes or series of Common Stock, the issuance of which could adversely affect the holders of our Common Stock (including our Class A Common Stock).
Upon completion of this offering, our Charter will authorize us to issue up to 520,000,000 shares of stock, and our board of directors, without any action by our stockholders, may amend our Charter from time to time to increase or decrease the aggregate number of shares or the number of shares of any class or series of stock that we have authority to issue. Holders of shares of our Common Stock (including our Class A Common Stock) do not have preemptive rights to acquire any shares issued by us in the future.
In addition, our board of directors may classify or reclassify any unissued shares of our Common Stock (including our Class A Common Stock) or preferred stock and establish the preferences, rights, and powers of any such stock. As a result, our board of directors could authorize the issuance of preferred stock or separate classes or series of Common Stock with terms and conditions that could have priority, with respect to distributions and amounts payable upon our liquidation, over the rights of our Common Stock (including our Class A Common Stock). The issuance of shares of such preferred or separate classes or series of Common Stock could dilute the value of an investment in shares of our Common Stock (including our Class A Common Stock). The issuance of shares of preferred stock or a separate class or series of Common Stock could provide the holders
43
Table of Contents
thereof with specified dividend payments and payments upon liquidation prior or senior to those of the Common Stock (including our Class A Common Stock), and could also have the effect of delaying, discouraging, or preventing a change in control of us, including an extraordinary transaction (such as a merger, tender offer, or sale of all or substantially all of our assets) that might provide a premium price for holders of our Common Stock (including our Class A Common Stock).
Termination of the Employment Agreements with certain members of our senior management team that will become effective upon the Internalization could be costly and prevent a change in control of our company.
The Employment Agreements with certain members of our senior management team that will become effective upon the Internalization provide that if their employment with us terminates under certain circumstances (including in connection with a change in control of our Company), we may be required to pay them significant amounts of severance compensation, thereby making it costly to terminate their employment. Furthermore, these provisions could delay or prevent a transaction or a change in control of our Company that might involve a premium paid for shares of our Common Stock (including our Class A Common Stock) or otherwise be in the best interests of our stockholders.
We may experience adverse consequences as a result of the Internalization.
We expect to close the proposed Internalization in the first quarter of 2020, through which we will acquire the entities that currently perform advisory and management services for us. The Internalization will involve the termination of contractual arrangements with BRE, the onboarding of employees by us, and the assumption of contractual relationships and integration of services by us. There is no guarantee that the Internalization will be successful or achieve the results in the timeframe we expect or at all. In addition, as a self-managed REIT, we may encounter unforeseen costs, expenses, and difficulties associated with providing these services on a self-advised basis, which may materially adversely affect us.
Our ability to recover any loss that we may suffer as a result of the Internalization may be limited.
On November 11, 2019, we, the OP, BRE, certain of BRE’s shareholders, and other related parties entered into the Merger Agreement relating to the Internalization. The Merger Agreement contained customary representations and warranties, including representations from BRE regarding, among other things, its organization, capitalization, operations, taxes, employee matters, and liabilities. The representations and warranties of the parties in the Merger Agreement will not survive the closing of the Internalization and any alleged inaccuracies in or breaches of these representations and warranties, including those made by BRE to us, will not serve as the basis for any post-closing indemnification claims. We purchased a representations and warranties insurance policy against which we will be able to make claims in the event that the representations and warranties of BRE or other parties to us prove to have been inaccurate. The insurance policy is subject to exceptions and limitations, and there can be no assurance that we would be able to successfully recover any loss that we may suffer arising from a breach of a representation or warranty under the Merger Agreement, and as a result, we may be materially adversely affected.
Our board of directors may change our investment and financing policies without stockholder approval, which could materially and adversely alter the nature of an investment in us.
The methods of implementing our investment policies and strategy may vary as new real estate development trends emerge, new investment techniques are developed, and market conditions evolve. Our investment and financing policies are exclusively determined by our board of directors and senior management team. Accordingly, our stockholders do not control these policies. Further, our organizational documents do not limit the amount or percentage of indebtedness, funded or otherwise, that we may incur. Although we are not required to maintain a particular leverage ratio, we generally intend to maintain on a sustained basis a level of net debt that is generally less than six times our annualized adjusted EBITDAre. However, from time to time, our ratio of net debt to our annualized adjusted EBITDAre may exceed six times. Our board of directors may alter or
44
Table of Contents
eliminate our current policy on borrowing at any time without stockholder approval. If this policy changed, we could become more highly leveraged, which could result in an increase in our debt service costs and obligations. Higher leverage also increases the risk of default on our obligations. In addition, a change in our investment policies, including the manner in which we allocate our resources across our portfolio or the types of assets in which we seek to invest, may increase our exposure to interest rate risk, real estate market fluctuations, and liquidity risk. Changes to our policies with regard to the foregoing could materially and adversely affect us.
Our rights and the rights of our stockholders to take action against our directors and officers are limited.
Maryland law provides that a director of a Maryland corporation will not have any liability in that capacity if he or she performs his or her duties in accordance with the applicable standard of conduct. Our Charter limits the liability of our directors and officers to us and our stockholders for money damages to the maximum extent permitted by Maryland law. Therefore, our directors and officers are subject to monetary liability resulting only from:
| • | actual receipt of an improper benefit or profit in money, property, or services; or |
| • | active and deliberate dishonesty by the director or officer that was established by a final judgment as being material to the cause of action adjudicated. |
As a result, we and our stockholders have rights against our directors and officers that are more limited than might otherwise exist. Accordingly, in the event that actions taken by any of our directors or officers impede the performance of our Company, your and our ability to recover damages from such director or officer will be limited. Our Charter and Second Amended and Restated Bylaws also require us to indemnify and advance expenses to our directors and our officers for losses they may incur by reason of their service in those capacities subject to any limitations under Maryland law or in our Charter. Moreover, we have entered into separate indemnification agreements with each of our directors and executive officers. As a result, we and our stockholders may have more limited rights against these persons than might otherwise exist under common law, which could reduce our stockholders’ and our recovery against such persons. In addition, we may be obligated to fund the defense costs incurred by these persons in some cases, which would reduce the cash available for distributions.
We are a holding company with no direct operations and rely on funds received from the OP to pay liabilities.
We are a holding company and conduct substantially all of our operations through the OP. We do not have, apart from an interest in the OP, any independent operations. As a result, we rely on distributions from the OP to pay any distributions we might declare on shares of our Common Stock (including our Class A Common Stock). We will also rely on distributions from the OP to meet any of our obligations, including any tax liability on taxable income allocated to us from the OP. In addition, because we are a holding company, your claims as stockholders are structurally subordinated to all existing and future liabilities and obligations (whether or not for borrowed money) of the OP and its subsidiaries. Therefore, in the event of our bankruptcy, liquidation, or reorganization, our assets and those of the OP and its subsidiaries will be able to satisfy the claims of our stockholders only after all of our and the OP and its subsidiaries’ liabilities and obligations have been paid in full.
Our UPREIT structure may result in potential conflicts of interest between the interests of our stockholders and members in the OP, which may materially and adversely impede business decisions that could benefit our stockholders.
Conflicts of interest could arise in the future as a result of the relationships between us and our affiliates, on the one hand, and the OP or any future member thereof, on the other. Our directors and officers have duties to our Company under applicable Maryland law in connection with the management of our Company. At the same time, we, as the managing member of the OP, will have fiduciary duties and obligations to the OP and its members under New York law and the limited liability company agreement of the OP in connection with the management of the OP. Our fiduciary duties and obligations, as the managing member of the OP, and its members may come into conflict with the duties of our directors and officers to our Company.
45
Table of Contents
While we intend to avoid situations involving conflicts of interest, there may be situations in which the interests of the OP may conflict with the interests of us. Our activities specifically authorized by or described in the OP Agreement may be performed by us and will not, in any case or in the aggregate, be deemed a breach of the OP Agreement or any duty owed by us to the OP or any member. In exercising our authority under the OP Agreement, we may, but are under no obligation to, take into account the tax consequences of any member of any action we take. We and the OP have no liability to a non-managing member under any circumstances as a result of an income tax liability incurred by such non-managing member as a result of an action (or inaction) by us pursuant to our authority under the OP Agreement.
The OP Agreement provides that the managing member will not be liable to the OP, its members, or any other person bound by the OP Agreement for monetary damages for losses sustained, liabilities incurred, or benefits not derived by the OP or any member, except for liability for the member’s gross negligence or willful misconduct. Moreover, the OP Agreement provides that the OP is required to indemnify the managing member, its affiliates, and certain related persons, and any manager, officer, stockholder, director, member, employee, representative, or agent of the managing member or its affiliates from and against any and all claims that relate to the operations of the OP, except if (1) the act was committed in bad faith, (ii) the act was the result of active and deliberate dishonesty and was material to the cause of action involved, or (iii) it personally gained in fact a financial income or other advantage to which it was not entitled under law.
We are an “emerging growth company,” and we cannot be certain if the reduced SEC reporting requirements applicable to emerging growth companies will make our Common Stock (including our Class A Common Stock) less attractive to investors, which could make the market price and trading volume of our Common Stock (including our Class A Common Stock) be more volatile and decline significantly.
We are an “emerging growth company” as defined in the Jumpstart Our Business Startups Act (the “JOBS Act”). We will remain an “emerging growth company” until the earliest to occur of (i) the last day of the fiscal year during which our total annual revenue equals or exceeds $1.07 billion (subject to adjustment for inflation), (ii) the last day of the fiscal year following the fifth anniversary of this offering, (iii) the date on which we have, during the previous 36-month period, issued more than $1 billion in non-convertible debt securities, or (iv) the date on which we are deemed to be a “large accelerated filer” under the Securities and Exchange Act of 1934, as amended (the “Exchange Act”). We intend to take advantage of exemptions from various reporting requirements that are applicable to most other public companies, whether or not they are classified as “emerging growth companies,” including, but not limited to, an exemption from the provisions of Section 404(b) of the Sarbanes-Oxley Act of 2002 (“Sarbanes-Oxley”) requiring that our independent registered public accounting firm provide an attestation report on the effectiveness of our internal control over financial reporting. An attestation report by our auditor would require additional procedures by them that could detect problems with our internal control over financial reporting that are not detected by management. If our system of internal control over financial reporting is not determined to be appropriately designed or operating effectively, it could require us to restate financial statements, cause us to fail to meet reporting obligations, and cause investors to lose confidence in our reported financial information, all of which could lead to a significant decline in the market price of our Common Stock (including our Class A Common Stock). The JOBS Act also provides that an “emerging growth company” can take advantage of the extended transition period provided in the Securities Act of 1933, as amended (the “Securities Act”), for complying with new or revised accounting standards. However, we have chosen to “opt out” of this extended transition period and, as a result, we will comply with new or revised accounting standards on or prior to the relevant dates on which adoption of such standards is required for all public companies that are not emerging growth companies. Our decision to opt out of the extended transition period for complying with new or revised accounting standards is irrevocable. We cannot predict if investors will find our Common Stock or our Class A Common Stock, as applicable, less attractive because we intend to rely on certain of these exemptions and benefits under the JOBS Act. If some investors find our Common Stock or Class A Common Stock, as applicable, less attractive as a result, there may be a less active, liquid, and/or orderly trading market for our Common Stock (including our Class A Common Stock) and the market price and trading volume of our Common Stock (including our Class A Common Stock) may be more volatile and decline significantly.
46
Table of Contents
The value of an investment in our Common Stock (including our Class A Common Stock) may be reduced if we are required to register as an investment company under the Investment Company Act of 1940, as amended (the “Investment Company Act”) and, if we are subject to registration under the Investment Company Act, we will not be able to continue our business.
Neither we, the OP, nor any of our subsidiaries intend to register as an investment company under the Investment Company Act. If we were obligated to register as an investment company, we would have to comply with a variety of substantive requirements under the Investment Company Act that would impose significant and onerous limitations on our operations, as well as require us to comply with various reporting, record keeping, voting, proxy disclosure, and other rules and regulations that would significantly alter our operations and significantly increase our operating expenses.
We believe that we, the OP, and most of the subsidiaries of the OP will not fall within the definition of investment company under Section 3(a)(1) of the Investment Company Act as we intend to invest primarily in real property through our wholly or majority-owned subsidiaries. Accordingly, we believe that we, the OP, and its subsidiaries will be primarily engaged in the non-investment company business of such subsidiaries and therefore will not fall within the aforementioned definition of investment company.
To ensure that neither we nor any of our subsidiaries, including the OP, are required to register as an investment company, each entity may be unable to sell assets that it would otherwise want to sell and may need to sell assets that it would otherwise wish to retain. In addition, we, the OP, or our subsidiaries may be required to acquire additional income- or loss-generating assets that we might not otherwise acquire or forego opportunities to acquire interests in companies that we would otherwise want to acquire. Although we, the OP, and our subsidiaries intend to monitor our portfolio periodically and prior to each acquisition and disposition, any of these entities may not be able to remain outside the definition of investment company or maintain an exclusion from the definition of investment company. If we, the OP, or our subsidiaries are required to register as an investment company but fail to do so, the unregistered entity would be prohibited from engaging in our business, and criminal and civil actions could be brought against such entity. In addition, the contracts of such entity would be unenforceable unless a court required enforcement, and a court could appoint a receiver to take control of the entity and liquidate its business.
U.S. Federal Income Tax Risks
Failure to qualify as a REIT would materially and adversely affect us and the value of our Common Stock (including our Class A Common).
We elected to qualify to be taxed as a REIT under Sections 856 through 860 of the Code and the applicable U.S. Treasury regulations, beginning with our taxable year ended December 31, 2008. We believe that we have been organized and operated in a manner to qualify for taxation as a REIT for U.S. federal income tax purposes commencing with such year, and we intend to continue operating in such a manner. However, we cannot assure you that we have qualified as a REIT, or that we will remain qualified as such in the future. If we lose our REIT status, we will face significant tax consequences that would substantially reduce our cash available for distribution to our stockholders for each of the years involved because:
| • | we would not be allowed a deduction for distributions to stockholders in computing our taxable income and would be subject to U.S. federal income tax at the corporate rate; |
| • | we also could be subject to the federal alternative minimum tax for taxable years beginning before January 1, 2018, and increased state and local taxes; |
| • | unless we are entitled to relief under applicable statutory provisions of the Code, we could not elect to be taxed as a REIT for four taxable years following the year during which qualification was lost; and |
| • | for the five years following re-election of REIT status, upon a taxable disposition of an asset owned as of such re-election, we would be subject to corporate level tax with respect to any built-in gain inherent in such asset at the time of re-election. |
47
Table of Contents
Any such corporate tax liability could be substantial and would reduce our cash available for, among other things, our operations and distributions to stockholders. In addition, if we fail to qualify as a REIT, we will not be required to make distributions to our stockholders. If this occurs, we may need to borrow funds or liquidate some of our properties in order to pay any applicable taxes. As a result of all these factors, our failure to qualify as a REIT also could impair our ability to execute our growth strategy and raise capital, and could materially and adversely affect the trading price of our Common Stock (including our Class A Common Stock).
Qualification as a REIT involves the application of technical and complex Code provisions for which there are only limited judicial and administrative interpretations. The determination of various factual matters and circumstances not entirely within our control may affect our ability to qualify as a REIT. In order to qualify as a REIT, we must satisfy a number of requirements, including requirements regarding the ownership of our stock, requirements regarding the composition of our assets and a requirement that at least 95% of our gross income in any year must be derived from qualifying sources, such as “rents from real property.” Also, we must make distributions to stockholders aggregating annually at least 90% of our REIT taxable income, computed without regard to the dividends paid deduction and our net capital gains. In addition, legislation, new regulations, administrative interpretations, or court decisions may materially and adversely affect our investors, our ability to qualify as a REIT for U.S. federal income tax purposes, or the desirability of an investment in a REIT relative to other investments.
Even if we remain qualified as a REIT for U.S. federal income tax purposes, we may be subject to other tax liabilities that reduce our cash flow and our ability to make distributions to our stockholders.
Even if we remain qualified as a REIT for U.S. federal income tax purposes, we may still be subject to some U.S. federal, state, and local income, property, and excise taxes on our income or property. For example:
| • | In order to qualify as a REIT, we must distribute annually at least 90% of our REIT taxable income to our stockholders (computed without regard to the dividends paid deduction and our net capital gain), and to the extent that we satisfy the distribution requirement but distribute less than 100% of our REIT taxable income, we will be subject to U.S. federal corporate income tax on the undistributed income. |
| • | If we should fail to distribute, or fail to be treated as having distributed, with respect to each calendar year at least the sum of (i) 85% of our REIT ordinary income for such year, (ii) 95% of our REIT capital gain net income for such year (other than capital gain income we elect to retain and pay tax on), and (iii) any undistributed taxable income from prior periods, we would be subject to a 4% nondeductible excise tax on the excess of such required distribution over the sum of (a) the amounts actually distributed and (b) the amounts we retained and upon which we paid income tax at the corporate level. |
| • | If we have (i) net income from the sale or other disposition of “foreclosure property” that is held primarily for sale to customers in the ordinary course of business or (ii) other non-qualifying net income from foreclosure property, we will be subject to tax at the U.S. federal corporate income tax rate on such income. To the extent that income from “foreclosure property” is otherwise qualifying income for purposes of the 75% gross income test, this tax is not applicable. |
| • | If we have net income from prohibited transactions (which are, in general, certain sales or other dispositions of property held primarily for sale to customers in the ordinary course of business, other than sales of foreclosure property and sales that qualify for a statutory safe harbor), such income will be subject to a 100% tax. |
| • | We may be subject to tax on gain recognized in a taxable disposition of assets acquired by way of a carryover basis transaction, when such gain is recognized on a disposition of an asset during a 5-year period beginning on the date on which we acquired the asset. To the extent of any “built-in gain,” such gain will be subject to U.S. federal income tax at the federal corporate income tax rate. Built-in gain means the excess of (i) the fair market value of the asset as of the beginning of the applicable |
48
Table of Contents
| recognition period over (ii) our adjusted basis in such asset as of the beginning of such recognition period. |
| • | We may perform additional, non-customary services for tenants of our buildings through a taxable REIT subsidiary (“TRS”), including real estate or non-real estate related services; however, any earnings that exceed allowable limits related to such services are subject to federal and state income taxes. |
In addition, TRSs will be subject to tax as regular corporations in the jurisdictions in which they operate.
If the OP fails to qualify as a partnership for U.S. federal income tax purposes, we would cease to qualify as a REIT and suffer other adverse consequences.
We believe that the OP will be treated as a partnership for U.S. federal income tax purposes. As a partnership, the OP would generally not be subject to U.S. federal income tax on its income. Instead, for U.S. federal income tax purposes, if the OP is treated as a partnership, each of its partners, including us, would be allocated, and may be required to pay tax with respect to, such partner’s share of its income. The OP may be required to determine and pay an imputed underpayment of tax (plus interest and penalties) resulting from an adjustment of the OP’s items of income, gain, loss, deduction, or credit at the partnership level. We cannot assure you that the IRS will not challenge the status of the OP or any other subsidiary partnership in which we own an interest as a disregarded entity or partnership for U.S. federal income tax purposes, or that a court would not sustain such a challenge. If the IRS were successful in treating the OP or any such other subsidiary partnership as an entity taxable as a corporation for U.S. federal income tax purposes, we would fail to meet the gross income tests and certain of the asset tests applicable to REITs and, accordingly, we would likely cease to qualify as a REIT. Also, the failure of the OP or any subsidiary partnerships to qualify as a disregarded entity or partnership could cause it to become subject to U.S. federal and state corporate income tax, which would reduce significantly the amount of cash available for debt service and for distribution to its partners, including us.
To satisfy the REIT distribution requirements, we may be forced to take certain actions to raise funds if we have insufficient cash flow which could materially and adversely affect us and the trading price of our Common Stock (including our Class A Common Stock).
To qualify as a REIT, we generally must distribute to our stockholders at least 90% of our REIT taxable income each year, computed without regard to the dividends paid deduction and our net capital gains, and we will be subject to corporate income tax on our undistributed taxable income to the extent that we distribute less than 100% of our REIT taxable income each year, computed without regard to the dividends paid deduction. In addition, we will be subject to a 4% nondeductible excise tax on the amount, if any, by which distributions paid by us in any calendar year are less than the sum of 85% of our ordinary income, 95% of our capital gain net income and 100% of our undistributed income from prior years. In order to satisfy these distribution requirements to maintain our REIT status and avoid the payment of income and excise taxes, we may need to take certain actions to raise funds if we have insufficient cash flow, such as borrowing funds, raising additional equity capital, selling a portion of our assets or finding another alternative to make distributions to our stockholders. We may be forced to take those actions even if the then-prevailing market conditions are not favorable for those actions. This situation could arise from, among other things, differences in timing between the actual receipt of cash and recognition of income for U.S. federal income tax purposes, or the effect of non-deductible capital expenditures or other non-deductible expenses, the creation of reserves, or required debt or amortization payments. Such actions could increase our costs and reduce the value of our Common Stock (including our Class A Common Stock). These sources, however, may not be available on favorable terms or at all. Our access to third-party sources of capital depends on a number of factors, including the market’s perception of our growth potential, our current debt levels, the market price of our Common Stock (including our Class A Common Stock), and our current and potential future earnings. We cannot assure you that we will have access to such capital on favorable terms at the desired times, or at all, which may cause us to curtail our investment
49
Table of Contents
activities and/or to dispose of assets at inopportune times, and could materially and adversely affect us and the trading price of our Common Stock (including our Class A Common Stock).
Further, to qualify as a REIT, we must also satisfy tests on an ongoing basis concerning, among other things, the sources of our income, nature of our assets, and the amounts we distribute to our stockholders. We may be required to make distributions to stockholders at times when it would be more advantageous to reinvest cash in our business or when we do not have funds readily available for distribution. Compliance with the REIT Requirements (as defined below in “Material U.S. Federal Income Tax Considerations—Taxation of our Company”) may hinder our ability to operate solely on the basis of maximizing profits.
The IRS may treat sale-leaseback transactions as loans, which could jeopardize our REIT status or require us to make an unexpected distribution.
We may purchase properties and lease them back to the sellers of such properties. The IRS may take the position that certain of these sale-leaseback transactions that we treat as leases are not “true leases” but are, instead, financing arrangements or loans for U.S. federal income tax purposes.
If a sale-leaseback transaction were so re-characterized, we might fail to satisfy the REIT asset tests, the income tests, or distribution requirements and consequently lose our REIT status effective with the year of re-characterization unless we elect to make an additional distribution to maintain our REIT status. The primary risk relates to the disallowance of deductions for depreciation and cost recovery relating to such property, which could affect the calculation of our REIT taxable income and could cause us to fail the REIT distribution requirement that requires a REIT to distribute at least 90% of its REIT taxable income, computed without regard to the dividends paid deduction and any net capital gain. In this circumstance, we may elect to distribute an additional dividend of the increased taxable income so as not to fail the REIT distribution test. This distribution would be paid to all stockholders at the time of declaration rather than the stockholders existing in the taxable year affected by the re-characterization.
Our stockholders may have current tax liability on distributions based on an election to reinvest in our Common Stock (or Class A Common Stock, as applicable).
A stockholder who participates in our distribution reinvestment plan will be deemed to have received, and for income tax purposes will be taxed on, the amount reinvested in shares of our Common Stock (or Class A Common Stock, as applicable) to the extent the amount reinvested was not a tax-free return of capital. As a result, unless a stockholder is a tax-exempt entity, the investor may have to use funds from other sources to pay the investor’s tax liability on the value of the shares of Common Stock (or Class A Common Stock, as applicable) received.
Dividends payable by REITs do not qualify for the reduced tax rates available for some dividends.
The maximum U.S. federal income tax rate applicable to income from “qualified dividends” payable to U.S. stockholders that are individuals, trusts, and estates is 20%. Ordinary dividends payable by REITs, however, generally are not eligible for the 20% rate applicable to “qualified dividends” except to the extent the REIT dividends are attributable to “qualified dividends” received by the REIT itself or generally attributable to income upon which we (or a predecessor) have paid U.S. federal corporate income tax. However, for non-corporate U.S. stockholders, ordinary dividends payable by REITs that are not designated as capital gain dividends or otherwise treated as “qualified dividends” generally are eligible for a deduction of 20% of the amount of such ordinary REIT dividends, for taxable years beginning before January 1, 2026. More favorable rates will nevertheless continue to apply for regular corporate “qualified dividends.” Although these rules do not adversely affect the taxation of REITs or dividends payable by REITs, to the extent that the 20% rate continues to apply to regular corporate qualified dividends, investors who are individuals, trusts and estates may regard investments in REITs to be relatively less attractive than investments in the stocks of non-REIT corporations.
50
Table of Contents
The tax imposed on REITs engaging in “prohibited transactions” may limit our ability to engage in transactions which would be treated as sales for U.S. federal income tax purposes.
A REIT’s net income from prohibited transactions is subject to a 100% penalty tax. In general, prohibited transactions are sales or other dispositions of property, other than foreclosure property, held primarily for sale to customers in the ordinary course of business. Although we do not intend to hold any properties that would be characterized as held for sale to customers in the ordinary course of our business, unless a sale or disposition qualifies under certain statutory safe harbors, such characterization is a factual determination and no guarantee can be given that the IRS would agree with our characterization of our properties or that we will always be able to make use of the available safe harbors.
Complying with the REIT Requirements may limit our ability to hedge effectively and may cause us to incur tax liabilities.
The REIT provisions of the Code substantially limit our ability to hedge our assets and liabilities. Any income from a hedging transaction that we enter into to manage the risk of interest rate changes with respect to borrowings made or to be made to acquire or carry real estate assets, or from certain terminations of such hedging positions, does not constitute “gross income” for purposes of the 75% or 95% gross income tests that apply to REITs, provided that certain identification requirements are met. To the extent that we enter into other types of hedging transactions or fail to properly identify such transaction as a hedge, the income is likely to be treated as non-qualifying income for purposes of the 75% and 95% gross income tests. See “Material U.S. Federal Income Tax Considerations.” As a result of these rules, we may be required to limit our use of advantageous hedging techniques or implement those hedges through a TRS. This could increase the cost of our hedging activities because any TRS in which we own an interest may be subject to tax on gains or expose us to greater risks associated with changes in interest rates than we would otherwise want to bear. In addition, losses in any TRS in which we own an interest will generally not provide any tax benefit, except that such losses could theoretically be carried forward against future taxable income in such TRS.
Complying with the REIT Requirements may force us to liquidate or forgo otherwise attractive investments.
To qualify as a REIT, we must continually satisfy tests concerning, among other things, the nature and diversification of our assets, the sources of our income, and the amounts we distribute to our stockholders. See “Material U.S. Federal Income Tax Considerations.” In connection with the Internalization, we will be treated as having acquired substantial amounts of goodwill that may not qualify for the 75% asset test. Compliance with these limitations, particularly given the goodwill that we acquire in the Internalization, may hinder our ability to make, and, in certain cases, maintain ownership of certain attractive investments that might not qualify for the 75% asset test. If we fail to comply with the REIT asset test requirements at the end of any calendar quarter, we must correct the failure within 30 days after the end of the calendar quarter or qualify for certain statutory relief provisions to avoid losing our REIT qualification and suffering adverse tax consequences. As a result, we may be required to liquidate or forgo otherwise attractive investments in order to satisfy the asset and income tests or to qualify under certain statutory relief provisions. These actions could have the effect of reducing our income, increasing our income tax liability, and reducing amounts available for distribution to our stockholders. In addition, we may be required to make distributions to stockholders at disadvantageous times or when we do not have funds readily available for distribution, and may be unable to pursue investments (or, in some cases, forego the sale of such investments) that would be otherwise advantageous to us in order to satisfy the REIT Requirements. Accordingly, satisfying the REIT Requirements could materially and adversely affect us. Moreover, if we are compelled to liquidate our investments to meet any of these asset, income, or distribution tests, or to repay obligations to our lenders, we may be unable to comply with one or more of the requirements applicable to REITs or may be subject to a 100% tax on any resulting gain if such sales constitute prohibited transactions.
51
Table of Contents
In certain circumstances, we may be liable for certain tax obligations of certain of the members of the OP.
In certain circumstances, we may be liable for tax obligations of certain of the members of the OP. In connection with certain UPREIT transactions, we have entered or will enter into tax protection agreements under which we have agreed to indemnify members of the OP against adverse tax consequences if we were to sell, convey, transfer, or otherwise dispose of our assets in taxable transactions, with specific exceptions and limitations. Pursuant to the tax protection agreements, we have also agreed to ensure that such members of the OP are allocated minimum amounts of the OP’s indebtedness. If we fail to meet our obligations under the tax protection agreements, we may be required to reimburse those members of the OP for the amount of the tax liabilities they incur, subject to certain limitations. We may enter into additional tax protection agreements in the future in connection with other UPREIT transactions. Although it may be in our stockholders’ best interest that we sell a property, it may be economically disadvantageous for us to do so because of these obligations. In order to limit our exposure to a tax obligation, our use of proceeds from any sales or dispositions of certain properties will be limited. With respect to the existing tax protection agreements with property contributors (excluding the Internalization), as of September 30, 2019, our potential indemnification obligation for the taxable sale of those properties is approximately $12.3 million.
In connection with the Internalization, we will enter into the Founding Owners’ Tax Protection Agreement, pursuant to which we have agreed to indemnify the Founding Owners against certain tax liabilities resulting from: (1) the sale, exchange, transfer, conveyance, or other disposition of the assets of BRE that we will acquire in the Internalization (the “Contributed Property”) in a taxable transaction prior to , 2030; and (2) our failure to offer the Founding Owners the opportunity to guarantee specific types of the OP’s indebtedness in order to enable them to continue to defer certain tax liabilities. Our maximum liability under the Founding Owners’ Tax Protection Agreement is capped at $10 million. The aggregate built-in gain on the Contributed Property that would be allocable to the Founding Owners is estimated to be approximately million.
The Blocker Corp Mergers may have adverse tax consequences.
As a general matter, notwithstanding that we qualify to be taxed as a REIT for U.S. federal income tax purposes, if we acquire appreciated assets from a non-REIT C corporation in a transaction in which the adjusted tax basis of the assets in its hands is determined by reference to the adjusted tax basis of the assets in the hands of the C corporation, we will be subject to entity-level tax on any gain recognized in connection with a disposition (such as a taxable sale) of any such assets during the 5-year period following such acquisition. In addition, in order to qualify as a REIT, we must not have, at the end of any taxable year, any earnings and profits accumulated in a non-REIT year.
Because each of Trident BRE Holdings I, Inc. and Trident BRE Holdings II, Inc. (the “Blocker Corps”) are taxable as a non-REIT C corporation and we will acquire their appreciated assets in connection with the Internalization in transactions (the “Blocker Corp Mergers”) in which the adjusted tax basis of the assets in our hands will be determined by reference to the adjusted tax basis of the assets in the hands of each of the Blocker Corps prior to the Blocker Corp Mergers, we will be subject to corporate income tax on the “built-in gain” with respect to the Blocker Corps’ assets at the time of the Blocker Corp Mergers if we dispose of those assets in a taxable transaction within five years following the Blocker Corp Mergers. This built-in gain is measured by the difference between the value of the Blocker Corps’ assets at the time of the Blocker Corp Mergers and the adjusted basis in those assets. We estimate this built-in gain to be approximately million. The assets of the Blocker Corps we will acquire in the Blocker Corp Mergers are the Blocker Corps’ interests in BRE. When those interests in BRE are contributed by us to the OP in exchange for OP Units and BRE is merged into the OP in tax-deferred transactions, the built-in gain associated with the Blocker Corps’ assets will be represented as part of an intangible asset on our balance sheet. The disposition of that intangible asset in a taxable transaction within five years following the Blocker Corp Mergers could trigger a corporate income tax on that built-in gain. The most likely transaction in which that intangible asset is disposed of would be a sale of the OP (or our interest in the OP) in a taxable transaction. Thus, if the OP (or our interest in the OP) is sold in a taxable transaction within
52
Table of Contents
five years following the Blocker Corp Mergers, we could incur a corporate income tax on approximately million of built-in gain.
Because the Blocker Corps are each taxable as a regular C corporation, we will succeed to any earnings and profits accumulated by the Blocker Corps for taxable periods prior to and including the Blocker Corp Mergers, referred to as “C corporation earnings and profits.” To qualify as a REIT, we cannot have any C corporation earnings and profits at the end of any taxable year. We estimate the C corporation earnings and profits of the Blocker Corps to be approximately $ million in total at the time of the Blocker Corp Mergers and we expect to utilize a nationally recognized accounting firm to prepare a study to assist management in confirming that calculation. During 2020, we expect to make sufficient distributions in excess of our earnings and profits (including the C corporation earnings and profits from the Blocker Corps) so we will not have to pay a special dividend to eliminate such C corporation earnings and profits. In effect, the inclusion of the C corporation earnings and profits from the Blocker Corps will increase the portion of our distributions during 2020 that are taxable as dividends. However, if we were determined to succeed to more C corporation earnings and profits as a result of the Blocker Corp Mergers or we were to have less distributions than expected during 2020, we may have to pay a special dividend and/or employ applicable deficiency dividend procedures to eliminate such earnings and profits. If we need to make a special dividend or pay a deficiency dividend and do not otherwise have cash on hand to do so, we may need to (i) sell assets at unfavorable prices, (ii) borrow on unfavorable terms, (iii) distribute amounts that would otherwise be invested in future acquisitions, capital expenditures, or repayment of debt, or (iv) make a taxable distribution of Common Stock (or Class A Common Stock, as applicable) as part of a distribution in which stockholders may elect to receive Common Stock (or Class A Common Stock, as applicable) or cash (subject to a limit measured as a percentage of the total distribution), in order to comply with REIT Requirements. These alternatives could increase our costs or reduce our equity. In addition, if we were to rely upon the remedial deficiency dividend procedures, we would be required to pay interest based on the amount of any such deficiency dividends.
In addition to the foregoing, as a result of the Blocker Corp Mergers, we will inherit any liability with respect to unpaid taxes of each of the Blocker Corps for any periods prior to the Blocker Corp Mergers.
Changes to the U.S. federal income tax laws, including the recent enactment of certain tax reform measures, could have a material and adverse effect on us.
The rules dealing with U.S. federal income taxation are constantly under review by persons involved in the legislative process and by the IRS and the U.S. Department of the Treasury, which may result in revisions to regulations and interpretations in addition to statutory changes. No assurance can be given as to whether, or in what form, any proposals affecting REITs or their stockholders will be enacted.
In particular, H.R. 1, commonly referred to as the Tax Cuts and Jobs Act (the “TCJA”), for which only limited guidance has been issued to date, significantly reforms the Code with respect to the taxation of both individuals and corporate entities, and there are numerous interpretive issues and ambiguities that are not yet clearly addressed, which require further guidance, including possibly in some cases, technical corrections. It is unclear if and when such guidance will be forthcoming, or in the case of technical corrections, will be enacted. Future regulatory guidance and legislation may significantly affect the impact of the TCJA. Changes to the U.S. federal tax laws and interpretations thereof could adversely affect an investment in our Common Stock (including our Class A Common Stock).
There may also be future changes in federal tax laws, regulations, rules, and judicial and administrative interpretations applicable to us and our business, the effect of which cannot be predicted. Our stockholders and prospective investors are urged to consult with their own tax advisors with respect to the TCJA and the status of other legislative, regulatory, or administrative developments and proposals and their potential effect on an investment in shares of our Class A Common Stock.
53
Table of Contents
Risks Related to this Offering and Ownership of Our Common Stock (Including Our Class A Common Stock)
There has been no public market for our Common Stock (including our Class A Common Stock) prior to this offering and an active trading market for our Common Stock (including our Class A Common Stock) may not develop following this offering.
Prior to this offering, there has been no public market for our Common Stock or our Class A Common Stock, and there can be no assurance that an active trading market will develop or be sustained or that shares of our Class A Common Stock (or Common Stock, following the Class A Conversion) will be resold at or above the initial public offering price. We intend to apply to have our Class A Common Stock listed on the NYSE upon completion of this offering, and to have our Common Stock listed effective as of the Class A Conversion. The initial public offering price of our Class A Common Stock will be determined by agreement among us and the underwriters, but there can be no assurance that our Class A Common Stock, or Common Stock, as applicable, will not trade below the initial public offering price following the completion of this offering. See “Underwriting.” The initial public offering price will not necessarily bear any relationship to our book value, assets, or financial condition; the prices at which we previously sold our Common Stock in private offerings; or any other established criteria of value and may not be indicative of the market price for our Common Stock or our Class A Common Stock after this offering. The price at which our Common Stock or our Class A Common Stock trades after the completion of this offering and the price at which our Common Stock trades following the Class A Conversion may be lower than the price at which the underwriters sell Class A Common Stock in this offering. The market value of our Common Stock or our Class A Common Stock could be substantially affected by general market conditions, including the extent to which a secondary market develops for our Common Stock or our Class A Common Stock in the future, the extent of institutional investor interest in us, the general reputation of REITs and the attractiveness of their equity securities in comparison to other equity securities (including securities issued by other real estate-based companies), our financial performance, and general stock and bond market conditions. If a robust public market for our Common Stock or our Class A Common Stock does not develop, you may have difficulty selling shares of our Common Stock or our Class A Common Stock, as applicable, which could adversely affect the price that you receive for such shares.
The market price and trading volume of shares of our Common Stock (including our Class A Common Stock) may be volatile following this offering.
The market price of shares of our Class A Common Stock and Common Stock following the Class A Conversion may fluctuate. In addition, the trading volume in shares of our Common Stock and Class A Common Stock, as applicable, may fluctuate and cause significant price variations to occur. Historically, these changes frequently appear to occur without regard to the operating performance of the affected companies. Hence, the price of our Common Stock and our Class A Common Stock, as applicable, could fluctuate based upon factors that have little or nothing to do with us in particular. If the market price of shares of our Common Stock and our Class A Common Stock, as applicable, declines significantly, you may be unable to resell your shares of our Common Stock or Class A Common Stock, as applicable, at or above the public offering price. We cannot assure you that the market price of shares of our Class A Common Stock or Common Stock following the Class A Conversion will not fluctuate or decline significantly, including a decline below the public offering price, in the future.
Some of the factors that could negatively affect our share price or result in fluctuations in the market price or trading volume of shares of our Common Stock (including our Class A Common Stock) include:
| • | actual or anticipated declines in our quarterly operating results or distributions; |
| • | changes in government regulations; |
| • | changes in laws affecting REITs and related tax matters; |
| • | the announcement of new contracts by us or our competitors; |
54
Table of Contents
| • | reductions in our FFO, AFFO, or earnings estimates; |
| • | publication of research reports about us or the real estate industry; |
| • | increases in market interest rates that lead purchasers of shares of our Common Stock or our Class A Common Stock to demand a higher yield; |
| • | the Class A Conversion, pursuant to which our existing Common Stock will become listed on the NYSE and freely tradeable, and the expiration or early release of the lock-up agreements entered into with the underwriters by certain parties described elsewhere in this prospectus under “Shares Eligible for Future Sale—Lock-up Agreements”; |
| • | future equity issuances, or the perception that they may occur, including issuances of Common Stock upon exercise or vesting of equity awards or redemption of OP units; |
| • | changes in market valuations of similar companies; |
| • | adverse market reaction to any increased indebtedness we incur in the future; |
| • | additions or departures of key management personnel; |
| • | actions by institutional stockholders; |
| • | differences between our actual financial and operating results and those expected by investors and analysts; |
| • | changes in analysts’ recommendations or projections; |
| • | speculation in the press or investment community; and |
| • | the realization of any of the other risk factors presented in this prospectus. |
In the past, securities class action litigation has often been instituted against companies following periods of volatility in the price of their common stock. This type of litigation could result in substantial costs and divert our management’s attention and resources, which could have a material adverse effect on our cash flows, our ability to execute our business strategy, and our ability to make distributions to our stockholder.
We may not be able to make distributions to our stockholders at the times or in the amounts we expect, or at all.
We intend to make cash distributions to our stockholders in amounts such that all or substantially all of our taxable income in each year, subject to adjustments, is distributed. However, we may not be able to continue to generate sufficient cash flow from our properties to permit us to make the distributions we expect. Our ability to continue to make distributions in the future may be adversely affected by the risk factors described in this prospectus. We can provide no assurance that we will be able to make or maintain distributions and certain agreements relating to our indebtedness may, under certain circumstances, limit or eliminate our ability to make distributions to our common stockholders. For instance, our Revolving Credit Facility contains provisions that restrict us from paying distributions if an event of default exists, other than distributions required to maintain our REIT status. We can give no assurance that rents from our properties will increase, or that future acquisitions of real properties or other investments will increase our cash available for distributions to stockholders. In addition, any distributions will be authorized at the sole discretion of our board of directors, and their form, timing, and amount, if any, will depend upon a number of factors, including our actual and projected results of operations, FFO, AFFO, liquidity, cash flows and financial condition, the revenue we actually receive from our properties, our operating expenses, our debt service requirements, our capital expenditures, prohibitions and other limitations under our financing arrangements, our REIT taxable income, the annual REIT distribution requirements, applicable law, and such other factors as our board of directors deems relevant.
Distributions are expected to be based upon our FFO, AFFO, financial condition, cash flows and liquidity, debt service requirements, and capital expenditure requirements for our properties. If we do not have sufficient
55
Table of Contents
cash available for distributions, we may need to fund the shortage out of working capital or borrow to provide funds for such distributions, which would reduce the amount of proceeds available for real estate investments and increase our future interest costs. Our inability to make distributions, or to make distributions at expected levels, could result in a decrease in trading price of our Class A Common Stock or Common Stock following the Class A Conversion.
We may change the dividend policy for our Common Stock (including our Class A Common Stock) in the future.
The decision to declare and pay dividends on our Common Stock (including our Class A Common Stock), as well as the form, timing, and amount of any such future dividends, will be at the sole discretion of our board of directors and will depend on our earnings, cash flows, liquidity, financial condition, capital requirements, contractual prohibitions or other limitations under our indebtedness, the annual distribution requirements under the REIT provisions of the Code, state law, and such other factors as our board of directors considers relevant. Any change in our dividend policy could have a material adverse effect on the market price of our Common Stock (including our Class A Common Stock).
Increases in market interest rates may result in a decrease in the value of shares of our Common Stock (including our Class A Common Stock).
One of the factors that will influence the price of shares of our Common Stock (including our Class A Common Stock) will be the distribution yield on shares of our Common Stock (including our Class A Common Stock) (as a percentage of the price of shares of our Common Stock (including our Class A Common Stock)) relative to market interest rates. An increase in market interest rates, which are currently at low levels relative to historical rates, may lead prospective purchasers of shares of our Common Stock (including our Class A Common Stock) to expect a higher distribution yield and higher interest rates would likely increase our borrowing costs and potentially decrease funds available for distribution. Thus, higher market interest rates could cause the per share trading price of our Common Stock (including our Class A Common Stock) to decrease.
This offering is expected to be dilutive to earnings, and there may be future dilution to earnings related to shares of our Common Stock (including our Class A Common Stock).
On a pro forma basis, we expect that this offering will have a dilutive effect on our expected earnings per share and FFO per share. The actual amount of dilution cannot be determined at this time and will be based upon numerous factors. The market price of shares of our Common Stock (including our Class A Common Stock) could decline as a result of issuances or sales of a large number of shares of our Common Stock (including our Class A Common Stock) in the market after this offering or the perception that such issuances or sales could occur. Additionally, future issuances or sales of substantial amounts of shares of our Common Stock (including our Class A Common Stock) may be at prices below the initial public offering price of the shares of our Class A Common Stock offered by this prospectus and may result in further dilution in our earnings and FFO per share and/or materially and adversely impact the per share trading price of our Common Stock (including our Class A Common Stock). See “Dilution.”
Future offerings of debt, which would be senior to shares of our Common Stock (including our Class A Common Stock) upon liquidation, and/or preferred equity securities that may be senior to shares of our Common Stock (including our Class A Common Stock) for purposes of distributions or upon liquidation, may materially and adversely affect the market price of shares of our Common Stock (including our Class A Common Stock).
In the future, we may attempt to increase our capital resources by making additional offerings of debt or preferred equity securities (or causing the OP to issue debt securities). Upon liquidation, holders of our debt securities and preferred stock and lenders with respect to other borrowings will receive distributions of our
56
Table of Contents
available assets prior to our stockholders. Additionally, any convertible or exchangeable securities that we issue in the future may have rights, preferences, and privileges more favorable than those of our Common Stock (including our Class A Common Stock) and may result in dilution to owners of our Common Stock (including our Class A Common Stock). Our stockholders are not entitled to preemptive rights or other protections against dilution. Our preferred stock, if issued, could have a preference on liquidating distributions or a preference on distribution payments that could limit our right to make distributions to our stockholders. Because our decision to issue securities in any future offering will depend on market conditions and other factors beyond our control, we cannot predict or estimate the amount, timing, or nature of our future offerings. Our stockholders bear the risk of our future offerings reducing the per share trading price of our Common Stock (including our Class A Common Stock).
Sales of substantial amounts of our Common Stock (including our Class A Common Stock) in the public markets, or the perception that they might occur, or the pending Class A Conversion could reduce the price of our Common Stock (including our Class A Common Stock).
Upon the completion of this offering, we expect to have outstanding a total of shares of our Common Stock (including our Class A Common Stock), or shares if the underwriters exercise in full their option to purchase additional shares. Prior to this offering, neither our Class A Common Stock nor our Common Stock was listed on any national securities exchange and the ability of stockholders to liquidate their investments was limited. Additionally, our share redemption program was terminated as of January 10, 2020. As a result, there may be increased demand to sell shares of our Common Stock upon the Class A Conversion, at which time shares of our Common Stock owned by the continuing investors will be listed on the NYSE and freely tradable. A large volume of sales of shares (or short sales) of our Common Stock (or our Class A Common Stock prior to the Class A Conversion) could decrease the prevailing market price of our Common Stock or our Class A Common Stock and could impair our ability to raise additional capital through the sale of equity securities in the future. Even if a substantial number of sales of our Common Stock or our Class A Common Stock are not effected, the mere perception of the possibility of these sales could depress the market price of our Common Stock or our Class A Common Stock and have a negative effect on our ability to raise capital in the future.
The shares of our Class A Common Stock that we are selling in this offering may be resold immediately in the public market unless they are held by “affiliates,” as that term is defined in Rule 144 of the Securities Act. The Common Stock and OP Units expected to be issued as consideration in connection with the Internalization will be “restricted securities” within the meaning of Rule 144 under the Securities Act and may not be sold in the absence of registration under the Securities Act unless an exemption from registration is available, including the exemptions contained in Rule 144. The Trident Owners and the Founding Owners (as well as our directors and officers) have agreed, subject to certain exceptions, not to sell or otherwise dispose of any of their Common Stock (including any Class A Common Stock) or OP Units (which may be exchanged for our Common Stock) from the date of this prospectus continuing through the date 180 days after the date of this prospectus, except with the underwriters’ prior written consent. As a result of the Registration Rights Agreement, however, all of these shares, including Common Stock that may be issued in exchange for OP Units, may be eligible for future sale without restriction, subject to applicable lock-up arrangements. See “Shares Eligible for Future Sale—Registration Rights” and “Certain Relationships and Related Transactions—Registration Rights Agreement.” Sales of a substantial number of such shares upon expiration of the lock-up agreements, the perception that such sales may occur, or early release of these agreements, could cause the market price of our Common Stock or our Class A Common Stock to fall or make it more difficult for you to sell your Class A Common Stock (or your Common Stock, as applicable) at a time and price that you deem appropriate.
Sales of substantial amounts of our capital stock in the public markets may dilute your voting power and your ownership interest in us.
Upon completion of this offering, our Charter will provide that we may issue up to 500,000,000 shares of Common Stock, of which will be designated as Class A Common Stock and will be shares of
57
Table of Contents
Common Stock without further designation, and 20,000,000 shares of preferred stock, $0.001 par value per share. Moreover, under Maryland law and as provided in our Charter, a majority of our entire board of directors has the power to amend our Charter to increase or decrease the aggregate number of shares of stock or the number of shares of stock of any class or series that we are authorized to issue without stockholder approval. Future issuances of shares of our Common Stock or our Class A Common Stock, securities convertible or exchangeable into Common Stock, or shares of our preferred stock may dilute the ownership interest of our common stockholders. Because our decision to issue additional equity or convertible or exchangeable securities in any future offering will depend on market conditions and other factors beyond our control, we cannot predict or estimate the amount, timing or nature of our future issuances. In addition, we are not required to offer any such securities to existing stockholders on a preemptive basis. Therefore, it may not be possible for existing stockholders to participate in such future issuances, which may dilute the existing stockholders’ interests in us.
A lack of research analyst coverage or restrictions on the ability of analysts associated with the co-managers of this offering to publish during certain time periods, including when we report our results of operations, could materially and adversely affect the trading price and liquidity of our Common Stock or our Class A Common Stock.
We cannot assure you that research analysts, including those associated with the underwriters of this offering, will initiate or maintain research coverage of us or our Class A Common Stock or, following the Class A Conversion, our Common Stock. In addition, regulatory rules prohibit research analysts associated with the co-managers of this offering from publishing or otherwise distributing a research report or from making a public appearance regarding us for 15 days prior to and after the expiration, waiver, or termination of any lock-up agreement that we or certain of our stockholders have entered into with the underwriters of this offering. Accordingly, it could be the case that research concerning our results of operations or the possible effects on us of significant news or a significant event will not be published or will be published on a delayed basis. A lack of research or the inability of certain research analysts to publish research relating to our results of operations or significant news or a significant event in a timely manner could materially and adversely affect the trading price and liquidity of our Common Stock or our Class A Common Stock.
Certain participants in our directed share program must hold their shares for a minimum of 180 days following the date of this prospectus and, accordingly, will be subject to market risks not imposed on other investors in the offering.
At our request, the underwriters have reserved up to 5% of the shares of our Class A Common Stock to be offered by this prospectus for sale, at the initial public offering price, to our directors, officers, employees, friends, family, and business associates. Purchasers of these shares who have entered into a lockup agreement with the underwriters in connection with this offering will be required to agree that they will not, subject to certain exceptions, dispose of or hedge any of such shares of Class A Common Stock or Common Stock held by them for at least 180 days after the date of this prospectus. As a result of the lockup restriction, these purchasers may face risks not faced by other investors who have the right to sell their shares at any time following the offering. These risks include the market risk of holding our shares during the period that such restrictions are in effect. In addition, the price of our Common Stock, including shares issued upon the Class A Conversion in respect of shares of Class A Common Stock, may decrease following the expiration of the lockup period if there is an increase in the number of shares for sale in the market.
58
Table of Contents
This prospectus contains forward-looking statements, which reflect our current views regarding our business, financial performance, growth prospects and strategies, market opportunities, and market trends. Forward-looking statements include all statements that are not historical facts. In some cases, you can identify these forward-looking statements by the use of words such as “outlook,” “believes,” “expects,” “potential,” “continues,” “may,” “will,” “should,” “could,” “seeks,” “approximately,” “projects,” “predicts,” “intends,” “plans,” “estimates,” “anticipates,” or the negative version of these words or other comparable words. All of the forward-looking statements included in this prospectus are subject to various risks and uncertainties. Assumptions relating to the foregoing involve judgments with respect to, among other things, future economic, competitive and market conditions, and future business decisions, all of which are difficult or impossible to predict accurately and many of which are beyond our control. Although we believe that the expectations reflected in such forward-looking statements are based on reasonable assumptions, our actual results, performance, and achievements could differ materially from those expressed in or by the forward-looking statements and may be affected by a variety of risks and other factors. Accordingly, there are or will be important factors that could cause actual outcomes or results to differ materially from such forward-looking statements. These factors include, but are not limited to, those factors described in “Risk Factors” beginning on page 26 of this prospectus. The “Risk Factors” section should not be construed as exhaustive and should be read in conjunction with other cautionary statements included elsewhere in this prospectus.
You are cautioned not to place undue reliance on any forward-looking statements included in this prospectus. All forward-looking statements are made as of the date of this prospectus and the risk that actual results, performance, and achievements will differ materially from the expectations expressed in or referenced by this prospectus will increase with the passage of time. We undertake no obligation to publicly update or review any forward-looking statement, whether as a result of new information, future developments, or otherwise, except as required by law. In light of the significant uncertainties inherent in the forward-looking statements included in this prospectus, the inclusion of such forward-looking statements should not be regarded as a representation by us, the underwriters, or any other person that the objectives and strategies set forth in this prospectus will be achieved.
59
Table of Contents
We estimate that the net proceeds to us from this offering will be approximately $ million, or $ million if the underwriters exercise in full their option to purchase additional shares of Class A Common Stock from us, in each case, after deducting underwriting discounts and commissions and other estimated expenses. The amount of net proceeds in each case is based on an assumed initial public offering price of $ per share, which is the mid-point of the price range set forth on the front cover of this prospectus. We intend to contribute the net proceeds from this offering to the OP in exchange for OP Units.
We expect the OP to use the net proceeds received from us to repay: (i) in full our 2020 Unsecured Term Loan, and (ii) approximately $ million of the outstanding balance under our Revolving Credit Facility, in each case, including any related fees and expenses. We expect to use any remaining net proceeds for general business and working capital purposes, including potential future acquisitions. No acquisitions are probable as of the date of this prospectus. Any proceeds received in connection with the exercise by the underwriters of their option to purchase additional shares will be used by the OP to repay a portion of the outstanding balance under our Revolving Credit Facility or for general business and working capital purposes, including potential future acquisitions.
The following table sets forth the maturity and interest rate as of , 2020, of the indebtedness to be repaid:
| Indebtedness to be Repaid |
Maturity Date |
Interest Rate | ||
| 2020 Unsecured Term Loan | August 2, 2020 | LIBOR plus 1.25% | ||
| Revolving Credit Facility | January 21, 2022 | LIBOR plus 1.20% |
We entered into the 2020 Unsecured Term Loan on August 2, 2019, to partially fund our purchase of the Industrial Portfolio Acquisition.
Certain of the underwriters and/or their respective affiliates are acting as agents, arrangers, and/or lenders under or may hold positions in the indebtedness to be repaid and accordingly will receive a portion of the proceeds from this offering. See “Underwriting—Relationships.”
Pending the permanent use of the net proceeds from this offering, we intend to invest the net proceeds in interest-bearing accounts, short-term investment-grade securities, money-market accounts, or other investments that are consistent with our intention to qualify for taxation as a REIT for U.S. federal income tax purposes.
60
Table of Contents
Following completion of this offering, we intend to make regular quarterly distributions to holders of our Common Stock (including our Class A Common Stock). Prior to this offering, we have paid distributions to holders of shares of our Common Stock on a monthly basis. We currently expect that the per share amount of our quarterly distributions on our Common Stock following completion of this offering will be $ , compared to the $1.32 paid in the aggregate on our Common Stock in the most recent quarter prior to this offering.
For the period commencing upon the completion of this offering and ending on , 2020, we intend to make a pro rata distribution based on a distribution rate of $ per share of our Common Stock (including our Class A Common Stock) for a full quarter. On an annualized basis, this would be $ per share, or an annualized distribution rate of approximately % based on the mid-point of the price range set forth on the front cover of this prospectus. We estimate that this initial annual distribution rate will represent approximately % of our estimated cash available for distribution to stockholders for the twelve months ending September 30, 2019, based on the mid-point of the price range set forth on the front cover of this prospectus. We do not intend to reduce the annualized distribution per share if the underwriters exercise their option to purchase additional shares. Our intended initial annual distribution rate has been established based on our estimate of cash available for distribution for the twelve months ending September 30, 2020, which we have calculated based on adjustments to our pro forma net income for the twelve months ended September 30, 2019. This estimate was based on our pro forma operating results and does not take into account our long-term business and growth strategies, nor does it take into account any unanticipated expenditures we may have to make or any financings for such expenditures. In estimating our cash available for distribution for the twelve months ending September 30, 2020, we have made certain assumptions as reflected in the table and footnotes below.
Our estimate of cash available for distribution does not include the effect of any changes in our working capital resulting from changes in our working capital accounts. In addition, our estimate of cash available for distribution does not include the approximately $ million to $ million of incremental general and administrative expenses expected to be incurred subsequent to the completion of this offering in order to operate as a public company but that are not reflected in our pro forma net income for the twelve months ended September 30, 2019. It also does not reflect the amount of cash estimated to be used for investing activities, financing activities, or other activities, other than reductions in interest expense associated with loan amortization. Any such investing and/or financing activities may have a material and adverse effect on our estimate of cash available for distribution. Because we have made the assumptions described herein in estimating cash available for distribution, we do not intend this estimate to be a projection or forecast of our actual results of operations, FFO, AFFO, liquidity, or financial condition, and we have estimated cash available for distribution for the sole purpose of determining our estimated initial annual distribution amount. Our estimate of cash available for distribution should not be considered as an alternative to cash flow from operating activities (computed in accordance with GAAP) or as an indicator of our liquidity or our ability to make distributions. In addition, the methodology upon which we made the adjustments described herein is not necessarily intended to be a basis for determining future distributions.
We intend to maintain our initial distribution rate for the 12 months following the completion of this offering unless our results of operations, FFO, AFFO, liquidity, cash flows, financial condition, prospects, economic conditions, or other factors differ materially from the assumptions used in projecting our initial distribution rate. We believe that our estimate of cash available for distribution constitutes a reasonable basis for setting the initial distribution rate. However, we cannot assure you that our estimate will prove accurate, and actual distributions may therefore be significantly below the expected distributions. Our actual results of operations will be affected by a number of factors, including the revenue received from our properties, our operating expenses, interest expense, and unanticipated capital expenditures. We may, from time to time, be required, or elect, to borrow under our Revolving Credit Facility or otherwise to pay distributions.
We cannot assure you that our estimated distributions will be made or sustained or that our board of directors will not change our distribution policy in the future. Any distributions will be at the sole discretion of
61
Table of Contents
our board of directors, and their form, timing, and amount, if any, will depend upon a number of factors, including our actual and projected results of operations, FFO, AFFO, liquidity, cash flows and financial condition, the revenue we actually receive from our properties, our operating expenses, our debt service requirements, our capital expenditures, prohibitions and other limitations under our financing arrangements, our REIT taxable income, the annual REIT distribution requirements, applicable law, including restrictions on distributions under Maryland law, and such other factors as our board of directors deems relevant. For more information regarding risk factors that could materially and adversely affect us and our ability to make cash distributions, see “Risk Factors—We may not be able to make distributions to our stockholders at the times or in the amounts we expect, or at all.” If our operations do not generate sufficient cash flow to enable us to pay our intended or required distributions, we may be required either to fund distributions from working capital, borrow, or raise equity or reduce such distributions. In addition, our Charter allows us to issue preferred stock that could have a preference on distributions and could limit our ability to make distributions to our stockholders. Additionally, under certain circumstances, agreements relating to our indebtedness could limit our ability to make distributions to our stockholders.
U.S. federal income tax law requires that a REIT distribute annually at least 90% of its REIT taxable income, determined without regard to the dividends paid deduction and excluding any net capital gains, and that it pay tax at the corporate rate to the extent that it annually distributes less than 100% of its REIT taxable income, determined without regard to the dividends paid deduction and including any net capital gains. In addition, a REIT will be required to pay a 4% nondeductible excise tax on the amount, if any, by which the distributions it makes in a calendar year are less than the sum of 85% of its ordinary income, 95% of its capital gain net income, and 100% of its undistributed income from prior years. For more information, see “Material U.S. Federal Income Tax Considerations.” We anticipate that our estimated cash available for distribution will be sufficient to enable us to meet the annual distribution requirements applicable to REITs and to avoid or minimize the imposition of corporate and excise taxes. However, under some circumstances, we may be required to make distributions in excess of cash available for distribution in order to meet these distribution requirements or to avoid or minimize the imposition of tax and we may need to borrow funds to make certain distributions.
62
Table of Contents
The following table sets forth our capitalization as of September 30, 2019:
| • | on an actual basis; |
| • | on a pro forma basis to give effect to the (i) Internalization (assuming the earnout consideration in the Internalization is paid in full) and (ii) Recapitalization; and |
| • | on a pro forma as adjusted basis to give effect to the transactions described in the preceding bullet and the issuance by us of shares of Class A Common Stock in this offering at an assumed initial public offering price of $ , the mid-point of the price range set forth on the cover page of this prospectus, and the use of proceeds therefrom as described under “Use of Proceeds.” |
| As of September 30, 2019 | ||||||||||||
| Actual | Pro Forma | Pro Forma As Adjusted |
||||||||||
| (In thousands, except share and per share amounts) |
||||||||||||
| Cash and Cash Equivalents: |
||||||||||||
| Total Cash and Cash Equivalents |
$ | $ | $ | |||||||||
| Debt: |
||||||||||||
| Revolving Credit Facility (1) |
||||||||||||
| Mortgages and notes payable, net |
||||||||||||
| Unsecured term notes |
||||||||||||
| Equity: |
||||||||||||
| Preferred stock, $0.001 par value per share; 20,000,000 shares authorized, no shares issued and outstanding, actual; 20,000,000 shares authorized, no shares issued and outstanding, pro forma |
||||||||||||
| Common Stock, $0.001 par value per share; 80,000,000 shares authorized, 25,482,000 shares issued and outstanding, actual; 500,000,000 shares authorized, shares issued and outstanding, pro forma; shares authorized, and shares issued and outstanding, respectively, pro forma as adjusted (2) |
||||||||||||
| Class A Common Stock, $0.001 par value per share; no shares authorized, issued, or outstanding, actual; shares authorized, and shares issued and outstanding, respectively, pro forma; shares authorized, and shares issued and outstanding, respectively, pro forma as adjusted (2) |
||||||||||||
| Additional paid in capital |
||||||||||||
| Total stockholders’ equity |
||||||||||||
|
|
|
|
|
|||||||||
| Members’ equity |
||||||||||||
|
|
|
|
|
|||||||||
| Non-controlling interest (3) |
||||||||||||
| Total Capitalization |
$ | $ | $ | |||||||||
|
|
|
|
|
|
|
|||||||
| (1) | Upon completion of this offering, we expect to increase the size of our Revolving Credit Facility to $ million and have $ million of availability. |
| (2) | Pro forma Common Stock outstanding assumes shares of Common Stock expected to be issued in connection with the Internalization, which represents the full amount, including both the base consideration and the maximum potential contingent consideration, payable in the form of Common Stock in connection with the Internalization. |
63
Table of Contents
Pro forma and pro forma as adjusted Common Stock shares authorized includes shares of Common Stock designated as Class A Common Stock and pro forma shares issued and outstanding excludes shares of Class A Common Stock to be issued in this offering.
Pro forma as adjusted Common Stock outstanding assumes (a) shares of our Class A Common Stock to be issued in this offering and (b) shares of Common Stock expected to be issued in connection with the Internalization, which represents the full amount, including both the base consideration and the maximum potential contingent consideration, payable in the form of Common Stock in connection with the Internalization. Excludes (i) shares of our Class A Common Stock issuable upon the exercise in full of the underwriters’ option to purchase additional shares of Class A Common Stock and (ii) shares of our Common Stock issuable in the future under our 2020 Equity Incentive Plan, as more fully described in “Executive Compensation—Material Terms of the 2020 Equity Incentive Plan.”
| (3) | Pro forma and pro forma as adjusted non-controlling interest includes OP Units expected to be issued in connection with the Internalization, which represents the full amount, including both base and the maximum potential contingent consideration, payable in the form of OP Units in connection with the Internalization. |
64
Table of Contents
Purchasers of our Class A Common Stock offered by this prospectus will experience an immediate and substantial dilution of the net tangible book value per share of our Class A Common Stock from the initial public offering price.
As of September 30, 2019, we had a net tangible book value of approximately $ million, or $ per share, held by continuing investors. After giving effect to the sale of our Class A Common Stock by us in this offering and the use of net proceeds described herein, the Recapitalization, the Internalization, and the other adjustments described in the unaudited pro forma consolidated financial statements included elsewhere in this prospectus, our pro forma net tangible book value as of September 30, 2019, would have been $ million, or $ per share of Common Stock (including Class A Common Stock) and OP Units on a fully diluted basis. This amount represents an immediate decrease in net tangible book value of $ per share to our continuing investors and an immediate dilution in pro forma net tangible book value of $ per share from the public offering price of $ per share of our Class A Common Stock to our new investors.
The following table illustrates this per share dilution.
| Assumed initial public offering price per share |
$ | |||||||
| Net tangible book value per share as of September 30, 2019 (1) |
$ | |||||||
| Net increase in net tangible book value per share attributable to this offering, the Recapitalization, the Internalization, and other pro forma adjustments |
$ | |||||||
|
|
|
|||||||
| Pro forma net tangible book value per share after this offering, the Recapitalization, the Internalization, and other pro forma adjustments (2) |
$ | |||||||
|
|
|
|||||||
| Dilution in pro forma net tangible book value per share to new investors (3) |
$ | |||||||
|
|
|
| (1) | Net tangible book value per share as of September 30, 2019, is determined by dividing net tangible book value by the number of shares of our Common Stock owned by continuing investors as of September 30, 2019. Net tangible book value equals total tangible assets less total tangible liabilities. Total tangible assets equals total assets less intangible lease assets, net, debt issuance costs-unsecured revolver, net, and leasing fees, net. Total tangible liabilities equals total liabilities less intangible lease liabilities, net. |
| (2) | Pro forma net tangible book value per share is determined by dividing pro forma net tangible book value by the total number of shares of our Common Stock (including Class A Common Stock) to be outstanding after this offering. The total number of shares of our Common Stock (including Class A Common Stock) to be outstanding after this offering includes the number of shares owned by continuing investors as of September 30, 2019 (including OP Units that may be exchanged for our Common Stock on a one-for-one basis), assuming the earnout is achieved in full, and the number of shares of Class A Common Stock issued in this offering, but excludes any shares that may be issued upon exercise of the underwriters’ option to purchase additional shares in the offering and any shares that may be issued in the future under our 2020 Equity Incentive Plan. |
| (3) | The dilution in pro forma net tangible book value per share to new investors is determined by subtracting pro forma net tangible book value per share from the assumed initial public offering price per share. |
The dilution information discussed above is illustrative only and will change based on the actual initial public offering price and other terms determined at the time of pricing of this offering. A $1.00 increase (decrease) in the assumed initial public offering price of $ per share, the midpoint of the price range set forth on the cover page of this prospectus, would increase (decrease) pro forma net tangible book value per share after this offering, the Recapitalization, the Internalization, and other pro forma adjustments by $ per share and increase (decrease) the dilution to new investors by $ per share, in each case less underwriting discounts and commissions and estimated offering expenses payable by us, assuming the number of shares of Class A Common Stock offered by us, as set forth on the cover page of this prospectus, remains the same. If the
65
Table of Contents
underwriters exercise in full their option to purchase additional shares of our Class A Common Stock, our pro forma net tangible book value per share would be $ and the dilution to new investors would be $ per share, assuming an initial public offering price of $ per share, the midpoint of the range set forth on the cover page of this prospectus.
Differences Between New Investors and Continuing Investors
The table below summarizes as of September 30, 2019, on a pro forma basis after giving effect to this offering, the Recapitalization, the Internalization, and other pro forma adjustments, the differences between the number of shares of Class A Common Stock, Common Stock, and OP Units held by continuing investors and received by new investors in this offering, the total consideration paid, and the average price per share paid by continuing investors and new investors.
| Class A Common Stock, Common Stock and OP Units |
Total Consideration |
Average Price Per Share |
||||||||||||||||||
| Number | Percentage | Number | Percentage |
|
||||||||||||||||
| Continuing investors |
% | $ | % | $ | ||||||||||||||||
| New investors in this offering |
$ | |||||||||||||||||||
|
|
|
|
|
|
|
|
|
|||||||||||||
| Total |
100.0 | % | $ | 100.0 | % | |||||||||||||||
|
|
|
|
|
|
|
|
|
|||||||||||||
66
Table of Contents
SELECTED CONSOLIDATED HISTORICAL AND PRO FORMA FINANCIAL AND OTHER DATA
Our historical consolidated balance sheet data as of December 31, 2018, 2017, and 2016 and consolidated results of operations for the years ended December 31, 2018, 2017, and 2016 have been derived from our audited historical consolidated financial statements included elsewhere in this prospectus. The below information also includes our unaudited condensed consolidated balance sheet data as of September 30, 2019 and our unaudited condensed consolidated results of operations for the nine months ended September 30, 2019 and 2018, which have been derived from our historical unaudited consolidated financial statements included elsewhere in this prospectus. The condensed consolidated financial statements have been prepared in accordance with GAAP for interim financial information and Article 10 of the SEC Regulation S-X. The Company believes all adjustments necessary for a fair presentation have been included in these interim condensed consolidated financial statements (which include only normal recurring adjustments). Our historical consolidated financial data included below and set forth elsewhere in this prospectus are not necessarily indicative of our future performance.
Our unaudited selected pro forma consolidated operating and balance sheet data as of and for the nine months ended September 30, 2019 and for the year ended December 31, 2018 is presented (i) with respect to statements of operations data, giving effect to the Industrial Portfolio Acquisition; the Internalization, assuming the earnout consideration in the Internalization is paid in full; the Recapitalization; and the completion of this offering and the use of proceeds described herein, based on the mid-point of the price range set forth on the front cover of this prospectus, assuming each of the transactions was completed on January 1, 2018, and (ii) with respect to balance sheet data, giving effect to the Internalization, assuming the earnout consideration in the Internalization is paid in full; the Recapitalization; and the completion of this offering and the use of proceeds described herein, based on the mid-point of the price range set forth on the front cover of this prospectus, assuming that each of the transactions was completed on September 30, 2019, in each case, giving effect to the other adjustments described in the unaudited pro forma consolidated financial statements included elsewhere in this prospectus. Our pro forma financial information is not necessarily indicative of what our actual financial position and results of operations would have been as of the date and for the periods indicated, nor does it purport to represent our future financial position or results of operations.
67
Table of Contents
You should read the following summary financial and other data together with “Management’s Discussion and Analysis of Financial Condition and Results of Operations,” “Business and Properties,” and our consolidated financial statements and related notes appearing elsewhere in this prospectus.
| For the nine months ended September 30, |
For the years ended December 31, | |||||||||||||||||||||||||||
| (in thousands, except per share data) | 2019 (Pro forma) (Unaudited) |
2019 (Historical) (Unaudited) |
2018 (Historical) (Unaudited) |
2018 (Pro forma) |
2018 (Historical) |
2017 (Historical) |
2016 (Historical) |
|||||||||||||||||||||
| Operating Data |
||||||||||||||||||||||||||||
| Revenues |
||||||||||||||||||||||||||||
| Lease revenues |
$ | — | $ | 213,884 | $ | 174,385 | $ | — | $ | 237,479 | $ | 181,563 | $ | 142,869 | ||||||||||||||
|
|
|
|
|
|
|
|
|
|
|
|
|
|
|
|||||||||||||||
| Operating expenses |
||||||||||||||||||||||||||||
| Depreciation and amortization |
77,989 | 61,303 | 83,994 | 62,263 | 46,321 | |||||||||||||||||||||||
| Asset management fees |
16,048 | 13,119 | 18,173 | 14,754 | 10,955 | |||||||||||||||||||||||
| Property management fees |
5,918 | 4,792 | 6,529 | 4,988 | 3,939 | |||||||||||||||||||||||
| Acquisition expenses |
— | — | — | — | 10,880 | |||||||||||||||||||||||
| Property and operating expense |
11,497 | 7,926 | 11,157 | 6,505 | 3,900 | |||||||||||||||||||||||
| General and administrative |
3,807 | 4,451 | 6,162 | 4,939 | 2,790 | |||||||||||||||||||||||
| State, franchise and foreign tax |
1,153 | 811 | 857 | 624 | 446 | |||||||||||||||||||||||
| Provision for impairment of investment in rental properties |
3,452 | 2,061 | 2,061 | 2,608 | — | |||||||||||||||||||||||
|
|
|
|
|
|
|
|
|
|
|
|
|
|
|
|||||||||||||||
| Total operating expenses |
— | 119,864 | 94,463 | — | 128,933 | 96,681 | 79,231 | |||||||||||||||||||||
|
|
|
|
|
|
|
|
|
|
|
|
|
|
|
|||||||||||||||
| Other income (expenses) |
||||||||||||||||||||||||||||
| Preferred distribution income |
— | 440 | 440 | 737 | 713 | |||||||||||||||||||||||
| Interest income |
6 | 178 | 179 | 467 | 88 | |||||||||||||||||||||||
| Interest expense |
(51,025 | ) | (38,115 | ) | (52,855 | ) | (34,751 | ) | (29,963 | ) | ||||||||||||||||||
| (Cost) gain of debt extinguishment |
(1,176 | ) | (101 | ) | (101 | ) | (5,151 | ) | (133 | ) | ||||||||||||||||||
| Gain (loss) on sale of real estate |
16,772 | 9,620 | 10,496 | 12,992 | 5,925 | |||||||||||||||||||||||
| Gain on sale of investment in related party |
— | 8,500 | 8,500 | — | — | |||||||||||||||||||||||
| Internalization expenses |
(1,195 | ) | — | — | — | — | ||||||||||||||||||||||
| Other (losses) gains |
— | — | (100 | ) | 379 | — | ||||||||||||||||||||||
|
|
|
|
|
|
|
|
|
|
|
|
|
|
|
|||||||||||||||
| Net income |
— | 57,402 | 60,444 | — | 75,105 | 59,555 | 40,268 | |||||||||||||||||||||
|
|
|
|
|
|
|
|
|
|
|
|
|
|
|
|||||||||||||||
| Net income attributable to non-controlling interests |
(3,942 | ) | (4,631 | ) | (5,730 | ) | (4,756 | ) | (3,914 | ) | ||||||||||||||||||
|
|
|
|
|
|
|
|
|
|
|
|
|
|
|
|||||||||||||||
| Net income attributable to Broadstone Net Lease, Inc. |
$ | — | $ | 53,460 | $ | 55,813 | $ | — | $ | 69,375 | $ | 54,799 | $ | 36,354 | ||||||||||||||
|
|
|
|
|
|
|
|
|
|
|
|
|
|
|
|||||||||||||||
| Pro forma weighted average number of shares of Common Stock outstanding |
|
|||||||||||||||||||||||||||
| Basic |
||||||||||||||||||||||||||||
|
|
|
|||||||||||||||||||||||||||
| Diluted |
||||||||||||||||||||||||||||
|
|
|
|||||||||||||||||||||||||||
| Pro forma net earnings per share of Common Stock |
|
|||||||||||||||||||||||||||
| Basic |
||||||||||||||||||||||||||||
|
|
|
|||||||||||||||||||||||||||
| Diluted |
||||||||||||||||||||||||||||
|
|
|
|||||||||||||||||||||||||||
68
Table of Contents
| As of September 30, | As of December 31, | |||||||||||||||||||
| (in thousands) | 2019 (Pro forma) (Unaudited) |
2019 (Historical) (Unaudited) |
2018 (Historical) |
2017 (Historical) |
2016 (Historical) |
|||||||||||||||
| Balance Sheet Data |
||||||||||||||||||||
| Investment in rental property, at cost |
$ | 3,756,705 | $ | 2,890,735 | $ | 2,376,141 | $ | 1,790,674 | ||||||||||||
| Investment in rental property, net |
3,501,546 | 2,683,746 | 2,227,758 | 1,684,971 | ||||||||||||||||
| Cash and cash equivalents |
14,008 | 18,612 | 9,355 | 21,635 | ||||||||||||||||
| Total assets |
3,991,788 | 3,096,797 | 2,578,756 | 1,952,054 | ||||||||||||||||
| Unsecured revolver |
303,300 | 141,100 | 273,000 | 102,000 | ||||||||||||||||
| Mortgage and notes payable, net |
112,562 | 78,952 | 67,832 | 106,686 | ||||||||||||||||
| Revolver |
1,671,511 | 1,225,773 | 836,912 | 657,891 | ||||||||||||||||
| Total liabilities |
2,263,288 | 1,567,877 | 1,294,555 | 953,517 | ||||||||||||||||
| Total Broadstone Net Lease, Inc. stockholders’ equity |
1,623,362 | 1,417,099 | 1,186,825 | 911,788 | ||||||||||||||||
| Total equity |
1,728,500 | 1,528,920 | 1,284,201 | 998,537 | ||||||||||||||||
| For the nine months ended September 30, |
For the years ended December 31, | |||||||||||||||||||||||||||
| (in thousands, except per share data) | 2019 (Pro forma) (Unaudited) |
2019 (Historical) (Unaudited) |
2018 (Historical) (Unaudited) |
2018 (Pro forma) |
2018 (Historical) |
2017 (Historical) |
2016 (Historical) |
|||||||||||||||||||||
| Other Data |
||||||||||||||||||||||||||||
| Dividend declared |
$ | 100,097 | $ | 83,367 | $ | 112,969 | $ | 92,768 | $ | 76,955 | ||||||||||||||||||
| Dividends declared per share of Common Stock |
3.95 | 3.86 | 5.15 | 4.98 | 4.91 | |||||||||||||||||||||||
| FFO 1 |
122,071 | 114,188 | 150,664 | 111,434 | 80,664 | |||||||||||||||||||||||
| AFFO 1 |
107,625 | 91,513 | 124,065 | 99,952 | 78,780 | |||||||||||||||||||||||
| EBITDA 1 |
186,416 | 159,862 | 211,954 | 156,569 | 116,552 | |||||||||||||||||||||||
| EBITDAre 1 |
173,096 | 152,303 | 203,519 | 146,185 | 110,627 | |||||||||||||||||||||||
| As of September 30, | As of December 31, | |||||||||||||||||||
| (dollars in thousands) | 2019 (Pro forma) (Unaudited) |
2019 (Historical) (Unaudited) |
2018 (Historical) |
2017 (Historical) |
2016 (Historical) |
|||||||||||||||
| Net Debt 1 |
$ | 2,052,120 | $ | 1,431,562 | $ | 1,171,371 | $ | 846,421 | ||||||||||||
| Number of properties |
662 | 621 | 528 | 417 | ||||||||||||||||
| Occupancy at period end |
99.7 | % | 99.7 | % | 99.6 | % | 98.0 | % | ||||||||||||
| (1) | See “Management’s Discussion and Analysis of Financial Condition and Results of Operations—Non-GAAP Financial Measures” for definitions of these metrics and reconciliations of these metrics to net income, the most directly comparable GAAP measure. |
69
Table of Contents
MANAGEMENT’S DISCUSSION AND ANALYSIS OF FINANCIAL CONDITION AND RESULTS OF OPERATIONS
The following discussion of our financial condition and results of operations should be read together with the “Prospectus Summary—Summary Consolidated Historical and Pro Forma Financial and Other Data,” “Selected Consolidated Historical and Pro Forma Financial and Other Data,” “Business and Properties,” and consolidated financial statements and related notes that are included elsewhere in this prospectus. Where appropriate, the following discussion includes the effects of the Industrial Portfolio Acquisition, Internalization, and this offering and the use of the net proceeds therefrom on a pro forma basis. These effects are reflected in our pro forma consolidated financial statements included elsewhere in this prospectus. This discussion contains forward-looking statements based upon our current expectations that involve risks and uncertainties. Our actual results may differ materially from those anticipated in these forward-looking statements as a result of various factors, including those set forth under “Forward-Looking Statements,” “Risk Factors,” or in other parts of this prospectus.
Overview
We acquire, own, and manage primarily single-tenant commercial real estate properties that are net leased on a long-term basis to a diversified group of tenants. Since our inception in 2007, we have selectively invested more than $4.3 billion in net leased assets in the industrial, healthcare, restaurant, office, and retail property types and as of September 30, 2019, have scaled our portfolio to 661 properties in 42 U.S. states and one property in Canada.
We derive substantially all of our revenue from rents received from single tenants of each of our net lease properties in our portfolio. We typically lease our properties pursuant to long-term net leases with initial terms of 10 years or more that often have renewal options. As of September 30, 2019, leases contributing 97.9% of our ABR provided for periodic rent escalations, generally ranging from 1.5% to 2.5% annually, with a weighted average annual minimum increase in ABR of 2.1%. As of September 30, 2019, our properties were occupied by approximately 187 different commercial tenants who operate 171 different brands that are diversified across 53 differing industries, with no single tenant accounting for more than 2.8% of our ABR.
In order to benefit from increasing economies of scale as we continue to grow, and as part of our evolution toward entering the public markets, our board of directors made the decision to internalize our management structure, which we expect to be completed in the first quarter of 2020. In connection with the Internalization, we will terminate our management agreements with BRE, enter into Employment Agreements with each of our anticipated named executive officers, and begin directly employing approximately 65 former employees of BRE. Our historical results of operations through September 30, 2019, include the payment of management fees that we will no longer pay following the Internalization and do not include the direct compensation expense associated with our approximately 65 employees, or certain professional fees, consulting, portfolio servicing costs, and other general and administrative expenses not previously incurred based upon our externally managed structure. See “Selected Consolidated Historical and Pro Forma Financial and Other Data.”
As of September 30, 2019, on a pro forma basis, we had $ of total debt outstanding, Net Debt of $ , and a ratio of Net Debt to Annualized Adjusted EBITDAre of x. We have historically maintained higher leverage than we intend to maintain as a publicly-traded REIT following this offering. In the future, we will seek to maintain on a sustained basis a level of Net Debt that is generally less than six times our Annualized Adjusted EBITDAre. We intend to repay $ million of our debt with the net proceeds of this offering. See “Use of Proceeds.” After giving effect to this offering and the use of proceeds therefrom, we expect to have $ million of available borrowing capacity under our increased Revolving Credit Facility and $ of cash and cash equivalents, as well as access to other sources of debt capital, including the public unsecured bond and private placement debt markets, with the benefit of our investment grade credit rating.
70
Table of Contents
Factors that Affect Our Results of Operations and Financial Condition
Our results of operations and financial condition are affected by numerous factors, many of which are beyond our control. Key factors that impact our results of operations and financial condition include rental rates, lease renewals and occupancy, acquisition volume, net lease terms, financing arrangements and leverage, property dispositions, general and administrative expenses, inflation, and tenant bankruptcies.
Rental Rates
Our ability to grow rental revenue from our existing portfolio will depend on our ability to realize the rental escalations built into our leases. As of September 30, 2019, leases contributing 97.9% of our ABR provided for increases in future annual base rent, generally ranging from 1.5% to 2.5% annually, with a weighted average minimum increase in ABR of 2.1% of base rent. Generally, our rent escalators increase rent on specified dates by a fixed percentage. Approximately 15.5% of our rent escalators are based on an increase in the CPI over a specified period and 2.1% of our leases are flat leases, meaning they do not provide for rent increases during their terms. During periods of low inflation, small increases in the CPI will result in limited increases in rental revenue from our leases that contain rent escalators based on CPI increases. However, when the CPI decreases or does not change over the relevant period, our rental revenue from such leases is not reduced and will remain the same.
Property Dispositions
From time to time, we will strategically dispose of properties, primarily where we believe the risk profile has changed and become misaligned with our then current risk-adjusted return objectives. The resulting gains or losses on dispositions may materially impact our operating results. The recognition of a gain or loss on the sale of real estate varies from transaction to transaction based on fluctuations in asset prices and demand in the real estate market at the time a property is listed for sale.
Lease Renewals and Occupancy
As of September 30, 2019, the weighted average remaining term of our leases was approximately 11.7 years, excluding renewal options. As of September 30, 2019, approximately 4.4% of our leases (based on ABR) will expire prior to January 1, 2024. See “Business and Properties—Our Real Estate Investment Portfolio—Lease Maturity Schedule, by % of ABR.” The stability of the rental revenue generated by our properties depends principally on our tenants’ ability to pay rent and our ability to collect rents, renew expiring leases or re-lease space upon the expiration or other termination of leases, lease currently vacant properties, and maintain or increase rental rates at our leased properties. To the extent our properties become vacant, we would forego rental income while remaining responsible for the payment of property taxes and maintaining the property until it is re-leased, which could negatively impact our operating results. However, given our historically strong occupancy rates (since our inception, occupancy has generally been above 99%), we do not anticipate that such impact will be significant.
Acquisition Volume
Our historical growth in revenues and earnings has been achieved through rent escalations associated with existing in-place leases, coupled with rental income generated from accretive property acquisitions. Our ability to grow revenue will depend, to a significant degree, on our ability to acquire additional properties. Our ability to grow requires us to identify and complete acquisitions that meet our investment criteria. Changes in capitalization rates, interest rates, or other factors may impact our acquisition opportunities in the future. Market conditions may also impact the total returns we can achieve on our investments. Our acquisition volume also depends on our ability to access third-party debt and equity financing to fund our capital needs.
71
Table of Contents
Net Lease Terms
Substantially all of our leases are net leases pursuant to which our tenant generally is obligated to pay all expenses associated with the leased property including real estate taxes, insurance, maintenance, repairs, and capital costs. A limited number of leases require us to pay some or all of the property expenses such as the cost of environmental liabilities, roof and structure repairs, real estate taxes, insurance, or certain non-structural repairs and maintenance. An increase in the number of leases in which we are responsible for some or all of these expenses could negatively influence our operating results. Additionally, we seek to use master lease structures where it fits market practice in the particular property type, pursuant to which we seek to lease multiple properties to a single tenant on an all or none basis. Master leases strengthen our ability to preserve rental revenue and prevent costs associated with vacancies for underperforming properties. We believe the master lease structure is most prevalent and applicable to leases in our restaurant and retail property types, while less relevant to our other property types, such as healthcare and industrial. As of September 30, 2019, master leases contributed approximately 35.9% of our overall ABR (our largest master lease by ABR related to 25 properties and contributed 2.5% of our ABR, and our smallest master lease by ABR related to two properties and contributed 0.1% of our ABR), 73.1% of our restaurant property ABR (167 of our 254 restaurant properties), and 67.0% of our retail property ABR (85 of our 136 properties).
Interest Expense
Upon completion of this offering, we expect to have pro forma total debt outstanding of $ million, with a weighted average annual interest rate of % and a weighted average maturity of , % of which is fixed rate debt or hedged through interest rate swaps. We anticipate that we will continue to incur debt in the future in order to fund future acquisition activity, which will increase the amount of interest expense we incur. In addition, although we attempt to limit our total floating-rate debt exposure, changes in the interest rate environment could either increase or decrease our weighted average interest rate in the future. Any changes to our debt structure, including borrowings under the Revolving Credit Facility that we expect to have on a pro forma basis, or debt financing associated with property acquisitions, could materially influence our operating results depending on the terms of any such debt.
Property Management and Asset Management Fees
Following completion of the Internalization, we will no longer pay property management and asset management fees, which had historically increased in correlation to the size of our portfolio.
General and Administrative Expenses
Following completion of the Internalization, our general and administrative expenses will include direct employee compensation costs for our approximately 65 employees. In addition, our general and administrative expenses will include certain professional fees, consulting, portfolio servicing costs, and other general and administrative expenses not previously incurred based upon our externally managed structure. Given our current team and structure, we expect that as our portfolio grows, we will experience limited increases in general and administrative expenses in the next few years after 2020, such that those expenses will grow at a significantly slower rate than the overall portfolio and corresponding lease revenues.
Impact of Inflation
Our rental revenues may be impacted by inflation. Many of our leases contain rent escalators that increase rent at a fixed amount and may not be sufficient during periods of high inflation. Leases that contributed approximately 15.5% of our ABR as of September 30, 2019, contained rent escalators based on increases in CPI and the associated increases in rental revenue may be limited during periods of low inflation. The impact of inflation on our property and operating expenses is limited since substantially all of our leases are net leases, and
72
Table of Contents
property-level expenses are generally paid by our tenants. To the extent we bear the cost of such expense, we attempt to limit our exposure to inflation through the use of warranties and other remedies that reduce the likelihood of a significant capital outlay. Inflation and increased costs may also have an adverse impact to our tenants and their creditworthiness if the increase in property-level expenses is greater than their increase in revenues.
Tenant Bankruptcies
Adverse economic conditions, particularly those that affect the markets in which our properties are located, or downturns in our tenants’ industries could impair our tenants’ ability to meet their lease obligations to us and our ability to renew expiring leases or re-lease space. In particular, the bankruptcy of one or more of our tenants could adversely affect our ability to collect rents from such tenant and maintain our portfolio’s occupancy. We have historically experienced only a limited number of tenant bankruptcies, which have not been material to our historical results.
Results of Operations
Our historical results of operations through September 30, 2019, discussed below, include the payment of asset and property management fees that we will no longer will pay following the Internalization, and do not include the expected direct compensation expense associated with approximately 65 employees expected to be employed by us following the Internalization or incremental general and administrative expenses.
Comparison of the Nine Months Ended September 30, 2019 and the Nine Months Ended September 30, 2018
Lease Revenues
| For the nine months ended September 30, |
Increase/(Decrease) | |||||||||||||||
| 2019 | 2018 | $ | % | |||||||||||||
| Contractual rental amounts billed for operating leases and straight-line rent adjustments |
$ | 200,307 | $ | 163,611 | $ | 36,696 | 22.4 | % | ||||||||
| Adjustment to revenue recognized for uncollectible rental amounts billed |
(440 | ) | — | (440 | ) | >100 | % | |||||||||
| Operating expenses billed to/reimbursed from tenants |
10,572 | 7,764 | 2,808 | 36.2 | % | |||||||||||
| Other income from real estate transactions |
431 | 74 | 357 | >100 | % | |||||||||||
|
|
|
|
|
|
|
|
|
|||||||||
| Total lease revenues from operating leases |
210,870 | 171,449 | 39,421 | 23.0 | % | |||||||||||
| Earned income from direct financing leases |
3,014 | 2,936 | 78 | 2.7 | % | |||||||||||
|
|
|
|
|
|
|
|
|
|||||||||
| Total lease revenues |
$ | 213,884 | $ | 174,385 | $ | 39,499 | 22.7 | % | ||||||||
|
|
|
|
|
|
|
|
|
|||||||||
The increase in revenues for nine months ended September 30, 2019, was primarily attributable to the growth in our real estate portfolio, which was achieved through rent escalations associated with existing in-place leases, coupled with rental revenue generated from accretive property acquisitions completed since the third quarter of 2018, and continued strong portfolio operating performance. Since the third quarter of 2018, we have acquired 109 properties for $1.2 billion, excluding capitalized acquisition costs, including 66 properties acquired for $993.7 million during the first nine months of 2019. During the first nine months of 2019, we experienced greater than 99% rent collection and occupancy (based on rentable square footage), and as of September 30, 2019, the annual ABR weighted average rent minimum increase on our properties was 2.1%.
73
Table of Contents
Operating Expenses
| For the nine months ended | ||||||||||||||||
| September 30, | Increase/(Decrease) | |||||||||||||||
| (in thousands) | 2019 | 2018 | $ | % | ||||||||||||
| Operating expenses |
||||||||||||||||
| Depreciation and amortization |
$ | 77,989 | $ | 61,303 | $ | 16,686 | 27.2 | % | ||||||||
| Asset management fees |
16,048 | 13,119 | 2,929 | 22.3 | % | |||||||||||
| Property management fees |
5,918 | 4,792 | 1,126 | 23.5 | % | |||||||||||
| Property and operating expense |
11,497 | 7,926 | 3,571 | 45.1 | % | |||||||||||
| General and administrative |
3,807 | 4,451 | (644 | ) | (14.5) | % | ||||||||||
| State, franchise and foreign tax |
1,153 | 811 | 342 | 42.2 | % | |||||||||||
| Provision for impairment of investment in rental properties |
3,452 | 2,061 | 1,391 | 67.5 | % | |||||||||||
|
|
|
|
|
|
|
|||||||||||
| Total operating expenses |
$ | 119,864 | $ | 94,463 | $ | 25,401 | 26.9 | % | ||||||||
|
|
|
|
|
|
|
|||||||||||
Depreciation and amortization
The increase in depreciation and amortization expense for the nine months ended September 30, 2019, was primarily due to the growth in our real estate portfolio, as discussed above.
Asset management fees
We paid our third-party manager a quarterly fee equal to 0.25% of the aggregate value of our equity on a fully diluted basis. The increase in asset management fees during the nine months ended September 30, 2019, was primarily the result of an increase in our total outstanding equity on a fully diluted basis, which resulted from continued equity capital investments. As of September 30, 2019, there were 27.2 million shares of our Common Stock and non-controlling membership units outstanding, compared to 22.8 million as of September 30, 2018. The increase in equity capital was used to partially fund the continued growth in our real estate portfolio. In addition to the increase in total outstanding equity, the increase in asset management fees reflects a higher average share value, as then determined by our board of directors.
Property management fees
We paid our third-party manager a monthly fee equal to 3% of gross rentals collected from our real estate portfolio as compensation for its property management services. The increase in property management fees during the nine months ended September 30, 2019, was primarily the result of growth in our portfolio as a result of additional property acquisitions and rent escalations.
Property and operating expense
The increase in property and operating expense in the nine months ended September 30, 2019, was mainly attributable to an increase in the number of our properties for which we are responsible for paying a majority of the ongoing property maintenance, insurance, and real estate tax expenses and are reimbursed by the tenant under the terms of the respective net leases. There was a corresponding increase in operating expenses billed to tenants and included within Lease revenues, as discussed above.
General and administrative
The decrease in general and administrative expenses for the nine months ended September 30, 2019, is mainly attributable to a decrease in bad debt expense, which was approximately $1.1 million in the nine months ended September 30, 2018. As discussed in Note 2 in the Notes to Condensed Consolidated Financial Statements
74
Table of Contents
for the nine months ended September 30, 2019, included elsewhere in this prospectus, prior to the adoption of ASC 842, provisions for doubtful accounts were recorded as bad debt expense and included in General and administrative expenses on the Condensed Consolidated Statements of Income and Comprehensive Income. Subsequent to the adoption of ASC 842 on January 1, 2019, provisions for doubtful accounts are recorded as an offset to Lease revenues, and totaled $0.4 million for the nine months ended September 30, 2019. Following completion of the Internalization, our general and administrative expenses will include direct employee compensation costs for approximately 65 employees. In addition, our general and administrative expenses will include certain professional fees, consulting, portfolio servicing costs, and other general and administrative expenses not previously incurred based on our externally managed structure. Given our current team and structure, we expect that as our portfolio grows, we will experience limited increases in general and administrative expenses in the next few years after 2020, such that those expenses will grow at a significantly slower rate than the overall portfolio and corresponding lease revenues.
Provision for impairment of investment in rental properties
We review long-lived assets to be held and used for possible impairment when events or changes in circumstances indicate that their carrying amount may not be recoverable. Such events and circumstances include, but are not limited to, changes in our strategy with respect to a certain property or properties, changes in our assessment of a tenant’s future viability, and property vacancies. During the nine months ended September 30, 2019, we recognized $3.5 million of impairment expense related to four properties whose carrying amounts we determined were not recoverable. In determining the fair value of the assets at the time of measurement, and depending on the specific property being evaluated, we utilized a capitalization rate of 14.6%, a weighted average discount rate of 8%, and a weighted average price per square foot of $226. During the nine months ended September 30, 2018, we recognized $2.1 million of impairment expense related to five properties whose carrying amounts we determined were not recoverable. In determining the fair value of the assets at the time of measurement, and depending upon the specific property being evaluated, we utilized capitalization rates ranging from 7.5% to 10%, and a weighted average discount rate of 8%.
Other income (expenses)
| For the nine months ended | ||||||||||||||||
| September 30, | Increase/(Decrease) | |||||||||||||||
| (in thousands) | 2019 | 2018 | $ | % | ||||||||||||
| Other income (expenses) |
||||||||||||||||
| Preferred distribution income |
$ | — | $ | 440 | $ | (440 | ) | (100.0) | % | |||||||
| Interest income |
6 | 178 | (172 | ) | (96.6) | % | ||||||||||
| Interest expense |
(51,025 | ) | (38,115 | ) | 12,910 | 33.9 | % | |||||||||
| Cost of debt extinguishment |
(1,176 | ) | (101 | ) | 1,075 | >100.0 | % | |||||||||
| Gain on sale of real estate |
16,772 | 9,620 | 7,152 | 74.3 | % | |||||||||||
| Gain on sale of investment in related party |
— | 8,500 | (8,500 | ) | (100.0) | % | ||||||||||
| Internalization expenses |
(1,195 | ) | — | (1,195 | ) | >100.0 | % | |||||||||
Interest expense
The increase in interest expense during the nine months ended September 30, 2019, resulted primarily from an increase in average outstanding borrowings compared to September 30, 2018, due primarily to the incurrence of indebtedness in connection with the Industrial Portfolio Acquisition. The increase in debt is reflective of growth in our portfolio of real estate investments, somewhat mitigated by a decrease in our weighted cost of borrowings, inclusive of interest rate swaps.
Gain on sale of real estate
Our recognition of a gain or loss on the sale of real estate varies from transaction to transaction based on fluctuations in asset prices and demand in the real estate market at the time a property is listed for sale. During
75
Table of Contents
the nine months ended September 30, 2019, we recognized gains of $16.8 million on the sale of 25 properties, compared to gains of $9.6 million on the sale of 15 properties during the nine months ended September 30, 2018.
Gain on sale of investment in related party
During the nine months ended September 30, 2018, we sold our investment of 100 non-voting convertible preferred units of BRE, a related party at such time, to Trident BRE LLC, another related party to BRE, for an aggregate sales price of $18.5 million. The preferred units had a carrying value of $10 million at the time of sale, resulting in a gain of $8.5 million. Prior to the sale, we received preferred distribution income on the preferred units.
Internalization expenses
During the nine months ended September 30, 2019, we incurred $1.2 million of third-party fees and consulting expenses associated with the then pending Internalization.
Comparison of the Year Ended December 31, 2018 and the Year Ended December 31, 2017
Revenues
| Year ended December 31, | Increase/(Decrease) | |||||||||||||||
| 2018 | 2017 | $ | % | |||||||||||||
| Contractual rental amounts billed for operating leases and straight-line rent adjustments |
222,208 | 170,493 | 51,715 | 30.3 | % | |||||||||||
| Operating expenses billed to/reimbursed from tenants |
11,221 | 6,721 | 4,500 | 67.0 | % | |||||||||||
| Other income from real estate transactions |
109 | 208 | (99 | ) | (47.6) | % | ||||||||||
|
|
|
|
|
|
|
|
|
|||||||||
| Total lease revenues from operating leases |
233,538 | 177,422 | 56,116 | 31.6 | % | |||||||||||
| Earned income from direct financing leases |
3,941 | 4,141 | (200 | ) | (4.8) | % | ||||||||||
|
|
|
|
|
|
|
|
|
|||||||||
| Total lease revenues |
$ | 237,479 | $ | 181,563 | $ | 55,916 | 30.8 | % | ||||||||
|
|
|
|
|
|
|
|
|
|||||||||
The increase in revenues for year ended December 31, 2018, was primarily attributable to the growth in our real estate portfolio, which was achieved through rent escalations associated with existing in-place leases, coupled with rental revenue generated from accretive property acquisitions during the year, and continued strong portfolio operating performance. For the year ended December 31, 2018, we closed 26 real estate acquisitions and acquired $606.8 million in real estate, excluding acquisition costs, comprised of 113 new properties.
Operating Expenses
| Year Ended December 31, | Increase/(Decrease) | |||||||||||||||
| (in thousands) | 2018 | 2017 | $ | % | ||||||||||||
| Operating expenses: |
||||||||||||||||
| Depreciation and amortization |
$ | 83,994 | $ | 62,263 | $ | 21,731 | 34.9 | % | ||||||||
| Asset management fees |
18,173 | 14,754 | 3,419 | 23.2 | % | |||||||||||
| Property management fees |
6,529 | 4,988 | 1,541 | 30.9 | % | |||||||||||
| Property and operating expense |
11,157 | 6,505 | 4,652 | 71.5 | % | |||||||||||
| General and administrative |
6,162 | 4,939 | 1,223 | 24.8 | % | |||||||||||
| State and franchise tax |
857 | 624 | 233 | 37.3 | % | |||||||||||
| Provision for impairment of investment in rental properties |
2,061 | 2,608 | (547 | ) | (21.0) | % | ||||||||||
|
|
|
|
|
|
|
|||||||||||
| Total operating expenses |
$ | 128,933 | $ | 96,681 | $ | 32,252 | 33.4 | % | ||||||||
|
|
|
|
|
|
|
|||||||||||
76
Table of Contents
Depreciation and amortization
The increase in depreciation and amortization expense for the year ended December 31, 2018, was primarily due to the growth in our real estate portfolio, as discussed above.
Asset management fees
The increase in asset management fees for the year ended December 31, 2018, is primarily a result of an increase in our total outstanding equity on a fully diluted basis as a result of continued equity capital investments. As of December 31, 2018, there were 23.75 million shares of our Common Stock and non-controlling OP Units outstanding, compared to 20.46 million as of December 31, 2017. In addition, the share value of our Common Stock, which was set by our board of directors, increased from December 31, 2017, to December 31, 2018. The increase in equity capital was used to partially fund the continued growth in our real estate portfolio.
Property management fees
The increase in property management fees for the year ended December 31, 2018, was primarily the result of growth in our portfolio resulting from additional property acquisitions and rent escalations.
Property and operating expense
The increase in property and operating expense for the year ended December 31, 2018, is primarily attributable to the number of properties we own for which we are responsible for paying a majority of ongoing property maintenance, insurance, and real estate tax expenses, which are then reimbursed by tenants under the terms of the respective leases. There was a corresponding increase in operating expenses billed to tenants and included in Lease revenues.
Other income (expenses)
| Year Ended December 31, | Increase/(Decrease) | |||||||||||||||
| (in thousands) | 2018 | 2017 | $ | % | ||||||||||||
| Other income (expenses) |
||||||||||||||||
| Preferred distribution income |
$ | 440 | $ | 737 | $ | (297 | ) | (40.3) | % | |||||||
| Interest income |
179 | 467 | (288 | ) | (61.7) | % | ||||||||||
| Interest expense |
(52,855 | ) | (34,751 | ) | 18,104 | 52.1 | % | |||||||||
| Cost of debt extinguishment |
(101 | ) | (5,151 | ) | (5,050 | ) | (98.0) | % | ||||||||
| Gain on sale of real estate |
10,496 | 12,992 | (2,496 | ) | (19.2) | % | ||||||||||
| Gain on sale of investment in related party |
8,500 | — | 8,500 | >100.0 | % | |||||||||||
| Other (losses) gains |
(100 | ) | 379 | (479 | ) | >100.0 | % | |||||||||
Interest expense
The increase in interest expense for the year ended December 31, 2018, is due primarily to an increase in average outstanding borrowings. Total outstanding debt on our unsecured credit facilities and unsecured senior notes, excluding capitalized debt issuance costs, increased from $1,113.0 million at December 31, 2017, to $1,371.1 million at December 31, 2018, primarily reflecting the issuance of $225 million of Series B Senior Notes and $100 million of Series C Senior Notes in July 2018.
Cost of debt extinguishment
The cost of debt extinguishment represents the difference between the price paid to extinguish debt compared to its carrying value, plus any unamortized debt issuance costs at the time of extinguishment. To the
77
Table of Contents
extent that the price paid to extinguish the debt is greater than the carrying value of debt, we would recognize a loss on extinguishment. The loss would be increased by the amount of previously capitalized debt issuance costs that remain unamortized at the time of extinguishment. To the extent that the price paid to extinguish the debt is less than the carrying value of debt, we would recognize a gain on extinguishment, netted by any unamortized debt issuance costs. These amounts fluctuate period-over-period based on the variability in the interest rate environment, changes in financial institutions’ credit standards, and our activity in capital markets to manage our leverage position.
The decrease in cost of debt extinguishment for the year ended December 31, 2018, is a direct result of costs and fees associated with our renegotiating our credit facility in 2017, whereas we did not have any similar costs or fees in 2018.
Gain on sale of investment in related party
For the year ended December 31, 2018, we sold our entire investment in 100 non-voting convertible preferred units of BRE, a related party at such time, to Trident BRE LLC, another related party of BRE. We sold the preferred units for an aggregate sales price of $18.5 million, which had a carrying value of $10.0 million at the time of sale. Prior to the sale, we had received preferred distribution income on the preferred units.
Liquidity and Capital Resources
Liquidity/REIT Requirements
Liquidity is a measure of our ability to meet potential cash requirements, including our ongoing commitments to repay debt, fund our operations, acquire properties, make distributions to our stockholders, and other general business needs. As a REIT, we are required to distribute to our stockholders at least 90% of our taxable income determined without regard to the dividends paid deduction and excluding net capital gain, on an annual basis. As a result, it is unlikely that we will be able to retain substantial cash balances to meet our liquidity needs from our annual taxable income. Instead, we expect to meet our liquidity needs primarily by relying upon external sources of capital.
Short-term Liquidity Requirements
Our short-term liquidity requirements consist primarily of funds necessary to pay for our operating expenses, including our general and administrative expenses as well as interest payments on our outstanding debt and to pay distributions. Since our portfolio has a strong occupancy level and substantially all of our leases are net leases, we do not currently anticipate making significant capital expenditures or incurring other significant property costs. We expect to meet our short-term liquidity requirements primarily from cash and cash equivalents balances, net cash provided by operating activities, and borrowings under our Revolving Credit Facility.
Long-term Liquidity Requirements
Our long-term liquidity requirements consist primarily of funds necessary to repay debt and invest in additional revenue generating properties. Debt capital is provided through unsecured term notes, revolving debt facilities, and senior unsecured notes. In addition to our current access to bank and private placement debt markets on an unsecured basis, upon completion of this offering, we expect to gain access to the public unsecured bond market that was largely unavailable to us based on the liquidity profile of our previous equity private placement channel.
The source and mix of our debt capital in the future will be impacted by market conditions as well as our continued focus on lengthening our debt maturity profile to better align with our portfolio’s lease terms, staggering debt maturities to reduce the risk that a significant amount of debt will mature in any single year in the future, and managing our exposure to interest rate risk.
78
Table of Contents
We expect to meet our long-term liquidity requirements primarily from borrowings under our Revolving Credit Facility, future debt and equity financings, and proceeds from limited sales of our properties. Our ability to access these capital sources may be impacted by unfavorable market conditions, particularly in the debt and equity capital markets, that are outside of our control. In addition, our success will depend on our operating performance, our borrowing restrictions, our degree of leverage, market perceptions of our Company, and other factors. Our acquisition growth strategy significantly depends on our ability to obtain acquisition-financing on favorable terms. We seek to reduce the risk that long-term debt capital may be unavailable to us by strengthening our balance sheet by investing in real estate with creditworthy tenants and lease guarantors, and by maintaining an appropriate mix of debt and equity capitalization. We also, from time to time, obtain or assume non-recourse mortgage financing from banks and insurance companies secured by mortgages on the corresponding specific property. Mortgages, however, are not currently a strategic focus of the active management of our leverage profile. Rather, we enter into mortgages and notes payable as ancillary business transactions on an as-needed basis, most often as the result of lease assumption transactions.
Pro Forma Liquidity and Capital
As of September 30, 2019, we had on a pro forma basis $ million of cash and cash equivalents. In addition, upon completion of this offering, we expect to have $ million of available borrowing capacity under our Revolving Credit Facility. We believe that following completion of this offering, we will have access to capital sufficient to meet our capital needs for the foreseeable future.
Leverage Policy
Upon completion of this offering, we will have pro forma total debt outstanding of $ million and a pro forma Net Debt to Annualized Adjusted EBITDAre ratio of approximately x. We seek to maintain a prudent balance between debt and equity financing and, following completion of this offering, will seek to maintain on a sustained basis a level of net debt that is generally less than six times our Annualized Adjusted EBITDAre. Our board of directors may from time to time modify our leverage policy in light of then current economic conditions, relative costs of debt and equity capital, changes in the market price of our Common Stock (including our Class A Common Stock), acquisition opportunities, and other factors.
We achieved our current investment grade credit rating based on our conservative leverage profile, diversified real estate investment portfolio, access to capital, and earnings stability provided by the creditworthiness of our tenants. Factors that could negatively impact our credit rating include, but are not limited to: a significant increase in our leverage on a sustained basis, a significant increase in the proportion of secured debt levels, a significant decline in our unencumbered asset base, weakening of our corporate governance structure, and a significant decline in our real estate portfolio diversification or the creditworthiness of our tenants. Factors that could positively impact our credit rating include, but are not limited to, continued growth in the portfolio, improvement in our leverage and Net Debt ratios, lengthening of our debt maturity profile, and our Internalization. We have aligned our strategic growth priorities with these factors, as we believe the favorable debt pricing and access to multiple sources of debt capital resulting from our investment grade credit rating provides us with an advantageous cost of capital and risk-adjusted return on investment for our stockholders.
Debt to be Outstanding After This Offering
Upon completion of this offering, we will have pro forma debt outstanding of approximately $ million. Our pro forma debt will consist of approximately $ million of unsecured debt and approximately $ million of secured debt. The weighted average annual interest rate on our pro forma debt will be %. Approximately % of our pro forma debt will be fixed rate debt or hedged through interest rate swaps.
79
Table of Contents
The following table sets forth certain information about our pro forma debt to be outstanding after this offering.
| (in thousands, except interest rates) | Outstanding Balance (Pro forma) |
Interest Rate |
Maturity Date |
|||||||
| Credit Facility |
||||||||||
| Revolving Credit Facility |
one-month LIBOR + 1.20% | Jan. 2022 | ||||||||
| 2023 Unsecured Term Loan |
265,000 | one-month LIBOR + 1.35% | Jan. 2023 | |||||||
| 2024 Unsecured Term Loan |
190,000 | one-month LIBOR + 1.25% | Jun. 2024 | |||||||
|
|
|
|||||||||
|
|
|
|||||||||
| 2026 Unsecured Term Loan |
450,000 | one-month LIBOR + 1.85% | Feb. 2026 | |||||||
|
|
|
|||||||||
| Senior Notes |
||||||||||
| Series A |
150,000 | 4.84% | Apr. 2027 | |||||||
| Series B |
225,000 | 5.09% | Jul. 2028 | |||||||
| Series C |
100,000 | 5.19% | Jul. 2030 | |||||||
|
|
|
|||||||||
| 475,000 | ||||||||||
|
|
|
|||||||||
| Total |
||||||||||
|
|
|
|||||||||
Description of Certain Debt to be Outstanding After This Offering
The following is a summary of the material provisions of our current debt facilities (which encompass the Revolving Credit Facility, the 2023 Unsecured Term Loan, and the 2024 Unsecured Term Loan), the 2026 Unsecured Term Loan, and the senior notes.
Revolving Credit Facility
The Revolving Credit Facility has a maximum availability of $ , and includes a $35 million sublimit for swingline loans and $20 million available for issuance of letters of credit. The Revolving Credit Facility has an initial maturity date of January 2022 and provides for one five-month extension, at our election, subject to certain conditions set forth in the agreement and payment of a 0.0625% fee on the revolving commitments. As shown in the table below, the Revolving Credit Facility contains an applicable facility fee ranging between 0.125% and 0.30% per annum, based on our credit rating. Based on our current credit rating of Baa3, the facility fee is 0.25% per annum as of September 30, 2019.
| Level |
Credit Rating (S&P/Moody’s) |
Applicable Facility Fee | ||
| I |
A-/A3 or better | 0.125% | ||
| II |
BBB+/Baa1 | 0.15% | ||
| III |
BBB/Baa2 | 0.20% | ||
| IV |
BBB-/Baa3 | 0.25% | ||
| V |
Lower than BBB-/Baa3 | 0.30% |
As shown in the table below, borrowings on the Revolving Credit Facility bear interest at variable rates based on LIBOR plus a margin based on our credit rating ranging between 0.825% and 1.55% per annum. Based on our current credit rating, the applicable margin is 1.20% as of September 30, 2019.
| Level |
Credit Rating (S&P/Moody’s) |
Applicable Margin for LIBOR Loans | ||
| I |
A-/A3 or better | 0.825% | ||
| II |
BBB+/Baa1 | 0.875% | ||
| III |
BBB/Baa2 | 1.00% | ||
| IV |
BBB-/Baa3 | 1.20% | ||
| V |
Lower than BBB-/Baa3 | 1.55% |
80
Table of Contents
2023 Unsecured Term Loan
The 2023 Unsecured Term loan has an initial maturity date of January 2023. As shown in the table below, borrowings under the 2023 Unsecured Term Loan bear interest at variable rates based on LIBOR plus a margin based on our credit rating ranging between 0.90% and 1.75% per annum. Based on our current credit rating, the applicable margin is 1.35% as of September 30, 2019.
| Level |
Credit Rating (S&P/Moody’s) |
Applicable Margin for LIBOR Loans | ||
| I |
A-/A3 or better | 0.90% | ||
| II |
BBB+/Baa1 | 0.95% | ||
| III |
BBB/Baa2 | 1.10% | ||
| IV |
BBB-/Baa3 | 1.35% | ||
| V |
Lower than BBB-/Baa3 | 1.75% |
2024 Unsecured Term Loan
The 2024 Unsecured Term Loan has an initial maturity date of June 2024. As shown in the table below, borrowings under the 2024 Unsecured Term Loan are subject to interest at variable rates based on LIBOR plus a margin based on our credit rating ranging between 0.85% and 1.65% per annum. Based on our current credit rating, the applicable margin is 1.25% as of September 30, 2019.
| Level |
Credit Rating (S&P/Moody’s) |
Applicable Margin for LIBOR Loans | ||
| I |
A-/A3 or better | 0.85% | ||
| II |
BBB+/Baa1 | 0.90% | ||
| III |
BBB/Baa2 | 1.00% | ||
| IV |
BBB-/Baa3 | 1.25% | ||
| V |
Lower than BBB-/Baa3 | 1.65% |
2026 Unsecured Term Loan
The 2026 Unsecured Term Loan includes an accordion feature that provides for an increase in the facility size up to a total of $550 million of available capacity. Borrowings under the 2026 Unsecured Term Loan are payable interest only on a monthly basis during the term of the loan, with the principal amount due in February 2026. As shown in the table below, borrowings under the 2026 Unsecured Term loan bear interest equal to LIBOR plus a margin based on our credit rating ranging between 1.45% and 2.40% per annum. Based on our current grade credit rating, the applicable margin is 1.85% as of September 30, 2019.
| Level |
Credit Rating (S&P/Moody’s) |
Applicable Margin for LIBOR Loans | ||
| I |
A-/A3 or better | 1.45% | ||
| II |
BBB+/Baa1 | 1.50% | ||
| III |
BBB/Baa2 | 1.60% | ||
| IV |
BBB-/Baa3 | 1.85% | ||
| V |
Lower than BBB-/Baa3 | 2.40% |
Senior Notes
To mitigate interest rate risk, we have strategically added unsecured, fixed-rate, interest-only senior promissory notes (“Senior Notes”) to our capital structure. The Senior Notes were issued in three series (Series A, B, and C) as described below.
81
Table of Contents
Series A Notes
The Series A Notes are payable interest only semiannually during their term, bear interest at a fixed rate of 4.84% per annum, and mature on April 18, 2027.
Series B and Series C Notes
The Series B Notes mature on July 2, 2028, and the Series C Notes mature on July 2, 2030. The Series B and Series C Notes are payable interest only semiannually during their term, and bear interest at fixed rates of 5.09% per annum and 5.19% per annum, respectively.
Debt Covenants
We are subject to various covenants and financial reporting requirements pursuant to our debt facilities. The table below summarizes the applicable financial covenants, which are substantially the same across each of our debt facilities. As of September 30, 2019, and December 31, 2018, we were in compliance with all of our covenants. In the event of default, either through default on payments or breach of covenants, we may be restricted from paying dividends to our stockholders in excess of dividends required to maintain our REIT qualification. For each of the previous three years, we paid dividends out of our cash flows from operations in excess of the distribution amounts required to maintain our REIT qualification.
| Covenants |
Required | Actual (as of September 30, 2019) |
Actual (as of December 31, 2018) | |||
| Leverage Ratio (1) |
£ 0.60 to 1.00 | 0.52 | 0.43 | |||
| Secured Indebtedness Ratio (2) |
£ 0.40 to 1.00 | 0.03 | 0.02 | |||
| Unencumbered Coverage Ratio (3) |
³ 1.75 to 1.00 | 3.52 | 4.07 | |||
| Fixed Charge Coverage Ratio (4) |
³ 1.50 to 1.00 | 2.84 | 3.02 | |||
| Total Unsecured Indebtedness to Total Unencumbered Eligible Property Value (5) |
£ 0.60 to 1.00 | 0.54 | 0.48 | |||
| Dividends and Other Restricted Payments |
Only applicable in case of default |
Not Applicable |
Not Applicable |
| (1) | The leverage ratio is calculated as the ratio of total indebtedness to total market value. For debt covenant purposes, total market value is computed on a consolidated basis as the net operating income for the most recently completed fiscal quarter on properties owned for four consecutive quarters at a capitalization rate of 7.50%, multiplied by four, plus the acquisition price of properties acquired in the last four quarters, and the GAAP book value of mortgages receivable, development property, unimproved real estate, unrestricted cash and cash equivalents, and all other tangible assets (the latter subject to a cap of 5% of total market value). For purposes of determining total market value, net operating income from properties disposed of during the immediately preceding period of four consecutive fiscal quarters are excluded. |
| (2) | The secured indebtedness ratio is the ratio of secured indebtedness to total market value. Secured indebtedness represents outstanding mortgage borrowings. |
| (3) | The unencumbered coverage ratio is the ratio of net operating income for all eligible properties to unsecured interest expense for the most recent fiscal quarter. |
| (4) | The fixed charge coverage ratio is the ratio of adjusted EBITDA to fixed charges for the most recent fiscal quarter. Adjusted EBITDA is computed as net income adjusted for depreciation and amortization, interest expense, income tax expense and franchise tax expense, gains and losses from the sale of properties, equity in net income of unconsolidated subsidiaries, non-cash expenses related to mark to market exposure under derivatives contracts, straight-line rent adjustments, amortization of intangibles, gains and losses on early extinguishment of debt, non-cash severance and restructuring charges, transaction costs expensed, and reserves for replacements with respect to certain properties. Fixed charges are computed as interest expense, |
82
Table of Contents
| plus scheduled principal repayments of debt, excluding balloon payments if applicable, plus preferred dividends paid or accrued, if applicable. |
| (5) | The ratio is calculated as the ratio of total unsecured indebtedness to unencumbered property value. |
Derivative Instruments and Hedging Activities
We are exposed to interest rate risk arising from changes in interest rates on the floating-rate borrowings under our unsecured credit facilities and a certain mortgage. Borrowings pursuant to our unsecured credit facilities and the mortgage bear interest at floating rates based on LIBOR plus an applicable margin. Accordingly, fluctuations in market interest rates may increase or decrease our interest expense, which will in turn, increase or decrease our net income and cash flow.
We attempt to manage our interest rate risk by entering into interest rate swaps. As of September 30, 2019, we had 34 interest rate swaps outstanding in an aggregate notional amount of $909.9 million. Under these agreements, we receive monthly payments from the counterparties equal to the related variable interest rates multiplied by the outstanding notional amounts. In turn, we pay the counterparties each month an amount equal to a fixed interest rate multiplied by the related outstanding notional amounts. The intended net impact of these transactions is that we pay a fixed interest rate on our variable-rate borrowings. The interest rate swaps have been designated by us as cash flow hedges for accounting purposes and are reported at fair value. We assess, both at inception and on an ongoing basis, the effectiveness of our qualifying cash flow hedges. We have not entered, and do not intend to enter, into derivative or interest rate transactions for speculative purposes.
Cash Flows
Cash, cash equivalents and restricted cash totaled $44.1 million at September 30, 2019 as compared to $19.0 million at December 31, 2018. Cash, cash equivalents and restricted cash totaled $28.0 million at September 30, 2018 as compared to $10.1 million at December 31, 2017. The table below shows information concerning cash flows for the nine months ended September 30, 2019 and 2018, and the years ended December 31, 2018 and 2017:
| For the nine months ended September 30, |
For the years ended December 31, |
|||||||||||||||
| (In thousands) | 2019 | 2018 | 2018 | 2017 | ||||||||||||
| Net cash provided by operating activities |
$ | 110,933 | $ | 93,517 | $ | 128,011 | $ | 97,940 | ||||||||
| Net cash used in investing activities |
(870,227 | ) | (274,590 | ) | (510,459 | ) | (611,835 | ) | ||||||||
| Net cash provided by financing activities |
784,420 | 199,002 | 391,338 | 500,891 | ||||||||||||
|
|
|
|
|
|
|
|
|
|||||||||
| Increase in cash and cash equivalents and restricted cash |
$ | 25,126 | $ | 17,929 | $ | 8,890 | $ | (13,004 | ) | |||||||
|
|
|
|
|
|
|
|
|
|||||||||
The increase in net cash provided by operating activities during the nine months ended September 30, 2019 and year ended December 31, 2018, as compared to the comparable prior year periods, was mainly due to increased revenues associated with growth in our real estate portfolio.
The increase in cash used in investing activities in the nine months ended September 30, 2019 as compared to the nine months ended September 30, 2018, reflected increased outflows for the acquisition of properties (most notably the Industrial Portfolio Acquisition). In addition, during the 2018 period, we received $18.5 million from the sale of our investment in preferred units of BRE, with no such cash inflow in 2019. These factors were somewhat offset by increased proceeds from the disposal of properties as we actively manage our balance sheet following the Industrial Portfolio Acquisition. The decrease in cash used in investing activities for the year ended December 31, 2018 as compared to the year ended December 31, 2017, mainly reflected lower outflows for the acquisition of properties combined with the cash received on the sale of the preferred units of BRE.
83
Table of Contents
The increase in cash provided by financing activities in the nine months ended September 30, 2019 as compared to the nine months ended September 30, 2018, mainly reflects net incremental borrowings and increased proceeds from the issuance of our Common Stock, which were used to fund the increased acquisition activity, partially offset by increased distributions resulting from an increase in the number of shares of Common Stock outstanding. The decrease in cash provided by financing activities for the year ended December 31, 2018 as compared to the year ended December 31, 2017, mainly reflected lower net borrowings due to lower acquisition volume, combined with lower proceeds from the sale of Common Stock reflective of the equity cap and queue program that we had instituted in November 2017 to better match fund inflows from equity investments with outflows for acquisitions.
Off-Balance Sheet Arrangements
We had no off-balance sheet arrangements as of September 30, 2019, or December 31, 2018.
Contractual Obligations
The following table provides information with respect to our contractual commitments and obligations as of September 30, 2019 (dollar amounts in thousands), on a pro forma basis.
| Year of Maturity |
Term Loans (a) | Revolver (b) | Senior Notes |
Mortgages and Notes Payable |
Interest Expense (c) |
Tenant Improvement Allowances (d) |
Operating Leases |
Total | ||||||||||||||||||||||||
| Remainder of 2019 |
$ | $ | $ | $ | $ | $ | $ | $ | ||||||||||||||||||||||||
| 2020 |
||||||||||||||||||||||||||||||||
| 2021 |
||||||||||||||||||||||||||||||||
| 2022 |
||||||||||||||||||||||||||||||||
| 2023 |
||||||||||||||||||||||||||||||||
| Thereafter |
||||||||||||||||||||||||||||||||
|
|
|
|
|
|
|
|
|
|
|
|
|
|
|
|
|
|||||||||||||||||
| Total |
$ | $ | $ | $ | $ | $ | $ | $ | ||||||||||||||||||||||||
|
|
|
|
|
|
|
|
|
|
|
|
|
|
|
|
|
|||||||||||||||||
| (a) | We may extend the 2020 Unsecured Term Loan twice, each time for a six-month period, subject to certain conditions, including the payment of an extension fee equal to 0.05% of the aggregate principal amount of loans outstanding. |
| (b) | We may extend the Revolver once, for a five-month period, subject to certain conditions, including the payment of an extension fee equal to 0.0625% of the revolving commitments. |
| (c) | Interest expense is projected based on the outstanding borrowings and interest rates in effect as of September 30, 2019. This amount includes the impact of interest rate swap agreements. |
| (d) | We expect to pay tenant improvement allowances out of cash flows from operations or from additional borrowings. |
Additionally, we are a party to three separate tax protection agreements with the contributing members of three distinct UPREIT transactions and we expect to enter into the Founding Owners’ Tax Protection Agreement with the Founding Owners in connection with the Internalization. The tax protection agreements require us to indemnify the beneficiaries in the event of a sale, exchange, transfer, or other disposal of the contributed property, or in the case of the Founding Owners’ Tax Protection Agreement, the entire Company, in a taxable transaction that would cause such beneficiaries to recognize a gain that is protected under the agreements, subject to certain exceptions. Based on values as of September 30, 2019, on a pro forma basis, taxable sales would trigger liability under the four tax protection agreements of approximately $22.3 million. Based on information available, we do not believe that the events resulting in damages as detailed above have occurred or are likely to occur in the foreseeable future. Accordingly, we have excluded these commitments from the contractual commitments table above.
84
Table of Contents
We may enter into commitments to purchase goods and services in connection with the operation of our business. Those commitments generally have terms of one-year or less and reflect expenditure levels comparable to our historical expenditures.
Critical Accounting Policies and Estimates
The preparation of our consolidated financial statements in conformance with GAAP requires management to make estimates and assumptions that affect the reported amounts of assets, liabilities, revenues, and expenses as well as other disclosures in the financial statements. On an ongoing basis, management evaluates its estimates and assumptions; however, actual results may differ from these estimates and assumptions, which in turn could have a material impact on our financial statements. A summary of our significant accounting policies and procedures are included in Note 2, “Summary of Significant Accounting Policies”, contained in the financial statements included elsewhere in this prospectus. Management believes the following critical accounting policies, among others, affect its more significant estimates and assumptions used in the preparation of our consolidated financial statements.
Investments in Rental Property
We record investments in rental property accounted for under operating leases at cost. We record investments in rental property accounted for under direct financing leases at their net investment (which at the inception of the lease generally represents the cost of the property).
We early adopted ASU 2017-01, Business Combinations (Topic 805): Clarifying the Definition of a Business (“ASU 2017-01”), on a prospective basis, effective January 1, 2017. The guidance changes the definition of a business to exclude acquisitions where substantially all of the fair value of the assets acquired are concentrated in a single identifiable asset or group of similar identifiable assets, and therefore are accounted for as asset acquisitions instead of business combinations. All of our acquisitions of real estate closed subsequent to adopting ASU 2017-01 are accounted for as asset acquisitions. The Internalization will be accounted for as the acquisition of a business.
We allocate the purchase price of investments in rental property accounted for as an asset acquisition based on the relative fair value of the assets acquired and liabilities assumed. These generally include tangible assets, consisting of land and land improvements, buildings and other improvements, and equipment, and identifiable intangible assets and liabilities, including the value of in-place leases and acquired above-market and below-market leases. Acquisition costs incurred in connection with investments in real estate accounted for as asset acquisitions are capitalized and included with the allocated purchase price. The results of operations of acquired properties are included in the Consolidated Statements of Income and Comprehensive Income from the respective date of acquisition.
We allocate the purchase price of investments in rental property accounted for as a business combination based on the estimated fair value at the date of the acquisition of the assets acquired and liabilities assumed. These generally include tangible assets, consisting of land and land improvements, buildings and other improvements, and equipment, and identifiable intangible assets and liabilities, including the value of in-place leases and acquired above-market and below-market leases. We anticipate that the purchase price of the Internalization will mainly be allocated to goodwill. Acquisition costs incurred in connection with business combinations are expensed at the time of acquisition. The results of operations of acquired businesses are included in the Consolidated Statements of Income and Comprehensive Income from the respective date of acquisition.
We use multiple sources to estimate fair value, including information obtained about each property as a result of our pre-acquisition due diligence and our marketing and leasing activities. Factors that impact our fair value determination include real estate market conditions, industry conditions that the tenant operates in, and
85
Table of Contents
characteristics of the real estate and/or real estate appraisals. Changes in any of these factors could impact the future purchase prices of our investments and the corresponding capitalization rates recognized. We do not believe the assumptions used to fair value the investments upon acquisition have a significant degree of estimation uncertainty.
We determine the fair value of tangible assets of an acquired property by valuing the property as if it were vacant. Management then allocates the as-if-vacant value to land and land improvements, buildings, and equipment based on comparable sales and other relevant information with respect to the property, as estimated by management. Specifically, the “if vacant” value of buildings and equipment is calculated using an income approach. Assumptions used in the income approach to value buildings include: capitalization and discount rates, lease-up time, market rents, make ready costs, land value, and land improvement value.
The estimated fair value of acquired in-place leases equals the costs we would have had to incur to lease the properties to the occupancy level of the properties at the date of acquisition. Such costs include the fair value of leasing commissions and other operating costs that would have been incurred to lease the properties, had they been vacant, to their acquired occupancy level. We amortize acquired in-place leases as of the date of acquisition over the remaining initial non-cancellable terms of the respective leases to amortization expense.
We record acquired above-market and below-market lease values based on the present value (using an interest rate that reflects the risks associated with the lease acquired) of the differences between the contractual amounts to be paid pursuant to the in-place leases and management’s estimate of fair market value lease rates at the time of acquisition for the corresponding in-place leases. We amortize the capitalized above-market and below-market lease values as adjustments to rental revenue over the remaining term of the respective leases.
Should a tenant terminate its lease, we charge the unamortized portion of the in-place lease value to amortization expense and we charge the unamortized portion of above-market or below-market lease value to rental revenue.
Management estimates the fair value of assumed mortgages and notes payable based upon indications of then-current market pricing for similar types of debt with similar maturities. We record assumed mortgages and notes payable at their estimated fair value as of the assumption date, and the difference between the estimated fair value and the notes’ outstanding principal balance is amortized to interest expense over the remaining term of the debt.
Long-lived Asset Impairment
We review long-lived assets to be held and used for possible impairment when events or changes in circumstances indicate that their carrying amounts may not be recoverable. If, and when, such events or changes in circumstances are present, an impairment exists to the extent the carrying value of the asset or asset group exceeds the sum of the undiscounted cash flows expected to result from the use of the asset or asset group and its eventual disposition. Such cash flows include factors such as expected future operating income, as adjusted for trends and prospects, as well as the effects of demand, competition, and other factors. An impairment loss is measured as the amount by which the carrying amount of the asset or asset group exceeds the fair value of the asset or asset group. A significant judgement is made as to if and when impairment should be taken. If our strategy, or one or more of the assumptions described above were to change in the future, an impairment may need to be recognized.
Inputs used in establishing fair value for impaired real estate assets generally fall within Level 3 of the fair value hierarchy, which are characterized as requiring significant judgment as little or no current market activity may be available for validation. The main indicator used to establish the classification of the inputs is current market conditions, as derived through our use of published commercial real estate market information. We determine the valuation of impaired assets using generally accepted valuation techniques including discounted
86
Table of Contents
cash flow analysis, income capitalization, analysis of recent comparable sales transactions, actual sales negotiations, and bona fide purchase offers received from third parties. We may consider a single valuation technique or multiple valuation techniques, as appropriate, when estimating the fair value of real estate.
During the years ended December 31, 2018, 2017, and 2016, we recorded impairment charges of $2.1 million, $2.6 million, and zero, respectively, which resulted from non-payment of past due rental amounts, concerns over the respective tenants’ future viability, and changes to the overall investment strategy for certain real estate assets. In determining the fair value of the real estate assets at the time of measurement, we utilized capitalization rates ranging from 7.25% to 12.0% and a weighted average discount rate of 8.0%, which are Level 3 inputs. We believe the uncertainty in the future cash flows was reflected in the significant capitalization rate, and the estimates were based on the information available at the time of impairment. One of the properties for which an impairment charge was recorded in 2017, was subsequently sold in 2018. The assumptions we used in determining the amount of the impairment charge on this property were validated upon the subsequent sale, which was at a value consistent with our originally estimated impaired value.
Revenue Recognition
The Company commences revenue recognition on its leases based on a number of factors, including the initial determination that the contract is or contains a lease. Generally, all of the Company’s property related contracts are or contain leases, and therefore revenue is recognized when the lessee takes possession of or controls the physical use of the leased assets. In most instances this occurs on the lease commencement date. At the time of lease assumption or at the inception of a new lease, including new leases that arise from amendments, the Company assesses the terms and conditions of the lease to determine the proper lease classification.
Certain of the Company’s leases require tenants to pay rent based upon a percentage of the property’s net sales (“percentage rent”) or contain rent escalators indexed to future changes in the CPI. Lease income associated with such provisions is considered variable lease income and therefore is not included in the initial measurement of the lease receivable, or in the calculation of straight-line rent revenue. Such amounts are recognized as income when the amounts are determinable.
We adopted the provisions of Accounting Standards Update (“ASU”) 2016-02, Leases (Topic 842) and related ASUs subsequently issued (collectively, “ASC 842”) as of January 1, 2019.
Leases Executed on or After Adoption of ASC 842
A lease is classified as an operating lease if none of the following criteria are met: (i) ownership transfers to the lessee at the end of the lease term, (ii) the lessee has a purchase option that is reasonably expected to be exercised, (iii) the lease term is for a major part of the economic life of the leased property, (iv) the present value of the future lease payments and any residual value guaranteed by the lessee that is not already reflected in the lease payments equals or exceeds substantially all of the fair value of the leased property, and (v) the leased property is of such a specialized nature that it is expected to have no future alternative use to the Company at the end of the lease term. If one or more of these criteria are met, the lease will generally be classified as a sales-type lease, unless the lease contains a residual value guarantee from a third party other than the lessee, in which case it would be classified as a direct financing lease under certain circumstances in accordance with ASC 842.
ASC 842 requires the Company to account for the right to use land as a separate lease component, unless the accounting effect of doing so would be insignificant. Determination of significance requires management judgment. In determining whether the accounting effect of separately reporting the land component from other components for its real estate leases is significant, the Company assesses: (i) whether separating the land component impacts the classification of any lease component, (ii) the value of the land component in the context of the overall contract, and (iii) whether the right to use the land is coterminous with the rights to use the other assets.
87
Table of Contents
Leases Executed Prior to Adoption of ASC 842
A lease arrangement was classified as an operating lease if none of the following criteria were met: (i) ownership transferred to the lessee prior to or shortly after the end of the lease term, (ii) the lessee had a bargain purchase option during or at the end of the lease term, (iii) the lease term was greater than or equal to 75% of the underlying property’s estimated useful life, or (iv) the present value of the future minimum lease payments (excluding executory costs) was greater than or equal to 90% of the fair value of the leased property. If one or more of these criteria were met, and the minimum lease payments were determined to be reasonably predictable and collectible, the lease arrangement was generally accounted for as a direct financing lease. Consistent with ASC 840, Leases, if the fair value of the land component was 25% or more of the total fair value of the leased property, the land was considered separately from the building for purposes of applying the lease term and minimum lease payments criterion in (iii) and (iv) above.
Revenue recognition methods for operating leases, direct financing leases, and sales-type leases are described below:
Rental property accounted for under operating leases—Revenue is recognized as rents are earned on a straight-line basis over the non-cancelable terms of the related leases. For leases that have fixed and measurable rent escalations, the difference between such rental income earned and the cash rent due under the provisions of the lease is recorded as Accrued rental income on the Condensed Consolidated Balance Sheets.
Rental property accounted for under direct financing leases—The Company utilizes the direct finance method of accounting to record direct financing lease income. The net investment in the direct financing lease represents receivables for the sum of future lease payments to be received and the estimated residual value of the leased property, less unamortized unearned income (which represents the difference between undiscounted cash flows and discounted cash flows). Unearned income is deferred and amortized into income over the lease terms so as to produce a constant periodic rate of return on the Company’s net investment in the leases.
Rental property accounted for under sales-type leases—For leases accounted for as sales-type leases, the Company records selling profit arising from the lease at inception, along with the net investment in the lease. The Company leases assets through the assumption of existing leases or through sale-leaseback transactions, and records such assets at their fair value at the time of acquisition, which in most cases coincides with lease inception. As a result, the Company does not generally recognize selling profit on sales-type leases. The net investment in the sales-type lease represents receivables for the sum of future lease payments and the estimated unguaranteed residual value of the leased property, each measured at net present value. Interest income is recorded over the lease terms so as to produce a constant periodic rate of return on the Company’s net investment in the leases.
Certain of the Company’s contracts contain nonlease components (e.g., charges for management fees, common area maintenance, and reimbursement of third-party maintenance expenses) in addition to lease components (i.e., monthly rental charges). Services related to nonlease components are provided over the same period of time as, and billed in the same manner as, monthly rental charges. The Company elected to apply the practical expedient available under ASC 842, for all classes of assets, not to separate the lease components from the nonlease components when accounting for operating leases. Since the lease component is the predominant component under each of these leases, combined revenues from both the lease and nonlease components are reported as Lease revenues in the accompanying Condensed Consolidated Statements of Income and Comprehensive Income.
Derivative Instruments and Hedging
Management uses interest rate swap agreements to manage risks related to interest rate movements on our variable-rate debt. The interest rate swap agreements, designated and qualifying as cash flow hedges, are reported
88
Table of Contents
at fair value. We adopted ASU 2017-12, Derivatives and Hedging (Topic 815): Targeted Improvements to Accounting and Hedging Activities, effective January 1, 2018 on a modified retrospective basis. ASU 2017-12 amended the designation and measurement guidance for qualifying hedging transactions and the presentation of hedge results in an entity’s financial statements.
Prior to the adoption of ASU 2017-12, the gain or loss on the effective portion of the hedge was initially included as a component of other comprehensive income or loss and was subsequently reclassified into earnings when interest payments on the related debt were incurred and as the swap net settlements occurred. If and when there was ineffectiveness realized on a swap agreement, the Company recognized the ineffectiveness as a component of interest expense in the period incurred.
ASU 2017-12 removed the concept of separately measuring and reporting hedge ineffectiveness and requires a company to present the earnings effect of the hedging instrument in the same income statement line item in which the earnings effect of the hedged item is reported. In accordance with ASU 2017-12, the gain or loss on the qualifying hedges is initially included as a component of other comprehensive income or loss and is subsequently reclassified into earnings when interest payments (the forecasted transactions) on the related debt are incurred and as the swap net settlements occur.
When an existing cash flow hedge is terminated, we determine the accounting treatment for the accumulated gain or loss recognized in accumulated other comprehensive income, based on the probability of the hedged forecasted transaction occurring within the period the cash flow hedge was anticipated to affect earnings. If management determines that the hedged forecasted transaction is probable of occurring during the original period, the accumulated gain or loss is reclassified into earnings over the remaining life of the cash flow hedge using a straight-line method, which approximates an effective interest method. If management determines that the hedged forecasted transaction is not probable of occurring during the original period, the entire amount of accumulated gain or loss is reclassified into earnings in the period the cash flow hedge is terminated.
Management documents its risk management strategy and hedge effectiveness at the inception of and during the term of each hedge. Our interest rate risk management strategy is intended to stabilize cash flow requirements by maintaining interest rate swap agreements to convert certain variable-rate debt to a fixed rate.
The other information presented below is being filed as a result of the Company’s adoption of ASC 842 on January 1, 2019. As part of that adoption, the Company elected the available practical expedient, for all classes of assets, not to separate lease components in contracts from the nonlease components in those contracts, when recording revenues associated with operating leases where it is the lessor. Since the lease component is the predominant component under the Company’s leases, combined revenues from both the lease and nonlease components are accounted for in accordance with ASC 842 and will be reported in all periods subsequent to the adoption of the new accounting guidance in a single caption, “Lease revenues,” on the Company’s Consolidated Statements of Income and Comprehensive Income. The presentation and disclosure of Lease revenues have been adjusted to reflect these changes for the three and nine months ended September 30, 2019. Refer to Reclassifications in Note 2 of Part I, Item 1. “Financial Statements,” for further details on these updates to significant accounting policies.
This information is intended to assist investors in making comparisons of the Company’s historical financial information with future financial information. The reported financial information below has been revised to conform to the current presentation.
89
Table of Contents
This table below summarizes total revenues as originally reported in the Consolidated Statements of Income and Comprehensive Income included in the Company’s 2018 Annual Report on Form 10-K, as follows (in thousands):
As originally reported
| For the years ended December 31, | ||||||||||||
| 2018 | 2017 | 2016 | ||||||||||
| Revenues |
||||||||||||
| Rental income from operating leases |
$ | 222,208 | $ | 170,493 | $ | 133,943 | ||||||
| Earned income from direct financing leases |
3,941 | 4,141 | 4,544 | |||||||||
| Operating expenses reimbursed from tenants |
11,221 | 6,721 | 4,173 | |||||||||
| Other income from real estate transactions |
109 | 208 | 209 | |||||||||
|
|
|
|
|
|
|
|||||||
| Total revenues |
$ | 237,479 | $ | 181,563 | $ | 142,869 | ||||||
|
|
|
|
|
|
|
|||||||
As revised
| For the years ended December 31, | ||||||||||||
| 2018 | 2017 | 2016 | ||||||||||
| Revenues |
||||||||||||
| Lease revenues |
$ | 237,479 | $ | 181,563 | $ | 142,869 | ||||||
Recently Issued Accounting Pronouncements
See “Note 2—Summary of Significant Accounting Policies” to our consolidated financial statements included elsewhere in this prospectus for a discussion of recent accounting pronouncements.
Quantitative and Qualitative Disclosures About Market Risk
We are exposed to interest rate risk arising from changes in interest rates on the floating-rate borrowings under our unsecured credit facilities and a certain mortgage. Borrowings pursuant to our unsecured credit facilities and the floating-rate mortgage bear interest at floating rates based on LIBOR plus an applicable margin. Accordingly, fluctuations in market interest rates may increase or decrease our interest expense, which will in turn, increase or decrease our net income and cash flow.
We manage a portion of our interest rate risk by entering into interest rate swaps. Our interest rate risk management strategy is intended to stabilize cash flow requirements by maintaining interest rate swaps to convert certain variable-rate debt to a fixed rate. As of September 30, 2019, we had 34 interest rate swaps outstanding, in an aggregate notional amount of $909.9 million. Under these agreements, we receive monthly payments from the counterparties equal to the related variable interest rates multiplied by the outstanding notional amounts. In turn, we pay the counterparties each month an amount equal to a fixed interest rate multiplied by the related outstanding notional amounts. The intended net impact of these transactions is that we pay a fixed interest rate on our variable-rate borrowings. The interest rate swaps have been designated by us as cash flow hedges for accounting purposes and are reported at fair value. We assess, both at inception and on an ongoing basis, the effectiveness of our qualifying cash flow hedges. We have not entered, and do not intend to enter, into derivative or interest rate transactions for speculative purposes.
90
Table of Contents
The table below summarizes the terms of our interest rate swaps at September 30, 2019.
| (in thousands, except interest rates) | ||||||||||||||||||||
| Counterparty |
Maturity Date | Fixed Rate |
Variable Rate Index | Notional Amount |
Fair Value | |||||||||||||||
| Bank of America, N.A. |
November 2023 | 2.80 | % | one-month LIBOR | $ | 25,000 | $ | (1,389 | ) | |||||||||||
| Bank of Montreal |
July 2024 | 1.16 | % | one-month LIBOR | 40,000 | 421 | ||||||||||||||
| Bank of Montreal |
January 2025 | 1.91 | % | one-month LIBOR | 25,000 | (694 | ) | |||||||||||||
| Bank of Montreal |
July 2025 | 2.32 | % | one-month LIBOR | 25,000 | (1,333 | ) | |||||||||||||
| Bank of Montreal |
January 2026 | 1.92 | % | one-month LIBOR | 25,000 | (833 | ) | |||||||||||||
| Bank of Montreal |
January 2026 | 2.05 | % | one-month LIBOR | 40,000 | (1,643 | ) | |||||||||||||
| Bank of Montreal |
December 2026 | 2.33 | % | one-month LIBOR | 10,000 | (662 | ) | |||||||||||||
| Bank of Montreal |
December 2026 | 1.99 | % | one-month LIBOR | 25,000 | (1,058 | ) | |||||||||||||
| Bank of Montreal |
December 2027 | 2.37 | % | one-month LIBOR | 25,000 | (1,905 | ) | |||||||||||||
| Bank of Montreal |
May 2029 | 2.09 | % | one-month LIBOR | 25,000 | (1,502 | ) | |||||||||||||
| Capital One, National Association |
December 2021 | 1.05 | % | one-month LIBOR | 15,000 | 133 | ||||||||||||||
| Capital One, National Association |
December 2024 | 1.58 | % | one-month LIBOR | 15,000 | (165 | ) | |||||||||||||
| Capital One, National Association |
January 2026 | 2.08 | % | one-month LIBOR | 35,000 | (1,515 | ) | |||||||||||||
| Capital One, National Association |
April 2026 | 2.68 | % | one-month LIBOR | 15,000 | (1,243 | ) | |||||||||||||
| Capital One, National Association |
July 2026 | 1.32 | % | one-month LIBOR | 35,000 | 118 | ||||||||||||||
| Capital One, National Association |
December 2027 | 2.37 | % | one-month LIBOR | 25,000 | (1,932 | ) | |||||||||||||
| M&T Bank |
August 2021 | 1.02 | % | one-month LIBOR | 4,948 | 42 | ||||||||||||||
| M&T Bank |
September 2022 | 2.83 | % | one-month LIBOR | 25,000 | (1,031 | ) | |||||||||||||
| M&T Bank |
November 2023 | 2.65 | % | one-month LIBOR | 25,000 | (1,284 | ) | |||||||||||||
| Regions Bank |
May 2020 | 2.12 | % | one-month LIBOR | 50,000 | (104 | ) | |||||||||||||
| Regions Bank |
December 2023 | 1.18 | % | one-month LIBOR | 25,000 | 199 | ||||||||||||||
| Regions Bank |
May 2029 | 2.11 | % | one-month LIBOR | 25,000 | (1,562 | ) | |||||||||||||
| Regions Bank |
June 2029 | 2.03 | % | one-month LIBOR | 25,000 | (1,383 | ) | |||||||||||||
| SunTrust Bank |
April 2024 | 1.99 | % | one-month LIBOR | 25,000 | (745 | ) | |||||||||||||
| SunTrust Bank |
April 2025 | 2.20 | % | one-month LIBOR | 25,000 | (1,181 | ) | |||||||||||||
| SunTrust Bank |
July 2025 | 1.99 | % | one-month LIBOR | 25,000 | (934 | ) | |||||||||||||
| SunTrust Bank |
December 2025 | 2.30 | % | one-month LIBOR | 25,000 | (1,474 | ) | |||||||||||||
| SunTrust Bank |
January 2026 | 1.93 | % | one-month LIBOR | 25,000 | (915 | ) | |||||||||||||
| U.S. Bank National Association |
June 2029 | 2.03 | % | one-month LIBOR | 25,000 | (1,395 | ) | |||||||||||||
| U.S. Bank National Association |
August 2029 | 1.35 | % | one-month LIBOR | 25,000 | 207 | ||||||||||||||
| Wells Fargo Bank, N.A. |
February 2021 | 2.39 | % | one-month LIBOR | 35,000 | (385 | ) | |||||||||||||
| Wells Fargo Bank, N.A. |
October 2024 | 2.72 | % | one-month LIBOR | 15,000 | (994 | ) | |||||||||||||
| Wells Fargo Bank, N.A. |
April 2027 | 2.72 | % | one-month LIBOR | 25,000 | (2,427 | ) | |||||||||||||
| Wells Fargo Bank, N.A. |
January 2028 | 2.37 | % | one-month LIBOR | 75,000 | (5,801 | ) | |||||||||||||
|
|
|
|
|
|||||||||||||||||
| $ | 909,948 | $ | (36,369 | ) | ||||||||||||||||
|
|
|
|
|
|||||||||||||||||
With the exception of our interest rate swap transactions, we have not engaged in transactions in derivative financial instruments or derivative commodity instruments.
As of September 30, 2019, our financial instruments were not exposed to significant market risk due to foreign currency exchange risk.
Non-GAAP Financial Measures
Our reported results and net earnings per diluted share are presented in accordance with GAAP. We also disclose funds from operations (“FFO”), adjusted funds from operations (“AFFO”), earnings before interest, taxes, depreciation and amortization (“EBITDA”), EBITDA further adjusted to exclude gains (losses) on sales of
91
Table of Contents
depreciable property and real estate impairment losses (“EBITDAre”), Adjusted EBITDAre, Annualized Adjusted EBITDAre, Net Debt, Adjusted Net Operating Income (“NOI”) and Adjusted Cash NOI, each of which are non-GAAP measures. We believe these non-GAAP financial measures are industry measures used by analysts and investors to compare the operating performance of REITs.
We compute FFO in accordance with the standards established by the Board of Governors of the National Association of Real Estate Investment Trusts (“Nareit”), the worldwide representative voice for REITs and publicly traded real estate companies with an interest in the U.S. real estate and capital markets. Nareit defines FFO as GAAP net income or loss adjusted to exclude net gains (losses) from sales of certain depreciated real estate assets, depreciation and amortization expense from real estate assets, gains and losses from change in control, and impairment charges related to certain previously depreciated real estate assets. To derive AFFO, we modify the Nareit computation of FFO to include other adjustments to GAAP net income related to certain non-cash revenues and expenses, including straight-line rents, cost of debt extinguishments, amortization of lease intangibles, amortization of debt issuance costs, amortization of net mortgage premiums, (gain) loss on interest rate swaps and other non-cash interest expense, realized gains or losses on foreign currency transactions, internalization expenses, extraordinary items, and other specified non-cash items. We believe that such items are not a result of normal operations and thus we believe excluding such items assists management and investors in distinguishing whether changes in our operations are due to growth or decline of operations at our properties or from other factors.
Our leases typically include cash rents that increase over the term of the lease to compensate us for anticipated increases in market rentals over time. Our leases do not include significant front-loading or back-loading of payments, or significant rent-free periods. Therefore, we find it useful to evaluate rent on a contractual basis as it allows for comparison of existing rental rates to market rental rates. We further exclude costs or gains recorded on the extinguishment of debt, non-cash interest expense and gains, the amortization of debt issuance costs, net mortgage premiums, and lease intangibles, realized gains and losses on foreign currency transactions, and Internalization expenses, as these items are not indicative of ongoing operational results. We use AFFO as a measure of our performance when we formulate corporate goals.
FFO is used by management, investors, and analysts to facilitate meaningful comparisons of operating performance between periods and among our peers, primarily because it excludes the effect of real estate depreciation and amortization and net gains on sales, which are based on historical costs and implicitly assume that the value of real estate diminishes predictably over time, rather than fluctuating based on existing market conditions. We believe that AFFO is a useful supplemental measure for investors to consider because it will help them to better assess our operating performance without the distortions created by one-time cash and non-cash revenues or expenses. FFO and AFFO may not be comparable to similarly titled measures employed by other REITs, and comparisons of our FFO and AFFO with the same or similar measures disclosed by other REITs may not be meaningful. FFO and AFFO should not be considered alternatives to net income as a performance measure or to cash flows from operations, as reported on our statement of cash flows, or as a liquidity measure, and should be considered in addition to, and not in lieu of, GAAP financial measures.
Neither the SEC nor any other regulatory body has passed judgment on the acceptability of the adjustments to FFO that we use to calculate AFFO. In the future, the SEC, Nareit or another regulatory body may decide to standardize the allowable adjustments across the REIT industry and in response to such standardization we may have to adjust our calculation and characterization of AFFO accordingly.
92
Table of Contents
The following is a reconciliation of historical and pro forma net income (which is the most comparable GAAP measure) to FFO and AFFO:
| For the nine months ended September 30, |
For the years ended December 31, |
|||||||||||||||||||||||||||
| (in thousands) | 2019 (Pro forma) (Unaudited) |
2019 (Historical) (Unaudited) |
2018 (Historical) (Unaudited) |
2018 (Pro forma) |
2018 (Historical) |
2017 (Historical) |
2016 (Historical) |
|||||||||||||||||||||
| Net income |
$ | — | $ | 57,402 | $ | 60,444 | $ | — | $ | 75,105 | $ | 59,555 | $ | 40,268 | ||||||||||||||
| Real property depreciation and amortization |
77,989 | 61,303 | 83,994 | 62,263 | 46,321 | |||||||||||||||||||||||
| Gain on sale of real estate |
(16,772 | ) | (9,620 | ) | (10,496 | ) | (12,992 | ) | (5,925 | ) | ||||||||||||||||||
| Provision for impairment of investment in rental properties |
3,452 | 2,061 | 2,061 | 2,608 | — | |||||||||||||||||||||||
|
|
|
|
|
|
|
|
|
|
|
|
|
|
|
|||||||||||||||
| FFO |
$ | — | $ | 122,071 | $ | 114,188 | $ | — | $ | 150,664 | $ | 111,434 | $ | 80,664 | ||||||||||||||
|
|
|
|
|
|
|
|
|
|
|
|
|
|
|
|||||||||||||||
| Capital improvements/reserves |
(97 | ) | (147 | ) | (196 | ) | (196 | ) | (194 | ) | ||||||||||||||||||
| Straight-line rent adjustment |
(15,882 | ) | (15,640 | ) | (19,492 | ) | (17,132 | ) | (13,847 | ) | ||||||||||||||||||
| Cost of debt extinguishment |
1,176 | 101 | 101 | 5,151 | 133 | |||||||||||||||||||||||
| Gain on sale of investments in related party |
— | (8,500 | ) | (8,500 | ) | — | — | |||||||||||||||||||||
| Amortization of debt issuance costs |
1,761 | 1,410 | 1,918 | 1,795 | 1,817 | |||||||||||||||||||||||
| Amortization of net mortgage premiums |
(108 | ) | (107 | ) | (142 | ) | 61 | (191 | ) | |||||||||||||||||||
| Gain on interest rate swaps and other non-cash interest expense |
(163 | ) | (4 | ) | (84 | ) | (1,280 | ) | — | |||||||||||||||||||
| Amortization of lease intangibles |
(2,328 | ) | 212 | (304 | ) | 498 | (482 | ) | ||||||||||||||||||||
| Internalization expenses |
1,195 | — | — | — | — | |||||||||||||||||||||||
| Other losses (gains) |
— | — | 100 | (379 | ) | — | ||||||||||||||||||||||
| Acquisition expenses |
— | — | — | — | 10,880 | |||||||||||||||||||||||
|
|
|
|
|
|
|
|
|
|
|
|
|
|
|
|||||||||||||||
| AFFO |
$ | — | $ | 107,625 | $ | 91,513 | $ | — | $ | 124,065 | $ | 99,952 | $ | 78,780 | ||||||||||||||
|
|
|
|
|
|
|
|
|
|
|
|
|
|
|
|||||||||||||||
We compute EBITDA as earnings before interest, income taxes and depreciation and amortization. EBITDA is a measure commonly used in our industry. We believe that this ratio provides investors and analysts with a measure of our leverage that includes our operating results unaffected by the differences in capital structures, capital investment cycles and useful life of related assets compared to other companies in our industry. In 2017, Nareit issued a white paper recommending that companies that report EBITDA also report EBITDAre in financial reports. We compute EBITDAre in accordance with the definition adopted by Nareit. Nareit defines EBITDAre as EBITDA (as defined above) excluding gains (loss) from the sales of depreciable property and provisions for impairment on investment in real estate. We believe EBITDA and EBITDAre are useful to investors and analysts because they provide important supplemental information about our operating performance exclusive of certain non-cash and other costs.
EBITDA and EBITDAre are not measures of financial performance under GAAP, and our EBITDA and EBITDAre may not be comparable to similarly titled measures of other companies. You should not consider our EBITDA and EBITDAre as alternatives to net income or cash flows from operating activities determined in accordance with GAAP.
93
Table of Contents
The following table reconciles net income (which is the most comparable GAAP measure) to EBITDA and EBITDAre:
| For the nine months ended September 30, |
For the years ended December 31, |
|||||||||||||||||||||||||||
| (in thousands) | 2019 (Pro forma) (Unaudited) |
2019 (Historical) (Unaudited) |
2018 (Historical) (Unaudited) |
2018 (Pro forma) |
2018 (Historical) |
2017 (Historical) |
2016 (Historical) |
|||||||||||||||||||||
| Net income |
$ | 57,402 | $ | 60,444 | $ | 75,105 | $ | 59,555 | $ | 40,268 | ||||||||||||||||||
| Depreciation and amortization |
77,989 | 61,303 | 83,994 | 62,263 | 46,321 | |||||||||||||||||||||||
| Interest expense |
51,025 | 38,115 | 52,855 | 34,751 | 29,963 | |||||||||||||||||||||||
| Income taxes |
— | — | — | — | — | |||||||||||||||||||||||
|
|
|
|
|
|
|
|
|
|
|
|
|
|
|
|||||||||||||||
| EBITDA |
$ | 186,416 | $ | 159,862 | $ | 211,954 | $ | 156,569 | $ | 116,552 | ||||||||||||||||||
| Provision for impairment of investment in rental properties |
3,452 | 2,061 | 2,061 | 2,608 | — | |||||||||||||||||||||||
| Gain on sale of real estate |
(16,772 | ) | (9,620 | ) | (10,496 | ) | (12,992 | ) | (5,925 | ) | ||||||||||||||||||
|
|
|
|
|
|
|
|
|
|
|
|
|
|
|
|||||||||||||||
| EBITDAre |
$ | 173,096 | $ | 152,303 | $ | 203,519 | $ | 146,185 | $ | 110,627 | ||||||||||||||||||
|
|
|
|
|
|
|
|
|
|
|
|
|
|
|
|||||||||||||||
We further adjust EBITDAre (“Adjusted EBITDAre”) for the most recently completed quarter (i) based on an estimate calculated as if all investment and disposition activity that took place during the quarter had been made on the first day of the quarter, (ii) to exclude certain GAAP income and expense amounts that we believe are infrequent and unusual in nature because they relate to unique circumstances or transactions that had not previously occurred and which we do not anticipate occurring in the future, and (iii) to eliminate the impact of lease termination fees from certain of our tenants. We then annualize quarterly Adjusted EBITDAre by multiplying it by four (“Annualized Adjusted EBITDAre”), which we believe provides a meaningful estimate of our current run rate for all of our investments as of the end of the most recently completed quarter. You should not unduly rely on this measure as it is based on assumptions and estimates that may prove to be inaccurate. Our actual reported EBITDAre for future periods may be significantly different from our Annualized Adjusted EBITDAre.
We further adjust Adjusted EBITDAre to compute Adjusted Net Operating Income (“Adjusted NOI”), a non-GAAP financial measure, by excluding costs incurred at the corporate level, including asset management, property management, and general and administrative expenses. We further adjust Adjusted NOI to exclude non-cash items included in total revenues and property expenses, such as straight-line rental revenue and other amortization and non-cash items, based on an estimate calculated as if all investment and disposition activity that took place during the quarter had been made on the first day of the quarter (“Adjusted Cash NOI”). We then annualize quarterly Adjusted NOI and Adjusted Cash NOI by multiplying each amount by four (“Annualized Adjusted NOI” and “Annualized Adjusted Cash NOI”, respectively). We believe Adjusted NOI and Adjusted Cash NOI provide useful and relevant information because they reflect only those income and expense items that are incurred at the property level and present such items on an unlevered basis. We believe that the exclusion of certain non-cash revenues and expenses from Adjusted Cash NOI is a useful supplemental measure for investors to consider because it will help them to better assess our operating performance without the distortions created by non-cash revenues or expenses. You should not unduly rely on Annualized Adjusted NOI and Annualized Adjusted Cash NOI as they are based on assumptions and estimates that may prove to be inaccurate. Our actual reported Adjusted NOI and Adjusted Cash NOI for future periods may be significantly different from our Annualized Adjusted NOI and Annualized Adjusted Cash NOI.
Adjusted NOI and Adjusted Cash NOI are not measurements of financial performance under GAAP. You should not consider our Adjusted NOI and Adjusted Cash NOI as alternatives to net income or cash flows from
94
Table of Contents
operating activities determined in accordance with GAAP. Additionally, our computation of Adjusted NOI and Adjusted Cash NOI may differ from the methodology for calculating these metrics used by companies in our industry, and, therefore, may not be comparable to similarly titled measures reported by other companies.
The following table reconciles net income (which is the most comparable GAAP measure) to Adjusted EBITDAre, Adjusted NOI and Adjusted Cash NOI. Information is also presented with respect to Annualized EBITDAre, Annualized Adjusted EBITDAre, Annualized Adjusted NOI, and Annualized Adjusted Cash NOI:
| For the three months ended September 30, |
For the three months ended December 31, |
|||||||||||||||||||||||||||
| (in thousands) | 2019 (Pro forma) (Unaudited) |
2019 (Historical) (Unaudited) |
2018 (Historical) (Unaudited) |
2018 (Pro forma) (Unaudited) |
2018 (Historical) (Unaudited) |
2017 (Historical) (Unaudited) |
2016 (Historical) (Unaudited) |
|||||||||||||||||||||
| Net income |
$ | 25,038 | $ | 23,064 | $ | 14,660 | $ | 16,826 | $ | 13,794 | ||||||||||||||||||
| Depreciation and amortization |
28,392 | 21,869 | 22,691 | 17,294 | 13,048 | |||||||||||||||||||||||
| Interest expense |
18,465 | 14,484 | 14,740 | 9,569 | 5,797 | |||||||||||||||||||||||
| Income taxes |
— | — | — | — | — | |||||||||||||||||||||||
|
|
|
|
|
|
|
|
|
|
|
|
|
|
|
|||||||||||||||
| EBITDA |
$ | 71,895 | $ | 59,417 | $ | 52,091 | $ | 43,689 | $ | 32,639 | ||||||||||||||||||
| Provision for impairment of investment in rental properties |
2,435 | 2,061 | — | — | — | |||||||||||||||||||||||
| Gain on sale of real estate |
(12,585 | ) | (2,025 | ) | (876 | ) | (2,660 | ) | (1,836 | ) | ||||||||||||||||||
|
|
|
|
|
|
|
|
|
|
|
|
|
|
|
|||||||||||||||
| EBITDAre |
$ | 61,745 | $ | 59,453 | $ | 51,215 | $ | 41,029 | $ | 30,803 | ||||||||||||||||||
| Adjustment for current quarter investment and disposition activity |
8,349 | 539 | 3,403 | 5,533 | 1,888 | |||||||||||||||||||||||
| Adjustment to exclude non-recurring expenses (income)1 |
923 | (8,500 | ) | — | — | — | ||||||||||||||||||||||
| Adjustment to exclude lease termination fees |
(407 | ) | — | — | — | — | ||||||||||||||||||||||
| Adjustment to exclude acquisition expenses |
— | — | — | — | 2,624 | |||||||||||||||||||||||
|
|
|
|
|
|
|
|
|
|
|
|
|
|
|
|||||||||||||||
| Adjusted EBITDAre |
$ | 70,610 | $ | 51,492 | $ | 54,618 | $ | 46,562 | $ | 35,315 | ||||||||||||||||||
| Asset management fees |
5,610 | 4,663 | 5,054 | 4,088 | 3,185 | |||||||||||||||||||||||
| Property management fees |
2,098 | 1,680 | 1,737 | 1,353 | 1,071 | |||||||||||||||||||||||
| General and administrative |
1,315 | 1,664 | 1,712 | 1,641 | 839 | |||||||||||||||||||||||
|
|
|
|
|
|
|
|
|
|
|
|
|
|
|
|||||||||||||||
| Adjusted Net Operating Income (“NOI”) |
$ | 79,633 | $ | 59,499 | $ | 63,121 | $ | 53,644 | $ | 40,410 | ||||||||||||||||||
| Straight-line rental revenue, net |
(6,306 | ) | (5,393 | ) | (4,227 | ) | (5,431 | ) | (4,672 | ) | ||||||||||||||||||
| Other amortization and non-cash charges |
115 | 183 | (72 | ) | 93 | (1,857 | ) | |||||||||||||||||||||
|
|
|
|
|
|
|
|
|
|
|
|
|
|
|
|||||||||||||||
| Adjusted Cash NOI |
$ | 73,442 | $ | 54,289 | $ | 58,822 | $ | 48,306 | $ | 33,881 | ||||||||||||||||||
|
|
|
|
|
|
|
|
|
|
|
|
|
|
|
|||||||||||||||
| Annualized EBITDAre |
$ | 246,980 | $ | 237,812 | $ | 204,860 | $ | 164,116 | $ | 123,212 | ||||||||||||||||||
| Annualized Adjusted EBITDAre |
282,440 | 205,968 | 218,472 | 186,248 | 141,260 | |||||||||||||||||||||||
| Annualized Adjusted NOI |
318,532 | 237,996 | 252,484 | 214,576 | 161,640 | |||||||||||||||||||||||
| Annualized Adjusted Cash NOI |
293,768 | 217,156 | 235,288 | 193,224 | 135,524 | |||||||||||||||||||||||
95
Table of Contents
| 1 | 2019 amount represents expenses associated with the Internalization. 2018 amounts represent a gain recognized on the sale of our entire prior investment in preferred units of BRE. These items pertain to unique transactions that had not previously occurred, and that we do not anticipate will occur in the future. |
Net Debt is a non-GAAP financial measure. We define Net Debt as our gross debt (defined as total debt plus deferred financing costs) less cash and cash equivalents and restricted cash. Net Debt to Annualized EBITDAre and Net Debt to Annualized Adjusted EBITDAre, represent Net Debt divided by Annualized EBITDAre and Annualized Adjusted EBITDAre, respectively. We believe that these ratios are useful to investors and analysts because they provide information about gross debt less cash and cash equivalents, which could be useful to repay debt, compared to our performance as measured using EBITDAre, which is described above.
The following table reconciles total debt (which is the most comparable GAAP measure) to Net Debt, and presents the ratio of Net Debt to Annualized EBITDAre and Net Debt to Annualized Adjusted EBITDAre, respectively:
| As of September 30, | As of December 31, | |||||||||||||||||||
| (in thousands) | 2019 (Pro forma) (Unaudited) |
2019 (Historical) (Unaudited) |
2018 (Historical) |
2017 (Historical) |
2016 (Historical) |
|||||||||||||||
| Debt |
||||||||||||||||||||
| Mortgages and notes payable, net |
$ | 112,562 | $ | 78,952 | $ | 67,832 | $ | 106,686 | ||||||||||||
| Unsecured term notes, net |
1,671,511 | 1,225,773 | 836,912 | 657,891 | ||||||||||||||||
| Unsecured revolver |
303,300 | 141,100 | 273,000 | 102,000 | ||||||||||||||||
| Debt issuance costs |
8,862 | 4,726 | 3,726 | 2,947 | ||||||||||||||||
|
|
|
|
|
|
|
|
|
|
|
|||||||||||
| Gross Debt |
2,096,235 | 1,450,551 | 1,181,470 | 869,524 | ||||||||||||||||
| Cash and cash equivalents |
— | (14,008 | ) | (18,612 | ) | (9,355 | ) | (21,635 | ) | |||||||||||
| Restricted cash |
(30,107 | ) | (377 | ) | (744 | ) | (1,468 | ) | ||||||||||||
|
|
|
|
|
|
|
|
|
|
|
|||||||||||
| Net Debt |
$ | 2,052,120 | $ | 1,431,562 | $ | 1,171,371 | $ | 846,421 | ||||||||||||
|
|
|
|
|
|
|
|
|
|
|
|||||||||||
| Net Debt to Annualized EBITDAre |
8.31 | 6.99 | 7.14 | 6.87 | ||||||||||||||||
|
|
|
|
|
|
|
|
|
|
|
|||||||||||
| Net Debt to Annualized Adjusted EBITDAre |
7.27 | 6.55 | 6.29 | 5.99 | ||||||||||||||||
|
|
|
|
|
|
|
|
|
|
|
|||||||||||
96
Table of Contents
Outlook
Rosen Consulting Group (“RCG)” has a positive outlook on the net lease real estate market generally and on certain segments of property types, including industrial, healthcare, restaurant, office and retail for the following reasons:
| • | Net leases offer multiple benefits for property owners and tenants, including, for property owners, rental income stability, inflation mitigation and potential residual property value appreciation, and for tenants, the opportunity to monetize real properties and allocate capital more efficiently. |
| • | RCG estimates the total value of owner-occupied commercial real estate in the U.S. is in the $1.5 to $2.0 trillion range as of 2019. RCG believes that many of these owner-occupied properties could become net leased assets, increasing the size of the net lease market through sale-leaseback transactions. |
| • | RCG believes that the net lease market generally can increase in size and will accommodate a substantial increase in investment activity. |
Net Lease Real Estate Overview
The net lease market is characterized primarily by single-tenant properties occupied by tenants across a range of industries, including corporate headquarters, manufacturing and distribution facilities, quick service restaurants and healthcare. Net lease real estate is a uniquely structured real estate investment that minimizes property management responsibilities for the property owners. A net lease, unlike a gross lease which places financial responsibility for most expenses with the property owner, shifts the majority or entirety of expenses such as maintenance, insurance, utilities, property taxes and capital expenditures to the lessee. The structure of a net lease can result in passive and stable cash flows for the owner with the benefit of potential property value appreciation.
Net leases are often executed for seven to 15 years or more. Lease agreements typically include tenant options to renew, further extending the life of a net lease beyond the initial term. Comparatively, multitenant real estate properties with gross leases typically have average lease terms between five and ten years with fewer options to extend. The longer-term characteristics of a net lease can minimize costs associated with re-tenanting a property. Tenants typically agree to net lease terms for locations that are of high value, whether that is because of a mission-critical nature of the facility, proximity to suppliers or storefronts, or access to consumers. Within the lease term, net leases may feature rent escalations of a fixed percentage or in relation to an inflation measure such as the CPI. This allows a net lease investment to provide some mitigation against inflation pressures. As a result, net leases can offer stable, predictable and passive cash flows over time, similar to interest-bearing corporate bonds but with potential upside for appreciation in property values and inflation mitigation.
The longer lease terms of net lease properties may be ideal for tenants that desire to remain in locations vital to business success, such as prime retail corridors, sites adjacent to transportation infrastructure or locations convenient to customers, labor pools and patients. The importance of these sites is a key component of a tenant’s decision to enter into a net lease. Similarly, the strength of the tenant leasing the space is vital in determining the quality of the net lease. Many property owners focus on high credit quality tenants, including nationally recognized businesses with strong corporate cash flows. Furthermore, many property owners focus on industries with positive underlying demand drivers, which may be less subject to economic volatility. Quality net lease tenants contribute to income stability and may mitigate against economic volatility.
The structure of a net lease can be beneficial in several ways to lessees. Under a net lease, tenants are able to occupy and control locations for longer periods than a standard lease while preserving needed capital for core business operations. The net lease structure may also assist corporate tenants with expansion opportunities by foregoing capital-intensive ownership and property development alternatives. A net lease also allows an owner-occupier to monetize real estate through a sale-leaseback transaction, which can provide capital for expansion opportunities, to retire debt or reinvest in the business platform.
97
Table of Contents
For property owners, there are multiple benefits of a net lease structure. A net lease offers greater rental income stability and predictability than traditional leases. The longer term and agreed upon rent escalations can create stable cash flows over an extended period of time. The contractual rent increases, often at an annual frequency, can serve to hedge against rising inflation. With the tenant financially responsible for most expenses, the landlord is further insulated against potential surges in inflation. Furthermore, minimal operating expenses borne by the lessor combined with the net lease structure can translate to a more consistent and predictable rental income stream.
Tenants with strong corporate financial metrics can minimize the vacancy risk to property owners of real estate assets. As net-leased locations are often critical to core businesses, tenants that occupy these mission-critical net-leased properties are likely to maintain lease payments even in the case of corporate reorganizations, bankruptcy filings or mergers. Should a net lease tenant relocate or go out of business, the real estate asset often holds residual value, which may be substantial, depending upon the characteristics and location of the property. Even without a tenant and the recurring cash flow, the building may be repositioned to a single tenant or multitenant facility with the potential to secure a new cash flow stream. The underlying land also holds value regardless of the existing structure, particularly well-located sites in urban areas or within proximity to transportation infrastructure, business customers or consumers.
Finally, the long-term nature of the lease may offer some protection for property owners against economic volatility because short-term fluctuations in market-rate rents should not materially impact the in-place rental income from a net lease property. In both economic expansions and downturns, net lease rent growth exhibits less volatility than most other commercial real estate categories. During 2008 and 2009, one of the most severe economic downturns in modern times, rent growth for net-leased properties remained positive while average rent growth declined among other commercial property types. Economic cycles can often cause shifts in real estate occupancy and rental income, but the long-term lease structure of net lease real estate can often be more resistant to market downturns.
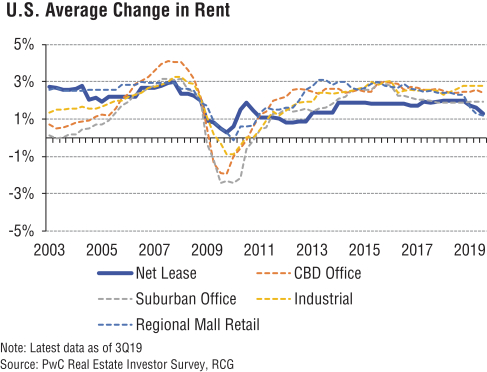
Ownership within the net lease real estate market is highly fragmented and the size of the market is constantly evolving. While some investors specialize in net lease assets, net leased real estate may also provide
98
Table of Contents
diversification benefits to traditional real estate investors. The stable revenue stream and resiliency to market cycles of net-leased real estate, particularly when combined with geographic, property type and tenant industry diversification, can help insulate real estate investment portfolios from greater volatility of cash flows. The stability of revenue in a net-leased asset is comparable to a bond, and some investors may benefit from utilizing net lease real estate in place of corporate or sovereign bonds, particularly in a rising interest rate environment. There are a number of large publicly traded and non-traded REITs that invest in net lease properties, but most single tenant net lease assets are owned by smaller investors. These smaller investors, including individuals, families, trusts and real estate operating companies, often own relatively few assets. Furthermore, many net leased properties are located in smaller metropolitan areas that are often overlooked by large-scale institutional real estate investors. This may limit buyer competition for available net leased properties in some markets, potentially offering well-capitalized firms opportunities to acquire net leased assets. The fragmented ownership can help create investment opportunities and well-capitalized firms with real estate market expertise may have an advantage to acquire properties or portfolios.
The fragmented and evolving nature of ownership in the net lease market make it difficult to quantify the overall size of the net lease market. Net lease tenants constantly expand into new locations and owner-occupiers engage in sale-leaseback and other net lease transactions, adding to and removing properties from the universe of investable net lease real estate properties. RCG estimates the total value of owner-occupied real estate in the U.S. is in the $1.5 to $2.0 trillion range as of 2019. Many of these owner-occupied properties could become net leased assets, increasing the size of the net lease market through sale-leaseback transactions. This estimate is a small portion of the nearly 5.6 million commercial buildings encompassing more than 87 billion square feet in 2012, according to the Energy Information Administration, not to mention the millions of square feet built in the years since 2012. With this magnitude, there is considerable potential for the net lease market to expand as owner-occupiers sell properties to raise capital and corporations expand operations.
Although the fragmented ownership and evolving market make determining the size of the net lease market challenging, given the economic expansion, construction of new net lease properties, and sale-leaseback transactions by occupiers, RCG believes that the net lease market can increase in size and accommodate a substantial increase in investment activity.
99
Table of Contents
Net Lease Real Estate Investment Trends
In line with the challenge of measuring the size of the net lease market, assessing the volume of transactions in net lease real estate is similarly challenging. However, sales volume of single tenant properties can be a helpful proxy for net lease transactions as a large share of single tenant properties are net leased. Through November 2019, single tenant investment sales activity reached an annualized figure of $57.9 billion, on par with the $58.2 billion in 2018, according to Real Capital Analytics. During the five-year period from 2014 through 2018, single tenant investment sales reached $235.2 billion, or $47.0 billion on average each year. The historically high level of investment interest in the net lease sector is driven by the potential for stable cash flows and expectations of asset value appreciation.
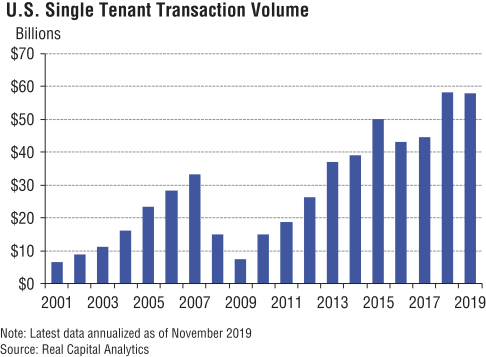
100
Table of Contents
The high level of investment interest from investors has continued to place pressure on cap rates for single tenant real estate assets. The average single tenant transactional cap rate remained near historical lows at 6.3% through November 2019, according to Real Capital Analytics, and has changed little in the last four years. The average cap rates are based on properties throughout the country and contain tenants of varying credit ratings, as such, there is a range of cap rates. Generally, cap rates may be lower than the average for quality properties and properties with investment-grade tenants. The stable cap rate is a result of the inflow of investment capital into the sector.
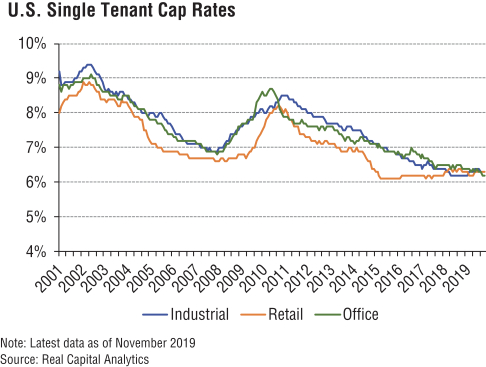
101
Table of Contents
Even as single tenant cap rates remained near historical lows, the spread to corporate and sovereign bonds remained wide. Through November 2019, the single tenant cap rate spread to 10-year Treasury bond yields was 449 basis points, compared with the average spread of 459 basis points since 2010. Compared with BBB corporate bond yields, the spread in November 2019 was 285 basis points, wider than the average spread since 2010 of 257 basis points. Even as bond yields moved lower, the average cap rate was stable, leading to widened spreads and potential opportunities for greater investment returns relative to a comparable investment class. RCG believes that single tenant real estate investment volume and cap rate trends are indicative of the net lease market, and that when compared with corporate and sovereign bonds, the net lease market may provide opportunities for bond-like cash flows priced at higher spreads.
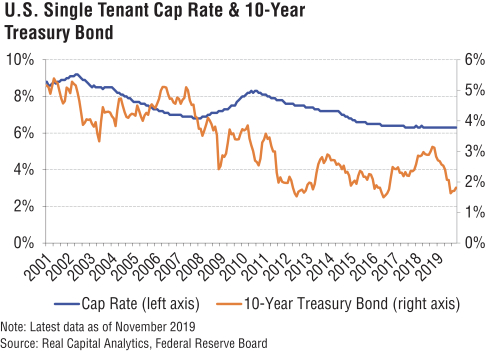
Economic Overview of Selected Markets
U.S. Overview. The recent expansion in the U.S. economy continued into late 2019, with continued hiring throughout many industries, increased consumer spending and income growth. From January through November 2019, U.S. employers created nearly 2.0 million jobs, compared with nearly 2.5 million jobs during the same period in 2018, according to the Bureau of Labor Statistics. Since the beginning of 2015, nearly 11.9 million jobs were created nationally.
In 2019, an average of nearly 180,000 jobs were created monthly, helping to maintain a low unemployment rate of 3.3% in November 2019, according to the Bureau of Labor Statistics. With the economy at nearly full employment, year-over-year wage growth reached 3.7% in November 2019, according to the Federal Reserve Bank of Atlanta. With expectations for a continuation of tight labor market conditions, moderately strong wage growth should persist.
The estimated U.S. population increased to more than 328.2 million in 2019, an increase of approximately 1.6 million people from 2018, according to the Census Bureau. From 2014 to 2019, the national population increased by 9.9 million people. The sustained population growth and young adults moving out on their own contributed to an estimated 1.5 million new households in 2018, according to an RCG estimate. The positive demographic trends combined with job creation and wage growth have led to growing consumer demand for goods and services.
102
Table of Contents
Industrial. Economic growth drives the movement of materials and goods between producers, wholesalers, retailers, businesses and consumers. Growth in online sales activities continued to drive an increase in freight traffic in recent years. Online, or e-commerce, sales increased to $154.5 billion in the third quarter 2019, up from $37.4 billion in the third quarter of 2010, according to the Census Bureau. The Transportation Services Index for freight remained stable for much of 2019 and has grown from 98.5 in January 2009 to 138.6 in October 2019, according to the Bureau of Transportation Services.
In order to transport goods to stores, provide food to restaurants and bars, and ship items to consumers, retailers typically employ distribution activities from warehouse facilities located across the country. In particular, last mile delivery locations to consumers and businesses can be mission critical for distribution and logistics services. Additionally, consumer demand for fresh food continues to rise, driving demand growth for cold storage warehouse and distribution space close to farms and producers as well as in proximity to retailers, restaurants and consumers. The increase in consumer demand for organic food products also drives a further increase in demand for specialized storage and distribution facilities. The growing online grocery segment increases demand for cold storage in and around urban markets. The location of warehouses with proximity to consumers or storefronts and prime transportation infrastructure access are highly sought after by retailers and wholesalers.
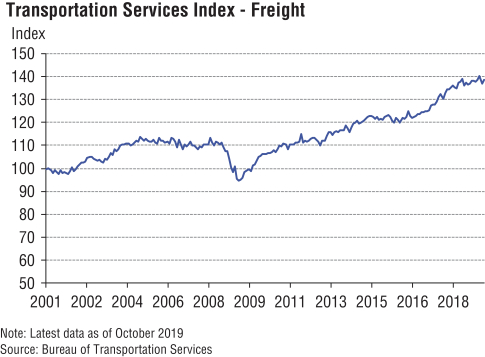
103
Table of Contents
Healthcare. The expansion of healthcare insurance coverage by public programs as well as through private employers with a greater share of the population employed, in part drove further increases in healthcare utilization and spending. Approximately 91.5% of the U.S. population had health insurance at some point in 2018, according to the Census Bureau. Demographic trends, including an aging population, extended life expectancy and a large wave of the millennial generation moving into life stages that tend to utilize health services at a greater rate, also provide a growing base of demand for healthcare services. In 2018, healthcare spending in the U.S. reached $3.6 trillion, an increase of 4.6% from the previous year, according to the U.S. Centers for Medicare & Medicaid Services. In addition to hospitals and medical insurers referring more patients to outpatient facilities, evolving consumer preferences for healthcare including increased utilization of preventative and alternative care accelerated demand for healthcare services physically detached from hospital system campuses. Many of these medical services benefit from long-term stability of their locations in order to best care for patients, and can be prime tenants for net leased real estate.
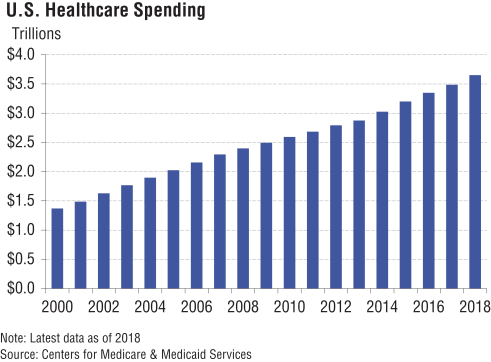
104
Table of Contents
Restaurants. Dining out provides consumers with a social experience that cannot be replicated by eating meals at home. This type of experience can be resilient against online service expansion, including the rise of food delivery services. Spending on food services and drinking places increased to $65.2 billion for the month of November 2019, and more than $705 billion from January to November 2019, an increase of 4.3% from the same 11-month period in 2018, according to the Department of Commerce and Census Bureau. Consumer spending on eating out now exceeds spending in grocery stores, highlighting the growing consumer preference for enjoying meals and drinks outside of the home, including in casual dining, quick service restaurants, bars and fast food establishments. Consumer spending on dining establishments should continue to increase, driven by shifts in preferences and demographic factors. With more households residing in smaller living spaces, nearly 26 million households lived in multifamily unit buildings with five or greater units in 2018, an increase of 3% from the previous year, according to the Census Bureau, cooking at home or gathering friends and relatives for a meal may be challenging given the space constraints. Furthermore, as the millennial generation ages, much of the generation will transition into life stages typically characterized by rising incomes and elevated spending, which bodes well for restaurants and food and drink-related gathering places. The resiliency of dining establishments combined with positive consumer preferences should support further expansion of food service and drinking establishments, creating additional opportunities for net lease real estate investments.
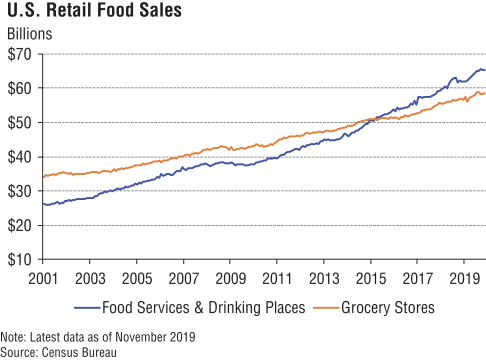
105
Table of Contents
Office. Much of the private sector hiring during the current economic expansion was in office-using industries, including professional and business services, technology, and financial activities. Office-using employment increased to more than 32.2 million employees in November 2019, according to RCG calculations of Bureau of Labor Statistics data. From January to November 2019, more than half a million office-using jobs were created. From January 2015 to November 2019, nearly 3.0 million office-using jobs were created. The level of office-using employment is a highly correlated indicator to tenant demand for office space. The positive hiring trends should in turn be a positive indicator for office tenants and, in particular, mission-critical locations in net-leased properties.
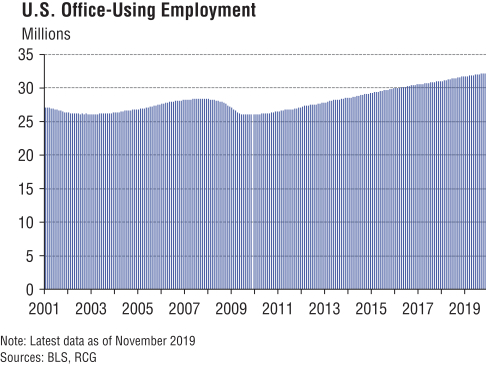
Retail. Consumer spending, as measured by seasonally adjusted retail and food services sales, increased to nearly $528 billion in November 2019 and to more than $5.6 trillion in 2019 year-to-date through November 2019, an increase of 3.4% from the same period in 2018, according to the Census Bureau. While online sales have absorbed some sales from physical locations, most large retailers utilize omnichannel sales strategies to boost overall sales. Additionally, some retailers that began as online-only storefronts have opened physical locations in recent years.
106
Table of Contents
Additionally, some retail segments, including specialized goods and service-oriented and experience-based businesses, may provide insulation against competition from online platforms. Furthermore, retailers selling large items that are difficult to ship, and/or that benefit from enabling customers to examine products prior to purchasing, are also somewhat internet-resilient. While there are challenges for some retailers, and online retailers now account for 11.2% of retail sales, according to the Census Bureau, internet-resilient goods and services retailers may continue to expand and provide additional tenant opportunities for net lease real estate.
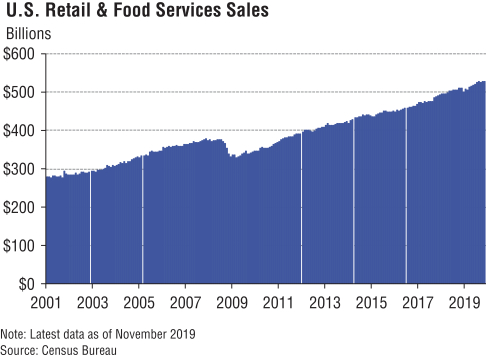
107
Table of Contents
Our Company
We are a REIT that acquires, owns, and manages primarily single-tenant commercial real estate properties that are net leased on a long-term basis to a diversified group of tenants. We utilize an investment strategy underpinned by strong fundamental credit analysis and prudent real estate underwriting. Since our inception in 2007, we have selectively invested more than $4.3 billion in net leased real estate across the industrial, healthcare, restaurant, office, and retail property types, and have scaled our portfolio to 661 properties in 42 U.S. states and one property in Canada, with an aggregate gross asset value of $4.1 billion.
We focus on investing in real estate that is operated by creditworthy single tenants in industries characterized by positive business drivers and trends, where the properties are an integral part of the tenants’ businesses and there are opportunities to secure long-term net leases. Through long-term net leases, our tenants are able to retain operational control of their strategically important locations, while allocating their debt and equity capital to fund their core business operations rather than real estate ownership.
| • | Diversified Portfolio. As of September 30, 2019, our portfolio comprised approximately 27.5 million rentable square feet of operational space, and was highly diversified based on property type, geography, tenant, and industry: |
| • | Property Type: We are focused primarily on industrial, healthcare, restaurant, office, and retail property types based on our extensive experience in and conviction around these sectors. Within these sectors, we have meaningful concentrations in manufacturing, distribution and warehouse, clinical, casual dining, quick service restaurant, corporate headquarters, food processing, flex/research and development, and cold storage. |
| • | Geographic Diversity: Our properties are located in 42 U.S. states and British Columbia, Canada, with no single geographic concentration exceeding 10.5% of our ABR. |
| • | Tenant and Industry Diversity: Our properties are occupied by approximately 187 different commercial tenants who operate 171 different brands that are diversified across 53 differing industries, with no single tenant accounting for more than 2.8% of our ABR. |
| • | Strong In-Place Leases with Significant Remaining Lease Term. Our portfolio is currently 99.8% leased based on rentable square footage with a weighted average remaining lease term of approximately 11.7 years, excluding renewal options. |
| • | Standard Contractual Base Rent Escalation. 97.9% of our leases have contractual rent escalations, with an annual weighted average minimum increase in ABR of 2.1%. |
| • | Extensive Tenant Financial Reporting. 87.7% of our ABR is received from tenants that are required to provide us with specified financial information on a periodic basis and an additional 4.1% of our ABR is received from tenants that are public companies, required to file financial statements with the SEC, although they are not required to provide us with specified financial information under the terms of our lease. |
From our inception in 2007 through 2015, our portfolio grew to over 300 properties with a gross asset value of $1.4 billion. Growth further accelerated under the leadership of Christopher J. Czarnecki, our Chief Executive Officer since 2017, who joined us in 2009 and was instrumental in building our senior leadership team, developing our strategy and increasing our level of acquisition activity. Our team has acquired more than $500 million of net leased real estate every year since 2015, with acquisition activity of approximately $1.0 billion during 2019, and has grown our portfolio to 662 properties with a gross asset value of $4.1 billion as of September 30, 2019. In order to benefit from increasing economies of scale as we continue to grow, and as a part of our evolution toward entering the public markets, our board of directors made the decision to internalize
108
Table of Contents
our existing management team, which is expected to become effective in the first quarter of 2020. Upon closing of the Internalization, each member of our senior management team will become a full-time employee of BNL.
We intend to continue to execute our growth strategy, utilizing our long-standing, established relationships to source new acquisition opportunities. Following completion of this offering, we believe that our balance sheet, including available borrowing capacity under our Revolving Credit Facility, and overall leverage profile will enable us to significantly expand our portfolio.
We conduct substantially all of our activities through, and all of our properties are held directly or indirectly by, the OP, which is commonly referred to as an umbrella partnership real estate investment trust or UPREIT. We are the sole managing member of the OP. Assuming completion of the Recapitalization, the Internalization, and this offering, and assuming the earnout consideration in the Internalization is paid in full, as of September 30, 2019, on a pro forma basis, we owned approximately % of its issued and outstanding OP Units, with the remaining % of its OP Units held by persons who were issued OP Units pursuant to the Internalization or in exchange for their interests in properties acquired by the OP.
Our Target Markets
We are a leading net lease REIT that provides financing solutions to companies seeking to monetize their real estate assets. We intend to acquire primarily freestanding, single-tenant commercial properties located in the United States either directly from creditworthy tenants through sale-leaseback transactions, where they sell their properties and simultaneously lease them back through long-term net leases, or through the purchase of properties already subject to a net lease. Under either scenario, our properties are generally under lease and fully occupied at the time of acquisition. We do not currently engage in the development of real estate, but may pursue build-to-suit developments of net leased real estate in the future.
109
Table of Contents
We are focused primarily on industrial, healthcare, restaurant, office, and retail property types and are focused on maintaining a well-diversified portfolio. We target acquisition opportunities that meet our selective criteria to achieve an appropriate risk-adjusted return on capital. Our average per property investment is approximately $5.6 million and we target individual property acquisitions of up to approximately $100 million. We also may pursue portfolio acquisitions that are significantly larger based on the desirability of the portfolio, including multiple factors such as, but not limited to, property type, geography, tenant, and industry. We generally pursue attractive investment opportunities in the U.S. regardless of geographic location, but have historically concentrated our acquisition efforts in the Midwest and Southwest regions of the country.
Our Competitive Strengths
We believe we possess the following competitive strengths that enable us to implement our business and growth strategies and distinguish our Company from other market participants, allowing us to compete effectively in the single-tenant, net lease market:
| • | Diversified Portfolio of High-Quality Properties that are Key to Tenant Operations. Our portfolio is diversified by property type, geography, tenant, and industry. As of September 30, 2019, our portfolio consisted of 661 individual net leased commercial properties located in 42 U.S. states and one property located in British Columbia, Canada. Our portfolio is primarily focused in industrial, healthcare, restaurant, office, and retail property types, with approximately 187 tenants operating 171 different brands across 53 different industries. Our top ten tenants represented 19.5% of our portfolio ABR as of September 30, 2019, with no single tenant representing more than 2.8%. As of September 30, 2019, 99.8% of our portfolio’s rentable square footage, representing all but four of our properties, was subject to a lease, substantially all of which are net leases. The weighted average remaining term of our leases was approximately 11.7 years, excluding renewal options, and 97.9% of our leases had contractual rent escalations, with an annual ABR weighted average minimum increase of 2.1%. We focus on acquiring a diversified portfolio of properties that are strategically located or important to the tenant’s business. We believe that our highly diversified portfolio provides us with acquisition flexibility, positioning us for significant growth, and helps mitigate the risks inherent in a concentration in only one or a few property types, geographies, tenants, or industries, including risks presented by tenant bankruptcies, adverse industry trends, and economic downturns in a particular geographic area. |
| • | Scalable Net Lease Platform Well Positioned for Significant Growth. With approximately 65 employees upon closing of the Internalization who have extensive net lease expertise and significant experience managing our portfolio, our platform is highly scalable. We have developed leading institutional capabilities across origination, transaction negotiation and documentation, underwriting, financing, and property and asset management. In tandem with our highly diversified portfolio, we have structured our acquisition group in teams of experienced, dedicated industry specialists focused on each of our core property types. Given our team and organizational structure upon closing of the Internalization, we expect that as our portfolio grows, we will experience limited increases in general and administrative expenses, such that those expenses will grow at a significantly slower rate than the overall portfolio and corresponding lease revenues. |
| • | Meaningful Value Creation and Risk Mitigation through Active Asset Management. Our asset and property management teams focus on creating value post-acquisition through active tenant engagement and risk monitoring and mitigation. We seek to create value through leveraging our strong tenant relationships facilitating additional investment opportunities, including opportunistically agreeing to fund or reimburse certain of our tenants for expansion and improvement costs at our properties in exchange for contractually specified rent increases or term extensions. Approximately 87.7% of our ABR is received from tenants that are required to periodically provide us with certain financial information and an additional 4.1% of our ABR is received from tenants that are public companies, which we believe enhances our ability to actively monitor our investments, negotiate lease renewals, and proactively manage our portfolio to protect stockholder value. |
110
Table of Contents
| • | Strong Balance Sheet with Investment Grade Credit Rating. Upon completion of this offering, we expect to have pro forma total debt outstanding of $ million, with a weighted average annual interest rate of % and a weighted average maturity of , % of which is fixed rate debt or hedged through interest rate swaps. In addition, we expect to have approximately $ million of available borrowing capacity under our Revolving Credit Facility and approximately $ million of cash and cash equivalents upon completion of the offering. Upon completion of this offering, we will have a pro forma Net Debt to annualized adjusted EBITDAre ratio of approximately x. Our fiscal strength has enabled us to build a portfolio that is greater than 95% unencumbered on a gross assets basis, with 654 unencumbered properties and approximately $112.9 million of mortgage debt on the remaining properties. Our disciplined ownership and operation of our business is reflected in our investment grade credit rating from Moody’s Investors Service (“Moody’s”) of Baa3 with a stable outlook. We believe we are well positioned to grow our portfolio successfully while maintaining an attractive leverage profile. |
| • | Experienced and Innovative Senior Leadership Team with Proven Net Lease Track Record. Our senior management team has significant net lease real estate, public company, finance, and capital markets experience, including working together and collectively managing our business, operations, and portfolio since 2015. Our senior management team has a strong investment track record having acquired $2.8 billion of net leased real estate since 2015. Christopher J. Czarnecki, our Chief Executive Officer, joined us in 2009 and has over 13 years of experience in the real estate industry, and has overseen various functions, including capital markets activities, acquisitions, accounting, property management, and operations. His responsibilities included raising new debt and equity capital for investment, managing investor relations, industry research, board and investor communications, and portfolio analytics. Our senior management team also has an extensive network of relationships in the net lease real estate business, as well as in the investment banking, real estate broker, financial advisory, and lending communities, which will continue to underpin the expansion of our platform. Our Chief Financial Officer, Ryan M. Albano, who joined us in 2013, has extensive experience in finance and real estate and has significantly contributed to our debt capital markets strategy, particularly since becoming our Chief Financial Officer in 2017, having executed more than $2 billion of debt transactions in that time. Our Chief Investment Officer, Sean T. Cutt, who joined us in 2012, has extensive experience in real estate and has led the sourcing, underwriting, and execution of our acquisitions and dispositions strategies since 2016. Our Chief Operating Officer, John D. Moragne, who joined us in 2016, has extensive experience in real estate and corporate operations, and was instrumental in leading our transition to a public reporting company in 2017. |
Our Business and Growth Strategies
Our primary business objectives are to maximize cash flows, the value of our portfolio, and total returns to our stockholders through pursuit of the following business and growth strategies:
| • | Internal Growth through Long-Term Net Leases with Strong Contractual Rent Escalations. We seek to enter into long-term net leases that include strong rent escalations over the lease term. As of September 30, 2019, substantially all of our portfolio (based on ABR) was subject to net leases, our leases had a weighted average remaining lease term of approximately 11.7 years, excluding renewal options, and 97.9% of our leases had contractual rent escalations, with an annual ABR weighted average minimum increase of 2.1%. 82.4% of our leases have fixed annual rent increases or periodic escalations over the term of the lease (e.g., a 10% increase every five years), 15.5% have annual lease escalations based on increases in the consumer price index, and the remaining 2.1% are flat leases, meaning that they do not contain rent escalation provisions. |
| • | Disciplined and Targeted Acquisition Growth While Maintaining Our Diversified Portfolio. We plan to continue our disciplined and targeted acquisition strategy to identify properties that are both individually compelling and contribute to our portfolio’s overall diversification based on property type, geography, tenant, and industry. Within each property type, we target specific acquisition opportunities |
111
Table of Contents
| in a highly selective manner. For example, in the healthcare property type, we primarily target medical office buildings, large regional physician practices, and off-campus clinics affiliated with major health systems that range in value from $5 to $15 million because we believe these investment characteristics demonstrate risk-adjusted returns that are consistent with our investment objectives. We also are highly focused on growing our business where we can capture the best opportunities across different property types while maintaining the overall diversity of our portfolio. Although a larger portfolio acquisition may impact the relative percentages of our property types, we strive to maintain a highly diversified portfolio on a sustained basis. Given current market dynamics and trends, we expect industrial to continue to be our greatest concentration (measured by ABR) followed by healthcare, restaurant, office, and retail. We believe our reputation, in-depth market knowledge, and extensive network of established relationships in the net lease industry will continue to provide us access to an ongoing pipeline of attractive investment opportunities. |
| • | Selectively Identify Attractive Adjacent Opportunities to Our Core Property Types. We have and will continue to seek attractive adjacent opportunities to our core property types in the net lease space, which have historically provided us the opportunity to earn higher relative returns. For example, in 2015, we began acquiring and structuring long-term net leases for laboratory facilities, veterinary clinics, and cold storage facilities prior to what we believe was the more general market acceptance of these asset types in the healthcare and industrial sectors. We intend to continue opportunistically employing this strategy where we believe we can generate appropriate risk-adjusted returns for our stockholders on a long-term basis. |
| • | Actively Manage Our Balance Sheet to Maximize Capital Efficiency. We seek to maintain a prudent balance between debt and equity financing and to maintain funding sources that lock in long-term investment spreads, limit interest rate sensitivity, and align with our lease terms. As of September 30, 2019, on a pro forma basis, we had $ of total debt outstanding, net debt of $ , and ratio of net debt to annualized adjusted EBITDAre of x. In the future, we will seek to maintain on a sustained basis a level of net debt that is generally less than six times our annualized adjusted EBITDAre. Following completion of this offering, we expect to have $ million of available borrowing capacity under our Revolving Credit Facility and $ of cash and cash equivalents, and we may pursue access to other sources of debt capital, including the public unsecured and private placement debt markets, with the benefit of our investment grade credit rating. |
| • | Proactively Manage Our Portfolio. We believe our proactive approach to asset management and property management helps enhance the performance of our portfolio through risk mitigation strategies and opportunistic sales. We regularly review and monitor each of our properties to identify changes in the business performance and credit quality of our tenants, individual property level performance metrics, and the local real estate market conditions. We believe that our proactive approach to asset management enables our platform to identify and address any issues, including the determination to sell any of our properties where we believe the risk profile has changed and become misaligned with our then current risk-adjusted return objectives. We also may selectively decide to sell properties that no longer meet one or more of our investment criteria or that may be sold opportunistically at attractive prices. Since 2015, we have sold 67 properties for an aggregate sales price of approximately $258.2 million, resulting in a 23.1% gain over book value and a 17.4% gain over original purchase price. |
Our Real Estate Investment Portfolio
To achieve an appropriate risk-adjusted return, we intend to maintain a diversified portfolio of real estate spread across multiple property types, geographic locations, tenants, and industries. As of September 30, 2019, we had a diversified portfolio of 661 properties located in 42 states and one property located in Canada that were occupied by 187 different tenants and provided ABR of $293.8 million. As of September 30, 2019, our largest tenant accounted for just 2.8% of ABR, and our top ten tenants represented only 19.5% of our ABR.
112
Table of Contents
As of September 30, 2019, our top ten tenants (based on ABR) represented only 19.5% of our ABR and included Art Van Furniture, Red Lobster, Jack’s Family Restaurants, Axcelis, Hensley, Outback Steakhouse, Krispy Kreme, BluePearl, Big Tex Trailer Manufacturing, and Siemens. Set forth below is information with respect to each of our top ten tenants. Additional information regarding these tenants, including the number of properties each tenant leases from us, is provided below under the heading “Top 20 Tenants.”
Art Van Furniture (Art Van Furniture, LLC). Art Van Furniture is a furniture retail store chain with headquarters in Warren, Michigan. The retailer operates under several brand names, including Art Van Furniture, Levin Furniture, and Wolf Furniture, among others. Art Van Furniture has 190 locations across nine states. Founded in 1959, Art Van Furniture is now owned by affiliates of Thomas H. Lee Partners, a private equity firm that purchased the company from the founder in 2017.
Red Lobster (Red Lobster Intermediate Holdings, LLC). Red Lobster is the world’s largest seafood restaurant company with more than 700 restaurants worldwide and approximately 50,000 employees. Red Lobster was founded in 1968 by Bill Darden in Lakeland, Florida, and has been owned since 2014 by Golden Gate Capital.
Jack’s Family Restaurants (Big Jack Holdings, LP/Jack’s Family Restaurants, LP). Jack’s Family Restaurants is a regional premium quick-service restaurant chain in operation since 1960 that offers Southern-inspired foods. As of January 1, 2019, the company operated 161 free-standing restaurants. Jack’s Family Restaurants is owned by an affiliate of private equity firm AEA Investors LP.
Axcelis (Axcelis Technologies, Inc.). Founded in 1995 and headquartered in Beverly, Massachusetts, Axcelis designs, manufactures, and services ion implantation and other processing equipment used in the fabrication of semiconductor chips worldwide. Axcelis offers a line of high-energy, high-current, and medium-current implanters, curing systems, and thermal processing systems, as well as aftermarket lifecycle products and services.
Hensley (Hensley & Company). Hensley is a multi-generational, family-owned beverage wholesaler that distributes a wide portfolio of beverages. Founded in 1955, Hensley is based in Phoenix, Arizona, with branches in Chandler, Prescott, and Tucson. It distributes beers, wines, cocktails, spirits, and snacks, as well as non-alcoholic beverages including cold drinks, energy drinks, teas, sodas, and orange juices.
Outback Steakhouse (Bloomin’ Brands, Inc.). Bloomin’ Brands, Inc., through its subsidiaries, owns and operates casual, upscale casual, and fine dining restaurants across the world. Founded in 1988, Bloomin’ Brands operates Outback Steakhouse, Carrabba’s Italian Grill, Fleming’s Prime Steakhouse & Wine Bar, and Bonefish Grill. At year-end 2018, Bloomin’ Brands, Inc. owned and operated 1,068 restaurants and franchised 164 restaurants across 48 states, as well as 125 restaurants and franchised 131 restaurants across 20 countries, Puerto Rico, and Guam. Outback Steakhouse is an Australian-themed American casual dining restaurant chain.
Krispy Kreme (Krispy Kreme Doughnut Corporation). Krispy Kreme is a global retailer of premium-quality doughnuts, coffee, treats, and packaged sweets. Krispy Kreme products can be found in approximately 12,000 grocery, convenience, and mass merchant stores in the United States. As of December 30, 2018, Krispy Kreme operated approximately 1,400 retail shops in 33 countries. Krispy Kreme is owned by JAB Holding Company.
BluePearl (BluePearl Holdings, LLC). BluePearl, founded in 1996 and based in Tampa, Florida, does business as BluePearl Veterinary Partners and operates specialty and emergency veterinary hospitals, providing a full range of critical, clinical, and rehabilitation services. Since 2015, BluePearl has operated as a subsidiary of Mars Petcare US, Inc.
113
Table of Contents
Big Tex Trailer Manufacturing (American Trailer World Corp.). Founded in 1982 and headquartered in Mt. Pleasant, Texas, Big Tex Trailer Manufacturing manufactures and distributes professional grade trailers and truck beds, consumer grade trailers, as well as enclosed trailers. As of December 31, 2018, Big Tex operates 20 manufacturing facilities, 33 wholesale and retail parts distribution and sales locations, and 70 retail stores throughout the United States. Big Tex is owned by Bain Capital Private Equity.
Siemens (Siemens Medical Solutions USA, Inc./Flender Corporation). Siemens Medical Solutions USA, Inc. operates as a subsidiary of Siemens Corporation. Siemens provides medical imaging, laboratory diagnostics, and healthcare information technology products. Flender Corporation was acquired by Siemens Energy & Automation in 2006. Flender Corporation manufactures mechanical and electrical components for power transmission equipment including drive systems, gear units, couplings, and geared motors. The company is headquartered in Elgin, Illinois, with manufacturing facilities and sales offices internationally.
The following charts summarize our portfolio diversification by property type, tenant, industry, and geographic location as of September 30, 2019. The percentages below are calculated based on our ABR as of September 30, 2019.
Diversification by Property Type
Top 10 Property Types
114
Table of Contents
| Property Type |
# Properties |
ABR ($‘000s) |
ABR as a % of Total Portfolio |
Square Feet (‘000s) |
SF as a % of Total Portfolio |
|||||||||||||||
| Industrial |
||||||||||||||||||||
| Manufacturing |
55 | $ | 39,876 | 13.6 | % | 7,531 | 27.4 | % | ||||||||||||
| Distribution & Warehouse |
32 | 38,933 | 13.3 | % | 6,989 | 25.5 | % | |||||||||||||
| Food Processing |
15 | 19,825 | 6.7 | % | 2,286 | 8.3 | % | |||||||||||||
| Flex and R&D |
7 | 16,173 | 5.5 | % | 1,457 | 5.3 | % | |||||||||||||
| Cold Storage |
4 | 12,156 | 4.1 | % | 933 | 3.4 | % | |||||||||||||
|
|
|
|
|
|
|
|
|
|
|
|||||||||||
| Industrial Total |
113 | 126,963 | 43.2 | % | 19,196 | 69.9 | % | |||||||||||||
| Healthcare |
||||||||||||||||||||
| Clinical |
51 | 25,659 | 8.7 | % | 1,103 | 4.0 | % | |||||||||||||
| Surgical |
16 | 9,486 | 3.2 | % | 369 | 1.3 | % | |||||||||||||
| Animal Health Services |
20 | 7,864 | 2.7 | % | 314 | 1.2 | % | |||||||||||||
| Life Science |
9 | 7,329 | 2.5 | % | 549 | 2.0 | % | |||||||||||||
| Healthcare Services |
30 | 7,069 | 2.4 | % | 270 | 1.0 | % | |||||||||||||
|
|
|
|
|
|
|
|
|
|
|
|||||||||||
| Healthcare Total |
126 | 57,407 | 19.5 | % | 2,605 | 9.5 | % | |||||||||||||
| Restaurant |
||||||||||||||||||||
| Quick Service Restaurants |
159 | 25,727 | 8.8 | % | 533 | 1.9 | % | |||||||||||||
| Casual Dining |
95 | 21,006 | 7.1 | % | 606 | 2.2 | % | |||||||||||||
|
|
|
|
|
|
|
|
|
|
|
|||||||||||
| Restaurant Total |
254 | 46,733 | 15.9 | % | 1,139 | 4.1 | % | |||||||||||||
| Office |
||||||||||||||||||||
| Strategic Operations |
7 | 13,265 | 4.5 | % | 1,021 | 3.7 | % | |||||||||||||
| Corporate Headquarters |
6 | 9,484 | 3.2 | % | 649 | 2.4 | % | |||||||||||||
| Call Center |
4 | 5,517 | 1.9 | % | 392 | 1.4 | % | |||||||||||||
|
|
|
|
|
|
|
|
|
|
|
|||||||||||
| Office Total |
17 | 28,266 | 9.6 | % | 2,062 | 7.5 | % | |||||||||||||
| Retail |
||||||||||||||||||||
| Home Furnishings |
15 | 9,784 | 3.3 | % | 860 | 3.2 | % | |||||||||||||
| Automotive |
57 | 9,530 | 3.3 | % | 747 | 2.7 | % | |||||||||||||
| General Merchandise |
64 | 8,775 | 3.0 | % | 692 | 2.5 | % | |||||||||||||
|
|
|
|
|
|
|
|
|
|
|
|||||||||||
| Retail Total |
136 | 28,089 | 9.6 | % | 2,299 | 8.4 | % | |||||||||||||
| Other Total |
16 | 6,367 | 2.2 | % | 173 | 0.6 | % | |||||||||||||
|
|
|
|
|
|
|
|
|
|
|
|||||||||||
| Total |
662 | $ | 293,825 | 100.0 | % | 27,474 | 100.0 | % | ||||||||||||
|
|
|
|
|
|
|
|
|
|
|
|||||||||||
115
Table of Contents
Diversification by Industry
| Industry |
# Properties | ABR ($‘000s) |
ABR as a % of Total Portfolio |
Square Feet (‘000s) |
SF as a % of Total Portfolio |
|||||||||||||||
| Restaurants |
255 | $ | 47,397 | 16.1 | % | 1,170 | 4.3 | % | ||||||||||||
| Healthcare Facilities |
101 | 45,954 | 15.6 | % | 1,840 | 6.7 | % | |||||||||||||
| Packaged Foods & Meats |
7 | 12,924 | 4.4 | % | 1,285 | 4.7 | % | |||||||||||||
| Food Distributors |
7 | 12,534 | 4.3 | % | 1,556 | 5.7 | % | |||||||||||||
| Home Furnishing Retail |
19 | 12,131 | 4.1 | % | 1,300 | 4.7 | % | |||||||||||||
| Specialized Consumer Services |
42 | 10,740 | 3.7 | % | 753 | 2.7 | % | |||||||||||||
| Auto Parts & Equipment |
32 | 10,239 | 3.5 | % | 2,241 | 8.2 | % | |||||||||||||
| Metal & Glass Containers |
8 | 9,402 | 3.2 | % | 2,196 | 8.0 | % | |||||||||||||
| Healthcare Services |
15 | 7,685 | 2.6 | % | 467 | 1.7 | % | |||||||||||||
| Air Freight & Logistics |
13 | 7,537 | 2.6 | % | 519 | 1.9 | % | |||||||||||||
| Aerospace & Defense |
6 | 7,428 | 2.5 | % | 921 | 3.3 | % | |||||||||||||
| Distributors |
12 | 6,684 | 2.3 | % | 961 | 3.5 | % | |||||||||||||
| Electronic Components |
2 | 6,372 | 2.2 | % | 466 | 1.7 | % | |||||||||||||
| Industrial Machinery |
15 | 5,386 | 1.8 | % | 1,096 | 4.0 | % | |||||||||||||
| Home Furnishings |
2 | 5,130 | 1.7 | % | 942 | 3.4 | % | |||||||||||||
| Other (38 industries) |
122 | 86,282 | 29.4 | % | 9,710 | 35.3 | % | |||||||||||||
| Untenanted properties |
4 | — | — | 51 | 0.2 | % | ||||||||||||||
|
|
|
|
|
|
|
|
|
|
|
|||||||||||
| Total |
662 | $ | 293,825 | 100.0 | % | 27,474 | 100.0 | % | ||||||||||||
|
|
|
|
|
|
|
|
|
|
|
|||||||||||
116
Table of Contents
Diversification by Geography, by % of ABR
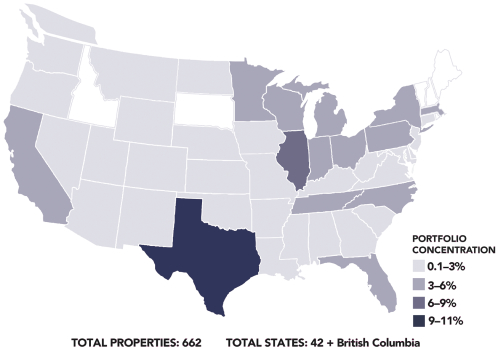
|
State |
# Properties |
ABR ($‘000s) |
ABR as a % of Total Portfolio |
Square Feet (‘000s) |
SF as a % of Total Portfolio |
State |
# Properties |
ABR ($‘000s) |
ABR as a % of Total Portfolio |
Square Feet (‘000s) |
SF as a % of Total Portfolio |
|||||||||||||||||||||||||||||||||||||
| TX |
53 | $ | 30,966 | 10.5 | % | 3,251 | 11.8 | % | VA | 14 | $ | 4,521 | 1.5 | % | 110 | 0.4 | % | |||||||||||||||||||||||||||||||
| IL |
28 | 19,773 | 6.7 | % | 1,990 | 7.2 | % | WA | 15 | 3,988 | 1.4 | % | 150 | 0.6 | % | |||||||||||||||||||||||||||||||||
| MI |
35 | 16,809 | 5.7 | % | 1,439 | 5.2 | % | MO | 9 | 3,808 | 1.3 | % | 733 | 2.7 | % | |||||||||||||||||||||||||||||||||
| FL |
52 | 16,054 | 5.5 | % | 844 | 3.1 | % | KY | 18 | 3,693 | 1.3 | % | 179 | 0.6 | % | |||||||||||||||||||||||||||||||||
| WI |
33 | 15,218 | 5.2 | % | 1,569 | 5.7 | % | SC | 17 | 3,279 | 1.1 | % | 342 | 1.3 | % | |||||||||||||||||||||||||||||||||
| CA |
11 | 15,037 | 5.1 | % | 1,554 | 5.7 | % | NE | 6 | 2,900 | 1.0 | % | 509 | 1.9 | % | |||||||||||||||||||||||||||||||||
| OH |
37 | 14,233 | 4.8 | % | 1,379 | 5.0 | % | MD | 4 | 2,804 | 1.0 | % | 293 | 1.1 | % | |||||||||||||||||||||||||||||||||
| IN |
29 | 11,958 | 4.1 | % | 1,738 | 6.3 | % | LA | 2 | 2,726 | 0.9 | % | 161 | 0.6 | % | |||||||||||||||||||||||||||||||||
| NC |
29 | 10,578 | 3.6 | % | 1,149 | 4.2 | % | IA | 4 | 2,610 | 0.9 | % | 622 | 2.3 | % | |||||||||||||||||||||||||||||||||
| MN |
22 | 9,608 | 3.3 | % | 1,254 | 4.6 | % | NM | 7 | 2,420 | 0.8 | % | 77 | 0.3 | % | |||||||||||||||||||||||||||||||||
| PA |
17 | 9,451 | 3.2 | % | 1,077 | 3.9 | % | UT | 3 | 2,240 | 0.8 | % | 280 | 1.0 | % | |||||||||||||||||||||||||||||||||
| MA |
4 | 9,394 | 3.2 | % | 1,009 | 3.7 | % | CT | 2 | 1,616 | 0.6 | % | 55 | 0.2 | % | |||||||||||||||||||||||||||||||||
| NY |
16 | 8,937 | 3.0 | % | 578 | 2.1 | % | MS | 2 | 1,607 | 0.6 | % | 239 | 0.9 | % | |||||||||||||||||||||||||||||||||
| TN |
37 | 8,865 | 3.0 | % | 372 | 1.4 | % | WV | 8 | 1,600 | 0.6 | % | 36 | 0.1 | % | |||||||||||||||||||||||||||||||||
| OK |
28 | 8,310 | 2.8 | % | 856 | 3.1 | % | MT | 7 | 1,446 | 0.5 | % | 43 | 0.2 | % | |||||||||||||||||||||||||||||||||
| AL |
45 | 7,766 | 2.6 | % | 177 | 0.6 | % | CO | 3 | 1,406 | 0.5 | % | 94 | 0.3 | % | |||||||||||||||||||||||||||||||||
| AZ |
6 | 7,675 | 2.6 | % | 716 | 2.6 | % | NV | 2 | 1,283 | 0.4 | % | 81 | 0.3 | % | |||||||||||||||||||||||||||||||||
| AR |
11 | 7,246 | 2.5 | % | 284 | 1.0 | % | ND | 2 | 893 | 0.3 | % | 28 | 0.1 | % | |||||||||||||||||||||||||||||||||
| GA |
25 | 6,793 | 2.3 | % | 910 | 3.3 | % | DE | 3 | 657 | 0.2 | % | 35 | 0.1 | % | |||||||||||||||||||||||||||||||||
| KS |
10 | 4,837 | 1.7 | % | 639 | 2.3 | % | WY | 1 | 279 | 0.1 | % | 21 | 0.1 | % | |||||||||||||||||||||||||||||||||
| NJ |
3 | 4,524 | 1.5 | % | 366 | 1.3 | % | OR | 1 | 98 | <0.1 | % | 4 | <0.1 | % | |||||||||||||||||||||||||||||||||
|
|
|
|
|
|
|
|
|
|
|
|||||||||||||||||||||||||||||||||||||||
| Total US | 661 | $ | 289,906 | 98.7 | % | 27,243 | 99.2 | % | ||||||||||||||||||||||||||||||||||||||||
| Total Canada | 1 | 3,919 | 1.3 | % | 231 | 0.8 | % | |||||||||||||||||||||||||||||||||||||||||
|
|
|
|
|
|
|
|
|
|
|
|||||||||||||||||||||||||||||||||||||||
| Grand Total | 662 | $ | 293,825 | 100.0 | % | 27,474 | 100.0 | % | ||||||||||||||||||||||||||||||||||||||||
|
|
|
|
|
|
|
|
|
|
|
|||||||||||||||||||||||||||||||||||||||
117
Table of Contents
At September 30, 2019, 99.8% of our portfolio’s rentable square footage, representing all but four of our properties, is subject to a lease. Our cash flows from operations are primarily generated through our real estate investment portfolio and the monthly lease payments received under our long-term leases with our tenants.
Because substantially all of our properties are leased under long-term leases, we are not currently required to perform significant ongoing leasing activities on our properties. The leases for three of our properties, representing less than 1% of our ABR, will expire before 2021. As of September 30, 2019, the weighted average remaining term of our leases was approximately 11.7 years, excluding renewal options. Less than 5% of the properties in our portfolio are subject to leases without at least one renewal option. More than 59% of our rental revenue is derived from leases that expire during 2030 and thereafter. As of September 30, 2019, no more than 9% of our rental revenue is derived from leases that expire in any single year in the next ten years. One of our properties has a tenant repurchase option. The following chart sets forth our lease expirations based upon the terms of our leases in place as of September 30, 2019.
Lease Maturity Schedule, by % of ABR
| Expiration |
2020 | 2021 | 2022 | 2023 | 2024 | 2025 | 2026 | 2027 | 2028 | 2029 | 2030 | 2031 | 2032 | 2033 | 2034 | 2035 | 2036 | 2037 | 2038 | 2039 | 2040+ | |||||||||||||||||||||||||||||||||||||||||||||||||||||||||||||||
| # Properties |
3 | 11 | 4 | 13 | 14 | 21 | 34 | 32 | 36 | 61 | 83 | 17 | 46 | 46 | 34 | 48 | 30 | 55 | 32 | 36 | 2 | |||||||||||||||||||||||||||||||||||||||||||||||||||||||||||||||
| # Leases |
3 | 11 | 5 | 13 | 14 | 21 | 26 | 26 | 30 | 26 | 36 | 12 | 21 | 14 | 17 | 9 | 5 | 12 | 28 | 8 | 2 | |||||||||||||||||||||||||||||||||||||||||||||||||||||||||||||||
118
Table of Contents
The following table presents certain information based on lease expirations by year. Amounts are in thousands, except the number of properties.
| Expiration Year |
# Properties | ABR ($‘000s) |
ABR as a % of Total Portfolio |
Square Feet (‘000s) |
SF as a % of Total Portfolio |
|||||||||||||||
| 2020 |
3 | $ | 783 | 0.3 | % | 87 | 0.3 | % | ||||||||||||
| 2021 |
11 | 1,919 | 0.7 | % | 99 | 0.4 | % | |||||||||||||
| 2022 |
4 | 3,273 | 1.1 | % | 124 | 0.5 | % | |||||||||||||
| 2023 |
13 | 6,873 | 2.3 | % | 703 | 2.5 | % | |||||||||||||
| 2024 |
14 | 13,545 | 4.6 | % | 1,672 | 6.1 | % | |||||||||||||
| 2025 |
21 | 7,627 | 2.6 | % | 693 | 2.5 | % | |||||||||||||
| 2026 |
34 | 18,333 | 6.2 | % | 1,521 | 5.5 | % | |||||||||||||
| 2027 |
32 | 22,851 | 7.8 | % | 2,006 | 7.3 | % | |||||||||||||
| 2028 |
36 | 26,266 | 8.9 | % | 2,715 | 9.9 | % | |||||||||||||
| 2029 |
61 | 18,247 | 6.2 | % | 2,481 | 9.0 | % | |||||||||||||
| 2030 |
83 | 43,376 | 14.8 | % | 4,318 | 15.7 | % | |||||||||||||
| 2031 |
17 | 5,327 | 1.8 | % | 518 | 1.9 | % | |||||||||||||
| 2032 |
46 | 22,804 | 7.8 | % | 2,303 | 8.4 | % | |||||||||||||
| 2033 |
46 | 20,252 | 6.9 | % | 2,339 | 8.5 | % | |||||||||||||
| 2034 |
34 | 7,150 | 2.4 | % | 454 | 1.7 | % | |||||||||||||
| 2035 |
48 | 15,975 | 5.4 | % | 1,453 | 5.3 | % | |||||||||||||
| 2036 |
30 | 9,606 | 3.3 | % | 784 | 2.9 | % | |||||||||||||
| 2037 |
55 | 26,805 | 9.1 | % | 1,713 | 6.2 | % | |||||||||||||
| 2038 |
32 | 6,619 | 2.3 | % | 303 | 1.1 | % | |||||||||||||
| 2039 |
36 | 15,892 | 5.4 | % | 1,131 | 4.1 | % | |||||||||||||
| Thereafter |
2 | 302 | 0.1 | % | 6 | — | ||||||||||||||
| Untenanted properties |
4 | — | — | 51 | 0.2 | % | ||||||||||||||
|
|
|
|
|
|
|
|
|
|
|
|||||||||||
| Total |
662 | $ | 293,825 | 100.0 | % | 27,474 | 100.0 | % | ||||||||||||
|
|
|
|
|
|
|
|
|
|
|
|||||||||||
119
Table of Contents
Top 20 Tenants
Our top tenants and brands by percentage of ABR at September 30, 2019, are listed in the tables below. The percentages of ABR shown are calculated based on the ABR associated with the tenant or brand divided by total ABR. Amounts are in thousands, except the number of properties
| Tenant |
Property Type |
# Properties |
ABR ($‘000s) |
ABR as a % of Total Portfolio |
Square Feet (‘000s) |
SF as a % of Total Portfolio |
||||||||||||||||
| Art Van Furniture, LLC* |
Home Furnishings | 10 | $ | 8,285 | 2.8 | % | 665 | 2.4 | % | |||||||||||||
| Red Lobster Hospitality & Red Lobster Restaurants LLC* |
Casual Dining | 25 | 7,469 | 2.5 | % | 203 | 0.7 | % | ||||||||||||||
| Jack’s Family Restaurants LP* |
Quick Service Restaurants | 36 | 5,948 | 2.0 | % | 121 | 0.5 | % | ||||||||||||||
| Axcelis Technologies, Inc. |
Flex and R&D | 1 | 5,604 | 1.9 | % | 417 | 1.5 | % | ||||||||||||||
| Hensley & Company* |
Distribution & Warehouse | 3 | 5,533 | 1.9 | % | 577 | 2.1 | % | ||||||||||||||
| Outback Steakhouse of Florida LLC* 1 |
Casual Dining | 24 | 5,402 | 1.8 | % | 152 | 0.6 | % | ||||||||||||||
| Krispy Kreme Doughnut Corporation |
Quick Service Restaurants/Food Processing |
27 | 5,034 | 1.7 | % | 156 | 0.6 | % | ||||||||||||||
| BluePearl Holdings, LLC* |
Animal Health Services | 12 | 4,877 | 1.7 | % | 154 | 0.6 | % | ||||||||||||||
| Big Tex Trailer Manufacturing, Inc.* |
Automotive/Distribution & Warehouse/Manufacturing/ Corporate Headquarters |
17 | 4,671 | 1.6 | % | 1,302 | 4.7 | % | ||||||||||||||
| Siemens Medical Solutions USA, Inc. & Siemens Corporation |
Manufacturing/Flex and R&D | 2 | 4,575 | 1.6 | % | 545 | 2.0 | % | ||||||||||||||
| Nestle’ Dreyer’s Ice Cream Company |
Cold Storage | 1 | 4,280 | 1.4 | % | 310 | 1.1 | % | ||||||||||||||
| Nationwide Mutual Insurance Company* |
Strategic Operations | 2 | 4,083 | 1.4 | % | 407 | 1.5 | % | ||||||||||||||
| Arkansas Surgical Hospital |
Surgical | 1 | 4,055 | 1.4 | % | 129 | 0.5 | % | ||||||||||||||
| Cascade Aerospace Inc. |
Manufacturing | 1 | 3,919 | 1.3 | % | 231 | 0.8 | % | ||||||||||||||
| Bob Evans Restaurants, LLC* |
Casual Dining | 25 | 3,790 | 1.3 | % | 131 | 0.5 | % | ||||||||||||||
| Fresh Express Incorporated |
Food Processing | 1 | 3,734 | 1.3 | % | 335 | 1.2 | % | ||||||||||||||
| BEF Foods, Inc.* |
Food Processing | 2 | 3,694 | 1.3 | % | 331 | 1.2 | % | ||||||||||||||
| Securus Technologies Holdings, Inc. |
Corporate Headquarters | 1 | 3,664 | 1.2 | % | 154 | 0.6 | % | ||||||||||||||
| Zips Car Wash, LLC* |
Automotive | 14 | 3,199 | 1.1 | % | 57 | 0.2 | % | ||||||||||||||
| Centene Management Company, LLC |
Strategic Operations | 1 | 3,157 | 1.1 | % | 220 | 0.8 | % | ||||||||||||||
|
|
|
|
|
|
|
|
|
|
|
|||||||||||||
| Total Top 20 Tenants |
206 | $ | 94,973 | 32.3 | % | 6,597 | 23.9 | % | ||||||||||||||
|
|
|
|
|
|
|
|
|
|
|
|||||||||||||
| 1 | Tenant’s properties include 22 Outback Steakhouse restaurants and two Carrabba’s Italian Grill Restaurants |
| * | Subject to a master lease |
120
Table of Contents
Top 20 Brands
| Brand |
Property Type |
# Properties |
ABR ($‘000s) |
ABR as a % of Total Portfolio |
Square Feet (‘000s) |
SF as a % of Total Portfolio |
||||||||||||||||
| Art Van Furniture* |
Home Furnishings | 10 | $ | 8,285 | 2.8 | % | 665 | 2.4 | % | |||||||||||||
| Bob Evans Farms* |
Casual Dining/Food Processing | 27 | 7,484 | 2.6 | % | 462 | 1.7 | % | ||||||||||||||
| Red Lobster* |
Casual Dining | 25 | 7,469 | 2.5 | % | 203 | 0.7 | % | ||||||||||||||
| Wendy’s# |
Quick Service Restaurants | 41 | 6,002 | 2.0 | % | 122 | 0.4 | % | ||||||||||||||
| Jack’s Family Restaurants* |
Quick Service Restaurants | 36 | 5,948 | 2.0 | % | 121 | 0.4 | % | ||||||||||||||
| Axcelis |
Flex and R&D | 1 | 5,604 | 1.9 | % | 417 | 1.5 | % | ||||||||||||||
| Hensley* |
Distribution & Warehouse | 3 | 5,533 | 1.9 | % | 577 | 2.1 | % | ||||||||||||||
| Krispy Kreme |
Quick Service Restaurants/Food Processing | 27 | 5,034 | 1.7 | % | 156 | 0.6 | % | ||||||||||||||
| BluePearl Veterinary Partners* |
Animal Health Services | 12 | 4,877 | 1.7 | % | 154 | 0.6 | % | ||||||||||||||
| Outback Steakhouse* |
Casual Dining | 22 | 4,725 | 1.6 | % | 138 | 0.5 | % | ||||||||||||||
| Big Tex Trailers* |
Automotive/Distribution & Warehouse/Manufacturing/ Corporate Headquarters |
17 | 4,671 | 1.6 | % | 1,302 | 4.7 | % | ||||||||||||||
| Taco Bell# |
Quick Service Restaurants | 37 | 4,664 | 1.6 | % | 94 | 0.3 | % | ||||||||||||||
| Siemens |
Manufacturing/Flex and R&D | 2 | 4,575 | 1.6 | % | 545 | 2.0 | % | ||||||||||||||
| Nestle |
Cold Storage | 1 | 4,280 | 1.4 | % | 310 | 1.1 | % | ||||||||||||||
| Nationwide Mutual Insurance Co.* |
Strategic Operations | 2 | 4,083 | 1.4 | % | 407 | 1.5 | % | ||||||||||||||
| Arkansas Surgical Hospital |
Surgical | 1 | 4,055 | 1.4 | % | 129 | 0.5 | % | ||||||||||||||
| Cascade Aerospace |
Manufacturing | 1 | 3,919 | 1.3 | % | 231 | 0.8 | % | ||||||||||||||
| Chiquita |
Food Processing | 1 | 3,734 | 1.3 | % | 335 | 1.2 | % | ||||||||||||||
| Securus Technologies |
Corporate Headquarters | 1 | 3,664 | 1.2 | % | 154 | 0.6 | % | ||||||||||||||
| Zips Car Wash* |
Automotive | 14 | 3,199 | 1.1 | % | 57 | 0.2 | % | ||||||||||||||
|
|
|
|
|
|
|
|
|
|
|
|||||||||||||
| Total Top 20 Brands |
281 | $ | 101,805 | 34.6 | % | 6,579 | 23.8 | % | ||||||||||||||
|
|
|
|
|
|
|
|
|
|
|
|||||||||||||
| * | Subject to a master lease |
| # | Includes properties leased by multiple tenants, some, not all, of which are subject to master leases |
121
Table of Contents
Historical Acquisitions and Dispositions
The following table and below charts illustrate our annual acquisition and disposition activity since 2015. The acquisition dollar amounts are based on investment cost and the disposition dollar amounts reflect the sale prices of the properties sold:
| Year ended December 31, | Nine months ended September 30, |
|||||||||||||||||||
| 2015 | 2016 | 2017 | 2018 | 2019 | ||||||||||||||||
| Acquisitions (1) |
$ | 550,128 | $ | 518,812 | $ | 683,644 | $ | 606,825 | $ | 993,689 | ||||||||||
| Volume (‘000s) |
||||||||||||||||||||
| Industrial |
179,191 | 64,737 | 206,095 | 182,682 | 852,807 | |||||||||||||||
| Healthcare |
135,821 | 69,116 | 147,242 | 207,196 | 32,024 | |||||||||||||||
| Office |
— | 127,667 | 79,480 | 34,670 | 63,639 | |||||||||||||||
| Restaurant |
233,116 | 173,454 | 59,813 | 89,755 | 3,214 | |||||||||||||||
| Retail |
2,000 | 44,439 | 175,321 | 92,522 | 42,005 | |||||||||||||||
| Other |
— | 39,399 | 15,693 | — | — | |||||||||||||||
| Transactions (#) |
27 | 22 | 29 | 26 | 16 | |||||||||||||||
| Average Transaction Price |
$ | 20,375 | $ | 23,582 | $ | 23,574 | $ | 23,339 | $ | 62,106 | ||||||||||
| Properties (#) |
116 | 88 | 124 | 113 | 66 | |||||||||||||||
| Average Property Price |
$ | 4,742 | $ | 5,896 | $ | 5,513 | $ | 5,370 | $ | 15,056 | ||||||||||
| Cash Cap Rate |
6.9 | % | 6.8 | % | 7.2 | % | 6.9 | % | 6.6 | % | ||||||||||
| Remaining Lease Term (years) |
16.6 | 15.4 | 15.0 | 11.0 | 12.3 | |||||||||||||||
| Dispositions |
$ | 19,455 | $ | 39,500 | $ | 66,532 | $ | 57,402 | $ | 94,791 | ||||||||||
| Volume (‘000s) |
||||||||||||||||||||
| Industrial |
2,200 | — | 41,690 | 5,409 | 26,076 | |||||||||||||||
| Healthcare |
16,849 | 29,969 | 22,671 | 19,965 | 15,846 | |||||||||||||||
| Office |
— | — | — | 4,075 | — | |||||||||||||||
| Restaurant |
406 | 9,531 | — | 16,840 | 32,883 | |||||||||||||||
| Retail |
— | — | 2,171 | 11,113 | 14,023 | |||||||||||||||
| Other |
— | — | — | — | 5,963 | |||||||||||||||
| Transactions (#) |
6 | 9 | 13 | 20 | 25 | |||||||||||||||
| Properties (#) |
6 | 9 | 13 | 20 | 25 | |||||||||||||||
| Aggregate (Loss) Gain on Sale |
$ | (713 | ) | $ | 5,925 | $ | 12,992 | $ | 10,496 | $ | 16,772 | |||||||||
| Cash Cap Rate |
7.8 | % | 6.7 | % | 7.5 | % | 7.5 | % | 7.0 | % | ||||||||||
| (1) | Other than the financial statements included elsewhere within this prospectus, no acquisition was deemed significant for the periods presented. |
122
Table of Contents
Historical Acquisitions ($ in thousands)
Historical Dispositions ($ in thousands)
123
Table of Contents
Investment Guidelines
We seek to acquire primarily freestanding, single-tenant commercial real estate properties located in the United States, with a target size for individual property acquisitions of up to approximately $100 million. We generally seek to invest in properties that are under lease and fully occupied at the time of acquisition. We also seek to maintain our portfolio’s diversification by property type, geography, tenant, and industry in an effort to reduce fluctuations in income caused by under-performing individual real estate assets or adverse economic conditions affecting an entire industry or geographic region. When evaluating whether a property acquisition would contribute to our overall portfolio’s diversification, we expect to take into account the percentage a single property, tenant, or brand would represent in our overall portfolio, as well as geographic concentrations, both by the metropolitan statistical area and by state. While we consider these criteria when evaluating acquisition opportunities, we may also pursue opportunistic investments that do not meet one or more of these factors if we assess that a transaction presents compelling risk-adjusted returns. We intend to primarily acquire portfolios and assets over time that will generally not result in any one tenant representing more than 5% of ABR.
We are focused primarily on investing in the industrial, healthcare, restaurant, office, and retail property types. Within each property type, we target specific acquisition opportunities in a highly selective manner.
| • | Industrial. We focus on single-tenant manufacturing, warehouse and distribution facilities, refrigerated storage, flex-space, food processing, and research and development facilities where the tenant has a strong credit profile and experienced management team. We look for industrial assets where the real estate is mission critical to the tenant’s operations, where the property sits on an essential or strategic location for the tenant, and where it would be difficult or more expensive for the tenant to relocate. We look for industrial properties that are located in close proximity to major transportation thoroughfares such as airports, ports, railways, major freeways or interstate highways. |
| • | Healthcare. We focus on single-tenant medical office buildings, large regional physician practices, and off-campus clinics affiliated with major health systems, as well as laboratories, ambulatory surgical centers, service-type locations such as dental and dialysis centers, and animal health service clinics. We primarily focus on healthcare properties that have substantial tenant investments like special regulatory permits and buildouts that would make relocation difficult or costly. We look for healthcare properties that are mission critical to tenant operations, generally located adjacent to or near hospital campuses or other medical facilities, and where the tenant has a strong credit profile and is not easily displaced by regulatory changes. In certain instances, we will seek additional credit enhancements to augment the credit of the tenant. In states where a certificate of need statute exists, we ensure that our sites carry this designation to maintain long-term viability. |
| • | Restaurant. We focus our restaurant investments primarily in single-tenant quick service restaurant and casual dining properties, with an emphasis on restaurants that are located in strong retail markets. We underwrite restaurant properties primarily based on the fundamental value of the underlying real estate, site level performance, corporate owned location or experienced multi-unit franchise operators, and whether the property is subject to a master lease with multiple operating locations. |
| • | Office. We focus on single-tenant corporate headquarters, call centers, and mission-critical business operations with creditworthy tenants where the property is strategically located or important to the tenant’s business. Key considerations for us when making office investments include a strong tenant credit profile, previous tenant investment in the property, occupancy costs relative to the market, divisibility of the space, and cost associated with repositioning the space upon lease expiration. |
| • | Retail. We focus on e-commerce resistant industries where the presence of a physical location is important to the end consumer and mission critical to the tenant. Our retail investments are primarily in single-tenant, net leased retail establishments in the home furnishings, automotive, and general merchandise industries, with an emphasis on market presence and necessity shopping. We underwrite retail properties primarily based on the fundamental value of the underlying real estate, site level performance, corporate owned location or experienced multi-unit franchise operators, and whether the property is subject to a master lease with multiple operating locations. |
124
Table of Contents
Our Leases
We typically lease our properties pursuant to long-term net leases with initial terms of 10 years or more that often have renewal options. Substantially all of our leases are net, meaning our tenant generally is obligated to pay all expenses associated with the leased property (such as real estate taxes, insurance, maintenance, repairs, and capital costs). We seek to use master lease structures where it fits market practice in the particular property type, pursuant to which we seek to lease multiple properties to a single tenant on an all or none basis. In a master lease structure, a tenant is responsible for a single lease payment relating to the entire portfolio of leased properties, as opposed to multiple lease payments relating to individually leased properties. The master lease structure prevents a tenant from “cherry picking” locations, where it unilaterally gives up underperforming properties while maintaining its leasehold interest in well-performing properties. We believe the master lease structure is most prevalent and applicable to leases in our restaurant and retail property type and less relevant to our other property types, such as healthcare and industrial. Additionally, when we acquire properties associated with a tenant that has an existing master lease structure with us, we seek to add the new properties to the existing master lease structure to strengthen the existing lease with such tenant. As of September 30, 2019, master leases contributed approximately 35.9% of our overall ABR (our largest master lease by ABR related to 25 properties and contributed 2.5% of our ABR, and our smallest master lease by ABR related to two properties and contributed 0.1% of our ABR), 73.1% of our restaurant property ABR (167 of our 254 restaurant properties), and 67.0% of our retail property ABR (85 of our 136 properties).
As of September 30, 2019, 87.7% of our ABR was received from tenants that are required to provide us with specified financial information on a periodic basis and an additional 4.1% of our ABR was received from tenants that are public companies, which are required to file financial statements with the SEC, although they are not required to provide us with specified financial information under the terms of our lease.
Substantially all of our leases provide for periodic contractual rent escalations. As of September 30, 2019, leases contributing 97.9% of our ABR provided for increases in future annual base rent, generally ranging from 1.5% to 2.5% annually, with an ABR weighted average annual minimum increase equal to 2.1% of base rent. Generally, our rent escalators increase rent on specified dates by a fixed percentage. Our escalations provide us with a source of organic growth and a measure of inflation protection. Additional information on lease escalation frequency and weighted average annual escalation rates as of September 30, 2019 is displayed below.
| Lease Escalation Frequency |
% of ABR | Weighted Average Annual Minimum Increase (1) |
||||||
| Annually |
81.7 | % | 2.1 | % | ||||
| Every 2 years |
0.1 | % | 1.8 | % | ||||
| Every 3 years |
2.6 | % | 3.0 | % | ||||
| Every 4 years |
1.3 | % | 2.4 | % | ||||
| Every 5 years |
6.9 | % | 2.0 | % | ||||
| Other escalation frequencies |
5.3 | % | 1.8 | % | ||||
| Flat |
2.1 | % | N/A | |||||
|
|
|
|||||||
| Total/Weighted Average (2) |
100.0 | % | 2.1 | % | ||||
|
|
|
|||||||
| (1) | Represents the ABR weighted average annual minimum increase of the entire portfolio as if all escalations occurred annually. For leases where rent escalates by the greater of a stated fixed percentage or the change in CPI, we have assumed an escalation equal to the stated fixed percentage in the lease. As of September 30, 2019, leases contributing 10.4% of our ABR provide for rent increases equal to the lesser of a stated fixed percentage or the change in CPI. As any future increase in CPI is unknowable at this time, we have not included an increase in the rent pursuant to these leases in the weighted average annual minimum increase presented. |
| (2) | Weighted by ABR. |
125
Table of Contents
The escalation provisions of our leases (by percentage of ABR) as of September 30, 2019, are displayed in the following chart:
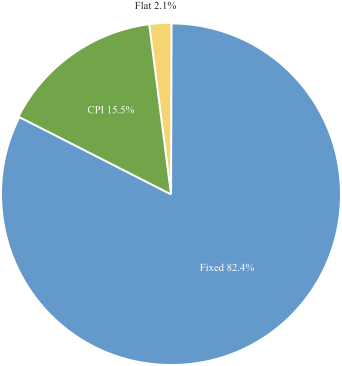
If requested by a tenant, we may, subject to the tenant’s history, creditworthiness, and other relevant considerations, agree to reimburse or provide a loan to the tenant for property expansion or improvement costs that it incurs in connection with improvements at a property, 100% of which it leases from us. In exchange for such reimbursement or loan, we generally receive contractually specified rent that increases proportionally with our funding. For example, we may agree to reimburse a tenant, up to a specified amount, for property expansion or improvement costs that it incurs in improving a commercial facility on its property. Generally, as we reimburse the tenant for property expansion or improvement costs, the rent will increase proportionally with our funding, which generally allows us to achieve a consistent cash yield on our funding throughout improvement.
Investment Origination Process
Our criteria for selecting properties are based on the following underwriting principles:
| • | fundamental value and characteristics of the underlying real estate; |
| • | creditworthiness of the tenant; |
| • | demand drivers and trends in the tenant industry; and |
| • | transaction structure and pricing. |
We believe we can achieve an appropriate risk-adjusted return through these underwriting principles and conservatively project a property’s potential to generate targeted returns from current and future cash flows. We believe targeted returns are achieved through a combination of in-place income at the time of acquisition, rent growth, and a property’s potential for appreciation.
126
Table of Contents
Investment Underwriting
When evaluating a property acquisition, pursuant to our underwriting guidelines, we consider the condition of the property, the creditworthiness of the tenant, the strength of any personal or corporate guarantees, the tenant’s historical performance at the property or similar properties, the location of the property, the overall economic condition of the community in which the property is located, and the property’s potential for appreciation. In addition, we perform detailed credit reviews of the financial condition of all our proposed tenants to determine their financial strength and flexibility. We apply our credit underwriting guidelines prior to acquiring a property and when we are re-leasing properties in our portfolio. While we seek creditworthy tenants, we do not require them to be investment grade credit rated. Our credit review process includes analyzing a tenant’s financial statements and other available information, including information that be publicly reported by the tenant. When we obtain guarantees on our leases, we also analyze the creditworthiness of the guarantors. Depending on the circumstances, our process will also include discussions with the tenant’s or lease guarantor’s management team surrounding their business plan and strategy.
Portfolio Management
Our portfolio management strategy is centered around portfolio optimization, risk management, and risk mitigation and is based upon the following principles:
Tenant Financial Monitoring
We evaluate the creditworthiness of our existing tenants on an ongoing basis by holding regularly scheduled real estate portfolio reviews; reviewing updated tenant financial statements on a quarterly or annual basis, depending on the terms of the lease; analyzing updated tenant credit ratings; and reviewing our ongoing analysis of the economy and trends in the industries in which our tenants operate, including corporate press releases and other publications providing insights into tenant financial health. The review includes a review of real estate fundamentals and an analysis of the tenant’s recent financial statements, including key metrics such as rent coverage and leverage ratios, among other applicable credit metrics, credit ratings, and economic considerations relevant to the tenant. Our asset management team also periodically reviews tenant financial statements and relevant credit performance metrics. Our credit monitoring procedures also include regular communications with management of tenants, who are required to notify us of certain events under the terms of our leases, such as events of default and property damage. We believe our ongoing credit monitoring will enable us to identify material changes to a tenant’s credit quality in a timely basis and preserve our financial position.
To assess the probability of tenant insolvency, we utilize S&P Capital IQ, which provides us a model for predicting private company defaults through the calculation of a tenant’s implied credit rating when a public rating is not available. We compute implied credit ratings for each tenant by inputting the regularly received (or publicly available) tenant financial statements into S&P Capital IQ’s system and methodology. Tenant credit ratings, public or implied, however, are only one component of how we assess the risk of tenant insolvency. We also use our own internal estimate of the likelihood of an insolvency or default, based on the regularly monitored performance of our properties, our assessment of each tenant’s financial health, including profitability, liquidity, indebtedness, and leverage profile, and our assessment of the health and performance of the tenant’s particular industry.
Real Estate Site Inspections
Our physical inspections of properties include review by one or more members of our investment team. Under certain circumstances, however, if we acquire a large portfolio of properties, it may not be practicable to physically inspect each property, in which case we will rely on other due diligence procedures, such as site visits and property condition reports completed by third parties and the review of financial and documentary information that may include third-party reports such as title surveys, environmental reports, and zoning reports.
127
Table of Contents
We periodically perform site inspections of our properties based on an evaluation of financial performance, unique property characteristics, and industry factors and trends. We use information gained from site visits to monitor tenant compliance with maintenance obligations and to provide a leading indicator of property-level performance trends.
Manage Lease Renewals
Prior to lease maturity, our team actively engages with tenants to understand likelihood of renewal and the considerations of executing an extension of the lease term. Additionally, as part of our ongoing relationship with tenants, we seek to extend lease terms well in advance of expiration to the extent opportunistically available, such as the case with tenant requested building expansions or adding properties to an existing master lease. Our team also works with real estate brokers to understand and keep up to date on relevant local market trends.
Response to Tenant Defaults
Through continuous review of tenant and lease guarantor credit, our team seeks to identify and respond quickly to any default or similar problems to improve investment recoveries. Our team also negotiates lease and lease guarantee changes during change of control events at the tenant or lease guarantor level, with a focus on mutually beneficial workout scenarios.
Selective Property Sales
Our team focuses our disposition efforts around capturing increased value and avoiding value degradation due to unfavorable changes in the critical nature of an asset, underlying real estate fundamentals, tenant credit profile, or lease and guarantee structures. In addition, on a selective basis, we may acquire and re-sell properties that we purchase in connection with the acquisition of a larger portfolio of properties. If properties are being sold on an all or none basis, we may purchase some properties that do not meet our desired investment criteria to acquire a larger portfolio of properties we wish to hold. Since 2015, we have sold 67 properties for an aggregate sales price of approximately $258.2 million, resulting in a 23.1% gain over book value and a 17.4% gain over original purchase price.
Financing Strategy
Historically, we primarily have used our Revolving Credit Facility to finance property acquisitions, which had an outstanding balance of $303.3 million as of September 30, 2019. While we have not used mortgage loans and notes payable (“mortgage financing”) as a strategic source of debt capital for acquisitions, we have occasionally utilized mortgage financing for a single property or a group of related properties acquired from a single seller. As of September 30, 2019, only eight of our 662 properties were secured by mortgage financing with an aggregate outstanding principal balance of mortgage loans and notes payable of $112.9 million. In the future, we expect to continue to utilize our Revolving Credit Facility as well as the debt private placement, bank term notes, and bond markets as principal forms of debt capital. We may also assume debt when conducting a transaction or we may mortgage existing properties.
Tax Status
We elected to qualify to be taxed as a REIT under the Code beginning with our taxable year ended December 31, 2008. We believe that as of such date we have been organized and have operated in a manner to qualify for taxation as a REIT for U.S. federal income tax purposes. We intend to continue to be organized and operate in such a manner.
Competition
The commercial real estate market is highly competitive. We compete for tenants to occupy our properties in all of our markets with other owners and operators of commercial real estate. We compete based on a number
128
Table of Contents
of factors that include location, rental rates, security, suitability of the property’s design to prospective tenants’ needs, and the manner in which the property is operated and marketed. The number of competing properties in a particular market could have a material effect on our occupancy levels, rental rates, and the operating expenses of certain of our properties.
In addition, we compete with other entities engaged in real estate investment activities to locate suitable properties to acquire and purchasers to buy our properties. These competitors include other REITs, private and institutional real estate investors, sovereign wealth funds, banks, mortgage bankers, insurance companies, investment banking firms, lenders, specialty finance companies, and other entities. Some of these competitors, including larger REITs, have substantially greater financial resources, including lower cost of capital, than we have. The relative size of their portfolios may allow them to absorb properties with lower returns or allow them to accept more risk on a given property than we can prudently manage, including risks with respect to the creditworthiness of tenants. In addition, these same entities may seek financing through similar channels to us. Competition from these REITs and other third-party real estate investors may limit the number of suitable investment opportunities available to us. It also may result in higher prices, lower yields, and a narrower spread of yields over our borrowing costs, making it more difficult for us to acquire new investments on attractive terms.
Employees
Currently, we have no employees. Effective upon the completion of the Internalization, however, we expect to have approximately 65 full-time employees. Our staff will be comprised of professional employees engaged in origination, underwriting, closing, accounting and financial reporting, portfolio and asset management, capital markets, and other corporate activities essential to our business.
Legal Proceedings
We may become party to various lawsuits, claims and other legal proceedings that arise in the ordinary course of our business. Since our organization in 2007, we have not been a party, as plaintiff or defendant, to any legal proceedings that we believe to be material or which, individually or in the aggregate, would be expected to have a material effect on our business, financial condition, or results of operation if determined adversely to us.
Principal Executive Offices
Our principal executive offices are located at 800 Clinton Square, Rochester, New York, 14604, and our telephone number is (585) 287-6500. Upon closing of the Internalization, we will occupy approximately 24,072 square feet of space leased from Clinton Asset Holding Associates, L.P. (“CAHA”), an affiliated third party. Amy Tait, our Chairman and a member of our board of directors, and members of her immediate family own interests in CAHA. We believe that our offices are adequate for our present and currently planned future operations and that adequate additional space will be available if needed in the future.
Insurance
Our tenants are generally required to maintain liability and property insurance coverage for the properties they lease from us pursuant to net leases. These leases generally require our tenants to name us (and any of our lenders that have a mortgage on the property leased by the tenant) as additional insureds on their liability policies and additional named insured and/or loss payee (or mortgagee, in the case of our lenders) on their property policies. Depending on the location of the property, losses of a catastrophic nature, such as those caused by earthquakes and floods, may be covered by insurance policies that are held by our tenant with limitations such as large deductibles or co-payments that a tenant may not be able to meet. In addition, losses of a catastrophic nature, such as those caused by wind/hail, hurricanes, terrorism or acts of war, may be uninsurable or not economically insurable. In the event there is damage to our properties that is not covered by insurance and such properties are subject to recourse indebtedness, we will continue to be liable for the indebtedness, even if these properties are irreparably damaged.
129
Table of Contents
In addition to being a named insured on our tenants’ liability policies, we separately maintain commercial general liability coverage and, in certain instances, general or specific (e.g., flood) property-level insurance coverage on certain properties or pursuant to the terms of certain of our leases. We also maintain full property coverage on all untenanted properties and other property coverage as may be required by our lenders, which are not required to be carried by our tenants under our leases.
Regulation
General. Our investments are subject to various laws, ordinances, and regulations, including, among other things, fire and safety requirements, zoning regulations, land use controls, and environmental controls relating to air and water quality, noise pollution, and indirect environmental impacts. We believe that we have all permits and approvals necessary under current law to operate our investments.
Americans with Disabilities Act. Under Title III of the ADA, and rules promulgated thereunder, in order to protect individuals with disabilities, public accommodations must remove architectural and communication barriers that are structural in nature from existing places of public accommodation to the extent “readily achievable.” In addition, under the ADA, alterations to a place of public accommodation or a commercial facility are to be made so that, to the maximum extent feasible, such altered portions are readily accessible to and usable by disabled individuals. The “readily achievable” standard takes into account, among other factors, the financial resources of the affected site and the owner, lessor or other applicable person.
Compliance with the ADA, as well as other federal, state, and local laws, may require modifications to properties we currently own or may purchase, or may restrict renovations of those properties. Failure to comply with these laws or regulations could result in the imposition of fines or an award of damages to private litigants, as well as the incurrence of the costs of making modifications to attain compliance, and future legislation could impose additional obligations or restrictions on our properties. Although our tenants are generally responsible for all maintenance and repairs of the property pursuant to our lease, including compliance with the ADA and other similar laws or regulations, we could be held liable as the owner of the property for a failure of one of our tenants to comply with these laws or regulations.
Environmental Matters
Federal, state, and local environmental laws and regulations regulate, and impose liability for, releases of hazardous or toxic substances into the environment. Under various of these laws and regulations, a current or previous owner, operator or tenant of real estate may be required to investigate and clean up hazardous or toxic substances, hazardous wastes or petroleum product releases or threats of releases at the property, and may be held liable to a government entity or to third parties for property damage and for investigation, clean-up, and monitoring costs incurred by those parties in connection with the actual or threatened contamination. These laws may impose clean-up responsibility and liability without regard to fault, or whether or not the owner, operator, or tenant knew of or caused the presence of the contamination. The liability under these laws may be joint and several for the full amount of the investigation, clean-up, and monitoring costs incurred or to be incurred or actions to be undertaken, although a party held jointly and severally liable may seek to obtain contributions from other identified, solvent, responsible parties of their fair share toward these costs. These costs may be substantial, and can exceed the value of the property. In addition, some environmental laws may create a lien on the contaminated site in favor of the government for damages and costs it incurs in connection with the contamination. As the owner or operator of real estate, we also may be liable under common law to third parties for damages and injuries resulting from environmental contamination emanating from the real estate. The presence of contamination, or the failure to properly remediate contamination, on a property may adversely affect the ability of the owner, operator or tenant to sell or rent that property or to borrow using the property as collateral, and may adversely impact our investment in that property.
Some of our properties contain, have contained, or are adjacent to or near other properties that have contained or currently contain storage tanks for the storage of petroleum products or other hazardous or toxic
130
Table of Contents
substances. Similarly, some of our properties currently are or were used in the past for commercial or industrial purposes that involve or involved the use of petroleum products or other hazardous or toxic substances, or are adjacent to or near properties that have been or are used for similar commercial or industrial purposes. These operations create a potential for the release of petroleum products or other hazardous or toxic substances, and we could potentially be required to pay to clean up any contamination. In addition, environmental laws regulate a variety of activities that can occur on a property, including the storage of petroleum products or other hazardous or toxic substances, air emissions, water discharges, and exposure to lead-based paint. Such laws may impose fines or penalties for violations, and may require permits or other governmental approvals to be obtained for the operation of a business involving such activities. Any of the foregoing matters could have a material adverse effect on us.
Environmental laws also govern the presence, maintenance, and removal of asbestos-containing materials (“ACM”). Federal regulations require building owners and those exercising control over a building’s management to identify and warn, through signs and labels, of potential hazards posed by workplace exposure to installed ACM in their building. The regulations also have employee training, record keeping, and due diligence requirements pertaining to ACM. Significant fines can be assessed for violation of these regulations. As a result of these regulations, building owners and those exercising control over a building’s management may be subject to an increased risk of personal injury lawsuits by workers and others exposed to ACM. The regulations may affect the value of a building containing ACM in which we have invested. Federal, state, and local laws and regulations also govern the removal, encapsulation, disturbance, handling, and/or disposal of ACM when those materials are in poor condition or in the event of construction, remodeling, renovation, or demolition of a building. These laws may impose liability for improper handling or a release into the environment of ACM and may provide for fines to, and for third parties to seek recovery from, owners or operators of real properties for personal injury or improper work exposure associated with ACM.
When excessive moisture accumulates in buildings or on building materials, mold growth may occur, particularly if the moisture problem remains undiscovered or is not addressed over a period of time. Some molds may produce airborne toxins or irritants. Indoor air quality issues can also stem from inadequate ventilation, chemical contamination from indoor or outdoor sources, and other biological contaminants such as pollen, viruses, and bacteria. Indoor exposure to airborne toxins or irritants above certain levels can be alleged to cause a variety of adverse health effects and symptoms, including allergic or other reactions. As a result, the presence of significant mold or other airborne contaminants at any of our properties could require us to undertake a costly remediation program to contain or remove the mold or other airborne contaminants from the affected property or increase indoor ventilation. In addition, the presence of significant mold or other airborne contaminants could expose us to liability from our tenants, employees of our tenants, or others if property damage or personal injury occurs.
Before completing any property acquisition, we typically obtain environmental assessments in order to identify potential environmental concerns at the property. These assessments are carried out in accordance with the Standard Practice for Environmental Site Assessments (ASTM Practice E 1527-13) as set by ASTM International, formerly known as the American Society for Testing and Materials, and generally include a physical site inspection, a review of relevant federal, state, and local environmental and health agency database records, one or more interviews with appropriate site-related personnel, review of the property’s chain of title, and review of historical aerial photographs and other information on past uses of the property. These assessments are limited in scope. If, however, recommended in the initial assessments, we may undertake additional assessments such as soil and/or groundwater sampling or other limited subsurface investigations and ACM or mold surveys to test for substances of concern. A prior owner or operator of a property or historical operations at our properties may have created a material environmental condition that is not known to us or the independent consultants preparing the site assessments. Material environmental conditions may have arisen after the review was completed or may arise in the future, and future laws, ordinances, or regulations may impose material additional environmental liability. If environmental concerns are not satisfactorily resolved in any initial or additional assessments, we may obtain environmental insurance policies to insure against potential
131
Table of Contents
environmental risk or loss depending on the type of property, the availability and cost of the insurance, and various other factors we deem relevant (e.g., an environmental occurrence affects one of our properties where our lessee may not have the financial capability to honor its indemnification obligations to us). Our ultimate liability for environmental conditions may exceed the policy limits on any environmental insurance policies we obtain, if any.
Generally, our leases require the lessee to comply with environmental law and provide that the lessee will indemnify us for any loss or expense we incur as a result of lessee’s violation of environmental law or the presence, use or release of hazardous materials on our property attributable to the lessee. If our lessees do not comply with environmental law, or we are unable to enforce the indemnification obligations of our lessees, our results of operations would be adversely affected.
We cannot predict what other environmental legislation or regulations will be enacted in the future, how existing or future laws or regulations will be administered or interpreted, or what environmental conditions may be found to exist on the properties in the future. Compliance with existing and new laws and regulations may require us or our tenants to spend funds to remedy environmental problems. If we or our tenants were to become subject to significant environmental liabilities, we could be materially and adversely affected.
Implications of Being an Emerging Growth Company
We are an emerging growth company, as defined in the Jumpstart Our Business Startups Act, and as such we are eligible to take advantage of certain exemptions from various reporting requirements that are applicable to other public companies that are not emerging growth companies, including, but not limited to, not being required to comply with the auditor attestation requirements of Section 404 of the Sarbanes-Oxley, reduced disclosure obligations regarding executive compensation in our periodic reports and proxy statements, and exemptions from the requirements of holding a nonbinding advisory vote on executive compensation and stockholder approval of any golden parachute payments not previously approved. Although we have not made a determination whether to take advantage of any or all of these exemptions, we have irrevocably opted-out of the extended transition period afforded to emerging growth companies in Section 7(a)(2)(B) of the Securities Act for complying with new or revised accounting standards. As a result, we will comply with new or revised accounting standards on the same time frames as other public companies that are not emerging growth companies.
We expect to remain an “emerging growth company” until the earliest of (i) the last day of the first fiscal year in which our annual gross revenues exceed $1.07 billion (subject to adjustment for inflation), (ii) December 31 of the fiscal year that we become a “large accelerated filer” as defined in Rule 12b-2 under the Exchange Act, which would occur if the market value of our shares of Common Stock (including our Class A Common Stock) held by non-affiliates exceeds $700 million as of the last business day of our most recently completed second fiscal quarter and we have been publicly reporting for at least 12 months, (iii) the date on which we have issued more than $1.0 billion in non-convertible debt securities during the preceding 36-month period, or (iv) December 31 of the fiscal year following the fifth anniversary of this offering.
132
Table of Contents
Our Directors and Executive Officers
Our board of directors consists of eight directors, a majority of whom are independent within the meaning of the listing standards of the NYSE. Each of our directors will be elected by our stockholders to serve until the next annual meeting of our stockholders and until his or her successor is duly elected and qualifies. See “Certain Provisions of Maryland Law and of Our Charter and Second Amended and Restated Bylaws—Our Board of Directors.” We expect the first annual meeting of our stockholders after this offering will be held in 2020. Each officer will serve until his or her successor is elected and qualifies or until his or her death, or his or her resignation or removal. Any officer may be removed, with or without cause, by the board of directors, but such removal will be without prejudice to the contract rights, if any, of the officer so removed.
The following table sets forth certain information concerning the individuals who will be our directors and executive officers upon the completion of this offering:
| Name |
Age | Position | ||
| Christopher J. Czarnecki |
39 | Chief Executive Officer, President, and Director | ||
| Ryan M. Albano |
38 | Executive Vice President and Chief Financial Officer | ||
| Sean T. Cutt |
45 | Executive Vice President and Chief Investment Officer | ||
| John D. Moragne |
37 | Executive Vice President, Chief Operating Officer, and Secretary | ||
| Amy L. Tait |
61 | Chairman of the Board of Directors | ||
| Laurie A. Hawkes |
64 | Lead Independent Director | ||
| David M. Jacobstein |
73 | Director | ||
| Agha S. Khan |
40 | Director | ||
| Shekar Narasimhan |
66 | Director | ||
| Geoffrey H. Rosenberger |
66 | Director | ||
| James H. Watters |
66 | Director |
Board of Directors
The following sets forth certain information relating to our directors. Two of our directors, Amy Tait and Agha Khan, were designated by BRE pursuant to the asset management agreement. See “Certain Relationship and Related Party Transactions.” Our board of directors has carefully considered whether our directors have the experience, qualification, attributes, and skills, taken as a whole, to enable our board of directors to satisfy its oversight responsibilities effectively in light of our business and structure. In particular, our board of directors focused on each person’s background and experience as reflected in the information included in each of the directors’ individual biographies set forth below. We believe that our directors provide an appropriate mix of experience and skills relevant to the size and nature of our business, as set forth below:
Amy L. Tait, Founder and Chairman of the Board of Directors
Ms. Tait is one of our founders and has served on our board of directors since inception in 2007. Ms. Tait brings four decades of commercial real estate experience to her position. She started her real estate career with Chemical Bank in management training and commercial real estate lending before joining Home Leasing Corporation, the predecessor to Home Properties, Inc. (formerly a publicly traded company on the NYSE as “HME”). Ms. Tait then served as Executive Vice President of Home Properties from its IPO in 1994 to 2001, and as a director and chair of the company’s Real Estate Investment Committee until 2012. Ms. Tait’s responsibilities have included acquisitions, finance, capital markets, investor relations, legal, human resources, and strategic planning. Ms. Tait serves on the board of directors of Broadtree Residential, Inc. and Broadstone Real Estate Access Fund, the board of managers of BRE, and the Board of Governors of Nareit, and has served numerous other community organizations. Ms. Tait has been recognized in Rochester, New York, with the D’Tocqueville
133
Table of Contents
Award, the Athena Award, and Business Hall of Fame induction. She holds a B.S. degree in Civil Engineering from Princeton University and an M.B.A. from the Simon Graduate School of Business at the University of Rochester.
We believe that Ms. Tait’s deep operational and historical experience as one of our founders and Chairman of our board of directors, her prior experience as a director of a large publicly-traded REIT, and prior management experience provides our board of directors with strategic and industry-specific expertise.
Christopher J. Czarnecki, Chief Executive Officer, President, and Director
Mr. Czarnecki has served as our Chief Executive Officer and President and as a non-independent director on our board of directors since February 2017. Mr. Czarnecki has previously served as our President, Chief Financial Officer, and Vice President of Capital Markets. During his career with us, Mr. Czarnecki has overseen all of our major functions, including acquisitions, debt and equity capital markets activities, accounting, property and asset management, operations, investor relations, research, board and investor communications, and portfolio analytics. He has served in similar roles with BRE. Prior to joining BRE in 2009, Mr. Czarnecki was a commercial real estate lender and credit analyst for Branch Banking & Trust Co. (“BB&T”), where he graduated from the BB&T Leadership Development Program. Mr. Czarnecki is a member of Nareit and is also a member of M&T Bank’s Rochester Regional Advisory board and a guest lecturer in real estate courses at the Simon Graduate School of Business at the University of Rochester. Mr. Czarnecki serves on the board of directors of Broadtree Residential, Inc. and Broadstone Real Estate Access Fund, on the board of managers of BRE, and on the board of trustees of The Strong National Museum of Play. Mr. Czarnecki holds a B.A. in Economics from the University of Rochester, a Diploma in Management Studies from the Judge Business School at the University of Cambridge, and an M.B.A. in Finance and Corporate Accounting from the Simon Graduate School of Business at the University of Rochester.
We believe that Mr. Czarnecki’s familiarity with our operations and his extensive experience with net lease financing and investing in real estate qualify him to serve on our board of directors.
Laurie A. Hawkes, Lead Independent Director
Ms. Hawkes has been a Director since May 2016. She currently serves as our Lead Independent Director and is a member of the Audit Committee and the Compensation Committee. With over 35 years of business experience, Ms. Hawkes has held executive leadership positions as an investment banker, private real estate equity investor, and successful principal and entrepreneur. She has extensive expertise in raising capital in the public and private markets; executing real estate acquisition strategies to drive portfolio growth; developing strategic business plans; and creating scalable operational platforms. Ms. Hawkes was a pioneer in bringing institutional capital to the single-family rental sector. In 2008, she co-founded American Residential Properties, LLC and ARP Phoenix Fund I, to acquire, operate, and manage single-family rental homes. In 2012, Ms. Hawkes co-founded American Residential Properties, Inc., a REIT, and led its capital raising and operations from a start-up to a $2.4 billion enterprise. She co-led the company’s IPO, which was listed on the NYSE under the ticker “ARPI” in May 2013. Ms. Hawkes served as President & Chief Operating Officer and member of the board of directors of ARPI, and was responsible for its financing, capital markets strategy, and operational platform. ARPI merged with American Homes 4 Rent in March 2016. The merger of these two publicly traded companies created an $8 billion enterprise, which now trades under the NYSE ticker “AMH.” Prior to ARPI, Ms. Hawkes served as President & Head of Acquisitions of U.S. Realty Advisors, LLC, a $3 billion private real estate equity firm based in New York City, which specializes in single-tenant, net leased commercial real estate investment and asset management. She joined the firm in 1995, became a Partner in 1997 and was President from 2003 to 2007. Ms. Hawkes served as a Managing Director in Real Estate Investment Banking at CS First Boston Corp. from 1993 to 1995 with responsibility for new business development, including corporate sale leaseback and net lease financings. Ms. Hawkes began her career as an investment banker at Salomon Brothers Inc. from 1979 to 1993, specializing in corporate real estate acquisitions and structured mortgage financings in the Real
134
Table of Contents
Estate and Commercial Mortgage Finance Departments. Ms. Hawkes has had public, private, and non-profit board experience, including ARPI, the board of directors of Broadtree Residential, Inc. from May 2016 to August 2019 and the governing boards for Bowdoin College for 22 years. She has also been active in leadership roles with Opportunity International, a non-profit organization providing micro-financing for women. Ms. Hawkes is a former principal of the NASD, former member of the Urban Land Institute, was the recipient of Housingwire’s Women of Influence for Top Women in Business and is a noted speaker, including case study guest lecturer in real estate at the Yale School of Management. She holds a B.A. from Bowdoin College and an M.B.A. from Cornell University.
We believe that Ms. Hawkes’s extensive investment and business experience, including her service as the chief operating officer and a board member of a large publicly-traded REIT, qualifies her to serve on our board of directors.
David M. Jacobstein, Director
Mr. Jacobstein has served as one of our directors since May 2013 and currently serves as chair of the Audit Committee, as chair of the Compensation Committee, and as a member of the Nominating and Corporate Governance Committee. Mr. Jacobstein has more than 30 years of real estate experience and since July 2009 has provided consulting services to real estate related businesses. Mr. Jacobstein was the senior advisor to the real estate industry group at Deloitte LLP from June 2007 to June 2009, where he advised Deloitte’s real estate practitioners on strategy, maintained and developed key client relationships, and shaped thought leadership that addressed key industry and market trends. From 1999 to 2007, he was President and Chief Operating Officer of Developers Diversified Realty Corp. (“DDR,” now known as SITE Centers (NYSE: “SITC”)), a leading owner, developer, and manager of market-dominant community shopping centers. Mr. Jacobstein also served on DDR’s board of directors from 2000 to 2004. Prior to joining DDR, he served as Vice Chairman and Chief Operating Officer of Wilmorite, Inc., a Rochester, New York, based developer of regional shopping malls. Since August 2009, Mr. Jacobstein has served on the board of trustees of Corporate Office Properties Trust (NYSE: “OFC”), a publicly traded owner, developer, and manager of office and data center properties primarily in locations that support United States Government agencies and their contractors. Mr. Jacobstein also serves on the advisory board of The Pike Company, a general contractor and construction management company based in Rochester, New York. He previously served on the advisory board of the Marcus & Millichap Company, a diversified real estate holding company based in Palo Alto, California, and on the advisory board of White Oak Partners, Inc., a private equity firm concentrating in real estate investment based in Columbus, Ohio. Mr. Jacobstein began his career as a corporate and securities lawyer. He is a member of the National Association of Corporate Directors and the International Council of Shopping Centers. Mr. Jacobstein holds a B.A. from Colgate University and a J.D. from The George Washington University Law Center.
We believe that Mr. Jacobstein’s extensive financial and business experience, including his service as the chief operating officer and a board member of large publicly-traded REITs, qualifies him to serve on our board of directors. In addition, his experience in financial matters and risk management and as chair of another publicly-traded REIT audit committee, allows him to provide guidance to the board in overseeing financial and accounting aspects of our operations.
Agha S. Khan, Director
Mr. Khan has served as one of our directors since June 2015. Mr. Khan is a Senior Principal of Stone Point Capital LLC (“Stone Point”), a financial services-focused private equity firm that has raised and managed seven private equity funds – the Trident funds – with aggregate committed capital of more than $19 billion. Mr. Khan joined Stone Point in 2002. Previously, Mr. Khan was an Analyst in the Financial Institutions Group at Salomon Smith Barney. Mr. Khan is a director of AMC Group Holdings LP, The ARC Group, LLC, Broadtree Residential, Inc., Formation Capital, LLC, FC Encore, LP, Grace Hill, Inc., Henderson Park Holdings Ltd., Home Point Financial Corporation, Kensington Vanguard National Land Services, LLC, New Point VII Limited,
135
Table of Contents
Omni Holding Company LLC, CREA, LLC, Prima Capital Advisors, LLC, Rialto Capital Holdings, Inc., Sabal Capital Holdings, Inc., Situs Group Holdings GP, LLC and Ten-X, LLC. Mr. Khan holds a B.A. from Cornell University.
We believe that Mr. Khan’s prior investment experience provides our board of directors with strategic and industry-specific expertise.
Shekar Narasimhan, Director
Mr. Narasimhan has served as one of our directors since our inception and currently serves as a member of the Nominating and Corporate Governance Committee. Mr. Narasimhan is currently the Managing Partner at Beekman Advisors, Inc., which provides strategic advisory services to companies and investors involved in real estate, mortgage finance, affordable housing and related sectors, which he co-founded in 2003. He also serves as chairman of Papillon Capital, LLC, an investment company focused on sustainable infrastructure investing in emerging markets. He is also a Principal of Rivermont Enterprise Capital which has set up the Rivermont Enterprise Emerging Communities Fund, a qualified opportunity zone fund. Prior to joining Beekman Advisors, Mr. Narasimhan was a Managing Director of Prudential Mortgage Capital Company, one of the nation’s leading providers of commercial mortgage financing. Prior to his time at Prudential, he was Chairman and Chief Executive Officer of the WMF Group Ltd. (formerly NASDAQ: “WMFG”), a publicly traded, commercial mortgage financial services company. WMF was one of the largest such firms in the country before being acquired by Prudential in 2000. Mr. Narasimhan also served on the board of directors of Broadtree Residential, Inc. from December 2012 to August 2019. Mr. Narasimhan also currently serves on the board of directors of Enterprise Community Investment, Inc. Mr. Narasimhan is a commissioner on the Virginia Housing Development Authority and on the board of the Democracy Alliance and a Senior Industry Fellow at the Joint Center for Housing Studies at Harvard University. Mr. Narasimhan has served several terms on the board of directors of the Mortgage Bankers Association of America, was the first chair of the MBA’s Commercial/Multifamily board of governors and founded its Multifamily Steering Committee. He was elected as the first chair of the Fannie Mae DUS Advisory Committee. Mr. Narasimhan has previously served on the boards of the Low Income Investment Fund, the Community Preservation and Development Corporation, the National Housing Conference, the National Multi Housing Council and as a member of the board for Housing and Community Development for Virginia. He is a sought-after speaker on housing finance and affordable housing and is considered a leading expert on rental housing issues in the United States. Mr. Narasimhan also previously served as a member of the President’s Advisory Commission on Asian Americans and Pacific Islanders. Mr. Narasimhan has received numerous awards and recognitions in the real estate industry, including the MBA’s highest honor in 1999 and the Fannie Mae Lifetime Achievement Award in 2003. In 2010, he was the recipient of the Dean H.J. Zoffer Distinguished Service Medal from the University of Pittsburgh. He has earned the designation of Certified Mortgage Banker. Mr. Narasimhan holds a B.S. in Chemical Engineering from the Indian Institute of Technology, New Delhi, India and an M.B.A. from the Katz Graduate School of Business at the University of Pittsburgh.
We believe that Mr. Narasimhan’s extensive investment and business experience, including his service as the chief executive officer and a board member of a publicly traded, commercial mortgage financial services company, qualifies him to serve on our board of directors.
Geoffrey H. Rosenberger, Director
Mr. Rosenberger has served as one of our directors since our inception and currently serves as a member of the Audit Committee. He began his professional investment career in 1976 when he joined Manning & Napier Advisors, Inc. as a security analyst covering a broad range of businesses and industries. In 1984, Mr. Rosenberger co-founded Clover Capital Management, Inc., a Rochester, New York, based investment management firm with over $2 billion of client assets under management. In 2004, Mr. Rosenberger retired from Clover Capital (n/k/a Federated Clover) and has since focused his time both on the not-for-profit sector as well as
136
Table of Contents
being actively involved as an “angel” investor funding new business formations. Mr. Rosenberger serves as a member of the board of directors of the Greater Rochester Health Foundation, Vnomics Corp., Simpore, Inc., and True North Rochester Preparatory Charter School. Mr. Rosenberger has also served as a past chair of the Greater Rochester Chapter of the American Red Cross and previously served on the boards of Manning & Napier, Inc. (NYSE: “MN”), Broadtree Residential, Inc., the Junior Achievement of Rochester, McQuaid Jesuit High School, St. Bernard’s Institute, and Holy Sepulchre Cemetery. Mr. Rosenberger is a Chartered Financial Analyst. He holds a B.S. in Economics and an M.B.A. from the University of Kentucky.
We believe that Mr. Rosenberger’s extensive financial and business experience, including his public company board experience, qualifies him to serve on our board of directors. In addition, his knowledge and background in accounting allows him to provide guidance to the board of directors in overseeing financial and accounting aspects of our operations.
James H. Watters, Director
Mr. Watters has served as one of our directors since our inception and currently serves as chair of the Nominating and Corporate Governance Committee and as a member of the Audit Committee and Compensation Committee. Since 1997, Mr. Watters has served as Senior Vice President and Treasurer, Finance and Administration of Rochester Institute of Technology (“RIT”), where he is responsible for the direct investment of $250 million of working capital, the administration of the investment process for $880 million of endowment assets, which includes overseeing approval for ten real estate funds and the management and issuance of $275 million of public debt. Mr. Watters serves in the senior leadership role to more than 830 full-time staff charged with responsibility for the financial, physical, human capital, and information assets of RIT. Mr. Watters is also vice chairman of RIT’s global subsidiary where he negotiates business models and real estate transactions for RIT’s global campuses. He has instructed various graduate business courses during his tenure in the RIT College of Applied Sciences and the E. Philip Saunders College of Business. He serves on various profit and not-for-profit boards throughout Rochester, New York, including Broadtree Residential, Inc. Prior to joining RIT, Mr. Watters spent 16 years with the University of Pittsburgh in positions such as Assistant Vice Chancellor for Finance and Business and Assistant Vice Chancellor for Real Estate and Management. Mr. Watters began his career in higher education administration assisting in the management of offshore insurance captives for the University of Pittsburgh. Mr. Watters holds a B.S., M.S., and Ph.D. from the University of Pittsburgh.
We believe that Mr. Watters’s extensive financial and business experience qualifies him to serve on our board of directors.
Executive Officers
The following sets forth certain information relating to our executive officers. For Mr. Czarnecki’s biography, please see above under “Board of Directors.”
Ryan M. Albano, Executive Vice President and Chief Financial Officer
Mr. Albano has served as our Executive Vice President and Chief Financial Officer since February 2017. Mr. Albano is responsible for strategic and financial planning, monitoring key performance metrics, financial reporting, accounting, corporate development, and capital market activities. Prior to becoming our Chief Financial Officer, Mr. Albano served as the Company’s Vice President of Finance from 2013 to February 2017. Prior to joining BRE, Mr. Albano worked for Manning & Napier, Inc. (NYSE: “MN”) from 2011 to 2013. During this time, Mr. Albano served in various finance roles, initially assisting in the successful execution of Manning and Napier, Inc.’s IPO in 2011 and subsequently serving as Assistant CFO of the company’s mutual fund division. Before Manning & Napier, Mr. Albano worked for KPMG LLP in various roles serving both public and private companies from 2004 to 2011. A certified public accountant, he holds an M.B.A. in finance and competitive strategy from the Simon Graduate School of Business at the University of Rochester and a B.S. in accounting from St. John Fisher College.
137
Table of Contents
Sean T. Cutt, Executive Vice President and Chief Investment Officer
Mr. Cutt has served as our Executive Vice President since January 2020 and Chief Investment Officer since August 2018. Mr. Cutt previously served as the Company’s President and Chief Operating Officer from February 2017 to August 2018. Prior to that, he served as the Company’s Senior Vice President of Acquisitions, Dispositions and Portfolio Management. His primary responsibilities include managing acquisitions, dispositions, asset management, tenant credit analysis, investment policy, and real estate underwriting. Prior to joining BRE in 2012, Mr. Cutt was an Assistant Vice President of Development for Macerich (NYSE: MAC) from 2006 to 2012 and was responsible for managing large scale retail shopping centers and mixed-use development projects across the country. Before joining Macerich, he worked at SWBR Architects & Engineers and managed projects with a wide variety of property types. Mr. Cutt holds a B.S. in Organizational Management from Roberts Wesleyan College and an M.B.A. from the Simon Graduate School of Business at the University of Rochester. Mr. Cutt has served on several not-for-profit and for-profit boards throughout Rochester, New York. He served on the board of directors for the Rochester American Diabetes Association, as a committee member for the Rochester Tour de Cure, on the construction committee for Edgewood Free Methodist Church, and as treasurer and board member for Hunt Hollow Ski Club.
John D. Moragne, Executive Vice President, Chief Operating Officer, and Secretary
Mr. Moragne has served as our Executive Vice President, Chief Operating Officer, and Secretary since August 2018. Mr. Moragne previously served as the Company’s General Counsel and Chief Compliance Officer from March 2016 to August 2018. Mr. Moragne is responsible for leading and managing all portfolio management, operations, administrative, human resource, information technology, legal, compliance, corporate governance, and risk management functions and affairs for the Company. Prior to joining BRE in 2016, Mr. Moragne was a partner at the law firm now known as Vaisey Nicholson & Nearpass PLLC from April 2015 to February 2016 and was a corporate and securities attorney at the law firm Nixon Peabody LLP from September 2007 through March 2015. Mr. Moragne holds a B.A. from SUNY Geneseo and a J.D. from The George Washington University Law School.
Family Relationships
There are no family relationships among any of our directors or executive officers.
Corporate Governance Profile
We have structured our corporate governance in a manner we believe closely aligns our interests with those of our stockholders. Upon completion of this offering, notable features of our corporate governance structure will include the following:
| • | our board of directors is not classified, with each of our directors subject to election annually, and we may not elect to be subject to the elective provision of the MGCL that would classify our board of directors without the affirmative vote of a majority of the votes cast on the matter by stockholders entitled to vote generally in the election of directors; |
| • | stockholders have the ability to amend our bylaws by majority vote; |
| • | out of eight directors are independent; |
| • | a fully independent audit committee, compensation committee, and nominating and corporate governance committee; |
| • | at least one of our directors will qualify as an “audit committee financial expert” as defined by the SEC; |
| • | we have opted out of the business combination and control share acquisition statutes in the MGCL; and |
138
Table of Contents
| • | we do not have a stockholder rights plan, and we will not adopt a stockholder rights plan in the future without (a) the approval of our stockholders or (b) seeking ratification from our stockholders within 12 months of adoption of the plan if the board of directors determines, in the exercise of its duties under applicable law, that it is in our best interest to adopt a rights plan without the delay of seeking prior stockholder approval. |
Our directors will stay informed about our business by attending meetings of our board of directors and the committees on which they serve and through supplemental reports and communications. Our independent directors are expected to meet regularly in executive sessions without the presence of our corporate officers or non-independent directors.
Director Independence
We expect our board of directors to determine that each of , , , and is an “independent director,” as such term is defined by the applicable rules and regulations of the NYSE.
Board Structure
Our board of directors consists of eight members. Our Charter and Second Amended and Restated Bylaws will provide that the number of our directors may be established by a majority of our board of directors from time to time, provided that the number of directors constituting the board of directors may never be less than the minimum number required by the MGCL nor more than twelve.
Each director will hold office until the next annual meeting of stockholders and until his or her successor is duly elected and qualified or until his or her earlier death, resignation, or removal. A director may resign at any time by delivering his or her resignation to the board, the chairman of the board, or the secretary of the Company. Any and all vacancies on our board of directors for any cause may be filled by a majority of the remaining directors, even if the remaining directors do not constitute a quorum, or a majority of our stockholders. Any individual so elected as a director to fill a vacancy will serve for the remainder of the full term of the directorship in which the vacancy occurred and until his or her successor is elected and qualified.
At any meeting of the board of directors, except as otherwise required by law, a majority of the total number of directors then in office will constitute a quorum for all purposes.
Role of Our Board of Directors in Risk Oversight
One of the key functions of our board of directors is informed oversight of our risk management process. Our board of directors administers this oversight function directly, with support from its three standing committees: the Audit Committee, the Compensation Committee, and the Nominating and Corporate Governance Committee, each of which addresses risks specific to its respective areas of oversight. In particular, as more fully described below, our Audit Committee has the responsibility to consider and discuss our major financial risk exposures and the steps our management has taken to monitor and control these exposures, including guidelines and policies to govern the process by which risk assessment and management is undertaken. The Audit Committee also monitors compliance with legal and regulatory requirements, in addition to oversight of the performance of our internal audit function. Our Compensation Committee assesses and monitors whether any of our compensation policies and programs has the potential to encourage excessive risk-taking. Our Nominating and Corporate Governance committee provides oversight with respect to corporate governance and ethical conduct and monitors the effectiveness of our corporate governance guidelines, including whether such guidelines are successful in preventing illegal or improper liability-creating conduct.
Board Committees
Upon the completion of this offering, our board of directors will have three standing committees: an Audit Committee, a Compensation Committee, and a Nominating and Corporate Governance Committee. The principal
139
Table of Contents
functions of each committee are briefly described below. Additionally, our board of directors may from time to time establish other committees to facilitate its oversight of management of the business and affairs of our Company. The charter of each committee will be available on our website at http://investors.bnl.broadstone.com upon the completion of this offering. Our website is not part of this prospectus.
Audit Committee
Our board of directors has adopted an audit committee charter, which defines the Audit Committee’s principal functions, including oversight related to:
| • | the integrity of the Company’s financial statements and other financial information provided by the Company to its stockholders and others; |
| • | the selection of independent auditors for the Company and review of the auditors’ qualifications and independence; |
| • | the evaluation of the performance of the independent auditors; and |
| • | the review of, and oversight over the implementation of, the Company’s risk management policies. |
The Audit Committee is also responsible for engaging, evaluating, compensating, and overseeing an independent registered public accounting firm, reviewing with the independent registered public accounting firm the plans for and results of the audit engagement, approving services that may be provided by the independent registered public accounting firm, including audit and non-audit services, such as tax services, reviewing the independence of the independent registered public accounting firm, considering the range of audit and non-audit fees, and reviewing the adequacy of our internal accounting controls. The Audit Committee also will prepare the audit committee report required by SEC regulations to be included in our annual report.
Our Audit Committee is composed of Messrs. Jacobstein (Chair), Rosenberger, and Watters and Ms. Hawkes. Our board of directors determined affirmatively that (i) each of Mr. Jacobstein and Rosenberger qualifies as an “audit committee financial expert” as such term has been defined by the SEC in Item 407(d)(5) of Regulation S-K and (ii) each member of our Audit Committee is “financially literate” as that term is defined by NYSE listing standards and meets the definition for “independence” for the purposes of serving on our Audit Committee under NYSE listing standards and Rule 10A-3 under the Exchange Act.
Compensation Committee
Our board of directors has adopted a compensation committee charter, which defines the Compensation Committee’s principal functions to include:
| • | discharging responsibilities relating to compensation of the Company’s Chief Executive Officer, other executive officers and directors, taking into consideration, among other factors, any stockholder vote on compensation; |
| • | implementing and administering the Company’s incentive compensation plans and equity-based plans; |
| • | overseeing and assisting the Company in preparing the Compensation Discussion & Analysis for inclusion in the Company’s proxy statement and/or annual report on Form 10-K; |
| • | providing for inclusion in the Company’s proxy statement a description of the processes and procedures for the consideration and determination of executive officer and director compensation; and |
| • | preparing and submitting for inclusion in the Company’s proxy statement and/or annual report on Form 10-K a compensation committee report. |
The Compensation Committee has the authority, in its sole discretion, to retain or obtain the advice of a compensation consultant, legal counsel, or other adviser as it deems appropriate. The Compensation Committee
140
Table of Contents
may form and delegate authority to subcommittees consisting of one or more members when it deems appropriate. Our Compensation Committee is composed of Messrs. Jacobstein (Chair) and Watters and Ms. Hawkes. Our board of directors determined affirmatively that each member of our Compensation Committee meets the definition for “independence” for the purpose of serving on our Compensation Committee under applicable rules of the NYSE and each member of our Compensation Committee meets the definition of a “non-employee trustee” for the purpose of serving on our Compensation Committee under Rule 16b-3 of the Exchange Act.
Nominating and Corporate Governance Committee
Our board of directors has adopted a nominating and corporate governance committee charter, which defines the Nominating and Corporate Governance committee’s principal functions to include:
| • | identifying and recommending to the full board qualified candidates for election as directors and recommend nominees for election as directors at the annual meeting of stockholders consistent with criteria approved by the Board; |
| • | developing and recommending to the board a set of corporate governance guidelines applicable to the Company, and implementing and monitoring such guidelines as adopted by the board; |
| • | overseeing the board’s compliance with financial, legal, and regulatory requirements and its ethics program as set forth in the Company’s Code of Business Conduct and Ethics (the “Code of Ethics”); |
| • | reviewing and making recommendations to the board on matters involving the general operation of the board, including the size and composition of the board and the structure and composition of board committees; |
| • | recommending to the board nominees for each board committee; |
| • | annually facilitating the assessment of the board’s performance as a whole and of individual directors, as required by applicable law, regulations, and the NYSE corporate governance listing standards; |
| • | overseeing the board’s evaluation of management; and |
| • | considering corporate governance issues that may arise from time to time and making recommendations to the board with respect thereto. |
Our Nominating and Corporate Governance committee is comprised of Messrs. Watters (Chair), Jacobstein, and Narasimhan. Our board of directors determined affirmatively that each member of our Nominating and Corporate Governance committee meets the definition of independence under NYSE listing standards.
Compensation Committee Interlocks and Insider Participation
None of our executive officers serves, or in the past has served, as a member of the board of directors or compensation committee, or other committee serving an equivalent function, of any entity that has one or more executive officers who serve as members of our board of directors or our Compensation Committee. None of the members of our Compensation Committee is, or has ever been, an officer or employee of our company.
Employment Agreements
In connection with the Internalization, we entered into Employment Agreements with each of Messrs. Czarnecki, Albano, Cutt, and Moragne, to be effective as of the completion of the Internalization.
Director Compensation
Our directors, except for directors who are employed by us, receive an annual retainer of $100,000, payable in arrears in equal quarterly installments as compensation for services as a director. In addition, the chairperson
141
Table of Contents
of the Audit Committee receives an additional annual retainer of $15,000, and the chairperson of the Nominating and Corporate Governance committee receives an additional annual retainer of $5,000. Each non-chairperson member of the board’s Audit Committee also receives an additional annual retainer of $5,000. Each of the aforementioned retainers are payable in the form of shares of our Common Stock; provided, that, in accordance with the terms of our director compensation and stock ownership policy, a director may elect to receive 30% of such compensation in the form of cash if such director maintains the minimum stock retention limit established by our board of directors from time to time. We also reimburse our directors for reasonable travel and other expenses incurred in connection with attending meetings of our board of directors and committees of our board of directors and otherwise performing their duties as directors. Our stock ownership guidelines require our directors to own a minimum of $250,000 in shares of our Common Stock, with an initial cash component of at least 20%. New directors have four years to comply with this guideline.
Code of Ethics
Our board of directors has adopted the Code of Ethics, which applies to our directors, officers, and employees. Among other matters, our Code of Ethics is designed to deter wrongdoing and to promote:
| • | honest and ethical conduct, including the ethical handling of actual or apparent conflicts of interest between personal and professional relationships; |
| • | full, fair, accurate, timely, and understandable disclosure in reports and documents that the Company files with, or submits to, the SEC and in stockholder reports and other public communications made by the Company; |
| • | compliance with applicable laws and governmental rules and regulations; |
| • | the prompt internal reporting of violations of the Code of Ethics to an appropriate person or persons identified in the Code of Ethics; and |
| • | accountability for adherence to the Code of Ethics. |
Any waiver of the Code of Ethics for our directors or executive officers must be approved by a majority of our independent directors, and any such waiver shall be promptly disclosed as required by law and NYSE regulations.
Indemnification
We have entered into indemnification agreements with each of our directors and executive officers. The indemnification agreements require that, subject to certain conditions, we indemnify each director and officer to the fullest extent permitted by law against any and all liabilities and expenses to which they may become subject by reason of their service as a director, officer, employee, or agent of our Company, and that we advance to each director and officer all related expenses incurred by each director or officer in defense of any claim or proceeding without any preliminary determination of the director’s or officer’s entitlement to indemnification; provided, that any amounts advanced will be refunded to us by the indemnified director or officer if it is ultimately determined that they did not meet the standard of conduct necessary for indemnification. The indemnification agreements also require that we maintain directors’ and officers’ liability insurance covering our directors and officers on terms at least as favorable as the policy coverage in place as of the date each indemnification agreement is entered into. Each indemnification agreement may only amended by the mutual written agreement of our Company and the director or officer party thereto.
Insofar as indemnification for liabilities arising under the Securities Act may be permitted to directors, officers, or persons controlling our Company pursuant to the foregoing provisions, we have been informed that in the opinion of the SEC such indemnification is against public policy as expressed in the Securities Act and is therefore unenforceable.
142
Table of Contents
Summary Compensation Information
Currently, we do not employ, and therefore have not paid any compensation to, any executive officers or any other employees, nor have we maintained any employee benefit plans or arrangements or have otherwise had any obligations under any compensatory programs.
Effective upon the completion of the Internalization, however, we will begin to employ employees, including our named executive officers. Upon closing of the Internalization, we anticipate our named executive officers in respect of fiscal year 2020 will be:
| • | Christopher J. Czarnecki, President and Chief Executive Officer; |
| • | Ryan M. Albano, Executive Vice President and Chief Financial Officer; |
| • | Sean T. Cutt, Executive Vice President and Chief Investment Officer; and |
| • | John D. Moragne, Executive Vice President, Chief Operating Officer, and Secretary. |
On November 11, 2019, in connection with the execution of the Merger Agreement relating to the Internalization, each of these individuals entered into Employment Agreements with the OP to serve in their respective positions, effective upon the closing of the Internalization. As detailed below, the Employment Agreements set forth the terms of each of these individuals’ employment, including their compensation arrangements, roles and responsibilities, and term of employment, all of which automatically becomes effective as of the closing of the Internalization.
The following table sets forth the generally anticipated levels and forms of compensation to be paid in fiscal year 2020, following the closing of the Internalization, to our executive officers under the expected terms of their Employment Agreements and related compensation arrangements.
Summary of Anticipated Compensation for Fiscal Year 2020
| Name and Principal Position |
Year (1) | Salary ($) (2) |
Stock Awards ($) (3) |
Non-Equity Incentive Plan Compensation ($) (4) |
All Other Compensation ($) (5) |
Total ($) | ||||||||||||||||||
| Christopher J. Czarnecki, President and Chief Executive Officer |
2020 | $ | 625,000 | $ | 2,000,000 | $ | 750,000 | — | $ | 3,375,000 | ||||||||||||||
| Ryan M. Albano, Executive Vice President and Chief Financial Officer |
2020 | $ | 375,000 | $ | 700,000 | $ | 375,000 | — | $ | 1,450,000 | ||||||||||||||
| Sean T. Cutt, Executive Vice President and Chief Investment Officer |
2020 | $ | 375,000 | $ | 700,000 | $ | 375,000 | — | $ | 1,450,000 | ||||||||||||||
| John D. Moragne, Executive Vice President, Chief Operating Officer, and Secretary |
2020 | $ | 375,000 | $ | 700,000 | $ | 375,000 | — | $ | 1,450,000 | ||||||||||||||
| (1) | Information provided for 2020 fiscal year, based on the expected terms of the executives’ Employment Agreements (as described more fully below) and other anticipated compensation arrangements. The information provided above is based on certain assumptions as described in the footnotes to this table and may not be reflective of actual compensation figures for fiscal year 2020. |
143
Table of Contents
| (2) | Salaries included reflect an annual amount, as set forth in each executive’s Employment Agreement. |
| (3) | Stock award values based on anticipated grant date fair value for equity grants to be granted in fiscal 2020 pursuant to the terms of the Employment Agreements. |
| (4) | Amounts reported assume target performance is achieved for fiscal year 2020. |
| (5) | No significant amounts of other compensation is known as of the date of this filing. |
Narrative Disclosure
Upon closing of the Internalization, in addition to the Employment Agreements with each of the aforementioned named executive officers becoming effective, the Company anticipates that it will begin implementing a comprehensive compensation program. As reflected in the named executive officers’ Employment Agreements, as more fully described below, in addition to base salary and the provision of customary employee benefits, it is anticipated that the named executive officers, as well as other key employees, will be eligible to participate in an annual cash bonus program and long-term equity based compensation plan, each beginning in 2020.
The Compensation Committee engaged FTI Consulting, Inc. as its independent compensation consultant who provided market data and related information in connection with the Employment Agreements with our anticipated named executive officers and is assisting the Compensation Committee in (i) developing a compensation philosophy and compensation objectives for our executive compensation program; (ii) determining the appropriate levels of compensation for the named executive officers and non-employee directors; and (iii) setting short-term and long-term performance metrics to underpin incentives for the Company’s annual cash bonus program and performance-based features of the Company’s long-term incentive program, all in furtherance of the Compensation Committee’s goal of appropriately motivating and retaining the named executive officers and aligning the interests of management with those of our stockholders. Our compensation consultant has not been engaged by management or any of our executive officers to perform any work on behalf of management collectively or the executive officers individually during 2019. The Compensation Committee considers our compensation consultant to be independent.
Executive Officer Employment Agreements
The Employment Agreements with Messrs. Czarnecki, Albano, Cutt, and Moragne will automatically become effective upon the closing of the Internalization. Each of the Employment Agreements provides for a term of four years, unless terminated earlier as provided under its terms. Pursuant to the terms of the Employment Agreement, the executive receives an annual base salary of $625,000 for Mr. Czarnecki, and $375,000 for each of Messrs. Albano, Cutt, and Moragne, subject to increase, but not decrease, during the employment term, unless the decrease is pursuant to across-the-board salary reductions affecting other senior-level executives of the Company. Beginning in 2020, the executive shall be eligible to receive a target annual bonus equal to 120% of the executive’s base salary for Mr. Czarnecki, and 100% for Messrs. Albano, Cutt, and Moragne, with the actual bonus amount, if any, to be based on actual performance relative to company-wide and individual performance goals. In addition, the executive is entitled to reimbursement for reasonable out-of-pocket business expenses incurred in performing his duties in accordance with the expense reimbursement policy of the Company in effect from time to time and is eligible to participate in all benefit programs for which other senior executives of the Company are generally eligible. In addition, in 2020, the executive shall be entitled to receive a long-term incentive award under the Company’s long-term equity compensation program with a target grant value of $2,000,000 for Mr. Czarnecki, and $700,000 for Messrs. Albano, Cutt, and Moragne, which is contemplated to consist of 40% time-vested awards and 60% performance-based awards. In addition, the terms of each Employment Agreement provide for payments upon certain terminations of employment as described below under “Payments upon Certain Events of Termination or Change in Control.” The terms of each Employment Agreement also include restrictive covenants providing for non-competition, non-solicitation of employees and non-interference with business relationships, in each case, during employment and for 12 months thereafter, mutual non-disparagement, and perpetual non-disclosure and non-use of confidential information.
144
Table of Contents
Long-Term Equity Program
Prior to the consummation of this offering, the Board will adopt the 2020 Equity Incentive Plan in order to provide long-term equity-based incentives to our key employees, including our named executive officers and non-employee directors, which the Compensation Committee believes is a critical element in providing a balanced executive compensation program and aligning the interests of our named executive officers with those of our stockholders. As provided in the Employment Agreements, the Compensation Committee intends for initial grants of awards to the named executive officers to occur in 2020, consisting of 40% time-vested and 60% performance-vested awards. For further information regarding the 2020 Equity Incentive Plan see the description of material terms under the heading “—Material Terms of the Equity Incentive Plan.”
Outstanding Equity Awards at the Time of this Offering
No executive officer held any equity awards in respect of the Company’s securities at the end of the prior fiscal year.
Additional Narrative Disclosure
In connection with the Internalization, we will assume a tax-qualified Section 401(k) retirement savings plan that provides for employee contributions and employer matching contributions. Our executive officers will be eligible to participate in the tax-qualified Section 401(k) retirement savings plan on the same basis as other employees who satisfy the plan’s eligibility requirements, including any requirements relating to age and length of service.
Currently we do not anticipate our compensation program for fiscal year 2020 including any other material benefits programs or perquisites for our executive officers.
Payments upon Certain Events of Termination or Change in Control
Under the terms of the Employment Agreement for each of the executive officers, which will become effective upon the closing of the Internalization, the executive officers will be entitled to receive certain payments in connection with certain termination events, as described below.
In the event of the executive’s termination of employment by the Company without “Cause” or by the executive for “Good Reason” (as such terms are defined in the Employment Agreement), or if the executive is terminated by the Company following the expiration of the term of the Employment Agreement, the executive is entitled to receive: (i) accrued benefits consisting of unpaid base salary and accrued but unused vacation and/or paid time off through the date of termination, reimbursement for all reasonable out-of-pocket business expenses incurred and paid by Executive through date of termination, vested benefits under Company benefit plans, and any annual bonus earned but unpaid as of the date of termination (collectively, the “Accrued Benefits”); (ii) a lump sum payment equal to two times the sum of the executive’s base salary and then-current target bonus for Mr. Czarnecki and 1.5 times the sum of the executive’s base salary and then-current target bonus for Messrs. Albano, Cutt, and Moragne, or, if during the period consisting of the three months prior to or 12 months following a Change in Control (the “Change in Control Window”), three times the sum of the base salary and then-current target bonus for Mr. Czarnecki and two times the sum of the executive’s base salary and then-current target bonus for Messrs. Albano, Cutt, and Moragne; (iii) a prorated target bonus for year of date of termination, through the date of termination; (iv) payment of COBRA premiums for 24 months; and (v) full vesting of any outstanding equity awards that are subject solely to time-based vesting conditions. All the severance payments and benefits are conditioned on the executive executing and not revoking a general release of claims for the benefit of the Company and continued compliance with the restrictive covenants, as described below. In the event of a “change in control” of the Company (as defined in the Employment Agreement), if any of the payments or benefits provided for under the Employment Agreement or otherwise payable to the executive
145
Table of Contents
would constitute “parachute payments” within the meaning of Section 280G of the Code and would be subject to the related excise tax under Section 4999 of the Code, then the executive will be entitled to receive either the full payment of such payments and benefits or a reduced amount of payments and benefits, where the reduced amount would result in no portion of the payments or benefits being subject to the excise tax, whichever results in the greater amount after-tax benefits being retained by the executive.
In the event the executive’s employment with the Company is terminated due to the executive’s Disability (as defined in the Employment Agreement), the executive will be entitled to receive, (i) the Accrued Benefits; (ii) full vesting of any outstanding equity awards that are subject solely to time-based vesting conditions; (iii) a prorated target bonus for year of date of termination, through the date of termination; and (iv) payment of COBRA premiums for 12 months. In the event the executive’s death, the executive’s estate will be entitled to receive (i) the Accrued Benefits; (ii) full vesting of any outstanding equity awards that are subject solely to time-based vesting conditions; (iii) a prorated target bonus for year of date of termination, through the date of termination; and (iv) payment of COBRA premiums for 12 months.
In the event of the executive’s employment is terminated by the Company for Cause, or the Executive voluntarily terminates employment (without Good Reason), the Executive will be entitled to receive the Accrued Benefits, except, in the case of termination for Cause, the Executive will not receive any amount of an otherwise earned but unpaid annual bonus.
Director Compensation
Director Compensation Program for 2019
During 2019, we paid those directors considered independent or their nominees for their service as our directors an annual retainer of $100,000, payable in arrears in equal quarterly installments. In addition, we paid the following additional annual retainers: (a) $10,000 to each of the board of directors’ Lead Independent Director and the chairperson of the Audit Committee, (b) $5,000 to the chairperson of the Governance Committee, and (c) $5,000 to each non-chairperson member of the Audit Committee. In addition, in connection with the proposed Internalization, our board of directors formed a special committee comprised of Ms. Hawkes, who served as chairperson of the special committee, and Messrs. Jacobstein, Narasimhan, and Rosenberger. The chairperson of the special committee was paid a monthly retainer of $10,000, with aggregate fees capped at $50,000, and each non-chairperson member of the special committee were paid a monthly retainer of $5,000, with aggregate fees capped at $25,000.
The retainers payable to those directors considered independent as described above were paid in the form of shares of our Common Stock with a value equal to the amount of the applicable retainer payment, provided that, in accordance with the terms of the director compensation and stock ownership policy (the “Policy”) in effect for 2019, two of our independent directors elected to receive 30% of such compensation in the form of cash. In order for an independent director to elect to receive such compensation in the form of a mixture of shares of our Common Stock and cash, the independent director must maintain the minimum stock retention limit established by the board of directors from time to time. Pursuant to the Policy, each of our independent directors has acquired and retained ownership of a minimum of $250,000 in shares of our Common Stock. Shares of our Common Stock owned indirectly by a director (e.g., through a spouse) count towards meeting this stock ownership requirement.
146
Table of Contents
The table below sets forth certain information regarding the compensation earned by or paid to our directors during the fiscal year ended December 31, 2019.
Director Compensation in Fiscal Year 2019
| Name | Fees Earned or Paid In Cash |
All Other Compensation(1) |
Total | |||||||||
| Christopher J. Czarnecki |
— | — | — | |||||||||
| Laurie A. Hawkes (2) |
— | $ | 165,000 | $ | 165,000 | |||||||
| David M. Jacobstein (2) |
$ | 40,500 | $ | 94,500 | $ | 135,000 | ||||||
| Agha S. Khan |
— | — | — | |||||||||
| Thomas P. Lydon, Jr. (2)(3) |
— | $ | 84,783 | $ | 84,783 | |||||||
| Shekar Narasimhan (2) |
$ | 37,500 | $ | 87,500 | $ | 125,000 | ||||||
| Geoffrey H. Rosenberger (2) |
— | $ | 130,000 | $ | 130,000 | |||||||
| Amy L. Tait |
— | — | — | |||||||||
| James H. Watters (2) |
— | $ | 110,000 | $ | 110,000 | |||||||
|
|
|
|
|
|
|
|||||||
| Totals |
$ | 78,000 | $ | 671,783 | $ | 749,783 | ||||||
|
|
|
|
|
|
|
|||||||
| (1) | The amounts shown in this column reflect the aggregate fair value of shares of our Common Stock computed as of the grant date in accordance with the FASB Accounting Standards Codification Topic 718. |
| (2) | 2019 Independent Directors. |
| (3) | Resigned from our board of directors in November 2019. |
Director Compensation Program for 2020
Our directors, except for directors who are employed by us, receive an annual retainer of $100,000, payable in arrears in equal quarterly installments as compensation for services as a director. In addition, the chairperson of the Audit Committee receives an additional annual retainer of $15,000, and the chairperson of the Nominating and Corporate Governance Committee receives an additional annual retainer of $5,000. Each non-chairperson member of the Audit Committee also receives an additional annual retainer of $5,000. Each of the aforementioned retainers are payable in the form of shares of our Common Stock; provided, that, in accordance with the terms of our director compensation and stock ownership policy, a director may elect to receive 30% of such compensation in the form of cash if such director maintains the minimum stock retention limit established by our board of directors from time to time. We also reimburse our directors for reasonable travel and other expenses incurred in connection with attending meetings of our board of directors and committees of our board of directors and otherwise performing their duties as directors.
Material Terms of the 2020 Equity Incentive Plan
Prior to the completion of this offering, our board of directors will adopt the 2020 Equity Incentive Plan, under which equity awards may be made in respect of shares of our Common Stock (“Shares”), as described further below in the section titled “—Shares Available.” Under the 2020 Equity Incentive Plan, awards may be granted in the form of options, restricted stock, restricted stock units, stock appreciation rights, dividend equivalent rights, share awards and performance-based awards (including performance share units and performance-based restricted stock) and LTIP Units (as defined below). The following is a summary of the material terms of the 2020 Equity Incentive Plan. This summary is qualified in its entirety by reference to the full text of the 2020 Equity Incentive Plan which has been filed as Exhibit 10.3 to this registration statement.
Administration. The 2020 Equity Incentive Plan will be administered by our Compensation Committee. The Compensation Committee shall consist of at least two directors of the board of directors and may consist of the entire board of directors. The Compensation Committee will generally consist of directors considered to be non-employee directors for purposes of Section 16 of the Exchange Act.
147
Table of Contents
Plan Term. The 2020 Equity Incentive Plan will become effective immediately prior to the closing of this offering, and will terminate on the tenth (10th) anniversary thereof, unless earlier terminated by our board of directors.
Eligibility. Under the 2020 Equity Incentive Plan, “Eligible Individuals” include officers, employees, consultants, and non-employee directors providing services to the Company and its subsidiaries. The Compensation Committee will determine which Eligible Individuals will receive grants of awards.
Incentives Available. Under the 2020 Equity Incentive Plan, the Compensation Committee may grant any of the following types of awards to an Eligible Individual: nonqualified stock options (“Options”); stock appreciation rights (“SARs”); restricted stock grants (“Restricted Stock”); restricted stock units (“RSUs”); Performance Awards; Dividend Equivalent Rights; Share Awards; and LTIP Units, each as defined below (each type of grant is considered an “Award”).
Shares Available. Subject to any adjustment as provided in the 2020 Equity Incentive Plan, up to Shares may be issued pursuant to Awards granted under the 2020 Equity Incentive Plan, all of which may be granted as incentive stock options (“ISOs”). For a non-employee director, the maximum dollar amount of cash or the fair market value of Shares that any individual may receive in any calendar year in respect of Awards may not exceed $ .
If an Award or any portion thereof that is granted under 2020 Equity Incentive Plan (i) expires or otherwise terminates without all of the Shares covered by such Award having been issued or (ii) is settled in cash (i.e., the participant receives cash rather than Shares), such expiration, termination, or settlement will not reduce (or otherwise offset) the number of Shares that may be available for issuance under 2020 Equity Incentive Plan. If any Shares issued pursuant to an Award are forfeited and returned back to or reacquired by the Company because of the failure to meet a contingency or condition required to vest such Shares in the participant, then the Shares that are forfeited or reacquired will again become available for issuance under 2020 Equity Incentive Plan. Any Shares tendered or withheld (i) to pay the exercise price of an Option or (ii) to satisfy tax withholding obligations associated with an Award granted under 2020 Equity Incentive Plan shall not become available again for issuance under 2020 Equity Incentive Plan.
Stock Options. The Compensation Committee may grant Options to Eligible Individuals. An Option is the right to purchase one or more Shares at a designated exercise price, which Option is not subject to statutory requirements and limitations required for certain tax advantages allowed under Section 422 of the Code.
Vesting and Exercise Periods for Options. Each Option granted under the 2020 Equity Incentive Plan may be subject to certain vesting requirements and will become exercisable in accordance with the specific terms and conditions of the Option, as determined by the Compensation Committee at the time of grant and set forth in an Award agreement. The term of an Option generally may not exceed ten years from the date it is granted (five years in the case of an ISO granted to a ten-percent stockholder). Each Option, to the extent it becomes exercisable, may be exercised at any time in whole or in part until its expiration or termination, unless otherwise provided in applicable Award agreement.
Exercise Price for Options. The purchase price per Share with respect to any Option granted under the 2020 Equity Incentive Plan may be not less than 100% of the fair market value of a share of Common Stock on the date the Option is granted.
Stock Appreciation Rights. The Compensation Committee may grant SARs to Eligible Individuals on terms and conditions determined by the Compensation Committee at the time of grant and set forth in an Award agreement. A SAR may be granted (a) at any time if unrelated to an Option or (b) if related to an Option, either at the time of grant or at any time thereafter during the term of the Option.
148
Table of Contents
Amount Payable. A SAR is a right granted to a participant to receive an amount equal to the excess of the fair market value of a Share on the last business day preceding the date of exercise of such SAR over the fair market value of a Share on the date the SAR was granted. A SAR may be settled or paid in cash, Shares or a combination of each, in accordance with its terms.
Duration. Each SAR will be exercisable or be forfeited or expire on such terms as the Compensation Committee determines. Except in limited circumstances, an SAR shall have a term of no greater than ten years.
Prohibition on Repricings. The Compensation Committee will have no authority to make any adjustment or amendment (other than in connection with certain changes in capitalization or certain corporate transactions in accordance with the terms of the 2020 Equity Incentive Plan, as generally described below) that reduces, or would have the effect of reducing, the exercise price of an Option or SAR previously granted under the 2020 Equity Incentive Plan, unless the Company’s stockholders approve such adjustment or amendment.
Dividend Equivalent Rights. The Compensation Committee may grant dividend equivalent rights (“Dividend Equivalent Rights”), either in tandem with an Award or as a separate Award, to Eligible Individuals on terms and conditions determined by the Compensation Committee at the time of grant and set forth in an Award agreement. A Dividend Equivalent Right is a right to receive cash or Shares based on the value of dividends that are paid with respect to the Shares. Amounts payable in respect of Dividend Equivalent Rights may be payable currently or, if applicable, deferred until the lapsing of restrictions on such dividend equivalent rights or until the vesting, exercise, payment, settlement, or other lapse of restrictions on the Award to which the Dividend Equivalent Rights relate, subject to compliance with Section 409A of the Code. Dividend Equivalent Rights may be settled in cash or shares of Common Stock or a combination thereof, in a single installment or multiple installments, as determined by the Compensation Committee.
Restricted Stock; Restricted Stock Units. The Compensation Committee may grant either Shares (Restricted Stock) or phantom Shares (RSUs), in each case subject to certain vesting requirements, on terms and conditions determined by the Compensation Committee at the time of grant and set forth in an Award agreement.
Restricted Stock. Unless the Compensation Committee determines otherwise, upon the issuance of shares of Restricted Stock, the participant shall have all of the rights of a stockholder with respect to such Shares, including the right to vote the Shares and to receive all dividends or other distributions made with respect to the Shares. The Compensation Committee may determine that the payment to the participant of dividends, or a specified portion thereof, declared or paid on such Shares shall be deferred until the lapsing of the restrictions imposed upon such Shares and held by the Company for the account of the participant until such time. Payment of deferred dividends in respect of shares of Restricted Stock shall be made upon the lapsing of restrictions imposed on the shares of Restricted Stock in respect of which the deferred dividends were paid, and any dividends deferred in respect of any shares of Restricted Stock shall be forfeited upon the forfeiture of such shares of Restricted Stock.
Period for Lapsing of Restrictions on Restricted Stock. During such period as may be set by the Compensation Committee in the Award agreement (the “Vesting Period”), the Participant shall not be permitted to sell, transfer, pledge, hypothecate, or assign shares of Restricted Stock awarded under the 2020 Equity Incentive Plan except by will or the laws of descent and distribution. The Compensation Committee may also impose such other restrictions and conditions, including the attainment of pre-established Performance Objectives (as defined below) or other corporate or individual performance goals, on Restricted Stock as it determines in its sole discretion.
Restricted Stock Units. Each RSU shall represent the right of the participant to receive a payment upon vesting of the RSU, or on any later date specified by the Compensation Committee, of an amount equal to the fair market value of a Share as of the date the RSU becomes vested (together with such dividends as may have accrued with respect to such Share from the time of the grant of the Award until the time of vesting), or such
149
Table of Contents
later date as determined by the Compensation Committee at the time the RSU is granted (and which will be set forth in the applicable grant agreement). An RSU may be settled or paid in cash, Shares or a combination of each, as determined by the Compensation Committee.
Performance Awards. Performance awards ((“Performance Awards”) (including performance units (“Performance Units”) and performance share units (“Performance Share Units”)) and performance-based restricted stock (“Performance-Based Restricted Stock”)) may be granted to Eligible Individuals on terms and conditions determined by the Compensation Committee and set forth in an Award agreement.
Performance Units. Performance Units shall be denominated in a specified dollar amount and, contingent upon the attainment of specified performance objectives within a performance cycle and such other vesting conditions as may be determined by the Compensation Committee (including without limitation, a continued employment requirement following the end of the applicable performance period), represent the right to receive payment of the specified dollar amount or a percentage of the specified dollar amount depending on the level of performance objective attained; provided, however, that the Compensation Committee may at the time a Performance Unit is granted specify a maximum amount payable in respect of a vested Performance Unit. The award agreement for each Performance Unit shall specify the number of Performance Units to which it relates, the Performance Objectives and other conditions which must be satisfied in order for the Performance Unit to vest and the performance cycle within which such Performance Objectives must be satisfied and the circumstances under which the award will be forfeited.
Performance Share Units. Performance Share Units shall be denominated in Shares and, contingent upon the attainment of specified Performance Objectives within a performance cycle and such other vesting conditions as may be determined by the Compensation Committee (including, without limitation, a continued employment requirement following the end of the applicable performance period), represent the right to receive an amount of the fair market value of a Share on the date the Performance Share Unit becomes vested or any other date specified by the Compensation Committee or a percentage of such amount depending on the level of Performance Objective attained; provided, however, that the Compensation Committee may at the time a Performance Share Unit is granted specify a maximum amount payable in respect of a vested Performance Share Unit. A Performance Share Unit may be settled in cash, shares, or a combination of each. The Award agreement for each Performance Share Unit shall specify the number of Performance Share Units to which it relates, the Performance Objectives and other conditions which must be satisfied in order for the Performance Share Unit to vest and the performance cycle within which such Performance Objectives must be satisfied and the circumstances under which the Award will be forfeited.
Performance-Based Restricted Stock. Performance-Based Restricted Stock shall consist of an Award of shares of Restricted Stock, issued in the participant’s name and subject to appropriate restrictions and transfer limitations. Unless the Compensation Committee determines otherwise and as set forth in the applicable Award agreement, upon issuance of Shares of Performance-Based Restricted Stock, the participant shall have all of the rights of a stockholder with respect to such Shares, including the right to vote the Shares and to receive all dividends or other distributions paid or made with respect to Shares. The Award agreement for each Award of Performance-Based Restricted Stock will specify the number of shares of Performance-Based Restricted Stock to which it relates, the Performance Objectives and other conditions that must be satisfied in order for the Performance-Based Restricted Stock to vest, the performance cycle within which the Performance Objectives must be satisfied (which will not be less than one (1) year) and the circumstances under which the Award will be forfeited. At the time the Award of Performance-Based Restricted Stock is granted, the Compensation Committee may determine that the payment to the participant of dividends, or a specified portion thereof, declared or paid on Shares represented by such Award which have been issued by the Company to the participant shall be deferred until the lapsing of the restrictions imposed upon such Performance-Based Restricted Stock and held by the Company for the account of the participant until such time. Payment of deferred dividends in respect of Shares of Performance-Based Restricted Stock shall be made upon the lapsing of restrictions imposed on the Performance-Based Restricted Stock in respect of which the deferred dividends were paid, and any dividends
150
Table of Contents
deferred in respect of any Performance-Based Restricted Stock shall be forfeited upon the forfeiture of such Performance-Based Restricted Stock.
Performance Objectives. Performance objectives (“Performance Objectives”) may be expressed in terms of (i) net earnings; (ii) earnings per share; (iii) net debt; (iv) revenue or sales growth; (v) net or operating income; (vi) net operating profit; (vii) return measures (including, but not limited to, return on assets, capital, equity or sales); (viii) cash flow (including, but not limited to, operating cash flow, distributable cash flow and free cash flow); (ix) earnings before or after taxes, interest, depreciation, amortization and/or rent; (x) share price (including, but not limited to growth measures and total stockholder return); (xi) expense control or loss management; (xii) customer satisfaction; (xiii) market share; (xiv) economic value added; (xv) working capital; (xvi) the formation of joint ventures or the completion of other corporate transactions; (xvii) gross or net profit margins; (xviii) revenue mix; (xix) operating efficiency; (xx) product diversification; (xxi) market penetration; (xxii) measurable achievement in quality, operation or compliance initiatives; (xxiii) quarterly dividends or distributions; (xxiv) employee retention or turnover; or (xxv) any other operational, financial or other goal as may be determined by the Compensation Committee; (xxvi) AFFO or FFO, or (xxvii) any combination of or a specified increase in any of the foregoing. Performance Objectives may be in respect of the performance of the Company, any of its Subsidiaries or Divisions (as defined in the 2020 Equity Incentive Plan) or any combination thereof. Performance Objectives may be absolute or relative (to prior performance of the Company or to the performance of one or more other entities or external indices) and may be expressed in terms of a progression within a specified range. The Compensation Committee may adjust Performance Objectives from time to time to reflect the impact of specified events, including any one or more of the following with respect to the applicable performance period: (i) the gain, loss, income, or expense resulting from changes in accounting principles or tax laws that become effective during the performance period; (ii) the gain, loss, income, or expense reported publicly by the Company with respect to the performance period that are extraordinary or unusual in nature or infrequent in occurrence; (iii) the gains or losses resulting from, and the direct expenses incurred in connection with, the disposition of a business or the sale of investments or non-core assets; (iv) the gain or loss from all or certain claims and/or litigation and all or certain insurance recoveries relating to claims or litigation; (v) the impact of investments or acquisitions made during the year or, to the extent provided by the Compensation Committee, any prior year; or (vi) other extraordinary or unusual events as determined by the Compensation Committee. The events may relate to the Company as a whole or to any part of the Company’s business or operations, as determined by the Compensation Committee. Any adjustments based on the effect of certain events are to be determined in accordance with generally accepted accounting principles and standards, unless another objective method of measurement is designated by the Compensation Committee.
Prior to the vesting, payment, settlement, or lapsing of any restrictions the Compensation Committee shall determine that the applicable Performance Objectives have been satisfied. In respect of a Performance Award, the Compensation Committee may, in its sole discretion, (i) reduce the amount of cash paid or number of Shares to be issued or that have been issued and that become vested or on which restrictions lapse, and/or (ii) establish rules and procedures that have the effect of limiting the amount payable to any Participant to an amount that is less than the amount that otherwise would be payable under such Award. The Compensation Committee may exercise such discretion in a non-uniform manner among Participants.
Share Awards. The Compensation Committee may grant an Award of Shares (“Share Awards”) to an Eligible Individual on such terms and conditions as the Compensation Committee may determine at the time of grant. A Share Award may be made as additional compensation for services rendered by the Eligible Individual or may be in lieu of cash or other compensation to which the Eligible Individual is entitled from the Company.
LTIP Units. The Compensation Committee may grant an Award of LTIP Units (“LTIP Units”) to an Eligible Individual on such terms and conditions as the Compensation Committee may determine at the time of grant. LTIP Units are intended to be profits interests in the OP, the rights and features of which, if applicable, will be set forth in the OP Agreement, as applicable.
151
Table of Contents
Adjustments upon Changes in Capitalization. In the event that the outstanding Shares are changed into or exchanged for a different number or kind of Shares or other stock or securities or other equity interests of the Company or another corporation or entity, whether through merger, consolidation, reorganizations, recapitalization, reclassification, stock dividend, stock split, reverse stock split, substitution, or other similar corporate event or transaction, or an extraordinary dividend or distribution by the Company in respect of its Shares or other capital stock or securities convertible into capital stock in cash, securities, or other property, the Compensation Committee shall determine the appropriate adjustments, if any, to (a) the maximum number and kind of shares of stock or other securities or other equity interests as to which Awards may be granted under the 2020 Equity Incentive Plan, (b) the maximum number and class of Shares or other stock or securities that may be issued upon exercise of ISOs, (c) the number and kind of Shares or other securities covered by any or all outstanding Awards that have been granted under the 2020 Equity Incentive Plan, (d) the option price of outstanding Options and the base price of outstanding SARs, and (e) the Performance Objectives applicable to outstanding Performance Awards.
Effect of Change in Control or Certain Other Transactions. Generally, the Award agreement evidencing each Award will provide any specific terms applicable to that Award in the event of a Change in Control of the Company (as defined below). Unless otherwise provided in an Award agreement, in connection with a merger, consolidation, reorganization, recapitalization, or other similar change in the capital stock of the Company, or a liquidation or dissolution of the Company or a Change in Control (each a “Corporate Transaction”), Awards shall either: (a) continue following such Corporate Transaction, which may include, in the discretion of the Compensation Committee or the parties to the Corporate Transaction, the assumption, continuation, or substitution of the Awards, in each case with appropriate adjustments to the number, kind of shares, and exercise prices of the Awards; (b) become vested in whole or in part; or (c) terminate.
For purposes of the 2020 Equity Incentive Plan, “Change in Control” generally means the occurrence of any of the following events with respect to the Company: (a) any person (other than directly from the Company) first acquires securities of the Company representing fifty percent or more of the combined voting power of the Company’s then outstanding voting securities, other than an acquisition by certain employee benefit plans, the Company or a related entity, or any person in connection with a non-control transaction; (b) a majority of the members of the board of directors is replaced by directors whose appointment or election is not endorsed by a majority of the members of the board of directors serving immediately prior to such appointment or election; (c) any merger, consolidation, or reorganization, other than in a non-control transaction; (d) a complete liquidation or dissolution or (e) sale or disposition of all or substantially all of the assets. A “non-control transaction” generally includes any transaction in which (i) stockholders immediately before such transaction continue to own at least a majority of the combined voting power of such resulting entity following the transaction; (ii) a majority of the members of the board of directors immediately before such transaction continue to constitute at least a majority of the board of the surviving entity following such transaction, or (iii) with certain exceptions, no person other than any person who had beneficial ownership of more than fifty percent of the combined voting power of the Company’s then outstanding voting securities immediately prior to such transaction has beneficial ownership of more than fifty percent of the combined voting power of the surviving entity’s outstanding voting securities immediately after such transaction.
Options and SARs Terminated in Corporate Transaction. If Options or SARs are to terminate in the event of a Corporate Transaction, the holders of vested Options or SARs must be provided either (a) fifteen days to exercise their Options or SARs or (b) payment (in cash or other consideration) in respect of each Share covered by the Option of SAR being cancelled in an amount equal to the excess, if any, of the per Share consideration to be paid to stockholders in the Corporate Transaction over the price of the Option or the SAR. If the per Share consideration to be paid to stockholders in the Corporate Transaction is less than the exercise price of the Option or SAR, the Option or SAR may be terminated without payment of any kind. The holders of unvested Options or SARs may also receive payment, at the discretion of the Compensation Committee, in the same manner as described above for vested Options and SARs. The Compensation Committee may also accelerate the vesting on any unvested Option or SAR and provide holders of such Options or SARS a reasonable opportunity to exercise the Award.
152
Table of Contents
Other Awards Terminated in Corporate Transaction. If Awards other than Options and SARs are to terminate in connection with a corporate transaction, the holders of vested Awards will be provided, and holders of unvested Awards may be provided, at the discretion of the Compensation Committee, payment (in cash or other consideration upon or immediately following the Corporate Transaction, or, to the extent permitted by Section 409A of the Code, on a deferred basis) in respect of each Share covered by the Award being cancelled in an amount equal to the per Share price to be paid to stockholders in the Corporate Transaction, where the value of any non-cash consideration will be determined by the Compensation Committee in good faith.
The Compensation Committee may, in its sole discretion, provide for different treatment for different Awards or Awards held by different parties, and where alternative treatment is available for a participant’s Awards, may allow the participant to choose which treatment will apply to his or her Awards.
Transferability. The 2020 Equity Incentive Plan generally restricts the transfer of any Awards, except (a) transfers by will or the laws of descent and distribution or (b) to a beneficiary designated by the participant, to whom any benefit under the 2020 Equity Incentive Plan is to be paid or who may exercise any rights of the participant in the event of the participant’s death before he or she receives any or all of such benefit or exercises an Award.
Amendment or Termination of the Equity Incentive Plan. The 2020 Equity Incentive Plan may be amended or terminated by the board of directors without stockholder approval unless stockholder approval of the amendment or termination is required under applicable law, regulation, or New York Stock Exchange requirement. No amendment may materially and adversely alter or impair any Awards that had been granted under the 2020 Equity Incentive Plan prior to the amendment without the impacted participant’s consent. The 2020 Equity Incentive Plan will terminate on the tenth anniversary of its effective date; however, when the 2020 Equity Incentive Plan terminates, any applicable terms will remain in effect for administration of any Awards outstanding at the time of the 2020 Equity Incentive Plan’s termination.
Forfeiture Events; Clawback. The Compensation Committee may specify in an Award agreement that the participant’s rights, payments and benefits with respect to an Award shall be subject to reduction, cancellation, forfeiture, clawback, or recoupment upon the occurrence of certain specified events or as required by law, in addition to any otherwise applicable forfeiture provisions that apply to the Award. Without limiting the generality of the foregoing, any Award under the 2020 Equity Incentive Plan shall be subject to the terms of any clawback policy maintained by the Company, as it may be amended from time to time.
153
Table of Contents
CERTAIN RELATIONSHIPS AND RELATED PARTY TRANSACTIONS
Related party transactions are transactions in which we are a participant where the amount involved exceeds $120,000 and a member of our board of directors, an executive officer, or a holder of more than 5% of our voting securities (or an immediate family member of any of the foregoing) has a direct or indirect material interest. We have not implemented a formal written policy relating to the review, approval, or ratification of related party transactions, though we plan to adopt a written policy upon the consummation of this offering. However, in practice, all such related party transactions are reported to, and approved by, our full board of directors, excluding any interested directors, or a duly-appointed committee of disinterested directors. Our board of directors will consider all relevant facts and circumstances when deliberating such transactions, including whether the terms of the transaction are fair to us.
The following is a summary of certain related party transactions, other than compensation arrangements which are described under the sections of this prospectus entitled “Management—Director Compensation” and “Executive Compensation.” The related party transactions listed below were all approved by our board of directors.
Internalization and Repurchase of Common Stock
On November 11, 2019, we entered into the Merger Agreement providing for the internalization of the external management functions currently performed for the Company and the OP by BRE or its affiliates. We expect the Internalization will close in the first quarter of 2020. In connection with the proposed Internalization, we expect approximately 65 employees of BRE, including our entire senior management team, will become our employees, providing continuity of management for the Company. Currently, our day-to-day operations are managed by BRE under the supervision of our board of directors, pursuant to the terms and conditions of our asset and property management agreements, which will be terminated in connection with the closing of the Internalization. In connection with the Internalization, we also repurchased all of the outstanding shares of our Common Stock held by BRE at $85.00 per share for approximately $20 million on December 27, 2019. See “Recapitalization, Internalization, and Structure of Our Company” for a further discussion on the terms of the Internalization.
In connection with the completion of the Internalization, certain of our executive officers and directors and their affiliates are expected to receive certain material benefits, including the following:
| • | Amy Tait, our Chairman and a member of our board of directors, and certain immediate family members, are expected to receive approximately OP Units (with a value of approximately $ , based on the mid-point of the price range set forth on the front cover of this prospectus) and approximately $ in cash (collectively, with the OP Units, a total value of approximately $ ); |
| • | Trident BRE LLC, with which Agha Khan, a member of our board of directors, is affiliated, is expected to receive shares of our Common Stock and OP Units (collectively, with a value of approximately $ , based on the mid-point of the price range set forth on the front cover of this prospectus), and approximately $ in cash (collectively, with the Common Stock and OP Units, a total value of approximately $ ); |
| • | Christopher J. Czarnecki, our Chief Executive Officer, President, and Director, is expected to receive approximately shares of Common Stock (with a value of approximately $ , based on the mid-point of the price range set forth on the front cover of this prospectus) and approximately $ in cash, the majority of which was used to pay tax related obligations triggered in connection with the transaction (collectively, with the Common Stock, a total value of approximately $ ); |
| • | Ryan M. Albano, our Executive Vice President and Chief Financial Officer, is expected to receive approximately shares of Common Stock (with a value of approximately $ , based on the mid-point of the price range set forth on the front cover of this prospectus) and approximately $ |
154
Table of Contents
| in cash, the majority of which was used to pay tax related obligations triggered in connection with the transaction (collectively, with the Common Stock, a total value of approximately $ ); |
| • | Sean T. Cutt, our Executive Vice President and Chief Investment Officer, is expected to receive approximately shares of Common Stock (with a value of approximately $ , based on the mid-point of the price range set forth on the front cover of this prospectus) and approximately $ in cash, the majority of which was used to pay tax related obligations triggered in connection with the transaction (collectively, with the Common Stock, a total value of approximately $ ); |
| • | John D. Moragne, our Executive Vice President, Chief Operating Officer, and Secretary, is expected to receive approximately shares of Common Stock (with a value of approximately $ , based on the mid-point of the price range set forth on the front cover of this prospectus) and approximately $ in cash, the majority of which was used to pay tax related obligations triggered in connection with the transaction (collectively, with the Common Stock, a total value of approximately $ ); |
| • | In connection with the Internalization, we may be required to pay $75 million of additional “earnout” consideration (payable in four tranches of $10 million, $15 million, $25 million, and $25 million, and in the same form of consideration as the initial payments) if certain milestones related to the dollar volume-weighted average price of our Class A Common Stock (or Common Stock after the Class A Conversion) are achieved during specified periods of time following the completion of this offering. The number of shares of Common Stock and OP Units potentially issuable as “earnout” consideration will be determined by dividing the dollar value of any payment by $85. See “Recapitalization, Internalization, and Structure of Our Company—Internalization” for further information relating to the terms of the Internalization; |
| • | We entered into Employment Agreements with Messrs. Czarnecki, Albano, Cutt and Moragne, as more fully described under “Executive Compensation—Narrative Disclosure—Executive Employment Agreements,” to be effective as of the completion of the Internalization; |
| • | We will enter into the Registration Rights Agreement, the Founding Owners’ Tax Protection Agreement and certain other arrangements, as more fully described under “Certain Relationships and Related Party Transactions”; |
| • | We entered into indemnification agreements with each of our directors and executive officers, as more fully described below; and |
| • | We will have adopted our 2020 Equity Incentive Plan. |
Principal Executive Offices
In connection with the Internalization, we expect to assume the lease agreement relating to our principal executive offices with CAHA, an affiliated third party. Amy Tait, our Chairman and a member of our board of directors, indirectly owns an approximate 1.6% interest in CAHA. The lease is scheduled to expire on August 31, 2023, with two five-year renewal options. The annual gross rent for 2020 is approximately $547,324, with 2% annual increases thereafter.
Registration Rights Agreement
Upon closing of the Internalization, we expect to enter into a Registration Rights Agreement that provides the Trident Owners with certain demand registration rights and the Trident Owners and the Founding Owners with customary piggyback registration rights. Agha Khan, a member of our board of directors, is affiliated with the Trident Owners, and Amy Tait, our Chairman and member of our board of directors, members of her family, and certain family trusts are affiliated with the Founding Owners. The Registration Rights Agreement also provides that we will pay certain expenses relating to such registrations and indemnify the registration rights holders against certain liabilities which may arise under the Securities Act.
155
Table of Contents
Tax Protection Agreement
Upon closing of the Internalization, we expect to enter into the Founding Owners’ Tax Protection Agreement, pursuant to which we have agreed to indemnify the Founding Owners against certain tax liabilities resulting from: (1) the sale, exchange, transfer, conveyance, or other disposition of the assets of BRE that we acquired in the Internalization (the “Contributed Property”) in a taxable transaction prior to , 2030; and (2) our failure to offer the Founding Owners the opportunity to guarantee specific types of the OP’s indebtedness in order to enable them to continue to defer certain tax liabilities. Our maximum liability under the Founding Owners’ Tax Protection Agreement is capped at $10 million. The aggregate built-in gain on the Contributed Property that would be allocable to the Founding Owners is estimated to be approximately $ million and does not include any of our real property assets.
Asset Management Agreement and Property Management Agreement
Upon closing of the Internalization, we will terminate our asset management agreement and property management agreement. Pursuant to the terms of the asset management agreement, we paid approximately $21.9 million in fees during 2019. Pursuant to the terms of the property management agreement, we paid approximately $8.2 million in fees during 2019. Our third-party asset manager and property manager are affiliated with BRE. Each of Ms. Tait, our Chairman and a member of our board of directors, Mr. Khan, a member of our board of directors, and Mr. Czarnecki, our Chief Executive Officer, President, and Director, is a member of the Board of Managers of BRE and owns an interest in BRE. In addition, each of Mr. Albano, our Executive Vice President and Chief Financial Officer, Mr. Cutt, our Executive Vice President and Chief Investment Officer, and Mr. Moragne, our Executive Vice President, Chief Operating Officer, and Secretary, also own an interest in BRE.
Indemnification Agreements
We have entered into indemnification agreements with each of our directors and executive officers. The indemnification agreements require that, subject to certain conditions, we indemnify each director and officer to the fullest extent permitted by law against any and all liabilities and expenses to which they may become subject by reason of their service as a director, officer, employee, or agent of our Company, and that we advance to each director and officer all reasonable expenses incurred by each director or officer in defense of any claim or proceeding without any preliminary determination of the director’s or officer’s entitlement to indemnification; provided, that any amounts advanced will be refunded to us by the indemnified director or officer if it is ultimately determined that they did not meet the standard of conduct necessary for indemnification. The indemnification agreements also require that we maintain directors’ and officers’ liability insurance covering our directors and officers on terms at least as favorable as the policy coverage in place as of the date each indemnification agreement is entered into unless otherwise approved by a majority of our board of directors. Each indemnification agreement may only amended by the mutual written agreement of our Company and the director or officer party thereto.
Insofar as indemnification for liabilities arising under the Securities Act may be permitted to directors, officers, or persons controlling our Company pursuant to the foregoing provisions, we have been informed that in the opinion of the SEC such indemnification is against public policy as expressed in the Securities Act and is therefore unenforceable.
There is currently no pending material litigation or proceeding involving any of our directors, officers, or employees for which indemnification is sought.
Employment Agreements
In connection with the Internalization, we entered into Employment Agreements with each of Messrs. Czarnecki, Albano, Cutt, and Moragne, to be effective as of the completion of the Internalization. See “Executive Compensation—Narrative Disclosure—Executive Officer Employment Agreements” for further details.
156
Table of Contents
Equity Incentive Plan
In connection with this offering, we will adopt our 2020 Equity Incentive Plan to provide equity incentive opportunities to our officers, employees, and non-employee directors. An aggregate of shares of our Common Stock will be authorized for issuance under awards granted pursuant to our 2020 Equity Incentive Plan. See “Executive Compensation—Material Terms of the 2020 Equity Incentive Plan” for further details.
Directed Share Program
At our request, the underwriters have reserved for sale, at the initial public offering price, up to 5.0% of the shares offered by this prospectus for sale to some of our directors, officers, employees, and certain related persons as part of a directed share program. The directed share program will not limit the ability of such directors, officers, employees, and related persons to purchase more than $120,000 in value of our Class A Common Stock. We do not currently know the extent to which these related persons will participate in our directed share program, if at all, or the extent to which they will purchase more than $120,000 in value of our Class A Common Stock.
Statement of Policy Regarding Transactions with Related Persons
Upon completion of this offering, we will adopt a written statement of policy regarding transactions with related persons (the “related person policy”). Our related person policy requires that a “related person” (as defined as in paragraph (a) of Item 404 of Regulation S-K) must promptly disclose to us any “related person transaction” (defined as any transaction that is anticipated would be reportable by us under Item 404(a) of Regulation S-K in which we were or are to be a participant and the amount involved exceeds $120,000 and in which any related person had or will have a direct or indirect material interest) and all material facts with respect thereto. We will then promptly communicate that information to our board of directors. No related person transaction will be executed without the approval or ratification of our board of directors or a duly authorized committee of our board of directors. It is our policy that directors interested in a related person transaction will recuse themselves from any vote on a related person transaction in which they have an interest.
157
Table of Contents
RECAPITALIZATION, INTERNALIZATION, AND STRUCTURE OF OUR COMPANY
Recapitalization
Immediately prior to the closing of this offering, we will effect the REIT Recapitalization, pursuant to which (i) we will establish a new class of Common Stock as “Class A Common Stock” for sale in this offering and (ii) we will effect a four-for-one stock split of our Common Stock that is outstanding immediately prior to the closing of this offering. The four-for-one stock split is intended to achieve a stock price that is consistent with market expectations for underwritten public offerings by REITs. In connection with the REIT Recapitalization, the OP will effect a recapitalization of its OP Units, pursuant to which it will effect a four-for-one split of its outstanding OP Units.
The terms of our Class A Common Stock are identical to the terms of our Common Stock, except that each share of our Class A Common Stock will automatically convert into one share of our Common Stock 180 days after completion of this offering. The automatic conversion feature of the Class A Common Stock is the only difference between the terms of the Class A Common Stock and the Common Stock. Additionally, prior to the Class A Conversion, the holders of Class A Common Stock, voting as a separate class, are required to approve any amendment to our Charter that will affect such holders differently than the holders of our Common Stock.
The Class A Common Stock will be immediately listed on the NYSE under the symbol “BNL” upon completion of this offering and will be freely tradeable. The Common Stock (then including the shares of Common Stock issued upon conversion of the Class A Common Stock) will be listed on the date that is 180 days after completion of this offering.
The Recapitalization will have the effect of increasing the total number of outstanding shares of our Common Stock. On , 2020, immediately prior to the stock split, we had approximately million shares of Common Stock outstanding. Upon completion of this offering, we expect to have an aggregate of approximately million shares of our Common Stock (including our Class A Common Stock) outstanding. Of this amount, approximately million shares will be Class A Common Stock (representing % of our total outstanding Common Stock (including our Class A Common Stock) and % of our Common Stock (including our Class A Common Stock) and OP Units on a fully diluted basis).
The Recapitalization will be effected on a pro rata basis with respect to all of our stockholders immediately prior to this offering. Accordingly, it will not affect any such stockholder’s proportionate ownership of our outstanding shares. The Recapitalization also will be effected on a pro rata basis with respect to all of the members of the OP immediately prior to this offering.
The terms of our Common Stock (including our Class A Common Stock) are described more fully under “Description of Our Capital Stock” in this prospectus.
Internalization
On November 11, 2019, we entered into the Merger Agreement providing for the internalization of the external management functions currently performed for the Company and the OP by BRE or its affiliates. We expect the Internalization will close in the first quarter of 2020. In connection with the Internalization, the following transactions have occurred or are expected to occur:
| • | Pursuant to the Merger Agreement, we repurchased all of the outstanding shares of our Common Stock held by BRE at $85.00 per share for approximately $20 million on December 27, 2019. |
| • | We will acquire 100% of BRE through three mergers: |
| • | Our newly-formed corporate subsidiary merged into Trident BRE Holdings I, Inc. (“Blocker Corp 1”); |
158
Table of Contents
| • | Another newly-formed corporate subsidiary of ours merged into Trident BRE Holdings II, Inc. (“Blocker Corp 2” and together with Blocker Corp 1, the “Blocker Corps”); |
| • | The Blocker Corps will contribute their interests in BRE to the OP in exchange for OP Units; and |
| • | BRE will merge into the OP. |
| • | As consideration in the three mergers, we will issue shares of our Common Stock, the OP will issue OP Units, the OP will pay $ in cash, and the OP will assume approximately $94 million of debt. We expect to refinance $60 million of the assumed indebtedness with a new loan that is guaranteed by the Founding Owners. The aggregate value of the Common Stock, OP Units, and cash to be issued upon consummation of the Mergers will be approximately $206 million. |
| • | Our current management team and corporate staff will become employed by a subsidiary of the OP, and we will become internally managed. We entered into Employment Agreements with our four named executive officers, to be effective upon completion of the Internalization. |
| • | We will enter into the Registration Rights Agreement and the Founding Owners’ Tax Protection Agreement. |
| • | In connection with the Internalization, we may be required to pay $75 million of additional “earnout” consideration (payable in four tranches of $10 million, $15 million, $25 million, and $25 million, and in the same proportion of equity interests and cash as the initial payments) if certain milestones related to the 40-day dollar VWAP of our Class A Common Stock (or Common Stock after the Class A Conversion) are achieved during specified periods of time following the completion of this offering, as set forth below. The number of shares of Common Stock and OP Units potentially issuable as “earnout” consideration will be determined by dividing the dollar value of the payment by $85 (as adjusted to reflect any stock splits or recapitalizations, as applicable). In addition, if we have not completed an initial public offering by December 31, 2020, we may be required to provide liquidity to holders of our equity interests issued in the Internalization by repurchasing them at a price based on their then-current value. |
| Earnout Tranche |
Number of |
Cash |
VWAP of Common Stock |
Applicable Earnout Period | ||||||
| $10 million |
$ | 90.00 | The two-year period beginning on the earlier of (i) closing date of this offering or (ii) December 31, 2020. | |||||||
| $15 million |
$ | 95.00 | The two-year period beginning on the earlier of (i) closing date of this offering or (ii) December 31, 2020. | |||||||
| $25 million |
$ | 97.50 | The four-year period beginning on the date that is exactly one year after the earnout period begins for the first and second tranches above. | |||||||
| $25 million |
$ | 100.00 | The four-year period beginning on the date that is exactly one year after the earnout period begins for the first and second tranches above. | |||||||
The terms of the Employment Agreements are more fully described under “Executive Compensation—Narrative Disclosure—Executive Officer Employment Agreements.” The terms of the Registration Rights Agreement and the Founding Owners’ Tax Protection Agreement are more fully described under “Certain Relationships and Related Party Transactions.”
159
Table of Contents
Consequences of the Recapitalization, the Internalization, and this Offering
Share amounts and percentages below assume that the underwriters’ option to purchase additional shares is not exercised. Upon completion of the Recapitalization, the Internalization, and this offering, and assuming the earnout consideration in the Internalization is paid in full:
| • | Purchasers of shares of our Class A Common Stock in this offering will own % of the outstanding shares of our Common Stock, including our Class A Common Stock (or % of our Common Stock, including our Class A Common Stock, and OP Units on a fully diluted basis). |
| • | Our directors and officers will own shares of our Common Stock, representing % of the outstanding shares of our Common Stock, including our Class A Common Stock (or % of our Common Stock, including our Class A Common Stock, and OP Units on a fully diluted basis). |
| • | The Trident Owners will own shares of our Common Stock and OP Units, representing % of the outstanding shares of our Common Stock, including our Class A Common Stock, and OP Units on a fully diluted basis. |
| • | The Founding Owners will own shares of our Common Stock and OP Units, representing % of the outstanding shares of our Common Stock, including our Class A Common Stock, and OP Units on a fully diluted basis. |
| • | Our other continuing investors prior to this offering (i.e., the continuing investors other than our directors and officers and the Trident Owners) will own shares of our Common Stock, representing % of the outstanding shares of our Common Stock, including our Class A Common Stock (or % of our Common Stock, including our Class A Common Stock, and OP Units on a fully diluted basis). |
| • | The other existing OP Unit holders (i.e., the existing OP Unit holders other than the Founding Owners, the Trident Owners, the Blocker Corps, and us) will own OP Units, representing % of the outstanding OP Units and % of our Common Stock, including our Class A Common Stock, and OP Units on a fully diluted basis. |
| • | We will contribute the net proceeds from this offering to the OP in exchange for OP Units, and we will, directly or indirectly, own % of the outstanding OP Units ( % held directly by us and % held indirectly through the Blocker Corps). |
| • | The OP will use the net proceeds from this offering to repay borrowings under the 2020 Unsecured Term Loan and Revolving Credit Facility and for general business and working capital purposes, including potential future acquisitions. See “Use of Proceeds.” |
| • | As of September 30, 2019, the OP had approximately $ million of indebtedness outstanding, and we expect to increase the size of the Revolving Credit Facility, which will be available for general corporate purposes, including for funding future acquisitions. |
| • | We will adopt our 2020 Equity Incentive Plan to provide equity incentive opportunities to certain parties, including members of our board of directors and our management team and other employees. |
160
Table of Contents
The following chart sets forth information about our Company, the OP, and certain related parties upon completion of the Recapitalization, Internalization, and this offering, and assuming the earnout consideration in the Internalization is paid in full. Share amounts and percentages below assume that the underwriters’ option to purchase additional shares is not exercised.
| (1) | Directors & Officers include Common Stock beneficially owned by Agha S. Khan (which is also included in the Common Stock owned by the Trident Owners). |
| (2) | Other Continuing Investors include the continuing investors other than Directors & Officers and Trident Owners. |
| (3) | Other Existing OP Unit Holders include the existing OP Unit holders other than Founding Owners, Trident Owners, Blocker Corps, and Our Company. |
161
Table of Contents
HISTORICAL PRIVATE EQUITY ISSUANCES AND REDEMPTIONS
Beginning in 2007 and through December 31, 2019, we raised equity capital through private offerings of our Common Stock at prices established by our board of directors from time to time, including pursuant to the terms of the Company’s Distribution Reinvestment Plan (“DRIP”). Our board of directors established the prices from time to time primarily based on the net asset value of our real estate portfolio, which in turn reflected periodic real estate appraisals and valuations of our debt received from third-party consultants, adjustments for the fair value of non-real estate assets, and input from our management. Since 2015, we issued a total of 19.0 million shares of our Common Stock.
We also instituted a share redemption program to provide an opportunity for purchasers of our Common Stock in the private offerings to request some or all of their shares of our Common Stock to be repurchased, subject to certain restrictions and limitations, at a price equal to or at a discount from the current price, as determined by our board of directors, in effect as of the date of the redemption. Since 2015, we redeemed a total of 0.5 million shares of our Common Stock.
As of January 10, 2020, we terminated our DRIP and share redemption program, in each case, effective February 10, 2020.
162
Table of Contents
The following table presents a summary of Common Stock issuances and redemptions (in thousands of shares):
Historical Share Activity
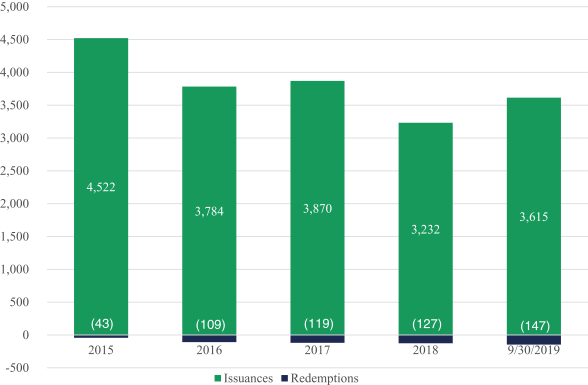
| Thousands of Shares | ||||||||||||||||
| Period |
Shares of Common Stock Outstanding at Beginning of Period |
Issuances | Redemptions | Shares of Common Stock Outstanding at End of Period |
||||||||||||
| 2015 |
7,004 | 4,522 | (43 | ) | 11,483 | |||||||||||
| 2016 |
11,483 | 3,784 | (109 | ) | 15,158 | |||||||||||
| 2017 |
15,158 | 3,870 | (119 | ) | 18,909 | |||||||||||
| 2018 |
18,909 | 3,232 | (127 | ) | 22,014 | |||||||||||
| September 30, 2019 |
22,014 | 3,615 | (147 | ) | 25,482 | |||||||||||
| Total |
19,023 | (545 | ) | |||||||||||||
163
Table of Contents
POLICIES WITH RESPECT TO CERTAIN ACTIVITIES
The following is a discussion of certain of our investment, financing, and other policies. These policies have been determined by our board of directors and, in general, may be amended or revised from time to time by our board of directors without a vote of our stockholders.
Investment Policies
Investments in Real Estate or Interests in Real Estate
We will conduct all of our investment activities through the OP and its subsidiaries. Our objective is to maximize stockholder value by generating attractive risk-adjusted returns through acquiring, owning, and managing primarily single-tenant commercial real estate properties that are net leased on a long-term basis to a diversified group of tenants. For a discussion of our properties and our acquisition and other strategic objectives, see “Business and Properties.”
We expect to pursue our objective primarily through the ownership by the OP of our existing properties and other acquired properties and assets. We focus on investing in real estate that is operated by creditworthy single tenants in industries characterized by positive business drivers and trends, where the properties are an integral part of the tenants’ businesses and there are opportunities to secure long-term leases. We seek to acquire primarily freestanding, single-tenant commercial real estate properties located in the United States, with a target size for individual property acquisitions of up to approximately $100 million. We generally seek to invest in properties that are under lease and fully occupied at the time of acquisition. We also seek to maintain our portfolio’s diversification by property type, geography, tenant, and industry in an effort to reduce fluctuations in income caused by under-performing individual real estate assets or adverse economic conditions affecting an entire industry or geographic region. We intend to primarily acquire portfolios and assets over time, which will generally not result in any one tenant representing more than 5% of ABR. While we consider these criteria when making investments, we may also consummate opportunistic investments in managing our business and make investments that do not meet one or more of these criteria if we believe the opportunity presents an attractive risk-adjusted return. In addition, we may purchase assets for long-term investment, expand and improve the properties we presently own or other acquired properties, or sell such properties, in whole or in part, when circumstances warrant. We intend to engage in future investment activities in a manner that is consistent with the maintenance of our status as a REIT for U.S. federal income tax purposes.
We may also participate with third parties in property ownership, through joint ventures or other types of co-ownership. These types of investments may permit us to own interests in larger assets without unduly reducing our diversification and, therefore, provide us with flexibility in structuring our portfolio. We will not, however, enter into a joint venture or other partnership arrangement to make an investment that would not otherwise meet our investment policies.
Equity investments in acquired properties may be subject to existing mortgage financing and other indebtedness or to new indebtedness which may be incurred in connection with acquiring or refinancing these properties. Debt service on such financing or indebtedness will have a priority over any distributions with respect to our Common Stock. Investments are also subject to our policy not to be treated as an “investment company” under the Investment Company Act.
Securities of or Interests in Persons Primarily Engaged in Real Estate Activities and Other Issuers
Subject to the percentage of ownership limitations and the income and asset tests necessary for REIT qualification, we may invest in securities of other REITs, other entities engaged in real estate activities, or securities of other issuers, including for the purpose of exercising control over such entities. We do not intend that our investments in securities will require us to register as an investment company under the Investment Company Act, and we would intend to divest such securities before any such registration would be required.
164
Table of Contents
Investments in Other Securities
Other than as described above, we do not intend to invest in any additional securities such as bonds, preferred stocks, or common stock.
Dispositions
To capture increased value or avoid value degradation due to unfavorable changes in the critical nature of an asset, underlying real estate fundamentals, tenant credit profile, or lease and guarantee structures, we may selectively dispose of any of our properties that we determine are not suitable for long-term investment purposes based upon management’s review of our portfolio. In addition, on a selective basis, we may acquire and re-sell properties that we purchase in connection with the acquisition of a larger portfolio of properties. If properties are being sold on an all or none basis, we may purchase some properties that do not meet our desired investment criteria to acquire a larger portfolio of properties we wish to hold for the long term. In each case, we will ensure that such action would be in our best interest and consistent with our intention to qualify for taxation as a REIT.
Financings and Leverage Policy
We anticipate using a number of different sources to finance our acquisitions and operations, including cash flows from operations, asset sales, seller financing, issuance of debt securities, private financings (such as additional bank credit facilities, which may or may not be secured by our assets), property-level mortgage debt, common or preferred equity issuances, or any combination of these sources, to the extent available to us, or other sources that may become available from time to time. Historically, we primarily have used our Revolving Credit Facility to finance property acquisitions, and we expect to continue to utilize our Revolving Credit Facility as well as the debt private placement, bank term notes, and bond markets as principal forms of debt capital. We may also assume debt when conducting a transaction or we may mortgage existing properties. While we have not used mortgage financing as a strategic source of debt capital for acquisitions, we have occasionally utilized mortgage financing for a single property or a group of related properties acquired from a single seller.
Any debt that we incur may be recourse or non-recourse and may be secured or unsecured. We also may take advantage of joint venture or other partnering opportunities as such opportunities arise in order to acquire properties that would otherwise be unavailable to us. We may use the proceeds of our borrowings to acquire assets, to refinance existing debt, or for general corporate purposes.
Although we are not required to maintain a particular leverage ratio, we generally intend to maintain on a sustained basis a level of net debt that is generally less than six times our annualized adjusted EBITDAre. However, from time to time, our ratio of net debt to our annualized adjusted EBITDAre may exceed six times. We intend to use debt as a means of providing additional funds for the acquisition of assets, to refinance existing debt, or for general corporate purposes. Our Charter and Second Amended and Restated Bylaws will not limit the amount of debt that we may incur, and our board of directors has not adopted a policy limiting the total amount of debt that we may incur.
Our board of directors will consider a number of factors in evaluating the amount of debt that we may incur. Our board of directors may from time to time modify its views regarding the appropriate amount of debt financing in light of then-current economic conditions, relative costs of debt and equity capital, market values of our properties, general conditions in the market for debt and equity securities, fluctuations in the market price of our Common Stock (including our Class A Common Stock), growth and investment opportunities, and other factors. Our decision to use leverage in the future to finance our assets will be at our discretion and will not be subject to the approval of our stockholders.
165
Table of Contents
Equity Capital Policies
To the extent that our board of directors determines to obtain additional capital, we may issue equity securities, including senior securities, retain earnings (subject to provisions in the Code requiring distributions of income to maintain REIT qualification), or pursue a combination of these methods.
Existing stockholders will have no preemptive right to common or preferred stock or units issued in any securities offering by us, and any such offering might cause a dilution of a stockholder’s investment in us. Although we have no current plans to do so, we may in the future issue shares of our Common Stock (including our Class A Common Stock) or OP Units in connection with acquisitions of property.
We may, under certain circumstances, purchase shares of our Common Stock, including shares of our Class A Common Stock, or other securities in the open market or in private transactions with our stockholders, provided that those purchases are approved by our board of directors. We previously maintained a share redemption program under which we repurchased shares of our Common Stock that had been sold in our prior private offerings. Our previous share redemption program was terminated on January 10, 2020. Our board of directors has no present intention of causing us to repurchase any shares of our Common Stock (including our Class A Common Stock) or other securities after the closing of this offering, and any such action would only be taken in conformity with applicable federal and state laws and the applicable requirements for qualification as a REIT.
Prior to this offering, we issued Common Stock in our prior private offerings and expect to issue Common Stock in connection with the closing of the Internalization. We have also issued OP Units in exchange for property and expect to issue OP Units in connection with the closing of the Internalization. We may issue OP Units in connection with potential future acquisitions.
We have not engaged in trading, underwriting, or agency distribution or sale of securities of other than the OP and do not intend to do so.
Code of Ethics
Our board of directors has adopted the Code of Ethics, which seeks to identify and mitigate conflicts of interest between our employees, directors, and officers and our Company. However, we cannot assure you that these policies or provisions of law will always be successful in eliminating or minimizing the influence of such conflicts, and if they are not successful, decisions could be made that might fail to reflect fully the interests of stockholders.
Interested Director Transactions
Pursuant to the MGCL, a contract or other transaction between us and a director or between us and any other corporation or other entity in which any of our directors is a director or has a material financial interest is not void or voidable solely because of such common directorship or interest, the presence of such director at the meeting at which the contract or transaction is authorized, approved, or ratified or the counting of the director’s vote in favor thereof, if:
| • | the fact of the common directorship or interest is disclosed or known to our board of directors or a committee of our board of directors, and our board of directors or such committee authorizes, approves, or ratifies the contract or transaction by a majority of disinterested directors, even if the disinterested directors constitute less than a quorum; |
| • | the fact of the common directorship or interest is disclosed or known to our stockholders entitled to vote thereon, and the contract or transaction is authorized, approved, or ratified by a majority of the votes cast by the stockholders entitled to vote other than the votes of shares owned of record or beneficially by the interested director or corporation, firm, or other entity; or |
| • | the contract or transaction is fair and reasonable to us. |
166
Table of Contents
Upon completion of this offering, we will adopt the related person policy. Our related person policy requires that a “related person” (as defined as in paragraph (a) of Item 404 of Regulation S-K) must promptly disclose to us any “related person transaction” (defined as any transaction that is anticipated would be reportable by us under Item 404(a) of Regulation S-K in which we were or are to be a participant and the amount involved exceeds $120,000 and in which any related person had or will have a direct or indirect material interest) and all material facts with respect thereto. We will then promptly communicate that information to our board of directors. No related person transaction will be executed without the approval or ratification of our board of directors or a duly authorized committee of our board of directors. It is our policy that directors interested in a related person transaction will recuse themselves from any vote on a related person transaction in which they have an interest.
Reporting Policies
We intend to make available to our stockholders our annual reports, including our audited financial statements. We are subject to the information reporting requirements of the Exchange Act. Pursuant to those requirements, we are required to file annual and periodic reports, proxy statements, and other information, including audited financial statements, with the SEC.
167
Table of Contents
DESCRIPTION OF THE SECOND AMENDED AND RESTATED LIMITED LIABILITY COMPANY AGREEMENT OF BROADSTONE NET LEASE, LLC
A summary of the material terms and provisions of the Second Amended and Restated Limited Liability Company Agreement of Broadstone Net Lease, LLC, which we refer to as the “OP Agreement,” is set forth below. This summary is not complete and is subject to and qualified in its entirety by reference to the applicable provisions of New York law and the OP Agreement. For more detail, please refer to the OP Agreement itself, a copy of which will be filed as an exhibit to the registration statement of which this prospectus is a part.
General
The OP, Broadstone Net Lease, LLC, is a New York limited liability company that was formed on August 8, 2006. We are the sole managing member of the OP. We will contribute the net proceeds received by us from this offering to the OP in exchange for OP Units therein. Assuming completion of the Recapitalization, the Internalization, and this offering, and assuming the earnout consideration in the Internalization is paid in full, as of September 30, 2019, on a pro forma basis, we owned approximately % of the interests in the OP (or % if the underwriters exercise their option to purchase additional shares in full). We own substantially all of our assets and conduct substantially all of our operations through the OP. Our interest in the OP generally entitles us to share in cash distributions from, and in the profits and losses of, the OP in proportion to our percentage ownership.
Some of our property acquisitions to date have been, and future property acquisitions could be, financed by issuing OP Units in exchange for property owned by third-parties. Such third parties are then entitled to share in cash distributions from, and in the profits and losses of, the OP in proportion to their respective percentage interests in the OP if and to the extent cash distributions are authorized by us as the managing member. These OP Units generally are exchangeable for cash or, at our election, shares of our Common Stock at a one-to-one ratio, subject to adjustment and limitation in certain circumstances, from time to time when the OP Units are issued.
The provisions of the OP Agreement described below and elsewhere in the prospectus will be in effect upon the completion of this offering. We do not intend to list the OP Units on any exchange or any national market system.
Purpose and Management of the OP
The OP is formed for the purpose of conducting any business that may be lawfully conducted by a limited liability company under New York law. The OP may enter into any partnership, joint venture, or other similar arrangement to engage in any business that is legally permitted under New York law, including anything necessary or incidental to the foregoing. However, so long as we determine to continue to qualify as a REIT, the business of the OP is limited to and is required to be conducted in a manner as to permit us at all times to be classified as a REIT for U.S. federal income tax purposes.
Except as otherwise expressly provided in the OP Agreement, we, as the managing member, have the exclusive right and full authority and responsibility to manage and operate the OP’s business. In particular, we are under no obligation to consider the tax consequences to non-managing members when making decisions for the benefit of the OP but we are expressly permitted to take into account our tax consequences. Non-managing members generally do not have any right to participate in or exercise control or management power over the business and affairs of the OP or the power to sign documents for or otherwise bind the OP. The non-managing members have no power to remove us as managing member.
Fiduciary Responsibilities
Our directors and officers have duties under applicable Maryland law to manage us in a manner consistent with the best interests of our Company. At the same time, we, as managing member, have fiduciary duties under applicable New York law to manage the OP in a manner beneficial to the OP and its members. Our duties, as managing member, to the OP and its non-managing members, therefore, may come into conflict with the duties of our directors and officers to our Company.
168
Table of Contents
Pursuant to the OP Agreement, we act on behalf of the OP, its equityholders (and, to the extent separate, our equityholders) and generally are under no obligation to consider the separate interests of the non-managing members in the OP (including, without limitation, the tax consequences to such non-managing members or their assignees) in deciding whether to cause the OP to take (or decline to take) any actions. Provided that we act in good faith and pursuant to our authority under the OP Agreement, any decisions or actions taken or not taken in accordance with the terms of the OP Agreement will not constitute a breach of any duty owed to the OP or its non-managing members by law or equity, fiduciary, or otherwise. In addition, as a general matter, the OP Agreement expressly limits our liability by providing that we, as managing member, and our officers and directors, are not liable for monetary or other damages to the OP, the non-managing members, or assignees for losses sustained, liabilities incurred, or benefits not derived as a result of errors in judgment or mistakes of fact or law or of any act or omission unless we acted in bad faith and the act or omission was material to the matter giving rise to the loss, liability, or benefit not derived.
Term
The term of the OP commenced on August 8, 2006, and will continue until the earlier of:
| • | an event of our withdrawal, as the managing member, (other than an event of bankruptcy), unless within 90 days after the withdrawal, the written consent of the non-managing members, as defined in the OP Agreement, to continue the business of the OP and to the appointment, effective as of the date of withdrawal, of a substitute managing member is obtained; |
| • | an election to dissolve the OP by us, as managing member, in our sole and absolute discretion; |
| • | entry of a decree of judicial dissolution of the OP pursuant to New York law; |
| • | the sale of all or substantially all of the assets and properties of the OP for cash or for marketable securities; or |
| • | entry of a final and non-appealable judgment by a court of competent jurisdiction ruling that we are bankrupt or insolvent, or entry of a final and non-appealable order for relief against us, under any federal or state bankruptcy or insolvency laws, unless prior to or at the time of the entry of such judgment or order, the consent of a majority of the holders of the OP Units to continue the business of the OP and to the appointment, effective as of a date prior to the date of such order or judgment, of a substitute managing member is obtained. |
Issuance of Additional OP Units and Preferred Units
We, as the managing member, are authorized to cause the OP to issue additional OP Units or other membership interests to its members, including us and our affiliates, or other persons without the approval of any non-managing members. These OP Units may be issued in one or more classes or in one or more series of any class, with designations, preferences, and relative, participating, optional, or other special rights, powers, and duties, including rights, powers, and duties senior to one or more other classes of membership interests (including OP Units held by us), as determined by us in our sole and absolute discretion without the approval of any non-managing member, subject to limitations described below.
No OP Unit or interest may be issued to us as managing member unless:
| • | the OP issues OP Units or other membership interests in connection with the grant, award, or issuance of shares or other equity interests in us having designations, preferences, and other rights so that the economic interests attributable to the newly issued shares or other equity interests in us are substantially similar to the designations, preferences, and other rights, except voting rights, of the OP Units or other membership interests issued to us and we contribute to the OP the proceeds received by us from the issuance of such shares or other equity securities; |
| • | we make an additional capital contribution to the OP; or |
169
Table of Contents
| • | the OP issues the additional OP Units or other membership interests to all members holding OP Units or other membership interests in the same class or series in proportion to their respective percentage interests in that class or series. |
Conflicts of Interest
Conflicts of interest exist or could arise in the future as a result of our relationships with the OP or any non-managing member of the OP. Our directors and officers have duties to our Company and our stockholders under applicable Maryland law in connection with their management of our Company. At the same time, we, as sole managing member, have fiduciary duties to the OP and to its non-managing members under New York law in connection with the management of the OP. Our duties as sole managing member of the OP and its members may come into conflict with the duties of our directors and officers to our Company and our stockholders.
Limitation on Liability and Indemnification
We, as the managing member of the OP, and our directors and officers are not liable for monetary or other damages to the OP, any members or assignees for losses sustained, liabilities incurred, or benefits not derived as a result of errors in judgment or mistakes of fact or law or of any act or omission, unless we acted in bad faith and the act or omission was material to the matter giving rise to the loss, liability, or benefit not derived. To the fullest extent permitted by applicable law, the OP Agreement indemnifies us, as managing member, any non-managing members, any of our officers, directors, trustees, managers, members, stockholders, or partners and other persons as we may designate from and against any and all losses, claims, damages, liabilities, joint or several, expenses, judgments, fines, settlements, and other amounts incurred in connection with any claims, demands, actions, suits, or proceedings relating to us, the OP, or the operations of or ownership of property by the OP, unless it is established by a final determination of a court of competent jurisdiction that:
| • | the act or omission of the indemnitee was material to the matter giving rise to the proceeding and either was committed in bad faith or was the result of active and deliberate dishonesty; |
| • | the indemnitee actually received an improper personal benefit in money, property, or services; or |
| • | in the case of any criminal proceeding, the indemnitee had reasonable cause to believe that the act or omission was unlawful. |
OP Expenses
The OP Agreement provides that the OP is responsible for and pays directly, or reimburses any person that paid on the OP’s behalf, any expenses related to the OP’s (i) selection, evaluation, structuring, negotiation, acquisition, and disposition of, and investment in, properties acquired by the OP, including but not limited to legal fees and expenses, brokerage commissions, financing fees and expenses, costs of financial analysis, costs of appraisals and surveys, nonrefundable option payments, architectural and engineering reports, environmental and asbestos audits, and title insurance and escrow fees, and (ii) all other operating expenses of the OP and us, including taxes, fees, and certain expenses of our board of directors, annual and other periodic fees of auditors and counsel, insurance, litigation, and capital and extraordinary expenditures not reimbursed by tenants of the OP’s properties.
Distributions
The OP Agreement requires the distribution of available cash on at least a quarterly basis. Available cash is, with respect to any period for which such calculation is being made, cash of the OP, regardless of source, including capital contributions and loans to the OP, as determined by us to be appropriate for distribution in our sole and absolute discretion.
170
Table of Contents
Unless we otherwise specifically agree in the OP Agreement or in an agreement entered into at the time a new class or series is created, no membership interest will be entitled to a distribution in preference to any other membership interest. A non-managing member will not in any event receive a distribution of available cash with respect to an OP Unit for a quarter or shorter period if the member is entitled to receive a distribution out of that same available cash with respect to a share of our Company for which that OP Unit has been exchanged or redeemed.
We will make reasonable efforts, as determined by us in our sole and absolute discretion and consistent with our qualification as a REIT, to distribute available cash:
| • | to the non-managing members so as to preclude the distribution from being treated as part of a disguised sale for U.S. federal income tax purposes; and |
| • | to us, as managing member, in an amount sufficient to enable us to pay stockholder dividends that will satisfy our requirements for qualifying as a REIT and to avoid any federal income or excise tax liability for us. |
Upon the liquidation of the OP, after payment of debts and obligations, any remaining assets of the OP will be distributed to the holders of OP Units that are entitled to any preference in distribution upon liquidation in accordance with the rights of any such class or series, and the balance, if any, will be distributed to the members in accordance with their capital accounts, after giving effect to all contributions, distributions, and allocations for all periods.
Allocation of Net Income and Net Loss
Net income and net loss of the OP are determined and allocated with respect to each taxable year of the OP. Except as otherwise provided in the OP Agreement, an allocation of a share of net income or net loss is treated as an allocation of the same share of each item of income, gain, loss, or deduction that is taken into account in computing net income or net loss. Except as otherwise provided in the OP Agreement, including with respect to special allocations with respect to LTIP Units, net income and net loss are allocated to the managing member and the non-managing members in accordance with their respective percentage interests in the class at the end of each fiscal year. The OP Agreement contains provisions for special allocations intended to comply with certain regulatory requirements, including the requirements of Treasury Regulations Sections 1.704-1(b), 1.704-2 and 1.752-3(a). See “Material U.S. Federal Income Tax Considerations.”
Assignment and Transfer of OP Units
We, as managing member, generally may not transfer any of our OP Units in the OP, or voluntarily withdraw as the managing member of the OP, except in connection with (i) a merger, consolidation, or other combination with or into another person following the consummation of which the equity holders of the surviving entity are substantially identical to our stockholders, or as otherwise permitted by the OP Agreement, or (ii) a merger, consolidation, or other combination with or into another person or a sale of all or substantially all of our assets or any reclassification, recapitalization, or change of our outstanding shares that is approved by more than 50% of the OP Units (including those held by us) and pursuant to which each member receives or has the right to receive cash, securities, or other property for each OP Unit owned by such member equal to the product of conversion factor calculated pursuant to the OP Agreement and the per-share amount paid to a stockholder.
With certain limited exceptions, the non-managing members may not transfer their interests in the OP, in whole or in part, without our written consent, which consent may be withheld in our sole and absolute discretion.
Even if our consent is not required for a transfer by a non-managing member, we, as managing member, may prohibit the transfer of OP Units by a non-managing member unless we receive a written opinion of legal
171
Table of Contents
counsel that the transfer would not require filing of a registration statement under the Securities Act and would not otherwise violate any federal or state securities laws or regulations applicable to the OP or the OP Units. Further, except for certain limited exceptions, no transfer of OP Units by a non-managing member, without our prior written consent, may be made if:
| • | in the opinion of legal counsel for the OP, there is a significant risk that the transfer would cause the OP to cease to be classified as a partnership for U.S. federal income tax purposes; |
| • | in the opinion of legal counsel for the OP, there is a significant risk that the transfer would adversely affect our ability to continue to qualify as a REIT or would subject us to certain additional taxes; or |
| • | such transfer is effectuated through an “established securities market” or a “secondary market (or the substantial equivalent thereof)” within the meaning of Section 7704 of the Code. |
Except with our consent to the admission of the transferee as a non-managing member, no transferee shall have any rights by virtue of the transfer other than the rights of an assignee, and will not be entitled to vote OP Units in any matter presented to the non-managing members for a vote. We, as managing member, will have the right to consent to the admission of a transferee of the interest of a non-managing member, which consent may be given or withheld by us in our sole and absolute discretion.
Redemption Rights for Non-Managing Members
As a general rule, each non-managing member may exercise a redemption right to redeem his or her OP Units at any time beginning six months following the date of the issuance of the OP Units held by the non-managing member. If we give the non-managing members notice of our intention to make an extraordinary distribution of cash or property to our stockholders or effect a merger, a sale of all or substantially all of our assets, or any other similar extraordinary transaction, each non-managing member may exercise its unit redemption right, regardless of the length of time it has held its OP Units. This unit redemption right begins when such notice is given, which must be at least 20 business days before the record date for determining stockholders eligible to receive the distribution or to vote upon the approval of the merger, sale or other extraordinary transaction, and ends on the record date. We, in our sole discretion, may shorten the required notice period of not less than 20 business days prior to the record date to determine the stockholders eligible to vote upon a distribution or extraordinary transaction. If no record date is applicable, we may shorten the required notice period of not less than 20 business days before a distribution in our sole and absolute discretion.
A non-managing member may exercise its unit redemption right by giving written notice to the OP and us. The OP Units specified in the notice generally will be redeemed on the twentieth business day following the date we received the redemption notice or, in the case of the exercise of a unit redemption right in connection with an extraordinary transaction, the date the OP and we received the redemption notice. A non-managing member may not exercise the unit redemption right for fewer than 1,000 OP Units, or if the non-managing member holds fewer than 1,000 OP Units, all of the OP Units held by that non-managing member. The redeeming member will have no right to receive any distributions paid on or after the redemption date with respect to those OP Units redeemed.
Unless we elect to assume and perform the OP’s obligation with respect to the unit redemption right, as described below, a non-managing member exercising a unit redemption right will receive cash from the OP in an amount equal to the Market Value (as defined below) of shares of our Common Stock for which the OP Units would have been redeemed if we had assumed and satisfied the OP’s obligation by paying shares of our Common Stock, as described below. “Market Value” of our Common Stock for this purpose (assuming a market then exists) means the average of the closing trading price of our Class A Common Stock on the NYSE for the 10 trading days before the day on which we received the redemption notice.
We may elect to assume and perform the OP’s obligation to acquire the OP Units being redeemed in exchange for either cash in the amount specified above or a number of shares of our Common Stock equal to the
172
Table of Contents
number of OP Units offered for redemption, adjusted as specified in the OP Agreement to take into account prior share dividends or any subdivisions or combinations of our Common Stock. As managing member, we will have the sole discretion to elect whether the redemption right will be satisfied by us in cash or shares of our Common Stock.
A non-managing member may not exercise its unit redemption right if delivery of shares of our Common Stock by us would be prohibited either under the provisions of our Charter or under applicable federal or state securities laws, in each case, regardless of whether we would in fact elect to assume and satisfy the unit redemption right with shares.
Notwithstanding the foregoing, in the event of an extraordinary distribution of cash or property to our stockholders or if we effect a merger, a sale of all or substantially all of our assets, or any other similar extraordinary transaction, we will have the right, exercisable in our sole and absolute discretion, to require the redemption rights of all holders of OP Units to be deemed to be automatically exercised and assumed by us for shares of our Common Stock, effective upon the date on which such transaction is consummated.
LTIP Units
In addition to the OP Units, the OP has authorized a class of LTIP Units. LTIP Units are a special class of membership units in the OP that are structured to qualify as “profits interests” for tax purposes, with the result that at issuance they have no capital account in the OP. Following completion of this offering, we may at any time cause the OP to issue LTIP Units to our directors, officers, employees, and consultants. Any LTIP Units issued by the OP may be subjected to vesting requirements as determined by the Compensation Committee of our board of directors.
Vested LTIP Units receive the same quarterly per unit profit distributions as the other outstanding OP Units in the OP. Unvested LTIP Units do not receive distributions until they become vested, at which time they are entitled to distributions plus catch-up distributions for the period during which such units were not vested. Initially, each LTIP Unit will have a capital account of zero, and, therefore, the holder of the LTIP Unit would receive nothing if the OP were liquidated immediately after the LTIP Unit is awarded. However, the OP Agreement requires that “book gain” or economic appreciation in our assets realized by the OP, whether as a result of an actual asset sale or upon the revaluation of our assets, as permitted by applicable Treasury Regulations, be allocated first to LTIP Units until the capital account per LTIP Unit is equal to the capital account per OP Unit. The applicable Treasury Regulations and the OP Agreement provide that assets of the OP may be revalued upon specified events, including upon additional capital contributions by us or other members of the OP, upon a distribution by the OP to a member in redemption of OP Units, upon the liquidation of the OP, or upon a later issuance of additional LTIP Units. Each LTIP Unit is convertible by the OP or by the holder into OP Units at any time, and upon equalization of the capital account of an LTIP Unit with the per unit capital account of the OP Units (and full vesting of the LTIP Unit, if such unit is subject to vesting), the LTIP Unit will be convertible into one OP Unit, subject to certain exceptions and adjustments. There is a risk that an LTIP Unit will never become convertible into one OP Unit because of insufficient gain realization to equalize capital accounts, and, therefore, the value that a holder will realize for a given number of vested LTIP Units may be less than the value of an equal number of shares of our Common Stock.
Amendment of OP Agreement
In general, other than as described below, the OP Agreement may only be amended exclusively by us, as managing member, without the consent of the non-managing members. Amendments to the OP Agreement requiring approval of the non-managing members may be proposed by us, as managing member, or by any non-managing member holding membership interests representing 25% or more of the percentage interest of the OP Units entitled to vote thereon.
173
Table of Contents
The approval of a majority of the membership interests held by non-managing members is necessary to, among other things:
| • | amend provisions restricting our power to conduct businesses other than owning membership interests of the OP and the relationship of our shares to OP Units; |
| • | amend provisions restricting our power to issue or repurchase shares without causing a simultaneous issuance or repurchase of units by the OP; |
| • | amend provisions regarding the transfer of membership interests held by us; |
| • | amend provisions regarding the transfer of membership interests held by non-managing members; |
| • | amend provisions regarding the unit redemption right of the non-managing members; |
| • | adopt amendments that would convert a non-managing member’s interest into a managing member’s interest; |
| • | adopt amendments that would modify the limited liability of a non-managing member; |
| • | amend provisions regarding or adopt amendments that would alter the interest of a member in profits or losses, or the right to receive any distributions, except as permitted under the OP Agreement with respect to the admission of new members or the issuance of additional OP Units; or |
| • | adopt amendments that would impose any obligation to make capital contributions. |
Tax Matters
The OP Agreement provides that we, as the managing member of the OP, is the “partnership representative” of the OP and, as such, has authority to handle tax audits and to make tax elections under the Code on behalf of the OP.
Mergers and Sales of Assets
Subject to the restrictions on our ability to transfer interests in the OP above under “—Assignment and Transfer of OP Units” we may and may cause the OP to engage in a merger, consolidation, or other combination transaction only if we have provided notice to the non-managing members at least 20 business days, or such shorter period as determined by us in our sole and absolute discretion, before the record date for determining stockholders eligible to vote upon the approval of the merger, consolidation, or other combination transaction.
174
Table of Contents
The following table sets forth certain information regarding the beneficial ownership of shares of our Common Stock (including our Class A Common Stock) and OP Units, which are exchangeable into our Common Stock on a one for one basis, immediately following the completion of this offering for (1) each person who is expected to be the beneficial owner of more than 5% of our outstanding Common Stock, (2) each of our directors and named executive officers, and (3) all of our directors and executive officers as a group. Each person named in the table has sole voting and investment power with respect to all of the shares of our Common Stock shown as beneficially owned by such person, except as otherwise set forth in the notes to the table.
The SEC has defined “beneficial ownership” of a security to mean the possession, directly or indirectly, of voting power and/or investment power over such security. A stockholder is also deemed to be, as of any date, the beneficial owner of all securities that such stockholder has the right to acquire within 60 days after that date through (1) the exercise of any option, warrant, or right, (2) the conversion of a security, (3) the power to revoke a trust, discretionary account, or similar arrangement, or (4) the automatic termination of a trust, discretionary account, or similar arrangement. In computing the number of shares beneficially owned by a person and the percentage ownership of that person, shares of our Common Stock (including our Class A Common Stock) and OP Units subject to options or other rights (as set forth above) held by that person that are exercisable as of the date hereof, or will become exercisable within 60 days thereafter, are deemed outstanding, while such shares are not deemed outstanding for purposes of computing percentage ownership of any other person. Unless otherwise indicated, the address of each named person is c/o Broadstone Net Lease, Inc., 800 Clinton Square, Rochester, New York, 14604. No shares beneficially owned by any executive officer or director have been pledged as security.
| Name of Beneficial Owner |
# of shares of our Class A Common Stock |
# of shares of our Common Stock |
# of OP Units |
Total # of shares of our Common Stock, including Class A Common Stock, and OP Units |
Percentage of all Common Stock |
|||||||||||||||
| Greater than 5% Stockholders |
||||||||||||||||||||
|
|
||||||||||||||||||||
| Directors and Named Executive Officers |
||||||||||||||||||||
| Amy L. Tait |
||||||||||||||||||||
| Christopher J. Czarnecki |
||||||||||||||||||||
| Ryan M. Albano |
||||||||||||||||||||
| Sean T. Cutt (1) |
||||||||||||||||||||
| John D. Moragne |
||||||||||||||||||||
| Laurie A. Hawkes |
||||||||||||||||||||
| David M. Jacobstein |
||||||||||||||||||||
| Agha S. Khan |
||||||||||||||||||||
| Shekar Narasimhan |
||||||||||||||||||||
| Geoffrey H. Rosenberger |
||||||||||||||||||||
| James H. Watters |
||||||||||||||||||||
| All Directors and Executive Officers as a Group (11 persons) |
||||||||||||||||||||
| (1) |
shares of our Common Stock owned by Mr. Cutt are currently pledged as security under a loan agreement, which is expected to be paid off in full upon completion of this offering. |
175
Table of Contents
DESCRIPTION OF OUR CAPITAL STOCK
The following is a summary of the material terms of our capital stock, as of the completion of this offering, and is qualified in its entirety by our Charter and our Second Amended and Restated Bylaws, each of which will be filed as an exhibit to the registration statement of which this prospectus is a part, and applicable Maryland law. For a complete description, you are urged to review in their entirety our Charter and our Second Amended and Restated Bylaws, and applicable Maryland law. See “Where You Can Find More Information.”
General
Prior to the completion of this offering, our Charter will authorize the issuance of an aggregate of 520,000,000 shares of capital stock, of which 500,000,000 shares will be designated as Common Stock with a par value of $0.001 per share, and 20,000,000 shares will be designated as preferred stock with a par value of $0.001 per share. Of our 500,000,000 authorized shares of Common Stock, shares will be reclassified and further designated as Class A Common Stock and are Common Stock without further designation. Immediately prior to the Recapitalization, we had approximately million shares of Common Stock outstanding and no outstanding shares of Class A Common Stock or preferred stock. Upon completion of this offering, shares of Common Stock (including our Class A Common Stock) will be issued and outstanding, and no shares of preferred stock will be issued and outstanding.
Our board of directors, with the approval of a majority of our entire board of directors and without any action by our stockholders, may amend our Charter from time to time to increase or decrease the aggregate number of shares of capital stock or the number of shares of capital stock of any class or series that we have authority to issue. In addition, our Charter authorizes our board of directors to classify and reclassify any unissued shares of our Common Stock and preferred stock into other classes or series of stock and to set, subject to the restrictions on ownership and transfer of our stock in our Charter, the terms, the preferences, conversion, or other rights, voting powers, restrictions, limitations as to dividends, or other distributions, qualifications, and terms and conditions of redemption for each class or series. Thus, our board of directors could authorize the issuance of shares of Common Stock or preferred stock with terms and conditions which provide the holders thereof with specified dividend payments and payments upon liquidation prior or senior to those of the Common Stock (including our Class A Common Stock) and which could have the effect of delaying, deferring, or preventing a transaction or a change in control that might involve a premium price for our Common Stock (including our Class A Common Stock) or that our common stockholders otherwise believe to be in their best interests.
Common Stock
All holders of shares of our Common Stock (including our Class A Common Stock) are entitled to one vote per share on all matters voted on by stockholders, including election of our directors. Prior to the Class A Conversion, the Class A Common Stock and Common Stock will vote together as one class, except that the holders of Class A Common Stock, voting as a separate class, are required to approve any amendment to our Charter which will affect such holders differently than the holders of our Common Stock. Directors are elected by a plurality of the votes cast at a meeting in which directors are being elected and at which a quorum is present. Our Charter does not provide for cumulative voting in the election of our directors, which means that the holders of a majority of the outstanding shares of our Common Stock (including our Class A Common Stock) can effectively elect all of the directors then standing for election, and the holders of the remaining shares will not be able to elect any directors. Subject to any preferential rights of any outstanding class or series of preferred stock (or other capital stock), the holders of shares of our Common Stock (including our Class A Common Stock) are entitled to such distributions as may be authorized from time to time by our board of directors and declared by us out of legally available funds and, in the event of our liquidation, dissolution, or winding up, are also entitled to share ratably in our assets legally available for distribution to our stockholders after payment of, or adequate provision for, all of our known debts and liabilities. All holders of our Common Stock (including our Class A Common Stock) will share equally in any distributions authorized by our board of directors and declared by us.
176
Table of Contents
Our common stockholders have no preference, exchange, sinking fund, or redemption rights and have no preemptive rights to purchase or subscribe for any of our capital stock. Pursuant to the Class A Conversion, each share of our Class A Common Stock will automatically convert into one share of our Common Stock 180 days after the completion of this offering. Otherwise, our common stockholders will have no conversion rights. Our Charter does not include a provision, as permitted by the MGCL, providing that our stockholders are not entitled to exercise the rights of an objecting stockholder, sometimes referred to as “appraisal rights.” However, the MGCL further provides that these rights are not available to holders of stock of any class or series listed on a national securities exchange. Accordingly, the Class A Common Stock will not be entitled to these rights upon issuance, and the Common Stock will be entitled to these rights (applicable only under limited circumstances, including a merger, consolidation, share exchange, or transfer of assets) for a period from the closing of this offering until the Class A Conversion. Subject to the restrictions on ownership and transfer of our stock in our Charter, holders of shares of our Common Stock (including our Class A Common Stock) will initially have equal dividend, liquidation, and other rights. Because our operating assets will be held by the OP or its wholly-owned subsidiaries, these subsidiaries may be able to merge or transfer all or substantially all of their assets without the approval of our stockholders. Stockholders are not liable for our acts or obligations due to their status as stockholders.
Our board of directors has authorized the issuance of shares of our capital stock without certificates. Shares of our Common Stock (including our Class A Common Stock) are and will be held in “uncertificated” form, which eliminates the physical handling and safekeeping responsibilities inherent in owning transferable share certificates and eliminates the need to return a duly executed share certificate to effect a transfer. Information regarding restrictions on the transferability of our shares of Common Stock (including our Class A Common Stock) that, under Maryland law, would otherwise have been required to appear on our share certificates are instead furnished to our stockholders upon request and without charge. We maintain a stock ledger that contains the name and address of each stockholder and the number of shares that the stockholder holds.
Pursuant to the OP Agreement, as a general rule, each non-managing member may exercise a redemption right to redeem his or her OP Units for either cash or, at our election, a number of shares of our Common Stock at any time beginning six months following the date of the issuance of the OP Units held by the non-managing member. See “Description of the Second Amended and Restated Limited Liability Company Agreement of Broadstone Net Lease, LLC—Redemption Rights for Non-Managing Members.”
Preferred Stock
Our Charter authorizes our board of directors to classify and reclassify any unissued shares of our Common Stock and preferred stock into other classes or series of stock. Prior to issuance of shares of each class or series, our board of directors is required by the MGCL and by our Charter to set, subject to the restrictions on ownership and transfer of our stock in our Charter, the terms, the preferences, conversion, or other rights, voting powers, restrictions, limitations as to dividends, or other distributions, qualifications, and terms and conditions of redemption for each class or series. Thus, our board of directors could authorize the issuance of shares of Common Stock or preferred stock with terms or conditions which provide the holders thereof with specified dividend payments and payments upon liquidation prior or senior to those of the Common Stock (including our Class A Common Stock) or have the effect of delaying, deferring, or preventing a transaction or change in control that might involve a premium price for such holders or otherwise be in their best interest. Our board of directors has no present plans to issue preferred stock, but may do so at any time in the future without stockholder approval.
Power to Issue Additional Shares of Common Stock and Preferred Stock
We believe that the power to issue additional shares of our Common Stock or preferred stock and to classify or reclassify unissued shares of our Common Stock or preferred stock and to issue the classified or reclassified shares provides us with increased flexibility in structuring possible future financings and acquisitions and in
177
Table of Contents
meeting other needs which might arise. These actions can be taken without action by our stockholders, unless stockholder approval is required by applicable law, the terms of any class or series of our stock or the rules of any stock exchange or automated quotation system on which our stock may be listed or traded. Although we have no present intention of doing so, we could issue a class or series of stock that would provide the holders thereof with specified dividend payments and payments upon liquidation prior or senior to those of the Common Stock (including our Class A Common Stock) or could delay, defer, or prevent a transaction or a change in control of our company that might involve a premium price for our stock or that our stockholders otherwise believe to be in their best interest. In addition, our issuance of additional shares of stock in the future could dilute the voting and other rights of your shares. See “Certain Provisions of Maryland Law and of Our Charter and Second Amended and Restated Bylaws—Anti-takeover Effect of Certain Provisions of Maryland Law and of Our Charter and Second Amended and Restated Bylaws” and “Risk Factors—Sales of substantial amounts of our Class A common stock or common stock in the public markets may dilute your voting power and your ownership interest in us.”
Restrictions on Ownership and Transfer of Shares of Capital Stock
For us to qualify as a REIT, no more than 50% in value of the outstanding shares of our stock may be owned, directly or indirectly through the application of certain attribution rules under the Code, by any five or fewer individuals, as defined in the Code to include specified entities, during the last half of any taxable year, excluding our first taxable year for which we elect to be taxed as a REIT. In addition, the outstanding shares of our stock must be owned by 100 or more persons during at least 335 days of a 12-month taxable year or during a proportionate part of a shorter taxable year, excluding our first taxable year for which we elect to be taxed as a REIT. In addition, we must meet requirements regarding the nature of our gross income to qualify as a REIT. One of these requirements is that at least 75% of our gross income for each calendar year must consist of rents from real property and income from other real property investments. Subject to special rules for leases to our taxable REIT subsidiaries, the aggregate of the rents received by the OP from any tenant will not qualify as rents from real property, which could result in our loss of REIT status, if we own, actually or constructively within the meaning of certain provisions of the Code, 10% or more of the ownership interests in that tenant. To assist us in preserving our status as a REIT, among other consequences, our Charter contains limitations on the ownership and transfer of shares of our stock which are intended to prohibit: (1) any person or entity from owning or acquiring, directly or indirectly, more than 9.8% of the value of the aggregate of our then outstanding capital stock (of any class or series) or more than 9.8% of the value or number of shares, whichever is more restrictive, of the aggregate of our then outstanding Common Stock (including our Class A Common Stock) and (2) any transfer of or other event or transaction with respect to shares of capital stock (including our Class A Common Stock) that would result in the beneficial ownership of our outstanding shares of capital stock by fewer than 100 persons. In addition, our Charter includes provisions intended to prohibit any transfer of, or other event with respect to, shares of our capital stock that would result in us being “closely held” within the meaning of Section 856(h) of the Code or otherwise failing to qualify as a REIT (including, but not limited to, ownership that would result in us owning an interest in a tenant if the income derived by us from such tenant would cause us to fail to satisfy any of the gross income requirements of Section 856(c) of the Code).
Our Charter provides that the shares of our capital stock of any class or series that, if transferred, would result in a violation of the ownership limits described above will be transferred automatically to a trust effective on the business day before the purported transfer of such shares of our capital stock. We will designate a trustee of the trust that will not be affiliated with us or the purported transferee or record holder. We will also name a charitable organization as beneficiary of the trust. The trustee will receive all distributions on the shares of our capital stock in the trust and will hold such distributions in trust for the benefit of the beneficiary. The trustee also will vote the shares of capital stock in the trust and, subject to Maryland law, will have the authority to rescind as void any vote cast by the intended transferee prior to our discovery that the shares have been transferred to the trust and to recast the vote in accordance with the desires of the trustee acting for the benefit of the charitable beneficiary. However, if we have already taken irreversible corporate action, then the trustee will not have the authority to rescind and recast the vote. Our Charter provides that the intended transferee will
178
Table of Contents
acquire no rights in such shares of capital stock, unless, in the case of a transfer that would cause a violation of the 9.8% ownership limits the transfer is exempted (prospectively or retroactively) by our board of directors from the ownership limits based upon receipt of information (including certain representations and undertakings from the intended transferee) that such transfer would not result in us being “closely held” within the meaning of Section 856(h) of the Code (without regard to whether the ownership interest is held during the last half of a taxable year), or otherwise failing to qualify as a REIT (including, but not limited to, ownership that would result in us owning an interest in a tenant that is described in Section 856(d)(2)(B) of the Code if the income derived by us from such tenant would cause us to fail to satisfy any of the gross income requirements of Section 856(c) of the Code). If the transfer to the trust would not be effective for any reason to prevent a violation of the foregoing limitations on ownership and transfer, then our Charter provides that the transfer of that number of shares that otherwise would cause the violation will be null and void, with the intended transferee acquiring no rights in such shares. In addition, our Charter provides that any transfer of shares of our capital stock that would result in shares of our capital stock being beneficially owned by fewer than 100 persons will be null and void and the intended transferee will acquire no rights in such shares of our capital stock.
Within 20 days of receiving notice from us that shares of our stock have been transferred to the trust, the trustee will sell the shares to a person designated by the trustee, whose ownership of the shares will not violate the above ownership limitations. Upon the sale, the interest of the charitable beneficiary in the shares sold will terminate and the trustee will distribute the net proceeds of the sale to the intended transferee and to the charitable beneficiary as follows. The intended transferee will receive an amount equal to the lesser of (1) the price paid by the intended transferee for the shares or, if the intended transferee did not give value for the shares in connection with the event causing the shares to be held in the trust (e.g., a gift, devise or other similar transaction), the closing or last sales price reported on the NYSE of the shares on the day of the event causing the shares to be held in the trust and (2) the price received by the trustee from the sale or other disposition of the shares. Any net sale proceeds in excess of the amount payable to the intended transferee will be paid immediately to the charitable beneficiary. If, prior to our discovery that shares have been transferred to the trust, the shares are sold by the intended transferee, then (1) the shares will be deemed to have been sold on behalf of the trust and (2) to the extent that the intended transferee received an amount for the shares that exceeds the amount described above that such intended transferee was entitled to receive, such excess will be paid to the trustee upon demand.
In addition, shares of our stock held in the trust will be deemed to have been offered for sale to us, or our designee, at a price per share equal to the lesser of (1) the price per share in the transaction that resulted in the transfer to the trust (or, in the case of a devise or gift, the closing or last sales price reported on the NYSE at the time of the devise or gift) and (2) 95% of the closing or last sales price reported on the NYSE on the date we, or our designee, accept the offer. We will have the right to accept the offer until the trustee has sold the shares. Upon a sale to us, the interest of the charitable beneficiary in the shares sold will terminate and the trustee will distribute the net proceeds of the sale to the intended transferee.
Any person who acquires or attempts or intends to acquire shares of our capital stock in violation of the foregoing restrictions or who would have owned shares of our capital stock that were transferred to any such trust is required to give immediate written notice to us or, in the case of a proposed or attempted transaction, at least 15 days’ prior written notice. In both cases, such persons must provide to us such other information as we may request to determine the effect, if any, of such event on our status as a REIT. The foregoing restrictions will continue to apply until our board of directors determines it is no longer in our best interest to attempt to, or to continue to qualify as a REIT or that compliance is no longer required in order for REIT qualification.
The ownership limits do not apply to a person or persons that our board of directors exempts (prospectively or retroactively) from the ownership limits upon receiving appropriate assurances from such person that our qualification as a REIT is not jeopardized. Any person who owns more than 5.0% (or such other percentage as required under the Code or the Treasury Regulations promulgated thereunder) of the outstanding shares of our capital stock during any taxable year will be asked to deliver a statement or affidavit setting forth, among other things, the number of shares of our capital stock beneficially owned.
179
Table of Contents
Any certificates representing shares of our stock will bear a legend referring to the restrictions on ownership and transfer of our stock described above.
These restrictions on ownership and transfer apply to all classes and series of our capital stock, including our Class A Common Stock and Common Stock, and could delay, defer, or prevent a transaction or a change of control of our company that might involve a premium price for our stock that our stockholders believe to be in their best interest.
Transfer Agent and Registrar
The transfer agent and registrar for our shares of our Class A Common Stock and Common Stock will be Computershare Trust Company, N.A.
180
Table of Contents
CERTAIN PROVISIONS OF MARYLAND LAW AND OF OUR CHARTER AND SECOND AMENDED AND RESTATED BYLAWS
The following summary of certain provisions of Maryland law and our Charter and Second Amended and Restated Bylaws, as of the completion of this offering, does not purport to be complete and is subject to and qualified in its entirety by reference to our Charter and Second Amended and Restated Bylaws, each of which will be filed as exhibit to the registration statement of which this prospectus is a part, and to Maryland law. See “Where You Can Find More Information.”
Our Board of Directors
Our Charter and Second Amended and Restated Bylaws will provide that the number of directors of our Company may be established, increased, or decreased only by a majority of our directors then serving but may not be fewer than the minimum number required under the MGCL (which is one) or our Charter (whichever is greater) nor, unless our bylaws are amended, more than 12.
Removal of Directors
Under the MGCL, subject to the rights of holders of one or more classes or series of preferred stock to elect or remove one or more directors, and unless the board of directors is classified (which ours is not) or the charter requires cause or a higher vote (which ours does not), stockholders may remove any director, with or without cause, by the affirmative vote of a majority of all the votes entitled to be cast generally for the election of directors.
Business Combinations
Under the MGCL, certain “business combinations” (including a merger, consolidation, statutory share exchange, or, in certain circumstances specified under the statute, an asset transfer or issuance or reclassification of equity securities) between a Maryland corporation and any interested stockholder, or an affiliate of such an interested stockholder, are prohibited for five years after the most recent date on which the interested stockholder becomes an interested stockholder. Maryland law defines an interested stockholder as:
| • | any person who beneficially owns, directly or indirectly, 10% or more of the voting power of the corporation’s outstanding voting stock; or |
| • | an affiliate or associate of the corporation who, at any time within the two-year period prior to the date in question, was the beneficial owner of 10% or more of the voting power of the then-outstanding voting stock of the corporation. |
A person is not an interested stockholder under the MGCL if the board of directors approved in advance the transaction by which the person otherwise would have become an interested stockholder. In approving a transaction, the board of directors may provide that its approval is subject to compliance, at or after the time of the approval, with any terms and conditions determined by it.
After such five-year period, any such business combination must be recommended by the board of directors of the corporation and approved by the affirmative vote of at least:
| • | 80% of the votes entitled to be cast by holders of outstanding shares of voting stock of the corporation; and |
| • | two-thirds of the votes entitled to be cast by holders of voting stock of the corporation other than shares held by the interested stockholder with whom (or with whose affiliate) the business combination is to be effected or held by an affiliate or associate of the interested stockholder. |
181
Table of Contents
These supermajority approval requirements do not apply if, among other conditions, the corporation’s common stockholders receive a minimum price (as defined in the MGCL) for their shares and the consideration is received in cash or in the same form as previously paid by the interested stockholder for its share.
These provisions of the MGCL do not apply, however, to business combinations that are approved or exempted by a corporation’s board of directors prior to the time that the interested stockholder becomes an interested stockholder. As permitted by the MGCL, our Charter exempts any business combination between us and any other person from the provisions of this statute. Consequently, the five-year prohibition and the supermajority vote requirements will not apply to business combinations involving us. As a result, any person will be able to enter into business combinations with us that may not be in the best interests of our stockholders, without compliance with the supermajority vote requirements and other provisions of the statute.
Control Share Acquisitions
The MGCL provides that a holder of “control shares” of a Maryland corporation acquired in a “control share acquisition” has no voting rights with respect to those shares except to the extent approved by the affirmative vote of at least two-thirds of the votes entitled to be cast by stockholders entitled to exercise or direct the exercise of the voting power in the election of directors generally but excluding: (1) the person who has made or proposes to make the control share acquisition; (2) any officer of the corporation; or (3) any employee of the corporation who is also a director of the corporation. “Control shares” are voting shares of stock that, if aggregated with all other such shares of stock previously acquired by the acquirer or in respect of which the acquirer is able to exercise or direct the exercise of voting power (except solely by virtue of a revocable proxy), would entitle the acquirer to exercise voting power in electing directors within one of the following ranges:
| • | one-tenth or more but less than one-third; |
| • | one-third or more but less than a majority; or |
| • | a majority or more of all voting power. |
Control shares do not include shares that the acquiring person is then entitled to vote as a result of having previously obtained stockholder approval. A “control share acquisition” means the acquisition, directly or indirectly, of ownership of, or the power to direct the exercise of voting power with respect to, issued and outstanding control shares, subject to certain exceptions.
A person who has made or proposes to make a control share acquisition, upon satisfaction of certain conditions (including an undertaking to pay expenses and making an “acquiring person statement” as described in the MGCL), may compel the board of directors of the company to call a special meeting of stockholders to be held within 50 days of demand to consider the voting rights of the control shares. If no request for a special meeting is made, the corporation may itself present the question at any stockholders meeting.
If voting rights of control shares are not approved at the meeting or if the acquiring person does not deliver an “acquiring person statement” as required by the statute, then, subject to certain conditions and limitations, the corporation may redeem any or all of the control shares (except those for which voting rights have previously been approved) for fair value determined, without regard to the absence of voting rights for the control shares, as of the date of the last control share acquisition by the acquirer or, if a meeting of stockholders at which the voting rights of such shares are considered and not approved is held, as of the date of such meeting. If voting rights for control shares are approved at a stockholders meeting and the acquirer becomes entitled to vote a majority of the shares entitled to vote, all other stockholders may exercise appraisal rights. The fair value of the shares as determined for purposes of such appraisal rights may not be less than the highest price per share paid by the acquirer in the control share acquisition.
The control share acquisition statute does not apply (1) to shares acquired in a merger, consolidation, or statutory share exchange if the corporation is a party to the transaction or (2) to acquisitions approved or exempted by the charter or bylaws of the corporation.
182
Table of Contents
Our Charter and Second Amended and Restated Bylaws will contain a provision exempting from the control share acquisition statute any and all control share acquisitions by any person of shares of our stock.
Subtitle 8
Subtitle 8 of Title 3 of the MGCL permits a Maryland corporation with a class of equity securities registered under the Exchange Act and at least three independent directors to elect, by provision in its charter or bylaws or a resolution of its board of directors and notwithstanding any contrary provision in the charter or bylaws, to be subject to any or all of the following five provisions:
| • | a classified board; |
| • | a two-thirds vote requirement for removing a director; |
| • | a requirement that the number of directors be fixed only by vote of the directors; |
| • | a requirement that a vacancy on the board be filled only by a vote of the remaining directors (whether or not they constitute a quorum) and for the remainder of the full term of the class of directors in which the vacancy occurred and until a successor is elected and qualifies; or |
| • | a majority requirement for the calling of a special meeting of stockholders. |
Through provisions in our Second Amended and Restated Bylaws, we will opt out of all provisions of Subtitle 8, including the provisions that would permit us to classify our board of directors without stockholder approval. Moreover, our Second Amended and Restated Bylaws will provide that, without the affirmative vote of a majority of the votes cast on the matter by stockholders entitled to vote generally in the election of directors, we may not elect to be subject to any of the provisions of Subtitle 8, and this provision of our bylaws may not be amended without the prior approval of a similar vote of our shareholders.
Through provisions in our Charter and Second Amended and Restated Bylaws unrelated to Subtitle 8, we will (1) vest in our board of directors the exclusive power to fix the number of directors and (2) require, unless called by our chairman, our president, our chief executive officer, a majority of our board of directors, or a majority of the independent directors, the written request of stockholders entitled to cast not less than a majority of all the votes entitled to be cast on such matter at such meeting to call a special meeting of stockholders. If we receive stockholder approval to elect to be subject to the provisions of Subtitle 8 relating to a classified board, our board of directors would automatically be classified into three classes with staggered terms of office of three years each. In such circumstance, the classification and staggered terms of office of the directors would make it more difficult for a third party to gain control of the board of directors since at least two annual meetings of stockholders, instead of one, generally would be required to effect a change in the majority of the directors.
Amendments to Our Charter and Second Amended and Restated Bylaws
As provided in the MGCL, amendments to our Charter must be advised by our board of directors and approved by the affirmative vote of two-thirds of the votes entitled to be cast on the matter. In addition, prior to the Class A Conversion, the holders of Class A Common Stock, voting as a separate class, are required to approve any amendment to our Charter which will affect such holders differently than the holders of our Common Stock. Pursuant to our Second Amended and Restated Bylaws as of the completion of this offering, both our board of directors and a majority of our stockholders will be able to amend our bylaws.
Meetings of Stockholders
Under our Second Amended and Restated Bylaws and pursuant to Maryland law, annual meetings of stockholders will be held each year at a date and at the time and place determined by our board of directors. Special meetings of stockholders may be called by the chairman of our board of directors, our president, our
183
Table of Contents
chief executive officer, a majority of our board of directors, or a majority of our independent directors. Additionally, subject to the provisions of our Second Amended and Restated Bylaws, special meetings of the stockholders to act on any matter must be called by our secretary upon the written request of stockholders entitled to cast not less than a majority of all the votes entitled to be cast on such matter at such meeting who have requested the special meeting in accordance with the procedures set forth in, and provided the information and certifications required by, our Second Amended and Restated Bylaws. Only matters set forth in the notice of the special meeting may be considered and acted upon at such a meeting. Our secretary will inform the requesting stockholders of the reasonably estimated cost of preparing and delivering the notice of meeting (including our proxy materials), and the requesting stockholder must pay such estimated cost before our secretary may prepare and deliver the notice of the special meeting.
Advance Notice of Director Nominations and New Business
Our Second Amended and Restated Bylaws will provide that with respect to an annual meeting of stockholders, nominations of individuals for election to our board of directors and the proposal of business to be considered by a stockholder may be made only (1) pursuant to our notice of the meeting, (2) by or at the direction of our board of directors, or (3) by a stockholder who is a stockholder of record both at the time of giving the advance notice required by our Second Amended and Restated Bylaws and at the time of the meeting, who is entitled to vote at the meeting in the election of each individual so nominated or on any such other business, and who has complied with the advance notice procedures of our Second Amended and Restated Bylaws. With respect to special meetings of stockholders, only the business specified in our notice of the meeting may be brought before the meeting. Nominations of individuals for election to our board of directors at a special meeting may be made only (1) by or at the direction of our board of directors or (2) provided that the special meeting has been called in accordance with our Second Amended and Restated Bylaws for the purpose of electing directors, by a stockholder who is a stockholder of record both at the time of giving the advance notice required by our bylaws and at the time of the meeting, who is entitled to vote at the meeting in the election of each individual so nominated and who has complied with the advance notice provisions of our Second Amended and Restated Bylaws.
The purpose of requiring stockholders to give advance notice of nominations and other proposals is to afford our board of directors and our stockholders the opportunity to consider the qualifications of the proposed nominees or the advisability of the other proposals and, to the extent considered necessary by our board of directors, to inform stockholders and make recommendations regarding the nominations or other proposals. Although our Second Amended and Restated Bylaws will not give our board of directors the power to disapprove timely stockholder nominations and proposals, our Second Amended and Restated Bylaws may have the effect of precluding a contest for the election of directors or proposals for other action if the proper procedures are not followed, and of discouraging or deterring a third party from conducting a solicitation of proxies to elect its own slate of directors to our board of directors or to approve its own proposal.
Anti-takeover Effect of Certain Provisions of Maryland Law and of Our Charter and Second Amended and Restated Bylaws
The restrictions on ownership and transfer of our stock and the advance notice provisions of our Second Amended and Restated Bylaws could delay, defer, or prevent a transaction or a change of control of our company. Likewise, if our board of directors were to elect to be subject to the business combination provisions of the MGCL or if the provision in our Second Amended and Restated Bylaws opting out of the control share acquisition provisions of the MGCL were amended or rescinded, these provisions of the MGCL could have similar anti-takeover effects.
Further, a majority of our entire board of directors has the power, to increase or decrease the aggregate number of authorized shares of stock or the number of shares of any class or series of stock that we are authorized to issue, to classify, and reclassify any unissued shares of our stock into other classes or series of
184
Table of Contents
stock, and to authorize us to issue the newly classified shares, as discussed under the caption “Description of Our Capital Stock—Power to Issue Additional Shares of Common Stock and Preferred Stock,” and could authorize the issuance of shares of Common Stock or another class or series of stock, including a class or series of preferred stock, that could provide the holders thereof with specified dividend payments and payments upon liquidation prior or senior to those of the Common Stock, and could have the effect of delaying, deferring, or preventing a change in control of us. These actions may be taken without stockholder approval unless such approval is required by applicable law, the terms of any other class or series of our stock, or the rules of any stock exchange or automated quotation system on which any of our stock is listed or traded. We believe that the power of our board of directors to increase or decrease the number of authorized shares of stock and to classify or reclassify unissued shares of our Common Stock or preferred stock and thereafter to cause us to issue such shares of stock will provide us with increased flexibility in structuring possible future financings and acquisitions and in meeting other needs which might arise.
Our Charter and Second Amended and Restated Bylaws also will provide that the number of directors may be established only by our board of directors, which prevents our stockholders from increasing the number of our directors and filling any vacancies created by such increase with their own nominees. The provisions of our Second Amended and Restated Bylaws discussed above under the captions “—Meetings of Stockholders” and “—Advance Notice of Director Nominations and New Business” will require stockholders seeking to call a special meeting, nominate an individual for election as a director, or propose other business at an annual or special meeting to comply with certain notice and information requirements. We believe that these provisions will help to assure the continuity and stability of our business strategies and policies as determined by our board of directors and promote good corporate governance by providing us with clear procedures for calling special meetings, information about a stockholder proponent’s interest in us, and adequate time to consider stockholder nominees and other business proposals. However, these provisions, alone or in combination, could make it more difficult for our stockholders to remove incumbent directors or fill vacancies on our board of directors with their own nominees and could delay, defer, or prevent a change in control, including a proxy contest or tender offer that might involve a premium price for our common stockholders or otherwise be in the best interest of our stockholders.
Forum for Certain Litigation
Our Second Amended and Restated Bylaws will provide that, unless we consent in writing to the selection of an alternative forum, the Circuit Court for Baltimore City, Maryland, or, if that Court does not have jurisdiction, the United States District Court for the District of Maryland, Baltimore Division, will be the sole and exclusive forum for (a) any derivative action or proceeding brought on behalf of our company, (b) any action asserting a claim of breach of any duty owed by any of our directors or officers or employees to us or to our stockholders, (c) any action asserting a claim against us or any of our directors or officers or employees arising pursuant to any provision of the MGCL or our Charter or Second Amended and Restated Bylaws, or (d) any action asserting a claim against us or any of our directors or officers or employees that is governed by the internal affairs doctrine.
Limitation of Liability and Indemnification of Directors and Officers
Maryland law permits a Maryland corporation to include in its charter a provision limiting the liability of its directors and officers to the corporation and its stockholders for money damages except for liability resulting from actual receipt of an improper benefit or profit in money, property, or services or active and deliberate dishonesty that is established by a final judgment and is material to the cause of action. Our Charter contains such a provision that eliminates such liability to the maximum extent permitted by Maryland law.
The MGCL requires a Maryland corporation (unless its charter provides otherwise, which our Charter does not) to indemnify a director or officer who has been successful, on the merits or otherwise, in the defense of any proceeding to which he or she is made or threatened to be made a party by reason of his or her service in that
185
Table of Contents
capacity. The MGCL permits a Maryland corporation to indemnify its present and former directors and officers, among others, against judgments, penalties, fines, settlements, and reasonable expenses actually incurred by them in connection with any proceeding to which they may be made or are threatened to be made a party by reason of their service in those or other capacities unless it is established that:
| • | the act or omission of the director or officer was material to the matter giving rise to the proceeding and |
| • | was committed in bad faith; or |
| • | was the result of active and deliberate dishonesty; |
| • | the director or officer actually received an improper personal benefit in money, property or services; or |
| • | in the case of any criminal proceeding, the director or officer had reasonable cause to believe that the act or omission was unlawful. |
However, under the MGCL, a Maryland corporation may not indemnify a director or officer for an adverse judgment in a suit by or on behalf of the corporation or if the director or officer was adjudged liable on the basis that personal benefit was improperly received, unless, in either case, a court orders indemnification and then only for expenses. A court may order indemnification if it determines that the director or officer is fairly and reasonably entitled to indemnification, even though the director or officer did not meet the prescribed standard of conduct or was adjudged liable on the basis that personal benefit was improperly received.
Our Charter provides, as permitted by the MGCL, that we may advance reasonable expenses incurred by a director or officer who is party to a proceeding in advance of the final disposition of the proceeding upon our receipt of:
| • | a written affirmation by the director or officer of his or her good faith belief that he or she has met the standard of conduct necessary for indemnification by us; and |
| • | a written undertaking by the director or officer or on his or her behalf to repay the amount advanced to him or her if it is ultimately determined that the standard of conduct for indemnification by us was not met. |
Our Charter also requires us to provide the same indemnification and advancement of expenses that we are permitted to provide to directors and officers to any person who served as an employee or agent of our company or an employee or agent of BRE.
Indemnification Agreements
We have entered into indemnification agreements with each of our directors and executive officers. The indemnification agreements require that, subject to certain conditions, we indemnify each director and officer to the fullest extent permitted by law against any and all liabilities and expenses to which they may become subject by reason of their service as a director, officer, employee, or agent of our company, and that we advance to each director and officer all related expenses incurred by each director or officer in defense of any claim or proceeding without any preliminary determination of the director’s or officer’s entitlement to indemnification; provided, that any amounts advanced will be refunded to us by the indemnified director or officer if it is ultimately determined that they did not meet the standard of conduct necessary for indemnification. The indemnification agreements also require that we maintain directors’ and officers’ liability insurance covering our directors and officers on terms at least as favorable as the policy coverage in place as of the date each indemnification agreement is entered into. Each indemnification agreement may only amended by the mutual written agreement of our Company and the director or officer party thereto.
In addition to the indemnification agreements described above, we have also purchased and maintain directors’ and officers’ liability insurance covering that insures both us and our directors and officers against
186
Table of Contents
exposure and liability normally insured against under such policies, including exposure to liabilities of the type addressed by the indemnity provisions described above.
REIT Qualification
Our Charter provides that our board of directors may revoke or otherwise terminate our REIT election, without approval of our stockholders, if it determines that it is no longer in our best interest to continue to be qualified as a REIT.
187
Table of Contents
SHARES ELIGIBLE FOR FUTURE SALE
General
Upon the completion of this offering and the Recapitalization, we will have outstanding:
| • | shares of Class A Common Stock; |
| • | shares of Common Stock; and |
| • | shares of Common Stock issuable upon exchange of OP Units. |
Of these shares, the shares of Class A Common Stock sold in this offering ( shares if the underwriters exercise in full their option to purchase additional shares) will be freely transferable without restrictions (other than the restrictions on ownership and transfer set forth in our Charter) or further registration under the Securities Act by persons other than “affiliates” as that term is defined in Rule 144 under the Securities Act. Trading of our Class A Common Stock on the NYSE is expected to commence in connection with the completion of this offering.
The shares of Common Stock held as of the closing of this offering by continuing investors who are not affiliates also will be freely transferable without restriction (other than the restrictions on ownership and transfer set forth in our Charter) or further registration under the Securities Act by persons who are not affiliates, but will not be listed on a national securities exchange upon completion of this offering. All shares of Common Stock are expected to be listed on the NYSE 180 days after completion of this offering.
In addition, a total of shares of our Common Stock are issuable upon exchange of OP Units that we expect to be outstanding upon completion of this offering. These shares of Common Stock also will be freely transferable without restriction (other than the restrictions on ownership and transfer set forth in our Charter and restrictions under lockup agreements) or further registration under the Securities Act by persons who are not affiliates but will not be listed on the NYSE until 180 days after completion of this offering.
The shares of Class A Common Stock sold in this offering will automatically convert into Common Stock on a one-for-one basis 180 days after completion of this offering when the Common Stock is listed on the NYSE.
Rule 144
In general, under Rule 144 as currently in effect, beginning 90 days after the date of this prospectus, a person who is not deemed to have been an affiliate of ours at any time during the three months preceding a sale and who has beneficially owned shares considered to be restricted securities under Rule 144 for at least six months would be entitled to sell those shares, subject only to the availability of current public information about us. A non-affiliated person who has beneficially owned shares considered to be restricted securities under Rule 144 for at least one year would be entitled to sell those shares without regard to the provisions of Rule 144.
An affiliate of ours who has beneficially owned shares of our Common Stock for at least six months would be entitled to sell, within any three-month period, a number of shares that does not exceed the greater of:
| • | 1% of the shares of our Common Stock of the same class then outstanding; or |
| • | the average weekly trading volume of our Common Stock on the NYSE during the four calendar weeks preceding the date on which notice of the sale is filed with the SEC; |
provided, in each case, that we are subject to the Exchange Act periodic reporting requirements for at least 90 days before the sale and have filed all required reports during that time period. Such sales by affiliates must also comply with the manner of sale, current public information, and notice provisions of Rule 144.
188
Table of Contents
Sales under Rule 144 by our affiliates or persons selling shares on behalf of our affiliates are also subject to manner of sale provisions, notice requirements, and the availability of current public information about us.
Lock-Up Agreements
In connection with this offering, we, all of our officers and directors, and certain holders of shares of our Common Stock and OP Units prior to this offering have agreed with the underwriters, subject to certain exceptions, not to offer, sell, contract to sell, pledge, grant any option to purchase, make any short sale, or otherwise dispose of or hedge any of their Common Stock, or any options or warrants to purchase any shares of Common Stock of the Company, or any securities convertible into, exchangeable for, or that represent the right to receive shares of Common Stock of the Company (including OP Units), whether now owned or hereinafter acquired, owned directly by us, or these other persons (including holding as a custodian) or with respect to which we or such other persons have beneficial ownership within the rules and regulations of the SEC during the period from the date of this prospectus continuing through the date 180 days after the date of this prospectus. See “Underwriting.”
Incentive Award Plan
We intend to adopt our 2020 Equity Incentive Plan prior to the completion of this offering. Our 2020 Equity Incentive Plan provides for the grant of incentive awards to our employees, directors, officers, and consultants of our Company and our subsidiaries, including the OP. We intend to reserve shares of our Common Stock for issuance under our 2020 Equity Incentive Plan.
We intend to file with the SEC a Registration Statement on Form S-8 covering the shares of our Common Stock issuable under our 2020 Equity Incentive Plan. Shares of our Class A Common Stock covered by this registration statement, including any shares of our Common Stock issuable upon the exercise of options or shares of restricted Common Stock, will be eligible for transfer or resale without restriction under the Securities Act unless held by affiliates.
Registration Rights Agreement
Upon closing of the Internalization, we expect to enter into a Registration Rights Agreement that provides the Trident Owners with certain demand registration rights and the Trident Owners and the Founding Owners with customary piggyback registration rights with regard to the shares of Common Stock, including Common Stock issuable upon the conversion of OP Units, held by them. Agha Khan, a member of our board of directors, is affiliated with the Trident Owners, and Amy Tait, our Chairman and member of our board of directors, members of her family, and certain family trusts are affiliated with the Founding Owners. The Registration Rights Agreement also provide that we will pay certain expenses relating to such registrations and indemnify the registration rights holders against certain liabilities which may arise under the Securities Act.
189
Table of Contents
MATERIAL U.S. FEDERAL INCOME TAX CONSIDERATIONS
This section summarizes the material U.S. federal income tax considerations that a U.S. holder (as defined below) or a non-U.S. holder (as defined below in “Taxation of Non-U.S. Holders of Our Class A Common Stock (and the Common Stock Into Which Our Class A Common Stock is Converted)”) may consider relevant in connection with the purchase, ownership, and disposition of our Class A Common Stock (and the Common Stock into which our Class A Common Stock is converted). This summary does not purport to consider all aspects of U.S. federal income taxation that might be relevant to holders of shares of our Class A Common Stock (and the Common Stock into which our Class A Common Stock is converted). The summary is based on the Code, final, temporary and proposed U.S. Treasury Regulations, administrative rulings and court decisions in effect as of the date of this prospectus, all of which are subject to change at any time, possibly with retroactive effect. Any such change could alter the U.S. federal income tax consequences described herein. No ruling has been sought from the IRS and there can be no assurance that the IRS will not challenge any of the U.S. federal income tax consequences described herein. Moreover, the statements in this prospectus, and the opinion of counsel described below, are not binding on the IRS or a court and do not preclude the IRS from asserting, or a court from sustaining, a contrary result.
For purposes of this summary, the term “U.S. holder” means a beneficial owner of shares of our Class A Common Stock (and the Common Stock into which our Class A Common Stock is converted) that is for U.S. federal income tax purposes:
| • | a citizen or resident of the United States; |
| • | a corporation, or other entity taxable as a corporation, created or organized under the laws of the United States or any state thereof (or the District of Columbia); |
| • | a trust if it (1) is subject to the primary supervision of a court within the United States and one or more U.S. persons have the authority to control all substantial decisions of the trust, or (2) has a valid election in effect under applicable U.S. Treasury Regulations to be treated as a U.S. person; or |
| • | an estate that is subject to U.S. federal income tax on its income regardless of its source. |
This summary only addresses U.S. federal income tax consequences to holders of shares of our Class A Common Stock (and the Common Stock into which our Class A Common Stock is converted) that hold such shares as a capital asset within the meaning of Section 1221 of the Code. The statements in this summary are not intended to be, and should not be construed as, tax advice. Further, this summary does not address all aspects of U.S. federal income taxation that may be relevant to such holder in light of such holder’s particular circumstances or that may be applicable to holders subject to special treatment under U.S. federal income tax laws (including, for example, banks or other financial institutions, insurance companies, REITs, regulated investment companies, broker-dealers, dealers in securities or currencies, traders in securities or other persons that have elected to use a mark-to-market method of accounting, tax-exempt entities including governmental authorities (both U.S. and non-U.S.), a non-U.S. holder that owns or has owned actually or constructively more than 10% of our Common Stock (including our Class A Common Stock), holders whose functional currency is not the U.S. dollar, holders who acquired their shares pursuant to the exercise of employee stock options or otherwise as compensation or through a tax-qualified retirement plan, holders who hold their shares in an individual retirement or other tax-deferred account, holders subject to the alternative minimum tax provisions of the Code, U.S. expatriates, persons who hold shares on behalf of another person as nominee, trusts and estates, persons owning, or deemed to own under constructive ownership rules of the Code, more than 9.8% of the value of our outstanding shares of capital stock or more than 9.8% of the value or number of shares, of our outstanding Common Stock (including our Class A Common Stock) (except to the extent discussed herein), holders who hold their shares as part of a hedge, straddle, integration, constructive sale, conversion, “synthetic security,” or other risk reduction transaction or integrated investment, S corporations, partnerships or other pass-through entities (or investors in S corporations, partnerships or other pass-through entities) and persons otherwise subject to special tax treatment under the Code). In addition, no information is provided herein with respect to applicable state, local or non-U.S. tax laws or U.S. federal laws other than those pertaining to the U.S. federal income tax (except to the extent discussed below).
190
Table of Contents
If a partnership (including an entity or arrangement classified as a partnership for U.S. federal income tax purposes) holds shares of our Class A Common Stock (or the Common Stock into which our Class A Common Stock is converted, as applicable), the tax treatment of a partner in the partnership generally will depend on the status of the partner and the activities of the partnership. A stockholder that is a partner in a partnership and partners in such partnership should consult their tax advisors about the U.S. federal income tax consequences of the purchase, ownership and disposition of shares of our Class A Common Stock (and the Common Stock into which our Class A Common Stock is converted).
THE U.S. FEDERAL INCOME TAX CONSIDERATIONS DESCRIBED BELOW ARE NOT INTENDED TO CONSTITUTE A COMPLETE DESCRIPTION OF ALL TAX CONSIDERATIONS RELATING TO THE PURCHASE, OWNERSHIP, AND DISPOSITION OF OUR CLASS A COMMON STOCK (AND THE COMMON STOCK INTO WHICH OUR CLASS A COMMON STOCK IS CONVERTED) AND OF OUR ELECTION TO BE TAXED AS A REIT. YOU ARE URGED TO CONSULT YOUR TAX ADVISOR REGARDING THE TAX CONSEQUENCES OF SUCH PURCHASE, OWNERSHIP, DISPOSITION AND ELECTION, INCLUDING THE EFFECTS OF U.S. FEDERAL, STATE AND LOCAL, NON-U.S. AND OTHER TAX LAWS AND REGARDING ANY POTENTIAL CHANGES IN APPLICABLE TAX LAWS.
Taxation of Our Company
General
We elected to qualify to be taxed as a REIT under Sections 856 through 860 of the Code and the applicable U.S. Treasury Regulations, which contain the requirements for qualifying as a REIT, which we refer to in this prospectus as the “REIT Requirements,” commencing with our taxable year ended December 31, 2008. We believe that as of such date we have been organized and have operated in a manner to qualify for taxation as a REIT for U.S. federal income tax purposes. We intend to continue to be organized and operate in such a manner, but no assurance can be given that we have operated or will be able to continue to operate in a manner so as to qualify or remain qualified.
The REIT Requirements are technical and complex. The following discussion sets forth only certain material aspects of those requirements. This summary is qualified in its entirety by the applicable Code provisions, rules and regulations promulgated thereunder, and administrative and judicial interpretations thereof.
Fried, Frank, Harris, Shriver & Jacobson LLP (“Fried Frank”) has acted as our tax counsel in connection with the filing of this prospectus. Fried Frank has rendered an opinion to us, dated as of , 2020, to the effect that, commencing with our taxable year ended December 31, 2016, we have been organized and operated in conformity with the requirements for qualification and taxation as a REIT under Sections 856 through 860 of the Code and the current and proposed method of operation of us and our subsidiaries as described in this prospectus will enable us to continue to meet the requirements for qualification and taxation as a REIT under the Code. It must be emphasized that the Fried Frank opinion is based and conditioned upon certain assumptions and representations relating to our organization and operation and is conditioned upon certain representations made by us as to certain matters (including representations concerning our income and properties and the past, present, and future conduct of our business operations as set forth in this prospectus and one or more certificates provided by our officers). The Fried Frank opinion is expressed as of the date thereof and Fried Frank has no obligation to advise us of any subsequent change in the matters stated, represented or assumed or any subsequent change in the applicable law. The Fried Frank opinion does not foreclose the possibility of a contrary position taken by the IRS or the U.S. Department of the Treasury in regulations or rulings issued in the future and the opinion is not binding on the IRS or any court and is not a guarantee that the IRS will not assert a contrary position or that a court will not sustain a position asserted by the IRS. Moreover, our continued qualification and taxation as a REIT depends upon our ability to meet, through actual annual operating results, certain requirements relating to the nature of our income and assets, distributions to stockholders and diversity of stock ownership, and various other qualification tests imposed under the REIT Requirements which are discussed below. Fried Frank has not undertaken to review our compliance with these requirements on a continuing basis. No assurance can be given
191
Table of Contents
that the actual results of our operations, the sources of our income, the nature of our assets, our distributions to stockholders and the diversity of our share ownership for any given taxable year will satisfy such requirements. See “—Failure to Qualify as a REIT.”
So long as we qualify for taxation as a REIT, we generally will not be subject to U.S. federal corporate income taxes on that portion of our ordinary income or capital gain that is currently distributed to stockholders, subject to certain exceptions discussed below. We expect that such treatment would substantially eliminate the U.S. federal “double taxation” on earnings that generally results from an investment in a corporation.
Even if we remain qualified as a REIT for U.S. federal income tax purposes, we may still be subject to U.S. federal income, state and local income, property and excise taxes on our income or property in certain circumstances, which include, but are not limited to, the following:
| • | In order to qualify as a REIT, we must distribute annually at least 90% of our REIT taxable income to our stockholders (computed without regard to the dividends paid deduction and our net capital gain), and to the extent that we satisfy the distribution requirement but distribute less than 100% of our REIT taxable income, we will be subject to federal corporate income tax on the undistributed income; |
| • | If we should fail to distribute, or fail to be treated as having distributed, with respect to each calendar year at least the sum of (i) 85% of our REIT ordinary income for such year, (ii) 95% of our REIT capital gain net income for such year (other than capital gain income we elect to retain and pay tax on) and (iii) any undistributed taxable income from prior periods, we would be subject to a 4% nondeductible excise tax on the excess of such required distribution over the sum of (a) the amounts actually distributed and (b) the amounts we retained and upon which we paid income tax at the corporate level; |
| • | Under certain circumstances, for taxable years beginning before January 1, 2018, we may be subject to the “alternative minimum tax” on certain of our tax preference items, if any; |
| • | If we have (i) net income from the sale or other disposition of “foreclosure property” that is held primarily for sale to customers in the ordinary course of business or (ii) other non-qualifying net income from foreclosure property, we will be subject to tax at the highest corporate tax rate on such income; |
| • | If we have net income from prohibited transactions (which are, in general, certain sales or other dispositions of property held primarily for sale to customers in the ordinary course of business, other than sales of foreclosure property and sales that qualify for a statutory safe harbor), such income will be subject to a 100% tax; |
| • | We may be subject to tax on gain recognized in a taxable disposition of assets acquired by way of a carryover basis transaction, when such gain is recognized on a disposition of an asset during a 5-year period beginning on the date on which we acquired the asset. To the extent of any “built-in gain,” such gain will be subject to U.S. federal income tax at the federal corporate income tax rate. Built-in gain means the excess of (i) the fair market value of the asset as of the beginning of the applicable recognition period over (ii) our adjusted basis in such asset as of the beginning of such recognition period; |
| • | If we should fail to satisfy the 75% gross income test or the 95% gross income test (which are discussed below), but have nonetheless maintained our qualification as a REIT because certain other requirements have been met, we will be subject to a 100% tax on the net income attributable to the greater of the amount by which we fail the 75% or the 95% test; |
| • | Similarly, if we should fail to satisfy the asset tests or other requirements applicable to REITs, as described below, yet nonetheless qualify as a REIT because there is reasonable cause for the failure and other applicable requirements are met, we may be subject to a penalty. The amount of the penalty will be at least $50,000 per failure, and, in the case of certain asset test failures, will be equal to the amount |
192
Table of Contents
| of net income generated by the assets in question multiplied by the highest corporate tax rate if that amount exceeds $50,000 per failure; |
| • | We may perform additional, non-customary services for tenants of our buildings through a taxable REIT subsidiary (“TRS”), including real estate or non-real estate related services; however, any earnings that exceed allowable limits related to such services are subject to federal and state income taxes; and |
| • | We will be subject to a 100% tax on transactions with our TRSs if such transactions are not at arm’s length. |
No assurance can be given that the amount of such U.S. federal income tax will not be substantial. In addition, we and our subsidiaries may be subject to a variety of taxes other than U.S. federal income tax, including payroll taxes, real property transfer taxes, and state, local and foreign income, franchise, property and other taxes on assets and operations. We could also be subject to tax in situations and on transactions not presently contemplated.
Requirements for Qualification
As indicated above, to qualify as a REIT, a corporation must elect to be so treated and must meet various (a) organizational requirements, (b) gross income tests, (c) asset tests and (d) distribution requirements. Our ability to satisfy the asset tests will depend upon our analysis of the fair market values of our assets, some of which are not susceptible to a precise determination. Our compliance with the REIT income and quarterly asset requirements will also depend upon our ability to successfully manage the composition of our income and assets on an ongoing basis.
Organizational Requirements
The Code defines a REIT as a corporation, trust, or association that makes a REIT election with its tax return and:
| 1. | that is managed by one or more trustees or directors; |
| 2. | the beneficial ownership of which is evidenced by transferable shares, or by transferable certificates of beneficial interest; |
| 3. | that would be taxable as a domestic corporation, but for the REIT Requirements; |
| 4. | that is not a bank, an insurance company or certain other specified types of financial institutions; |
| 5. | the beneficial ownership of which is held by 100 or more persons; |
| 6. | not more than 50% in value of the outstanding stock of which is owned, directly or constructively, by five or fewer individuals (as defined in the Code to include certain entities) at any time during the last half of each taxable year; and |
| 7. | that meets certain other tests, described below, regarding the nature of its income and assets. |
The Code provides that the conditions described in the first four bullets above, inclusive, must be met during the entire taxable year and that the condition described in the fifth bullet above must be met during at least 335 days of a taxable year of 12 months, or during a proportionate part of a taxable year of less than 12 months. For purposes of the condition described in the sixth bullet above, certain tax-exempt entities are generally treated as individuals, and the beneficiaries of a pension trust that qualifies under Section 401(a) of the Code and that holds shares of a REIT will be treated as holding shares of the REIT in proportion to their actuarial interests in the pension trust. In addition, if a REIT fails to satisfy the condition described in the sixth bullet above for any taxable year, the REIT will nonetheless be deemed to have satisfied the condition if it complied with U.S.
193
Table of Contents
Treasury Regulations requiring the maintenance of records to ascertain ownership and did not know (and would not have known using reasonable diligence) that it was closely held for the year. We believe that we have sufficient diversity of ownership to satisfy the conditions in the fifth and sixth bullets above. In addition, our Charter restricts the transfer and ownership of our stock so that we should continue to satisfy these conditions. The provisions of our Charter that restrict the transfer and ownership of our Common Stock (including our Class A Common Stock) are described in “Description of Capital Stock—Restrictions on Transfer and Ownership of Capital Stock.”
In addition, we have requested and intend to continue to request on an annual basis from certain stockholders, and those stockholders will be required to provide, information relating to the number of shares actually or constructively owned by such stockholders. Ownership for purposes of conditions described in the fifth and sixth bullet above is defined using certain constructive ownership rules. As a result, the acquisition of less than 9.8% of our stock by an individual or entity may cause that individual or entity constructively to own more than 9.8% of such stock, thereby triggering the transfer restrictions described in “Description of Capital Stock—Restrictions on Transfer and Ownership of Capital Stock.”
Effect of Subsidiary Entities
Partnerships and Disregarded Entities. In the case of a REIT that is a partner in a partnership or a member in a limited liability company treated as a partnership for U.S. federal income tax purposes, U.S. Treasury Regulations provide that the REIT will be deemed to own its proportionate share of the assets of the partnership or limited liability company, as the case may be, based on its interest in partnership capital, subject to special rules relating to the 10% asset test described below. Also, the REIT will be deemed to be entitled to its proportionate share of the income of that entity. The assets and gross income of the partnership or limited liability company retain the same character in the hands of the REIT for purposes of Section 856 of the Code, including satisfying the gross income tests and the asset tests. Thus, our pro rata share of the assets and items of income of any partnership or limited liability company treated as a partnership or disregarded entity for U.S. federal income tax purposes, including such partnership’s or limited liability company’s share of these items of any partnership or limited liability company treated as a partnership or disregarded entity for U.S. federal income tax purposes in which it owns an interest, would be treated as our assets and items of income for purposes of applying the requirements described in this discussion, including the gross income and asset tests described below. A brief summary of the rules governing the federal income taxation of partnerships and limited liability companies is set forth below in “—Tax Aspects of the OP, the Subsidiary Partnerships, and the Limited Liability Companies.”
We will have control of the OP and the subsidiary partnerships and limited liability companies and intend to operate them in a manner consistent with the requirements for our qualification as a REIT. If we become a limited partner or non-managing member in any partnership or limited liability company and such entity takes or expects to take actions that could jeopardize our status as a REIT or require us to pay tax, we may be forced to dispose of our interest in such entity. In addition, it is possible that a partnership or limited liability company could take an action which could cause us to fail a gross income or asset test, and that we would not become aware of such action in time to dispose of our interest in the partnership or limited liability company or take other corrective action on a timely basis. In that case, we could fail to qualify as a REIT unless we were entitled to relief, as described below. The OP currently is a partnership for U.S. federal income tax purposes. Consequently, the OP’s assets and operations may affect our ability to qualify as a REIT.
Qualified REIT Subsidiaries. A corporation that is a qualified REIT subsidiary (“QRS”) is not treated as a corporation separate from its parent REIT. All assets, liabilities and items of income, deduction and credit of a QRS are treated as assets, liabilities and items of income, deduction and credit of the parent REIT. A QRS is a corporation, other than a TRS, all of the stock of which is owned by the parent REIT. Thus, in applying the requirements described herein, any QRS that we own will be ignored for U.S. federal income tax purposes, and all assets, liabilities and items of income, deduction and credit of such subsidiary will be treated as our assets, liabilities and items of income, deduction and credit.
194
Table of Contents
Taxable REIT Subsidiaries. A REIT may own up to 100% of the shares of one or more TRSs. A domestic TRS is a fully taxable corporation that may earn income that would not be qualifying income if earned directly by the parent REIT. Other than some activities relating to lodging and health care facilities, a TRS may generally engage in any business, including the provision of customary or non-customary services to tenants of its parent REIT. To the extent that a domestic TRS is required to pay taxes, it will have less cash available for distribution to us. If dividends are paid to us by our domestic TRSs, then the dividends we pay to our stockholders who are taxed at individual rates, up to the amount of dividends we receive from our domestic TRSs, will generally be eligible to be taxed at the reduced 20% rate currently applicable to qualified dividend income. See “—Taxation of U.S. Holders of Our Class A Common Stock (and the Common Stock Into Which Our Class A Common Stock is Converted).” Dividends paid by foreign TRSs may not be treated similarly, and the tax treatment of a foreign TRS in its jurisdiction of tax residence will depend on the laws of that jurisdiction and may vary considerably.
The subsidiary and the REIT must jointly elect to treat the subsidiary as a TRS. A corporation of which a TRS directly or indirectly owns securities possessing more than 35% of the total voting power or total value of the outstanding securities of such corporation will automatically be treated as a TRS. We are not treated as holding the assets of a TRS or as receiving any income that the TRS earns. Rather, the stock issued by a TRS to us is an asset in our hands, and we treat the distributions paid to us from such TRS, if any, as income. This treatment can affect our compliance with the gross income and asset tests. Because we do not include the assets and income of TRSs in determining our compliance with the REIT Requirements, we may use such entities to undertake indirectly activities that the REIT rules might otherwise preclude us from doing directly or through pass-through subsidiaries. Overall, no more than 20% (or, for taxable years beginning before January 1, 2018, 25%) of the value of a REIT’s assets may consist of stock or securities of one or more TRSs.
A domestic TRS will pay income tax at regular corporate rates on any income that it earns. In addition, for taxable years beginning after December 31, 2017, taxpayers, including TRSs, are subject to a limitation on their ability to deduct net business interest generally equal to 30% of adjusted taxable income, subject to certain exceptions. See “—Annual Distribution Requirements.” This provision may limit the ability of our TRSs to deduct interest, which could increase their taxable income. Further, the rules impose a 100% excise tax on certain transactions between a TRS and its parent REIT or the REIT’s tenants that are not conducted on an arm’s-length basis.
Non-REIT Earnings and Profits
In order to qualify as a REIT, we cannot have at the end of any taxable year any earnings and profits that were accumulated in any taxable year in which the REIT provisions did not apply to us (which we refer to in this prospectus as C corporation earnings and profits). Because the Blocker Corps will be acquired by us pursuant to mergers (the “Blocker Corp Mergers”) in the Internalization, and each of the Blocker Corps is taxable as a regular C corporation, we will succeed to any C corporation earnings and profits accumulated by the Blocker Corps for taxable periods prior to and including the Blocker Corp Mergers. See “Recapitalization, Internalization, and Structure of Our Company.” We estimate the C corporation earnings and profits of the Blocker Corps to be approximately $ million in total at the time of the Blocker Corp Mergers and we expect to utilize a nationally recognized accounting firm to prepare a study to assist management in confirming that calculation. During 2020, we expect to make sufficient distributions in excess of our earnings and profits (including the C corporation earnings and profits from the Blocker Corps) so we will not have to pay a special dividend to eliminate such C corporation earnings and profits. In effect, the inclusion of the C corporation earnings and profits from the Blocker Corps will increase the portion of our distributions during 2020 that are taxable as dividends. However, if we were determined to succeed to more C corporation earnings and profits as a result of the Blocker Corp Mergers or we were to have less distributions than expected during 2020, we may have to pay a special dividend and/or employ applicable deficiency dividend procedures to eliminate such earnings and profits. If we need to make a special dividend or pay a deficiency dividend and do not otherwise have cash on hand to do so, we may need to (i) sell assets at unfavorable prices, (ii) borrow on unfavorable terms, (iii) distribute amounts that would otherwise be invested in future acquisitions, capital expenditures or repayment
195
Table of Contents
of debt, or (iv) make a taxable distribution of Common Stock (or Class A Common Stock, as applicable) as part of a distribution in which stockholders may elect to receive Common Stock (or Class A Common Stock, as applicable) or cash (subject to a limit measured as a percentage of the total distribution), in order to comply with REIT requirements. In addition, if we were to rely upon the remedial deficiency dividend procedures, we would be required to pay interest based on the amount of any such deficiency dividends.
Gross Income Tests
In order to maintain qualification as a REIT, we must annually satisfy the following two gross income requirements:
| • | At least 75% of our gross income (excluding gross income from prohibited transactions and certain hedging and foreign currency transactions) for each taxable year must be derived directly or indirectly from investments relating to real property or mortgages on real property (such as interest on obligations secured by mortgages on real property (and, for taxable years beginning after December 31, 2015, personal property that is ancillary to such real property if the fair market value of such personal property does not exceed 15% of the aggregate fair market value of such personal and real property), certain “rents from real property,” gain from the sale or other disposition of real property (including interests in real property and interests in mortgages on real property) which is not dealer property, and certain fees with respect to agreements to make or acquire mortgage loans), from certain types of temporary investments or from certain other types of gross income; and |
| • | At least 95% of our gross income (excluding gross income from prohibited transactions and certain hedging and foreign currency transactions) for each taxable year must be derived from such real property investments as aforesaid and from dividends, interest, and gain from the sale or other disposition of stock or securities and certain other types of gross income (or from any combination of the foregoing). |
In order to qualify as a REIT, the rental income received by us must constitute “rents from real property.” Rent that we receive from our real property will qualify as “rents from real property,” which is qualifying income for purposes of the 75% and 95% gross income tests, only if the following conditions are met:
| • | First, the rent must not be based, in whole or in part, on the income or profits of any person, but may be based on a fixed percentage or percentages of receipts or sales. Rent that consists, in whole or in part, of one or more percentages of the lessee’s receipts or sales in excess of determinable dollar amounts, however, will qualify as “rents from real property” if (i) the determinable amounts do not depend in whole or in part on the income or profits of the lessee and (ii) the percentages and determinable amounts are fixed at the time the lease is entered into and a change in percentages and determinable amounts is not renegotiated during the term of the lease (including any renewal periods of the lease) in a manner that has the effect of basing rent on income or profits. More generally, rent will not qualify as “rents from real property” if, considering the leases and all the surrounding circumstances, the arrangement does not conform with normal business practice, but is in reality used as a means of basing the rent on income or profits; |
| • | Second, neither we nor an actual or constructive owner of 10% or more of our stock may own, actually or constructively, 10% or more of a tenant from whom we receive rents. However, rents we receive from such a tenant that is a TRS of ours will not be excluded from the definition of “rents from real property” as a result of this condition if at least 90% of the space at the property to which the rents relate is leased to third parties, and the rents paid by the TRS are substantially comparable to rents paid by our other tenants for comparable space. Whether rents paid by a TRS are substantially comparable to rents paid by other tenants is determined at the time the lease with the TRS is entered into, extended, and modified, if such modification increases the rents due under such lease. Notwithstanding the foregoing, however, if a lease with a “controlled TRS” is modified and such modification results in an increase in the rents payable by such TRS, any such increase will not qualify as “rents from real |
196
Table of Contents
| property.” For purposes of this rule, a “controlled TRS” is a TRS in which the parent REIT owns stock possessing more than 50% of the voting power or more than 50% of the total value of the outstanding stock of such TRS; |
| • | Third, if rent attributable to personal property (including furniture, fixtures and equipment) leased in connection with a lease of real property is 15% or less of the total rent received under the lease, then the rent attributable to personal property will qualify as “rents from real property.” However, if the 15% threshold is exceeded, the rent attributable to personal property will not qualify as “rents from real property.” In such case, we may transfer a portion of such personal property to a TRS; and |
| • | Fourth, we generally must not operate or manage our real property or furnish or render services to our tenants, other than through an “independent contractor” who is adequately compensated and from whom we do not derive revenue. However, we need not provide services through an “independent contractor,” but instead may provide services directly to our tenants, if the services are “usually or customarily rendered” in connection with the rental of space for occupancy only and are not considered to be provided for the tenants’ convenience. Charges for such customarily rendered services will qualify as “rents from real property.” If we provide services to a tenant that are other than those usually or customarily provided in connection with the rental of space for occupancy only, amounts received or accrued by us for any such services will not be treated as “rents from real property” for purposes of the REIT gross income tests but will not cause other amounts received with respect to the property to fail to be treated as “rents from real property” unless the amounts treated as received in respect of such services, together with amounts received for certain management services, exceed 1% of all amounts received or accrued by us during the taxable year with respect to such property. If the 1% threshold is exceeded, then all amounts received or accrued by us with respect to the property will not qualify as “rents from real property,” even if the impermissible services are provided to some, but not all, of the tenants of the property. Furthermore, we may own up to 100% of the stock of one or more TRSs which may, except in certain circumstances, provide customary and non-customary services to our tenants without tainting our rental income for the related properties. To the extent we perform non-customary services for tenants of our buildings, we intend to provide such services through a TRS. |
The rents received by us will qualify as “rents from real property” in satisfying the gross income requirements for a REIT only if the conditions described in the four bullets above are met. In order for the rents received or accrued by us from tenants to be treated as qualifying rents for purposes of the REIT gross income requirements, the provisions of our Charter restrict the transfer and ownership of our stock. The provisions of our Charter that restrict the transfer and ownership of our Common Stock (including our Class A Common Stock) are described in “Description of Capital Stock—Restrictions on Transfer and Ownership of Capital Stock.” Nevertheless, there can be no assurance that such restrictions will be effective in ensuring that we will not be treated as related to any tenant of ours.
Interest income constitutes qualifying mortgage interest for purposes of the 75% gross income test (as described above) to the extent that the obligation upon which such interest is paid is secured by a mortgage on real property. If we receive interest income with respect to a mortgage loan that is secured by both real property and other property, and the highest principal amount of the loan outstanding during a taxable year exceeds the fair market value of the real property on the date that we acquired or originated the mortgage loan, the interest income will be apportioned between the real property and the other collateral, and our income from the arrangement will qualify for purposes of the 75% gross income test only to the extent that the interest is allocable to the real property. In the case of real estate mortgage loans that are secured by both real property and personal property, if the fair market value of such personal property does not exceed 15% of the total fair market value of all property securing the loan, then the personal property securing the loan will be treated as real property for purposes of determining whether the mortgage is a qualifying asset under the 75% asset test and interest income that qualifies for purposes of the 75% gross income test. Even if a loan is not secured by real property, or is under secured, the income that it generates may nonetheless qualify for purposes of the 95% gross income test. For these purposes, the term “interest” generally does not include any amount received or accrued, directly or
197
Table of Contents
indirectly, if the determination of all or some of the amount depends in any way on the income or profits of any person. We believe that we have structured, and intend to structure, all of our loan investments as needed so that our investments in loans do not prevent us from satisfying the 75% gross income test.
From time to time, we may enter into hedging transactions with respect to one or more of our assets or liabilities. Our hedging activities may include entering into interest rate swaps, caps, and floors, options to purchase these items, and futures and forward contracts. Income from a hedging transaction, including gain from the sale or disposition of such a transaction, that is clearly identified as a hedging transaction as specified in the Code will not constitute gross income under, and thus will be exempt from, the 75% and 95% gross income tests. The term “hedging transaction,” as used above, generally means (A) any transaction we enter into in the normal course of our business primarily to manage risk of (1) interest rate changes or fluctuations with respect to borrowings made or to be made by us to acquire or carry real estate assets, or (2) currency fluctuations with respect to an item of qualifying income under the 75% or 95% gross income test or any property which generates such income and (B) new transactions entered into to hedge the income or loss from prior hedging transactions, where the property or indebtedness which was the subject of the prior hedging transaction was extinguished or disposed of. To the extent that we do not properly identify such transactions as hedges or we hedge with other types of financial instruments, the income from those transactions is not likely to be treated as qualifying income for purposes of the gross income tests. We intend to structure any hedging transactions in a manner that does not jeopardize our status as a REIT.
We own one property (and entity) located outside the United States, and may in the future own additional properties or entities located outside the United States. These acquisitions could cause us to incur foreign currency gains or losses. Any foreign currency gains, to the extent attributable to specified items of qualifying income or gain, or specified qualifying assets, generally will not constitute gross income for purposes of the 75% and 95% gross income tests, and therefore will be excluded from these tests.
Prohibited Transaction Income
Any gain that we realize on the sale of property held as inventory or otherwise held primarily for sale to customers in the ordinary course of business, including our share of any such gain realized by our OP, either directly or through its subsidiary partnerships and limited liability companies, will be treated as income from a prohibited transaction that is subject to a 100% penalty tax, unless certain safe harbor exceptions apply. This prohibited transaction income may also adversely affect our ability to satisfy the gross income tests for qualification as a REIT. Under existing law, whether property is held as inventory or primarily for sale to customers in the ordinary course of a trade or business is a question of fact that depends on all the facts and circumstances surrounding the particular transaction. We intend to cause the OP to hold its properties for investment with a view to long-term appreciation, to engage in the business of acquiring and owning its properties and to make occasional sales of the properties as are consistent with our investment objective. We do not intend, and do not intend to permit the OP or its subsidiary partnerships or limited liability companies, to enter into any sales that are prohibited transactions. However, the IRS may successfully contend that some or all of the sales made by the OP or its subsidiary partnerships or limited liability companies are prohibited transactions. We would be required to pay the 100% penalty tax on our allocable share of the gains resulting from any such sales. The 100% penalty tax will not apply to gains from the sale of assets that are held through a TRS, but such income will be subject to tax at regular U.S. federal corporate income tax rates.
Relief Provisions for Failing the 75% or 95% Gross Income Tests
If we fail to satisfy one or both of the 75% or 95% gross income tests for any taxable year, we may nevertheless qualify as a REIT for such year if certain relief provisions of the Code apply. These relief provisions will generally apply if our failure to meet such tests was due to reasonable cause and not due to willful neglect, we attach a schedule of the sources of our income to our return, and any incorrect information on the schedule was not due to fraud with intent to evade tax. Under certain circumstances, we may prefer not to have the relief
198
Table of Contents
provisions apply. If these relief provisions are inapplicable to a particular set of circumstances involving us, we might not qualify as a REIT. As discussed above under “—Taxation of Our Company—General,” even where these relief provisions apply, a tax would be imposed based upon the amount by which we fail to satisfy the particular gross income test.
Asset Tests
At the close of each quarter of our taxable year, we must satisfy the following five tests relating to the nature of our assets:
| • | At least 75% of the value of our total assets must be represented by (i) real estate assets, including (a) stock or debt instruments that do not otherwise qualify as real estate assets and that are not held for more than one year that were purchased with the proceeds of a stock offering or long-term (at least five years) debt offering of ours, (b) for taxable years beginning after December 31, 2015, debt instruments of publicly offered REITs and personal property leased in connection with real property if the rent attributable to personal property is not greater than 15% of the total rent received under such lease, (c) any mortgage on real property to the extent it is secured by real property with a value of at least the amount of the mortgage (at the time the mortgage is acquired or entered into), and (d) for taxable years beginning after December 31, 2015, ancillary personal property securing a mortgage described in the preceding clause (c), provided that the value of such ancillary personal property is less than 15% of the aggregate fair market value of the personal and real property securing such mortgage, (ii) cash, (iii) cash items, and (iv) government securities; |
| • | Not more than 25% of our total assets may be represented by securities other than those in the 75% asset class; |
| • | Of the assets included in the 25% asset class, other than securities of TRSs, the value of any one issuer’s securities owned by us may not exceed 5% of the value of our total assets, and we may not own more than 10% of any one issuer’s outstanding voting securities or more than 10% of the value of any one issuer’s outstanding securities; |
| • | Not more than 20% (or, for taxable years beginning before January 1, 2018, 25%) of our total assets may be represented by securities of one or more TRSs; and |
| • | Not more than 25% of our total assets may be represented by debt instruments of publicly offered REITs not secured by real property for taxable years beginning after December 31, 2015. |
Relief Provisions for Failing the Asset Tests
If we fail to satisfy the asset tests at the end of a quarter, we will not lose our REIT qualification if:
| • | we satisfied the asset tests at the end of the preceding calendar quarter; and |
| • | the discrepancy between the value of our assets and the asset test requirements arose from changes in the market values of our assets and was not wholly or partly caused by the acquisition of one or more non-qualifying assets. |
If we did not satisfy the condition described in the second bullet above and the failure to satisfy the asset tests results from an acquisition of securities or other property during a quarter, the failure can be cured by disposition of sufficient non-qualifying assets within 30 days after the close of that quarter. We have maintained and intend to continue to maintain adequate records of the value of our assets to ensure compliance with the asset tests, and intend to take such action within 30 days after the close of any quarter as may be required to cure any noncompliance but no assurance can be given that such asset tests will be met.
If we violate the 5% value test, 10% voting test or 10% value test described above at the end of any calendar quarter, we will not lose our REIT qualification if (i) the failure is de minimis (up to the lesser of 1% of our total
199
Table of Contents
assets or $10 million) and (ii) we dispose of assets or otherwise comply with the asset tests within six months after the last day of the quarter. In the event of a more than de minimis failure of any of the asset tests, as long as the failure was due to reasonable cause and not to willful neglect, we will not lose our REIT qualification if we (i) file with the IRS a schedule describing the assets that caused the failure, (ii) dispose of these assets or otherwise comply with the asset tests within six months after the last day of the quarter and (iii) pay a tax equal to the greater of $50,000 per failure or an amount equal to the product of the highest corporate income tax rate (currently 21%) and the net income from the non-qualifying assets during the period in which we failed to satisfy the asset tests.
Annual Distribution Requirements
In order to be treated as a REIT, we are required to distribute dividends (other than capital gains dividends) to our stockholders in an amount at least equal to:
(A) the sum of
(i) 90% of our “REIT taxable income” (computed without regard to the dividends paid deduction and our net capital gain), and
(ii) 90% of the net income, if any, from foreclosure property in excess of the special tax on income from foreclosure property,
minus
(B) the sum of certain items of noncash income.
Such distributions must be paid in the taxable year to which they relate, or in the following taxable year if either (i) we declare the distribution before we file a timely U.S. federal income tax return for the year and pay the distribution with or before the first regular dividend payment after such declaration or (ii) we declare the distribution in October, November or December of the taxable year, payable to stockholders of record on a specified day in any such month, and we actually pay the dividends before the end of January of the following year. The distributions under clause (i) are taxable to owners of our Common Stock (including our Class A Common Stock) in the year in which paid, and the distributions in clause (ii) are treated as paid on December 31 of the prior taxable year. In both instances, these distributions relate to our prior taxable year for purposes of the 90% distribution requirement. If we dispose of any asset that is acquired from a C corporation by way of a carryover basis transaction during the 5-year period beginning on the date on which we acquired the asset, we may be required to distribute at least 90% of the built-in gain (after tax), if any, recognized on the disposition of the asset. See “Built-In Gains Tax” below.
To the extent that we do not distribute (or are not treated as having distributed) all of our net capital gain or distribute (or are treated as having distributed) at least 90%, but less than 100%, of our “REIT taxable income,” as adjusted, we will be subject to tax thereon at regular ordinary and capital gains corporate tax rates. “REIT taxable income” is the taxable income of a REIT, which generally is computed in the same fashion as the taxable income of any corporation, except that (i) certain deductions are not available, such as the deduction for dividends received, (ii) a REIT may deduct dividends paid (or deemed paid) during the taxable year, (iii) net capital gains and losses are excluded, and (iv) certain other adjustments are made. We may elect to retain rather than distribute our net long-term capital gains while treating the capital gain as if distributed. The effect of such an election is that (i) we are required to pay the tax on such gains, (ii) U.S. holders, while required to include their proportionate share of the undistributed long-term capital gain in income, will receive a credit or refund for their share of the tax paid by us, and (iii) the basis of a U.S. holder’s stock would be increased by the amount of the undistributed long-term capital gains (minus the amount of capital gains tax paid by us) included in the U.S. holder’s long-term capital gains. If we should fail to distribute during each calendar year at least the sum of (i) 85% of our REIT ordinary income for such year, (ii) 95% of our REIT capital gain net income for such year (other than capital gain income which we elect to retain and pay tax on), and (iii) any undistributed taxable
200
Table of Contents
income from prior periods, we would be subject to a 4% nondeductible excise tax on the excess of such required distribution over the sum of (a) the amounts actually distributed and (b) the amounts we retained and upon which we paid income tax at the corporate level.
We intend to make timely distributions sufficient to satisfy the annual distribution requirement. It is possible that, from time to time, we may not have sufficient cash or other liquid assets to meet the 90% distribution requirement due to timing differences between (i) the actual receipt of income and actual payment of deductible expenses and (ii) the inclusion of such income and deduction of such expenses in calculating our taxable income. For example, (i) income must be accrued for U.S. federal income tax purposes no later than when such income is taken into account as revenue in our financial statements, subject to certain exceptions, which could also create timing differences between net taxable income and the receipt of cash attributable to such income, (ii) newly proposed U.S. Treasury Regulations could limit the deduction we may claim for our proportionate share of the compensation expense attributable to the remuneration paid by the OP for services performed by certain of our highly ranked and highly compensated employees, and (iii) the deductibility of “business interest” for all entities is subject to limitations, which may be elected out of by certain real property trades or businesses, provided that they use an alternative depreciation system to depreciate certain property. We believe that we will be eligible to make this election. If we make this election, although we would not be subject to the interest expense limitation described above, our depreciation deductions may be reduced and, as a result, our REIT taxable income for a taxable year may be increased.
In the event that such an insufficiency occurs, in order to meet the 90% distribution requirement and maintain our status as a REIT, we may have to sell assets at unfavorable prices, borrow on unfavorable terms, pay taxable stock dividends, or pursue other strategies. We do not currently intend to pay taxable stock dividends. However, if for any taxable year, we have significant amounts of taxable income in excess of available cash flow, we may have to declare dividends in cash and stock.
If we make a taxable stock distribution, U.S. holders would be required to include the full amount of the dividend (i.e., the cash and stock portion) as ordinary income to the extent of our current and accumulated earnings and profits for U.S. federal income tax purposes. As a result, a U.S. holder may be required to pay income taxes with respect to such dividends in excess of the cash received. If a U.S. holder sells our stock that it receives as a dividend in order to pay this tax, the sales proceeds may be less than the amount included in income with respect to the dividend, depending on the market price of the stock at the time of the sale. Furthermore, with respect to non-U.S. holders, we may be required to withhold U.S. tax with respect to such dividends, including in respect of all or a portion of such dividend that is payable in stock. In addition, if a significant number of our stockholders determine to sell shares of our stock in order to pay taxes owed on dividends, these sales may put downward pressure on the trading price of our stock.
Under certain circumstances, we may be able to rectify a failure to meet the distribution requirement for a year by paying “deficiency dividends” to stockholders in a later year, which may be included in our deduction for dividends paid for the earlier year. Thus, we may be able to avoid being taxed on amounts distributed as deficiency dividends; however, we will be required to pay interest based upon the amount of any deduction taken for deficiency dividends.
To the extent that we have available net operating losses and capital losses carried forward from prior taxable years, such losses may reduce the amount of distributions that we must make to comply with the annual distribution requirements. However, as a result of the enactment of the TCJA, net operating loss (“NOL”) carryforwards of losses arising in taxable years beginning after December 31, 2017 may be deducted only to the extent of 80% of our “REIT taxable income” in the carryforward year (computed without regard to the NOL deduction). In contrast to prior law, which permitted unused NOL carryforwards to be carried back two years and forward 20 years, the TCJA provides that losses arising in taxable years ending after December 31, 2017 can no longer be carried back but can be carried forward indefinitely. Such losses, however, are not passed through to a holder of our Common Stock and do not offset such stockholder’s income from other sources, nor would they affect the character of any distributions that a stockholder receives from us.
201
Table of Contents
Like-Kind Exchanges
We may dispose of real property that is not held primarily for sale in transactions intended to qualify as like-kind exchanges under the Code. Such like-kind exchanges are intended to result in the deferral of gain for U.S. federal income tax purposes. The failure of any such transaction to qualify as a like-kind exchange could require us to pay U.S. federal income tax, possibly including the 100% prohibited transaction tax, or deficiency dividends, depending on the facts and circumstances surrounding the particular transaction.
Tax Liabilities and Attributes Inherited in Connection with Acquisitions
From time to time, we may acquire other corporations or entities and, in connection with such acquisitions, we may succeed to the historical tax attributes and liabilities of such entities. For example, as a result of the Blocker Corp Mergers, we will inherit any liability with respect to unpaid taxes of each of the Blocker Corps for any periods prior to and including the Blocker Corp Mergers. See “Recapitalization, Internalization, and Structure of Our Company.”
Foreclosure Property
The foreclosure property rules permit us (by our election) to foreclose or repossess properties without being disqualified as a REIT as a result of receiving income that does not qualify under the gross income tests. However, in such a case, we would be subject to the U.S. federal corporate income tax on the net non-qualifying income from the “foreclosure property,” and the after-tax amount would increase the dividends we would be required to distribute to stockholders. See “—Annual Distribution Requirements.” This corporate tax would not apply to income that qualifies under the 75% gross income test.
Foreclosure property treatment will end on the first day on which we enter into a lease of the applicable property that will give rise to income that does not qualify under the 75% gross income test, but will not end if the lease will give rise only to qualifying income under such test. Foreclosure property treatment also will end if any construction takes place on the property (other than completion of a building or other improvement that was more than 10% complete before default became imminent). Foreclosure property treatment is generally available for an initial period of three years and, in certain circumstances, may be extended for an additional three years.
Statutory Relief
If we fail to satisfy one or more of the requirements for qualification as a REIT, other than the income tests and asset tests discussed above, we will not lose our status as a REIT if our failure was due to reasonable cause and not willful neglect, and we pay a penalty of $50,000 for each such failure.
Failure to Qualify as a REIT
If we fail to qualify for taxation as a REIT in any taxable year, and the relief provisions described above do not apply, we will be subject to tax (including, for taxable years beginning before January 1, 2018, any applicable alternative minimum tax) on our taxable income at the corporate tax rate. We also could be subject to increased state and local taxes. Distributions to stockholders in any year in which we fail to qualify will not be deductible by us and they will not be required to be made. In such event, to the extent of current and accumulated earnings and profits, all distributions to stockholders will be taxable as ordinary dividend income. Subject to certain limitations of the U.S. federal income tax laws, corporate stockholders might be eligible for the dividends received deduction and stockholders taxed at individual rates might be eligible for the current reduced U.S. federal income tax rate of 20% on such dividends. Unless entitled to relief under specific statutory provisions, we will also be disqualified from taxation as a REIT for the four taxable years following the year during which qualification was lost, and will not be permitted to requalify unless we distribute any earnings and profits attributable to the period when we failed to qualify. In addition, we may be subject to tax on any built-in gains on
202
Table of Contents
property held during the period during which we did not qualify if we sell such property within five years of requalification, but only to the extent of our net built-in gain at the time of requalification. It is not possible to state whether in all circumstances we would be entitled to such statutory relief.
Built-In Gains Tax
From time to time, we may acquire C corporations in transactions in which the basis of the corporations’ assets in our hands is determined by reference to the basis of the assets in the hands of the acquired corporations (“carryover basis transactions”). In the case of assets we acquire from a C corporation in a carryover basis transaction, if we dispose of any such asset in a taxable transaction (including by deed in lieu of foreclosure) during the five-year period beginning on the date of the carryover basis transaction, then we will be required to pay tax at the corporate income tax rate on the gain recognized to the extent of the built-in gain at the time of the carryover basis transaction. The foregoing result with respect to the recognition of gain assumes that the C corporation will refrain from making an election to receive different treatment under applicable U.S. Treasury Regulations on its tax return for the year in which we acquire the asset from the C corporation. Any taxes we pay as a result of such gain would reduce the amount available for distribution to our stockholders.
Because each of the Blocker Corps is taxable as a non-REIT C corporation and we will acquire their appreciated assets in carryover basis transactions, we will be subject to corporate income tax on the “built-in gain” with respect to the Blocker Corps’ assets at the time of the Blocker Corp Mergers if we dispose of those assets in a taxable transaction within five years following the Blocker Corp Mergers. See “Recapitalization, Internalization, and Structure of Our Company.” This built-in gain is measured by the difference between the value of the Blocker Corps’ assets at the time of the Blocker Corp Mergers and the adjusted basis in those assets. We estimate this built-in gain to be approximately million. The assets of the Blocker Corps we will acquire in the Blocker Corp Mergers are the Blocker Corps’ interests in BRE. When those interests in BRE are contributed by us to the OP in exchange for OP Units and BRE is merged into the OP in tax-deferred transactions, the built-in gain associated with the Blocker Corps’ assets will be represented as part of an intangible asset on our balance sheet. The disposition of that intangible asset in a taxable transaction within five years following the Blocker Corp Mergers could trigger a corporate income tax on that built-in gain. The most likely transaction in which that intangible asset is disposed of would be a sale of the OP (or our interest in the OP) in a taxable transaction. Thus, if the OP (or our interest in the OP) is sold in a taxable transaction within five years following the Blocker Corp Mergers, we could incur a corporate income tax on approximately $ million of built-in gain.
Tax Aspects of the OP, the Subsidiary Partnerships, and the Limited Liability Companies
General
All of our investments will be held directly and indirectly through our OP. The OP will be treated as a partnership for U.S. federal income tax purposes, and we will be treated as owning our proportionate share of the items of income, gain, loss, deduction and credit of the OP for such purposes. In addition, the OP will hold certain of its investments indirectly through subsidiary partnerships and limited liability companies that we believe will be treated as partnerships or disregarded entities for U.S. federal income tax purposes. In general, entities that are treated as partnerships or disregarded entities for U.S. federal income tax purposes are “pass-through” entities which generally are not required to pay federal income tax. Rather, partners or members of such entities are allocated their shares of the items of income, gain, loss, deduction and credit of the partnership or limited liability company, and are potentially required to pay tax on this income, without regard to whether they receive a distribution from the partnership or limited liability company. We will include in our income our share of these partnership and limited liability company items for purposes of the various gross income tests, the computation of our REIT taxable income, and the REIT distribution requirements. Moreover, for purposes of the asset tests, we will include our pro rata share of assets held by our OP, including its share of its subsidiary partnerships and limited liability companies, based on our capital interests in each such entity. See “—Taxation of Our Company.”
203
Table of Contents
Entity Classification
Our interests in the OP and the subsidiary partnerships and limited liability companies involve special tax considerations, including the possibility that the IRS might challenge the status of these entities as partnerships or disregarded entities. For example, an entity that would otherwise be treated as a partnership for U.S. federal income tax purposes may nonetheless be taxable as a corporation if it is treated as a “publicly traded partnership” for U.S. federal income tax purposes. A partnership or limited liability company would be treated as a publicly traded partnership if its interests are traded on an established securities market or are readily tradable on a secondary market or a substantial equivalent thereof, within the meaning of applicable U.S. Treasury Regulations. We do not anticipate that the OP or any subsidiary partnership or limited liability company will be treated as a publicly traded partnership that is taxable as a corporation. However, if any such entity were treated as a corporation, it would be required to pay an entity-level tax on its income. In this situation, the character of our assets and items of gross income would change and could prevent us from satisfying the REIT asset tests and possibly the REIT income tests. See “—Taxation of Our Company—Asset Tests” and “—Income Tests.” This, in turn, could prevent us from qualifying as a REIT. See “—Failure to Qualify” for a discussion of the effect of our failure to meet these tests. In addition, a change in the tax status of the OP or a subsidiary partnership or limited liability company might be treated as a taxable event. If so, we might incur a tax liability without any related cash payment. We believe the OP will be treated as a partnership for U.S. federal income tax purposes, and each of its subsidiary partnerships and limited liability companies will be treated as partnerships or disregarded entities, as applicable, for U.S. federal income tax purposes.
Allocations of Income, Gain, Loss and Deduction
A partnership agreement (or, in the case of a limited liability company treated as a partnership for U.S. federal income tax purposes, the limited liability company agreement) will generally determine the allocation of income and loss among partners. These allocations, however, will be disregarded for tax purposes if they do not comply with the provisions of Section 704(b) of the Code and the U.S. Treasury Regulations thereunder. Generally, Section 704(b) of the Code and the U.S. Treasury Regulations thereunder require that partnership allocations respect the economic arrangement of the partners. If an allocation of partnership income or loss does not comply with the requirements of Section 704(b) of the Code and the U.S. Treasury Regulations thereunder, the item subject to the allocation will be reallocated in accordance with the partners’ interests in the partnership. This reallocation will be determined by taking into account all of the facts and circumstances relating to the economic arrangement of the partners with respect to such item.
Tax Allocations With Respect to the Properties
Under Section 704(c) of the Code, income, gain, loss and deduction attributable to appreciated or depreciated property that is contributed to a partnership (including a limited liability company treated as a partnership for U.S. federal income tax purposes) in exchange for an interest in the partnership must be allocated in a manner so that the contributing partner is charged with the unrealized gain, or benefits from the unrealized loss, associated with the property at the time of the contribution, as adjusted from time to time. The amount of the unrealized gain or unrealized loss generally is equal to the difference between the fair market value or book value and the adjusted tax basis of the contributed property at the time of contribution (this difference is referred to as a book-tax difference), as adjusted from time to time. These allocations are solely for U.S. federal income tax purposes and do not affect the book capital accounts or other economic or legal arrangements among the partners.
Appreciated property has been contributed to the OP in exchange for OP Units. Appreciated property may be contributed to the OP in exchange for OP Units in connection with future acquisitions, including in connection with the Internalization. Those contributions will result in book-tax differences, which will result in us have a lower adjusted tax basis with respect to that portion of the OP’s assets than we would have with respect to assets having a tax basis equal to fair market value at the time of acquisition. This will result in lower depreciation
204
Table of Contents
deductions with respect to the portion of the OP’s assets attributable to such contributions, which could cause us to be allocated tax gain in excess of book gain in the event of a property disposition. The partnership agreement requires that allocations be made in a manner consistent with Section 704(c) of the Code. U.S. Treasury Regulations issued under Section 704(c) of the Code provide partnerships with a choice of several methods of accounting for book-tax differences. Any book-tax differences will be accounted for using any method approved under Section 704(c) of the Code and the applicable U.S. Treasury Regulations as chosen by us as managing member of the OP, subject to compliance with the terms of our tax protection agreements. Under certain available methods, the carryover basis of contributed properties in the hands of the OP (i) could cause us to be allocated lower amounts of depreciation deductions for tax purposes than would be allocated to us if all contributed properties were to have a tax basis equal to their fair market value at the time of the contribution and (ii) in the event of a sale of such properties, could cause us to be allocated taxable gain in excess of the economic or book gain allocated to us as a result of such sale, with a corresponding benefit to the contributing partners. An allocation described in (ii) above might cause us to recognize taxable income in excess of cash proceeds in the event of a sale or other disposition of property, which may adversely affect our ability to comply with the REIT distribution requirements and may result in a greater portion of our distributions being taxed as dividends. Any property acquired by the OP in a taxable transaction will initially have a tax basis equal to its fair market value, and Section 704(c) of the Code will not apply.
Partnership Audit Rules
New rules applicable to U.S. federal income tax audits of partnerships apply to any subsidiary partnership including the OP and any entity in which we directly or indirectly invest that is treated as a partnership for U.S. federal income tax purposes. Any audit adjustment to items of income, gain, loss, deduction, or credit of a partnership (and any partner’s distributive share thereof) is determined, and taxes, interest, or penalties attributable thereto are assessed and collected, at the partnership level regardless of changes in composition of the partners (or their relative ownership) between the year under audit and the year of the adjustment. The rules could result in partnerships in which we directly or indirectly invest being required to pay additional taxes, interest and penalties as a result of an audit adjustment, and we, as a direct or indirect partner of these partnerships, could be required to bear the economic burden of those taxes, interest, and penalties even though we, as a REIT, may not otherwise have been required to pay additional corporate-level taxes as a result of the related audit adjustment. Under certain procedures, the partnership-level tax liability may take into account the fact that we generally do not pay federal income tax. The rules also include an elective alternative method under which the additional taxes resulting from the adjustment are assessed from the affected partners, subject to a higher rate of interest than otherwise would apply. These rules could increase the U.S. federal income tax, interest, and/or penalties economically borne by us in the event of a U.S. federal income tax audit of a subsidiary partnership in comparison to prior law. Investors are urged to consult their tax advisors with respect to these changes and their potential impact on their investment in our Common Stock (including our Class A Common Stock).
Taxation of U.S. Holders of Our Class A Common Stock (and the Common Stock Into Which Our Class A Common Stock is Converted)
REIT Distributions
Distributions Generally. As long as we qualify as a REIT, distributions by us to a U.S. holder out of our current and accumulated earnings and profits (and not designated as capital gains dividends) will be taken into account by such U.S. holder as ordinary income. Dividends paid by us to a corporate U.S. holder will not be eligible for the dividends received deduction for corporations. In addition, dividends paid by a REIT to a U.S. holder taxed at individual rates generally will not qualify for the 20% U.S. federal income tax rate for “qualified dividend income.” The maximum U.S. federal income tax rate on qualified dividend income is lower than the maximum U.S. federal income tax rate on ordinary income, which is currently 37%. Qualified dividend income generally includes dividends paid to U.S. holders taxed at individual rates by domestic C corporations and certain qualified foreign corporations. Because we are not generally subject to U.S. federal income tax on the portion of
205
Table of Contents
our REIT taxable income distributed to our stockholders, our dividends generally will not be eligible for the 20% rate on qualified dividend income. As a result, our ordinary REIT dividends will be taxed at the higher U.S. federal income tax rate applicable to ordinary income. However, under the TCJA, the effective tax rate on ordinary REIT dividends for U.S. holders of shares of our Common Stock (including our Class A Common Stock) that are individuals, estates or trusts is effectively reduced by permitting such holders to claim a deduction in determining their taxable income equal to 20% of any such dividends they receive. The deduction is set to expire after December 31, 2025. In addition, the 20% U.S. federal income tax rate for qualified dividend income will apply to our ordinary REIT dividends, if any, that are (i) attributable to dividends received by us from non-REIT U.S. corporations, such as a domestic TRS, and (ii) to the extent generally attributable to income upon which we (or a predecessor) have paid U.S. federal corporate income tax (e.g., any C corporation earnings and profits that we will succeed to in the Blocker Corp Mergers, any net “built-in gain” we recognize with respect to the Blocker Corps’ assets owned at the time of the Blocker Corp Mergers that is subject to U.S. federal corporate income tax within 5 years, or to the extent that we distribute less than 100% of our taxable income). In general, to qualify for the reduced U.S. federal income tax rate on qualified dividend income, a U.S. holder must hold the relevant Common Stock (or Class A Common Stock, as applicable) for more than 60 days during the 121-day period beginning on the date that is 60 days before the date on which such stock becomes ex-dividend.
A distribution in excess of current and accumulated earnings and profits will first be treated as a tax-free return of capital, reducing the tax basis in the U.S. holder’s Common Stock (or Class A Common Stock, as applicable), and a distribution in excess of the U.S. holder’s tax basis in its Common Stock (or Class A Common Stock, as applicable) will be a taxable gain realized from the sale of such shares. Dividends declared by us in October, November or December of any year payable to a stockholder of record on a specified date in any such month shall be treated as both paid by us and received by the stockholder on December 31 of such year, provided that the dividend is actually paid by us during January of the following calendar year. We will be treated as having sufficient earnings and profits to treat as a dividend any distribution by us up to the amount required to be distributed in order to avoid imposition of the 4% nondeductible excise tax discussed under “—Taxation of Our Company—General” and “—Taxation of Our Company—Annual Distribution Requirements” above. As a result, U.S. holders may be required to treat as taxable dividends certain distributions that would otherwise result in tax-free returns of capital. Moreover, any “deficiency dividend” will be treated as a “dividend” (an ordinary dividend or a capital gain dividend, as the case may be), regardless of our earnings and profits.
Capital Gain Distributions. Distributions that are designated by us as capital gain dividends will be treated as long-term capital gain (to the extent they do not exceed our actual net capital gain) for the taxable year without regard to the period for which the stockholder has held its stock. However, corporate stockholders may be required to treat up to 20% of certain capital gains dividends as ordinary income, pursuant to Section 291(d) of the Code. If we elect to retain capital gains rather than distribute them, a U.S. holder will be deemed to receive a capital gain dividend equal to the amount of such retained capital gains. In such a case, a U.S. holder will receive certain tax credits and basis adjustments reflecting the deemed distribution and deemed payment of taxes by the U.S. holder.
Dispositions of Our Class A Common Stock (or the Common Stock Into Which Our Class A Common Stock is Converted)
In general, a U.S. holder will realize gain or loss upon the sale, redemption, or other taxable disposition of our Common Stock (including our Class A Common Stock) in an amount equal to the difference between the sum of the fair market value of any property received and the amount of cash received in such disposition, and the U.S. holder’s adjusted tax basis in our Common Stock (or Class A Common Stock, as applicable) at the time of the disposition. In general, a U.S. holder’s tax basis will equal the U.S. holder’s acquisition cost, increased by the excess of net capital gains deemed distributed to the U.S. holder, less tax deemed paid on it, and reduced by returns of capital. Gain from the sale or disposition of our Common Stock (including our Class A Common Stock) held for more than one year will generally be long-term capital gain. Capital losses recognized by a U.S. holder upon the disposition of shares of our Common Stock (including our Class A Common Stock) held for more than one year at the time of disposition will be considered long-term capital losses, and are generally
206
Table of Contents
available only to offset capital gain income of the U.S. holder but not ordinary income, except in the case of individuals, who may offset up to $3,000 of ordinary income each year. In addition, any loss upon a sale or exchange of shares of our Common Stock (including our Class A Common Stock) by a U.S. holder who has held such shares for six months or less, after applying holding period rules, will be treated as a long-term capital loss to the extent of distributions received from us that are required to be treated by the U.S. holder as long-term capital gain.
If a U.S. holder recognizes a loss upon a disposition of our Common Stock (including our Class A Common Stock) in an amount that exceeds a prescribed threshold, it is possible that the provisions of U.S. Treasury Regulations involving “reportable transactions” could apply, with a resulting requirement to separately disclose the loss-generating transaction to the IRS. While these U.S. Treasury Regulations are directed towards “tax shelters,” they are written quite broadly, and apply to transactions that would not typically be considered tax shelters. In addition, there are significant penalties for failure to comply with these requirements. Each prospective holder of our Common Stock (including our Class A Common Stock) should consult its tax advisor concerning any possible disclosure obligation with respect to the receipt or disposition of our Common Stock (including our Class A Common Stock), or transactions that might be undertaken directly or indirectly by us. Moreover, holders should be aware that we and other participants in the transactions involving us (including our advisors) may be subject to disclosure or other requirements pursuant to these U.S. Treasury Regulations.
Class A Conversion
A U.S. holder generally will not recognize gain or loss upon the conversion of its Class A Common Stock into Common Stock. A U.S. holder’s basis in the Common Stock received upon conversion generally will be the same as its basis in the converted Class A Common Stock. A U.S. holder’s holding period in the shares of Common Stock received upon conversion will include the period during which such holder held the converted shares of Class A Common Stock.
Passive Activity Losses and Investment Interest
Distributions made by us and gain arising from the sale or exchange by a U.S. holder of shares of our Common Stock (including our Class A Common Stock) will not be treated as passive activity income. As a result, U.S. holders will not be able to apply any “passive losses” against income or gain relating to shares of our Common Stock (including our Class A Common Stock). Distributions made by us, to the extent they do not constitute return of capital, generally will be treated as investment income for purposes of computing the investment interest limitation.
Additional Tax on Net Investment Income
A U.S. holder that is an individual or estate, or a trust that does not fall into a special class of trusts that is exempt from such tax, will generally be subject to a 3.8% tax on the lesser of (i) the U.S. holder’s “net investment income” for a taxable year and (ii) the excess of the U.S. holder’s modified adjusted gross income for such taxable year over $200,000 ($250,000 in the case of joint filers). For these purposes, “net investment income” will generally include taxable distributions and deemed distributions paid with respect to stock, interest on debt obligations, other types of investment income, and net gain attributable to the disposition of stock or debt obligations and other types of investment gain (in each case, unless such stock, debt instruments or other investment property, as the case may be, are held in connection with certain trades or businesses), but will be reduced by any deductions properly allocable to such distributions, interest, income or net gain.
Information Reporting and Backup Withholding Tax
We will report to a U.S. holder and the IRS the amount of distributions we pay during each calendar year and the amount of tax we withhold, if any. Under the backup withholding rules, a U.S. holder of our Common
207
Table of Contents
Stock (including our Class A Common Stock) may be subject to backup withholding (currently at a maximum rate of 24%) with respect to distributions unless such U.S. holder:
| • | is a corporation or comes within certain other exempt categories and, when required, demonstrates this fact; or |
| • | provides an accurate taxpayer identification number, certifies as to no loss of exemption from backup withholding, and otherwise complies with the applicable requirements of the backup withholding rules. |
Any amount paid as backup withholding will be creditable against a U.S. holder’s income tax liability, provided that proper information is timely provided to the IRS.
U.S. holders should consult their tax advisors with respect to the U.S. federal, state and local and non-U.S. tax consequences to them of an investment in our Common Stock (including our Class A Common Stock), including applicable tax rates and tax reporting requirements, and the effect of any possible changes in the tax laws.
Taxation of Non-U.S. Holders of Our Class A Common Stock (and the Common Stock Into Which Our Class A Common Stock is Converted)
The rules governing U.S. federal income taxation of holders of shares of our Common Stock (including our Class A Common Stock) that are not U.S. holders or partnerships for U.S. federal income tax purposes and that are not subject to U.S. federal income tax on a net income basis and that neither own nor have owned actually or constructively more than 10% of our Common Stock (including our Class A Common Stock), which we call “non-U.S. holders,” are complex. The following discussion is only a limited summary of these rules. In addition, non-U.S. holders should be aware that certain other rules (not discussed herein) may apply, including whether an interest in a REIT is treated as a United States real property interest (“USRPI”) as defined in Section 897 of the Code, with respect to certain non-U.S. holders. Non-U.S. holders that own or have owned actually or constructively more than 10% of our Common Stock (including our Class A Common Stock) generally will be subject to U.S. federal withholding tax and U.S. federal income tax (and U.S. federal income tax return tax filing obligations) upon the sale or other disposition of our Common Stock (including our Class A Common Stock) (unless we are, and remain a “domestically controlled qualified investment entity”) or distributions that are treated as attributable to gain from sales or exchanges by us of USRPIs (subject to exceptions for (i) certain non-U.S. publicly traded stockholders that meet certain record-keeping and other requirements (“qualified stockholders”), except to the extent owners of such qualified stockholders that are not also qualified stockholders own, actually or constructively, more than 10% of our Common Stock (including our Class A Common Stock), and (ii) certain “qualified foreign pension funds” and entities all of the interests of which are held by “qualified foreign pension funds”).
Prospective non-U.S. holders should consult their tax advisors with respect to the U.S. federal, state and local and non-U.S. tax consequences to them of an investment in our Common Stock (including our Class A Common Stock), including any tax reporting requirements.
REIT Distributions
Ordinary Dividends. Distributions, other than distributions that are treated as attributable to gain from sales or exchanges by us of USRPIs, and other than distributions designated by us as capital gain dividends, will be treated as ordinary income to the extent that they are made out of our current or accumulated earnings and profits. A U.S. withholding tax equal to 30% of the gross amount of the distribution will ordinarily apply to distributions of this kind to non-U.S. holders, unless an applicable tax treaty reduces that tax. However, if income from a non-U.S. holder’s investment in our Common Stock (including our Class A Common Stock) is treated as effectively connected with the non-U.S. holder’s conduct of a U.S. trade or business or attributable to a permanent establishment that the non-U.S. holder maintains in the United States if required by an applicable income tax treaty as a condition for subjecting the non-U.S. holder to U.S. taxation on a net income basis, U.S.
208
Table of Contents
federal income tax at graduated rates will generally apply to the non-U.S. holder in the same manner as U.S. holders are taxed with respect to dividends, and the 30% U.S. branch profits tax may also apply if the non-U.S. holder is a foreign corporation (unless an applicable tax treaty reduces that tax). We expect to withhold U.S. tax at the rate of 30% on the gross amount of any dividends, other than dividends treated as attributable to gain from sales or exchanges of USRPIs and capital gain dividends, paid to a non-U.S. holder, unless (a) a lower treaty rate applies and the required form evidencing eligibility for that reduced rate is filed with us or the appropriate withholding agent or (b) the non-U.S. holder files an IRS Form W-8ECI or a successor form with us or the appropriate withholding agent claiming that the distributions are effectively connected with the non-U.S. holder’s conduct of a U.S. trade or business and in either case other applicable requirements were met.
Distributions in excess of our current and accumulated earnings and profits, which are not treated as attributable to the gain from our disposition of a USRPI, will not be taxable to a non-U.S. holder to the extent that they do not exceed the non-U.S. holder’s adjusted tax basis in its Common Stock (or Class A Common Stock, as applicable). Distributions of this kind will instead reduce the non-U.S. holder’s adjusted tax basis in its Common Stock (or Class A Common Stock, as applicable). To the extent that distributions of this kind exceed a non-U.S. holder’s adjusted tax basis in its Common Stock (or Class A Common Stock, as applicable), they will give rise to tax liability if the non-U.S. holder otherwise would have to pay U.S. federal tax on any gain from the sale or disposition of its Common Stock (or Class A Common Stock, as applicable), as described below. If it cannot be determined at the time a distribution is made whether the distribution will be in excess of current and accumulated earnings and profits, we will withhold U.S. federal withholding tax at the rate applicable to dividends on the distribution. However, the non-U.S. holder may seek a refund of these amounts from the IRS if it is subsequently determined that the distribution was, in fact, in excess of our current and accumulated earnings and profits.
Capital Gain Dividends. Assuming that our Class A Common Stock (or Common Stock, as applicable) is regularly traded on an established securities market in the United States, capital gain distributions on our Class A Common Stock (or Common Stock, as applicable) that are attributable to gain on our sale of USRPIs will be treated as ordinary dividends rather than as gain from the sale of a USRPI. As a result, non-U.S. holders generally will be subject to U.S. withholding tax on such capital gain distributions in the same manner as they are subject to U.S. withholding tax on ordinary dividends as described above in “—Ordinary Dividends.”
Dispositions of Our Common Stock (Including Our Class A Common Stock)
Assuming that our Class A Common Stock (or Common Stock, as applicable) is regularly traded on an established securities market, a non-U.S. holder generally will not be subject to U.S. federal income tax on gain realized on a sale or other disposition of our Class A Common Stock (or Common Stock, as applicable).
However, a non-U.S. holder generally will incur U.S. federal income tax on gain if:
| • | the gain is effectively connected with the non-U.S. holder’s U.S. trade or business, in which case the non-U.S. holder will be subject to the same treatment as U.S. holders with respect to such gain, or |
| • | the non-U.S. holder is a nonresident alien individual who was present in the United States for 183 days or more during the taxable year and meets certain other criteria, in which case the non-U.S. holder will incur a U.S. federal tax of 30% on his or her net capital gains. |
Class A Conversion
A non-U.S. holder generally will not recognize gain or loss upon the conversion of Class A Common Stock into Common Stock.
Foreign Account Tax Compliance Act (FATCA)
Pursuant to U.S. withholding provisions commonly referred to as the Foreign Account Tax Compliance Act (“FATCA”), payments to certain non-U.S. holders of dividends on our Common Stock (including our Class A
209
Table of Contents
Common Stock) will generally be subject to a withholding tax of 30%, unless such non-U.S. holders are compliant with various reporting requirements under FATCA. In order to be compliant with FATCA, among other requirements, such certain non-U.S. holders may need to register with the IRS and may need to obtain certain information from its interest holders and disclose certain of this information to the IRS or its local tax authority under the terms of an intergovernmental agreement. No assurance can be provided that non-U.S. holders will not be subject to this withholding tax. Non-U.S. holders should consult their tax advisors regarding the potential implications of this withholding tax.
Information Reporting and Backup Withholding Tax
Dividends paid to a non-U.S. holder may be subject to U.S. information reporting and backup withholding. A non-U.S. holder will be exempt from backup withholding if the non-U.S. holder provides a properly executed IRS Form W-8BEN or W-8BEN-E, as applicable, or otherwise meets documentary evidence requirements for establishing its status as a non-U.S. holder or otherwise establishes an exemption.
The gross proceeds from the disposition of our Common Stock (including our Class A Common Stock) may be subject to U.S. information reporting and backup withholding. If a non-U.S. holder sells our Common Stock (including our Class A Common Stock) outside the United States through a non-U.S. office of a non-U.S. broker and the sales proceeds are paid to the non-U.S. holder outside the United States, then the U.S. backup withholding and information reporting requirements generally will not apply to that payment. However, U.S. information reporting, but not U.S. backup withholding, will apply to a payment of sales proceeds, even if that payment is made outside the United States, if a non-U.S. holder sells our Common Stock (including our Class A Common Stock) through a non-U.S. office of a broker that is a United States person or has certain enumerated connections with the United States, unless the broker has documentary evidence in its files that the non-U.S. holder is not a United States person and certain other conditions are met or the non-U.S. holder otherwise establishes an exemption.
If a non-U.S. holder receives payments of the proceeds of a sale of our Common Stock (including our Class A Common Stock) to or through a U.S. office of a broker, the payment is subject to both U.S. backup withholding and information reporting unless the non-U.S. holder provides a properly executed IRS Form W-8BEN or W-8BEN-E, as applicable, certifying that the non-U.S. holder is not a “United States person” or the non-U.S. holder otherwise establishes an exemption.
A non-U.S. holder generally may obtain a refund of any amounts withheld under the backup withholding rules that exceed the non-U.S. holder’s U.S. federal income tax liability by timely filing a refund claim with the IRS.
Non-U.S. holders should consult their tax advisors with respect to the U.S. federal income and withholding tax consequences, and state, local and non-U.S. tax consequences, of an investment in shares of our Common Stock (including our Class A Common Stock), including applicable tax reporting requirements.
Legislative or Other Actions Affecting REITs
The rules dealing with U.S. federal income taxation are constantly under review by persons involved in the legislative process and by the IRS and the U.S. Department of the Treasury. No assurance can be given as to whether, or in what form, any proposals affecting REITs or their stockholders will be enacted. In particular, the TCJA, for which only limited guidance has been issued to date, significantly reforms the Code with respect to the taxation of both individuals and corporate entities, and there are numerous interpretive issues and ambiguities that are not yet clearly addressed, which require further guidance, including possibly in some cases, technical corrections. It is unclear if and when such guidance will be forthcoming, or in the case of technical corrections, will be enacted. Future regulatory guidance and legislation may significantly affect the impact of the TCJA.
210
Table of Contents
Changes to the U.S. federal tax laws and interpretations thereof could adversely affect an investment in our Common Stock (including our Class A Common Stock).
Other Tax Consequences
State, local and non-U.S. income tax laws may differ substantially from the corresponding U.S. federal income tax laws, and this discussion does not purport to describe any aspect of the tax laws of any state, local or non-U.S. jurisdiction, or any U.S. federal tax other than the income tax. You should consult your tax advisor regarding the effect of state, local and non-U.S. tax laws with respect to our tax treatment as a REIT and on an investment in our Common Stock (including our Class A Common Stock).
211
Table of Contents
The following is a summary of certain considerations associated with the investment in our shares of Common Stock (including our Class A Common Stock) by employee benefit plans that are subject to ERISA, plans, individual retirement accounts, and other arrangements that are subject to Section 4975 of the Code or provisions under any other federal, state, local, non-U.S., or other laws or regulations that are similar to such provisions of ERISA or the Code (collectively, “Similar Laws”), and entities whose underlying assets are considered to include “plan assets” (within the meaning of Section 3(42) of ERISA) of any such plan, account, or arrangement (each, a “Plan”).
General Fiduciary Matters
ERISA and the Code impose certain duties on persons who are fiduciaries of a Plan subject to Title I of ERISA or Section 4975 of the Code (an “ERISA Plan”) and prohibit certain transactions involving the assets of an ERISA Plan and its fiduciaries or other interested parties. Under ERISA and the Code, any person who exercises any discretionary authority or control over the administration of such an ERISA Plan or the management or disposition of the assets of such an ERISA Plan, or who renders investment advice for a fee or other compensation to such an ERISA Plan, is generally considered to be a fiduciary of the ERISA Plan.
In considering an investment in our shares of our Class A Common Stock with the assets of any Plan, a fiduciary should consider the Plan’s particular circumstances, as well as the facts in connection with the offering of our shares of Class A Common Stock, and determine whether the investment in the shares of our Class A Common Stock is in accordance with the documents and instruments governing the Plan and the applicable provisions of ERISA, the Code, or any Similar Law relating to a fiduciary’s duties to the Plan including, without limitation, the prudence, diversification, delegation of control, and prohibited transaction provisions of ERISA, the Code, and any other applicable Similar Laws.
Prohibited Transaction Issues
Section 406 of ERISA and Section 4975 of the Code prohibit ERISA Plans from engaging in specified transactions involving plan assets with persons or entities who are “parties in interest,” within the meaning of ERISA, or “disqualified persons,” within the meaning of Section 4975 of the Code, unless an exemption is available. A party in interest or disqualified person who engages in a non-exempt prohibited transaction may be subject to excise taxes and other penalties and liabilities under ERISA and the Code. In addition, the fiduciary of the ERISA Plan that engages in such a non-exempt prohibited transaction may be subject to penalties and liabilities under ERISA and the Code. The acquisition and/or holding of shares of Common Stock (including our Class A Common Stock) by an ERISA Plan with respect to which the issuer or the initial purchaser is considered a party in interest or a disqualified person may constitute or result in a direct or indirect prohibited transaction under Section 406 of ERISA and/or Section 4975 of the Code, unless the investment is acquired and is held in accordance with an applicable statutory, class or individual prohibited transaction exemption.
Because of the foregoing, shares of Class A Common Stock should not be purchased or held by any person investing “plan assets” of any Plan, unless such purchase and holding will not constitute a non-exempt prohibited transaction under ERISA and the Code or similar violation of any applicable Similar Laws.
Plan Asset Issues
In addition, a fiduciary of a Plan should consider whether the Plan will, if it invests in our shares of Class A Common Stock, be deemed to own an undivided interest in our assets, which would result in our becoming a fiduciary of the Plan and subject our assets and operations to the regulatory restrictions of ERISA, the Code, and any applicable Similar Laws, including their respective prohibited transaction restrictions, unless an exception applies.
212
Table of Contents
The regulations issued by the U.S. Department of Labor concerning the definition of what constitutes the assets of an employee benefit plan (the “plan asset regulations”) provide, as a general rule, that the underlying assets and properties of corporations, partnerships, trusts, and certain other entities in which a plan purchases an “equity interest” will be deemed, for purposes of ERISA, to be assets of the investing plan unless any applicable exceptions applies. Under the plan asset regulations, an exception is available (and therefore the general described above would not apply) with respect to an equity investment in “publicly offered securities,” which means, generally, under the plan asset regulations, equity securities of an entity that are (a) widely held (i.e., held by 100 or more investors who are independent of the issuer and each other); (b) freely transferable; and (c) part of a class of securities registered under Section 12(b) or 12(g) of the Exchange Act. Other exemptions include investments in equity securities of an “operating company (as defined in the plan asset regulations) and investments in entities where there is no significant investment by “benefit plan investors” (as defined in the plan asset regulations). Our Class A Common Stock being offered pursuant to this prospectus are part of a class of shares that is being registered under section 12(b) of the Exchange Act, and we believe we will also meet the other criteria to qualify for the “publicly offered securities” exemption; therefore, we do not believe that our underlying assets will be treated under the plan asset regulations as the assets of any Plan that acquires and/or holds our Common Stock (including our Class A Common Stock). However, qualification under the “publicly offered securities” or another exemption cannot be guaranteed.
The foregoing discussion is general in nature and is not intended to be all inclusive or constitute legal advice. This discussion is based on the provisions of ERISA and the Code, and related regulations and guidance thereunder, as of the date of this prospectus, and no assurance can be given that future legislation, court decisions, regulations rulings, or other guidance will not modify the requirements described above. Due to the complexity of these rules and the excise taxes, penalties, and liabilities that may be imposed upon persons involved in non-exempt prohibited transactions, it is particularly important that fiduciaries, or other persons considering acquiring and/or holding shares of our Common Stock (including our Class A Common Stock) on behalf of, or with the assets of, any Plan, consult with their counsel regarding the potential applicability of ERISA, Section 4975 of the Code, and any Similar Laws to such investment and whether an exemption would be applicable to the acquisition and holding of the shares of Common Stock. Each purchaser of shares of Class A Common Stock has exclusive responsibility for ensuring that their acquisition and holding of shares of our Common Stock complies with the fiduciary responsibility rules of ERISA and does not violate the fiduciary or prohibited transaction rules of ERISA, the Code, or applicable Similar Laws. The sale of any shares of Common Stock (including our Class A Common Stock) to a Plan is in no respect a representation by us or any of our affiliates or representatives that such an investment meets all relevant legal requirements with respect to investments by Plans generally or any particular Plan or that such investment is appropriate for Plans generally or any particular Plan.
213
Table of Contents
Broadstone Net Lease, Inc., Broadstone Net Lease, LLC, and the underwriters named below have entered into an underwriting agreement with respect to the shares of Class A Common Stock being offered. Subject to certain conditions, each underwriter has severally agreed to purchase the number of shares of Class A Common Stock indicated in the following table. J.P. Morgan Securities LLC and Goldman Sachs & Co. LLC are the representatives of the underwriters.
| Underwriters |
Number of Shares | |||
| J.P. Morgan Securities LLC |
||||
| Goldman Sachs & Co. LLC |
||||
|
|
|
|||
| Total |
||||
|
|
|
|||
The underwriters are committed to take and pay for all of the shares of Class A Common Stock being offered, if any are taken, other than the shares of Class A Common Stock covered by the option described below unless and until this option is exercised. The underwriting agreement also provides that if an underwriter defaults, the purchase commitments of non-defaulting underwriters may also be increased or the offering may be terminated.
The underwriters have an option to buy up to an additional shares of Class A Common Stock from us to cover sales by the underwriters of a greater number of shares of Class A Common Stock than the total number set forth in the table above. They may exercise the option for 30 days. If any shares of Class A Common Stock are purchased pursuant to the option, the underwriters will severally purchase shares of Class A Common Stock in approximately the same proportion as set forth in the table above.
The following table shows the per share and total underwriting discounts to be paid to the underwriters by us. Such amounts are shown assuming both no exercise and full exercise of the underwriters’ option to purchase up to additional shares of Class A Common Stock.
Paid by Us
| No Exercise | Full Exercise | |||||||
| Per Share |
$ | $ | ||||||
| Total |
$ | $ | ||||||
Shares of Class A Common Stock sold by the underwriters to the public will initially be offered at the initial public offering price set forth on the cover of this prospectus. Any shares of Class A Common Stock sold by the underwriters to securities dealers may be sold at a discount of up to $ per share from the initial public offering price. After the initial offering of the shares of Class A Common Stock, the representatives may change the offering price and the other selling terms. The offering of the shares of Class A Common Stock by the underwriters is subject to receipt and acceptance and subject to the underwriters’ right to reject any order in whole or in part. Sales of shares of Class A Common Stock made outside of the United States may be made by affiliates of the underwriters.
We, all of our officers and directors, and certain holders of shares of our Common Stock and OP Units prior to this offering have agreed with the underwriters, subject to certain exceptions, not to offer, sell, contract to sell, pledge, grant any option to purchase, make any short sale, or otherwise dispose of or hedge any of their Common Stock, or any options or warrants to purchase any shares of Common Stock of the Company, or any securities convertible into, exchangeable for, or that represent the right to receive shares of Common Stock of the Company (including OP Units), whether now owned or hereinafter acquired, owned directly by us, or these other persons (including holding as a custodian) or with respect to which we or such other persons have beneficial ownership within the rules and regulations of the SEC during the period from the date of this prospectus continuing through the date 180 days after the date of this prospectus.
214
Table of Contents
The restrictions described in the immediately preceding paragraph do not apply to, with respect to us or the OP:
| • | the shares of Class A Common Stock sold in this offering to the underwriters; |
| • | any Common Stock or securities issued pursuant to an employee stock option plan existing on the date of this prospectus; and |
| • | any Common Stock or securities convertible or exchangeable for Common Stock outstanding pursuant to an employee stock option plan as of the date of this prospectus. |
In addition, the transfer restrictions above with respect to officers, directors, and such holders do not apply to a transfer that satisfies one of the following conditions:
| • | is a bona fide gift or gifts, provided that the donee or donees thereof agree to be bound in writing by the restrictions described herein; |
| • | is to any trust for the direct or indirect benefit of such officers, directors, or holders or the immediate family of such officers, directors, or holders, provided that the trustee of the trust agrees to be bound in writing by the restrictions described herein, and provided further that any such transfer shall not involve a disposition for value; or |
| • | with the prior written consent of the representatives of the underwriters. |
Prior to the offering, there has been no public market for the shares of our Class A Common Stock. The initial public offering price has been negotiated among us and the representatives. Among the factors to be considered in determining the initial public offering price of the shares of Class A Common Stock, in addition to prevailing market conditions, will be our historical performance, estimates of our business potential and earnings prospects, an assessment of our management, and the consideration of the above factors in relation to market valuation of companies in related businesses. Neither we nor the underwriters can assure investors that an active trading market will develop for our Class A Common Stock, or that the shares of Class A Common Stock will trade in the public market at or above the initial public offering price.
We intend to apply to list the Class A Common Stock on the NYSE under the symbol “BNL.” In order to meet one of the requirements for listing the Class A Common Stock on the NYSE, the underwriters have undertaken to sell lots of 100 or more shares of Class A Common Stock to a minimum of 400 beneficial holders.
In connection with the offering, the underwriters may purchase and sell Class A Common Stock in the open market. These transactions may include short sales, stabilizing transactions, and purchases to cover positions created by short sales. Short sales involve the sale by the underwriters of a greater number of shares of Class A Common Stock than they are required to purchase in the offering, and a short position represents the amount of such sales that have not been covered by subsequent purchases. A “covered short position” is a short position that is not greater than the amount of additional shares of Class A Common Stock for which the underwriters’ option to purchase additional Class A Common Stock described above may be exercised. The underwriters may cover any covered short position by either exercising their option to purchase additional shares of Class A Common Stock or purchasing shares of Class A Common Stock in the open market. In determining the source of shares of Class A Common Stock to cover the covered short position, the underwriters will consider, among other things, the price of shares of Class A Common Stock available for purchase in the open market as compared to the price at which they may purchase additional shares of Class A Common Stock pursuant to the option described above. “Naked” short sales are any short sales that create a short position greater than the amount of additional shares of Class A Common Stock for which the option to purchase additional Class A Common Stock described above may be exercised. The underwriters must cover any such naked short position by purchasing shares of Class A Common Stock in the open market. A naked short position is more likely to be created if the underwriters are concerned that there may be downward pressure on the price of the Class A Common Stock in the open market after pricing that could adversely affect investors who purchase in the offering. Stabilizing transactions consist of
215
Table of Contents
various bids for or purchases of Class A Common Stock made by the underwriters in the open market prior to the completion of the offering.
The underwriters also may impose a penalty bid. This occurs when a particular underwriter repays to the underwriters a portion of the underwriting discount received by it because the representatives have repurchased shares of Class A Common Stock sold by or for the account of such underwriter in stabilizing or short covering transactions.
Purchases to cover a short position and stabilizing transactions, as well as other purchases by the underwriters for their own accounts, may have the effect of preventing or retarding a decline in the market price of our Class A Common Stock, and together with the imposition of the penalty bid, may stabilize, maintain or otherwise affect the market price of the Class A Common Stock. As a result, the price of the Class A Common Stock may be higher than the price that otherwise might exist in the open market. The underwriters are not required to engage in these activities and may end any of these activities at any time. These transactions may be effected on NYSE, in the over-the-counter market or otherwise.
Other than in the United States, no action has been taken by us or the underwriters that would permit a public offering of the shares of Class A Common Stock offered by this prospectus in any jurisdiction where action for that purpose is required. The Class A Common Stock offered by this prospectus may not be offered or sold, directly or indirectly, nor may this prospectus or any other offering material or advertisements in connection with the offer and sale of any such securities be distributed or published in any jurisdiction, except under circumstances that will result in compliance with the applicable rules and regulations of that jurisdiction. Persons into whose possession this prospectus comes are advised to inform themselves about and to observe any restrictions relating to the offering and the distribution of this prospectus.
European Economic Area
In relation to each Member State of the European Economic Area (each a “Member State”), no shares of Class A Common Stock have been offered or will be offered pursuant to the offering to the public in that Member State prior to the publication of a prospectus in relation to the Class A Common Stock which has been approved by the competent authority in that Member State or, where appropriate, approved in another Member State and notified to the competent authority in that Member State, all in accordance with the Prospectus Regulation), except that offers of Class A Common Stock may be made to the public in that Member State at any time under the following exemptions under the Prospectus Regulation:
| (a) | to any legal entity which is a qualified investor as defined under the Prospectus Regulation; |
| (b) | to fewer than 150 natural or legal persons (other than qualified investors as defined under the Prospectus Regulation), subject to obtaining the prior consent of the representatives for any such offer; or |
| (c) | in any other circumstances falling within Article 1(4) of the Prospectus Regulation, |
provided that no such offer of Class A Common Stock shall require the Company or any representative to publish a prospectus pursuant to Article 3 of the Prospectus Regulation or supplement a prospectus pursuant to Article 23 of the Prospectus Regulation.
For the purposes of this provision, the expression an “offer to the public” in relation to any Class A Common Stock in any Member State means the communication in any form and by any means of sufficient information on the terms of the offer and any Class A Common Stock to be offered so as to enable an investor to decide to purchase or subscribe for any Class A Common Stock, and the expression “Prospectus Regulation” means Regulation (EU) 2017/1129.
The shares of Class A Common Stock described herein are not intended to be offered, sold or otherwise made available to and should not be offered, sold or otherwise made available to any retail investor in the
216
Table of Contents
European Economic Area (“EEA”). For these purposes, a retail investor means a person who is one (or more) of: (i) a retail client as defined in point (11) of Article 4(1) of Directive 2014/65/EU (“MiFID II”); (ii) a customer within the meaning of Directive 2002/92/EC (“IMD”), where that customer would not qualify as a professional client as defined in point (10) of Article 4(1) of MiFID II; or (iii) not a qualified investor as defined in the Prospectus Regulation. Consequently no key information document required by Regulation (EU) No 1286/2014 (the “PRIIPs Regulation”) for offering or selling any of the shares of Class A Common Stock described herein or otherwise making such securities available to retail investors in the EEA has been prepared and therefore offering or selling the shares of Class A Common Stock or otherwise making them available to any retail investor in the EEA may be unlawful under the PRIIPS Regulation.
United Kingdom
In addition, in the United Kingdom, this prospectus is being distributed only to, and is directed only at, and any offer subsequently made may only be directed at persons who are “qualified investors” (as defined in the Prospectus Regulation) (i) who have professional experience in matters relating to investments falling within Article 19(5) of the Financial Services and Markets Act 2000 (Financial Promotion) Order 2005, as amended (the “Order”) and/or (ii) who are high net worth companies (or persons to whom it may otherwise be lawfully communicated) falling within Article 49(2)(a) to (d) of the Order (all such persons together being referred to as “relevant persons”).
Any person in the United Kingdom that is not a relevant person should not act or rely on the information included in this document or use it as basis for taking any action. In the United Kingdom, any investment or investment activity that this prospectus relates to may be made or taken exclusively by relevant persons.
Canada
The Class A Common Stock may be sold in Canada only to purchasers purchasing, or deemed to be purchasing, as principal that are accredited investors, as defined in National Instrument 45-106 Prospectus Exemptions or subsection 73.3(1) of the Securities Act (Ontario), and are permitted clients, as defined in National Instrument 31-103 Registration Requirements, Exemptions, and Ongoing Registrant Obligations. Any resale of the Class A Common Stock must be made in accordance with an exemption form, or in a transaction not subject to, the prospectus requirements of applicable securities laws.
Securities legislation in certain provinces or territories of Canada may provide a purchaser with remedies for rescission or damages if this prospectus (including any amendment thereto) contains a misrepresentation, provided that the remedies for rescission or damages are exercised by the purchaser within the time limit prescribed by the securities legislation of the purchaser’s province or territory. The purchaser should refer to any applicable provisions of the securities legislation of the purchaser’s province or territory of these rights or consult with a legal advisor.
Pursuant to section 3A.3 of National Instrument 33-105 Underwriting Conflicts (NI 33-105), the underwriters are not required to comply with the disclosure requirements of NI 33-105 regarding underwriter conflicts of interest in connection with this offering.
Australia
This prospectus:
| • | does not constitute a disclosure document or a prospectus under Chapter 6D.2 of the Corporations Act 2001 (Cth) (the “Corporations Act”); |
| • | has not been, and will not be, lodged with the Australian Securities and Investments Commission (“ASIC”), as a disclosure document for the purposes of the Corporations Act and does not purport to |
217
Table of Contents
| include the information required of a disclosure document for the purposes of the Corporations Act; and |
| • | may only be provided in Australia to select investors who are able to demonstrate that they fall within one or more of the categories of investors, available under section 708 of the Corporations Act (“Exempt Investors”). |
The Class A Common Stock may not be directly or indirectly offered for subscription or purchased or sold, and no invitations to subscribe for or buy the Class A Common Stock may be issued, and no draft or definitive prospectus, advertisement or other offering material relating to any Class A Common Stock may be distributed in Australia, except where disclosure to investors is not required under Chapter 6D of the Corporations Act or is otherwise in compliance with all applicable Australian laws and regulations. By submitting an application for the Class A Common Stock, you represent and warrant to us that you are an Exempt Investor.
As any offer of Class A Common Stock under this prospectus will be made without disclosure in Australia under Chapter 6D.2 of the Corporations Act, the offer of those securities for resale in Australia within 12 months may, under section 707 of the Corporations Act, require disclosure to investors under Chapter 6D.2 if none of the exemptions in section 708 applies to that resale. By applying for the Class A Common Stock you undertake to us that you will not, for a period of 12 months from the date of issue of the Class A Common Stock, offer, transfer, assign or otherwise alienate such Class A Common Stock to investors in Australia except in circumstances where disclosure to investors is not required under Chapter 6D.2 of the Corporations Act or where a compliant disclosure document is prepared and lodged with ASIC.
Hong Kong
The Class A Common Stock may not be offered or sold in Hong Kong by means of any prospectus other than (i) in circumstances which do not constitute an offer to the public within the meaning of the Companies (Winding Up and Miscellaneous Provisions) Ordinance (Cap. 32 of the Laws of Hong Kong) (“Companies (Winding Up and Miscellaneous Provisions) Ordinance”) or which do not constitute an invitation to the public within the meaning of the Securities and Futures Ordinance (Cap. 571 of the Laws of Hong Kong) (“Securities and Futures Ordinance”), or (ii) to “professional investors” as defined in the Securities and Futures Ordinance and any rules made thereunder, or (iii) in other circumstances which do not result in the prospectus being a “prospectus” as defined in the Companies (Winding Up and Miscellaneous Provisions) Ordinance, and no advertisement, invitation or document relating to the Class A Common Stock may be issued or may be in the possession of any person for the purpose of issue (in each case whether in Hong Kong or elsewhere), which is directed at, or the contents of which are likely to be accessed or read by, the public in Hong Kong (except if permitted to do so under the securities laws of Hong Kong) other than with respect to shares of Class A Common Stock which are or are intended to be disposed of only to persons outside Hong Kong or only to “professional investors” in Hong Kong as defined in the Securities and Futures Ordinance and any rules made thereunder.
Singapore
This prospectus has not been and will not be registered as a prospectus with the Monetary Authority of Singapore. Accordingly, this prospectus and any other document or material in connection with the offer or sale, or invitation for subscription or purchase, of the shares of common stock may not be circulated or distributed, nor may the shares of common stock be offered or sold, or be made the subject of an invitation for subscription or purchase, whether directly or indirectly, to any person in Singapore other than (i) to an institutional investor (as defined in Section 4A of the Securities and Futures Act, Chapter 289 of Singapore, as modified or amended from time to time (the “SFA”)) pursuant to Section 274 of the SFA, (ii) to a relevant person (as defined in Section 275(2) of the SFA) pursuant to Section 275(1) of the SFA, or any person pursuant to Section 275(1A) of the SFA, and in accordance with the conditions specified in Section 275 of the SFA or (iii) otherwise pursuant to, and in accordance with the conditions of, any other applicable provision of the SFA, in each case subject to conditions set forth in the SFA.
218
Table of Contents
Where the shares of common stock are subscribed or purchased under Section 275 of the SFA by a relevant person which is:
| (a) | a corporation (which is not an accredited investor (as defined in Section 4A of the SFA)) the sole business of which is to hold investments and the entire share capital of which is owned by one or more individuals, each of whom is an accredited investor; or |
| (b) | a trust (where the trustee is not an accredited investor) whose sole purpose is to hold investments and each beneficiary of the trust is an individual who is an accredited investor, |
securities or securities-based derivatives contracts (each term as defined in Section 2(1) of the SFA) of that corporation or the beneficiaries’ rights and interest (howsoever described) in that trust shall not be transferred within six months after that corporation or that trust has acquired the shares of common stock pursuant to an offer made under Section 275 of the SFA except:
| (1) | to an institutional investor or to a relevant person, or to any person arising from an offer referred to in Section 275(1A) or Section 276(4)(i)(B) of the SFA; |
| (2) | where no consideration is or will be given for the transfer; |
| (3) | where the transfer is by operation of law; |
| (4) | as specified in Section 276(7) of the SFA; or |
| (5) | as specified in Regulation 37A of the Securities and Futures (Offers of Investments) (Securities and Securities-based Derivatives Contracts) Regulations 2018. |
Japan
The Class A Common Stock has not been and will not be registered under the Financial Instruments and Exchange Act of Japan (Act No. 25 of 1948, as amended) (the “FIEA”). The Class A Common Stock may not be offered or sold, directly or indirectly, in Japan or to or for the benefit of any resident of Japan (including any person resident in Japan or any corporation or other entity organized under the laws of Japan) or to others for reoffering or resale, directly or indirectly, in Japan or to or for the benefit of any resident of Japan, except pursuant to an exemption from the registration requirements of the FIEA and otherwise in compliance with any relevant laws and regulations of Japan.
Dubai International Financial Centre (“DIFC”)
This prospectus relates to an Exempt Offer in accordance with the Markets Rules 2012 of the Dubai Financial Services Authority (“DFSA”). This prospectus is intended for distribution only to persons of a type specified in the Markets Rules 2012 of the DFSA. It must not be delivered to, or relied on by, any other person. The DFSA has no responsibility for reviewing or verifying any documents in connection with Exempt Offers. The DFSA has not approved this prospectus supplement nor taken steps to verify the information set forth herein and has no responsibility for this prospectus. The Class A Common Stock to which this prospectus relates may be illiquid and/or subject to restrictions on their resale. Prospective purchasers of the Class A Common Stock offered should conduct their own due diligence on the Class A Common Stock. If you do not understand the contents of this prospectus you should consult an authorized financial advisor.
In relation to its use in the DIFC, this prospectus is strictly private and confidential and is being distributed to a limited number of investors and must not be provided to any person other than the original recipient, and may not be reproduced or used for any other purpose. The interests in the Class A Common Stock may not be offered or sold directly or indirectly to the public in the DIFC.
We estimate that our share of the total expenses of the offering, excluding underwriting discounts, will be approximately $ , including up to $ in connection with the qualification of this offering with the Financial Industry Regulatory Authority, Inc. by counsel to the underwriters.
219
Table of Contents
We have agreed to indemnify the several underwriters against certain liabilities, including liabilities under the Securities Act.
The underwriters and their respective affiliates are full service financial institutions engaged in various activities, which may include sales and trading, commercial and investment banking, advisory, investment management, investment research, principal investment, hedging, market making, brokerage and other financial and nonfinancial activities and services. Certain of the underwriters and their respective affiliates have provided, and may in the future provide, a variety of these services to the issuer and to persons and entities with relationships with the issuer, for which they received or will receive customary fees and expenses. Certain of the underwriters and/or their respective affiliates are acting as agents, arrangers and/or lenders under the 2020 Secured Term Loan or the Revolving Credit Facility to be repaid with the proceeds of this offering and accordingly will receive a portion of the proceeds from this offering.
In the ordinary course of their various business activities, the underwriters and their respective affiliates, officers, directors and employees may purchase, sell or hold a broad array of investments and actively trade securities, derivatives, loans, commodities, currencies, credit default swaps and other financial instruments for their own account and for the accounts of their customers, and such investment and trading activities may involve or relate to assets, securities and/or instruments of the issuer (directly, as collateral securing other obligations or otherwise) and/or persons and entities with relationships with the issuer. The underwriters and their respective affiliates also may communicate independent investment recommendations, market color or trading ideas and/or publish or express independent research views in respect of such assets, securities or instruments and may at any time hold, or recommend to clients that they should acquire, long and/or short positions in such assets, securities and instruments.
220
Table of Contents
Certain legal matters, including certain tax matters, will be passed upon for us by Fried, Frank, Harris, Shriver & Jacobson LLP. Clifford Chance US LLP, New York, New York, will act as counsel to the underwriters. Ballard Spahr LLP will pass upon the validity of the shares of our Class A Common Stock sold in this offering and certain other matters under Maryland law.
The consolidated financial statements of Broadstone Net Lease, Inc. and subsidiaries as of December 31, 2018 and 2017, and for each of the three years ended December 31, 2018, and the related financial statement schedule included in this prospectus and in the registration statement have been audited by Deloitte & Touche LLP, an independent registered public accounting firm, as stated in their report thereon appearing herein. Such consolidated financial statements and financial statement schedule have been so included in reliance upon the report of such firm given upon their authority as experts in accounting and auditing.
The combined statements of revenues and certain operating expenses of the Industrial Portfolio Acquisition for the year ended December 31, 2018, included in this prospectus has been audited by Deloitte & Touche LLP, independent auditors, as stated in their report thereon appearing herein (which report expresses an unmodified opinion and includes an emphasis-of-matter paragraph referring to the purpose of the statements), and is included in reliance upon the report of such firm given upon their authority as experts in accounting and auditing.
Unless otherwise indicated, all statistical and economic market data included in this prospectus, including information relating to the economic conditions in the single-tenant market contained in “Prospectus Summary” and “Market Opportunity” is derived from market information prepared for us by RCG, a nationally recognized real estate consulting firm, and is included in this prospectus in reliance on RCG’s authority as an expert in such matters.
WHERE YOU CAN FIND MORE INFORMATION
We maintain a web site at http://investors.bnl.broadstone.com. Information contained on our web site is not incorporated by reference into this prospectus, and you should not consider information contained on our web site to be part of this prospectus.
We have filed a registration statement on Form S-11, of which this prospectus constitutes a part, with the SEC under the Securities Act with respect to this offering of our Class A Common Stock. This prospectus does not contain all of the information set forth in the registration statement, which also includes numerous exhibits and schedules. For further information with respect to our Company and the shares of Class A Common Stock offered hereby, reference is made to the registration statement, including the exhibits and schedules thereto. Statements contained in this prospectus as to the contents of any contract or other document are not necessarily complete, and where such document has been filed as an exhibit to the registration statement, each statement is qualified in all respects by reference to the contents of the full document. Our SEC filings, including our registration statement, are available to you, free of charge, on the SEC’s web site, www.sec.gov.
We file annual, quarterly, and special reports, proxy statements and other information with the SEC. We furnish our stockholders by mail (or, where permitted, by electronic delivery and notification) with annual reports containing consolidated financial statements certified by an independent registered public accounting firm. These periodic reports and other information are and will be available through the SEC’s web site referred to above.
221
Table of Contents
F-1
Table of Contents
Pro Forma Financial Statements of Broadstone Net Lease, Inc. (Unaudited)
Broadstone Net Lease, Inc. and Subsidiaries
Introduction to Unaudited Pro Forma Condensed Consolidated Financial Statements
The Unaudited Pro Forma Condensed Consolidated Financial Statements of Broadstone Net Lease, Inc. and Subsidiaries (“the Company”) are based upon the historical financial statements of the Company, included elsewhere in this prospectus, and prepared on a pro forma basis to reflect the completion of the following transactions:
Industrial Portfolio Acquisition
On August 29, 2019, the Company acquired a portfolio of 23 net leased industrial and office/flex properties, comprising 6.9 million rentable square feet for an aggregate purchase price of approximately $735.7 million, excluding capitalized acquisition costs (the “Industrial Portfolio Acquisition”). The properties are located across 14 states in the continental United States, with one property located in British Columbia, Canada.
The Company funded the acquisition using a combination of debt and equity capital, including funds received from drawing the remaining $150 million commitment available under its unsecured term loan due in 2026 (the “2026 Unsecured Term Loan”), borrowing $300 million from a newly executed unsecured term loan due in 2020 (the “2020 Unsecured Term Loan”), proceeds from its senior unsecured revolving credit facility (the “Revolving Credit Facility”), and proceeds from its ongoing private offering of shares of common stock.
The Industrial Portfolio Acquisition was accounted for as an asset acquisition under Accounting Standards Codification (“ASC”) 805. The total purchase price was allocated to the individual assets acquired and liabilities assumed based upon their relative fair values, which included tangible assets, consisting of land and land improvements, buildings and other improvements, and equipment, and identifiable intangible assets and liabilities, including the value of in-place leases and acquired above-market and below-market leases. Acquisition costs incurred in connection with investments in real estate accounted for as asset acquisitions are capitalized and included with the allocated purchase price. Intangible assets were recognized at their relative fair values in accordance with ASC 350.
Internalization of Management Functions
On November 11, 2019, the Company, Broadstone Net Lease, LLC, the Company’s operating company (the “OP”), Broadstone Real Estate, LLC, the Company’s property manager (“BRE”), Broadstone Net Lease Sub 1, Inc., a wholly-owned subsidiary of the Company (“BNL Sub 1”), Broadstone Net Lease Sub 2, Inc., a wholly-owned subsidiary of the Company (“BNL Sub 2”), Trident BRE Holdings I, Inc. (“Blocker Corp 1”), Trident BRE Holdings II, Inc. (“Blocker Corp 2” and, together, with Blocker Corp 1, the “Blocker Corps”), and, solely for purposes of Sections 6.18, 6.19, and 6.20, Trident BRE Holdings I, L.P. and Trident BRE Holdings II, L.P., entered into an Agreement and Plan of Merger (the “Merger Agreement”) providing for the internalization of the external management functions being performed for the Company and the OP by BRE and Broadstone Asset Management, LLC, the Company’s asset manager and wholly-owned subsidiary of BRE, through a series of transactions involving the acquisition of BRE by the OP (such transactions, collectively, the “Internalization”). Upon consummation of the Internalization, the Company’s current management team and corporate staff, who are currently employed by BRE, will become employees of an indirect subsidiary of the OP and the Company will become internally managed.
Pursuant to the Merger Agreement, (i) BNL Sub 1 will merge with and into Blocker Corp 1, with Blocker Corp 1 surviving (the “Blocker Corp 1 Merger”), (ii) BNL Sub 2 will merge with and into Blocker Corp 2, with Blocker Corp 2 surviving (the “Blocker Corp 2 Merger” and together with the Blocker Corp I Merger, the “Blocker Mergers”), and (iii) immediately following the Blocker Mergers, BRE will merge with and into the OP, with the OP surviving (the “OP Merger” and, together with the Blocker Mergers, the “Mergers”).
F-2
Table of Contents
The Merger Agreement provides for the payment of the following consideration: (i) each outstanding share of common stock of Blocker Corp 1 will be exchanged for a number of shares of common stock of the Company (“Common Stock”) determined in accordance with the terms of the Merger Agreement, (ii) each outstanding share of common stock of Blocker Corp 2 will be exchanged for a number of shares of Common Stock determined in accordance with the terms of the Merger Agreement, and (iii) each outstanding unit of ownership interest in BRE (the “BRE Units”) will be converted into the right to receive, depending upon the type of BRE Unit, a combination of (i) Common Stock, (ii) membership units in the OP (“OP Units”), and/or (iii) cash, in each case, in an amount determined in accordance with the terms of the Merger Agreement. Each holder of BRE Units which is entitled, per the terms of the Merger Agreement, to elect the form of merger consideration they receive will be entitled to elect to receive Common Stock, OP Units, or cash (or a combination thereof) in exchange for such BRE Units.
The aggregate value of the Common Stock, OP Units, and cash to be issued upon consummation of the Mergers is approximately $206 million, plus the assumption by the Company of debt of approximately $94 million.
In addition to the consideration to be paid upon consummation of the Mergers, the Merger Agreement provides that additional “earnout” consideration of up to an aggregate of $75 million (payable in four tranches of $10 million, $15 million, $25 million, and $25 million and in the same proportion of equity interests and cash as the initial payments) will be due and payable to the former holders of BRE Units if certain milestones related to either (a) the 40-day dollar volume-weighted average price of a share of the Class A Common Stock (or Common Stock after the Class A Conversion) (“VWAP of a REIT Share”) on the principal exchange or securities market (or over-the-counter market) on which the Class A Common Stock (or Common Stock after the Class A Conversion) is then traded, following the completion of an initial public offering of the Company’s Class A Common Stock, are achieved during specified periods of time following such completion (the “Earnout Periods”).
The earnout tranches, applicable VWAP of a REIT Share, and the applicable Earnout Periods are as follows:
| Earnout Tranche |
VWAP of a REIT Share |
Applicable Earnout Period | ||||
| $10 million |
$ | 90.00 | The two-year period beginning on the closing date of the initial public offering. | |||
| $15 million |
$ | 95.00 | The two-year period beginning on the closing date of the initial public offering. | |||
| $25 million |
$ | 97.50 | The four-year period beginning on the date that is exactly one year after the earnout period begins for the first and second tranches above. | |||
| $25 million |
$ | 100.00 | The four-year period beginning on the date that is exactly one year after the earnout period begins for the first and second tranches above. | |||
The Merger Agreement also provides for the repurchase of all of the shares of Common Stock owned by BRE for approximately $20 million.
The Internalization will be accounted for as a business combination under ASC 805. The total purchase price will be allocated to the identifiable tangible and intangible assets acquired and liabilities assumed based upon their respective fair values. The allocations of the purchase prices reflected in these unaudited pro forma condensed consolidated financial statements have not been finalized and are based upon preliminary estimates of these fair values, which is the best available information at the current time. A final determination of the fair values of the assets and liabilities, which cannot be made prior to the close of the Internalization, and which is expected to occur during 2020, will be based on the actual valuations of the tangible and intangible assets and liabilities that exist as of the dates of completion of the acquisitions. Consequently, amounts preliminarily allocated to identifiable tangible and intangible assets and liabilities could change significantly from those used in the unaudited Pro Forma Condensed Consolidated Financial Statements and could result in a material change.
F-3
Table of Contents
Recapitalization
The Pro Forma Condensed Consolidated Financial Statements also give effect to the completion of the recapitalization of the Common Stock immediately prior to the closing of this offering, pursuant to which (i) the Company will establish a new class of Common Stock as “Class A Common Stock” for sale in this offering and (ii) the Company will effect a four-for-one stock split of its Common Stock that is outstanding immediately prior to the closing of this offering (the “REIT Recapitalization”). The four-for-one stock split is intended to achieve a stock price that is consistent with market expectations for underwritten public offerings by REITs. In connection with the REIT Recapitalization, the OP will effect a recapitalization of its OP Units, pursuant to which it will effect a four-for-one split of its outstanding OP Units (collectively, with the REIT Recapitalization, the “Recapitalization”).
The terms of the Class A Common Stock are identical to the terms of the Common Stock, except that each share of the Class A Common Stock will automatically convert into one share of the Company’s Common Stock 180 days after completion of this offering. The automatic conversion feature of the Class A Common Stock is the only difference between the terms of the Class A Common Stock and the Common Stock. Additionally, prior to the Class A Conversion, the holders of Class A Common Stock, voting as a separate class, are required to approve any amendment to our Charter that will affect such holders differently than the holders of our Common Stock.
The Class A Common Stock will be immediately listed on the New York Stock Exchange under the symbol “BNL” upon completion of this offering and will be freely tradeable. The Common Stock (then including the Class A Common Stock as a result of the automatic conversion) will be listed on the date that is 180 days after completion of this offering.
The Recapitalization will have the effect of increasing the total number of outstanding shares of the Company’s Common Stock. On , 2020, immediately prior to the stock split, we had approximately million shares of Common Stock outstanding. Upon completion of this offering, we expect to have an aggregate of approximately million shares of the Common Stock (including the Class A Common Stock) outstanding. Of this amount, approximately million shares will be Class A Common Stock (representing % of the Company’s total outstanding Common Stock (including our Class A Common Stock) and % of the Company’s Common Stock (including our Class A Common Stock) and OP Units on a fully diluted basis).
The Recapitalization will be effected on a pro rata basis with respect to all of the Company’s stockholders immediately prior to this offering. Accordingly, it will not affect any such stockholder’s proportionate ownership of the Company’s outstanding shares. The Recapitalization also will be effected on a pro rata basis with respect to all of the members of the OP immediately prior to this offering.
The Recapitalization will have the effect of increasing the total number of outstanding shares of the Common Stock.
Once the Recapitalization is completed, Common Stock share amount and per share data included herein will give retroactive effect to the Recapitalization.
This Offering and the Use of Proceeds
The Pro Forma Condensed Consolidated Financial Statements also give effect to the completion of this offering, the use of the net proceeds therefrom as described under “Use of Proceeds” elsewhere in this prospectus.
The Unaudited Pro Forma Condensed Consolidated Balance Sheet as of September 30, 2019, reflects the financial position of the Company as if the Internalization and Recapitalization were each completed on September 30, 2019. The Industrial Portfolio Acquisition was completed on August 29, 2019 and is included in the historical Condensed Consolidated Balance Sheet of the Company as of September 30, 2019. The Unaudited Pro Forma Condensed Consolidated Statements of Income for the nine months ended September 30, 2019, and for the year ended December 31, 2018, present the Company’s results of operations as if the Industrial Portfolio Acquisition, Internalization, and Recapitalization were each completed on January 1, 2018.
F-4
Table of Contents
The Unaudited Pro Forma Condensed Consolidated Financial Statements are prepared for informational purposes only and are based upon available information, estimates, and assumptions that the Company considers reasonable. However, they are not necessarily indicative of what the Company’s actual financial position or operating results would have been had the above transactions occurred as of the dates indicated, nor do they purport to represent the consolidated financial position or results of operations for future periods of the Company. Differences between these preliminary estimates and the final accounting for these transactions may occur and these differences could have a material impact on the accompanying Unaudited Pro Forma Condensed Consolidated Financial Statements.
The Unaudited Pro Forma Condensed Consolidated Financial Statements should be read in conjunction with the notes thereto and with the Management’s Discussion and Analysis of Financial Condition and Results of Operations included elsewhere in this prospectus.
F-5
Table of Contents
Broadstone Net Lease, Inc. and Subsidiaries
Pro Forma Condensed Consolidated Balance Sheet as of September 30, 2019
(Unaudited)
(in thousands, except per share amounts)
| Broadstone Net Lease, Inc. (A) |
Internalization (B) | Recapitalization (C) | Pro Forma Adjustments |
Consolidated Pro Forma Results Prior to IPO |
IPO/ Repayment of Debt |
Pro Forma Results (Combined) |
||||||||||||||||||||||||||||||
| Assets |
||||||||||||||||||||||||||||||||||||
| Accounted for using the operating method, net of accumulated depreciation |
$ | 3,459,626 | ||||||||||||||||||||||||||||||||||
| Accounted for using the direct financing method |
41,920 | |||||||||||||||||||||||||||||||||||
|
|
|
|
|
|
|
|
|
|
|
|
|
|
|
|||||||||||||||||||||||
| Investment in rental property, net |
3,501,546 | |||||||||||||||||||||||||||||||||||
| Cash and cash equivalents |
14,008 | (E) | (G, H) | |||||||||||||||||||||||||||||||||
| Accrued rental income |
81,251 | |||||||||||||||||||||||||||||||||||
| Tenant and other receivables, net |
861 | |||||||||||||||||||||||||||||||||||
| Prepaid expenses and other assets |
34,594 | (D) | ||||||||||||||||||||||||||||||||||
| Goodwill |
— | (D) | ||||||||||||||||||||||||||||||||||
| Interest rate swap, assets |
1,120 | |||||||||||||||||||||||||||||||||||
| Intangible lease assets, net |
342,478 | |||||||||||||||||||||||||||||||||||
| Debt issuance costs—unsecured revolver, net |
2,679 | (H) | ||||||||||||||||||||||||||||||||||
| Leasing fees, net |
13,251 | |||||||||||||||||||||||||||||||||||
|
|
|
|
|
|
|
|
|
|
|
|
|
|
|
|||||||||||||||||||||||
| Total assets |
$ | 3,991,788 | ||||||||||||||||||||||||||||||||||
|
|
|
|
|
|
|
|
|
|
|
|
|
|
|
|||||||||||||||||||||||
| Liabilities and equity |
||||||||||||||||||||||||||||||||||||
| Unsecured revolver |
$ | 303,300 | (D, E) | (H) | ||||||||||||||||||||||||||||||||
| Mortgages and notes payable, net |
112,562 | |||||||||||||||||||||||||||||||||||
| Unsecured term notes, net |
1,671,511 | (E) | (H) | |||||||||||||||||||||||||||||||||
| Interest rate swap, liabilities |
37,489 | |||||||||||||||||||||||||||||||||||
| Accounts payable and other liabilities |
34,008 | (D, E) | ||||||||||||||||||||||||||||||||||
| Due to related parties |
433 | (F) | ||||||||||||||||||||||||||||||||||
| Accrued interest payable |
9,482 | |||||||||||||||||||||||||||||||||||
| Intangible lease liabilities, net |
94,503 | |||||||||||||||||||||||||||||||||||
|
|
|
|
|
|
|
|
|
|
|
|
|
|
|
|||||||||||||||||||||||
| Total liabilities |
2,263,288 | |||||||||||||||||||||||||||||||||||
|
|
|
|
|
|
|
|
|
|
|
|
|
|
|
|||||||||||||||||||||||
| Equity |
||||||||||||||||||||||||||||||||||||
| Broadstone Net Lease, Inc. stockholders’ equity: |
||||||||||||||||||||||||||||||||||||
| Preferred stock, $0.001 par value |
— | |||||||||||||||||||||||||||||||||||
| Common Stock, $0.001 par value |
25 | (E) | (G) | |||||||||||||||||||||||||||||||||
| Class A Common Stock , $0.001 par value |
||||||||||||||||||||||||||||||||||||
| Additional paid-in capital |
1,852,038 | (E) | (G) | |||||||||||||||||||||||||||||||||
| Cumulative distributions in excess of retained earnings |
(194,790 | ) | ||||||||||||||||||||||||||||||||||
| Accumulated other comprehensive loss |
(33,911 | ) | ||||||||||||||||||||||||||||||||||
|
|
|
|
|
|
|
|
|
|
|
|
|
|
|
|||||||||||||||||||||||
| Total Broadstone Net Lease, Inc. stockholders’ equity |
1,623,362 | |||||||||||||||||||||||||||||||||||
| Non-controlling interests |
105,138 | |||||||||||||||||||||||||||||||||||
|
|
|
|
|
|
|
|
|
|
|
|
|
|
|
|||||||||||||||||||||||
| Total equity |
1,728,500 | |||||||||||||||||||||||||||||||||||
|
|
|
|
|
|
|
|
|
|
|
|
|
|
|
|||||||||||||||||||||||
| Total liabilities and equity |
$ | 3,991,788 | ||||||||||||||||||||||||||||||||||
|
|
|
|
|
|
|
|
|
|
|
|
|
|
|
|||||||||||||||||||||||
The accompanying notes are an integral part of these unaudited pro forma condensed consolidated financial statements.
F-6
Table of Contents
Broadstone Net Lease, Inc. and Subsidiaries
Notes to Pro Forma Condensed Consolidated Balance Sheet as of September 30, 2019 (Unaudited)
(in thousands)
| (A) | Reflects the historical Condensed Consolidated Balance Sheet of the Company as of September 30, 2019. |
| (B) | Reflects the unaudited historical balance sheet of BRE as of September 30, 2019, as presented elsewhere in this prospectus. |
| (C) | Reflects the completion of the Recapitalization as if it occurred on September 30, 2019. |
| (D) | Reflects the acquisition of certain assets and liabilities from BRE as part of the Internalization. The Internalization will be accounted for as a business combination and accordingly, the Company will allocate the purchase price utilizing the acquisition method to record assets acquired and liabilities assumed at their estimated fair values. Acquisition costs incurred in connection with the Internalization will be expensed as incurred. |
The pro forma adjustment reflects the allocation of the purchase price associated with the Internalization transaction as follows.
| (in thousands) |
||||
| Prepaid expenses and other assets: |
||||
| Right-of-use asset |
||||
| Office equipment |
||||
|
|
|
|||
| Total prepaid expenses and other assets |
— | |||
| Goodwill |
||||
| Operating lease liability |
||||
| Assumed debt |
||||
|
|
|
|||
| $— | ||||
|
|
|
|||
The allocation of the purchase price has not been finalized and is based upon preliminary estimates of these fair values, which is the best available information at the current time. A final determination of the fair values of the assets and liabilities, which cannot be made prior to the close of the Internalization, and which is expected to occur during 2020, will be based on the actual valuations of the tangible and intangible assets and liabilities that exist as of the dates of completion of the acquisitions. Consequently, amounts preliminarily allocated to identifiable tangible and intangible assets and liabilities could change significantly from those used in the Unaudited Pro Forma Condensed Consolidated Financial Statements and could result in a material change.
F-7
Table of Contents
| (E) | Reflects the maximum potential consideration to be paid for the Internalization. The maximum potential consideration to be paid pursuant to the Merger Agreement consists of (i) base consideration of approximately $206 million plus assumption of debt of approximately $94 million, which were paid upon closing and (ii) additional consideration of $75 million, which represents the full amount of the potential contingent consideration payable as earnout consideration in connection with the Internalization. The total estimated value of the Internalization is as follows: |
| (in thousands) |
||||
| Base consideration |
$ | |||
| shares of Common Stock at $85 per share |
||||
| Cash |
||||
| Assumption of debt |
||||
| Potential deferred earn-out |
||||
| shares of Common Stock |
||||
| Cash |
||||
| Total estimated maximum value of Internalization |
||||
|
|
|
|||
| $ | ||||
|
|
|
| (F) | Reflects the reversal of amounts due to BRE reflected in the Company’s historical balance sheet as of September 30, 2019. |
| (G) | Reflects the net proceeds expected from the sale of shares of Class A Common Stock in this offering, at an assumed public offering price of $ per share, which is the mid-point of the price range set forth on the front cover of this prospectus, net of underwriting discounts and commissions and other estimated offering expenses. The actual public offering price of the Class A Common Stock sold in this offering will be determined at the time of pricing and will be influenced by then-prevailing market conditions. The actual public offering price may be lower or higher than the price assumed herein. |
| (in thousands) | Cash | Total Stockholders’ Equity |
||||||
| Gross offering proceeds |
||||||||
| Underwriting discounts and commissions |
||||||||
| Offering expenses |
||||||||
| Net proceeds |
||||||||
| (H) | Reflects the use of the net proceeds from this offering to repay (i) in full the Company’s 2020 Unsecured Term Loan, and (ii) approximately $ million of the outstanding balance under the Company’s Revolving Credit Facility (including $ of unamortized debt issuance costs related to the foregoing), with any balance of such net proceeds held in cash and available for general business and working capital purposes, including potential future acquisitions. |
F-8
Table of Contents
Broadstone Net Lease, Inc. and Subsidiaries
Pro Forma Condensed Consolidated Statements of Income
For the Nine Months Ended September 30, 2019
(Unaudited)
(in thousands, except per share amounts)
| Broadstone Net Lease, Inc. (A) |
Industrial Portfolio Acquisition (B) |
Internalization (C) |
Pro Forma Adjustments |
Consolidated Pro Forma Results Prior to IPO |
IPO/ Repayment of Debt |
Pro Forma Results (Combined) |
||||||||||||||||||||||||||||||
| Revenues |
||||||||||||||||||||||||||||||||||||
| Lease revenues |
$ | 213,884 | $ | 32,981 | $ | 3,023 | (D) | |||||||||||||||||||||||||||||
|
|
|
|
|
|
|
|
|
|
|
|
|
|
|
|||||||||||||||||||||||
| Operating expenses |
||||||||||||||||||||||||||||||||||||
| Depreciation and amortization |
77,989 | — | 13,981 | (E) | ||||||||||||||||||||||||||||||||
| Asset management fees |
16,048 | — | (16,048 | ) | (F) | |||||||||||||||||||||||||||||||
| Property management fees |
5,918 | — | (5,918 | ) | (F) | |||||||||||||||||||||||||||||||
| Property and operating expense |
11,497 | 1,003 | ||||||||||||||||||||||||||||||||||
| General and administrative |
3,807 | — | (G) | |||||||||||||||||||||||||||||||||
| State, franchise and foreign tax |
1,153 | — | 171 | (H) | ||||||||||||||||||||||||||||||||
| Provision for impairment of investment in rental properties |
3,452 | — | — | |||||||||||||||||||||||||||||||||
|
|
|
|
|
|
|
|
|
|
|
|
|
|
|
|||||||||||||||||||||||
| Total operating expenses |
119,864 | 1,003 | (7,814 | ) | ||||||||||||||||||||||||||||||||
|
|
|
|
|
|
|
|
|
|
|
|
|
|
|
|||||||||||||||||||||||
| Other income (expenses) |
||||||||||||||||||||||||||||||||||||
| Interest income |
6 | — | ||||||||||||||||||||||||||||||||||
| Interest expense |
(51,025 | ) | — | (I) | (M) | |||||||||||||||||||||||||||||||
| Cost of debt extinguishment |
(1,176 | ) | — | |||||||||||||||||||||||||||||||||
| Gain on sale of real estate |
16,772 | — | ||||||||||||||||||||||||||||||||||
| Internalization expenses |
(1,195 | ) | — | 1,195 | (J) | |||||||||||||||||||||||||||||||
|
|
|
|
|
|
|
|
|
|
|
|
|
|
|
|||||||||||||||||||||||
| Net income |
57,402 | 31,978 | ||||||||||||||||||||||||||||||||||
| Net income attributable to non-controlling interests |
(3,942 | ) | — | (K) | ||||||||||||||||||||||||||||||||
|
|
|
|
|
|
|
|
|
|
|
|
|
|
|
|||||||||||||||||||||||
| Net income attributable to Broadstone Net Lease, Inc. |
$ | 53,460 | $ | 31,978 | ||||||||||||||||||||||||||||||||
|
|
|
|
|
|
|
|
|
|
|
|
|
|
|
|||||||||||||||||||||||
| Weighted average number of Common Stock, including Class A Common Stock, outstanding |
||||||||||||||||||||||||||||||||||||
| Basic |
23,394 | 770 | (L) | (N) | ||||||||||||||||||||||||||||||||
|
|
|
|
|
|
|
|||||||||||||||||||||||||||||||
| Diluted |
25,131 | 770 | (L) | (N) | ||||||||||||||||||||||||||||||||
|
|
|
|
|
|
|
|||||||||||||||||||||||||||||||
| Net earnings per common share |
||||||||||||||||||||||||||||||||||||
| Basic and diluted |
$ | 2.28 | ||||||||||||||||||||||||||||||||||
|
|
|
|
|
|
|
|||||||||||||||||||||||||||||||
The accompanying notes are an integral part of these unaudited pro forma condensed consolidated financial statements.
F-9
Table of Contents
Broadstone Net Lease, Inc. and Subsidiaries
Notes to Pro Forma Condensed Consolidated Statements of Income for the Nine Months Ended September 30, 2019 (Unaudited)
(in thousands)
| (A) | Reflects the historical unaudited Condensed Consolidated Financial Statements of the Company for the nine months ended September 30, 2019, giving effect to the Recapitalization as if it was completed on January 1, 2018 |
| (B) | Reflects eight months of historical results of the Industrial Portfolio Acquisition as set forth in the table below. The results of the Industrial Portfolio Acquisition were included in the Company’s consolidated operating results beginning in September 2019. |
| (in thousands) | ||||
| Lease revenues |
$ | 32,981 | ||
| Property and operating expense |
1,003 | |||
| Net income |
31,978 | |||
| Net income attributable to non-controlling interest |
31,978 | |||
| (C) | Reflects the unaudited historical statement of operations for the nine months ended September 30, 2019, of BRE, as presented elsewhere within this prospectus. |
| (D) | Pro forma adjustment reflects the following items related to incremental lease revenues, giving effect to the Industrial Portfolio Acquisition as if it had been acquired on January 1, 2018: |
| (in thousands) | Nine Months Ended September 30, 2019 |
|||
| Straight-line rent adjustment |
$ | 1,958 | ||
| Amortization of above- and below-market lease intangibles |
1,065 | |||
|
|
|
|||
| $ | 3,023 | |||
|
|
|
|||
The Company recognizes rental revenue from operating leases on a straight-line basis over the life of the related leases. The pro forma adjustment reflects the estimated incremental straight-line rental income to be recognized over the remaining life of the leases in the Industrial Portfolio Acquisition as of the acquisition date, as compared to the straight-line rental income that had been recorded in the Combined Statements of Revenues and Certain Operating Expenses of the Industrial Portfolio Acquisition for the appropriate period.
The Company records acquired above-market and below-market leases at their fair values, and recognizes the related amortization as an adjustment to rental revenue over the remaining lease term. The remaining lease terms of the properties acquired with the Industrial Portfolio Acquisition range from 5.0 years to 20.4 years.
| (E) | Reflects incremental depreciation expense and amortization of acquired in-place leases associated with the Industrial Portfolio Acquisition and assets acquired from BRE, assuming that each transaction occurred on January 1, 2018, as follows: |
| (in thousands) | Industrial Portfolio Acquisition |
Internalization | Total | |||||||||
| Depreciation |
$ | 10,443 | $ | 10,443 | ||||||||
| Amortization of acquired in-place leases |
3,538 | 3,538 | ||||||||||
|
|
|
|
|
|
|
|||||||
| $ | 13,981 | $ | — | $ | 13,981 | |||||||
|
|
|
|
|
|
|
|||||||
F-10
Table of Contents
Depreciation is computed using the straight-line method over the estimated useful lives of the related assets, which are as follows:
| Land improvements |
15 years | |||
| Buildings and other improvements |
15 to 39 years |
| (F) | Reflects the reversal of asset management fees and property management fees payable to BRE or its affiliates, under the agreements in existence prior to the Internalization. |
| (G) | Reflects incremental expense associated with as a result of the Internalization, as well as the elimination of certain expenses from the historical financial statements of BRE, including . |
| (H) | The pro forma adjustment reflects estimated state, franchise, and foreign taxes associated with the properties acquired in the Industrial Portfolio Acquisition. |
| (I) | Reflects incremental interest expense associated with the debt financing associated with the Industrial Portfolio Acquisition and amortization of debt issuance costs associated with that debt, and assumption and repayment of BRE debt and the related interest rate swap as part of the Internalization and amortization of debt issuance costs associated with that debt, as if the transactions had each occurred on January 1, 2018. Pro forma interest expense was calculated using the one-month LIBOR rate of % in effect as of . A change in one-month LIBOR of plus or minus 0.125% would increase or decrease, respectively, annual pro forma acquisition related interest expense by approximately $ . |
| (J) | Reflects reversal of internalization expenses reflected in the historical financial statements as such amounts are directly related to the Internalization and will not recur. |
| (K) | The Company conducts substantially all of its activities through, and all of its properties are held directly or indirectly by, the OP. Certain interests in the OP, referred to as non-controlling interests, are held by members who acquired their interest by contributing property to the OP or in connection with the Internalization. The Company owns the remaining ownership interest in the OP. The pro forma adjustment reflects the allocation of a portion of the historical results of the Industrial Portfolio Acquisition and the Internalization, and the pro forma adjustments, to non-controlling interests. The calculation of amounts due to non-controlling interest also reflects the pro forma effect of the assumed issuance of additional shares of the Company’s Common Stock described in Note E to the Pro Forma Condensed Consolidated Balance Sheet. On a pro forma basis, non-controlling interests represent economic ownership interests of approximately 6.4% as of September 30, 2019 prior to the impact of this offering and the use of proceeds described in this prospectus. |
| (L) | The Company funded a portion of the Industrial Portfolio Acquisition using aggregate proceeds of $85,182 from the issuance of 990 shares of its Common Stock in July 2019 at a price equal to $86.00 per share. The issuance of such common shares was included in the Company’s historical weighted average shares outstanding calculation for the nine months ended September 30, 2019, at a weighted average 220 shares. The pro forma adjustment represents the incremental 770 shares necessary to reflect the issuance of 990 shares as if the transaction occurred on January 1, 2018. Adjustment also assumes shares of Common Stock and OP Units were issued and cash of $ was paid in connection with the Internalization, which represents the maximum earnout consideration payable in accordance with the Internalization. |
| (M) | Reflects a reduction in interest expense related to the repayment (i) in full the Company’s 2020 Unsecured Term Loan, and (ii) approximately $ million of the outstanding balance under the Company’s Revolving Credit Facility (including $ of unamortized debt issuance costs related to the foregoing), with the net proceeds from this offering, offset by $ million increase in interest expense associated with the unused fee related to the Revolving Credit Facility, giving effect to the increase in the Company’s borrowing capacity under the facility upon the closing of this offering, as if such repayment and increase took place on January 1, 2018. The Revolving Credit Facility requires that we pay fees equal to a percentage |
F-11
Table of Contents
| of any unused portion of the borrowing capacity under the facility. Pro forma interest expense was calculated using the one-month LIBOR rate of % in effect as of . A change in one-month LIBOR of plus or minus 0.125% would increase or decrease, respectively, annual pro forma acquisition related interest expense by approximately $ . |
| (N) | Pro forma net income per share is based on the number of shares of Common Stock, including shares of the Class A Common Stock, and OP Units outstanding as of January 1, 2018, plus the Class A Common Stock to be issued pursuant to this offering at an offering price of $ per share, which is the mid-point of the price range set forth on the front cover of this prospectus, assuming shares of Common Stock and OP Units were issued and payment of $ cash in connection with the Internalization, which represents the maximum earnout consideration payable in accordance with the Internalization. |
F-12
Table of Contents
Historical Financial Statements of Broadstone Net Lease, Inc. (Unaudited)
Broadstone Net Lease, Inc. and Subsidiaries
Condensed Consolidated Balance Sheets
(Unaudited)
(in thousands, except per share amounts)
| September 30, 2019 |
December 31, 2018 |
|||||||
| Assets |
||||||||
| Accounted for using the operating method, net of accumulated depreciation |
$ | 3,459,626 | $ | 2,641,746 | ||||
| Accounted for using the direct financing method |
41,920 | 42,000 | ||||||
|
|
|
|
|
|||||
| Investment in rental property, net |
3,501,546 | 2,683,746 | ||||||
| Cash and cash equivalents |
14,008 | 18,612 | ||||||
| Accrued rental income |
81,251 | 69,247 | ||||||
| Tenant and other receivables, net |
861 | 1,026 | ||||||
| Prepaid expenses and other assets |
34,594 | 4,316 | ||||||
| Interest rate swap, assets |
1,120 | 17,633 | ||||||
| Intangible lease assets, net |
342,478 | 286,258 | ||||||
| Debt issuance costs—unsecured revolver, net |
2,679 | 2,261 | ||||||
| Leasing fees, net |
13,251 | 13,698 | ||||||
|
|
|
|
|
|||||
| Total assets |
$ | 3,991,788 | $ | 3,096,797 | ||||
|
|
|
|
|
|||||
| Liabilities and equity |
||||||||
| Unsecured revolver |
$ | 303,300 | $ | 141,100 | ||||
| Mortgages and notes payable, net |
112,562 | 78,952 | ||||||
| Unsecured term notes, net |
1,671,511 | 1,225,773 | ||||||
| Interest rate swap, liabilities |
37,489 | 1,820 | ||||||
| Accounts payable and other liabilities |
34,008 | 24,394 | ||||||
| Due to related parties |
433 | 114 | ||||||
| Accrued interest payable |
9,482 | 9,777 | ||||||
| Intangible lease liabilities, net |
94,503 | 85,947 | ||||||
|
|
|
|
|
|||||
| Total liabilities |
2,263,288 | 1,567,877 | ||||||
|
|
|
|
|
|||||
| Commitments and contingencies (See Note 16) |
||||||||
| Equity |
||||||||
| Broadstone Net Lease, Inc. stockholders’ equity: |
||||||||
| Preferred stock, $0.001 par value; 20,000 shares authorized, no shares issued or outstanding |
— | — | ||||||
| Common stock, $0.001 par value; 80,000 shares authorized, 25,482 and 22,014 shares issued and outstanding at September 30, 2019 and December 31, 2018, respectively |
25 | 22 | ||||||
| Additional paid-in capital |
1,852,038 | 1,557,421 | ||||||
| Cumulative distributions in excess of retained earnings |
(194,790 | ) | (155,150 | ) | ||||
| Accumulated other comprehensive (loss) income |
(33,911 | ) | 14,806 | |||||
|
|
|
|
|
|||||
| Total Broadstone Net Lease, Inc. stockholders’ equity |
1,623,362 | 1,417,099 | ||||||
| Non-controlling interests |
105,138 | 111,821 | ||||||
|
|
|
|
|
|||||
| Total equity |
1,728,500 | 1,528,920 | ||||||
|
|
|
|
|
|||||
| Total liabilities and equity |
$ | 3,991,788 | $ | 3,096,797 | ||||
|
|
|
|
|
|||||
The accompanying notes are an integral part of these condensed consolidated financial statements.
F-13
Table of Contents
Broadstone Net Lease, Inc. and Subsidiaries
Condensed Consolidated Statements of Income and Comprehensive Income
(Unaudited)
(in thousands, except per share amounts)
| For the three months ended September 30, |
For the nine months ended September 30, |
|||||||||||||||
| 2019 | 2018 | 2019 | 2018 | |||||||||||||
| Revenues |
||||||||||||||||
| Lease revenues |
$ | 76,401 | $ | 61,764 | $ | 213,884 | $ | 174,385 | ||||||||
|
|
|
|
|
|
|
|
|
|||||||||
| Operating expenses |
||||||||||||||||
| Depreciation and amortization |
28,392 | 21,869 | 77,989 | 61,303 | ||||||||||||
| Asset management fees |
5,610 | 4,663 | 16,048 | 13,119 | ||||||||||||
| Property management fees |
2,098 | 1,680 | 5,918 | 4,792 | ||||||||||||
| Property and operating expense |
3,855 | 2,777 | 11,497 | 7,926 | ||||||||||||
| General and administrative |
1,315 | 1,664 | 3,807 | 4,451 | ||||||||||||
| State, franchise and foreign tax |
405 | 58 | 1,153 | 811 | ||||||||||||
| Provision for impairment of investment in rental properties |
2,435 | 2,061 | 3,452 | 2,061 | ||||||||||||
|
|
|
|
|
|
|
|
|
|||||||||
| Total operating expenses |
44,110 | 34,772 | 119,864 | 94,463 | ||||||||||||
|
|
|
|
|
|
|
|
|
|||||||||
| Other income (expenses) |
||||||||||||||||
| Preferred distribution income |
— | 65 | — | 440 | ||||||||||||
| Interest income |
5 | 16 | 6 | 178 | ||||||||||||
| Interest expense |
(18,465 | ) | (14,484 | ) | (51,025 | ) | (38,115 | ) | ||||||||
| Cost of debt extinguishment |
(455 | ) | (50 | ) | (1,176 | ) | (101 | ) | ||||||||
| Gain on sale of real estate |
12,585 | 2,025 | 16,772 | 9,620 | ||||||||||||
| Gain on sale of investment in related party |
— | 8,500 | — | 8,500 | ||||||||||||
| Internalization expenses |
(923 | ) | — | (1,195 | ) | — | ||||||||||
|
|
|
|
|
|
|
|
|
|||||||||
| Net income |
25,038 | 23,064 | 57,402 | 60,444 | ||||||||||||
| Net income attributable to non-controlling interests |
(1,650 | ) | (1,797 | ) | (3,942 | ) | (4,631 | ) | ||||||||
|
|
|
|
|
|
|
|
|
|||||||||
| Net income attributable to Broadstone Net Lease, Inc. |
$ | 23,388 | $ | 21,267 | $ | 53,460 | $ | 55,813 | ||||||||
|
|
|
|
|
|
|
|
|
|||||||||
| Weighted average number of common shares outstanding |
||||||||||||||||
| Basic |
24,642 | 20,554 | 23,394 | 19,850 | ||||||||||||
|
|
|
|
|
|
|
|
|
|||||||||
| Diluted |
26,379 | 22,291 | 25,131 | 21,496 | ||||||||||||
|
|
|
|
|
|
|
|
|
|||||||||
| Net earnings per common share |
||||||||||||||||
| Basic and diluted |
$ | 0.95 | $ | 1.03 | $ | 2.28 | $ | 2.81 | ||||||||
|
|
|
|
|
|
|
|
|
|||||||||
| Comprehensive income |
||||||||||||||||
| Net income |
$ | 25,038 | $ | 23,064 | $ | 57,402 | $ | 60,444 | ||||||||
| Other comprehensive income |
||||||||||||||||
| Change in fair value of interest rate swaps |
(16,380 | ) | 6,299 | (52,182 | ) | 30,296 | ||||||||||
| Realized gain on interest rate swaps |
(41 | ) | (4 | ) | (163 | ) | (4 | ) | ||||||||
|
|
|
|
|
|
|
|
|
|||||||||
| Comprehensive income |
8,617 | 29,359 | 5,057 | 90,736 | ||||||||||||
| Comprehensive income attributable to non-controlling interests |
(557 | ) | (2,288 | ) | (315 | ) | (6,931 | ) | ||||||||
|
|
|
|
|
|
|
|
|
|||||||||
| Comprehensive income attributable to Broadstone Net Lease, Inc. |
$ | 8,060 | $ | 27,071 | $ | 4,742 | $ | 83,805 | ||||||||
|
|
|
|
|
|
|
|
|
|||||||||
The accompanying notes are an integral part of these condensed consolidated financial statements.
F-14
Table of Contents
Broadstone Net Lease, Inc. and Subsidiaries
Condensed Consolidated Statements of Stockholders’ Equity
(Unaudited)
(in thousands, except per share amounts)
| Common Stock |
Additional Paid-in Capital |
Subscriptions Receivable |
Cumulative Distributions in Excess of Retained Earnings |
Accumulated Other Comprehensive (Loss) Income |
Non- controlling Interests |
Total | ||||||||||||||||||||||
| Balance, January 1, 2019 |
$ | 22 | $ | 1,557,421 | $ | — | $ | (155,150 | ) | $ | 14,806 | $ | 111,821 | $ | 1,528,920 | |||||||||||||
| Net income |
— | — | — | 13,938 | — | 1,084 | 15,022 | |||||||||||||||||||||
| Issuance of 883 shares of common stock |
1 | 75,099 | (225 | ) | — | — | — | 74,875 | ||||||||||||||||||||
| Other offering costs |
— | (300 | ) | — | — | — | — | (300 | ) | |||||||||||||||||||
| Distributions declared ($0.43 per share January 2019, $0.44 per share February through March 2019) |
— | — | — | (29,635 | ) | — | (2,348 | ) | (31,983 | ) | ||||||||||||||||||
| Change in fair value of interest rate swap agreements |
— | — | — | — | (11,713 | ) | (911 | ) | (12,624 | ) | ||||||||||||||||||
| Realized gain on interest rate swap agreements |
— | — | — | — | (75 | ) | (6 | ) | (81 | ) | ||||||||||||||||||
| Redemption of 21 shares of common stock |
— | (1,803 | ) | — | — | — | — | (1,803 | ) | |||||||||||||||||||
|
|
|
|
|
|
|
|
|
|
|
|
|
|
|
|||||||||||||||
| Balance, March 31, 2019 |
$ | 23 | $ | 1,630,417 | $ | (225 | ) | $ | (170,847 | ) | $ | 3,018 | $ | 109,640 | $ | 1,572,026 | ||||||||||||
| Net income |
— | — | — | 16,134 | — | 1,208 | 17,342 | |||||||||||||||||||||
| Issuance of 892 shares of common stock |
1 | 76,004 | 225 | — | — | — | 76,230 | |||||||||||||||||||||
| Other offering costs |
— | (300 | ) | — | — | — | — | (300 | ) | |||||||||||||||||||
| Distributions declared ($0.44 per share April through June 2019) |
— | — | — | (30,934 | ) | — | (2,297 | ) | (33,231 | ) | ||||||||||||||||||
| Change in fair value of interest rate swap agreements |
— | — | — | — | (21,564 | ) | (1,614 | ) | (23,178 | ) | ||||||||||||||||||
| Realized gain on interest rate swap agreements |
— | — | — | — | (38 | ) | (3 | ) | (41 | ) | ||||||||||||||||||
| Redemption of 38 shares of common stock |
— | (3,210 | ) | — | — | — | — | (3,210 | ) | |||||||||||||||||||
|
|
|
|
|
|
|
|
|
|
|
|
|
|
|
|||||||||||||||
| Balance, June 30, 2019 |
$ | 24 | $ | 1,702,911 | $ | — | $ | (185,647 | ) | $ | (18,584 | ) | $ | 106,934 | $ | 1,605,638 | ||||||||||||
| Net income |
— | — | — | 23,388 | — | 1,650 | 25,038 | |||||||||||||||||||||
| Issuance of 1,840 shares of common stock |
1 | 157,191 | — | — | — | — | 157,192 | |||||||||||||||||||||
| Other offering costs |
— | (703 | ) | — | — | — | — | (703 | ) | |||||||||||||||||||
| Distributions declared ($0.44 per share July through September 2019) |
— | — | — | (32,531 | ) | — | (2,352 | ) | (34,883 | ) | ||||||||||||||||||
| Change in fair value of interest rate swap agreements |
— | — | — | — | (15,288 | ) | (1,092 | ) | (16,380 | ) | ||||||||||||||||||
| Realized gain on interest rate swap agreements |
— | — | — | — | (39 | ) | (2 | ) | (41 | ) | ||||||||||||||||||
| Redemption of 88 shares of common stock |
— | (7,361 | ) | — | — | — | — | (7,361 | ) | |||||||||||||||||||
|
|
|
|
|
|
|
|
|
|
|
|
|
|
|
|||||||||||||||
| Balance, September 30, 2019 |
$ | 25 | $ | 1,852,038 | $ | — | $ | (194,790 | ) | $ | (33,911 | ) | $ | 105,138 | $ | 1,728,500 | ||||||||||||
|
|
|
|
|
|
|
|
|
|
|
|
|
|
|
|||||||||||||||
The accompanying notes are an integral part of these condensed consolidated financial statements.
F-15
Table of Contents
Broadstone Net Lease, Inc. and Subsidiaries
Condensed Consolidated Statements of Stockholders’ Equity—(continued)
(Unaudited)
(in thousands, except per share amounts)
| Common Stock |
Additional Paid-in Capital |
Subscriptions Receivable |
Cumulative Distributions in Excess of Retained Earnings |
Accumulated Other Comprehensive Income |
Non- controlling Interests |
Total | ||||||||||||||||||||||
| Balance, January 1, 2018 |
$ | 19 | $ | 1,301,979 | $ | (15 | ) | $ | (120,280 | ) | $ | 5,122 | $ | 97,376 | $ | 1,284,201 | ||||||||||||
| Net income |
— | — | — | 17,573 | — | 1,422 | 18,995 | |||||||||||||||||||||
| Issuance of 710 shares of common stock |
1 | 57,154 | (129 | ) | — | — | — | 57,026 | ||||||||||||||||||||
| Other offering costs |
— | (224 | ) | — | — | — | — | (224 | ) | |||||||||||||||||||
| Distributions declared ($0.415 per share January 2018, $0.43 per share February through March 2018) |
— | — | — | (24,476 | ) | — | (2,472 | ) | (26,948 | ) | ||||||||||||||||||
| Change in fair value of interest rate swap agreements |
— | — | — | — | 15,685 | 1,270 | 16,955 | |||||||||||||||||||||
| Conversion of eight membership units to eight shares of common stock |
— | 684 | — | — | — | (684 | ) | — | ||||||||||||||||||||
| Redemption of 46 shares of common stock |
— | (3,577 | ) | — | — | — | — | (3,577 | ) | |||||||||||||||||||
| Cancellation of nine shares of common stock |
— | (748 | ) | — | — | — | — | (748 | ) | |||||||||||||||||||
|
|
|
|
|
|
|
|
|
|
|
|
|
|
|
|||||||||||||||
| Balance, March 31, 2018 |
$ | 20 | $ | 1,355,268 | $ | (144 | ) | $ | (127,183 | ) | $ | 20,807 | $ | 96,912 | $ | 1,345,680 | ||||||||||||
| Net income |
— | — | — | 16,974 | — | 1,412 | 18,386 | |||||||||||||||||||||
| Issuance of 695 shares of common stock |
— | 56,886 | (356 | ) | — | — | — | 56,530 | ||||||||||||||||||||
| Other offering costs |
— | (301 | ) | — | — | — | — | (301 | ) | |||||||||||||||||||
| Issuance of 194 membership units |
— | — | — | — | — | 15,797 | 15,797 | |||||||||||||||||||||
| Distributions declared ($0.43 per share April through June 2018) |
— | — | — | (25,620 | ) | — | (2,383 | ) | (28,003 | ) | ||||||||||||||||||
| Change in fair value of interest rate swap agreements |
— | — | — | — | 6,503 | 539 | 7,042 | |||||||||||||||||||||
| Redemption of 28 shares of common stock |
— | (2,312 | ) | — | — | — | — | (2,312 | ) | |||||||||||||||||||
|
|
|
|
|
|
|
|
|
|
|
|
|
|
|
|||||||||||||||
| Balance, June 30, 2018 |
$ | 20 | $ | 1,409,541 | $ | (500 | ) | $ | (135,829 | ) | $ | 27,310 | $ | 112,277 | $ | 1,412,819 | ||||||||||||
| Net income |
— | — | — | 21,267 | — | 1,797 | 23,064 | |||||||||||||||||||||
| Issuance of 870 shares of common stock |
1 | 72,770 | (1,190 | ) | — | — | — | 71,581 | ||||||||||||||||||||
| Other offering costs |
— | (297 | ) | — | — | — | — | (297 | ) | |||||||||||||||||||
| Distributions declared ($0.43 per share July through September 2018) |
— | — | — | (26,555 | ) | — | (1,861 | ) | (28,416 | ) | ||||||||||||||||||
| Change in fair value of interest rate swap agreements |
— | — | — | — | 5,807 | 492 | 6,299 | |||||||||||||||||||||
| Realized gain on interest rate swap agreements |
— | — | — | — | (3 | ) | (1 | ) | (4 | ) | ||||||||||||||||||
| Redemption of 32 shares of common stock |
— | (2,675 | ) | — | — | — | — | (2,675 | ) | |||||||||||||||||||
|
|
|
|
|
|
|
|
|
|
|
|
|
|
|
|||||||||||||||
| Balance, September 30, 2018 |
$ | 21 | $ | 1,479,339 | $ | (1,690 | ) | $ | (141,117 | ) | $ | 33,114 | $ | 112,704 | $ | 1,482,371 | ||||||||||||
|
|
|
|
|
|
|
|
|
|
|
|
|
|
|
|||||||||||||||
The accompanying notes are an integral part of these condensed consolidated financial statements.
F-16
Table of Contents
Broadstone Net Lease, Inc. and Subsidiaries
Condensed Consolidated Statements of Cash Flows
(Unaudited)
(in thousands)
| For the nine months ended September 30, |
||||||||
| 2019 | 2018 | |||||||
| Operating activities |
||||||||
| Net income |
$ | 57,402 | $ | 60,444 | ||||
| Adjustments to reconcile net income including non-controlling interest to net cash provided by operating activities: |
||||||||
| Depreciation and amortization including intangibles associated with investment in rental property |
75,661 | 61,515 | ||||||
| Provision for impairment on investment in rental properties |
3,452 | 2,061 | ||||||
| Amortization of debt issuance costs charged to interest expense |
1,655 | 1,303 | ||||||
| Straight-line rent and financing lease adjustments |
(15,882 | ) | (15,640 | ) | ||||
| Cost of debt extinguishment |
1,176 | 101 | ||||||
| Gain on sale of real estate |
(16,772 | ) | (9,620 | ) | ||||
| Settlement of interest rate swap |
— | 760 | ||||||
| Gain on sale of investment in related party |
— | (8,500 | ) | |||||
| Leasing fees paid |
(747 | ) | (1,325 | ) | ||||
| Other non-cash items |
277 | 468 | ||||||
| Changes in assets and liabilities: |
||||||||
| Tenant and other receivables |
165 | (65 | ) | |||||
| Prepaid expenses and other assets |
(393 | ) | (799 | ) | ||||
| Accounts payable and other liabilities |
5,234 | (893 | ) | |||||
| Accrued interest payable |
(295 | ) | 3,707 | |||||
|
|
|
|
|
|||||
| Net cash provided by operating activities |
110,933 | 93,517 | ||||||
|
|
|
|
|
|||||
| Investing activities |
||||||||
| Acquisition of rental property accounted for using the operating method, net of mortgages assumed of $49,782 and $20,845 in 2019 and 2018, respectively |
(957,820 | ) | (329,664 | ) | ||||
| Acquisition of rental property accounted for using the direct financing method |
— | (430 | ) | |||||
| Capital expenditures and improvements |
(4,044 | ) | (4,326 | ) | ||||
| Proceeds from sale of investment in related party |
— | 18,500 | ||||||
| Proceeds from disposition of rental property, net |
90,137 | 41,330 | ||||||
| Change in deposits on investments in rental property |
1,500 | — | ||||||
|
|
|
|
|
|||||
| Net cash used in investing activities |
(870,227 | ) | (274,590 | ) | ||||
|
|
|
|
|
|||||
| Financing activities |
||||||||
| Proceeds from issuance of common stock, net |
260,475 | 146,791 | ||||||
| Redemptions of common stock |
(12,374 | ) | (8,564 | ) | ||||
| Borrowings on mortgages, notes payable and unsecured term notes, net of mortgages assumed of $49,782 and $20,845 in 2019 and 2018, respectively |
750,000 | 415,000 | ||||||
| Principal payments on mortgages, notes payable and unsecured term notes |
(316,191 | ) | (33,930 | ) | ||||
| Borrowings on unsecured revolver |
389,100 | 189,500 | ||||||
| Repayments on unsecured revolver |
(226,900 | ) | (462,500 | ) | ||||
| Cash distributions paid to stockholders |
(45,219 | ) | (38,410 | ) | ||||
| Cash distributions paid to non-controlling interests |
(6,980 | ) | (6,630 | ) | ||||
| Debt issuance and extinguishment costs paid |
(7,491 | ) | (2,255 | ) | ||||
|
|
|
|
|
|||||
| Net cash provided by financing activities |
784,420 | 199,002 | ||||||
|
|
|
|
|
|||||
| Net increase in cash and cash equivalents and restricted cash |
25,126 | 17,929 | ||||||
| Cash and cash equivalents and restricted cash at beginning of period |
18,989 | 10,099 | ||||||
|
|
|
|
|
|||||
| Cash and cash equivalents and restricted cash at end of period |
$ | 44,115 | $ | 28,028 | ||||
|
|
|
|
|
|||||
| Reconciliation of cash and cash equivalents and restricted cash |
||||||||
| Cash and cash equivalents at beginning of period |
$ | 18,612 | $ | 9,355 | ||||
| Restricted cash at beginning of period |
377 | 744 | ||||||
|
|
|
|
|
|||||
| Cash and cash equivalents and restricted cash at beginning of period |
$ | 18,989 | $ | 10,099 | ||||
|
|
|
|
|
|||||
| Cash and cash equivalents at end of period |
$ | 14,008 | $ | 17,301 | ||||
| Restricted cash at end of period |
30,107 | 10,727 | ||||||
|
|
|
|
|
|||||
| Cash and cash equivalents and restricted cash at end of period |
$ | 44,115 | $ | 28,028 | ||||
|
|
|
|
|
|||||
The accompanying notes are an integral part of these condensed consolidated financial statements.
F-17
Table of Contents
Broadstone Net Lease, Inc. and Subsidiaries
Notes to the Condensed Consolidated Financial Statements (Unaudited)
(in thousands)
1. Business Description
Broadstone Net Lease, Inc. (the “Company”) is a Maryland corporation formed on October 18, 2007, that elected to be taxed as a real estate investment trust (“REIT”) commencing with the taxable year ended December 31, 2008. The Company focuses on investing in income-producing, net leased commercial properties, primarily in the United States. The Company leases properties to industrial, healthcare, restaurant, office, retail, and other commercial businesses under long-term lease agreements. At September 30, 2019, the Company owned a diversified portfolio of 661 individual net leased commercial properties located in 42 states throughout the continental United States and one property in British Columbia, Canada.
Broadstone Net Lease, LLC (the “OP”), is the entity through which the Company conducts its business and owns (either directly or through subsidiaries) all of the Company’s properties. The Company is the sole managing member of the OP. The remaining interests in the OP, which are referred to as non-controlling interests, are held by members who acquired their interest by contributing property to the OP in exchange for membership units of the OP (“OP Units”). As the Company conducts substantially all of its operations through the OP, it is structured as what is referred to as an umbrella partnership real estate investment trust (“UPREIT”). The following table summarizes the economic ownership interest in the OP:
| Percentage of OP Units owned by |
September 30, 2019 |
December 31, 2018 |
||||||
| Company |
93.6 | % | 92.7 | % | ||||
| Non-controlling interests |
6.4 | % | 7.3 | % | ||||
|
|
|
|
|
|||||
| 100.0 | % | 100.0 | % | |||||
|
|
|
|
|
|||||
The Company operates under the direction of its board of directors (the “Board of Directors”), which is responsible for the management and control of the Company’s (as defined below) affairs. The Company is currently externally managed and its Board of Directors has retained the Company’s sponsor, Broadstone Real Estate, LLC (the “Manager”) and Broadstone Asset Management, LLC (the “Asset Manager”) to manage the Company’s day-to-day affairs, to implement the Company’s investment strategy, and to provide certain property management services for the Company’s properties, subject to the Board of Directors’ direction, oversight, and approval. The Asset Manager is a wholly owned subsidiary of the Manager and all of the Company’s officers are employees of the Manager. Accordingly, both the Manager and the Asset Manager are related parties of the Company. Refer to Note 3 for further discussion concerning related parties and related party transactions.
2. Summary of Significant Accounting Policies
Interim Information
The accompanying Condensed Consolidated Financial Statements have been prepared in accordance with accounting principles generally accepted in the United States of America (“GAAP”) for interim financial information (Accounting Standards Codification (“ASC”) 270, Interim Reporting) and Article 10 of the Securities and Exchange Commission’s (“SEC”) Regulation S-X. Accordingly, the Company has omitted certain footnote disclosures which would substantially duplicate those contained within the audited consolidated financial statements for the year ended December 31, 2018, included in the Company’s 2018 Annual Report on Form 10-K, filed with the SEC on March 14, 2019. Therefore, the readers of this prospectus should refer to those audited consolidated financial statements, specifically Note 2, Summary of Significant Accounting Policies, for further discussion of significant accounting policies and estimates. The Company believes all adjustments necessary for a fair presentation have been included in these interim Condensed Consolidated Financial Statements (which include only normal recurring adjustments).
F-18
Table of Contents
Principles of Consolidation
The Condensed Consolidated Financial Statements include the accounts and operations of the Company, the OP and its consolidated subsidiaries, all of which are wholly owned by the OP (collectively, the “Company”). All intercompany balances and transactions have been eliminated in consolidation.
To the extent the Company has a variable interest in entities that are not evaluated under the variable interest entity (“VIE”) model, the Company evaluates its interests using the voting interest entity model. The Company has complete responsibility for the day-to-day management, authority to make decisions, and control of the OP. Based on consolidation guidance, the Company has concluded that the OP is a VIE as the members in the OP do not possess kick-out rights or substantive participating rights. Accordingly, the Company consolidates its interest in the OP. However, as the Company holds the majority voting interest in the OP, it qualifies for the exemption from providing certain disclosure requirements associated with investments in VIEs.
The portion of the OP not owned by the Company is presented as non-controlling interests as of and during the periods presented.
Basis of Accounting
The Condensed Consolidated Financial Statements have been prepared in accordance with GAAP.
Use of Estimates
The preparation of Condensed Consolidated Financial Statements in conformity with GAAP requires management to make certain estimates and assumptions that affect the reported amounts of assets and liabilities and disclosure of contingent assets and liabilities at the date of the Condensed Consolidated Financial Statements and the reported amounts of revenues and expenses during the reporting periods. Significant estimates include, but are not limited to, the allocation of purchase price between investment in rental property and intangible assets acquired and liabilities assumed, the value of long-lived assets, the provision for impairment, the depreciable lives of rental property, the amortizable lives of intangible assets and liabilities, the allowance for doubtful accounts, the fair value of assumed debt and notes payable, the fair value of the Company’s interest rate swap agreements, and the determination of any uncertain tax positions. Accordingly, actual results may differ from those estimates.
Long-lived Asset Impairment
The Company reviews long-lived assets to be held and used for possible impairment when events or changes in circumstances indicate that their carrying amounts may not be recoverable. If, and when, such events or changes in circumstances are present, an impairment exists to the extent the carrying value of the asset or asset group exceeds the sum of the undiscounted cash flows expected to result from the use of the asset or asset group and its eventual disposition. Such cash flows include expected future operating income, as adjusted for trends and prospects, as well as the effects of demand, competition, and other factors. An impairment loss is measured as the amount by which the carrying amount of the asset or asset group exceeds the fair value of the asset or asset group. A significant judgment is made as to if and when impairment should be taken. If the Company’s strategy, or one or more of the assumptions described above were to change in the future, an impairment may need to be recognized.
Inputs used in establishing fair value for real estate assets generally fall within Level 3 of the fair value hierarchy, which are characterized as requiring significant judgment as little or no current market activity may be available for validation. The main indicator used to establish the classification of the inputs is current market conditions, as derived through the use of published commercial real estate market information. The Company determines the valuation of impaired assets using generally accepted valuation techniques including discounted cash flow
F-19
Table of Contents
analysis, income capitalization, analysis of recent comparable sales transactions, actual sales negotiations, and bona fide purchase offers received from third parties. Management may consider a single valuation technique or multiple valuation techniques, as appropriate, when estimating the fair value of its real estate.
During the three and nine months ended September 30, 2019, the Company recorded impairment charges of $2,435 and $3,452, respectively. During the three and nine months ended September 30, 2018, the Company recorded impairment charges of $2,061. Impairment indicators were identified due to concerns over the tenant’s future viability, property vacancies, and changes to the overall investment strategy for the real estate assets. The amount of the impairment charges were based on management’s consideration of the factors detailed above. In determining the fair value of the impaired assets at September 30, 2019 and March 31, 2019, the measurement dates, the Company utilized a capitalization rate of 14.58%, a weighted average discount rate of 8.00%, and a weighted average price per square foot of $226. In determining the fair value of the impaired assets at September 30, 2018, the measurement date, the Company utilized capitalization rates ranging from 7.50% to 10.00%, and a weighted average discount rate of 8.00%.
Revenue Recognition
The Company commences revenue recognition on its leases based on a number of factors, including the initial determination that the contract is or contains a lease. Generally, all of the Company’s property related contracts are or contain leases, and therefore revenue is recognized when the lessee takes possession of or controls the physical use of the leased assets. In most instances this occurs on the lease commencement date. At the time of lease assumption or at the inception of a new lease, including new leases that arise from amendments, the Company assesses the terms and conditions of the lease to determine the proper lease classification.
Certain of the Company’s leases require tenants to pay rent based upon a percentage of the property’s net sales (“percentage rent”) or contain rent escalators indexed to future changes in the Consumer Price Index. Lease income associated with such provisions is considered variable lease income and therefore is not included in the initial measurement of the lease receivable, or in the calculation of straight-line rent revenue. Such amounts are recognized as income when the amounts are determinable.
As described in Recently Adopted Accounting Standards elsewhere in Note 2, the Company adopted the provisions of Accounting Standards Update (“ASU”) 2016-02, Leases (Topic 842) and related ASUs subsequently issued (collectively, “ASC 842”) as of January 1, 2019.
Leases Executed on or After Adoption of ASC 842
A lease is classified as an operating lease if none of the following criteria are met: (i) ownership transfers to the lessee at the end of the lease term, (ii) the lessee has a purchase option that is reasonably expected to be exercised, (iii) the lease term is for a major part of the economic life of the leased property, (iv) the present value of the future lease payments and any residual value guaranteed by the lessee that is not already reflected in the lease payments equals or exceeds substantially all of the fair value of the leased property, and (v) the leased property is of such a specialized nature that it is expected to have no future alternative use to the Company at the end of the lease term. If one or more of these criteria are met, the lease will generally be classified as a sales-type lease, unless the lease contains a residual value guarantee from a third party other than the lessee, in which case it would be classified as a direct financing lease under certain circumstances in accordance with ASC 842.
ASC 842 requires the Company to account for the right to use land as a separate lease component, unless the accounting effect of doing so would be insignificant. Determination of significance requires management judgment. In determining whether the accounting effect of separately reporting the land component from other components for its real estate leases is significant, the Company assesses: (i) whether separating the land component impacts the classification of any lease component, (ii) the value of the land component in the context of the overall contract, and (iii) whether the right to use the land is coterminous with the rights to use the other assets.
F-20
Table of Contents
Leases Executed Prior to Adoption of ASC 842
A lease arrangement was classified as an operating lease if none of the following criteria were met: (i) ownership transferred to the lessee prior to or shortly after the end of the lease term, (ii) the lessee had a bargain purchase option during or at the end of the lease term, (iii) the lease term was greater than or equal to 75% of the underlying property’s estimated useful life, or (iv) the present value of the future minimum lease payments (excluding executory costs) was greater than or equal to 90% of the fair value of the leased property. If one or more of these criteria were met, and the minimum lease payments were determined to be reasonably predictable and collectible, the lease arrangement was generally accounted for as a direct financing lease. Consistent with ASC 840, Leases, if the fair value of the land component was 25% or more of the total fair value of the leased property, the land was considered separately from the building for purposes of applying the lease term and minimum lease payments criterion in (iii) and (iv) above.
Revenue recognition methods for operating leases, direct financing leases, and sales-type leases are described below:
Rental property accounted for under operating leases—Revenue is recognized as rents are earned on a straight-line basis over the non-cancelable terms of the related leases. For leases that have fixed and measurable rent escalations, the difference between such rental income earned and the cash rent due under the provisions of the lease is recorded as Accrued rental income on the Condensed Consolidated Balance Sheets.
Rental property accounted for under direct financing leases—The Company utilizes the direct finance method of accounting to record direct financing lease income. The net investment in the direct financing lease represents receivables for the sum of future lease payments to be received and the estimated residual value of the leased property, less unamortized unearned income (which represents the difference between undiscounted cash flows and discounted cash flows). Unearned income is deferred and amortized into income over the lease terms so as to produce a constant periodic rate of return on the Company’s net investment in the leases.
Rental property accounted for under sales-type leases—For leases accounted for as sales-type leases, the Company records selling profit arising from the lease at inception, along with the net investment in the lease. The Company leases assets through the assumption of existing leases or through sale-leaseback transactions, and records such assets at their fair value at the time of acquisition, which in most cases coincides with lease inception. As a result, the Company does not generally recognize selling profit on sales-type leases. The net investment in the sales-type lease represents receivables for the sum of future lease payments and the estimated unguaranteed residual value of the leased property, each measured at net present value. Interest income is recorded over the lease terms so as to produce a constant periodic rate of return on the Company’s net investment in the leases.
Certain of the Company’s contracts contain nonlease components (e.g., charges for management fees, common area maintenance, and reimbursement of third-party maintenance expenses) in addition to lease components (i.e., monthly rental charges). Services related to nonlease components are provided over the same period of time as, and billed in the same manner as, monthly rental charges. The Company elected to apply the practical expedient available under ASC 842, for all classes of assets, not to separate the lease components from the nonlease components when accounting for operating leases. Since the lease component is the predominant component under each of these leases, combined revenues from both the lease and nonlease components are reported as Lease revenues in the accompanying Condensed Consolidated Statements of Income and Comprehensive Income.
F-21
Table of Contents
Rent Received in Advance
Rent received in advance represents tenant payments received prior to the contractual due date, and is included in Accounts payable and other liabilities on the Condensed Consolidated Balance Sheets. Rent received in advance is as follows:
| (in thousands) | September 30, 2019 |
December 31, 2018 |
||||||
| Rent received in advance |
$ | 10,694 | $ | 7,832 | ||||
Allowance for Doubtful Accounts
Prior to the adoption of ASC 842, provisions for doubtful accounts were recorded as bad debt expense and included in General and administrative expenses on the accompanying Condensed Consolidated Statements of Income and Comprehensive Income. Subsequent to the adoption of ASC 842, provisions for doubtful accounts are recorded prospectively as an offset to Lease revenues on the accompanying Condensed Consolidated Statements of Income and Comprehensive Income.
Fair Value Measurements
ASC 820, Fair Value Measurements and Disclosures, defines fair value as the price that would be received for an asset or paid to transfer a liability (an exit price) in the principal or most advantageous market for the asset or liability in an orderly transaction between market participants on the measurement date. ASC 820 also establishes a three-tier fair value hierarchy, which prioritizes the inputs used in measuring fair value.
The balances of financial instruments measured at fair value on a recurring basis are as follows (see Note 10):
| September 30, 2019 | ||||||||||||||||
| (in thousands) | Total | Level 1 | Level 2 | Level 3 | ||||||||||||
| Interest rate swap, assets |
$ | 1,120 | $ | — | $ | 1,120 | $ | — | ||||||||
| Interest rate swap, liabilities |
(37,489 | ) | — | (37,489 | ) | — | ||||||||||
|
|
|
|
|
|
|
|
|
|||||||||
| $ | (36,369 | ) | $ | — | $ | (36,369 | ) | $ | — | |||||||
|
|
|
|
|
|
|
|
|
|||||||||
| December 31, 2018 | ||||||||||||||||
| (in thousands) | Total | Level 1 | Level 2 | Level 3 | ||||||||||||
| Interest rate swap, assets |
$ | 17,633 | $ | — | $ | 17,633 | $ | — | ||||||||
| Interest rate swap, liabilities |
(1,820 | ) | — | (1,820 | ) | — | ||||||||||
|
|
|
|
|
|
|
|
|
|||||||||
| $ | 15,813 | $ | — | $ | 15,813 | $ | — | |||||||||
|
|
|
|
|
|
|
|
|
|||||||||
The Company has estimated that the carrying amount reported on the Condensed Consolidated Balance Sheets for Cash and cash equivalents, Prepaid expenses and other assets, Tenant and other receivables, net, and Accounts payable and other liabilities, approximates their fair values due to their short-term nature.
The fair value of the Company’s debt was estimated using Level 2 and Level 3 inputs based on recent financing transactions, estimates of the fair value of the property that serves as collateral for such debt, historical risk premiums for loans of comparable quality, current London Interbank Offered Rate (“LIBOR”), U.S. treasury obligation interest rates, and on the discounted estimated future cash payments to be made on such debt. The discount rates estimated reflect the Company’s judgment as to the approximate current lending rates for loans or groups of loans with similar maturities and assumes that the debt is outstanding through maturity. Market information, as available, or present value techniques were utilized to estimate the amounts required to be disclosed. Since such amounts are estimates that are based on limited available market information for similar
F-22
Table of Contents
transactions and do not acknowledge transfer or other repayment restrictions that may exist on specific loans, it is unlikely that the estimated fair value of any such debt could be realized by immediate settlement of the obligation.
The following table summarizes the carrying amount reported on the Condensed Consolidated Balance Sheets and the Company’s estimate of the fair value of the Mortgages and notes payable, net, Unsecured term notes, net, and Unsecured revolver:
| (in thousands) | September 30, 2019 |
December 31, 2018 |
||||||
| Carrying amount |
$ | 2,096,235 | $ | 1,450,551 | ||||
| Fair value |
2,180,100 | 1,439,264 | ||||||
As disclosed under Long-lived Asset Impairment elsewhere in Note 2, the Company’s non-recurring fair value measurements consisted of the fair value of impaired real estate assets that were determined using Level 3 inputs.
Right-of-Use Assets and Lease Liabilities
In accordance with ASC 842, the Company records right-of-use assets and lease liabilities associated with leases of land where it is the lessee under non-cancelable operating leases (“ground leases”). The lease liability is equal to the net present value of the future payments to be made under the lease, discounted using estimates based on observable market factors. The right-of-use asset is generally equal to the lease liability plus initial direct costs associated with the leases. The Company includes in the recognition of the right-of-use asset and lease liability those renewal periods that are reasonably certain to be exercised, based on the facts and circumstances that exist at lease inception. Amounts associated with percentage rent provisions are considered variable lease costs and are not included in the initial measurement of the right-of-use asset or lease liability. As allowed under ASC 842, the Company has made an accounting policy election, applicable to all asset types, to not separate lease from nonlease components when allocating contract consideration related to ground leases.
Right-of-use assets and lease liabilities associated with ground leases were included in the accompanying Condensed Consolidated Balance Sheets as follows:
| (in thousands) |
Financial Statement Presentation |
September 30, 2019 |
||||
| Right-of-use assets |
Prepaid expenses and other assets |
$ | 1,654 | |||
| Lease liabilities |
Accounts payable and other liabilities |
1,246 | ||||
Taxes Collected From Tenants and Remitted to Governmental Authorities
A majority of the Company’s properties are leased on a triple-net basis, which provides that the tenants are responsible for the payment of all property operating expenses, including, but not limited to, property taxes, maintenance, insurance, repairs, and capital costs, during the lease term. The Company records such expenses on a net basis. In other situations, the Company may collect property taxes from its tenants and remit those taxes to governmental authorities. Taxes collected from tenants and remitted to governmental authorities are presented on a gross basis, where amounts billed to tenants are included in Lease revenues, and the corresponding expense is included in Property and operating expense, in the accompanying Condensed Consolidated Statements of Income and Comprehensive Income.
Rental Expense
Rental expense associated with ground leases is recorded on a straight-line basis over the term of each lease, for leases that have fixed and measurable rent escalations. Under the provisions of ASC 842, the difference between rental expense incurred on a straight-line basis and the cash rental payments due under the provisions of the lease
F-23
Table of Contents
is recorded as part of the right-of-use asset in the accompanying September 30, 2019 Condensed Consolidated Balance Sheet. Prior to the adoption of ASC 842, at December 31, 2018, this difference was recorded as a deferred liability and was included as a component of Accounts payable and other liabilities in the accompanying Condensed Consolidated Balance Sheets. Amounts associated with percentage rent provisions based on the achievement of sales targets are recognized as variable rental expense when achievement of the sales targets is considered probable. Rental expense is included in Property and operating expenses on the accompanying Condensed Consolidated Statements of Income and Comprehensive Income.
Recently Adopted Accounting Standards
In February 2016, the FASB issued ASU 2016-02, Leases (Topic ASC 842), which superseded the existing guidance for lease accounting, ASC 840. ASC 842 is effective January 1, 2019, with early adoption permitted. The guidance requires lessees to recognize a right-of-use asset and a corresponding lease liability, initially measured at the present value of lease payments, for both operating and financing leases. Under the new pronouncement, lessor accounting is largely unchanged from prior GAAP, however disclosures were expanded. The Company adopted ASC 842 on January 1, 2019 on a modified retrospective basis and elected the following practical expedients:
| • | The “Package of Three,” which allows an entity to not reassess (i) whether any expired or existing contracts are, or contain, leases, (ii) the lease classification for any expired or existing leases, and (iii) initial direct costs for existing leases. |
| • | The optional transition method to initially apply the guidance of ASC 842 at the adoption date and to recognize a cumulative-effect adjustment to the opening balance of retained earnings. As a result of electing this practical expedient, the Company’s reporting for the comparative periods presented will continue to be in accordance with ASC 840, including the required disclosures. |
| • | The ability to make an accounting policy election, by class of underlying asset, to not separate nonlease components from the associated lease component and to account for those components as a single component if certain conditions are met. |
ASC 842 requires all income from leases to be presented as a single line item, rather than the prior presentation where rental income from leases was shown separately from amounts billed and collected as reimbursements from tenants on the Condensed Consolidated Statements of Income and Comprehensive Income. In addition, bad debt expense is required to be recorded as an adjustment to Lease revenues, rather than recorded within Operating expenses on the Condensed Consolidated Statements of Income and Comprehensive Income, as had previously been the case.
The Company is primarily a lessor and therefore adoption of ASC 842 did not have a material impact on its Condensed Consolidated Financial Statements. Upon adoption of ASC 842, it was not necessary for the Company to record a cumulative-effect adjustment to the opening balance of retained earnings, however the Company recognized a right-of-use asset and corresponding lease liability as of January 1, 2019, of $1,687 and $1,261, respectively, related to operating leases where it is the lessee (see Note 16). The right-of-use asset was recorded net of a previously recorded straight-line rent liability of $7 and ground lease intangible asset, net of $432 as of the date of adoption.
In October 2018, the FASB issued ASU 2018-16, Derivatives and Hedging (Topic 815): Inclusion of the Secured Overnight Financing Rate (SOFR) Overnight Index Swap (OIS) Rate as a Benchmark Interest Rate for Hedge Accounting Purposes. Previously under Topic 815, the eligible benchmark interest rates in the United States were the interest rates on direct Treasury obligations of the U.S. government (UST), the LIBOR swap rate, the OIS Rate based on the Fed Funds Effective Rate, and the Securities Industry and Financial Markets Association (SIFMA) Municipal Swap Rate, which was introduced in ASU 2017-12, Derivatives and Hedging (Topic 815): Targeted Improvements to Accounting for Hedging Activities (“ASU 2017-12”). The amendments in ASU
F-24
Table of Contents
2018-16 permit the use of the OIS rate based on SOFR as a benchmark interest rate for hedge accounting purposes under Topic 815. The amendments in this update were effective for fiscal years beginning after December 15, 2018, and interim periods within those fiscal years for public business entities that already adopted the amendments in ASU 2017-12 (which the Company adopted effective January 1, 2018). The Company adopted ASU 2018-16 as of January 1, 2019 on a prospective basis for qualifying new or redesignated hedging relationships entered into on or after the date of adoption. Adoption of this guidance had no impact on the Condensed Consolidated Financial Statements.
Other Recently Issued Accounting Standards
In June 2016, the FASB issued ASU 2016-13, Financial Instruments—Credit Losses which changes how entities measure credit losses for most financial assets. Financial assets that are measured at amortized cost will be required to be presented at the net amount expected to be collected with an allowance for credit losses deducted from the amortized cost basis. The guidance requires an entity to utilize broader information in estimating the expected credit loss, including forecasted information. In November 2018, the FASB issued ASU 2018-19, Codification Improvements to Topic 326, Financial Instruments—Credit Losses which clarified that operating lease receivables recorded by lessors are explicitly excluded from the scope of this guidance. In May 2019, the FASB issued ASU 2019-05, Financial Instruments—Credit Losses (Topic 326): Targeted Transition Relief, which provides entities with an option to irrevocably elect the fair value option for eligible instruments upon adoption of Topic 326. ASU 2016-13 is effective January 1, 2020, with early adoption permitted beginning on January 1, 2019, under a modified retrospective application. The Company continues to evaluate the impact this new standard will have on its Condensed Consolidated Financial Statements, including the transition relief provisions, but does not expect such impact will be material based upon the composition of its current lease portfolio.
In August 2018, the FASB issued ASU 2018-13, Fair Value Measurement (Topic 820) Disclosure Framework—Changes to the Disclosure Requirements for Fair Value Measurement. The amendments under ASU 2018-13 remove, add, and modify certain disclosure requirements on fair value measurements in ASC 820. The amendments are effective for fiscal years, and interim periods within those fiscal years, beginning after December 15, 2019, with early adoption permitted. The Company is currently evaluating the impact the new standard will have on its Condensed Consolidated Financial Statements and expects to adopt the new disclosures on a prospective basis on January 1, 2020.
In April 2019, the FASB issued ASU 2019-04, Codification Improvements to Topic 326, Financial Instruments—Credit Losses, Topic 815, Derivatives and Hedging, and Topic 825, Financial Instruments which clarifies and improves guidance within the recently issued standards on credit losses, hedging, and recognition and measurement of financial instruments. The Company will assess the impact of the changes to Topic 326 in connection with its adoption of ASU 2018-13 discussed above. The provisions of ASU 2019-04 relating to Topics 815 and 825 are effective on January 1, 2020. The Company is currently evaluating the impact of adopting ASU 2019-04, but does not anticipate that it will have a material impact on its financial statements.
Reclassifications
Certain prior-period amounts have been reclassified to conform with the current period’s presentation, including certain items described below which resulted from the adoption of ASC 842.
F-25
Table of Contents
Components of revenue that were previously reported as Rental income from operating leases, Earned income from direct financing leases, Operating expenses reimbursed from tenants, and Other income from real estate transactions, on the Condensed Consolidated Statements of Income and Comprehensive Income, have been combined and reported as Lease revenues on the Condensed Consolidated Statements of Income and Comprehensive Income as follows:
| As originally reported (in thousands) |
For the three months ended September 30, 2018 |
For the nine months ended September 30, 2018 |
||||||
| Revenues |
||||||||
| Rental income from operating leases |
$ | 58,189 | $ | 163,611 | ||||
| Earned income from direct financing leases |
1,017 | 2,936 | ||||||
| Operating expenses reimbursed from tenants |
2,529 | 7,764 | ||||||
| Other income from real estate transactions |
29 | 74 | ||||||
|
|
|
|
|
|||||
| Total revenues |
$ | 61,764 | $ | 174,385 | ||||
|
|
|
|
|
|||||
| As revised (in thousands) |
For the three months ended September 30, 2018 |
For the nine months ended September 30, 2018 |
||||||
| Revenues |
||||||||
| Lease revenues |
$ | 61,764 | $ | 174,385 | ||||
|
|
|
|
|
|||||
In addition, as discussed above, in connection with recording the transition adjustment for the right-of-use asset related to operating leases where the Company is the lessee, amounts reported as ground lease intangible assets, net and ground lease straight-line rent liabilities on the Condensed Consolidated Balance Sheet at December 31, 2018, were reclassified as of January 1, 2019, and are now included as components of the right-of-use asset.
The Company reclassified Restricted cash of $377 and Tenant and capital reserves of $1,136 to Prepaid expenses and other assets on the Condensed Consolidated Balance Sheets at December 31, 2018, to conform with the current period presentation. Additionally, Tenant improvement allowances of $2,125 were reclassified to Accounts payable and other liabilities on the Condensed Consolidated Balance Sheets at December 31, 2018, to conform with the current presentation. The reclassifications are changes from one acceptable presentation to another acceptable presentation.
3. Related-Party Transactions
Property Management Agreement
The Company and the OP are a party to a property management agreement (as amended, the “Property Management Agreement”) with the Manager, a related party in which certain directors of the Company have either a direct or indirect ownership interest. Under the terms of the Property Management Agreement, the Manager manages and coordinates certain aspects of the leasing of the Company’s rental property.
In exchange for services provided under the Property Management Agreement, the Manager receives certain fees and other compensation as follows:
| (i) | 3% of gross rentals collected each month from the rental property for property management services (other than one property, which calls for 5% of gross rentals under the Property Management Agreement); and |
| (ii) | Re-leasing fees for existing rental property equal to one month’s rent for a new lease with an existing tenant and two months’ rent for a new lease with a new tenant. |
F-26
Table of Contents
The Property Management Agreement automatically renewed on January 1, 2019 for three years ending December 31, 2021, subject to earlier termination pursuant to the terms of the Property Management Agreement. The Property Management Agreement provides for termination: (i) immediately by the Company’s Independent Directors Committee (“IDC”) for Cause, as defined in the Property Management Agreement, (ii) by the IDC, upon 30 days’ written notice to the Manager, in connection with a change in control of the Manager, as defined in the Property Management Agreement, (iii) by the IDC, by providing the Manager with written notice of termination not less than one year prior to the last calendar day of any renewal term, (iv) by the Manager upon written notice to the Company not less than one year prior to the last calendar day of any renewal period, (v) automatically in the event of a Termination Event, as defined in the Property Management Agreement, and (vi) by the IDC upon a Key Person Event, as defined in the Property Management Agreement.
If the Company terminates the agreement prior to any renewal term or in any manner described above, other than termination by the Company for Cause, the Company will be subject to a termination fee equal to three times the Management Fees, as defined in the Property Management Agreement, to which the Manager was entitled during the 12-month period immediately preceding the date of such termination. Although not terminable at September 30, 2019, if the Property Management Agreement had been terminated at September 30, 2019, subject to the conditions noted above, the termination fee would have been $22,965.
Asset Management Agreement
The Company and the OP are party to an asset management agreement (as amended, the “Asset Management Agreement”) with the Asset Manager, a single member limited liability company with the Manager as the single member, and therefore a related party in which certain directors of the Company have an indirect ownership interest. Under the terms of the Asset Management Agreement, the Asset Manager is responsible for, among other things, the Company’s acquisition, initial leasing, and disposition strategies, financing activities, and providing support to the Company’s IDC for its valuation functions and other duties. The Asset Manager also nominates two individuals to serve on the Board of Directors of the Company.
Under the terms of the Asset Management Agreement, the Asset Manager is compensated as follows:
| (i) | a quarterly asset management fee equal to 0.25% of the aggregate value of common stock, based on the per share value as determined by the IDC each quarter, on a fully diluted basis as if all interests in the OP had been converted into shares of the Company’s common stock; |
| (ii) | 0.5% of the proceeds from future equity closings as reimbursement for offering, marketing, and brokerage expenses; |
| (iii) | 1% of the gross purchase price paid for each rental property acquired (other than acquisitions described in (iv) below), including any property contributed in exchange for membership interests in the OP; |
| (iv) | 2% of the gross purchase price paid for each rental property acquired in the event that the acquisition of a rental property requires a new lease (as opposed to the assumption of an existing lease), such as a sale-leaseback transaction; |
| (v) | 1% of the gross sale price received for each rental property disposition; and |
| (vi) | 1% of the Aggregate Consideration, as defined in the Asset Management Agreement, received in connection with a Disposition Event. The Asset Management Agreement defines a Disposition Event in the same manner as a Termination Event is defined in the Property Management Agreement discussed above. |
The Asset Management Agreement automatically renewed on January 1, 2019 for three years ending December 31, 2021, subject to earlier termination pursuant to the terms of the Asset Management Agreement. The Asset Management Agreement provides for termination: (i) immediately by the IDC for Cause, as defined in the Asset Management Agreement, (ii) by the IDC, upon 30 days’ written notice to the Asset Manager, in
F-27
Table of Contents
connection with a change in control of the Asset Manager, as defined in the Asset Management Agreement, (iii) by the IDC, by providing the Asset Manager with written notice of termination not less than one year prior to the last calendar day of any renewal term, (iv) by the Asset Manager upon written notice to the Company not less than one year prior to the last calendar day of any renewal period, (v) automatically in the event of a Disposition Event, as defined in the Asset Management Agreement, and (vi) by the IDC upon a Key Person Event, as defined in the Asset Management Agreement.
If the Company terminates the agreement prior to any renewal term or in any manner described above, other than termination by the Company for Cause, the Company will be required to pay to the Asset Manager a termination fee equal to three times the Asset Management Fee to which the Asset Manager was entitled during the 12-month period immediately preceding the date of such termination. Although not terminable at September 30, 2019, if the Asset Management Agreement had been terminated at September 30, 2019, subject to the conditions noted above, the termination fee would have been $63,306.
Total fees incurred under the Property Management Agreement and Asset Management Agreement are as follows:
| (in thousands) | For the three months ended September 30, |
For the nine months ended September 30, |
||||||||||||||||
| Type of Fee |
Financial Statement Presentation |
2019 | 2018 | 2019 | 2018 | |||||||||||||
| Asset management fee |
Asset management fees |
$ | 5,610 | $ | 4,663 | $ | 16,048 | $ | 13,119 | |||||||||
| Property management fee |
Property management fees |
2,098 | 1,680 | 5,918 | 4,792 | |||||||||||||
|
|
|
|
|
|
|
|
|
|||||||||||
| Total management fee expense |
7,708 | 6,343 | 21,966 | 17,911 | ||||||||||||||
| Marketing fee (offering costs) |
Additional paid-in capital |
703 | 297 | 1,303 | 822 | |||||||||||||
| Acquisition fee |
Capitalized as a component of assets acquired |
7,932 | 1,105 | 9,937 | 3,491 | |||||||||||||
| Leasing fee |
Leasing fees, net |
312 | 148 | 747 | 1,325 | |||||||||||||
| Disposition fee |
Gain on sale of real estate |
596 | 116 | 947 | 439 | |||||||||||||
|
|
|
|
|
|
|
|
|
|||||||||||
| Total management fees |
$ | 17,251 | $ | 8,009 | $ | 34,900 | $ | 23,988 | ||||||||||
|
|
|
|
|
|
|
|
|
|||||||||||
Included in Due to related parties on the Condensed Consolidated Balance Sheets at September 30, 2019 and December 31, 2018, are $433 and $114 of unpaid management fees, respectively. All fees related to the Property Management Agreement and the Asset Management Agreement are paid for in cash within the Company’s normal payment cycle for vendors.
F-28
Table of Contents
4. Acquisitions
The Company closed on the following acquisitions during the nine months ended September 30, 2019:
| (in thousands, except number of properties) | Number of Properties |
Real Estate Acquisition Price |
||||||||
| Date |
Property Type | |||||||||
| January 31, 2019 |
Healthcare | 1 | $ | 4,747 | ||||||
| March 12, 2019 |
Industrial | 1 | 10,217 | |||||||
| March 15, 2019 |
Retail | 10 | 13,185 | |||||||
| March 19, 2019 |
Retail | 14 | 19,128 | |||||||
| March 26, 2019 |
Industrial | 1 | 25,801 | |||||||
| April 30, 2019 |
Other | 1 | 76,000 | (a) | ||||||
| May 21, 2019 |
Retail | 2 | 6,500 | |||||||
| May 31, 2019 |
Retail | 1 | 3,192 | |||||||
| June 7, 2019 |
Other | 1 | 30,589 | |||||||
| June 26, 2019 |
Industrial | 2 | 11,180 | |||||||
| July 15, 2019 |
Retail | 1 | 3,214 | |||||||
| July 15, 2019 |
Industrial | 1 | 11,330 | |||||||
| July 31, 2019 |
Healthcare | 5 | 27,277 | |||||||
| August 27, 2019 |
Industrial | 1 | 4,404 | |||||||
| August 29, 2019 |
Industrial/Office/Other | 23 | 735,740 | |||||||
| September 17, 2019 |
Industrial | 1 | 11,185 | |||||||
|
|
|
|
|
|||||||
| 66 | $ | 993,689 | (b) | |||||||
|
|
|
|
|
|||||||
| (a) | In conjunction with this acquisition, the Company assumed a mortgage with a principal balance of $49,782 with an interest rate of 4.92% and a maturity date of February 2028 (see Note 9). |
| (b) | Acquisition price does not include capitalized acquisition costs of $16,647. |
The Company closed on the following acquisitions during the nine months ended September 30, 2018:
| (in thousands, except number of properties) | Number of Properties |
Real Estate Acquisition Price |
||||||||
| Date |
Property Type | |||||||||
| March 27, 2018 |
Industrial | 1 | $ | 22,000 | ||||||
| March 30, 2018 |
Industrial/Retail | 26 | 78,530 | |||||||
| April 30, 2018 |
Other | 1 | 16,170 | |||||||
| June 6, 2018 |
Industrial | 1 | 8,500 | |||||||
| June 14, 2018 |
Industrial | 1 | 39,700 | |||||||
| June 14, 2018 |
Retail | 6 | 14,479 | |||||||
| June 21, 2018 |
Retail | 1 | 20,231 | |||||||
| June 21, 2018 |
Industrial | 1 | 38,340 | (c) | ||||||
| June 29, 2018 |
Industrial | 1 | 10,400 | |||||||
| June 29, 2018 |
Retail | 2 | 6,433 | |||||||
| July 12, 2018 |
Industrial | 1 | 11,212 | |||||||
| July 17, 2018 |
Retail | 5 | 14,845 | |||||||
| July 17, 2018 |
Office | 1 | 34,670 | |||||||
| August 6, 2018 |
Industrial | 2 | 4,802 | |||||||
| August 10, 2018 |
Retail | 20 | 44,977 | |||||||
|
|
|
|
|
|||||||
| 70 | $ | 365,289 | (d) | |||||||
|
|
|
|
|
|||||||
| (c) | In conjunction with this acquisition, the Company assumed a mortgage with a principal balance of $20,845 with an interest rate of 4.36% and a maturity date of August 2025 (see Note 9). |
| (d) | Acquisition price does not include capitalized acquisition costs of $8,019. |
F-29
Table of Contents
The Company allocated the purchase price of these properties to the fair value of the assets acquired and liabilities assumed. The following table summarizes the purchase price allocation for completed acquisitions:
| For the nine months ended September 30, |
||||||||
| (in thousands) | 2019 | 2018 | ||||||
| Land |
$ | 155,434 | $ | 47,930 | ||||
| Land improvements |
44,929 | 20,815 | ||||||
| Buildings and other improvements |
745,116 | 271,696 | ||||||
| Equipment |
— | 2,891 | ||||||
| Acquired in-place leases (e) |
77,868 | 36,342 | ||||||
| Acquired above-market leases (f) |
2,800 | 3,347 | ||||||
| Acquired below-market leases (g) |
(15,811 | ) | (10,143 | ) | ||||
| Direct financing investments |
— | 430 | ||||||
| Mortgages payable |
(49,782 | ) | (20,845 | ) | ||||
|
|
|
|
|
|||||
| $ | 960,554 | $ | 352,463 | |||||
|
|
|
|
|
|||||
| (e) | The weighted average amortization period for acquired in-place leases is 13 years and 14 years for acquisitions completed during the nine months ended September 30, 2019 and 2018, respectively. |
| (f) | The weighted average amortization period for acquired above-market leases is 18 years and 15 years for acquisitions completed during the nine months ended September 30, 2019 and 2018, respectively. |
| (g) | The weighted average amortization period for acquired below-market leases is 10 years and 13 years for acquisitions completed during the nine months ended September 30, 2019 and 2018, respectively. |
The above acquisitions were funded using a combination of available cash on hand, borrowings under the Company’s unsecured revolving line of credit and unsecured term loan agreements, and proceeds from equity issuances. All acquisitions closed during the nine months ended September 30, 2019 and 2018, qualified as asset acquisitions and, as such, acquisition costs were capitalized.
Subsequent to September 30, 2019, the Company closed on the following acquisitions (see Note 17):
| (in thousands, except number of properties) | Number of Properties |
Real Estate Acquisition Price |
||||||||||
| Date |
Property Type | |||||||||||
| October 31, 2019 |
Retail/Healthcare | 3 | $ | 12,922 | ||||||||
| November 7, 2019 |
Retail | 1 | 3,142 | |||||||||
|
|
|
|
|
|||||||||
| 4 | $ | 16,064 | ||||||||||
|
|
|
|
|
|||||||||
The Company has not completed the allocation of the acquisition date fair values for the properties acquired subsequent to September 30, 2019; however, it expects the acquisitions to qualify as asset acquisitions and that the purchase price of these properties will primarily be allocated to land, land improvements, building and acquired lease intangibles.
F-30
Table of Contents
5. Sale of Real Estate
The Company closed on the following sales of real estate, none of which qualified as discontinued operations:
| For the three months ended September 30, |
For the nine months ended September 30, |
|||||||||||||||
| (in thousands, except number of properties) | 2019 | 2018 | 2019 | 2018 | ||||||||||||
| Number of properties disposed |
16 | 4 | 25 | 15 | ||||||||||||
| Aggregate sale price |
$ | 59,691 | $ | 11,609 | $ | 94,791 | $ | 43,951 | ||||||||
| Aggregate carrying value |
(43,920 | ) | (9,016 | ) | (73,365 | ) | (31,710 | ) | ||||||||
| Additional sales expenses |
(3,186 | ) | (568 | ) | (4,654 | ) | (2,621 | ) | ||||||||
|
|
|
|
|
|
|
|
|
|||||||||
| Gain on sale of real estate |
$ | 12,585 | $ | 2,025 | $ | 16,772 | $ | 9,620 | ||||||||
|
|
|
|
|
|
|
|
|
|||||||||
6. Investment in Rental Property and Lease Arrangements
The Company generally leases its investment rental property to established tenants in the retail, healthcare, manufacturing, office and other industries. At September 30, 2019, the Company had 642 real estate properties which were leased under leases that have been classified as operating leases and 16 that have been classified as direct financing leases. Of the 16 leases classified as direct financing leases, four include land portions which are accounted for as operating leases (see Revenue Recognition within Note 2). Substantially all leases have initial terms of 10 to 20 years. The Company’s leases generally provide for limited increases in rent as a result of fixed increases, increases in the Consumer Price Index, or increases in the tenant’s sales volume. Generally, tenants are also required to pay all property taxes and assessments, substantially maintain the interior and exterior of the building, and maintain property and liability insurance coverage. The leases also typically provide for one or more multiple year renewal options subject to generally the same terms and conditions as the initial lease. None of the Company’s leases contain purchase options.
The Company’s leases do not include residual value guarantees. To protect the residual value of its assets under lease, the Company requires tenants to maintain certain levels of property insurance, and in some cases will purchase supplemental policies directly. Management physically inspects each property on a regular basis, to ensure the tenant is maintaining the property so that it will be in a condition at the end of the lease term that is suitable for the Company to lease to a new tenant without the need for significant additional investment. For assets other than land, at lease inception the Company estimates the residual value taking into consideration the original fair value of the asset, less anticipated depreciation over the lease term. In general, at lease inception the Company assumes the value ascribed to land will be fully recoverable at the end of the lease term.
Investment in Rental Property—Accounted for Using the Operating Method
Rental property subject to non-cancelable operating leases with tenants are as follows:
| (in thousands) | September 30, 2019 |
December 31, 2018 |
||||||
| Land |
$ | 551,903 | $ | 411,043 | ||||
| Land improvements |
279,629 | 239,701 | ||||||
| Buildings and improvements |
2,871,761 | 2,186,499 | ||||||
| Equipment |
11,492 | 11,492 | ||||||
|
|
|
|
|
|||||
| 3,714,785 | 2,848,735 | |||||||
| Less accumulated depreciation |
(255,159 | ) | (206,989 | ) | ||||
|
|
|
|
|
|||||
| $ | 3,459,626 | $ | 2,641,746 | |||||
|
|
|
|
|
|||||
F-31
Table of Contents
Depreciation expense on investment in rental property was as follows:
| For the three months ended September 30, |
For the nine months ended September 30, |
|||||||||||||||
| (in thousands) | 2019 | 2018 | 2019 | 2018 | ||||||||||||
| Depreciation |
$ | 21,843 | $ | 17,196 | $ | 60,128 | $ | 48,345 | ||||||||
Estimated lease payments to be received under non-cancelable operating leases with tenants at September 30, 2019 are as follows:
| (in thousands) | ||||
| Remainder of 2019 |
$ | 72,718 | ||
| 2020 |
294,220 | |||
| 2021 |
298,899 | |||
| 2022 |
301,996 | |||
| 2023 |
304,828 | |||
| Thereafter |
2,562,223 | |||
|
|
|
|||
| $ | 3,834,884 | |||
|
|
|
|||
Since lease renewal periods are exercisable at the option of the tenant, the above amounts only include future lease payments due during the initial lease terms. In addition, such amounts exclude any potential variable rent increases that are based on changes in the Consumer Price Index or future variable rents which may be received under the leases based on a percentage of the tenant’s gross sales.
Investment in Rental Property—Direct Financing Leases
The Company’s net investment in direct financing leases is comprised of the following:
| (in thousands) | September 30, 2019 |
December 31, 2018 |
||||||
| Undiscounted estimated lease payments to be received |
$ | 73,775 | $ | 76,829 | ||||
| Estimated unguaranteed residual values |
20,358 | 20,358 | ||||||
| Unearned income |
(52,213 | ) | (55,187 | ) | ||||
|
|
|
|
|
|||||
| Net investment in direct financing leases |
$ | 41,920 | $ | 42,000 | ||||
|
|
|
|
|
|||||
Undiscounted estimated lease payments to be received under non-cancelable direct financing leases with tenants at September 30, 2019 are as follows:
| (in thousands) | ||||
| Remainder of 2019 |
$ | 1,022 | ||
| 2020 |
4,194 | |||
| 2021 |
4,283 | |||
| 2022 |
4,369 | |||
| 2023 |
4,456 | |||
| Thereafter |
55,451 | |||
|
|
|
|||
| $ | 73,775 | |||
|
|
|
|||
The above rental receipts do not include future lease payments for renewal periods, potential variable Consumer Price Index rent increases, or variable percentage rent payments that may become due in future periods.
F-32
Table of Contents
The following table summarizes amounts reported as Lease revenues on the Condensed Consolidated Statements of Income and Comprehensive Income:
| (in thousands) | For the three months ended September 30, 2019 |
For the nine months ended September 30, 2019 |
||||||
| Contractual rental amounts billed for operating leases |
$ | 65,579 | $ | 184,292 | ||||
| Adjustment to recognize contractual operating lease billings on a straight-line basis |
5,575 | 16,015 | ||||||
| Adjustment to revenue recognized for uncollectible rental amounts billed |
— | (440 | ) | |||||
|
|
|
|
|
|||||
| Total operating lease rental revenues |
71,154 | 199,867 | ||||||
| Earned income from direct financing leases |
1,005 | 3,014 | ||||||
| Operating expenses billed to tenants |
3,811 | 10,572 | ||||||
| Other income from real estate transactions |
431 | 431 | ||||||
|
|
|
|
|
|||||
| Total lease revenues |
$ | 76,401 | $ | 213,884 | ||||
|
|
|
|
|
|||||
7. Intangible Assets and Liabilities
The following is a summary of intangible assets and liabilities and related accumulated amortization:
| (in thousands) | September 30, 2019 |
December 31, 2018 |
||||||
| Lease intangibles: |
||||||||
| Acquired above-market leases |
$ | 64,931 | $ | 64,164 | ||||
| Less accumulated amortization |
(17,275 | ) | (14,740 | ) | ||||
|
|
|
|
|
|||||
| Acquired above-market leases, net |
47,656 | 49,424 | ||||||
|
|
|
|
|
|||||
| Acquired in-place leases |
351,720 | 277,659 | ||||||
| Less accumulated amortization |
(56,898 | ) | (40,825 | ) | ||||
|
|
|
|
|
|||||
| Acquired in-place leases, net |
294,822 | 236,834 | ||||||
|
|
|
|
|
|||||
| Total intangible lease assets, net |
$ | 342,478 | $ | 286,258 | ||||
|
|
|
|
|
|||||
| Acquired below-market leases |
$ | 114,316 | $ | 101,602 | ||||
| Less accumulated amortization |
(19,813 | ) | (15,655 | ) | ||||
|
|
|
|
|
|||||
| Intangible lease liabilities, net |
$ | 94,503 | $ | 85,947 | ||||
|
|
|
|
|
|||||
| Leasing fees |
$ | 17,316 | $ | 17,274 | ||||
| Less accumulated amortization |
(4,065 | ) | (3,576 | ) | ||||
|
|
|
|
|
|||||
| Leasing fees, net |
$ | 13,251 | $ | 13,698 | ||||
|
|
|
|
|
|||||
Amortization for intangible lease assets and liabilities is as follows:
| (in thousands) | For the three months ended September 30, |
For the nine months ended September 30, |
||||||||||||||||
| Intangible |
Financial Statement |
2019 | 2018 | 2019 | 2018 | |||||||||||||
| Acquired in-place leases and leasing fees |
Depreciation and amortization | $ | 6,549 | $ | 4,673 | $ | 17,861 | $ | 12,958 | |||||||||
| Above-market and below-market leases |
Increase (decrease) to lease revenues | 875 | 255 | 2,335 | (212 | ) | ||||||||||||
F-33
Table of Contents
Estimated future amortization of intangible assets and liabilities at September 30, 2019 is as follows:
| (in thousands) | ||||
| Remainder of 2019 |
$ | 6,113 | ||
| 2020 |
24,267 | |||
| 2021 |
23,856 | |||
| 2022 |
23,241 | |||
| 2023 |
22,862 | |||
| Thereafter |
160,887 | |||
|
|
|
|||
| $ | 261,226 | |||
|
|
|
|||
8. Unsecured Credit Agreements
The following table summarizes the Company’s unsecured credit agreements:
| Outstanding Balance | ||||||||||||||
| (in thousands, except interest rates) | September 30, 2019 |
December 31, 2018 |
Interest Rate (d) |
Maturity Date |
||||||||||
| 2019 Unsecured Term Loan (a) |
$ | — | $ | 300,000 | one-month LIBOR + 1.40% | Feb. 2020 | (g) | |||||||
|
|
|
|
|
|||||||||||
| 2020 Unsecured Term Loan (a) |
300,000 | — | one-month LIBOR + 1.25% | Aug. 2020 | (h) | |||||||||
|
|
|
|
|
|||||||||||
| Unsecured Revolving Credit and Term Loan Agreement (a) |
||||||||||||||
| Revolver (b) |
303,300 | 141,100 | one-month LIBOR + 1.20%(e) | Jan. 2022 | ||||||||||
| 2023 Unsecured Term Loan |
265,000 | 265,000 | one-month LIBOR + 1.35% | Jan. 2023 | ||||||||||
| 2024 Unsecured Term Loan |
190,000 | 190,000 | one-month LIBOR + 1.25%(f) | Jun. 2024 | ||||||||||
|
|
|
|
|
|||||||||||
| 758,300 | 596,100 | |||||||||||||
|
|
|
|
|
|||||||||||
| 2026 Unsecured Term Loan (a) |
450,000 | — | one-month LIBOR + 1.85% | Feb. 2026 | ||||||||||
|
|
|
|
|
|||||||||||
| Senior Notes (a) |
||||||||||||||
| Series A |
150,000 | 150,000 | 4.84% | Apr. 2027 | ||||||||||
| Series B |
225,000 | 225,000 | 5.09% | Jul. 2028 | ||||||||||
| Series C |
100,000 | 100,000 | 5.19% | Jul. 2030 | ||||||||||
|
|
|
|
|
|||||||||||
| 475,000 | 475,000 | |||||||||||||
|
|
|
|
|
|||||||||||
| Total |
1,983,300 | 1,371,100 | ||||||||||||
| Debt issuance costs, net (c) |
(8,489 | ) | (4,227 | ) | ||||||||||
|
|
|
|
|
|||||||||||
| $ | 1,974,811 | $ | 1,366,873 | |||||||||||
|
|
|
|
|
|||||||||||
| (a) | The Company believes it was in compliance with all financial covenants for all periods presented. |
| (b) | At December 31, 2018, the Company had an outstanding balance of $15,000 on the swingline loan feature of the Revolver, due within five business days. On January 2, 2019, the balance became a part of the Revolver and matures in January 2022. |
| (c) | Amounts presented include debt issuance costs, net, related to the unsecured term notes and senior notes only. |
| (d) | At September 30, 2019 and December 31, 2018, one-month LIBOR was 2.09% and 2.35%, respectively. |
| (e) | At December 31, 2018, the swingline loan balance of $15,000 bore interest at 5.45% and the remaining Revolver balance of $126,100 bore interest at one-month LIBOR plus 1.20%. |
| (f) | On July 1, 2019, the Company amended the 2024 Unsecured Term Loan agreement to reduce the variable rate margin from a range of 1.50% to 2.45% to a range of 0.85% to 1.65%. Prior to the amendment, at December 31, 2018, the applicable margin on the 2024 Unsecured Term Loan was 1.90%. |
| (g) | In January 2019 the Company exercised the first of two extension options, extending the maturity date of the loan from February 2019 to February 2020. The loan was subsequently repaid in full on February 27, 2019 in connection with entering into the 2026 Unsecured Term Loan. |
| (h) | The 2020 Unsecured Term Loan allows two six-month extensions, at the Company’s option, subject to payment of a fee equal to 0.05% of the outstanding principal balance at the time of extension. |
F-34
Table of Contents
On February 27, 2019, the Company entered into a $450,000 seven-year unsecured term loan agreement (the “2026 Unsecured Term Loan”) with Capital One, National Association as administrative agent. The 2026 Unsecured Term Loan provides an accordion feature for up to a total of $550,000 borrowing capacity. The 2026 Unsecured Term Loan has an initial maturity date of February 27, 2026. Borrowings under the 2026 Unsecured Term Loan are subject to interest only payments at variable rates equal to LIBOR plus a margin between 1.45% and 2.40% per annum based on the OP’s credit rating. Based on the OP’s current credit rating of Baa3, the applicable margin under the 2026 Unsecured Term Loan is 1.85%. The 2026 Unsecured Term Loan is subject to a fee of 0.25% per annum on the amount of the commitment, reduced by the amount of term loans outstanding. At closing, $300,000 of the commitment was funded and used to repay the 2019 Unsecured Term Loan in full. The remaining $150,000 commitment was drawn on August 27, 2019 and used to fund acquisitions.
On February 28, 2019, the Company amended the Unsecured Revolving Credit and Term Loan Agreement to increase the amount available under the Revolver from $425,000 to $600,000. This increased the total available borrowings under the Unsecured Revolving Credit and Term Loan Agreement to $1,055,000. All other terms and conditions of the Unsecured Revolving Credit and Term Loan Agreement remain the same as those in effect prior to this amendment.
On July 1, 2019, the Company amended the Unsecured Revolving Credit and Term Loan Agreement. Prior to the amendment, the borrowings under the 2024 Unsecured Term Loan were subject to interest at variable rates based on LIBOR plus a margin based on the OP’s credit rating ranging between 1.50% and 2.45% per annum with the applicable margin being 1.90% at December 31, 2018. The amendment reduced the margin to a range between 0.85% and 1.65% per annum and based on the OP’s current credit rating of Baa3, the applicable margin is 1.25% beginning on July 1, 2019. All other terms and conditions of the Unsecured Revolving Credit and Term Loan Agreement remained materially the same as those in effect prior to this amendment.
On August 2, 2019, the Company entered into a $300,000 term loan agreement (the “2020 Unsecured Term Loan”) with JP Morgan Chase Bank, N.A. as administrative agent. The 2020 Unsecured Term Loan was subject to a fee of 0.25% per annum on the amount of the commitment, reduced by the amount of term loans outstanding. The entire amount of $300,000 was funded on August 28, 2019 and used to fund acquisitions. Borrowings under the 2020 Unsecured Term Loan are subject to interest only payments at variable rates equal to LIBOR plus a margin based on the OP’s credit rating between 0.85% and 1.65% per annum. Based on the OP’s current credit rating of Baa3, the applicable margin is 1.25%.
At September 30, 2019, the weighted average interest rate on all outstanding borrowings was 3.89%. In addition, the Revolver is subject to a facility fee of 0.25% per annum.
For the three and nine months ended September 30, 2019, the Company paid $1,281 and $6,510, respectively, in debt issuance costs associated with the 2020 Unsecured Term Loan, the 2026 Unsecured Term Loan and the amended Unsecured Revolving Credit and Term Loan Agreement. For each separate debt instrument, on a lender by lender basis, in accordance with ASC 470-50, Debt Modifications and Extinguishment, the Company performed an assessment of whether the transaction was deemed to be new debt, a modification of existing debt, or an extinguishment of existing debt. Debt issuance costs are either deferred and amortized over the term of the associated debt or expensed as incurred. Based on this assessment, $1,275 and $6,504 of the debt issuance costs incurred in the three and nine months ended September 30, 2019, respectively, were deemed to be related to the issuance of new debt, or the modification of existing debt, and therefore have been deferred and are being amortized over the term of the associated debt. The remaining $6 of the debt issuance costs incurred in the three and nine months ended September 30, 2019, were deemed to be related to the extinguishment of debt and were expensed and included in Cost of debt extinguishment in the accompanying Condensed Consolidated Statements of Income and Comprehensive Income. Additionally, $113 and $328 of unamortized debt issuance costs were expensed in the three and nine months ended September 30, 2019, respectively, and included in Cost of debt extinguishment in the accompanying Condensed Consolidated Statements of Income and Comprehensive Income.
F-35
Table of Contents
Debt issuance costs are amortized as a component of interest expense in the accompanying Condensed Consolidated Statements of Income and Comprehensive Income. The following table summarizes debt issuance cost amortization:
| For the three months ended September 30, |
For the nine months ended September 30, |
|||||||||||||||
| (in thousands) |
2019 | 2018 | 2019 | 2018 | ||||||||||||
| Debt issuance costs amortization |
$ | 611 | $ | 477 | $ | 1,761 | $ | 1,410 | ||||||||
9. Mortgages and Notes Payable
The Company’s mortgages and notes payable consist of the following:
| (in thousands, except interest rates) Lender |
Origination |
Maturity |
Interest |
September 30, 2019 |
December 31, 2018 |
|||||||||||||
| (1) | Wilmington Trust National Association | Apr-19 | Feb-28 | 4.92% | $ | 49,340 | $ | — | (a) (b) (c) (n) | |||||||||
| (2) | Wilmington Trust National Association | Jun-18 | Aug-25 | 4.36% | 20,409 | 20,674 | (a) (b) (c) (m) | |||||||||||
| (3) | PNC Bank | Oct-16 | Nov-26 | 3.62% | 17,980 | 18,260 | (b) (c) | |||||||||||
| (4) | Sun Life | Mar-12 | Oct-21 | 5.13% | 10,990 | 11,288 | (b) (g) | |||||||||||
| (5) | Aegon | Apr-12 | Oct-23 | 6.38% | 7,968 | 8,496 | (b) (h) | |||||||||||
| (6) | M&T Bank | Oct-17 | Aug-21 | one-month LIBOR+3% |
4,949 | 5,051 | (b) (d) (i) (j) | |||||||||||
| (7) | Note holders | Dec-08 | Dec-23 | 6.25% | 750 | 750 | (d) | |||||||||||
| (8) | Standard Insurance Co. | Jul-10 | Aug-30 | 6.75% | 549 | 563 | (b) (c) (d) (f) | |||||||||||
| (9) | Symetra Financial | Nov-17 | Oct-26 | 3.65% | — | 6,467 | (a) (b) (k) (l) | |||||||||||
| (10) | Columbian Mutual Life Insurance Company | Aug-10 | Sep-25 | 7.00% | — | 1,459 | (b) (c) (d) | |||||||||||
| (11) | Legg Mason Mortgage Capital Corporation | Aug-10 | Aug-22 | 7.06% | — | 4,692 | (b) (e) | |||||||||||
| (12) | Standard Insurance Co. | Apr-09 | May-34 | 6.88% | — | 1,751 | (b) (c) | |||||||||||
|
|
|
|
|
|||||||||||||||
| 112,935 | 79,451 | |||||||||||||||||
| Debt issuance costs, net | (373 | ) | (499 | ) | ||||||||||||||
|
|
|
|
|
|||||||||||||||
| $ | 112,562 | $ | 78,952 | |||||||||||||||
|
|
|
|
|
|||||||||||||||
| (a) | Non-recourse debt includes the indemnification/guaranty of the Company and/or the OP pertaining to fraud, environmental claims, insolvency and other matters. |
| (b) | Debt secured by related rental property and lease rents. |
| (c) | Debt secured by guaranty of the OP. |
| (d) | Debt secured by guaranty of the Company. |
| (e) | Debt is guaranteed by a third party. |
| (f) | The interest rate represents the initial interest rate on the respective note. The interest rate will be adjusted at Standard Insurance’s discretion (based on prevailing rates) at 119 months from the first payment date, and the monthly installments will be adjusted accordingly. At the time Standard Insurance may adjust the interest rate for the note payable, the Company has the right to prepay the note without penalty. |
| (g) | Mortgage was assumed in March 2012 as part of an UPREIT transaction. The debt was recorded at fair value at the time of the assumption. |
| (h) | Mortgage was assumed in April 2012 as part of the acquisition of the related property. The debt was recorded at fair value at the time of the assumption. |
| (i) | The Company entered into an interest rate swap agreement in connection with the mortgage note, as further described in Note 10. |
F-36
Table of Contents
| (j) | Mortgage was assumed in October 2017 as part of an UPREIT transaction. The debt was recorded at fair value at the time of the assumption. |
| (k) | Mortgage was assumed in November 2017 as part of the acquisition of the related property. The debt was recorded at fair value at the time of the assumption. |
| (l) | The interest rate will be adjusted to the holder’s quoted five-year commercial mortgage rate for similar size and quality. |
| (m) | Mortgage was assumed in June 2018 as part of the acquisition of the related property. The debt was recorded at fair value at the time of assumption. |
| (n) | Mortgage was assumed in April 2019 as part of the acquisition of the related property. The debt was recorded at fair value at the time of assumption. |
At September 30, 2019, investment in rental property of $179,769 is pledged as collateral against the Company’s mortgages and notes payable.
The following table summarizes the mortgages extinguished by the Company:
| (in thousands, except number of mortgages) |
For the nine months ended September 30, 2019 |
For the year ended December 31, 2018 |
||||||
| Number of mortgages |
4 | 2 | ||||||
| Outstanding balance of mortgages |
$ | 13,905 | $ | 6,666 | ||||
The following table summarizes the cost of mortgage extinguishment:
| For the three months ended September 30, |
For the nine months ended September 30, |
|||||||||||||||
| (in thousands) | 2019 | 2018 | 2019 | 2018 | ||||||||||||
| Cost of mortgage extinguishment |
$ | 336 | $ | 50 | $ | 842 | $ | 101 | ||||||||
Estimated future principal payments to be made under the above mortgage and note payable agreements, and the Company’s unsecured credit agreements (see Note 8) at September 30, 2019 are as follows:
| (in thousands) | ||||
| Remainder of 2019 |
$ | 784 | ||
| 2020 |
303,210 | |||
| 2021 |
18,028 | |||
| 2022 |
306,230 | |||
| 2023 |
273,356 | |||
| Thereafter |
1,194,627 | |||
|
|
|
|||
| $ | 2,096,235 | |||
|
|
|
|||
Certain of the Company’s mortgage and note payable agreements provide for prepayment fees and can be terminated under certain events of default as defined under the related agreements. These prepayment fees are not reflected as part of the table above.
10. Interest Rate Swaps
Interest rate swaps were entered into with certain financial institutions in order to mitigate the impact of interest rate variability over the term of the related debt agreements. The interest rate swaps are considered cash flow hedges. In order to reduce counterparty concentration risk, the Company has a diversification policy for institutions that serve as swap counterparties. Under these agreements, the Company receives monthly payments
F-37
Table of Contents
from the counterparties on these interest rate swaps equal to the related variable interest rates multiplied by the outstanding notional amounts. Certain interest rate swaps amortize on a monthly basis. In turn, the Company pays the counterparties each month an amount equal to a fixed rate multiplied by the related outstanding notional amounts. The intended net impact of these transactions is that the Company pays a fixed interest rate on its variable-rate borrowings.
The following is a summary of the Company’s outstanding interest rate swap agreements:
| (in thousands, except interest rates) | Fair Value | |||||||||||||||||||||||
| Counterparty |
Maturity Date | Fixed Rate |
Variable Rate Index |
Notional Amount |
September 30, 2019 |
December 31, 2018 |
||||||||||||||||||
| Bank of America, N.A. |
November 2023 | 2.80% | one-month LIBOR | $ | 25,000 | $ | (1,389 | ) | $ | (411 | ) | |||||||||||||
| Bank of Montreal |
July 2024 | 1.16% | one-month LIBOR | 40,000 | 421 | 2,702 | ||||||||||||||||||
| Bank of Montreal |
January 2025 | 1.91% | one-month LIBOR | 25,000 | (694 | ) | 769 | |||||||||||||||||
| Bank of Montreal |
July 2025 | 2.32% | one-month LIBOR | 25,000 | (1,333 | ) | 222 | |||||||||||||||||
| Bank of Montreal |
January 2026 | 1.92% | one-month LIBOR | 25,000 | (833 | ) | 915 | |||||||||||||||||
| Bank of Montreal |
January 2026 | 2.05% | one-month LIBOR | 40,000 | (1,643 | ) | 1,130 | |||||||||||||||||
| Bank of Montreal |
December 2026 | 2.33% | one-month LIBOR | 10,000 | (662 | ) | 132 | |||||||||||||||||
| Bank of Montreal |
December 2026 | 1.99% | one-month LIBOR | 25,000 | (1,058 | ) | — | |||||||||||||||||
| Bank of Montreal |
December 2027 | 2.37% | one-month LIBOR | 25,000 | (1,905 | ) | 355 | |||||||||||||||||
| Bank of Montreal |
May 2029 | 2.09% | one-month LIBOR | 25,000 | (1,502 | ) | — | |||||||||||||||||
| Capital One, National Association |
December 2021 | 1.05% | one-month LIBOR | 15,000 | 133 | 605 | ||||||||||||||||||
| Capital One, National Association |
December 2024 | 1.58% | one-month LIBOR | 15,000 | (165 | ) | 727 | |||||||||||||||||
| Capital One, National Association |
January 2026 | 2.08% | one-month LIBOR | 35,000 | (1,515 | ) | 930 | |||||||||||||||||
| Capital One, National Association |
April 2026 | 2.68% | one-month LIBOR | 15,000 | (1,243 | ) | (189 | ) | ||||||||||||||||
| Capital One, National Association |
July 2026 | 1.32% | one-month LIBOR | 35,000 | 118 | 2,877 | ||||||||||||||||||
| Capital One, National Association |
December 2027 | 2.37% | one-month LIBOR | 25,000 | (1,932 | ) | 345 | |||||||||||||||||
| M&T Bank |
August 2021 | 1.02% | one-month LIBOR | 4,948 | 42 | 177 | (a), (b) | |||||||||||||||||
| M&T Bank |
September 2022 | 2.83% | one-month LIBOR | 25,000 | (1,031 | ) | (362 | ) | ||||||||||||||||
| M&T Bank |
November 2023 | 2.65% | one-month LIBOR | 25,000 | (1,284 | ) | (254 | ) | ||||||||||||||||
| Regions Bank |
May 2020 | 2.12% | one-month LIBOR | 50,000 | (104 | ) | 271 | |||||||||||||||||
| Regions Bank |
December 2023 | 1.18% | one-month LIBOR | 25,000 | 199 | 1,484 | ||||||||||||||||||
| Regions Bank |
May 2029 | 2.11% | one-month LIBOR | 25,000 | (1,562 | ) | — | |||||||||||||||||
| Regions Bank |
June 2029 | 2.03% | one-month LIBOR | 25,000 | (1,383 | ) | — | |||||||||||||||||
| SunTrust Bank |
April 2024 | 1.99% | one-month LIBOR | 25,000 | (745 | ) | 554 | |||||||||||||||||
| SunTrust Bank |
April 2025 | 2.20% | one-month LIBOR | 25,000 | (1,181 | ) | 382 | |||||||||||||||||
| SunTrust Bank |
July 2025 | 1.99% | one-month LIBOR | 25,000 | (934 | ) | 728 | |||||||||||||||||
| SunTrust Bank |
December 2025 | 2.30% | one-month LIBOR | 25,000 | (1,474 | ) | 299 | |||||||||||||||||
| SunTrust Bank |
January 2026 | 1.93% | one-month LIBOR | 25,000 | (915 | ) | 903 | |||||||||||||||||
| U.S. Bank National Association |
June 2029 | 2.03% | one-month LIBOR | 25,000 | (1,395 | ) | — | |||||||||||||||||
| U.S. Bank National Association |
August 2029 | 1.35% | one-month LIBOR | 25,000 | 207 | — | ||||||||||||||||||
| Wells Fargo Bank, N.A. |
February 2021 | 2.39% | one-month LIBOR | 35,000 | (385 | ) | 59 | |||||||||||||||||
| Wells Fargo Bank, N.A. |
October 2024 | 2.72% | one-month LIBOR | 15,000 | (994 | ) | (222 | ) | ||||||||||||||||
| Wells Fargo Bank, N.A. |
April 2027 | 2.72% | one-month LIBOR | 25,000 | (2,427 | ) | (382 | ) | ||||||||||||||||
| Wells Fargo Bank, N.A. |
January 2028 | 2.37% | one-month LIBOR | 75,000 | (5,801 | ) | 1,067 | |||||||||||||||||
|
|
|
|
|
|||||||||||||||||||||
| $ | (36,369 | ) | $ | 15,813 | ||||||||||||||||||||
|
|
|
|
|
|||||||||||||||||||||
| (a) | Notional amount at December 31, 2018 was $5,051. |
| (b) | Interest rate swap was assumed in October 2017 as part of an UPREIT transaction. |
F-38
Table of Contents
The total amounts recognized, and the location in the accompanying Condensed Consolidated Statements of Income and Comprehensive Income, from converting from variable rates to fixed rates under these agreements are as follows:
| (in thousands) For the three months ended September 30, |
Amount of (Loss) Gain Recognized in Accumulated Other Comprehensive (Loss) Income |
Reclassification from Accumulated Other Comprehensive (Loss) Income |
Total Interest Expense Presented in the Consolidated Statements of Income and Comprehensive Income |
|||||||||||||
| Location | Amount of Gain (Loss) |
|||||||||||||||
| 2019 |
$ | (16,380 | ) | Interest expense | $ | 387 | $ | 18,465 | ||||||||
| 2018 |
6,299 | Interest expense | (20 | ) | 14,484 | |||||||||||
| (in thousands) For the nine months ended September 30, |
Amount of (Loss) Gain Recognized in Accumulated Other Comprehensive (Loss) Income |
Reclassification from Accumulated Other Comprehensive (Loss) Income |
Total Interest Expense Presented in the Consolidated Statements of Income and Comprehensive Income |
|||||||||||||
| Location | Amount of Gain (Loss) |
|||||||||||||||
| 2019 |
$ | (52,182 | ) | Interest expense | $ | 2,001 | $ | 51,025 | ||||||||
| 2018 |
30,296 | Interest expense | (1,287 | ) | 38,115 | |||||||||||
Amounts related to the interest rate swaps expected to be reclassified out of Accumulated other comprehensive (loss) income to Interest expense during the next twelve months are estimated to be a loss of $3,688. The Company is exposed to credit risk in the event of non-performance by the counterparties of the swaps. The Company minimizes the risk exposure by limiting counterparties to major banks who meet established credit and capital guidelines.
11. Non-Controlling Interests
Under the Company’s UPREIT structure, entities and individuals can contribute their properties in exchange for membership interests in the OP. Properties contributed as part of UPREIT transactions were valued at $15,797 during the nine months ended September 30, 2018, which represents the estimated fair value of the properties contributed, less any assumed debt. There were no UPREIT transactions during the three and nine months ended September 30, 2019.
12. Credit Risk Concentrations
The Company maintained bank balances that, at times, exceeded the federally insured limit during the nine months ended September 30, 2019. The Company has not experienced losses relating to these deposits and management does not believe that the Company is exposed to any significant credit risk with respect to these amounts.
The Company’s rental property is managed by the Manager and the Asset Manager as described in Note 3. Management fees paid to the Manager and Asset Manager represent 17% and 20% of total operating expenses for the three months ended September 30, 2019 and 2018, respectively, and 18% and 19% of total operating expenses for the nine months ended September 30, 2019 and 2018, respectively. These amounts do not include acquisition fees paid to the Asset Manager that were capitalized (see Note 3). The Company has mortgages and notes payable with three institutions that comprise 62%, 16%, and 10% of total mortgages and notes payable at September 30, 2019. The Company has mortgages and notes payable with four institutions that comprise 26%, 23%, 14%, and 11% of total mortgages and notes payable at December 31, 2018. For the three and nine months ended September 30, 2019 and 2018, the Company had no individual tenants or common franchises that accounted for more than 10% of total revenues.
F-39
Table of Contents
13. Equity
Share Redemption Program
The following table summarizes redemptions under the Share Redemption Program:
| For the three months ended September 30, |
For the nine months ended September 30, |
|||||||||||||||
| (in thousands, except number of redemptions) | 2019 | 2018 | 2019 | 2018 | ||||||||||||
| Number of redemptions requested |
20 | 11 | 49 | 33 | ||||||||||||
| Number of shares |
88 | 32 | 147 | 106 | ||||||||||||
| Aggregate redemption price |
$ | 7,361 | $ | 2,675 | $ | 12,374 | $ | 8,564 | ||||||||
Distribution Reinvestment Plan
The Company has adopted a Distribution Reinvestment Plan (“DRIP”), pursuant to which the Company’s stockholders and holders of OP Units (other than the Company), may elect to have cash distributions reinvested in additional shares of the Company’s common stock. Cash distributions will be reinvested in additional shares of common stock pursuant to the DRIP at a per share price equal to 98% of the Determined Share Value as of the applicable distribution date. The Company may amend the DRIP at any time upon written notice to each participant at least 10 days prior to the effective date of the amendment. The Company may terminate the DRIP upon written notice to each participant at least 30 days prior to the effective date of the termination. At September 30, 2019 and December 31, 2018, a total of 2,797 and 2,233 shares of common stock, respectively, have been issued under the DRIP.
14. Earnings per Share
The following table summarizes the components used in the calculation of basic and diluted earnings per share (“EPS”):
| For the three months ended September 30, |
For the nine months ended September 30, |
|||||||||||||||
| (in thousands, except per share) | 2019 | 2018 | 2019 | 2018 | ||||||||||||
| Basic earnings: |
||||||||||||||||
| Net earnings attributable to Broadstone Net Lease, Inc. |
$ | 23,388 | $ | 21,267 | $ | 53,460 | $ | 55,813 | ||||||||
|
|
|
|
|
|
|
|
|
|||||||||
| Diluted earnings: |
||||||||||||||||
| Net earnings attributable to Broadstone Net Lease, Inc. |
$ | 23,388 | $ | 21,267 | $ | 53,460 | $ | 55,813 | ||||||||
| Net earnings attributable to non-controlling interests |
1,650 | 1,797 | 3,942 | 4,631 | ||||||||||||
|
|
|
|
|
|
|
|
|
|||||||||
| $25,038 | $23,064 | $57,402 | $60,444 | |||||||||||||
|
|
|
|
|
|
|
|
|
|||||||||
| Basic and diluted weighted average shares outstanding: |
||||||||||||||||
| Weighted average number of common shares outstanding used in basic earnings per share |
24,642 | 20,554 | 23,394 | 19,850 | ||||||||||||
| Effects of convertible membership units |
1,737 | 1,737 | 1,737 | 1,646 | ||||||||||||
|
|
|
|
|
|
|
|
|
|||||||||
| Weighted average number of common shares outstanding used in diluted earnings per share |
26,379 | 22,291 | 25,131 | 21,496 | ||||||||||||
|
|
|
|
|
|
|
|
|
|||||||||
| Basic and diluted net earnings per common share |
$ | 0.95 | $ | 1.03 | $ | 2.28 | $ | 2.81 | ||||||||
|
|
|
|
|
|
|
|
|
|||||||||
In the table above, outstanding OP Units are included in the diluted earnings per share calculation. However, because such OP Units would also require that the share of the OP income attributable to such OP Units (which are currently presented as non-controlling interest) also be added back to net income, there is no effect on EPS.
F-40
Table of Contents
15. Supplemental Cash Flow Disclosures
Cash paid for interest was $49,828 and $33,108 for the nine months ended September 30, 2019 and 2018, respectively. Cash paid for state income, franchise and foreign taxes was $809 and $307 for the nine months ended September 30, 2019 and 2018, respectively.
The following are non-cash transactions and have been excluded from the accompanying Condensed Consolidated Statements of Cash Flows:
| • | During the nine months ended September 30, 2019 and 2018, the Company issued 550 and 458 shares, respectively, of common stock with a value of approximately $46,084 and $37,055, respectively, under the terms of the DRIP (see Note 13). |
| • | During the nine months ended September 30, 2018, the Company issued 194 OP Units in exchange for property contributed in UPREIT transactions valued at $15,797 (see Note 11). |
| • | During the nine months ended September 30, 2018, the Company cancelled nine thousand shares of common stock with a value of $748 that were pledged as collateral by a tenant. The cancellation of the shares was used to settle $748 in outstanding receivables associated with the tenant. |
| • | At September 30, 2019 and 2018, dividend amounts declared and accrued but not yet paid amounted to $11,932 and $9,722, respectively. |
| • | Upon adoption of ASC 842 on January 1, 2019, described in Note 2, the Company recorded right-of-use assets of $1,687 and lease liabilities of $1,261 associated with ground leases where it is the lessee. The right-of-use asset was recorded net of a straight-line rent liability of $7 and ground lease intangible asset, net of $432 as of the date of adoption. |
| • | In connection with real estate transactions conducted during the nine months ended September 30, 2018, the Company settled notes receivable in the amount of $6,527 in exchange for a reduction to the cash paid for the associated real estate assets. |
| • | In connection with real estate transactions conducted during the nine months ended September 30, 2019, the Company assumed tenant improvement allowances of $2,517 in exchange for a reduction to the cash paid to acquire the associated real estate assets. |
16. Commitments and Contingencies
Litigation
From time to time, the Company is a party to various litigation matters incidental to the conduct of the Company’s business. While the resolution of such matters cannot be predicted with certainty, based on currently available information, the Company does not believe that the final outcome of any of these matters will have a material effect on its consolidated financial position, results of operations, or liquidity.
Property and Acquisition Related
In connection with ownership and operation of real estate, the Company may potentially be liable for cost and damages related to environmental matters. The Company is not aware of any non-compliance, liability, claim, or other environmental condition that would have a material effect on its consolidated financial position, results of operations, or liquidity.
As part of acquisitions closed during the nine months ended September 30, 2019, the company assumed three lease agreements that provided for a total of $2,517 in tenant improvement allowances.
F-41
Table of Contents
Balances associated with tenant improvement allowances are included in Accounts payable and other liabilities on the Condensed Consolidated Balance Sheets as follows:
| (in thousands) |
September 30, 2019 |
December 31, 2018 |
||||||
| Tenant improvement allowances |
$ | 3,664 | $ | 2,125 | ||||
Obligations Under Operating Leases
The Company leases land at certain properties under non-cancellable operating leases with initial lease terms ranging from 2025 to 2066. These leases contain provisions for fixed monthly payments, subject to rent escalations. One lease requires the Company to make annual rent payments calculated based upon sales generated at the property (“percentage rent”). None of the leases are subject to any sublease agreement.
The following table summarizes the total lease costs associated with these leases, reported as a component of Property and operating expense in the accompanying Condensed Consolidated Statements of Income and Comprehensive Income:
| For the three months ended September 30, |
For the nine months ended September 30, |
|||||||||||||||
| (in thousands) | 2019 | 2018 | 2019 | 2018 | ||||||||||||
| Operating lease costs |
$ | 35 | $ | 23 | $ | 105 | $ | 26 | ||||||||
| Variable lease costs |
11 | 11 | 34 | 13 | ||||||||||||
|
|
|
|
|
|
|
|
|
|||||||||
| Total lease costs |
$ | 46 | $ | 34 | $ | 139 | $ | 39 | ||||||||
|
|
|
|
|
|
|
|
|
|||||||||
The following table summarizes payments associated with obligations under operating leases, reported as Cash flows from operating activities on the accompanying Condensed Consolidated Statements of Cash Flows:
| For the three months ended September 30, |
For the nine months ended September 30, |
|||||||||||||||
| (in thousands) | 2019 | 2018 | 2019 | 2018 | ||||||||||||
| Operating lease payments |
$ | 27 | $ | 20 | $ | 127 | $ | 23 | ||||||||
Estimated future lease payments required under non-cancelable operating leases at September 30, 2019, and a reconciliation to the lease liabilities, is as follows:
| (in thousands) | ||||
| Remainder of 2019 |
$ | 29 | ||
| 2020 |
120 | |||
| 2021 |
122 | |||
| 2022 |
124 | |||
| 2023 |
125 | |||
| Thereafter |
2,540 | |||
|
|
|
|||
| Total undiscounted cash flows |
3,060 | |||
| Less imputed interest |
(1,814 | ) | ||
|
|
|
|||
| Lease liabilities |
$ | 1,246 | ||
|
|
|
|||
The above rental payments include future minimum lease payments due during the initial lease terms. Such amounts exclude any variable lease payments associated with percentage rent or changes in the Consumer Price Index that may become due in future periods.
F-42
Table of Contents
17. Subsequent Events
The Company has evaluated subsequent events through November 12, 2019, which is the date the condensed consolidated financial statements were available to be issued.
Through November 12, 2019, the Company has raised $5,789 equivalent to 69 shares of the Company’s common stock through the DRIP. Through November 12, 2019, the Company has paid $11,932 in distributions, including dividend reinvestments.
Subsequent to September 30, 2019, the Company continued to expand its operations through the acquisition of additional rental property and associated intangible assets and liabilities. The Company acquired approximately $16,064 of rental property and associated intangible assets and liabilities. Through November 12, 2019, the Company sold five properties with an aggregate carrying value of $10,922 for total proceeds of $13,731. The Company incurred additional expenses related to the sales of approximately $745, resulting in a gain on sale of real estate of approximately $2,064.
On October 31, 2019, the Board of Directors declared a distribution of $0.44 per share on the Company’s common stock and approved a distribution of $0.44 per OP Unit for monthly distributions through January 2020. The distributions are payable on or prior to the 15th day of the following month to stockholders and unit holders of record on the record date, which is generally the next-to-the-last business day of the prior month. In addition, the IDC determined the share value for the Company’s common stock to be $85.00 per share for the period from November 1, 2019 through January 31, 2020.
Subsequent to September 30, 2019, the OP paid off borrowings on the Revolver in the aggregate amount of $6,000.
Internalization
On November 11, 2019, the Company entered into a definitive merger agreement (the “Merger Agreement”) with the Manager and other parties providing for the internalization of the external management functions currently performed for the Company by the Manager (the “Internalization”). Upon consummation of the Internalization, the Company’s current management team and corporate staff, who are currently employed by the Manager, will become employed by an indirect subsidiary of the Company, and the Company will become internally managed. Subject to the satisfaction of specified closing conditions, the Internalization is scheduled to close during the first quarter of 2020. The Internalization is not considered a termination event under the Property Management Agreement and the Asset Management Agreement (see Note 3). The Property Management Agreement and Asset Management Agreement, however, will be terminated upon closing of the Internalization, but no fees will be payable under them as a result of that termination. The Internalization will consist of the acquisition of the Manager through a series of mergers pursuant to the Merger Agreement.
The consideration paid pursuant to the Merger Agreement will consist of (i) base consideration of approximately $206 million plus assumption of debt of approximately $94 million, payable upon closing and (ii) additional consideration of up to $75 million payable in four tranches of $10 million, $15 million, $25 million, and $25 million if certain milestones related to either (a) the dollar volume-weighted average price of a share of the Company’s common stock (“VWAP per REIT Share”), following the completion of an initial public offering of the Company’s common stock (“IPO”), or (b) the Company’s adjusted funds from operations (“AFFO”) per share, prior to the completion of an IPO, are achieved during specified periods of time following the closing of the Internalization (the “Earnout Periods”). The consideration will consist of a combination of cash, shares of the Company’s common stock, and OP Units, at the election of the owners of the Manager.
F-43
Table of Contents
The earnout tranches, applicable VWAP of a REIT Share and AFFO per share, and the applicable Earnout Periods are as follows:
| If the Company has completed an IPO | If the Company has not completed an IPO | |||||||||||
| Earnout Tranche |
VWAP of a REIT Share |
Applicable Earnout Period |
AFFO per Share |
Applicable Earnout Period | ||||||||
| $10 million | $ | 90.00 | The two-year period beginning on the earlier of (i) the IPO closing date or (ii) December 31, 2020. | $ | 5.85 | The two-year period consisting of the calendar years ended December 31, 2020 and December 31, 2021. | ||||||
| $15 million | $ | 95.00 | The two-year period beginning on the earlier of (i) the IPO closing date or (ii) December 31, 2020. | $ | 5.95 | The two-year period consisting of the calendar years ended December 31, 2020 and December 31, 2021. | ||||||
| $25 million | $ | 97.50 | The four-year period beginning on the date that is exactly one year after the earnout period begins for the first and second tranches above. | $ | 6.30 | The four-year period consisting of the calendar years ended December 31, 2021, December 31, 2022, December 31, 2023 and December 31, 2024. | ||||||
| $25 million | $ | 100.00 | The four-year period beginning on the date that is exactly one year after the earnout period begins for the first and second tranches above. | $ | 6.70 | The four-year period consisting of the calendar years ended December 31, 2021, December 31, 2022, December 31, 2023 and December 31, 2024. | ||||||
Upon closing of the Internalization, the Company’s existing management team, who are currently employees of the Manager, including the Company’s current executive officers, will become employees of the Company, providing a seamless transition and clarity as to future senior leadership. Each of Christopher J. Czarnecki, Ryan M. Albano, John D. Moragne, and Sean T. Cutt are expected to terminate their employment with the Manager and enter into employment agreements with the Company or its subsidiary to serve as the Company’s Chief Executive Officer, Chief Financial Officer, Chief Operating Officer, and Chief Investment Officer, respectively.
The Merger Agreement contains customary representations, warranties and covenants. Each party’s obligation to consummate the transactions contemplated by the Merger Agreement is subject to customary closing conditions.
The Merger Agreement does not provide that the completion of an IPO is a condition to the closing of the Internalization. Under the terms of the Merger Agreement, however, if the Company does not complete an IPO by December 31, 2020, then the former owners of the Manager who receive shares of the Company’s common stock and/or OP Units will be granted certain redemption rights as a means to provide additional liquidity in the absence of an IPO.
Prior to closing the Internalization, the Company has agreed to repurchase all of the outstanding shares of common stock held by the Manager in exchange for cash at a per share price equal to $85.00, the current Determined Share Value.
F-44
Table of Contents
REPORT OF INDEPENDENT REGISTERED PUBLIC ACCOUNTING FIRM
To the stockholders and the Board of Directors of Broadstone Net Lease, Inc.
Opinion on the Financial Statements
We have audited the accompanying consolidated balance sheets of Broadstone Net Lease, Inc. and Subsidiaries (the “Company”) as of December 31, 2018 and 2017, the related consolidated statements of income and comprehensive income, stockholders’ equity, and cash flows for each of the three years ended December 31, 2018 and the related notes and the schedule listed in the Index at Item 15 (collectively referred to as the “financial statements”). In our opinion, the financial statements present fairly, in all material respects, the financial position of the Company as of December 31, 2018 and 2017, and the results of its operations and its cash flows for each of the three years in the period ended December 31, 2018, in conformity with accounting principles generally accepted in the United States of America.
Basis for Opinion
These financial statements are the responsibility of the Company’s management. Our responsibility is to express an opinion on the Company’s financial statements based on our audits. We are a public accounting firm registered with the Public Company Accounting Oversight Board (United States) (PCAOB) and are required to be independent with respect to the Company in accordance with the U.S. federal securities laws and the applicable rules and regulations of the Securities and Exchange Commission and the PCAOB.
We conducted our audits in accordance with the standards of the PCAOB. Those standards require that we plan and perform the audit to obtain reasonable assurance about whether the financial statements are free of material misstatement, whether due to error or fraud. The Company is not required to have, nor were we engaged to perform, an audit of its internal control over financial reporting. As part of our audits, we are required to obtain an understanding of internal control over financial reporting but not for the purpose of expressing an opinion on the effectiveness of the Company’s internal control over financial reporting. Accordingly, we express no such opinion.
Our audits included performing procedures to assess the risks of material misstatement of the financial statements, whether due to error or fraud, and performing procedures that respond to those risks. Such procedures included examining, on a test basis, evidence regarding the amounts and disclosures in the financial statements. Our audits also included evaluating the accounting principles used and significant estimates made by management, as well as evaluating the overall presentation of the financial statements. We believe that our audits provide a reasonable basis for our opinion.
/s/ Deloitte & Touche LLP
Rochester, New York
March 14, 2019
We have served as the Company’s auditor since 2016.
F-45
Table of Contents
Broadstone Net Lease, Inc. and Subsidiaries
Consolidated Balance Sheets
(in thousands, except per share amounts)
| December 31, | ||||||||
| 2018 | 2017 | |||||||
| Assets |
||||||||
| Accounted for using the operating method, net of accumulated depreciation |
$ | 2,641,746 | $ | 2,186,141 | ||||
| Accounted for using the direct financing method |
42,000 | 41,617 | ||||||
|
|
|
|
|
|||||
| Investment in rental property, net |
2,683,746 | 2,227,758 | ||||||
| Cash and cash equivalents |
18,612 | 9,355 | ||||||
| Restricted cash |
377 | 744 | ||||||
| Accrued rental income |
69,247 | 52,018 | ||||||
| Tenant and other receivables, net |
1,026 | 897 | ||||||
| Tenant and capital reserves |
1,136 | 943 | ||||||
| Prepaid expenses and other assets |
2,803 | 267 | ||||||
| Notes receivable |
— | 6,527 | ||||||
| Investment in related party |
— | 10,000 | ||||||
| Interest rate swap, assets |
17,633 | 11,008 | ||||||
| Intangible lease assets, net |
286,258 | 242,659 | ||||||
| Debt issuance costs—unsecured revolver, net |
2,261 | 3,026 | ||||||
| Leasing fees, net |
13,698 | 13,554 | ||||||
|
|
|
|
|
|||||
| Total assets |
$ | 3,096,797 | $ | 2,578,756 | ||||
|
|
|
|
|
|||||
| Liabilities and equity |
||||||||
| Unsecured revolver |
$ | 141,100 | $ | 273,000 | ||||
| Mortgages and notes payable, net |
78,952 | 67,832 | ||||||
| Unsecured term notes, net |
1,225,773 | 836,912 | ||||||
| Interest rate swap, liabilities |
1,820 | 5,020 | ||||||
| Accounts payable and other liabilities |
22,269 | 20,345 | ||||||
| Due to related parties |
114 | 722 | ||||||
| Tenant improvement allowances |
2,125 | 5,669 | ||||||
| Accrued interest payable |
9,777 | 3,311 | ||||||
| Intangible lease liabilities, net |
85,947 | 81,744 | ||||||
|
|
|
|
|
|||||
| Total liabilities |
1,567,877 | 1,294,555 | ||||||
|
|
|
|
|
|||||
| Commitments and contingencies (See Note 18) |
||||||||
| Equity |
||||||||
| Broadstone Net Lease, Inc. stockholders’ equity: |
||||||||
| Preferred stock, $0.001 par value; 20,000 shares authorized, no shares issued or outstanding |
— | — | ||||||
| Common stock, $0.001 par value; 80,000 shares authorized, 22,014 and 18,909 shares issued and outstanding at December 31, 2018 and 2017, respectively |
22 | 19 | ||||||
| Additional paid-in capital |
1,557,421 | 1,301,979 | ||||||
| Subscriptions receivable |
— | (15 | ) | |||||
| Cumulative distributions in excess of retained earnings |
(155,150 | ) | (120,280 | ) | ||||
| Accumulated other comprehensive income |
14,806 | 5,122 | ||||||
|
|
|
|
|
|||||
| Total Broadstone Net Lease, Inc. stockholders’ equity |
1,417,099 | 1,186,825 | ||||||
| Non-controlling interests |
111,821 | 97,376 | ||||||
|
|
|
|
|
|||||
| Total equity |
1,528,920 | 1,284,201 | ||||||
|
|
|
|
|
|||||
| Total liabilities and equity |
$ | 3,096,797 | $ | 2,578,756 | ||||
|
|
|
|
|
|||||
The accompanying notes are an integral part of these consolidated financial statements.
F-46
Table of Contents
Broadstone Net Lease, Inc. and Subsidiaries
Consolidated Statements of Income and Comprehensive Income
(in thousands, except per share amounts)
| For the years ended December 31, | ||||||||||||
| 2018 | 2017 | 2016 | ||||||||||
| Revenues |
||||||||||||
| Rental income from operating leases |
$ | 222,208 | $ | 170,493 | $ | 133,943 | ||||||
| Earned income from direct financing leases |
3,941 | 4,141 | 4,544 | |||||||||
| Operating expenses reimbursed from tenants |
11,221 | 6,721 | 4,173 | |||||||||
| Other income from real estate transactions |
109 | 208 | 209 | |||||||||
|
|
|
|
|
|
|
|||||||
| Total revenues |
237,479 | 181,563 | 142,869 | |||||||||
|
|
|
|
|
|
|
|||||||
| Operating expenses |
||||||||||||
| Depreciation and amortization |
83,994 | 62,263 | 46,321 | |||||||||
| Asset management fees |
18,173 | 14,754 | 10,955 | |||||||||
| Property management fees |
6,529 | 4,988 | 3,939 | |||||||||
| Acquisition expenses |
— | — | 10,880 | |||||||||
| Property and operating expense |
11,157 | 6,505 | 3,900 | |||||||||
| General and administrative |
6,162 | 4,939 | 2,790 | |||||||||
| State and franchise tax |
857 | 624 | 446 | |||||||||
| Provision for impairment of investment in rental properties |
2,061 | 2,608 | — | |||||||||
|
|
|
|
|
|
|
|||||||
| Total operating expenses |
128,933 | 96,681 | 79,231 | |||||||||
|
|
|
|
|
|
|
|||||||
| Other income (expenses) |
||||||||||||
| Preferred distribution income |
440 | 737 | 713 | |||||||||
| Interest income |
179 | 467 | 88 | |||||||||
| Interest expense |
(52,855 | ) | (34,751 | ) | (29,963 | ) | ||||||
| Cost of debt extinguishment |
(101 | ) | (5,151 | ) | (133 | ) | ||||||
| Gain on sale of real estate |
10,496 | 12,992 | 5,925 | |||||||||
| Gain on sale of investment in related party |
8,500 | — | — | |||||||||
| Other (losses) gains |
(100 | ) | 379 | — | ||||||||
|
|
|
|
|
|
|
|||||||
| Net income |
75,105 | 59,555 | 40,268 | |||||||||
| Net income attributable to non-controlling interests |
(5,730 | ) | (4,756 | ) | (3,914 | ) | ||||||
|
|
|
|
|
|
|
|||||||
| Net income attributable to Broadstone Net Lease, Inc. |
$ | 69,375 | $ | 54,799 | $ | 36,354 | ||||||
|
|
|
|
|
|
|
|||||||
| Weighted average number of common shares outstanding |
||||||||||||
| Basic |
20,242 | 17,084 | 13,178 | |||||||||
|
|
|
|
|
|
|
|||||||
| Diluted |
21,910 | 18,567 | 14,597 | |||||||||
|
|
|
|
|
|
|
|||||||
| Net Earnings per common share |
||||||||||||
| Basic and diluted |
$ | 3.43 | $ | 3.21 | $ | 2.76 | ||||||
|
|
|
|
|
|
|
|||||||
| Comprehensive income |
||||||||||||
| Net income |
$ | 75,105 | $ | 59,555 | $ | 40,268 | ||||||
| Other comprehensive income |
||||||||||||
| Change in fair value of interest rate swaps |
10,584 | 4,166 | 13,771 | |||||||||
| Realized gain on interest rate swaps |
(84 | ) | (873 | ) | — | |||||||
|
|
|
|
|
|
|
|||||||
| Comprehensive income |
85,605 | 62,848 | 54,039 | |||||||||
| Comprehensive income attributable to non-controlling interests |
(6,546 | ) | (5,019 | ) | (5,253 | ) | ||||||
|
|
|
|
|
|
|
|||||||
| Comprehensive income attributable to Broadstone Net Lease, Inc. |
$ | 79,059 | $ | 57,829 | $ | 48,786 | ||||||
|
|
|
|
|
|
|
|||||||
The accompanying notes are an integral part of these consolidated financial statements.
F-47
Table of Contents
Broadstone Net Lease, Inc. and Subsidiaries
Consolidated Statements of Stockholders’ Equity
(in thousands, except per share amounts)
| Common Stock |
Additional Paid-in Capital |
Subscriptions Receivable |
Cumulative Distributions in Excess of Retained Earnings |
Accumulated Other Comprehensive (Loss)/Income |
Non- controlling Interests |
Total | ||||||||||||||||||||||
| Balance, January 1, 2016 |
$ | 11 | $ | 738,909 | $ | (1,506 | ) | $ | (56,911 | ) | $ | (10,340 | ) | $ | 77,782 | $ | 747,945 | |||||||||||
| Net income |
— | — | — | 36,354 | — | 3,914 | 40,268 | |||||||||||||||||||||
| Issuance of 3,784 shares of common stock |
4 | 284,062 | (8,284 | ) | — | — | — | 275,782 | ||||||||||||||||||||
| Other offering costs |
— | (1,310 | ) | — | — | — | — | (1,310 | ) | |||||||||||||||||||
| Issuance of 97 membership units |
— | — | — | — | — | 7,190 | 7,190 | |||||||||||||||||||||
| Distributions declared ($0.405 per share January and February 2016, $0.410 per share March through December 2016) |
— | — | — | (69,403 | ) | — | (7,552 | ) | (76,955 | ) | ||||||||||||||||||
| Change in fair value of interest rate swap agreements |
— | — | — | — | 12,432 | 1,339 | 13,771 | |||||||||||||||||||||
| Redemption of 109 shares of common stock |
— | (8,154 | ) | — | — | — | — | (8,154 | ) | |||||||||||||||||||
| Adjustment of non-controlling interests |
— | (4,076 | ) | — | — | — | 4,076 | — | ||||||||||||||||||||
|
|
|
|
|
|
|
|
|
|
|
|
|
|
|
|||||||||||||||
| Balance, December 31, 2016 |
15 | 1,009,431 | (9,790 | ) | (89,960 | ) | 2,092 | 86,749 | 998,537 | |||||||||||||||||||
| Net income |
— | — | — | 54,799 | — | 4,756 | 59,555 | |||||||||||||||||||||
| Issuance of 3,833 shares of common stock |
4 | 303,711 | 9,775 | — | — | — | 313,490 | |||||||||||||||||||||
| Other offering costs |
— | (1,380 | ) | — | — | — | — | (1,380 | ) | |||||||||||||||||||
| Issuance of 161 membership units |
— | — | — | — | — | 12,913 | 12,913 | |||||||||||||||||||||
| Distributions declared ($0.410 per share January 2017, $0.415 per share February through December 2017) |
— | — | — | (85,119 | ) | — | (7,649 | ) | (92,768 | ) | ||||||||||||||||||
| Change in fair value of interest rate swap agreements |
— | — | — | — | 3,834 | 332 | 4,166 | |||||||||||||||||||||
| Realized loss on interest rate swap agreements |
— | — | — | — | (804 | ) | (69 | ) | (873 | ) | ||||||||||||||||||
| Conversion of 37 membership units to 37 shares of common stock |
— | 2,986 | — | — | — | (2,986 | ) | — | ||||||||||||||||||||
| Redemption of 119 shares of common stock |
— | (9,439 | ) | — | — | — | — | (9,439 | ) | |||||||||||||||||||
| Adjustment of non-controlling interests |
— | (3,330 | ) | — | — | — | 3,330 | — | ||||||||||||||||||||
|
|
|
|
|
|
|
|
|
|
|
|
|
|
|
|||||||||||||||
| Balance, December 31, 2017 |
19 | 1,301,979 | (15 | ) | (120,280 | ) | 5,122 | 97,376 | 1,284,201 | |||||||||||||||||||
| Net income |
— | — | — | 69,375 | — | 5,730 | 75,105 | |||||||||||||||||||||
| Issuance of 3,233 shares of common stock |
3 | 268,478 | 15 | — | — | — | 268,496 | |||||||||||||||||||||
| Other offering costs |
— | (1,158 | ) | — | — | — | — | (1,158 | ) | |||||||||||||||||||
| Issuance of 194 membership units |
— | — | — | — | — | 15,797 | 15,797 | |||||||||||||||||||||
| Distributions declared ($0.415 per share January 2018, $0.430 per share February through December 2018) |
— | — | — | (104,245 | ) | — | (8,724 | ) | (112,969 | ) | ||||||||||||||||||
| Change in fair value of interest rate swap agreements |
— | — | — | — | 9,762 | 822 | 10,584 | |||||||||||||||||||||
| Realized gain on interest rate swap agreements |
— | — | — | — | (78 | ) | (6 | ) | (84 | ) | ||||||||||||||||||
| Conversion of eight membership units to eight shares of common stock |
— | 684 | — | — | — | (684 | ) | — | ||||||||||||||||||||
| Redemption of 127 shares of common stock |
— | (10,304 | ) | — | — | — | — | (10,304 | ) | |||||||||||||||||||
| Cancellation of nine shares of common stock |
— | (748 | ) | — | — | — | — | (748 | ) | |||||||||||||||||||
| Adjustment of non-controlling interests |
— | (1,510 | ) | — | — | — | 1,510 | — | ||||||||||||||||||||
|
|
|
|
|
|
|
|
|
|
|
|
|
|
|
|||||||||||||||
| Balance, December 31, 2018 |
$ | 22 | $ | 1,557,421 | $ | — | $ | (155,150 | ) | $ | 14,806 | $ | 111,821 | $ | 1,528,920 | |||||||||||||
|
|
|
|
|
|
|
|
|
|
|
|
|
|
|
|||||||||||||||
The accompanying notes are an integral part of these consolidated financial statements.
F-48
Table of Contents
Broadstone Net Lease, Inc. and Subsidiaries
Consolidated Statements of Cash Flows
(in thousands)
| For the years ended December 31, | ||||||||||||
| 2018 | 2017 | 2016 | ||||||||||
| Operating activities |
||||||||||||
| Net income |
$ | 75,105 | $ | 59,555 | $ | 40,268 | ||||||
| Adjustments to reconcile net income including non-controlling interest to net cash provided by operating activities: |
||||||||||||
| Depreciation and amortization including intangibles associated with investment in rental property |
83,690 | 62,759 | 45,839 | |||||||||
| Provision for impairment of investment in rental properties |
2,061 | 2,608 | — | |||||||||
| Amortization of debt issuance costs charged to interest expense |
1,776 | 1,893 | 1,626 | |||||||||
| Straight-line rent and financing lease adjustments |
(19,492 | ) | (17,132 | ) | (13,847 | ) | ||||||
| Cost of debt extinguishment |
101 | 5,151 | 81 | |||||||||
| Gain on sale of real estate |
(10,496 | ) | (12,992 | ) | (5,925 | ) | ||||||
| Settlement of interest rate swap |
760 | (1,965 | ) | — | ||||||||
| Gain on sale of investment in related party |
(8,500 | ) | — | — | ||||||||
| Leasing fees paid |
(1,399 | ) | (3,339 | ) | (2,932 | ) | ||||||
| Other non-cash items |
528 | (1,258 | ) | 405 | ||||||||
| Changes in assets and liabilities: |
||||||||||||
| Tenant and other receivables |
(876 | ) | (542 | ) | 214 | |||||||
| Prepaid expenses and other assets |
(936 | ) | (8 | ) | 212 | |||||||
| Accounts payable and other liabilities |
(777 | ) | 1,501 | 1,060 | ||||||||
| Accrued interest payable |
6,466 | 1,709 | 188 | |||||||||
|
|
|
|
|
|
|
|||||||
| Net cash provided by operating activities |
128,011 | 97,940 | 67,189 | |||||||||
|
|
|
|
|
|
|
|||||||
| Investing activities |
||||||||||||
| Acquisition of rental property accounted for using the operating method, net of mortgages assumed of $20,845, $5,205 and $0 in 2018, 2017 and 2016, respectively |
(575,764 | ) | (657,286 | ) | (500,061 | ) | ||||||
| Related party acquisition of rental property accounted for using the operating method, net of mortgage assumed of $0, $6,721 and $0 in 2018, 2017 and 2016, respectively |
— | (7,531 | ) | — | ||||||||
| Acquisition of rental property accounted for using the direct financing method |
(430 | ) | (3,546 | ) | (544 | ) | ||||||
| Capital expenditures and improvements |
(4,960 | ) | (6,606 | ) | (1,938 | ) | ||||||
| Issuance of notes receivable |
— | — | (2,827 | ) | ||||||||
| Proceeds from sale of investment in related party |
18,500 | — | — | |||||||||
| Proceeds from disposition of rental property, net |
53,988 | 63,310 | 34,890 | |||||||||
| Increase in tenant and capital reserves |
(193 | ) | (176 | ) | (93 | ) | ||||||
| Change in deposits on investments in rental property |
(1,600 | ) | — | — | ||||||||
|
|
|
|
|
|
|
|||||||
| Net cash used in investing activities |
(510,459 | ) | (611,835 | ) | (470,573 | ) | ||||||
|
|
|
|
|
|
|
|||||||
| Financing activities |
||||||||||||
| Proceeds from issuance of common stock, net |
215,902 | 272,827 | 246,453 | |||||||||
| Redemptions of common stock |
(10,204 | ) | (9,439 | ) | (8,154 | ) | ||||||
| Borrowings on mortgages, notes payable and unsecured term notes, net of mortgages assumed of $20,845, $11,926 and $0 in 2018, 2017 and 2016, respectively |
415,000 | 515,000 | 114,000 | |||||||||
| Principal payments on mortgages, notes payable and unsecured term notes |
(34,722 | ) | (386,080 | ) | (11,387 | ) | ||||||
| Borrowings on unsecured revolver |
343,600 | 494,000 | 308,500 | |||||||||
| Repayments on unsecured revolver |
(475,500 | ) | (323,000 | ) | (206,500 | ) | ||||||
| Cash distributions paid to stockholders |
(51,845 | ) | (44,540 | ) | (35,731 | ) | ||||||
| Cash distributions paid to non-controlling interests |
(8,638 | ) | (7,574 | ) | (6,967 | ) | ||||||
| Debt issuance and extinguishment costs paid |
(2,255 | ) | (10,303 | ) | (864 | ) | ||||||
|
|
|
|
|
|
|
|||||||
| Net cash provided by financing activities |
391,338 | 500,891 | 399,350 | |||||||||
|
|
|
|
|
|
|
|||||||
| Net increase (decrease) in cash and cash equivalents and restricted cash |
8,890 | (13,004 | ) | (4,034 | ) | |||||||
| Cash and cash equivalents and restricted cash at beginning of period |
10,099 | 23,103 | 27,137 | |||||||||
|
|
|
|
|
|
|
|||||||
| Cash and cash equivalents and restricted cash at end of period |
$ | 18,989 | $ | 10,099 | $ | 23,103 | ||||||
|
|
|
|
|
|
|
|||||||
| Reconciliation of cash and cash equivalents and restricted cash |
||||||||||||
| Cash and cash equivalents at beginning of period |
$ | 9,355 | $ | 21,635 | $ | 27,050 | ||||||
| Restricted cash at beginning of period |
744 | 1,468 | 87 | |||||||||
|
|
|
|
|
|
|
|||||||
| Cash and cash equivalents and restricted cash at beginning of period |
$ | 10,099 | $ | 23,103 | $ | 27,137 | ||||||
|
|
|
|
|
|
|
|||||||
| Cash and cash equivalents at end of period |
$ | 18,612 | $ | 9,355 | $ | 21,635 | ||||||
| Restricted cash at end of period |
377 | 744 | 1,468 | |||||||||
|
|
|
|
|
|
|
|||||||
| Cash and cash equivalents and restricted cash at end of period |
$ | 18,989 | $ | 10,099 | $ | 23,103 | ||||||
|
|
|
|
|
|
|
|||||||
The accompanying notes are an integral part of these consolidated financial statements.
F-49
Table of Contents
Broadstone Net Lease, Inc. and Subsidiaries
Notes to Consolidated Financial Statements (in thousands)
December 31, 2018, 2017, and 2016
1. Business Description
Broadstone Net Lease, Inc. (the “Company”) is a Maryland corporation formed on October 18, 2007, that elected to be taxed as a real estate investment trust (“REIT”) commencing with the taxable year ended December 31, 2008. The Company focuses on investing in income-producing, net leased commercial properties. The Company leases properties to industrial, healthcare, restaurant, office, retail, and other commercial businesses under long-term lease agreements. At December 31, 2018, the Company owned a diversified portfolio of 621 individual net leased commercial properties located in 42 states throughout the continental United States.
Broadstone Net Lease, LLC (the “OP”), is the entity through which the Company conducts its business and owns (either directly or through subsidiaries) all of the Company’s properties. The Company is the sole managing member of the Operating Company. The remaining interests in the OP, which are referred to as non-controlling interests, are held by members who acquired their interest by contributing property to the OP in exchange for membership units of the OP (“OP Units”). As the Company conducts substantially all of its operations through the OP, it is structured as what is referred to as an Umbrella Partnership Real Estate Investment Trust (“UPREIT”). The following table summarizes the economic ownership interest in the OP at December 31, 2018, 2017, and 2016:
| December 31, | ||||||||||||
| Percentage of shares owned by |
2018 | 2017 | 2016 | |||||||||
| Company |
92.7 | % | 92.4 | % | 91.4 | % | ||||||
| Non-controlling interests |
7.3 | % | 7.6 | % | 8.6 | % | ||||||
|
|
|
|
|
|
|
|||||||
| 100.0 | % | 100.0 | % | 100.0 | % | |||||||
|
|
|
|
|
|
|
|||||||
The Company operates under the direction of its board of directors (the “Board of Directors”), which is responsible for the management and control of the Company’s (as defined below) affairs. The Company is externally managed and its Board of Directors has retained the Company’s sponsor, Broadstone Real Estate, LLC (the “Manager”) and Broadstone Asset Management, LLC (the “Asset Manager”) to manage the Company’s day-to-day affairs, to implement the Company’s investment strategy and to provide certain property management services for the Company’s properties, subject to the Board of Director’s direction, oversight, and approval. The Asset Manager is a wholly owned subsidiary of the Manager and all of the Company’s officers are employees of the Manager. Accordingly, both the Manager and the Asset Manager are related parties of the Company. Refer to Note 3 for further discussion over related parties and related party transactions.
2. Summary of Significant Accounting Policies
Principles of Consolidation
The Consolidated Financial Statements include the accounts and operations of the Company, the OP, and its consolidated subsidiaries, all of which are wholly owned by the OP (collectively, the “Company”). All intercompany balances and transactions have been eliminated in consolidation.
To the extent the Company has a variable interest in entities that are not evaluated under the variable interest entity (“VIE”) model, the Company evaluates its interests using the voting interest entity model. The Company holds a 92.7% interest in the OP at December 31, 2018 and is the sole managing member of the OP, which gives the Company exclusive and complete responsibility for the day-to-day management, authority to make decisions, and control of the OP. Based on consolidation guidance, the Company has concluded that the OP is a VIE as the members in the OP do not possess kick-out rights or substantive participating rights. Accordingly, the Company
F-50
Table of Contents
consolidates its interest in the OP. However, as the Company holds the majority voting interest in the OP, it qualifies for the exemption from providing certain disclosure requirements associated with investments in VIEs.
The portion of the OP not owned by the Company is presented as non-controlling interests as of and during the periods presented.
Basis of Accounting
The Consolidated Financial Statements have been prepared in accordance with generally accepted accounting principles in the United States (“GAAP”).
Use of Estimates
The preparation of Consolidated Financial Statements in conformity with GAAP requires management to make certain estimates and assumptions that affect the reported amounts of assets and liabilities and disclosure of contingent assets and liabilities at the date of the Consolidated Financial Statements and the reported amounts of revenues and expenses during the reporting periods. Significant estimates include, but are not limited to, the allocation of purchase price between investment in rental property and intangible assets acquired and liabilities assumed, the value of long-lived assets, the provision for impairment, the depreciable lives of rental property, the amortizable lives of intangible assets and liabilities, the allowance for doubtful accounts, the fair value of assumed debt and notes payable, the fair value of the Company’s interest rate swap agreements, and the determination of any uncertain tax positions. Accordingly, actual results may differ from those estimates.
Investment in Rental Property
Rental property accounted for under operating leases is recorded at cost. Rental property accounted for under direct financing leases is recorded at its net investment, which generally represents the cost of the property at the inception of the lease.
The Company early adopted Financial Accounting Standards Board (“FASB”) Accounting Standards Update (“ASU”) 2017-01, Business Combinations (Topic 805): Clarifying the Definition of a Business (“ASU 2017-01”), on a prospective basis, effective January 1, 2017. The guidance changes the definition of a business to exclude acquisitions where substantially all of the fair value of the assets acquired are concentrated in a single identifiable asset or group of similar identifiable assets, and therefore are accounted for as asset acquisitions instead of business combinations. All of the acquisitions closed subsequent to the adoption of this guidance, and therefore during the years ended December 31, 2018 and 2017, did not meet the definition of a business and accordingly were accounted for as asset acquisitions.
The Company allocates the purchase price of investments in rental property accounted for as an asset acquisition based on the relative fair value of the assets acquired and liabilities assumed. These generally include tangible assets, consisting of land and land improvements, buildings and other improvements, and equipment, and identifiable intangible assets and liabilities, including the value of in-place leases and acquired above-market and below-market leases. Acquisition costs incurred in connection with investments in real estate accounted for as asset acquisitions are capitalized and included with the allocated purchase price. The results of operations of acquired properties are included in the Consolidated Statements of Income and Comprehensive Income from the respective date of acquisition.
The Company allocates the purchase price of investments in rental property accounted for as a business combination based on the estimated fair value at the date of the acquisition of the assets acquired and liabilities assumed. These generally include tangible assets, consisting of land and land improvements, buildings and other improvements, and equipment, and identifiable intangible assets and liabilities, including the value of in-place leases and acquired above-market and below-market leases. Acquisition costs incurred in connection with
F-51
Table of Contents
investments in real estate accounted for as business combinations are expensed at the time of acquisition. The results of operations of acquired properties are included in the Consolidated Statements of Income and Comprehensive Income from the respective date of acquisition.
Estimated fair value determinations are based on management’s judgment, which considers various factors including real estate market conditions, industry conditions that the tenant operates in, and characteristics of the real estate and/or real estate appraisals.
The estimated fair value of the tangible assets of an acquired property is determined by valuing the property as if it were vacant. The as-if-vacant value is then allocated to land and land improvements, buildings, and equipment based on comparable sales and other relevant information with respect to the property as estimated by management. Specifically, the “if vacant” value of buildings and equipment is calculated using an income approach. Assumptions used in the income approach to value the buildings include: capitalization and discount rates, lease-up time, market rents, make ready costs, land value, and land improvement value.
The estimated fair value of acquired in-place leases are the costs that the Company would have had to incur to lease the properties to the occupancy level of the properties at the date of acquisition. Such costs include the fair value of leasing commissions and other operating costs that would have been incurred to lease the properties, had they been vacant, to their acquired occupancy level. Acquired in-place leases as of the date of acquisition are amortized over the remaining non-cancellable lease terms of the respective leases to amortization expense.
Acquired above-market and below-market lease values are recorded based on the present value (using an interest rate that reflects the risks associated with the lease acquired) of the differences between the contractual amounts to be paid pursuant to the in-place leases and management’s estimate of fair market value lease rates at the time of acquisition for the corresponding in-place leases. The capitalized above-market and below-market lease values are amortized as adjustments to rental income over the remaining term of the respective leases.
Should a tenant terminate its lease, the unamortized portion of the in-place lease value is charged to amortization expense and the unamortized portion of above-market or below-market lease value is charged to rental income.
Management estimates the fair value of assumed mortgages and notes payable based upon indications of then-current market pricing for similar types of debt with similar maturities. Assumed mortgages and notes payable are initially recorded at their estimated fair value as of the assumption date, and the difference between such estimated fair value and the notes’ outstanding principal balance is amortized to interest expense over the remaining term of the debt.
Expenditures for significant betterments and improvements are capitalized. Maintenance and repairs are charged to expense when incurred. Construction and improvement costs incurred in connection with the development of new properties or the redevelopment of existing properties are capitalized. Real estate taxes, interest costs, and leasing and development costs incurred during construction periods are capitalized. Capitalization is based on qualified expenditures and interest rates. Capitalized real estate taxes, interest costs, and leasing and development costs are amortized over lives which are consistent with the related assets. There were no capitalized interest or real estate taxes during the years ended December 31, 2018, 2017, and 2016.
Long-lived Asset Impairment
The Company reviews long-lived assets to be held and used for possible impairment when events or changes in circumstances indicate that their carrying amounts may not be recoverable. If, and when, such events or changes in circumstances are present, an impairment exists to the extent the carrying value of the asset or asset group exceeds the sum of the undiscounted cash flows expected to result from the use of the asset or asset group and its eventual disposition. Such cash flows include expected future operating income, as adjusted for trends and prospects, as well as the effects of demand, competition, and other factors. An impairment loss is measured as the
F-52
Table of Contents
amount by which the carrying amount of the asset or asset group exceeds the fair value of the asset or asset group. A significant judgment is made as to if and when impairment should be taken. If our strategy, or one or more of the assumptions described above were to change in the future, an impairment may need to be recognized.
Inputs used in establishing fair value for real estate assets generally fall within Level 3 of the fair value hierarchy, which are characterized as requiring significant judgment as little or no current market activity may be available for validation. The main indicator used to establish the classification of the inputs is current market conditions, as derived through the use of published commercial real estate market information. The Company determines the valuation of impaired assets using generally accepted valuation techniques including discounted cash flow analysis, income capitalization, analysis of recent comparable sales transactions, actual sales negotiations and bona fide purchase offers received from third parties. Management may consider a single valuation technique or multiple valuation techniques, as appropriate, when estimating the fair value of its real estate.
For the years ended December 31, 2018, 2017, and 2016, the Company recorded impairment charges of $2,061, $2,608, and $0, respectively, which resulted from non-payment of rental amounts, concerns over the respective tenant’s future viability, and changes to the overall investment strategy for certain real estate assets. The amount of the impairment charge was based on management’s consideration of the factors detailed above. In determining the fair value of the impaired assets at September 30, 2018, the time of measurement, the Company utilized capitalization rates ranging from 7.50% to 10.00%, and a weighted average discount rate of 8.00%. In determining the fair value of the impaired assets at September 30, 2017, the time of measurement, the Company utilized capitalization rates ranging from 7.25% to 12.00%, and a weighted average discount rate of 8.00%.
The Company has reduced the carrying values of the impaired real estate assets to their estimated fair values at the measurement dates as detailed below:
| September 30, 2018 | September 30, 2017 | |||||||||||||||||||||||
| (in thousands) | Carrying Amount |
Allocation of Impairment |
Net Carrying Amount |
Carrying Amount |
Allocation of Impairment |
Net Carrying Amount |
||||||||||||||||||
| Investments in rental property accounted for using the operating method, net of accumulated depreciation |
$ | 12,834 | $ | (1,702 | ) | $ | 11,132 | $ | 16,159 | $ | (2,401 | ) | $ | 13,758 | ||||||||||
| Intangible lease assets, net |
2,305 | (384 | ) | 1,921 | 1,263 | (204 | ) | 1,059 | ||||||||||||||||
| Leasing fees, net |
131 | (19 | ) | 112 | 123 | (16 | ) | 107 | ||||||||||||||||
| Intangible lease liabilities, net |
(989 | ) | 44 | (945 | ) | (101 | ) | 13 | (88 | ) | ||||||||||||||
|
|
|
|
|
|
|
|
|
|
|
|
|
|||||||||||||
| $ | 14,281 | $ | (2,061 | ) | $ | 12,220 | $ | 17,444 | $ | (2,608 | ) | $ | 14,836 | |||||||||||
|
|
|
|
|
|
|
|
|
|
|
|
|
|||||||||||||
Investments in Rental Property Held for Sale
The Company classifies investments in rental property as held for sale when all of the following criteria are met: (i) management commits to a plan to sell the property, (ii) the property is available for immediate sale in its present condition, subject only to terms that are usual and customary for sales of investment properties, (iii) an active program to locate a buyer and conduct other actions required to complete the sale has been initiated, (iv) the sale of the property is probable in occurrence and is expected to qualify as a completed sale, (v) the property is actively marketed for sale at a sale price that is reasonable in relation to its fair value, and (vi) actions required to complete the sale indicate that it is unlikely that any significant changes will be made or that the plan to sell will be withdrawn.
For properties classified as held for sale, the Company suspends depreciation and amortization of the related assets, including the acquired in-place lease and above- or below-market lease intangibles, as well as straight-line revenue recognition of the associated lease, and records the investment in rental property at the lower of cost or
F-53
Table of Contents
net realizable value. The assets and liabilities associated with the properties classified as held for sale are presented separately on the Consolidated Balance Sheets for the most recent reporting period. At December 31, 2018 and 2017, the Company did not have any properties that met the held for sale criteria, and therefore, were not classified as held for sale.
Sales of Real Estate
As described further in Recently Adopted Accounting Standards elsewhere in Note 2, the Company adopted ASU 2017-05, Other Income—Gains and Losses from the Derecognition of Nonfinancial Assets, effective January 1, 2018 on a prospective basis. Under ASU 2017-05, the Company’s sales of real estate are generally considered to be sales to non-customers, requiring the Company to identify each distinct non-financial asset promised to the buyer. The Company determines whether the buyer obtains control of the non-financial assets, achieved through the transfer of the risks and rewards of ownership of the non-financial assets. If control is transferred to the buyer, the Company derecognizes the asset.
If the Company determines that it did not transfer control of the non-financial assets to the buyer, the Company analyzes the contract for separate performance obligations and allocates a portion of the sales price to each performance obligation. As performance obligations are satisfied, the Company recognizes the respective income in the Consolidated Statements of Income and Comprehensive Income.
Prior to the adoption of ASU 2017-05, the Company recognized real estate sales when all of the following criteria were met: (i) a sale was consummated, (ii) the buyer had demonstrated an adequate commitment to pay for the property, (iii) the Company’s receivable was not subject to future subordination, and (iv) the Company had transferred the risks and rewards of ownership to the buyer and did not have continuing involvement. Unless all conditions were met, recognition of all or a portion of the profit was deferred.
The Company presents discontinued operations if disposals of properties represent a strategic shift in operations. Those strategic shifts would need to have a major effect on the Company’s operations and financial results in order to meet the definition. For the years ended December 31, 2018, 2017, and 2016, the Company did not have property dispositions that qualified as discontinued operations.
Depreciation
Depreciation is computed using the straight-line method over the estimated useful lives of the related assets, which are as follows:
| Land improvements |
15 years | |||
| Buildings and other improvements |
15 to 39 years | |||
| Equipment |
7 years |
Rental Expense
Rental expense associated with land that the Company leases under non-cancellable operating leases, is recorded on a straight-line basis over the term of each lease, for leases that have fixed and measurable rent escalations. The difference between rental expense incurred on a straight-line basis and cash rental payments due under provisions of the lease is recorded as a deferred liability and is included as a component of Accounts payable and other liabilities in the accompanying Consolidated Balance Sheets.
Investment in Related Party
Investment in related party relates to a non-voting, preferred unit investment in the Manager. Income on the Company’s investment is recognized based on the stated preferred rate of return. Such amounts are included as Preferred distribution income in the Consolidated Statements of Income and Comprehensive Income.
F-54
Table of Contents
Cash Equivalents
Cash equivalents consist of highly liquid investments with an original maturity at date of acquisition of three months or less, including money market funds. The Company estimates that the fair value of cash equivalents approximates the carrying value due to the relatively short maturity of these instruments.
Restricted Cash
Restricted cash includes escrow funds the Company maintains pursuant to the terms of certain mortgages, notes payable, and lease agreements, and undistributed proceeds from the sale of properties under Section 1031 of the Internal Revenue Code.
Revenue Recognition
At the inception of a new lease arrangement, including new leases that arise from amendments, the Company assesses the terms and conditions to determine the proper lease classification. A lease arrangement is classified as an operating lease if none of the following criteria are met: (i) ownership transfers to the lessee prior to or shortly after the end of the lease term, (ii) lessee has a bargain purchase option during or at the end of the lease term, (iii) the lease term is greater than or equal to 75% of the underlying property’s estimated useful life, or (iv) the present value of the future minimum lease payments (excluding executory costs) is greater than or equal to 90% of the fair value of the leased property. If one or more of these criteria are met, and the minimum lease payments are determined to be reasonably predictable and collectible, the lease arrangement is generally accounted for as a direct financing lease. Consistent with FASB Accounting Standards Codification (“ASC”) 840, Leases, if the fair value of the land component is 25% or more of the total fair value of the leased property, the land is considered separately from the building for purposes of applying the lease term and minimum lease payments criterion in (iii) and (iv) above.
Revenue recognition methods for operating leases and direct financing leases are described below:
Rental property accounted for under operating leases—Revenue is recognized as rents are earned on a straight-line basis over the non-cancelable terms of the related leases. In most cases, revenue recognition under operating leases begins when the lessee takes possession of, or controls, the physical use of the leased asset. Generally, this occurs on the lease commencement date. For leases that have fixed and measurable rent escalations, the difference between such rental income earned and the cash rent due under the provisions of the lease is recorded as Accrued rental income on the Consolidated Balance Sheets.
Rental property accounted for under direct financing leases—The Company utilizes the direct finance method of accounting to record direct financing lease income. For a lease accounted for as a direct financing lease, the net investment in the direct financing lease represents receivables for the sum of future minimum lease payments and the estimated residual value of the leased property, less the unamortized unearned income. Unearned income is deferred and amortized into income over the lease terms so as to produce a constant periodic rate of return on the Company’s net investment in the leases.
Adoption of ASU 2014-09, described further in Recently Adopted Accounting Standards elsewhere in Note 2, did not have an impact on the nature, amount or timing of revenue recognized for operating leases and direct financing leases as revenue from these sources is derived from lease contracts and therefore falls outside the scope of this guidance.
F-55
Table of Contents
Rent Received in Advance
Rent received in advance represents tenant payments received prior to the contractual due date and are included in Accounts payable and other liabilities on the Consolidated Balance Sheets. Rents received in advance at December 31, 2018 and 2017 are as follows:
| December 31, | ||||||||
| (in thousands) | 2018 | 2017 | ||||||
| Rents received in advance |
$ | 7,832 | $ | 8,585 | ||||
Allowance for Doubtful Accounts
Management periodically reviews the sufficiency of the allowance for doubtful accounts, taking into consideration its historical losses and existing economic conditions, and adjusts the allowance as it considers necessary. Uncollected tenant receivables are written off against the allowance when all possible means of collection have been exhausted.
The following table summarizes the changes in the allowance for doubtful accounts for the years ended December 31, 2018, 2017, and 2016:
| For the years ended December 31, |
||||||||||||
| (in thousands) | 2018 | 2017 | 2016 | |||||||||
| Balance as of January 1 |
$ | 742 | $ | 323 | $ | 262 | ||||||
| Provision for doubtful accounts |
1,521 | 419 | 67 | |||||||||
| Write-offs |
(177 | ) | — | (6 | ) | |||||||
|
|
|
|
|
|
|
|||||||
| Balance as of December 31 |
$ | 2,086 | $ | 742 | $ | 323 | ||||||
|
|
|
|
|
|
|
|||||||
Notes Receivable
Balances in notes receivable represent interest-only loans to third parties secured by the real estate assets of the obligors. The Manager performs property management functions for each of the loan holders. Management evaluates the creditworthiness of each borrower prior to entering into the loan agreements. Further, management periodically reviews the notes receivable for collectability based on historical experience, continued review of the obligor’s creditworthiness, and other relevant factors. Interest income on notes receivable is recognized as it is earned in accordance with the applicable loan agreement and is included as a component of Other income (expenses) in the Consolidated Statements of Income and Comprehensive Income.
Tenant and Capital Reserves
The terms of one of the Company’s operating leases requires the establishment of tenant and capital reserves. Under the tenant reserve requirement, amounts are deposited into an escrow account, to be used to fund certain costs to maintain the rental property. Under the capital reserve lease requirement, the tenant is required to pay additional amounts to fund capital improvements, replacements, and repairs made to the property. The Company has no obligation to fund capital improvements beyond these reserve balances.
The balances of the tenant and capital reserves at December 31, 2018 and 2017 are as follows:
| December 31, | ||||||||
| (in thousands) | 2018 | 2017 | ||||||
| Tenant reserve |
$ | 774 | $ | 627 | ||||
| Capital reserve |
362 | 316 | ||||||
|
|
|
|
|
|||||
| $ | 1,136 | $ | 943 | |||||
|
|
|
|
|
|||||
F-56
Table of Contents
Debt Issuance Costs
Debt issuance costs—Unsecured revolver—Debt issuance costs incurred in connection with the Company’s unsecured revolver have been deferred and are being amortized over the term of the loan commitment using the straight-line method, which approximates the effective interest method. In accordance with ASU 2015-15, Presentation and Subsequent Measurement of Debt Issuance Costs Associated with Line of Credit Arrangements, the Company has recorded debt issuance costs associated with the unsecured revolver as an asset on the Consolidated Balance Sheets.
Debt issuance costs—Mortgages and notes payable – Debt issuance costs incurred in connection with the Company’s mortgages and notes payable have been deferred and are being amortized over the term of the respective loan term using the straight-line method, which approximates the effective interest method, and are recorded in Mortgages and notes payable, net on the Consolidated Balance Sheets.
Debt issuance costs—Unsecured term notes and senior notes – Debt issuance costs incurred in connection with the Company’s unsecured term notes and senior notes have been deferred and are being amortized over the term of the respective loan term using the straight-line method, which approximates the effective interest method, and are recorded in Unsecured term notes, net on the Consolidated Balance Sheets.
In accordance with ASU 2015-03, Simplifying the Presentation of Debt Issuance Costs, the Company presents debt issuance costs related to a recognized debt liability as a direct deduction from the carrying amount of the liability, consistent with debt discounts, in the Consolidated Balance Sheets.
The following table summarizes debt issuance costs on the Consolidated Balance Sheets at December 31, 2018 and 2017:
| December 31, | ||||||||
| (in thousands) | 2018 | 2017 | ||||||
| Unsecured Revolver: |
||||||||
| Debt issuance costs |
$ | 3,431 | $ | 3,431 | ||||
| Less accumulated amortization |
(1,170 | ) | (405 | ) | ||||
|
|
|
|
|
|||||
| $ | 2,261 | $ | 3,026 | |||||
|
|
|
|
|
|||||
| Mortgages and notes payable: |
||||||||
| Debt issuance costs |
$ | 834 | $ | 1,040 | ||||
| Less accumulated amortization |
(335 | ) | (402 | ) | ||||
|
|
|
|
|
|||||
| $ | 499 | $ | 638 | |||||
|
|
|
|
|
|||||
| Unsecured term notes and senior notes: |
||||||||
| Debt issuance costs |
$ | 6,997 | $ | 4,788 | ||||
| Less accumulated amortization |
(2,770 | ) | (1,700 | ) | ||||
|
|
|
|
|
|||||
| $ | 4,227 | $ | 3,088 | |||||
|
|
|
|
|
|||||
Leasing Fees
Leasing fees represent costs incurred to lease properties to tenants and are being amortized using the straight-line method over the term of the lease to which they relate, which range from 9 to 29 years.
Derivative Instruments
The Company uses interest rate swap agreements to manage risks related to interest rate movements. The interest rate swap agreements, designated and qualifying as cash flow hedges, are reported at fair value. As discussed in
F-57
Table of Contents
Recently Adopted Financial Standards elsewhere in Note 2, the Company early adopted ASU 2017-12, Derivatives and Hedging (Topic 815): Targeted Improvements to Accounting and Hedging Activities, effective January 1, 2018 on a modified retrospective basis. ASU 2017-12 amended the designation and measurement guidance for qualifying hedging transactions and the presentation of hedge results in an entity’s financial statements.
Prior to the adoption of ASU 2017-12, the gain or loss on the effective portion of the hedge was initially included as a component of other comprehensive income or loss and was subsequently reclassified into earnings when interest payments on the related debt were incurred and as the swap net settlements occurred. If and when there was ineffectiveness realized on a swap agreement, the Company recognized the ineffectiveness as a component of interest expense in the period incurred.
ASU 2017-12 removed the concept of separately measuring and reporting hedge ineffectiveness and requires a company to present the earnings effect of the hedging instrument in the same income statement line item in which the earnings effect of the hedged item is reported. In accordance with ASU 2017-12, the gain or loss on the qualifying hedges is initially included as a component of other comprehensive income or loss and is subsequently reclassified into earnings when interest payments (the forecasted transactions) on the related debt are incurred and as the swap net settlements occur.
When an existing cash flow hedge is terminated, the Company determines the accounting treatment for the accumulated gain or loss recognized in Accumulated other comprehensive income based on the probability of the hedged forecasted transaction occurring within the period the cash flow hedge was anticipated to affect earnings. If the Company determines that the hedged forecasted transaction is probable of occurring during the original period, the accumulated gain or loss is reclassified into earnings over the remaining life of the cash flow hedge using a straight-line method, which approximates an effective interest method. If the Company determines that the hedged forecasted transaction is not probable of occurring during the original period, the entire amount of accumulated gain or loss is reclassified into earnings in the period the cash flow hedge is terminated.
The Company documents its risk management strategy and hedge effectiveness at the inception of, and during the term of, each hedge. The Company’s interest rate risk management strategy is intended to stabilize cash flow requirements by maintaining interest rate swap agreements to convert certain variable-rate debt to a fixed rate.
Property Loss and Insurance Recoveries
Property losses, whether full or partial, are accounted for using a combination of impairment, insurance, and revenue recognition guidance prescribed by GAAP. Upon incurring a loss event, the Company evaluates for asset impairment under ASC 350, Intangibles—Goodwill and Other, and ASC 360, Property, Plant, and Equipment. Under the terms of the Company’s lease agreements with tenants, a majority of which are triple-net whereby the tenants are responsible for insurance, taxes, and maintenance, among other property costs, the tenants are responsible for repairs and maintenance to the properties. The terms of the leases also require the tenants to continue making their monthly rental payments despite the property loss. To the extent that the assets are recoverable, determined utilizing undiscounted cash flows expected to result from the use of the asset or asset group and its eventual disposition, the Company accounts for a full or partial property loss as an acceleration of depreciation and evaluates whether all or a portion of the property loss can be offset by the recognition of insurance recoveries.
Under the terms of the lease agreements with tenants, in the case of full or partial loss to a property, the tenant has an obligation to restore/rebuild the premises as nearly as possible to its value, condition and character immediately prior to such event. To mitigate the risk of loss, the Company requires tenants to maintain general liability insurance policies on the replacement value of the properties. Based on these considerations, the Company follows the guidance in ASC 605-40, Classification of Insurance Recoveries, for the conversion of nonmonetary assets (i.e., the properties) to monetary assets (i.e., insurance recoveries or tenant recoveries).
F-58
Table of Contents
Under ASC 605-40, once probable of receipt, the Company recognizes an insurance/tenant recovery receivable in Tenant and other receivables, net, in the Consolidated Balance Sheets, with a corresponding offset to the accelerated depreciation recognized in the Consolidated Statements of Income and Comprehensive Income. If the insurance/tenant recovery is less than the amount of accelerated depreciation recognized, the Company will recognize a net loss in the Consolidated Statements of Income and Comprehensive Income. If the insurance/tenant recovery is greater than the amount of accelerated depreciation recognized, the Company will only recognize a recovery up to the amount of the accelerated depreciation, and will account for the excess as a gain contingency in accordance with ASC 450-30, Gain Contingencies. Gain contingencies are recognized when earned and realized, which typically will occur at the time of final settlement or when non-refundable cash advances are received.
Non-controlling Interests
Non-controlling interests represents the membership interests held in the OP of 7.3%, 7.6%, and 8.6% at December 31, 2018, 2017, and 2016, respectively, by third parties which are accounted for as a separate component of equity.
The Company periodically adjusts the carrying value of non-controlling interests to reflect their share of the book value of the OP. Such adjustments are recorded to Additional paid-in capital as a reallocation of Non-controlling interests in the Consolidated Statements of Stockholders’ Equity.
Subscriptions Receivable
The subscriptions receivable is related to shares issued to the Company’s stockholders for which the proceeds have not yet been received solely due to the fact of timing of transfers from the escrow agent holding the funds. The receivables have been fully collected during the following month after the balance sheet date of the Consolidated Financial Statements. In accordance with the Securities and Exchange Commission (“SEC”) Rule 5-02.30 of Regulation S-X, the Company records its subscriptions receivable as a deduction from Stockholder’s equity in the accompanying Consolidated Balance Sheets.
Segment Reporting
The Company currently operates in a single reportable segment, which includes the acquisition, leasing, and ownership of net leased properties. The Company’s chief operating decision maker assesses, measures, and reviews the operating and financial results at the consolidated level for the entire portfolio, and therefore, each property or property type is not considered an individual operating segment. The Company does not evaluate the results of operations based on geography, size, or property type.
Fair Value Measurements
ASC 820, Fair Value Measurements and Disclosures defines fair value as the price that would be received for an asset or paid to transfer a liability (an exit price) in the principal or most advantageous market for the asset or liability in an orderly transaction between market participants on the measurement date. ASC 820 also establishes a three-tier fair value hierarchy, which prioritizes the inputs used in measuring fair value.
The standard describes three levels of inputs that may be used to measure fair value:
Level 1—Quoted prices that are available in active markets for identical assets or liabilities. The types of financial instruments included in Level 1 are marketable, available-for-sale equity securities that are traded in an active exchange market.
Level 2—Pricing inputs other than quoted prices in active markets, such as quoted prices for similar assets or liabilities; quoted prices in markets that are not active; or other inputs that are observable or can be
F-59
Table of Contents
corroborated by observable market data for substantially the full term of the assets or liabilities. Instruments included in this category are derivative contracts whose value is determined using a pricing model with inputs (such as yield curves and credit spreads) that are observable in the market or can be derived principally from or corroborated by observable market data.
Level 3—Unobservable inputs that are supported by little or no market activity and that are significant to the fair value of the assets or liabilities. Level 3 includes assets and liabilities whose values are determined using pricing models, discounted cash flow methodologies, or similar techniques, as well as instruments for which the determination of fair value requires significant management judgment or estimation.
The balances of financial instruments measured at fair value on a recurring basis at December 31, 2018 and 2017 are as follows (see Note 11):
| December 31, 2018 | ||||||||||||||||
| (in thousands) | Total | Level 1 | Level 2 | Level 3 | ||||||||||||
| Interest rate swap, assets |
$ | 17,633 | $ | — | $ | 17,633 | $ | — | ||||||||
| Interest rate swap, liabilities |
(1,820 | ) | — | (1,820 | ) | — | ||||||||||
|
|
|
|
|
|
|
|
|
|||||||||
| $ | 15,813 | $ | — | $ | 15,813 | $ | — | |||||||||
|
|
|
|
|
|
|
|
|
|||||||||
| December 31, 2017 | ||||||||||||||||
| Total | Level 1 | Level 2 | Level 3 | |||||||||||||
| Interest rate swap, assets |
$ | 11,008 | $ | — | $ | 11,008 | $ | — | ||||||||
| Interest rate swap, liabilities |
(5,020 | ) | — | (5,020 | ) | — | ||||||||||
|
|
|
|
|
|
|
|
|
|||||||||
| $ | 5,988 | $ | — | $ | 5,988 | $ | — | |||||||||
|
|
|
|
|
|
|
|
|
|||||||||
Interest rate swaps are derivative instruments that have no quoted readily available Level 1 inputs, and therefore are measured at fair value using inputs that are directly observable in active markets and are classified within Level 2 of the valuation hierarchy, using an income approach. Specifically, the fair value of the interest rate swaps is determined using a discounted cash flow analysis on the expected future cash flows of each instrument. This analysis utilizes observable market data including yield curves and implied volatilities to determine the market’s expectation of the future cash flows of the variable component. The fixed and variable components of the interest rate swaps are then discounted using calculated discount factors developed based on the overnight indexed swap (“OIS”) curve and are aggregated to arrive at a single valuation for the period. The Company also incorporates credit valuation adjustments to appropriately reflect both its own nonperformance risk and the respective counterparty’s nonperformance risk in the fair value measurements. Although the Company has determined that the majority of the inputs used to value its interest rate swaps fall within Level 2 of the fair value hierarchy, the credit valuation adjustments associated with its interest rate swaps utilize Level 3 inputs, such as estimates of current credit spreads to evaluate the likelihood of default by itself and its counterparties. At December 31, 2018 and 2017, the Company has assessed the significance of the impact of the credit valuation adjustments on the overall valuation of its derivative positions and has determined that the credit valuation adjustments are not significant to the overall valuation. As a result, the Company has determined that its interest rate swap valuations in their entirety are appropriately classified within Level 2 of the fair value hierarchy.
The Company has estimated that the carrying amount reported on the Consolidated Balance Sheets for Cash and cash equivalents, Restricted cash, Tenant and other receivables, net, Notes receivable, and Accounts payable and other liabilities approximates their fair values due to their short-term nature.
The fair value of the Company’s debt was estimated using Level 2 and Level 3 inputs based on recent financing transactions, estimates of the fair value of the property that serves as collateral for such debt, historical risk premiums for loans of comparable quality, current London Interbank Offered Rate (“LIBOR”), U.S. treasury obligation interest rates, and on the discounted estimated future cash payments to be made on such debt. The
F-60
Table of Contents
discount rates estimated reflect the Company’s judgment as to the approximate current lending rates for loans or groups of loans with similar maturities and assumes that the debt is outstanding through maturity. Market information, as available, or present value techniques were utilized to estimate the amounts required to be disclosed. Since such amounts are estimates that are based on limited available market information for similar transactions and do not acknowledge transfer or other repayment restrictions that may exist on specific loans, it is unlikely that the estimated fair value of any such debt could be realized by immediate settlement of the obligation.
The following table summarizes the carrying amount reported on the Consolidated Balance Sheets and the Company’s estimate of the fair value of the Mortgages and notes payable, net, Unsecured term notes, net, and Unsecured revolver at December 31, 2018 and 2017:
| December 31, | ||||||||
| (in thousands) | 2018 | 2017 | ||||||
| Carrying amount |
$ | 1,450,551 | $ | 1,181,470 | ||||
| Fair value |
1,439,264 | 1,177,197 | ||||||
As disclosed under the Long-lived Asset Impairment section elsewhere in Note 2, the Company’s non-recurring fair value measurements at December 31, 2018 and 2017, consisted of the fair value of impaired real estate assets that were determined using Level 3 inputs.
Income Taxes
The Company has made an election to be taxed as a REIT under Sections 856 through 860 of the Internal Revenue Code of 1986, (as amended, the “Code”), commencing with its taxable year ended December 31, 2008. The Company believes it is organized and operates in such a manner as to qualify for treatment as a REIT and intends to operate in the foreseeable future in such a manner so that it will remain qualified as a REIT for federal income tax purposes. Accordingly, the Company is not subject to federal corporate income tax to the extent its dividends paid equals or exceeds its adjusted taxable income, as defined in the Code.
The Company is subject to state and local income or franchise taxes in certain states in which some of its properties are located and records these taxes as state and franchise tax expense in the accompanying Consolidated Statements of Income and Comprehensive Income when due.
The Company is required to file income tax returns with federal and various state taxing authorities. At December 31, 2018, the Company’s federal and state income tax returns remain subject to examination by the respective taxing authorities for the 2015 through 2017 tax years.
The Company recognizes and measures uncertain tax positions using a two-step approach. The first step is to evaluate the tax position for recognition by determining if the weight of available evidence indicates it is more-likely-than-not that the position will be sustained upon examination, including resolution of related appeals or litigation processes, if any. In making this assessment, the Company must assume that the taxing authority will examine the income tax position and have full knowledge of all relevant information. The second step is to measure the tax benefit as the largest amount that is more than 50% likely of being realized upon ultimate settlement. The Company considers many factors when evaluating and estimating tax positions and tax benefits, which may require periodic adjustments and which may or may not accurately forecast actual outcomes.
The Company has determined that it has no uncertain tax positions at December 31, 2018 and 2017, or for the years ended December 31, 2018, 2017, and 2016, which include the tax status of the Company.
Interest and penalties related to income taxes are charged to tax expense during the year in which they are incurred.
F-61
Table of Contents
Taxes Collected From Tenants and Remitted to Governmental Authorities
A majority of the Company’s properties are leased on a triple-net basis, which provides that the tenants are responsible for the payment of all property operating expenses, including, but not limited to, property taxes, maintenance, insurance, repairs, and capital costs, during the lease term. The Company records such expenses on a net basis.
The following table summarizes the approximate property tax payments made directly to the taxing authorities by the Company’s tenants, pursuant to their lease obligations, for the years ended December 31, 2018, 2017, and 2016:
| For the years ended December 31, | ||||||||||||
| (in thousands) | 2018 | 2017 | 2016 | |||||||||
| Property taxes paid by tenants directly to taxing authority |
$ | 23,800 | $ | 19,700 | $ | 16,200 | ||||||
In other situations, the Company may collect property taxes from its tenants and remit those taxes to governmental authorities. Taxes collected from tenants and remitted to governmental authorities are presented on a gross basis, where revenue is included in Operating expenses reimbursed from tenants and expense is included in Property and operating expense in the accompanying Consolidated Statements of Income and Comprehensive Income.
The following table summarizes taxes collected from tenants and remitted to governmental authorities for the years ended December 31, 2018, 2017, and 2016:
| For the years ended December 31, | ||||||||||||
| (in thousands) | 2018 | 2017 | 2016 | |||||||||
| Property taxes collected from tenants |
$ | 5,572 | $ | 2,877 | $ | 2,004 | ||||||
| Property taxes remitted on behalf of tenants |
5,547 | 2,899 | 1,933 | |||||||||
Recently Adopted Accounting Standards
In August 2017, the FASB issued ASU 2017-12, Derivatives and Hedging (Topic 815): Targeted Improvements to Accounting for Hedging Activities. ASU 2017-12 amends the designation and measurement guidance for qualifying hedging transactions and the presentation of hedge results in an entity’s financial statements. The new guidance removes the concept of separately measuring and reporting hedge ineffectiveness and requires a company to present the earnings effect of the hedging instrument in the same income statement line item in which the earnings effect of the hedged item is reported. Disclosure requirements have been modified to include a tabular disclosure related to the effect of hedging instruments on the income statement and eliminate the requirement to disclose the ineffective portion of the change in fair value of such instruments. The new guidance is effective January 1, 2019, with early adoption permitted, and provides companies with a modified retrospective transition method for each cash flow and net investment hedge relationship existing on the date of adoption. This adoption method requires a company to recognize the cumulative effect of initially applying the ASU as an adjustment to accumulated other comprehensive income with a corresponding adjustment to the opening balance of retained earnings as of the beginning of the fiscal year that an entity adopts the update. The Company early adopted the guidance effective January 1, 2018. The Company did not recognize a cumulative effect adjustment upon adoption as the Company had not recognized ineffectiveness on any of the hedging instruments existing as of the date of adoption.
In November 2016, the FASB issued ASU 2016-18, Statement of Cash Flows—Restricted Cash. ASU 2016-18 requires that the statement of cash flows explain the change during the period in the total of cash, cash equivalents, and amounts generally described as restricted cash or cash equivalents. Therefore, amounts generally described as restricted cash and equivalents should be included with cash and cash equivalents when reconciling
F-62
Table of Contents
the beginning and end of period total amounts on the statement of cash flows. Previously, there had been no specific guidance to address how to classify or present these changes. ASU 2016-18 is effective, on a retrospective basis, for interim and annual periods beginning after December 15, 2017, with early adoption permitted. The Company adopted ASU 2016-18 as of January 1, 2018. In line with the retrospective adoption of this standard, the Company removed the change in restricted cash of $724 and $(1,381) from Cash flows used in investing activities for the years ended December 31, 2017 and 2016, respectively . See Reclassifications elsewhere in Note 2.
In August 2016, the FASB issued ASU 2016-15, Classification of Certain Cash Receipts and Cash Payments. ASU 2016-15 provides classification guidance for eight specific topics, including but not limited to, debt extinguishment costs, contingent consideration payments made after a business combination, and distributions received from equity method investees. ASU 2016-15 became effective, on a retrospective basis, for interim and annual periods beginning after December 15, 2017, with early adoption permitted. The Company adopted ASU 2016-15 as of January 1, 2018. The classification of debt extinguishment costs in the Consolidated Statements of Cash Flows addressed by ASU 2016-15 is applicable to the Company. However, adoption of this guidance did not have an impact on the Company’s Consolidated Statements of Cash Flows, as the Company historically classified these cash flows as required by the guidance.
In May 2014, the FASB issued ASU 2014-09, Revenue from Contracts with Customers (Topic 606). ASU 2014-09, including all updates, is a comprehensive new revenue recognition model requiring a company to recognize revenue to depict the transfer of goods or services to a customer at an amount reflecting the consideration it expects to receive in exchange for those goods or services. In adopting ASU 2014-09, companies may use either a full retrospective or a modified retrospective approach. Additionally, this guidance requires improved disclosures regarding the nature, amount, timing, and uncertainty of revenue and cash flows arising from contracts with customers. The Company adopted ASU 2014-09 as of January 1, 2018, on a modified retrospective basis. The adoption had no effect on the Company’s Consolidated Financial Statements as the Company’s revenues are lease related, which are not subject to provisions of ASU 2014-09.
In February 2017, the FASB issued ASU 2017-05, Other Income – Gains and Losses from the Derecognition of Nonfinancial Assets. This new guidance was required to be adopted concurrently with the amendments in ASU 2014-09. The new pronouncement adds guidance for partial sales of nonfinancial assets, including real estate. In adopting ASU 2017-05, companies may use either a full retrospective or a modified retrospective approach. The Company previously recognized revenue on sales of real estate at the time the asset was transferred (i.e., at the time of closing). Upon adoption of ASU 2014-09, as discussed above, and therefore ASU 2017-05, the Company now evaluates any separate contract or performance obligation to determine proper timing of revenue recognition, as well as sales price allocation when a performance obligation is identified. Adoption of this pronouncement had no effect on the Company’s Consolidated Financial Statements during the year ended December 31, 2018 or in any periods.
Other Recently Issued Accounting Standards
In February 2016, the FASB issued ASU 2016-02, Leases (Topic 842), which supersedes the existing guidance for lease accounting, Leases (Topic 840). ASU 2016-02, and related ASUs subsequently issued, are effective January 1, 2019, with early adoption permitted. The guidance requires lessees to recognize a right-of-use asset and a corresponding lease liability, initially measured at the present value of lease payments, for both operating and financing leases. Under the new pronouncement, lessor accounting is largely unchanged from existing GAAP, however disclosures will be expanded. The new standard provides a number of practical expedients, one of which, ‘the Package of Three’, allows an entity to not reassess (i) whether any expired or existing contracts are, or contain, leases, (ii) the lease classification for any expired or existing leases, and (iii) initial direct costs for existing leases. In July 2018, the FASB issued ASU 2018-11, Leases (Topic 842) Targeted Improvements which provides an optional transition method where an entity can initially apply the guidance at the adoption date and recognize a cumulative-effect adjustment to the opening balance of retained earnings. An entity’s reporting
F-63
Table of Contents
for the comparative periods presented will continue to be in accordance with current GAAP (ASC 840), including the required disclosures. The new guidance also allows lessors to make an accounting policy election, by class of underlying asset, to not separate non-lease components from the associated lease component and to account for those components as a single component if certain conditions are met. The guidance requires all income from leases to be presented as a single line item, rather than the current presentation where rental income from leases is shown separately from reimbursements from tenants on the Consolidated Statements of Income and Comprehensive Income. In addition, bad debt expense is required to be presented as an adjustment to revenue, rather than the current presentation within Operating expenses on the Consolidated Statements of Income and Comprehensive Income.
The Company is primarily a lessor and therefore adoption of ASU 2016-02 will not have a material impact on the Consolidated Financial Statements. The Company has completed its inventory of leases and has identified changes needed to its processes and systems impacted by the new standard and will adopt the guidance using the transition method provided in ASU 2018-11 on January 1, 2019. The Company does not anticipate a material cumulative-effect adjustment to the opening balance of retained earnings. The Company will elect the practical expedient to not separate non-lease components and, based on the assessment of the current leases in the portfolio, the components will be combined and accounted for in accordance with ASC 842. The Company will elect the Package of Three practical expedient and expects to present revenue related to leases as a single line item, net of bad debt expense, on the Consolidated Statements of Income and Comprehensive Income beginning January 1, 2019. Upon adoption, the Company expects to recognize a right-of-use asset and corresponding lease liability of approximately $1,700 and $1,300, respectively, for operating leases where it is the lessee (see Note 18). The right-of-use asset will be presented net of the existing straight-line rent liability of $7 and the ground lease intangible asset of $432.
In June 2016, the FASB issued ASU 2016-13, Financial Instruments—Credit Losses which changes how entities measure credit losses for most financial assets. Financial assets that are measured at amortized cost will be required to be presented at the net amount expected to be collected with an allowance for credit losses deducted from the amortized cost basis. The guidance requires an entity to utilize broader information in estimating the expected credit loss, including forecasted information. In November 2018, the FASB issued ASU 2018-19, Codification Improvements to Topic 326, Financial Instruments—Credit Losses which clarified that operating lease receivables recorded by lessors are explicitly excluded from the scope of this guidance. ASU 2016-13 is effective January 1, 2020, with early adoption permitted beginning on January 1, 2019, under a modified retrospective application. The Company continues to evaluate the impact this new standard will have on its Consolidated Financial Statements, but does not expect such impact to be material based upon the composition of its current lease portfolio.
In August 2018, the FASB issued ASU 2018-13, Fair Value Measurement (Topic 820) Disclosure Framework—Changes to the Disclosure Requirements for Fair Value Measurement. The amendments under ASU 2018-13 remove, add, and modify certain disclosure requirements on fair value measurements in ASC 820. The amendments are effective for fiscal years, and interim periods within those fiscal years, beginning after December 15, 2019, with early adoption permitted. The Company is currently evaluating the impact the new standard will have on its Consolidated Financial Statements and expects to adopt the new disclosures on a prospective basis on January 1, 2020.
In October 2018, the FASB issued ASU 2018-16, Derivatives and Hedging (Topic 815): Inclusion of the Secured Overnight Financing Rate (SOFR) Overnight Index Swap (OIS) Rate as a Benchmark Interest Rate for Hedge Accounting Purposes. Currently under Topic 815, the eligible benchmark interest rates in the United States are the interest rates on direct Treasury obligations of the U.S. government (UST), the LIBOR swap rate, the OIS Rate based on the Fed Funds Effective Rate, and the Securities Industry and Financial Markets Association (SIFMA) Municipal Swap Rate, which was introduced in ASU 2017-12. The amendments in ASU 2018-16 permit the use of the OIS rate based on SOFR as a benchmark interest rate for hedge accounting purposes under Topic 815. The amendments in this update are effective for fiscal years beginning after December 15, 2018, and
F-64
Table of Contents
interim periods within those fiscal years for public business entities that have already adopted the amendments in ASU 2017-12 (see Recently Adopted Accounting Standards elsewhere in Note 2). The Company will adopt the guidance effective January 1, 2019 on a prospective basis for qualifying new or redesignated hedging relationships entered into on or after the date of adoption. The Company does not anticipate the adoption of this guidance to have an impact on the Consolidated Financial Statements.
Reclassifications
As described below, certain prior period amounts have been reclassified to conform with the current period’s presentation.
In connection with the adoption of ASU 2016-18, Statement of Cash Flows—Restricted Cash, discussed in Recently Adopted Accounting Standards elsewhere in Note 2, certain reclassifications have been made to prior-period balances to conform to current presentation in the Consolidated Statements of Cash Flows. Under ASU 2016-18, changes in restricted cash which were previously shown in Cash flows used in investing activities in the Consolidated Statements of Cash Flows are now reflected as part of the total change in cash, cash equivalents and restricted cash in the Consolidated Statements of Cash Flows.
3. Related-Party Transactions
Property Management Agreement
The Company and the OP are a party to a property management agreement (as amended, the “Property Management Agreement”) with the Manager, a related party in which certain directors of the Company have either a direct or indirect ownership interest. Under the terms of the Property Management Agreement, the Manager manages and coordinates certain aspects of the leasing of the Company’s rental property.
Effective January 1, 2018, the Property Management Agreement was amended to, among other things, extend the recurring term of the agreement from one year to three years, clarify termination provisions, include a Termination Event concept and a Key Person Event concept, each as defined in the Property Management Agreement, and remove fee provisions relating to short-term financing or guarantees provided by the Manager to the OP.
In exchange for services provided under the Property Management Agreement, the Manager receives certain fees and other compensation as follows:
| (i) | 3% of gross rentals collected each month from the rental property for property management services (other than one property, which has a separate agreement for 5% of gross rentals); and |
| (ii) | Re-leasing fees for existing rental property equal to one month’s rent for a new lease with an existing tenant and two months’ rent for a new lease with a new tenant. |
In addition, prior to January 1, 2018, the Manager was able to provide, but was not obligated to provide, short-term financing to, or guarantees for, the OP. In exchange for these services, the Manager was entitled to receive an interest rate of up to the prime rate plus 1.00% in exchange for any advances to the OP, and 0.05% for guaranteeing recourse carve-outs on financing arrangements. No such advances or guarantees were made during the years ended December 31, 2017 and 2016.
The Property Management Agreement will automatically renew on January 1, 2019 for three years ending December 31, 2021, subject to earlier termination pursuant to the terms of the Property Management Agreement. The Property Management Agreement provides for termination (i) immediately by the Company’s Independent Directors Committee (“IDC”) for Cause, as defined in the Property Management Agreement, (ii) by the IDC, upon 30 days’ written notice to the Manager, in connection with a change in control of the Manager, as defined
F-65
Table of Contents
in the Property Management Agreement, (iii) by the IDC, by providing the Manager with written notice of termination not less than one year prior to the last calendar day of any renewal term, (iv) by the Manager upon written notice to the Company not less than one year prior to the last calendar day of any renewal period, (v) automatically in the event of a Termination Event, and (vi) by the IDC upon a Key Person Event.
If the Company terminates the agreement prior to any renewal term or in any manner described above, other than termination by the Company for Cause, the Company will be subject to a termination fee equal to three times the Management Fees, as defined in the Property Management Agreement, to which the Manager was entitled during the 12-month period immediately preceding the date of such termination. Although not terminable at December 31, 2018, if the Property Management Agreement had been terminated at December 31, 2018, subject to the conditions noted above, the termination fee would have been $19,588.
Asset Management Agreement
The Company and the OP are party to an asset management agreement (as amended the “Asset Management Agreement”) with the Asset Manager, a single member limited liability company with the Manager as the single member, and therefore a related party in which certain directors of the Company have an indirect ownership interest. Under the terms of the Asset Management Agreement, the Asset Manager is responsible for, among other things, the Company’s acquisition, initial leasing, and disposition strategies, financing activities, and providing support to the Company’s IDC for its valuation functions and other duties. The Asset Manager also nominates two individuals to serve on the Board of Directors of the Company.
Effective January 1, 2018, the Asset Management Agreement was amended to, among other things, extend the recurring term of the agreement from one year to three years, provide for additional disposition fee provisions, and include a Disposition Event concept and Key Person Event concept, each as defined in the amended Asset Management Agreement. The Asset Management Agreement defines a Disposition Event in the same manner as a Termination Event is defined in the Property Management Agreement discussed above.
Under the terms of the Asset Management Agreement, the Asset Manager is compensated as follows:
| (i) | a quarterly asset management fee equal to 0.25% of the aggregate value of common stock, based on the per share value as determined by the IDC each quarter, on a fully diluted basis as if all interests in the OP had been converted into shares of the Company’s common stock; |
| (ii) | 0.5% of the proceeds from future equity closings as reimbursement for offering, marketing, and brokerage expenses; |
| (iii) | 1% of the gross purchase price paid for each rental property acquired (other than acquisitions described in (iv) below), including any property contributed in exchange for membership interests in the OP; |
| (iv) | 2% of the gross purchase price paid for each rental property acquired in the event that the acquisition of a rental property requires a new lease (as opposed to the assumption of an existing lease), such as a sale-leaseback transaction; and |
| (v) | 1% of the gross sale price received for each rental property disposition. |
For the year ended December 31, 2018, the following was included in the Asset Management Agreement, in addition to the fees noted above:
| (vi) | 1% of the Aggregate Consideration, as defined in the Asset Management Agreement, received in connection with a Disposition Event. |
The Asset Management Agreement will automatically renew on January 1, 2019, for three years ending December 31, 2021, subject to earlier termination pursuant to the terms of the Asset Management Agreement. The Asset Management Agreement provides for termination (i) immediately by the IDC for Cause, as defined in
F-66
Table of Contents
the Asset Management Agreement, (ii) by the IDC, upon 30 days’ written notice to the Asset Manager, in connection with a change in control of the Asset Manager, as defined in the Asset Management Agreement, (iii) by the IDC, by providing the Asset Manager with written notice of termination not less than one year prior to the last calendar of any renewal term, (iv) by the Asset Manager upon written notice to the Company not less than one year prior to the last calendar day of any renewal period, (v) automatically in the event of a Disposition Event, and (vi) by the IDC upon a Key Person Event.
If the Company terminates the agreement prior to any renewal term or in any manner described above, other than termination by the Company for Cause, the Company will be required to pay to the Asset Manager a termination fee equal to three times the Asset Management Fee to which the Asset Manager was entitled during the 12-month period immediately preceding the date of such termination. Although not terminable at December 31, 2018, if the Asset Management Agreement had been terminated at December 31, 2018 subject to the conditions noted above, the termination fee would have been $54,520.
Total fees incurred under the Property Management Agreement and Asset Management Agreement for the years ended December 31, 2018, 2017, and 2016, are as follows:
| (in thousands) | Financial Statement Presentation |
For the years ended December 31, | ||||||||||||
| Type of Fee |
2018 | 2017 | 2016 | |||||||||||
| Asset management fee |
Asset management fees | $ | 18,173 | $ | 14,754 | $ | 10,955 | |||||||
| Property management fee |
Property management fees | 6,529 | 4,988 | 3,939 | ||||||||||
|
|
|
|
|
|
|
|||||||||
| Total management fee expense |
24,702 | 19,742 | 14,894 | |||||||||||
| Marketing fee (offering costs) |
Additional paid-in capital | 1,158 | 1,380 | 1,310 | ||||||||||
| Acquisition fee |
Capitalized as a component of assets acquired in 2018 and 2017 (See Note 4) and included as acquisition expenses in 2016 |
5,907 | 6,580 | 5,203 | ||||||||||
| Leasing fee |
Leasing fees, net | 1,399 | 3,339 | 2,932 | ||||||||||
| Disposition fee |
Gain on sale of real estate | 573 | 605 | 133 | ||||||||||
|
|
|
|
|
|
|
|||||||||
| Total management fees |
$ | 33,739 | $ | 31,646 | $ | 24,472 | ||||||||
|
|
|
|
|
|
|
|||||||||
Included in management fees are $114 and $722 of unpaid fees recorded in Due to related parties on the Consolidated Balance Sheets at December 31, 2018 and 2017, respectively. All fees related to the Property Management Agreement and the Asset Management Agreement are paid for in cash within the Company’s normal payment cycle for vendors.
Investment in Related Party
On June 30, 2015, the Company issued 139 shares with a value of $10,000 to the Manager in exchange for 100 non-voting convertible preferred units of the Manager, which represented a 6.4% ownership interest in the Manager at the time of the transaction on a fully-diluted basis. The Company had the right to convert the preferred units to non-voting common units of the Manager between January 1, 2018 and December 31, 2019. Subsequent to the conversion period, the Manager had the option to redeem the convertible preferred units at their original value of $10,000, plus any accrued and unpaid preferred return. On July 31, 2018, the Company sold its investment to an existing owner of the Manager. The preferred units were sold for an aggregate sales price of $18,500 and had a carrying value of $10,000 at the time of sale. The transaction was approved by the Board of Directors and IDC. At December 31, 2017, the carrying amount of the investment was $10,000. The preferred units provided a stated preferred return at inception of 7.0% with 0.25% increases every June 30th. Preferred distributions related to the investment in the Manager for the years ended December 31, 2018, 2017, and 2016 amounted to $440, $737, and $713, respectively.
F-67
Table of Contents
Legal Services
The Company retains the legal services of Vaisey Nicholson & Nearpass, PLLC (“VNN”), formerly a related party. One former minority partner of VNN is an immediate family member to a member of the management of the Company and an indirect minority owner of the Manager. Beginning January 2017, the family member was no longer an owner or partner of VNN and therefore, prospectively, VNN is no longer deemed a related party. Legal services obtained from VNN are mainly for acquisition and disposition of real estate and related matters, as well as general counsel regarding property management and financing. The Company utilizes the services of other outside legal counsel as well. These fees are paid for in cash within the Company’s normal payment cycle for vendor payments. The following table details the type of legal fees incurred from VNN as a related party for the year ended December 31, 2016:
| (in thousands) | Financial Statement Presentation |
December 31, 2016 |
||||
| Type of Fee | ||||||
| Legal services—general |
General and administrative | $ | 324 | |||
| Organization costs |
General and administrative | 22 | ||||
|
|
|
|||||
| 346 | ||||||
| Finance related costs |
Debt issuance costs (a) | 122 | ||||
| Acquisition related fees |
Acquisition expenses | 2,520 | ||||
| Legal services—tenant related |
Property and operating expenses | 40 | ||||
| Property disposition related fees |
Gain on sale of real estate | 47 | ||||
|
|
|
|||||
| Total related party legal expenses |
$ | 3,075 | ||||
|
|
|
|||||
| (a) | Amounts are recorded within Debt issuance costs—unsecured revolver, net, Mortgages and notes payable, net, and Unsecured term notes, net, on the accompanying Consolidated Balance Sheets. |
F-68
Table of Contents
4. Acquisitions
The Company closed on the following acquisitions during the year ended December 31, 2018:
| (in thousands, except number of properties) | Property Type | Number of Properties |
Real Estate Acquisition Price |
|||||||||
| Date | ||||||||||||
| March 27, 2018 |
Industrial | 1 | $ | 22,000 | ||||||||
| March 30, 2018 |
Industrial/Retail | 26 | 78,530 | |||||||||
| April 30, 2018 |
Other | 1 | 16,170 | (a) | ||||||||
| June 6, 2018 |
Industrial | 1 | 8,500 | |||||||||
| June 14, 2018 |
Industrial | 1 | 39,700 | |||||||||
| June 14, 2018 |
Retail | 6 | 14,479 | |||||||||
| June 21, 2018 |
Retail | 1 | 20,231 | |||||||||
| June 21, 2018 |
Industrial | 1 | 38,340 | (b) | ||||||||
| June 29, 2018 |
Industrial | 1 | 10,400 | |||||||||
| June 29, 2018 |
Retail | 2 | 6,433 | (c) | ||||||||
| July 12, 2018 |
Industrial | 1 | 11,212 | |||||||||
| July 17, 2018 |
Retail | 5 | 14,845 | |||||||||
| July 17, 2018 |
Office | 1 | 34,670 | |||||||||
| August 6, 2018 |
Industrial | 2 | 4,802 | |||||||||
| August 10, 2018 |
Retail | 20 | 44,977 | |||||||||
| October 11, 2018 |
Healthcare | 4 | 17,448 | |||||||||
| October 26, 2019 |
Industrial | 1 | 8,816 | |||||||||
| October 31, 2018 |
Retail | 1 | 2,016 | |||||||||
| November 30, 2018 |
Retail | 3 | 5,357 | |||||||||
| December 4, 2018 |
Retail | 2 | 6,036 | |||||||||
| December 6, 2018 |
Healthcare | 6 | 46,100 | |||||||||
| December 12, 2018 |
Healthcare | 1 | 20,312 | |||||||||
| December 20, 2018 |
Industrial | 1 | 18,250 | |||||||||
| December 20, 2018 |
Healthcare | 18 | 93,129 | |||||||||
| December 28, 2018 |
Industrial | 1 | 10,035 | |||||||||
| December 28, 2018 |
Healthcare | 5 | 14,037 | |||||||||
|
|
|
|
|
|||||||||
| 113 | $ | 606,825 | (d) | |||||||||
|
|
|
|
|
|||||||||
| (a) | In conjunction with this acquisition, the Company settled a note receivable with the seller in the amount of $3,700, in exchange for a reduction in the cash paid for the transaction (see Note 8). |
| (b) | In conjunction with this acquisition, the Company assumed a mortgage with a principal balance of $20,845 with an interest rate at 4.36% and a maturity date of August 2025 (see Note 10). |
| (c) | In conjunction with this acquisition, the Company settled a note receivable with the seller in the amount of $2,827, in exchange for a reduction in the cash paid for the transaction (see Note 8). |
| (d) | Acquisition price does not include capitalized acquisition costs of $12,643. |
F-69
Table of Contents
The Company closed on the following acquisitions during the year ended December 31, 2017:
| (in thousands, except number of properties) | Property Type | Number of Properties |
Real Estate Acquisition Price |
|||||||||
| Date | ||||||||||||
| January 18, 2017 |
Retail | 1 | $ | 2,520 | ||||||||
| March 1, 2017 |
Retail | 9 | 87,196 | |||||||||
| April 28, 2017 |
Retail | 25 | 48,898 | |||||||||
| June 2, 2017 |
Healthcare | 2 | 13,300 | |||||||||
| June 15, 2017 |
Retail | 2 | 2,700 | |||||||||
| June 30, 2017 |
Industrial | 2 | 12,250 | |||||||||
| June 30, 2017 |
Healthcare | 7 | 25,989 | |||||||||
| July 7, 2017 |
Office | 1 | 32,210 | |||||||||
| August 4, 2017 |
Healthcare | 3 | 11,732 | |||||||||
| August 31, 2017 |
Healthcare | 3 | 16,700 | |||||||||
| August 31, 2017 |
Industrial | 2 | 6,148 | |||||||||
| September 13, 2017 |
Retail | 5 | 4,994 | |||||||||
| September 29, 2017 |
Industrial/Retail | 7 | 30,012 | |||||||||
| September 29, 2017 |
Industrial | 1 | 57,372 | |||||||||
| October 13, 2017 |
Healthcare | 1 | 10,000 | (e) | ||||||||
| November 1, 2017 |
Other | 4 | 15,693 | (f) (g) | ||||||||
| December 7, 2017 |
Office | 2 | 19,295 | |||||||||
| December 7, 2017 |
Healthcare | 1 | 5,095 | |||||||||
| December 7, 2017 |
Healthcare | 1 | 2,678 | |||||||||
| December 8, 2017 |
Industrial/Office | 3 | 74,200 | |||||||||
| December 14, 2017 |
Office | 1 | 24,500 | |||||||||
| December 18, 2017 |
Other | 1 | 22,585 | |||||||||
| December 22, 2017 |
Industrial | 2 | 19,000 | |||||||||
| December 22, 2017 |
Industrial | 1 | 21,037 | |||||||||
| December 27, 2017 |
Retail | 1 | 1,446 | |||||||||
| December 28, 2017 |
Industrial | 1 | 28,450 | |||||||||
| December 29, 2017 |
Retail | 9 | 28,224 | |||||||||
| December 29, 2017 |
Retail | 20 | 39,552 | |||||||||
| December 29, 2017 |
Healthcare | 6 | 19,868 | |||||||||
|
|
|
|
|
|||||||||
| 124 | $ | 683,644 | (h) | |||||||||
|
|
|
|
|
|||||||||
| (e) | In conjunction with this acquisition, the Company assumed a mortgage with a principal balance of $5,205 with a variable interest rate at one-month LIBOR plus 3.0% and a maturity date of August 2021 (see Note 10). The Company also assumed an interest rate swap with a fixed rate of 1.02% and a maturity date of August 2021 (see Note 11). |
| (f) | The acquisition was conducted with a related party and approved by the IDC. The fees required under the Asset Management Agreement (see Note 3) were waived by the Asset Manager. |
| (g) | In conjunction with this acquisition, the Company assumed a mortgage with a principal balance of $6,721 with an interest rate of 3.65% and a maturity date of October 2026 (see Note 10). |
| (h) | Acquisition price does not include acquisition costs of $12,349. |
F-70
Table of Contents
The Company closed on the following acquisitions during the year ended December 31, 2016:
| (in thousands, except number of properties) | Property Type | Number of Properties |
Real Estate Acquisition Price |
|||||||||
| Date | ||||||||||||
| January 25, 2016 |
Retail | 3 | $ | 13,376 | ||||||||
| February 1, 2016 |
Retail | 1 | 27,000 | |||||||||
| March 24, 2016 |
Industrial | 1 | 15,650 | |||||||||
| April 7, 2016 |
Healthcare | 2 | 17,115 | |||||||||
| April 25, 2016 |
Office | 2 | 54,600 | |||||||||
| May 9, 2016 |
Retail | 5 | 42,390 | |||||||||
| May 12, 2016 |
Office | 1 | 4,500 | |||||||||
| May 20, 2016 |
Retail | 19 | 36,843 | |||||||||
| May 25, 2016 |
Healthcare | (i) | 5,624 | |||||||||
| June 30, 2016 |
Retail | 7 | 28,477 | |||||||||
| July 15, 2016 |
Healthcare | 2 | 26,700 | |||||||||
| August 12, 2016 |
Other | 3 | 12,399 | |||||||||
| September 14, 2016 |
Office | 1 | 14,000 | |||||||||
| September 29, 2016 |
Retail | 24 | 82,338 | |||||||||
| October 3, 2016 |
Retail | 6 | 6,872 | |||||||||
| November 10, 2016 |
Office | 1 | 10,550 | |||||||||
| November 21, 2016 |
Retail | 2 | 7,597 | |||||||||
| November 29, 2016 |
Office | 4 | 15,177 | |||||||||
| December 19, 2016 |
Industrial | 1 | 23,050 | |||||||||
| December 23, 2016 |
Office | 1 | 43,517 | |||||||||
| December 30, 2016 |
Office | 1 | 15,550 | |||||||||
| December 30, 2016 |
Industrial | 1 | 15,487 | |||||||||
|
|
|
|
|
|||||||||
| 88 | $ | 518,812 | ||||||||||
|
|
|
|
|
|||||||||
| (i) | Acquisition of capital expansion on existing property. |
The Company allocated the purchase price of these properties to the fair value of the assets acquired and liabilities assumed. The following table summarizes the purchase price allocation for acquisitions completed during the years ended December 31, 2018, 2017, and 2016:
| December 31, | ||||||||||||
| (in thousands) |
2018 | 2017 | 2016 | |||||||||
| Land |
$ | 72,559 | $ | 67,945 | $ | 70,938 | ||||||
| Land improvements |
32,498 | 54,804 | 38,526 | |||||||||
| Buildings and other improvements |
454,391 | 508,541 | 358,058 | |||||||||
| Equipment |
2,892 | 7,671 | — | |||||||||
| Acquired in-place leases (j) |
62,631 | 77,073 | 52,867 | |||||||||
| Acquired above-market leases (k) |
5,538 | 14,905 | 19,420 | |||||||||
| Acquired below-market leases (l) |
(11,471 | ) | (38,493 | ) | (21,541 | ) | ||||||
| Direct financing investments |
430 | 3,546 | 544 | |||||||||
| Mortgages payable, net |
(20,845 | ) | (11,926 | ) | — | |||||||
| Non-real estate liabilities |
(56 | ) | (2,777 | ) | (8,649 | ) | ||||||
|
|
|
|
|
|
|
|||||||
| $ | 598,567 | $ | 681,289 | $ | 510,163 | |||||||
|
|
|
|
|
|
|
|||||||
| (j) | The weighted average amortization period for acquired in-place leases is 13 years, 15 years, and 17 years for acquisitions completed during the years ended December 31, 2018, 2017, and 2016, respectively. |
| (k) | The weighted average amortization period for acquired above-market leases is 16 years, 17 years, and 17 years for acquisitions completed during the years ended December 31, 2018, 2017, and 2016, respectively. |
| (l) | The weighted average amortization period for acquired below-market leases is 13 years, 19 years, and 17 years for acquisitions completed during the years ended December 31, 2018, 2017, and 2016, respectively. |
F-71
Table of Contents
The above acquisitions were funded using a combination of available cash on hand and proceeds from the Company’s unsecured revolving line of credit and unsecured term notes. All of the acquisitions closed during the years ended December 31, 2018 and 2017, qualified as asset acquisitions and, as such, acquisition costs were capitalized in accordance with ASU 2017-01. In conjunction with the acquisitions closed during the year ended December 31, 2016, expenses of $10,880 were incurred and included in Acquisition expenses in the accompanying Consolidated Statements of Income and Comprehensive Income.
The Company recorded the following revenues and net income, excluding the impact of one-time acquisition expenses, in the Consolidated Statements of Income and Comprehensive Income related to properties acquired and accounted for as business combinations from the date of acquisition through December 31, 2016:
| (in thousands) | December 31, 2016 |
|||
| Revenues |
$ | 17,088 | ||
| Net income |
9,462 | |||
Condensed Pro Forma Financial Information (Unaudited)
The results of operations, excluding the impact of one-time acquisition costs of $10,880 for the year ended December 31, 2016, of the acquisitions accounted for as business combinations, for which financial information was available, are included in the following unaudited pro forma financial information as if these acquisitions had been completed as of the beginning of the comparable prior annual period prior to the acquisition date. The following unaudited pro forma financial information is presented as if the 2016 acquisitions were completed at January 1, 2015. Pro forma financial information is not presented for the 2018 and 2017 acquisitions based on their qualification as asset acquisitions in accordance with ASU 2017-01. These pro forma results are for comparative purposes only and are not necessarily indicative of what the Company’s actual results of operations would have been had the acquisitions occurred at the beginning of the periods presented, nor are they necessarily indicative of future operating results.
The unaudited condensed pro forma financial information is as follows for the year ended December 31, 2016:
| (in thousands) | December 31, 2016 |
|||
| Revenues |
$ | 174,727 | ||
| Net income |
69,504 | |||
Subsequent to December 31, 2018, the Company closed on the following acquisitions, (see Note 19):
| (in thousands, except number of properties) | ||||||||||
| Date |
Property Type | Number of Properties |
Acquisition Price |
|||||||
| January 31, 2019 |
Healthcare | 1 | $ | 4,747 | ||||||
| March 12, 2019 |
Industrial | 1 | 10,217 | |||||||
|
|
|
|
|
|||||||
| 2 | $ | 14,964 | ||||||||
|
|
|
|
|
|||||||
The Company has not completed the allocation of the acquisition date fair values for the properties acquired subsequent to December 31, 2018; however, it expects the acquisitions to qualify as asset acquisitions and that the purchase price of these properties will primarily be allocated to land, land improvements, building, and acquired lease intangibles.
F-72
Table of Contents
5. Sale of Real Estate
The Company closed on the following sales of real estate, none of which qualified as discontinued operations, during the years ended December 31, 2018, 2017, and 2016:
| For the years ended December 31, | ||||||||||||
| (in thousands, except number of properties) | 2018 | 2017 | 2016 | |||||||||
| Number of properties disposed |
20 | 13 | 9 | |||||||||
| Aggregate sale price |
$ | 57,402 | $ | 66,532 | $ | 39,500 | (a) | |||||
| Aggregate carrying value |
(43,492 | ) | (50,339 | ) | (32,665 | ) | ||||||
| Additional sales expenses |
(3,414 | ) | (3,201 | ) | (910 | ) | ||||||
|
|
|
|
|
|
|
|||||||
| Gain on sale of real estate |
$ | 10,496 | $ | 12,992 | $ | 5,925 | ||||||
|
|
|
|
|
|
|
|||||||
| (a) | The Company provided seller financing of $3,700 in connection with one of the 2016 sales (see Note 8). |
6. Investment in Rental Property and Lease Arrangements
The Company generally leases its investment rental property to established tenants. At December 31, 2018, the Company had 605 real estate properties which were leased under leases that have been classified as operating leases and 16 that have been classified as direct financing leases. Of the 16 leases classified as direct financing leases, four include land portions which are accounted for as operating leases (see Revenue Recognition within Note 2). Substantially all leases have initial terms of 10 to 20 years and provide for minimum rentals as defined in ASC 840, Leases. In addition, the leases generally provide for limited increases in rent as a result of fixed increases, increases in the Consumer Price Index, or increases in the tenant’s sales volume. Generally, the tenant is also required to pay all property taxes and assessments, substantially maintain the interior and exterior of the building, and maintain property and liability insurance coverage. The leases also typically provide one or more multiple year renewal options subject to generally the same terms and conditions as the initial lease.
Investment in Rental Property—Accounted for Using the Operating Method
Rental property subject to non-cancelable operating leases with tenants are as follows at December 31, 2018 and 2017:
| December 31, | ||||||||
| (in thousands) | 2018 | 2017 | ||||||
| Land |
$ | 411,043 | $ | 348,940 | ||||
| Land improvements |
239,701 | 211,674 | ||||||
| Buildings and building improvements |
2,185,024 | 1,754,796 | ||||||
| Tenant improvements |
1,475 | 11,425 | ||||||
| Equipment |
11,492 | 7,689 | ||||||
|
|
|
|
|
|||||
| 2,848,735 | 2,334,524 | |||||||
| Less accumulated depreciation |
(206,989 | ) | (148,383 | ) | ||||
|
|
|
|
|
|||||
| $ | 2,641,746 | $ | 2,186,141 | |||||
|
|
|
|
|
|||||
Depreciation expense on investment in rental property was as follows for the years ended December 31, 2018, 2017, and 2016:
| For the years ended December 31, | ||||||||||||
| (in thousands) | 2018 | 2017 | 2016 | |||||||||
| Depreciation |
$ | 66,055 | $ | 50,360 | $ | 37,976 | ||||||
F-73
Table of Contents
Estimated minimum future rental receipts required under non-cancelable operating leases with tenants at December 31, 2018 are as follows:
| (in thousands) | ||||
| 2019 |
$ | 231,725 | ||
| 2020 |
235,426 | |||
| 2021 |
238,223 | |||
| 2022 |
240,083 | |||
| 2023 |
241,498 | |||
| Thereafter |
2,007,118 | |||
|
|
|
|||
| $ | 3,194,073 | |||
|
|
|
|||
Since lease renewal periods are exercisable at the option of the tenant, the above amounts only include future minimum lease payments due during the initial lease terms. In addition, such amounts exclude any potential variable rent increases that are based on the Consumer Price Index or future contingent rents which may be received under the leases based on a percentage of the tenant’s gross sales.
Investment in Rental Property—Accounted for Using the Direct Financing Method
The Company’s net investment in direct financing leases is as follows at December 31, 2018 and 2017:
| December 31, | ||||||||
| (in thousands) | 2018 | 2017 | ||||||
| Minimum lease payments to be received |
$ | 76,829 | $ | 77,889 | ||||
| Estimated unguaranteed residual values |
20,358 | 19,758 | ||||||
| Less unearned revenue |
(55,187 | ) | (56,030 | ) | ||||
|
|
|
|
|
|||||
| Net investment in direct financing leases |
$ | 42,000 | $ | 41,617 | ||||
|
|
|
|
|
|||||
Minimum future rental receipts required under non-cancelable direct financing leases with tenants at December 31, 2018 are as follows:
| (in thousands) | ||||
| 2019 |
$ | 4,076 | ||
| 2020 |
4,194 | |||
| 2021 |
4,283 | |||
| 2022 |
4,369 | |||
| 2023 |
4,456 | |||
| Thereafter |
55,451 | |||
|
|
|
|||
| $ | 76,829 | |||
|
|
|
|||
The above rental receipts do not include future minimum lease payments for renewal periods, potential variable Consumer Price Index rent increases, or contingent rental payments that may become due in future periods.
F-74
Table of Contents
7. Intangible Assets and Liabilities
The following is a summary of intangible assets and liabilities and related accumulated amortization at December 31, 2018 and 2017:
| December 31, | ||||||||
| (in thousands) | 2018 | 2017 | ||||||
| Lease intangibles: |
||||||||
| Acquired above-market leases |
$ | 64,164 | $ | 59,502 | ||||
| Less accumulated amortization |
(14,740 | ) | (9,183 | ) | ||||
|
|
|
|
|
|||||
| Acquired above-market leases, net |
49,424 | 50,319 | ||||||
|
|
|
|
|
|||||
| Acquired in-place leases |
277,659 | 216,858 | ||||||
| Less accumulated amortization |
(40,825 | ) | (24,518 | ) | ||||
|
|
|
|
|
|||||
| Acquired in-place leases, net |
236,834 | 192,340 | ||||||
|
|
|
|
|
|||||
| Total intangible lease assets, net |
$ | 286,258 | $ | 242,659 | ||||
|
|
|
|
|
|||||
| Acquired below-market leases |
$ | 101,602 | $ | 91,667 | ||||
| Less accumulated amortization |
(15,655 | ) | (9,923 | ) | ||||
|
|
|
|
|
|||||
| Intangible lease liabilities, net |
$ | 85,947 | $ | 81,744 | ||||
|
|
|
|
|
|||||
| Leasing fees |
$ | 17,274 | $ | 16,286 | ||||
| Less accumulated amortization |
(3,576 | ) | (2,732 | ) | ||||
|
|
|
|
|
|||||
| Leasing fees, net |
$ | 13,698 | $ | 13,554 | ||||
|
|
|
|
|
|||||
Amortization for intangible lease assets and liabilities for the years ended December 31, 2018, 2017, and 2016 is as follows:
| (in thousands) | For the years ended December 31, | |||||||||||||
| Intangible |
Financial Statement Presentation |
2018 | 2017 | 2016 | ||||||||||
| Acquired in-place leases and leasing fees |
Depreciation and amortization |
$ | 17,939 | $ | 11,903 | $ | 8,345 | |||||||
| Above-market and below-market leases |
Increase (decrease) to rental income from operating leases |
304 | (496 | ) | 482 | |||||||||
Estimated future amortization of intangible assets and liabilities at December 31, 2018 is as follows:
| (in thousands) | ||||
| 2019 |
$ | 19,123 | ||
| 2020 |
18,844 | |||
| 2021 |
18,432 | |||
| 2022 |
17,818 | |||
| 2023 |
17,438 | |||
| Thereafter |
122,354 | |||
|
|
|
|||
| $ | 214,009 | |||
|
|
|
|||
8. Notes Receivable
During 2016, the Company, as the lender, entered into two loan agreements in the amount of $3,700 and $2,827. The agreements called for interest-only payments at 7.00% and 6.35% per annum through maturity in February and November 2019, respectively. Each of the loans was collateralized by the real estate assets held by the obligors and represented first mortgage liens on net leased commercial properties in Florida and Michigan,
F-75
Table of Contents
respectively. There were no prior liens on the properties at the time the notes were issued. As each of the loans were considered to be fully collectible, the carrying amount of the loans were equal to the face amount as of December 31, 2017. In connection with real estate transactions conducted during the year ended 2018, the Company settled the notes in full, in exchange for a reduction to the cash paid for the associated real estate assets (see Note 4). Interest income earned on the notes receivable amounted to $174, $445, and $77 for the years ended December 31, 2018, 2017, and 2016, respectively.
9. Unsecured Credit Agreements
2015 Unsecured Term Loan Agreement
On June 23, 2017, the Company amended and restated the term loan agreement by and among the Company, the OP, as the borrower, SunTrust Bank, as Administrative Agent, and the lenders party thereto (as amended and restated, the “2015 Unsecured Term Loan Agreement”). The 2015 Unsecured Term Loan Agreement amended certain terms, conditions, covenants, and other provisions to align them with those included in the 2017 Unsecured Revolving Credit and Term Loan Agreement described below, in addition to allowing a one-time, non-pro-rata $50,000 paydown on the loan (the “2015 Unsecured Term Loan”). On September 27, 2018, the Company made a $25,000 pro-rata paydown on the 2015 Unsecured Term Loan. The 2015 Unsecured Term Loan has an initial maturity date of February 2019 and provides for two one-year extension options, at the election of the Company, subject to compliance with all covenants and the payment of a 0.10% fee. Borrowings under the 2015 Unsecured Term Loan bear interest at variable rates based on the one-month LIBOR plus a margin based on the OP’s investment grade credit rating ranging between 0.90% and 1.75%. Based on the OP’s current credit rating of Baa3, the applicable margin under the 2015 Unsecured Term Loan is 1.40%.
2017 Unsecured Revolving Credit and Term Loan Agreement
On June 23, 2017, the Company and the OP entered into an $800,000 unsecured revolving credit and term loan agreement (“2017 Unsecured Revolving Credit and Term Loan Agreement”) with Manufacturers & Traders Trust Company (“M&T Bank”), as Administrative Agent, four participating banks as Joint Lead Arrangers and Joint Bookrunners, four participating banks as Co-Syndication Agents, and four participating banks, as Co-Documentation Agents. The 2017 Unsecured Revolving Credit and Term Loan Agreement consisted of a $400,000 senior unsecured revolving credit facility (“Revolver”), a $250,000 senior unsecured delayed draw term loan (“5.5-Year Term Loan”), and a $150,000 senior unsecured delayed draw term loan (“7-Year Term Loan”). The 2017 Unsecured Revolving Credit and Term Loan Agreement provides an accordion feature for up to a total of $1,000,000 of borrowing capacity. The Revolver includes a $35,000 sublimit for swingline loans and $20,000 available for issuance of letters of credit.
On November 20, 2017, pursuant to the terms of a Consent and Agreement Regarding Commitment Increases and Additional Term Loans (the “Commitment Increase”) among the Company, the OP, as the borrower, M&T Bank, as Administrative Agent, and the original parties to the 2017 Unsecured Revolving Credit and Term Loan Agreement, plus U.S. Bank National Association and Raymond James, N.A. as new lenders added pursuant to the Commitment Increase, the OP obtained an additional $80,000 in credit commitments from the lenders, raising the total available borrowings under the 2017 Unsecured Revolving Credit and Term Loan Agreement to $880,000. Except as amended by the Commitment Increase, all terms and conditions of the 2017 Unsecured Revolving Credit and Term Loan Agreement remain the same as those in effect prior to the Commitment Increase. As amended by the Commitment Increase, the 2017 Unsecured Revolving Credit and Term Loan Agreement consists of the $425,000 Revolver, the $265,000 5.5-Year Term Loan, and the $190,000 7-Year Term Loan.
The Revolver has an initial maturity date of January 2022 and provides for one five-month extension, at the election of the Company, subject to certain conditions set forth in the agreement and payment of a 0.0625% fee on the revolving commitments. Borrowings on the Revolver bear interest at variable rates based on LIBOR plus a
F-76
Table of Contents
margin based on the OP’s investment grade credit rating ranging between 0.825% and 1.55% per annum. The Revolver contains an applicable facility fee based on the OP’s credit rating ranging between 0.13% and 0.30% per annum. The 5.5-Year Term Loan provided for up to three delayed draws from inception through June 2018 at the request of the Company. All borrowings on the 5.5-Year Term Loan were funded as of December 31, 2017. Borrowings under the 5.5-Year Term Loan bear interest at variable rates based on LIBOR plus a margin based on the OP’s credit rating ranging between 0.90% and 1.75% per annum through the maturity date of January 2023. The 7-Year Term Loan provided for up to three delayed draws from inception through June 2018 at the request of the Company. The Company requested a draw for the remaining available borrowings under the 7-Year term loan in June 2018. Borrowings under the 7-Year Term Loan bear interest at variable rates based on LIBOR plus a margin based on the OP’s credit rating ranging between 1.50% and 2.45% through the maturity date of June 2024. Based on the OP’s current credit rating of Baa3, the applicable margin under the Revolver, 5.5-Year Term Loan, and 7-Year Term Loan are 1.20%, 1.35%, and 1.90%, respectively, and the applicable facility fee is 0.25% per annum. The 5.5-Year Term Loan and 7-Year Term Loan are both subject to a fee of 0.25% per annum on the amount of the commitments, reduced by the amount of term loans outstanding under the applicable loan. The Company is subject to various financial and nonfinancial covenants under the 2017 Unsecured Revolving Credit and Term Loan Agreement.
Senior Notes
In January 2017, the Company commenced a private offering of unsecured, fixed-rate, interest-only senior promissory notes (the “Series A Notes”). On March 16, 2017, the Company entered into a Note and Guaranty Agreement with each of the purchasers of the Series A Notes. On April 18, 2017, the Company closed the offering and issued the Series A Notes for an aggregate principal amount of $150,000. The Series A Notes were issued by the OP and guaranteed by the Company. The Series A Notes were issued at par, bear interest at a rate of 4.84% per annum (priced at 240 basis points above the 10-year U.S. Treasury yield at the time of pricing), and have a 10-year maturity, maturing on April 18, 2027.
On July 2, 2018, the Company entered into a Note and Guaranty Agreement (the “NGA Agreement”) with each of the purchasers of unsecured, fixed-rate, interest-only, guaranteed senior promissory notes. Under the NGA Agreement, the OP issued and sold senior promissory notes in two series, Series B Guaranteed Senior Notes (the “Series B Notes”) and Series C Guaranteed Senior Notes (the “Series C Notes”), for an aggregate principal amount of $325,000. The Series B Notes provide for an aggregate principal amount of $225,000 with a fixed-rate of 5.09% through the maturity date of July 2, 2028. The Series C Notes provide for an aggregate principal amount of $100,000 with a fixed-rate of 5.19% through the maturity date of July 2, 2030. On July 2, 2018, the OP issued $100,000 of the Series B Notes and $50,000 of the Series C Notes. The remaining $125,000 principal of the Series B Notes and $50,000 principal of the Series C Notes were funded on September 13, 2018. The proceeds of both issuances were used to pay off borrowings on the Revolver, along with $25,000 of the outstanding principal on the 2015 Unsecured Term Loan.
F-77
Table of Contents
The following table summarizes the Company’s unsecured credit agreements:
| Outstanding Balance | Interest Rate (d) |
Maturity Date | ||||||||||||
| December 31, | ||||||||||||||
| (in thousands, except interest rates) | 2018 | 2017 | ||||||||||||
| 2015 Unsecured Term Loan (a) |
$ | 300,000 | $ | 325,000 | one-month LIBOR + 1.40% | Feb. 2019 | (f) | |||||||
|
|
|
|
|
|||||||||||
| 2017 Unsecured Revolving Credit and Term Loan Agreement (a) |
||||||||||||||
| Revolver (b) |
141,100 | 273,000 | (e) | Jan. 2022 | ||||||||||
| 5.5-Year term loan |
265,000 | 265,000 | one- month LIBOR + 1.35% | Jan. 2023 | ||||||||||
| 7-Year term loan |
190,000 | 100,000 | one- month LIBOR + 1.90% | Jun. 2024 | ||||||||||
|
|
|
|
|
|||||||||||
| 596,100 | 638,000 | |||||||||||||
|
|
|
|
|
|||||||||||
| Senior Notes (a) |
||||||||||||||
| Series A |
150,000 | 150,000 | 4.84% | Apr. 2027 | ||||||||||
| Series B |
225,000 | — | 5.09% | Jul. 2028 | ||||||||||
| Series C |
100,000 | — | 5.19% | Jul. 2030 | ||||||||||
|
|
|
|
|
|||||||||||
| 475,000 | 150,000 | |||||||||||||
|
|
|
|
|
|||||||||||
| Total |
1,371,100 | 1,113,000 | ||||||||||||
| Debt issuance costs, net (c) |
(4,227 | ) | (3,088 | ) | ||||||||||
|
|
|
|
|
|||||||||||
| $ | 1,366,873 | $ | 1,109,912 | |||||||||||
|
|
|
|
|
|||||||||||
| (a) | The Company believes it was in compliance with all financial covenants for all periods presented. |
| (b) | At December 31, 2018, the Company had an outstanding balance of $15,000 on the swingline loan feature of the Revolver, due within five business days. On January 2, 2019, the balance became a part of the Revolver and matures January 2022. |
| (c) | Amounts presented include debt issuance costs, net, related to the unsecured term notes and senior notes only. |
| (d) | At December 31, 2018 and 2017, the one-month LIBOR rate was 2.35% and 1.37%, respectively. At December 31, 2017, the three-month LIBOR rate was 1.49%. |
| (e) | At December 31, 2018, the swingline loan balance of $15,000 bore interest at 5.45% and the remaining Revolver balance of $126,100 bore interest at one-month LIBOR plus 1.20%. At December 31, 2017, $223,000 of the Revolver balance bore interest at one-month LIBOR plus 1.20%, while the remaining balance of $50,000 bore interest at three-month LIBOR plus 1.20%. |
| (f) | Subsequent to year end, the first one-year extension was exercised, extending the maturity date to February 2020. |
At December 31, 2018 and 2017, the weighted average interest rate on all outstanding borrowings was 4.23% and 3.03%, respectively.
Debt issuance costs are amortized as a component of interest expense in the accompanying Consolidated Statements of Income and Comprehensive Income. The following table summarizes debt issuance cost amortization for the years ended December 31, 2018, 2017, and 2016:
| For the years ended December 31, | ||||||||||||
| (in thousands) | 2018 | 2017 | 2016 | |||||||||
| Debt issuance costs amortization |
$ | 1,918 | $ | 1,794 | $ | 1,817 | ||||||
For the year ended December 31, 2018, the Company paid $2,209 in debt issuance costs associated with the Series B Notes and Series C Notes.
F-78
Table of Contents
For the year ended December 31, 2017, the Company paid $8,711 in debt issuance costs associated with the Series A Notes, the 2017 Unsecured Revolving Credit and Term Loan Agreement, and the 2015 Unsecured Term Loan Agreement. For each separate debt instrument, on a lender by lender basis, in accordance with ASC 470-50, Debt Modifications and Extinguishment, the Company performed an assessment of whether the transaction was deemed to be new debt, a modification of existing debt, or an extinguishment of existing debt. Debt issuance costs are either deferred and amortized over the term of the associated debt or expensed as incurred. Based on this assessment, $5,810 of the debt issuance costs related to the issuance of new debt and therefore have been deferred and are being amortized over the term of the associated debt. The remaining $2,901 of debt issuance costs were associated with lenders whose commitments under the new agreements have been determined to be an extinguishment and such debt issuance costs were expensed as a component of the Cost of debt extinguishment in the accompanying Consolidated Statements of Income and Comprehensive Income for the year ended December 31, 2017. Additionally, $654 of unamortized debt issuance costs were expensed and included in Cost of debt extinguishment in the accompanying Consolidated Statements of Income and Comprehensive Income for the year ended December 31, 2017.
10. Mortgages and Notes Payable
The Company’s mortgages and notes payable consist of the following at December 31, 2018 and 2017:
| (in thousands, except interest rates) | Origination Date (Month/ Year) |
Maturity Date (Month/ Year) |
Interest Rate |
December 31, | ||||||||||||||||||
| Lender |
2018 | 2017 | ||||||||||||||||||||
| (1) Wilmington Trust National Association |
Jun-18 | Aug-25 | 4.36% | $ | 20,674 | $ | — | (a) (b) (c) (m) | ||||||||||||||
| (2) PNC Bank |
Oct-16 | Nov-26 | 3.62% | 18,260 | 18,622 | (b) (c) | ||||||||||||||||
| (3) Sun Life |
Mar-12 | Oct-21 | 5.13% | 11,288 | 11,670 | (b) (g) | ||||||||||||||||
| (4) Aegon |
Apr-12 | Oct-23 | 6.38% | 8,496 | 9,168 | (b) (h) | ||||||||||||||||
| (5) Symetra Financial |
Nov-17 | Oct-26 | 3.65% | 6,467 | 6,685 | (a) (b) (k) (l) | ||||||||||||||||
| (6) M&T Bank |
Oct-17 | Aug-21 | |
one—month LIBOR+3% |
|
5,051 | 5,183 | (b) (d) (i) (j) | ||||||||||||||
| (7) Legg Mason Mortgage Capital Corporation |
Aug-10 | Aug-22 | 7.06% | 4,692 | 5,670 | (b) (e) | ||||||||||||||||
| (8) Standard Insurance Co. |
Apr-09 | May-34 | 6.88% | 1,751 | 1,813 | (b) (c) (f) | ||||||||||||||||
| (9) Columbian Mutual Life Insurance Company |
Aug-10 | Sep-25 | 7.00% | 1,459 | 1,500 | (b) (c) (d) | ||||||||||||||||
| (10) Note holders |
Dec-08 | Dec-23 | 6.25% | 750 | 750 | (d) | ||||||||||||||||
| (11) Standard Insurance Co. |
Jul-10 | Aug-30 | 6.75% | 563 | 581 | (b) (c) (d) (f) | ||||||||||||||||
| (12) Siemens Financial Services, Inc. |
Sep-10 | Sep-20 | 5.47% | — | 5,820 | (a) (b) | ||||||||||||||||
| (13) Symetra Financial |
Mar-11 | Apr-31 | 6.34% | — | 1,008 | (a) (b) | ||||||||||||||||
|
|
|
|
|
|||||||||||||||||||
| 79,451 | 68,470 | |||||||||||||||||||||
| Debt issuance costs, net |
(499 | ) | (638 | ) | ||||||||||||||||||
|
|
|
|
|
|||||||||||||||||||
| $ | 78,952 | $ | 67,832 | |||||||||||||||||||
|
|
|
|
|
|||||||||||||||||||
| (a) | Non-recourse debt includes the indemnification/guaranty of the Company and/or OP pertaining to fraud, environmental claims, insolvency and other matters. |
| (b) | Debt secured by related rental property and lease rents. |
| (c) | Debt secured by guaranty of the OP. |
| (d) | Debt secured by guaranty of the Company. |
| (e) | Debt is guaranteed by a third party. |
| (f) | The interest rate represents the initial interest rate on the respective notes. The interest rate will be adjusted at Standard Insurance’s discretion (based on prevailing rates) at certain times throughout the term of the note, ranging from 119 to 239 months, and the monthly installments will be adjusted accordingly. At the time Standard Insurance may adjust the interest rate for notes payable, the Company has the right to prepay |
F-79
Table of Contents
| the note without penalty. Subsequent to December 31, 2018, the Company prepaid one of these mortgages with no prepayment penalty (see Note 19). |
| (g) | Mortgage was assumed in March 2012 as part of an UPREIT transaction. The debt was recorded at fair value at the time of the assumption. |
| (h) | Mortgage was assumed in April 2012 as part of the acquisition of the related property. The debt was recorded at fair value at the time of the assumption. |
| (i) | The Company entered into an interest rate swap agreement in connection with the mortgage note, as further described in Note 11. |
| (j) | Mortgage was assumed in October 2017 as part of an UPREIT transaction. The debt was recorded at fair value at the time of the assumption. |
| (k) | Mortgage was assumed in November 2017 as part of the acquisition of the related property. The debt was recorded at fair value at the time of the assumption. |
| (l) | The interest rate will be adjusted to the holder’s quoted five-year commercial mortgage rate for similar size and quality. |
| (m) | Mortgage was assumed in June 2018 as part of the acquisition of the related property. The debt was recorded at fair value at the time of assumption. |
At December 31, 2018, investment in rental property of $139,765 is pledged as collateral against the Company’s mortgages and notes payable.
The following table summarizes the mortgages extinguished by the Company during the years ended December 31, 2018, 2017, and 2016:
| For the years ended December 31, | ||||||||||||
| (in thousands, except number) | 2018 | 2017 | 2016 | |||||||||
| Number of mortgages |
2 | 7 | 4 | |||||||||
| Outstanding balance of mortgages |
$ | 6,666 | $ | 48,108 | $ | 8,199 | ||||||
The following table summarizes the cost of mortgage extinguishment for the years ended December 31, 2018, 2017, and 2016:
| For the years ended December 31, | ||||||||||||
| (in thousands) | 2018 | 2017 | 2016 | |||||||||
| Cost of mortgage extinguishment |
$ | 101 | $ | 1,596 | $ | 133 | ||||||
Estimated future principal payments to be made under the above mortgage and note payable agreements, and the Company’s unsecured credit agreements (see Note 9) at December 31, 2018 are as follows:
| (in thousands) | ||||
| 2019 |
$ | 3,433 | ||
| 2020 |
303,672 | |||
| 2021 |
18,584 | |||
| 2022 |
144,166 | |||
| 2023 |
272,456 | |||
| Thereafter |
708,240 | |||
|
|
|
|||
| $ | 1,450,551 | |||
|
|
|
|||
Certain of the Company’s mortgage and note payable agreements provide for prepayment fees and can be terminated under certain events of default as defined under the related agreements. These prepayment fees are not reflected as part of the table above.
F-80
Table of Contents
11. Interest Rate Swaps
Interest rate swaps were entered into with certain financial institutions in order to mitigate the impact of interest rate variability over the term of the related debt agreements. The interest rate swaps are considered cash flow hedges. In order to reduce counterparty concentration risk, the Company has a diversification policy for institutions that serve as swap counterparties. Under these agreements, the Company receives monthly payments from the counterparties on these interest rate swaps equal to the related variable interest rates multiplied by the outstanding notional amounts. Certain interest rate swaps amortize on a monthly basis. In turn, the Company pays the counterparties each month an amount equal to a fixed rate multiplied by the related outstanding notional amounts. The intended net impact of these transactions is that the Company pays a fixed interest rate on its variable-rate borrowings.
The following is a summary of the Company’s outstanding interest rate swap agreements at December 31, 2018 and 2017:
| Fair Value | ||||||||||||||||||||||||
| (in thousands, except interest rates) | December 31, | |||||||||||||||||||||||
| Counterparty |
Maturity Date | Fixed Rate | Variable Rate Index | Notional Amount | 2018 | 2017 | ||||||||||||||||||
| Bank of America, N.A. |
November 2023 | 2.80 | % | one-month LIBOR | $ | 25,000 | $ | (411 | ) | $ | (863 | ) | ||||||||||||
| Bank of Montreal |
July 2024 | 1.16 | % | one-month LIBOR | 40,000 | 2,702 | 2,503 | |||||||||||||||||
| Bank of Montreal |
January 2025 | 1.91 | % | one-month LIBOR | 25,000 | 769 | 464 | |||||||||||||||||
| Bank of Montreal |
July 2025 | 2.32 | % | one-month LIBOR | 25,000 | 222 | (194 | ) | ||||||||||||||||
| Bank of Montreal |
January 2026 | 1.92 | % | one-month LIBOR | 25,000 | 915 | 561 | |||||||||||||||||
| Bank of Montreal |
January 2026 | 2.05 | % | one-month LIBOR | 40,000 | 1,130 | 520 | |||||||||||||||||
| Bank of Montreal |
December 2026 | 2.33 | % | one-month LIBOR | 10,000 | 132 | (63 | ) | ||||||||||||||||
| Bank of Montreal |
December 2027 | 2.37 | % | one-month LIBOR | 25,000 | 355 | (192 | ) | ||||||||||||||||
| Capital One, N.A. |
December 2021 | 1.05 | % | one-month LIBOR | 15,000 | 605 | 607 | |||||||||||||||||
| Capital One, N.A. |
December 2024 | 1.58 | % | one-month LIBOR | 15,000 | 727 | 603 | |||||||||||||||||
| Capital One, N.A. |
January 2026 | 2.08 | % | one-month LIBOR | 35,000 | 930 | 399 | |||||||||||||||||
| Capital One, N.A. |
July 2026 | 1.32 | % | one-month LIBOR | 35,000 | 2,877 | 2,565 | |||||||||||||||||
| Capital One, N.A. |
December 2027 | 2.37 | % | one-month LIBOR | 25,000 | 345 | (189 | ) | ||||||||||||||||
| Capital One, N.A. |
April 2026 | 2.68 | % | one-month LIBOR | 15,000 | (189 | ) | — | ||||||||||||||||
| M&T Bank |
August 2021 | 1.02 | % | one-month LIBOR | 5,051 | 177 | 182 | (b), (c) | ||||||||||||||||
| M&T Bank |
September 2022 | 2.83 | % | one-month LIBOR | 25,000 | (362 | ) | (810 | ) | |||||||||||||||
| M&T Bank |
November 2023 | 2.65 | % | one-month LIBOR | 25,000 | (254 | ) | (686 | ) | |||||||||||||||
| Regions Bank |
March 2018 | 1.77 | % | one-month LIBOR | — | — | (9 | ) (a) | ||||||||||||||||
| Regions Bank |
March 2019 | 1.91 | % | three-month LIBOR | — | — | 2 | (a) | ||||||||||||||||
| Regions Bank |
May 2020 | 2.12 | % | one-month LIBOR | 50,000 | 271 | (153 | ) | ||||||||||||||||
| Regions Bank |
March 2022 | 2.43 | % | three-month LIBOR | — | — | (254 | ) (a) | ||||||||||||||||
| Regions Bank |
December 2023 | 1.18 | % | one-month LIBOR | 25,000 | 1,484 | 1,402 | |||||||||||||||||
| SunTrust Bank |
April 2024 | 1.99 | % | one-month LIBOR | 25,000 | 554 | 261 | |||||||||||||||||
| SunTrust Bank |
April 2025 | 2.20 | % | one-month LIBOR | 25,000 | 382 | — | |||||||||||||||||
| SunTrust Bank |
July 2025 | 1.99 | % | one-month LIBOR | 25,000 | 728 | 386 | |||||||||||||||||
| SunTrust Bank |
December 2025 | 2.30 | % | one-month LIBOR | 25,000 | 299 | (138 | ) | ||||||||||||||||
| SunTrust Bank |
January 2026 | 1.93 | % | one-month LIBOR | 25,000 | 903 | 553 | |||||||||||||||||
| Wells Fargo Bank, N.A. |
February 2021 | 2.39 | % | one-month LIBOR | 35,000 | 59 | (369 | ) | ||||||||||||||||
| Wells Fargo Bank, N.A. |
October 2024 | 2.72 | % | one-month LIBOR | 15,000 | (222 | ) | (510 | ) | |||||||||||||||
| Wells Fargo Bank, N.A. |
January 2028 | 2.37 | % | one-month LIBOR | 75,000 | 1,067 | (590 | ) | ||||||||||||||||
| Wells Fargo Bank, N.A. |
April 2027 | 2.72 | % | one-month LIBOR | 25,000 | (382 | ) | — | ||||||||||||||||
|
|
|
|
|
|||||||||||||||||||||
| $ | 15,813 | $ | 5,988 | |||||||||||||||||||||
|
|
|
|
|
|||||||||||||||||||||
| (a) | Notional amount at December 31, 2017 was $25,000. |
| (b) | Notional amount at December 31, 2017 was $5,183. |
| (c) | Interest rate swap was assumed in October 2017 as part of an UPREIT transaction. |
F-81
Table of Contents
The total amounts recognized, and the location in the accompanying Consolidated Statements of Income and Comprehensive Income, from converting from variable rates to fixed rates under these agreements are as follows for the years ended December 31, 2018, 2017, and 2016:
| (in thousands) | Amount of Gain Recognized in Accumulated Other Comprehensive |
Reclassification from Accumulated Other Comprehensive Income |
Total Interest Expense Presented in the Consolidated Statements of Income and Comprehensive |
|||||||||||
| For the years ended December 31, |
Income | Location | Amount of Loss | Income | ||||||||||
| 2018 |
$ | 10,584 | Interest expense | $ | 910 | $ | 52,855 | |||||||
| 2017 |
4,166 | Interest expense | 5,099 | 34,751 | ||||||||||
| 2016 |
13,771 | Interest expense | 9,322 | 29,963 | ||||||||||
Amounts related to the interest rate swaps expected to be reclassified out of Accumulated other comprehensive income to Interest expense during 2019 are estimated to be a gain of $3,446. The Company is exposed to credit risk in the event of non-performance by the counterparties of the swaps. The Company minimizes this risk exposure by limiting counterparties to major banks who meet established credit and capital guidelines.
The fair value of the interest rate swaps at December 31, 2018 and 2017 are based on a valuation of the discounted future payments as provided by the counterparties, as disclosed in Note 2.
12. Non-Controlling Interests
Under the Company’s UPREIT structure, entities and individuals can contribute their properties in exchange for membership interests in the OP. Properties contributed as part of UPREIT transactions were valued at $15,797, $10,498, and $7,190 during the years ended December 31, 2018, 2017, and 2016, respectively, which represents the estimated fair value of the properties contributed, less any assumed debt. The cumulative amount of UPREIT properties contributed, less assumed debt, amounted to $128,746, $112,949, and $102,451 during the years ended December 31, 2018, 2017, and 2016, respectively. In exchange for the properties contributed, 1,737, 1,551, and 1,427 non-controlling OP Units were issued and outstanding, representing a 7.3%, 7.6%, and 8.6% interest in the OP at December 31, 2018, 2017, and 2016, respectively.
The OP Units are economically equivalent to the Company’s common stock and, subject to certain restrictions, are convertible into the Company’s common stock at the option of the respective unit holders on a one-to-one basis. The OP Units are not redeemable for cash in any circumstance and are therefore considered to be permanent equity. Exchanges of OP Units held by non-controlling interest holders are recorded by reducing non-controlling interest on a historical cost basis with a corresponding increase in common stock and additional paid-in capital.
The following table summarizes OP Units exchanged for shares of common stock for the years ended December 31, 2018, 2017, and 2016:
| For the years ended December 31, | ||||||||||||
| (in thousands) | 2018 | 2017 | 2016 | |||||||||
| OP Units exchanged |
8 | 37 | — | |||||||||
| Shares of common stock received |
8 | 37 | — | |||||||||
| Value of shares/units exchanged |
$ | 684 | $ | 2,986 | $ | — | ||||||
Holders of the OP Units do not have voting rights at the Company level.
F-82
Table of Contents
13. Credit Risk Concentrations
The Company maintained bank balances that, at times, exceeded the federally insured limit during the years ended December 31, 2018, 2017, and 2016. The Company has not experienced losses relating to these deposits and management does not believe that the Company is exposed to any significant credit risk with respect to these amounts.
The Company’s rental property is managed by the Manager and the Asset Manager as described in Note 3. Management fees paid to the Manager and Asset Manager represent 19%, 20%, and 25% of total operating expenses for the years ended December 31, 2018, 2017, and 2016, respectively. The 2018 and 2017 amounts do not include acquisition costs paid to the Asset Manager as they were capitalized in accordance with ASU 2017-01 (see Notes 2 and 3). The Company has mortgages and notes payable with four institutions that comprise 26%, 23%, 14%, and 11% of total mortgages and notes payable at December 31, 2018. The Company had mortgages and notes payable with four institutions that comprise 27%, 17%, 13%, and 11% of total mortgages and notes payable at December 31, 2017. The Company had mortgages and notes payable with four institutions that comprised 20%, 18%, 12%, and 11% of total mortgages and notes payable at December 31, 2016. For the years ended December 31, 2018, 2017, and 2016, the Company had no individual tenants or common franchises that accounted for more than 10% of total revenues.
14. Equity
General
Pursuant to the Company’s Articles of Incorporation (the “Charter”), the Company is authorized to issue an aggregate of 100,000 shares of capital stock, consisting of 80,000 shares designated as common stock with a par value of $0.001 per share, and 20,000 shares designated as preferred stock with a par value of $0.001 per share (unrounded). The Board of Directors, without any action by the Company’s stockholders, may amend the Charter from time to time to increase or decrease the aggregate number of shares of capital stock or the number of shares of capital stock of any class or series that the Company has authority to issue.
Common Stock
The shares of the Company’s common stock entitle the holders to one vote per share on all matters upon which stockholders are entitled to vote, to receive dividends and other distributions as authorized by the Board of Directors in accordance with the Maryland General Corporation Law, and to all rights of a stockholder pursuant to the Maryland General Corporation Law. The common stock has no preferences or preemptive conversion or exchange rights.
Pursuant to the limited liability company agreement between the Company and the OP, each outstanding OP Units is convertible into one share of the Company’s common stock, subject to the terms and conditions set forth in the OP’s operating agreement.
Preferred Stock
The Charter also provides the Board of Directors with the authority to issue one or more classes or series of preferred stock, and prior to the issuance of such shares of preferred stock, the Board of Directors shall have the power from time to time to classify or reclassify, in one or more series, any unissued shares and designate the preferences, rights and privileges of such shares of preferred stock. At December 31, 2018 and 2017, no shares of the Company’s preferred stock were issued and outstanding.
Share Redemption Program
The Board of Directors approved a share redemption program (“Share Redemption Program”) under which the Company may repurchase shares of its outstanding common stock after December 31, 2009. The Board of Directors approved and adopted an amended and restated Share Redemption Program effective as of June 28, 2017.
F-83
Table of Contents
Under the Share Redemption Program, stockholders may request that the Company redeem shares after one year from the original investment date, subject to certain exceptions as set forth in the Share Redemption Program. Under the Share Redemption Program, the Company is not obligated to repurchase shares and, notwithstanding any other term of the Share Redemption Program, the Board of Directors or IDC may reject any share redemption request made by any stockholder at any time. Shares held for more than 12 months, but less than five years, will be redeemed at a purchase price equal to 95% of the current share value established from time to time by the IDC (the “Determined Share Value”), and shares held for five years or more will be redeemed at a purchase price equal to 100% of the current Determined Share Value, subject to certain exemptions as set forth in the Share Redemption Program.
Total shares redeemed pursuant to the Share Redemption Program in any quarter may not exceed 1% of the total number of shares outstanding at the beginning of the calendar year plus 50% of the total number of any additional shares issued during the prior calendar quarter under the DRIP, provided that the total number of shares redeemed during any calendar year may not exceed 5% of the number of shares outstanding as of the first day of such calendar year. The Board of Directors or the IDC may amend, suspend, or terminate the Share Redemption Program at any time upon 30 days’ notice to the Company’s stockholders.
The following table summarizes redemptions under the Share Redemption Program for the years ended December 31, 2018, 2017, and 2016:
| For the years ended December 31, | ||||||||||||
| (in thousands, except number of redemptions) | 2018 | 2017 | 2016 | |||||||||
| Number of redemptions requested |
50 | 32 | 27 | |||||||||
| Number of shares |
127 | 119 | 109 | |||||||||
| Aggregate redemption price |
$ | 10,304 | $ | 9,439 | $ | 8,154 | ||||||
Distribution Reinvestment Plan
The Company has adopted the DRIP, pursuant to which the Company’s stockholders and holders of OP Units (other than the Company), may elect to have cash distributions reinvested in additional shares of the Company’s common stock. Cash distributions will be reinvested in additional shares of common stock pursuant to the DRIP at a per share price equal to 98% of the Determined Share Value as of the applicable distribution date. The Company may amend the DRIP at any time upon written notice to each participant at least 10 days prior to the effective date of the amendment. The Company may terminate the DRIP upon written notice to each participant at least 30 days prior to the effective date of the termination. At December 31, 2018, 2017, and 2016, a total of 2,233, 1,592, and 1,076, shares of common stock, respectively, have been issued under the DRIP.
F-84
Table of Contents
15. Earnings per Share
The following table summarizes the components used in the calculation of basic and diluted earnings per share (“EPS”) for the years ended December 31, 2018, 2017, and 2016:
| For the years ended December 31, | ||||||||||||
| (in thousands, except per share) | 2018 | 2017 | 2016 | |||||||||
| Basic earnings: |
||||||||||||
| Net earnings attributable to Broadstone Net Lease, Inc |
$ | 69,375 | $ | 54,799 | $ | 36,354 | ||||||
|
|
|
|
|
|
|
|||||||
| Diluted earnings: |
||||||||||||
| Net earnings attributable to Broadstone Net Lease, Inc |
$ | 69,375 | $ | 54,799 | $ | 36,354 | ||||||
| Net earnings attributable to non-controlling interests |
5,730 | 4,756 | 3,914 | |||||||||
|
|
|
|
|
|
|
|||||||
| $ | 75,105 | $ | 59,555 | $ | 40,268 | |||||||
|
|
|
|
|
|
|
|||||||
| Basic and diluted weighted average shares outstanding: |
||||||||||||
| Weighted average number of common shares outstanding used in basic earnings per share |
20,242 | 17,084 | 13,178 | |||||||||
| Effects of convertible membership units |
1,668 | 1,483 | 1,419 | |||||||||
|
|
|
|
|
|
|
|||||||
| Weighted average number of common shares outstanding used in diluted earnings per share |
21,910 | 18,567 | 14,597 | |||||||||
|
|
|
|
|
|
|
|||||||
| Basic and diluted net earnings per common share |
$ | 3.43 | $ | 3.21 | $ | 2.76 | ||||||
|
|
|
|
|
|
|
|||||||
In the table above, outstanding OP Units are included in the diluted earnings per share calculation. However, because such OP Units would also require that the share of the OP income attributable to such OP Units also be added back to net income, there is no effect on EPS.
16. Income Taxes
For federal income tax purposes, distributions to stockholders are characterized as ordinary dividends, capital gain distributions, or return of capital distributions. Return of capital distributions will reduce stockholders’ basis in their shares, but not below zero. The portion of the distribution that exceeds the adjusted basis of the stock with be treated as gain from the sale or exchange of property. The following table shows the character of the distributions the Company paid on a percentage basis for the years ended December 31, 2018, 2017, and 2016:
| For the years ended December 31, |
||||||||||||
| Character of Distributions |
2018 | 2017 | 2016 | |||||||||
| Ordinary dividends |
55 | % | 51 | % | 58 | % | ||||||
| Capital gain distributions |
8 | % | — | % | — | % | ||||||
| Return of capital distributions |
37 | % | 49 | % | 42 | % | ||||||
|
|
|
|
|
|
|
|||||||
| 100 | % | 100 | % | 100 | % | |||||||
|
|
|
|
|
|
|
|||||||
17. Supplemental Cash Flow Disclosures
Cash paid for interest was $44,697, $32,429, and $28,147 for the years ended December 31, 2018, 2017, and 2016, respectively. Cash paid for state income and franchise tax was $947, $655, and $310 for the years ended December 31, 2018, 2017, and 2016, respectively.
F-85
Table of Contents
The following are non-cash transactions and have been excluded from the accompanying Consolidated Statements of Cash Flows:
| • | During the years ended December 31, 2018, 2017, and 2016, the Company issued 622, 499, and 391 shares, respectively, of common stock with a value of approximately $50,826, $38,848, and $27,615, respectively, under the terms of the DRIP (see Note 14). |
| • | During the years ended December 31, 2018, 2017, and 2016, the Company issued 194, 161, and 97 OP Units, respectively, in exchange for property contributed in UPREIT transactions valued at $15,797, $12,913, and $7,190, respectively (see Note 12). |
| • | During the year ended December 31, 2018, the Company cancelled nine thousand shares of common stock with a value of $748 that were pledged as collateral by a tenant. The cancellation of the shares was used to settle $748 in outstanding receivables associated with the tenant. |
| • | During the year ended December 31, 2016, the Company issued a note receivable for $3,700 in connection with the sale of real estate (see Note 8). |
| • | At December 31, 2018, 2017, and 2016, dividend amounts declared and accrued but not yet paid amounted to $10,111, $8,449, and $6,643, respectively. |
| • | In connection with real estate transactions conducted during the year ended December 31, 2018, the Company settled notes receivable in the amount of $6,527 in exchange for a reduction to the cash paid for the associated real estate assets (see Notes 4 and 8). |
| • | In connection with real estate transactions conducted during the years ended December 31, 2017 and 2016, the Company accepted tenant improvement allowances and credits for rent in advance of $2,777 and $1,730, and $8,649 and $2,367, respectively, in exchange for a reduction to the cash paid for the associated real estate assets. |
18. Commitments and Contingencies
Litigation
From time to time, the Company is a party to various litigation matters incidental to the conduct of the Company’s business. While the resolution of such matters cannot be predicted with certainty, based on currently available information, the Company does not believe that the final outcome of any of these matters will have a material effect on its consolidated financial position, results of operations or liquidity.
Property and Acquisition Related
In connection with ownership and operation of real estate, the Company may potentially be liable for cost and damages related to environmental matters. The Company is not aware of any non-compliance, liability, claim, or other environmental condition that would have a material effect on its consolidated financial position, results of operations, or liquidity.
As part of acquisitions closed during 2017 and 2016, the Company assumed six separate lease agreements that provided for a total of $2,777 and $10,464, respectively, in tenant improvement allowances.
Balances associated with tenant improvement allowances at December 31, 2018 and 2017 were as follows:
| December 31, | ||||||||
| (in thousands) | 2018 | 2017 | ||||||
| Tenant improvement allowances |
$ | 2,125 | $ | 5,669 | ||||
F-86
Table of Contents
Payments made for work completed under tenant improvement allowances for the years ended December 31, 2018 and 2017 were as follows:
| For the years ended December 31, | ||||||||
| (in thousands) | 2018 | 2017 | ||||||
| Payments for tenant improvement allowances |
$ | 4,026 | $ | 6,598 | ||||
The Company is a party to three separate Tax Protection Agreements (Agreements) with the contributing members (Protected Members) of three distinct UPREIT transactions conducted in October 2017, February 2016, and November 2015. The Agreements require the Company to pay monetary damages in the event of a sale, exchange, transfer or other disposal of the contributed property in a taxable transaction that would cause a Protected Member to recognize a Protected Gain, as defined in the Agreements and subject to certain exceptions. In such an event, the Company will pay monetary damages to the Protected Members in the amount of the aggregate federal, state, and local income taxes incurred as a result of the income or gain allocated or recognized by the Protected Member as an outcome of the transaction, subject to certain caps and limitations contained in the Agreements. The Company is required to allocate to the Protected Members, an amount of nonrecourse liabilities that is at least equal to the Minimum Liability Amount for each Protected Member, as contained in the Agreements. The minimum liability amount and the associated allocation of nonrecourse liabilities are calculated in accordance with applicable tax regulations, are completed at the OP level, and do not represent GAAP accounting. Therefore, there is no impact to the Consolidated Financial Statements. If the nonrecourse liabilities allocated do not meet the requirement, the Company will pay monetary damages to the Protected Members in the amount of the aggregate federal, state, and local income taxes incurred as a result of the income or gain allocated or recognized by the Protected Member as an outcome to the default. The maximum aggregate amount the Company may be liable for under the Agreements is approximately $12,300. Based on information available, the Company does not believe that the events resulting in damages as detailed above have occurred.
Obligations Under Operating Leases
In connection with 2018 acquisitions, the Company leases land at certain properties under non-cancellable operating leases with initial lease terms ranging from 2025 to 2066. These leases contain provisions for fixed monthly rent payments, subject to rent escalations. One lease requires the Company to make annual rent payments calculated based upon sales generated at the property (“percentage rent”). For the year ended December 31, 2018, rent expense associated with these leases, included in Property and operating expense on the Consolidated Statements of Income and Comprehensive Income, amounted to $82, including $23 of percentage rent expense.
Minimum future rental payments due under non-cancelable operating leases at December 31, 2018 are as follows:
| (in thousands) | ||||
| 2019 |
$ | 118 | ||
| 2020 |
120 | |||
| 2021 |
122 | |||
| 2022 |
124 | |||
| 2023 |
125 | |||
| Thereafter |
2,540 | |||
|
|
|
|||
| $ | 3,149 | |||
|
|
|
|||
The above rental payments include future minimum lease payments due during the initial lease terms. Such amounts exclude any contingent amounts associated with percentage rent or changes in the Consumer Price Index.
F-87
Table of Contents
19. Subsequent Events
The Company has evaluated subsequent events through March 14, 2019, which is the date the Consolidated Financial Statements were available to be issued.
Through February 28, 2019, the most recent monthly equity closing, the Company has raised $49,800 for a total of 584 shares through monthly equity closings, including dividend reinvestments. Through February 15, 2019, the most recent distribution date, the Company has paid $20,338 in distributions, including dividend reinvestments.
On February 8, 2019, the Board of Directors declared monthly distributions of $0.44 per share of the Company’s common stock and OP Units of record through April 29, 2019. The distributions are payable on the 15th of the following month to stockholders and unit holders of record on the last day of the month. In addition, the Company’s IDC determined the share value for the Company’s common stock is $85 per share for subscription agreements received from February 1, 2019 through April 30, 2019.
Subsequent to December 31, 2018, the Company continued to expand its operations through the acquisition of additional rental property and associated intangible assets and liabilities. Through March 14, 2019, the Company acquired approximately $14,964 of rental property and associated intangible assets and liabilities (see Note 4). Through March 14, 2019 the Company sold four properties with an aggregate carrying value of $9,213 for total proceeds of $11,291. The Company incurred additional expenses related to the sales of approximately $629, resulting in a gain on sale of real estate of approximately $1,449.
Subsequent to December 31, 2018, the OP paid off borrowings on the Revolver in the aggregate amount of $40,000 and transferred the $15,000 outstanding swingline loan at December 31, 2018 to the Revolver. On January 18, 2019, the Company prepaid a mortgage in full in the amount of $1,745.
On January 10, 2019, the Company exercised its first of two options available under the terms of the 2015 Unsecured Term Loan Agreement (see Note 9), extending the maturity date of the loan through February 6, 2020, in exchange for the payment of a 0.10% fee.
On February 27, 2019, the Company entered into a $450,000 seven-year unsecured term loan agreement (the “2019 Unsecured Term Loan”) with Capital One, N.A. as administrative agent. The 2019 Unsecured Term Loan provides an accordion feature for up to a total of $550,000 borrowing capacity. The 2019 Unsecured Term Loan has an initial maturity date of February 27, 2026. Borrowings under the 2019 Unsecured Term Loan are subject to interest only payments at variable rates equal to LIBOR plus a margin based on the OP’s investment grade credit rating between 1.45% and 2.40% per annum. Based on the OP’s current credit rating of Baa3, the applicable margin under the 2019 Unsecured Term Loan is 1.85%. The 2019 Unsecured Term Loan is subject to a fee of 0.25% per annum on the amount of the commitment, reduced by the amount of term loans outstanding. At closing, $300,000 of the commitment was funded and used to repay the 2015 Unsecured Term Loan (see Note 9) in full. The remaining $150,000 commitment can be drawn in up to three requests through August 27, 2019.
On February 28, 2019, the Company amended the 2017 Unsecured Revolving Credit and Term Loan Agreement (see Note 9) to increase the amount available under the Revolver from $425,000 to $600,000. This increased the total available borrowings under the 2017 Unsecured Revolving Credit and Term Loan Agreement to $1,055,000. All other terms and conditions of the 2017 Unsecured Revolving Credit and Term Loan Agreement remain the same as those in effect prior to this amendment.
In connection with the 2019 Unsecured Term Loan and the amended 2017 Unsecured Revolving Credit and Term Loan Agreement, the Company paid approximately $5,100 in debt issuance costs. The Company is currently performing an analysis of these costs in accordance with ASU 470-50, Debt Modifications and Extinguishment, to determine the amount of costs to be deferred and amortized over the term of the associated debt and the amount of the costs, if any, that will be expensed as debt extinguishment.
F-88
Table of Contents
20. Selected Quarterly Results (unaudited)
Presented below is a summary of the Company’s unaudited quarterly financial information for the years ended December 31, 2018 and 2017:
| For the quarter ended | ||||||||||||||||
| (in thousands, except per share) | March 31, 2018 |
June 30, 2018 |
September 30, 2018 |
December 31, 2018 |
||||||||||||
| Total revenues |
$ | 55,589 | $ | 57,032 | $ | 61,764 | $ | 63,094 | ||||||||
| Net income |
$ | 18,995 | $ | 18,386 | $ | 23,064 | $ | 14,660 | ||||||||
| Net income attributable to non-controlling interests |
(1,422 | ) | (1,412 | ) | (1,797 | ) | (1,099 | ) | ||||||||
|
|
|
|
|
|
|
|
|
|||||||||
| Net income attributable to Broadstone Net Lease, Inc. |
$ | 17,573 | $ | 16,974 | $ | 21,267 | $ | 13,561 | ||||||||
|
|
|
|
|
|
|
|
|
|||||||||
| Net earnings per common share basic and diluted |
$ | 0.92 | $ | 0.86 | $ | 1.03 | $ | 0.63 | ||||||||
|
|
|
|
|
|
|
|
|
|||||||||
| Weighted average number of common shares outstanding |
||||||||||||||||
| Basic |
19,167 | 19,829 | 20,554 | 21,416 | ||||||||||||
|
|
|
|
|
|
|
|
|
|||||||||
| Diluted |
20,719 | 21,478 | 22,291 | 23,154 | ||||||||||||
|
|
|
|
|
|
|
|
|
|||||||||
| For the quarter ended | ||||||||||||||||
| (in thousands, except per share) | March 31, 2017 |
June 30, 2017 |
September 30, 2017 |
December 31, 2017 |
||||||||||||
| Total revenues |
$ | 42,185 | $ | 43,671 | $ | 46,235 | $ | 49,472 | ||||||||
| Net income |
$ | 13,747 | $ | 15,992 | $ | 12,990 | $ | 16,826 | ||||||||
| Net income attributable to non-controlling interests |
(1,153 | ) | (1,265 | ) | (1,042 | ) | (1,296 | ) | ||||||||
|
|
|
|
|
|
|
|
|
|||||||||
| Net income attributable to Broadstone Net Lease, Inc. |
$ | 12,594 | $ | 14,727 | $ | 11,948 | $ | 15,530 | ||||||||
|
|
|
|
|
|
|
|
|
|||||||||
| Net earnings per common share basic and diluted |
$ | 0.81 | $ | 0.89 | $ | 0.68 | $ | 0.84 | ||||||||
|
|
|
|
|
|
|
|
|
|||||||||
| Weighted average number of common shares outstanding |
||||||||||||||||
| Basic |
15,582 | 16,623 | 17,617 | 18,515 | ||||||||||||
|
|
|
|
|
|
|
|
|
|||||||||
| Diluted |
17,009 | 18,051 | 19,147 | 20,096 | ||||||||||||
|
|
|
|
|
|
|
|
|
|||||||||
F-89
Table of Contents
Broadstone Net Lease, Inc. and Subsidiaries
Schedule III—Real Estate Assets and Accumulated Depreciation
As of December 31, 2018
(in thousands)
| Initial Costs to Company (A) |
Costs Capitalized Subsequent to Acquisition |
Gross Amount at Which Carried at Close of Period |
Life on Which Depreciation is Computed (Years) |
|||||||||||||||||||||||||||||||||||||||||||||||
| City |
State | Encumbrance | Land | Buildings and Improvements |
Land | Improvements | Land | Buildings and Improvements |
Total (B) | Accumulated Depreciation |
Date of Construction |
Date Acquired |
||||||||||||||||||||||||||||||||||||||
| Retail Properties: |
||||||||||||||||||||||||||||||||||||||||||||||||||
| Augusta |
GA | $ | — | $ | 270 | $ | 1,108 | $ | — | $ | — | $ | 270 | $ | 1,108 | $ | 1,378 | $ | 374 | 1992 | 2007 | 15-39 | ||||||||||||||||||||||||||||
| Pensacola |
FL | — | 207 | 1,595 | — | — | 207 | 1,595 | 1,802 | 534 | 1998 | 2007 | 15-39 | |||||||||||||||||||||||||||||||||||||
| Jacksonville |
FL | — | 223 | 1,262 | — | — | 223 | 1,262 | 1,485 | 495 | 1987 | 2007 | 15-39 | |||||||||||||||||||||||||||||||||||||
| Emporia |
VA | — | 325 | 1,841 | — | — | 325 | 1,841 | 2,166 | 643 | 1993 | 2007 | 15-39 | |||||||||||||||||||||||||||||||||||||
| Sarasota |
FL | — | 553 | 3,131 | — | — | 553 | 3,131 | 3,684 | 953 | 1994 | 2008 | 15-39 | |||||||||||||||||||||||||||||||||||||
| Jacksonville |
FL | 1,459 | 673 | 2,691 | — | — | 673 | 2,691 | 3,364 | 767 | 1998 | 2009 | 15-39 | |||||||||||||||||||||||||||||||||||||
| Katy |
TX | — | 500 | 648 | — | — | 500 | 648 | 1,148 | 201 | 1997 | 2009 | 15-39 | |||||||||||||||||||||||||||||||||||||
| La Porte |
TX | — | 250 | 1,151 | — | — | 250 | 1,151 | 1,401 | 342 | 1996 | 2009 | 15-39 | |||||||||||||||||||||||||||||||||||||
| Rowlett |
TX | — | 350 | 776 | — | — | 350 | 776 | 1,126 | 247 | 1995 | 2009 | 15-39 | |||||||||||||||||||||||||||||||||||||
| Norman |
OK | — | 280 | 1,049 | — | — | 280 | 1,049 | 1,329 | 287 | 1991 | 2009 | 15-39 | |||||||||||||||||||||||||||||||||||||
| Oklahoma City |
OK | — | 540 | 517 | — | — | 540 | 517 | 1,057 | 185 | 2001 | 2009 | 15-39 | |||||||||||||||||||||||||||||||||||||
| Ashland City |
TN | — | 59 | 973 | — | — | 59 | 973 | 1,032 | 61 | 1992 | 2016 | 15-39 | |||||||||||||||||||||||||||||||||||||
| Cadiz |
KY | — | 77 | 1,048 | — | — | 77 | 1,048 | 1,125 | 68 | 1992 | 2016 | 15-39 | |||||||||||||||||||||||||||||||||||||
| Centerville |
TN | — | 68 | 965 | — | — | 68 | 965 | 1,033 | 65 | 2006 | 2016 | 15-39 | |||||||||||||||||||||||||||||||||||||
| Kingston Springs |
TN | — | 92 | 978 | — | — | 92 | 978 | 1,070 | 68 | 1998 | 2016 | 15-39 | |||||||||||||||||||||||||||||||||||||
| Mount Juliet |
TN | — | 76 | 995 | — | — | 76 | 995 | 1,071 | 66 | 1994 | 2016 | 15-39 | |||||||||||||||||||||||||||||||||||||
| White House |
TN | — | 105 | 927 | — | — | 105 | 927 | 1,032 | 66 | 2003 | 2016 | 15-39 | |||||||||||||||||||||||||||||||||||||
| Stillwater |
OK | — | 811 | 1,622 | — | — | 811 | 1,622 | 2,433 | 440 | 2008 | 2010 | 15-39 | |||||||||||||||||||||||||||||||||||||
| Mountain Home |
AR | — | 338 | 1,016 | — | — | 338 | 1,016 | 1,354 | 269 | 1988 | 2010 | 15-39 | |||||||||||||||||||||||||||||||||||||
| Batesville |
AR | — | 214 | 1,055 | — | — | 214 | 1,055 | 1,269 | 292 | 1988 | 2010 | 15-39 | |||||||||||||||||||||||||||||||||||||
| Paragould |
AR | — | 187 | 1,444 | — | — | 187 | 1,444 | 1,631 | 349 | 1990 | 2010 | 15-39 | |||||||||||||||||||||||||||||||||||||
| Forrest City |
AR | — | 84 | 941 | — | — | 84 | 941 | 1,025 | 261 | 1989 | 2010 | 15-39 | |||||||||||||||||||||||||||||||||||||
| Dyersburg |
TN | — | 276 | 1,250 | — | — | 276 | 1,250 | 1,526 | 315 | 1989 | 2010 | 15-39 | |||||||||||||||||||||||||||||||||||||
| Martin |
TN | — | 152 | 858 | — | — | 152 | 858 | 1,010 | 241 | 1999 | 2010 | 15-39 | |||||||||||||||||||||||||||||||||||||
| Union City |
TN | — | 72 | 806 | — | — | 72 | 806 | 878 | 217 | 1988 | 2010 | 15-39 | |||||||||||||||||||||||||||||||||||||
| Highland Heights |
KY | — | 850 | 1,984 | — | — | 850 | 1,984 | 2,834 | 469 | 1985 | 2010 | 15-39 | |||||||||||||||||||||||||||||||||||||
| Somerset |
NJ | — | 912 | 2,735 | — | — | 912 | 2,735 | 3,647 | 637 | 1992 | 2011 | 15-39 | |||||||||||||||||||||||||||||||||||||
| Inver Grove Heights |
MN | — | 592 | 1,777 | — | — | 592 | 1,777 | 2,369 | 436 | 1997 | 2011 | 15-39 | |||||||||||||||||||||||||||||||||||||
| Mankato |
MN | — | 712 | 2,136 | — | — | 712 | 2,136 | 2,848 | 498 | 1994 | 2011 | 15-39 | |||||||||||||||||||||||||||||||||||||
| Saint Paul |
MN | — | 606 | 1,817 | — | — | 606 | 1,817 | 2,423 | 448 | 1994 | 2011 | 15-39 | |||||||||||||||||||||||||||||||||||||
| Jackson |
TN | — | 204 | 1,154 | — | — | 204 | 1,154 | 1,358 | 253 | 1999 | 2011 | 15-39 | |||||||||||||||||||||||||||||||||||||
| Henderson |
TN | — | 141 | 800 | — | — | 141 | 800 | 941 | 167 | 1986 | 2012 | 15-39 | |||||||||||||||||||||||||||||||||||||
F-90
Table of Contents
| Initial Costs to Company (A) |
Costs Capitalized Subsequent to Acquisition |
Gross Amount at Which Carried at Close of Period |
Life on Which Depreciation is Computed (Years) |
|||||||||||||||||||||||||||||||||||||||||||||||
| City |
State | Encumbrance | Land | Buildings and Improvements |
Land | Improvements | Land | Buildings and Improvements |
Total (B) | Accumulated Depreciation |
Date of Construction |
Date Acquired |
||||||||||||||||||||||||||||||||||||||
| Lexington |
TN | — | 150 | 848 | — | — | 150 | 848 | 998 | 179 | 1995 | 2012 | 15-39 | |||||||||||||||||||||||||||||||||||||
| Humboldt |
TN | — | 118 | 669 | — | — | 118 | 669 | 787 | 157 | 1993 | 2012 | 15-39 | |||||||||||||||||||||||||||||||||||||
| Cocoa Beach |
FL | — | 283 | 848 | — | — | 283 | 848 | 1,131 | 174 | 1992 | 2012 | 15-39 | |||||||||||||||||||||||||||||||||||||
| Lake Mary |
FL | — | 422 | 1,265 | — | — | 422 | 1,265 | 1,687 | 243 | 1989 | 2012 | 15-39 | |||||||||||||||||||||||||||||||||||||
| New Smyrna Beach |
FL | — | 382 | 1,146 | — | — | 382 | 1,146 | 1,528 | 273 | 2008 | 2012 | 15-39 | |||||||||||||||||||||||||||||||||||||
| Orlando |
FL | — | 351 | 1,052 | — | — | 351 | 1,052 | 1,403 | 213 | 1990 | 2012 | 15-39 | |||||||||||||||||||||||||||||||||||||
| Orlando |
FL | — | 219 | 656 | — | — | 219 | 656 | 875 | 153 | 1996 | 2012 | 15-39 | |||||||||||||||||||||||||||||||||||||
| Savannah |
GA | — | 390 | 1,170 | — | — | 390 | 1,170 | 1,560 | 241 | 2009 | 2012 | 15-39 | |||||||||||||||||||||||||||||||||||||
| Savannah |
GA | — | 376 | 1,129 | — | — | 376 | 1,129 | 1,505 | 226 | 2009 | 2012 | 15-39 | |||||||||||||||||||||||||||||||||||||
| Oakwood |
GA | — | 400 | 1,199 | — | — | 400 | 1,199 | 1,599 | 244 | 2008 | 2012 | 15-39 | |||||||||||||||||||||||||||||||||||||
| Hinesville |
GA | — | 402 | 1,207 | — | — | 402 | 1,207 | 1,609 | 262 | 2008 | 2012 | 15-39 | |||||||||||||||||||||||||||||||||||||
| Princeton |
WV | — | 269 | 1,524 | — | — | 269 | 1,524 | 1,793 | 285 | 1976 | 2012 | 15-39 | |||||||||||||||||||||||||||||||||||||
| Princeton |
WV | — | 301 | 1,703 | — | — | 301 | 1,703 | 2,004 | 317 | 1991 | 2012 | 15-39 | |||||||||||||||||||||||||||||||||||||
| Marietta |
OH | — | 246 | 1,395 | — | — | 246 | 1,395 | 1,641 | 253 | 2007 | 2012 | 15-39 | |||||||||||||||||||||||||||||||||||||
| Pomeroy |
OH | — | 208 | 1,178 | — | — | 208 | 1,178 | 1,386 | 232 | 1997 | 2012 | 15-39 | |||||||||||||||||||||||||||||||||||||
| Elkins |
WV | — | 452 | 1,355 | — | — | 452 | 1,355 | 1,807 | 252 | 1980 | 2012 | 15-39 | |||||||||||||||||||||||||||||||||||||
| State College |
PA | — | 365 | 1,461 | — | — | 365 | 1,461 | 1,826 | 262 | 1976 | 2012 | 15-39 | |||||||||||||||||||||||||||||||||||||
| Summerville |
WV | — | 109 | 2,366 | — | — | 109 | 2,366 | 2,475 | 125 | 1993 | 2017 | 15-39 | |||||||||||||||||||||||||||||||||||||
| Oxford |
AL | — | 240 | 958 | — | — | 240 | 958 | 1,198 | 186 | 1999 | 2012 | 15-39 | |||||||||||||||||||||||||||||||||||||
| Oxford |
AL | — | 320 | 158 | — | 1,100 | 320 | 1,258 | 1,578 | 96 | 2009 | 2012 | 15-39 | |||||||||||||||||||||||||||||||||||||
| Pell City |
AL | — | 237 | 1,340 | — | — | 237 | 1,340 | 1,577 | 238 | 2002 | 2012 | 15-39 | |||||||||||||||||||||||||||||||||||||
| Tuscaloosa |
AL | — | 449 | 1,796 | — | — | 449 | 1,796 | 2,245 | 321 | 2010 | 2012 | 15-39 | |||||||||||||||||||||||||||||||||||||
| Jacksonville |
AL | — | 190 | 1,077 | — | — | 190 | 1,077 | 1,267 | 202 | 2000 | 2012 | 15-39 | |||||||||||||||||||||||||||||||||||||
| Tuscaloosa |
AL | — | 422 | 1,686 | — | — | 422 | 1,686 | 2,108 | 314 | 2001 | 2012 | 15-39 | |||||||||||||||||||||||||||||||||||||
| Tampa |
FL | — | 208 | 1,179 | — | — | 208 | 1,179 | 1,387 | 208 | 1980 | 2012 | 15-39 | |||||||||||||||||||||||||||||||||||||
| Tampa |
FL | — | 288 | 1,634 | — | — | 288 | 1,634 | 1,922 | 298 | 1987 | 2012 | 15-39 | |||||||||||||||||||||||||||||||||||||
| Richmond |
VA | — | 202 | 1,147 | — | — | 202 | 1,147 | 1,349 | 212 | 1984 | 2012 | 15-39 | |||||||||||||||||||||||||||||||||||||
| Exton |
PA | — | 470 | 1,882 | — | — | 470 | 1,882 | 2,352 | 357 | 1982 | 2012 | 15-39 | |||||||||||||||||||||||||||||||||||||
| Richmond |
VA | — | 133 | 755 | — | — | 133 | 755 | 888 | 154 | 1981 | 2012 | 15-39 | |||||||||||||||||||||||||||||||||||||
| Paoli |
PA | — | 360 | 1,440 | — | — | 360 | 1,440 | 1,800 | 256 | 1982 | 2012 | 15-39 | |||||||||||||||||||||||||||||||||||||
| Seffner |
FL | — | 127 | 1,910 | — | — | 127 | 1,910 | 2,037 | 285 | 1992 | 2013 | 15-39 | |||||||||||||||||||||||||||||||||||||
| Bradenton |
FL | — | 277 | 1,621 | — | — | 277 | 1,621 | 1,898 | 249 | 1996 | 2013 | 15-39 | |||||||||||||||||||||||||||||||||||||
| Zephyrhills |
FL | — | 127 | 1,696 | — | — | 127 | 1,696 | 1,823 | 262 | 1992 | 2013 | 15-39 | |||||||||||||||||||||||||||||||||||||
| Saint Petersburg |
FL | — | 233 | 1,440 | — | — | 233 | 1,440 | 1,673 | 218 | 1988 | 2013 | 15-39 | |||||||||||||||||||||||||||||||||||||
| Tampa |
FL | — | 189 | 1,234 | — | — | 189 | 1,234 | 1,423 | 200 | 1996 | 2013 | 15-39 | |||||||||||||||||||||||||||||||||||||
| Dade City |
FL | — | 163 | 802 | — | — | 163 | 802 | 965 | 140 | 2008 | 2013 | 15-39 | |||||||||||||||||||||||||||||||||||||
| White Marsh |
MD | — | 3,223 | 200 | — | — | 3,223 | 200 | 3,423 | 47 | 1986 | 2013 | 15-39 | |||||||||||||||||||||||||||||||||||||
| Manassas |
VA | — | 1,187 | 197 | — | — | 1,187 | 197 | 1,384 | 39 | 1986 | 2013 | 15-39 | |||||||||||||||||||||||||||||||||||||
| Morrisville |
NC | — | 235 | 46 | — | — | 235 | 46 | 281 | 12 | 1960 | 2013 | 15-39 | |||||||||||||||||||||||||||||||||||||
F-91
Table of Contents
| Initial Costs to Company (A) |
Costs Capitalized Subsequent to Acquisition |
Gross Amount at Which Carried at Close of Period |
Life on Which Depreciation is Computed (Years) |
|||||||||||||||||||||||||||||||||||||||||||||||
| City |
State | Encumbrance | Land | Buildings and Improvements |
Land | Improvements | Land | Buildings and Improvements |
Total (B) | Accumulated Depreciation |
Date of Construction |
Date Acquired |
||||||||||||||||||||||||||||||||||||||
| Aston |
PA | — | 2,554 | 126 | — | — | 2,554 | 126 | 2,680 | 28 | 1984 | 2013 | 15-39 | |||||||||||||||||||||||||||||||||||||
| Cincinnati |
OH | — | 1,001 | 173 | — | — | 1,001 | 173 | 1,174 | 47 | 1976 | 2013 | 15-39 | |||||||||||||||||||||||||||||||||||||
| Columbus |
OH | — | 757 | 77 | — | — | 757 | 77 | 834 | 17 | 1981 | 2013 | 15-39 | |||||||||||||||||||||||||||||||||||||
| Windsor |
CT | — | 1,887 | 204 | — | — | 1,887 | 204 | 2,091 | 56 | 1986 | 2013 | 15-39 | |||||||||||||||||||||||||||||||||||||
| Pittsburgh |
PA | — | 1,691 | 244 | — | — | 1,691 | 244 | 1,935 | 56 | 1989 | 2013 | 15-39 | |||||||||||||||||||||||||||||||||||||
| Palmdale |
CA | — | 995 | 2,811 | — | — | 995 | 2,811 | 3,806 | 572 | 1991 | 2013 | 15-39 | |||||||||||||||||||||||||||||||||||||
| Palmdale |
CA | — | 670 | 1,610 | — | — | 670 | 1,610 | 2,280 | 350 | 2006 | 2013 | 15-39 | |||||||||||||||||||||||||||||||||||||
| Palmdale |
CA | — | 987 | 3,817 | — | — | 987 | 3,817 | 4,804 | 696 | 1991 | 2013 | 15-39 | |||||||||||||||||||||||||||||||||||||
| Alamogordo |
NM | — | 22 | 2,117 | — | — | 22 | 2,117 | 2,139 | 292 | 1983 | 2014 | 15-39 | |||||||||||||||||||||||||||||||||||||
| Roswell |
NM | — | 64 | 2,059 | — | — | 64 | 2,059 | 2,123 | 275 | 1990 | 2014 | 15-39 | |||||||||||||||||||||||||||||||||||||
| Moore |
OK | — | 64 | 1,249 | — | — | 64 | 1,249 | 1,313 | 179 | 1975 | 2014 | 15-39 | |||||||||||||||||||||||||||||||||||||
| Del City |
OK | — | 40 | 1,370 | — | — | 40 | 1,370 | 1,410 | 188 | 1980 | 2014 | 15-39 | |||||||||||||||||||||||||||||||||||||
| Oklahoma City |
OK | — | 105 | 1,150 | — | — | 105 | 1,150 | 1,255 | 157 | 1977 | 2014 | 15-39 | |||||||||||||||||||||||||||||||||||||
| Oklahoma City |
OK | — | 721 | 1,049 | — | — | 721 | 1,049 | 1,770 | 163 | 2003 | 2014 | 15-39 | |||||||||||||||||||||||||||||||||||||
| Mustang |
OK | — | 70 | 1,722 | — | — | 70 | 1,722 | 1,792 | 239 | 2004 | 2014 | 15-39 | |||||||||||||||||||||||||||||||||||||
| Yukon |
OK | — | 63 | 1,851 | — | — | 63 | 1,851 | 1,914 | 262 | 1994 | 2014 | 15-39 | |||||||||||||||||||||||||||||||||||||
| Fort Worth |
TX | — | 487 | 934 | — | — | 487 | 934 | 1,421 | 133 | 2003 | 2014 | 15-39 | |||||||||||||||||||||||||||||||||||||
| Kearney |
NE | — | 113 | 1,242 | — | — | 113 | 1,242 | 1,355 | 177 | 1982 | 2014 | 15-39 | |||||||||||||||||||||||||||||||||||||
| Kearney |
NE | — | 176 | 1,238 | — | — | 176 | 1,238 | 1,414 | 182 | 1991 | 2014 | 15-39 | |||||||||||||||||||||||||||||||||||||
| Grand Island |
NE | — | 425 | — | — | — | 425 | — | 425 | — | 1992 | 2014 | — | |||||||||||||||||||||||||||||||||||||
| Ogallala |
NE | — | 291 | 1,243 | — | — | 291 | 1,243 | 1,534 | 194 | 1986 | 2014 | 15-39 | |||||||||||||||||||||||||||||||||||||
| McAlester |
OK | — | 52 | 1,521 | — | — | 52 | 1,521 | 1,573 | 217 | 2006 | 2014 | 15-39 | |||||||||||||||||||||||||||||||||||||
| Oklahoma City |
OK | — | 466 | 928 | — | — | 466 | 928 | 1,394 | 106 | 1970 | 2015 | 15-39 | |||||||||||||||||||||||||||||||||||||
| Laredo |
TX | — | 425 | 2,476 | — | — | 425 | 2,476 | 2,901 | 330 | 2001 | 2014 | 15-39 | |||||||||||||||||||||||||||||||||||||
| Mt. Pleasant |
TX | — | 1,141 | 997 | — | — | 1,141 | 997 | 2,138 | 208 | 1972 | 2014 | 15-39 | |||||||||||||||||||||||||||||||||||||
| Madill |
OK | — | 739 | 714 | — | — | 739 | 714 | 1,453 | 89 | 1993 | 2014 | 15-39 | |||||||||||||||||||||||||||||||||||||
| Fort Worth |
TX | — | 1,142 | 554 | — | — | 1,142 | 554 | 1,696 | 88 | 1980 | 2014 | 15-39 | |||||||||||||||||||||||||||||||||||||
| Dallas |
TX | — | 454 | 449 | — | — | 454 | 449 | 903 | 81 | 1984 | 2014 | 15-39 | |||||||||||||||||||||||||||||||||||||
| Wichita Falls |
TX | — | 674 | 186 | — | — | 674 | 186 | 860 | 33 | 1995 | 2014 | 15-39 | |||||||||||||||||||||||||||||||||||||
| Lytle |
TX | — | 97 | 815 | — | — | 97 | 815 | 912 | 100 | 2008 | 2015 | 15-39 | |||||||||||||||||||||||||||||||||||||
| New Caney |
TX | — | 37 | 875 | — | — | 37 | 875 | 912 | 96 | 1972 | 2015 | 15-39 | |||||||||||||||||||||||||||||||||||||
| St. George |
UT | — | 362 | 2,447 | (80 | ) | (539 | ) | 282 | 1,908 | 2,190 | 229 | 2000 | 2015 | 15-39 | |||||||||||||||||||||||||||||||||||
| Tooele |
UT | — | 389 | 1,945 | (45 | ) | (223 | ) | 344 | 1,722 | 2,066 | 203 | 2000 | 2015 | 15-39 | |||||||||||||||||||||||||||||||||||
| Cedar City |
UT | — | 333 | 2,544 | (4 | ) | (31 | ) | 329 | 2,513 | 2,842 | 311 | 2000 | 2015 | 15-39 | |||||||||||||||||||||||||||||||||||
| West Valley City |
UT | — | 326 | 2,222 | (22 | ) | (152 | ) | 304 | 2,070 | 2,374 | 236 | 1998 | 2015 | 15-39 | |||||||||||||||||||||||||||||||||||
| Renton |
WA | — | 539 | 1,141 | — | — | 539 | 1,141 | 1,680 | 128 | 1986 | 2015 | 15-39 | |||||||||||||||||||||||||||||||||||||
| Tacoma |
WA | — | 807 | 643 | — | — | 807 | 643 | 1,450 | 91 | 1991 | 2015 | 15-39 | |||||||||||||||||||||||||||||||||||||
| Tacoma |
WA | — | 562 | 897 | — | — | 562 | 897 | 1,459 | 105 | 1993 | 2015 | 15-39 | |||||||||||||||||||||||||||||||||||||
| Tukwila |
WA | — | 1,170 | 419 | — | — | 1,170 | 419 | 1,589 | 92 | 1993 | 2015 | 15-39 | |||||||||||||||||||||||||||||||||||||
| Federal Way |
WA | — | 334 | 1,088 | — | — | 334 | 1,088 | 1,422 | 111 | 1995 | 2015 | 15-39 | |||||||||||||||||||||||||||||||||||||
F-92
Table of Contents
| Initial Costs to Company (A) |
Costs Capitalized Subsequent to Acquisition |
Gross Amount at Which Carried at Close of Period |
Life on Which Depreciation is Computed (Years) |
|||||||||||||||||||||||||||||||||||||||||||||||
| City |
State | Encumbrance | Land | Buildings and Improvements |
Land | Improvements | Land | Buildings and Improvements |
Total (B) | Accumulated Depreciation |
Date of Construction |
Date Acquired |
||||||||||||||||||||||||||||||||||||||
| Lakewood |
WA | — | 1,372 | 878 | — | — | 1,372 | 878 | 2,250 | 120 | 1995 | 2015 | 15-39 | |||||||||||||||||||||||||||||||||||||
| Burlington |
WA | — | 178 | 1,982 | — | — | 178 | 1,982 | 2,160 | 204 | 2000 | 2015 | 15-39 | |||||||||||||||||||||||||||||||||||||
| Everett |
WA | — | 175 | 1,473 | — | — | 175 | 1,473 | 1,648 | 163 | 1986 | 2015 | 15-39 | |||||||||||||||||||||||||||||||||||||
| Puyallup |
WA | — | 622 | — | — | — | 622 | — | 622 | — | 1994 | 2015 | — | |||||||||||||||||||||||||||||||||||||
| Aberdeen |
WA | — | 218 | 1,446 | — | — | 218 | 1,446 | 1,664 | 150 | 2006 | 2015 | 15-39 | |||||||||||||||||||||||||||||||||||||
| Florence |
AL | — | 337 | 2,609 | — | — | 337 | 2,609 | 2,946 | 267 | 2011 | 2015 | 15-39 | |||||||||||||||||||||||||||||||||||||
| Decatur |
AL | — | 364 | 3,708 | — | — | 364 | 3,708 | 4,072 | 375 | 2014 | 2015 | 15-39 | |||||||||||||||||||||||||||||||||||||
| Tupelo |
MS | — | 297 | 3,030 | — | — | 297 | 3,030 | 3,327 | 300 | 2012 | 2015 | 15-39 | |||||||||||||||||||||||||||||||||||||
| Russellville |
AR | — | 250 | 3,354 | (54 | ) | (725 | ) | 196 | 2,629 | 2,825 | 268 | 2014 | 2015 | 15-39 | |||||||||||||||||||||||||||||||||||
| Adamsville |
TN | — | 59 | 1,675 | — | — | 59 | 1,675 | 1,734 | 158 | 2005 | 2015 | 15-39 | |||||||||||||||||||||||||||||||||||||
| Adamsville |
AL | — | 123 | 1,924 | — | — | 123 | 1,924 | 2,047 | 191 | 1989 | 2015 | 15-39 | |||||||||||||||||||||||||||||||||||||
| Alexandria |
AL | — | 79 | 2,318 | — | — | 79 | 2,318 | 2,397 | 214 | 2004 | 2015 | 15-39 | |||||||||||||||||||||||||||||||||||||
| Ashville |
AL | — | 124 | 1,696 | — | — | 124 | 1,696 | 1,820 | 156 | 1999 | 2015 | 15-39 | |||||||||||||||||||||||||||||||||||||
| Athens |
AL | — | 143 | 1,996 | — | — | 143 | 1,996 | 2,139 | 184 | 2007 | 2015 | 15-39 | |||||||||||||||||||||||||||||||||||||
| Carbon Hill |
AL | — | 54 | 1,634 | — | — | 54 | 1,634 | 1,688 | 154 | 1998 | 2015 | 15-39 | |||||||||||||||||||||||||||||||||||||
| Carrollton |
GA | — | 77 | 2,030 | — | — | 77 | 2,030 | 2,107 | 187 | 2008 | 2015 | 15-39 | |||||||||||||||||||||||||||||||||||||
| Centreville |
AL | — | 140 | 2,251 | — | — | 140 | 2,251 | 2,391 | 200 | 2013 | 2015 | 15-39 | |||||||||||||||||||||||||||||||||||||
| Gadsden |
AL | — | 42 | 2,571 | — | — | 42 | 2,571 | 2,613 | 230 | 1991 | 2015 | 15-39 | |||||||||||||||||||||||||||||||||||||
| Cullman |
AL | — | 71 | 1,799 | — | — | 71 | 1,799 | 1,870 | 164 | 1997 | 2015 | 15-39 | |||||||||||||||||||||||||||||||||||||
| Cullman |
AL | — | 79 | 1,949 | — | — | 79 | 1,949 | 2,028 | 185 | 2006 | 2015 | 15-39 | |||||||||||||||||||||||||||||||||||||
| Dora |
AL | — | 18 | — | — | 2,095 | 18 | 2,095 | 2,113 | — | 1968 | 2015 | 15-39 | |||||||||||||||||||||||||||||||||||||
| Double Springs |
AL | — | 306 | 1,752 | — | — | 306 | 1,752 | 2,058 | 168 | 1995 | 2015 | 15-39 | |||||||||||||||||||||||||||||||||||||
| Moulton |
AL | — | 117 | 1,752 | — | — | 117 | 1,752 | 1,869 | 169 | 2003 | 2015 | 15-39 | |||||||||||||||||||||||||||||||||||||
| Guntersville |
AL | — | 382 | 2,020 | — | — | 382 | 2,020 | 2,402 | 197 | 2015 | 2015 | 15-39 | |||||||||||||||||||||||||||||||||||||
| Harpersville |
AL | — | 48 | 2,645 | — | — | 48 | 2,645 | 2,693 | 230 | 1995 | 2015 | 15-39 | |||||||||||||||||||||||||||||||||||||
| Harvest |
AL | — | 163 | 2,060 | — | — | 163 | 2,060 | 2,223 | 194 | 2014 | 2015 | 15-39 | |||||||||||||||||||||||||||||||||||||
| Henderson |
TN | — | 111 | 1,608 | — | — | 111 | 1,608 | 1,719 | 173 | 1987 | 2015 | 15-39 | |||||||||||||||||||||||||||||||||||||
| Madison |
AL | — | 209 | 1,958 | — | — | 209 | 1,958 | 2,167 | 190 | 2011 | 2015 | 15-39 | |||||||||||||||||||||||||||||||||||||
| Lawrenceburg |
TN | — | 117 | 1,832 | — | — | 117 | 1,832 | 1,949 | 215 | 2014 | 2015 | 15-39 | |||||||||||||||||||||||||||||||||||||
| Montevallo |
AL | — | 60 | 2,203 | — | — | 60 | 2,203 | 2,263 | 202 | 2009 | 2015 | 15-39 | |||||||||||||||||||||||||||||||||||||
| Muscle Shoals |
AL | — | 44 | — | — | 1,867 | 44 | 1,867 | 1,911 | — | 1984 | 2015 | 15-39 | |||||||||||||||||||||||||||||||||||||
| Odenville |
AL | — | 100 | 1,652 | — | — | 100 | 1,652 | 1,752 | 169 | 2000 | 2015 | 15-39 | |||||||||||||||||||||||||||||||||||||
| Piedmont |
AL | — | 33 | 1,934 | — | — | 33 | 1,934 | 1,967 | 170 | 1981 | 2015 | 15-39 | |||||||||||||||||||||||||||||||||||||
| Reform |
AL | — | 201 | 1,979 | — | — | 201 | 1,979 | 2,180 | 205 | 1992 | 2015 | 15-39 | |||||||||||||||||||||||||||||||||||||
| Roanoke |
AL | — | 83 | 1,625 | — | — | 83 | 1,625 | 1,708 | 149 | 2006 | 2015 | 15-39 | |||||||||||||||||||||||||||||||||||||
| Savannah |
TN | — | 62 | 1,693 | — | — | 62 | 1,693 | 1,755 | 165 | 2012 | 2015 | 15-39 | |||||||||||||||||||||||||||||||||||||
| Sheffield |
AL | — | 43 | 1,730 | — | — | 43 | 1,730 | 1,773 | 150 | 1967 | 2015 | 15-39 | |||||||||||||||||||||||||||||||||||||
| Somerville |
AL | — | 28 | 1,758 | — | — | 28 | 1,758 | 1,786 | 182 | 2001 | 2015 | 15-39 | |||||||||||||||||||||||||||||||||||||
| Springville |
AL | — | 31 | 1,994 | — | — | 31 | 1,994 | 2,025 | 176 | 1993 | 2015 | 15-39 | |||||||||||||||||||||||||||||||||||||
| Stevenson |
AL | — | 306 | 1,862 | — | — | 306 | 1,862 | 2,168 | 170 | 1985 | 2015 | 15-39 | |||||||||||||||||||||||||||||||||||||
F-93
Table of Contents
| Initial Costs to Company (A) |
Costs Capitalized Subsequent to Acquisition |
Gross Amount at Which Carried at Close of Period |
Life on Which Depreciation is Computed (Years) |
|||||||||||||||||||||||||||||||||||||||||||||||
| City |
State | Encumbrance | Land | Buildings and Improvements |
Land | Improvements | Land | Buildings and Improvements |
Total (B) | Accumulated Depreciation |
Date of Construction |
Date Acquired |
||||||||||||||||||||||||||||||||||||||
| Trussville |
AL | — | 34 | 2,039 | — | — | 34 | 2,039 | 2,073 | 178 | 1992 | 2015 | 15-39 | |||||||||||||||||||||||||||||||||||||
| Tuscumbia |
AL | — | 117 | 1,831 | — | — | 117 | 1,831 | 1,948 | 179 | 2004 | 2015 | 15-39 | |||||||||||||||||||||||||||||||||||||
| Wedowee |
AL | — | 92 | 1,454 | — | — | 92 | 1,454 | 1,546 | 129 | 2002 | 2015 | 15-39 | |||||||||||||||||||||||||||||||||||||
| Huntsville |
AL | — | 133 | 2,029 | — | — | 133 | 2,029 | 2,162 | 184 | 2010 | 2015 | 15-39 | |||||||||||||||||||||||||||||||||||||
| Ashwaubenon |
WI | — | 86 | 2,008 | — | — | 86 | 2,008 | 2,094 | 186 | 1994 | 2015 | 15-39 | |||||||||||||||||||||||||||||||||||||
| Oshkosh |
WI | — | 145 | 1,795 | — | — | 145 | 1,795 | 1,940 | 175 | 1996 | 2015 | 15-39 | |||||||||||||||||||||||||||||||||||||
| Green Bay |
WI | — | 106 | 1,713 | — | — | 106 | 1,713 | 1,819 | 165 | 1996 | 2015 | 15-39 | |||||||||||||||||||||||||||||||||||||
| West Bend |
WI | — | 113 | 1,704 | — | — | 113 | 1,704 | 1,817 | 163 | 1996 | 2015 | 15-39 | |||||||||||||||||||||||||||||||||||||
| Appleton |
WI | — | 96 | 1,637 | — | — | 96 | 1,637 | 1,733 | 157 | 1996 | 2015 | 15-39 | |||||||||||||||||||||||||||||||||||||
| Appleton |
WI | — | 95 | 2,478 | — | — | 95 | 2,478 | 2,573 | 225 | 1976 | 2015 | 15-39 | |||||||||||||||||||||||||||||||||||||
| Manitowoc |
WI | — | 106 | 1,714 | — | — | 106 | 1,714 | 1,820 | 166 | 1996 | 2015 | 15-39 | |||||||||||||||||||||||||||||||||||||
| Eau Claire |
WI | — | 137 | 2,245 | — | — | 137 | 2,245 | 2,382 | 219 | 1994 | 2015 | 15-39 | |||||||||||||||||||||||||||||||||||||
| Dover |
DE | — | 211 | 3,455 | — | — | 211 | 3,455 | 3,666 | 307 | 1991 | 2015 | 15-39 | |||||||||||||||||||||||||||||||||||||
| Norman |
OK | — | 232 | 3,733 | — | — | 232 | 3,733 | 3,965 | 334 | 1982 | 2015 | 15-39 | |||||||||||||||||||||||||||||||||||||
| Knoxville |
TN | — | 151 | 2,775 | — | — | 151 | 2,775 | 2,926 | 267 | 1978 | 2015 | 15-39 | |||||||||||||||||||||||||||||||||||||
| Wichita |
KS | — | 468 | 3,475 | — | — | 468 | 3,475 | 3,943 | 311 | 1982 | 2015 | 15-39 | |||||||||||||||||||||||||||||||||||||
| Las Cruces |
NM | — | 108 | 4,069 | — | — | 108 | 4,069 | 4,177 | 369 | 1991 | 2015 | 15-39 | |||||||||||||||||||||||||||||||||||||
| Lee’s Summit |
MO | — | 132 | 3,447 | — | — | 132 | 3,447 | 3,579 | 324 | 2010 | 2015 | 15-39 | |||||||||||||||||||||||||||||||||||||
| Gadsden |
AL | — | 219 | 2,915 | — | — | 219 | 2,915 | 3,134 | 266 | 1981 | 2015 | 15-39 | |||||||||||||||||||||||||||||||||||||
| Murfreesboro |
TN | — | 247 | 2,747 | — | — | 247 | 2,747 | 2,994 | 266 | 1987 | 2015 | 15-39 | |||||||||||||||||||||||||||||||||||||
| Macon |
GA | — | 258 | 3,235 | — | — | 258 | 3,235 | 3,493 | 287 | 1972 | 2015 | 15-39 | |||||||||||||||||||||||||||||||||||||
| Lexington |
KY | — | 1,258 | — | — | — | 1,258 | — | 1,258 | — | 1976 | 2015 | — | |||||||||||||||||||||||||||||||||||||
| Joliet |
IL | — | 686 | 3,072 | — | — | 686 | 3,072 | 3,758 | 298 | 1991 | 2015 | 15-39 | |||||||||||||||||||||||||||||||||||||
| Wheat Ridge |
CO | — | 451 | 3,614 | — | — | 451 | 3,614 | 4,065 | 317 | 1974 | 2015 | 15-39 | |||||||||||||||||||||||||||||||||||||
| Tulsa |
OK | — | 125 | 3,846 | — | — | 125 | 3,846 | 3,971 | 338 | 1987 | 2015 | 15-39 | |||||||||||||||||||||||||||||||||||||
| Oakdale |
MN | — | 197 | 3,455 | — | — | 197 | 3,455 | 3,652 | 303 | 2006 | 2015 | 15-39 | |||||||||||||||||||||||||||||||||||||
| Pineville |
NC | — | 74 | 3,587 | — | — | 74 | 3,587 | 3,661 | 325 | 1991 | 2015 | 15-39 | |||||||||||||||||||||||||||||||||||||
| Albuquerque |
NM | — | 196 | 3,389 | — | — | 196 | 3,389 | 3,585 | 311 | 2002 | 2015 | 15-39 | |||||||||||||||||||||||||||||||||||||
| Maple Grove |
MN | — | 243 | 3,253 | — | — | 243 | 3,253 | 3,496 | 296 | 2001 | 2015 | 15-39 | |||||||||||||||||||||||||||||||||||||
| Madison |
TN | — | 97 | 4,617 | — | — | 97 | 4,617 | 4,714 | 341 | 1972 | 2016 | 15-39 | |||||||||||||||||||||||||||||||||||||
| Florence |
KY | — | 61 | 4,687 | — | — | 61 | 4,687 | 4,748 | 350 | 1977 | 2016 | 15-39 | |||||||||||||||||||||||||||||||||||||
| Maplewood |
MN | — | 315 | 1,551 | — | — | 315 | 1,551 | 1,866 | 154 | 1983 | 2016 | 15-39 | |||||||||||||||||||||||||||||||||||||
| Santa Fe |
NM | — | 121 | 2,979 | — | — | 121 | 2,979 | 3,100 | 219 | 1990 | 2016 | 15-39 | |||||||||||||||||||||||||||||||||||||
| Memphis |
TN | — | 103 | 3,327 | — | — | 103 | 3,327 | 3,430 | 260 | 2008 | 2016 | 15-39 | |||||||||||||||||||||||||||||||||||||
| Jonesboro |
AR | — | 324 | 3,383 | — | — | 324 | 3,383 | 3,707 | 259 | 2011 | 2016 | 15-39 | |||||||||||||||||||||||||||||||||||||
| Lafayette |
IN | — | 285 | 3,436 | — | — | 285 | 3,436 | 3,721 | 263 | 2012 | 2016 | 15-39 | |||||||||||||||||||||||||||||||||||||
| Bridgeport |
WV | — | 88 | 4,074 | — | — | 88 | 4,074 | 4,162 | 334 | 2007 | 2016 | 15-39 | |||||||||||||||||||||||||||||||||||||
| St. Mary’s |
OH | — | 56 | 3,997 | — | — | 56 | 3,997 | 4,053 | 335 | 2011 | 2016 | 15-39 | |||||||||||||||||||||||||||||||||||||
| Lima |
OH | — | 69 | 3,813 | — | — | 69 | 3,813 | 3,882 | 317 | 2009 | 2016 | 15-39 | |||||||||||||||||||||||||||||||||||||
| Sterling |
VA | 18,260 | 24,395 | — | — | — | 24,395 | — | 24,395 | — | 2004 | 2016 | — | |||||||||||||||||||||||||||||||||||||
F-94
Table of Contents
| Initial Costs to Company (A) |
Costs Capitalized Subsequent to Acquisition |
Gross Amount at Which Carried at Close of Period |
Life on Which Depreciation is Computed (Years) |
|||||||||||||||||||||||||||||||||||||||||||||||
| City |
State | Encumbrance | Land | Buildings and Improvements |
Land | Improvements | Land | Buildings and Improvements |
Total (B) | Accumulated Depreciation |
Date of Construction |
Date Acquired |
||||||||||||||||||||||||||||||||||||||
| Round Rock |
TX | — | 769 | 4,176 | — | — | 769 | 4,176 | 4,945 | 304 | 1984 | 2016 | 15-39 | |||||||||||||||||||||||||||||||||||||
| Austin |
TX | — | 1,184 | 5,678 | — | — | 1,184 | 5,678 | 6,862 | 418 | 1998 | 2016 | 15-39 | |||||||||||||||||||||||||||||||||||||
| Austin |
TX | — | 2,104 | 7,566 | — | — | 2,104 | 7,566 | 9,670 | 585 | 2006 | 2016 | 15-39 | |||||||||||||||||||||||||||||||||||||
| Austin |
TX | — | 4,190 | 7,829 | — | — | 4,190 | 7,829 | 12,019 | 579 | 1994 | 2016 | 15-39 | |||||||||||||||||||||||||||||||||||||
| Central City |
KY | — | 315 | 580 | — | — | 315 | 580 | 895 | 50 | 1978 | 2016 | 15-39 | |||||||||||||||||||||||||||||||||||||
| Owensboro |
KY | — | 177 | 615 | — | — | 177 | 615 | 792 | 46 | 1972 | 2016 | 15-39 | |||||||||||||||||||||||||||||||||||||
| Newburgh |
IN | — | 330 | — | — | — | 330 | — | 330 | — | 1994 | 2016 | — | |||||||||||||||||||||||||||||||||||||
| Sikeston |
MO | — | 205 | 2,235 | — | — | 205 | 2,235 | 2,440 | 171 | 1940 | 2016 | 15-39 | |||||||||||||||||||||||||||||||||||||
| Evansville |
IN | — | 636 | 3,655 | — | — | 636 | 3,655 | 4,291 | 264 | 1949 | 2016 | 15-39 | |||||||||||||||||||||||||||||||||||||
| Evansville |
IN | — | 244 | 2,375 | — | — | 244 | 2,375 | 2,619 | 167 | 1909 | 2016 | 15-39 | |||||||||||||||||||||||||||||||||||||
| Marion |
IL | — | 314 | 2,089 | — | — | 314 | 2,089 | 2,403 | 152 | 1970 | 2016 | 15-39 | |||||||||||||||||||||||||||||||||||||
| Kennett |
MO | — | 191 | 1,198 | — | — | 191 | 1,198 | 1,389 | 89 | 1970 | 2016 | 15-39 | |||||||||||||||||||||||||||||||||||||
| Poplar Bluff |
MO | — | 149 | 1,794 | — | — | 149 | 1,794 | 1,943 | 138 | 1970 | 2016 | 15-39 | |||||||||||||||||||||||||||||||||||||
| Cape Girardeau |
MO | — | 76 | 542 | — | — | 76 | 542 | 618 | 46 | 1988 | 2016 | 15-39 | |||||||||||||||||||||||||||||||||||||
| Scott City |
MO | — | 260 | 3,052 | — | — | 260 | 3,052 | 3,312 | 225 | 1978 | 2016 | 15-39 | |||||||||||||||||||||||||||||||||||||
| Henderson |
KY | — | 290 | 729 | — | — | 290 | 729 | 1,019 | 61 | 1973 | 2016 | 15-39 | |||||||||||||||||||||||||||||||||||||
| Blytheville |
AR | — | 413 | 3,405 | — | — | 413 | 3,405 | 3,818 | 267 | 1966 | 2016 | 15-39 | |||||||||||||||||||||||||||||||||||||
| Harrisburg |
IL | — | 131 | 839 | — | — | 131 | 839 | 970 | 59 | 1970 | 2016 | 15-39 | |||||||||||||||||||||||||||||||||||||
| Clarksville |
IN | — | 1,091 | 3,890 | — | — | 1,091 | 3,890 | 4,981 | 309 | 1961 | 2016 | 15-39 | |||||||||||||||||||||||||||||||||||||
| Owensboro |
KY | — | 499 | 734 | — | — | 499 | 734 | 1,233 | 59 | 1976 | 2016 | 15-39 | |||||||||||||||||||||||||||||||||||||
| Evansville |
IN | — | 203 | 369 | — | — | 203 | 369 | 572 | 41 | 2001 | 2016 | 15-39 | |||||||||||||||||||||||||||||||||||||
| Haubstadt |
IN | — | 379 | 1,349 | — | — | 379 | 1,349 | 1,728 | 117 | 2005 | 2016 | 15-39 | |||||||||||||||||||||||||||||||||||||
| Otterbein |
IN | — | 177 | 1,385 | — | — | 177 | 1,385 | 1,562 | 127 | 1978 | 2016 | 15-39 | |||||||||||||||||||||||||||||||||||||
| Dothan |
AL | — | 539 | 2,551 | — | — | 539 | 2,551 | 3,090 | 177 | 1997 | 2016 | 15-39 | |||||||||||||||||||||||||||||||||||||
| Tallahassee |
FL | — | 864 | 2,184 | — | — | 864 | 2,184 | 3,048 | 161 | 1995 | 2016 | 15-39 | |||||||||||||||||||||||||||||||||||||
| Peachtree City |
GA | — | 476 | 2,590 | — | — | 476 | 2,590 | 3,066 | 185 | 1997 | 2016 | 15-39 | |||||||||||||||||||||||||||||||||||||
| Valdosta |
GA | — | 524 | 2,504 | — | — | 524 | 2,504 | 3,028 | 179 | 1997 | 2016 | 15-39 | |||||||||||||||||||||||||||||||||||||
| Orland Park |
IL | — | 686 | 2,358 | — | — | 686 | 2,358 | 3,044 | 176 | 1994 | 2016 | 15-39 | |||||||||||||||||||||||||||||||||||||
| Rockford |
IL | — | 450 | 2,701 | — | — | 450 | 2,701 | 3,151 | 188 | 1996 | 2016 | 15-39 | |||||||||||||||||||||||||||||||||||||
| Bloomington |
IN | — | 240 | 2,761 | — | — | 240 | 2,761 | 3,001 | 177 | 1994 | 2016 | 15-39 | |||||||||||||||||||||||||||||||||||||
| Kokomo |
IN | — | 106 | 3,065 | — | — | 106 | 3,065 | 3,171 | 189 | 1995 | 2016 | 15-39 | |||||||||||||||||||||||||||||||||||||
| Clarkston |
MI | — | 284 | 2,788 | — | — | 284 | 2,788 | 3,072 | 212 | 1997 | 2016 | 15-39 | |||||||||||||||||||||||||||||||||||||
| Madison Heights |
MI | — | 58 | 3,094 | — | — | 58 | 3,094 | 3,152 | 190 | 1995 | 2016 | 15-39 | |||||||||||||||||||||||||||||||||||||
| Brighton |
MI | — | 102 | 2,920 | — | — | 102 | 2,920 | 3,022 | 209 | 1998 | 2016 | 15-39 | |||||||||||||||||||||||||||||||||||||
| Jackson |
MI | — | 177 | 2,846 | — | — | 177 | 2,846 | 3,023 | 199 | 1996 | 2016 | 15-39 | |||||||||||||||||||||||||||||||||||||
| Hendersonville |
NC | — | 165 | 2,928 | — | — | 165 | 2,928 | 3,093 | 215 | 2000 | 2016 | 15-39 | |||||||||||||||||||||||||||||||||||||
| New Bern |
NC | — | 284 | 2,525 | — | — | 284 | 2,525 | 2,809 | 177 | 2000 | 2016 | 15-39 | |||||||||||||||||||||||||||||||||||||
| Las Vegas |
NV | — | 962 | 2,086 | — | — | 962 | 2,086 | 3,048 | 165 | 2002 | 2016 | 15-39 | |||||||||||||||||||||||||||||||||||||
F-95
Table of Contents
| Initial Costs to Company (A) |
Costs Capitalized Subsequent to Acquisition |
Gross Amount at Which Carried at Close of Period |
Life on Which Depreciation is Computed (Years) |
|||||||||||||||||||||||||||||||||||||||||||||||
| City |
State | Encumbrance | Land | Buildings and Improvements |
Land | Improvements | Land | Buildings and Improvements |
Total (B) | Accumulated Depreciation |
Date of Construction |
Date Acquired |
||||||||||||||||||||||||||||||||||||||
| Cherry Hill |
NJ | — | 791 | 2,340 | — | — | 791 | 2,340 | 3,131 | 174 | 1992 | 2016 | 15-39 | |||||||||||||||||||||||||||||||||||||
| Harrisburg |
PA | — | 735 | 2,340 | — | — | 735 | 2,340 | 3,075 | 168 | 1994 | 2016 | 15-39 | |||||||||||||||||||||||||||||||||||||
| Pittsburgh |
PA | — | 363 | 3,488 | — | — | 363 | 3,488 | 3,851 | 241 | 1996 | 2016 | 15-39 | |||||||||||||||||||||||||||||||||||||
| Beaumont |
TX | — | 206 | 3,241 | — | — | 206 | 3,241 | 3,447 | 222 | 1996 | 2016 | 15-39 | |||||||||||||||||||||||||||||||||||||
| Desoto |
TX | — | 535 | 2,542 | — | — | 535 | 2,542 | 3,077 | 186 | 1999 | 2016 | 15-39 | |||||||||||||||||||||||||||||||||||||
| Lewisville |
TX | — | 299 | 2,786 | — | — | 299 | 2,786 | 3,085 | 182 | 1994 | 2016 | 15-39 | |||||||||||||||||||||||||||||||||||||
| Webster |
TX | — | 591 | 2,622 | — | — | 591 | 2,622 | 3,213 | 188 | 1995 | 2016 | 15-39 | |||||||||||||||||||||||||||||||||||||
| Harrisonburg |
VA | — | 444 | 2,645 | — | — | 444 | 2,645 | 3,089 | 196 | 1998 | 2016 | 15-39 | |||||||||||||||||||||||||||||||||||||
| Beckley |
WV | — | 194 | 3,049 | — | — | 194 | 3,049 | 3,243 | 206 | 1997 | 2016 | 15-39 | |||||||||||||||||||||||||||||||||||||
| Ithaca |
MI | — | 739 | 2,669 | — | — | 739 | 2,669 | 3,408 | 200 | 2015 | 2016 | 15-39 | |||||||||||||||||||||||||||||||||||||
| Gillette |
WY | — | 366 | 3,447 | — | — | 366 | 3,447 | 3,813 | 245 | 2014 | 2016 | 15-39 | |||||||||||||||||||||||||||||||||||||
| Novi |
MI | — | 201 | 12,681 | — | — | 201 | 12,681 | 12,882 | 677 | 1985 | 2017 | 15-39 | |||||||||||||||||||||||||||||||||||||
| Lansing |
MI | — | 88 | 13,919 | — | 3 | 88 | 13,922 | 14,010 | 715 | 1999 | 2017 | 15-39 | |||||||||||||||||||||||||||||||||||||
| Flint |
MI | — | 83 | 7,987 | — | — | 83 | 7,987 | 8,070 | 412 | 1977 | 2017 | 15-39 | |||||||||||||||||||||||||||||||||||||
| Clinton Township |
MI | — | 358 | 9,551 | — | — | 358 | 9,551 | 9,909 | 495 | 1987 | 2017 | 15-39 | |||||||||||||||||||||||||||||||||||||
| Chesterfield |
MI | — | 753 | 9,716 | — | — | 753 | 9,716 | 10,469 | 519 | 2003 | 2017 | 15-39 | |||||||||||||||||||||||||||||||||||||
| Traverse City |
MI | — | 106 | 8,468 | — | — | 106 | 8,468 | 8,574 | 438 | 1998 | 2017 | 15-39 | |||||||||||||||||||||||||||||||||||||
| Warren |
MI | — | 158 | 5,394 | — | — | 158 | 5,394 | 5,552 | 278 | 1991 | 2017 | 15-39 | |||||||||||||||||||||||||||||||||||||
| Grandville |
MI | — | 339 | 4,368 | — | — | 339 | 4,368 | 4,707 | 232 | 2002 | 2017 | 15-39 | |||||||||||||||||||||||||||||||||||||
| Grand Rapids |
MI | — | 68 | 1,038 | — | — | 68 | 1,038 | 1,106 | 57 | 2014 | 2017 | 15-39 | |||||||||||||||||||||||||||||||||||||
| Portage |
MI | — | 38 | 2,041 | — | — | 38 | 2,041 | 2,079 | 108 | 1981 | 2017 | 15-39 | |||||||||||||||||||||||||||||||||||||
| Brook Park |
OH | — | 180 | 1,875 | — | — | 180 | 1,875 | 2,055 | 96 | 2000 | 2017 | 15-39 | |||||||||||||||||||||||||||||||||||||
| Terre Haute |
IN | — | 207 | 1,860 | — | — | 207 | 1,860 | 2,067 | 93 | 1984 | 2017 | 15-39 | |||||||||||||||||||||||||||||||||||||
| Harmarville |
PA | — | 157 | 1,761 | — | — | 157 | 1,761 | 1,918 | 98 | 1984 | 2017 | 15-39 | |||||||||||||||||||||||||||||||||||||
| Youngstown |
OH | — | 72 | 1,945 | — | — | 72 | 1,945 | 2,017 | 98 | 1983 | 2017 | 15-39 | |||||||||||||||||||||||||||||||||||||
| Mars |
PA | — | 381 | 1,572 | — | — | 381 | 1,572 | 1,953 | 90 | 2004 | 2017 | 15-39 | |||||||||||||||||||||||||||||||||||||
| Lafayette |
IN | — | 125 | 1,793 | — | — | 125 | 1,793 | 1,918 | 88 | 1976 | 2017 | 15-39 | |||||||||||||||||||||||||||||||||||||
| Joliet |
IL | — | 366 | 1,505 | — | — | 366 | 1,505 | 1,871 | 89 | 1983 | 2017 | 15-39 | |||||||||||||||||||||||||||||||||||||
| Cincinnati |
OH | — | 638 | 1,515 | — | — | 638 | 1,515 | 2,153 | 87 | 1988 | 2017 | 15-39 | |||||||||||||||||||||||||||||||||||||
| Delaware |
OH | — | 54 | 1,788 | — | — | 54 | 1,788 | 1,842 | 90 | 1987 | 2017 | 15-39 | |||||||||||||||||||||||||||||||||||||
| Wadsworth |
OH | — | 310 | 1,612 | — | — | 310 | 1,612 | 1,922 | 91 | 1989 | 2017 | 15-39 | |||||||||||||||||||||||||||||||||||||
| Fort Wright |
KY | — | 68 | 2,374 | — | 9 | 68 | 2,383 | 2,451 | 121 | 1997 | 2017 | 15-39 | |||||||||||||||||||||||||||||||||||||
| Akron |
OH | — | 134 | 1,605 | — | — | 134 | 1,605 | 1,739 | 106 | 1998 | 2017 | 15-39 | |||||||||||||||||||||||||||||||||||||
| Mt. Vernon |
IL | — | 68 | 1,849 | — | — | 68 | 1,849 | 1,917 | 102 | 2001 | 2017 | 15-39 | |||||||||||||||||||||||||||||||||||||
| Maysville |
KY | — | 37 | 1,889 | — | — | 37 | 1,889 | 1,926 | 98 | 2003 | 2017 | 15-39 | |||||||||||||||||||||||||||||||||||||
| Parkersburg |
WV | — | 280 | 1,631 | — | — | 280 | 1,631 | 1,911 | 88 | 2004 | 2017 | 15-39 | |||||||||||||||||||||||||||||||||||||
| Chesterton |
IN | — | 343 | 1,613 | — | — | 343 | 1,613 | 1,956 | 88 | 2004 | 2017 | 15-39 | |||||||||||||||||||||||||||||||||||||
| Huntington |
WV | — | 344 | 1,575 | — | — | 344 | 1,575 | 1,919 | 84 | 2005 | 2017 | 15-39 | |||||||||||||||||||||||||||||||||||||
| Amelia |
OH | — | 315 | 1,719 | — | — | 315 | 1,719 | 2,034 | 87 | 2006 | 2017 | 15-39 | |||||||||||||||||||||||||||||||||||||
F-96
Table of Contents
| Initial Costs to Company (A) |
Costs Capitalized Subsequent to Acquisition |
Gross Amount at Which Carried at Close of Period |
Life on Which Depreciation is Computed (Years) |
|||||||||||||||||||||||||||||||||||||||||||||||
| City |
State | Encumbrance | Land | Buildings and Improvements |
Land | Improvements | Land | Buildings and Improvements |
Total (B) | Accumulated Depreciation |
Date of Construction |
Date Acquired |
||||||||||||||||||||||||||||||||||||||
| Bellefontaine |
OH | — | 100 | 1,833 | — | — | 100 | 1,833 | 1,933 | 99 | 1994 | 2017 | 15-39 | |||||||||||||||||||||||||||||||||||||
| Logan |
OH | — | 153 | 1,880 | — | — | 153 | 1,880 | 2,033 | 110 | 2008 | 2017 | 15-39 | |||||||||||||||||||||||||||||||||||||
| Harrison |
OH | — | 204 | 1,514 | — | — | 204 | 1,514 | 1,718 | 82 | 2014 | 2017 | 15-39 | |||||||||||||||||||||||||||||||||||||
| Upper Sandusky |
OH | — | 171 | 1,198 | — | — | 171 | 1,198 | 1,369 | 64 | 1994 | 2017 | 15-39 | |||||||||||||||||||||||||||||||||||||
| San Antonio |
TX | — | 300 | 1,277 | — | 1 | 300 | 1,278 | 1,578 | 63 | 1998 | 2017 | 15-39 | |||||||||||||||||||||||||||||||||||||
| Selma |
TX | — | 269 | 805 | — | — | 269 | 805 | 1,074 | 53 | 2013 | 2017 | 15-39 | |||||||||||||||||||||||||||||||||||||
| Linwood |
NC | — | 206 | 475 | — | — | 206 | 475 | 681 | 40 | 1997 | 2017 | 15-39 | |||||||||||||||||||||||||||||||||||||
| Vinton |
TX | — | 469 | 384 | — | — | 469 | 384 | 853 | 30 | 2016 | 2017 | 15-39 | |||||||||||||||||||||||||||||||||||||
| Columbus |
MN | — | 406 | 945 | — | 2 | 406 | 947 | 1,353 | 48 | 1983 | 2017 | 15-39 | |||||||||||||||||||||||||||||||||||||
| Louisville |
KY | — | 370 | 240 | — | — | 370 | 240 | 610 | 17 | 2002 | 2017 | 15-39 | |||||||||||||||||||||||||||||||||||||
| Dunn |
NC | — | 199 | 659 | — | — | 199 | 659 | 858 | 35 | 2017 | 2017 | 15-39 | |||||||||||||||||||||||||||||||||||||
| San Marcos |
TX | — | 486 | 776 | — | — | 486 | 776 | 1,262 | 44 | 2017 | 2017 | 15-39 | |||||||||||||||||||||||||||||||||||||
| Oshkosh |
WI | — | 134 | 5,372 | — | — | 134 | 5,372 | 5,506 | 210 | 1995 | 2017 | 15-39 | |||||||||||||||||||||||||||||||||||||
| Sheboygan |
WI | — | 266 | 2,787 | — | — | 266 | 2,787 | 3,053 | 127 | 2002 | 2017 | 15-39 | |||||||||||||||||||||||||||||||||||||
| Fond du Lac |
WI | — | 120 | 658 | — | — | 120 | 658 | 778 | 33 | 2006 | 2017 | 15-39 | |||||||||||||||||||||||||||||||||||||
| Green Bay |
WI | — | 398 | 9,087 | — | 2 | 398 | 9,089 | 9,487 | 351 | 1992 | 2017 | 15-39 | |||||||||||||||||||||||||||||||||||||
| Manitowoc |
WI | — | 293 | 2,926 | — | — | 293 | 2,926 | 3,219 | 127 | 1993 | 2017 | 15-39 | |||||||||||||||||||||||||||||||||||||
| Boynton Beach |
FL | — | 960 | 2,803 | — | 10 | 960 | 2,813 | 3,773 | 197 | 2007 | 2017 | 7-39 | |||||||||||||||||||||||||||||||||||||
| Jacksonville |
FL | — | 444 | 2,179 | — | — | 444 | 2,179 | 2,623 | 183 | 2008 | 2017 | 7-39 | |||||||||||||||||||||||||||||||||||||
| Jacksonville |
FL | — | 319 | 2,191 | — | — | 319 | 2,191 | 2,510 | 130 | 1999 | 2017 | 7-39 | |||||||||||||||||||||||||||||||||||||
| Miami Gardens |
FL | — | 803 | 2,181 | — | — | 803 | 2,181 | 2,984 | 179 | 2009 | 2017 | 7-39 | |||||||||||||||||||||||||||||||||||||
| Orange Park |
FL | — | 365 | 2,471 | — | — | 365 | 2,471 | 2,836 | 241 | 2006 | 2017 | 7-39 | |||||||||||||||||||||||||||||||||||||
| Milton |
FL | — | 505 | 1,994 | — | — | 505 | 1,994 | 2,499 | 172 | 2005 | 2017 | 7-39 | |||||||||||||||||||||||||||||||||||||
| Wichita |
KS | — | 488 | 2,135 | — | — | 488 | 2,135 | 2,623 | 170 | 2008 | 2017 | 7-39 | |||||||||||||||||||||||||||||||||||||
| Tulsa |
OK | — | 113 | 1,890 | — | — | 113 | 1,890 | 2,003 | 165 | 2008 | 2017 | 7-39 | |||||||||||||||||||||||||||||||||||||
| Alcoa |
TN | — | 751 | 1,829 | — | — | 751 | 1,829 | 2,580 | 169 | 1993 | 2017 | 7-39 | |||||||||||||||||||||||||||||||||||||
| Wichita |
KS | — | 233 | 2,443 | — | — | 233 | 2,443 | 2,676 | 58 | 2006 | 2018 | 7-39 | |||||||||||||||||||||||||||||||||||||
| Wichita |
KS | — | 206 | 2,262 | — | — | 206 | 2,262 | 2,468 | 58 | 2006 | 2018 | 7-39 | |||||||||||||||||||||||||||||||||||||
| Wichita |
KS | — | 234 | 1,761 | — | — | 234 | 1,761 | 1,995 | 52 | 2008 | 2018 | 7-39 | |||||||||||||||||||||||||||||||||||||
| Texarkana |
TX | — | 139 | 3,211 | — | — | 139 | 3,211 | 3,350 | 71 | 2016 | 2018 | 7-39 | |||||||||||||||||||||||||||||||||||||
| Pace |
FL | — | 215 | 2,955 | — | — | 215 | 2,955 | 3,170 | 74 | 2015 | 2018 | 7-39 | |||||||||||||||||||||||||||||||||||||
| Hoosick Falls |
NY | — | 78 | 1,612 | — | — | 78 | 1,612 | 1,690 | 63 | 2012 | 2017 | 15-39 | |||||||||||||||||||||||||||||||||||||
| Hadley |
NY | — | 100 | 1,586 | — | — | 100 | 1,586 | 1,686 | 65 | 2014 | 2017 | 15-39 | |||||||||||||||||||||||||||||||||||||
| Cairo |
NY | — | 106 | 1,609 | — | — | 106 | 1,609 | 1,715 | 58 | 2014 | 2017 | 15-39 | |||||||||||||||||||||||||||||||||||||
| Bridgewater |
NY | — | 241 | 1,482 | — | — | 241 | 1,482 | 1,723 | 59 | 2014 | 2017 | 15-39 | |||||||||||||||||||||||||||||||||||||
| Valatie |
NY | — | 102 | 1,720 | — | — | 102 | 1,720 | 1,822 | 62 | 2014 | 2017 | 15-39 | |||||||||||||||||||||||||||||||||||||
| Wurtsboro |
NY | — | 83 | 1,640 | — | — | 83 | 1,640 | 1,723 | 64 | 2014 | 2017 | 15-39 | |||||||||||||||||||||||||||||||||||||
| Ellenburg Center |
NY | — | 133 | 1,595 | — | — | 133 | 1,595 | 1,728 | 59 | 2014 | 2017 | 15-39 | |||||||||||||||||||||||||||||||||||||
| Marion |
NY | — | 149 | 1,457 | — | — | 149 | 1,457 | 1,606 | 50 | 2013 | 2017 | 15-39 | |||||||||||||||||||||||||||||||||||||
| Oswego |
NY | — | 124 | 1,636 | — | — | 124 | 1,636 | 1,760 | 60 | 2015 | 2017 | 15-39 | |||||||||||||||||||||||||||||||||||||
F-97
Table of Contents
| Initial Costs to Company (A) |
Costs Capitalized Subsequent to Acquisition |
Gross Amount at Which Carried at Close of Period |
Life on Which Depreciation is Computed (Years) |
|||||||||||||||||||||||||||||||||||||||||||||||
| City |
State | Encumbrance | Land | Buildings and Improvements |
Land | Improvements | Land | Buildings and Improvements |
Total (B) | Accumulated Depreciation |
Date of Construction |
Date Acquired |
||||||||||||||||||||||||||||||||||||||
| Cincinnati |
OH | — | 367 | 1,168 | — | — | 367 | 1,168 | 1,535 | 40 | 2014 | 2017 | 15-39 | |||||||||||||||||||||||||||||||||||||
| Dayton |
OH | — | 249 | 1,240 | — | — | 249 | 1,240 | 1,489 | 45 | 2013 | 2017 | 15-39 | |||||||||||||||||||||||||||||||||||||
| West Alexandria |
OH | — | 371 | 1,108 | — | — | 371 | 1,108 | 1,479 | 39 | 2011 | 2017 | 15-39 | |||||||||||||||||||||||||||||||||||||
| Sheffield |
MA | — | 109 | 1,687 | — | 6 | 109 | 1,693 | 1,802 | 55 | 2015 | 2017 | 15-39 | |||||||||||||||||||||||||||||||||||||
| Cedar Hill |
TX | — | 501 | 1,842 | — | — | 501 | 1,842 | 2,343 | 59 | 2015 | 2017 | 15-39 | |||||||||||||||||||||||||||||||||||||
| Bear |
DE | — | 398 | 2,164 | — | 6 | 398 | 2,170 | 2,568 | 72 | 2017 | 2017 | 15-39 | |||||||||||||||||||||||||||||||||||||
| Charlotte |
NC | — | 1,148 | 1,789 | — | 6 | 1,148 | 1,795 | 2,943 | 60 | 2013 | 2017 | 15-39 | |||||||||||||||||||||||||||||||||||||
| Oak Ridge |
TN | — | 1,167 | 1,684 | — | — | 1,167 | 1,684 | 2,851 | 61 | 2013 | 2017 | 15-39 | |||||||||||||||||||||||||||||||||||||
| Alcoa |
TN | — | 1,022 | 1,760 | — | — | 1,022 | 1,760 | 2,782 | 63 | 2015 | 2017 | 15-39 | |||||||||||||||||||||||||||||||||||||
| Smyrna |
DE | — | 1,366 | 2,708 | — | — | 1,366 | 2,708 | 4,074 | 113 | 2016 | 2017 | 15-39 | |||||||||||||||||||||||||||||||||||||
| North Fort Myers |
FL | — | 1,011 | 3,353 | — | 6 | 1,011 | 3,359 | 4,370 | 139 | 2015 | 2017 | 15-39 | |||||||||||||||||||||||||||||||||||||
| Salisbury |
NC | — | 131 | 1,243 | — | — | 131 | 1,243 | 1,374 | 27 | 1974 | 2018 | 15-39 | |||||||||||||||||||||||||||||||||||||
| High Point |
NC | — | 202 | 1,765 | — | — | 202 | 1,765 | 1,967 | 39 | 1975 | 2018 | 15-39 | |||||||||||||||||||||||||||||||||||||
| Fayetteville |
NC | — | 251 | 3,324 | — | — | 251 | 3,324 | 3,575 | 69 | 1970 | 2018 | 15-39 | |||||||||||||||||||||||||||||||||||||
| Raleigh |
NC | — | 619 | 3,327 | — | — | 619 | 3,327 | 3,946 | 70 | 1971 | 2018 | 15-39 | |||||||||||||||||||||||||||||||||||||
| Gastonia |
NC | — | 236 | 1,311 | — | — | 236 | 1,311 | 1,547 | 29 | 1991 | 2018 | 15-39 | |||||||||||||||||||||||||||||||||||||
| Virginia Beach |
VA | — | 665 | 4,104 | — | — | 665 | 4,104 | 4,769 | 87 | 1966 | 2018 | 15-39 | |||||||||||||||||||||||||||||||||||||
| Hampton |
VA | — | 642 | 1,108 | — | — | 642 | 1,108 | 1,750 | 28 | 2016 | 2018 | 15-39 | |||||||||||||||||||||||||||||||||||||
| Greenville |
SC | — | 946 | 3,068 | — | — | 946 | 3,068 | 4,014 | 64 | 1973 | 2018 | 15-39 | |||||||||||||||||||||||||||||||||||||
| Riverdale |
GA | — | 311 | 2,518 | — | — | 311 | 2,518 | 2,829 | 55 | 2003 | 2018 | 15-39 | |||||||||||||||||||||||||||||||||||||
| Marietta |
GA | — | 152 | 1,732 | — | — | 152 | 1,732 | 1,884 | 37 | 1986 | 2018 | 15-39 | |||||||||||||||||||||||||||||||||||||
| Memphis |
TN | — | 632 | 2,376 | — | — | 632 | 2,376 | 3,008 | 54 | 1978 | 2018 | 15-39 | |||||||||||||||||||||||||||||||||||||
| Chattanooga |
TN | — | 470 | 3,391 | — | — | 470 | 3,391 | 3,861 | 72 | 1970 | 2018 | 15-39 | |||||||||||||||||||||||||||||||||||||
| Florence |
AL | — | 234 | 1,534 | — | — | 234 | 1,534 | 1,768 | 35 | 2004 | 2018 | 15-39 | |||||||||||||||||||||||||||||||||||||
| Madison |
TN | — | 325 | 1,026 | — | — | 325 | 1,026 | 1,351 | 23 | 2014 | 2018 | 15-39 | |||||||||||||||||||||||||||||||||||||
| Louisville |
KY | — | 387 | 4,698 | — | — | 387 | 4,698 | 5,085 | 99 | 1965 | 2018 | 15-39 | |||||||||||||||||||||||||||||||||||||
| Louisville |
KY | — | 297 | 2,867 | — | — | 297 | 2,867 | 3,164 | 60 | 1966 | 2018 | 15-39 | |||||||||||||||||||||||||||||||||||||
| Huntsville |
AL | — | 251 | 3,819 | — | — | 251 | 3,819 | 4,070 | 79 | 1968 | 2018 | 15-39 | |||||||||||||||||||||||||||||||||||||
| Matthews |
NC | — | 432 | 941 | — | — | 432 | 941 | 1,373 | 23 | 2013 | 2018 | 15-39 | |||||||||||||||||||||||||||||||||||||
| Brentwood |
TN | — | 924 | 803 | — | — | 924 | 803 | 1,727 | 22 | 2004 | 2018 | 15-39 | |||||||||||||||||||||||||||||||||||||
| Pensacola |
FL | — | 328 | 2,600 | — | — | 328 | 2,600 | 2,928 | 55 | 2007 | 2018 | 15-39 | |||||||||||||||||||||||||||||||||||||
| Augusta |
GA | — | 253 | 772 | — | — | 253 | 772 | 1,025 | 17 | 2012 | 2018 | 15-39 | |||||||||||||||||||||||||||||||||||||
| Columbus |
OH | — | 587 | 503 | — | — | 587 | 503 | 1,090 | 14 | 1995 | 2018 | 15-39 | |||||||||||||||||||||||||||||||||||||
| Evansville |
IN | — | 158 | 1,403 | — | — | 158 | 1,403 | 1,561 | 32 | 2003 | 2018 | 15-39 | |||||||||||||||||||||||||||||||||||||
| Mishawaka |
IN | — | 330 | 2,074 | — | — | 330 | 2,074 | 2,404 | 46 | 2003 | 2018 | 15-39 | |||||||||||||||||||||||||||||||||||||
| Nashville |
TN | — | 416 | 1,511 | — | — | 416 | 1,511 | 1,927 | 9 | 2003 | 2018 | 15-39 | |||||||||||||||||||||||||||||||||||||
| Miles City |
MT | — | 547 | 1,616 | — | — | 547 | 1,616 | 2,163 | 29 | 1995 | 2018 | 15-39 | |||||||||||||||||||||||||||||||||||||
| Dickinson |
ND | — | 294 | 2,447 | — | — | 294 | 2,447 | 2,741 | 37 | 1983 | 2018 | 15-39 | |||||||||||||||||||||||||||||||||||||
| Billings |
MT | — | 516 | 2,128 | — | — | 516 | 2,128 | 2,644 | 36 | 1977 | 2018 | 15-39 | |||||||||||||||||||||||||||||||||||||
| Billings |
MT | — | 356 | 1,728 | — | — | 356 | 1,728 | 2,084 | 29 | 1976 | 2018 | 15-39 | |||||||||||||||||||||||||||||||||||||
F-98
Table of Contents
| Initial Costs to Company (A) |
Costs Capitalized Subsequent to Acquisition |
Gross Amount at Which Carried at Close of Period |
Life on Which Depreciation is Computed (Years) |
|||||||||||||||||||||||||||||||||||||||||||||||
| City |
State | Encumbrance | Land | Buildings and Improvements |
Land | Improvements | Land | Buildings and Improvements |
Total (B) | Accumulated Depreciation |
Date of Construction |
Date Acquired |
||||||||||||||||||||||||||||||||||||||
| Billings |
MT | — | 753 | 1,448 | — | — | 753 | 1,448 | 2,201 | 25 | 2003 | 2018 | 15-39 | |||||||||||||||||||||||||||||||||||||
| Downers Grove |
IL | — | 1,919 | 16,366 | — | — | 1,919 | 16,366 | 18,285 | 243 | 1974 | 2018 | 15-39 | |||||||||||||||||||||||||||||||||||||
| Benzonia |
MI | — | 89 | 3,009 | — | — | 89 | 3,009 | 3,098 | 49 | 2014 | 2018 | 15-39 | |||||||||||||||||||||||||||||||||||||
| Flushing |
MI | — | 201 | 2,863 | — | — | 201 | 2,863 | 3,064 | 48 | 2014 | 2018 | 15-39 | |||||||||||||||||||||||||||||||||||||
| Irmo |
SC | — | 119 | 4,255 | — | — | 119 | 4,255 | 4,374 | 43 | 2006 | 2018 | 15-39 | |||||||||||||||||||||||||||||||||||||
| Anderson |
SC | — | 312 | 4,113 | — | — | 312 | 4,113 | 4,425 | 43 | 2008 | 2018 | 15-39 | |||||||||||||||||||||||||||||||||||||
| Elizabethton |
TN | — | 270 | 4,077 | — | — | 270 | 4,077 | 4,347 | 41 | 2005 | 2018 | 15-39 | |||||||||||||||||||||||||||||||||||||
| Albany |
GA | — | 164 | 3,816 | — | — | 164 | 3,816 | 3,980 | 40 | 2007 | 2018 | 15-39 | |||||||||||||||||||||||||||||||||||||
| Moncks Corner |
SC | — | 265 | 4,307 | — | — | 265 | 4,307 | 4,572 | 44 | 2006 | 2018 | 15-39 | |||||||||||||||||||||||||||||||||||||
| Greeneville |
TN | — | 117 | 4,122 | — | — | 117 | 4,122 | 4,239 | 41 | 2003 | 2018 | 15-39 | |||||||||||||||||||||||||||||||||||||
| Lexington |
SC | — | 219 | 898 | — | — | 219 | 898 | 1,117 | 11 | 2015 | 2018 | 15-39 | |||||||||||||||||||||||||||||||||||||
| Lexington |
SC | — | 348 | 714 | — | — | 348 | 714 | 1,062 | 9 | 2015 | 2018 | 15-39 | |||||||||||||||||||||||||||||||||||||
| Orangeburg |
SC | — | 238 | 3,323 | — | — | 238 | 3,323 | 3,561 | 38 | 2006 | 2018 | 15-39 | |||||||||||||||||||||||||||||||||||||
| West Columbia |
SC | — | 296 | 1,140 | — | — | 296 | 1,140 | 1,436 | 13 | 2016 | 2018 | 15-39 | |||||||||||||||||||||||||||||||||||||
| Brooklet |
GA | — | — | 497 | — | — | — | 497 | 497 | 5 | 1999 | 2018 | 15-39 | |||||||||||||||||||||||||||||||||||||
| Rex |
GA | — | 175 | 885 | — | — | 175 | 885 | 1,060 | 12 | 1999 | 2018 | 15-39 | |||||||||||||||||||||||||||||||||||||
| Pendleton |
SC | — | 313 | 538 | — | — | 313 | 538 | 851 | 10 | 1998 | 2018 | 15-39 | |||||||||||||||||||||||||||||||||||||
| Pembroke |
GA | — | 213 | 393 | — | — | 213 | 393 | 606 | 7 | 2000 | 2018 | 15-39 | |||||||||||||||||||||||||||||||||||||
| Loganville |
GA | — | 422 | 2,353 | — | — | 422 | 2,353 | 2,775 | 34 | 1998 | 2018 | 15-39 | |||||||||||||||||||||||||||||||||||||
| Campobello |
SC | — | 189 | 437 | — | — | 189 | 437 | 626 | 7 | 2000 | 2018 | 15-39 | |||||||||||||||||||||||||||||||||||||
| Central |
SC | — | 323 | 552 | — | — | 323 | 552 | 875 | 10 | 2001 | 2018 | 15-39 | |||||||||||||||||||||||||||||||||||||
| Moncks Corner |
SC | — | 213 | 562 | — | — | 213 | 562 | 775 | 8 | 2003 | 2018 | 15-39 | |||||||||||||||||||||||||||||||||||||
| Camden |
SC | — | 614 | 613 | — | — | 614 | 613 | 1,227 | 11 | 2000 | 2018 | 15-39 | |||||||||||||||||||||||||||||||||||||
| Lincolnton |
GA | — | 172 | 625 | — | — | 172 | 625 | 797 | 9 | 2001 | 2018 | 15-39 | |||||||||||||||||||||||||||||||||||||
| Louisville |
KY | — | 162 | 948 | — | — | 162 | 948 | 1,110 | 4 | 2002 | 2018 | 15-39 | |||||||||||||||||||||||||||||||||||||
| Cincinnati |
OH | — | 184 | 1,396 | — | — | 184 | 1,396 | 1,580 | 5 | 1987 | 2018 | 15-39 | |||||||||||||||||||||||||||||||||||||
| Madison |
IN | — | 126 | 2,230 | — | — | 126 | 2,230 | 2,356 | 8 | 1996 | 2018 | 15-39 | |||||||||||||||||||||||||||||||||||||
| Big Spring |
TX | — | 465 | 2,363 | — | — | 465 | 2,363 | 2,828 | 3 | 2008 | 2018 | 15-39 | |||||||||||||||||||||||||||||||||||||
| Cuero |
TX | — | 472 | 2,285 | — | — | 472 | 2,285 | 2,757 | 3 | 2010 | 2018 | 15-39 | |||||||||||||||||||||||||||||||||||||
| Industrial Properties: |
||||||||||||||||||||||||||||||||||||||||||||||||||
| Becker |
MN | 750 | 921 | 4,540 | — | — | 921 | 4,540 | 5,461 | 1,405 | 2000 | 2008 | 15-39 | |||||||||||||||||||||||||||||||||||||
| Tacoma |
WA | — | 1,634 | 4,902 | — | — | 1,634 | 4,902 | 6,536 | 1,244 | 1977 | 2011 | 15-39 | |||||||||||||||||||||||||||||||||||||
| New Haven |
IN | — | 445 | 2,521 | — | — | 445 | 2,521 | 2,966 | 748 | 1960 | 2011 | 15-39 | |||||||||||||||||||||||||||||||||||||
| Raleigh |
NC | — | 2,034 | 8,137 | — | — | 2,034 | 8,137 | 10,171 | 1,754 | 1999 | 2012 | 15-39 | |||||||||||||||||||||||||||||||||||||
| Eureka |
MO | — | 2,328 | 9,311 | — | — | 2,328 | 9,311 | 11,639 | 2,741 | 1990 | 2012 | 15-39 | |||||||||||||||||||||||||||||||||||||
| Durham |
NC | 11,288 | 3,000 | 17,531 | — | — | 3,000 | 17,531 | 20,531 | 4,022 | 2009 | 2012 | 15-39 | |||||||||||||||||||||||||||||||||||||
| Kilgore |
TX | — | 160 | 908 | — | — | 160 | 908 | 1,068 | 259 | 2008 | 2012 | 15-39 | |||||||||||||||||||||||||||||||||||||
| American Canyon |
CA | 8,496 | 2,378 | 26,142 | — | — | 2,378 | 26,142 | 28,520 | 5,277 | 2002 | 2012 | 15-39 | |||||||||||||||||||||||||||||||||||||
| Huber Heights |
OH | — | 583 | 1,748 | — | — | 583 | 1,748 | 2,331 | 495 | 1985 | 2012 | 15-39 | |||||||||||||||||||||||||||||||||||||
F-99
Table of Contents
| Initial Costs to Company (A) |
Costs Capitalized Subsequent to Acquisition |
Gross Amount at Which Carried at Close of Period |
Life on Which Depreciation is Computed (Years) |
|||||||||||||||||||||||||||||||||||||||||||||||
| City |
State | Encumbrance | Land | Buildings and Improvements |
Land | Improvements | Land | Buildings and Improvements |
Total (B) | Accumulated Depreciation |
Date of Construction |
Date Acquired |
||||||||||||||||||||||||||||||||||||||
| Eastlake |
OH | — | 854 | 2,562 | — | — | 854 | 2,562 | 3,416 | 620 | 1981 | 2012 | 15-39 | |||||||||||||||||||||||||||||||||||||
| Houston |
TX | — | 3,250 | 9,751 | — | — | 3,250 | 9,751 | 13,001 | 1,766 | 2005 | 2012 | 15-39 | |||||||||||||||||||||||||||||||||||||
| Katy |
TX | — | 1,978 | 7,912 | — | — | 1,978 | 7,912 | 9,890 | 1,450 | 2012 | 2012 | 15-39 | |||||||||||||||||||||||||||||||||||||
| Union Grove |
WI | — | 239 | 957 | — | — | 239 | 957 | 1,196 | 167 | 1993 | 2012 | 15-39 | |||||||||||||||||||||||||||||||||||||
| Union Grove |
WI | — | 347 | 1,386 | — | — | 347 | 1,386 | 1,733 | 233 | 1979 | 2012 | 15-39 | |||||||||||||||||||||||||||||||||||||
| Rock Hill |
SC | — | 796 | 3,185 | — | 72 | 796 | 3,257 | 4,053 | 769 | 1999 | 2012 | 15-39 | |||||||||||||||||||||||||||||||||||||
| Union Grove |
WI | — | 427 | 3,413 | — | — | 427 | 3,413 | 3,840 | 437 | 2014 | 2015 | 15-39 | |||||||||||||||||||||||||||||||||||||
| Oshkosh |
WI | — | 456 | 869 | — | — | 456 | 869 | 1,325 | 116 | 2007 | 2015 | 15-39 | |||||||||||||||||||||||||||||||||||||
| Hoffman Estates |
IL | — | 12,253 | 23,456 | — | — | 12,253 | 23,456 | 35,709 | 4,450 | 1988 | 2013 | 15-39 | |||||||||||||||||||||||||||||||||||||
| Norton Shores |
MI | — | 198 | 2,932 | — | — | 198 | 2,932 | 3,130 | 405 | 2002 | 2014 | 15-39 | |||||||||||||||||||||||||||||||||||||
| Muskegon |
MI | — | 168 | 2,751 | — | 13 | 168 | 2,764 | 2,932 | 468 | 1985 | 2013 | 15-39 | |||||||||||||||||||||||||||||||||||||
| Muskegon |
MI | — | 454 | 6,889 | — | 3 | 454 | 6,892 | 7,346 | 1,195 | 2012 | 2013 | 15-39 | |||||||||||||||||||||||||||||||||||||
| Muskegon |
MI | — | 463 | 2,512 | — | 23 | 463 | 2,535 | 2,998 | 463 | 1978 | 2013 | 15-39 | |||||||||||||||||||||||||||||||||||||
| Muskegon |
MI | — | 257 | 655 | — | — | 257 | 655 | 912 | 129 | 2005 | 2013 | 15-39 | |||||||||||||||||||||||||||||||||||||
| Greenwich |
CT | — | 16,898 | 959 | — | — | 16,898 | 959 | 17,857 | 168 | 1967 | 2014 | 15-39 | |||||||||||||||||||||||||||||||||||||
| Elgin |
IL | — | 4,339 | 17,458 | — | — | 4,339 | 17,458 | 21,797 | 2,402 | 2009 | 2014 | 15-39 | |||||||||||||||||||||||||||||||||||||
| Shakopee |
MN | — | 3,962 | 21,296 | — | — | 3,962 | 21,296 | 25,258 | 3,071 | 2014 | 2014 | 15-39 | |||||||||||||||||||||||||||||||||||||
| Houston |
TX | — | 1,242 | 2,698 | — | — | 1,242 | 2,698 | 3,940 | 463 | 1972 | 2014 | 15-39 | |||||||||||||||||||||||||||||||||||||
| Winona |
MN | — | 1,653 | 7,694 | — | — | 1,653 | 7,694 | 9,347 | 920 | 2008 | 2014 | 15-39 | |||||||||||||||||||||||||||||||||||||
| Winona |
MN | — | 804 | 4,412 | — | — | 804 | 4,412 | 5,216 | 515 | 2008 | 2014 | 15-39 | |||||||||||||||||||||||||||||||||||||
| Mt. Pleasant |
TX | — | 1,785 | 5,540 | — | — | 1,785 | 5,540 | 7,325 | 737 | 1994 | 2014 | 15-39 | |||||||||||||||||||||||||||||||||||||
| Madill |
OK | — | 1,395 | 5,796 | — | — | 1,395 | 5,796 | 7,191 | 737 | 1999 | 2014 | 15-39 | |||||||||||||||||||||||||||||||||||||
| Madill |
OK | — | 2,657 | 1,566 | — | 1,001 | 2,657 | 2,567 | 5,224 | 240 | 1972 | 2014 | 15-39 | |||||||||||||||||||||||||||||||||||||
| Madill |
OK | — | 621 | 1,759 | — | — | 621 | 1,759 | 2,380 | 224 | 1977 | 2014 | 15-39 | |||||||||||||||||||||||||||||||||||||
| Willis Point |
TX | — | 3,102 | 2,420 | — | — | 3,102 | 2,420 | 5,522 | 380 | 2003 | 2014 | 15-39 | |||||||||||||||||||||||||||||||||||||
| Fitzgerald |
GA | — | 1,939 | 3,316 | — | — | 1,939 | 3,316 | 5,255 | 478 | 1997 | 2014 | 15-39 | |||||||||||||||||||||||||||||||||||||
| Cordele |
GA | — | 2,705 | 3,786 | — | — | 2,705 | 3,786 | 6,491 | 473 | 2000 | 2014 | 15-39 | |||||||||||||||||||||||||||||||||||||
| Kingston |
OK | — | 1,857 | 1,692 | — | — | 1,857 | 1,692 | 3,549 | 252 | 2013 | 2014 | 15-39 | |||||||||||||||||||||||||||||||||||||
| Odessa |
TX | — | 529 | 3,327 | — | — | 529 | 3,327 | 3,856 | 409 | 2012 | 2015 | 15-39 | |||||||||||||||||||||||||||||||||||||
| Columbia |
MD | — | 667 | 9,220 | — | — | 667 | 9,220 | 9,887 | 1,041 | 1984 | 2015 | 15-39 | |||||||||||||||||||||||||||||||||||||
| Menomonee Falls |
WI | — | 1,378 | 18,557 | — | — | 1,378 | 18,557 | 19,935 | 2,007 | 2001 | 2015 | 15-39 | |||||||||||||||||||||||||||||||||||||
| Elk River |
MN | — | 763 | 4,937 | — | — | 763 | 4,937 | 5,700 | 632 | 2008 | 2015 | 15-39 | |||||||||||||||||||||||||||||||||||||
| Elk River |
MN | — | 477 | 2,517 | — | — | 477 | 2,517 | 2,994 | 322 | 2006 | 2015 | 15-39 | |||||||||||||||||||||||||||||||||||||
| Sanford |
FL | — | 2,075 | 7,600 | — | — | 2,075 | 7,600 | 9,675 | 851 | 2002 | 2015 | 15-39 | |||||||||||||||||||||||||||||||||||||
| Columbus |
GA | — | 615 | 9,942 | — | — | 615 | 9,942 | 10,557 | 977 | 1907 | 2015 | 15-39 | |||||||||||||||||||||||||||||||||||||
| Ephrata |
PA | — | 531 | 6,995 | — | — | 531 | 6,995 | 7,526 | 1,021 | 2000 | 2015 | 15-39 | |||||||||||||||||||||||||||||||||||||
| Greer |
SC | — | 607 | 2,502 | — | — | 607 | 2,502 | 3,109 | 304 | 1978 | 2015 | 15-39 | |||||||||||||||||||||||||||||||||||||
F-100
Table of Contents
| Initial Costs to Company (A) |
Costs Capitalized Subsequent to Acquisition |
Gross Amount at Which Carried at Close of Period |
Life on Which Depreciation is Computed (Years) |
|||||||||||||||||||||||||||||||||||||||||||||||
| City |
State | Encumbrance | Land | Buildings and Improvements |
Land | Improvements | Land | Buildings and Improvements |
Total (B) | Accumulated Depreciation |
Date of Construction |
Date Acquired |
||||||||||||||||||||||||||||||||||||||
| Joplin |
MO | — | 831 | 9,600 | — | — | 831 | 9,600 | 10,431 | 1,027 | 1993 | 2015 | 15-39 | |||||||||||||||||||||||||||||||||||||
| Katy |
TX | — | 1,493 | 3,883 | — | — | 1,493 | 3,883 | 5,376 | 463 | 1996 | 2015 | 15-39 | |||||||||||||||||||||||||||||||||||||
| Kinston |
NC | — | 1,017 | 10,418 | — | — | 1,017 | 10,418 | 11,435 | 1,101 | 1979 | 2015 | 15-39 | |||||||||||||||||||||||||||||||||||||
| Euless |
TX | — | 1,487 | 3,051 | — | — | 1,487 | 3,051 | 4,538 | 337 | 1991 | 2015 | 15-39 | |||||||||||||||||||||||||||||||||||||
| Jacksonville |
TX | — | 1,221 | 3,316 | — | — | 1,221 | 3,316 | 4,537 | 334 | 1974 | 2015 | 15-39 | |||||||||||||||||||||||||||||||||||||
| Lima |
OH | — | 656 | 21,645 | — | — | 656 | 21,645 | 22,301 | 1,942 | 2009 | 2015 | 15-39 | |||||||||||||||||||||||||||||||||||||
| Sulphur Springs |
TX | — | 1,720 | 20,756 | — | — | 1,720 | 20,756 | 22,476 | 1,862 | 1989 | 2015 | 15-39 | |||||||||||||||||||||||||||||||||||||
| Portage |
IN | — | 1,181 | 13,130 | — | — | 1,181 | 13,130 | 14,311 | 1,375 | 2001 | 2016 | 15-39 | |||||||||||||||||||||||||||||||||||||
| St. Cloud |
MN | — | 565 | 20,420 | — | — | 565 | 20,420 | 20,985 | 1,391 | 1999 | 2016 | 15-39 | |||||||||||||||||||||||||||||||||||||
| New Kensington |
PA | — | 907 | 13,058 | — | — | 907 | 13,058 | 13,965 | 778 | 2015 | 2016 | 15-39 | |||||||||||||||||||||||||||||||||||||
| Denver |
CO | — | 1,105 | 8,077 | — | 1,050 | 1,105 | 9,127 | 10,232 | 389 | 1975 | 2017 | 15-39 | |||||||||||||||||||||||||||||||||||||
| Denver |
CO | — | 252 | 1,658 | — | — | 252 | 1,658 | 1,910 | 75 | 1977 | 2017 | 15-39 | |||||||||||||||||||||||||||||||||||||
| Germantown |
WI | — | 612 | 2,062 | — | — | 612 | 2,062 | 2,674 | 85 | 1989 | 2017 | 15-39 | |||||||||||||||||||||||||||||||||||||
| Germantown |
WI | — | 575 | 2,086 | — | — | 575 | 2,086 | 2,661 | 84 | 2000 | 2017 | 15-39 | |||||||||||||||||||||||||||||||||||||
| Green Bay |
WI | — | 406 | 7,032 | — | — | 406 | 7,032 | 7,438 | 287 | 1989 | 2017 | 15-39 | |||||||||||||||||||||||||||||||||||||
| Two Rivers |
WI | — | 445 | 1,885 | — | — | 445 | 1,885 | 2,330 | 97 | 1994 | 2017 | 15-39 | |||||||||||||||||||||||||||||||||||||
| Little Chute |
WI | — | 342 | 52,744 | — | 2 | 342 | 52,746 | 53,088 | 2,119 | 2017 | 2017 | 7-39 | |||||||||||||||||||||||||||||||||||||
| Las Vegas |
NV | — | 3,034 | 11,857 | — | — | 3,034 | 11,857 | 14,891 | 375 | 2017 | 2017 | 15-39 | |||||||||||||||||||||||||||||||||||||
| Walker |
LA | — | 4,646 | 30,310 | — | — | 4,646 | 30,310 | 34,956 | 1,041 | 2017 | 2017 | 15-39 | |||||||||||||||||||||||||||||||||||||
| Saxonburg |
PA | — | 1,048 | 7,545 | — | 1 | 1,048 | 7,546 | 8,594 | 274 | 2008 | 2017 | 15-39 | |||||||||||||||||||||||||||||||||||||
| Butler |
PA | — | 1,885 | 6,294 | — | — | 1,885 | 6,294 | 8,179 | 244 | 1990 | 2017 | 15-39 | |||||||||||||||||||||||||||||||||||||
| Story City |
IA | — | 5,700 | 13,916 | — | 20 | 5,700 | 13,936 | 19,636 | 498 | 1997 | 2017 | 15-39 | |||||||||||||||||||||||||||||||||||||
| San Jose |
CA | — | 9,489 | 18,617 | — | 956 | 9,489 | 19,573 | 29,062 | 648 | 1983 | 2017 | 15-39 | |||||||||||||||||||||||||||||||||||||
| Taunton |
MA | — | 3,157 | 16,851 | — | — | 3,157 | 16,851 | 20,008 | 433 | 1987 | 2018 | 15-39 | |||||||||||||||||||||||||||||||||||||
| Knoxville |
TN | — | 447 | 4,276 | — | — | 447 | 4,276 | 4,723 | 90 | 1977 | 2018 | 15-39 | |||||||||||||||||||||||||||||||||||||
| Elk Grove Village |
IL | — | 2,014 | 3,686 | — | — | 2,014 | 3,686 | 5,700 | 85 | 2014 | 2018 | 15-39 | |||||||||||||||||||||||||||||||||||||
| Elgin |
IL | — | 3,265 | 4,947 | — | — | 3,265 | 4,947 | 8,212 | 96 | 1981 | 2018 | 15-39 | |||||||||||||||||||||||||||||||||||||
| Lordstown |
OH | — | 1,028 | 36,068 | — | — | 1,028 | 36,068 | 37,096 | 540 | 2012 | 2018 | 15-39 | |||||||||||||||||||||||||||||||||||||
| Perth Amboy |
NJ | 20,674 | 5,622 | 35,420 | — | — | 5,622 | 35,420 | 41,042 | 501 | 1933 | 2018 | 15-39 | |||||||||||||||||||||||||||||||||||||
| Indianapolis |
IN | — | 840 | 8,395 | — | — | 840 | 8,395 | 9,235 | 133 | 1972 | 2018 | 15-39 | |||||||||||||||||||||||||||||||||||||
| Hazelwood |
MO | — | 2,936 | 7,565 | — | — | 2,936 | 7,565 | 10,501 | 105 | 1966 | 2018 | 15-39 | |||||||||||||||||||||||||||||||||||||
| Fridley |
MN | — | 273 | 1,986 | — | — | 273 | 1,986 | 2,259 | 23 | 1973 | 2018 | 15-39 | |||||||||||||||||||||||||||||||||||||
| Burnsville |
MN | — | 207 | 2,209 | — | — | 207 | 2,209 | 2,416 | 26 | 1973 | 2018 | 15-39 | |||||||||||||||||||||||||||||||||||||
| North Canton |
OH | — | 338 | 8,263 | — | — | 338 | 8,263 | 8,601 | 51 | 1988 | 2018 | 15-39 | |||||||||||||||||||||||||||||||||||||
| Madison |
MS | — | 3,348 | 11,997 | — | — | 3,348 | 11,997 | 15,345 | 15 | 2003 | 2018 | 15-39 | |||||||||||||||||||||||||||||||||||||
| Novi |
MI | — | 872 | 8,274 | — | — | 872 | 8,274 | 9,146 | 10 | 2018 | 2018 | 15-39 | |||||||||||||||||||||||||||||||||||||
| Healthcare Properties: |
||||||||||||||||||||||||||||||||||||||||||||||||||
| Fayetteville |
GA | — | 865 | 4,901 | — | — | 865 | 4,901 | 5,766 | 1,427 | 1985 | 2008 | 15-39 | |||||||||||||||||||||||||||||||||||||
| Houston |
TX | 1,751 | 598 | 3,388 | — | — | 598 | 3,388 | 3,986 | 958 | 1980 | 2008 | 15-39 | |||||||||||||||||||||||||||||||||||||
F-101
Table of Contents
| Initial Costs to Company (A) |
Costs Capitalized Subsequent to Acquisition |
Gross Amount at Which Carried at Close of Period |
Life on Which Depreciation is Computed (Years) |
|||||||||||||||||||||||||||||||||||||||||||||||
| City |
State | Encumbrance | Land | Buildings and Improvements |
Land | Improvements | Land | Buildings and Improvements |
Total (B) | Accumulated Depreciation |
Date of Construction |
Date Acquired |
||||||||||||||||||||||||||||||||||||||
| Rockford |
IL | — | 216 | 1,225 | — | — | 216 | 1,225 | 1,441 | 376 | 1993 | 2008 | 15-39 | |||||||||||||||||||||||||||||||||||||
| Machesney Park |
IL | — | 218 | 1,237 | — | — | 218 | 1,237 | 1,455 | 403 | 1996 | 2008 | 15-39 | |||||||||||||||||||||||||||||||||||||
| Loves Park |
IL | 563 | 190 | 890 | — | — | 190 | 890 | 1,080 | 274 | 1982 | 2010 | 15-39 | |||||||||||||||||||||||||||||||||||||
| Memphis |
TN | — | 530 | 2,722 | — | — | 530 | 2,722 | 3,252 | 804 | 1993 | 2009 | 15-39 | |||||||||||||||||||||||||||||||||||||
| Savannah |
GA | — | 160 | 641 | — | — | 160 | 641 | 801 | 182 | 1986 | 2009 | 15-39 | |||||||||||||||||||||||||||||||||||||
| Pooler |
GA | — | 272 | 1,089 | — | — | 272 | 1,089 | 1,361 | 305 | 1990 | 2009 | 15-39 | |||||||||||||||||||||||||||||||||||||
| Savannah |
GA | — | 114 | 457 | — | — | 114 | 457 | 571 | 116 | 1978 | 2009 | 15-39 | |||||||||||||||||||||||||||||||||||||
| Savannah |
GA | — | 148 | 590 | — | — | 148 | 590 | 738 | 182 | 1981 | 2009 | 15-39 | |||||||||||||||||||||||||||||||||||||
| Houston |
TX | — | 2,022 | 6,065 | — | — | 2,022 | 6,065 | 8,087 | 1,561 | 2002 | 2010 | 15-39 | |||||||||||||||||||||||||||||||||||||
| Greece |
NY | — | 1,391 | 30,442 | — | 3,268 | 1,391 | 33,710 | 35,101 | 7,425 | 2011 | 2010 | 7-39 | |||||||||||||||||||||||||||||||||||||
| Tampa |
FL | — | 580 | 3,304 | — | — | 580 | 3,304 | 3,884 | 765 | 2002 | 2011 | 15-39 | |||||||||||||||||||||||||||||||||||||
| Tampa |
FL | — | 790 | 4,021 | — | — | 790 | 4,021 | 4,811 | 903 | 1985 | 2011 | 15-39 | |||||||||||||||||||||||||||||||||||||
| Wesley Chapel |
FL | — | 340 | 2,862 | — | — | 340 | 2,862 | 3,202 | 650 | 2008 | 2011 | 15-39 | |||||||||||||||||||||||||||||||||||||
| Brandon |
FL | — | 292 | 1,961 | — | — | 292 | 1,961 | 2,253 | 440 | 1998 | 2011 | 15-39 | |||||||||||||||||||||||||||||||||||||
| Plano |
TX | — | 965 | 2,895 | — | — | 965 | 2,895 | 3,860 | 642 | 2000 | 2011 | 15-39 | |||||||||||||||||||||||||||||||||||||
| Ada |
OK | — | 293 | 1,172 | — | — | 293 | 1,172 | 1,465 | 262 | 2011 | 2011 | 15-39 | |||||||||||||||||||||||||||||||||||||
| Oklahoma City |
OK | — | 427 | 1,282 | — | — | 427 | 1,282 | 1,709 | 270 | 2001 | 2011 | 15-39 | |||||||||||||||||||||||||||||||||||||
| Sapulpa |
OK | — | 510 | 1,271 | — | — | 510 | 1,271 | 1,781 | 245 | 2011 | 2012 | 15-39 | |||||||||||||||||||||||||||||||||||||
| Lawton |
OK | — | 357 | 1,422 | — | — | 357 | 1,422 | 1,779 | 258 | 2012 | 2012 | 15-39 | |||||||||||||||||||||||||||||||||||||
| McAlester |
OK | — | 413 | 1,669 | — | — | 413 | 1,669 | 2,082 | 301 | 2012 | 2012 | 15-39 | |||||||||||||||||||||||||||||||||||||
| Weatherford |
OK | — | 357 | 1,419 | — | — | 357 | 1,419 | 1,776 | 266 | 2012 | 2012 | 15-39 | |||||||||||||||||||||||||||||||||||||
| Ardmore |
OK | — | 575 | 1,400 | — | — | 575 | 1,400 | 1,975 | 227 | 2013 | 2013 | 15-39 | |||||||||||||||||||||||||||||||||||||
| Wichita |
KS | — | 295 | 1,606 | — | — | 295 | 1,606 | 1,901 | 252 | 2013 | 2013 | 15-39 | |||||||||||||||||||||||||||||||||||||
| Bartlesville |
OK | — | 505 | 1,629 | — | — | 505 | 1,629 | 2,134 | 262 | 2013 | 2013 | 15-39 | |||||||||||||||||||||||||||||||||||||
| Melbourne |
FL | — | 3,320 | 13,281 | — | — | 3,320 | 13,281 | 16,601 | 2,490 | 1993 | 2012 | 15-39 | |||||||||||||||||||||||||||||||||||||
| Sarasota |
FL | — | 1,290 | 4,899 | — | — | 1,290 | 4,899 | 6,189 | 848 | 2002 | 2013 | 15-39 | |||||||||||||||||||||||||||||||||||||
| Sarasota |
FL | — | 934 | 5,013 | — | 282 | 934 | 5,295 | 6,229 | 836 | 2002 | 2013 | 15-39 | |||||||||||||||||||||||||||||||||||||
| Englewood |
FL | — | 207 | 679 | — | — | 207 | 679 | 886 | 116 | 1985 | 2013 | 15-39 | |||||||||||||||||||||||||||||||||||||
| Brookfield |
WI | — | 338 | 4,603 | — | — | 338 | 4,603 | 4,941 | 767 | 2005 | 2013 | 15-39 | |||||||||||||||||||||||||||||||||||||
| Waukesha |
WI | — | 302 | 11,218 | — | — | 302 | 11,218 | 11,520 | 1,724 | 2005 | 2013 | 15-39 | |||||||||||||||||||||||||||||||||||||
| Plainfield |
IL | — | 128 | 7,843 | 702 | 1,489 | 830 | 9,332 | 10,162 | 1,297 | 2012 | 2013 | 15-39 | |||||||||||||||||||||||||||||||||||||
| Greenfield |
WI | — | 212 | 7,163 | — | — | 212 | 7,163 | 7,375 | 1,097 | 2011 | 2013 | 15-39 | |||||||||||||||||||||||||||||||||||||
| Brookfield |
WI | — | 331 | 7,542 | — | — | 331 | 7,542 | 7,873 | 1,194 | 2008 | 2013 | 15-39 | |||||||||||||||||||||||||||||||||||||
| Goodyear |
AZ | — | 558 | 3,529 | — | — | 558 | 3,529 | 4,087 | 534 | 2013 | 2013 | 15-39 | |||||||||||||||||||||||||||||||||||||
| Richmond |
VA | — | 348 | 2,986 | — | — | 348 | 2,986 | 3,334 | 420 | 2011 | 2013 | 15-39 | |||||||||||||||||||||||||||||||||||||
| Montgomery |
AL | — | 94 | 1,303 | — | — | 94 | 1,303 | 1,397 | 214 | 2013 | 2013 | 15-39 | |||||||||||||||||||||||||||||||||||||
| Kingwood |
TX | — | 253 | 5,236 | — | — | 253 | 5,236 | 5,489 | 630 | 2009 | 2014 | 15-39 | |||||||||||||||||||||||||||||||||||||
| Lubbock |
TX | — | 1,616 | 6,195 | — | 135 | 1,616 | 6,330 | 7,946 | 751 | 2001 | 2014 | 15-39 | |||||||||||||||||||||||||||||||||||||
| Russellville |
AR | — | 1,232 | 4,752 | — | — | 1,232 | 4,752 | 5,984 | 653 | 2010 | 2014 | 15-39 | |||||||||||||||||||||||||||||||||||||
| Little Rock |
AR | — | 1,866 | 5,294 | — | — | 1,866 | 5,294 | 7,160 | 747 | 2012 | 2014 | 15-39 | |||||||||||||||||||||||||||||||||||||
F-102
Table of Contents
| Initial Costs to Company (A) |
Costs Capitalized Subsequent to Acquisition |
Gross Amount at Which Carried at Close of Period |
Life on Which Depreciation is Computed (Years) |
|||||||||||||||||||||||||||||||||||||||||||||||
| City |
State | Encumbrance | Land | Buildings and Improvements |
Land | Improvements | Land | Buildings and Improvements |
Total (B) | Accumulated Depreciation |
Date of Construction |
Date Acquired |
||||||||||||||||||||||||||||||||||||||
| Conway |
AR | — | 1,522 | 3,579 | — | 5,624 | 1,522 | 9,203 | 10,725 | 821 | 2007 | 2014 | 15-39 | |||||||||||||||||||||||||||||||||||||
| Hudsonville |
MI | — | 199 | 3,631 | — | — | 199 | 3,631 | 3,830 | 385 | 2007 | 2015 | 15-39 | |||||||||||||||||||||||||||||||||||||
| Franklin |
TN | — | 766 | 3,728 | — | — | 766 | 3,728 | 4,494 | 451 | 2005 | 2015 | 15-39 | |||||||||||||||||||||||||||||||||||||
| Elk Grove Village |
IL | — | 252 | 2,933 | — | — | 252 | 2,933 | 3,185 | 314 | 1985 | 2015 | 15-39 | |||||||||||||||||||||||||||||||||||||
| Virginia Beach |
VA | — | 827 | 3,310 | — | — | 827 | 3,310 | 4,137 | 262 | 2008 | 2016 | 15-39 | |||||||||||||||||||||||||||||||||||||
| Tampa |
FL | — | 42 | 6,945 | — | — | 42 | 6,945 | 6,987 | 378 | 1999 | 2016 | 39 | |||||||||||||||||||||||||||||||||||||
| Tampa |
FL | — | 8 | 732 | — | — | 8 | 732 | 740 | 40 | 1999 | 2016 | 39 | |||||||||||||||||||||||||||||||||||||
| Tampa |
FL | — | 33 | 2,094 | — | — | 33 | 2,094 | 2,127 | 114 | 2013 | 2016 | 39 | |||||||||||||||||||||||||||||||||||||
| Houston |
TX | — | 405 | 2,586 | — | — | 405 | 2,586 | 2,991 | 151 | 2002 | 2016 | 15-39 | |||||||||||||||||||||||||||||||||||||
| Mt. Dora |
FL | — | 1,338 | 4,788 | — | — | 1,338 | 4,788 | 6,126 | 482 | 1988 | 2015 | 15-39 | |||||||||||||||||||||||||||||||||||||
| Mt. Dora |
FL | — | 477 | 691 | — | — | 477 | 691 | 1,168 | 92 | 1987 | 2015 | 15-39 | |||||||||||||||||||||||||||||||||||||
| Summerfield |
FL | — | 295 | 2,146 | — | — | 295 | 2,146 | 2,441 | 216 | 2000 | 2015 | 15-39 | |||||||||||||||||||||||||||||||||||||
| Summerfield |
FL | — | 362 | 2,632 | — | — | 362 | 2,632 | 2,994 | 265 | 2008 | 2015 | 15-39 | |||||||||||||||||||||||||||||||||||||
| Leesburg |
FL | — | 402 | 1,869 | — | — | 402 | 1,869 | 2,271 | 201 | 1994 | 2015 | 15-39 | |||||||||||||||||||||||||||||||||||||
| Tempe |
AZ | — | 1,181 | 14,580 | — | — | 1,181 | 14,580 | 15,761 | 1,529 | 2006 | 2015 | 15-39 | |||||||||||||||||||||||||||||||||||||
| Lincoln |
NE | — | 1,300 | 13,163 | — | — | 1,300 | 13,163 | 14,463 | 1,319 | 1973 | 2015 | 15-39 | |||||||||||||||||||||||||||||||||||||
| North Little Rock |
AR | — | 532 | 51,843 | — | — | 532 | 51,843 | 52,375 | 4,391 | 2005 | 2015 | 15-39 | |||||||||||||||||||||||||||||||||||||
| Worthington |
OH | — | 264 | 12,053 | — | — | 264 | 12,053 | 12,317 | 878 | 1979 | 2016 | 15-39 | |||||||||||||||||||||||||||||||||||||
| Carmel |
IN | — | 243 | 3,519 | — | — | 243 | 3,519 | 3,762 | 343 | 2006 | 2016 | 15-39 | |||||||||||||||||||||||||||||||||||||
| Copley |
OH | — | 104 | 6,359 | — | — | 104 | 6,359 | 6,463 | 245 | 1996 | 2017 | 15-39 | |||||||||||||||||||||||||||||||||||||
| Cleveland |
OH | — | 323 | 2,744 | — | — | 323 | 2,744 | 3,067 | 116 | 2007 | 2017 | 15-39 | |||||||||||||||||||||||||||||||||||||
| Girard |
OH | — | 75 | 1,107 | — | — | 75 | 1,107 | 1,182 | 56 | 2003 | 2017 | 15-39 | |||||||||||||||||||||||||||||||||||||
| Moraine (Dayton) |
OH | — | 336 | 3,654 | — | 2 | 336 | 3,656 | 3,992 | 128 | 2017 | 2017 | 15-39 | |||||||||||||||||||||||||||||||||||||
| Commerce Township |
MI | — | 412 | 1,935 | — | 2 | 412 | 1,937 | 2,349 | 75 | 2007 | 2017 | 15-39 | |||||||||||||||||||||||||||||||||||||
| Modesto |
CA | — | 689 | 19,200 | — | — | 689 | 19,200 | 19,889 | 1,226 | 1984 | 2016 | 15-39 | |||||||||||||||||||||||||||||||||||||
| Modesto |
CA | — | 300 | 4,273 | — | — | 300 | 4,273 | 4,573 | 285 | 1984 | 2016 | 15-39 | |||||||||||||||||||||||||||||||||||||
| Clinton Township |
MI | — | 396 | 6,694 | — | 35 | 396 | 6,729 | 7,125 | 328 | 2016 | 2017 | 15-39 | |||||||||||||||||||||||||||||||||||||
| Westland |
MI | — | 394 | 6,106 | — | 9 | 394 | 6,115 | 6,509 | 286 | 1994 | 2017 | 15-39 | |||||||||||||||||||||||||||||||||||||
| Lenoir |
NC | — | 150 | 3,622 | — | — | 150 | 3,622 | 3,772 | 167 | 2010 | 2017 | 15-39 | |||||||||||||||||||||||||||||||||||||
| Morganton |
NC | — | 164 | 3,010 | — | — | 164 | 3,010 | 3,174 | 141 | 2000 | 2017 | 15-39 | |||||||||||||||||||||||||||||||||||||
| Rutherford College |
NC | — | 130 | 2,692 | — | — | 130 | 2,692 | 2,822 | 126 | 2007 | 2017 | 15-39 | |||||||||||||||||||||||||||||||||||||
| Hickory |
NC | — | 473 | 4,991 | — | — | 473 | 4,991 | 5,464 | 244 | 2000 | 2017 | 15-39 | |||||||||||||||||||||||||||||||||||||
| Newton |
NC | — | 195 | 1,085 | — | — | 195 | 1,085 | 1,280 | 56 | 1994 | 2017 | 15-39 | |||||||||||||||||||||||||||||||||||||
| Newton |
NC | — | 101 | 458 | — | — | 101 | 458 | 559 | 22 | 1998 | 2017 | 15-39 | |||||||||||||||||||||||||||||||||||||
| Wilson |
NC | — | 547 | 6,214 | — | 51 | 547 | 6,265 | 6,812 | 294 | 1993 | 2017 | 15-39 | |||||||||||||||||||||||||||||||||||||
| Overland Park |
KS | — | 456 | 3,789 | — | — | 456 | 3,789 | 4,245 | 147 | 2006 | 2017 | 15-39 | |||||||||||||||||||||||||||||||||||||
| Overland Park |
KS | — | 205 | 8,045 | — | — | 205 | 8,045 | 8,250 | 287 | 2016 | 2017 | 15-39 | |||||||||||||||||||||||||||||||||||||
| Overland Park |
KS | — | 571 | 3,715 | — | — | 571 | 3,715 | 4,286 | 173 | 1965 | 2017 | 15-39 | |||||||||||||||||||||||||||||||||||||
F-103
Table of Contents
| Initial Costs to Company (A) |
Costs Capitalized Subsequent to Acquisition |
Gross Amount at Which Carried at Close of Period |
Life on Which Depreciation is Computed (Years) |
|||||||||||||||||||||||||||||||||||||||||||||||
| City |
State | Encumbrance | Land | Buildings and Improvements |
Land | Improvements | Land | Buildings and Improvements |
Total (B) | Accumulated Depreciation |
Date of Construction |
Date Acquired |
||||||||||||||||||||||||||||||||||||||
| Crestview Hills |
KY | 5,051 | 192 | 8,342 | — | — | 192 | 8,342 | 8,534 | 266 | 2005 | 2017 | 15-39 | |||||||||||||||||||||||||||||||||||||
| Pittsburg |
KS | — | 103 | 2,264 | — | — | 103 | 2,264 | 2,367 | 70 | 2016 | 2017 | 15-39 | |||||||||||||||||||||||||||||||||||||
| Prairieville |
LA | — | 369 | 3,275 | — | — | 369 | 3,275 | 3,644 | 103 | 2016 | 2017 | 15-39 | |||||||||||||||||||||||||||||||||||||
| Charlotte |
NC | — | 825 | 4,969 | — | 14 | 825 | 4,983 | 5,808 | 151 | 1989 | 2017 | 15-39 | |||||||||||||||||||||||||||||||||||||
| Tulsa |
OK | — | 734 | 3,143 | — | — | 734 | 3,143 | 3,877 | 97 | 2016 | 2017 | 15-39 | |||||||||||||||||||||||||||||||||||||
| Rhinelander |
WI | — | 55 | 1,689 | — | — | 55 | 1,689 | 1,744 | 55 | 2013 | 2017 | 15-39 | |||||||||||||||||||||||||||||||||||||
| Charlotte |
NC | — | 534 | 1,101 | — | — | 534 | 1,101 | 1,635 | 58 | 1999 | 2017 | 15-39 | |||||||||||||||||||||||||||||||||||||
| Zionsville |
IN | — | 591 | 4,243 | — | — | 591 | 4,243 | 4,834 | 25 | 2016 | 2018 | 15-39 | |||||||||||||||||||||||||||||||||||||
| Noblesville |
IN | — | — | 6,216 | — | — | — | 6,216 | 6,216 | 33 | 2017 | 2018 | 15-39 | |||||||||||||||||||||||||||||||||||||
| Warren |
MI | — | 110 | 1,604 | — | — | 110 | 1,604 | 1,714 | 9 | 1998 | 2018 | 15-39 | |||||||||||||||||||||||||||||||||||||
| Tullahoma |
TN | — | 114 | 3,674 | — | — | 114 | 3,674 | 3,788 | 22 | 2003 | 2018 | 15-39 | |||||||||||||||||||||||||||||||||||||
| Brandon |
FL | — | 475 | 2,438 | — | — | 475 | 2,438 | 2,913 | 3 | 2008 | 2018 | 15-39 | |||||||||||||||||||||||||||||||||||||
| Atlanta |
GA | — | 2,397 | 12,271 | — | — | 2,397 | 12,271 | 14,668 | 14 | 1999 | 2018 | 15-39 | |||||||||||||||||||||||||||||||||||||
| Northfield |
IL | — | 548 | 4,184 | — | — | 548 | 4,184 | 4,732 | 5 | 1964 | 2018 | 15-39 | |||||||||||||||||||||||||||||||||||||
| Ann Arbor |
MI | — | 209 | 562 | — | — | 209 | 562 | 771 | 1 | 1954 | 2018 | 15-39 | |||||||||||||||||||||||||||||||||||||
| Southfield |
MI | — | 1,013 | 14,967 | — | — | 1,013 | 14,967 | 15,980 | 17 | 2004 | 2018 | 15-39 | |||||||||||||||||||||||||||||||||||||
| Clearwater |
FL | — | 819 | 961 | — | — | 819 | 961 | 1,780 | 1 | 1977 | 2018 | 15-39 | |||||||||||||||||||||||||||||||||||||
| Arlington |
TX | — | 1,931 | 15,873 | — | — | 1,931 | 15,873 | 17,804 | 18 | 2015 | 2018 | 15-39 | |||||||||||||||||||||||||||||||||||||
| Naperville |
IL | — | 711 | 5,349 | — | — | 711 | 5,349 | 6,060 | 6 | 2005 | 2018 | 15-39 | |||||||||||||||||||||||||||||||||||||
| Yorkville |
IL | — | 234 | 4,003 | — | — | 234 | 4,003 | 4,237 | 5 | 2000 | 2018 | 15-39 | |||||||||||||||||||||||||||||||||||||
| Yorkville |
IL | — | 260 | 1,944 | — | — | 260 | 1,944 | 2,204 | 2 | 2006 | 2018 | 15-39 | |||||||||||||||||||||||||||||||||||||
| Sycamore |
IL | — | 152 | 3,621 | — | — | 152 | 3,621 | 3,773 | 4 | 1999 | 2018 | 15-39 | |||||||||||||||||||||||||||||||||||||
| Sycamore |
IL | — | 13 | 282 | — | — | 13 | 282 | 295 | — | 1999 | 2018 | 15-39 | |||||||||||||||||||||||||||||||||||||
| Sandwich |
IL | — | 315 | 4,876 | — | — | 315 | 4,876 | 5,191 | 6 | 1995 | 2018 | 15-39 | |||||||||||||||||||||||||||||||||||||
| Olympia Fields |
IL | — | 565 | 5,698 | — | — | 565 | 5,698 | 6,263 | 7 | 2007 | 2018 | 15-39 | |||||||||||||||||||||||||||||||||||||
| Shelby |
NC | — | 124 | 2,217 | — | — | 124 | 2,217 | 2,341 | 2 | 2006 | 2018 | 15-39 | |||||||||||||||||||||||||||||||||||||
| Lacey |
WA | — | 2,441 | 15,769 | — | — | 2,441 | 15,769 | 18,210 | 18 | 2004 | 2018 | 15-39 | |||||||||||||||||||||||||||||||||||||
| Aberdeen |
WA | — | 899 | 4,482 | — | — | 899 | 4,482 | 5,381 | 5 | 2007 | 2018 | 15-39 | |||||||||||||||||||||||||||||||||||||
| Bremerton |
WA | — | 140 | 3,154 | — | — | 140 | 3,154 | 3,294 | 4 | 1999 | 2018 | 15-39 | |||||||||||||||||||||||||||||||||||||
| Spartanburg |
SC | — | 251 | 3,821 | — | — | 251 | 3,821 | 4,072 | 5 | 2006 | 2018 | 15-39 | |||||||||||||||||||||||||||||||||||||
| Newport News |
VA | — | 831 | 3,977 | — | — | 831 | 3,977 | 4,808 | 5 | 2004 | 2018 | 15-39 | |||||||||||||||||||||||||||||||||||||
| Newport News |
VA | — | 587 | 3,466 | — | — | 587 | 3,466 | 4,053 | 4 | 2006 | 2018 | 15-39 | |||||||||||||||||||||||||||||||||||||
| Hanover |
PA | — | 80 | 3,752 | — | — | 80 | 3,752 | 3,832 | 4 | 2003 | 2018 | 15-39 | |||||||||||||||||||||||||||||||||||||
| Roanoke |
VA | — | 267 | 3,027 | — | — | 267 | 3,027 | 3,294 | 3 | 1990 | 2018 | 15-39 | |||||||||||||||||||||||||||||||||||||
| Wayland |
MI | — | 373 | 2,592 | — | — | 373 | 2,592 | 2,965 | 3 | 1999 | 2018 | 15-39 | |||||||||||||||||||||||||||||||||||||
| Johnson City |
NY | — | 357 | 4,934 | — | — | 357 | 4,934 | 5,291 | 5 | 1970 | 2018 | 15-39 | |||||||||||||||||||||||||||||||||||||
| Bradenton |
FL | — | 547 | 5,055 | — | — | 547 | 5,055 | 5,602 | 6 | 1984 | 2018 | 15-39 | |||||||||||||||||||||||||||||||||||||
| Bradenton |
FL | — | 292 | 2,085 | — | — | 292 | 2,085 | 2,377 | 2 | 1982 | 2018 | 15-39 | |||||||||||||||||||||||||||||||||||||
| Bradenton |
FL | — | 112 | 1,167 | — | — | 112 | 1,167 | 1,279 | 1 | 1982 | 2018 | 15-39 | |||||||||||||||||||||||||||||||||||||
| Bradenton |
FL | — | 274 | 1,589 | — | — | 274 | 1,589 | 1,863 | 2 | 1995 | 2018 | 15-39 | |||||||||||||||||||||||||||||||||||||
| Ruskin |
FL | — | 203 | 1,526 | — | — | 203 | 1,526 | 1,729 | 3 | 2004 | 2018 | 15-39 | |||||||||||||||||||||||||||||||||||||
F-104
Table of Contents
| Initial Costs to Company (A) |
Costs Capitalized Subsequent to Acquisition |
Gross Amount at Which Carried at Close of Period |
Life on Which Depreciation is Computed (Years) |
|||||||||||||||||||||||||||||||||||||||||||||||
| City |
State | Encumbrance | Land | Buildings and Improvements |
Land | Improvements | Land | Buildings and Improvements |
Total (B) | Accumulated Depreciation |
Date of Construction |
Date Acquired |
||||||||||||||||||||||||||||||||||||||
| Office Properties: |
||||||||||||||||||||||||||||||||||||||||||||||||||
| Union Grove |
WI | — | 85 | 340 | — | — | 85 | 340 | 425 | 59 | 1993 | 2012 | 15-39 | |||||||||||||||||||||||||||||||||||||
| Milwaukee |
WI | — | 668 | 5,650 | — | — | 668 | 5,650 | 6,318 | 647 | 1989 | 2014 | 15-39 | |||||||||||||||||||||||||||||||||||||
| Mt. Pleasant |
TX | — | 2,214 | 3,717 | — | — | 2,214 | 3,717 | 5,931 | 573 | 2008 | 2014 | 15-39 | |||||||||||||||||||||||||||||||||||||
| Harleysville |
PA | — | 3,513 | 24,767 | — | — | 3,513 | 24,767 | 28,280 | 2,167 | 1950 | 2016 | 15-39 | |||||||||||||||||||||||||||||||||||||
| Harrisburg |
PA | — | 958 | 19,060 | — | — | 958 | 19,060 | 20,018 | 1,439 | 1976 | 2016 | 15-39 | |||||||||||||||||||||||||||||||||||||
| Wood Dale |
IL | — | 2,806 | 8,726 | — | — | 2,806 | 8,726 | 11,532 | 659 | 1986 | 2016 | 15-39 | |||||||||||||||||||||||||||||||||||||
| Milpitas |
CA | — | 1,478 | 8,164 | — | — | 1,478 | 8,164 | 9,642 | 501 | 1982 | 2016 | 15-39 | |||||||||||||||||||||||||||||||||||||
| Austin |
TX | — | 300 | 29,681 | — | 8,649 | 300 | 38,330 | 38,630 | 2,312 | 1984 | 2016 | 7-39 | |||||||||||||||||||||||||||||||||||||
| Melbourne |
FL | — | 1,701 | 12,141 | — | — | 1,701 | 12,141 | 13,842 | 723 | 2012 | 2016 | 15-39 | |||||||||||||||||||||||||||||||||||||
| Pittsford |
NY | — | 40 | 29,530 | — | 1,000 | 40 | 30,530 | 30,570 | 1,243 | 1975 | 2017 | 15-39 | |||||||||||||||||||||||||||||||||||||
| Mesa |
AZ | — | 785 | 5,034 | — | — | 785 | 5,034 | 5,819 | 162 | 1998 | 2017 | 15-39 | |||||||||||||||||||||||||||||||||||||
| Albuquerque |
NM | — | 987 | 11,357 | — | 3 | 987 | 11,360 | 12,347 | 346 | 1996 | 2017 | 15-39 | |||||||||||||||||||||||||||||||||||||
| Jacksonville |
FL | — | 1,251 | 19,784 | — | — | 1,251 | 19,784 | 21,035 | 598 | 1984 | 2017 | 15-39 | |||||||||||||||||||||||||||||||||||||
| Troy |
MI | — | 1,665 | 19,798 | — | 1 | 1,665 | 19,799 | 21,464 | 618 | 1984 | 2017 | 15-39 | |||||||||||||||||||||||||||||||||||||
| Tampa |
FL | — | 3,954 | 10,732 | — | — | 3,954 | 10,732 | 14,686 | 215 | 1984 | 2018 | 15-39 | |||||||||||||||||||||||||||||||||||||
| Carrollton |
TX | — | 3,743 | 28,025 | — | — | 3,743 | 28,025 | 31,768 | 357 | 1999 | 2018 | 15-39 | |||||||||||||||||||||||||||||||||||||
| Other Properties: |
||||||||||||||||||||||||||||||||||||||||||||||||||
| Rochester |
NY | 4,692 | 589 | 9,872 | — | — | 589 | 9,872 | 10,461 | 2,420 | 2001 | 2010 | 15-39 | |||||||||||||||||||||||||||||||||||||
| Knoxville |
TN | — | 744 | 2,246 | — | — | 744 | 2,246 | 2,990 | 576 | 1975 | 2011 | 15-39 | |||||||||||||||||||||||||||||||||||||
| Melbourne |
FL | — | 809 | 3,235 | — | — | 809 | 3,235 | 4,044 | 678 | 1998 | 2012 | 15-39 | |||||||||||||||||||||||||||||||||||||
| Groveport |
OH | — | 710 | 5,087 | — | — | 710 | 5,087 | 5,797 | 817 | 1979 | 2014 | 15-39 | |||||||||||||||||||||||||||||||||||||
| West Valley City |
UT | — | 1,336 | 5,822 | — | 10,000 | 1,336 | 15,822 | 17,158 | 2,610 | 1998 | 2014 | 15-39 | |||||||||||||||||||||||||||||||||||||
| San Jose |
CA | — | 914 | 2,704 | — | — | 914 | 2,704 | 3,618 | 238 | 1920 | 2016 | 15-27.5 | |||||||||||||||||||||||||||||||||||||
| Norman |
OK | — | 68 | 5,358 | — | — | 68 | 5,358 | 5,426 | 472 | 1965 | 2016 | 15-27.5 | |||||||||||||||||||||||||||||||||||||
| Corvallis |
OR | — | 122 | 1,114 | — | — | 122 | 1,114 | 1,236 | 100 | 1939 | 2016 | 15-27.5 | |||||||||||||||||||||||||||||||||||||
| Oneonta |
NY | — | 23 | 838 | — | — | 23 | 838 | 861 | 36 | 1893 | 2017 | 15-27.5 | |||||||||||||||||||||||||||||||||||||
| Lexington |
KY | — | 28 | 2,605 | — | — | 28 | 2,605 | 2,633 | 109 | 1985 | 2017 | 15-27.5 | |||||||||||||||||||||||||||||||||||||
| Tallahassee |
FL | 6,467 | 74 | 7,476 | — | — | 74 | 7,476 | 7,550 | 310 | 2015 | 2017 | 15-27.5 | |||||||||||||||||||||||||||||||||||||
| Greenville |
NC | — | 122 | 1,700 | — | — | 122 | 1,700 | 1,822 | 74 | 1923 | 2017 | 15-27.5 | |||||||||||||||||||||||||||||||||||||
| Indianapolis |
IN | — | 1,086 | 18,552 | — | 1,050 | 1,086 | 19,602 | 20,688 | 620 | 1995 | 2017 | 15-39 | |||||||||||||||||||||||||||||||||||||
| Acquisitions in Progress (C) |
— | — | 202 | — | — | — | 202 | 202 | ||||||||||||||||||||||||||||||||||||||||||
|
|
|
|
|
|
|
|
|
|
|
|
|
|
|
|
|
|
|
|||||||||||||||||||||||||||||||||
| Total (D) |
$ | 79,451 | $ | 410,546 | $ | 2,399,494 | $ | 497 | $ | 38,198 | $ | 411,043 | $ | 2,437,692 | $ | 2,848,735 | $ | 206,989 | ||||||||||||||||||||||||||||||||
|
|
|
|
|
|
|
|
|
|
|
|
|
|
|
|
|
|
|
|||||||||||||||||||||||||||||||||
Notes:
| (A) | The initial cost to the Company represents the original purchase price of the property (see Note 4). |
| (B) | The aggregate cost of real estate owned as of December 31, 2018 for U.S. federal income tax purposes was approximately $3,000,000. |
| (C) | Acquisition costs in progress represents costs incurred during the year ended December 31, 2018 related to asset acquisitions expected to close during the year ended December 31, 2019. |
| (D) | This schedule excludes properties subject to leases that are classified as direct financing leases. |
F-105
Table of Contents
Change in Total Real Estate Assets
| For the years ended December 31, | ||||||||||||
| 2018 | 2017 | 2016 | ||||||||||
| Balance, beginning of period |
$ | 2,334,524 | $ | 1,743,403 | $ | 1,306,515 | ||||||
| Acquisitions and building improvements |
568,036 | 640,961 | 469,460 | |||||||||
| Dispositions |
(51,950 | ) | (47,181 | ) | (32,572 | ) | ||||||
| Impairment |
(1,875 | ) | (2,659 | ) | — | |||||||
|
|
|
|
|
|
|
|||||||
| Balance, end of period |
$ | 2,848,735 | $ | 2,334,524 | $ | 1,743,403 | ||||||
|
|
|
|
|
|
|
|||||||
Change in Accumulated Depreciation
| For the years ended December 31, | ||||||||||||
| 2018 | 2017 | 2016 | ||||||||||
| Balance, beginning of period |
$ | 148,383 | $ | 105,703 | $ | 70,171 | ||||||
| Acquisitions and building improvements |
66,156 | 49,832 | 37,976 | |||||||||
| Dispositions |
(7,376 | ) | (6,942 | ) | (2,444 | ) | ||||||
| Impairment |
(174 | ) | (210 | ) | — | |||||||
|
|
|
|
|
|
|
|||||||
| Balance, end of period |
$ | 206,989 | $ | 148,383 | $ | 105,703 | ||||||
|
|
|
|
|
|
|
|||||||
F-106
Table of Contents
S-X 3-14 Financial Statements of Industrial Portfolio Acquisition
INDEPENDENT AUDITORS’ REPORT
To the Board of Directors and Stockholders of Broadstone Net Lease, Inc.
We have audited the accompanying Combined Statement of Revenues and Certain Operating Expenses of the portfolio of 23 triple-net leased industrial and office/flex properties (the “Acquired Industrial and Office Portfolio”) acquired by Broadstone Net Lease, Inc. and its wholly owned subsidiaries (the “Company”) for the year ended December 31, 2018, and the related notes (the “Historical Summary”). The properties within the Acquired Industrial and Office Portfolio are under common ownership and management.
Management’s Responsibility for the Historical Summary
Management is responsible for the preparation and fair presentation of the Historical Summary in accordance with accounting principles generally accepted in the United States of America; this includes the design, implementation, and maintenance of internal control relevant to the preparation and fair presentation of the Historical Summary that is free from material misstatement, whether due to fraud or error.
Auditors’ Responsibility
Our responsibility is to express an opinion on the Historical Summary based on our audit. We conducted our audit in accordance with auditing standards generally accepted in the United States of America. Those standards require that we plan and perform the audit to obtain reasonable assurance about whether the Historical Summary is free from material misstatement.
An audit involves performing procedures to obtain audit evidence about the amounts and disclosures in the Historical Summary. The procedures selected depend on the auditor’s judgment, including the assessment of the risks of material misstatement of the Historical Summary, whether due to fraud or error. In making those risk assessments, the auditor considers internal control relevant to the Company’s preparation and fair presentation of the Historical Summary in order to design audit procedures that are appropriate in the circumstances, but not for the purpose of expressing an opinion on the effectiveness of the Acquired Industrial and Office Portfolio’s internal control. Accordingly, we express no such opinion. An audit also includes evaluating the appropriateness of accounting policies used and the reasonableness of significant accounting estimates made by management, as well as evaluating the overall presentation of the Historical Summary.
We believe that the audit evidence we have obtained is sufficient and appropriate to provide a basis for our audit opinion.
Opinion
In our opinion, the Historical Summary referred to above presents fairly, in all material respects, the revenues and certain operating expenses described in Note 1 of the Acquired Industrial and Office Portfolio for the year ended December 31, 2018, in accordance with accounting principles generally accepted in the United States of America.
Emphasis of Matter
We draw attention to Note 1 to the Historical Summary, which describes that the accompanying Historical Summary was prepared in accordance with Rule 3-14 of Regulation S-X promulgated under the Securities Act of 1933, as amended (for inclusion in the Current Report on Form 8-K/A of Broadstone Net Lease, Inc.) and is not intended to be a complete presentation of the Acquired Industrial and Office Portfolio’s revenues and expenses. Our opinion is not modified with respect to this matter.
/s/ Deloitte & Touche LLP
Rochester, New York
October 11, 2019
F-107
Table of Contents
Acquired Industrial and Office Portfolio
Combined Statements of Revenues and Certain Operating Expenses
For the Six Months Ended June 30, 2019 (Unaudited) and Year Ended December 31, 2018
(in thousands)
| Six Months Ended June 30, 2019 (unaudited) |
Year Ended December 31, 2018 |
|||||||
| Revenues |
||||||||
| Lease revenues |
$ | 24,706 | $ | 49,099 | ||||
|
|
|
|
|
|||||
| Certain operating expenses |
||||||||
| Property and operating expenses |
751 | 1,493 | ||||||
|
|
|
|
|
|||||
| Total certain operating expenses |
751 | 1,493 | ||||||
|
|
|
|
|
|||||
| Revenues in excess of certain operating expenses |
$ | 23,955 | $ | 47,606 | ||||
|
|
|
|
|
|||||
The accompanying notes are an integral part of these combined statements of revenues and certain operating expenses.
F-108
Table of Contents
Acquired Industrial and Office Portfolio
Notes to Combined Statements of Revenues and Certain Operating Expenses
Six Months Ended June 30, 2019 (Unaudited) and Year Ended December 31, 2018
(in thousands)
1. Organization and Basis of Presentation
On August 29, 2019, Broadstone Net Lease, Inc. and its wholly owned subsidiaries (collectively, the “Company”) acquired a portfolio of 23 triple-net leased industrial and office/flex properties, comprising 6.9 million rentable square feet (unaudited), for an aggregate purchase price of approximately $735.7 million, excluding capitalized acquisition costs (the “Acquired Industrial and Office Portfolio”). The properties are located across 14 states in the continental United States, with one property located in British Columbia, Canada. The properties within the Acquired Industrial and Office Portfolio are under common ownership and management.
The accompanying Combined Statements of Revenues and Certain Operating Expenses (the “Historical Summary”) have been prepared in accordance with Rule 3-14 of Regulation S-X promulgated under the Securities Act of 1933, as amended, which requires certain information with respect to real estate operations to be included with certain filings with the Securities and Exchange Commission. The Historical Summary is not representative of the actual operations for the periods presented as it excludes certain historical items, such as depreciation and amortization, interest expense, amortization of above and below market leases, and other costs not directly related to the future operations of the Acquired Industrial and Office Portfolio.
The Historical Summary and notes thereto for the six months ended June 30, 2019 included in this report are unaudited. In the opinion of management, all adjustments necessary for a fair presentation of the Historical Summary have been included. Such adjustments consisted of normal recurring items. Interim results are not necessarily indicative of results for a full year.
2. Summary of Significant Accounting Policies
Use of Estimates
The preparation of financial statements in conformity with accounting principles generally accepted in the United States of America (“GAAP”) requires management to make certain estimates and assumptions that may affect the reported amounts in the Historical Summary and related notes. Actual results may differ from those estimates.
Revenue Recognition
All of the Acquired Industrial and Office Portfolio’s leases are classified as operating leases. Revenue is recognized as rents are earned on a straight-line basis over the non-cancelable terms of the related leases. Certain of the leases provide for rent escalation indexed to future changes in the Consumer Price Index. Lease revenue associated with such provisions is considered variable lease revenue, and is not included in the calculation of straight-line rental revenue. Such amounts are recognized as income when the amounts are determinable.
A majority of the Acquired Industrial and Office Portfolio’s properties are leased on a triple-net basis, which provides that the tenants are responsible for the payment of all property operating expenses, including, but not limited to, property taxes, maintenance, insurance, repairs, and capital costs, during the lease term. The Acquired Industrial and Office Portfolio records such expenses on a net basis. For a portion of the leases, the Acquired Industrial and Office Portfolio pays for certain expenses, such as real estate taxes and property insurance, and is subsequently reimbursed by the tenant. Such items are presented on a gross basis in the Historical Summary, meaning that amounts billed to tenants for such expenses are included in Lease revenues and amounts reimbursed by tenants are included in Property and operating expenses.
F-109
Table of Contents
3. Leases
The following table summarizes the amounts reported as Lease revenues in the Historical Summary:
| (in thousands) | Six Months Ended June 30, 2019 (unaudited) |
Year Ended December 31, 2018 |
||||||
| Revenues |
||||||||
| Rental income from operating leases |
$ | 23,955 | $ | 47,606 | ||||
| Operating expenses billed to tenants |
751 | 1,493 | ||||||
|
|
|
|
|
|||||
| Total lease revenues |
$ | 24,706 | $ | 49,099 | ||||
|
|
|
|
|
|||||
At June 30, 2019, estimated lease payments to be received under non-cancelable operating leases with tenants are as follows (unaudited):
| (in thousands) | ||||
| Remainder of 2019 |
$ | 23,161 | ||
| 2020 |
47,171 | |||
| 2021 |
48,406 | |||
| 2022 |
49,190 | |||
| 2023 |
50,203 | |||
| Thereafter |
382,726 | |||
|
|
|
|||
| $ | 600,857 | |||
|
|
|
|||
Since lease renewal periods are exercisable at the option of the tenant, the above amounts only include future lease payments due during the initial lease terms. In addition, such amounts exclude any potential variable rent increases that are based solely on changes in the Consumer Price Index.
4. Tenant Concentrations
One lease with a single tenant, and associated with three properties, comprised 12.2% of the Acquired Industrial and Office Portfolio’s rental income from operating leases for the year ended December 31, 2018, and 12.1% (unaudited) of rental income from operating leases for the six months ended June 30, 2019.
5. Commitments and Contingencies
The Acquired Industrial and Office Portfolio is presently not subject to material litigation nor, to management’s knowledge, is any material litigation threatened against the Acquired Industrial and Office Portfolio.
6. Subsequent Events
In preparing the accompanying Historical Summary, management evaluated events and transactions that occurred through the date that the accompanying financial statements were available to be issued on October 11, 2019.
F-110
Table of Contents
S-X 3-05 Financial Statements of Broadstone Real Estate, LLC
In connection with the proposed Internalization, which is expected to close in the first quarter of 2020, the Company expects to provide financial statements of Broadstone Real Estate, LLC, consistent with Regulation S-X Article 3-05.
F-111
Table of Contents
[PROSPECTUS ART – TO BE INCLUDED IN A SUBSEQUENT SUBMISSION / AMENDMENT]
Table of Contents
Broadstone Net Lease, Inc.
Shares of Class A Common Stock
PROSPECTUS
Joint Book-Running Managers
J.P. Morgan
Goldman Sachs & Co. LLC
Through and including , 2020 (the 25th day after the date of this prospectus), all dealers effecting transactions in these securities, whether or not participating in this offering, may be required to deliver a prospectus. This is in addition to a dealer’s obligation to deliver a prospectus when acting as an underwriter and with respect to an unsold allotment or subscription.
Table of Contents
PART II
INFORMATION NOT REQUIRED IN PROSPECTUS
Item 31. Other Expenses of Issuance and Distribution.
The following table itemizes the expenses incurred by us in connection with the issuance and registration of the securities being registered hereunder. All amounts shown are estimates except for the SEC registration fee and the Financial Industry Regulatory Authority, Inc., or FINRA, filing fee and the NYSE listing fee.
| SEC Registration Fee |
$ | * | ||
| FINRA Filing Fee |
* | |||
| NYSE Listing Fees |
* | |||
| Accounting Fees and Expenses |
* | |||
| Legal Fees and Expenses |
* | |||
| Printing Fees and Expenses |
* | |||
| Transfer Agent and Registrar Fees |
* | |||
| Miscellaneous |
* | |||
| Total |
$ | * | ||
|
|
|
| * | To be filed by amendment. |
Item 32. Sales to Special Parties.
None.
Item 33. Recent Sales of Unregistered Securities.
During the three years ended December 31, 2019, we issued an aggregate of 9.76 million shares of our Common Stock to investors in capital raising transactions for an aggregate purchase price of $808.7 million and we issued 1.93 million shares of our Common Stock to investors pursuant to our distribution reinvestment plan for an aggregate purchase price of $156.9 million.
In each case, the aforementioned securities were issued in reliance on the exemption set forth in Section 4(a)(2) of the Securities Act.
Item 34. Indemnification of Directors and Officers.
Maryland law permits a Maryland corporation to include in its charter a provision limiting the liability of its directors and officers to the corporation and its stockholders for money damages except for liability resulting from actual receipt of an improper benefit or profit in money, property, or services or active and deliberate dishonesty that is established by a final judgment and is material to the cause of action. Our Charter contains such a provision that eliminates such liability to the maximum extent permitted by Maryland law.
The MGCL requires a Maryland corporation (unless its charter provides otherwise, which our Charter does not) to indemnify a director or officer who has been successful, on the merits or otherwise, in the defense of any proceeding to which he or she is made or threatened to be made a party by reason of his or her service in that capacity. The MGCL permits a Maryland corporation to indemnify its present and former directors and officers, among others, against judgments, penalties, fines, settlements, and reasonable expenses actually incurred by them
II-1
Table of Contents
in connection with any proceeding to which they may be made or are threatened to be made a party by reason of their service in those or other capacities unless it is established that:
| • | the act or omission of the director or officer was material to the matter giving rise to the proceeding and |
| • | was committed in bad faith; or |
| • | was the result of active and deliberate dishonesty; |
| • | the director or officer actually received an improper personal benefit in money, property or services; or |
| • | in the case of any criminal proceeding, the director or officer had reasonable cause to believe that the act or omission was unlawful. |
However, under the MGCL, a Maryland corporation may not indemnify a director or officer for an adverse judgment in a suit by or on behalf of the corporation or if the director or officer was adjudged liable on the basis that personal benefit was improperly received, unless, in either case, a court orders indemnification and then only for expenses. A court may order indemnification if it determines that the director or officer is fairly and reasonably entitled to indemnification, even though the director or officer did not meet the prescribed standard of conduct or was adjudged liable on the basis that personal benefit was improperly received.
The Charter provides, as permitted by the MGCL, that we may advance reasonable expenses incurred by a director or officer who is party to a proceeding in advance of the final disposition of the proceeding upon our receipt of:
| • | a written affirmation by the director or officer of his or her good faith belief that he or she has met the standard of conduct necessary for indemnification by us; and |
| • | a written undertaking by the director or officer or on his or her behalf to repay the amount advanced to him or her if it is ultimately determined that the standard of conduct for indemnification by us was not met. |
Our Charter also requires us to provide the same indemnification and advancement of expenses that we are permitted to provide to directors and officers to any person who served as an employee or agent of our Company or an employee or agent of BRE.
We have entered into indemnification agreements with each of our directors and executive officers. The indemnification agreements require that, subject to certain conditions, we indemnify each director and officer to the fullest extent permitted by law against any and all liabilities and expenses to which they may become subject by reason of their service as a director, officer, employee, or agent of our Company, and that we advance to each director and officer all related expenses incurred by each director or officer in defense of any claim or proceeding without any preliminary determination of the director’s or officer’s entitlement to indemnification; provided, that any amounts advanced will be refunded to us by the indemnified director or officer if it is ultimately determined that they did not meet the standard of conduct necessary for indemnification. The indemnification agreements also require that we maintain directors’ and officers’ liability insurance covering our directors and officers on terms at least as favorable as the policy coverage in place as of the date each indemnification agreement is entered into. Each indemnification agreement may only amended by the mutual written agreement of our Company and the director or officer party thereto.
Insofar as indemnification for liabilities arising under the Securities Act may be permitted to directors, officers or persons controlling our Company pursuant to the foregoing provisions, we have been informed that in the opinion of the SEC such indemnification is against public policy as expressed in the Securities Act and is therefore unenforceable.
II-2
Table of Contents
Item 35. Treatment of Proceeds from Stock Being Registered.
The consideration to be received by us from the securities registered hereunder will be credited to the appropriate capital account.
Item 36. Financial Statements and Exhibits.
(A) Financial Statements: See Index to Financial Statements.
(B) Exhibits: The following exhibits are filed as part of, or incorporated by reference into, this registration statement on Form S-11:
| Exhibit |
Description | |
| #1.1 | Form of Underwriting Agreement | |
| 2.1 | Agreement and Plan of Merger, dated as of November 11, 2019, by and among Broadstone Net Lease, Inc., Broadstone Net Lease, LLC, Broadstone Net Lease Sub 1, Inc., Broadstone Net Lease Sub 2, Inc., Broadstone Real Estate, LLC, Trident BRE Holdings I, Inc., Trident BRE Holdings II, Inc. and, solely for purposes of Sections 6.18, 6.19 and 6.20, Trident BRE Holdings I, L.P. and Trident BRE Holdings II, L.P. (filed as Exhibit 2.1 to the Company’s Current Report on Form 8-K filed November 12, 2019, and incorporated herein by reference) | |
| 3.1 | Articles of Incorporation of Broadstone Net Lease, Inc. (filed as Exhibit 3.1 to the Company’s General Form for Registration of Securities on Form 10 filed on April 24, 2017, and incorporated herein by reference) | |
| #3.2 | Form of Articles Supplementary of Broadstone Net Lease, Inc. | |
| #3.3 | Form of Articles of Amendment of Broadstone Net Lease, Inc. | |
| #3.4 | Form of Articles of Amendment of Broadstone Net Lease, Inc. | |
| #3.5 | Form of Articles of Restatement of Broadstone Net Lease, Inc. | |
| #3.6 | Form of Second Amended and Restated Bylaws of Broadstone Net Lease, Inc., to be in effect upon the completion of this offering | |
| #4.1 | Form of Class A Common Stock Certificate of Broadstone Net Lease, Inc. | |
| #5.1 | Opinion of Ballard Spahr LLP | |
| #8.1 | Opinion of Fried, Frank, Harris, Shriver & Jacobson LLP with respect to certain tax matters | |
| #10.1 | Form of Second Amended and Restated Limited Liability Company Agreement of Broadstone Net Lease, LLC to be in effect upon the completion of this offering | |
| #10.2 | Registration Rights Agreement between Broadstone Net Lease, Inc. and the persons named therein | |
| #†10.3 | Form of Broadstone Net Lease, Inc. and Broadstone Net Lease, LLC 2020 Equity Incentive Plan | |
| #†10.4 | Form of 2020 Equity Incentive Plan Restricted Stock Award Grant Notice and Agreement for directors | |
| #†10.5 | Form of 2020 Equity Incentive Plan Restricted Stock Award Grant Notice and Agreement for employees | |
| 10.6 | Credit Agreement, dated as of October 2, 2012, by and among Broadstone Net Lease, Inc., Broadstone Net Lease, LLC, Manufacturers and Traders Trust Company, as administrative agent, and the lenders party thereto, among others (the “Credit Agreement”) (filed as Exhibit 10.5 to the Company’s Amended Registration Statement on Form 10 filed June 1, 2017 and incorporated herein by reference) | |
II-3
Table of Contents
| Exhibit |
Description | |
| 10.7 | First Amendment to Credit Agreement, dated as of June 27, 2014, by and among Broadstone Net Lease, Inc., Broadstone Net Lease, LLC, Manufacturers and Traders Trust Company, as administrative agent, and the lenders party thereto (filed as Exhibit 10.6 to the Company’s Amended Registration Statement on Form 10 filed June 1, 2017 and incorporated herein by reference) | |
| 10.8 | Second Amendment to Credit Agreement, dated as of December 22, 2014, by and among Broadstone Net Lease, Inc., Broadstone Net Lease, LLC, Manufacturers and Traders Trust Company, as administrative agent, and the lenders party thereto (filed as Exhibit 10.7 to the Company’s Registration Statement on Form 10 filed April 24, 2017 and incorporated herein by reference) | |
| 10.9 | Third Amendment to Credit Agreement, dated as of November 6, 2015, by and among Broadstone Net Lease, Inc., Broadstone Net Lease, LLC, Manufacturers and Traders Trust Company, as administrative agent, and the lenders party thereto (filed as Exhibit 10.8 to the Company’s Registration Statement on Form 10 filed April 24, 2017 and incorporated herein by reference) | |
| 10.10 | Fourth Amendment to Credit Agreement, dated as of June 30, 2016, by and among Broadstone Net Lease, Inc., Broadstone Net Lease, LLC, Manufacturers and Traders Trust Company, as administrative agent, and the lenders party thereto (filed as Exhibit 10.9 to the Company’s Registration Statement on Form 10 filed April 24, 2017 and incorporated herein by reference) | |
| 10.11 | Fifth Amendment to Credit Agreement, dated as of December 23, 2016, by and among Broadstone Net Lease, Inc., Broadstone Net Lease, LLC, Manufacturers and Traders Trust Company, as administrative agent, and the lenders party thereto (filed as Exhibit 10.10 to the Company’s Registration Statement on Form 10 filed on April 24, 2017 and incorporated herein by reference) | |
| 10.12 | Sixth Amendment to Credit Agreement and Agreement regarding Commitment Increases and Additional Term Loans, dated as of March 23, 2017, by and among Broadstone Net Lease, Inc., Broadstone Net Lease, LLC, Manufacturers and Traders Trust Company, as administrative agent, and the lenders party thereto (filed as Exhibit 10.11 to the Company’s Registration Statement on Form 10 filed April 24, 2017 and incorporated herein by reference) | |
| 10.13 | Seventh Amendment to Credit Agreement, dated as of May 25, 2017, by and among Broadstone Net Lease, Inc., Broadstone Net Lease, LLC, Manufacturers and Traders Trust Company, as administrative agent, and the lenders party thereto (filed as Exhibit 10.26 to the Company’s Amended Registration Statement on Form 10 filed June 1, 2017 and incorporated herein by reference) | |
| 10.14 | Term Loan Agreement, dated as of May 24, 2013, by and among Broadstone Net Lease, Inc., Broadstone Net Lease, LLC, Regions Bank, as administrative agent, and the lenders party thereto, among others (“Regions Term Loan Agreement”) (filed as Exhibit 10.12 to the Company’s Amended Registration Statement on Form 10 filed June 1, 2017 and incorporated herein by reference) | |
| 10.15 | First Amendment to Regions Term Loan Agreement, dated as of October 11, 2013, by and among Broadstone Net Lease, Inc., Broadstone Net Lease, LLC and Regions Bank, as administrative agent, and the lenders party thereto (filed as Exhibit 10.13 to the Company’s Registration Statement on Form 10 filed April 24, 2017 and incorporated herein by reference) | |
| 10.16 | Second Amendment to Regions Term Loan Agreement, dated as of November 6, 2015, by and among Broadstone Net Lease, Inc., Broadstone Net Lease, LLC, Regions Bank, as administrative agent, and the lenders party thereto (filed as Exhibit 10.14 to the Company’s Registration Statement on Form 10 filed April 24, 2017 and incorporated herein by reference) | |
| 10.17 | Third Amendment to Regions Term Loan Agreement, dated as of June 30, 2016, by and among Broadstone Net Lease, Inc., Broadstone Net Lease, LLC, Regions Bank, as administrative agent, and the lenders party thereto (filed as Exhibit 10.15 to the Company’s Registration Statement on Form 10 filed April 24, 2017 and incorporated herein by reference) | |
II-4
Table of Contents
| Exhibit |
Description | |
| 10.18 | Fourth Amendment to Regions Term Loan Agreement, dated as of December 23, 2016, by and among Broadstone Net Lease, Inc., Broadstone Net Lease, LLC, Regions Bank, as administrative agent, and the lenders party thereto (filed as Exhibit 10.16 to the Company’s Registration Statement on Form 10 filed April 24, 2017 and incorporated herein by reference) | |
| 10.19 | Term Loan Agreement, dated as of November 6, 2015, by and among Broadstone Net Lease, Inc., Broadstone Net Lease, LLC, SunTrust Bank, as administrative agent, and the lenders party thereto, among others (“SunTrust Term Loan Agreement”) (filed as Exhibit 10.17 to the Company’s Amended Registration Statement on Form 10 filed June 1, 2017 and incorporated herein by reference) | |
| 10.20 | First Amendment to SunTrust Term Loan Agreement, dated as of June 30, 2016, by and among Broadstone Net Lease, Inc., Broadstone Net Lease, LLC, SunTrust Bank, as administrative agent, and the lenders party thereto (filed as Exhibit 10.18 to the Company’s Registration Statement on Form 10 filed April 24, 2017 and incorporated herein by reference) | |
| 10.21 | Second Amendment to SunTrust Term Loan Agreement, dated as of December 23, 2016, by and among Broadstone Net Lease, Inc., Broadstone Net Lease, LLC, SunTrust Bank, as administrative agent, and the lenders party thereto (filed as Exhibit 10.19 to the Company’s Registration Statement on Form 10 filed April 24, 2017 and incorporated herein by reference) | |
| 10.22 | Guaranty, dated as of October 2, 2012, by Broadstone Net Lease, Inc. and Broadstone Net Lease, LLC, among others, in favor of Manufacturers and Traders Trust Company, as administrative agent, and the lenders party to the Credit Agreement (filed as Exhibit 10.20 to the Company’s Registration Statement on Form 10 filed April 24, 2017 and incorporated herein by reference) | |
| 10.23 | Guaranty, dated as of May 24, 2013, by Broadstone Net Lease, Inc. and Broadstone Net Lease, LLC, among others, in favor of Regions Bank, as administrative agent, and the lenders party to the Regions Term Loan Agreement (filed as Exhibit 10.21 to the Company’s Registration Statement on Form 10 filed April 24, 2017 and incorporated herein by reference) | |
| 10.24 | Guaranty, dated as of November 6, 2015, by Broadstone Net Lease, Inc. and Broadstone Net Lease, LLC, among others, in favor of SunTrust Bank, as administrative agent, and the lenders party to the SunTrust Term Loan Agreement (filed as Exhibit 10.22 to the Company’s Registration Statement on Form 10 filed April 24, 2017 and incorporated herein by reference) | |
| 10.25 | Note and Guaranty Agreement, dated as of March 16, 2017, for 4.84% Guaranteed Senior Notes due April 18, 2027, by and among Broadstone Net Lease, Inc., Broadstone Net Lease, LLC, and the purchasers party thereto (filed as Exhibit 10.23 to the Company’s Registration Statement on Form 10 filed April 24, 2017 and incorporated herein by reference) | |
| 10.26 | Form of Indemnification Agreement, between Broadstone Net Lease, Inc. and each of its officers and directors (filed as Exhibit 10.25 to the Company’s Registration Statement on Form 10 filed April 24, 2017 and incorporated herein by reference) | |
| 10.27 | Revolving Credit and Term Loan Agreement, dated as of June 23, 2017, by and among Broadstone Net Lease, LLC, Broadstone Net Lease, Inc., Manufacturers and Traders Trust Company, as administrative agent, and the lenders party thereto, among others (filed as Exhibit 10.1 to the Company’s Current Report on Form 8-K filed June 29, 2017, and incorporated herein by reference) | |
| 10.28 | Amended and Restated Term Loan Agreement, dated as of June 23, 2017, by and among Broadstone Net Lease, LLC, Broadstone Net Lease, Inc., SunTrust Bank, as administrative agent, and the lenders party thereto, among others (filed as Exhibit 10.2 to the Company’s Current Report on Form 8-K filed June 29, 2017, and incorporated herein by reference) | |
II-5
Table of Contents
| Exhibit |
Description | |
| 10.29 | Consent and Agreement Regarding Commitment Increases and Additional Term Loans, dated as of November 20, 2017, by and among Broadstone Net Lease, Inc., Broadstone Net Lease, LLC, Manufacturers and Traders Trust Company, as administrative agent, and the lenders party thereto (filed as Exhibit 10.1 to the Company’s Current Report on Form 8-K filed November 27, 2017, and incorporated herein by reference) | |
| 10.30 | Note and Guaranty Agreement, dated as of July 2, 2018, for 5.09% Series B Guaranteed Senior Notes due July 2, 2028 and 5.19% Series C Guaranteed Senior Notes due July 2, 2030, by and among Broadstone Net Lease, Inc., Broadstone Net Lease, LLC, and the purchasers party thereto (filed as Exhibit 10.1 to the Company’s Current Report on Form 8-K filed July 6, 2018, and incorporated herein by reference) | |
| 10.31 | Term Loan Agreement, dated as of February 27, 2019, by and among Broadstone Net Lease, Inc., Broadstone Net Lease, Capital One, National Association, and the other parties thereto (“Capital One Term Loan Agreement”) (filed as Exhibit 10.1 to the Company’s Current Report on Form 8-K filed on March 5, 2019, and incorporated herein by reference) | |
| 10.32 | First Amendment to Capital One Term Loan Agreement, dated as of July 1, 2019, by and among Broadstone Net Lease, Inc., Broadstone Net Lease, Capital One, National Association, as administrative agent, and the lenders party thereto (filed as Exhibit 10.1 to the Company’s Quarterly Report on Form 10-Q for the period ended September 30, 2019, and incorporated herein by reference) | |
| 10.33 | Guaranty, dated as of February 27, 2019, by Broadstone Net Lease, Inc. in favor of Capital One, National Association, as administrative agent, and the lenders party to the Capital One Term Loan Agreement (filed as Exhibit 10.3 to the Company’s Current Report on Form 8-K filed on March 5, 2019, and incorporated herein by reference) | |
| 10.34 | First Amendment and Agreement Regarding Commitment Increases, dated February as of 28, 2019, by and among Broadstone Net Lease, Inc., Broadstone Net Lease, LLC, Manufacturers and Traders Trust Company and the other parties thereto (filed as Exhibit 10.2 to the Company’s Current Report on Form 8-K filed on March 5, 2019, and incorporated herein by reference) | |
| 10.35 | Partial Assignment and Assumption of Purchase Agreement, dated July 23, 2019, by and among the Assignees thereto, CF Alpha & Golf Propco LLC, CF Alpha & Golf KS Propco LLC, CF Alpha & Golf MA Propco LLC, and CF Alpha & Golf Property BC ULC (filed as Exhibit 10.2 to the Company’s Quarterly Report on Form 10-Q for the period ended September 30, 2019, and incorporated herein by reference) | |
| 10.36 | Second Amendment to Revolving Credit and Term Loan Agreement, dated as of July 1, 2019, by and among Broadstone Net Lease, Inc., Broadstone Net Lease, LLC, Manufacturers and Traders Trust Company, and the other parties thereto (filed as Exhibit 10.1 to the Company’s Current Report on Form 8-K filed July 3, 2019, and incorporated herein by reference) | |
| 10.37 | Term Loan Agreement, dated as of August 2, 2019, by and among Broadstone Net Lease, Inc., Broadstone Net Lease, LLC, JPMorgan Chase Bank, N.A., BMO Capital Markets Corp., Capital One, National Association, Regions Bank, Regions Capital Markets and the other lenders party thereto (filed as Exhibit 10.1 to the Company’s Current Report on Form 8-K filed August 7, 2019, and incorporated herein by reference) | |
| 10.38 | Guaranty, dated as of August 2, 2019, by Broadstone Net Lease, Inc. in favor of JPMorgan Chase Bank, N.A. (filed as Exhibit 10.2 to the Company’s Current Report on Form 8-K filed August 7, 2019, and incorporated herein by reference) | |
| #21.1 | List of Subsidiaries of Broadstone Net Lease, Inc. | |
| #23.1 | Consent of Deloitte & Touche LLP | |
II-6
Table of Contents
| Exhibit |
Description | |
| #23.2 | Consent of Ballard Spahr LLP (contained in Exhibit 5.1) | |
| #23.3 | Consent of Fried, Frank, Harris, Shriver & Jacobson LLP (contained in Exhibit 8.1) | |
| #23.4 | Consent of Rosen Consulting Group | |
| # | To be filed by amendment. |
| † | Indicates management contract or compensatory plan. |
Item 37. Undertakings.
The undersigned registrant hereby undertakes that:
(1) For purposes of determining any liability under the Securities Act, the information omitted from the form of prospectus filed as part of this registration statement in reliance upon Rule 430A and contained in a form of prospectus filed by the registrant pursuant to Rule 424(b)(1) or (4) or 497(h) under the Securities Act shall be deemed to be part of this registration statement as of the time it was declared effective.
(2) For the purpose of determining any liability under the Securities Act, each post-effective amendment that contains a form of prospectus shall be deemed to be a new registration statement relating to the securities offered therein, and the offering of such securities at that time shall be deemed to be the initial bona fide offering thereof.
The undersigned registrant hereby further undertakes to provide to the underwriters at the closing specified in the underwriting agreement, certificates in such denominations and registered in such names as required by the underwriters to permit prompt delivery to each purchaser.
Insofar as indemnification for liabilities arising under the Securities Act may be permitted to directors, officers and controlling persons of the registrant pursuant to the foregoing provisions, or otherwise, the registrant has been advised that in the opinion of the SEC such indemnification is against public policy as expressed in the Securities Act and is, therefore, unenforceable. In the event that a claim for indemnification against such liabilities (other than the payment by the registrant of expenses incurred or paid by a director, officer or controlling person of the registrant in the successful defense of any action, suit, or proceeding) is asserted by such director, officer or controlling person in connection with the securities being registered, the registrant will, unless in the opinion of its counsel the matter has been settled by controlling precedent, submit to a court of appropriate jurisdiction the question whether such indemnification by it is against public policy as expressed in the Securities Act and will be governed by the final adjudication of such issue.
II-7
Table of Contents
SIGNATURES
Pursuant to the requirements of the Securities Act of 1933, as amended, the registrant certifies that it has reasonable grounds to believe that it meets all of the requirements for filing on Form S-11 and has duly caused this registration statement to be signed on its behalf by the undersigned, thereunto duly authorized, in the City of Rochester, New York, on this day of , 2020.
| BROADSTONE NET LEASE, INC. | ||
| By: | ||
| Christopher J. Czarnecki | ||
| Chief Executive Officer and President | ||
Pursuant to the requirements of the Securities Act of 1933, as amended, this Registration Statement has been signed by the following persons in the capacities and on the dates indicated.
| Date: |
| |
| Amy L. Tait | ||
| Chairman of the Board of Directors | ||
| Date: |
| |
| Christopher J. Czarnecki | ||
| Director, Chief Executive Officer, and President (Principal Executive Officer) | ||
| Date: |
| |
| Laurie A. Hawkes | ||
| Director | ||
| Date: |
| |
| David M. Jacobstein | ||
| Director | ||
| Date: |
| |
| Agha S. Khan | ||
| Director | ||
| Date: |
| |
| Shekar Narasimhan | ||
| Director | ||
| Date: |
| |
| Geoffrey H. Rosenberger | ||
| Director | ||
| Date: |
| |
| James H. Watters | ||
| Director | ||
| Date: |
| |
| Ryan M. Albano | ||
| Executive Vice President and Chief Financial Officer (Principal Financial Officer) | ||
| Date: |
| |
| Timothy D. Dieffenbacher | ||
| Chief Accounting Officer and Treasurer (Principal Accounting Officer) | ||