Table of Contents
UNITED STATES
SECURITIES AND EXCHANGE COMMISSION
Washington, D.C. 20549
FORM N-CSR
CERTIFIED SHAREHOLDER REPORT OF
REGISTERED MANAGEMENT INVESTMENT COMPANIES
Investment Company Act file number: 811-22167
Allianz Funds Multi-Strategy Trust
(Exact name of registrant as specified in charter)
1633 Broadway, New York, NY 10019
(Address of principal executive offices) (Zip code)
Lawrence G. Altadonna
1633 Broadway, New York, NY 10019
(Name and address of agent for service)
Registrant’s telephone number, including area code: 212-739-3371
Date of fiscal year end: November 30, 2014
Date of reporting period: May 31, 2014
Table of Contents
Item 1. Report to Shareholders

Allianz Multi-Strategy Funds
SHARE CLASSES A, B, C, D, R, P, INSTITUTIONAL, R6, ADMINISTRATIVE
Semiannual Report
May 31, 2014
This material is authorized for use only when preceded or accompanied by the current Allianz Multi-Strategy Funds prospectus. Investors should consider the investment objectives, risks, charges and expenses of each Fund carefully before investing. This and other information is contained in the Funds’ prospectuses and summary prospectuses. Please read the prospectus carefully before you invest or send money.

Receive this report electronically and eliminate paper mailings.
To enroll, go to http://us.allianzgi.com/edelivery.
Table of Contents
A Word About Risk: A fund may be subject to various risks as described in its prospectus. Some of those risks may include, but are not limited to, the following: derivatives risk, smaller company risk, non-US investment risk, focused investment risk and specific sector investment risks. Use of derivative instruments may involve certain costs and risks such as liquidity risk, interest rate risk, market risk, credit risk, counterparty risk, management risk and the risk that a fund is unable to close out a position when it is most advantageous to do so. Portfolios investing in derivatives could lose more than the principal amount invested in those instruments. Investing in foreign securities may entail risk due to foreign economic and political developments; this risk may be enhanced when investing in emerging markets. Smaller companies may be more volatile than larger companies and may entail more risk. Concentrating investments in individual sectors may add additional risk and additional volatility compared to a diversified equity portfolio. AllianzGI target-date funds seek to manage risk and return by blending two separately-managed portfolios: a return-generating portfolio for growth potential, and a defensive portfolio for principal protection. The balance grows increasingly defensive over time until the target date is reached, after which the Fund’s assets roll into a retirement income strategy. The principal values of the Funds are not guaranteed at any time, including the target date. Please refer to the Fund’s applicable current prospectus for complete details.
Table of Contents
Letter from the President

| 2 | May 31, 2014 | | Semiannual Report |
Table of Contents
Outlook
We remain constructive on the US economic recovery and expect the first-quarter GDP decline to be followed by a meaningful bounce during the second quarter.
Federal Reserve officials have tied the outlook for monetary policy to incoming economic data. Based on our forecasts for growth, we believe that Fed asset purchases will end in the fourth quarter of 2014, with an increase in the Fed funds rate possible in mid-2015.
Additional Information
For many of our shareholders, especially those who are nearing or in retirement, income-generation is a top priority. But with continued low yields on investment-grade core bonds and the growing threat of interest-rate hikes, an overallocation to low-yielding, rate-sensitive securities may threaten today’s scarce income streams and put long-term goals in jeopardy.
If you’d like more information about this issue, talk to your financial advisor and consider reading our educational white paper, Strategies to Generate a Diversified Income Stream in a Low-Yield Environment.
Visit http://us.allianzgi.com/whitepaper to download a copy.
On behalf of Allianz Global Investors Fund Management and our Sub-Advisers, thank you for investing with us. We remain dedicated to serving your investment needs.
Sincerely,

Julian Sluyters
President & CEO
Past performance is no guarantee of future results. Unless otherwise noted, index returns reflect the reinvestment of income dividends and capital gains, if any, but do not reflect fees, brokerage commissions or other expenses of investing. It is not possible to invest directly in an index.
Receive this report electronically and eliminate paper mailings.
To enroll, go to http://us.allianzgi.com/edelivery.
| Semiannual Report | | May 31, 2014 | 3 |
Table of Contents
Unaudited
AllianzGI Target-Date and Target Risk Funds*
For the period of December 1, 2013, through May 31, 2014, as provided by the US Multi-Asset Group.
Market Review and Outlook
What Happened
The Fellowship of the Central Bankers
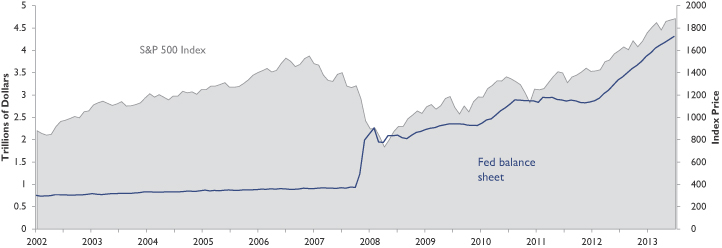
For the six months ending May 31, 2014, a handful of central banks and their leaders—what we have termed, the fellowship of the central bankers—remained a key driver of market returns. As has been the case for recent periods, we believe that this fellowship contributed to most risk assets around the world rising and most government bond yields around the world falling. This is evident in the chart below that tracks the unprecedented expansion of the Fed’s balance sheet and the persistent upward march of the S&P 500 Index.
In the US, the taper announcement came at the December Federal Open Market Committee (FOMC) meeting and was implemented in January with a $10 billion reduction to Treasury bonds and mortgage-backed security purchases. The new Chair of the Federal Reserve, Janet Yellen, assumed her position at the helm of the FOMC and did not waste time making changes. At her first meeting in March, she both changed the nature of the Fed’s forward guidance from quantitative (targeted at least in part to achieving 6.5% unemployment) to qualitative and refocused market attention on speculating about the end of the Fed’s Zero Interest Rate Policy (ZIRP), which has been in place now for five years. In the wake of the changes, US 10-year Treasury yields continued to plummet from their recent high of 3.00% in late December to a low of 2.44% on May 28, 2014.
Around the world, the fellowship of the central bankers continued to influence markets with the result similar to that of the chart below. In Europe, during the period, European Central Bank (ECB) president Mario Draghi’s comments about the appreciation of the Euro and his reference to the possibility of further quantitative easing contributed to peripheral bond yields falling. In Spain, the yield on 10-year government bonds fell from 4.24% on December 5, 2013 to 2.82% on May 28, 2014 and in Italy, the yield on such bonds fell from a high of 4.22% on December 5, 2013 to 2.91% on May 14, 2014. (Yields in each moved steadily downward in June as well). Evidence of an economic recovery in both the core countries of Europe, including Germany and France, as well as the periphery also contributed to bond price appreciation. Elsewhere, the Bank of Japan (BOJ) continued its aggressive quantitative easing program. In the United Kingdom, the Bank of England maintained its record low interest rate and left unchanged its stimulus program of holding 375 billion pounds in government bonds.
United States, Europe and Emerging Markets
In the US, in the period from January through March, market observers had two big questions: First, would US growth continue despite a soft patch related to bad weather throughout parts of the country; and second, would markets avoid a repeat of the “taper tantrum” episode observed last spring. As it turned out, we learned in April that the answer to both was “yes.” The employment, retail sales and manufacturing data for March showed significant improvement compared with February, and most major asset classes posted positive returns for the quarter.
For the six-month period ending May 31, 2014, US equities were up 7.62% based on the S&P 500 Index and 5 to 10-year Treasuries were up 2.28% based on the Barclays US Treasury 5-10Yr Index.
Globally, in broad terms, equities and bonds were up as well: MSCI ACWI returned 6.02% and the Barclays Global Aggregate Index returned 3.55%. In fixed income, as with the previous period, the “fellowship of the central bankers” influenced all bond markets—including US Treasuries, where yields fluctuated, but remained in a range.
Global equities benefited from a steady recovery in Europe, which attracted both attention and capital inflows and drove up the value of the euro. The core and periphery of Europe saw positive equity performance. The periphery outperformed, with Spain up 12.99% and Italy up 15.96% (each based on respective MSCI dollar-denominated indexes). In the developed world, Japan was an underperformer, returning -3.56% in dollar terms.
For the period, emerging markets (EM) underperformed developed markets. Performance in EM was mixed for the period. From December 1, 2013 through early February, the MSCI Emerging Markets Index lost roughly 9.5%. However, from February 5 through May 23, the index was up 13.8%. Overall, emerging market stocks finished the period up 1.89%. Despite uncertainties surrounding growth in several key emerging-market countries, commodity prices, which are generally tightly linked to EM, finished the period up 7.77% led by energy, including Natural Gas which was up 23.03% and petroleum up 6.03%, based on the Dow Jones UBS Commodity Index.
* The “Target-Date Funds” are the AllianzGI Retirement 2015 Fund, the AllianzGI Retirement 2020 Fund, the AllianzGI Retirement 2025 Fund, the AllianzGI Retirement 2030 Fund, the AllianzGI Retirement 2035 Fund, the AllianzGI Retirement 2040 Fund, the AllianzGI Retirement 2045 Fund, the AllianzGI Retirement 2050 Fund and the AllianzGI Retirement 2055 Fund. The “Target Risk Funds” are the AllianzGI Retirement Income Fund, the AllianzGI Global Allocation Fund and the AllianzGI Global Allocation Fund.
| 4 | May 31, 2014 | | Semiannual Report |
Table of Contents
Unaudited
AllianzGI Target-Date and Target Risk Funds (cont’d)
Outlook
At the close of the reporting period, we believe that investors are left with few options. The first is simply waiting out the central banks’ financial repression strategy, and slowly losing money in real terms with the losses adding up over time. At a 2.5% inflation rate, an account earning a zero nominal rate loses 14.0% of its value after six years.
Alternatively, investors can buy risky assets and follow the “Don’t Fight the Fed, ECB, BOE and BOJ” rule. Such an approach relies on further price/earnings expansion (or at least no contraction) and some earnings growth. This is an increasingly difficult proposition as global central banks push asset prices up and bond yields below inflation. This strategy involves hunting for still-undervalued assets to realize both earnings growth and expansions in valuation, as well as for sustainable and growing dividends. We believe that the opportunity set is limited.
Patience may turn out to be the best investment strategy during what is now the sixth year of financial repression. When spreads are tight, shorter-term real rates are negative and valuations are high almost everywhere, a slow but small loss of purchasing power is not the worst outcome. And recovering economies have pockets of value and opportunities for growth.
As a result, our favored investment themes are short-duration credit risk, high-quality dividends with growth and the few remaining value opportunities. Carefully building portfolios around these themes, while waiting out the recovery and central-bank normalization, is expected to pay off eventually. This is a global exercise. There will be times of stress that will be accompanied by sharp sell-offs. Since evidence indicates that the economy and equity markets could be in a long-term uptrend, these sell-offs, when acute, can be the time to buy.
At the end of the period, AllianzGI Target-Date Funds and AllianzGI Retirement Income Fund remain underweight hard duration and exposed to fixed-income strategies that may benefit in rising-rate environments. The portfolios remain modestly underweight commodities and real estate relative to their benchmarks. All of the portfolios are within their benchmark-determined risk budgets.
During the reporting period, several changes to the Target-Date and Target Risk Funds’ portfolios were made including, in the fixed income portion, a net reduction to hard duration through trimming the PIMCO Real Return Fund and the PIMCO Mortgage Opportunities Fund. To this end, the PIMCO Senior Floating Rate Fund was also added. There was an increase in the Funds’ exposure to equities in Spain, given the recovery in Europe and based on the team’s work to find opportunities based on valuations. Exposure to emerging market equities was reduced in early January and further reduced later in the period at least in part to further underweight markets that have not yet implemented what we believe are needed structural reforms.
| Semiannual Report | | May 31, 2014 | 5 |
Table of Contents
Unaudited
AllianzGI Retirement 2015 Fund
For the period of December 1, 2013 through May 31, 2014, as provided by the US Multi-Asset Group.
Fund Insights
| 6 | May 31, 2014 | | Semiannual Report |
Table of Contents
Unaudited
AllianzGI Retirement 2015 Fund (cont’d)
Average Annual Total Return for the period ended May 31, 2014
| 6 Month* | 1 Year | 5 Year | Since Inception† | |||||||||||||||
| AllianzGI Retirement 2015 Fund Class A | 4.04% | 5.39% | 8.60% | 9.50% | ||||||||||||||
|
|
AllianzGI Retirement 2015 Fund Class A (adjusted) | –1.68% | –0.41% | 7.38% | 8.37% | |||||||||||||
| AllianzGI Retirement 2015 Fund Class C | 3.68% | 4.61% | 7.79% | 8.68% | ||||||||||||||
|
|
AllianzGI Retirement 2015 Fund Class C (adjusted) | 2.68% | 3.61% | 7.79% | 8.68% | |||||||||||||
|
|
AllianzGI Retirement 2015 Fund Class D | 3.99% | 5.28% | 8.54% | 9.45% | |||||||||||||
|
|
AllianzGI Retirement 2015 Fund Class R | 3.90% | 5.04% | 8.28% | 9.19% | |||||||||||||
|
|
AllianzGI Retirement 2015 Fund Class P | 4.22% | 5.72% | 8.89% | 9.79% | |||||||||||||
|
|
AllianzGI Retirement 2015 Fund Class R6 | 4.27% | 5.83% | 8.98% | 9.89% | |||||||||||||
| AllianzGI Retirement 2015 Fund Administrative Class | 4.12% | 5.46% | 8.65% | 9.56% | ||||||||||||||
|
|
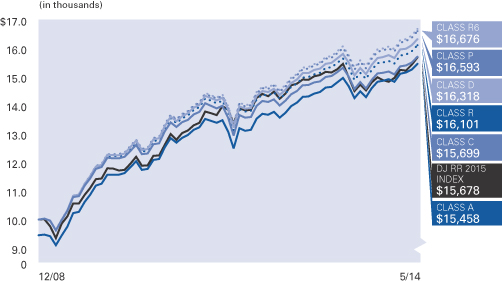
Dow Jones Real Return 2015 Index | 5.31% | 4.67% | 8.20% | 8.65% | |||||||||||||
| Lipper Mixed-Asset Target 2015 Funds Average | 4.28% | 8.63% | 10.43% | 10.96% | ||||||||||||||
† The Fund began operations on 12/29/08. Benchmark return comparisons began on the fund inception date. Lipper performance comparisons began on 12/31/08.
* Cumulative return.
Performance quoted represents past performance and is no guarantee of future results. Current performance may be lower or higher than performance shown. For performance current to the most recent month-end, visit our website at us.allianzgi.com. Investment return and the principal value will fluctuate. Shares may be worth more or less than original cost when redeemed. The adjusted returns take into account the maximum initial sales charge of 5.50% on Class A shares and the contingent deferred sales charge (CDSC) of 1% on Class C shares, which may apply to shares redeemed during the first year of ownership. Returns do not reflect deduction of taxes that a shareholder would pay on fund distributions or redemption of fund shares. See pages 86 and 87 for more information. The Fund’s gross expense ratios are 1.17% for Class A shares, 1.92% for Class C shares, 1.17% for Class D shares, 1.42% for Class R shares, 0.77% for Class P shares, 0.67% for Class R6 shares and 1.02% for Administrative Class shares. These ratios do not include an expense reduction, contractually guaranteed through at least 3/31/15. The Fund’s expense ratios net of this reduction are 0.97% for Class A shares, 1.72% for Class C shares, 1.07% for Class D shares, 1.32% for Class R shares, 0.67% for Class P shares, 0.57% for Class R6 shares and 0.92% for Administrative Class shares. Expense ratio information is as of the Fund’s current prospectus dated April 1, 2014, as supplemented to date.
| Semiannual Report | | May 31, 2014 | 7 |
Table of Contents
Unaudited
AllianzGI Retirement 2015 Fund (cont’d)
| Shareholder Expense Example | Actual Performance | |||||||||||||
| Class A | Class C | Class D | Class R | Class P | Class R6 | Administrative Class | ||||||||
| Beginning Account Value (12/1/13) | $1,000.00 | $1,000.00 | $1,000.00 | $1,000.00 | $1,000.00 | $1,000.00 | $1,000.00 | |||||||
| Ending Account Value (5/31/14) | $1,040.40 | $1,036.80 | $1,039.90 | $1,039.00 | $1,042.20 | $1,042.70 | $1,041.20 | |||||||
| Expenses Paid During Period | $2.03 | $5.84 | $2.54 | $3.81 | $0.51 | $— | $1.78 | |||||||
| Hypothetical Performance | ||||||||||||||
| (5% return before expenses) | ||||||||||||||
| Class A | Class C | Class D | Class R | Class P | Class R6 | Administrative Class | ||||||||
| Beginning Account Value (12/1/13) | $1,000.00 | $1,000.00 | $1,000.00 | $1,000.00 | $1,000.00 | $1,000.00 | $1,000.00 | |||||||
| Ending Account Value (5/31/14) | $1,022.94 | $1,019.20 | $1,022.44 | $1,021.19 | $1,024.43 | $1,024.93 | $1,023.19 | |||||||
| Expenses Paid During Period | $2.02 | $5.79 | $2.52 | $3.78 | $0.50 | $— | $1.77 | |||||||
For each class of the Fund, expenses (net of fee waiver and reimbursement, if any) are equal to the annualized expense ratio for the class (0.40% for Class A, 1.15% for Class C, 0.50% for Class D, 0.75% for Class R, 0.10% for Class P, 0.00% for Class R6 and 0.35% for Administrative Class), multiplied by the average account value over the period, multiplied by 182/365. The expense ratio does not include the expenses of the Underlying Funds, which based upon the allocation of the Fund’s assets among the Underlying Funds are indirectly borne by the shareholders of the Fund.
| 8 | May 31, 2014 | | Semiannual Report |
Table of Contents
Unaudited
AllianzGI Retirement 2020 Fund
For the period of December 1, 2013 through May 31, 2014, as provided by the US Multi Asset Group.
Fund Insights
| Semiannual Report | | May 31, 2014 | 9 |
Table of Contents
Unaudited
AllianzGI Retirement 2020 Fund (cont’d)
Average Annual Total Return for the period ended May 31, 2014
| 6 Month* | 1 Year | 5 Year | Since Inception† | |||||||||||||||
| AllianzGI Retirement 2020 Fund Class A | 4.33% | 5.93% | 8.95% | 9.87% | ||||||||||||||
|
|
AllianzGI Retirement 2020 Fund Class A (adjusted) | –1.41% | 0.10% | 7.73% | 8.73% | |||||||||||||
| AllianzGI Retirement 2020 Fund Class C | 3.92% | 5.14% | 8.12% | 9.03% | ||||||||||||||
|
|
AllianzGI Retirement 2020 Fund Class C (adjusted) | 2.92% | 4.14% | 8.12% | 9.03% | |||||||||||||
|
|
AllianzGI Retirement 2020 Fund Class D | 4.24% | 5.78% | 8.88% | 9.80% | |||||||||||||
|
|
AllianzGI Retirement 2020 Fund Class R | 4.14% | 5.58% | 8.63% | 9.55% | |||||||||||||
|
|
AllianzGI Retirement 2020 Fund Class P | 4.48% | 6.24% | 9.24% | 10.15% | |||||||||||||
|
|
AllianzGI Retirement 2020 Fund Class R6 | 4.53% | 6.40% | 9.34% | 10.26% | |||||||||||||
| AllianzGI Retirement 2020 Fund Administrative Class | 4.36% | 5.96% | 9.00% | 9.92% | ||||||||||||||
|
|
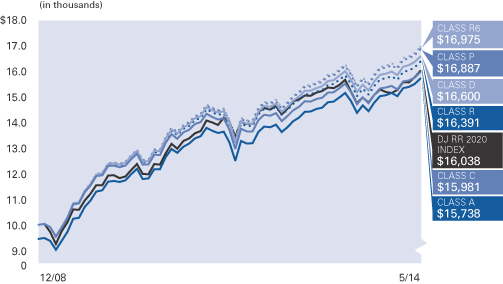
Dow Jones Real Return 2020 Index | 5.45% | 5.28% | 8.61% | 9.11% | |||||||||||||
| Lipper Mixed-Asset Target 2020 Funds Average | 4.49% | 9.69% | 11.16% | 11.59% | ||||||||||||||
† The Fund began operations on 12/29/08. Benchmark return comparisons began on the fund inception date. Lipper performance comparisons began on 12/31/08.
* Cumulative return.
Performance quoted represents past performance and is no guarantee of future results. Current performance may be lower or higher than performance shown. For performance current to the most recent month-end, visit our website at us.allianzgi.com. Investment return and the principal value will fluctuate. Shares may be worth more or less than original cost when redeemed. The adjusted returns take into account the maximum initial sales charge of 5.50% on Class A shares and the contingent deferred sales charge (CDSC) of 1% on Class C shares, which may apply to shares redeemed during the first year of ownership. Returns do not reflect deduction of taxes that a shareholder would pay on fund distributions or redemption of fund shares. See pages 86 and 87 for more information. The Fund’s gross expense ratios are 1.19% for Class A shares, 1.94% for Class C shares, 1.19% for Class D shares, 1.44% for Class R shares, 0.79% for Class P shares, 0.69% for Class R6 shares and 1.04% for Administrative Class shares. These ratios do not include an expense reduction, contractually guaranteed through at least 3/31/15. The Fund’s expense ratios net of this reduction are 0.99% for Class A shares, 1.74% for Class C shares, 1.09% for Class D shares, 1.34% for Class R shares, 0.69% for Class P shares, 0.59% for Class R6 shares and 0.94% for Administrative Class shares. Expense ratio information is as of the Fund’s current prospectus dated April 1, 2014, as supplemented to date.
| 10 | May 31, 2014 | | Semiannual Report |
Table of Contents
Unaudited
AllianzGI Retirement 2020 Fund (cont’d)
| Shareholder Expense Example | Actual Performance | |||||||||||||
| Class A | Class C | Class D | Class R | Class P | Class R6 | Administrative Class | ||||||||
| Beginning Account Value (12/1/13) | $1,000.00 | $1,000.00 | $1,000.00 | $1,000.00 | $1,000.00 | $1,000.00 | $1,000.00 | |||||||
| Ending Account Value (5/31/14) | $1,043.30 | $1,039.20 | $1,042.40 | $1,041.40 | $1,044.80 | $1,045.30 | $1,043.60 | |||||||
| Expenses Paid During Period | $2.04 | $5.85 | $2.55 | $3.82 | $0.51 | $— | $1.78 | |||||||
| Hypothetical Performance | ||||||||||||||
| (5% return before expenses) | ||||||||||||||
| Class A | Class C | Class D | Class R | Class P | Class R6 | Administrative Class | ||||||||
| Beginning Account Value (12/1/13) | $1,000.00 | $1,000.00 | $1,000.00 | $1,000.00 | $1,000.00 | $1,000.00 | $1,000.00 | |||||||
| Ending Account Value (5/31/14) | $1,022.94 | $1,019.20 | $1,022.44 | $1,021.19 | $1,024.43 | $1,024.93 | $1,023.19 | |||||||
| Expenses Paid During Period | $2.02 | $5.79 | $2.52 | $3.78 | $0.50 | $— | $1.77 | |||||||
For each class of the Fund, expenses (net of fee waiver and reimbursement, if any) are equal to the annualized expense ratio for the class (0.40% for Class A, 1.15% for Class C, 0.50% for Class D, 0.75% for Class R, 0.10% for Class P, 0.00% for Class R6 and 0.35% for Administrative Class), multiplied by the average account value over the period, multiplied by 182/365. The expense ratio does not include the expenses of the Underlying Funds, which based upon the allocation of the Fund’s assets among the Underlying Funds are indirectly borne by the shareholders of the Fund.
| Semiannual Report | | May 31, 2014 | 11 |
Table of Contents
Unaudited
AllianzGI Retirement 2025 Fund
For the period of December 1, 2013 through May 31, 2014, as provided by the US Multi Asset Group.
Fund Insights
| 12 | May 31, 2014 | | Semiannual Report |
Table of Contents
Unaudited
AllianzGI Retirement 2025 Fund (cont’d)
Average Annual Total Return for the period ended May 31, 2014
| 6 Month* |
1 Year |
Since Inception† |
||||||||||||
| AllianzGI Retirement 2025 Fund Class A | 4.52% | 6.67% | 8.54% | |||||||||||
|
|
AllianzGI Retirement 2025 Fund Class A (adjusted) | –1.23% | 0.80% | 6.06% | ||||||||||
|
|
AllianzGI Retirement 2025 Fund Class R | 4.31% | 6.27% | 8.15% | ||||||||||
|
|
AllianzGI Retirement 2025 Fund Class P | 4.67% | 7.00% | 8.87% | ||||||||||
|
|
AllianzGI Retirement 2025 Fund Class R6 | 4.72% | 7.05% | 8.95% | ||||||||||
| AllianzGI Retirement 2025 Fund Administrative Class | 4.56% | 6.70% | 8.58% | |||||||||||
|
|
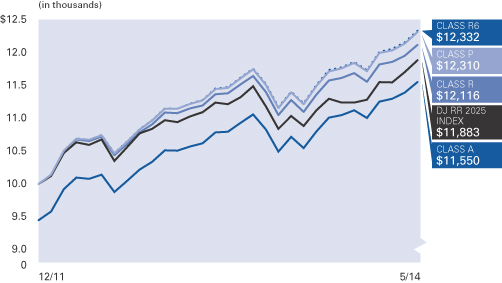
Dow Jones Real Return 2025 Index | 5.71% | 6.27% | 7.30% | ||||||||||
| Lipper Mixed-Asset Target 2025 Funds Average | 5.06% | 12.06% | 13.19% | |||||||||||
† The Fund began operations on 12/19/11. Benchmark return comparisons began on the fund inception date. Lipper performance comparisons began on 12/31/11.
* Cumulative return.
Performance quoted represents past performance and is no guarantee of future results. Current performance may be lower or higher than performance shown. For performance current to the most recent month-end, visit our website at us.allianzgi.com. Investment return and the principal value will fluctuate. Shares may be worth more or less than original cost when redeemed. The adjusted returns take into account the maximum initial sales charge of 5.50% on Class A shares. Returns do not reflect deduction of taxes that a shareholder would pay on fund distributions or redemption of fund shares. See pages 86 and 87 for more information. The Fund’s gross expense ratios are 1.21% for Class A shares, 1.46% for Class R shares, 0.81% for Class P shares, 0.71% for Class R6 shares and 1.06% for Administrative Class shares. These ratios do not include an expense reduction, contractually guaranteed through at least 3/31/15. The Fund’s expense ratios net of this reduction are 1.01% for Class A shares, 1.36% for Class R shares, 0.71% for Class P shares, 0.61% for Class R6 shares and 0.96% for Administrative Class shares. Expense ratio information is as of the Fund’s current prospectus dated April 1, 2014, as supplemented to date.
| Semiannual Report | | May 31, 2014 | 13 |
Table of Contents
Unaudited
AllianzGI Retirement 2025 Fund (cont’d)
| Shareholder Expense Example | Actual Performance | |||||||||
| Class A | Class R | Class P | Class R6 | Administrative Class | ||||||
| Beginning Account Value (12/1/13) | $1,000.00 | $1,000.00 | $1,000.00 | $1,000.00 | $1,000.00 | |||||
| Ending Account Value (5/31/14) | $1,045.20 | $1,043.10 | $1,046.70 | $1,047.20 | $1,045.60 | |||||
| Expenses Paid During Period | $2.04 | $3.82 | $0.51 | $— | $1.78 | |||||
| Hypothetical Performance | ||||||||||
| (5% return before expenses) | ||||||||||
| Class A | Class R | Class P | Class R6 | Administrative Class | ||||||
| Beginning Account Value (12/1/13) | $1,000.00 | $1,000.00 | $1,000.00 | $1,000.00 | $1,000.00 | |||||
| Ending Account Value (5/31/14) | $1,022.94 | $1,021.19 | $1,024.43 | $1,024.93 | $1,023.19 | |||||
| Expenses Paid During Period | $2.02 | $3.78 | $0.50 | $— | $1.77 | |||||
For each class of the Fund, expenses (net of fee waiver and reimbursement, if any) are equal to the annualized expense ratio for the class (0.40% for Class A, 0.75% for Class R, 0.10% for Class P, 0.00% for Class R6 and 0.35% for Administrative Class), multiplied by the average account value over the period, multiplied by 182/365. The expense ratio does not include the expenses of the Underlying Funds, which based upon the allocation of the Fund’s assets among the Underlying Funds are indirectly borne by the shareholders of the Fund.
| 14 | May 31, 2014 | | Semiannual Report |
Table of Contents
Unaudited
AllianzGI Retirement 2030 Fund
For the period of December 1, 2013 through May 31, 2014, as provided by the US Multi Asset Group.
Fund Insights
| Semiannual Report | | May 31, 2014 | 15 |
Table of Contents
Unaudited
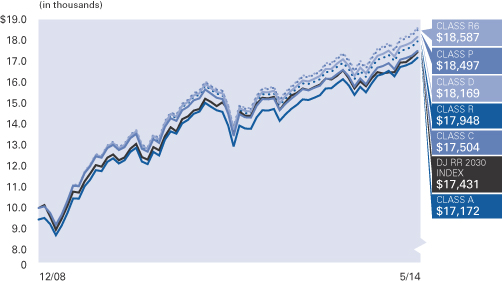
AllianzGI Retirement 2030 Fund (cont’d)
Average Annual Total Return for the period ended May 31, 2014
| 6 Month* | 1 Year | 5 Year | Since Inception† | |||||||||||||||
| AllianzGI Retirement 2030 Fund Class A | 4.71% | 8.28% | 10.44% | 11.65% | ||||||||||||||
|
|
AllianzGI Retirement 2030 Fund Class A (adjusted) | –1.05% | 2.32% | 9.20% | 10.49% | |||||||||||||
| AllianzGI Retirement 2030 Fund Class C | 4.37% | 7.48% | 9.62% | 10.89% | ||||||||||||||
|
|
AllianzGI Retirement 2030 Fund Class C (adjusted) | 3.37% | 6.48% | 9.62% | 10.89% | |||||||||||||
|
|
AllianzGI Retirement 2030 Fund Class D | 4.71% | 8.21% | 10.39% | 11.65% | |||||||||||||
|
|
AllianzGI Retirement 2030 Fund Class R | 4.59% | 7.89% | 10.11% | 11.40% | |||||||||||||
|
|
AllianzGI Retirement 2030 Fund Class P | 4.92% | 8.61% | 10.73% | 12.01% | |||||||||||||
|
|
AllianzGI Retirement 2030 Fund Class R6 | 4.97% | 8.71% | 10.83% | 12.11% | |||||||||||||
| AllianzGI Retirement 2030 Fund Administrative Class | 4.78% | 8.32% | 10.50% | 11.78% | ||||||||||||||
|
|
Dow Jones Real Return 2030 Index | 6.10% | 7.66% | 10.09% | 10.80% | |||||||||||||
| Lipper Mixed-Asset Target 2030 Funds Average | 5.16% | 13.00% | 12.98% | 13.44% | ||||||||||||||
† The Fund began operations on 12/29/08. Benchmark return comparisons began on the fund inception date. Lipper performance comparisons began on 12/31/08.
* Cumulative return.
Performance quoted represents past performance and is no guarantee of future results. Current performance may be lower or higher than performance shown. For performance current to the most recent month-end, visit our website at us.allianzgi.com. Investment return and the principal value will fluctuate. Shares may be worth more or less than original cost when redeemed. The adjusted returns take into account the maximum initial sales charge of 5.50% on Class A shares and the contingent deferred sales charge (CDSC) of 1% on Class C shares, which may apply to shares redeemed during the first year of ownership. Returns do not reflect deduction of taxes that a shareholder would pay on fund distributions or redemption of fund shares. See pages 86 and 87 for more information. The Fund’s gross expense ratios are 1.28% for Class A shares, 2.03% for Class C shares, 1.28% for Class D shares, 1.53% for Class R shares, 0.88% for Class P shares, 0.78% for Class R6 shares and 1.13% for Administrative Class shares. These ratios do not include an expense reduction, contractually guaranteed through at least 3/31/15. The Fund’s expense ratios net of this reduction are 1.03% for Class A shares, 1.78% for Class C shares, 1.13% for Class D shares, 1.38% for Class R shares, 0.73% for Class P shares, 0.63% for Class R6 shares and 0.98% for Administrative Class shares. Expense ratio information is as of the Fund’s current prospectus dated April 1, 2014, as supplemented to date.
| 16 | May 31, 2014 | | Semiannual Report |
Table of Contents
Unaudited
AllianzGI Retirement 2030 Fund (cont’d)
| Shareholder Expense Example | Actual Performance | |||||||||||||
| Class A | Class C | Class D | Class R | Class P | Class R6 | Administrative Class | ||||||||
| Beginning Account Value (12/1/13) | $1,000.00 | $1,000.00 | $1,000.00 | $1,000.00 | $1,000.00 | $1,000.00 | $1,000.00 | |||||||
| Ending Account Value (5/31/14) | $1,047.10 | $1,043.70 | $1,047.10 | $1,045.90 | $1,049.20 | $1,049.70 | $1,047.80 | |||||||
| Expenses Paid During Period | $1.79 | $5.60 | $2.30 | $3.57 | $0.26 | $— | $1.53 | |||||||
| Hypothetical Performance | ||||||||||||||
| (5% return before expenses) | ||||||||||||||
| Class A | Class C | Class D | Class R | Class P | Class R6 | Administrative Class | ||||||||
| Beginning Account Value (12/1/13) | $1,000.00 | $1,000.00 | $1,000.00 | $1,000.00 | $1,000.00 | $1,000.00 | $1,000.00 | |||||||
| Ending Account Value (5/31/14) | $1,023.19 | $1,019.45 | $1,022.69 | $1,021.44 | $1,024.68 | $1,024.93 | $1,023.44 | |||||||
| Expenses Paid During Period | $1.77 | $5.54 | $2.27 | $3.53 | $0.25 | $— | $1.51 | |||||||
For each class of the Fund, expenses (net of fee waiver and reimbursement, if any) are equal to the annualized expense ratio for the class (0.35% for Class A, 1.10% for Class C, 0.45% for Class D, 0.70% for Class R, 0.05% for Class P, 0.00% for Class R6 and 0.30% for Administrative Class), multiplied by the average account value over the period, multiplied by 182/365. The expense ratio does not include the expenses of the Underlying Funds, which based upon the allocation of the Fund’s assets among the Underlying Funds are indirectly borne by the shareholders of the Fund.
| Semiannual Report | | May 31, 2014 | 17 |
Table of Contents
Unaudited
AllianzGI Retirement 2035 Fund
For the period of December 1, 2013 through May 31, 2014, as provided by the US Multi Asset Group.
Fund Insights
| 18 | May 31, 2014 | | Semiannual Report |
Table of Contents
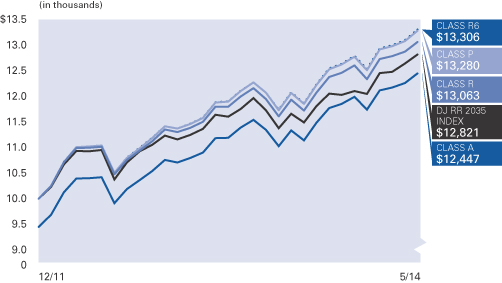
Unaudited
AllianzGI Retirement 2035 Fund (cont’d)
Average Annual Total Return for the period ended May 31, 2014
| 6 Month* | 1 Year | Since Inception† |
||||||||||||
| AllianzGI Retirement 2035 Fund Class A | 5.00% | 9.68% | 11.91% | |||||||||||
|
|
AllianzGI Retirement 2035 Fund Class A (adjusted) | –0.77% | 3.65% | 9.36% | ||||||||||
|
|
AllianzGI Retirement 2035 Fund Class R | 4.81% | 9.32% | 11.54% | ||||||||||
|
|
AllianzGI Retirement 2035 Fund Class P | 5.18% | 10.03% | 12.28% | ||||||||||
|
|
AllianzGI Retirement 2035 Fund Class R6 | 5.29% | 10.20% | 12.37% | ||||||||||
| AllianzGI Retirement 2035 Fund Administrative Class | 5.05% | 9.78% | 11.98% | |||||||||||
|
|
Dow Jones Real Return 2035 Index | 6.57% | 9.34% | 10.69% | ||||||||||
| Lipper Mixed-Asset Target 2035 Funds Average | 5.40% | 14.54% | 15.70% | |||||||||||
† The Fund began operations on 12/19/11. Benchmark return comparisons began on the fund inception date. Lipper performance comparisons began on 12/31/11.
* Cumulative return.
Performance quoted represents past performance and is no guarantee of future results. Current performance may be lower or higher than performance shown. For performance current to the most recent month-end, visit our website at us.allianzgi.com. Investment return and the principal value will fluctuate. Shares may be worth more or less than original cost when redeemed. The adjusted returns take into account the maximum initial sales charge of 5.50% on Class A shares. Returns do not reflect deduction of taxes that a shareholder would pay on fund distributions or redemption of fund shares. See pages 86 and 87 for more information. The Fund’s gross expense ratios are 1.31% for Class A shares, 1.56% for Class R shares, 0.91% for Class P shares, 0.81% for Class R6 shares and 1.16% for Administrative Class shares. These ratios do not include an expense reduction, contractually guaranteed through at least 3/31/15. The Fund’s expense ratios net of this reduction are 1.06% for Class A shares, 1.41% for Class R shares, 0.76% for Class P shares, 0.66% for Class R6 shares and 1.01% for Administrative Class shares. Expense ratio information is as of the Fund’s current prospectus dated April 1, 2014, as supplemented to date.
| Semiannual Report | | May 31, 2014 | 19 |
Table of Contents
Unaudited
AllianzGI Retirement 2035 Fund (cont’d)
| Shareholder Expense Example | Actual Performance | |||||||||
| Class A | Class R | Class P | Class R6 | Administrative Class | ||||||
| Beginning Account Value (12/1/13) | $1,000.00 | $1,000.00 | $1,000.00 | $1,000.00 | $1,000.00 | |||||
| Ending Account Value (5/31/14) | $1,050.00 | $1,048.10 | $1,051.80 | $1,052.90 | $1,050.50 | |||||
| Expenses Paid During Period | $1.79 | $3.57 | $0.26 | $— | $1.53 | |||||
| Hypothetical Performance | ||||||||||
| (5% return before expenses) | ||||||||||
| Class A | Class R | Class P | Class R6 | Administrative Class | ||||||
| Beginning Account Value (12/1/13) | $1,000.00 | $1,000.00 | $1,000.00 | $1,000.00 | $1,000.00 | |||||
| Ending Account Value (5/31/14) | $1,023.19 | $1,021.44 | $1,024.68 | $1,024.93 | $1,023.44 | |||||
| Expenses Paid During Period | $1.77 | $3.53 | $0.25 | $— | $1.51 | |||||
For each class of the Fund, expenses (net of fee waiver and reimbursement, if any) are equal to the annualized expense ratio for the class (0.35% for Class A, 0.70% for Class R, 0.05% for Class P, 0.00% for Class R6 and 0.30% for Administrative Class), multiplied by the average account value over the period, multiplied by 182/365. The expense ratio does not include the expenses of the Underlying Funds, which based upon the allocation of the Fund’s assets among the Underlying Funds are indirectly borne by the shareholders of the Fund.
| 20 | May 31, 2014 | | Semiannual Report |
Table of Contents
Unaudited
AllianzGI Retirement 2040 Fund
For the period of December 1, 2013 through May 31, 2014, as provided by the US Multi Asset Group.
Fund Insights
| Semiannual Report | | May 31, 2014 | 21 |
Table of Contents
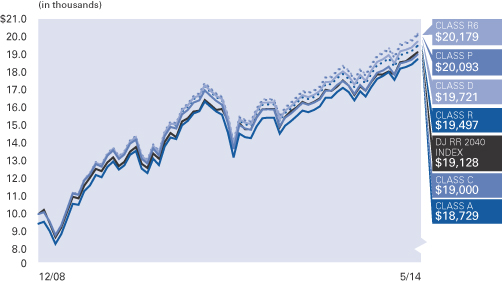
Unaudited
AllianzGI Retirement 2040 Fund (cont’d)
Average Annual Total Return for the period ended May 31, 2014
| 6 Month* |
1 Year |
5 Year |
Since Inception† |
|||||||||||||||
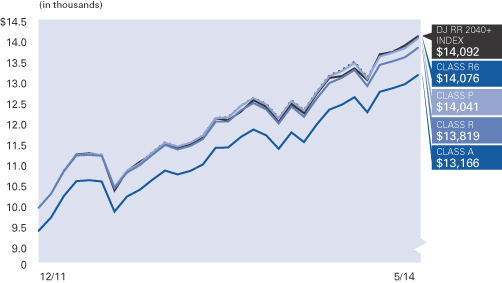
| AllianzGI Retirement 2040 Fund Class A | 5.26% | 10.90% | 12.08% | 13.45% | ||||||||||||||
|
|
AllianzGI Retirement 2040 Fund Class A (adjusted) | –0.53% | 4.80% | 10.82% | 12.27% | |||||||||||||
| AllianzGI Retirement 2040 Fund Class C | 4.94% | 10.13% | 11.25% | 12.58% | ||||||||||||||
|
|
AllianzGI Retirement 2040 Fund Class C (adjusted) | 3.94% | 9.13% | 11.25% | 12.58% | |||||||||||||
|
|
AllianzGI Retirement 2040 Fund Class D | 5.28% | 10.82% | 12.00% | 13.35% | |||||||||||||
|
|
AllianzGI Retirement 2040 Fund Class R | 5.11% | 10.56% | 11.75% | 13.11% | |||||||||||||
|
|
AllianzGI Retirement 2040 Fund Class P | 5.45% | 11.27% | 12.38% | 13.74% | |||||||||||||
|
|
AllianzGI Retirement 2040 Fund Class R6 | 5.50% | 11.36% | 12.47% | 13.83% | |||||||||||||
| AllianzGI Retirement 2040 Fund Administrative Class | 5.32% | 10.99% | 12.14% | 13.50% | ||||||||||||||
|
|
Dow Jones Real Return 2040 Index | 6.99% | 10.93% | 11.77% | 12.72% | |||||||||||||
| Lipper Mixed-Asset Target 2040 Funds Average | 5.38% | 14.57% | 13.93% | 14.38% | ||||||||||||||
† The Fund began operations on 12/29/08. Benchmark return comparisons began on the fund inception date. Lipper performance comparisons began on 12/31/08.
* Cumulative return.
Performance quoted represents past performance and is no guarantee of future results. Current performance may be lower or higher than performance shown. For performance current to the most recent month-end, visit our website at us.allianzgi.com. Investment return and the principal value will fluctuate. Shares may be worth more or less than original cost when redeemed. The adjusted returns take into account the maximum initial sales charge of 5.50% on Class A shares and the contingent deferred sales charge (CDSC) of 1% on Class C shares, which may apply to shares redeemed during the first year of ownership. Returns do not reflect deduction of taxes that a shareholder would pay on fund distributions or redemption of fund shares. See pages 86 and 87 for more information. The Fund’s gross expense ratios are 1.34% for Class A shares, 2.09% for Class C shares, 1.34% for Class D shares, 1.59% for Class R shares, 0.94% for Class P shares, 0.84% for Class R6 shares and 1.19% for Administrative Class shares. These ratios do not include an expense reduction, contractually guaranteed through at least 3/31/15. The Fund’s expense ratios net of this reduction are 1.09% for Class A shares, 1.84% for Class C shares, 1.19% for Class D shares, 1.44% for Class R shares, 0.79% for Class P shares, 0.69% for Class R6 shares and 1.04% for Administrative Class shares. Expense ratio information is as of the Fund’s current prospectus dated April 1, 2014, as supplemented to date.
| 22 | May 31, 2014 | | Semiannual Report |
Table of Contents
Unaudited
AllianzGI Retirement 2040 Fund (cont’d)
| Shareholder Expense Example | Actual Performance | |||||||||||||
| Class A | Class C | Class D | Class R | Class P | Class R6 | Administrative Class | ||||||||
| Beginning Account Value (12/1/13) | $1,000.00 | $1,000.00 | $1,000.00 | $1,000.00 | $1,000.00 | $1,000.00 | $1,000.00 | |||||||
| Ending Account Value (5/31/14) | $1,052.60 | $1,049.40 | $1,052.80 | $1,051.10 | $1,054.50 | $1,055.00 | $1,053.20 | |||||||
| Expenses Paid During Period | $1.74 | $5.57 | $2.25 | $3.53 | $0.20 | $— | $1.48 | |||||||
| Hypothetical Performance | ||||||||||||||
| (5% return before expenses) | ||||||||||||||
| Class A | Class C | Class D | Class R | Class P | Class R6 | Administrative Class | ||||||||
| Beginning Account Value (12/1/13) | $1,000.00 | $1,000.00 | $1,000.00 | $1,000.00 | $1,000.00 | $1,000.00 | $1,000.00 | |||||||
| Ending Account Value (5/31/14) | $1,023.24 | $1,019.50 | $1,022.74 | $1,021.49 | $1,024.73 | $1,024.93 | $1,023.49 | |||||||
| Expenses Paid During Period | $1.72 | $5.49 | $2.22 | $3.48 | $0.20 | $— | $1.46 | |||||||
For each class of the Fund, expenses (net of fee waiver and reimbursement, if any) are equal to the annualized expense ratio for the class (0.34% for Class A, 1.09% for Class C, 0.44% for Class D, 0.69% for Class R, 0.04% for Class P, 0.00% for Class R6 and 0.29% for Administrative Class), multiplied by the average account value over the period, multiplied by 182/365. The expense ratio does not include the expenses of the Underlying Funds, which based upon the allocation of the Fund’s assets among the Underlying Funds are indirectly borne by the shareholders of the Fund.
| Semiannual Report | | May 31, 2014 | 23 |
Table of Contents
Unaudited
AllianzGI Retirement 2045 Fund
For the period of December 1, 2013 through May 31, 2014, as provided by the US Multi Asset Group.
Fund Insights
| 24 | May 31, 2014 | | Semiannual Report |
Table of Contents
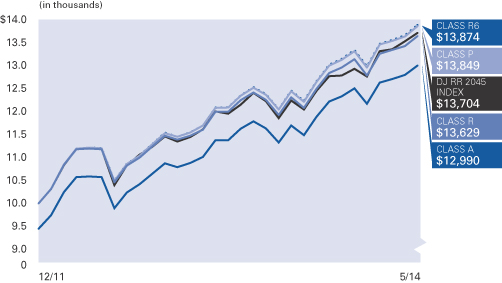
Unaudited
AllianzGI Retirement 2045 Fund (cont’d)
Average Annual Total Return for the period ended May 31, 2014
| 6 Month* | 1 Year | Since Inception† | ||||||||||||
| AllianzGI Retirement 2045 Fund Class A | 5.38% | 11.69% | 13.87% | |||||||||||
|
|
AllianzGI Retirement 2045 Fund Class A (adjusted) | –0.41% | 5.54% | 11.27% | ||||||||||
|
|
AllianzGI Retirement 2045 Fund Class R | 5.23% | 11.31% | 13.47% | ||||||||||
|
|
AllianzGI Retirement 2045 Fund Class P | 5.58% | 12.05% | 14.21% | ||||||||||
|
|
AllianzGI Retirement 2045 Fund Class R6 | 5.60% | 12.13% | 14.30% | ||||||||||
| AllianzGI Retirement 2045 Fund Administrative Class | 5.44% | 11.80% | 13.89% | |||||||||||
|
|
Dow Jones Real Return 2045 Index | 7.26% | 12.18% | 13.74% | ||||||||||
| Lipper Mixed-Asset Target 2045 Funds Average | 5.53% | 15.59% | 17.07% | |||||||||||
† The Fund began operations on 12/19/11. Benchmark return comparisons began on the fund inception date. Lipper performance comparisons began on 12/31/11.
* Cumulative return.
Performance quoted represents past performance and is no guarantee of future results. Current performance may be lower or higher than performance shown. For performance current to the most recent month-end, visit our website at us.allianzgi.com. Investment return and the principal value will fluctuate. Shares may be worth more or less than original cost when redeemed. The adjusted returns take into account the maximum initial sales charge of 5.50% on Class A shares. Returns do not reflect deduction of taxes that a shareholder would pay on fund distributions or redemption of fund shares. See pages 86 and 87 for more information. The Fund’s gross expense ratios are 1.37% for Class A shares, 1.62% for Class R shares, 0.97% for Class P shares, 0.87% for Class R6 shares and 1.22% for Administrative Class shares. These ratios do not include an expense reduction, contractually guaranteed through at least 3/31/15. The Fund’s expense ratios net of this reduction are 1.10% for Class A shares, 1.45% for Class R shares, 0.80% for Class P shares, 0.70% for Class R6 shares and 1.05% for Administrative Class shares. Expense ratio information is as of the Fund’s current prospectus dated April 1, 2014, as supplemented to date.
| Semiannual Report | | May 31, 2014 | 25 |
Table of Contents
Unaudited
AllianzGI Retirement 2045 Fund (cont’d)
| Shareholder Expense Example | Actual Performance | |||||||||
| Class A | Class R | Class P | Class R6 | Administrative Class | ||||||
| Beginning Account Value (12/1/13) | $1,000.00 | $1,000.00 | $1,000.00 | $1,000.00 | $1,000.00 | |||||
| Ending Account Value (5/31/14) | $1,053.80 | $1,052.30 | $1,055.80 | $1,056.00 | $1,054.40 | |||||
| Expenses Paid During Period | $1.69 | $3.48 | $0.15 | $— | $1.43 | |||||
| Hypothetical Performance | ||||||||||
| (5% return before expenses) | ||||||||||
| Class A | Class R | Class P | Class R6 | Administrative Class | ||||||
| Beginning Account Value (12/1/13) | $1,000.00 | $1,000.00 | $1,000.00 | $1,000.00 | $1,000.00 | |||||
| Ending Account Value (5/31/14) | $1,023.29 | $1,021.54 | $1,024.78 | $1,024.93 | $1,023.54 | |||||
| Expenses Paid During Period | $1.66 | $3.43 | $0.15 | $— | $1.41 | |||||
For each class of the Fund, expenses (net of fee waiver and reimbursement, if any) are equal to the annualized expense ratio for the class (0.33% for Class A, 0.68% for Class R, 0.03% for Class P, 0.00% for Class R6 and 0.28% for Administrative Class), multiplied by the average account value over the period, multiplied by 182/365. The expense ratio excludes the expenses of the Underlying Funds, which based upon the allocation of the Fund’s assets among the Underlying Funds are indirectly borne by the shareholders of the Fund.
| 26 | May 31, 2014 | | Semiannual Report |
Table of Contents
Unaudited
AllianzGI Retirement 2050 Fund
For the period of December 1, 2013 through May 31, 2014, as provided by the US Multi Asset Group.
Fund Insights
| Semiannual Report | | May 31, 2014 | 27 |
Table of Contents
Unaudited
AllianzGI Retirement 2050 Fund (cont’d)
Average Annual Total Return for the period ended May 31, 2014
| 6 Month* |
1 Year |
5 Year | Since Inception† |
|||||||||||||||
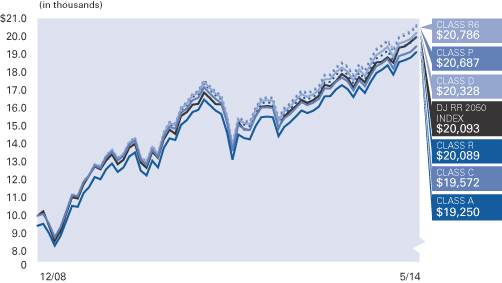
| AllianzGI Retirement 2050 Fund Class A | 5.49% | 12.10% | 12.73% | 14.03% | ||||||||||||||
|
|
AllianzGI Retirement 2050 Fund Class A (adjusted) | –0.31% | 5.94% | 11.47% | 12.85% | |||||||||||||
| AllianzGI Retirement 2050 Fund Class C | 5.11% | 11.27% | 11.88% | 13.20% | ||||||||||||||
|
|
AllianzGI Retirement 2050 Fund Class C (adjusted) | 4.11% | 10.27% | 11.88% | 13.20% | |||||||||||||
|
|
AllianzGI Retirement 2050 Fund Class D | 5.41% | 12.01% | 12.67% | 13.98% | |||||||||||||
|
|
AllianzGI Retirement 2050 Fund Class R | 5.34% | 11.75% | 12.40% | 13.73% | |||||||||||||
|
|
AllianzGI Retirement 2050 Fund Class P | 5.63% | 12.45% | 13.02% | 14.35% | |||||||||||||
|
|
AllianzGI Retirement 2050 Fund Class R6 | 5.71% | 12.53% | 13.12% | 14.45% | |||||||||||||
| AllianzGI Retirement 2050 Fund Administrative Class | 5.46% | 12.14% | 12.78% | 14.11% | ||||||||||||||
|
|
Dow Jones Real Return 2050 Index | 7.38% | 13.03% | 12.68% | 13.74% | |||||||||||||
| Lipper Mixed-Asset Target 2050+ Funds Average | 5.52% | 15.15% | 14.18% | 14.59% | ||||||||||||||
† The Fund began operations on 12/29/08. Benchmark return comparisons began on the fund inception date. Lipper performance comparisons began on 12/31/08.
* Cumulative return.
Performance quoted represents past performance and is no guarantee of future results. Current performance may be lower or higher than performance shown. For performance current to the most recent month-end, visit our website at us.allianzgi.com. Investment return and the principal value will fluctuate. Shares may be worth more or less than original cost when redeemed. The adjusted returns take into account the maximum initial sales charge of 5.50% on Class A shares and the contingent deferred sales charge (CDSC) of 1% on Class C shares, which may apply to shares redeemed during the first year of ownership. Returns do not reflect deduction of taxes that a shareholder would pay on fund distributions or redemption of fund shares. See pages 86 and 87 for more information. The Fund’s gross expense ratios are 1.40% for Class A shares, 2.15% for Class C shares, 1.40% for Class D shares, 1.65% for Class R shares, 1.00% for Class P shares, 0.90% for Class R6 shares and 1.25% for Administrative Class shares. These ratios do not include an expense reduction, contractually guaranteed through at least 3/31/15. The Fund’s expense ratios net of this reduction are 1.10% for Class A shares, 1.85% for Class C shares, 1.20% for Class D shares, 1.45% for Class R shares, 0.80% for Class P shares, 0.70% for Class R6 shares and 1.05% for Administrative Class shares. Expense ratio information is as of the Fund’s current prospectus dated April 1, 2014, as supplemented to date.
The Dow Jones Real Return 2050 Index inception date was 12/31/2009. Accordingly, Dow Jones Real Return 40+ Index performance is used for periods prior to 12/31/2009.
| 28 | May 31, 2014 | | Semiannual Report |
Table of Contents
Unaudited
AllianzGI Retirement 2050 Fund (cont’d)
| Shareholder Expense Example | Actual Performance | |||||||||||||
| Class A | Class C | Class D | Class R | Class P | Class R6 | Administrative Class | ||||||||
| Beginning Account Value (12/1/13) | $1,000.00 | $1,000.00 | $1,000.00 | $1,000.00 | $1,000.00 | $1,000.00 | $1,000.00 | |||||||
| Ending Account Value (5/31/14) | $1,054.90 | $1,051.10 | $1,054.10 | $1,053.40 | $1,056.30 | $1,057.10 | $1,054.60 | |||||||
| Expenses Paid During Period | $1.59 | $5.42 | $2.10 | $3.38 | $0.05 | $— | $1.33 | |||||||
| Hypothetical Performance | ||||||||||||||
| (5% return before expenses) | ||||||||||||||
| Class A | Class C | Class D | Class R | Class P | Class R6 | Administrative Class | ||||||||
| Beginning Account Value (12/1/13) | $1,000.00 | $1,000.00 | $1,000.00 | $1,000.00 | $1,000.00 | $1,000.00 | $1,000.00 | |||||||
| Ending Account Value (5/31/14) | $1,023.39 | $1,019.65 | $1,022.89 | $1,021.64 | $1,024.88 | $1,024.93 | $1,023.64 | |||||||
| Expenses Paid During Period | $1.56 | $5.34 | $2.07 | $3.33 | $0.05 | $— | $1.31 | |||||||
For each class of the Fund, expenses (net of fee waiver and reimbursement, if any) are equal to the annualized expense ratio for the class (0.31% for Class A, 1.06% for Class C, 0.41% for Class D, 0.66% for Class R, 0.01% for Class P, 0.00% for Class R6 and 0.26% for Administrative Class), multiplied by the average account value over the period, multiplied by 182/365. The expense ratio does not include the expenses of the Underlying Funds, which based upon the allocation of the Fund’s assets among the Underlying Funds are indirectly borne by the shareholders of the Fund.
| Semiannual Report | | May 31, 2014 | 29 |
Table of Contents
Unaudited
AllianzGI Retirement 2055 Fund
For the period of December 1, 2013 through May 31, 2014, as provided by the US Multi Asset Group.
Fund Insights
Average Annual Total Return for the period ended May 31, 2014
| 6 Month* | 1 Year | Since Inception† | ||||||||||||
| AllianzGI Retirement 2055 Fund Class A | 5.63% | 12.28% | 14.50% | |||||||||||
|
|
AllianzGI Retirement 2055 Fund Class A (adjusted) | –0.18% | 6.11% | 11.88% | ||||||||||
|
|
AllianzGI Retirement 2055 Fund Class R | 5.45% | 11.94% | 14.13% | ||||||||||
|
|
AllianzGI Retirement 2055 Fund Class P | 5.82% | 12.65% | 14.87% | ||||||||||
|
|
AllianzGI Retirement 2055 Fund Class R6 | 5.87% | 12.75% | 14.97% | ||||||||||
| AllianzGI Retirement 2055 Fund Administrative Class | 5.66% | 12.44% | 14.57% | |||||||||||
|
|
Dow Jones Real Return 2040+ Index | 7.24% | 13.53% | 15.04% | ||||||||||
| Lipper Mixed-Asset Target 2055+ Funds Average | 5.66% | 16.30% | 17.44% | |||||||||||
† The Fund began operations on 12/19/11. Benchmark return comparisons began on the fund inception date. Lipper performance comparisons began on 12/31/11.
* Cumulative return.
Performance quoted represents past performance and is no guarantee of future results. Current performance may be lower or higher than performance shown. For performance current to the most recent month-end, visit our website at us.allianzgi.com. Investment return and the principal value will fluctuate. Shares may be worth more or less than original cost when redeemed. The adjusted returns take into account the maximum initial sales charge of 5.50% on Class A shares. Returns do not reflect deduction of taxes that a shareholder would pay on fund distributions or redemption of fund shares. See pages 86 and 87 for more information. The Fund’s gross expense ratios are 1.40% for Class A shares, 1.65% for Class R shares, 1.00% for Class P shares, 0.90% for Class R6 shares and 1.25% for Administrative Class shares. These ratios do not include an expense reduction, contractually guaranteed through at least 3/31/15. The Fund’s expense ratios net of this reduction are 1.10% for Class A shares, 1.45% for Class R shares, 0.80% for Class P shares, 0.70% for Class R6 shares and 1.05% for Administrative Class shares. Expense ratio information is as of the Fund’s current prospectus dated April 1, 2014, as supplemented to date.
| 30 | May 31, 2014 | | Semiannual Report |
Table of Contents
Unaudited
AllianzGI Retirement 2055 Fund (cont’d)
| Shareholder Expense Example | Actual Performance | |||||||||
| Class A | Class R | Class P | Class R6 | Administrative Class | ||||||
| Beginning Account Value (12/1/13) | $1,000.00 | $1,000.00 | $1,000.00 | $1,000.00 | $1,000.00 | |||||
| Ending Account Value (5/31/14) | $1,056.30 | $1,054.50 | $1,058.20 | $1,058.70 | $1,056.60 | |||||
| Expenses Paid During Period | $1.54 | $3.33 | $— | $— | $1.28 | |||||
| Hypothetical Performance | ||||||||||
| (5% return before expenses) | ||||||||||
| Class A | Class R | Class P | Class R6 | Administrative Class | ||||||
| Beginning Account Value (12/1/13) | $1,000.00 | $1,000.00 | $1,000.00 | $1,000.00 | $1,000.00 | |||||
| Ending Account Value (5/31/14) | $1,023.44 | $1,021.69 | $1,024.93 | $1,024.93 | $1,023.68 | |||||
| Expenses Paid During Period | $1.51 | $3.28 | $— | $— | $1.26 | |||||
For each class of the Fund, expenses (net of fee waiver and reimbursement, if any) are equal to the annualized expense ratio for the class (0.30% for Class A, 0.65% for Class R, 0.00% for Class P, 0.00% for Class R6 and 0.25% for Administrative Class), multiplied by the average account value over the period, multiplied by 182/365. The expense ratio does not include the expenses of the Underlying Funds, which based upon the allocation of the Fund’s assets among the Underlying Funds are indirectly borne by the shareholders of the Fund.
| Semiannual Report | | May 31, 2014 | 31 |
Table of Contents
Unaudited
AllianzGI Retirement Income Fund
For the period of December 1, 2013 through May 31, 2014, as provided by the US Multi Asset Group.
Fund Insights
| 32 | May 31, 2014 | | Semiannual Report |
Table of Contents
Unaudited
AllianzGI Retirement Income Fund (cont’d)
Average Annual Total Return for the period ended May 31, 2014
| 6 Month* | 1 Year | 5 Year | Since Inception† | |||||||||||||||
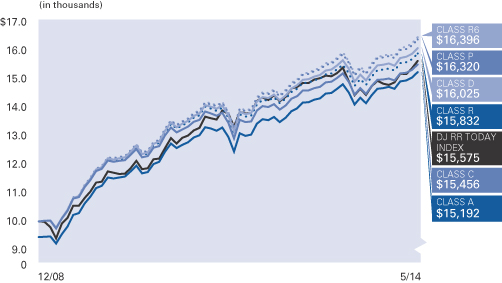
| AllianzGI Retirement Income Fund Class A |
3.85% | 4.92% | 8.24% | 9.16% | ||||||||||||||
|
|
AllianzGI Retirement Income Fund Class A (adjusted) |
–1.86% | –0.85% | 7.02% | 8.03% | |||||||||||||
| AllianzGI Retirement Income Fund Class C |
3.50% | 4.15% | 7.45% | 8.36% | ||||||||||||||
|
|
AllianzGI Retirement Income Fund Class C (adjusted) |
2.50% | 3.15% | 7.45% | 8.36% | |||||||||||||
|
|
AllianzGI Retirement Income Fund Class D |
3.80% | 4.78% | 8.19% | 9.10% | |||||||||||||
|
|
AllianzGI Retirement Income Fund Class R |
3.64% | 4.54% | 7.91% | 8.84% | |||||||||||||
|
|
AllianzGI Retirement Income Fund Class P |
3.98% | 5.25% | 8.54% | 9.45% | |||||||||||||
|
|
AllianzGI Retirement Income Fund Class R6 |
4.05% | 5.34% | 8.64% | 9.56% | |||||||||||||
| AllianzGI Retirement Income Fund Administrative Class |
3.85% | 4.97% | 8.30% | 9.23% | ||||||||||||||
|
|
Dow Jones Real Return Today Index |
5.32% | 4.81% | 8.11% | 8.52% | |||||||||||||
| Lipper Mixed-Asset Target Today Funds Average |
3.72% | 6.24% | 8.16% | 8.57% | ||||||||||||||
† The Fund began operations on 12/29/08. Benchmark return comparisons began on the fund inception date. Lipper performance comparisons began on 12/31/08.
* Cumulative return.
Performance quoted represents past performance and is no guarantee of future results. Current performance may be lower or higher than performance shown. For performance current to the most recent month-end, visit our website at us.allianzgi.com. Investment return and the principal value will fluctuate. Shares may be worth more or less than original cost when redeemed. The adjusted returns take into account the maximum initial sales charge of 5.50% on Class A shares and the contingent deferred sales charge (CDSC) of 1% on Class C shares, which may apply to shares redeemed during the first year of ownership. Returns do not reflect deduction of taxes that a shareholder would pay on fund distributions or redemption of fund shares. See pages 86 and 87 for more information. The Fund’s gross expense ratios are 1.16% for Class A shares, 1.91% for Class C shares, 1.16% for Class D shares, 1.41% for Class R shares, 0.76% for Class P shares, 0.66% for Class R6 shares and 1.01% for Administrative Class shares. These ratios do not include an expense reduction, contractually guaranteed through at least 3/31/15. The Fund’s expense ratios net of this reduction are 0.95% for Class A shares, 1.70% for Class C shares, 1.05% for Class D shares, 1.30% for Class R shares, 0.65% for Class P shares, 0.55% for Class R6 shares and 0.90% for Administrative Class shares. Expense ratio information is as of the Fund’s current prospectus dated April 1, 2014, as supplemented to date.
| Semiannual Report | | May 31, 2014 | 33 |
Table of Contents
Unaudited
AllianzGI Retirement Income Fund (cont’d)
| Shareholder Expense Example | Actual Performance | |||||||||||||
| Class A | Class C | Class D | Class R | Class P | Class R6 | Administrative Class | ||||||||
| Beginning Account Value (12/1/13) | $1,000.00 | $1,000.00 | $1,000.00 | $1,000.00 | $1,000.00 | $1,000.00 | $1,000.00 | |||||||
| Ending Account Value (5/31/14) | $1,038.50 | $1,035.00 | $1,038.00 | $1,036.40 | $1,039.80 | $1,040.50 | $1,038.50 | |||||||
| Expenses Paid During Period | $1.93 | $5.73 | $2.44 | $3.71 | $0.46 | $— | $1.68 | |||||||
| Hypothetical Performance | ||||||||||||||
| (5% return before expenses) | ||||||||||||||
| Class A | Class C | Class D | Class R | Class P | Class R6 | Administrative Class | ||||||||
| Beginning Account Value (12/1/13) | $1,000.00 | $1,000.00 | $1,000.00 | $1,000.00 | $1,000.00 | $1,000.00 | $1,000.00 | |||||||
| Ending Account Value (5/31/14) | $1,023.04 | $1,019.30 | $1,022.54 | $1,021.29 | $1,024.48 | $1,024.93 | $1,023.29 | |||||||
| Expenses Paid During Period | $1.92 | $5.69 | $2.42 | $3.68 | $0.45 | $— | $1.66 | |||||||
For each class of the Fund, expenses (net of fee waiver and reimbursement, if any) are equal to the annualized expense ratio for the class (0.38% for Class A, 1.13% for Class C, 0.48% for Class D, 0.73% for Class R, 0.09% for Class P, 0.00% for Class R6 and 0.33% for Administrative Class), multiplied by the average account value over the period, multiplied by 182/365. The expense ratio does not include the expenses of the Underlying Funds, which based upon the allocation of the Fund’s assets among the Underlying Funds are indirectly borne by the shareholders of the Fund.
| 34 | May 31, 2014 | | Semiannual Report |
Table of Contents
Unaudited
AllianzGI Global Allocation Fund
For the period of December 1, 2013 through May 31, 2014, as provided by the US Multi Asset Group.
Fund Insights
| Semiannual Report | | May 31, 2014 | 35 |
Table of Contents
Unaudited
AllianzGI Global Allocation Fund (cont’d)
Average Annual Total Return for the period ended May 31, 2014
| 6 Month* | 1 Year |
5 Year |
10 Year |
Since Inception† | ||||||||||||||||||
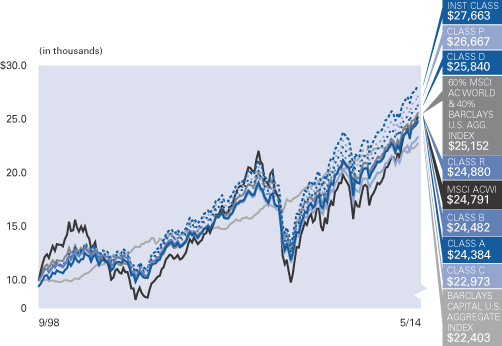
| AllianzGI Global Allocation Fund Class A | 4.66% | 10.02% | 11.21% | 6.35% | 6.24% | |||||||||||||||||
|
|
AllianzGI Global Allocation Fund Class A (adjusted) | –1.10% | 3.97% | 9.96% | 5.75% | 5.86% | ||||||||||||||||
| AllianzGI Global Allocation Fund Class B | 4.32% | 9.22% | 10.41% | 5.79% | 5.88% | |||||||||||||||||
|
|
AllianzGI Global Allocation Fund Class B (adjusted) | –0.68% | 4.22% | 10.14% | 5.79% | 5.88% | ||||||||||||||||
| AllianzGI Global Allocation Fund Class C | 4.39% | 9.27% | 10.40% | 5.57% | 5.45% | |||||||||||||||||
|
|
AllianzGI Global Allocation Fund Class C (adjusted) | 3.39% | 8.27% | 10.40% | 5.57% | 5.45% | ||||||||||||||||
|
|
AllianzGI Global Allocation Fund Class D | 4.72% | 10.09% | 11.20% | 6.36% | 6.25% | ||||||||||||||||
|
|
AllianzGI Global Allocation Fund Class R | 4.60% | 9.81% | 10.95% | 6.11% | 5.99% | ||||||||||||||||
|
|
AllianzGI Global Allocation Fund Class P | 4.79% | 10.30% | 11.43% | 6.58% | 6.46% | ||||||||||||||||
|
|
AllianzGI Global Allocation Fund Institutional Class | 4.84% | 10.31% | 11.53% | 6.80% | 6.71% | ||||||||||||||||
| AllianzGI Global Allocation Fund Administrative Class | 4.71% | 9.93% | 11.23% | 6.40% | 6.29% | |||||||||||||||||
|
|
MSCI All Country World Index | 6.02% | 17.15% | 13.73% | 7.47% | 5.97% | ||||||||||||||||
|
|
60% MSCI AC World Index/40% Barclays U.S. Aggregate Index | 4.98% | 11.29% | 10.46% | 6.84% | 6.06% | ||||||||||||||||
|
|
Barclays U.S. Aggregate Index | 3.28% | 2.71% | 4.96% | 4.99% | 5.28% | ||||||||||||||||
| Lipper Mixed-Asset Target Allocation Moderate Funds Average | 5.09% | 11.11% | 11.38% | 6.08% | 5.71% | |||||||||||||||||
† The Fund began operations on 9/30/98. Benchmark return comparisons began on the fund inception date. Lipper performance comparisons began on 9/30/98.
* Cumulative return.
Performance quoted represents past performance and is no guarantee of future results. Current performance may be lower or higher than performance shown. For performance current to the most recent month-end, visit our website at us.allianzgi.com. Investment return and the principal value will fluctuate. Shares may be worth more or less than original cost when redeemed. The adjusted returns take into account the maximum sales charge of 5.50% on Class A shares, 5% contingent deferred sales charge (CDSC) on Class B shares and 1% CDSC on Class C shares. Returns do not reflect deduction of taxes that a shareholder would pay on fund distributions or redemption of fund shares. See pages 86 and 87 for more information. The Fund’s gross expense ratios are 2.09% for Class A shares, 2.91% for Class B shares, 2.83% for Class C shares, 2.12% for Class D shares, 2.27% for Class R shares, 1.86% for Class P shares, 1.84% for Institutional Class shares and 2.21% for Administrative Class shares. These ratios do not include an expense reduction, contractually guaranteed through at least 3/31/15. The Fund’s expense ratios net of this reduction are 1.13% for Class A shares, 1.84% for Class B shares, 1.86% for Class C shares, 1.13% for Class D shares, 1.29% for Class R shares, 0.89% for Class P shares, 0.89% for Institutional Class shares and 1.14% for Administrative Class shares. Expense ratio information is as of the Fund’s current prospectus dated April 1, 2014, as supplemented to date.
| 36 | May 31, 2014 | | Semiannual Report |
Table of Contents
Unaudited
AllianzGI Global Allocation Fund (cont’d)
| Shareholder Expense Example | Actual Performance | |||||||||||||||
| Class A | Class B | Class C | Class D | Class R | Class P | Institutional Class |
Administrative Class | |||||||||
| Beginning Account Value (12/1/13) | $1,000.00 | $1,000.00 | $1,000.00 | $1,000.00 | $1,000.00 | $1,000.00 | $1,000.00 | $1,000.00 | ||||||||
| Ending Account Value (5/31/14) | $1,046.60 | $1,043.20 | $1,043.90 | $1,047.20 | $1,046.00 | $1,047.90 | $1,048.40 | $1,047.10 | ||||||||
| Expenses Paid During Period | $2.04 | $5.65 | $5.76 | $1.89 | $2.86 | $0.82 | $0.82 | $2.09 | ||||||||
| Hypothetical Performance | ||||||||||||||||
| (5% return before expenses) | ||||||||||||||||
| Class A | Class B | Class C | Class D | Class R | Class P | Institutional Class |
Administrative Class | |||||||||
| Beginning Account Value (12/1/13) | $1,000.00 | $1,000.00 | $1,000.00 | $1,000.00 | $1,000.00 | $1,000.00 | $1,000.00 | $1,000.00 | ||||||||
| Ending Account Value (5/31/14) | $1,022.94 | $1,019.40 | $1,019.30 | $1,023.09 | $1,022.14 | $1,024.13 | $1,024.13 | $1,022.89 | ||||||||
| Expenses Paid During Period | $2.02 | $5.59 | $5.69 | $1.86 | $2.82 | $0.81 | $0.81 | $2.07 | ||||||||
For each class of the Fund, expenses (net of fee waiver and reimbursement, if any) are equal to the annualized expense ratio for the class (0.40% for Class A, 1.11% for Class B, 1.13% for Class C, 0.37% for Class D, 0.56% for Class R, 0.16% for Class P, 0.16% for Institutional Class and 0.41% for Administrative Class), multiplied by the average account value over the period, multiplied by 182/365. The expense ratio does not include the expenses of the Underlying Funds, which based upon the allocation of the Fund’s assets among the Underlying Funds are indirectly borne by the shareholders of the Fund.
| Semiannual Report | | May 31, 2014 | 37 |
Table of Contents
Unaudited
AllianzGI Global Growth Allocation Fund
For the period of December 1, 2013 through May 31, 2014, as provided by the US Multi Asset Group.
Fund Insights
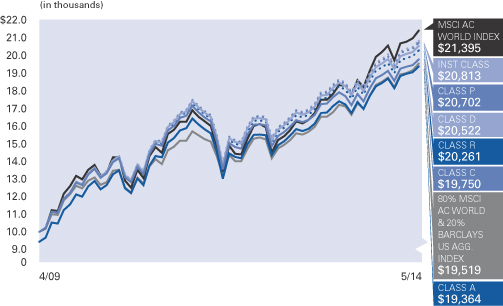
Average Annual Total Return for the period ended May 31, 2014
| 6 Month* | 1 Year | 5 Year | Since Inception† | |||||||||||||||
| AllianzGI Global Growth Allocation Fund Class A | 5.08% | 12.54% | 12.94% | 15.13% | ||||||||||||||
|
|
AllianzGI Global Growth Allocation Fund Class A (adjusted) | –0.70% | 6.35% | 11.67% | 13.86% | |||||||||||||
| AllianzGI Global Growth Allocation Fund Class C | 4.65% | 11.69% | 12.13% | 14.29% | ||||||||||||||
|
|
AllianzGI Global Growth Allocation Fund Class C (adjusted) | 3.75% | 10.72% | 12.13% | 14.29% | |||||||||||||
|
|
AllianzGI Global Growth Allocation Fund Class D | 5.10% | 12.56% | 12.96% | 15.15% | |||||||||||||
|
|
AllianzGI Global Growth Allocation Fund Class R | 4.95% | 12.29% | 12.69% | 14.87% | |||||||||||||
|
|
AllianzGI Global Growth Allocation Fund Class P | 5.16% | 12.73% | 13.17% | 15.36% | |||||||||||||
|
|
AllianzGI Global Growth Allocation Fund Institutional Class | 5.23% | 12.84% | 13.29% | 15.48% | |||||||||||||
| AllianzGI Global Growth Allocation Fund Administrative Class | 5.07% | 12.54% | 13.00% | 15.19% | ||||||||||||||
|
|
MSCI AC World Index | 6.02% | 17.15% | 13.73% | 16.11% | |||||||||||||
|
|
80% MSCI ACWI 20% Barclays US Agg. Index | 5.51% | 14.21% | 12.14% | 14.04% | |||||||||||||
| Lipper Global Flexible Port Fund Average | 4.53% | 8.72% | 10.50% | 11.92% | ||||||||||||||
† The Fund began operations on 4/27/09. Benchmark return comparisons began on the fund inception date. Lipper performance comparisons began on 4/30/09.
* Cumulative return.
Performance quoted represents past performance and is no guarantee of future results. Current performance may be lower or higher than performance shown. For performance current to the most recent month-end, visit our website at us.allianzgi.com. Investment return and the principal value will fluctuate. Shares may be worth more or less than original cost when redeemed. The adjusted returns take into account the maximum initial sales charge of 5.50% on Class A shares and the contingent deferred sales charge (CDSC) of 1% on Class C shares, which may apply to shares redeemed during the first year of ownership. Returns do not reflect deduction of taxes that a shareholder would pay on fund distributions or redemption of fund shares. See pages 86 and 87 for more information. The Fund’s gross expense ratios are 4.67% for Class A shares, 5.36% for Class C shares, 4.99% for Class D shares, 5.11% for Class R shares, 4.59% for Class P shares, 4.31% for Institutional Class shares and 4.62% for Administrative Class shares. These ratios do not include an expense reduction, contractually guaranteed through at least 3/31/15. The Fund’s expense ratios net of this reduction are 1.23% for Class A shares, 2.01% for Class C shares, 1.23% for Class D shares, 1.46% for Class R shares, 1.06% for Class P shares, 0.96% for Institutional Class shares and 1.21% for Administrative Class shares. Expense ratio information is as of the Fund’s current prospectus dated April 1, 2014, as supplemented to date.
| 38 | May 31, 2014 | | Semiannual Report |
Table of Contents
Unaudited
AllianzGI Global Growth Allocation Fund (cont’d)
| Shareholder Expense Example | Actual Performance | |||||||||||||
| Class A | Class C | Class D | Class R | Class P | Institutional Class |
Administrative Class | ||||||||
| Beginning Account Value (12/1/13) | $1,000.00 | $1,000.00 | $1,000.00 | $1,000.00 | $1,000.00 | $1,000.00 | $1,000.00 | |||||||
| Ending Account Value (5/31/14) | $1,050.80 | $1,046.50 | $1,051.00 | $1,049.50 | $1,051.60 | $1,052.30 | $1,050.70 | |||||||
| Expenses Paid During Period | $2.05 | $6.02 | $2.05 | $3.22 | $1.18 | $0.67 | $1.94 | |||||||
| Hypothetical Performance | ||||||||||||||
| (5% return before expenses) | ||||||||||||||
| Class A | Class C | Class D | Class R | Class P | Institutional Class |
Administrative Class | ||||||||
| Beginning Account Value (12/1/13) | $1,000.00 | $1,000.00 | $1,000.00 | $1,000.00 | $1,000.00 | $1,000.00 | $1,000.00 | |||||||
| Ending Account Value (5/31/14) | $1,022.94 | $1,019.05 | $1,022.94 | $1,021.79 | $1,023.78 | $1,024.28 | $1,023.04 | |||||||
| Expenses Paid During Period | $2.02 | $5.94 | $2.02 | $3.18 | $1.16 | $0.66 | $1.92 | |||||||
For each class of the Fund, expenses (net of fee waiver and reimbursement, if any) are equal to the annualized expense ratio for the class (0.40% for Class A, 1.18% for Class C, 0.40% for Class D, 0.63% for Class R, 0.23% for Class P, 0.13% for Institutional Class and 0.38% for Administrative Class), multiplied by the average account value over the period, multiplied by 182/365. The expense ratio does not include the expenses of the Underlying Funds, which based upon the allocation of the Fund’s assets among the Underlying Funds are indirectly borne by the shareholders of the Fund.
| Semiannual Report | | May 31, 2014 | 39 |
Table of Contents
Unaudited
AllianzGI Behavioral Advantage Large Cap Fund
For the period of December 1, 2013 through May 31, 2014, as provided by Raife Giovinazzo, CFA, PhD, Portfolio Manager.
Fund Insights
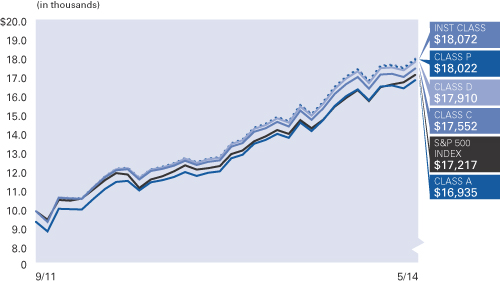
Average Annual Total Return for the period ended May 31, 2014
| 6 Month* | 1 Year | Since Inception† |
||||||||||||
| AllianzGI Behavioral Advantage Large Cap Fund Class A | 5.25% | 20.09% | 23.83% | |||||||||||
|
|
AllianzGI Behavioral Advantage Large Cap Fund Class A (adjusted) | –0.54% | 13.48% | 21.28% | ||||||||||
| AllianzGI Behavioral Advantage Large Cap Fund Class C | 4.87% | 19.17% | 22.88% | |||||||||||
|
|
AllianzGI Behavioral Advantage Large Cap Fund Class C (adjusted) | 3.87% | 18.17% | 22.88% | ||||||||||
|
|
AllianzGI Behavioral Advantage Large Cap Fund Class D | 5.26% | 20.08% | 23.81% | ||||||||||
|
|
AllianzGI Behavioral Advantage Large Cap Fund Class P | 5.37% | 20.32% | 24.09% | ||||||||||
|
|
AllianzGI Behavioral Advantage Large Cap Fund Institutional Class | 5.42% | 20.43% | 24.21% | ||||||||||
|
|
S&P 500 Index | 7.62% | 20.45% | 22.05% | ||||||||||
| Lipper Multi-Cap Core Fund Average | 6.27% | 19.48% | 18.85% | |||||||||||
† The Fund began operations on 9/8/11. Benchmark return comparisons began on the fund inception date. Lipper performance comparisons began on 8/31/11.
* Cumulative return.
Performance quoted represents past performance and is no guarantee of future results. Current performance may be lower or higher than performance shown. For performance current to the most recent month-end, visit our website at us.allianzgi.com. Investment return and the principal value will fluctuate. Shares may be worth more or less than original cost when redeemed. The adjusted returns take into account the maximum initial sales charge of 5.50% on Class A shares and the contingent deferred sales charge (CDSC) of 1% on Class C shares, which may apply to shares redeemed during the first year of ownership. Returns do not reflect deduction of taxes that a shareholder would pay on fund distributions or redemption of fund shares. See pages 86 and 87 for more information. The Fund’s gross expense ratios are 1.25% for Class A shares, 2.08% for Class C shares, 2.08% for Class D shares, 1.20% for Class P shares and 1.05% for Institutional Class shares. These ratios do not include an expense reduction, contractually guaranteed through at least 3/31/15. The Fund’s expense ratios net of this reduction are 0.81% for Class A shares, 1.57% for Class C shares, 0.81% for Class D shares, 0.65% for Class P shares and 0.55% for Institutional Class shares. Expense ratio information is as of the Fund’s current prospectus dated April 1, 2014, as supplemented to date.
| 40 | May 31, 2014 | | Semiannual Report |
Table of Contents
Unaudited
AllianzGI Behavioral Advantage Large Cap Fund (cont’d)
| Shareholder Expense Example | Actual Performance | |||||||||
| Class A | Class C | Class D | Class P | Institutional Class | ||||||
| Beginning Account Value (12/1/13) | $1,000.00 | $1,000.00 | $1,000.00 | $1,000.00 | $1,000.00 | |||||
| Ending Account Value (5/31/14) | $1,052.50 | $1,048.70 | $1,052.60 | $1,053.70 | $1,054.20 | |||||
| Expenses Paid During Period | $4.20 | $8.02 | $4.15 | $3.33 | $2.82 | |||||
| Hypothetical Performance | ||||||||||
| (5% return before expenses) | ||||||||||
| Class A | Class C | Class D | Class P | Institutional Class | ||||||
| Beginning Account Value (12/1/13) | $1,000.00 | $1,000.00 | $1,000.00 | $1,000.00 | $1,000.00 | |||||
| Ending Account Value (5/31/14) | $1,020.84 | $1,017.10 | $1,020.89 | $1,021.69 | $1,022.19 | |||||
| Expenses Paid During Period | $4.13 | $7.90 | $4.08 | $3.28 | $2.77 | |||||
For each class of the Fund, expenses (net of fee waiver and reimbursement, if any) are equal to the annualized expense ratio for the class (0.82% for Class A, 1.57% for Class C, 0.81% for Class D, 0.65% for Class P and 0.55% for Institutional Class), multiplied by the average account value over the period, multiplied by 182/365.
| Semiannual Report | | May 31, 2014 | 41 |
Table of Contents
Unaudited
AllianzGI Best Styles Global Equity Fund
Since the Fund’s inception on December 2, 2013 through May 31, 2014, as provided by Klaus Teloeken, Portfolio Manager.
Fund Insights
Cumulative Return for the period ended May 31, 2014
| Since Inception† | ||||||
|
|
AllianzGI Best Styles Global Equity Fund Class R6 | 6.80% | ||||
|
|
MSCI AC World Index | 6.48% | ||||
| Lipper Global Multi-Cap Core Fund Avg. | 5.12% | |||||
† The Fund began operations on 12/2/2013. Benchmark return comparisons began on the fund inception date. Lipper performance comparisons began on 11/30/2013.
Performance quoted represents past performance and is no guarantee of future results. Current performance may be lower or higher than performance shown. For performance current to the most recent month-end, visit our website at us.allianzgi.com. Investment return and the principal value will fluctuate. Shares may be worth more or less than original cost when redeemed. Returns do not reflect deduction of taxes that a shareholder would pay on fund distributions or redemption of fund shares. See pages 86 and 87 for more information. The Fund’s gross expense ratio is 3.25% for Class R6 shares. This ratio does not include an expense reduction, contractually guaranteed through at least 3/31/15. The Fund’s expense ratio net of this reduction ratio is 0.40% for Class R6 shares. Expense ratio information is as of the Fund’s current prospectus dated April 1, 2014, as supplemented to date.
| 42 | May 31, 2014 | | Semiannual Report |
Table of Contents
Unaudited
AllianzGI Best Styles Global Equity Fund (cont’d)
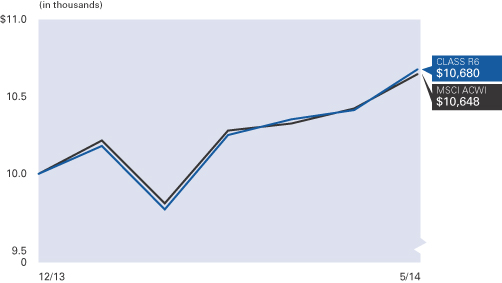
| Shareholder Expense Example | Actual Performance | |
| Class R6 | ||
| Beginning Account Value (12/2/13) | $1,000.00 | |
| Ending Account Value (5/31/14) | $1,068.00 | |
| Expenses Paid During Period | $2.04 | |
| Hypothetical Performance | ||
| (5% return before expenses) | ||
| Class R6 | ||
| Beginning Account Value (12/1/13) | $1,000.00 | |
| Ending Account Value (5/31/14) | $1,022.94 | |
| Expenses Paid During Period | $2.02 |
The Fund commenced operations on December 2, 2013. The Actual expense example is based on the period since inception; the Hypothetical expense example is based on the period beginning December 1, 2013. If the Hypothetical expense example had been based on the period since inception, the Ending Account Value and Expenses Paid During Period would have been $1,022.68 and $1.99.
Expenses (net of fee waiver and reimbursement, if any) are equal to the annualized expense ratio of 0.40% multiplied by the average account value over the period, multiplied by 180/365 for the Actual expense example and 182/365 for the Hypothetical expense example.
| Semiannual Report | | May 31, 2014 | 43 |
Table of Contents
Unaudited
AllianzGI China Equity Fund
For the period of December 1, 2013, through May 31, 2014, as provided by Christina Chung, Portfolio Manager.
Fund Insights
Average Annual Total Return for the period ended May 31, 2014
| 6 Month* | 1 Year |
Since Inception† |
||||||||||||
| AllianzGI China Equity Fund Class A |
–6.71% | 3.29% | 5.28% | |||||||||||
|
|
AllianzGI China Equity Fund Class A (adjusted) |
–11.84% | –2.40% | 3.80% | ||||||||||
| AllianzGI China Equity Fund Class C |
–7.09% | 2.43% | 4.53% | |||||||||||
|
|
AllianzGI China Equity Fund Class C (adjusted) |
–8.02% | 1.43% | 4.53% | ||||||||||
|
|
AllianzGI China Equity Fund Class D |
–6.76% | 3.22% | 5.32% | ||||||||||
|
|
AllianzGI China Equity Fund Class P |
–6.65% | 3.53% | 5.59% | ||||||||||
|
|
AllianzGI China Equity Fund Institutional Class |
–6.62% | 3.60% | 5.68% | ||||||||||
|
|
MSCI China Index |
–7.02% | 4.27% | 3.88% | ||||||||||
| Lipper China Region Funds Average |
–4.17% | 5.34% | 5.89% | |||||||||||
† The Fund began operations on 6/7/10. Benchmark return comparisons began on the fund inception date. Lipper performance comparisons began on 5/31/2010.
* Cumulative return.
Performance quoted represents past performance and is no guarantee of future results. Current performance may be lower or higher than performance shown. For performance current to the most recent month-end, visit our website at us.allianzgi.com. Investment return and the principal value will fluctuate. Shares may be worth more or less than original cost when redeemed. The adjusted returns take into account the maximum initial sales charge of 5.50% on Class A shares and the contingent deferred sales charge (CDSC) of 1% on Class C shares, which may apply to shares redeemed during the first year of ownership. Returns do not reflect deduction of taxes that a shareholder would pay on fund distributions or redemption of fund shares. See pages 86 and 87 for more information. The Fund’s gross expense ratios are 5.88% for Class A shares, 6.59% for Class C shares, 13.23% for Class D shares, 5.73% for Class P shares and 5.69% for Institutional Class shares. These ratios do not include an expense reduction, contractually guaranteed through at least 3/31/15. The Fund’s expense ratios net of this reduction are 1.70% for Class A shares, 2.45% for Class C shares, 1.77% for Class D shares, 1.51% for Class P shares and 1.45% for Institutional Class shares. Expense ratio information is as of the Fund’s current prospectus dated April 1, 2014, as supplemented to date.
| 44 | May 31, 2014 | | Semiannual Report |
Table of Contents
Unaudited
AllianzGI China Equity Fund (cont’d)
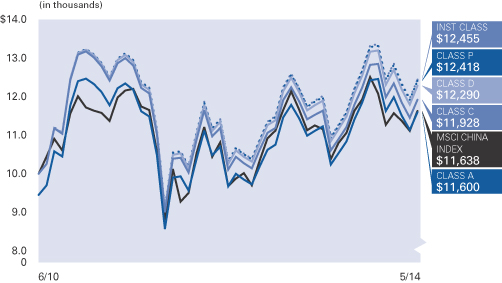
| Shareholder Expense Example | Actual Performance | |||||||||
| Class A | Class C | Class D | Class P | Institutional Class | ||||||
| Beginning Account Value (12/1/13) | $1,000.00 | $1,000.00 | $1,000.00 | $1,000.00 | $1,000.00 | |||||
| Ending Account Value (5/31/14) | $932.90 | $929.10 | $932.40 | $933.50 | $933.80 | |||||
| Expenses Paid During Period | $8.29 | $12.17 | $8.53 | $7.28 | $6.99 | |||||
| Hypothetical Performance | ||||||||||
| (5% return before expenses) | ||||||||||
| Class A | Class C | Class D | Class P | Institutional Class | ||||||
| Beginning Account Value (12/1/13) | $1,000.00 | $1,000.00 | $1,000.00 | $1,000.00 | $1,000.00 | |||||
| Ending Account Value (5/31/14) | $1,016.36 | $1,012.32 | $1,016.11 | $1,017.40 | $1,017.70 | |||||
| Expenses Paid During Period | $8.65 | $12.69 | $8.90 | $7.59 | $7.29 | |||||
For each class of the Fund, expenses (net of fee waiver and reimbursement, if any) are equal to the annualized expense ratio for the class (1.72% for Class A, 2.53% for Class C, 1.77% for Class D, 1.51% for Class P and 1.45% for Institutional Class), multiplied by the average account value over the period, multiplied by 182/365.
| Semiannual Report | | May 31, 2014 | 45 |
Table of Contents
Unaudited
AllianzGI Convertible Fund
For the period of December 1, 2013, through May 31, 2014, as provided by Douglas Forsyth, Portfolio Manager.
Fund Insights
| 46 | May 31, 2014 | | Semiannual Report |
Table of Contents
Unaudited
AllianzGI Convertible Fund (cont’d)
Average Annual Total Return for the period ended May 31, 2014
| 6 Month* | 1 Year | 5 Year | 10 Year | Since Inception† | ||||||||||||||||
| AllianzGI Convertible Fund Class A | 7.09% | 16.49% | 16.00% | 9.83% | 10.75% | |||||||||||||||
|
|
AllianzGI Convertible Fund Class A (adjusted) | 1.20% | 10.08% | 14.69% | 9.21% | 10.45% | ||||||||||||||
| AllianzGI Convertible Fund Class C | 6.69% | 15.60% | 15.15% | 9.02% | 9.92% | |||||||||||||||
|
|
AllianzGI Convertible Fund Class C (adjusted) | 5.69% | 14.60% | 15.15% | 9.02% | 9.92% | ||||||||||||||
|
|
AllianzGI Convertible Fund Class D | 7.05% | 16.39% | 15.97% | 9.82% | 10.74% | ||||||||||||||
|
|
AllianzGI Convertible Fund Class R | 6.91% | 15.87% | 15.63% | 9.52% | 10.45% | ||||||||||||||
|
|
AllianzGI Convertible Fund Class P | 7.18% | 16.72% | 16.22% | 10.06% | 10.98% | ||||||||||||||
|
|
AllianzGI Convertible Fund Institutional Class | 7.25% | 16.80% | 16.35% | 10.17% | 11.09% | ||||||||||||||
| AllianzGI Convertible Fund Administrative Class | 7.13% | 16.53% | 16.04% | 9.85% | 10.76% | |||||||||||||||
|
|
BofA Merrill Lynch All Convertibles Index | 8.63% | 18.66% | 16.32% | 7.60% | 8.63% | ||||||||||||||
| Lipper Conv. Securities Fund Average | 6.52% | 14.81% | 13.59% | 6.67% | 8.74% | |||||||||||||||
† The Fund began operations on 4/19/93. Benchmark return comparisons began on the fund inception date. Lipper performance comparisons began on 4/30/93.
* Cumulative return.
Performance quoted represents past performance and is no guarantee of future results. Current performance may be lower or higher than performance shown. For performance current to the most recent month-end, visit our website at us.allianzgi.com. Investment return and the principal value will fluctuate. Shares may be worth more or less than original cost when redeemed. The adjusted returns take into account the maximum initial sales charge of 5.50% on Class A shares and the contingent deferred sales charge (CDSC) of 1% on Class C shares, which may apply to shares redeemed during the first year of ownership. Returns do not reflect deduction of taxes that a shareholder would pay on fund distributions or redemption of fund shares. See pages 86 and 87 for more information. The Fund’s expense ratios are 0.96% for Class A shares, 1.70% for Class C shares, 1.02% for Class D shares, 1.51% for Class R shares, 0.75% for Class P shares, 0.65% for Institutional Class shares and 0.90% for Administrative Class shares. Expense ratio information is as of the Fund’s current prospectus dated April 1, 2014, as supplemented to date.
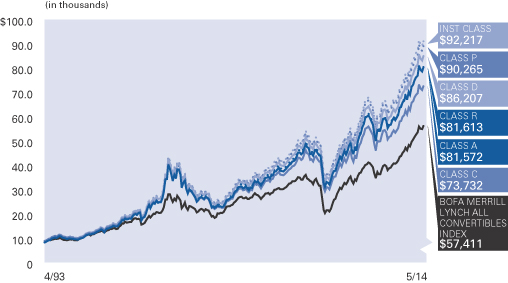
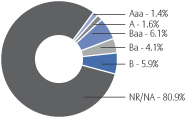
| Semiannual Report | | May 31, 2014 | 47 |
Table of Contents
Unaudited
AllianzGI Convertible Fund (cont’d)
| Shareholder Expense Example | Actual Performance | |||||||||||||
| Class A | Class C | Class D | Class R | Class P | Institutional Class |
Administrative Class | ||||||||
| Beginning Account Value (12/1/13) | $1,000.00 | $1,000.00 | $1,000.00 | $1,000.00 | $1,000.00 | $1,000.00 | $1,000.00 | |||||||
| Ending Account Value (5/31/14) | $1,070.90 | $1,066.90 | $1,070.50 | $1,069.10 | $1,071.80 | $1,072.50 | $1,071.30 | |||||||
| Expenses Paid During Period | $4.80 | $8.66 | $4.96 | $6.45 | $3.77 | $3.31 | $4.54 | |||||||
| Hypothetical Performance | ||||||||||||||
| (5% return before expenses) | ||||||||||||||
| Class A | Class C | Class D | Class R | Class P | Institutional Class |
Administrative Class | ||||||||
| Beginning Account Value (12/1/13) | $1,000.00 | $1,000.00 | $1,000.00 | $1,000.00 | $1,000.00 | $1,000.00 | $1,000.00 | |||||||
| Ending Account Value (5/31/14) | $1,020.29 | $1,016.55 | $1,020.14 | $1,018.70 | $1,021.29 | $1,021.74 | $1,020.54 | |||||||
| Expenses Paid During Period | $4.68 | $8.45 | $4.84 | $6.29 | $3.68 | $3.23 | $4.43 | |||||||
For each class of the Fund, expenses are equal to the annualized expense ratio for the class (0.93% for Class A, 1.68% for Class C, 0.96% for Class D, 1.25% for Class R, 0.73% for Class P, 0.64% for Institutional Class and 0.88% for Administrative Class), multiplied by the average account value over the period, multiplied by 182/365.
| 48 | May 31, 2014 | | Semiannual Report |
Table of Contents
Unaudited
AllianzGI Global Fundamental Strategy Fund
For the period of December 1, 2013 through May 31, 2014, as provided by Andreas Utermann, Portfolio Manager.
Fund Insights
Cumulative Return for the period ended May 31, 2014
| 6 Month | Since Inception† | |||||||||
| AllianzGI Global Fundamental Strategy Fund Class A | 5.37% | 8.53% | ||||||||
|
|
AllianzGI Global Fundamental Strategy Fund Class A (adjusted) | –0.43% | 2.56% | |||||||
| AllianzGI Global Fundamental Strategy Fund Class C | 4.99% | 7.79% | ||||||||
|
|
AllianzGI Global Fundamental Strategy Fund Class C (adjusted) | 3.99% | 6.79% | |||||||
|
|
AllianzGI Global Fundamental Strategy Fund Class D | 5.37% | 8.53% | |||||||
|
|
AllianzGI Global Fundamental Strategy Fund Class P | 5.44% | 8.68% | |||||||
|
|
AllianzGI Global Fundamental Strategy Fund Institutional Class | 5.49% | 8.80% | |||||||
|
|
USD Overnight LIBOR | 0.05% | 0.09% | |||||||
|
|
70% MSCI ACWI/30% Barclays Global Aggregate Index | 5.32% | 15.78% | |||||||
|
|
USD Overnight LIBOR + 4% | 2.09% | 3.87% | |||||||
| Lipper Absolute Return Funds Average | 1.69% | 4.16% | ||||||||
† The Fund began operations on 7/1/13. Benchmark return comparisons began on the fund inception date. Lipper performance comparisons began on 6/30/13.
Performance quoted represents past performance and is no guarantee of future results. Current performance may be lower or higher than performance shown. For performance current to the most recent month-end, visit our website at us.allianzgi.com. Investment return and the principal value will fluctuate. Shares may be worth more or less than original cost when redeemed. The adjusted returns take into account the maximum initial sales charge of 5.50% on Class A shares and the contingent deferred sales charge (CDSC) of 1% on Class C shares, which may apply to shares redeemed during the first year of ownership. Returns do not reflect deduction of taxes that a shareholder would pay on fund distributions or redemption of fund shares. See pages 86 and 87 for more information. The Fund’s gross expense ratios are 1.94% for Class A shares, 2.69% for Class C shares, 1.94% for Class D shares, 1.69% for Class P shares and 1.67% for Institutional Class shares. These ratios do not include an expense reduction, contractually guaranteed through at least 3/31/15. The Fund’s expense ratios net of this reduction are 1.25% for Class A shares, 2.00% for Class C shares, 1.25% for Class D shares, 1.10% for Class P shares and 1.00% for Institutional Class shares. Expense ratio information is as of the Fund’s current prospectus dated April 1, 2014, as supplemented to date.
| Semiannual Report | | May 31, 2014 | 49 |
Table of Contents
Unaudited
AllianzGI Global Fundamental Strategy Fund (cont’d)
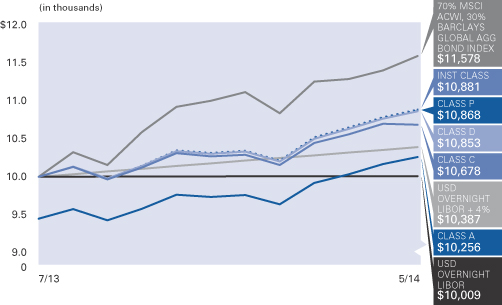
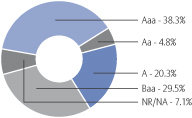
| Shareholder Expense Example | Actual Performance | |||||||||
| Class A | Class C | Class D | Class P | Institutional Class | ||||||
| Beginning Account Value (12/1/13) | $1,000.00 | $1,000.00 | $1,000.00 | $1,000.00 | $1,000.00 | |||||
| Ending Account Value (5/31/14) | $1,053.70 | $1,049.90 | $1,053.70 | $1,054.40 | $1,054.90 | |||||
| Expenses Paid During Period | $6.40 | $10.22 | $6.40 | $5.63 | $5.12 | |||||
| Hypothetical Performance | ||||||||||
| (5% return before expenses) | ||||||||||
| Class A | Class C | Class D | Class P | Institutional Class | ||||||
| Beginning Account Value (12/1/13) | $1,000.00 | $1,000.00 | $1,000.00 | $1,000.00 | $1,000.00 | |||||
| Ending Account Value (5/31/14) | $1,018.70 | $1,014.96 | $1,018.70 | $1,019.45 | $1,019.95 | |||||
| Expenses Paid During Period | $6.29 | $10.05 | $6.29 | $5.54 | $5.04 | |||||
For each class of the Fund, expenses (net of fee waiver and reimbursement, if any) are equal to the annualized expense ratio for the class (1.25% for Class A, 2.00% for Class C, 1.25% for Class D, 1.10% for Class P and 1.00% for Institutional Class), multiplied by the average account value over the period, multiplied by 182/365.
| 50 | May 31, 2014 | | Semiannual Report |
Table of Contents
Unaudited
AllianzGI Global Managed Volatility Fund
For the period of December 1, 2013 to May 31, 2014, as provided by Kunal Ghosh, Portfolio Manager.
Fund Insights
Average Annual Total Return for the period ended May 31, 2014
| 6 Month* | 1 Year | Since Inception† | ||||||||||||
| AllianzGI Global Managed Volatility Fund Class A | 5.75% | 10.68% | 12.17% | |||||||||||
|
|
AllianzGI Global Managed Volatility Fund Class A (adjusted) | –0.07% | 4.59% | 9.61% | ||||||||||
| AllianzGI Global Managed Volatility Fund Class C | 5.33% | 9.92% | 11.35% | |||||||||||
|
|
AllianzGI Global Managed Volatility Fund Class C (adjusted) | 4.33% | 8.92% | 11.35% | ||||||||||
|
|
AllianzGI Global Managed Volatility Fund Class D | 5.74% | 10.73% | 12.20% | ||||||||||
|
|
AllianzGI Global Managed Volatility Fund Class P | 5.85% | 10.97% | 12.45% | ||||||||||
|
|
AllianzGI Global Managed Volatility Fund Institutional Class | 5.90% | 11.08% | 12.55% | ||||||||||
|
|
MSCI World Index | 6.52% | 18.87% | 21.02% | ||||||||||
|
|
MSCI World Minimum Volatility Index | 5.75% | 12.92% | 14.61% | ||||||||||
| Lipper Global Multi-Cap Value Funds Average | 6.08% | 17.65% | 17.68% | |||||||||||
† The Fund began operations on 12/19/11. Benchmark return comparisons began on the fund inception date. Lipper performance comparisons began on 12/31/11.
* Cumulative return.
Performance quoted represents past performance and is no guarantee of future results. Current performance may be lower or higher than performance shown. For performance current to the most recent month-end, visit our website at us.allianzgi.com. Investment return and the principal value will fluctuate. Shares may be worth more or less than original cost when redeemed. The adjusted returns take into account the maximum initial sales charge of 5.50% on Class A shares and the contingent deferred sales charge (CDSC) of 1% on Class C shares, which may apply to shares redeemed during the first year of ownership. Returns do not reflect deduction of taxes that a shareholder would pay on fund distributions or redemption of fund shares. See pages 86 and 87 for more information. The Fund’s gross expense ratios are 2.63% for Class A shares, 3.26% for Class C shares, 2.84% for Class D shares, 2.38% for Class P shares and 2.32% for Institutional Class shares. These ratios do not include an expense reduction, contractually guaranteed through at least 3/31/15. The Fund’s expense ratios net of this reduction are 0.94% for Class A shares, 1.62% for Class C shares, 0.94% for Class D shares, 0.69% for Class P shares and 0.60% for Institutional Class shares. Expense ratio information is as of the Fund’s current prospectus dated April 1, 2014, as supplemented to date.
| Semiannual Report | | May 31, 2014 | 51 |
Table of Contents
Unaudited
AllianzGI Global Managed Volatility Fund (cont’d)
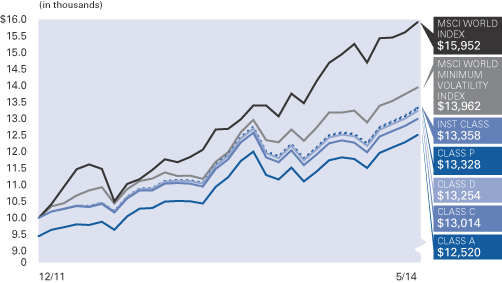
| Shareholder Expense Example | Actual Performance | |||||||||
| Class A | Class C | Class D | Class P | Institutional Class | ||||||
| Beginning Account Value (12/1/13) | $1,000.00 | $1,000.00 | $1,000.00 | $1,000.00 | $1,000.00 | |||||
| Ending Account Value (5/31/14) | $1,057.50 | $1,053.30 | $1,057.40 | $1,058.50 | $1,059.00 | |||||
| Expenses Paid During Period | $4.87 | $8.34 | $4.62 | $3.59 | $3.08 | |||||
| Hypothetical Performance | ||||||||||
| (5% return before expenses) | ||||||||||
| Class A | Class C | Class D | Class P | Institutional Class | ||||||
| Beginning Account Value (12/1/13) | $1,000.00 | $1,000.00 | $1,000.00 | $1,000.00 | $1,000.00 | |||||
| Ending Account Value (5/31/14) | $1,020.19 | $1,016.80 | $1,020.44 | $1,021.44 | $1,021.94 | |||||
| Expenses Paid During Period | $4.78 | $8.20 | $4.53 | $3.53 | $3.02 | |||||
For each class of the Fund, expenses (net of fee waiver and reimbursement, if any) are equal to the annualized expense ratio for the class (0.95% for Class A, 1.63% for Class C, 0.90% for Class D, 0.70% for Class P and 0.60% for Institutional Class), multiplied by the average account value over the period, multiplied by 182/365.
| 52 | May 31, 2014 | | Semiannual Report |
Table of Contents
Unaudited
For the period of December 1, 2013 to May 31, 2014, as provided by Andreas Fruschki, Portfolio Manager.
Fund Insights
Average Annual Total Return for the period ended May 31, 2014
| 6 Month* | 1 Year | 5 Year | Since Inception† | |||||||||||||||
| AllianzGI Global Water Fund Class A | 6.77% | 18.41% | 14.63% | 5.47% | ||||||||||||||
|
|
AllianzGI Global Water Fund Class A (adjusted) | 0.90% | 11.90% | 13.34% | 4.51% | |||||||||||||
| AllianzGI Global Water Fund Class C | 6.36% | 17.52% | 13.76% | 4.68% | ||||||||||||||
|
|
AllianzGI Global Water Fund Class C (adjusted) | 5.36% | 16.52% | 13.76% | 4.68% | |||||||||||||
|
|
AllianzGI Global Water Fund Class D | 6.62% | 18.28% | 14.58% | 5.43% | |||||||||||||
|
|
AllianzGI Global Water Fund Class P | 6.89% | 18.67% | 14.88% | 5.70% | |||||||||||||
|
|
AllianzGI Global Water Fund Institutional Class | |
6.90% |
|
|
18.91% |
|
|
15.02% |
|
|
5.82% |
| |||||
|
|
MSCI AC World Index | 6.02% | 17.15% | 13.73% | 4.75% | |||||||||||||
|
|
S&P Global Water Index | 11.11% | 23.78% | 17.34% | 7.77% | |||||||||||||
| Lipper Global Natural Resources Funds Average | 9.03% | 17.40% | 6.75% | –1.03% | ||||||||||||||
† The Fund began operations on 3/31/08. Benchmark return comparisons began on the fund inception date. Lipper performance comparisons began on 3/31/08.
* Cumulative return.
Performance quoted represents past performance and is no guarantee of future results. Current performance may be lower or higher than performance shown. For performance current to the most recent month-end, visit our website at us.allianzgi.com. Investment return and the principal value will fluctuate. Shares may be worth more or less than original cost when redeemed. The adjusted returns take into account the maximum initial sales charge of 5.50% on Class A shares and the contingent deferred sales charge (CDSC) of 1% on Class C shares, which may apply to shares redeemed during the first year of ownership. Returns do not reflect deduction of taxes that a shareholder would pay on fund distributions or redemption of fund shares. See pages 86 and 87 for more information. The Fund’s expense ratios are 1.52% for Class A shares, 2.29% for Class C shares, 1.60% for Class D shares, 1.26% for Class P shares and 1.18% for Institutional Class shares. Expense ratio information is as of the Fund’s current prospectus dated April 1, 2014, as supplemented to date.
| Semiannual Report | | May 31, 2014 | 53 |
Table of Contents
Unaudited
AllianzGI Global Water Fund (cont’d)
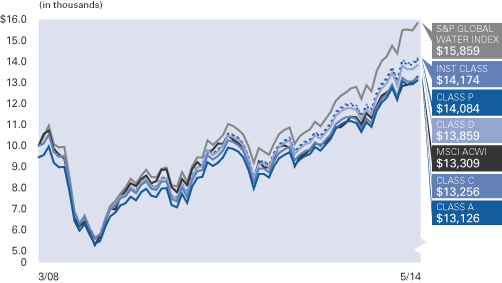
| Shareholder Expense Example | Actual Performance | |||||||||
| Class A | Class C | Class D | Class P | Institutional Class | ||||||
| Beginning Account Value (12/1/13) | $1,000.00 | $1,000.00 | $1,000.00 | $1,000.00 | $1,000.00 | |||||
| Ending Account Value (5/31/14) | $1,067.70 | $1,063.60 | $1,066.20 | $1,068.90 | $1,069.00 | |||||
| Expenses Paid During Period | $7.37 | $11.37 | $8.24 | $6.19 | $5.73 | |||||
| Hypothetical Performance | ||||||||||
| (5% return before expenses) | ||||||||||
| Class A | Class C | Class D | Class P | Institutional Class | ||||||
| Beginning Account Value (12/1/13) | $1,000.00 | $1,000.00 | $1,000.00 | $1,000.00 | $1,000.00 | |||||
| Ending Account Value (5/31/14) | $1,017.80 | $1,013.91 | $1,016.95 | $1,018.95 | $1,019.40 | |||||
| Expenses Paid During Period | $7.19 | $11.10 | $8.05 | $6.04 | $5.59 | |||||
For each class of the Fund, expenses are equal to the annualized expense ratio for the class (1.43% for Class A, 2.21% for Class C, 1.60% for Class D, 1.20% for Class P and 1.11% for Institutional Class), multiplied by the average account value over the period, multiplied by 182/365.
| 54 | May 31, 2014 | | Semiannual Report |
Table of Contents
Unaudited
AllianzGI High Yield Bond Fund
For the period of December 1, 2013, through May 31, 2014, as provided by Doug Forsyth, Portfolio Manager.
Fund Insights
| Semiannual Report | | May 31, 2014 | 55 |
Table of Contents
Unaudited
AllianzGI High Yield Bond Fund (cont’d)
Average Annual Total Return for the period ended May 31, 2014
| 6 Month* | 1 Year | 5 Year | 10 Year | Since Inception† | ||||||||||||||||||
| AllianzGI High Yield Bond Fund Class A | 4.26% | 6.96% | 12.60% | 8.21% | 8.17% | |||||||||||||||||
|
|
AllianzGI High Yield Bond Fund Class A (adjusted) | 0.35% | 2.95% | 11.74% | 7.79% | 7.94% | ||||||||||||||||
| AllianzGI High Yield Bond Fund Class C | 3.78% | 6.05% | 11.78% | 7.41% | 7.37% | |||||||||||||||||
|
|
AllianzGI High Yield Bond Fund Class C (adjusted) | 2.78% | 5.06% | 11.78% | 7.41% | 7.37% | ||||||||||||||||
|
|
AllianzGI High Yield Bond Fund Class D | 4.07% | 6.76% | 12.58% | 8.20% | 8.16% | ||||||||||||||||
|
|
AllianzGI High Yield Bond Fund Class R | 4.17% | 6.77% | 12.34% | 7.95% | 7.91% | ||||||||||||||||
|
|
AllianzGI High Yield Bond Fund Class P | 4.30% | 7.13% | 12.81% | 8.39% | 8.34% | ||||||||||||||||
|
|
AllianzGI High Yield Bond Fund Institutional Class | 4.33% | 7.18% | 13.02% | 8.66% | 8.65% | ||||||||||||||||
| AllianzGI High Yield Bond Fund Administrative Class | 4.23% | 6.98% | 12.64% | 8.23% | 8.18% | |||||||||||||||||
|
|
BofA Merrill Lynch US High Yield Master II Index | 5.33% | 7.94% | 14.47% | 8.97% | 7.74% | ||||||||||||||||
| Lipper High Yield Funds Average | 4.56% | 6.95% | 13.04% | 7.69% | 6.73% | |||||||||||||||||
† The Fund began operations on 7/31/96. Benchmark return comparisons began on the fund inception date. Lipper performance comparisons began on 7/31/96.
* Cumulative return.
Performance quoted represents past performance and is no guarantee of future results. Current performance may be lower or higher than performance shown. For performance current to the most recent month-end, visit our website at us.allianzgi.com. Investment return and the principal value will fluctuate. Shares may be worth more or less than original cost when redeemed. The adjusted returns take into account the maximum initial sales charge of 3.75% on Class A shares and the contingent deferred sales charge (CDSC) of 1% on Class C shares, which may apply to shares redeemed during the first year of ownership. Returns do not reflect deduction of taxes that a shareholder would pay on fund distributions or redemption of fund shares. See pages 86 and 87 for more information. The Fund’s expense ratios are 0.91% for Class A shares, 1.70% for Class C shares, 1.02% for Class D shares, 1.32% for Class R shares, 0.71% for Class P shares, 0.62% for Institutional Class shares and 0.90% for Administrative Class shares. Expense ratio information is as of the Fund’s current prospectus dated April 1, 2014, as supplemented to date.
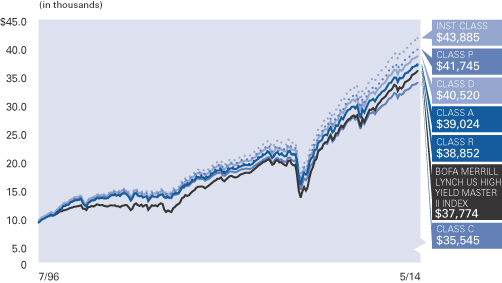
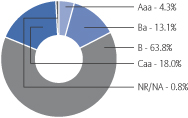
| 56 | May 31, 2014 | | Semiannual Report |
Table of Contents
Unaudited
AllianzGI High Yield Bond Fund (cont’d)
| Shareholder Expense Example | Actual Performance | |||||||||||||
| Class A | Class C | Class D | Class R | Class P | Institutional Class |
Administrative Class | ||||||||
| Beginning Account Value (12/1/13) | $1,000.00 | $1,000.00 | $1,000.00 | $1,000.00 | $1,000.00 | $1,000.00 | $1,000.00 | |||||||
| Ending Account Value (5/31/14) | $1,042.60 | $1,037.80 | $1,040.70 | $1,041.70 | $1,043.00 | $1,043.30 | $1,042.30 | |||||||
| Expenses Paid During Period | $4.74 | $8.64 | $5.19 | $6.21 | $3.67 | $3.21 | $4.58 | |||||||
| Hypothetical Performance | ||||||||||||||
| (5% return before expenses) | ||||||||||||||
| Class A | Class C | Class D | Class R | Class P | Institutional Class |
Administrative Class | ||||||||
| Beginning Account Value (12/1/13) | $1,000.00 | $1,000.00 | $1,000.00 | $1,000.00 | $1,000.00 | $1,000.00 | $1,000.00 | |||||||
| Ending Account Value (5/31/14) | $1,020.29 | $1,016.45 | $1,019.85 | $1,018.85 | $1,021.34 | $1,021.79 | $1,020.44 | |||||||
| Expenses Paid During Period | $4.68 | $8.55 | $5.14 | $6.14 | $3.63 | $3.18 | $4.53 | |||||||
For each class of the Fund, expenses (net of fee waiver and reimbursement, if any) are equal to the annualized expense ratio for the class (0.93% for Class A, 1.70% for Class C, 1.02% for Class D, 1.22% for Class R, 0.72% for Class P, 0.63% for Institutional Class and 0.90% for Administrative Class), multiplied by the average account value over the period, multiplied by 182/365.
| Semiannual Report | | May 31, 2014 | 57 |
Table of Contents
Unaudited
AllianzGI International Small-Cap Fund
For the period of December 1, 2013, through May 31, 2014 as provided by Andrew Neville, Portfolio Manager.
Fund Insights
| 58 | May 31, 2014 | | Semiannual Report |
Table of Contents
Unaudited
AllianzGI International Small-Cap Fund (cont’d)
Average Annual Total Return for the period ended May 31, 2014
| 6 Month* | 1 Year | 5 Year | 10 Year | Since Inception† | ||||||||||||||||||
| AllianzGI International Small-Cap Fund Class A | 1.81% | 15.67% | 16.22% | 11.37% | 13.06% | |||||||||||||||||
|
|
AllianzGI International Small-Cap Fund Class A (adjusted) | –3.79% | 9.31% | 14.92% | 10.74% | 12.67% | ||||||||||||||||
| AllianzGI International Small-Cap Fund Class C | 1.43% | 14.82% | 15.36% | 10.54% | 12.22% | |||||||||||||||||
|
|
AllianzGI International Small-Cap Fund Class C (adjusted) | 0.50% | 13.82% | 15.36% | 10.54% | 12.22% | ||||||||||||||||
|
|
AllianzGI International Small-Cap Fund Class D | 1.83% | 15.69% | 16.21% | 11.36% | 13.06% | ||||||||||||||||
|
|
AllianzGI International Small-Cap Fund Class R | 1.71% | 15.40% | 15.93% | 11.09% | 12.78% | ||||||||||||||||
|
|
AllianzGI International Small-Cap Fund Class P | 1.90% | 15.89% | 16.47% | 11.64% | 13.40% | ||||||||||||||||
|
|
AllianzGI International Small-Cap Fund Institutional Class | 1.94% | 15.99% | 16.61% | 11.78% | 13.50% | ||||||||||||||||
|
|
MSCI World ex-US Small Cap Index | 6.88% | 21.66% | 15.07% | 9.03% | 8.49% | ||||||||||||||||
|
|
MSCI EAFE Small Cap Index | 6.39% | 22.53% | 15.31% | 9.14% | 8.41% | ||||||||||||||||
| Lipper International Small/Mid-Cap Growth Funds Average | 5.76% | 19.25% | 16.22% | 10.10% | 9.60% | |||||||||||||||||
† The Fund began operations on 12/31/97. Benchmark return comparisons began on the fund inception date. Lipper performance comparisons began on 12/31/97.
* Cumulative return.
Performance quoted represents past performance and is no guarantee of future results. Current performance may be lower or higher than performance shown. For performance current to the most recent month-end, visit our website at us.allianzgi.com. Investment return and the principal value will fluctuate. Shares may be worth more or less than original cost when redeemed. The adjusted returns take into account the maximum initial sales charge of 5.50% on Class A shares and the contingent deferred sales charge (CDSC) of 1% on Class C shares, which may apply to shares redeemed during the first year of ownership. Returns do not reflect deduction of taxes that a shareholder would pay on fund distributions or redemption of fund shares. See pages 86 and 87 for more information. The Fund’s gross expense ratios are 1.83% for Class A shares, 2.43% for Class C shares, 1.73% for Class D shares, 1.96% for Class R shares, 1.52% for Class P shares and 1.44% for Institutional Class shares. These ratios do not include an expense reduction, contractually guaranteed through at least 3/31/15. The Fund’s expense ratios net of this reduction are 1.45% for Class A shares, 2.19% for Class C shares, 1.45% for Class D shares, 1.70% for Class R shares, 1.28% for Class P shares and 1.21% for Institutional Class shares. Expense ratio information is as of the Fund’s current prospectus dated April 1, 2014, as supplemented to date.
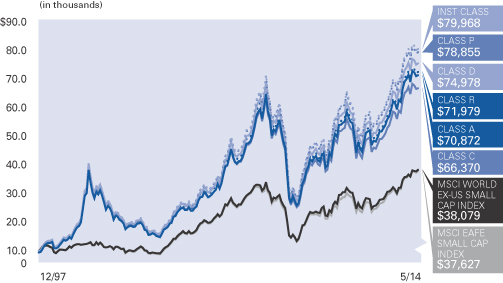
| Semiannual Report | | May 31, 2014 | 59 |
Table of Contents
Unaudited
AllianzGI International Small-Cap Fund (cont’d)
| Shareholder Expense Example | Actual Performance | |||||||||||
| Class A | Class C | Class D | Class R | Class P | Institutional Class | |||||||
| Beginning Account Value (12/1/13) | $1,000.00 | $1,000.00 | $1,000.00 | $1,000.00 | $1,000.00 | $1,000.00 | ||||||
| Ending Account Value (5/31/14) | $1,018.10 | $1,014.30 | $1,018.30 | $1,017.10 | $1,019.00 | $1,019.40 | ||||||
| Expenses Paid During Period | $7.30 | $11.05 | $7.30 | $8.55 | $6.49 | $6.09 | ||||||
| Hypothetical Performance | ||||||||||||
| (5% return before expenses) | ||||||||||||
| Class A | Class C | Class D | Class R | Class P | Institutional Class | |||||||
| Beginning Account Value (12/1/13) | $1,000.00 | $1,000.00 | $1,000.00 | $1,000.00 | $1,000.00 | $1,000.00 | ||||||
| Ending Account Value (5/31/14) | $1,017.70 | $1,013.96 | $1,017.70 | $1,016.45 | $1,018.50 | $1,018.90 | ||||||
| Expenses Paid During Period | $7.29 | $11.05 | $7.29 | $8.55 | $6.49 | $6.09 | ||||||
For each class of the Fund, expenses (net of fee waiver and reimbursement, if any) are equal to the annualized expense ratio for the class (1.45% for Class A, 2.20% for Class C, 1.45% for Class D, 1.70% for Class R, 1.29% for Class P and 1.21% for Institutional Class), multiplied by the average account value over the period, multiplied by 182/365.
| 60 | May 31, 2014 | | Semiannual Report |
Table of Contents
Unaudited
AllianzGI Micro Cap Fund
For the period of December 1, 2013, through May 31, 2014, as provided by Robert Marren, Portfolio Manager.
Fund Insights
Average Annual Total Return for the period ended May 31, 2014
| 6 Month* | 1 Year | 5 Year | 10 Year | Since Inception† | ||||||||||||||||||
| AllianzGI Micro Cap Fund Class A | –0.85% | 23.74% | 20.07% | 8.17% | 11.78% | |||||||||||||||||
|
|
AllianzGI Micro Cap Fund Class A (adjusted) | –6.30% | 16.94% | 18.72% | 7.56% | 11.45% | ||||||||||||||||
|
|
AllianzGI Micro Cap Fund Class P | –0.78% | 23.89% | 20.28% | 8.40% | 12.02% | ||||||||||||||||
|
|
AllianzGI Micro Cap Fund Institutional Class | –0.78% | 23.95% | 20.41% | 8.51% | 12.14% | ||||||||||||||||
|
|
Russell Microcap Growth Index | –2.22% | 19.53% | 19.64% | 6.40% | 6.73% | ||||||||||||||||
| Lipper Small-Cap Core Funds Average | –2.85% | 15.77% | 19.28% | 8.22% | 9.04% | |||||||||||||||||
† The Fund began operations on 7/12/95. Benchmark return comparisons began on the fund inception date. Lipper performance comparisons began on 6/30/95.
* Cumulative return.
Performance quoted represents past performance and is no guarantee of future results. Current performance may be lower or higher than performance shown. For performance current to the most recent month-end, visit our website at us.allianzgi.com. Investment return and the principal value will fluctuate. Shares may be worth more or less than original cost when redeemed. The adjusted returns take into account the maximum initial sales charge of 5.50% on Class A shares. Returns do not reflect deduction of taxes that a shareholder would pay on fund distributions or redemption of fund shares. See pages 86 and 87 for more information. The Fund’s gross expense ratios are 2.07% for Class A shares, 1.90% for Class P shares and 2.01% for Institutional Class shares. This ratio does not include an expense reduction, contractually guaranteed through at least 3/31/15. The Fund’s expense ratios net of this reduction are 1.62% for Class A shares, 1.44% for Class P shares and 1.54% for Institutional Class shares. Expense ratio information is as of the Fund’s current prospectus dated April 1, 2014, as supplemented to date.
| Semiannual Report | | May 31, 2014 | 61 |
Table of Contents
Unaudited
AllianzGI Micro Cap Fund (cont’d)
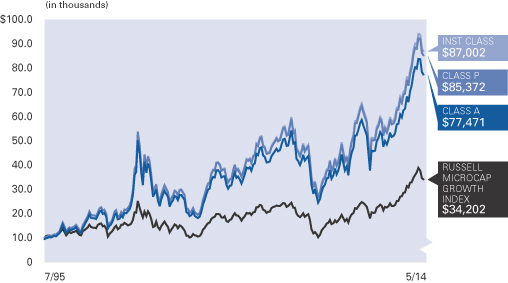
| Shareholder Expense Example | Actual Performance | |||||
| Class A | Class P | Institutional Class | ||||
| Beginning Account Value (12/1/13) | $1,000.00 | $1,000.00 | $1,000.00 | |||
| Ending Account Value (5/31/14) | $991.50 | $992.20 | $992.20 | |||
| Expenses Paid During Period | $8.49 | $7.80 | $7.65 | |||
| Hypothetical Performance | ||||||
| (5% return before expenses) | ||||||
| Class A | Class P | Institutional Class | ||||
| Beginning Account Value (12/1/13) | $1,000.00 | $1,000.00 | $1,000.00 | |||
| Ending Account Value (5/31/14) | $1,016.40 | $1,017.10 | $1,017.25 | |||
| Expenses Paid During Period | $8.60 | $7.90 | $7.75 | |||
For each class of the Fund, expenses (net of fee waiver and reimbursement, if any) are equal to the annualized expense ratio for the class (1.71% for Class A, 1.57% for Class P and 1.54% for Institutional Class), multiplied by the average account value over the period, multiplied by 182/365.
| 62 | May 31, 2014 | | Semiannual Report |
Table of Contents
Unaudited
AllianzGI Multi-Asset Real Return Fund
For the period of December 1, 2013, through May 31, 2014 as provided by Dr. Michael Stamos, CFA, Ph.D., Portfolio Manager.
Fund Insights
Average Annual Total Return for the period ended May 31, 2014
| 6 Month* | 1 Year | Since Inception† |
||||||||||||
| AllianzGI Multi-Asset Real Return Fund Class A | 7.11% | 8.52% | 6.47% | |||||||||||
|
|
AllianzGI Multi-Asset Real Return Fund Class A (adjusted) | 1.21% | 2.55% | 2.40% | ||||||||||
| AllianzGI Multi-Asset Real Return Fund Class C | 6.71% | 7.77% | 5.72% | |||||||||||
|
|
AllianzGI Multi-Asset Real Return Fund Class C (adjusted) | 5.71% | 6.77% | 5.72% | ||||||||||
|
|
AllianzGI Multi-Asset Real Return Fund Class D | 7.11% | 8.53% | 6.48% | ||||||||||
|
|
AllianzGI Multi-Asset Real Return Fund Class P | 7.20% | 8.68% | 6.63% | ||||||||||
|
|
AllianzGI Multi-Asset Real Return Fund Institutional Class | 7.27% | 8.76% | 6.73% | ||||||||||
|
|
Barclays US Government Inflation-Linked Bond Index | 4.42% | 0.47% | –2.76% | ||||||||||
| Lipper Global Flexible Port Fund Average | 4.53% | 8.72% | 9.10% | |||||||||||
† The Fund began operations on 12/17/12. Benchmark return comparisons began on the fund inception date. Lipper performance comparisons began on 12/31/12.
* Cumulative return
Performance quoted represents past performance and is no guarantee of future results. Current performance may be lower or higher than performance shown. For performance current to the most recent month-end, visit our website at us.allianzgi.com. Investment return and the principal value will fluctuate. Shares may be worth more or less than original cost when redeemed. The adjusted returns take into account the maximum initial sales charge of 5.50% on Class A shares and the contingent deferred sales charge (CDSC) of 1% on Class C shares, which may apply to shares redeemed during the first year of ownership. Returns do not reflect deduction of taxes that a shareholder would pay on fund distributions or redemption of fund shares. See pages 86 and 87 for more information. The Fund’s gross expense ratios are 5.58% for Class A shares, 6.71% for Class C shares, 16.68% for Class D shares, 4.91% for Class P shares and 4.90% for Institutional Class shares. These ratios do not include an expense reduction, contractually guaranteed through at least 3/31/15. The Fund’s expense ratios net of this reduction are 1.26% for Class A shares, 2.01% for Class C shares, 1.26% for Class D shares, 1.11% for Class P shares and 1.01% for Institutional Class shares. Expense ratio information is as of the Fund’s current prospectus dated April 1, 2014, as supplemented to date.
| Semiannual Report | | May 31, 2014 | 63 |
Table of Contents
Unaudited
AllianzGI Multi-Asset Real Return Fund (cont’d)
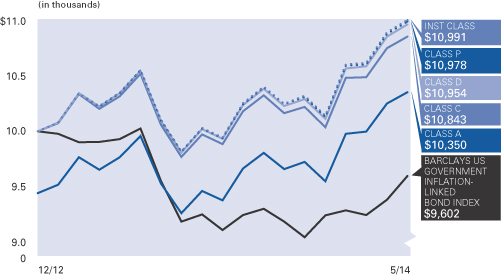
| Shareholder Expense Example | Actual Performance | |||||||||
| Class A | Class C | Class D | Class P | Institutional Class | ||||||
| Beginning Account Value (12/1/13) | $1,000.00 | $1,000.00 | $1,000.00 | $1,000.00 | $1,000.00 | |||||
| Ending Account Value (5/31/14) | $1,071.10 | $1,067.10 | $1,071.10 | $1,072.00 | $1,072.70 | |||||
| Expenses Paid During Period | $4.39 | $8.25 | $4.39 | $3.62 | $3.10 | |||||
| Hypothetical Performance | ||||||||||
| (5% return before expenses) | ||||||||||
| Class A | Class C | Class D | Class P | Institutional Class | ||||||
| Beginning Account Value (12/1/13) | $1,000.00 | $1,000.00 | $1,000.00 | $1,000.00 | $1,000.00 | |||||
| Ending Account Value (5/31/14) | $1,020.69 | $1,016.95 | $1,020.69 | $1,021.44 | $1,021.94 | |||||
| Expenses Paid During Period | $4.28 | $8.05 | $4.28 | $3.53 | $3.02 | |||||
For each class of the Fund, expenses (net of fee waiver and reimbursement, if any) are equal to the annualized expense ratio for the class (0.85% for Class A, 1.60% for Class C, 0.85% for Class D, 0.70% for Class P and 0.60% for Institutional Class), multiplied by the average account value over the period, multiplied by 182/365. The expense ratio does not include the expenses of the Underlying Funds, which based upon the allocation of the Fund’s assets among the Underlying Funds are indirectly borne by the shareholders of the Fund.
| 64 | May 31, 2014 | | Semiannual Report |
Table of Contents
Unaudited
AllianzGI NFJ Emerging Markets Value Fund
For the period of December 1, 2013, through May 31, 2014, as reviewed by Morley Campbell CFA, Portfolio Manager.
Fund Insights
Average Annual Total Return for the period ended May 31, 2014
| 6 Month* | 1 Year | Since Inception† | ||||||||||||
| AllianzGI NFJ Emerging Markets Value Fund Class A |
4.02% | 2.77% | 5.68% | |||||||||||
|
|
AllianzGI NFJ Emerging Markets Value Fund Class A (adjusted) |
–1.70% | –2.88% | 1.63% | ||||||||||
| AllianzGI NFJ Emerging Markets Value Fund Class C |
3.66% | 2.00% | 4.90% | |||||||||||
|
|
AllianzGI NFJ Emerging Markets Value Fund Class C (adjusted) |
2.66% | 1.01% | 4.90% | ||||||||||
|
|
AllianzGI NFJ Emerging Markets Value Fund Class D |
4.09% | 2.74% | 5.70% | ||||||||||
|
|
AllianzGI NFJ Emerging Markets Value Fund Class P |
4.13% | 2.93% | 5.83% | ||||||||||
|
|
AllianzGI NFJ Emerging Markets Value Fund Institutional Class |
4.22% | 3.06% | 5.98% | ||||||||||
|
|
MSCI Emerging Markets Index |
1.89% | 4.27% | 1.13% | ||||||||||
| Lipper Emerging Markets Fund Average |
2.87% | 4.38% | 2.43% | |||||||||||
† The Fund began operations on 12/18/12. Benchmark return comparisons began on the fund inception date. Lipper performance comparisons began on 12/31/12.
* Cumulative return
Performance quoted represents past performance and is no guarantee of future results. Current performance may be lower or higher than performance shown. For performance current to the most recent month-end, visit our website at us.allianzgi.com. Investment return and the principal value will fluctuate. Shares may be worth more or less than original cost when redeemed. The adjusted returns take into account the maximum initial sales charge of 5.50% on Class A shares and the contingent deferred sales charge (CDSC) of 1% on Class C shares, which may apply to shares redeemed during the first year of ownership. Returns do not reflect deduction of taxes that a shareholder would pay on fund distributions or redemption of fund shares. See pages 86 and 87 for more information. The Fund’s gross expense ratios are 15.72% for Class A shares, 18.06% for Class C shares, 7.13% for Class D shares, 6.37% for Class P shares and 6.43% for Institutional Class shares. These ratios do not include an expense reduction, contractually guaranteed through at least 3/31/15. The Fund’s expense ratios net of this reduction are 1.55% for Class A shares, 2.30% for Class C shares, 1.55% for Class D shares, 1.39% for Class P shares and 1.30% for Institutional Class shares. Expense ratio information is as of the Fund’s current prospectus dated April 1, 2014, as supplemented to date.
| Semiannual Report | | May 31, 2014 | 65 |
Table of Contents
Unaudited
AllianzGI NFJ Emerging Markets Value Fund (cont’d)
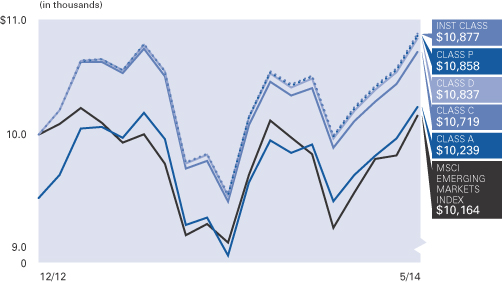
| Shareholder Expense Example | Actual Performance | |||||||||
| Class A | Class C | Class D | Class P | Institutional Class | ||||||
| Beginning Account Value (12/1/13) | $1,000.00 | $1,000.00 | $1,000.00 | $1,000.00 | $1,000.00 | |||||
| Ending Account Value (5/31/14) | $1,040.20 | $1,036.60 | $1,040.90 | $1,041.30 | $1,042.20 | |||||
| Expenses Paid During Period | $7.88 | $11.68 | $7.89 | $7.12 | $6.62 | |||||
| Hypothetical Performance | ||||||||||
| (5% return before expenses) | ||||||||||
| Class A | Class C | Class D | Class P | Institutional Class | ||||||
| Beginning Account Value (12/1/13) | $1,000.00 | $1,000.00 | $1,000.00 | $1,000.00 | $1,000.00 | |||||
| Ending Account Value (5/31/14) | $1,017.20 | $1,013.46 | $1,017.20 | $1,017.95 | $1,018.45 | |||||
| Expenses Paid During Period | $7.80 | $11.55 | $7.80 | $7.04 | $6.54 | |||||
For each class of the Fund, expenses (net of fee waiver and reimbursement, if any) are equal to the annualized expense ratio for the class (1.55% for Class A, 2.30% for Class C, 1.55% for Class D, 1.40% for Class P and 1.30% for Institutional Class), multiplied by the average account value over the period, multiplied by 182/365.
| 66 | May 31, 2014 | | Semiannual Report |
Table of Contents
Unaudited
AllianzGI NFJ Global Dividend Value Fund
For the period of December 1, 2013, through May 31, 2014 as reviewed by R. Burns McKinney, CFA, Portfolio Manager.
Fund Insights
| Semiannual Report | | May 31, 2014 | 67 |
Table of Contents
Unaudited
AllianzGI NFJ Global Dividend Value Fund (cont’d)
Average Annual Total Return for the period ended May 31, 2014
| 6 Month* |
1 Year |
Since Inception† |
||||||||||||
| AllianzGI NFJ Global Dividend Value Fund Class A | 4.48% | 13.17% | 13.16% | |||||||||||
|
|
AllianzGI NFJ Global Dividend Value Fund Class A (adjusted) | –1.27% | 6.94% | 11.87% | ||||||||||
| AllianzGI NFJ Global Dividend Value Fund Class C | 4.07% | 12.29% | 12.30% | |||||||||||
|
|
AllianzGI NFJ Global Dividend Value Fund Class C (adjusted) | 3.07% | 11.29% | 12.30% | ||||||||||
|
|
AllianzGI NFJ Global Dividend Value Fund Class D | 4.40% | 13.06% | 13.11% | ||||||||||
|
|
AllianzGI NFJ Global Dividend Value Fund Class P | 4.55% | 13.34% | 13.37% | ||||||||||
|
|
AllianzGI NFJ Global Dividend Value Fund Institutional Class | 4.62% | 13.44% | 13.48% | ||||||||||
|
|
MSCI ACWI | 6.02% | 17.15% | 14.08% | ||||||||||
| Lipper Global Equity Income Average | 7.12% | 16.16% | 13.77% | |||||||||||
† The Fund began operations on 6/26/09. Benchmark return comparisons began on the fund inception date. Lipper performance comparisons began on 6/30/09.
* Cumulative return.
Performance quoted represents past performance and is no guarantee of future results. Current performance may be lower or higher than performance shown. For performance current to the most recent month-end, visit our website at us.allianzgi.com. Investment return and the principal value will fluctuate. Shares may be worth more or less than original cost when redeemed. The adjusted returns take into account the maximum initial sales charge of 5.50% on Class A shares and the contingent deferred sales charge (CDSC) of 1% on Class C shares, which may apply to shares redeemed during the first year of ownership. Returns do not reflect deduction of taxes that a shareholder would pay on fund distributions or redemption of fund shares. See pages 86 and 87 for more information. The Fund’s gross expense ratios are 1.51% for Class A shares, 2.27% for Class C shares, 1.55% for Class D shares, 1.32% for Class P shares and 1.21% for Institutional Class shares. These ratios do not include an expense reduction, contractually guaranteed through at least 3/31/15. The Fund’s expense ratios net of this reduction are 1.20% for Class A shares, 1.99% for Class C shares, 1.28% for Class D shares, 1.04% for Class P shares and 0.95% for Institutional Class shares. Expense ratio information is as of the Fund’s current prospectus dated April 1, 2014, as supplemented to date.
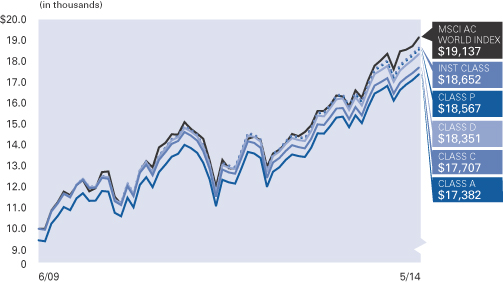
| 68 | May 31, 2014 | | Semiannual Report |
Table of Contents
Unaudited
AllianzGI NFJ Global Dividend Value Fund (cont’d)
| Shareholder Expense Example | Actual Performance | |||||||||
| Class A | Class C | Class D | Class P | Institutional Class | ||||||
| Beginning Account Value (12/1/13) | $1,000.00 | $1,000.00 | $1,000.00 | $1,000.00 | $1,000.00 | |||||
| Ending Account Value (5/31/14) | $1,044.80 | $1,040.70 | $1,044.00 | $1,045.50 | $1,046.20 | |||||
| Expenses Paid During Period | $6.12 | $10.12 | $6.57 | $5.30 | $4.85 | |||||
| Hypothetical Performance | ||||||||||
| (5% return before expenses) | ||||||||||
| Class A | Class C | Class D | Class P | Institutional Class | ||||||
| Beginning Account Value (12/1/13) | $1,000.00 | $1,000.00 | $1,000.00 | $1,000.00 | $1,000.00 | |||||
| Ending Account Value (5/31/14) | $1,018.95 | $1,015.01 | $1,018.50 | $1,019.75 | $1,020.19 | |||||
| Expenses Paid During Period | $6.04 | $10.00 | $6.49 | $5.24 | $4.78 | |||||
For each class of the Fund, expenses (net of fee waiver and reimbursement, if any) are equal to the annualized expense ratio for the class (1.20% for Class A, 1.99% for Class C, 1.29% for Class D, 1.04% for Class P and 0.95% for Institutional Class), multiplied by the average account value over the period, multiplied by 182/365.
| Semiannual Report | | May 31, 2014 | 69 |
Table of Contents
Unaudited
AllianzGI NFJ International Small-Cap Value Fund
For the period of December 1, 2013 through May 31, 2014, as reviewed by L. Baxter Hines, CFA, Portfolio Manager.
Fund Insights
| 70 | May 31, 2014 | | Semiannual Report |
Table of Contents
Unaudited
AllianzGI NFJ International Small-Cap Value Fund (cont’d)
Average Annual Total Return for the period ended May 31, 2014
| 6 Month* | 1 Year | Since Inception† | ||||||||||
| AllianzGI NFJ International Small-Cap Value Fund Class A | 9.34% | 22.90% | 25.40% | |||||||||
|
|
AllianzGI NFJ International Small-Cap Value Fund Class A (adjusted) | 3.33% | 16.15% | 21.90% | ||||||||
| AllianzGI NFJ International Small-Cap Value Fund Class C | 8.98% | 22.07% | 24.53% | |||||||||
|
|
AllianzGI NFJ International Small-Cap Value Fund Class C (adjusted) | 7.98% | 21.07% | 24.53% | ||||||||
|
|
AllianzGI NFJ International Small-Cap Value Fund Class D | 9.38% | 22.91% | 25.43% | ||||||||
|
|
AllianzGI NFJ International Small-Cap Value Fund Class P | 9.47% | 23.15% | 25.61% | ||||||||
|
|
AllianzGI NFJ International Small-Cap Value Fund Institutional Class | 9.50% | 23.22% | 25.73% | ||||||||
|
|
MSCI World ex-US Small Cap Index |
6.88% | 21.66% | 25.54% | ||||||||
| Lipper International Small/Mid-Cap Value Fund Average |
8.16% | 22.91% | 27.47% | |||||||||
† The Fund began operations on 6/1/12. Benchmark return comparisons began on the fund inception date. Lipper performance comparisons began on 5/31/12.
* Cumulative return.
Performance quoted represents past performance and is no guarantee of future results. Current performance may be lower or higher than performance shown. For performance current to the most recent month-end, visit our website at us.allianzgi.com. Investment return and the principal value will fluctuate. Shares may be worth more or less than original cost when redeemed. The adjusted returns take into account the maximum initial sales charge of 5.50% on Class A shares and the contingent deferred sales charge (CDSC) of 1% on Class C shares, which may apply to shares redeemed during the first year of ownership. Returns do not reflect deduction of taxes that a shareholder would pay on fund distributions or redemption of fund shares. See pages 86 and 87 for more information. The Fund’s gross expense ratios are 4.06% for Class A shares, 4.91% for Class C shares, 5.81% for Class D shares, 3.88% for Class P shares and 3.91% for Institutional Class shares. These ratios do not include an expense reduction, contractually guaranteed through at least 3/31/15. The Fund’s expense ratios net of this reduction are 1.45% for Class A shares, 2.20% for Class C shares, 1.45% for Class D shares, 1.30% for Class P shares and 1.20% for Institutional Class shares. Expense ratio information is as of the Fund’s current prospectus dated April 1, 2014, as supplemented to date.
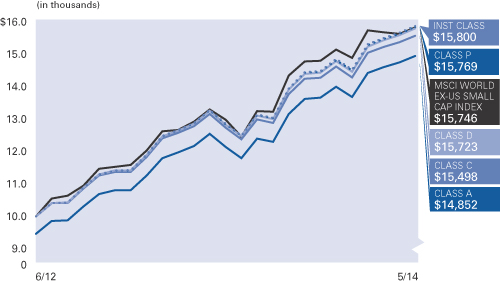
| Semiannual Report | | May 31, 2014 | 71 |
Table of Contents
Unaudited
AllianzGI NFJ International Small-Cap Value Fund (cont’d)
| Shareholder Expense Example | Actual Performance | |||||||||
| Class A | Class C | Class D | Class P | Institutional Class | ||||||
| Beginning Account Value (12/1/13) | $1,000.00 | $1,000.00 | $1,000.00 | $1,000.00 | $1,000.00 | |||||
| Ending Account Value (5/31/14) | $1,093.40 | $1,089.80 | $1,093.80 | $1,094.70 | $1,095.00 | |||||
| Expenses Paid During Period | $7.57 | $11.46 | $7.57 | $6.79 | $6.27 | |||||
| Hypothetical Performance | ||||||||||
| (5% return before expenses) | ||||||||||
| Class A | Class C | Class D | Class P | Institutional Class | ||||||
| Beginning Account Value (12/1/13) | $1,000.00 | $1,000.00 | $1,000.00 | $1,000.00 | $1,000.00 | |||||
| Ending Account Value (5/31/14) | $1,017.70 | $1,013.96 | $1,017.70 | $1,018.45 | $1,018.95 | |||||
| Expenses Paid During Period | $7.29 | $11.05 | $7.29 | $6.54 | $6.04 | |||||
For each class of the Fund, expenses (net of fee waiver and reimbursement, if any) are equal to the annualized expense ratio for the class (1.45% for Class A, 2.20% for Class C, 1.45% for Class D, 1.30% for Class P and 1.20% for Institutional Class), multiplied by the average account value over the period, multiplied by 182/365.
| 72 | May 31, 2014 | | Semiannual Report |
Table of Contents
Unaudited
AllianzGI NFJ International Value II Fund
For the period of December 1, 2013 through May 31, 2014, as reviewed by L. Baxter Hines, CFA, Portfolio Manager.
Fund Insights
Average Annual Total Return for the period ended May 31, 2014
| 6 Month* | 1 Year | Since Inception† | ||||||||||||
| AllianzGI NFJ International Value II Fund Class A | 6.03% | 16.88% | 14.39% | |||||||||||
|
|
AllianzGI NFJ International Value II Fund Class A (adjusted) | 0.20% | 10.45% | 11.83% | ||||||||||
| AllianzGI NFJ International Value II Fund Class C | 5.60% | 16.02% | 13.52% | |||||||||||
|
|
AllianzGI NFJ International Value II Fund Class C (adjusted) | 4.60% | 15.02% | 13.52% | ||||||||||
|
|
AllianzGI NFJ International Value II Fund Class D | 6.00% | 16.89% | 14.38% | ||||||||||
|
|
AllianzGI NFJ International Value II Fund Class P | 6.11% | 17.07% | 14.62% | ||||||||||
|
|
AllianzGI NFJ International Value II Fund Institutional Class | 6.14% | 17.15% | 14.73% | ||||||||||
|
|
MSCI EAFE Index | 5.33% | 18.04% | 16.88% | ||||||||||
| Lipper International Multi-Cap Value Average | 5.80% | 19.69% | 15.72% | |||||||||||
† The Fund began operations on 12/1/11. Benchmark return comparisons began on the fund inception date. Lipper performance comparisons began on 11/30/11.
* Cumulative return.
Performance quoted represents past performance and is no guarantee of future results. Current performance may be lower or higher than performance shown. For performance current to the most recent month-end, visit our website at us.allianzgi.com. Investment return and the principal value will fluctuate. Shares may be worth more or less than original cost when redeemed. The adjusted returns take into account the maximum initial sales charge of 5.50% on Class A shares and the contingent deferred sales charge (CDSC) of 1% on Class C shares, which may apply to shares redeemed during the first year of ownership. Returns do not reflect deduction of taxes that a shareholder would pay on fund distributions or redemption of fund shares. See pages 86 and 87 for more information. The Fund’s gross expense ratios are 7.16% for Class A shares, 8.26% for Class C shares, 7.04% for Class D shares, 6.87% for Class P shares and 6.77% for Institutional Class shares. These ratios do not include an expense reduction, contractually guaranteed through at least 3/31/15. The Fund’s expense ratios net of this reduction are 1.20% for Class A shares, 1.95% for Class C shares, 1.20% for Class D shares, 1.00% for Class P shares and 0.95% for Institutional Class shares. Expense ratio information is as of the Fund’s current prospectus dated April 1, 2014, as supplemented to date.
| Semiannual Report | | May 31, 2014 | 73 |
Table of Contents
Unaudited
AllianzGI NFJ International Value II Fund (cont’d)
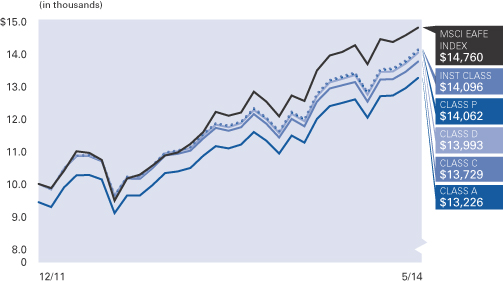
| Shareholder Expense Example | Actual Performance | |||||||||
| Class A | Class C | Class D | Class P | Institutional Class | ||||||
| Beginning Account Value (12/1/13) | $1,000.00 | $1,000.00 | $1,000.00 | $1,000.00 | $1,000.00 | |||||
| Ending Account Value (5/31/14) | $1,060.30 | $1,056.00 | $1,060.00 | $1,061.10 | $1,061.40 | |||||
| Expenses Paid During Period | $6.16 | $10.00 | $6.16 | $5.29 | $4.88 | |||||
| Hypothetical Performance | ||||||||||
| (5% return before expenses) | ||||||||||
| Class A | Class C | Class D | Class P | Institutional Class | ||||||
| Beginning Account Value (12/1/13) | $1,000.00 | $1,000.00 | $1,000.00 | $1,000.00 | $1,000.00 | |||||
| Ending Account Value (5/31/14) | $1,018.95 | $1,015.21 | $1,018.95 | $1,019.80 | $1,020.19 | |||||
| Expenses Paid During Period | $6.04 | $9.80 | $6.04 | $5.19 | $4.78 | |||||
For each class of the Fund, expenses (net of fee waiver and reimbursement, if any) are equal to the annualized expense ratio for the class (1.20% for Class A, 1.95% for Class C, 1.20% for Class D, 1.03% for Class P and 0.95% for Institutional Class), multiplied by the average account value over the period, multiplied by 182/365.
| 74 | May 31, 2014 | | Semiannual Report |
Table of Contents
Unaudited
AllianzGI Short Duration High Income Fund
For the period of December 1, 2013 through May 31, 2014 as provided by Douglas Forsyth, Portfolio Manager.
Fund Insights
Average Annual Total Return for the period ended May 31, 2014
| 6 Month* | 1 Year | Since Inception† | ||||||||||||
| AllianzGI Short Duration High Income Fund Class A | 2.40% | 4.76% | 6.90% | |||||||||||
|
|
AllianzGI Short Duration High Income Fund Class A (adjusted) | 0.10% | 2.40% | 5.99% | ||||||||||
| AllianzGI Short Duration High Income Fund Class C | 2.29% | 4.53% | 6.47% | |||||||||||
|
|
AllianzGI Short Duration High Income Fund Class C (adjusted) | 1.29% | 3.53% | 6.47% | ||||||||||
|
|
AllianzGI Short Duration High Income Fund Class D | 2.41% | 4.78% | 6.91% | ||||||||||
|
|
AllianzGI Short Duration High Income Fund Class P | 2.49% | 5.00% | 7.07% | ||||||||||
|
|
AllianzGI Short Duration High Income Fund Institutional Class | 2.53% | 5.10% | 7.20% | ||||||||||
|
|
BofA Merrill Lynch 1-3 Year BB US Cash Pay High Yield Index | 2.13% | 5.12% | 8.17% | ||||||||||
† The Fund began operations on 10/3/11. Benchmark return comparisons began on the fund inception date.
* Cumulative return.
Performance quoted represents past performance and is no guarantee of future results. Current performance may be lower or higher than performance shown. For performance current to the most recent month-end, visit our website at us.allianzgi.com. Investment return and the principal value will fluctuate. Shares may be worth more or less than original cost when redeemed. The adjusted returns take into account the maximum initial sales charge of 2.25% on Class A shares and the contingent deferred sales charge (CDSC) of 1% on Class C shares, which may apply to shares redeemed during the first year of ownership. Returns do not reflect deduction of taxes that a shareholder would pay on fund distributions or redemption of fund shares. See pages 86 and 87 for more information. The Fund’s gross expense ratios are 0.90% for Class A shares, 1.16% for Class C shares, 1.08% for Class D shares, 0.71% for Class P shares and 0.61% for Institutional Class shares. These ratios do not include an expense reduction, contractually guaranteed through at least 3/31/15. The Fund’s expense ratios net of this reduction are 0.85% for Class A shares, 1.10% for Class C shares, 0.85% for Class D shares, 0.70% for Class P shares and 0.61% for Institutional Class shares. Expense ratio information is as of the Fund’s current prospectus dated April 1, 2014, as supplemented to date.
| Semiannual Report | | May 31, 2014 | 75 |
Table of Contents
Unaudited
AllianzGI Short Duration High Income Fund (cont’d)
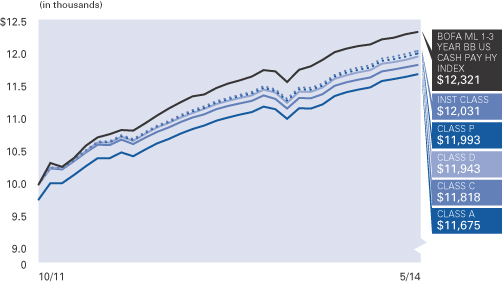
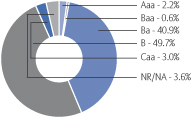
| Shareholder Expense Example | Actual Performance | |||||||||
| Class A | Class C | Class D | Class P | Institutional Class | ||||||
| Beginning Account Value (12/1/13) | $1,000.00 | $1,000.00 | $1,000.00 | $1,000.00 | $1,000.00 | |||||
| Ending Account Value (5/31/14) | $1,024.00 | $1,022.90 | $1,024.10 | $1,024.90 | $1,025.30 | |||||
| Expenses Paid During Period | $4.29 | $5.55 | $4.29 | $3.53 | $3.03 | |||||
| Hypothetical Performance | ||||||||||
| (5% return before expenses) | ||||||||||
| Class A | Class C | Class D | Class P | Institutional Class | ||||||
| Beginning Account Value (12/1/13) | $1,000.00 | $1,000.00 | $1,000.00 | $1,000.00 | $1,000.00 | |||||
| Ending Account Value (5/31/14) | $1,020.69 | $1,019.45 | $1,020.69 | $1,021.44 | $1,021.94 | |||||
| Expenses Paid During Period | $4.28 | $5.54 | $4.28 | $3.53 | $3.02 | |||||
For each class of the Fund, expenses (net of fee waiver and reimbursement, if any) are equal to the annualized expense ratio for the class (0.85% for Class A, 1.10% for Class C, 0.85% for Class D, 0.70% for Class P and 0.60% for Institutional Class), multiplied by the average account value over the period, multiplied by 182/365.
| 76 | May 31, 2014 | | Semiannual Report |
Table of Contents
Unaudited
AllianzGI Structured Return Fund (formerly AllianzGI Structured Alpha Fund)
For the period of December 1, 2013 through May 31, 2014, as provided by Greg Tournant, Portfolio Manager.
Fund Insights
Average Annual Total Return for the period ended May 31, 2014
| 6 Month* | 1 Year | Since Inception† | ||||||||||||
| AllianzGI Structured Return Fund Class A | 1.41% | 5.94% | 4.88% | |||||||||||
|
|
AllianzGI Structured Return Fund Class A (adjusted) | –4.17% | 0.12% | 0.97% | ||||||||||
| AllianzGI Structured Return Fund Class C | 1.03% | 5.03% | 4.04% | |||||||||||
|
|
AllianzGI Structured Return Fund Class C (adjusted) | 0.06% | 4.03% | 4.04% | ||||||||||
|
|
AllianzGI Structured Return Fund Class D | 1.41% | 6.08% | 4.97% | ||||||||||
|
|
AllianzGI Structured Return Fund Class P | 1.47% | 6.08% | 5.01% | ||||||||||
|
|
AllianzGI Structured Return Fund Institutional Class | 1.60% | 6.21% | 5.15% | ||||||||||
|
|
BofA Merrill Lynch 3-Month US Treasury Bill Index | 0.03% | 0.06% | 0.07% | ||||||||||
| Lipper Absolute Return Funds Average | 1.69% | 2.64% | 4.08% | |||||||||||
† The Fund began operations on 12/3/12. Benchmark return comparisons began on the fund inception date. Lipper performance comparisons began on 11/30/12.
* Cumulative return.
Performance quoted represents past performance and is no guarantee of future results. Current performance may be lower or higher than performance shown. For performance current to the most recent month-end, visit our website at us.allianzgi.com. Investment return and the principal value will fluctuate. Shares may be worth more or less than original cost when redeemed. The adjusted returns take into account the maximum initial sales charge of 5.50% on Class A shares and the contingent deferred sales charge (CDSC) of 1% on Class C shares, which may apply to shares redeemed during the first year of ownership. Returns do not reflect deduction of taxes that a shareholder would pay on fund distributions or redemption of fund shares. See pages 86 and 87 for more information. The Fund’s gross expense ratios are 5.34% for Class A shares, 4.91% for Class C shares, 4.29% for Class D shares, 3.97% for Class P shares and 3.64% for Institutional Class shares. These ratios do not include an expense reduction, contractually guaranteed through at least 7/31/15. The Fund’s expense ratios net of this reduction are 1.15% for Class A shares, 1.90% for Class C shares, 1.15% for Class D shares, 1.00% for Class P shares and 0.90% for Institutional Class shares. Expense ratio information is as of the Fund’s current prospectus dated April 1, 2014, as supplemented to date.
| Semiannual Report | | May 31, 2014 | 77 |
Table of Contents
Unaudited
AllianzGI Structured Return Fund (formerly AllianzGI Structured Alpha Fund) (cont’d)
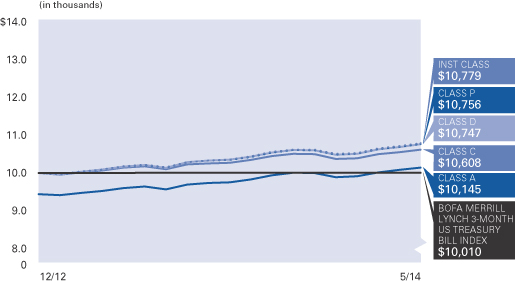
| Shareholder Expense Example | Actual Performance | |||||||||
| Class A | Class C | Class D | Class P | Institutional Class | ||||||
| Beginning Account Value (12/1/13) | $1,000.00 | $1,000.00 | $1,000.00 | $1,000.00 | $1,000.00 | |||||
| Ending Account Value (5/31/14) | $1,014.10 | $1,010.30 | $1,014.10 | $1,014.70 | $1,016.00 | |||||
| Expenses Paid During Period | $9.54 | $13.28 | $9.54 | $8.79 | $8.29 | |||||
| Hypothetical Performance | ||||||||||
| (5% return before expenses) | ||||||||||
| Class A | Class C | Class D | Class P | Institutional Class | ||||||
| Beginning Account Value (12/1/13) | $1,000.00 | $1,000.00 | $1,000.00 | $1,000.00 | $1,000.00 | |||||
| Ending Account Value (5/31/14) | $1,015.46 | $1,011.72 | $1,015.46 | $1,016.21 | $1,016.70 | |||||
| Expenses Paid During Period | $9.55 | $13.29 | $9.55 | $8.80 | $8.30 | |||||
For each class of the Fund, expenses (net of fee waiver and reimbursement, if any) are equal to the annualized expense ratio for the class (1.90% for Class A, 2.65% for Class C, 1.90% for Class D, 1.75% for Class P and 1.65% for Institutional Class), multiplied by the average account value over the period, multiplied by 182/365.
| 78 | May 31, 2014 | | Semiannual Report |
Table of Contents
Unaudited
AllianzGI Ultra Micro Cap Fund
For the period of December 1, 2013 through May 31, 2014, as provided by Robert Marren, Portfolio Manager.
Fund Insights
Average Annual Total Return for the period ended May 31, 2014
| 6 Month* | 1 Year | 5 Year | Since Inception† | |||||||||||||
| AllianzGI Ultra Micro Cap Fund Class A | –1.84% | 21.22% | 28.12% | 15.80% | ||||||||||||
|
|
AllianzGI Ultra Micro Cap Fund Class A (adjusted) | –7.24% | 14.55% | 26.68% | 14.77% | |||||||||||
|
|
AllianzGI Ultra Micro Cap Fund Class P | –1.80% | 21.39% | 28.40% | 16.07% | |||||||||||
|
|
AllianzGI Ultra Micro Cap Fund Institutional Class | –1.83% | 21.36% | 28.52% | 16.18% | |||||||||||
|
|
Russell Microcap Growth Index | –2.22% | 19.53% | 19.64% | 8.93% | |||||||||||
| Lipper Small-Cap Core Fund Average | –2.85% | 15.77% | 19.28% | 8.79% | ||||||||||||
† The Fund began operations on 1/28/08. Benchmark return comparisons began on the fund inception date. Lipper performance comparisons began on 1/31/08.
* Cumulative return.
Performance quoted represents past performance and is no guarantee of future results. Current performance may be lower or higher than performance shown. For performance current to the most recent month-end, visit our website at us.allianzgi.com. Investment return and the principal value will fluctuate. Shares may be worth more or less than original cost when redeemed. The adjusted returns take into account the maximum initial sales charge of 5.50% on Class A shares. Returns do not reflect deduction of taxes that a shareholder would pay on fund distributions or redemption of fund shares. See pages 86 and 87 for more information. The Fund’s expense ratios are 2.30% for Class A shares, 2.07% for Class P shares and 2.00% for Institutional Class shares. Expense ratio information is as of the Fund’s current prospectus dated April 1, 2014, as supplemented to date.
| Semiannual Report | | May 31, 2014 | 79 |
Table of Contents
Unaudited
AllianzGI Ultra Micro Cap Fund (cont’d)
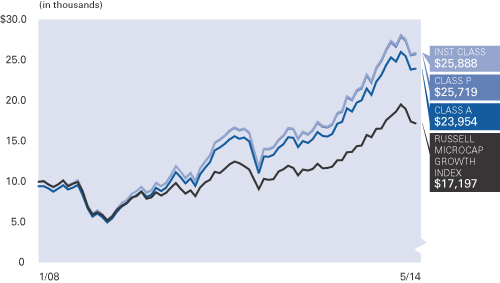
| Shareholder Expense Example | Actual Performance | |||||
| Class A | Class P | Institutional Class | ||||
| Beginning Account Value (12/1/13) | $1,000.00 | $1,000.00 | $1,000.00 | |||
| Ending Account Value (5/31/14) | $981.60 | $982.00 | $981.70 | |||
| Expenses Paid During Period | $10.47 | $9.88 | $9.88 | |||
| Hypothetical Performance | ||||||
| (5% return before expenses) | ||||||
| Class A | Class P | Institutional Class | ||||
| Beginning Account Value (12/1/13) | $1,000.00 | $1,000.00 | $1,000.00 | |||
| Ending Account Value (5/31/14) | $1,014.36 | $1,014.96 | $1,014.96 | |||
| Expenses Paid During Period | $10.65 | $10.05 | $10.05 | |||
For each class of the Fund, expenses are equal to the annualized expense ratio for the class (2.12% for Class A, 2.00% for Class P and 2.00% for Institutional Class), multiplied by the average account value over the period, multiplied by 182/365.
| 80 | May 31, 2014 | | Semiannual Report |
Table of Contents
Unaudited
AllianzGI U.S. Equity Hedged Fund
For the period of December 1, 2013 through May 31, 2014, as provided by Robert Marren, Portfolio Manager.
Fund Insights
Average Annual Total Return for the period ended May 31, 2014
| 6 Month* |
1 Year | Since Inception† |
||||||||||||
| AllianzGI U.S. Equity Hedged Fund Class A |
4.41% | 10.56% | 13.06% | |||||||||||
|
|
AllianzGI U.S. Equity Hedged Fund Class A (adjusted) |
–1.33% | 4.48% | 8.85% | ||||||||||
| AllianzGI U.S. Equity Hedged Fund Class C |
4.07% | 9.77% | 12.28% | |||||||||||
|
|
AllianzGI U.S. Equity Hedged Fund Class C (adjusted) |
3.07% | 8.77% | 12.28% | ||||||||||
|
|
AllianzGI U.S. Equity Hedged Fund Class D |
4.40% | 10.55% | 13.09% | ||||||||||
|
|
AllianzGI U.S. Equity Hedged Fund Class P |
4.47% | 10.75% | 13.28% | ||||||||||
|
|
AllianzGI U.S. Equity Hedged Fund Institutional Class |
4.56% | 10.84% | 13.39% | ||||||||||
|
|
S&P 500 Index |
7.62% | 20.45% | 25.89% | ||||||||||
| Lipper Equity Market Neutral Funds Average |
2.58% | 9.61% | 12.13% | |||||||||||
† The Fund began operations on 12/3/12. Benchmark return comparisons began on the fund inception date. Lipper performance comparisons began on 11/30/12.
* Cumulative return
Performance quoted represents past performance and is no guarantee of future results. Current performance may be lower or higher than performance shown. For performance current to the most recent month-end, visit our website at us.allianzgi.com. Investment return and the principal value will fluctuate. Shares may be worth more or less than original cost when redeemed. The adjusted returns take into account the maximum initial sales charge of 5.50% on Class A shares and the contingent deferred sales charge (CDSC) of 1% on Class C shares, which may apply to shares redeemed during the first year of ownership. Returns do not reflect deduction of taxes that a shareholder would pay on fund distributions or redemption of fund shares. See pages 86 and 87 for more information. The Fund’s gross expense ratios are 7.48% for Class A shares, 8.77% for Class C shares, 7.44% for Class D shares, 6.38% for Class P shares and 6.49% for Institutional Class shares. These ratios do not include an expense reduction, contractually guaranteed through at least 3/31/15. The Fund’s expense ratios net of this reduction are 1.25% for Class A shares, 2.00% for Class C shares, 1.25% for Class D shares, 1.10% for Class P shares and 1.00% for Institutional Class shares. Expense ratio information is as of the Fund’s current prospectus dated April 1, 2014, as supplemented to date.
| Semiannual Report | | May 31, 2014 | 81 |
Table of Contents
Unaudited
AllianzGI U.S. Equity Hedged Fund (cont’d)
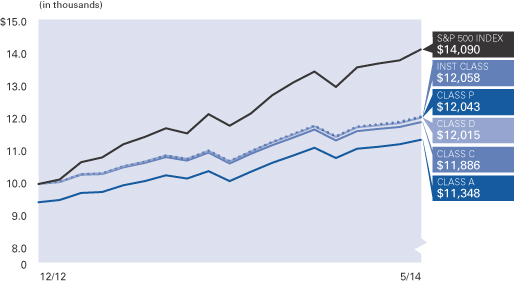
| Shareholder Expense Example | Actual Performance | |||||||||
| Class A | Class C | Class D | Class P | Institutional Class | ||||||
| Beginning Account Value (12/1/13) | $1,000.00 | $1,000.00 | $1,000.00 | $1,000.00 | $1,000.00 | |||||
| Ending Account Value (5/31/14) | $1,044.10 | $1,040.70 | $1,044.00 | $1,044.70 | $1,045.60 | |||||
| Expenses Paid During Period | $6.37 | $10.18 | $6.37 | $5.61 | $5.10 | |||||
| Hypothetical Performance | ||||||||||
| (5% return before expenses) | ||||||||||
| Class A | Class C | Class D | Class P | Institutional Class | ||||||
| Beginning Account Value (12/1/13) | $1,000.00 | $1,000.00 | $1,000.00 | $1,000.00 | $1,000.00 | |||||
| Ending Account Value (5/31/14) | $1,018.70 | $1,014.96 | $1,018.70 | $1,019.45 | $1,019.95 | |||||
| Expenses Paid During Period | $6.29 | $10.05 | $6.29 | $5.54 | $5.04 | |||||
For each class of the Fund, expenses (net of fee waiver and reimbursement, if any) are equal to the annualized expense ratio for the class (1.25% for Class A, 2.00% for Class C, 1.25% for Class D, 1.10% for Class P and 1.00% for Institutional Class), multiplied by the average account value over the period, multiplied by 182/365.
| 82 | May 31, 2014 | | Semiannual Report |
Table of Contents
Unaudited
AllianzGI U.S. Small-Cap Growth Fund (formerly AllianzGI U.S. Emerging Growth Fund)
For the period of December 1, 2013 through May 31, 2014, as provided by John McCraw, Portfolio Manager.
Fund Insights
| Semiannual Report | | May 31, 2014 | 83 |
Table of Contents
Unaudited
AllianzGI U.S. Small-Cap Growth Fund (formerly AllianzGI U.S. Emerging Growth Fund) (cont’d)
Average Annual Total Return for the period ended May 31, 2014
| 6 Month* | 1 Year | 5 Year | 10 Year | Since Inception† | ||||||||||||||||||
| AllianzGI U.S. Small-Cap Growth Fund Class A | –0.80% | 19.27% | 19.49% | 9.89% | 7.90% | |||||||||||||||||
|
|
AllianzGI U.S. Small-Cap Growth Fund Class A (adjusted) | –6.26% | 12.71% | 18.15% | 9.27% | 7.60% | ||||||||||||||||
| AllianzGI U.S. Small-Cap Growth Fund Class C | –1.16% | 18.37% | 18.63% | 9.09% | 7.10% | |||||||||||||||||
|
|
AllianzGI U.S. Small-Cap Growth Fund Class C (adjusted) | –2.08% | 17.37% | 18.63% | 9.09% | 7.10% | ||||||||||||||||
|
|
AllianzGI U.S. Small-Cap Growth Fund Class D | –0.80% | 19.32% | 19.52% | 9.90% | 7.90% | ||||||||||||||||
|
|
AllianzGI U.S. Small-Cap Growth Fund Class R | –0.92% | 19.05% | 19.24% | 9.64% | 7.64% | ||||||||||||||||
|
|
AllianzGI U.S. Small-Cap Growth Fund Class P | –0.74% | 19.52% | 19.79% | 10.17% | 8.17% | ||||||||||||||||
|
|
AllianzGI U.S. Small-Cap Growth Fund Institutional Class | –0.62% | 19.67% | 19.92% | 10.28% | 8.27% | ||||||||||||||||
|
|
Russell 2000 Growth Index | –1.79% | 16.71% | 19.82% | 8.74% | 7.09% | ||||||||||||||||
| Lipper Small-Cap Growth Funds Average | –2.85% | 15.77% | 19.28% | 8.22% | 9.27% | |||||||||||||||||
† The Fund began operations on 10/1/93. Benchmark return comparisons began on the fund inception date. Lipper performance comparisons began on 9/30/93.
* Cumulative return.
Performance quoted represents past performance and is no guarantee of future results. Current performance may be lower or higher than performance shown. For performance current to the most recent month-end, visit our website at us.allianzgi.com. Investment return and the principal value will fluctuate. Shares may be worth more or less than original cost when redeemed. The adjusted returns take into account the maximum initial sales charge of 5.50% on Class A shares and the contingent deferred sales charge (CDSC) of 1% on Class C shares, which may apply to shares redeemed during the first year of ownership. Returns do not reflect deduction of taxes that a shareholder would pay on fund distributions or redemption of fund shares. See pages 86 and 87 for more information. The Fund’s gross expense ratios are 1.91% for Class A shares, 2.73% for Class C shares, 2.00% for Class D shares, 2.16% for Class R shares, 1.74% for Class P shares and 1.69% for Institutional Class shares. These ratios do not include an expense reduction, contractually guaranteed through at least 3/31/15. The Fund’s expense ratios net of this reduction are 1.40% for Class A shares, 2.20% for Class C shares, 1.42% for Class D shares, 1.65% for Class R shares, 1.25% for Class P shares and 1.16% for Institutional Class shares. Expense ratio information is as of the Fund’s current prospectus dated April 1, 2014, as supplemented to date.
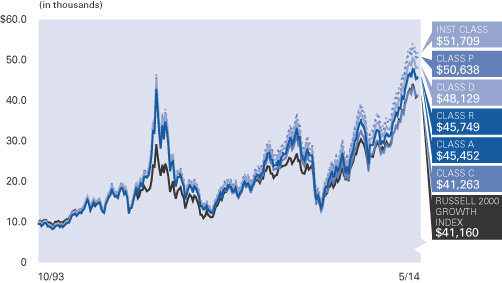
| 84 | May 31, 2014 | | Semiannual Report |
Table of Contents
Unaudited
AllianzGI U.S. Small-Cap Growth Fund (formerly AllianzGI U.S. Emerging Growth Fund) (cont’d)
| Shareholder Expense Example | Actual Performance | |||||||||||
| Class A | Class C | Class D | Class R | Class P | Institutional Class | |||||||
| Beginning Account Value (12/1/13) | $1,000.00 | $1,000.00 | $1,000.00 | $1,000.00 | $1,000.00 | $1,000.00 | ||||||
| Ending Account Value (5/31/14) | $992.00 | $988.40 | $992.00 | $990.80 | $992.60 | $993.80 | ||||||
| Expenses Paid During Period | $7.30 | $10.96 | $7.05 | $8.24 | $6.21 | $5.77 | ||||||
| Hypothetical Performance | ||||||||||||
| (5% return before expenses) | ||||||||||||
| Class A | Class C | Class D | Class R | Class P | Institutional Class | |||||||
| Beginning Account Value (12/1/13) | $1,000.00 | $1,000.00 | $1,000.00 | $1,000.00 | $1,000.00 | $1,000.00 | ||||||
| Ending Account Value (5/31/14) | $1,017.60 | $1,013.91 | $1,017.85 | $1,016.65 | $1,018.70 | $1,019.15 | ||||||
| Expenses Paid During Period | $7.39 | $11.10 | $7.14 | $8.35 | $6.29 | $5.84 | ||||||
For each class of the Fund, expenses (net of fee waiver and reimbursement, if any) are equal to the annualized expense ratio for the class (1.47% for Class A, 2.21% for Class C, 1.42% for Class D, 1.66% for Class R, 1.25% for Class P and 1.16% for Institutional Class), multiplied by the average account value over the period, multiplied by 182/365.
| Semiannual Report | | May 31, 2014 | 85 |
Table of Contents
Unaudited
| 86 | May 31, 2014 | | Semiannual Report |
Table of Contents
Unaudited
Important Information (cont’d)
| Semiannual Report | | May 31, 2014 | 87 |
Table of Contents
Unaudited
Unless otherwise noted, index returns reflect the reinvestment of income dividends and capital gains, if any, but do not reflect fees, brokerage commissions or other expenses of investing. It is not possible to invest directly in an index.
Prior to November 1, 2006, performance data for the MSCI Indices was calculated gross of dividend tax withholding. Performance data presently shown for the Indices is net of dividend tax withholding. This recalculation results in lower performance for the Indices.
| Index | Description | |
| Barclays Global Aggregate Index | The Barclays Global Aggregate Index provides a broad-based measure of the global investment-grade fixed income markets. The three major components of this index are the U.S. Aggregate, the Pan-European Aggregate, and the Asian-Pacific Aggregate Indices. The index also includes Eurodollar and Euro-Yen corporate bonds, Canadian government, agency and corporate securities, and USD investment grade 144A securities. | |
| Barclays Global High Yield Index | The Barclays Global High Yield Index is an unmanaged index considered representative of fixed rate, non-investment-grade debt of companies in the US, developed markets and emerging markets. | |
| Barclays US Aggregate Index | The Barclays US Aggregate Index is composed of securities from the Barclays Government/Credit Bond Index, Mortgage-Backed Securities Index, and Asset-Backed Securities Index. It is generally considered to be representative of the domestic, investment-grade, fixed-rate, taxable bond market. | |
| Barclays US Credit Index | The Barclays US Credit Index is the credit component of the U.S. Government/Credit index. It includes publicly issued U.S. corporate and specified foreign debentures and secured notes that meet the specified maturity, liquidity and quality requirements. To qualify, securities must be rated investment grade (Baa3 or better) by Moody’s. | |
| Barclays US Government Bond Index | The Barclays US Government Bond Index is composed of all publicly issued, nonconvertible, domestic debt of the U.S. Government or any agency thereof, quasi-federal corporations or corporate debt guaranteed by the U.S. Government. | |
| Barclays US Government Inflation-Linked Bond Index | Barclays US Government Inflation-Linked Bond Index measures the performance of the US Treasury Inflation Protected Securities (“TIPS”) market. The index includes TIPS with one or more years remaining maturity with total outstanding issue size of $500m or more. | |
| Barclays US Treasury 10-20 Year Index | The Barclays US Treasury 10-20 Year Index measures the performance of US Treasury securities that have remaining maturity of at least 10 years and less than 20 years. | |
| BofA Merrill Lynch 1-3 Year BB US Cash Pay High Yield Index | The BofA Merrill Lynch 1-3 Year BB US Cash Pay High Yield Index is a subset of The BofA Merrill Lynch U.S. Cash Pay High Yield Index including all securities with a remaining term to final maturity less than 3 years and rated BB1 through BB3, inclusive. The BofA Merrill Lynch US Cash Pay High Yield Index tracks the performance of U.S. dollar denominated below investment grade corporate debt, currently in a coupon paying period, that is publicly issued in the US domestic market. | |
| BofA Merrill Lynch 3-Month US Treasury Bill Index | The BofA Merrill Lynch 3-Month US Treasury Bill Index tracks the performance of the 3-month U.S. Treasury markets. | |
| BofA Merrill Lynch All Convertibles Index | The BofA Merrill Lynch All Convertibles Index is a widely used, unmanaged index that measures the performance of US dollar-denominated convertible securities not currently in bankruptcy with a total market value greater than $50 million at issuance. | |
| BofA Merrill Lynch US High Yield Master II Index | The BofA Merrill Lynch US High Yield Master II Index is an unmanaged index consisting of US dollar denominated bonds that are issued in countries having a BBB3 or higher debt rating with at least one year remaining until maturity. All bonds must have a credit rating below investment grade but not in default. | |
| 88 | May 31, 2014 | | Semiannual Report |
Table of Contents
Unaudited
Benchmark Descriptions (cont’d)
| Index | Description | |
| Dow Jones Real Return Target Date Index; DJ RR 2015 Index; DJ RR 2020 Index; DJ RR 2025 Index; DJ RR 2030 Index; DJ RR 2035 Index; DJ RR 2040 Index; DJ RR 2045 Index; DJ RR 2050 Index; DJ RR 2040+ Index; DJ RR Today Index | Each Dow Jones Real Return Target Date Index is a composite of other indexes. The sub-indexes represent traditional stocks and bonds in addition to real return assets such as inflation-linked bonds, commodities and real estate securities that are considered to potentially counterbalance inflation. The component asset classes are weighted within each index to reflect a targeted level of risk at the beginning and end of the investment horizon. Over time, the weights are adjusted based on predetermined formulas to systematically reduce the level of potential risk as the index’s maturity date approaches. | |
| Dow Jones UBS Commodity Index | The Dow Jones UBS Commodity Index is composed of futures contracts on 19 physical commodities. | |
| Dow Jones US Select REIT Index | The Dow Jones US Select REIT index is comprised of companies whose charters are the equity ownership and operation of commercial real estate and which operate under the REIT Act of 1960. | |
| MSCI All Country World Index (Also known as: MSCI AC World Index and MSCI ACWI) |
The MSCI All Country World Index (MSCI ACWI) is a free float-adjusted market capitalization weighted index that is designed to measure the equity market performance of developed and emerging markets. The MSCI ACWI consists of 45 country indices comprising 24 developed and 21 emerging market country indices. | |
| MSCI China Index | The MSCI China Index is a free float-adjusted market capitalization-weighted index of Chinese equities that includes China-affiliated corporations (“Red-chips” or “P-chips”) and China-incorporated corporations listed as “H-shares” on the Hong Kong Exchange or listed as B-shares on the Shanghai and Shenzhen exchanges. | |
| MSCI EAFE Index | The MSCI EAFE Index (Europe, Australasia, Far East) is a free float-adjusted market capitalization index that is designed to measure the equity market performance of developed markets, excluding the US & Canada. | |
| MSCI EAFE Small Cap Index | The MSCI EAFE Small Cap Index captures small cap representation across Developed Markets countries around the world, excluding the US and Canada. | |
| MSCI Emerging Markets Index | The MSCI Emerging Markets Index is a free float-adjusted market capitalization index that is designed to measure equity market performance in emerging markets. | |
| MSCI World ex-US Small Cap Index | The MSCI World ex-US Small Cap Index captures small cap representation across 23 of 24 of Developed Markets (DM) countries (excluding the United States). | |
| MSCI World Index | The MSCI World Index is a free float-adjusted market capitalization weighted index that is designed to measure the equity market performance of developed markets. | |
| MSCI World Minimum Volatility Index | MSCI World Minimum Volatility Index aims to reflect the performance characteristics of a minimum variance strategy applied to the MSCI large and mid cap equity universe across 24 Developed Markets countries. The index is calculated by optimizing the MSCI World Index, its parent index, for the lowest absolute risk (within a given set of constraints). Historically, the index has shown lower beta and volatility characteristics relative to the MSCI World Index. | |
| Russell 1000 Index | The Russell 1000 Index is an unmanaged index that consists of the 1,000 largest companies in the Russell 3000 Index and represents approximately 90% of the total market capitalization of the Russell 3000 Index. It is highly correlated with the S&P 500 Index. | |
| Russell 2000 Growth Index | The Russell 2000 Growth Index is an unmanaged index composed of those Russell 2000 companies with higher price-to-book ratios and higher forecasted growth values. | |
| Russell 2000 Index | The Russell 2000 Index measures the performance of the small-cap segment of the US equity universe. The Russell 2000 is a subset of the Russell 3000 Index representing approximately 10% of total market capitalization of that index. | |
| Semiannual Report | | May 31, 2014 | 89 |
Table of Contents
| Index | Description | |
| Russell Microcap Growth Index | The Russell Microcap Growth Index measures the performance of the microcap growth segment of the U.S. Equity market. It includes those Russell Microcap Index companies with higher price-to-book ratios and higher forecasted growth values. | |
| S&P 500 Index | The Standard & Poor’s 500 Index is an unmanaged market index generally considered representative of the stock market as a whole. The Index focuses on the large-cap segment of the U.S. equities market. | |
| S&P Global Water Index | The Standard & Poor’s Global Water Index is comprised of 50 of the largest publicly traded companies in water-related businesses that meet specific investability requirements. The Index is designed to provide liquid exposure to the leading publicly-listed companies in the global water industry, from both developed markets and emerging markets. | |
| USD Overnight LIBOR | USD Overnight LIBOR (London Interbank Offered Rate) is the average interest rate at which leading banks in London borrow US dollar funds from one another with a maturity of one day (overnight). | |
| 90 | May 31, 2014 | | Semiannual Report |
Table of Contents
May 31, 2014 (Unaudited)
| See accompanying Notes to Financial Statements | | May 31, 2014 | | Semiannual Report | 91 |
Table of Contents
Schedule of Investments
May 31, 2014 (Unaudited)
| 92 | Semiannual Report | | May 31, 2014 | | See accompanying Notes to Financial Statements |
Table of Contents
Schedule of Investments
May 31, 2014 (Unaudited)
| See accompanying Notes to Financial Statements | | May 31, 2014 | | Semiannual Report | 93 |
Table of Contents
Schedule of Investments
May 31, 2014 (Unaudited)
| 94 | Semiannual Report | | May 31, 2014 | | See accompanying Notes to Financial Statements |
Table of Contents
Schedule of Investments
May 31, 2014 (Unaudited)
| See accompanying Notes to Financial Statements | | May 31, 2014 | | Semiannual Report | 95 |
Table of Contents
Schedule of Investments
May 31, 2014 (Unaudited)
| 96 | Semiannual Report | | May 31, 2014 | | See accompanying Notes to Financial Statements |
Table of Contents
Schedule of Investments
May 31, 2014 (Unaudited)
| See accompanying Notes to Financial Statements | | May 31, 2014 | | Semiannual Report | 97 |
Table of Contents
Schedule of Investments
May 31, 2014 (Unaudited)
| 98 | Semiannual Report | | May 31, 2014 | | See accompanying Notes to Financial Statements |
Table of Contents
Schedule of Investments
May 31, 2014 (Unaudited)
| See accompanying Notes to Financial Statements | | May 31, 2014 | | Semiannual Report | 99 |
Table of Contents
Schedule of Investments
May 31, 2014 (Unaudited)
| 100 | Semiannual Report | | May 31, 2014 | | See accompanying Notes to Financial Statements |
Table of Contents
Schedule of Investments
May 31, 2014 (Unaudited)
| See accompanying Notes to Financial Statements | | May 31, 2014 | | Semiannual Report | 101 |
Table of Contents
Schedule of Investments
May 31, 2014 (Unaudited)
| 102 | Semiannual Report | | May 31, 2014 | | See accompanying Notes to Financial Statements |
Table of Contents
Schedule of Investments
May 31, 2014 (Unaudited)
| See accompanying Notes to Financial Statements | | May 31, 2014 | | Semiannual Report | 103 |
Table of Contents
Schedule of Investments
May 31, 2014 (Unaudited)
| 104 | Semiannual Report | | May 31, 2014 | | See accompanying Notes to Financial Statements |
Table of Contents
Schedule of Investments
May 31, 2014 (Unaudited)
| See accompanying Notes to Financial Statements | | May 31, 2014 | | Semiannual Report | 105 |
Table of Contents
Schedule of Investments
May 31, 2014 (Unaudited)
| 106 | Semiannual Report | | May 31, 2014 | | See accompanying Notes to Financial Statements |
Table of Contents
Schedule of Investments
May 31, 2014 (Unaudited)
| See accompanying Notes to Financial Statements | | May 31, 2014 | | Semiannual Report | 107 |
Table of Contents
Schedule of Investments
May 31, 2014 (Unaudited)
| 108 | Semiannual Report | | May 31, 2014 | | See accompanying Notes to Financial Statements |
Table of Contents
Schedule of Investments
May 31, 2014 (Unaudited)
| See accompanying Notes to Financial Statements | | May 31, 2014 | | Semiannual Report | 109 |
Table of Contents
Schedule of Investments
May 31, 2014 (Unaudited)
| 110 | Semiannual Report | | May 31, 2014 | | See accompanying Notes to Financial Statements |
Table of Contents
Schedule of Investments
May 31, 2014 (Unaudited)
| See accompanying Notes to Financial Statements | | May 31, 2014 | | Semiannual Report | 111 |
Table of Contents
Schedule of Investments
May 31, 2014 (Unaudited)
| 112 | Semiannual Report | | May 31, 2014 | | See accompanying Notes to Financial Statements |
Table of Contents
Schedule of Investments
May 31, 2014 (Unaudited)
| See accompanying Notes to Financial Statements | | May 31, 2014 | | Semiannual Report | 113 |
Table of Contents
Schedule of Investments
May 31, 2014 (Unaudited)
| 114 | Semiannual Report | | May 31, 2014 | | See accompanying Notes to Financial Statements |
Table of Contents
Schedule of Investments
May 31, 2014 (Unaudited)
| See accompanying Notes to Financial Statements | | May 31, 2014 | | Semiannual Report | 115 |
Table of Contents
Schedule of Investments
May 31, 2014 (Unaudited)
| 116 | Semiannual Report | | May 31, 2014 | | See accompanying Notes to Financial Statements |
Table of Contents
Schedule of Investments
May 31, 2014 (Unaudited)
| See accompanying Notes to Financial Statements | | May 31, 2014 | | Semiannual Report | 117 |
Table of Contents
Schedule of Investments
May 31, 2014 (Unaudited)
| 118 | Semiannual Report | | May 31, 2014 | | See accompanying Notes to Financial Statements |
Table of Contents
Schedule of Investments
May 31, 2014 (Unaudited)
| See accompanying Notes to Financial Statements | | May 31, 2014 | | Semiannual Report | 119 |
Table of Contents
Schedule of Investments
May 31, 2014 (Unaudited)
| 120 | Semiannual Report | | May 31, 2014 | | See accompanying Notes to Financial Statements |
Table of Contents
Schedule of Investments
May 31, 2014 (Unaudited)
| See accompanying Notes to Financial Statements | | May 31, 2014 | | Semiannual Report | 121 |
Table of Contents
Schedule of Investments
May 31, 2014 (Unaudited)
| 122 | Semiannual Report | | May 31, 2014 | | See accompanying Notes to Financial Statements |
Table of Contents
Schedule of Investments
May 31, 2014 (Unaudited)
| See accompanying Notes to Financial Statements | | May 31, 2014 | | Semiannual Report | 123 |
Table of Contents
Schedule of Investments
May 31, 2014 (Unaudited)
| 124 | Semiannual Report | | May 31, 2014 | | See accompanying Notes to Financial Statements |
Table of Contents
Schedule of Investments
May 31, 2014 (Unaudited)
| See accompanying Notes to Financial Statements | | May 31, 2014 | | Semiannual Report | 125 |
Table of Contents
Schedule of Investments
May 31, 2014 (Unaudited)
| 126 | Semiannual Report | | May 31, 2014 | | See accompanying Notes to Financial Statements |
Table of Contents
Schedule of Investments
May 31, 2014 (Unaudited)
| See accompanying Notes to Financial Statements | | May 31, 2014 | | Semiannual Report | 127 |
Table of Contents
Schedule of Investments
May 31, 2014 (Unaudited)
| 128 | Semiannual Report | | May 31, 2014 | | See accompanying Notes to Financial Statements |
Table of Contents
Schedule of Investments
May 31, 2014 (Unaudited)
| See accompanying Notes to Financial Statements | | May 31, 2014 | | Semiannual Report | 129 |
Table of Contents
Schedule of Investments
May 31, 2014 (Unaudited)
| 130 | Semiannual Report | | May 31, 2014 | | See accompanying Notes to Financial Statements |
Table of Contents
Schedule of Investments
May 31, 2014 (Unaudited)
| See accompanying Notes to Financial Statements | | May 31, 2014 | | Semiannual Report | 131 |
Table of Contents
Schedule of Investments
May 31, 2014 (Unaudited)
| 132 | Semiannual Report | | May 31, 2014 | | See accompanying Notes to Financial Statements |
Table of Contents
Schedule of Investments
May 31, 2014 (Unaudited)
| See accompanying Notes to Financial Statements | | May 31, 2014 | | Semiannual Report | 133 |
Table of Contents
Schedule of Investments
May 31, 2014 (Unaudited)
| 134 | Semiannual Report | | May 31, 2014 | | See accompanying Notes to Financial Statements |
Table of Contents
Schedule of Investments
May 31, 2014 (Unaudited)
| See accompanying Notes to Financial Statements | | May 31, 2014 | | Semiannual Report | 135 |
Table of Contents
Statements of Assets and Liabilities
May 31, 2014 (Unaudited)
| AllianzGI Retirement 2015 |
AllianzGI Retirement 2020 |
AllianzGI Retirement 2025 |
AllianzGI Retirement 2030 |
AllianzGI Retirement 2035 |
||||||||||||||||||
| Assets: | ||||||||||||||||||||||
| Investments, at value | $ | 2,465,202 | $ | 4,477,581 | $ | 5,316,831 | $ | 5,600,837 | $ | 4,740,165 | ||||||||||||
| Investments in Affiliates, at value | 26,330,207 | 45,290,544 | 51,766,974 | 53,913,509 | 44,541,134 | |||||||||||||||||
| Repurchase agreements, at value | — | 379,000 | 553,000 | 490,000 | 403,000 | |||||||||||||||||
| Cash | 16,346 | 617 | 546 | 293 | 282 | |||||||||||||||||
| Receivable for investments in Affiliates sold | 174,817 | — | — | — | — | |||||||||||||||||
| Receivable for investments sold | 11,373 | — | — | — | — | |||||||||||||||||
| Dividends receivable from Affiliates | 7,802 | 12,881 | 10,220 | 7,355 | 4,408 | |||||||||||||||||
| Receivable for Fund shares sold | 1,835 | 9,336 | 5,966 | 7,655 | 9,928 | |||||||||||||||||
| Receivable from Investment Manager | — | — | — | — | — | |||||||||||||||||
| Prepaid expenses | — | — | — | — | — | |||||||||||||||||
| Total Assets |
29,007,582 | 50,169,959 | 57,653,537 | 60,019,649 | 49,698,917 | |||||||||||||||||
| Liabilities: | ||||||||||||||||||||||
| Payable for investments in Affiliates purchased | — | — | — | — | — | |||||||||||||||||
| Payable for Fund shares redeemed | 151 | 9 | 5 | 23,223 | 2,107 | |||||||||||||||||
| Servicing fees payable | 2,314 | 4,557 | 5,212 | 4,669 | 3,300 | |||||||||||||||||
| Administration fees payable | 2,134 | 4,582 | 5,304 | 2,723 | 2,124 | |||||||||||||||||
| Distribution fees payable | 1,794 | 2,152 | 2,505 | 2,687 | 2,468 | |||||||||||||||||
| Accrued expenses | — | — | — | — | — | |||||||||||||||||
| Total Liabilities |
6,393 | 11,300 | 13,026 | 33,302 | 9,999 | |||||||||||||||||
| Net Assets | $ | 29,001,189 | $ | 50,158,659 | $ | 57,640,511 | $ | 59,986,347 | $ | 49,688,918 | ||||||||||||
| Net Assets Consist of: | ||||||||||||||||||||||
| Paid-in-capital | $ | 27,048,473 | $ | 47,449,674 | $ | 54,958,135 | $ | 55,474,445 | $ | 46,155,601 | ||||||||||||
| Undistributed (dividends in excess of) net investment income | 180,430 | 273,370 | 269,467 | 264,733 | 159,393 | |||||||||||||||||
| Accumulated net realized gain (loss) | (100,081 | ) | (346,829 | ) | (596,144 | ) | 120,801 | 66,806 | ||||||||||||||
| Net unrealized appreciation | 1,872,367 | 2,782,444 | 3,009,053 | 4,126,368 | 3,307,118 | |||||||||||||||||
| Net Assets | $ | 29,001,189 | $ | 50,158,659 | $ | 57,640,511 | $ | 59,986,347 | $ | 49,688,918 | ||||||||||||
| Cost of Investments | $ | 2,269,330 | $ | 4,157,109 | $ | 4,916,377 | $ | 5,109,724 | $ | 4,328,658 | ||||||||||||
| Cost of Investments in Affiliates | $ | 24,653,712 | $ | 42,828,572 | $ | 49,158,375 | $ | 50,278,254 | $ | 41,645,523 | ||||||||||||
| Cost of Repurchase Agreements | $ | — | $ | 379,000 | $ | 553,000 | $ | 490,000 | $ | 403,000 | ||||||||||||
| 136 | Semiannual Report | | May 31, 2014 | | See accompanying Notes to Financial Statements |
Table of Contents
| AllianzGI Retirement 2040 |
AllianzGI Retirement 2045 |
AllianzGI Retirement 2050 |
AllianzGI Retirement 2055 |
AllianzGI Retirement Income |
AllianzGI Global Allocation |
AllianzGI Global Growth Allocation |
||||||||||||||||||||||
| $ | 4,018,406 | $ | 2,358,412 | $ | 1,884,317 | $ | 627,778 | $ | 2,673,770 | $ | 20,147,583 | $ | 655,614 | |||||||||||||||
| 38,024,062 | 22,169,908 | 17,935,208 | 6,024,979 | 27,694,594 | 197,877,273 | 5,909,846 | ||||||||||||||||||||||
| 395,000 | 264,000 | 239,000 | — | 282,000 | 582,000 | — | ||||||||||||||||||||||
| 914 | 739 | 523 | 77,139 | 736 | 597 | 55,521 | ||||||||||||||||||||||
| — | — | — | — | — | — | — | ||||||||||||||||||||||
| — | — | — | — | — | — | — | ||||||||||||||||||||||
| 2,823 | — | — | — | 8,961 | — | — | ||||||||||||||||||||||
| 11,757 | 5,973 | 8,786 | 4,712 | 2,247 | 21,529 | 622 | ||||||||||||||||||||||
| — | — | 329 | 356 | — | 3,966 | 24,375 | ||||||||||||||||||||||
| — | — | — | — | — | 43,256 | 39,943 | ||||||||||||||||||||||
| 42,452,962 | 24,799,032 | 20,068,163 | 6,734,964 | 30,662,308 | 218,676,204 | 6,685,921 | ||||||||||||||||||||||
| — | — | — | — | — | 150,696 | — | ||||||||||||||||||||||
| 1,491 | 1 | 4 | 6,079 | 3,510 | 535,432 | 150,551 | ||||||||||||||||||||||
| 3,166 | 1,831 | 915 | 146 | 2,277 | 29,609 | 646 | ||||||||||||||||||||||
| 1,340 | 554 | — | — | 1,758 | — | — | ||||||||||||||||||||||
| 1,743 | 488 | 660 | 148 | 3,258 | 43,506 | 1,122 | ||||||||||||||||||||||
| — | — | — | — | — | 182,535 | 41,019 | ||||||||||||||||||||||
| 7,740 | 2,874 | 1,579 | 6,373 | 10,803 | 941,778 | 193,338 | ||||||||||||||||||||||
| $ | 42,445,222 | $ | 24,796,158 | $ | 20,066,584 | $ | 6,728,591 | $ | 30,651,505 | $ | 217,734,426 | $ | 6,492,583 | |||||||||||||||
| $ | 38,026,710 | $ | 22,414,367 | $ | 17,246,478 | $ | 5,708,101 | $ | 28,330,062 | $ | 190,419,322 | $ | 5,018,631 | |||||||||||||||
| |
94,710 |
|
37,897 | 21,045 | 8,051 | 115,661 | (34,442 | ) | (13,891 | ) | ||||||||||||||||||
| 541,378 | 192,017 | 453,183 | 166,522 | 252,023 | (1,263,905 | ) | 418,283 | |||||||||||||||||||||
| 3,782,424 | 2,151,877 | 2,345,878 | 845,917 | 1,953,759 | 28,613,451 | 1,069,560 | ||||||||||||||||||||||
| $ | 42,445,222 | $ | 24,796,158 | $ | 20,066,584 | $ | 6,728,591 | $ | 30,651,505 | $ | 217,734,426 | $ | 6,492,583 | |||||||||||||||
| $ | 3,600,323 | $ | 2,124,038 | $ | 1,670,779 | $ | 551,857 | $ | 2,436,703 | $ | 18,101,575 | $ | 577,269 | |||||||||||||||
| $ | 34,659,721 | $ | 20,252,405 | $ | 15,802,868 | $ | 5,254,983 | $ | 25,977,902 | $ | 171,309,830 | $ | 4,918,631 | |||||||||||||||
| $ | 395,000 | $ | 264,000 | $ | 239,000 | $ | — | $ | 282,000 | $ | 582,000 | $ | — | |||||||||||||||
| See accompanying Notes to Financial Statements | | May 31, 2014 | | Semiannual Report | 137 |
Table of Contents
Statements of Assets and Liabilities (cont’d)
May 31, 2014 (Unaudited)
| AllianzGI Retirement 2015 |
AllianzGI Retirement 2020 |
AllianzGI Retirement 2025 |
AllianzGI Retirement 2030 |
AllianzGI Retirement 2035 |
||||||||||||||||||
| Net Assets: | ||||||||||||||||||||||
| Class A | $ | 9,176,318 | $ | 19,778,126 | $ | 23,431,510 | $ | 19,542,004 | $ | 14,709,183 | ||||||||||||
| Class B | — | — | — | — | — | |||||||||||||||||
| Class C | 1,451,376 | 455,188 | — | 724,986 | — | |||||||||||||||||
| Class D | 111,664 | 365,052 | — | 678,659 | — | |||||||||||||||||
| Class R | 200,314 | 1,088,980 | 1,068,944 | 1,320,230 | 1,045,218 | |||||||||||||||||
| Class P | 4,547,641 | 12,866,095 | 13,546,024 | 18,244,642 | 14,362,799 | |||||||||||||||||
| Institutional Class | — | — | — | — | — | |||||||||||||||||
| Class R6 | 9,956,822 | 8,332,152 | 8,303,817 | 10,844,180 | 8,458,280 | |||||||||||||||||
| Administrative Class | 3,557,054 | 7,273,066 | 11,290,216 | 8,631,646 | 11,113,438 | |||||||||||||||||
| Shares Issued and Outstanding: | ||||||||||||||||||||||
| Class A | 460,356 | 1,000,703 | 1,350,444 | 924,140 | 791,462 | |||||||||||||||||
| Class B | — | — | — | — | — | |||||||||||||||||
| Class C | 73,526 | 23,081 | — | 34,505 | — | |||||||||||||||||
| Class D | 5,563 | 18,384 | — | 31,908 | — | |||||||||||||||||
| Class R | 9,981 | 55,055 | 61,819 | 62,246 | 56,327 | |||||||||||||||||
| Class P | 225,932 | 643,541 | 775,784 | 850,993 | 767,552 | |||||||||||||||||
| Institutional Class | — | — | — | — | — | |||||||||||||||||
| Class R6 | 494,181 | 416,230 | 475,288 | 504,781 | 451,432 | |||||||||||||||||
| Administrative Class | 177,166 | 365,844 | 648,072 | 403,854 | 595,526 | |||||||||||||||||
| Net Asset Value and Redemption Price Per Share:* | ||||||||||||||||||||||
| Class A | $ | 19.93 | $ | 19.76 | $ | 17.35 | $ | 21.15 | $ | 18.58 | ||||||||||||
| Class B | — | — | — | — | — | |||||||||||||||||
| Class C | 19.74 | 19.72 | — | 21.01 | — | |||||||||||||||||
| Class D | 20.07 | 19.86 | — | 21.27 | — | |||||||||||||||||
| Class R | 20.07 | 19.78 | 17.29 | 21.21 | 18.56 | |||||||||||||||||
| Class P | 20.13 | 19.99 | 17.46 | 21.44 | 18.71 | |||||||||||||||||
| Institutional Class | — | — | — | — | — | |||||||||||||||||
| Class R6 | 20.15 | 20.02 | 17.47 | 21.48 | 18.74 | |||||||||||||||||
| Administrative Class | 20.08 | 19.88 | 17.42 | 21.37 | 18.66 | |||||||||||||||||
| * | Net asset value and redemption price per share may not recalculate exactly due to rounding. |
| 138 | Semiannual Report | | May 31, 2014 | | See accompanying Notes to Financial Statements |
Table of Contents
| AllianzGI Retirement 2040 |
AllianzGI Retirement 2045 |
AllianzGI Retirement 2050 |
AllianzGI Retirement 2055 |
AllianzGI Retirement Income |
AllianzGI Global Allocation |
AllianzGI Global Growth Allocation |
||||||||||||||||||||||
| $ | 13,179,288 | $ | 8,273,519 | $ | 3,420,532 | $ | 631,770 | $ | 5,069,108 | $ | 70,164,700 | $ | 1,212,871 | |||||||||||||||
| — | — | — | — | — | 2,223,439 | — | ||||||||||||||||||||||
| 369,072 | — | 135,790 | — | 4,263,756 | 65,953,678 | 1,424,841 | ||||||||||||||||||||||
| 208,629 | — | 285,012 | — | 1,035,925 | 1,558,155 | 219,720 | ||||||||||||||||||||||
| 1,340,238 | 414,061 | 572,185 | 105,926 | 204,642 | 17,457 | 136,528 | ||||||||||||||||||||||
| 11,957,775 | 8,793,948 | 5,329,943 | 997,526 | 7,544,377 | 1,916,927 | 43,552 | ||||||||||||||||||||||
| — | — | — | — | — | 75,867,093 | 3,434,521 | ||||||||||||||||||||||
| 10,090,860 | 5,627,497 | 9,034,119 | 4,705,463 | 10,540,334 | — | — | ||||||||||||||||||||||
| 5,299,360 | 1,687,133 | 1,289,003 | 287,906 | 1,993,363 | 32,977 | 20,550 | ||||||||||||||||||||||
| 597,610 | 430,576 | 154,478 | 33,336 | 259,348 | 5,707,866 | 54,317 | ||||||||||||||||||||||
| — | — | — | — | — | 177,294 | — | ||||||||||||||||||||||
| 16,846 | — | 6,181 | — | 220,490 | 5,302,303 | 64,771 | ||||||||||||||||||||||
| 9,445 | — | 12,838 | — | 52,733 | 127,297 | 9,903 | ||||||||||||||||||||||
| 60,969 | 21,599 | 25,872 | 5,601 | 10,158 | 1,427 | 6,147 | ||||||||||||||||||||||
| 537,201 | 454,877 | 238,162 | 52,304 | 381,005 | 155,934 | 1,951 | ||||||||||||||||||||||
| — | — | — | — | — | 6,232,028 | 153,538 | ||||||||||||||||||||||
| 452,581 | 290,622 | 402,802 | 246,214 | 542,667 | — | — | ||||||||||||||||||||||
| 239,156 | 87,564 | 57,815 | 15,148 | 100,900 | 2,621 | 921 | ||||||||||||||||||||||
| $ | 22.05 | $ | 19.22 | $ | 22.14 | $ | 18.95 | $ | 19.55 | $ | 12.29 | $ | 22.33 | |||||||||||||||
| — | — | — | — | — | 12.54 | — | ||||||||||||||||||||||
| 21.91 | — | 21.97 | — | 19.34 | 12.44 | 22.00 | ||||||||||||||||||||||
| 22.09 | — | 22.20 | — | 19.64 | 12.24 | 22.19 | ||||||||||||||||||||||
| 21.98 | 19.17 | 22.12 | 18.91 | 20.15 | 12.24 | 22.21 | ||||||||||||||||||||||
| 22.26 | 19.33 | 22.38 | 19.07 | 19.80 | 12.29 | 22.32 | ||||||||||||||||||||||
| — | — | — | — | — | 12.17 | 22.37 | ||||||||||||||||||||||
| 22.30 | 19.36 | 22.43 | 19.11 | 19.42 | — | — | ||||||||||||||||||||||
| 22.16 | 19.27 | 22.30 | 19.01 | 19.76 | 12.58 | 22.30 | ||||||||||||||||||||||
| See accompanying Notes to Financial Statements | | May 31, 2014 | | Semiannual Report | 139 |
Table of Contents
Statements of Assets and Liabilities (cont’d)
May 31, 2014 (Unaudited)
| AllianzGI Behavioral Advantage Large Cap |
AllianzGI Best Styles Global Equity Fund |
AllianzGI China Equity |
AllianzGI Convertible |
AllianzGI Global Fundamental Strategy |
||||||||||||||||||
| Assets: | ||||||||||||||||||||||
| Investments, at value | $ | 81,323,042 | $ | 35,420,247 | $ | 3,637,723 | $ | 2,579,633,419 | $ | 22,706,751 | ||||||||||||
| Investments in Affiliates, at value | — | 144,635 | 377,974 | — | — | |||||||||||||||||
| Repurchase agreements, at value | — | 465,000 | — | 37,807,000 | 2,465,000 | |||||||||||||||||
| Cash | — | 331 | 94,496 | 436 | 372 | |||||||||||||||||
| Foreign currency, at value | — | 23,417 | 1,227 | — | 12,342 | |||||||||||||||||
| Unrealized appreciation of forward foreign currency contracts | — | — | — | — | 12,031 | |||||||||||||||||
| Dividends and interest receivable (net of foreign taxes) | 168,472 | 121,929 | 20,155 | 10,540,310 | 199,565 | |||||||||||||||||
| Receivable for investments sold | 238,978 | — | — | 28,703,377 | — | |||||||||||||||||
| Deposits with brokers for derivatives collateral | — | 587,206 | — | — | 116,897 | |||||||||||||||||
| Receivable for Fund shares sold | 38,016 | — | 100 | 3,828,593 | — | |||||||||||||||||
| Receivable from Investment Manager | — | 14,037 | 18,719 | — | — | |||||||||||||||||
| Deferred offering costs | — | 65,990 | — | — | 13,242 | |||||||||||||||||
| Tax reclaims receivable | 122 | 12,189 | — | — | 6,238 | |||||||||||||||||
| Dividends receivable from Affiliates | — | 312 | 6,754 | — | — | |||||||||||||||||
| Receivable for variation margin on futures contracts | — | 38,446 | — | — | — | |||||||||||||||||
| Prepaid expenses and other assets | 15,048 | 1,066 | 69,021 | 65,415 | 23,991 | |||||||||||||||||
| Total Assets |
81,783,678 | 36,894,805 | 4,226,169 | 2,660,578,550 | 25,556,429 | |||||||||||||||||
| Liabilities: | ||||||||||||||||||||||
| Payable for investments purchased | — | — | — | 40,071,594 | 1,114,339 | |||||||||||||||||
| Payable for Fund shares redeemed | 40,401 | 10,141 | — | 2,353,111 | 195 | |||||||||||||||||
| Payable to custodian for cash overdraft | 3,936 | — | — | — | — | |||||||||||||||||
| Payable for variation margin on futures contracts | — | — | — | — | 44,838 | |||||||||||||||||
| Investment management fees payable | 13,355 | — | — | 1,247,712 | 2,102 | |||||||||||||||||
| Distribution fees payable | 235 | — | 27 | 86,772 | 7 | |||||||||||||||||
| Servicing fees payable | 2,206 | — | 79 | 150,955 | 446 | |||||||||||||||||
| Unrealized depreciation of forward foreign currency contracts | — | — | — | — | 464 | |||||||||||||||||
| Due to Investment Manager | — | 49,893 | — | — | 13,242 | |||||||||||||||||
| Accrued expenses | 31,798 | 18,053 | 33,910 | 357,279 | 36,725 | |||||||||||||||||
| Total Liabilities |
91,931 | 78,087 | 34,016 | 44,267,423 | 1,212,358 | |||||||||||||||||
| Net Assets | $ | 81,691,747 | $ | 36,816,718 | $ | 4,192,153 | $ | 2,616,311,127 | $ | 24,344,071 | ||||||||||||
| 140 | Semiannual Report | | May 31, 2014 | | See accompanying Notes to Financial Statements |
Table of Contents
| AllianzGI Global Managed Volatility |
AllianzGI Global Water |
AllianzGI High Yield Bond |
AllianzGI International Small-Cap |
AllianzGI Micro Cap |
AllianzGI Multi-Asset Real Return |
AllianzGI NFJ Emerging Markets Value |
||||||||||||||||||||||
| $ | 17,764,110 | $ | 305,047,472 | $ | 441,282,757 | $ | 87,456,994 | $ | 40,708,432 | $ | 2,798,349 | $ | 9,505,514 | |||||||||||||||
| — | 6,867,581 | — | 19,101,311 | 378,484 | 3,353,852 | — | ||||||||||||||||||||||
| 225,000 | 15,757,000 | 19,808,000 | 2,070,000 | 419,000 | — | — | ||||||||||||||||||||||
| 64 | 448 | 143 | 620 | 972 | 67,690 | 58,957 | ||||||||||||||||||||||
| 3,450 | 487,614 | — | 447,530 | — | 817 | 231,919 | ||||||||||||||||||||||
|
|
— |
|
— | — | — | — | — | — | ||||||||||||||||||||
|
|
63,833 |
|
693,412 | 7,985,159 | 287,033 | 4,753 | 6,685 | 35,894 | ||||||||||||||||||||
| — | — | 635,254 | 342,491 | 578,797 | — | 319,955 | ||||||||||||||||||||||
| — | — | — | — | — | 11,509 | — | ||||||||||||||||||||||
| — | 1,978,719 | 679,800 | 39,901 | 114,774 | — | — | ||||||||||||||||||||||
| 15,373 | — | — | — | — | 20,394 | 17,920 | ||||||||||||||||||||||
| — | — | — | — | — | — | — | ||||||||||||||||||||||
| 7,943 | 257,129 | — | 75,351 | — | 87 | — | ||||||||||||||||||||||
| — | 42,903 | — | — | 1,862 | — | — | ||||||||||||||||||||||
|
|
— |
|
— | — | — | — | 12,431 | — | ||||||||||||||||||||
| 26,024 | 22,434 | 24,997 | 19,750 | 17,722 | 26,341 | 23,851 | ||||||||||||||||||||||
| 18,105,797 | 331,154,712 | 470,416,110 | 109,840,981 | 42,224,796 | 6,298,155 | 10,194,010 | ||||||||||||||||||||||
| 4 | — | 7,467,720 | 61,960 | 254,270 | — | 270,947 | ||||||||||||||||||||||
| 2,651 | 266,728 | 2,916,056 | 13,349 | 79,571 | — | 70,330 | ||||||||||||||||||||||
| — | — | — | — | — | — | — | ||||||||||||||||||||||
|
|
— |
|
— | — | — | — | — | — | ||||||||||||||||||||
| — | 264,556 | 185,317 | 57,836 | 32,719 | — | — | ||||||||||||||||||||||
| 116 | 44,607 | 23,990 | 656 | — | 58 | 27 | ||||||||||||||||||||||
| 79 | 50,747 | 33,858 | 1,575 | 843 | 48 | 325 | ||||||||||||||||||||||
|
|
— |
|
— | — | — | — | — | — | ||||||||||||||||||||
| — | — | — | — | — | — | — | ||||||||||||||||||||||
| 51,246 | 167,559 | 127,917 | 206,945 | 54,923 | 43,068 | 52,803 | ||||||||||||||||||||||
| 54,096 | 794,197 | 10,754,858 | 342,321 | 422,326 | 43,174 | 394,432 | ||||||||||||||||||||||
| $ | 18,051,701 | $ | 330,360,515 | $ | 459,661,252 | $ | 109,498,660 | $ | 41,802,470 | $ | 6,254,981 | $ | 9,799,578 | |||||||||||||||
| See accompanying Notes to Financial Statements | | May 31, 2014 | | Semiannual Report | 141 |
Table of Contents
Statements of Assets and Liabilities (cont’d)
May 31, 2014 (Unaudited)
| AllianzGI Behavioral Advantage Large Cap |
AllianzGI Best Styles Global Equity Fund |
AllianzGI China Equity |
AllianzGI Convertible |
AllianzGI Global Fundamental Strategy |
||||||||||||||||||
| Net Assets Consist of: | ||||||||||||||||||||||
| Paid-in-capital | $ | 68,247,301 | $ | 34,204,591 | $ | 4,210,025 | $ | 2,115,308,105 | $ | 22,802,394 | ||||||||||||
| Undistributed (dividends in excess of) net investment income | 399,501 | 473,189 | (8,733 | ) | 7,719,170 | 130,201 | ||||||||||||||||
| Accumulated net realized gain (loss) | 3,470,789 | 191,599 | (48,199 | ) | 122,284,049 | 166,464 | ||||||||||||||||
| Net unrealized appreciation | 9,574,156 | 1,947,339 | 39,060 | 370,999,803 | 1,245,012 | |||||||||||||||||
| Net Assets | $ | 81,691,747 | $ | 36,816,718 | $ | 4,192,153 | $ | 2,616,311,127 | $ | 24,344,071 | ||||||||||||
| Cost of Investments | $ | 71,748,886 | $ | 33,517,401 | $ | 3,540,267 | $ | 2,208,633,616 | $ | 21,429,552 | ||||||||||||
| Cost of Investments in Affiliates | $ | — | $ | 138,257 | $ | 436,366 | $ | — | $ | — | ||||||||||||
| Cost of Repurchase Agreements | $ | — | $ | 465,000 | $ | — | $ | 37,807,000 | $ | 2,465,000 | ||||||||||||
| Cost of Foreign Currency | $ | — | $ | 23,451 | $ | 1,227 | $ | — | $ | 12,316 | ||||||||||||
| Net Assets: | ||||||||||||||||||||||
| Class A | $ | 9,701,530 | $ | — | $ | 128,831 | $ | 483,918,061 | $ | 10,852 | ||||||||||||
| Class C | 385,837 | — | 32,948 | 135,599,355 | 10,777 | |||||||||||||||||
| Class D | 303,403 | — | 201,497 | 118,535,411 | 2,094,078 | |||||||||||||||||
| Class R | — | — | — | 1,295,344 | — | |||||||||||||||||
| Class P | 18,018 | — | 12,418 | 221,327,312 | 10,867 | |||||||||||||||||
| Institutional Class | 71,282,959 | — | 3,816,459 | 1,651,273,276 | 22,217,497 | |||||||||||||||||
| Administrative Class | — | — | — | 4,362,368 | — | |||||||||||||||||
| Class R6 | — | 36,816,718 | — | — | — | |||||||||||||||||
| Shares Issued and Outstanding: | ||||||||||||||||||||||
| Class A | 407,305 | — | 8,233 | 13,305,619 | 675 | |||||||||||||||||
| Class C | 16,463 | — | 2,114 | 3,726,817 | 672 | |||||||||||||||||
| Class D | 12,757 | — | 12,816 | 3,262,367 | 130,164 | |||||||||||||||||
| Class R | — | — | — | 35,670 | — | |||||||||||||||||
| Class P | 752 | — | 783 | 6,096,866 | 675 | |||||||||||||||||
| Institutional Class | 2,978,591 | — | 244,813 | 45,539,784 | 1,379,324 | |||||||||||||||||
| Administrative Class | — | — | — | 120,134 | — | |||||||||||||||||
| Class R6 | — | 2,297,484 | — | — | — | |||||||||||||||||
| Net Asset Value and Redemption Price Per Share:* |
||||||||||||||||||||||
| Class A | $ | 23.82 | $ | — | $ | 15.65 | $ | 36.37 | $ | 16.09 | ||||||||||||
| Class C | 23.44 | — | 15.59 | 36.38 | 16.04 | |||||||||||||||||
| Class D | 23.78 | — | 15.72 | 36.33 | 16.09 | |||||||||||||||||
| Class R | — | — | — | 36.31 | — | |||||||||||||||||
| Class P | 23.96 | — | 15.86 | 36.30 | 16.10 | |||||||||||||||||
| Institutional Class | 23.93 | — | 15.59 | 36.26 | 16.11 | |||||||||||||||||
| Administrative Class | — | — | — | 36.31 | — | |||||||||||||||||
| Class R6 | — | 16.02 | — | — | — | |||||||||||||||||
| * | Net asset value and redemption price per share may not recalculate exactly due to rounding. |
| 142 | Semiannual Report | | May 31, 2014 | | See accompanying Notes to Financial Statements |
Table of Contents
| AllianzGI Global Managed Volatility |
AllianzGI Global Water |
AllianzGI High Yield Bond |
AllianzGI International Small-Cap |
AllianzGI Micro Cap |
AllianzGI Multi-Asset Real Return |
AllianzGI NFJ Emerging Markets Value |
||||||||||||||||||||||
| $ | 15,509,177 | $ | 289,627,065 | $ | 442,590,037 | $ | 81,886,454 | $ | 32,486,451 | $ | 5,825,506 | $ | 9,381,781 | |||||||||||||||
|
|
135,317 |
|
1,068,991 | (2,577,346 | ) | 450,610 | (682,766 | ) | (8,785 | ) | 74,170 | |||||||||||||||||
| 801,244 | (13,439,762 | ) | (1,869,738 | ) | 8,511,701 | (3,712,214 | ) | (30,419 | ) | 55,450 | ||||||||||||||||||
| 1,605,963 | 53,104,221 | 21,518,299 | 18,649,895 | 13,710,999 | 468,679 | 288,177 | ||||||||||||||||||||||
| $ | 18,051,701 | $ | 330,360,515 | $ | 459,661,252 | $ | 109,498,660 | $ | 41,802,470 | $ | 6,254,981 | $ | 9,799,578 | |||||||||||||||
| $ | 16,158,272 | $ | 252,747,322 | $ | 419,764,458 | $ | 73,632,273 | $ | 27,241,317 | $ | 2,729,287 | $ | 9,215,739 | |||||||||||||||
| $ | — | $ | 6,064,842 | $ | — | $ | 14,280,487 | $ | 134,600 | $ | 2,966,589 | $ | — | |||||||||||||||
| $ | 225,000 | $ | 15,757,000 | $ | 19,808,000 | $ | 2,070,000 | $ | 419,000 | $ | — | $ | — | |||||||||||||||
| $ | 3,450 | $ | 486,612 | $ | — | $ | 445,331 | $ | — | $ | 819 | $ | 231,272 | |||||||||||||||
| $ | 156,650 | $ | 151,277,261 | $ | 59,167,350 | $ | 5,003,489 | $ | 4,150,824 | $ | 116,889 | $ | 28,685 | |||||||||||||||
| 183,329 | 72,004,515 | 26,054,911 | 1,064,198 | — | 112,116 | 43,236 | ||||||||||||||||||||||
| 122,062 | 22,310,798 | 74,880,304 | 1,451,779 | — | 29,748 | 1,496,439 | ||||||||||||||||||||||
| — | — | 3,007,130 | 81,259 | — | — | — | ||||||||||||||||||||||
| 13,326 | 60,880,843 | 86,750,807 | 30,725,956 | 2,133,202 | 10,979 | 10,859 | ||||||||||||||||||||||
| 17,576,334 | 23,887,098 | 174,619,893 | 71,171,979 | 35,518,444 | 5,985,249 | 8,220,359 | ||||||||||||||||||||||
| — | — | 35,180,857 | — | — | — | — | ||||||||||||||||||||||
| — | — | — | — | — | — | — | ||||||||||||||||||||||
| 8,700 | 11,439,382 | 5,712,526 | 126,764 | 275,252 | 7,250 | 1,815 | ||||||||||||||||||||||
| 10,404 | 5,590,033 | 2,519,599 | 27,203 | — | 7,010 | 2,752 | ||||||||||||||||||||||
| 6,783 | 1,692,361 | 7,448,434 | 36,070 | — | 1,842 | 94,465 | ||||||||||||||||||||||
| — | — | 299,661 | 2,067 | — | — | — | ||||||||||||||||||||||
| 736 | 4,575,878 | 8,647,084 | 783,687 | 141,213 | 679 | 685 | ||||||||||||||||||||||
| 971,300 | 1,821,863 | 17,356,084 | 1,767,535 | 2,340,244 | 370,309 | 518,467 | ||||||||||||||||||||||
| — | — | 3,511,556 | — | — | — | — | ||||||||||||||||||||||
| — | — | — | — | — | — | — | ||||||||||||||||||||||
| $ | 18.01 | $ | 13.22 | $ | 10.36 | $ | 39.47 | $ | 15.08 | $ | 16.12 | $ | 15.80 | |||||||||||||||
| 17.62 | 12.88 | 10.34 | 39.12 | — | 15.99 | 15.71 | ||||||||||||||||||||||
| 18.00 | 13.18 | 10.05 | 40.25 | — | 16.15 | 15.84 | ||||||||||||||||||||||
| — | — | 10.04 | 39.32 | — | — | — | ||||||||||||||||||||||
| 18.11 | 13.30 | 10.03 | 39.21 | 15.11 | 16.16 | 15.84 | ||||||||||||||||||||||
| 18.10 | 13.11 | 10.06 | 40.27 | 15.18 | 16.16 | 15.86 | ||||||||||||||||||||||
| — | — | 10.02 | — | — | — | — | ||||||||||||||||||||||
| — | — | — | — | — | — | — | ||||||||||||||||||||||
| See accompanying Notes to Financial Statements | | May 31, 2014 | | Semiannual Report | 143 |
Table of Contents
Statements of Assets and Liabilities (cont’d)
May 31, 2014 (Unaudited)
| AllianzGI NFJ Global Dividend Value |
AllianzGI NFJ International Small-Cap Value |
AllianzGI NFJ International Value II |
AllianzGI Short Duration High Income |
AllianzGI Structured Return |
||||||||||||||||||
| Assets: | ||||||||||||||||||||||
| Investments, at value | $ | 72,759,728 | $ | 21,317,364 | $ | 30,460,579 | $ | 710,232,357 | $ | 13,038,293 | ||||||||||||
| Investments in Affiliates, at value | — | 125,417 | — | — | — | |||||||||||||||||
| Repurchase agreements, at value | 1,170,000 | — | 3,620,000 | 15,596,000 | 3,638,000 | |||||||||||||||||
| Cash | 351 | 31,465 | 797 | 171,261 | 300 | |||||||||||||||||
| Foreign currency, at value | 209,053 | 134,640 | 34,014 | — | — | |||||||||||||||||
| Dividends and interest receivable (net of foreign taxes) | 467,941 | 105,072 | 163,879 | 10,941,615 | — | |||||||||||||||||
| Receivable for investments sold | — | — | 6,492 | 8,585,195 | — | |||||||||||||||||
| Deposits with brokers for derivatives collateral | — | — | — | — | 164,030 | |||||||||||||||||
| Receivable for Fund shares sold | 45,666 | 30,731 | 10,000 | 2,567,233 | 6,916 | |||||||||||||||||
| Receivable from Investment Manager | — | 5,854 | 75 | — | 49,569 | |||||||||||||||||
| Tax reclaims receivable | 9,607 | 13,435 | 13,878 | — | — | |||||||||||||||||
| Prepaid expenses | 39,722 | 71,030 | 17,017 | 43,837 | 14,934 | |||||||||||||||||
| Total Assets |
74,702,068 | 21,835,008 | 34,326,731 | 748,137,498 | 16,912,042 | |||||||||||||||||
| Liabilities: | ||||||||||||||||||||||
| Payable for investments purchased | — | — | 3,041,311 | 21,641,263 | — | |||||||||||||||||
| Payable for Fund shares redeemed | 8,437 | 21,595 | — | 1,488,485 | 44,921 | |||||||||||||||||
| Options written, at value | — | — | — | — | 48,354 | |||||||||||||||||
| Investment management fees payable | 32,118 | — | — | 303,915 | — | |||||||||||||||||
| Distribution fees payable | 3,724 | 750 | 30 | 17,558 | 69 | |||||||||||||||||
| Servicing fees payable | 3,911 | 1,117 | 37 | 67,727 | 758 | |||||||||||||||||
| Accrued expenses | 52,398 | 51,261 | 28,801 | 157,880 | 11,198 | |||||||||||||||||
| Total Liabilities |
100,588 | 74,723 | 3,070,179 | 23,676,828 | 105,300 | |||||||||||||||||
| Net Assets | $ | 74,601,480 | $ | 21,760,285 | $ | 31,256,552 | $ | 724,460,670 | $ | 16,806,742 | ||||||||||||
| Net Assets Consist of: | ||||||||||||||||||||||
| Paid-in-capital | $ | 62,104,341 | $ | 18,295,784 | $ | 28,616,155 | $ | 723,836,374 | $ | 16,468,959 | ||||||||||||
| Undistributed (dividends in excess of) net investment income | 962,161 | 181,559 | 326,421 | (4,829,594 | ) | (112,759 | ) | |||||||||||||||
| Accumulated net realized gain (loss) | 4,098,666 | 941,143 | 223,507 | (623,272 | ) | 234,864 | ||||||||||||||||
| Net unrealized appreciation | 7,436,312 | 2,341,799 | 2,090,469 | 6,077,162 | 215,678 | |||||||||||||||||
| Net Assets | $ | 74,601,480 | $ | 21,760,285 | $ | 31,256,552 | $ | 724,460,670 | $ | 16,806,742 | ||||||||||||
| Cost of Investments | $ | 65,320,557 | $ | 19,017,591 | $ | 28,370,765 | $ | 704,155,195 | $ | 13,168,437 | ||||||||||||
| Cost of Investments in Affiliates | $ | — | $ | 83,836 | $ | — | $ | — | $ | — | ||||||||||||
| Cost of Repurchase Agreements | $ | 1,170,000 | $ | — | $ | 3,620,000 | $ | 15,596,000 | $ | 3,638,000 | ||||||||||||
| Cost of Foreign Currency | $ | 211,687 | $ | 134,302 | $ | 34,000 | $ | — | $ | — | ||||||||||||
| Premiums Received for Options Written | $ | — | $ | — | $ | — | $ | — | $ | 394,176 | ||||||||||||
| 144 | Semiannual Report | | May 31, 2014 | | See accompanying Notes to Financial Statements |
Table of Contents
| AllianzGI Ultra Micro Cap |
AllianzGI U.S. Equity Hedged |
AllianzGI U.S. Small-Cap Growth |
||||||||||
| $ | 132,808,429 | $ | 7,377,738 | $ | 34,688,086 | |||||||
| — | — | 360,506 | ||||||||||
| 642,000 | 402,000 | 702,000 | ||||||||||
| 772 | 732 | 114 | ||||||||||
| — | — | — | ||||||||||
| |
28,950 |
|
14,776 | 11,601 | ||||||||
| 763,579 | 19,724 | 362,819 | ||||||||||
| |
— |
|
2,773 | — | ||||||||
| 86,878 | — | 39,514 | ||||||||||
| — | 17,634 | — | ||||||||||
| — | 10 | — | ||||||||||
| 14,302 | 14,961 | 33,448 | ||||||||||
| 134,344,910 | 7,850,348 | 36,198,088 | ||||||||||
| 618,808 | — | — | ||||||||||
| 248,527 | — | 20,661 | ||||||||||
| — | 19,760 | — | ||||||||||
| 186,753 | — | 8,226 | ||||||||||
| — | 110 | 416 | ||||||||||
| 15,850 | 426 | 1,275 | ||||||||||
| 27,272 | 68,500 | 23,366 | ||||||||||
| 1,097,210 | 88,796 | 53,944 | ||||||||||
| $ | 133,247,700 | $ | 7,761,552 | $ | 36,144,144 | |||||||
| $ | 110,704,907 | $ | 6,879,866 | $ | 23,808,266 | |||||||
| |
(1,973,989 |
) |
27,126 | (274,039 | ) | |||||||
| (2,049,586 | ) | (538,013 | ) | 2,894,725 | ||||||||
| 26,566,368 | 1,392,573 | 9,715,192 | ||||||||||
| $ | 133,247,700 | $ | 7,761,552 | $ | 36,144,144 | |||||||
| $ | 106,242,061 | $ | 5,985,029 | $ | 25,137,422 | |||||||
| $ | — | $ | — | $ | 195,978 | |||||||
| $ | 642,000 | $ | 402,000 | $ | 702,000 | |||||||
| $ | — | $ | — | $ | — | |||||||
| $ | — | $ | 19,624 | $ | — | |||||||
| See accompanying Notes to Financial Statements | | May 31, 2014 | | Semiannual Report | 145 |
Table of Contents
Statements of Assets and Liabilities (cont’d)
May 31, 2014 (Unaudited)
| AllianzGI NFJ Global Dividend Value |
AllianzGI NFJ International Small-Cap Value |
AllianzGI NFJ International Value II |
AllianzGI Short Duration High Income |
AllianzGI Structured Return |
||||||||||||||||||
| Net Assets: | ||||||||||||||||||||||
| Class A | $ | 11,877,386 | $ | 2,759,021 | $ | 106,520 | $ | 207,334,490 | $ | 2,260,987 | ||||||||||||
| Class C | 5,932,697 | 1,224,451 | 48,353 | 84,328,784 | 117,396 | |||||||||||||||||
| Class D | 837,719 | 1,108,647 | 14,030 | 37,432,463 | 1,159,694 | |||||||||||||||||
| Class R | — | — | — | — | — | |||||||||||||||||
| Class P | 1,909,707 | 23,593 | 24,034 | 166,996,062 | 61,596 | |||||||||||||||||
| Institutional Class | 54,043,971 | 16,644,573 | 31,063,615 | 228,368,871 | 13,207,069 | |||||||||||||||||
| Shares Issued and Outstanding: | ||||||||||||||||||||||
| Class A | 536,649 | 123,534 | 5,541 | 13,020,305 | 146,713 | |||||||||||||||||
| Class C | 271,369 | 55,265 | 2,535 | 5,305,980 | 7,712 | |||||||||||||||||
| Class D | 37,474 | 49,480 | 729 | 2,351,205 | 75,150 | |||||||||||||||||
| Class R | — | — | — | — | — | |||||||||||||||||
| Class P | 85,788 | 1,041 | 1,246 | 10,491,596 | 3,989 | |||||||||||||||||
| Institutional Class | 2,453,450 | 738,334 | 1,610,005 | 14,328,687 | 853,925 | |||||||||||||||||
| Net Asset Value and Redemption Price Per Share:* | ||||||||||||||||||||||
| Class A | $ | 22.13 | $ | 22.33 | $ | 19.22 | $ | 15.92 | $ | 15.41 | ||||||||||||
| Class C | 21.86 | 22.16 | 19.07 | 15.89 | 15.22 | |||||||||||||||||
| Class D | 22.35 | 22.41 | 19.24 | 15.92 | 15.43 | |||||||||||||||||
| Class R | — | — | — | — | — | |||||||||||||||||
| Class P | 22.26 | 22.66 | 19.29 | 15.92 | 15.44 | |||||||||||||||||
| Institutional Class | 22.03 | 22.54 | 19.29 | 15.94 | 15.47 | |||||||||||||||||
| * | Net asset value and redemption price per share may not recalculate exactly due to rounding. |
| 146 | Semiannual Report | | May 31, 2014 | | See accompanying Notes to Financial Statements |
Table of Contents
| AllianzGI Ultra Micro Cap |
AllianzGI U.S. Equity Hedged |
AllianzGI U.S. Small-Cap Growth |
||||||||||
| $ | 74,572,330 | $ | 1,541,666 | $ | 5,348,595 | |||||||
| — | 175,215 | 653,225 | ||||||||||
| — | 317,060 | 94,839 | ||||||||||
| — | — | 26,208 | ||||||||||
| 1,436,930 | 12,045 | 149,499 | ||||||||||
| 57,238,440 | 5,715,566 | 29,871,778 | ||||||||||
| 3,128,333 | 87,504 | 302,541 | ||||||||||
| — | 10,068 | 37,957 | ||||||||||
| — | 17,907 | 5,357 | ||||||||||
| — | — | 1,494 | ||||||||||
| 60,098 | 678 | 8,374 | ||||||||||
| 2,385,992 | 322,260 | 1,667,296 | ||||||||||
| $ | 23.84 | $ | 17.62 | $ | 17.68 | |||||||
| — | 17.40 | 17.21 | ||||||||||
| — | 17.71 | 17.70 | ||||||||||
| — | — | 17.55 | ||||||||||
| 23.91 | 17.75 | 17.85 | ||||||||||
| 23.99 | 17.74 | 17.92 | ||||||||||
| See accompanying Notes to Financial Statements | | May 31, 2014 | | Semiannual Report | 147 |
Table of Contents
Six Months ended May 31, 2014 (Unaudited)
| AllianzGI Retirement 2015 |
AllianzGI Retirement 2020 |
AllianzGI Retirement 2025 |
AllianzGI Retirement 2030 |
AllianzGI Retirement 2035 |
||||||||||||||||||
| Investment Income: | ||||||||||||||||||||||
| Dividends from investments in Affiliates | $ | 330,840 | $ | 541,428 | $ | 596,539 | $ | 693,123 | $ | 521,385 | ||||||||||||
| Dividends | 30,792 | 48,265 | 50,350 | 52,459 | 39,540 | |||||||||||||||||
| Contribution from Investment Manager (see Note 6) | — | — | — | 2,557 | 1,615 | |||||||||||||||||
| Total Investment Income |
361,632 | 589,693 | 646,889 | 748,139 | 562,540 | |||||||||||||||||
| Expenses: | ||||||||||||||||||||||
| Investment management | 7,021 | 11,487 | 12,578 | 13,375 | 10,460 | |||||||||||||||||
| Administration | 24,670 | 45,793 | 52,031 | 50,605 | 39,041 | |||||||||||||||||
| Distribution — Class B | — | — | — | — | — | |||||||||||||||||
| Distribution — Class C | 5,175 | 1,660 | — | 2,733 | — | |||||||||||||||||
| Distribution — Class R | 240 | 1,290 | 1,365 | 1,558 | 1,248 | |||||||||||||||||
| Administrative servicing — Class P | — | — | — | — | — | |||||||||||||||||
| Servicing — Class A | 11,289 | 23,047 | 27,742 | 22,708 | 16,930 | |||||||||||||||||
| Servicing — Class B | — | — | — | — | — | |||||||||||||||||
| Servicing — Class C | 1,725 | 553 | — | 911 | — | |||||||||||||||||
| Servicing — Class D | 207 | 387 | — | 818 | — | |||||||||||||||||
| Servicing — Class R | 240 | 1,290 | 1,365 | 1,558 | 1,248 | |||||||||||||||||
| Distribution and/or servicing — Administrative Class | 4,563 | 9,071 | 13,608 | 11,027 | 13,279 | |||||||||||||||||
| Sub-transfer agent — Class A | — | — | — | — | — | |||||||||||||||||
| Sub-transfer agent — Class B | — | — | — | — | — | |||||||||||||||||
| Sub-transfer agent — Class C | — | — | — | — | — | |||||||||||||||||
| Sub-transfer agent — Class D | — | — | — | — | — | |||||||||||||||||
| Sub-transfer agent — Class R | — | — | — | — | — | |||||||||||||||||
| Sub-transfer agent — Institutional Class | — | — | — | — | — | |||||||||||||||||
| Excise tax | — | — | — | — | — | |||||||||||||||||
| Trustees | — | — | — | — | — | |||||||||||||||||
| Custodian and accounting agent | — | — | — | — | — | |||||||||||||||||
| Shareholder communications | — | — | — | — | — | |||||||||||||||||
| Transfer agent | — | — | — | — | — | |||||||||||||||||
| Legal | — | — | — | — | — | |||||||||||||||||
| Insurance | — | — | — | — | — | |||||||||||||||||
| Audit and tax services | — | — | — | — | — | |||||||||||||||||
| Registration | — | — | — | — | — | |||||||||||||||||
| Miscellaneous | — | — | — | — | — | |||||||||||||||||
| Total Expenses |
55,130 | 94,578 | 108,689 | 105,293 | 82,206 | |||||||||||||||||
| Less: Fee Waiver/Reimbursement from Investment Manager |
(19,248 | ) | (32,415 | ) | (36,253 | ) | (47,015 | ) | (36,538 | ) | ||||||||||||
| Net Expenses |
35,882 | 62,163 | 72,436 | 58,278 | 45,668 | |||||||||||||||||
| Net Investment Income | 325,750 | 527,530 | 574,453 | 689,861 | 516,872 | |||||||||||||||||
| 148 | Semiannual Report | | May 31, 2014 | | See accompanying Notes to Financial Statements |
Table of Contents
| AllianzGI Retirement 2040 |
AllianzGI Retirement 2045 |
AllianzGI Retirement 2050 |
AllianzGI Retirement 2055 |
AllianzGI Retirement Income |
AllianzGI Global Allocation |
AllianzGI Global Growth Allocation |
||||||||||||||||||||||
| $ | 475,110 | $ | 234,466 | $ | 199,356 | $ | 70,090 | $ | 353,352 | $ | 2,991,510 | $ | 82,679 | |||||||||||||||
| 31,986 | 16,514 | 15,618 | 5,535 | 32,727 | 229,369 | 8,431 | ||||||||||||||||||||||
| 2,922 | 1,746 | 4,058 | 2,239 | 600 | — | — | ||||||||||||||||||||||
| 510,018 | 252,726 | 219,032 | 77,864 | 386,679 | 3,220,879 | 91,110 | ||||||||||||||||||||||
| 9,388 | 5,108 | 4,357 | 1,466 | 7,544 | 907,496 | 27,980 | ||||||||||||||||||||||
| 33,799 | 18,812 | 11,403 | 2,571 | 26,122 | — | — | ||||||||||||||||||||||
| — | — | — | — | — | 9,228 | — | ||||||||||||||||||||||
| 1,243 | — | 474 | — | 15,646 | 249,736 | 5,180 | ||||||||||||||||||||||
| 1,546 | 476 | 656 | 105 | 203 | 21 | 157 | ||||||||||||||||||||||
| — | — | — | — | — | 1,029 | 21 | ||||||||||||||||||||||
| 15,287 | 9,495 | 3,515 | 579 | 7,298 | 86,846 | 1,641 | ||||||||||||||||||||||
| — | — | — | — | — | 3,076 | — | ||||||||||||||||||||||
| 414 | — | 158 | — | 5,215 | 83,245 | 1,727 | ||||||||||||||||||||||
| 266 | — | 404 | — | 1,308 | 1,783 | 427 | ||||||||||||||||||||||
| 1,546 | 476 | 656 | 105 | 203 | 21 | 157 | ||||||||||||||||||||||
| 6,397 | 2,011 | 1,508 | 310 | 2,718 | 31 | 25 | ||||||||||||||||||||||
| — | — | — | — | — | 41,632 | 231 | ||||||||||||||||||||||
| — | — | — | — | — | 4,191 | — | ||||||||||||||||||||||
| — | — | — | — | — | 24,507 | 160 | ||||||||||||||||||||||
| — | — | — | — | — | 673 | 214 | ||||||||||||||||||||||
| — | — | — | — | — | — | 17 | ||||||||||||||||||||||
| — | — | — | — | — | 38,223 | 13 | ||||||||||||||||||||||
| — | — | — | — | 1,281 | — | — | ||||||||||||||||||||||
| — | — | — | — | — | 13,591 | 524 | ||||||||||||||||||||||
| — | — | — | — | — | 25,069 | 29,965 | ||||||||||||||||||||||
| — | — | — | — | — | 16,223 | 6,810 | ||||||||||||||||||||||
| — | — | — | — | — | 34,370 | 4,853 | ||||||||||||||||||||||
| — | — | — | — | — | 15,715 | 6,729 | ||||||||||||||||||||||
| — | — | — | — | — | 6,267 | 3,361 | ||||||||||||||||||||||
| — | — | — | — | — | 18,607 | 14,256 | ||||||||||||||||||||||
| — | — | — | — | — | 47,086 | 38,134 | ||||||||||||||||||||||
| — | — | — | — | — | 2,911 | 2,992 | ||||||||||||||||||||||
| 69,886 | 36,378 | 23,131 | 5,136 | 67,538 | 1,631,577 | 145,574 | ||||||||||||||||||||||
|
|
(33,402 |
) |
(19,421 | ) | (13,969 | ) | (3,858 | ) | (22,510 | ) | (1,041,229 | ) | (131,452 | ) | ||||||||||||||
| 36,484 | 16,957 | 9,162 | 1,278 | 45,028 | 590,348 | 14,122 | ||||||||||||||||||||||
| 473,534 | 235,769 | 209,870 | 76,586 | 341,651 | 2,630,531 | 76,988 | ||||||||||||||||||||||
| See accompanying Notes to Financial Statements | | May 31, 2014 | | Semiannual Report | 149 |
Table of Contents
Statements of Operations (cont’d)
Six Months ended May 31, 2014 (Unaudited)
| AllianzGI Retirement 2015 |
AllianzGI Retirement 2020 |
AllianzGI Retirement 2025 |
AllianzGI Retirement 2030 |
AllianzGI Retirement 2035 |
||||||||||||||||||
| Realized and Change in Unrealized Gain (Loss): | ||||||||||||||||||||||
| Net realized gain (loss) on: | ||||||||||||||||||||||
| Investments |
$ | 4,943 | $ | 4,453 | $ | 6,665 | $ | 13,925 | $ | 7,557 | ||||||||||||
| Investments in Affiliates |
246,417 | 52,154 | (205,290 | ) | 285,005 | 108,411 | ||||||||||||||||
| Net capital gain distributions received from underlying funds | 2,889 | 4,248 | 3,864 | 4,581 | 3,032 | |||||||||||||||||
| Net capital gain distributions received from underlying Affiliated funds | 111,474 | 189,927 | 243,090 | 330,608 | 292,363 | |||||||||||||||||
| Net change in unrealized appreciation/depreciation of: | ||||||||||||||||||||||
| Investments |
124,606 | 245,299 | 328,337 | 361,635 | 324,804 | |||||||||||||||||
| Investments in Affiliates |
426,072 | 1,148,165 | 1,647,947 | 1,165,183 | 1,173,833 | |||||||||||||||||
| Net Realized and Change in Unrealized Gain | 916,401 | 1,644,246 | 2,024,613 | 2,160,937 | 1,910,000 | |||||||||||||||||
| Net Increase in Net Assets Resulting from Investment Operations | $ | 1,242,151 | $ | 2,171,776 | $ | 2,599,066 | $ | 2,850,798 | $ | 2,426,872 | ||||||||||||
| 150 | Semiannual Report | | May 31, 2014 | | See accompanying Notes to Financial Statements |
Table of Contents
| AllianzGI Retirement 2040 |
AllianzGI Retirement 2045 |
AllianzGI Retirement 2050 |
AllianzGI Retirement 2055 |
AllianzGI Retirement Income |
AllianzGI Global Allocation |
AllianzGI Global Growth Allocation |
||||||||||||||||||||||
| $ | 595 | $ | 774 | $ | 5,547 | $ | 8,831 | $ | 1,246 | $ | 42,180 | $ | 27,558 | |||||||||||||||
| 421,406 | 29,653 | 308,927 | 52,427 | 325,234 | 6,657,460 | 346,239 | ||||||||||||||||||||||
|
|
2,606 |
|
1,267 | 1,614 | 610 | 3,475 | 22,692 | 1,598 | ||||||||||||||||||||
|
|
300,911 |
|
173,758 | 164,810 | 58,385 | 124,698 | 1,861,747 | 63,306 | ||||||||||||||||||||
| 308,864 | 179,650 | 137,587 | 37,183 | 137,500 | 1,126,244 | 20,698 | ||||||||||||||||||||||
| 786,321 | 726,340 | 280,632 | 127,194 | 307,079 | (2,623,746 | ) | (211,182 | ) | ||||||||||||||||||||
| 1,820,703 | 1,111,442 | 899,117 | 284,630 | 899,232 | 7,086,577 | 248,217 | ||||||||||||||||||||||
| $ |
2,294,237 |
|
$ | 1,347,211 | $ | 1,108,987 | $ | 361,216 | $ | 1,240,883 | $ | 9,717,108 | $ | 325,205 | ||||||||||||||
| See accompanying Notes to Financial Statements | | May 31, 2014 | | Semiannual Report | 151 |
Table of Contents
Statements of Operations (cont’d)
Period or Six Months ended May 31, 2014 (Unaudited)
| AllianzGI Behavioral Advantage Large Cap |
AllianzGI Best Styles Global Equity Fund (1) |
AllianzGI China Equity |
AllianzGI Convertible |
AllianzGI Global Fundamental Strategy |
||||||||||||||||||
| Investment Income: | ||||||||||||||||||||||
| Interest, net of foreign withholding taxes* | $ | — | $ | — | $ | — | $ | 18,216,312 | $ | 184,578 | ||||||||||||
| Dividends, net of foreign withholding taxes* | 666,524 | 532,408 | 25,313 | 9,796,522 | 167,447 | |||||||||||||||||
| Dividends from investments in Affiliates | — | 1,327 | 7,315 | — | — | |||||||||||||||||
| Miscellaneous | 2 | — | — | — | — | |||||||||||||||||
| Total Investment Income |
666,526 | 533,735 | 32,628 | 28,012,834 | 352,025 | |||||||||||||||||
| Expenses: | ||||||||||||||||||||||
| Investment management | 143,962 | 44,541 | 23,268 | 7,326,289 | 81,342 | |||||||||||||||||
| Distribution — Class C | 1,261 | — | 184 | 486,868 | 39 | |||||||||||||||||
| Distribution — Class R | — | — | — | 1,270 | — | |||||||||||||||||
| Administrative servicing — Class P | 9 | — | 6 | 120,863 | — | |||||||||||||||||
| Servicing — Class A | 11,459 | — | 160 | 498,798 | 13 | |||||||||||||||||
| Servicing — Class C | 420 | — | 61 | 162,289 | 13 | |||||||||||||||||
| Servicing — Class D | 280 | — | 264 | 163,966 | 584 | |||||||||||||||||
| Servicing — Class R | — | — | — | 1,270 | — | |||||||||||||||||
| Distribution and/or servicing — Administrative Class | — | — | — | 13,461 | — | |||||||||||||||||
| Sub-transfer agent — Class A | 223 | — | 83 | 95,691 | — | |||||||||||||||||
| Sub-transfer agent — Class C | 40 | — | 19 | 32,469 | — | |||||||||||||||||
| Sub-transfer agent — Class D | 311 | — | 5,658 | 53,054 | — | |||||||||||||||||
| Sub-transfer agent — Class R | — | — | — | 583 | — | |||||||||||||||||
| Sub-transfer agent — Institutional Class | 72 | — | 20 | 49,097 | 2 | |||||||||||||||||
| Sub-transfer agent — Administrative Class | — | — | — | 204 | — | |||||||||||||||||
| Legal | 6,358 | 6,094 | 5,256 | 71,985 | 4,155 | |||||||||||||||||
| Trustees | 3,616 | 2,061 | 307 | 150,364 | 1,373 | |||||||||||||||||
| Audit and tax services | 13,099 | 15,876 | 13,077 | 33,782 | 16,251 | |||||||||||||||||
| Registration | 42,194 | 4,278 | 24,432 | 262,790 | 20,160 | |||||||||||||||||
| Custodian and accounting agent | 49,193 | 82,686 | 44,579 | 118,186 | 41,313 | |||||||||||||||||
| Shareholder communications | 7,838 | 11,840 | 6,153 | 63,093 | 2,804 | |||||||||||||||||
| Transfer agent | 4,576 | 3,828 | 2,815 | 58,682 | 2,548 | |||||||||||||||||
| Organizational | — | 30,000 | — | — | — | |||||||||||||||||
| Offering | — | 64,206 | — | — | 77,746 | |||||||||||||||||
| Excise tax | — | 1,158 | — | — | — | |||||||||||||||||
| Recoupment expense | — | — | — | 4,802 | — | |||||||||||||||||
| Insurance | 3,892 | — | 3,115 | 28,414 | 3,145 | |||||||||||||||||
| Miscellaneous | 2,180 | 2,222 | 2,119 | 6,994 | 1,360 | |||||||||||||||||
| Total Expenses |
290,983 | 268,790 | 131,576 | 9,805,264 | 252,848 | |||||||||||||||||
| Less: Fee Waiver/Reimbursement from Investment Manager |
(78,506 | ) | (208,244 | ) | (100,127 | ) | — | (143,666 | ) | |||||||||||||
| Net Expenses |
212,477 | 60,546 | 31,449 | 9,805,264 | 109,182 | |||||||||||||||||
| Net Investment Income (Loss) | 454,049 | 473,189 | 1,179 | 18,207,570 | 242,843 | |||||||||||||||||
| (1) | Commencement of operations December 2, 2013. |
| 152 | Semiannual Report | | May 31, 2014 | | See accompanying Notes to Financial Statements |
Table of Contents
| AllianzGI Global Managed Volatility |
AllianzGI Global Water |
AllianzGI High Yield Bond |
AllianzGI International Small-Cap |
AllianzGI Micro Cap |
AllianzGI Multi-Asset Real Return |
AllianzGI NFJ Emerging Markets Value |
||||||||||||||||||||||
| $ | — | $ | — | $ | 15,709,084 | $ | — | $ | — | $ | 10,660 | $ | — | |||||||||||||||
| 235,247 | 3,296,610 | — | 843,453 | 72,937 | 30,761 | 170,230 | ||||||||||||||||||||||
| — | 105,541 | — | 229,209 | 4,138 | 10,980 | — | ||||||||||||||||||||||
| 1 | — | 46,013 | — | — | — | 846 | ||||||||||||||||||||||
| 235,248 | 3,402,151 | 15,755,097 | 1,072,662 | 77,075 | 52,401 | 171,076 | ||||||||||||||||||||||
| 33,232 | 1,363,813 | 1,068,200 | 538,529 | 276,681 | 21,650 | 42,899 | ||||||||||||||||||||||
| 676 | 231,230 | 99,756 | 3,239 | — | 313 | 135 | ||||||||||||||||||||||
| — | — | 3,688 | 57 | — | — | — | ||||||||||||||||||||||
| 6 | 25,546 | 40,081 | 16,146 | 1,201 | — | — | ||||||||||||||||||||||
| 150 | 165,656 | 73,600 | 6,025 | 3,455 | 76 | 25 | ||||||||||||||||||||||
| 225 | 77,076 | 33,252 | 1,080 | — | 104 | 45 | ||||||||||||||||||||||
| 65 | 24,583 | 101,399 | 1,214 | — | 19 | 1,650 | ||||||||||||||||||||||
| — | — | 3,688 | 57 | — | — | — | ||||||||||||||||||||||
| |
— |
|
— | 42,292 | — | — | — | — | ||||||||||||||||||||
| 56 | 48,266 | 16,631 | 2,074 | 215 | 10 | 1 | ||||||||||||||||||||||
| 18 | 24,888 | 8,025 | 26 | — | 8 | — | ||||||||||||||||||||||
| 67 | 7,847 | 43,091 | 17 | — | 5,250 | 4,540 | ||||||||||||||||||||||
| — | — | 2,019 | 7 | — | — | — | ||||||||||||||||||||||
| 15 | 1,226 | 9,565 | 4,439 | 17,474 | 4 | 341 | ||||||||||||||||||||||
| — | — | 3,060 | — | — | — | — | ||||||||||||||||||||||
| 5,156 | 10,526 | 19,359 | 7,326 | 4,887 | 16,005 | 3,830 | ||||||||||||||||||||||
| 1,093 | 15,601 | 29,020 | 7,440 | 2,858 | 391 | 526 | ||||||||||||||||||||||
| 16,251 | 22,926 | 23,699 | 17,942 | 16,448 | 14,755 | 16,250 | ||||||||||||||||||||||
| 32,159 | 54,927 | 112,241 | 60,998 | 23,680 | 32,345 | 30,436 | ||||||||||||||||||||||
| 68,849 | 76,241 | 45,355 | 128,242 | 34,933 | 44,226 | 86,122 | ||||||||||||||||||||||
| 7,134 | 19,503 | 19,472 | 8,338 | 7,099 | 8,327 | 7,897 | ||||||||||||||||||||||
| 3,343 | 12,442 | 21,650 | 9,152 | 4,749 | 2,344 | 2,407 | ||||||||||||||||||||||
| — | — | — | — | — | — | — | ||||||||||||||||||||||
| — | — | — | — | — | 6,226 | 3,794 | ||||||||||||||||||||||
| — | — | 46,272 | — | — | — | 65 | ||||||||||||||||||||||
| — | 24,577 | 28,707 | 90 | — | — | — | ||||||||||||||||||||||
| 3,356 | 6,057 | 7,995 | 4,835 | 3,388 | 3,162 | 3,177 | ||||||||||||||||||||||
| 2,441 | 2,662 | 3,538 | 3,152 | 2,130 | 2,369 | 2,750 | ||||||||||||||||||||||
| 174,292 | 2,215,593 | 1,905,655 | 820,425 | 399,198 | 157,584 | 206,890 | ||||||||||||||||||||||
|
|
(123,177 |
) |
— | (508 | ) | (144,040 | ) | (55,597 | ) | (139,747 | ) | (149,198 | ) | |||||||||||||||
| 51,115 | 2,215,593 | 1,905,147 | 676,385 | 343,601 | 17,837 | 57,692 | ||||||||||||||||||||||
| 184,133 | 1,186,558 | 13,849,950 | 396,277 | (266,526 | ) | 34,564 | 113,384 | |||||||||||||||||||||
| See accompanying Notes to Financial Statements | | May 31, 2014 | | Semiannual Report | 153 |
Table of Contents
Statements of Operations (cont’d)
Period or Six Months ended May 31, 2014 (Unaudited)
| AllianzGI Behavioral Advantage Large Cap |
AllianzGI Best Styles Global Equity Fund (1) |
AllianzGI China Equity |
AllianzGI Convertible |
AllianzGI Global Fundamental Strategy |
||||||||||||||||||
| Realized and Change in Unrealized Gain (Loss): | ||||||||||||||||||||||
| Net realized gain (loss) on: | ||||||||||||||||||||||
| Investments |
$ | 3,455,359 | $ | 107,037 | $ | 61,390 | $ | 96,085,731 | $ | 151,156 | ||||||||||||
| Investments in Affiliates |
— | (3,744 | ) | 144,059 | — | — | ||||||||||||||||
| Futures contracts |
— | 91,663 | — | — | (8,361 | ) | ||||||||||||||||
| Options written |
— | — | — | — | 35,097 | |||||||||||||||||
| Foreign currency transactions |
— | (3,357 | ) | (18 | ) | — | (14,771 | ) | ||||||||||||||
| Payments from Affiliates (See Note 13) | — | — | — | 475,282 | — | |||||||||||||||||
| Net capital gain distributions received from underlying Affiliated funds | — | — | — | — | — | |||||||||||||||||
| Net change in unrealized appreciation/depreciation of: | ||||||||||||||||||||||
| Investments |
59,273 | 1,902,846 | (286,588 | ) | 63,683,510 | 789,415 | ||||||||||||||||
| Investments in Affiliates |
— | 6,378 | (216,309 | ) | — | — | ||||||||||||||||
| Futures contracts |
— | 38,446 | — | — | (39,099 | ) | ||||||||||||||||
| Options written |
— | — | — | — | 12,316 | |||||||||||||||||
| Foreign currency transactions |
— | (331 | ) | (4 | ) | — | 12,690 | |||||||||||||||
| Net Realized and Change in Unrealized Gain (Loss) | 3,514,632 | 2,138,938 | (297,470 | ) | 160,244,523 | 938,443 | ||||||||||||||||
| Net Increase (Decrease) in Net Assets Resulting from Investment Operations | 3,968,681 | 2,612,127 | $ | (296,291 | ) | $ | 178,452,093 | $ | 1,181,286 | |||||||||||||
| * Foreign withholding taxes | 312 | 32,578 | 1,273 | — | 20,217 | |||||||||||||||||
| (1) | Commencement of operations, December 2, 2013 |
| 154 | Semiannual Report | | May 31, 2014 | | See accompanying Notes to Financial Statements |
Table of Contents
| AllianzGI Global Managed Volatility |
AllianzGI Global Water |
AllianzGI High Yield Bond |
AllianzGI International Small-Cap |
AllianzGI Micro Cap |
AllianzGI Multi-Asset Real Return |
AllianzGI NFJ Emerging Markets Value |
||||||||||||||||||||||
| $ | 666,727 | $ | 6,929,983 | $ | (1,945,327 | ) | $ | 4,942,493 | $ | 2,283,339 | $ | (39,269 | ) | $ | 221,502 | |||||||||||||
| — | — | — | 2,274,291 | 155,127 | 440 | — | ||||||||||||||||||||||
| — | — | — | — | — | (4,572 | ) | — | |||||||||||||||||||||
| — | — | — | — | — | — | — | ||||||||||||||||||||||
| (2,977 | ) | (69,588 | ) | — | (63,874 | ) | — | (4 | ) | (6,264 | ) | |||||||||||||||||
| — | — | 174,513 | — | — | — | — | ||||||||||||||||||||||
|
|
— |
|
— | — | — | — | 18,182 | — | ||||||||||||||||||||
| 209,349 | 12,141,843 | 6,314,622 | (4,350,028 | ) | (2,383,868 | ) | 182,888 | 105,565 | ||||||||||||||||||||
| — | (1,347,250 | ) | — | (1,310,657 | ) | 36,589 | 221,152 | — | ||||||||||||||||||||
| — | — | — | — | — | (1,330 | ) | — | |||||||||||||||||||||
| — | — | — | — | — | — | — | ||||||||||||||||||||||
| 268 | (12,392 | ) | — | 5,443 | — | (48 | ) | 1,553 | ||||||||||||||||||||
| |
873,367 |
|
17,642,596 | 4,543,808 | 1,497,668 | 91,187 | 377,439 | 322,356 | ||||||||||||||||||||
| $ |
1,057,500 |
|
$ | 18,829,154 | $ | 18,393,758 | $ | 1,893,945 | $ | (175,339 | ) | $ | 412,003 | $ | 435,740 | |||||||||||||
| 13,232 | 322,502 | — | 97,317 | 816 | 1,680 | 20,130 | ||||||||||||||||||||||
| See accompanying Notes to Financial Statements | | May 31, 2014 | | Semiannual Report | 155 |
Table of Contents
Statements of Operations (cont’d)
Six Months ended May 31, 2014 (Unaudited)
| AllianzGI NFJ Global Dividend Value |
AllianzGI NFJ International Small-Cap Value |
AllianzGI NFJ International Value II |
AllianzGI Short Duration High Income |
AllianzGI Structured Return |
||||||||||||||||||
| Investment Income: | ||||||||||||||||||||||
| Interest | $ | 1 | $ | — | $ | — | $ | 14,547,634 | $ | 3,094 | ||||||||||||
| Dividends, net of foreign withholding taxes* | 1,657,709 | 346,730 | 598,401 | — | — | |||||||||||||||||
| Dividends from investments in Affiliates | — | 1,619 | — | — | — | |||||||||||||||||
| Miscellaneous | — | — | — | 600,338 | — | |||||||||||||||||
| Total Investment Income |
1,657,710 | 348,349 | 598,401 | 15,147,972 | 3,094 | |||||||||||||||||
| Expenses: | ||||||||||||||||||||||
| Investment management | 288,116 | 91,875 | 72,293 | 1,519,228 | 84,517 | |||||||||||||||||
| Distribution — Class C | 21,605 | 3,531 | 175 | 90,808 | 413 | |||||||||||||||||
| Distribution — Class R | — | — | — | — | — | |||||||||||||||||
| Administrative servicing — Class P | 908 | — | 7 | 71,817 | — | |||||||||||||||||
| Servicing — Class A | 13,863 | 3,134 | 131 | 226,689 | 2,053 | |||||||||||||||||
| Servicing — Class C | 7,202 | 1,177 | 58 | 90,808 | 137 | |||||||||||||||||
| Servicing — Class D | 969 | 1,272 | 16 | 32,241 | 1,641 | |||||||||||||||||
| Servicing — Class R | — | — | — | — | — | |||||||||||||||||
| Sub-transfer agent — Class A | 1,614 | 104 | 15 | 29,395 | 349 | |||||||||||||||||
| Sub-transfer agent — Class C | 1,444 | 173 | 17 | 12,489 | 22 | |||||||||||||||||
| Sub-transfer agent — Class D | 22 | 4,834 | — | 15,616 | 5,109 | |||||||||||||||||
| Sub-transfer agent — Class R | — | — | — | — | — | |||||||||||||||||
| Sub-transfer agent — Institutional Class | 1,354 | 183 | — | 9,440 | 168 | |||||||||||||||||
| Legal | 5,815 | 4,986 | 2,284 | 20,641 | 51,529 | |||||||||||||||||
| Trustees | 4,888 | 811 | 352 | 34,335 | 756 | |||||||||||||||||
| Audit and tax services | 16,251 | 13,952 | 17,499 | 17,262 | 15,905 | |||||||||||||||||
| Registration | 23,422 | 26,673 | 22,984 | 98,431 | 21,986 | |||||||||||||||||
| Custodian and accounting agent | 55,401 | 78,671 | 48,721 | 48,486 | 65,948 | |||||||||||||||||
| Shareholder communications | 8,590 | 5,694 | 6,742 | 27,082 | 6,488 | |||||||||||||||||
| Transfer agent | 7,393 | 3,338 | 2,462 | 30,712 | 2,439 | |||||||||||||||||
| Offering | — | — | — | — | 795 | |||||||||||||||||
| Recoupment expense | — | — | — | 36,771 | — | |||||||||||||||||
| Insurance | 4,275 | 3,245 | 3,116 | 9,486 | 3,231 | |||||||||||||||||
| Miscellaneous | 2,463 | 2,516 | 2,176 | 1,756 | 3,481 | |||||||||||||||||
| Total Expenses |
465,595 | 246,169 | 179,048 | 2,423,493 | 266,967 | |||||||||||||||||
| Less: Fee Waiver/Reimbursement from Investment Manager |
(77,496 | ) | (120,955 | ) | (92,814 | ) | (17,531 | ) | (151,114 | ) | ||||||||||||
| Net Expenses |
388,099 | 125,214 | 86,234 | 2,405,962 | 115,853 | |||||||||||||||||
| Net Investment Income (Loss) | 1,269,611 | 223,135 | 512,167 | 12,742,010 | (112,759 | ) | ||||||||||||||||
| 156 | Semiannual Report | | May 31, 2014 | | See accompanying Notes to Financial Statements |
Table of Contents
| AllianzGI Ultra |
AllianzGI U.S. Equity Hedged |
AllianzGI U.S. Small-Cap Growth |
||||||||||
| $ | — | $ | — | $ | — | |||||||
| 288,717 | 72,113 | 63,629 | ||||||||||
| — | — | 2,602 | ||||||||||
| — | — | — | ||||||||||
| 288,717 | 72,113 | 66,231 | ||||||||||
| 1,097,943 | 26,163 | 167,290 | ||||||||||
| — | 634 | 2,393 | ||||||||||
| — | — | 32 | ||||||||||
| 690 | — | 64 | ||||||||||
| 97,533 | 1,842 | 6,610 | ||||||||||
| — | 211 | 798 | ||||||||||
| — | 365 | 111 | ||||||||||
| — | — | 32 | ||||||||||
| 13,736 | 267 | 142 | ||||||||||
| — | 31 | 79 | ||||||||||
| — | 5,076 | 7 | ||||||||||
| — | — | 3 | ||||||||||
| 3,658 | 30 | 928 | ||||||||||
| 9,830 | 6,280 | 5,957 | ||||||||||
| 6,620 | 483 | 2,443 | ||||||||||
| 16,450 | 13,881 | 13,453 | ||||||||||
| 44,200 | 21,855 | 42,284 | ||||||||||
| 45,661 | 78,237 | 44,159 | ||||||||||
| 13,059 | 6,098 | 6,845 | ||||||||||
| 7,383 | 2,435 | 6,498 | ||||||||||
| — | 782 | — | ||||||||||
| 147,056 | — | — | ||||||||||
| 4,137 | 3,144 | 3,711 | ||||||||||
| 2,368 | 2,552 | 2,618 | ||||||||||
| 1,510,324 | 170,366 | 306,457 | ||||||||||
| — | (129,968 | ) | (79,160 | ) | ||||||||
| 1,510,324 | 40,398 | 227,297 | ||||||||||
| (1,221,607 | ) | 31,715 | (161,066 | ) | ||||||||
| See accompanying Notes to Financial Statements | | May 31, 2014 | | Semiannual Report | 157 |
Table of Contents
Statements of Operations (cont’d)
Six Months ended May 31, 2014 (Unaudited)
| AllianzGI NFJ Global Dividend Value |
AllianzGI NFJ International Small-Cap Value |
AllianzGI NFJ International Value II |
AllianzGI Short Duration High Income |
AllianzGI Structured Return |
||||||||||||||||||
| Realized and Change in Unrealized Gain (Loss): | ||||||||||||||||||||||
| Net realized gain (loss) on: | ||||||||||||||||||||||
| Investments |
$ | 2,871,587 | $ | 863,281 | $ | 203,215 | $ | 2,387,723 | $ | (1,032,654 | ) | |||||||||||
| Investments in Affiliates |
— | — | — | — | — | |||||||||||||||||
| Options written |
— | — | — | — | 1,314,585 | |||||||||||||||||
| Foreign currency transactions |
5,831 | (2,187 | ) | 6,931 | — | — | ||||||||||||||||
| Payments from Affiliates (See Note 13) | — | — | — | — | — | |||||||||||||||||
| Net change in unrealized appreciation/depreciation of: | ||||||||||||||||||||||
| Investments |
(795,321 | ) | 683,360 | 1,331,686 | 269,288 | (102,741 | ) | |||||||||||||||
| Investments in Affiliates |
— | 6,305 | — | — | — | |||||||||||||||||
| Options written |
— | — | — | — | 231,360 | |||||||||||||||||
| Foreign currency transactions |
(3,792 | ) | 1,473 | 560 | — | — | ||||||||||||||||
| Net Realized and Change in Unrealized Gain (Loss) | 2,078,305 | 1,552,232 | 1,542,392 | 2,657,011 | 410,550 | |||||||||||||||||
| Net Increase (Decrease) in Net Assets Resulting from Investment Operations | $ | 3,347,916 | $ | 1,775,367 | $ | 2,054,559 | $ | 15,399,021 | $ | 297,791 | ||||||||||||
| * Foreign withholding taxes | 95,387 | 27,575 | 43,695 | — | — | |||||||||||||||||
| 158 | Semiannual Report | | May 31, 2014 | | See accompanying Notes to Financial Statements |
Table of Contents
| AllianzGI Ultra Micro Cap |
AllianzGI U.S. Equity Hedged |
AllianzGI U.S. Small-Cap Growth |
||||||||||
| $ | (1,964,388 | ) | $ | (221,986 | ) | $ | 1,809,509 | |||||
| — | — | 6,173 | ||||||||||
| — | 8,302 | — | ||||||||||
| — | — | — | ||||||||||
| — | 317 | — | ||||||||||
| (697,852 | ) | 513,071 | (2,035,098 | ) | ||||||||
| — | — | 90,612 | ||||||||||
| — | (758 | ) | — | |||||||||
| — | — | — | ||||||||||
| (2,662,240 | ) | 298,946 | (128,804 | ) | ||||||||
| $ | (3,883,847 | ) | $ | 330,661 | $ | (289,870 | ) | |||||
| — | — | 125 | ||||||||||
| See accompanying Notes to Financial Statements | | May 31, 2014 | | Semiannual Report | 159 |
Table of Contents
Statements of Changes in Net Assets
| AllianzGI Retirement 2015 | AllianzGI Retirement 2020 | |||||||||||||||||
| Six Months ended May 31, 2014 (Unaudited) |
Year ended November 30, 2013 |
Six Months ended May 31, 2014 (Unaudited) |
Year ended November 30, 2013 |
|||||||||||||||
| Increase in Net Assets from: | ||||||||||||||||||
| Investment Operations: |
||||||||||||||||||
| Net investment income | $ | 325,750 | $ | 550,150 | $ | 527,530 | $ | 741,668 | ||||||||||
| Net realized gain (loss) | 365,723 | (35,747 | ) | 250,782 | (330,343 | ) | ||||||||||||
| Net change in unrealized appreciation/depreciation | 550,678 | 71,953 | 1,393,464 | 542,205 | ||||||||||||||
| Net increase in net assets resulting from investment operations |
1,242,151 | 586,356 | 2,171,776 | 953,530 | ||||||||||||||
| Dividends and Distributions to Shareholders from: | ||||||||||||||||||
| Net investment income: | ||||||||||||||||||
| Class A |
(202,351 | ) | (151,229 | ) | (376,596 | ) | (216,157 | ) | ||||||||||
| Class C |
(14,041 | ) | (38,226 | ) | (4,276 | ) | (2,686 | ) | ||||||||||
| Class D |
(2,326 | ) | (36,338 | ) | (5,007 | ) | (6,077 | ) | ||||||||||
| Class R |
(1,465 | ) | (13,152 | ) | (14,740 | ) | (22,640 | ) | ||||||||||
| Class P |
(84,782 | ) | (110,299 | ) | (154,714 | ) | (124,213 | ) | ||||||||||
| Class R6 |
(178,596 | ) | (219,816 | ) | (160,647 | ) | (176,616 | ) | ||||||||||
| Administrative Class |
(73,602 | ) | (397 | ) | (138,300 | ) | (3,255 | ) | ||||||||||
| Net realized capital gains: | ||||||||||||||||||
| Class A |
— | — | — | (20,593 | ) | |||||||||||||
| Class C |
— | — | — | (926 | ) | |||||||||||||
| Class D |
— | — | — | (647 | ) | |||||||||||||
| Class R |
— | — | — | (2,281 | ) | |||||||||||||
| Class P |
— | — | — | (12,116 | ) | |||||||||||||
| Class R6 |
— | — | — | (16,558 | ) | |||||||||||||
| Administrative Class |
— | — | — | (1,258 | ) | |||||||||||||
| Total dividends and distributions to shareholders | (557,163 | ) | (569,457 | ) | (854,280 | ) | (606,023 | ) | ||||||||||
| Fund Share Transactions: | ||||||||||||||||||
| Net proceeds from the sale of shares | 15,324,020 | 14,415,003 | 20,304,848 | 27,968,920 | ||||||||||||||
| Issued in reinvestment of dividends and distributions | 556,498 | 563,101 | 854,232 | 606,023 | ||||||||||||||
| Cost of shares redeemed | (9,573,278 | ) | (10,695,386 | ) | (5,509,387 | ) | (11,330,116 | ) | ||||||||||
| Net increase from Fund share transactions | 6,307,240 | 4,282,718 | 15,649,693 | 17,244,827 | ||||||||||||||
| Total increase in net assets | 6,992,228 | 4,299,617 | 16,967,189 | 17,592,334 | ||||||||||||||
| Net Assets: | ||||||||||||||||||
| Beginning of period | 22,008,961 | 17,709,344 | 33,191,470 | 15,599,136 | ||||||||||||||
| End of period* | $ | 29,001,189 | $ | 22,008,961 | $ | 50,158,659 | $ | 33,191,470 | ||||||||||
| * Including undistributed net investment income of: |
$ | 180,430 | $ | 208,894 | $ | 273,370 | $ | 600,120 | ||||||||||
| 160 | Semiannual Report | | May 31, 2014 | | See accompanying Notes to Financial Statements |
Table of Contents
| AllianzGI Retirement 2025 | AllianzGI Retirement 2030 | AllianzGI Retirement 2035 | ||||||||||||||||||||||
| Six Months ended May 31, 2014 (Unaudited) |
Year ended November 30, 2013 |
Six Months ended May 31, 2014 (Unaudited) |
Year ended November 30, 2013 |
Six Months ended May 31, 2014 (Unaudited) |
Year ended November 30, 2013 |
|||||||||||||||||||
| $ | 574,453 | $ | 665,521 | $ | 689,861 | $ | 870,675 | $ | 516,872 | $ | 535,740 | |||||||||||||
| 48,329 | (416,905 | ) | 634,119 | (136,941 | ) | 411,363 | (178,620 | ) | ||||||||||||||||
| 1,976,284 | 786,392 | 1,526,818 | 1,586,487 | 1,498,637 | 1,557,091 | |||||||||||||||||||
| 2,599,066 | 1,035,008 | 2,850,798 | 2,320,221 | 2,426,872 | 1,914,211 | |||||||||||||||||||
| (426,739 | ) | (236,114 | ) | (428,196 | ) | (221,948 | ) | (300,338 | ) | (101,742 | ) | |||||||||||||
| — | — | (10,033 | ) | (10,874 | ) | — | — | |||||||||||||||||
| — | — | (13,222 | ) | (10,072 | ) | — | — | |||||||||||||||||
| (18,248 | ) | (21,077 | ) | (21,599 | ) | (29,886 | ) | (16,445 | ) | (19,990 | ) | |||||||||||||
| (80,183 | ) | (92,938 | ) | (184,881 | ) | (144,236 | ) | (113,126 | ) | (102,453 | ) | |||||||||||||
| (108,975 | ) | (106,062 | ) | (258,616 | ) | (263,982 | ) | (137,282 | ) | (127,515 | ) | |||||||||||||
| (200,811 | ) | (233 | ) | (200,325 | ) | (420 | ) | (224,389 | ) | (260 | ) | |||||||||||||
| — | (24,277 | ) | — | (16,870 | ) | — | (13,242 | ) | ||||||||||||||||
| — | — | — | (1,227 | ) | — | — | ||||||||||||||||||
| — | — | — | (845 | ) | — | — | ||||||||||||||||||
| — | (2,419 | ) | — | (2,202 | ) | — | (2,812 | ) | ||||||||||||||||
| — | (9,853 | ) | — | (10,688 | ) | — | (13,606 | ) | ||||||||||||||||
| — | (11,103 | ) | — | (19,278 | ) | — | (16,780 | ) | ||||||||||||||||
| — | (904 | ) | — | (562 | ) | — | (1,181 | ) | ||||||||||||||||
| (834,956 | ) | (504,980 | ) | (1,116,872 | ) | (733,090 | ) | (791,580 | ) | (399,581 | ) | |||||||||||||
| 26,830,617 | 28,907,362 | 25,365,464 | 27,480,286 | 20,803,207 | 20,515,998 | |||||||||||||||||||
| 829,681 | 496,764 | 1,113,004 | 730,493 | 788,966 | 396,954 | |||||||||||||||||||
| (5,594,929 | ) | (7,000,861 | ) | (8,425,540 | ) | (16,818,734 | ) | (3,048,242 | ) | (3,148,704 | ) | |||||||||||||
| 22,065,369 | 22,403,265 | 18,052,928 | 11,392,045 | 18,543,931 | 17,764,248 | |||||||||||||||||||
| 23,829,479 | 22,933,293 | 19,786,854 | 12,979,176 | 20,179,223 | 19,278,878 | |||||||||||||||||||
| 33,811,032 | 10,877,739 | 40,199,493 | 27,220,317 | 29,509,695 | 10,230,817 | |||||||||||||||||||
| $ | 57,640,511 | $ | 33,811,032 | $ | 59,986,347 | $ | 40,199,493 | $ | 49,688,918 | $ | 29,509,695 | |||||||||||||
| $ | 269,467 | $ | 529,970 | $ | 264,733 | $ | 691,744 | $ | 159,393 | $ | 434,101 | |||||||||||||
| See accompanying Notes to Financial Statements | | May 31, 2014 | | Semiannual Report | 161 |
Table of Contents
Statements of Changes in Net Assets (cont’d)
| AllianzGI Retirement 2040 | AllianzGI Retirement 2045 | |||||||||||||||||
| Six Months ended May 31, 2014 (Unaudited) |
Year ended November 30, 2013 |
Six Months ended May 31, 2014 (Unaudited) |
Year ended November 30, 2013 |
|||||||||||||||
| Increase (Decrease) in Net Assets from: | ||||||||||||||||||
| Investment Operations: |
||||||||||||||||||
| Net investment income | $ | 473,534 | $ | 547,945 | $ | 235,769 | $ | 261,082 | ||||||||||
| Net realized gain | 725,518 | 90,776 | 205,452 | 74,538 | ||||||||||||||
| Net change in unrealized appreciation/depreciation | 1,095,185 | 1,818,068 | 905,990 | 952,639 | ||||||||||||||
| Net increase in net assets resulting from investment operations |
2,294,237 | 2,456,789 | 1,347,211 | 1,288,259 | ||||||||||||||
| Dividends and Distributions to Shareholders from: | ||||||||||||||||||
| Net investment income: | ||||||||||||||||||
| Class A |
(299,358 | ) | (100,875 | ) | (181,709 | ) | (62,334 | ) | ||||||||||
| Class C |
(4,849 | ) | (4,540 | ) | — | — | ||||||||||||
| Class D |
(4,271 | ) | (5,385 | ) | — | — | ||||||||||||
| Class R |
(22,265 | ) | (22,878 | ) | (6,954 | ) | (7,644 | ) | ||||||||||
| Class P |
(113,845 | ) | (64,785 | ) | (56,921 | ) | (43,843 | ) | ||||||||||
| Class R6 |
(262,190 | ) | (214,057 | ) | (115,794 | ) | (101,568 | ) | ||||||||||
| Administrative Class |
(116,327 | ) | (654 | ) | (36,633 | ) | (308 | ) | ||||||||||
| Net realized capital gains: | ||||||||||||||||||
| Class A |
— | (7,682 | ) | — | (12,389 | ) | ||||||||||||
| Class C |
— | (439 | ) | — | — | |||||||||||||
| Class D |
— | (476 | ) | — | — | |||||||||||||
| Class R |
— | (1,677 | ) | — | (1,606 | ) | ||||||||||||
| Class P |
— | (4,871 | ) | — | (8,687 | ) | ||||||||||||
| Class R6 |
— | (15,947 | ) | — | (19,921 | ) | ||||||||||||
| Administrative Class |
— | (212 | ) | — | (343 | ) | ||||||||||||
| Return of Capital: | ||||||||||||||||||
| Class A |
— | — | — | — | ||||||||||||||
| Class C |
— | — | — | — | ||||||||||||||
| Class D |
— | — | — | — | ||||||||||||||
| Class R |
— | — | — | — | ||||||||||||||
| Class P |
— | — | — | — | ||||||||||||||
| Class R6 |
— | — | — | — | ||||||||||||||
| Administrative Class |
— | — | — | — | ||||||||||||||
| Total dividends and distributions to shareholders | (823,105 | ) | (444,478 | ) | (398,011 | ) | (258,643 | ) | ||||||||||
| Fund Share Transactions: | ||||||||||||||||||
| Net proceeds from the sale of shares | 19,762,687 | 16,759,032 | 11,512,061 | 7,291,721 | ||||||||||||||
| Issued in reinvestment of dividends and distributions | 821,263 | 441,636 | 397,833 | 258,522 | ||||||||||||||
| Cost of shares redeemed | (6,532,761 | ) | (5,635,221 | ) | (1,146,991 | ) | (1,178,869 | ) | ||||||||||
| Net increase (decrease) from Fund share transactions | 14,051,189 | 11,565,447 | 10,762,903 | 6,371,374 | ||||||||||||||
| Total increase (decrease) in net assets | 15,522,321 | 13,577,758 | 11,712,103 | 7,400,990 | ||||||||||||||
| Net Assets: | ||||||||||||||||||
| Beginning of period | 26,922,901 | 13,345,143 | 13,084,055 | 5,683,065 | ||||||||||||||
| End of period* | $ | 42,445,222 | $ | 26,922,901 | $ | 24,796,158 | $ | 13,084,055 | ||||||||||
| * Including undistributed net investment income of: |
$ | 94,710 | $ | 444,281 | $ | 37,897 | $ | 200,139 | ||||||||||
| 162 | Semiannual Report | | May 31, 2014 | | See accompanying Notes to Financial Statements |
Table of Contents
| AllianzGI Retirement 2050 | AllianzGI Retirement 2055 | AllianzGI Retirement Income | ||||||||||||||||||||||
| Six Months ended May 31, 2014 (Unaudited) |
Year ended November 30, 2013 |
Six Months ended May 31, 2014 (Unaudited) |
Year ended November 30, 2013 |
Six Months ended May 31, 2014 (Unaudited) |
Year ended November 30, 2013 |
|||||||||||||||||||
| $ | 209,870 | $ | 274,886 | $ | 76,586 | $ | 114,335 | $ | 341,651 | $ | 744,927 | |||||||||||||
| 480,898 | 168,103 | 120,253 | 96,730 | 454,653 | 311,964 | |||||||||||||||||||
| 418,219 | 1,054,220 | 164,377 | 383,798 | 444,579 | (278,951 | ) | ||||||||||||||||||
| 1,108,987 | 1,497,209 | 361,216 | 594,863 | 1,240,883 | 777,940 | |||||||||||||||||||
| (68,062 | ) | (16,717 | ) | (14,622 | ) | (842 | ) | (43,408 | ) | (179,152 | ) | |||||||||||||
| (2,510 | ) | (1,272 | ) | — | — | (14,168 | ) | (167,944 | ) | |||||||||||||||
| (8,335 | ) | (5,883 | ) | — | — | (6,476 | ) | (52,448 | ) | |||||||||||||||
| (10,670 | ) | (11,240 | ) | (1,766 | ) | (1,333 | ) | (716 | ) | (3,837 | ) | |||||||||||||
| (37,456 | ) | (24,444 | ) | (6,860 | ) | (2,203 | ) | (62,745 | ) | (208,689 | ) | |||||||||||||
| (245,688 | ) | (208,847 | ) | (124,091 | ) | (124,983 | ) | (84,779 | ) | (402,626 | ) | |||||||||||||
| (30,843 | ) | (511 | ) | (6,128 | ) | (386 | ) | (15,482 | ) | (27,354 | ) | |||||||||||||
| — | (1,929 | ) | (1,662 | ) | (448 | ) | — | (23,086 | ) | |||||||||||||||
| — | (214 | ) | — | — | — | (28,517 | ) | |||||||||||||||||
| — | (724 | ) | — | — | — | (7,188 | ) | |||||||||||||||||
| — | (1,290 | ) | (239 | ) | (698 | ) | — | (554 | ) | |||||||||||||||
| — | (2,680 | ) | (765 | ) | (1,113 | ) | — | (24,955 | ) | |||||||||||||||
| — | (22,716 | ) | (13,839 | ) | (59,925 | ) | — | (46,558 | ) | |||||||||||||||
| — | (118 | ) | (712 | ) | (249 | ) | — | (1,013 | ) | |||||||||||||||
| — | — | — | — | — | (7,402 | ) | ||||||||||||||||||
| — | — | — | — | — | (8,593 | ) | ||||||||||||||||||
| — | — | — | — | — | (2,420 | ) | ||||||||||||||||||
| — | — | — | — | — | (205 | ) | ||||||||||||||||||
| — | — | — | — | — | (9,769 | ) | ||||||||||||||||||
| — | — | — | — | — | (15,564 | ) | ||||||||||||||||||
| — | — | — | — | — | (2,004 | ) | ||||||||||||||||||
| (403,564 | ) | (298,585 | ) | (170,684 | ) | (192,180 | ) | (227,774 | ) | (1,219,878 | ) | |||||||||||||
| 8,182,692 | 5,500,024 | 1,535,570 | 908,455 | 9,926,189 | 10,247,332 | |||||||||||||||||||
| 403,508 | 298,585 | 170,684 | 192,180 | 227,712 | 1,202,902 | |||||||||||||||||||
| (2,713,996 | ) | (2,709,799 | ) | (223,711 | ) | (77,253 | ) | (6,838,452 | ) | (14,307,606 | ) | |||||||||||||
| 5,872,204 | 3,088,810 | 1,482,543 | 1,023,382 | 3,315,449 | (2,857,372 | ) | ||||||||||||||||||
| 6,577,627 | 4,287,434 | 1,673,075 | 1,426,065 | 4,328,558 | (3,299,310 | ) | ||||||||||||||||||
| 13,488,957 | 9,201,523 | 5,055,516 | 3,629,451 | 26,322,947 | 29,622,257 | |||||||||||||||||||
| $ | 20,066,584 | $ | 13,488,957 | $ | 6,728,591 | $ | 5,055,516 | $ | 30,651,505 | $ | 26,322,947 | |||||||||||||
| $ | 21,045 | $ | 214,739 | $ | 8,051 | $ | 84,932 | $ | 115,661 | $ | 1,784 | |||||||||||||
| See accompanying Notes to Financial Statements | | May 31, 2014 | | Semiannual Report | 163 |
Table of Contents
Statements of Changes in Net Assets (cont’d)
| AllianzGI Global Allocation |
AllianzGI Global Growth Allocation |
|||||||||||||||||
| Six Months ended May 31, 2014 (Unaudited) |
Year ended November 30, 2013 |
Six Months ended May 31, 2014 (Unaudited) |
Year ended November 30, 2013 |
|||||||||||||||
| Increase (Decrease) in Net Assets from: | ||||||||||||||||||
| Investment Operations: |
||||||||||||||||||
| Net investment income | $ | 2,630,531 | $ | 5,183,796 | $ | 76,988 | $ | 170,061 | ||||||||||
| Net realized gain (loss) | 8,584,079 | 10,540,301 | 438,701 | 832,100 | ||||||||||||||
| Net change in unrealized appreciation/depreciation | (1,497,502 | ) | 7,007,440 | (190,484 | ) | 176,941 | ||||||||||||
| Net increase (decrease) in net assets resulting from investment operations |
9,717,108 | 22,731,537 | 325,205 | 1,179,102 | ||||||||||||||
| Dividends and Distributions to Shareholders from: | ||||||||||||||||||
| Net investment income: | ||||||||||||||||||
| Class A |
(918,926 | ) | (2,664,819 | ) | (39,156 | ) | (23,226 | ) | ||||||||||
| Class B |
(22,362 | ) | (115,538 | ) | — | — | ||||||||||||
| Class C |
(629,790 | ) | (2,114,389 | ) | (30,091 | ) | (28,575 | ) | ||||||||||
| Class D |
(18,801 | ) | (13,156 | ) | (11,558 | ) | (3,362 | ) | ||||||||||
| Class R |
(211 | ) | (563 | ) | (3,379 | ) | (517 | ) | ||||||||||
| Class P |
(29,991 | ) | (55,750 | ) | (1,268 | ) | (513 | ) | ||||||||||
| Institutional Class |
(1,044,588 | ) | (2,475,717 | ) | (99,671 | ) | (156,839 | ) | ||||||||||
| Administrative Class |
(304 | ) | (54,859 | ) | (568 | ) | (487 | ) | ||||||||||
| Net realized capital gains: | ||||||||||||||||||
| Class A |
— | — | (149,637 | ) | (8,641 | ) | ||||||||||||
| Class C |
— | — | (157,668 | ) | (13,353 | ) | ||||||||||||
| Class D |
— | — | (43,047 | ) | (1,183 | ) | ||||||||||||
| Class R |
— | — | (12,794 | ) | (236 | ) | ||||||||||||
| Class P |
— | — | (4,617 | ) | (179 | ) | ||||||||||||
| Institutional Class |
— | — | (363,860 | ) | (50,786 | ) | ||||||||||||
| Administrative Class |
— | — | (2,184 | ) | (171 | ) | ||||||||||||
| Total dividends and distributions to shareholders | (2,664,973 | ) | (7,494,791 | ) | (919,498 | ) | (288,068 | ) | ||||||||||
| Fund Share Transactions: | ||||||||||||||||||
| Net proceeds from the sale of shares | 17,885,007 | 30,248,337 | 592,199 | 1,723,271 | ||||||||||||||
| Issued in reinvestment of dividends and distributions | 2,388,805 | 6,677,559 | 918,399 | 288,068 | ||||||||||||||
| Cost of shares redeemed | (22,651,066 | ) | (45,728,016 | ) | (1,103,432 | ) | (3,525,932 | ) | ||||||||||
| Net increase (decrease) from Fund share transactions | (2,377,254 | ) | (8,802,120 | ) | 407,166 | (1,514,593 | ) | |||||||||||
| Total increase (decrease) in net assets | 4,674,881 | 6,434,626 | (187,127 | ) | (623,559 | ) | ||||||||||||
| Net Assets: | ||||||||||||||||||
| Beginning of period | 213,059,545 | 206,624,919 | 6,679,710 | 7,303,269 | ||||||||||||||
| End of period* | $ | 217,734,426 | $ | 213,059,545 | $ | 6,492,583 | $ | 6,679,710 | ||||||||||
| * Including undistributed (dividends in excess of) net investment income of: |
$ | (34,442 | ) | $ | — | $ | (13,891 | ) | $ | 94,812 | ||||||||
| ** | Commencement of operations. |
| 164 | Semiannual Report | | May 31, 2014 | | See accompanying Notes to Financial Statements |
Table of Contents
| AllianzGI Behavioral Advantage Large Cap |
AllianzGI Best Styles Global Equity Fund |
AllianzGI China Equity | ||||||||||||||||||
| Six Months ended May 31, 2014 (Unaudited) |
Year ended November 30, 2013 |
Period from December 2, 2013** through May 31, 2014 (Unaudited) |
Six Months ended May 31, 2014 (Unaudited) |
Year ended November 30, 2013 |
||||||||||||||||
| $ | 454,049 | $ | 513,865 | $ | 473,189 | $ | 1,179 | $ | 50,999 | |||||||||||
| 3,455,359 | 2,100,176 | 191,599 | 205,431 | (23,662 | ) | |||||||||||||||
| 59,273 | 7,931,802 | 1,947,339 | (502,901 | ) | 599,575 | |||||||||||||||
| |
3,968,681 |
|
10,545,843 | 2,612,127 | (296,291 | ) | 626,912 | |||||||||||||
| (90,468 | ) | (538 | ) | — | (596 | ) | (2,022 | ) | ||||||||||||
| — | — | — | — | — | ||||||||||||||||
| (1,785 | ) | (753 | ) | — | (1 | ) | (1 | ) | ||||||||||||
| (454 | ) | (3,323 | ) | — | (1 | ) | (11,196 | ) | ||||||||||||
| — | — | — | — | — | ||||||||||||||||
| (111 | ) | (187 | ) | — | — | (226 | ) | |||||||||||||
| (412,898 | ) | (298,276 | ) | — | (29,159 | ) | (76,243 | ) | ||||||||||||
| — | — | — | — | — | ||||||||||||||||
| (306,253 | ) | (2,833 | ) | — | — | — | ||||||||||||||
| (8,823 | ) | (3,716 | ) | — | — | — | ||||||||||||||
| (6,512 | ) | (3,966 | ) | — | — | — | ||||||||||||||
| — | — | — | — | — | ||||||||||||||||
| (603 | ) | (733 | ) | — | — | — | ||||||||||||||
| (1,758,815 | ) | (1,029,278 | ) | — | — | — | ||||||||||||||
| — | — | — | — | — | ||||||||||||||||
| (2,586,722 | ) | (1,343,603 | ) | — | (29,757 | ) | (89,688 | ) | ||||||||||||
| 31,969,325 | 34,306,842 | 31,348,406 | 75,254 | 896,237 | ||||||||||||||||
| 2,232,454 | 1,342,737 | — | 29,757 | 89,688 | ||||||||||||||||
| (11,183,827 | ) | (4,876,491 | ) | (2,143,815 | ) | (84,667 | ) | (1,094,747 | ) | |||||||||||
| 23,017,952 | 30,773,088 | 29,204,591 | 20,344 | (108,822 | ) | |||||||||||||||
| 24,399,911 | 39,975,328 | 31,816,718 | (305,704 | ) | 428,402 | |||||||||||||||
| 57,291,836 | 17,316,508 | 5,000,000 | 4,497,857 | 4,069,455 | ||||||||||||||||
| $ | 81,691,747 | $ | 57,291,836 | $ | 36,816,718 | $ | 4,192,153 | $ | 4,497,857 | |||||||||||
| $ |
399,501 |
|
$ | 451,168 | $ | 473,189 | $ | (8,733 | ) | $ | 19,845 | |||||||||
| See accompanying Notes to Financial Statements | | May 31, 2014 | | Semiannual Report | 165 |
Table of Contents
Statements of Changes in Net Assets (cont’d)
| AllianzGI Convertible | AllianzGI Global Fundamental Strategy |
|||||||||||||||||
| Six Months ended May 31, 2014 (Unaudited) |
Year ended |
Six Months ended May 31, 2014 (Unaudited) |
Period from July 1, 2013** through November 30, 2013 |
|||||||||||||||
| Increase (Decrease) in Net Assets from: | ||||||||||||||||||
| Investment Operations: |
||||||||||||||||||
| Net investment income | $ | 18,207,570 | $ | 29,827,103 | $ | 242,843 | $ | 104,947 | ||||||||||
| Net realized gain (loss) | 96,561,013 | 106,379,772 | 163,121 | 51,753 | ||||||||||||||
| Net change in unrealized appreciation/depreciation | 63,683,510 | 213,706,272 | 775,322 | 469,690 | ||||||||||||||
| Net increase in net assets resulting from investment operations |
178,452,093 | 349,913,147 | 1,181,286 | 626,390 | ||||||||||||||
| Dividends and Distributions to Shareholders from: | ||||||||||||||||||
| Net investment income: | ||||||||||||||||||
| Class A |
(5,206,205 | ) | (2,361,786 | ) | (78 | ) | — | |||||||||||
| Class C |
(1,372,489 | ) | (461,374 | ) | (40 | ) | — | |||||||||||
| Class D |
(1,835,823 | ) | (829,104 | ) | (78 | ) | — | |||||||||||
| Class R |
(9,542 | ) | (2,662 | ) | — | — | ||||||||||||
| Class P |
(3,925,258 | ) | (1,432,561 | ) | (86 | ) | — | |||||||||||
| Institutional Class |
(26,509,214 | ) | (19,878,839 | ) | (183,029 | ) | — | |||||||||||
| Administrative Class |
(191,580 | ) | (106,752 | ) | — | — | ||||||||||||
| Net realized capital gains: | ||||||||||||||||||
| Class A |
(4,018,964 | ) | — | (41 | ) | — | ||||||||||||
| Class C |
(1,431,664 | ) | — | (41 | ) | — | ||||||||||||
| Class D |
(1,565,855 | ) | — | (41 | ) | — | ||||||||||||
| Class R |
(4,891 | ) | — | — | — | |||||||||||||
| Class P |
(3,104,927 | ) | — | (41 | ) | — | ||||||||||||
| Institutional Class |
(19,542,203 | ) | — | (82,562 | ) | — | ||||||||||||
| Administrative Class |
(160,290 | ) | — | — | — | |||||||||||||
| Total dividends and distributions to shareholders | (68,878,905 | ) | (25,073,078 | ) | (266,037 | ) | — | |||||||||||
| Fund Share Transactions: | ||||||||||||||||||
| Net proceeds from the sale of shares | 744,092,840 | 1,660,827,670 | 2,475,182 | 56,000 | ||||||||||||||
| Issued in reinvestment of dividends and distributions | 46,018,849 | 15,664,611 | 266,037 | — | ||||||||||||||
| Cost of shares redeemed | (687,159,760 | ) | (625,119,587 | ) | (34,787 | ) | — | |||||||||||
| Net increase (decrease) from Fund share transactions | 102,951,929 | 1,051,372,694 | 2,706,432 | 56,000 | ||||||||||||||
| Total increase (decrease) in net assets | 212,525,117 | 1,376,212,763 | 3,621,681 | 682,390 | ||||||||||||||
| Net Assets: | ||||||||||||||||||
| Beginning of period | 2,403,786,010 | 1,027,573,247 | 20,722,390 | 20,040,000 | ||||||||||||||
| End of period* | $ | 2,616,311,127 | $ | 2,403,786,010 | $ | 24,344,071 | $ | 20,722,390 | ||||||||||
| * Including undistributed (dividends in excess of) net investment income of: |
$ | 7,719,170 | $ | 28,561,711 | $ | 130,201 | $ | 70,669 | ||||||||||
| ** | Commencement of operations. |
| 166 | Semiannual Report | | May 31, 2014 | | See accompanying Notes to Financial Statements |
Table of Contents
| AllianzGI Global Managed Volatility |
AllianzGI Global Water | AllianzGI High Yield Bond | ||||||||||||||||||||||
| Six Months ended May 31, 2014 (Unaudited) |
Year ended |
Six Months ended May 31, 2014 (Unaudited) |
Year ended November 30, 2013 |
Six Months ended May 31, 2014 (Unaudited) |
Year ended November 30, 2013 |
|||||||||||||||||||
| $ | 184,133 | $ | 444,751 | $ | 1,186,558 | $ | 838,937 | $ | 13,849,950 | $ | 25,667,127 | |||||||||||||
| 663,750 | 619,199 | 6,860,395 | 3,254,498 | (1,770,814 | ) | 4,650,471 | ||||||||||||||||||
| 209,617 | 762,994 | 10,782,201 | 30,353,142 | 6,314,622 | 3,318,437 | |||||||||||||||||||
| 1,057,500 | 1,826,944 | 18,829,154 | 34,446,577 | 18,393,758 | 33,636,035 | |||||||||||||||||||
| (3,851 | ) | (1,861 | ) | (269,464 | ) | (679,198 | ) | (1,970,792 | ) | (6,143,161 | ) | |||||||||||||
| (5,765 | ) | (2,023 | ) | (44 | ) | (121,278 | ) | (791,808 | ) | (1,688,305 | ) | |||||||||||||
| (1,625 | ) | (1,690 | ) | (27,063 | ) | (75,427 | ) | (2,832,310 | ) | (4,839,632 | ) | |||||||||||||
| — | — | — | — | (98,356 | ) | (159,730 | ) | |||||||||||||||||
| (427 | ) | (392 | ) | (164,700 | ) | (186,883 | ) | (2,852,785 | ) | (2,457,369 | ) | |||||||||||||
| (539,014 | ) | (55,613 | ) | (175,053 | ) | (56,569 | ) | (5,793,523 | ) | (9,203,696 | ) | |||||||||||||
| — | — | — | — | (1,184,974 | ) | (2,036,554 | ) | |||||||||||||||||
| (2,166 | ) | (493 | ) | — | — | (611,065 | ) | (145,971 | ) | |||||||||||||||
| (3,464 | ) | (468 | ) | — | — | (225,704 | ) | (37,627 | ) | |||||||||||||||
| (1,049 | ) | (385 | ) | — | — | (931,903 | ) | (105,921 | ) | |||||||||||||||
| — | — | — | — | (24,613 | ) | (3,114 | ) | |||||||||||||||||
| (231 | ) | (100 | ) | — | — | (662,779 | ) | (18,364 | ) | |||||||||||||||
| (282,476 | ) | (133,935 | ) | — | — | (1,204,907 | ) | (175,436 | ) | |||||||||||||||
| — | — | — | — | (283,544 | ) | (41,582 | ) | |||||||||||||||||
| (840,068 | ) | (697,477 | ) | (636,324 | ) | (1,119,355 | ) | (19,469,063 | ) | (27,056,462 | ) | |||||||||||||
| 3,326,436 | 3,589,444 | 94,352,525 | 139,501,638 | 130,986,226 | 365,187,121 | |||||||||||||||||||
| 839,874 | 697,477 | 446,287 | 655,954 | 15,429,046 | 20,848,984 | |||||||||||||||||||
| (859,242 | ) | (5,585,663 | ) | (27,150,709 | ) | (40,240,156 | ) | (147,729,318 | ) | (285,089,695 | ) | |||||||||||||
| 3,307,068 | (1,298,742 | ) | 67,648,103 | 99,917,436 | (1,314,046 | ) | 100,946,410 | |||||||||||||||||
| 3,524,500 | (169,275 | ) | 85,840,933 | 133,244,658 | (2,389,351 | ) | 107,525,983 | |||||||||||||||||
| 14,527,201 | 14,696,476 | 244,519,582 | 111,274,924 | 462,050,603 | 354,524,620 | |||||||||||||||||||
| $ | 18,051,701 | $ | 14,527,201 | $ | 330,360,515 | $ | 244,519,582 | $ | 459,661,252 | $ | 462,050,603 | |||||||||||||
| $ |
135,317 |
|
$ | 501,866 | $ | 1,068,991 | $ | 518,757 | $ | (2,577,346 | ) | $ | (902,748 | ) | ||||||||||
| See accompanying Notes to Financial Statements | | May 31, 2014 | | Semiannual Report | 167 |
Table of Contents
Statements of Changes in Net Assets (cont’d)
| AllianzGI International Small-Cap | AllianzGI Micro Cap | |||||||||||||||||
| Six Months ended May 31, 2014 (Unaudited) |
Year ended November 30, 2013 |
Six Months ended May 31, 2014 (Unaudited) |
Year ended November 30, 2013 |
|||||||||||||||
| Increase (Decrease) in Net Assets from: | ||||||||||||||||||
| Investment Operations: |
||||||||||||||||||
| Net investment income (loss) | $ | 396,277 | $ | 485,853 | $ | (266,526 | ) | $ | (393,228 | ) | ||||||||
| Net realized gain (loss) | 7,152,910 | 22,157,689 | 2,438,466 | 5,183,506 | ||||||||||||||
| Net change in unrealized appreciation/depreciation | (5,655,242 | ) | 9,127,239 | (2,347,279 | ) | 9,903,699 | ||||||||||||
| Net increase (decrease) in net assets resulting from investment operations |
1,893,945 | 31,770,781 | (175,339 | ) | 14,693,977 | |||||||||||||
| Dividends and Distributions to Shareholders from: | ||||||||||||||||||
| Net investment income: | ||||||||||||||||||
| Class A |
(52,727 | ) | (5 | ) | — | — | ||||||||||||
| Class C |
(2,372 | ) | (323 | ) | — | — | ||||||||||||
| Class D |
(5,303 | ) | (11 | ) | — | — | ||||||||||||
| Class R |
(338 | ) | (153 | ) | — | — | ||||||||||||
| Class P |
(339,167 | ) | (314,004 | ) | — | — | ||||||||||||
| Institutional Class |
(616,345 | ) | (835,561 | ) | — | — | ||||||||||||
| Administrative Class*** |
(143 | ) | (1 | ) | — | — | ||||||||||||
| Net realized capital gains: | ||||||||||||||||||
| Class A |
(330,077 | ) | — | (55,508 | ) | (13,432 | ) | |||||||||||
| Class C |
(50,491 | ) | — | — | — | |||||||||||||
| Class D |
(23,504 | ) | — | — | — | |||||||||||||
| Class R |
(1,948 | ) | — | — | — | |||||||||||||
| Class P |
(2,400,832 | ) | — | (110,432 | ) | (31,638 | ) | |||||||||||
| Institutional Class |
(4,844,051 | ) | — | (2,112,388 | ) | (2,184,800 | ) | |||||||||||
| Administrative Class*** |
(1,090 | ) | — | — | — | |||||||||||||
| Total dividends and distributions to shareholders | (8,668,388 | ) | (1,150,058 | ) | (2,278,328 | ) | (2,229,870 | ) | ||||||||||
| Fund Share Transactions: | ||||||||||||||||||
| Net proceeds from the sale of shares | 19,750,960 | 38,103,115 | 10,267,702 | 13,526,507 | ||||||||||||||
| Issued in reinvestment of dividends and distributions | 8,355,332 | 1,138,431 | 2,274,870 | 2,215,649 | ||||||||||||||
| Cost of shares redeemed | (22,935,161 | ) | (79,496,990 | ) | (13,256,034 | ) | (11,046,819 | ) | ||||||||||
| Net increase (decrease) from Fund share transactions | 5,171,131 | (40,255,444 | ) | (713,462 | ) | 4,695,337 | ||||||||||||
| Total increase (decrease) in net assets | (1,603,312 | ) | (9,634,721 | ) | (3,167,129 | ) | 17,159,444 | |||||||||||
| Net Assets: | ||||||||||||||||||
| Beginning of period | 111,101,972 | 120,736,693 | 44,969,599 | 27,810,155 | ||||||||||||||
| End of period* | $ | 109,498,660 | $ | 111,101,972 | $ | 41,802,470 | $ | 44,969,599 | ||||||||||
| * Including undistributed (dividends in excess of) net investment income of: |
$ | 450,610 | $ | 1,070,728 | $ | (682,766 | ) | $ | (416,240 | ) | ||||||||
| ** | Commencement of operations. |
| *** | The Administrative Class of AllianzGI International Small-Cap liquidated on May 21, 2014. |
| 168 | Semiannual Report | | May 31, 2014 | | See accompanying Notes to Financial Statements |
Table of Contents
| AllianzGI Multi-Asset Real Return | AllianzGI NFJ Emerging Markets Value | AllianzGI NFJ Global Dividend Value | ||||||||||||||||||||||
| Six Months ended May 31, 2014 (Unaudited) |
Period from December 17, 2012** through November 30, 2013 |
Six Months ended May 31, 2014 (Unaudited) |
Period from December 18, 2012** through November 30, 2013 |
Six Months ended May 31, 2014 (Unaudited) |
Year ended November 30, 2013 |
|||||||||||||||||||
| $ | 34,564 | $ | 59,725 | $ | 113,384 | $ | 149,989 | $ | 1,269,611 | $ | 1,899,401 | |||||||||||||
| (25,223 | ) | 1,210 | 215,238 | (158,705 | ) | 2,877,418 | 3,737,570 | |||||||||||||||||
| 402,662 | 67,838 | 107,118 | 181,059 | (799,113 | ) | 8,506,884 | ||||||||||||||||||
| 412,003 | 128,773 | 435,740 | 172,343 | 3,347,916 | 14,143,855 | |||||||||||||||||||
| (799 | ) | — | (272 | ) | (258 | ) | (145,298 | ) | (198,998 | ) | ||||||||||||||
| (1,271 | ) | — | (315 | ) | (99 | ) | (54,749 | ) | (60,674 | ) | ||||||||||||||
| (164 | ) | — | (15,551 | ) | (4,846 | ) | (9,880 | ) | (11,466 | ) | ||||||||||||||
| — | — | — | — | — | — | |||||||||||||||||||
| (180 | ) | — | (153 | ) | (122 | ) | (25,239 | ) | (29,012 | ) | ||||||||||||||
| (103,079 | ) | — | (95,709 | ) | (73,371 | ) | (761,964 | ) | (1,218,754 | ) | ||||||||||||||
| — | — | — | — | — | — | |||||||||||||||||||
| (51 | ) | — | — | — | (289,188 | ) | (15,289 | ) | ||||||||||||||||
| (93 | ) | — | — | — | (156,211 | ) | (8,154 | ) | ||||||||||||||||
| (12 | ) | — | — | — | (20,067 | ) | (958 | ) | ||||||||||||||||
| — | — | — | — | — | — | |||||||||||||||||||
| (12 | ) | — | — | — | (47,916 | ) | (2,174 | ) | ||||||||||||||||
| (6,240 | ) | — | — | — | (1,403,066 | ) | (86,720 | ) | ||||||||||||||||
| — | — | — | — | — | — | |||||||||||||||||||
| (111,901 | ) | — | (112,000 | ) | (78,696 | ) | (2,913,578 | ) | (1,632,199 | ) | ||||||||||||||
| 592,783 | 137,728 | 2,395,315 | 5,003,054 | 10,489,445 | 22,951,780 | |||||||||||||||||||
| 111,901 | — | 112,000 | 78,696 | 2,650,906 | 1,512,963 | |||||||||||||||||||
| (51,072 | ) | (5,234 | ) | (642,226 | ) | (604,648 | ) | (9,154,601 | ) | (18,882,275 | ) | |||||||||||||
| 653,612 | 132,494 | 1,865,089 | 4,477,102 | 3,985,750 | 5,582,468 | |||||||||||||||||||
| 953,714 | 261,267 | 2,188,829 | 4,570,749 | 4,420,088 | 18,094,124 | |||||||||||||||||||
| 5,301,267 | 5,040,000 | 7,610,749 | 3,040,000 | 70,181,392 | 52,087,268 | |||||||||||||||||||
| $ | 6,254,981 | $ | 5,301,267 | $ | 9,799,578 | $ | 7,610,749 | $ | 74,601,480 | $ | 70,181,392 | |||||||||||||
| $ | (8,785 | ) | $ | 62,144 | $ | 74,170 | $ | 72,786 | $ | 962,161 | $ | 689,680 | ||||||||||||
| See accompanying Notes to Financial Statements | | May 31, 2014 | | Semiannual Report | 169 |
Table of Contents
Statements of Changes in Net Assets (cont’d)
| AllianzGI NFJ International Small-Cap Value |
AllianzGI NFJ International Value II |
|||||||||||||||||
| Six Months ended May 31, 2014 (Unaudited) |
Year ended November 30, 2013 |
Six Months ended May 31, 2014 (Unaudited) |
Year ended November 30, 2013 |
|||||||||||||||
| Increase (Decrease) in Net Assets from: | ||||||||||||||||||
| Investment Operations: |
||||||||||||||||||
| Net investment income (loss) | $ | 223,135 | $ | 184,098 | $ | 512,167 | $ | 85,369 | ||||||||||
| Net realized gain (loss) | 861,094 | 417,518 | 210,146 | 191,143 | ||||||||||||||
| Net change in unrealized appreciation/depreciation | 691,138 | 1,265,550 | 1,332,246 | 468,866 | ||||||||||||||
| Net increase (decrease) in net assets resulting from investment operations |
1,775,367 | 1,867,166 | 2,054,559 | 745,378 | ||||||||||||||
| Dividends and Distributions to Shareholders from: | ||||||||||||||||||
| Net investment income: | ||||||||||||||||||
| Class A |
(28,504 | ) | (20,797 | ) | (1,680 | ) | (668 | ) | ||||||||||
| Class C |
(11,996 | ) | (1,215 | ) | (811 | ) | (115 | ) | ||||||||||
| Class D |
(7,957 | ) | (5,602 | ) | (272 | ) | (136 | ) | ||||||||||
| Class P |
(133 | ) | (128 | ) | (282 | ) | (143 | ) | ||||||||||
| Institutional Class |
(188,554 | ) | (45,319 | ) | (238,666 | ) | (57,743 | ) | ||||||||||
| Net realized capital gains: | ||||||||||||||||||
| Class A |
(40,040 | ) | (5,301 | ) | (2,506 | ) | (70 | ) | ||||||||||
| Class C |
(9,712 | ) | (57 | ) | (1,594 | ) | (16 | ) | ||||||||||
| Class D |
(16,838 | ) | (607 | ) | (442 | ) | (16 | ) | ||||||||||
| Class P |
(251 | ) | (57 | ) | (442 | ) | (16 | ) | ||||||||||
| Institutional Class |
(215,346 | ) | (17,772 | ) | (138,919 | ) | (6,282 | ) | ||||||||||
| Total dividends and distributions to shareholders | (519,331 | ) | (96,855 | ) | (385,614 | ) | (65,205 | ) | ||||||||||
| Fund Share Transactions: | ||||||||||||||||||
| Net proceeds from the sale of shares | 5,945,932 | 11,135,989 | 24,985,131 | 341,684 | ||||||||||||||
| Issued in reinvestment of dividends and distributions | 518,387 | 96,234 | 385,614 | 65,204 | ||||||||||||||
| Cost of shares redeemed | (1,590,890 | ) | (2,078,411 | ) | (101,359 | ) | (1,246,435 | ) | ||||||||||
| Net increase (decrease) from Fund share transactions | 4,873,429 | 9,153,812 | 25,269,386 | (839,547 | ) | |||||||||||||
| Total increase (decrease) in net assets | 6,129,465 | 10,924,123 | 26,938,331 | (159,374 | ) | |||||||||||||
| Net Assets: | ||||||||||||||||||
| Beginning of period | 15,630,820 | 4,706,697 | 4,318,221 | 4,477,595 | ||||||||||||||
| End of period* | $ | 21,760,285 | $ | 15,630,820 | $ | 31,256,552 | $ | 4,318,221 | ||||||||||
| * Including undistributed (dividends in excess of) net investment income of: | $ | 181,559 | $ | 195,568 | $ | 326,421 | $ | 55,965 | ||||||||||
| ** | Commencement of operations. |
| 170 | Semiannual Report | | May 31, 2014 | | See accompanying Notes to Financial Statements |
Table of Contents
| AllianzGI Short Duration High Income |
AllianzGI Structured Return | AllianzGI Ultra Micro Cap | ||||||||||||||||||||||
| Six Months ended May 31, 2014 (Unaudited) |
Year ended November 30, 2013 |
Six Months ended May 31, 2014 (Unaudited) |
Period from December 3, 2012** through November 30, 2013 |
Six Months ended May 31, 2014 (Unaudited) |
Year ended November 30, 2013 |
|||||||||||||||||||
| $ | 12,742,010 | $ | 15,626,920 | $ | (112,759 | ) | $ | (126,988 | ) | $ | (1,221,607 | ) | $ | (716,570 | ) | |||||||||
| 2,387,723 | (1,886,608 | ) | 281,931 | 508,983 | (1,964,388 | ) | 263,637 | |||||||||||||||||
| 269,288 | 3,327,579 | 128,619 | 87,059 | (697,852 | ) | 24,719,725 | ||||||||||||||||||
| 15,399,021 | 17,067,891 | 297,791 | 469,054 | (3,883,847 | ) | 24,266,792 | ||||||||||||||||||
| (4,289,355 | ) | (6,075,369 | ) | — | — | (102 | ) | — | ||||||||||||||||
| (1,645,585 | ) | (2,115,400 | ) | — | — | — | — | |||||||||||||||||
| (621,121 | ) | (739,149 | ) | — | — | — | — | |||||||||||||||||
| (3,569,436 | ) | (4,408,587 | ) | — | — | — | — | |||||||||||||||||
| (5,260,064 | ) | (5,527,917 | ) | — | — | — | — | |||||||||||||||||
| — | (27,576 | ) | (24,284 | ) | — | (133,608 | ) | (16,345 | ) | |||||||||||||||
| — | (9,938 | ) | (4,872 | ) | — | — | — | |||||||||||||||||
| — | (3,477 | ) | (60,855 | ) | — | — | — | |||||||||||||||||
| — | (18,635 | ) | (2,607 | ) | — | (1,822 | ) | (314 | ) | |||||||||||||||
| — | (13,278 | ) | (336,705 | ) | — | (131,893 | ) | (22,004 | ) | |||||||||||||||
| (15,385,561 | ) | (18,939,326 | ) | (429,323 | ) | — | (267,425 | ) | (38,663 | ) | ||||||||||||||
| 295,757,817 | 501,029,596 | 7,822,501 | 4,819,307 | 51,334,167 | 114,937,995 | |||||||||||||||||||
| 12,616,458 | 15,566,518 | 429,323 | — | 262,278 | 36,319 | |||||||||||||||||||
| (136,468,245 | ) | (172,942,850 | ) | (1,359,687 | ) | (1,282,224 | ) | (39,220,992 | ) | (30,589,080 | ) | |||||||||||||
| 171,906,030 | 343,653,264 | 6,892,137 | 3,537,083 | 12,375,453 | 84,385,234 | |||||||||||||||||||
| 171,919,490 | 341,781,829 | 6,760,605 | 4,006,137 | 8,224,181 | 108,613,363 | |||||||||||||||||||
| 552,541,180 | 210,759,351 | 10,046,137 | 6,040,000 | 125,023,519 | 16,410,156 | |||||||||||||||||||
| $ | 724,460,670 | $ | 552,541,180 | $ | 16,806,742 | $ | 10,046,137 | $ | 133,247,700 | $ | 125,023,519 | |||||||||||||
| $ | (4,829,594 | ) | $ | (2,186,043 | ) | $ | (112,759 | ) | $ | — | $ | (1,973,989 | ) | $ | (752,280 | ) | ||||||||
| See accompanying Notes to Financial Statements | | May 31, 2014 | | Semiannual Report | 171 |
Table of Contents
Statements of Changes in Net Assets (cont’d)
| AllianzGI U.S. Equity Hedged | AllianzGI U.S. Small-Cap Growth |
|||||||||||||||
| Six Months ended May 31, 2014 (Unaudited) |
Period from December 3, 2012** through November 30, 2013 |
Six Months ended May 31, 2014 (Unaudited) |
Year ended November 30, 2013 |
|||||||||||||
| Increase in Net Assets from: | ||||||||||||||||
| Investment Operations: |
||||||||||||||||
| Net investment income (loss) | $ | 31,715 | $ | 47,172 | $ | (161,066 | ) | $ | (161,572 | ) | ||||||
| Net realized gain (loss) | (213,367 | ) | (228,900 | ) | 1,815,682 | 3,685,227 | ||||||||||
| Net change in unrealized appreciation/depreciation | 512,313 | 880,477 | (1,944,486 | ) | 8,171,710 | |||||||||||
| Net increase (decrease) in net assets resulting from investment operations |
330,661 | 698,749 | (289,870 | ) | 11,695,365 | |||||||||||
| Dividends and Distributions to Shareholders from: | ||||||||||||||||
| Net investment income: | ||||||||||||||||
| Class A |
(13,056 | ) | — | — | — | |||||||||||
| Class C |
(1,801 | ) | — | — | — | |||||||||||
| Class D |
(1,167 | ) | — | — | — | |||||||||||
| Class P |
(47 | ) | — | — | — | |||||||||||
| Institutional Class |
(36,196 | ) | — | — | — | |||||||||||
| Net realized capital gains: | ||||||||||||||||
| Class A |
(18,994 | ) | — | (332,389 | ) | (31,876 | ) | |||||||||
| Class C |
(2,235 | ) | — | (40,221 | ) | (4,670 | ) | |||||||||
| Class D |
(3,490 | ) | — | (4,379 | ) | (1,186 | ) | |||||||||
| Class R |
— | — | (1,768 | ) | (232 | ) | ||||||||||
| Class P |
(152 | ) | — | (6,673 | ) | (477 | ) | |||||||||
| Institutional Class |
(70,875 | ) | — | (1,863,982 | ) | (440,662 | ) | |||||||||
| Total dividends and distributions to shareholders | (148,013 | ) | — | (2,249,412 | ) | (479,103 | ) | |||||||||
| Fund Share Transactions: | ||||||||||||||||
| Net proceeds from the sale of shares | 669,909 | 3,572,078 | 8,963,363 | 16,516,133 | ||||||||||||
| Issued in reinvestment of dividends and distributions | 148,013 | — | 1,990,519 | 451,442 | ||||||||||||
| Cost of shares redeemed | (449,054 | ) | (100,791 | ) | (7,167,195 | ) | (15,100,256 | ) | ||||||||
| Net increase from Fund share transactions | 368,868 | 3,471,287 | 3,786,687 | 1,867,319 | ||||||||||||
| Total increase in net assets | 551,516 | 4,170,036 | 1,247,405 | 13,083,581 | ||||||||||||
| Net Assets: | ||||||||||||||||
| Beginning of period | 7,210,036 | 3,040,000 | 34,896,739 | 21,813,158 | ||||||||||||
| End of period* | $ | 7,761,552 | $ | 7,210,036 | $ | 36,144,144 | $ | 34,896,739 | ||||||||
| * Including undistributed (dividends in excess of) net investment income of: |
$ | 27,126 | $ | 47,678 | $ | (274,039 | ) | $ | (112,973 | ) | ||||||
| ** | Commencement of operations. |
| 172 | Semiannual Report | | May 31, 2014 | | See accompanying Notes to Financial Statements |
Table of Contents
(THIS PAGE INTENTIONALLY LEFT BLANK)
| See accompanying Notes to Financial Statements | | May 31, 2014 | | Semiannual Report | 173 |
Table of Contents
For a Share Outstanding for the Period ended:
| Net Asset Value, Beginning of Period |
Net Investment Income (a) |
Net Realized and Change in Unrealized Gain (Loss) |
Total from Investment Operations |
Dividends from Net Investment Income |
Distributions from Net Realized Capital Gains |
|||||||||||||||||||||
| AllianzGI Retirement 2015: | ||||||||||||||||||||||||||
| Class A | ||||||||||||||||||||||||||
| 5/31/2014+ |
$ | 19.56 | $ | 0.22 | $ | 0.55 | $ | 0.77 | $ | (0.40 | ) | $ | — | |||||||||||||
| 11/30/2013 |
19.52 | 0.49 | 0.10 | 0.59 | (0.55 | ) | — | |||||||||||||||||||
| 11/30/2012 |
18.86 | 0.48 | 1.27 | 1.75 | (0.70 | ) | (0.39 | ) | ||||||||||||||||||
| 11/30/2011 |
19.28 | 0.38 | 0.23 | 0.61 | (0.74 | ) | (0.29 | ) | ||||||||||||||||||
| 11/30/2010 |
18.38 | 0.48 | 1.22 | 1.70 | (0.68 | ) | (0.12 | ) | ||||||||||||||||||
| 12/29/2008* - 11/30/2009 |
15.00 | 0.53 | 2.85 | 3.38 | — | — | ||||||||||||||||||||
| Class C | ||||||||||||||||||||||||||
| 5/31/2014+ |
$ | 19.23 | $ | 0.14 | $ | 0.56 | $ | 0.70 | $ | (0.19 | ) | $ | — | |||||||||||||
| 11/30/2013 |
19.15 | 0.38 | 0.05 | 0.43 | (0.35 | ) | — | |||||||||||||||||||
| 11/30/2012 |
18.53 | 0.35 | 1.24 | 1.59 | (0.58 | ) | (0.39 | ) | ||||||||||||||||||
| 11/30/2011 |
19.09 | 0.31 | 0.14 | 0.45 | (0.72 | ) | (0.29 | ) | ||||||||||||||||||
| 11/30/2010 |
18.25 | 0.36 | 1.19 | 1.55 | (0.59 | ) | (0.12 | ) | ||||||||||||||||||
| 12/29/2008* - 11/30/2009 |
15.00 | 0.40 | 2.85 | 3.25 | — | — | ||||||||||||||||||||
| Class D | ||||||||||||||||||||||||||
| 5/31/2014+ |
$ | 19.54 | $ | 0.21 | $ | 0.56 | $ | 0.77 | $ | (0.24 | ) | $ | — | |||||||||||||
| 11/30/2013 |
19.52 | 0.88 | (0.32 | ) | 0.56 | (0.54 | ) | — | ||||||||||||||||||
| 11/30/2012 |
18.87 | 0.41 | 1.34 | 1.75 | (0.71 | ) | (0.39 | ) | ||||||||||||||||||
| 11/30/2011 |
19.30 | 0.58 | — | 0.58 | (0.72 | ) | (0.29 | ) | ||||||||||||||||||
| 11/30/2010 |
18.40 | 0.52 | 1.18 | 1.70 | (0.68 | ) | (0.12 | ) | ||||||||||||||||||
| 12/29/2008* - 11/30/2009 |
15.00 | 0.53 | 2.87 | 3.40 | — | — | ||||||||||||||||||||
| Class R | ||||||||||||||||||||||||||
| 5/31/2014+ |
$ | 19.48 | $ | 0.18 | $ | 0.56 | $ | 0.74 | $ | (0.15 | ) | $ | — | |||||||||||||
| 11/30/2013 |
19.50 | 0.46 | 0.05 | 0.51 | (0.53 | ) | — | |||||||||||||||||||
| 11/30/2012 |
18.85 | 0.19 | 1.51 | 1.70 | (0.66 | ) | (0.39 | ) | ||||||||||||||||||
| 11/30/2011 |
19.27 | 0.55 | — | 0.55 | (0.68 | ) | (0.29 | ) | ||||||||||||||||||
| 11/30/2010 |
18.35 | 0.53 | 1.13 | 1.66 | (0.62 | ) | (0.12 | ) | ||||||||||||||||||
| 12/29/2008* - 11/30/2009 |
15.00 | 0.47 | 2.88 | 3.35 | — | — | ||||||||||||||||||||
| Class P | ||||||||||||||||||||||||||
| 5/31/2014+ |
$ | 19.74 | $ | 0.24 | $ | 0.58 | $ | 0.82 | $ | (0.43 | ) | $ | — | |||||||||||||
| 11/30/2013 |
19.66 | 0.51 | 0.14 | 0.65 | (0.57 | ) | — | |||||||||||||||||||
| 11/30/2012 |
18.97 | 0.34 | 1.49 | 1.83 | (0.75 | ) | (0.39 | ) | ||||||||||||||||||
| 11/30/2011 |
19.37 | 0.65 | (0.01 | ) | 0.64 | (0.75 | ) | (0.29 | ) | |||||||||||||||||
| 11/30/2010 |
18.43 | 0.61 | 1.13 | 1.74 | (0.68 | ) | (0.12 | ) | ||||||||||||||||||
| 12/29/2008* - 11/30/2009 |
15.00 | 0.53 | 2.90 | 3.43 | — | — | ||||||||||||||||||||
| Class R6 | ||||||||||||||||||||||||||
| 5/31/2014+ |
$ | 19.77 | $ | 0.25 | $ | 0.58 | $ | 0.83 | $ | (0.45 | ) | $ | — | |||||||||||||
| 11/30/2013 |
19.68 | 0.54 | 0.12 | 0.66 | (0.57 | ) | — | |||||||||||||||||||
| 11/30/2012 |
18.99 | 0.54 | 1.31 | 1.85 | (0.77 | ) | (0.39 | ) | ||||||||||||||||||
| 11/30/2011 |
19.39 | 0.66 | — | 0.66 | (0.77 | ) | (0.29 | ) | ||||||||||||||||||
| 11/30/2010 |
18.45 | 0.61 | 1.14 | 1.75 | (0.69 | ) | (0.12 | ) | ||||||||||||||||||
| 12/29/2008* - 11/30/2009 |
15.00 | 0.55 | 2.90 | 3.45 | — | — | ||||||||||||||||||||
| Administrative Class | ||||||||||||||||||||||||||
| 5/31/2014+ |
$ | 19.68 | $ | 0.22 | $ | 0.58 | $ | 0.80 | $ | (0.40 | ) | $ | — | |||||||||||||
| 11/30/2013 |
19.60 | 0.22 | 0.37 | 0.59 | (0.51 | ) | — | |||||||||||||||||||
| 11/30/2012 |
18.94 | 0.48 | 1.29 | 1.77 | (0.72 | ) | (0.39 | ) | ||||||||||||||||||
| 11/30/2011 |
19.34 | 0.61 | — | 0.61 | (0.72 | ) | (0.29 | ) | ||||||||||||||||||
| 11/30/2010 |
18.40 | 0.58 | 1.14 | 1.72 | (0.66 | ) | (0.12 | ) | ||||||||||||||||||
| 12/29/2008* - 11/30/2009 |
15.00 | 0.51 | 2.89 | 3.40 | — | — | ||||||||||||||||||||
| + | unaudited |
| * | Commencement of operations. |
| (a) | Calculated on average shares outstanding during the period. |
| 174 | Semiannual Report | | May 31, 2014 | | See accompanying Notes to Financial Statements |
Table of Contents
| Total Dividends and Distributions |
Net Asset Value, End of Period |
Total Return (b) | Net Assets, End of Period (000s) |
Ratio of Expenses to Average Net Assets with Fee Waiver/ Reimbursement (c) |
Ratio of Expenses to Average Net Assets without Fee Waiver/ Reimbursement (c) |
Ratio of Net Investment Income to Average Net Assets (c) |
Portfolio Turnover Rate |
|||||||||||||||||||||||||
| $ | (0.40 | ) | $ | 19.93 | 4.04 | % | $ | 9,176 | 0.40 | %(d) | 0.60 | %(d) | 2.25 | %(d) | 61 | % | ||||||||||||||||
| (0.55 | ) | 19.56 | 3.10 | 4,900 | 0.40 | 0.60 | 2.55 | 94 | ||||||||||||||||||||||||
| (1.09 | ) | 19.52 | 9.88 | 1,798 | 0.40 | 0.60 | 2.57 | 70 | ||||||||||||||||||||||||
| (1.03 | ) | 18.86 | 3.27 | 1,564 | 0.47 | 2.06 | 2.03 | 108 | ||||||||||||||||||||||||
| (0.80 | ) | 19.28 | 9.67 | 229 | 0.50 | 5.47 | 2.62 | 24 | ||||||||||||||||||||||||
| — | 18.38 | 22.53 | 78 | 0.50 | (d) | 9.98 | (d) | 3.36 | (d) | 21 | ||||||||||||||||||||||
| $ | (0.19 | ) | $ | 19.74 | 3.68 | % | $ | 1,451 | 1.15 | %(d) | 1.35 | %(d) | 1.45 | %(d) | 61 | % | ||||||||||||||||
| (0.35 | ) | 19.23 | 2.29 | 1,445 | 1.15 | 1.35 | 2.01 | 94 | ||||||||||||||||||||||||
| (0.97 | ) | 19.15 | 9.08 | 2,049 | 1.15 | 1.35 | 1.91 | 70 | ||||||||||||||||||||||||
| (1.01 | ) | 18.53 | 2.44 | 2,347 | 1.22 | 2.66 | 1.65 | 108 | ||||||||||||||||||||||||
| (0.71 | ) | 19.09 | 8.88 | 305 | 1.25 | 7.23 | 1.99 | 24 | ||||||||||||||||||||||||
| — | 18.25 | 21.67 | 71 | 1.25 | (d) | 8.61 | (d) | 2.61 | (d) | 21 | ||||||||||||||||||||||
| $ | (0.24 | ) | $ | 20.07 | 3.99 | % | $ | 112 | 0.50 | %(d) | 0.60 | %(d) | 2.14 | %(d) | 61 | % | ||||||||||||||||
| (0.54 | ) | 19.54 | 2.95 | 191 | 0.50 | 0.60 | 4.52 | 94 | ||||||||||||||||||||||||
| (1.10 | ) | 19.52 | 9.82 | 1,290 | 0.50 | 0.60 | 2.19 | 70 | ||||||||||||||||||||||||
| (1.01 | ) | 18.87 | 3.20 | 251 | 0.50 | 2.22 | 3.07 | 108 | ||||||||||||||||||||||||
| (0.80 | ) | 19.30 | 9.62 | 204 | 0.50 | 5.74 | 2.84 | 24 | ||||||||||||||||||||||||
| — | 18.40 | 22.67 | 91 | 0.50 | (d) | 8.84 | (d) | 3.36 | (d) | 21 | ||||||||||||||||||||||
| $ | (0.15 | ) | $ | 20.07 | 3.90 | % | $ | 200 | 0.75 | %(d) | 0.85 | %(d) | 1.81 | %(d) | 61 | % | ||||||||||||||||
| (0.53 | ) | 19.48 | 2.71 | 227 | 0.75 | 0.85 | 2.39 | 94 | ||||||||||||||||||||||||
| (1.05 | ) | 19.50 | 9.50 | 469 | 0.75 | 0.85 | 1.01 | 70 | ||||||||||||||||||||||||
| (0.97 | ) | 18.85 | 2.94 | 14 | 0.75 | 2.46 | 2.91 | 108 | ||||||||||||||||||||||||
| (0.74 | ) | 19.27 | 9.43 | 13 | 0.75 | 5.77 | 2.87 | 24 | ||||||||||||||||||||||||
| — | 18.35 | 22.33 | 12 | 0.75 | (d) | 7.76 | (d) | 3.11 | (d) | 21 | ||||||||||||||||||||||
| $ | (0.43 | ) | $ | 20.13 | 4.22 | % | $ | 4,548 | 0.10 | %(d) | 0.20 | %(d) | 2.40 | %(d) | 61 | % | ||||||||||||||||
| (0.57 | ) | 19.74 | 3.39 | 3,925 | 0.10 | 0.20 | 2.65 | 94 | ||||||||||||||||||||||||
| (1.14 | ) | 19.66 | 10.27 | 3,845 | 0.10 | 0.20 | 1.78 | 70 | ||||||||||||||||||||||||
| (1.04 | ) | 18.97 | 3.44 | 14 | 0.25 | 2.00 | 3.41 | 108 | ||||||||||||||||||||||||
| (0.80 | ) | 19.37 | 9.88 | 14 | 0.30 | 5.38 | 3.32 | 24 | ||||||||||||||||||||||||
| — | 18.43 | 22.87 | 12 | 0.30 | (d) | 6.52 | (d) | 3.56 | (d) | 21 | ||||||||||||||||||||||
| $ | (0.45 | ) | $ | 20.15 | 4.27 | % | $ | 9,957 | — | %(d) | 0.10 | %(d) | 2.54 | %(d) | 61 | % | ||||||||||||||||
| (0.57 | ) | 19.77 | 3.52 | 7,675 | — | 0.12 | 2.77 | 94 | ||||||||||||||||||||||||
| (1.16 | ) | 19.68 | 10.31 | 8,243 | — | 0.15 | 2.84 | 70 | ||||||||||||||||||||||||
| (1.06 | ) | 18.99 | 3.53 | 5,885 | 0.15 | 1.90 | 3.48 | 108 | ||||||||||||||||||||||||
| (0.81 | ) | 19.39 | 10.02 | 5,553 | 0.20 | 5.26 | 3.32 | 24 | ||||||||||||||||||||||||
| — | 18.45 | 23.00 | 4,306 | 0.20 | (d) | 6.42 | (d) | 3.66 | (d) | 21 | ||||||||||||||||||||||
| $ | (0.40 | ) | $ | 20.08 | 4.12 | % | $ | 3,557 | 0.35 | %(d) | 0.45 | %(d) | 2.23 | %(d) | 61 | % | ||||||||||||||||
| (0.51 | ) | 19.68 | 3.08 | 3,646 | 0.35 | 0.45 | 1.13 | 94 | ||||||||||||||||||||||||
| (1.11 | ) | 19.60 | 9.97 | 15 | 0.35 | 0.45 | 2.57 | 70 | ||||||||||||||||||||||||
| (1.01 | ) | 18.94 | 3.23 | 14 | 0.42 | 2.17 | 3.23 | 108 | ||||||||||||||||||||||||
| (0.78 | ) | 19.34 | 9.75 | 13 | 0.45 | 5.54 | 3.17 | 24 | ||||||||||||||||||||||||
| — | 18.40 | 22.67 | 12 | 0.45 | (d) | 6.67 | (d) | 3.41 | (d) | 21 | ||||||||||||||||||||||
| (b) | Total return is calculated assuming a purchase of a share on the first day of the period and a sale of a share on the last day of each period reported. Dividends and distributions, if any, are assumed, for purposes of this calculation, to be reinvested. Total return does not reflect sales charges and includes the effect of fee waivers and reimbursements. Total return may reflect adjustments to conform to generally accepted accounting principles. Total return for a period of less than one year is not annualized. |
| (c) | Does not include expenses of the investment companies in which the Fund invests. |
| (d) | Annualized. |
| See accompanying Notes to Financial Statements | | May 31, 2014 | | Semiannual Report | 175 |
Table of Contents
Financial Highlights (cont’d)
For a Share Outstanding for the Period ended:
| Net Asset Value, Beginning of Period |
Net Investment Income (a) |
Net Realized and Change in Unrealized Gain (Loss) |
Total from Investment Operations |
Dividends from Net Investment Income |
Distributions from Net Realized Capital Gains |
|||||||||||||||||||||
| AllianzGI Retirement 2020: | ||||||||||||||||||||||||||
| Class A | ||||||||||||||||||||||||||
| 5/31/2014+ |
$ | 19.32 | $ | 0.21 | $ | 0.61 | $ | 0.82 | $ | (0.38 | ) | $ | — | |||||||||||||
| 11/30/2013 |
19.15 | 0.49 | 0.21 | 0.70 | (0.48 | ) | (0.05 | ) | ||||||||||||||||||
| 11/30/2012 |
18.82 | 0.44 | 1.34 | 1.78 | (0.70 | ) | (0.75 | ) | ||||||||||||||||||
| 11/30/2011 |
19.43 | 0.49 | 0.04 | 0.53 | (0.83 | ) | (0.31 | ) | ||||||||||||||||||
| 11/30/2010 |
18.58 | 0.52 | 1.18 | 1.70 | (0.66 | ) | (0.19 | ) | ||||||||||||||||||
| 12/29/2008* - 11/30/2009 |
15.00 | 0.53 | 3.05 | 3.58 | — | — | ||||||||||||||||||||
| Class C | ||||||||||||||||||||||||||
| 5/31/2014+ |
$ | 19.16 | $ | 0.14 | $ | 0.60 | $ | 0.74 | $ | (0.18 | ) | $ | — | |||||||||||||
| 11/30/2013 |
18.78 | 0.31 | 0.26 | 0.57 | (0.14 | ) | (0.05 | ) | ||||||||||||||||||
| 11/30/2012 |
18.53 | 0.37 | 1.23 | 1.60 | (0.60 | ) | (0.75 | ) | ||||||||||||||||||
| 11/30/2011 |
19.21 | 0.30 | 0.09 | 0.39 | (0.76 | ) | (0.31 | ) | ||||||||||||||||||
| 11/30/2010 |
18.46 | 0.32 | 1.22 | 1.54 | (0.60 | ) | (0.19 | ) | ||||||||||||||||||
| 12/29/2008* - 11/30/2009 |
15.00 | 0.40 | 3.06 | 3.46 | — | — | ||||||||||||||||||||
| Class D | ||||||||||||||||||||||||||
| 5/31/2014+ |
$ | 19.37 | $ | 0.20 | $ | 0.62 | $ | 0.82 | $ | (0.33 | ) | $ | — | |||||||||||||
| 11/30/2013 |
19.16 | 0.49 | 0.20 | 0.69 | (0.43 | ) | (0.05 | ) | ||||||||||||||||||
| 11/30/2012 |
18.84 | 0.39 | 1.36 | 1.75 | (0.68 | ) | (0.75 | ) | ||||||||||||||||||
| 11/30/2011 |
19.43 | 0.72 | (0.19 | ) | 0.53 | (0.81 | ) | (0.31 | ) | |||||||||||||||||
| 11/30/2010 |
18.59 | 0.52 | 1.17 | 1.69 | (0.66 | ) | (0.19 | ) | ||||||||||||||||||
| 12/29/2008* - 11/30/2009 |
15.00 | 0.53 | 3.06 | 3.59 | — | — | ||||||||||||||||||||
| Class R | ||||||||||||||||||||||||||
| 5/31/2014+ |
$ | 19.27 | $ | 0.18 | $ | 0.61 | $ | 0.79 | $ | (0.28 | ) | $ | — | |||||||||||||
| 11/30/2013 |
19.14 | 0.43 | 0.21 | 0.64 | (0.46 | ) | (0.05 | ) | ||||||||||||||||||
| 11/30/2012 |
18.81 | 0.18 | 1.54 | 1.72 | (0.64 | ) | (0.75 | ) | ||||||||||||||||||
| 11/30/2011 |
19.40 | 0.53 | (0.05 | ) | 0.48 | (0.76 | ) | (0.31 | ) | |||||||||||||||||
| 11/30/2010 |
18.55 | 0.55 | 1.09 | 1.64 | (0.60 | ) | (0.19 | ) | ||||||||||||||||||
| 12/29/2008* - 11/30/2009 |
15.00 | 0.47 | 3.08 | 3.55 | — | — | ||||||||||||||||||||
| Class P | ||||||||||||||||||||||||||
| 5/31/2014+ |
$ | 19.53 | $ | 0.23 | $ | 0.63 | $ | 0.86 | $ | (0.40 | ) | $ | — | |||||||||||||
| 11/30/2013 |
19.30 | 0.47 | 0.30 | 0.77 | (0.49 | ) | (0.05 | ) | ||||||||||||||||||
| 11/30/2012 |
18.94 | 0.37 | 1.47 | 1.84 | (0.73 | ) | (0.75 | ) | ||||||||||||||||||
| 11/30/2011 |
19.51 | 0.42 | 0.16 | 0.58 | (0.84 | ) | (0.31 | ) | ||||||||||||||||||
| 11/30/2010 |
18.62 | 0.64 | 1.10 | 1.74 | (0.66 | ) | (0.19 | ) | ||||||||||||||||||
| 12/29/2008* - 11/30/2009 |
15.00 | 0.54 | 3.08 | 3.62 | — | — | ||||||||||||||||||||
| + | Unaudited |
| * | Commencement of operations. |
| (a) | Calculated on average shares outstanding during the period. |
| (b) | Total return is calculated assuming a purchase of a share on the first day of the period and a sale of a share on the last day of each period reported. Dividends and distributions, if any, are assumed, for purposes of this calculation, to be reinvested. Total return does not reflect sales charges and includes the effect of fee waivers and reimbursements. Total return may reflect adjustments to conform to generally accepted accounting principles. Total return for a period of less than one year is not annualized. |
| (c) | Does not include expenses of the investment companies in which the Fund invests. |
| (d) | Annualized. |
| (e) | See Note 6 in the Notes to Financial Statements. |
| 176 | Semiannual Report | | May 31, 2014 | | See accompanying Notes to Financial Statements |
Table of Contents
| Total Dividends and Distributions |
Net Asset Value, End of Period |
Total Return (b) | Net Assets, End of Period (000s) |
Ratio of Expenses to Average Net Assets with Fee Waiver/ Reimbursement (c) |
Ratio of Expenses to Average Net Assets without Fee Waiver/ Reimbursement (c) |
Ratio of Net Investment Income to Average Net Assets (c) |
Portfolio Turnover Rate |
|||||||||||||||||||||||||
| $ | (0.38 | ) | $ | 19.76 | 4.33 | % | $ | 19,778 | 0.40 | %(d) | 0.60 | %(d) | 2.23 | %(d) | 44 | % | ||||||||||||||||
| (0.53 | ) | 19.32 | 3.75 | 9,102 | 0.40 | 0.60 | 2.60 | 86 | ||||||||||||||||||||||||
| (1.45 | ) | 19.15 | 10.23 | 985 | 0.38 | 0.60 | 2.40 | 55 | ||||||||||||||||||||||||
| (1.14 | ) | 18.82 | 2.82 | 351 | 0.48 | 2.71 | 2.56 | 56 | ||||||||||||||||||||||||
| (0.85 | ) | 19.43 | 9.60 | 154 | 0.53 | 6.52 | 2.79 | 23 | ||||||||||||||||||||||||
| — | 18.58 | 23.87 | 40 | 0.53 | (d) | 10.16 | (d) | 3.38 | (d) | 25 | ||||||||||||||||||||||
| $ | (0.18 | ) | $ | 19.72 | 3.92 | % | $ | 456 | 1.15 | %(d) | 1.35 | %(d) | 1.45 | %(d) | 44 | % | ||||||||||||||||
| (0.19 | ) | 19.16 | 3.02 | 438 | 1.15 | 1.35 | 1.64 | 86 | ||||||||||||||||||||||||
| (1.35 | ) | 18.78 | 9.29 | 364 | 1.13 | 1.35 | 2.07 | 55 | ||||||||||||||||||||||||
| (1.07 | ) | 18.53 | 2.07 | 669 | 1.23 | 3.40 | 1.61 | 56 | ||||||||||||||||||||||||
| (0.79 | ) | 19.21 | 8.72 | 204 | 1.28 | 8.05 | 1.72 | 23 | ||||||||||||||||||||||||
| — | 18.46 | 23.07 | 30 | 1.28 | (d) | 10.57 | (d) | 2.63 | (d) | 25 | ||||||||||||||||||||||
| $ | (0.33 | ) | $ | 19.86 | 4.24 | % | $ | 365 | 0.50 | %(d) | 0.60 | %(d) | 2.07 | %(d) | 44 | % | ||||||||||||||||
| (0.48 | ) | 19.37 | 3.67 | 319 | 0.50 | 0.60 | 2.58 | 86 | ||||||||||||||||||||||||
| (1.43 | ) | 19.16 | 10.02 | 266 | 0.48 | 0.60 | 2.12 | 55 | ||||||||||||||||||||||||
| (1.12 | ) | 18.84 | 2.85 | 115 | 0.52 | 2.91 | 3.80 | 56 | ||||||||||||||||||||||||
| (0.85 | ) | 19.43 | 9.54 | 187 | 0.53 | 5.95 | 2.80 | 23 | ||||||||||||||||||||||||
| — | 18.59 | 23.93 | 65 | 0.53 | (d) | 10.35 | (d) | 3.38 | (d) | 25 | ||||||||||||||||||||||
| $ | (0.28 | ) | $ | 19.78 | 4.14 | % | $ | 1,089 | 0.75 | %(d) | 0.85 | %(d) | 1.84 | %(d) | 44 | % | ||||||||||||||||
| (0.51 | ) | 19.27 | 3.40 | 1,022 | 0.75 | 0.85 | 2.26 | 86 | ||||||||||||||||||||||||
| (1.39 | ) | 19.14 | 9.84 | 938 | 0.73 | 0.85 | 0.97 | 55 | ||||||||||||||||||||||||
| (1.07 | ) | 18.81 | 2.57 | 14 | 0.77 | 3.09 | 2.77 | 56 | ||||||||||||||||||||||||
| (0.79 | ) | 19.40 | 9.25 | 13 | 0.78 | 6.30 | 2.99 | 23 | ||||||||||||||||||||||||
| — | 18.55 | 23.67 | 12 | 0.78 | (d) | 8.76 | (d) | 3.13 | (d) | 25 | ||||||||||||||||||||||
| $ | (0.40 | ) | $ | 19.99 | 4.48 | % | $ | 12,866 | 0.10 | %(d) | 0.20 | %(d) | 2.33 | %(d) | 44 | % | ||||||||||||||||
| (0.54 | ) | 19.53 | 4.06 | 7,643 | 0.10 | 0.20 | 2.44 | 86 | ||||||||||||||||||||||||
| (1.48 | ) | 19.30 | 10.55 | 5,323 | 0.08 | 0.20 | 1.95 | 55 | ||||||||||||||||||||||||
| (1.15 | ) | 18.94 | 3.07 | 42 | 0.17 | 1.39 | 2.24 | 56 | ||||||||||||||||||||||||
| (0.85 | ) | 19.51 | 9.81 | 14 | 0.33 | 5.93 | 3.44 | 23 | ||||||||||||||||||||||||
| — | 18.62 | 24.13 | 13 | 0.33 | (d) | 6.56 | (d) | 3.58 | (d) | 25 | ||||||||||||||||||||||
| See accompanying Notes to Financial Statements | | May 31, 2014 | | Semiannual Report | 177 |
Table of Contents
Financial Highlights (cont’d)
For a Share Outstanding for the Period ended:
| Net Asset Value, Beginning of Period |
Net Investment Income (a) |
Net Realized and Change in Unrealized Gain (Loss) |
Total from Investment Operations |
Dividends from Net Investment Income |
Distributions from Net Realized Capital Gains |
|||||||||||||||||||||
| AllianzGI Retirement 2020 (cont’d) | ||||||||||||||||||||||||||
| Class R6 | ||||||||||||||||||||||||||
| 5/31/2014+ |
$ | 19.57 | $ | 0.25 | $ | 0.62 | $ | 0.87 | $ | (0.42 | ) | $ | — | |||||||||||||
| 11/30/2013 |
19.32 | 0.58 | 0.21 | 0.79 | (0.49 | ) | (0.05 | ) | ||||||||||||||||||
| 11/30/2012 |
18.96 | 0.55 | 1.31 | 1.86 | (0.75 | ) | (0.75 | ) | ||||||||||||||||||
| 11/30/2011 |
19.53 | 0.64 | (0.04 | ) | 0.60 | (0.86 | ) | (0.31 | ) | |||||||||||||||||
| 11/30/2010 |
18.64 | 0.64 | 1.12 | 1.76 | (0.68 | ) | (0.19 | ) | ||||||||||||||||||
| 12/29/2008* - 11/30/2009 |
15.00 | 0.55 | 3.09 | 3.64 | — | — | ||||||||||||||||||||
| Administrative Class | ||||||||||||||||||||||||||
| 5/31/2014+ |
$ | 19.42 | $ | 0.22 | $ | 0.61 | $ | 0.83 | $ | (0.37 | ) | $ | — | |||||||||||||
| 11/30/2013 |
19.25 | 0.24 | 0.47 | 0.71 | (0.49 | ) | (0.05 | ) | ||||||||||||||||||
| 11/30/2012 |
18.90 | 0.51 | 1.28 | 1.79 | (0.69 | ) | (0.75 | ) | ||||||||||||||||||
| 11/30/2011 |
19.48 | 0.59 | (0.05 | ) | 0.54 | (0.81 | ) | (0.31 | ) | |||||||||||||||||
| 11/30/2010 |
18.60 | 0.61 | 1.10 | 1.71 | (0.64 | ) | (0.19 | ) | ||||||||||||||||||
| 12/29/2008* - 11/30/2009 |
15.00 | 0.52 | 3.08 | 3.60 | — | — | ||||||||||||||||||||
| AllianzGI Retirement 2025: | ||||||||||||||||||||||||||
| Class A | ||||||||||||||||||||||||||
| 5/31/2014+ |
$ | 16.92 | $ | 0.19 | $ | 0.56 | $ | 0.75 | $ | (0.32 | ) | $ | — | |||||||||||||
| 11/30/2013 |
16.63 | 0.41 | 0.32 | 0.73 | (0.40 | ) | (0.04 | ) | ||||||||||||||||||
| 12/19/2011* - 11/30/2012 |
15.00 | 0.34 | 1.43 | 1.77 | (0.14 | ) | — | |||||||||||||||||||
| Class R | ||||||||||||||||||||||||||
| 5/31/2014+ |
$ | 16.84 | $ | 0.16 | $ | 0.56 | $ | 0.72 | $ | (0.27 | ) | $ | — | |||||||||||||
| 11/30/2013 |
16.57 | 0.48 | 0.19 | 0.67 | (0.36 | ) | (0.04 | ) | ||||||||||||||||||
| 12/19/2011* - 11/30/2012 |
15.00 | 0.18 | 1.53 | 1.71 | (0.14 | ) | — | |||||||||||||||||||
| Class P | ||||||||||||||||||||||||||
| 5/31/2014+ |
$ | 17.02 | $ | 0.18 | $ | 0.60 | $ | 0.78 | $ | (0.34 | ) | $ | — | |||||||||||||
| 11/30/2013 |
16.67 | 0.48 | 0.31 | 0.79 | (0.40 | ) | (0.04 | ) | ||||||||||||||||||
| 12/19/2011* - 11/30/2012 |
15.00 | 0.38 | 1.44 | 1.82 | (0.15 | ) | — | |||||||||||||||||||
| Class R6 | ||||||||||||||||||||||||||
| 5/31/2014+ |
$ | 17.04 | $ | 0.21 | $ | 0.58 | $ | 0.79 | $ | (0.36 | ) | $ | — | |||||||||||||
| 11/30/2013 |
16.68 | 0.50 | 0.30 | 0.80 | (0.40 | ) | (0.04 | ) | ||||||||||||||||||
| 12/19/2011* - 11/30/2012 |
15.00 | 0.45 | 1.38 | 1.83 | (0.15 | ) | — | |||||||||||||||||||
| Administrative Class | ||||||||||||||||||||||||||
| 5/31/2014+ |
$ | 16.98 | $ | 0.19 | $ | 0.57 | $ | 0.76 | $ | (0.32 | ) | $ | — | |||||||||||||
| 11/30/2013 |
16.62 | 0.20 | 0.55 | 0.75 | (0.35 | ) | (0.04 | ) | ||||||||||||||||||
| 12/19/2011* - 11/30/2012 |
15.00 | 0.41 | 1.35 | 1.76 | (0.14 | ) | — | |||||||||||||||||||
| + | Unaudited |
| * | Commencement of operations. |
| (a) | Calculated on average shares outstanding during the period. |
| (b) | Total return is calculated assuming a purchase of a share on the first day of the period and a sale of a share on the last day of each period reported. Dividends and distributions, if any, are assumed, for purposes of this calculation, to be reinvested. Total return does not reflect sales charges and includes the effect of fee waivers and reimbursements. Total return may reflect adjustments to conform to generally accepted accounting principles. Total return for a period of less than one year is not annualized. |
| (c) | Does not include expenses of the investment companies in which the Fund invests. |
| (d) | Annualized. |
| (e) | See Note 6 in the Notes to Financial Statements. |
| 178 | Semiannual Report | | May 31, 2014 | | See accompanying Notes to Financial Statements |
Table of Contents
| Total Dividends and Distributions |
Net Asset Value, End of Period |
Total Return (b) | Net Assets, End of Period (000s) |
Ratio of Expenses to Average Net Assets with Fee Waiver/ Reimbursement (c) |
Ratio of Expenses to Average Net Assets without Fee Waiver/ Reimbursement (c) |
Ratio of Net Investment Income to Average Net Assets (c) |
Portfolio Turnover Rate |
|||||||||||||||||||||||||
| $ | (0.42 | ) | $ | 20.02 | 4.53 | % | $ | 8,332 | — | %(d) | 0.10 | %(d) | 2.58 | %(d) | 44 | % | ||||||||||||||||
| (0.54 | ) | 19.57 | 4.19 | 7,457 | — | 0.12 | 3.00 | 86 | ||||||||||||||||||||||||
| (1.50 | ) | 19.32 | 10.62 | 7,708 | — | (e) | 0.15 | 2.98 | 55 | |||||||||||||||||||||||
| (1.17 | ) | 18.96 | 3.16 | 5,157 | 0.17 | 2.51 | 3.34 | 56 | ||||||||||||||||||||||||
| (0.87 | ) | 19.53 | 9.90 | 4,834 | 0.23 | 5.80 | 3.44 | 23 | ||||||||||||||||||||||||
| — | 18.64 | 24.27 | 3,654 | 0.23 | (d) | 6.46 | (d) | 3.68 | (d) | 25 | ||||||||||||||||||||||
| $ | (0.37 | ) | $ | 19.88 | 4.36 | % | $ | 7,273 | 0.35 | %(d) | 0.45 | %(d) | 2.24 | %(d) | 44 | % | ||||||||||||||||
| (0.54 | ) | 19.42 | 3.79 | 7,210 | 0.35 | 0.45 | 1.27 | 86 | ||||||||||||||||||||||||
| (1.44 | ) | 19.25 | 10.20 | 15 | 0.33 | 0.45 | 2.73 | 55 | ||||||||||||||||||||||||
| (1.12 | ) | 18.90 | 2.87 | 14 | 0.44 | 2.78 | 3.09 | 56 | ||||||||||||||||||||||||
| (0.83 | ) | 19.48 | 9.63 | 14 | 0.48 | 6.08 | 3.29 | 23 | ||||||||||||||||||||||||
| — | 18.60 | 24.00 | 12 | 0.48 | (d) | 6.71 | (d) | 3.43 | (d) | 25 | ||||||||||||||||||||||
| $ | (0.32 | ) | $ | 17.35 | 4.52 | % | $ | 23,432 | 0.40 | %(d) | 0.60 | %(d) | 2.28 | %(d) | 44 | % | ||||||||||||||||
| (0.44 | ) | 16.92 | 4.54 | 13,058 | 0.40 | 0.60 | 2.48 | 76 | ||||||||||||||||||||||||
| (0.14 | ) | 16.63 | 11.86 | 335 | 0.38 | (d) | 0.60 | (d) | 2.22 | (d) | 55 | |||||||||||||||||||||
| $ | (0.27 | ) | $ | 17.29 | 4.31 | % | $ | 1,069 | 0.75 | %(d) | 0.85 | %(d) | 1.96 | %(d) | 44 | % | ||||||||||||||||
| (0.40 | ) | 16.84 | 4.16 | 753 | 0.75 | 0.85 | 2.88 | 76 | ||||||||||||||||||||||||
| (0.14 | ) | 16.57 | 11.51 | 1,284 | 0.73 | (d) | 0.85 | (d) | 1.19 | (d) | 55 | |||||||||||||||||||||
| $ | (0.34 | ) | $ | 17.46 | 4.67 | % | $ | 13,546 | 0.10 | %(d) | 0.20 | %(d) | 2.15 | %(d) | 44 | % | ||||||||||||||||
| (0.44 | ) | 17.02 | 4.84 | 4,336 | 0.10 | 0.20 | 2.88 | 76 | ||||||||||||||||||||||||
| (0.15 | ) | 16.67 | 12.21 | 3,873 | 0.08 | (d) | 0.20 | (d) | 2.47 | (d) | 55 | |||||||||||||||||||||
| $ | (0.36 | ) | $ | 17.47 | 4.72 | % | $ | 8,304 | — | %(d) | 0.10 | %(d) | 2.53 | %(d) | 44 | % | ||||||||||||||||
| (0.44 | ) | 17.04 | 4.93 | 5,058 | — | 0.12 | 3.02 | 76 | ||||||||||||||||||||||||
| (0.15 | ) | 16.68 | 12.28 | 5,375 | — | (d)(e) | 0.15 | (d) | 2.94 | (d) | 55 | |||||||||||||||||||||
| $ | (0.32 | ) | $ | 17.42 | 4.56 | % | $ | 11,290 | 0.35 | %(d) | 0.45 | %(d) | 2.30 | %(d) | 44 | % | ||||||||||||||||
| (0.39 | ) | 16.98 | 4.60 | 10,606 | 0.35 | 0.45 | 1.23 | 76 | ||||||||||||||||||||||||
| (0.14 | ) | 16.62 | 11.86 | 11 | 0.33 | (d) | 0.45 | (d) | 2.72 | (d) | 55 | |||||||||||||||||||||
| See accompanying Notes to Financial Statements | | May 31, 2014 | | Semiannual Report | 179 |
Table of Contents
Financial Highlights (cont’d)
For a Share Outstanding for the Period ended:
| Net Asset Value, Beginning of Period |
Net Investment Income (a) |
Net Realized and Change in Unrealized Gain (Loss) |
Total from Investment Operations |
Dividends from Net Investment Income |
Distributions from Net Realized Capital Gains |
|||||||||||||||||||||
| AllianzGI Retirement 2030: | ||||||||||||||||||||||||||
| Class A | ||||||||||||||||||||||||||
| 5/31/2014+ |
$ | 20.66 | $ | 0.26 | $ | 0.70 | $ | 0.96 | $ | (0.47 | ) | $ | — | |||||||||||||
| 11/30/2013 |
19.80 | 0.52 | 0.92 | 1.44 | (0.54 | ) | (0.04 | ) | ||||||||||||||||||
| 11/30/2012 |
19.77 | 0.29 | 1.61 | 1.90 | (0.70 | ) | (1.17 | ) | ||||||||||||||||||
| 11/30/2011 |
20.78 | 0.50 | (0.10 | ) | 0.40 | (0.85 | ) | (0.56 | ) | |||||||||||||||||
| 11/30/2010 |
19.36 | 0.50 | 1.59 | 2.09 | (0.51 | ) | (0.16 | ) | ||||||||||||||||||
| 12/29/2008* - 11/30/2009 |
15.00 | 0.41 | 3.95 | 4.36 | — | — | ||||||||||||||||||||
| Class C | ||||||||||||||||||||||||||
| 5/31/2014+ |
$ | 20.42 | $ | 0.18 | $ | 0.69 | $ | 0.87 | $ | (0.28 | ) | $ | — | |||||||||||||
| 11/30/2013 |
19.53 | 0.35 | 0.93 | 1.28 | (0.35 | ) | (0.04 | ) | ||||||||||||||||||
| 11/30/2012 |
19.51 | 0.43 | 1.30 | 1.73 | (0.54 | ) | (1.17 | ) | ||||||||||||||||||
| 11/30/2011 |
20.59 | 0.37 | (0.09 | ) | 0.28 | (0.80 | ) | (0.56 | ) | |||||||||||||||||
| 11/30/2010 |
19.28 | 0.26 | 1.66 | 1.92 | (0.45 | ) | (0.16 | ) | ||||||||||||||||||
| 12/29/2008* - 11/30/2009 |
15.00 | 0.28 | 4.00 | 4.28 | — | — | ||||||||||||||||||||
| Class D | ||||||||||||||||||||||||||
| 5/31/2014+ |
$ | 20.74 | $ | 0.25 | $ | 0.71 | $ | 0.96 | $ | (0.43 | ) | $ | — | |||||||||||||
| 11/30/2013 |
19.84 | 0.52 | 0.90 | 1.42 | (0.48 | ) | (0.04 | ) | ||||||||||||||||||
| 11/30/2012 |
19.82 | 0.52 | 1.36 | 1.88 | (0.69 | ) | (1.17 | ) | ||||||||||||||||||
| 11/30/2011 |
20.82 | 0.53 | (0.12 | ) | 0.41 | (0.85 | ) | (0.56 | ) | |||||||||||||||||
| 11/30/2010 |
19.40 | 0.47 | 1.62 | 2.09 | (0.51 | ) | (0.16 | ) | ||||||||||||||||||
| 12/29/2008* - 11/30/2009 |
15.00 | 0.41 | 3.99 | 4.40 | — | — | ||||||||||||||||||||
| Class R | ||||||||||||||||||||||||||
| 5/31/2014+ |
$ | 20.65 | $ | 0.22 | $ | 0.70 | $ | 0.92 | $ | (0.36 | ) | $ | — | |||||||||||||
| 11/30/2013 |
19.85 | 0.46 | 0.91 | 1.37 | (0.53 | ) | (0.04 | ) | ||||||||||||||||||
| 11/30/2012 |
19.81 | 0.18 | 1.67 | 1.85 | (0.64 | ) | (1.17 | ) | ||||||||||||||||||
| 11/30/2011 |
20.80 | 0.52 | (0.15 | ) | 0.37 | (0.80 | ) | (0.56 | ) | |||||||||||||||||
| 11/30/2010 |
19.37 | 0.49 | 1.54 | 2.03 | (0.44 | ) | (0.16 | ) | ||||||||||||||||||
| 12/29/2008* - 11/30/2009 |
15.00 | 0.34 | 4.03 | 4.37 | — | — | ||||||||||||||||||||
| Class P | ||||||||||||||||||||||||||
| 5/31/2014+ |
$ | 20.93 | $ | 0.25 | $ | 0.76 | $ | 1.01 | $ | (0.50 | ) | $ | — | |||||||||||||
| 11/30/2013 |
20.02 | 0.51 | 1.00 | 1.51 | (0.56 | ) | (0.04 | ) | ||||||||||||||||||
| 11/30/2012 |
19.95 | 0.41 | 1.57 | 1.98 | (0.74 | ) | (1.17 | ) | ||||||||||||||||||
| 11/30/2011 |
20.92 | 0.58 | (0.12 | ) | 0.46 | (0.87 | ) | (0.56 | ) | |||||||||||||||||
| 11/30/2010 |
19.45 | 0.58 | 1.56 | 2.14 | (0.51 | ) | (0.16 | ) | ||||||||||||||||||
| 12/29/2008* - 11/30/2009 |
15.00 | 0.41 | 4.04 | 4.45 | — | — | ||||||||||||||||||||
| + | Unaudited |
| * | Commencement of operations. |
| (a) | Calculated on average shares outstanding during the period. |
| (b) | Total return is calculated assuming a purchase of a share on the first day of the period and a sale of a share on the last day of each period reported. Dividends and distributions, if any, are assumed, for purposes of this calculation, to be reinvested. Total return does not reflect sales charges and includes the effect of fee waivers and reimbursements. Total return may reflect adjustments to conform to generally accepted accounting principles. Total return for a period of less than one year is not annualized. |
| (c) | Does not include expenses of the investment companies in which the Fund invests. |
| (d) | Annualized. |
| (e) | See Note 6 in the Notes to Financial Statements. |
| 180 | Semiannual Report | | May 31, 2014 | | See accompanying Notes to Financial Statements |
Table of Contents
| Total Dividends and Distributions |
Net Asset Value, End of Period |
Total Return (b) | Net Assets, End of Period (000s) |
Ratio of Expenses to Average Net Assets with Fee Waiver/ Reimbursement (c) |
Ratio of Expenses to Average Net Assets without Fee Waiver/ Reimbursement (c) |
Ratio of Net Investment Income to Average Net Assets (c) |
Portfolio Turnover Rate |
|||||||||||||||||||||||||
| $ | (0.47 | ) | $ | 21.15 | 4.71 | % | $ | 19,542 | 0.35 | %(d) | 0.60 | %(d) | 2.57 | %(d) | 46 | % | ||||||||||||||||
| (0.58 | ) | 20.66 | 7.48 | 10,080 | 0.35 | 0.60 | 2.58 | 79 | ||||||||||||||||||||||||
| (1.87 | ) | 19.80 | 10.68 | 10,692 | 0.29 | 0.60 | 1.48 | 47 | ||||||||||||||||||||||||
| (1.41 | ) | 19.77 | 1.76 | 460 | 0.45 | 2.50 | 2.43 | 52 | ||||||||||||||||||||||||
| (0.67 | ) | 20.78 | 11.07 | 286 | 0.63 | 5.46 | 2.57 | 33 | ||||||||||||||||||||||||
| — | 19.36 | 29.07 | 179 | 0.63 | (d) | 9.16 | (d) | 2.47 | (d) | 11 | ||||||||||||||||||||||
| $ | (0.28 | ) | $ | 21.01 | 4.37 | % | $ | 725 | 1.10 | %(d) | 1.35 | %(d) | 1.77 | %(d) | 46 | % | ||||||||||||||||
| (0.39 | ) | 20.42 | 6.63 | 736 | 1.10 | 1.35 | 1.77 | 79 | ||||||||||||||||||||||||
| (1.71 | ) | 19.53 | 9.80 | 605 | 1.04 | 1.35 | 2.26 | 47 | ||||||||||||||||||||||||
| (1.36 | ) | 19.51 | 1.20 | 654 | 1.21 | 3.34 | 1.84 | 52 | ||||||||||||||||||||||||
| (0.61 | ) | 20.59 | 10.17 | 542 | 1.38 | 7.39 | 1.32 | 33 | ||||||||||||||||||||||||
| — | 19.28 | 28.53 | 78 | 1.38 | (d) | 9.74 | (d) | 1.72 | (d) | 11 | ||||||||||||||||||||||
| $ | (0.43 | ) | $ | 21.27 | 4.71 | % | $ | 679 | 0.45 | %(d) | 0.60 | %(d) | 2.40 | %(d) | 46 | % | ||||||||||||||||
| (0.52 | ) | 20.74 | 7.34 | 643 | 0.45 | 0.60 | 2.60 | 79 | ||||||||||||||||||||||||
| (1.86 | ) | 19.84 | 10.48 | 519 | 0.39 | 0.60 | 2.69 | 47 | ||||||||||||||||||||||||
| (1.41 | ) | 19.82 | 1.89 | 377 | 0.48 | 2.51 | 2.59 | 52 | ||||||||||||||||||||||||
| (0.67 | ) | 20.82 | 11.04 | 295 | 0.63 | 5.63 | 2.41 | 33 | ||||||||||||||||||||||||
| — | 19.40 | 29.33 | 123 | 0.63 | (d) | 8.98 | (d) | 2.47 | (d) | 11 | ||||||||||||||||||||||
| $ | (0.36 | ) | $ | 21.21 | 4.59 | % | $ | 1,320 | 0.70 | %(d) | 0.85 | %(d) | 2.16 | %(d) | 46 | % | ||||||||||||||||
| (0.57 | ) | 20.65 | 7.09 | 1,199 | 0.70 | 0.85 | 2.28 | 79 | ||||||||||||||||||||||||
| (1.81 | ) | 19.85 | 10.23 | 1,103 | 0.64 | 0.85 | 0.95 | 47 | ||||||||||||||||||||||||
| (1.36 | ) | 19.81 | 1.66 | 14 | 0.74 | 2.82 | 2.54 | 52 | ||||||||||||||||||||||||
| (0.60 | ) | 20.80 | 10.73 | 14 | 0.88 | 5.79 | 2.53 | 33 | ||||||||||||||||||||||||
| — | 19.37 | 29.13 | 13 | 0.88 | (d) | 7.74 | (d) | 2.22 | (d) | 11 | ||||||||||||||||||||||
| $ | (0.50 | ) | $ | 21.44 | 4.92 | % | $ | 18,244 | 0.05 | %(d) | 0.20 | %(d) | 2.40 | %(d) | 46 | % | ||||||||||||||||
| (0.60 | ) | 20.93 | 7.77 | 7,748 | 0.05 | 0.20 | 2.54 | 79 | ||||||||||||||||||||||||
| (1.91 | ) | 20.02 | 10.97 | 5,103 | — | (e) | 0.20 | 2.06 | 47 | |||||||||||||||||||||||
| (1.43 | ) | 19.95 | 2.13 | 19 | 0.22 | 2.27 | 2.84 | 52 | ||||||||||||||||||||||||
| (0.67 | ) | 20.92 | 11.27 | 14 | 0.43 | 5.41 | 2.97 | 33 | ||||||||||||||||||||||||
| — | 19.45 | 29.67 | 13 | 0.43 | (d) | 6.37 | (d) | 2.67 | (d) | 11 | ||||||||||||||||||||||
| See accompanying Notes to Financial Statements | | May 31, 2014 | | Semiannual Report | 181 |
Table of Contents
Financial Highlights (cont’d)
For a Share Outstanding for the Period ended:
| Net Asset Value, Beginning of Period |
Net Investment Income (a) |
Net Realized and Change in Unrealized Gain (Loss) |
Total from Investment Operations |
Dividends from Net Investment Income |
Distributions from Net Realized Capital Gains |
|||||||||||||||||||||
| AllianzGI Retirement 2030 (cont’d) | ||||||||||||||||||||||||||
| Class R6 | ||||||||||||||||||||||||||
| 5/31/2014+ |
$ | 20.98 | $ | 0.31 | $ | 0.70 | $ | 1.01 | $ | (0.51 | ) | $ | — | |||||||||||||
| 11/30/2013 |
20.04 | 0.62 | 0.92 | 1.54 | (0.56 | ) | (0.04 | ) | ||||||||||||||||||
| 11/30/2012 |
19.97 | 0.61 | 1.38 | 1.99 | (0.75 | ) | (1.17 | ) | ||||||||||||||||||
| 11/30/2011 |
20.94 | 0.62 | (0.14 | ) | 0.48 | (0.89 | ) | (0.56 | ) | |||||||||||||||||
| 11/30/2010 |
19.47 | 0.59 | 1.56 | 2.15 | (0.52 | ) | (0.16 | ) | ||||||||||||||||||
| 12/29/2008* - 11/30/2009 |
15.00 | 0.43 | 4.04 | 4.47 | — | — | ||||||||||||||||||||
| Administrative Class | ||||||||||||||||||||||||||
| 5/31/2014+ |
$ | 20.87 | $ | 0.27 | $ | 0.70 | $ | 0.97 | $ | (0.47 | ) | $ | — | |||||||||||||
| 11/30/2013 |
19.96 | 0.26 | 1.21 | 1.47 | (0.52 | ) | (0.04 | ) | ||||||||||||||||||
| 11/30/2012 |
19.91 | 0.57 | 1.35 | 1.92 | (0.70 | ) | (1.17 | ) | ||||||||||||||||||
| 11/30/2011 |
20.88 | 0.58 | (0.14 | ) | 0.44 | (0.85 | ) | (0.56 | ) | |||||||||||||||||
| 11/30/2010 |
19.43 | 0.55 | 1.54 | 2.09 | (0.48 | ) | (0.16 | ) | ||||||||||||||||||
| 12/29/2008* - 11/30/2009 |
15.00 | 0.39 | 4.04 | 4.43 | — | — | ||||||||||||||||||||
| AllianzGI Retirement 2035: | ||||||||||||||||||||||||||
| Class A | ||||||||||||||||||||||||||
| 5/31/2014+ |
$ | 18.09 | $ | 0.23 | $ | 0.66 | $ | 0.89 | $ | (0.40 | ) | $ | — | |||||||||||||
| 11/30/2013 |
16.94 | 0.43 | 1.20 | 1.63 | (0.42 | ) | (0.06 | ) | ||||||||||||||||||
| 12/19/2011* - 11/30/2012 |
15.00 | 0.37 | 1.74 | 2.11 | (0.17 | ) | — | |||||||||||||||||||
| Class R | ||||||||||||||||||||||||||
| 5/31/2014+ |
$ | 18.00 | $ | 0.19 | $ | 0.67 | $ | 0.86 | $ | (0.30 | ) | $ | — | |||||||||||||
| 11/30/2013 |
16.89 | 0.41 | 1.15 | 1.56 | (0.39 | ) | (0.06 | ) | ||||||||||||||||||
| 12/19/2011* - 11/30/2012 |
15.00 | 0.16 | 1.90 | 2.06 | (0.17 | ) | — | |||||||||||||||||||
| Class P | ||||||||||||||||||||||||||
| 5/31/2014+ |
$ | 18.20 | $ | 0.20 | $ | 0.72 | $ | 0.92 | $ | (0.41 | ) | $ | — | |||||||||||||
| 11/30/2013 |
16.99 | 0.49 | 1.20 | 1.69 | (0.42 | ) | (0.06 | ) | ||||||||||||||||||
| 12/19/2011* - 11/30/2012 |
15.00 | 0.38 | 1.79 | 2.17 | (0.18 | ) | — | |||||||||||||||||||
| Class R6 | ||||||||||||||||||||||||||
| 5/31/2014+ |
$ | 18.23 | $ | 0.25 | $ | 0.68 | $ | 0.93 | $ | (0.42 | ) | $ | — | |||||||||||||
| 11/30/2013 |
17.00 | 0.54 | 1.17 | 1.71 | (0.42 | ) | (0.06 | ) | ||||||||||||||||||
| 12/19/2011* - 11/30/2012 |
15.00 | 0.46 | 1.72 | 2.18 | (0.18 | ) | — | |||||||||||||||||||
| Administrative Class | ||||||||||||||||||||||||||
| 5/31/2014+ |
$ | 18.15 | $ | 0.23 | $ | 0.67 | $ | 0.90 | $ | (0.39 | ) | $ | — | |||||||||||||
| 11/30/2013 |
16.94 | 0.22 | 1.43 | 1.65 | (0.38 | ) | (0.06 | ) | ||||||||||||||||||
| 12/19/2011* - 11/30/2012 |
15.00 | 0.42 | 1.69 | 2.11 | (0.17 | ) | — | |||||||||||||||||||
| + | Unaudited |
| * | Commencement of operations. |
| (a) | Calculated on average shares outstanding during the period. |
| (b) | Total return is calculated assuming a purchase of a share on the first day of the period and a sale of a share on the last day of each period reported. Dividends and distributions, if any, are assumed, for purposes of this calculation, to be reinvested. Total return does not reflect sales charges and includes the effect of fee waivers and reimbursements. Total return may reflect adjustments to conform to generally accepted accounting principles. Total return for a period of less than one year is not annualized. |
| (c) | Does not include expenses of the investment companies in which the Fund invests. |
| (d) | Annualized. |
| (e) | See Note 6 in the Notes to Financial Statements. |
| 182 | Semiannual Report | | May 31, 2014 | | See accompanying Notes to Financial Statements |
Table of Contents
| Total Dividends and Distributions |
Net Asset Value, End of Period |
Total Return (b) | Net Assets, End of Period (000s) |
Ratio of Expenses to Average Net Assets with Fee Waiver/ Reimbursement (c) |
Ratio of Expenses to Average Net Assets without Fee Waiver/ Reimbursement (c) |
Ratio of Net Investment Income to Average Net Assets (c) |
Portfolio Turnover Rate |
|||||||||||||||||||||||||
| $ | (0.51 | ) | $ | 21.48 | 4.97 | % | $ | 10,844 | — | %(d)(e) | 0.10 | %(d) | 2.95 | %(d) | 46 | % | ||||||||||||||||
| (0.60 | ) | 20.98 | 7.87 | 10,854 | — | (e) | 0.12 | 3.05 | 79 | |||||||||||||||||||||||
| (1.92 | ) | 20.04 | 11.07 | 9,182 | — | (e) | 0.15 | 3.14 | 47 | |||||||||||||||||||||||
| (1.45 | ) | 19.97 | 2.23 | 5,813 | 0.13 | 2.24 | 3.04 | 52 | ||||||||||||||||||||||||
| (0.68 | ) | 20.94 | 11.35 | 5,145 | 0.33 | 5.29 | 3.02 | 33 | ||||||||||||||||||||||||
| — | 19.47 | 29.80 | 4,163 | 0.33 | (d) | 6.27 | (d) | 2.77 | (d) | 11 | ||||||||||||||||||||||
| $ | (0.47 | ) | $ | 21.37 | 4.78 | % | $ | 8,632 | 0.30 | %(d) | 0.45 | %(d) | 2.59 | %(d) | 46 | % | ||||||||||||||||
| (0.56 | ) | 20.87 | 7.55 | 8,939 | 0.30 | 0.45 | 1.29 | 79 | ||||||||||||||||||||||||
| (1.87 | ) | 19.96 | 10.60 | 16 | 0.24 | 0.45 | 2.95 | 47 | ||||||||||||||||||||||||
| (1.41 | ) | 19.91 | 1.99 | 15 | 0.41 | 2.52 | 2.85 | 52 | ||||||||||||||||||||||||
| (0.64 | ) | 20.88 | 11.04 | 14 | 0.58 | 5.55 | 2.82 | 33 | ||||||||||||||||||||||||
| — | 19.43 | 29.53 | 13 | 0.58 | (d) | 6.52 | (d) | 2.52 | (d) | 11 | ||||||||||||||||||||||
| $ | (0.40 | ) | $ | 18.58 | 5.00 | % | $ | 14,709 | 0.35 | %(d) | 0.60 | %(d) | 2.53 | %(d) | 40 | % | ||||||||||||||||
| (0.48 | ) | 18.09 | 9.83 | 6,939 | 0.35 | 0.60 | 2.48 | 67 | ||||||||||||||||||||||||
| (0.17 | ) | 16.94 | 14.23 | 104 | 0.30 | (d) | 0.60 | (d) | 2.36 | (d) | 38 | |||||||||||||||||||||
| $ | (0.30 | ) | $ | 18.56 | 4.81 | % | $ | 1,045 | 0.70 | %(d) | 0.85 | %(d) | 2.11 | %(d) | 40 | % | ||||||||||||||||
| (0.45 | ) | 18.00 | 9.46 | 961 | 0.70 | 0.85 | 2.38 | 67 | ||||||||||||||||||||||||
| (0.17 | ) | 16.89 | 13.88 | 893 | 0.65 | (d) | 0.85 | (d) | 1.04 | (d) | 38 | |||||||||||||||||||||
| $ | (0.41 | ) | $ | 18.71 | 5.18 | % | $ | 14,363 | 0.05 | %(d) | 0.20 | %(d) | 2.18 | %(d) | 40 | % | ||||||||||||||||
| (0.48 | ) | 18.20 | 10.19 | 5,333 | 0.05 | 0.20 | 2.83 | 67 | ||||||||||||||||||||||||
| (0.18 | ) | 16.99 | 14.58 | 4,090 | — | (d) | 0.20 | (d) | 2.43 | (d) | 38 | |||||||||||||||||||||
| $ | (0.42 | ) | $ | 18.74 | 5.29 | % | $ | 8,458 | — | %(d)(e) | 0.10 | %(d) | 2.79 | %(d) | 40 | % | ||||||||||||||||
| (0.48 | ) | 18.23 | 10.24 | 5,850 | — | (e) | 0.12 | 3.10 | 67 | |||||||||||||||||||||||
| (0.18 | ) | 17.00 | 14.65 | 5,132 | — | (d)(e) | 0.15 | (d) | 3.00 | (d) | 38 | |||||||||||||||||||||
| $ | (0.39 | ) | $ | 18.66 | 5.05 | % | $ | 11,114 | 0.30 | %(d) | 0.45 | %(d) | 2.52 | %(d) | 40 | % | ||||||||||||||||
| (0.44 | ) | 18.15 | 9.95 | 10,427 | 0.30 | 0.45 | 1.29 | 67 | ||||||||||||||||||||||||
| (0.17 | ) | 16.94 | 14.23 | 12 | 0.25 | (d) | 0.45 | (d) | 2.76 | (d) | 38 | |||||||||||||||||||||
| See accompanying Notes to Financial Statements | | May 31, 2014 | | Semiannual Report | 183 |
Table of Contents
Financial Highlights (cont’d)
For a Share Outstanding for the Period ended:
| Net Asset Value, Beginning of Period |
Net Investment Income (a) |
Net Realized and Change in Unrealized Gain (Loss) |
Total from Investment Operations |
Dividends from Net Investment Income |
Distributions from Net Realized Capital Gains |
|||||||||||||||||||||
| AllianzGI Retirement 2040: | ||||||||||||||||||||||||||
| Class A | ||||||||||||||||||||||||||
| 5/31/2014+ |
$ | 21.45 | $ | 0.27 | $ | 0.84 | $ | 1.11 | $ | (0.51 | ) | $ | — | |||||||||||||
| 11/30/2013 |
19.71 | 0.49 | 1.82 | 2.31 | (0.53 | ) | (0.04 | ) | ||||||||||||||||||
| 11/30/2012 |
20.22 | 0.29 | 1.61 | 1.90 | (0.69 | ) | (1.72 | ) | ||||||||||||||||||
| 11/30/2011 |
21.88 | 0.52 | (0.27 | ) | 0.25 | (0.97 | ) | (0.94 | ) | |||||||||||||||||
| 11/30/2010 |
20.08 | 0.73 | 1.71 | 2.44 | (0.49 | ) | (0.15 | ) | ||||||||||||||||||
| 12/29/2008* - 11/30/2009 |
15.00 | 0.30 | 4.78 | 5.08 | — | — | ||||||||||||||||||||
| Class C | ||||||||||||||||||||||||||
| 5/31/2014+ |
$ | 21.21 | $ | 0.17 | $ | 0.86 | $ | 1.03 | $ | (0.33 | ) | $ | — | |||||||||||||
| 11/30/2013 |
19.53 | 0.34 | 1.80 | 2.14 | (0.42 | ) | (0.04 | ) | ||||||||||||||||||
| 11/30/2012 |
20.07 | 0.31 | 1.43 | 1.74 | (0.56 | ) | (1.72 | ) | ||||||||||||||||||
| 11/30/2011 |
21.65 | 0.27 | (0.18 | ) | 0.09 | (0.73 | ) | (0.94 | ) | |||||||||||||||||
| 11/30/2010 |
19.92 | 0.57 | 1.69 | 2.26 | (0.38 | ) | (0.15 | ) | ||||||||||||||||||
| 12/29/2008* - 11/30/2009 |
15.00 | 0.19 | 4.73 | 4.92 | — | — | ||||||||||||||||||||
| Class D | ||||||||||||||||||||||||||
| 5/31/2014+ |
$ | 21.42 | $ | 0.25 | $ | 0.85 | $ | 1.10 | $ | (0.43 | ) | $ | — | |||||||||||||
| 11/30/2013 |
19.61 | 0.56 | 1.74 | 2.30 | (0.45 | ) | (0.04 | ) | ||||||||||||||||||
| 11/30/2012 |
20.16 | 0.41 | 1.44 | 1.85 | (0.68 | ) | (1.72 | ) | ||||||||||||||||||
| 11/30/2011 |
21.88 | 0.76 | (0.51 | ) | 0.25 | (1.03 | ) | (0.94 | ) | |||||||||||||||||
| 11/30/2010 |
20.05 | 0.52 | 1.92 | 2.44 | (0.46 | ) | (0.15 | ) | ||||||||||||||||||
| 12/29/2008* - 11/30/2009 |
15.00 | 0.32 | 4.73 | 5.05 | — | — | ||||||||||||||||||||
| Class R | ||||||||||||||||||||||||||
| 5/31/2014+ |
$ | 21.31 | $ | 0.22 | $ | 0.85 | $ | 1.07 | $ | (0.40 | ) | $ | — | |||||||||||||
| 11/30/2013 |
19.63 | 0.44 | 1.80 | 2.24 | (0.52 | ) | (0.04 | ) | ||||||||||||||||||
| 11/30/2012 |
20.16 | 0.16 | 1.66 | 1.82 | (0.63 | ) | (1.72 | ) | ||||||||||||||||||
| 11/30/2011 |
21.85 | 0.56 | (0.36 | ) | 0.20 | (0.95 | ) | (0.94 | ) | |||||||||||||||||
| 11/30/2010 |
20.03 | 0.59 | 1.80 | 2.39 | (0.42 | ) | (0.15 | ) | ||||||||||||||||||
| 12/29/2008* - 11/30/2009 |
15.00 | 0.26 | 4.77 | 5.03 | — | — | ||||||||||||||||||||
| Class P | ||||||||||||||||||||||||||
| 5/31/2014+ |
$ | 21.63 | $ | 0.23 | $ | 0.93 | $ | 1.16 | $ | (0.53 | ) | $ | — | |||||||||||||
| 11/30/2013 |
19.82 | 0.49 | 1.90 | 2.39 | (0.54 | ) | (0.04 | ) | ||||||||||||||||||
| 11/30/2012 |
20.31 | 0.39 | 1.57 | 1.96 | (0.73 | ) | (1.72 | ) | ||||||||||||||||||
| 11/30/2011 |
21.97 | 0.67 | (0.36 | ) | 0.31 | (1.03 | ) | (0.94 | ) | |||||||||||||||||
| 11/30/2010 |
20.12 | 0.68 | 1.80 | 2.48 | (0.48 | ) | (0.15 | ) | ||||||||||||||||||
| 12/29/2008* - 11/30/2009 |
15.00 | 0.33 | 4.79 | 5.12 | — | — | ||||||||||||||||||||
| + | Unaudited |
| * | Commencement of operations. |
| (a) | Calculated on average shares outstanding during the period. |
| (b) | Total return is calculated assuming a purchase of a share on the first day of the period and a sale of a share on the last day of each period reported. Dividends and distributions, if any, are assumed, for purposes of this calculation, to be reinvested. Total return does not reflect sales charges and includes the effect of fee waivers and reimbursements. Total return may reflect adjustments to conform to generally accepted accounting principles. Total return for a period of less than one year is not annualized. |
| (c) | Does not include expenses of the investment companies in which the Fund invests. |
| (d) | Annualized. |
| (e) | See Note 6 in the Notes to Financial Statements. |
| 184 | Semiannual Report | | May 31, 2014 | | See accompanying Notes to Financial Statements |
Table of Contents
| Total Dividends and Distributions |
Net Asset Value, End of Period |
Total Return (b) | Net Assets, End of Period (000s) |
Ratio of Expenses to Average Net Assets with Fee Waiver/ Reimbursement (c) |
Ratio of Expenses to Average Net Assets without Fee Waiver/ Reimbursement (c) |
Ratio of Net Investment Income to Average Net Assets (c) |
Portfolio Turnover Rate |
|||||||||||||||||||||||||
| $ | (0.51 | ) | $ | 22.05 | 5.26 | % | $ | 13,179 | 0.34 | %(d) | 0.60 | %(d) | 2.53 | %(d) | 38 | % | ||||||||||||||||
| (0.57 | ) | 21.45 | 12.11 | 5,513 | 0.35 | 0.60 | 2.40 | 61 | ||||||||||||||||||||||||
| (2.41 | ) | 19.71 | 10.61 | 1,915 | 0.28 | 0.60 | 1.52 | 45 | ||||||||||||||||||||||||
| (1.91 | ) | 20.22 | 0.81 | 151 | 0.42 | 2.96 | 2.42 | 53 | ||||||||||||||||||||||||
| (0.64 | ) | 21.88 | 12.48 | 79 | 0.56 | 5.99 | 3.57 | 44 | ||||||||||||||||||||||||
| — | 20.08 | 33.87 | 23 | 0.56 | (d) | 11.53 | (d) | 1.93 | (d) | 13 | ||||||||||||||||||||||
| $ | (0.33 | ) | $ | 21.91 | 4.94 | % | $ | 369 | 1.09 | %(d) | 1.35 | %(d) | 1.63 | %(d) | 38 | % | ||||||||||||||||
| (0.46 | ) | 21.21 | 11.20 | 317 | 1.10 | 1.35 | 1.66 | 61 | ||||||||||||||||||||||||
| (2.28 | ) | 19.53 | 9.80 | 195 | 1.03 | 1.35 | 1.66 | 45 | ||||||||||||||||||||||||
| (1.67 | ) | 20.07 | 0.07 | 87 | 1.15 | 3.56 | 1.30 | 53 | ||||||||||||||||||||||||
| (0.53 | ) | 21.65 | 11.61 | 22 | 1.31 | 6.66 | 2.82 | 44 | ||||||||||||||||||||||||
| — | 19.92 | 32.80 | 42 | 1.31 | (d) | 11.89 | (d) | 1.18 | (d) | 13 | ||||||||||||||||||||||
| $ | (0.43 | ) | $ | 22.09 | 5.28 | % | $ | 209 | 0.44 | %(d) | 0.60 | %(d) | 2.33 | %(d) | 38 | % | ||||||||||||||||
| (0.49 | ) | 21.42 | 11.94 | 229 | 0.45 | 0.60 | 2.76 | 61 | ||||||||||||||||||||||||
| (2.40 | ) | 19.61 | 10.42 | 245 | 0.38 | 0.60 | 2.16 | 45 | ||||||||||||||||||||||||
| (1.97 | ) | 20.16 | 0.77 | 187 | 0.46 | 3.00 | 3.57 | 53 | ||||||||||||||||||||||||
| (0.61 | ) | 21.88 | 12.49 | 177 | 0.56 | 6.58 | 2.51 | 44 | ||||||||||||||||||||||||
| — | 20.05 | 33.67 | 45 | 0.56 | (d) | 10.43 | (d) | 1.93 | (d) | 13 | ||||||||||||||||||||||
| $ | (0.40 | ) | $ | 21.98 | 5.11 | % | $ | 1,340 | 0.69 | %(d) | 0.85 | %(d) | 2.05 | %(d) | 38 | % | ||||||||||||||||
| (0.56 | ) | 21.31 | 11.70 | 1,167 | 0.70 | 0.85 | 2.15 | 61 | ||||||||||||||||||||||||
| (2.35 | ) | 19.63 | 10.24 | 848 | 0.63 | 0.85 | 0.87 | 45 | ||||||||||||||||||||||||
| (1.89 | ) | 20.16 | 0.54 | 15 | 0.70 | 3.22 | 2.63 | 53 | ||||||||||||||||||||||||
| (0.57 | ) | 21.85 | 12.19 | 15 | 0.81 | 6.50 | 2.90 | 44 | ||||||||||||||||||||||||
| — | 20.03 | 33.53 | 14 | 0.81 | (d) | 10.01 | (d) | 1.68 | (d) | 13 | ||||||||||||||||||||||
| $ | (0.53 | ) | $ | 22.26 | 5.45 | % | $ | 11,958 | 0.04 | %(d) | 0.20 | %(d) | 2.12 | %(d) | 38 | % | ||||||||||||||||
| (0.58 | ) | 21.63 | 12.42 | 4,704 | 0.05 | 0.20 | 2.37 | 61 | ||||||||||||||||||||||||
| (2.45 | ) | 19.82 | 10.99 | 2,343 | — | (e) | 0.20 | 2.00 | 45 | |||||||||||||||||||||||
| (1.97 | ) | 20.31 | 1.06 | 15 | 0.21 | 2.75 | 3.11 | 53 | ||||||||||||||||||||||||
| (0.63 | ) | 21.97 | 12.64 | 15 | 0.36 | 6.10 | 3.35 | 44 | ||||||||||||||||||||||||
| — | 20.12 | 34.13 | 13 | 0.36 | (d) | 6.43 | (d) | 2.13 | (d) | 13 | ||||||||||||||||||||||
| See accompanying Notes to Financial Statements | | May 31, 2014 | | Semiannual Report | 185 |
Table of Contents
Financial Highlights (cont’d)
For a Share Outstanding for the Period ended:
| Net Asset Value, Beginning of Period |
Net Investment Income (a) |
Net Realized and Change in Unrealized Gain (Loss) |
Total from Investment Operations |
Dividends from Net Investment Income |
Distributions from Net Realized Capital Gains |
|||||||||||||||||||||
| AllianzGI Retirement 2040 (cont’d) | ||||||||||||||||||||||||||
| Class R6 | ||||||||||||||||||||||||||
| 5/31/2014+ |
$ | 21.66 | $ | 0.32 | $ | 0.86 | $ | 1.18 | $ | (0.54 | ) | $ | — | |||||||||||||
| 11/30/2013 |
19.83 | 0.60 | 1.81 | 2.41 | (0.54 | ) | (0.04 | ) | ||||||||||||||||||
| 11/30/2012 |
20.33 | 0.56 | 1.41 | 1.97 | (0.75 | ) | (1.72 | ) | ||||||||||||||||||
| 11/30/2011 |
22.00 | 0.68 | (0.36 | ) | 0.32 | (1.05 | ) | (0.94 | ) | |||||||||||||||||
| 11/30/2010 |
20.13 | 0.70 | 1.82 | 2.52 | (0.50 | ) | (0.15 | ) | ||||||||||||||||||
| 12/29/2008* - 11/30/2009 |
15.00 | 0.35 | 4.78 | 5.13 | — | — | ||||||||||||||||||||
| Administrative Class | ||||||||||||||||||||||||||
| 5/31/2014+ |
$ | 21.53 | $ | 0.27 | $ | 0.85 | $ | 1.12 | $ | (0.49 | ) | $ | — | |||||||||||||
| 11/30/2013 |
19.75 | 0.26 | 2.07 | 2.33 | (0.51 | ) | (0.04 | ) | ||||||||||||||||||
| 11/30/2012 |
20.26 | 0.52 | 1.38 | 1.90 | (0.69 | ) | (1.72 | ) | ||||||||||||||||||
| 11/30/2011 |
21.93 | 0.63 | (0.36 | ) | 0.27 | (1.00 | ) | (0.94 | ) | |||||||||||||||||
| 11/30/2010 |
20.09 | 0.65 | 1.80 | 2.45 | (0.46 | ) | (0.15 | ) | ||||||||||||||||||
| 12/29/2008* - 11/30/2009 |
15.00 | 0.31 | 4.78 | 5.09 | — | — | ||||||||||||||||||||
| AllianzGI Retirement 2045: | ||||||||||||||||||||||||||
| Class A | ||||||||||||||||||||||||||
| 5/31/2014+ |
$ | 18.67 | $ | 0.23 | $ | 0.77 | $ | 1.00 | $ | (0.45 | ) | $ | — | |||||||||||||
| 11/30/2013 |
17.02 | 0.41 | 1.79 | 2.20 | (0.46 | ) | (0.09 | ) | ||||||||||||||||||
| 12/19/2011* - 11/30/2012 |
15.00 | 0.32 | 1.92 | 2.24 | (0.22 | ) | — | |||||||||||||||||||
| Class R | ||||||||||||||||||||||||||
| 5/31/2014+ |
$ | 18.57 | $ | 0.19 | $ | 0.77 | $ | 0.96 | $ | (0.36 | ) | $ | — | |||||||||||||
| 11/30/2013 |
16.96 | 0.38 | 1.75 | 2.13 | (0.43 | ) | (0.09 | ) | ||||||||||||||||||
| 12/19/2011* - 11/30/2012 |
15.00 | 0.16 | 2.02 | 2.18 | (0.22 | ) | — | |||||||||||||||||||
| Class P | ||||||||||||||||||||||||||
| 5/31/2014+ |
$ | 18.77 | $ | 0.16 | $ | 0.87 | $ | 1.03 | $ | (0.47 | ) | $ | — | |||||||||||||
| 11/30/2013 |
17.06 | 0.47 | 1.79 | 2.26 | (0.46 | ) | (0.09 | ) | ||||||||||||||||||
| 12/19/2011* - 11/30/2012 |
15.00 | 0.39 | 1.89 | 2.28 | (0.22 | ) | — | |||||||||||||||||||
| Class R6 | ||||||||||||||||||||||||||
| 5/31/2014+ |
$ | 18.80 | $ | 0.25 | $ | 0.78 | $ | 1.03 | $ | (0.47 | ) | $ | — | |||||||||||||
| 11/30/2013 |
17.07 | 0.52 | 1.76 | 2.28 | (0.46 | ) | (0.09 | ) | ||||||||||||||||||
| 12/19/2011* - 11/30/2012 |
15.00 | 0.50 | 1.79 | 2.29 | (0.22 | ) | — | |||||||||||||||||||
| Administrative Class | ||||||||||||||||||||||||||
| 5/31/2014+ |
$ | 18.71 | $ | 0.23 | $ | 0.77 | $ | 1.00 | $ | (0.44 | ) | $ | — | |||||||||||||
| 11/30/2013 |
17.01 | 0.22 | 1.99 | 2.21 | (0.42 | ) | (0.09 | ) | ||||||||||||||||||
| 12/19/2011* - 11/30/2012 |
15.00 | 0.44 | 1.79 | 2.23 | (0.22 | ) | — | |||||||||||||||||||
| + | Unaudited |
| * | Commencement of operations. |
| (a) | Calculated on average shares outstanding during the period. |
| (b) | Total return is calculated assuming a purchase of a share on the first day of the period and a sale of a share on the last day of each period reported. Dividends and distributions, if any, are assumed, for purposes of this calculation, to be reinvested. Total return does not reflect sales charges and includes the effect of fee waivers and reimbursements. Total return may reflect adjustments to conform to generally accepted accounting principles. Total return for a period of less than one year is not annualized. |
| (c) | Does not include expenses of the investment companies in which the Fund invests. |
| (d) | Annualized. |
| (e) | See Note 6 in the Notes to Financial Statements. |
| 186 | Semiannual Report | | May 31, 2014 | | See accompanying Notes to Financial Statements |
Table of Contents
| Total Dividends and Distributions |
Net Asset Value, End of Period |
Total Return (b) | Net Assets, End of Period (000s) |
Ratio of Expenses to Average Net Assets with Fee Waiver/ Reimbursement (c) |
Ratio of Expenses to Average Net Assets without Fee Waiver/ Reimbursement (c) |
Ratio of Net Investment Income to Average Net Assets (c) |
Portfolio Turnover Rate |
|||||||||||||||||||||||||
| $ | (0.54 | ) | $ | 22.30 | 5.50 | % | $ | 10,091 | — | %(d)(e) | 0.10 | %(d) | 2.97 | %(d) | 38 | % | ||||||||||||||||
| (0.58 | ) | 21.66 | 12.51 | 9,939 | — | (e) | 0.12 | 2.93 | 61 | |||||||||||||||||||||||
| (2.47 | ) | 19.83 | 11.04 | 7,782 | — | (e) | 0.15 | 2.95 | 45 | |||||||||||||||||||||||
| (1.99 | ) | 20.33 | 1.11 | 5,315 | 0.10 | 2.65 | 3.15 | 53 | ||||||||||||||||||||||||
| (0.65 | ) | 22.00 | 12.83 | 4,769 | 0.26 | 5.98 | 3.43 | 44 | ||||||||||||||||||||||||
| — | 20.13 | 34.20 | 4,100 | 0.26 | (d) | 6.33 | (d) | 2.23 | (d) | 13 | ||||||||||||||||||||||
| $ | (0.49 | ) | $ | 22.16 | 5.32 | % | $ | 5,299 | 0.29 | %(d) | 0.45 | %(d) | 2.50 | %(d) | 38 | % | ||||||||||||||||
| (0.55 | ) | 21.53 | 12.13 | 5,054 | 0.30 | 0.45 | 1.27 | 61 | ||||||||||||||||||||||||
| (2.41 | ) | 19.75 | 10.67 | 17 | 0.23 | 0.45 | 2.72 | 45 | ||||||||||||||||||||||||
| (1.94 | ) | 20.26 | 0.87 | 15 | 0.38 | 2.93 | 2.94 | 53 | ||||||||||||||||||||||||
| (0.61 | ) | 21.93 | 12.48 | 15 | 0.51 | 6.24 | 3.20 | 44 | ||||||||||||||||||||||||
| — | 20.09 | 33.93 | 13 | 0.51 | (d) | 6.58 | (d) | 1.98 | (d) | 13 | ||||||||||||||||||||||
| $ | (0.45 | ) | $ | 19.22 | 5.38 | % | $ | 8,274 | 0.33 | %(d) | 0.60 | %(d) | 2.44 | %(d) | 20 | % | ||||||||||||||||
| (0.55 | ) | 18.67 | 13.33 | 4,313 | 0.33 | 0.60 | 2.31 | 51 | ||||||||||||||||||||||||
| (0.22 | ) | 17.02 | 15.09 | 61 | 0.29 | (d) | 0.60 | (d) | 2.08 | (d) | 38 | |||||||||||||||||||||
| $ | (0.36 | ) | $ | 19.17 | 5.23 | % | $ | 414 | 0.68 | %(d) | 0.85 | %(d) | 2.01 | %(d) | 20 | % | ||||||||||||||||
| (0.52 | ) | 18.57 | 12.94 | 356 | 0.68 | 0.85 | 2.17 | 51 | ||||||||||||||||||||||||
| (0.22 | ) | 16.96 | 14.67 | 293 | 0.64 | (d) | 0.85 | (d) | 1.07 | (d) | 38 | |||||||||||||||||||||
| $ | (0.47 | ) | $ | 19.33 | 5.58 | % | $ | 8,794 | 0.03 | %(d) | 0.20 | %(d) | 1.77 | %(d) | 20 | % | ||||||||||||||||
| (0.55 | ) | 18.77 | 13.68 | 2,286 | 0.03 | 0.20 | 2.63 | 51 | ||||||||||||||||||||||||
| (0.22 | ) | 17.06 | 15.37 | 1,584 | — | (d)(e) | 0.20 | (d) | 2.46 | (d) | 38 | |||||||||||||||||||||
| $ | (0.47 | ) | $ | 19.36 | 5.60 | % | $ | 5,627 | — | %(d)(e) | 0.10 | %(d) | 2.72 | %(d) | 20 | % | ||||||||||||||||
| (0.55 | ) | 18.80 | 13.80 | 4,587 | — | (e) | 0.12 | 2.91 | 51 | |||||||||||||||||||||||
| (0.22 | ) | 17.07 | 15.44 | 3,733 | — | (d)(e) | 0.15 | (d) | 3.23 | (d) | 38 | |||||||||||||||||||||
| $ | (0.44 | ) | $ | 19.27 | 5.44 | % | $ | 1,687 | 0.28 | %(d) | 0.45 | %(d) | 2.44 | %(d) | 20 | % | ||||||||||||||||
| (0.51 | ) | 18.71 | 13.40 | 1,542 | 0.28 | 0.45 | 1.23 | 51 | ||||||||||||||||||||||||
| (0.22 | ) | 17.01 | 15.02 | 12 | 0.24 | (d) | 0.45 | (d) | 2.84 | (d) | 38 | |||||||||||||||||||||
| See accompanying Notes to Financial Statements | | May 31, 2014 | | Semiannual Report | 187 |
Table of Contents
Financial Highlights (cont’d)
For a Share Outstanding for the Period ended:
| Net Asset Value, Beginning of Period |
Net Investment Income (a) |
Net Realized and Change in Unrealized Gain (Loss) |
Total from Investment Operations |
Dividends from Net Investment Income |
Distributions from Net Realized Capital Gains |
|||||||||||||||||||||
| AllianzGI Retirement 2050: | ||||||||||||||||||||||||||
| Class A | ||||||||||||||||||||||||||
| 5/31/2014+ |
$ | 21.55 | $ | 0.24 | $ | 0.92 | $ | 1.16 | $ | (0.57 | ) | $ | — | |||||||||||||
| 11/30/2013 |
19.48 | 0.42 | 2.32 | 2.74 | (0.60 | ) | (0.07 | ) | ||||||||||||||||||
| 11/30/2012 |
20.16 | 0.28 | 1.59 | 1.87 | (0.76 | ) | (1.79 | ) | ||||||||||||||||||
| 11/30/2011 |
22.00 | 0.61 | (0.34 | ) | 0.27 | (1.09 | ) | (1.02 | ) | |||||||||||||||||
| 11/30/2010 |
20.07 | 0.62 | 1.93 | 2.55 | (0.43 | ) | (0.19 | ) | ||||||||||||||||||
| 12/29/2008* - 11/30/2009 |
15.00 | 0.31 | 4.76 | 5.07 | — | — | ||||||||||||||||||||
| Class C | ||||||||||||||||||||||||||
| 5/31/2014+ |
$ | 21.34 | $ | 0.17 | $ | 0.90 | $ | 1.07 | $ | (0.44 | ) | $ | — | |||||||||||||
| 11/30/2013 |
19.25 | 0.30 | 2.27 | 2.57 | (0.41 | ) | (0.07 | ) | ||||||||||||||||||
| 11/30/2012 |
19.92 | 0.27 | 1.44 | 1.71 | (0.59 | ) | (1.79 | ) | ||||||||||||||||||
| 11/30/2011 |
21.85 | 0.44 | (0.34 | ) | 0.10 | (1.01 | ) | (1.02 | ) | |||||||||||||||||
| 11/30/2010 |
19.96 | 0.43 | 1.96 | 2.39 | (0.31 | ) | (0.19 | ) | ||||||||||||||||||
| 12/29/2008* - 11/30/2009 |
15.00 | 0.18 | 4.78 | 4.96 | — | — | ||||||||||||||||||||
| Class D | ||||||||||||||||||||||||||
| 5/31/2014+ |
$ | 21.58 | $ | 0.25 | $ | 0.89 | $ | 1.14 | $ | (0.52 | ) | $ | — | |||||||||||||
| 11/30/2013 |
19.48 | 0.45 | 2.28 | 2.73 | (0.56 | ) | (0.07 | ) | ||||||||||||||||||
| 11/30/2012 |
20.15 | 0.48 | 1.37 | 1.85 | (0.73 | ) | (1.79 | ) | ||||||||||||||||||
| 11/30/2011 |
22.01 | 0.59 | (0.34 | ) | 0.25 | (1.09 | ) | (1.02 | ) | |||||||||||||||||
| 11/30/2010 |
20.09 | 0.62 | 1.93 | 2.55 | (0.44 | ) | (0.19 | ) | ||||||||||||||||||
| 12/29/2008* - 11/30/2009 |
15.00 | 0.32 | 4.77 | 5.09 | — | — | ||||||||||||||||||||
| Class R | ||||||||||||||||||||||||||
| 5/31/2014+ |
$ | 21.46 | $ | 0.21 | $ | 0.90 | $ | 1.11 | $ | (0.45 | ) | $ | — | |||||||||||||
| 11/30/2013 |
19.47 | 0.37 | 2.29 | 2.66 | (0.60 | ) | (0.07 | ) | ||||||||||||||||||
| 11/30/2012 |
20.12 | 0.18 | 1.64 | 1.82 | (0.68 | ) | (1.79 | ) | ||||||||||||||||||
| 11/30/2011 |
21.97 | 0.58 | (0.37 | ) | 0.21 | (1.04 | ) | (1.02 | ) | |||||||||||||||||
| 11/30/2010 |
20.06 | 0.61 | 1.88 | 2.49 | (0.39 | ) | (0.19 | ) | ||||||||||||||||||
| 12/29/2008* - 11/30/2009 |
15.00 | 0.26 | 4.80 | 5.06 | — | — | ||||||||||||||||||||
| Class P | ||||||||||||||||||||||||||
| 5/31/2014+ |
$ | 21.77 | $ | 0.18 | $ | 1.02 | $ | 1.20 | $ | (0.59 | ) | $ | — | |||||||||||||
| 11/30/2013 |
19.64 | 0.48 | 2.35 | 2.83 | (0.63 | ) | (0.07 | ) | ||||||||||||||||||
| 11/30/2012 |
20.27 | 0.38 | 1.56 | 1.94 | (0.78 | ) | (1.79 | ) | ||||||||||||||||||
| 11/30/2011 |
22.10 | 0.69 | (0.39 | ) | 0.30 | (1.11 | ) | (1.02 | ) | |||||||||||||||||
| 11/30/2010 |
20.14 | 0.71 | 1.89 | 2.60 | (0.45 | ) | (0.19 | ) | ||||||||||||||||||
| 12/29/2008* - 11/30/2009 |
15.00 | 0.33 | 4.81 | 5.14 | — | — | ||||||||||||||||||||
| + | Unaudited |
| * | Commencement of operations. |
| (a) | Calculated on average shares outstanding during the period. |
| (b) | Total return is calculated assuming a purchase of a share on the first day of the period and a sale of a share on the last day of each period reported. Dividends and distributions, if any, are assumed, for purposes of this calculation, to be reinvested. Total return does not reflect sales charges and includes the effect of fee waivers and reimbursements. Total return may reflect adjustments to conform to generally accepted accounting principles. Total return for a period of less than one year is not annualized. |
| (c) | Does not include expenses of the investment companies in which the Fund invests. |
| (d) | Annualized. |
| (e) | See Note 6 in the Notes to Financial Statements. |
| 188 | Semiannual Report | | May 31, 2014 | | See accompanying Notes to Financial Statements |
Table of Contents
| Total Dividends and Distributions |
Net Asset Value, End of Period |
Total Return (b) | Net Assets, End of Period (000s) |
Ratio of Expenses to Average Net Assets with Fee Waiver/ Reimbursement (c) |
Ratio of Expenses to Average Net Assets without Fee Waiver/ Reimbursement (c) |
Ratio of Net Investment Income to Average Net Assets (c) |
Portfolio Turnover Rate |
|||||||||||||||||||||||||
| $ | (0.57 | ) | $ | 22.14 | 5.49 | % | $ | 3,421 | 0.31 | %(d) | 0.60 | %(d) | 2.22 | %(d) | 28 | % | ||||||||||||||||
| (0.67 | ) | 21.55 | 14.50 | 1,014 | 0.30 | 0.60 | 2.08 | 54 | ||||||||||||||||||||||||
| (2.55 | ) | 19.48 | 10.64 | 1,371 | 0.26 | 0.60 | 1.45 | 47 | ||||||||||||||||||||||||
| (2.11 | ) | 20.16 | 0.80 | 71 | 0.41 | 2.92 | 2.85 | 51 | ||||||||||||||||||||||||
| (0.62 | ) | 22.00 | 13.02 | 57 | 0.56 | 6.28 | 3.05 | 37 | ||||||||||||||||||||||||
| — | 20.07 | 33.80 | 30 | 0.56 | (d) | 9.92 | (d) | 1.91 | (d) | 11 | ||||||||||||||||||||||
| $ | (0.44 | ) | $ | 21.97 | 5.11 | % | $ | 136 | 1.06 | %(d) | 1.35 | %(d) | 1.56 | %(d) | 28 | % | ||||||||||||||||
| (0.48 | ) | 21.34 | 13.64 | 119 | 1.05 | 1.35 | 1.48 | 54 | ||||||||||||||||||||||||
| (2.38 | ) | 19.25 | 9.78 | 60 | 1.01 | 1.35 | 1.44 | 47 | ||||||||||||||||||||||||
| (2.03 | ) | 19.92 | (0.01 | ) | 48 | 1.17 | 3.70 | 2.09 | 51 | |||||||||||||||||||||||
| (0.50 | ) | 21.85 | 12.21 | 35 | 1.31 | 7.37 | 2.11 | 37 | ||||||||||||||||||||||||
| — | 19.96 | 33.07 | 13 | 1.31 | (d) | 10.64 | (d) | 1.16 | (d) | 11 | ||||||||||||||||||||||
| $ | (0.52 | ) | $ | 22.20 | 5.41 | % | $ | 285 | 0.41 | %(d) | 0.60 | %(d) | 2.34 | %(d) | 28 | % | ||||||||||||||||
| (0.63 | ) | 21.58 | 14.42 | 333 | 0.40 | 0.60 | 2.21 | 54 | ||||||||||||||||||||||||
| (2.52 | ) | 19.48 | 10.51 | 202 | 0.36 | 0.60 | 2.55 | 47 | ||||||||||||||||||||||||
| (2.11 | ) | 20.15 | 0.75 | 189 | 0.44 | 3.02 | 2.74 | 51 | ||||||||||||||||||||||||
| (0.63 | ) | 22.01 | 12.99 | 166 | 0.56 | 6.36 | 3.04 | 37 | ||||||||||||||||||||||||
| — | 20.09 | 33.93 | 91 | 0.56 | (d) | 11.64 | (d) | 1.91 | (d) | 11 | ||||||||||||||||||||||
| $ | (0.45 | ) | $ | 22.12 | 5.34 | % | $ | 572 | 0.66 | %(d) | 0.85 | %(d) | 1.96 | %(d) | 28 | % | ||||||||||||||||
| (0.67 | ) | 21.46 | 14.11 | 497 | 0.65 | 0.85 | 1.85 | 54 | ||||||||||||||||||||||||
| (2.47 | ) | 19.47 | 10.30 | 359 | 0.61 | 0.85 | 0.96 | 47 | ||||||||||||||||||||||||
| (2.06 | ) | 20.12 | 0.51 | 17 | 0.69 | 3.21 | 2.71 | 51 | ||||||||||||||||||||||||
| (0.58 | ) | 21.97 | 12.75 | 17 | 0.81 | 6.49 | 2.98 | 37 | ||||||||||||||||||||||||
| — | 20.06 | 33.73 | 13 | 0.81 | (d) | 10.14 | (d) | 1.66 | (d) | 11 | ||||||||||||||||||||||
| $ | (0.59 | ) | $ | 22.38 | 5.63 | % | $ | 5,330 | 0.01 | %(d) | 0.20 | %(d) | 1.68 | %(d) | 28 | % | ||||||||||||||||
| (0.70 | ) | 21.77 | 14.90 | 1,397 | — | 0.20 | 2.34 | 54 | ||||||||||||||||||||||||
| (2.57 | ) | 19.64 | 11.00 | 762 | — | (e) | 0.20 | 1.98 | 47 | |||||||||||||||||||||||
| (2.13 | ) | 20.27 | 0.96 | 15 | 0.19 | 2.75 | 3.21 | 51 | ||||||||||||||||||||||||
| (0.64 | ) | 22.10 | 13.26 | 15 | 0.36 | 6.08 | 3.48 | 37 | ||||||||||||||||||||||||
| — | 20.14 | 34.27 | 14 | 0.36 | (d) | 7.10 | (d) | 2.11 | (d) | 11 | ||||||||||||||||||||||
| See accompanying Notes to Financial Statements | | May 31, 2014 | | Semiannual Report | 189 |
Table of Contents
Financial Highlights (cont’d)
For a Share Outstanding for the Period ended:
| Net Asset Value, Beginning of Period |
Net Investment Income (a) |
Net Realized and Change in Unrealized Gain (Loss) |
Total from Investment Operations |
Dividends from Net Investment Income |
Distributions from Net Realized Capital Gains |
|||||||||||||||||||||
| AllianzGI Retirement 2050 (cont’d) | ||||||||||||||||||||||||||
| Class R6 | ||||||||||||||||||||||||||
| 5/31/2014+ |
$ | 21.80 | $ | 0.30 | $ | 0.92 | $ | 1.22 | $ | (0.59 | ) | $ | — | |||||||||||||
| 11/30/2013 |
19.66 | 0.55 | 2.29 | 2.84 | (0.63 | ) | (0.07 | ) | ||||||||||||||||||
| 11/30/2012 |
20.30 | 0.58 | 1.38 | 1.96 | (0.81 | ) | (1.79 | ) | ||||||||||||||||||
| 11/30/2011 |
22.12 | 0.69 | (0.35 | ) | 0.34 | (1.14 | ) | (1.02 | ) | |||||||||||||||||
| 11/30/2010 |
20.16 | 0.73 | 1.89 | 2.62 | (0.47 | ) | (0.19 | ) | ||||||||||||||||||
| 12/29/2008* - 11/30/2009 |
15.00 | 0.34 | 4.82 | 5.16 | — | — | ||||||||||||||||||||
| Administrative Class | ||||||||||||||||||||||||||
| 5/31/2014+ |
$ | 21.69 | $ | 0.26 | $ | 0.91 | $ | 1.17 | $ | (0.56 | ) | $ | — | |||||||||||||
| 11/30/2013 |
19.58 | 0.22 | 2.55 | 2.77 | (0.59 | ) | (0.07 | ) | ||||||||||||||||||
| 11/30/2012 |
20.23 | 0.53 | 1.36 | 1.89 | (0.75 | ) | (1.79 | ) | ||||||||||||||||||
| 11/30/2011 |
22.06 | 0.65 | (0.38 | ) | 0.27 | (1.08 | ) | (1.02 | ) | |||||||||||||||||
| 11/30/2010 |
20.11 | 0.68 | 1.89 | 2.57 | (0.43 | ) | (0.19 | ) | ||||||||||||||||||
| 12/29/2008* - 11/30/2009 |
15.00 | 0.30 | 4.81 | 5.11 | — | — | ||||||||||||||||||||
| AllianzGI Retirement 2055: | ||||||||||||||||||||||||||
| Class A | ||||||||||||||||||||||||||
| 5/31/2014+ |
$ | 18.51 | $ | 0.24 | $ | 0.78 | $ | 1.02 | $ | (0.52 | ) | $ | (0.06 | ) | ||||||||||||
| 11/30/2013 |
17.02 | 0.26 | 2.11 | 2.37 | (0.59 | ) | (0.29 | ) | ||||||||||||||||||
| 12/19/2011* - 11/30/2012 |
15.00 | 0.44 | 1.80 | 2.24 | (0.22 | ) | — | |||||||||||||||||||
| Class R | ||||||||||||||||||||||||||
| 5/31/2014+ |
$ | 18.42 | $ | 0.17 | $ | 0.81 | $ | 0.98 | $ | (0.43 | ) | $ | (0.06 | ) | ||||||||||||
| 11/30/2013 |
16.97 | 0.30 | 2.00 | 2.30 | (0.56 | ) | (0.29 | ) | ||||||||||||||||||
| 12/19/2011* - 11/30/2012 |
15.00 | 0.31 | 1.88 | 2.19 | (0.22 | ) | — | |||||||||||||||||||
| Class P | ||||||||||||||||||||||||||
| 5/31/2014+ |
$ | 18.61 | $ | 0.16 | $ | 0.89 | $ | 1.05 | $ | (0.53 | ) | $ | (0.06 | ) | ||||||||||||
| 11/30/2013 |
17.08 | 0.34 | 2.09 | 2.43 | (0.61 | ) | (0.29 | ) | ||||||||||||||||||
| 12/19/2011* - 11/30/2012 |
15.00 | 0.43 | 1.87 | 2.30 | (0.22 | ) | — | |||||||||||||||||||
| Class R6 | ||||||||||||||||||||||||||
| 5/31/2014+ |
$ | 18.64 | $ | 0.25 | $ | 0.81 | $ | 1.06 | $ | (0.53 | ) | $ | (0.06 | ) | ||||||||||||
| 11/30/2013 |
17.09 | 0.49 | 1.96 | 2.45 | (0.61 | ) | (0.29 | ) | ||||||||||||||||||
| 12/19/2011* - 11/30/2012 |
15.00 | 0.50 | 1.81 | 2.31 | (0.22 | ) | — | |||||||||||||||||||
| Administrative Class | ||||||||||||||||||||||||||
| 5/31/2014+ |
$ | 18.55 | $ | 0.21 | $ | 0.82 | $ | 1.03 | $ | (0.51 | ) | $ | (0.06 | ) | ||||||||||||
| 11/30/2013 |
17.03 | 0.22 | 2.16 | 2.38 | (0.57 | ) | (0.29 | ) | ||||||||||||||||||
| 12/19/2011* - 11/30/2012 |
15.00 | 0.44 | 1.81 | 2.25 | (0.22 | ) | — | |||||||||||||||||||
| + | Unaudited |
| * | Commencement of operations. |
| (a) | Calculated on average shares outstanding during the period. |
| (b) | Total return is calculated assuming a purchase of a share on the first day of the period and a sale of a share on the last day of each period reported. Dividends and distributions, if any, are assumed, for purposes of this calculation, to be reinvested. Total return does not reflect sales charges and includes the effect of fee waivers and reimbursements. Total return may reflect adjustments to conform to generally accepted accounting principles. Total return for a period of less than one year is not annualized. |
| (c) | Does not include expenses of the investment companies in which the Fund invests. |
| (d) | Annualized. |
| (e) | See Note 6 in the Notes to Financial Statements. |
| 190 | Semiannual Report | | May 31, 2014 | | See accompanying Notes to Financial Statements |
Table of Contents
| Total Dividends and Distributions |
Net Asset Value, End of Period |
Total Return (b) | Net Assets, End of Period (000s) |
Ratio of Expenses to Average Net Assets with Fee Waiver/ Reimbursement (c) |
Ratio of Expenses to Average Net Assets without Fee Waiver/ Reimbursement (c) |
Ratio of Net Investment Income to Average Net Assets (c) |
Portfolio Turnover Rate |
|||||||||||||||||||||||||
| $ | (0.59 | ) | $ | 22.43 | 5.71 | % | $ | 9,034 | — | %(d)(e) | 0.10 | %(d) | 2.78 | %(d) | 28 | % | ||||||||||||||||
| (0.70 | ) | 21.80 | 14.94 | 8,935 | — | (e) | 0.12 | 2.68 | 54 | |||||||||||||||||||||||
| (2.60 | ) | 19.66 | 11.06 | 6,431 | — | (e) | 0.15 | 3.03 | 47 | |||||||||||||||||||||||
| (2.16 | ) | 20.30 | 1.11 | 5,149 | 0.09 | 2.65 | 3.22 | 51 | ||||||||||||||||||||||||
| (0.66 | ) | 22.12 | 13.34 | 4,619 | 0.26 | 5.97 | 3.56 | 37 | ||||||||||||||||||||||||
| — | 20.16 | 34.40 | 3,963 | 0.26 | (d) | 7.00 | (d) | 2.21 | (d) | 11 | ||||||||||||||||||||||
| $ | (0.56 | ) | $ | 22.30 | 5.46 | % | $ | 1,289 | 0.26 | %(d) | 0.45 | %(d) | 2.42 | %(d) | 28 | % | ||||||||||||||||
| (0.66 | ) | 21.69 | 14.66 | 1,194 | 0.25 | 0.45 | 1.07 | 54 | ||||||||||||||||||||||||
| (2.54 | ) | 19.58 | 10.62 | 17 | 0.21 | 0.45 | 2.77 | 47 | ||||||||||||||||||||||||
| (2.10 | ) | 20.23 | 0.82 | 15 | 0.37 | 2.93 | 3.04 | 51 | ||||||||||||||||||||||||
| (0.62 | ) | 22.06 | 13.09 | 15 | 0.51 | 6.23 | 3.32 | 37 | ||||||||||||||||||||||||
| — | 20.11 | 34.07 | 14 | 0.51 | (d) | 7.25 | (d) | 1.96 | (d) | 11 | ||||||||||||||||||||||
| $ | (0.58 | ) | $ | 18.95 | 5.63 | % | $ | 632 | 0.30 | %(d) | 0.60 | %(d) | 2.60 | %(d) | 26 | % | ||||||||||||||||
| (0.88 | ) | 18.51 | 14.59 | 135 | 0.30 | 0.60 | 1.52 | 41 | ||||||||||||||||||||||||
| (0.22 | ) | 17.02 | 15.10 | 11 | 0.27 | (d) | 0.60 | (d) | 2.82 | (d) | 31 | |||||||||||||||||||||
| $ | (0.49 | ) | $ | 18.91 | 5.45 | % | $ | 106 | 0.65 | %(d) | 0.85 | %(d) | 1.82 | %(d) | 26 | % | ||||||||||||||||
| (0.85 | ) | 18.42 | 14.22 | 72 | 0.65 | 0.85 | 1.75 | 41 | ||||||||||||||||||||||||
| (0.22 | ) | 16.97 | 14.75 | 39 | 0.62 | (d) | 0.85 | (d) | 1.99 | (d) | 31 | |||||||||||||||||||||
| $ | (0.59 | ) | $ | 19.07 | 5.82 | % | $ | 998 | — | %(d) | 0.20 | %(d) | 1.71 | %(d) | 26 | % | ||||||||||||||||
| (0.90 | ) | 18.61 | 14.88 | 240 | — | 0.20 | 1.96 | 41 | ||||||||||||||||||||||||
| (0.22 | ) | 17.08 | 15.52 | 59 | — | (d)(e) | 0.20 | (d) | 2.77 | (d) | 31 | |||||||||||||||||||||
| $ | (0.59 | ) | $ | 19.11 | 5.87 | % | $ | 4,705 | — | %(d)(e) | 0.10 | %(d) | 2.77 | %(d) | 26 | % | ||||||||||||||||
| (0.90 | ) | 18.64 | 15.06 | 4,388 | — | (e) | 0.12 | 2.77 | 41 | |||||||||||||||||||||||
| (0.22 | ) | 17.09 | 15.52 | 3,509 | — | (d)(e) | 0.15 | (d) | 3.21 | (d) | 31 | |||||||||||||||||||||
| $ | (0.57 | ) | $ | 19.01 | 5.66 | % | $ | 288 | 0.25 | %(d) | 0.45 | %(d) | 2.27 | %(d) | 26 | % | ||||||||||||||||
| (0.86 | ) | 18.55 | 14.67 | 221 | 0.25 | 0.45 | 1.22 | 41 | ||||||||||||||||||||||||
| (0.22 | ) | 17.03 | 15.17 | 11 | 0.22 | (d) | 0.46 | (d) | 2.87 | (d) | 31 | |||||||||||||||||||||
| See accompanying Notes to Financial Statements | | May 31, 2014 | | Semiannual Report | 191 |
Table of Contents
Financial Highlights (cont’d)
For a Share Outstanding for the Period ended:
| Net Asset Value, Beginning of Period |
Net Investment Income (a) |
Net Realized and Change in Unrealized Gain |
Total from Investment Operations |
Dividends from Net Investment Income |
Distributions from Net Realized Capital Gains |
|||||||||||||||||||||
| AllianzGI Retirement Income: | ||||||||||||||||||||||||||
| Class A | ||||||||||||||||||||||||||
| 5/31/2014+ |
$ | 18.96 | $ | 0.22 | $ | 0.51 | $ | 0.73 | $ | (0.14 | ) | $ | — | |||||||||||||
| 11/30/2013 |
19.20 | 0.50 | 0.03 | 0.53 | (0.66 | ) | (0.08 | ) | ||||||||||||||||||
| 11/30/2012 |
18.27 | 0.48 | 1.23 | 1.71 | (0.58 | ) | (0.20 | ) | ||||||||||||||||||
| 11/30/2011 |
18.52 | 0.37 | 0.25 | 0.62 | (0.67 | ) | (0.20 | ) | ||||||||||||||||||
| 11/30/2010 |
17.81 | 0.47 | 1.05 | 1.52 | (0.61 | ) | (0.20 | ) | ||||||||||||||||||
| 12/29/2008* - 11/30/2009 |
15.00 | 0.53 | 2.71 | 3.24 | (0.43 | ) | — | |||||||||||||||||||
| Class C | ||||||||||||||||||||||||||
| 5/31/2014+ |
$ | 18.76 | $ | 0.14 | $ | 0.51 | $ | 0.65 | $ | (0.07 | ) | $ | — | |||||||||||||
| 11/30/2013 |
18.99 | 0.37 | 0.01 | 0.38 | (0.50 | ) | (0.08 | ) | ||||||||||||||||||
| 11/30/2012 |
18.09 | 0.31 | 1.24 | 1.55 | (0.45 | ) | (0.20 | ) | ||||||||||||||||||
| 11/30/2011 |
18.36 | 0.27 | 0.21 | 0.48 | (0.55 | ) | (0.20 | ) | ||||||||||||||||||
| 11/30/2010 |
17.83 | 0.28 | 1.11 | 1.39 | (0.66 | ) | (0.20 | ) | ||||||||||||||||||
| 12/29/2008* - 11/30/2009 |
15.00 | 0.41 | 2.72 | 3.13 | (0.30 | ) | — | |||||||||||||||||||
| Class D | ||||||||||||||||||||||||||
| 5/31/2014+ |
$ | 19.05 | $ | 0.20 | $ | 0.51 | $ | 0.71 | $ | (0.12 | ) | $ | — | |||||||||||||
| 11/30/2013 |
19.29 | 0.45 | 0.05 | 0.50 | (0.63 | ) | (0.08 | ) | ||||||||||||||||||
| 11/30/2012 |
18.36 | 0.30 | 1.41 | 1.71 | (0.58 | ) | (0.20 | ) | ||||||||||||||||||
| 11/30/2011 |
18.60 | 0.49 | 0.13 | 0.62 | (0.66 | ) | (0.20 | ) | ||||||||||||||||||
| 11/30/2010 |
17.83 | 0.49 | 1.04 | 1.53 | (0.56 | ) | (0.20 | ) | ||||||||||||||||||
| 12/29/2008* - 11/30/2009 |
15.00 | 0.52 | 2.72 | 3.24 | (0.41 | ) | — | |||||||||||||||||||
| Class R | ||||||||||||||||||||||||||
| 5/31/2014+ |
$ | 19.53 | $ | 0.18 | $ | 0.54 | $ | 0.72 | $ | (0.10 | ) | $ | — | |||||||||||||
| 11/30/2013 |
19.74 | 0.46 | 0.01 | 0.47 | (0.57 | ) | (0.08 | ) | ||||||||||||||||||
| 11/30/2012 |
18.77 | 0.24 | 1.45 | 1.69 | (0.52 | ) | (0.20 | ) | ||||||||||||||||||
| 11/30/2011 |
18.73 | 0.53 | 0.05 | 0.58 | (0.34 | ) | (0.20 | ) | ||||||||||||||||||
| 11/30/2010 |
17.86 | 0.49 | 1.01 | 1.50 | (0.43 | ) | (0.20 | ) | ||||||||||||||||||
| 12/29/2008* - 11/30/2009 |
15.00 | 0.47 | 2.74 | 3.21 | (0.35 | ) | — | |||||||||||||||||||
| Class P | ||||||||||||||||||||||||||
| 5/31/2014+ |
$ | 19.20 | $ | 0.23 | $ | 0.53 | $ | 0.76 | $ | (0.16 | ) | $ | — | |||||||||||||
| 11/30/2013 |
19.44 | 0.46 | 0.13 | 0.59 | (0.72 | ) | (0.08 | ) | ||||||||||||||||||
| 11/30/2012 |
18.49 | 0.32 | 1.48 | 1.80 | (0.65 | ) | (0.20 | ) | ||||||||||||||||||
| 11/30/2011 |
18.41 | 0.63 | 0.03 | 0.66 | (0.38 | ) | (0.20 | ) | ||||||||||||||||||
| 11/30/2010 |
17.85 | 0.57 | 0.99 | 1.56 | (0.80 | ) | (0.20 | ) | ||||||||||||||||||
| 12/29/2008* - 11/30/2009 |
15.00 | 0.54 | 2.74 | 3.28 | (0.43 | ) | — | |||||||||||||||||||
| Class R6 | ||||||||||||||||||||||||||
| 5/31/2014+ |
$ | 18.83 | $ | 0.24 | $ | 0.52 | $ | 0.76 | $ | (0.17 | ) | $ | — | |||||||||||||
| 11/30/2013 |
19.08 | 0.56 | 0.03 | 0.59 | (0.73 | ) | (0.08 | ) | ||||||||||||||||||
| 11/30/2012 |
18.16 | 0.49 | 1.28 | 1.77 | (0.65 | ) | (0.20 | ) | ||||||||||||||||||
| 11/30/2011 |
18.40 | 0.65 | 0.02 | 0.67 | (0.71 | ) | (0.20 | ) | ||||||||||||||||||
| 11/30/2010 |
17.85 | 0.57 | 1.01 | 1.58 | (0.83 | ) | (0.20 | ) | ||||||||||||||||||
| 12/29/2008* - 11/30/2009 |
15.00 | 0.55 | 2.74 | 3.29 | (0.44 | ) | — | |||||||||||||||||||
| Administrative Class | ||||||||||||||||||||||||||
| 5/31/2014+ |
$ | 19.15 | $ | 0.22 | $ | 0.52 | $ | 0.74 | $ | (0.13 | ) | $ | — | |||||||||||||
| 11/30/2013 |
19.41 | 0.22 | 0.32 | 0.54 | (0.69 | ) | (0.08 | ) | ||||||||||||||||||
| 11/30/2012 |
18.46 | 0.49 | 1.26 | 1.75 | (0.60 | ) | (0.20 | ) | ||||||||||||||||||
| 11/30/2011 |
18.40 | 0.59 | 0.03 | 0.62 | (0.36 | ) | (0.20 | ) | ||||||||||||||||||
| 11/30/2010 |
17.83 | 0.54 | 0.99 | 1.53 | (0.76 | ) | (0.20 | ) | ||||||||||||||||||
| 12/29/2008* - 11/30/2009 |
15.00 | 0.52 | 2.74 | 3.26 | (0.43 | ) | — | |||||||||||||||||||
| + | Unaudited |
| * | Commencement of operations. |
| (a) | Calculated on average shares outstanding during the period. |
| 192 | Semiannual Report | | May 31, 2014 | | See accompanying Notes to Financial Statements |
Table of Contents
| Distributions from Return of Capital |
Total Dividends and Distributions |
Net Asset Value, End of Period |
Total Return (b) | Net Assets, End of Period (000s) |
Ratio of Expenses to Average Net Assets with Fee Waiver/ Reimburse ment (c) |
Ratio of Expenses to Average Net Assets without Fee Waiver/ Reimburse ment (c) |
Ratio of Net Investment Income to Average Net Assets (c) |
Portfolio Turnover Rate |
||||||||||||||||||||||||||||
| $ | — | $ | (0.14 | ) | $ | 19.55 | 3.85 | % | $ | 5,069 | 0.38 | %(d) | 0.60 | %(d) | 2.26 | %(d) | 51 | % | ||||||||||||||||||
| (0.03 | ) | (0.77 | ) | 18.96 | 2.78 | 4,326 | 0.39 | 0.60 | 2.64 | 81 | ||||||||||||||||||||||||||
| — | (0.78 | ) | 19.20 | 9.68 | 4,891 | 0.40 | 0.60 | 2.57 | 51 | |||||||||||||||||||||||||||
| — | (0.87 | ) | 18.27 | 3.45 | 4,427 | 0.46 | 1.60 | 2.01 | 74 | |||||||||||||||||||||||||||
| — | (0.81 | ) | 18.52 | 8.86 | 595 | 0.52 | 5.29 | 2.65 | 22 | |||||||||||||||||||||||||||
| — | (0.43 | ) | 17.81 | 21.95 | 256 | 0.52 | (d) | 8.79 | (d) | 3.42 | (d) | 26 | ||||||||||||||||||||||||
| $ | — | $ | (0.07 | ) | $ | 19.34 | 3.50 | % | $ | 4,264 | 1.13 | %(d) | 1.35 | %(d) | 1.46 | %(d) | 51 | % | ||||||||||||||||||
| (0.03 | ) | (0.61 | ) | 18.76 | 2.03 | 4,359 | 1.14 | 1.35 | 1.99 | 81 | ||||||||||||||||||||||||||
| — | (0.65 | ) | 18.99 | 8.84 | 6,935 | 1.15 | 1.35 | 1.70 | 51 | |||||||||||||||||||||||||||
| — | (0.75 | ) | 18.09 | 2.71 | 5,820 | 1.22 | 2.48 | 1.50 | 74 | |||||||||||||||||||||||||||
| — | (0.86 | ) | 18.36 | 8.09 | 1,398 | 1.27 | 6.16 | 1.56 | 22 | |||||||||||||||||||||||||||
| — | (0.30 | ) | 17.83 | 21.11 | 133 | 1.27 | (d) | 10.38 | (d) | 2.67 | (d) | 26 | ||||||||||||||||||||||||
| $ | — | $ | (0.12 | ) | $ | 19.64 | 3.80 | % | $ | 1,036 | 0.48 | %(d) | 0.60 | %(d) | 2.11 | %(d) | 51 | % | ||||||||||||||||||
| (0.03 | ) | (0.74 | ) | 19.05 | 2.70 | 1,111 | 0.49 | 0.60 | 2.37 | 81 | ||||||||||||||||||||||||||
| — | (0.78 | ) | 19.29 | 9.53 | 1,553 | 0.50 | 0.60 | 1.59 | 51 | |||||||||||||||||||||||||||
| — | (0.86 | ) | 18.36 | 3.42 | 326 | 0.51 | 2.21 | 2.65 | 74 | |||||||||||||||||||||||||||
| — | (0.76 | ) | 18.60 | 8.89 | 179 | 0.52 | 5.75 | 2.75 | 22 | |||||||||||||||||||||||||||
| — | (0.41 | ) | 17.83 | 21.93 | 73 | 0.52 | (d) | 8.81 | (d) | 3.42 | (d) | 26 | ||||||||||||||||||||||||
| $ | — | $ | (0.10 | ) | $ | 20.15 | 3.64 | % | $ | 205 | 0.73 | %(d) | 0.85 | %(d) | 1.85 | %(d) | 51 | % | ||||||||||||||||||
| (0.03 | ) | (0.68 | ) | 19.53 | 2.46 | 152 | 0.74 | 0.85 | 2.36 | 81 | ||||||||||||||||||||||||||
| — | (0.72 | ) | 19.74 | 9.28 | 183 | 0.75 | 0.85 | 1.29 | 51 | |||||||||||||||||||||||||||
| — | (0.54 | ) | 18.77 | 3.18 | 17 | 0.76 | 4.59 | 2.82 | 74 | |||||||||||||||||||||||||||
| — | (0.63 | ) | 18.73 | 8.61 | 15 | 0.77 | 5.62 | 2.70 | 22 | |||||||||||||||||||||||||||
| — | (0.35 | ) | 17.86 | 21.72 | 12 | 0.77 | (d) | 7.31 | (d) | 3.17 | (d) | 26 | ||||||||||||||||||||||||
| $ | — | $ | (0.16 | ) | $ | 19.80 | 3.98 | % | $ | 7,544 | 0.09 | %(d) | 0.21 | %(d) | 2.33 | %(d) | 51 | % | ||||||||||||||||||
| (0.03 | ) | (0.83 | ) | 19.20 | 3.12 | 4,427 | 0.09 | 0.20 | 2.42 | 81 | ||||||||||||||||||||||||||
| — | (0.85 | ) | 19.44 | 10.05 | 4,751 | 0.10 | 0.20 | 1.71 | 51 | |||||||||||||||||||||||||||
| — | (0.58 | ) | 18.49 | 3.69 | 14 | 0.26 | 4.47 | 3.38 | 74 | |||||||||||||||||||||||||||
| — | (1.00 | ) | 18.41 | 9.13 | 13 | 0.32 | 5.13 | 3.20 | 22 | |||||||||||||||||||||||||||
| — | (0.43 | ) | 17.85 | 22.19 | 12 | 0.32 | (d) | 6.06 | (d) | 3.62 | (d) | 26 | ||||||||||||||||||||||||
| $ | — | $ | (0.17 | ) | $ | 19.42 | 4.05 | % | $ | 10,540 | — | %(d)(e) | 0.10 | %(d) | 2.59 | %(d) | 51 | % | ||||||||||||||||||
| (0.03 | ) | (0.84 | ) | 18.83 | 3.23 | 9,487 | — | (e) | 0.12 | 2.96 | 81 | |||||||||||||||||||||||||
| — | (0.85 | ) | 19.08 | 10.11 | 11,294 | — | 0.15 | 2.64 | 51 | |||||||||||||||||||||||||||
| — | (0.91 | ) | 18.16 | 3.77 | 4,904 | 0.16 | 1.81 | 3.53 | 74 | |||||||||||||||||||||||||||
| — | (1.03 | ) | 18.40 | 9.24 | 4,803 | 0.22 | 5.04 | 3.22 | 22 | |||||||||||||||||||||||||||
| — | (0.44 | ) | 17.85 | 22.30 | 3,779 | 0.22 | (d) | 5.96 | (d) | 3.72 | (d) | 26 | ||||||||||||||||||||||||
| $ | — | $ | (0.13 | ) | $ | 19.76 | 3.85 | % | $ | 1,994 | 0.33 | %(d) | 0.45 | %(d) | 2.23 | %(d) | 51 | % | ||||||||||||||||||
| (0.03 | ) | (0.80 | ) | 19.15 | 2.92 | 2,461 | 0.34 | 0.45 | 1.16 | 81 | ||||||||||||||||||||||||||
| — | (0.80 | ) | 19.41 | 9.71 | 15 | 0.35 | 0.45 | 2.59 | 51 | |||||||||||||||||||||||||||
| — | (0.56 | ) | 18.46 | 3.49 | 14 | 0.44 | 4.65 | 3.21 | 74 | |||||||||||||||||||||||||||
| — | (0.96 | ) | 18.40 | 8.94 | 13 | 0.47 | 5.28 | 3.05 | 22 | |||||||||||||||||||||||||||
| — | (0.43 | ) | 17.83 | 22.03 | 12 | 0.47 | (d) | 6.21 | (d) | 3.47 | (d) | 26 | ||||||||||||||||||||||||
| (b) | Total return is calculated assuming a purchase of a share on the first day of the period and a sale of a share on the last day of each period reported. Dividends and distributions, if any, are assumed, for purposes of this calculation, to be reinvested. Total return does not reflect sales charges and includes the effect of fee waivers and reimbursements. Total return may reflect adjustments to conform to generally accepted accounting principles. Total return for a period of less than one year is not annualized. |
| (c) | Does not include expenses of the investment companies in which the Fund invests. |
| (d) | Annualized. |
| (e) | See Note 6 in the Notes to Financial Statements. |
| See accompanying Notes to Financial Statements | | May 31, 2014 | | Semiannual Report | 193 |
Table of Contents
Financial Highlights (cont’d)
For a Share Outstanding for the Period ended:
| Net Asset Value, Beginning of Period |
Net Investment Income (a) |
Net Realized and Change in Unrealized Gain (Loss) |
Total from Investment Operations |
Dividends from Net Investment Income |
Distributions from Return of Capital |
|||||||||||||||||||||
| AllianzGI Global Allocation: | ||||||||||||||||||||||||||
| Class A | ||||||||||||||||||||||||||
| 5/31/2014+ |
$ | 11.90 | $ | 0.16 | $ | 0.39 | $ | 0.55 | $ | (0.16 | ) | $ | — | |||||||||||||
| 11/30/2013 |
11.07 | 0.31 | 0.95 | 1.26 | (0.43 | ) | — | |||||||||||||||||||
| 11/30/2012 |
10.30 | 0.25 | 0.84 | 1.09 | (0.32 | ) | — | |||||||||||||||||||
| 11/30/2011 |
10.58 | 0.25 | (0.14 | ) | 0.11 | (0.39 | ) | — | ||||||||||||||||||
| 11/30/2010 |
9.84 | 0.26 | 0.85 | 1.11 | (0.37 | ) | — | |||||||||||||||||||
| 7/1/2009** - 11/30/2009 |
8.45 | 0.08 | 1.35 | 1.43 | (0.04 | ) | — | |||||||||||||||||||
| 6/30/2009 |
10.62 | 0.30 | (1.98 | ) | (1.68 | ) | (0.40 | ) | (0.09 | ) | ||||||||||||||||
| Class B | ||||||||||||||||||||||||||
| 5/31/2014+ |
$ | 12.13 | $ | 0.13 | $ | 0.39 | $ | 0.52 | $ | (0.11 | ) | $ | — | |||||||||||||
| 11/30/2013 |
11.27 | 0.26 | 0.94 | 1.20 | (0.34 | ) | — | |||||||||||||||||||
| 11/30/2012 |
10.48 | 0.21 | 0.81 | 1.02 | (0.23 | ) | — | |||||||||||||||||||
| 11/30/2011 |
10.74 | 0.22 | (0.20 | ) | 0.02 | (0.28 | ) | — | ||||||||||||||||||
| 11/30/2010 |
9.92 | 0.22 | 0.83 | 1.05 | (0.23 | ) | — | |||||||||||||||||||
| 7/1/2009** - 11/30/2009 |
8.53 | 0.05 | 1.36 | 1.41 | (0.02 | ) | — | |||||||||||||||||||
| 6/30/2009 |
10.70 | 0.23 | (1.99 | ) | (1.76 | ) | (0.33 | ) | (0.08 | ) | ||||||||||||||||
| Class C | ||||||||||||||||||||||||||
| 5/31/2014+ |
$ | 12.04 | $ | 0.12 | $ | 0.39 | $ | 0.51 | $ | (0.11 | ) | $ | — | |||||||||||||
| 11/30/2013 |
11.19 | 0.23 | 0.96 | 1.19 | (0.34 | ) | — | |||||||||||||||||||
| 11/30/2012 |
10.41 | 0.17 | 0.85 | 1.02 | (0.24 | ) | — | |||||||||||||||||||
| 11/30/2011 |
10.69 | 0.18 | (0.16 | ) | 0.02 | (0.30 | ) | — | ||||||||||||||||||
| 11/30/2010 |
9.89 | 0.19 | 0.85 | 1.04 | (0.24 | ) | — | |||||||||||||||||||
| 7/1/2009** - 11/30/2009 |
8.50 | 0.05 | 1.36 | 1.41 | (0.02 | ) | — | |||||||||||||||||||
| 6/30/2009 |
10.68 | 0.24 | (2.01 | ) | (1.77 | ) | (0.33 | ) | (0.08 | ) | ||||||||||||||||
| Class D | ||||||||||||||||||||||||||
| 5/31/2014+ |
$ | 11.85 | $ | 0.14 | $ | 0.41 | $ | 0.55 | $ | (0.16 | ) | $ | — | |||||||||||||
| 11/30/2013 |
11.03 | 0.23 | 1.03 | 1.26 | (0.44 | ) | — | |||||||||||||||||||
| 11/30/2012 |
10.27 | 0.24 | 0.84 | 1.08 | (0.32 | ) | — | |||||||||||||||||||
| 11/30/2011 |
10.56 | 0.17 | (0.06 | ) | 0.11 | (0.40 | ) | — | ||||||||||||||||||
| 11/30/2010 |
9.83 | 0.23 | 0.87 | 1.10 | (0.37 | ) | — | |||||||||||||||||||
| 7/1/2009** - 11/30/2009 |
8.44 | 0.08 | 1.35 | 1.43 | (0.04 | ) | — | |||||||||||||||||||
| 5/4/2009* - 6/30/2009 |
8.20 | 0.02 | 0.27 | 0.29 | (0.04 | ) | (0.01 | ) | ||||||||||||||||||
| + | Unaudited |
| * | Commencement of operations. |
| ** | On April 14, 2009, the Board of Trustees approved a change in the Fund’s fiscal year from June 30 to November 30. |
| (a) | Calculated on average shares outstanding during the period. |
| (b) | Effective May 1, 2009, Fund redemption fees were eliminated. |
| (c) | Total return is calculated assuming a purchase of a share on the first day of the period and a sale of a share on the last day of each period reported. Dividends and distributions, if any, are assumed, for purposes of this calculation, to be reinvested. Total return does not reflect sales charges and includes the effect of fee waivers and reimbursements. Total return may reflect adjustments to conform to generally accepted accounting principles. Total return for a period of less than one year is not annualized. |
| (d) | Does not include expenses of the investment companies in which the Fund invests. |
| (e) | Annualized. |
| (f) | Less than $0.01 per share. |
| 194 | Semiannual Report | | May 31, 2014 | | See accompanying Notes to Financial Statements |
Table of Contents
| Total Dividends and Distributions |
Fund Redemption Fees (a)(b) |
Net Asset Value, End of Period |
Total Return (c) | Net Assets, End of Period (000s) |
Ratio of Expenses to Average Net Assets with Fee Waiver/ Reimburse ment (d) |
Ratio of Expenses to Average Net Assets without Fee Waiver/ Reimburse ment (d) |
Ratio of Net Investment Income to Average Net Assets (d) |
Portfolio Turnover Rate |
||||||||||||||||||||||||||||
| $ | (0.16 | ) | $ | — | $ | 12.29 | 4.66 | % | $ | 70,165 | 0.40 | % | 1.39 | % | 2.62 | % | 28 | % | ||||||||||||||||||
| (0.43 | ) | — | 11.90 | 11.79 | 69,565 | 0.41 | 1.36 | 2.68 | 45 | |||||||||||||||||||||||||||
| (0.32 | ) | — | 11.07 | 10.64 | 70,312 | 0.43 | 1.38 | 2.32 | 57 | |||||||||||||||||||||||||||
| (0.39 | ) | — | 10.30 | 0.95 | 73,816 | 0.47 | 1.35 | 2.32 | 64 | |||||||||||||||||||||||||||
| (0.37 | ) | — | 10.58 | 11.56 | 72,415 | 0.51 | 1.42 | 2.58 | 46 | |||||||||||||||||||||||||||
| (0.04 | ) | — | 9.84 | 16.93 | 57,225 | 0.52 | (e) | 1.39 | (e) | 1.98 | (e) | 11 | ||||||||||||||||||||||||
| (0.49 | ) | — | (f) | 8.45 | (15.51 | ) | 47,224 | 0.63 | 0.76 | 3.51 | 69 | |||||||||||||||||||||||||
| $ | (0.11 | ) | $ | — | $ | 12.54 | 4.32 | % | $ | 2,223 | 1.11 | % | 2.36 | % | 2.07 | % | 28 | % | ||||||||||||||||||
| (0.34 | ) | — | 12.13 | 10.84 | 2,874 | 1.14 | 2.18 | 2.25 | 45 | |||||||||||||||||||||||||||
| (0.23 | ) | — | 11.27 | 9.90 | 4,307 | 1.19 | 2.09 | 1.96 | 57 | |||||||||||||||||||||||||||
| (0.28 | ) | — | 10.48 | 0.15 | 9,467 | 1.22 | 2.10 | 1.95 | 64 | |||||||||||||||||||||||||||
| (0.23 | ) | — | 10.74 | 10.86 | 18,030 | 1.26 | 2.19 | 2.13 | 46 | |||||||||||||||||||||||||||
| (0.02 | ) | — | 9.92 | 16.44 | 31,698 | 1.27 | (e) | 2.11 | (e) | 1.23 | (e) | 11 | ||||||||||||||||||||||||
| (0.41 | ) | — | (f) | 8.53 | (16.12 | ) | 29,177 | 1.39 | 1.50 | 2.67 | 69 | |||||||||||||||||||||||||
| $ | (0.11 | ) | $ | — | $ | 12.44 | 4.39 | % | $ | 65,954 | 1.13 | % | 2.09 | % | 1.93 | % | 28 | % | ||||||||||||||||||
| (0.34 | ) | — | 12.04 | 10.81 | 68,756 | 1.14 | 2.10 | 1.98 | 45 | |||||||||||||||||||||||||||
| (0.24 | ) | — | 11.19 | 9.90 | 71,375 | 1.18 | 2.11 | 1.59 | 57 | |||||||||||||||||||||||||||
| (0.30 | ) | — | 10.41 | 0.15 | 78,367 | 1.22 | 2.09 | 1.64 | 64 | |||||||||||||||||||||||||||
| (0.24 | ) | — | 10.69 | 10.65 | 87,546 | 1.26 | 2.16 | 1.93 | 46 | |||||||||||||||||||||||||||
| (0.02 | ) | — | 9.89 | 16.62 | 89,277 | 1.27 | (e) | 2.14 | (e) | 1.23 | (e) | 11 | ||||||||||||||||||||||||
| (0.41 | ) | — | (f) | 8.50 | (16.21 | ) | 80,857 | 1.39 | 1.50 | 2.74 | 69 | |||||||||||||||||||||||||
| $ | (0.16 | ) | $ | — | $ | 12.24 | 4.72 | % | $ | 1,558 | 0.37 | % | 1.37 | % | 2.37 | % | 28 | % | ||||||||||||||||||
| (0.44 | ) | — | 11.85 | 11.70 | 1,189 | 0.37 | 1.39 | 1.99 | 45 | |||||||||||||||||||||||||||
| (0.32 | ) | — | 11.03 | 10.68 | 266 | 0.46 | 1.33 | 2.25 | 57 | |||||||||||||||||||||||||||
| (0.40 | ) | — | 10.27 | 0.95 | 197 | 0.45 | 1.38 | 1.56 | 64 | |||||||||||||||||||||||||||
| (0.37 | ) | — | 10.56 | 11.48 | 34 | 0.51 | 1.41 | 2.28 | 46 | |||||||||||||||||||||||||||
| (0.04 | ) | — | 9.83 | 16.95 | 13 | 0.52 | (e) | 1.38 | (e) | 1.98 | (e) | 11 | ||||||||||||||||||||||||
| (0.05 | ) | — | 8.44 | 3.55 | 10 | 0.52 | (e) | 1.34 | (e) | 1.85 | (e) | 69 | ||||||||||||||||||||||||
| See accompanying Notes to Financial Statements | | May 31, 2014 | | Semiannual Report | 195 |
Table of Contents
Financial Highlights (cont’d)
For a Share Outstanding for the Period ended:
| Net Asset Value, Beginning of Period |
Net Investment Income (a) |
Net Realized and Change in Unrealized Gain (Loss) |
Total from Investment Operations |
Dividends from Net Investment Income |
Distributions from Return of Capital |
|||||||||||||||||||||
| AllianzGI Global Allocation (cont’d) | ||||||||||||||||||||||||||
| Class R | ||||||||||||||||||||||||||
| 5/31/2014+ |
$ | 11.84 | $ | 0.15 | $ | 0.40 | $ | 0.55 | $ | (0.15 | ) | $ | — | |||||||||||||
| 11/30/2013 |
11.02 | 0.28 | 0.95 | 1.23 | (0.41 | ) | — | |||||||||||||||||||
| 11/30/2012 |
10.26 | 0.21 | 0.84 | 1.05 | (0.29 | ) | — | |||||||||||||||||||
| 11/30/2011 |
10.54 | 0.23 | (0.15 | ) | 0.08 | (0.36 | ) | — | ||||||||||||||||||
| 11/30/2010 |
9.81 | 0.24 | 0.84 | 1.08 | (0.35 | ) | — | |||||||||||||||||||
| 7/1/2009** - 11/30/2009 |
8.44 | 0.07 | 1.34 | 1.41 | (0.04 | ) | — | |||||||||||||||||||
| 5/4/2009* - 6/30/2009 |
8.20 | 0.02 | 0.27 | 0.29 | (0.04 | ) | (0.01 | ) | ||||||||||||||||||
| Class P | ||||||||||||||||||||||||||
| 5/31/2014+ |
$ | 11.90 | $ | 0.17 | $ | 0.39 | $ | 0.56 | $ | (0.17 | ) | $ | — | |||||||||||||
| 11/30/2013 |
11.07 | 0.32 | 0.96 | 1.28 | (0.45 | ) | — | |||||||||||||||||||
| 11/30/2012 |
10.28 | 0.29 | 0.81 | 1.10 | (0.31 | ) | — | |||||||||||||||||||
| 11/30/2011 |
10.56 | 0.27 | (0.14 | ) | 0.13 | (0.41 | ) | — | ||||||||||||||||||
| 11/30/2010 |
9.84 | 0.26 | 0.86 | 1.12 | (0.40 | ) | — | |||||||||||||||||||
| 7/1/2009** - 11/30/2009 |
8.44 | 0.08 | 1.36 | 1.44 | (0.04 | ) | — | |||||||||||||||||||
| 5/4/2009* - 6/30/2009 |
8.20 | 0.03 | 0.26 | 0.29 | (0.04 | ) | (0.01 | ) | ||||||||||||||||||
| Institutional Class | ||||||||||||||||||||||||||
| 5/31/2014+ |
$ | 11.78 | $ | 0.17 | $ | 0.39 | $ | 0.56 | $ | (0.17 | ) | $ | — | |||||||||||||
| 11/30/2013 |
10.97 | 0.32 | 0.95 | 1.27 | (0.46 | ) | — | |||||||||||||||||||
| 11/30/2012 |
10.21 | 0.26 | 0.84 | 1.10 | (0.34 | ) | — | |||||||||||||||||||
| 11/30/2011 |
10.48 | 0.27 | (0.13 | ) | 0.14 | (0.41 | ) | — | ||||||||||||||||||
| 11/30/2010 |
9.77 | 0.29 | 0.83 | 1.12 | (0.41 | ) | — | |||||||||||||||||||
| 7/1/2009** - 11/30/2009 |
8.38 | 0.09 | 1.34 | 1.43 | (0.04 | ) | — | |||||||||||||||||||
| 6/30/2009 |
10.55 | 0.33 | (1.97 | ) | (1.64 | ) | (0.43 | ) | (0.10 | ) | ||||||||||||||||
| Administrative Class | ||||||||||||||||||||||||||
| 5/31/2014+ |
$ | 12.17 | $ | 0.16 | $ | 0.41 | $ | 0.57 | $ | (0.16 | ) | $ | — | |||||||||||||
| 11/30/2013 |
11.30 | 0.43 | 0.85 | 1.28 | (0.41 | ) | — | |||||||||||||||||||
| 11/30/2012 |
10.51 | 0.26 | 0.84 | 1.10 | (0.31 | ) | — | |||||||||||||||||||
| 11/30/2011 |
10.78 | 0.13 | (0.01 | ) | 0.12 | (0.39 | ) | — | ||||||||||||||||||
| 11/30/2010 |
9.83 | 0.27 | 0.86 | 1.13 | (0.18 | ) | — | |||||||||||||||||||
| 7/1/2009** - 11/30/2009 |
8.44 | 0.08 | 1.35 | 1.43 | (0.04 | ) | — | |||||||||||||||||||
| 5/4/2009* - 6/30/2009 |
8.20 | 0.03 | 0.26 | 0.29 | (0.04 | ) | (0.01 | ) | ||||||||||||||||||
| + | Unaudited |
| * | Commencement of operations. |
| ** | On April 14, 2009, the Board of Trustees approved a change in the Fund’s fiscal year from June 30 to November 30. |
| (a) | Calculated on average shares outstanding during the period. |
| (b) | Effective May 1, 2009, Fund redemption fees were eliminated. |
| (c) | Total return is calculated assuming a purchase of a share on the first day of the period and a sale of a share on the last day of each period reported. Dividends and distributions, if any, are assumed, for purposes of this calculation, to be reinvested. Total return does not reflect sales charges and includes the effect of fee waivers and reimbursements. Total return may reflect adjustments to conform to generally accepted accounting principles. Total return for a period of less than one year is not annualized. |
| (d) | Does not include expenses of the investment companies in which the Fund invests. |
| (e) | Annualized. |
| (f) | Less than $0.01 per share. |
| 196 | Semiannual Report | | May 31, 2014 | | See accompanying Notes to Financial Statements |
Table of Contents
| Total Dividends and Distributions |
Fund Redemption Fees (a)(b) |
Net Asset Value, End of Period |
Total Return (c) | Net Assets, End of Period (000s) |
Ratio of Expenses to Average Net Assets with Fee Waiver/ Reimbursement (d) |
Ratio of Expenses to Average Net Assets without Fee Waiver/ Reimbursement (d) |
Ratio of Net Investment Income to Average Net Assets (d) |
Portfolio Turnover Rate |
||||||||||||||||||||||||||||
| $ | (0.15 | ) | $ | — | $ | 12.24 | 4.60 | % | $ | 17 | 0.56 | % | 1.53 | % | 2.46 | % | 28 | % | ||||||||||||||||||
| (0.41 | ) | — | 11.84 | 11.44 | 17 | 0.59 | 1.54 | 2.42 | 45 | |||||||||||||||||||||||||||
| (0.29 | ) | — | 11.02 | 10.44 | 15 | 0.67 | 1.56 | 2.02 | 57 | |||||||||||||||||||||||||||
| (0.36 | ) | — | 10.26 | 0.73 | 14 | 0.72 | 1.59 | 2.11 | 64 | |||||||||||||||||||||||||||
| (0.35 | ) | — | 10.54 | 11.30 | 13 | 0.76 | 1.64 | 2.38 | 46 | |||||||||||||||||||||||||||
| (0.04 | ) | — | 9.81 | 16.78 | 12 | 0.77 | (e) | 1.63 | (e) | 1.73 | (e) | 11 | ||||||||||||||||||||||||
| (0.05 | ) | — | 8.44 | 3.52 | 10 | 0.77 | (e) | 1.68 | (e) | 1.61 | (e) | 69 | ||||||||||||||||||||||||
| $ | (0.17 | ) | $ | — | $ | 12.29 | 4.79 | % | $ | 1,917 | 0.16 | % | 1.12 | % | 2.81 | % | 28 | % | ||||||||||||||||||
| (0.45 | ) | — | 11.90 | 11.92 | 1,960 | 0.19 | 1.13 | 2.81 | 45 | |||||||||||||||||||||||||||
| (0.31 | ) | — | 11.07 | 10.91 | 1,340 | 0.25 | 1.37 | 2.75 | 57 | |||||||||||||||||||||||||||
| (0.41 | ) | — | 10.28 | 1.13 | 1,996 | 0.27 | 1.22 | 2.52 | 64 | |||||||||||||||||||||||||||
| (0.40 | ) | — | 10.56 | 11.77 | 6,433 | 0.31 | 1.39 | 2.54 | 46 | |||||||||||||||||||||||||||
| (0.04 | ) | — | 9.84 | 16.99 | 1,658 | 0.31 | (e) | 1.21 | (e) | 2.19 | (e) | 11 | ||||||||||||||||||||||||
| (0.05 | ) | — | 8.44 | 3.55 | 1,477 | 0.27 | (e) | 1.37 | (e) | 2.04 | (e) | 69 | ||||||||||||||||||||||||
| $ | (0.17 | ) | $ | — | $ | 12.17 | 4.84 | % | $ | 75,867 | 0.16 | % | 1.13 | % | 2.81 | % | 28 | % | ||||||||||||||||||
| (0.46 | ) | — | 11.78 | 11.90 | 68,675 | 0.16 | 1.11 | 2.81 | 45 | |||||||||||||||||||||||||||
| (0.34 | ) | — | 10.97 | 11.01 | 57,357 | 0.15 | 1.14 | 2.47 | 57 | |||||||||||||||||||||||||||
| (0.41 | ) | — | 10.21 | 1.31 | 47,916 | 0.16 | 1.12 | 2.50 | 64 | |||||||||||||||||||||||||||
| (0.41 | ) | — | 10.48 | 11.88 | 37,093 | 0.21 | 1.15 | 2.91 | 46 | |||||||||||||||||||||||||||
| (0.04 | ) | — | 9.77 | 17.14 | 31,841 | 0.20 | (e) | 1.11 | (e) | 2.30 | (e) | 11 | ||||||||||||||||||||||||
| (0.53 | ) | — | (f) | 8.38 | (15.16 | ) | 16,150 | 0.13 | 0.30 | 3.89 | 69 | |||||||||||||||||||||||||
| $ | (0.16 | ) | $ | — | $ | 12.58 | 4.71 | % | $ | 33 | 0.41 | % | 1.27 | % | 2.62 | % | 28 | % | ||||||||||||||||||
| (0.41 | ) | — | 12.17 | 11.59 | 24 | 0.41 | 1.48 | 3.73 | 45 | |||||||||||||||||||||||||||
| (0.31 | ) | — | 11.30 | 10.70 | 1,653 | 0.40 | 1.42 | 2.35 | 57 | |||||||||||||||||||||||||||
| (0.39 | ) | — | 10.51 | 1.05 | 1,649 | 0.41 | 1.36 | 1.19 | 64 | |||||||||||||||||||||||||||
| (0.18 | ) | — | 10.78 | 11.62 | 14 | 0.46 | 1.37 | 2.68 | 46 | |||||||||||||||||||||||||||
| (0.04 | ) | — | 9.83 | 17.07 | 12 | 0.52 | (e) | 1.36 | (e) | 1.98 | (e) | 11 | ||||||||||||||||||||||||
| (0.05 | ) | — | 8.44 | 3.57 | 10 | 0.32 | (e) | 1.20 | (e) | 2.05 | (e) | 69 | ||||||||||||||||||||||||
| See accompanying Notes to Financial Statements | | May 31, 2014 | | Semiannual Report | 197 |
Table of Contents
Financial Highlights (cont’d)
For a Share Outstanding for the Period ended:
| Net Asset Value, Beginning of Period |
Net Investment Income (a) |
Net Realized and Change in Unrealized Gain (Loss) |
Total from Investment Operations |
Dividends from Net Investment Income |
Distributions from Net Realized Capital Gains |
|||||||||||||||||||||
| AllianzGI Global Growth Allocation: | ||||||||||||||||||||||||||
| Class A | ||||||||||||||||||||||||||
| 5/31/2014+ |
$ | 24.70 | $ | 0.27 | $ | 0.84 | $ | 1.11 | $ | (0.72 | ) | $ | (2.76 | ) | ||||||||||||
| 11/30/2013 |
22.04 | 0.42 | 3.07 | 3.49 | (0.61 | ) | (0.22 | ) | ||||||||||||||||||
| 11/30/2012 |
20.72 | 0.51 | 1.71 | 2.22 | (0.59 | ) | (0.31 | ) | ||||||||||||||||||
| 11/30/2011 |
22.03 | 0.45 | (0.33 | ) | 0.12 | (0.91 | ) | (0.52 | ) | |||||||||||||||||
| 11/30/2010 |
19.96 | 0.47 | 2.09 | 2.56 | (0.35 | ) | (0.14 | ) | ||||||||||||||||||
| 4/27/2009* - 11/30/2009 |
15.00 | 0.17 | 4.79 | 4.96 | — | — | ||||||||||||||||||||
| Class C | ||||||||||||||||||||||||||
| 5/31/2014+ |
$ | 24.28 | $ | 0.17 | $ | 0.84 | $ | 1.01 | $ | (0.53 | ) | $ | (2.76 | ) | ||||||||||||
| 11/30/2013 |
21.71 | 0.30 | 2.97 | 3.27 | (0.48 | ) | (0.22 | ) | ||||||||||||||||||
| 11/30/2012 |
20.49 | 0.30 | 1.74 | 2.04 | (0.51 | ) | (0.31 | ) | ||||||||||||||||||
| 11/30/2011 |
21.81 | 0.24 | (0.28 | ) | (0.04 | ) | (0.76 | ) | (0.52 | ) | ||||||||||||||||
| 11/30/2010 |
19.87 | 0.44 | 1.96 | 2.40 | (0.32 | ) | (0.14 | ) | ||||||||||||||||||
| 4/27/2009* - 11/30/2009 |
15.00 | 0.09 | 4.78 | 4.87 | — | — | ||||||||||||||||||||
| Class D | ||||||||||||||||||||||||||
| 5/31/2014+ |
$ | 24.58 | $ | 0.29 | $ | 0.82 | $ | 1.11 | $ | (0.74 | ) | $ | (2.76 | ) | ||||||||||||
| 11/30/2013 |
22.00 | 0.31 | 3.16 | 3.47 | (0.67 | ) | (0.22 | ) | ||||||||||||||||||
| 11/30/2012 |
20.78 | 0.37 | 1.85 | 2.22 | (0.69 | ) | (0.31 | ) | ||||||||||||||||||
| 11/30/2011 |
22.06 | 0.48 | (0.36 | ) | 0.12 | (0.88 | ) | (0.52 | ) | |||||||||||||||||
| 11/30/2010 |
19.96 | 0.63 | 1.94 | 2.57 | (0.33 | ) | (0.14 | ) | ||||||||||||||||||
| 4/27/2009* - 11/30/2009 |
15.00 | 0.17 | 4.79 | 4.96 | — | — | ||||||||||||||||||||
| Class R | ||||||||||||||||||||||||||
| 5/31/2014+ |
$ | 24.62 | $ | 0.27 | $ | 0.81 | $ | 1.08 | $ | (0.73 | ) | $ | (2.76 | ) | ||||||||||||
| 11/30/2013 |
21.90 | 0.23 | 3.20 | 3.43 | (0.49 | ) | (0.22 | ) | ||||||||||||||||||
| 11/30/2012 |
20.73 | 0.39 | 1.77 | 2.16 | (0.68 | ) | (0.31 | ) | ||||||||||||||||||
| 11/30/2011 |
22.01 | 0.40 | (0.34 | ) | 0.06 | (0.82 | ) | (0.52 | ) | |||||||||||||||||
| 11/30/2010 |
19.93 | 0.62 | 1.91 | 2.53 | (0.31 | ) | (0.14 | ) | ||||||||||||||||||
| 4/27/2009* - 11/30/2009 |
15.00 | 0.14 | 4.79 | 4.93 | — | — | ||||||||||||||||||||
| Class P | ||||||||||||||||||||||||||
| 5/31/2014+ |
$ | 24.71 | $ | 0.28 | $ | 0.85 | $ | 1.13 | $ | (0.76 | ) | $ | (2.76 | ) | ||||||||||||
| 11/30/2013 |
22.08 | 0.38 | 3.14 | 3.52 | (0.67 | ) | (0.22 | ) | ||||||||||||||||||
| 11/30/2012 |
20.85 | 0.49 | 1.77 | 2.26 | (0.72 | ) | (0.31 | ) | ||||||||||||||||||
| 11/30/2011 |
22.12 | 0.63 | (0.48 | ) | 0.15 | (0.90 | ) | (0.52 | ) | |||||||||||||||||
| 11/30/2010 |
19.99 | 0.71 | 1.91 | 2.62 | (0.35 | ) | (0.14 | ) | ||||||||||||||||||
| 4/27/2009* - 11/30/2009 |
15.00 | 0.19 | 4.80 | 4.99 | — | — | ||||||||||||||||||||
| Institutional Class | ||||||||||||||||||||||||||
| 5/31/2014+ |
$ | 24.74 | $ | 0.28 | $ | 0.86 | $ | 1.14 | $ | (0.75 | ) | $ | (2.76 | ) | ||||||||||||
| 11/30/2013 |
22.10 | 0.56 | 2.99 | 3.55 | (0.69 | ) | (0.22 | ) | ||||||||||||||||||
| 11/30/2012 |
20.87 | 0.51 | 1.78 | 2.29 | (0.75 | ) | (0.31 | ) | ||||||||||||||||||
| 11/30/2011 |
22.14 | 0.65 | (0.48 | ) | 0.17 | (0.92 | ) | (0.52 | ) | |||||||||||||||||
| 11/30/2010 |
20.00 | 0.73 | 1.91 | 2.64 | (0.36 | ) | (0.14 | ) | ||||||||||||||||||
| 4/27/2009* - 11/30/2009 |
15.00 | 0.20 | 4.80 | 5.00 | — | — | ||||||||||||||||||||
| Administrative Class | ||||||||||||||||||||||||||
| 5/31/2014+ |
$ | 24.67 | $ | 0.26 | $ | 0.85 | $ | 1.11 | $ | (0.72 | ) | $ | (2.76 | ) | ||||||||||||
| 11/30/2013 |
22.04 | 0.48 | 3.01 | 3.49 | (0.64 | ) | (0.22 | ) | ||||||||||||||||||
| 11/30/2012 |
20.81 | 0.46 | 1.77 | 2.23 | (0.69 | ) | (0.31 | ) | ||||||||||||||||||
| 11/30/2011 |
22.08 | 0.59 | (0.47 | ) | 0.12 | (0.87 | ) | (0.52 | ) | |||||||||||||||||
| 11/30/2010 |
19.97 | 0.68 | 1.90 | 2.58 | (0.33 | ) | (0.14 | ) | ||||||||||||||||||
| 4/27/2009* - 11/30/2009 |
15.00 | 0.17 | 4.80 | 4.97 | — | — | ||||||||||||||||||||
| + | Unaudited |
| * | Commencement of operations. |
| (a) | Calculated on average shares outstanding during the period. |
| (b) | Total return is calculated assuming a purchase of a share on the first day of the period and a sale of a share on the last day of each period reported. Dividends and distributions, if any, are assumed, for purposes of this calculation, to be reinvested. Total return does not reflect sales charges and includes the effect of fee waivers and reimbursements. Total return may reflect adjustments to conform to generally accepted accounting principles. Total return for a period of less than one year is not annualized. |
| 198 | Semiannual Report | | May 31, 2014 | | See accompanying Notes to Financial Statements |
Table of Contents
| Total Dividends and Distributions |
Net Asset Value, End of Period |
Total Return (b) | Net Assets, End of Period (000s) |
Ratio of Expenses to Average Net Assets with Fee Waiver/ Reimbursement (c) |
Ratio of Expenses to Average Net Assets without Fee Waiver/ Reimbursement (c) |
Ratio of Net Investment Income to Average Net Assets (c) |
Portfolio Turnover Rate |
|||||||||||||||||||||||||
| $ | (3.48 | ) | $ | 22.33 | 5.08 | % | $ | 1,213 | 0.40 | %(d) | 4.38 | %(d) | 2.43 | %(d) | 31 | % | ||||||||||||||||
| (0.83 | ) | 24.70 | 16.42 | 1,344 | 0.40 | 3.84 | 1.82 | 101 | ||||||||||||||||||||||||
| (0.90 | ) | 22.04 | 11.17 | 841 | 0.41 | 4.12 | 2.40 | 51 | ||||||||||||||||||||||||
| (1.43 | ) | 20.72 | 0.17 | 1,283 | 0.47 | 3.23 | 2.02 | 85 | ||||||||||||||||||||||||
| (0.49 | ) | 22.03 | 13.08 | 815 | 0.54 | 5.64 | 2.29 | 66 | ||||||||||||||||||||||||
| — | 19.96 | 33.07 | 41 | 0.54 | (d) | 6.46 | (d) | 1.57 | (d) | 6 | ||||||||||||||||||||||
| $ | (3.29 | ) | $ | 22.00 | 4.65 | % | $ | 1,425 | 1.18 | %(d) | 5.13 | %(d) | 1.61 | %(d) | 31 | % | ||||||||||||||||
| (0.70 | ) | 24.28 | 15.52 | 1,455 | 1.18 | 4.53 | 1.33 | 101 | ||||||||||||||||||||||||
| (0.82 | ) | 21.71 | 10.34 | 1,277 | 1.18 | 4.65 | 1.44 | 51 | ||||||||||||||||||||||||
| (1.28 | ) | 20.49 | (0.53 | ) | 1,241 | 1.20 | 4.46 | 1.13 | 85 | |||||||||||||||||||||||
| (0.46 | ) | 21.81 | 12.34 | 497 | 1.29 | 6.28 | 2.18 | 66 | ||||||||||||||||||||||||
| — | 19.87 | 32.47 | 181 | 1.29 | (d) | 7.21 | (d) | 0.82 | (d) | 6 | ||||||||||||||||||||||
| $ | (3.50 | ) | $ | 22.19 | 5.10 | % | $ | 220 | 0.40 | %(d) | 4.40 | %(d) | 2.63 | %(d) | 31 | % | ||||||||||||||||
| (0.89 | ) | 24.58 | 16.43 | 413 | 0.40 | 4.16 | 1.36 | 101 | ||||||||||||||||||||||||
| (1.00 | ) | 22.00 | 11.13 | 105 | 0.41 | 3.95 | 1.73 | 51 | ||||||||||||||||||||||||
| (1.40 | ) | 20.78 | 0.19 | 37 | 0.45 | 3.60 | 2.20 | 85 | ||||||||||||||||||||||||
| (0.47 | ) | 22.06 | 13.15 | 22 | 0.54 | 5.48 | 3.05 | 66 | ||||||||||||||||||||||||
| — | 19.96 | 33.07 | 13 | 0.54 | (d) | 6.46 | (d) | 1.57 | (d) | 6 | ||||||||||||||||||||||
| $ | (3.49 | ) | $ | 22.21 | 4.95 | % | $ | 136 | 0.63 | %(d) | 4.65 | %(d) | 2.47 | %(d) | 31 | % | ||||||||||||||||
| (0.71 | ) | 24.62 | 16.13 | 111 | 0.63 | 4.28 | 1.00 | 101 | ||||||||||||||||||||||||
| (0.99 | ) | 21.90 | 10.89 | 38 | 0.65 | 4.16 | 1.87 | 51 | ||||||||||||||||||||||||
| (1.34 | ) | 20.73 | (0.08 | ) | 36 | 0.71 | 3.90 | 1.84 | 85 | |||||||||||||||||||||||
| (0.45 | ) | 22.01 | 12.91 | 15 | 0.79 | 5.61 | 3.04 | 66 | ||||||||||||||||||||||||
| — | 19.93 | 32.87 | 13 | 0.79 | (d) | 6.71 | (d) | 1.32 | (d) | 6 | ||||||||||||||||||||||
| $ | (3.52 | ) | $ | 22.32 | 5.16 | % | $ | 44 | 0.23 | %(d) | 4.22 | %(d) | 2.53 | %(d) | 31 | % | ||||||||||||||||
| (0.89 | ) | 24.71 | 16.62 | 41 | 0.23 | 3.76 | 1.65 | 101 | ||||||||||||||||||||||||
| (1.03 | ) | 22.08 | 11.35 | 17 | 0.23 | 3.67 | 2.32 | 51 | ||||||||||||||||||||||||
| (1.42 | ) | 20.85 | 0.34 | 15 | 0.27 | 3.26 | 2.84 | 85 | ||||||||||||||||||||||||
| (0.49 | ) | 22.12 | 13.38 | 15 | 0.34 | 5.21 | 3.48 | 66 | ||||||||||||||||||||||||
| — | 19.99 | 33.27 | 13 | 0.34 | (d) | 6.31 | (d) | 1.77 | (d) | 6 | ||||||||||||||||||||||
| $ | (3.51 | ) | $ | 22.37 | 5.23 | % | $ | 3,434 | 0.13 | %(d) | 4.14 | %(d) | 2.57 | %(d) | 31 | % | ||||||||||||||||
| (0.91 | ) | 24.74 | 16.71 | 3,296 | 0.13 | 3.48 | 2.43 | 101 | ||||||||||||||||||||||||
| (1.06 | ) | 22.10 | 11.51 | 5,008 | 0.13 | 3.84 | 2.42 | 51 | ||||||||||||||||||||||||
| (1.44 | ) | 20.87 | 0.43 | 4,483 | 0.17 | 3.16 | 2.95 | 85 | ||||||||||||||||||||||||
| (0.50 | ) | 22.14 | 13.49 | 4,484 | 0.24 | 5.11 | 3.58 | 66 | ||||||||||||||||||||||||
| — | 20.00 | 33.33 | 3,920 | 0.24 | (d) | 6.21 | (d) | 1.87 | (d) | 6 | ||||||||||||||||||||||
| $ | (3.48 | ) | $ | 22.30 | 5.07 | % | $ | 21 | 0.38 | %(d) | 4.38 | %(d) | 2.38 | %(d) | 31 | % | ||||||||||||||||
| (0.86 | ) | 24.67 | 16.48 | 20 | 0.38 | 3.79 | 2.09 | 101 | ||||||||||||||||||||||||
| (1.00 | ) | 22.04 | 11.20 | 17 | 0.38 | 3.82 | 2.17 | 51 | ||||||||||||||||||||||||
| (1.39 | ) | 20.81 | 0.20 | 15 | 0.42 | 3.41 | 2.69 | 85 | ||||||||||||||||||||||||
| (0.47 | ) | 22.08 | 13.20 | 15 | 0.49 | 5.36 | 3.33 | 66 | ||||||||||||||||||||||||
| — | 19.97 | 33.13 | 13 | 0.49 | (d) | 6.46 | (d) | 1.62 | (d) | 6 | ||||||||||||||||||||||
| (c) | Does not include expenses of the investment companies in which the Fund invests. |
| (d) | Annualized. |
| See accompanying Notes to Financial Statements | | May 31, 2014 | | Semiannual Report | 199 |
Table of Contents
Financial Highlights (cont’d)
For a Share Outstanding for the Period ended:
| Net
Asset |
Net Investment Income (a) |
Net Realized and Change in Unrealized Gain |
Total from Investment Operations |
Dividends from Net Investment Income |
Distributions from Net Realized Capital Gains |
|||||||||||||||||||||
| AllianzGI Behavioral Advantage Large Cap: | ||||||||||||||||||||||||||
| Class A | ||||||||||||||||||||||||||
| 5/31/2014+ |
$ | 23.72 | $ | 0.12 | $ | 1.06 | $ | 1.18 | $ | (0.24 | ) | $ | (0.84 | ) | ||||||||||||
| 11/30/2013 |
19.04 | 0.24 | 5.73 | 5.97 | (0.20 | ) | (1.09 | ) | ||||||||||||||||||
| 11/30/2012 |
16.05 | 0.29 | 2.76 | 3.05 | (0.06 | ) | — | |||||||||||||||||||
| 9/8/2011* - 11/30/2011 |
15.00 | 0.04 | 1.01 | 1.05 | — | — | ||||||||||||||||||||
| Class C | ||||||||||||||||||||||||||
| 5/31/2014+ |
$ | 23.34 | $ | 0.03 | $ | 1.05 | $ | 1.08 | $ | (0.14 | ) | $ | (0.84 | ) | ||||||||||||
| 11/30/2013 |
18.90 | 0.09 | 5.65 | 5.74 | (0.21 | ) | (1.09 | ) | ||||||||||||||||||
| 11/30/2012 |
16.02 | 0.16 | 2.74 | 2.90 | (0.02 | ) | — | |||||||||||||||||||
| 9/8/2011* - 11/30/2011 |
15.00 | 0.01 | 1.01 | 1.02 | — | — | ||||||||||||||||||||
| Class D | ||||||||||||||||||||||||||
| 5/31/2014+ |
$ | 23.50 | $ | 0.12 | $ | 1.06 | $ | 1.18 | $ | (0.06 | ) | $ | (0.84 | ) | ||||||||||||
| 11/30/2013 |
19.04 | 0.23 | 5.68 | 5.91 | (0.36 | ) | (1.09 | ) | ||||||||||||||||||
| 11/30/2012 |
16.05 | 0.28 | 2.77 | 3.05 | (0.06 | ) | — | |||||||||||||||||||
| 9/8/2011* - 11/30/2011 |
15.00 | 0.04 | 1.01 | 1.05 | — | — | ||||||||||||||||||||
| Class P | ||||||||||||||||||||||||||
| 5/31/2014+ |
$ | 23.74 | $ | 0.14 | $ | 1.07 | $ | 1.21 | $ | (0.15 | ) | $ | (0.84 | ) | ||||||||||||
| 11/30/2013 |
19.09 | 0.29 | 5.71 | 6.00 | (0.26 | ) | (1.09 | ) | ||||||||||||||||||
| 11/30/2012 |
16.05 | 0.32 | 2.79 | 3.11 | (0.07 | ) | — | |||||||||||||||||||
| 9/8/2011* - 11/30/2011 |
15.00 | 0.05 | 1.00 | 1.05 | — | — | ||||||||||||||||||||
| Institutional Class | ||||||||||||||||||||||||||
| 5/31/2014+ |
$ | 23.74 | $ | 0.15 | $ | 1.07 | $ | 1.22 | $ | (0.19 | ) | $ | (0.84 | ) | ||||||||||||
| 11/30/2013 |
19.10 | 0.30 | 5.73 | 6.03 | (0.30 | ) | (1.09 | ) | ||||||||||||||||||
| 11/30/2012 |
16.06 | 0.34 | 2.77 | 3.11 | (0.07 | ) | — | |||||||||||||||||||
| 9/8/2011* - 11/30/2011 |
15.00 | 0.05 | 1.01 | 1.06 | — | — | ||||||||||||||||||||
| AllianzGI Best Styles Global Equity: | ||||||||||||||||||||||||||
| Class R6 | ||||||||||||||||||||||||||
| 12/2/2013* - 5/31/2014+ |
$ | 15.00 | $ | 0.24 | $ | 0.78 | $ | 1.02 | $ | — | $ | — | ||||||||||||||
| + | Unaudited |
| * | Commencement of operations. |
| (a) | Calculated on average shares outstanding during the period. |
| (b) | Total return is calculated assuming a purchase of a share on the first day of the period and a sale of a share on the last day of each period reported. Dividends and distributions, if any, are assumed, for purposes of this calculation, to be reinvested. Total return does not reflect sales charges and includes the effect of fee waivers and reimbursements. Total return may reflect adjustments to conform to generally accepted accounting principles. Total return for a period of less than one year is not annualized. |
| (c) | Annualized. |
| (d) | Less than 1%. |
| 200 | Semiannual Report | | May 31, 2014 | | See accompanying Notes to Financial Statements |
Table of Contents
| Total Dividends and Distributions |
Net Asset Value, End of Period |
Total Return (b) | Net Assets, End of Period (000s) |
Ratio of Expenses to Average Net Assets with Fee Waiver/ Reimbursement |
Ratio of Expenses to Average Net Assets without Fee Waiver/ Reimbursement |
Ratio of Net Investment Income to Average Net Assets |
Portfolio Turnover Rate |
|||||||||||||||||||||||||
| $ | (1.08 | ) | $ | 23.82 | 5.25 | % | $ | 9,702 | 0.82 | %(c) | 1.03 | %(c) | 1.02 | %(c) | 50 | % | ||||||||||||||||
| (1.29 | ) | 23.72 | 33.61 | 8,607 | 0.83 | 1.25 | 1.09 | 64 | ||||||||||||||||||||||||
| (0.06 | ) | 19.04 | 19.07 | 49 | 0.90 | 2.76 | 1.59 | 76 | ||||||||||||||||||||||||
| — | 16.05 | 7.00 | 11 | 0.90 | (c) | 2.84 | (c) | 1.14 | (c) | — | (d) | |||||||||||||||||||||
| $ | (0.98 | ) | $ | 23.44 | 4.87 | % | $ | 386 | 1.57 | %(c) | 1.79 | %(c) | 0.27 | %(c) | 50 | % | ||||||||||||||||
| (1.30 | ) | 23.34 | 32.60 | 204 | 1.59 | 2.08 | 0.44 | 64 | ||||||||||||||||||||||||
| (0.02 | ) | 18.90 | 18.15 | 64 | 1.65 | 3.62 | 0.89 | 76 | ||||||||||||||||||||||||
| — | 16.02 | 6.80 | 10 | 1.65 | (c) | 3.59 | (c) | 0.38 | (c) | — | (d) | |||||||||||||||||||||
| $ | (0.90 | ) | $ | 23.78 | 5.26 | % | $ | 303 | 0.81 | %(c) | 1.30 | %(c) | 1.07 | %(c) | 50 | % | ||||||||||||||||
| (1.45 | ) | 23.50 | 33.57 | 183 | 0.85 | 2.08 | 1.15 | 64 | ||||||||||||||||||||||||
| (0.06 | ) | 19.04 | 19.07 | 19 | 0.90 | 2.61 | 1.55 | 76 | ||||||||||||||||||||||||
| — | 16.05 | 7.00 | 11 | 0.90 | (c) | 2.84 | (c) | 1.14 | (c) | — | (d) | |||||||||||||||||||||
| $ | (0.99 | ) | $ | 23.96 | 5.37 | % | $ | 18 | 0.65 | %(c) | 0.87 | %(c) | 1.18 | %(c) | 50 | % | ||||||||||||||||
| (1.35 | ) | 23.74 | 33.83 | 17 | 0.65 | 1.20 | 1.42 | 64 | ||||||||||||||||||||||||
| (0.07 | ) | 19.09 | 19.43 | 13 | 0.65 | 2.38 | 1.76 | 76 | ||||||||||||||||||||||||
| — | 16.05 | 7.00 | 11 | 0.65 | (c) | 2.70 | (c) | 1.39 | (c) | — | (d) | |||||||||||||||||||||
| $ | (1.03 | ) | $ | 23.93 | 5.42 | % | $ | 71,283 | 0.55 | %(c) | 0.77 | %(c) | 1.30 | %(c) | 50 | % | ||||||||||||||||
| (1.39 | ) | 23.74 | 34.02 | 48,281 | 0.55 | 1.05 | 1.44 | 64 | ||||||||||||||||||||||||
| (0.07 | ) | 19.10 | 19.46 | 17,172 | 0.55 | 2.32 | 1.88 | 76 | ||||||||||||||||||||||||
| — | 16.06 | 7.07 | 10,705 | 0.55 | (c) | 2.58 | (c) | 1.48 | (c) | — | (d) | |||||||||||||||||||||
| $ | — | $ | 16.02 | 6.80 | % | $ | 36,817 | 0.40 | %(c) | 1.48 | %(c) | 3.19 | %(c) | 21 | % | |||||||||||||||||
| See accompanying Notes to Financial Statements | | May 31, 2014 | | Semiannual Report | 201 |
Table of Contents
Financial Highlights (cont’d)
For a Share Outstanding for the Period ended:
| Net Asset Value, Beginning of Period |
Net Investment Income (Loss) (a) |
Net Realized and Change in Unrealized Gain (Loss) |
Total from Investment Operations |
Dividends from Net Investment Income |
Distributions from Net Realized Capital Gains |
|||||||||||||||||||||
| AllianzGI China Equity: | ||||||||||||||||||||||||||
| Class A | ||||||||||||||||||||||||||
| 5/31/2014+ |
$ | 16.85 | $ | (0.01 | ) | $ | (1.12 | ) | $ | (1.13 | ) | $ | (0.07 | ) | $ | — | ||||||||||
| 11/30/2013 |
14.78 | 0.15 | 2.13 | 2.28 | (0.21 | ) | — | |||||||||||||||||||
| 11/30/2012 |
15.01 | 0.16 | 0.91 | 1.07 | (0.10 | ) | (1.20 | ) | ||||||||||||||||||
| 11/30/2011 |
19.81 | 0.60 | (4.58 | ) | (3.98 | ) | — | (e) | (0.82 | ) | ||||||||||||||||
| 6/7/2010* - 11/30/2010 |
15.00 | (0.09 | ) | 4.90 | 4.81 | — | — | |||||||||||||||||||
| Class C | ||||||||||||||||||||||||||
| 5/31/2014+ |
$ | 16.78 | $ | (0.11 | ) | $ | (1.08 | ) | $ | (1.19 | ) | $ | — | (e) | $ | — | ||||||||||
| 11/30/2013 |
14.63 | (0.03 | ) | 2.18 | 2.15 | — | (e) | — | ||||||||||||||||||
| 11/30/2012 |
14.88 | 0.06 | 0.89 | 0.95 | — | (e) | (1.20 | ) | ||||||||||||||||||
| 11/30/2011 |
19.78 | (0.10 | ) | (3.98 | ) | (4.08 | ) | — | (e) | (0.82 | ) | |||||||||||||||
| 6/7/2010* - 11/30/2010 |
15.00 | (0.17 | ) | 4.95 | 4.78 | — | — | |||||||||||||||||||
| Class D | ||||||||||||||||||||||||||
| 5/31/2014+ |
$ | 16.86 | $ | (0.02 | ) | $ | (1.12 | ) | $ | (1.14 | ) | $ | — | (e) | $ | — | ||||||||||
| 11/30/2013 |
14.91 | 0.07 | 2.23 | 2.30 | (0.35 | ) | — | |||||||||||||||||||
| 11/30/2012 |
15.04 | 0.16 | 0.91 | 1.07 | — | (e) | (1.20 | ) | ||||||||||||||||||
| 11/30/2011 |
19.84 | 0.02 | (3.99 | ) | (3.97 | ) | (0.01 | ) | (0.82 | ) | ||||||||||||||||
| 6/7/2010* - 11/30/2010 |
15.00 | (0.08 | ) | 4.92 | 4.84 | — | — | |||||||||||||||||||
| Class P | ||||||||||||||||||||||||||
| 5/31/2014+ |
$ | 16.99 | $ | — | (f) | $ | (1.13 | ) | $ | (1.13 | ) | $ | — | (e) | $ | — | ||||||||||
| 11/30/2013 |
14.78 | 0.23 | 2.11 | 2.34 | (0.13 | ) | — | |||||||||||||||||||
| 11/30/2012 |
15.10 | 0.01 | 1.08 | 1.09 | (0.21 | ) | (1.20 | ) | ||||||||||||||||||
| 11/30/2011 |
19.87 | 0.12 | (4.06 | ) | (3.94 | ) | (0.01 | ) | (0.82 | ) | ||||||||||||||||
| 6/7/2010* - 11/30/2010 |
15.00 | (0.02 | ) | 4.89 | 4.87 | — | — | |||||||||||||||||||
| Institutional Class | ||||||||||||||||||||||||||
| 5/31/2014+ |
$ | 16.82 | $ | 0.01 | $ | (1.12 | ) | $ | (1.11 | ) | $ | (0.12 | ) | $ | — | |||||||||||
| 11/30/2013 |
14.81 | 0.20 | 2.13 | 2.33 | (0.32 | ) | — | |||||||||||||||||||
| 11/30/2012 |
15.12 | 0.20 | 0.90 | 1.10 | (0.21 | ) | (1.20 | ) | ||||||||||||||||||
| 11/30/2011 |
19.88 | 0.18 | (4.10 | ) | (3.92 | ) | (0.02 | ) | (0.82 | ) | ||||||||||||||||
| 6/7/2010* - 11/30/2010 |
15.00 | (0.01 | ) | 4.89 | 4.88 | — | — | |||||||||||||||||||
| + | Unaudited |
| * | Commencement of operations. |
| (a) | Calculated on average shares outstanding during the period. |
| (b) | Total return is calculated assuming a purchase of a share on the first day of the period and a sale of a share on the last day of each period reported. Dividends and distributions, if any, are assumed, for purposes of this calculation, to be reinvested. Total return does not reflect sales charges and includes the effect of fee waivers and reimbursements. Total return may reflect adjustments to conform to generally accepted accounting principles. Total return for a period of less than one year is not annualized. |
| (c) | Annualized. |
| (d) | Payments from Affiliates increased the net asset value and the total return by $0.12 and 0.82%, respectively. |
| (e) | Less than $(0.01) per share. |
| (f) | Less than $0.01 per share. |
| 202 | Semiannual Report | | May 31, 2014 | | See accompanying Notes to Financial Statements |
Table of Contents
| Total Dividends and Distributions |
Net Asset Value, End of Period |
Total Return (b) | Net Assets, End of Period (000s) |
Ratio of Expenses to Average Net Assets with Fee Waiver/ Reimbursement |
Ratio of Expenses to Average Net Assets without Fee Waiver/ Reimbursement |
Ratio of Net Investment Income (Loss) to Average Net Assets |
Portfolio Turnover Rate |
|||||||||||||||||||||||||
| $ | (0.07 | ) | $ | 15.65 | (6.71 | )% | $ | 129 | 1.72 | %(c) | 6.29 | %(c) | (0.16 | )%(c) | 33 | % | ||||||||||||||||
| (0.21 | ) | 16.85 | (d) | 15.58 | (d) | 137 | 1.73 | 5.88 | 0.96 | 36 | ||||||||||||||||||||||
| (1.30 | ) | 14.78 | 8.35 | 137 | 1.72 | 6.54 | 1.15 | 36 | ||||||||||||||||||||||||
| (0.82 | ) | 15.01 | (20.45 | ) | 191 | 1.73 | 5.29 | 3.25 | 132 | |||||||||||||||||||||||
| — | 19.81 | 32.07 | 239 | 1.90 | (c) | 8.21 | (c) | (0.99 | )(c) | 21 | ||||||||||||||||||||||
| $ | — | (e) | $ | 15.59 | (7.09 | )% | $ | 33 | 2.53 | %(c) | 6.93 | %(c) | (1.40 | )%(c) | 33 | % | ||||||||||||||||
| — | (e) | 16.78 | (d) | 14.70 | (d) | 52 | 2.56 | 6.59 | (0.20 | ) | 36 | |||||||||||||||||||||
| (1.20 | ) | 14.63 | 7.49 | 55 | 2.52 | 8.46 | 0.43 | 36 | ||||||||||||||||||||||||
| (0.82 | ) | 14.88 | (21.02 | ) | 108 | 2.56 | 6.74 | (0.56 | ) | 132 | ||||||||||||||||||||||
| — | 19.78 | 31.87 | 387 | 2.65 | (c) | 8.88 | (c) | (1.88 | )(c) | 21 | ||||||||||||||||||||||
| $ | — | (e) | $ | 15.72 | (6.76 | )% | $ | 201 | 1.77 | %(c) | 11.52 | %(c) | (0.24 | )%(c) | 33 | % | ||||||||||||||||
| (0.35 | ) | 16.86 | (d) | 15.64 | (d) | 220 | 1.77 | 13.23 | 0.42 | 36 | ||||||||||||||||||||||
| (1.20 | ) | 14.91 | 8.26 | 362 | 1.74 | 15.31 | 1.14 | 36 | ||||||||||||||||||||||||
| (0.83 | ) | 15.04 | (20.40 | ) | 232 | 1.77 | 6.76 | 0.14 | 132 | |||||||||||||||||||||||
| — | 19.84 | 32.27 | 386 | 1.90 | (c) | 8.10 | (c) | (0.91 | )(c) | 21 | ||||||||||||||||||||||
| $ | — | (e) | $ | 15.86 | (6.65 | )% | $ | 12 | 1.51 | %(c) | 6.01 | %(c) | 0.03 | %(c) | 33 | % | ||||||||||||||||
| (0.13 | ) | 16.99 | (d) | 15.93 | (d) | 13 | 1.51 | 5.73 | 1.53 | 36 | ||||||||||||||||||||||
| (1.41 | ) | 14.78 | 8.51 | 25 | 1.50 | 5.74 | 0.08 | 36 | ||||||||||||||||||||||||
| (0.83 | ) | 15.10 | (20.18 | ) | 124 | 1.51 | 8.18 | 0.79 | 132 | |||||||||||||||||||||||
| — | 19.87 | 32.47 | 13 | 1.65 | (c) | 8.13 | (c) | (0.19 | )(c) | 21 | ||||||||||||||||||||||
| $ | (0.12 | ) | $ | 15.59 | (6.62 | )% | $ | 3,817 | 1.45 | %(c) | 5.92 | %(c) | 0.10 | %(c) | 33 | % | ||||||||||||||||
| (0.32 | ) | 16.82 | (d) | 15.99 | (d) | 4,076 | 1.45 | 5.69 | 1.31 | 36 | ||||||||||||||||||||||
| (1.41 | ) | 14.81 | 8.64 | 3,490 | 1.43 | 6.19 | 1.41 | 36 | ||||||||||||||||||||||||
| (0.84 | ) | 15.12 | (20.11 | ) | 3,216 | 1.45 | 5.96 | 1.04 | 132 | |||||||||||||||||||||||
| — | 19.88 | 32.53 | 3,923 | 1.55 | (c) | 8.01 | (c) | (0.08 | )(c) | 21 | ||||||||||||||||||||||
| See accompanying Notes to Financial Statements | | May 31, 2014 | | Semiannual Report | 203 |
Table of Contents
Financial Highlights (cont’d)
For a Share Outstanding for the Period ended:
| Net Asset Value, Beginning of Period |
Net Investment Income (a) |
Net Realized and Change in Unrealized Gain (Loss) |
Total from Investment Operations |
Dividends from Net Investment Income |
Distributions from Net Realized Capital Gains |
|||||||||||||||||||||
| AllianzGI Convertible: | ||||||||||||||||||||||||||
| Class A | ||||||||||||||||||||||||||
| 5/31/2014+ |
$ | 34.91 | $ | 0.22 | $ | 2.19 | $ | 2.41 | $ | (0.52 | ) | $ | (0.43 | ) | ||||||||||||
| 11/30/2013 |
28.27 | 0.54 | 6.59 | 7.13 | (0.49 | ) | — | |||||||||||||||||||
| 11/30/2012 |
28.11 | 0.53 | 1.95 | 2.48 | (0.75 | ) | (1.57 | ) | ||||||||||||||||||
| 11/30/2011 |
28.21 | 0.55 | 0.01 | 0.56 | (0.66 | ) | — | |||||||||||||||||||
| 4/12/2010* - 11/30/2010 |
26.22 | 0.38 | 1.82 | 2.20 | (0.21 | ) | — | |||||||||||||||||||
| Class C | ||||||||||||||||||||||||||
| 5/31/2014+ |
$ | 34.93 | $ | 0.09 | $ | 2.18 | $ | 2.27 | $ | (0.39 | ) | $ | (0.43 | ) | ||||||||||||
| 11/30/2013 |
28.30 | 0.30 | 6.60 | 6.90 | (0.27 | ) | — | |||||||||||||||||||
| 11/30/2012 |
28.15 | 0.32 | 1.96 | 2.28 | (0.56 | ) | (1.57 | ) | ||||||||||||||||||
| 11/30/2011 |
28.30 | 0.34 | 0.03 | 0.37 | (0.52 | ) | — | |||||||||||||||||||
| 4/12/2010* - 11/30/2010 |
26.22 | 0.24 | 1.84 | 2.08 | — | (d) | — | |||||||||||||||||||
| Class D | ||||||||||||||||||||||||||
| 5/31/2014+ |
$ | 34.86 | $ | 0.22 | $ | 2.18 | $ | 2.40 | $ | (0.50 | ) | $ | (0.43 | ) | ||||||||||||
| 11/30/2013 |
28.22 | 0.52 | 6.57 | 7.09 | (0.45 | ) | — | |||||||||||||||||||
| 11/30/2012 |
28.08 | 0.51 | 1.95 | 2.46 | (0.75 | ) | (1.57 | ) | ||||||||||||||||||
| 11/30/2011 |
28.16 | 0.54 | 0.03 | 0.57 | (0.65 | ) | — | |||||||||||||||||||
| 4/12/2010* - 11/30/2010 |
26.22 | 0.40 | 1.79 | 2.19 | (0.25 | ) | — | |||||||||||||||||||
| Class R | ||||||||||||||||||||||||||
| 5/31/2014+ |
$ | 34.87 | $ | 0.16 | $ | 2.19 | $ | 2.35 | $ | (0.48 | ) | $ | (0.43 | ) | ||||||||||||
| 11/30/2013 |
28.20 | 0.34 | 6.61 | 6.95 | (0.28 | ) | — | |||||||||||||||||||
| 11/30/2012 |
28.08 | 0.43 | 1.95 | 2.38 | (0.69 | ) | (1.57 | ) | ||||||||||||||||||
| 11/30/2011 |
28.17 | 0.48 | 0.02 | 0.50 | (0.59 | ) | — | |||||||||||||||||||
| 4/12/2010* - 11/30/2010 |
26.22 | 0.33 | 1.82 | 2.15 | (0.20 | ) | — | |||||||||||||||||||
| Class P | ||||||||||||||||||||||||||
| 5/31/2014+ |
$ | 34.84 | $ | 0.25 | $ | 2.18 | $ | 2.43 | $ | (0.54 | ) | $ | (0.43 | ) | ||||||||||||
| 11/30/2013 |
28.20 | 0.63 | 6.55 | 7.18 | (0.54 | ) | — | |||||||||||||||||||
| 11/30/2012 |
28.04 | 0.58 | 1.94 | 2.52 | (0.79 | ) | (1.57 | ) | ||||||||||||||||||
| 11/30/2011 |
28.12 | 0.60 | 0.01 | 0.61 | (0.69 | ) | — | |||||||||||||||||||
| 6/7/2010* - 11/30/2010 |
24.02 | 0.27 | 4.11 | 4.38 | (0.28 | ) | — | |||||||||||||||||||
| Institutional Class | ||||||||||||||||||||||||||
| 5/31/2014+ |
$ | 34.80 | $ | 0.27 | $ | 2.18 | $ | 2.45 | $ | (0.56 | ) | $ | (0.43 | ) | ||||||||||||
| 11/30/2013 |
28.16 | 0.61 | 6.59 | 7.20 | (0.56 | ) | — | |||||||||||||||||||
| 11/30/2012 |
28.00 | 0.62 | 1.94 | 2.56 | (0.83 | ) | (1.57 | ) | ||||||||||||||||||
| 11/30/2011 |
28.08 | 0.63 | 0.01 | 0.64 | (0.72 | ) | — | |||||||||||||||||||
| 11/30/2010 |
23.92 | 0.62 | 4.20 | 4.82 | (0.66 | ) | — | |||||||||||||||||||
| 4/1/2009** - 11/30/2009 |
19.01 | 0.50 | 4.77 | 5.27 | (0.36 | ) | — | |||||||||||||||||||
| 3/31/2009 |
24.88 | 0.43 | (5.73 | ) | (5.30 | ) | (0.43 | ) | (0.14 | ) | ||||||||||||||||
| Administrative Class | ||||||||||||||||||||||||||
| 5/31/2014+ |
$ | 34.84 | $ | 0.23 | $ | 2.19 | $ | 2.42 | $ | (0.52 | ) | $ | (0.43 | ) | ||||||||||||
| 11/30/2013 |
28.20 | 0.53 | 6.59 | 7.12 | (0.48 | ) | — | |||||||||||||||||||
| 11/30/2012 |
28.04 | 0.55 | 1.94 | 2.49 | (0.76 | ) | (1.57 | ) | ||||||||||||||||||
| 11/30/2011 |
28.14 | 0.55 | 0.01 | 0.56 | (0.66 | ) | — | |||||||||||||||||||
| 4/12/2010* - 11/30/2010 |
26.22 | 0.37 | 1.83 | 2.20 | (0.28 | ) | — | |||||||||||||||||||
| + | Unaudited |
| * | Commencement of operations. |
| ** | On November 13, 2009, the Board of Trustees approved a change in the Fund’s fiscal year from March 31 to November 30. |
| (a) | Calculated on average shares outstanding during the period. |
| (b) | Total return is calculated assuming a purchase of a share on the first day of the period and a sale of a share on the last day of each period reported. Dividends and distributions, if any, are assumed, for purposes of this calculation, to be reinvested. Total return does not reflect sales charges and includes the effect of fee waivers and reimbursements. Total return may reflect adjustments to conform to generally accepted accounting principles. Total return for a period of less than one year is not annualized. |
| 204 | Semiannual Report | | May 31, 2014 | | See accompanying Notes to Financial Statements |
Table of Contents
| Total Dividends and Distributions |
Net Asset Value, End of Period |
Total Return (b) | Net Assets, End of Period (000s) |
Ratio of Expenses to Average Net Assets with Fee Waiver/ Reimbursement |
Ratio of Expenses to Average Net Assets without Fee Waiver/ Reimbursement |
Ratio of Net Investment Income to Average Net Assets |
Portfolio Turnover Rate |
|||||||||||||||||||||||||
| $ | (0.95 | ) | $ | 36.37 | (f) | 7.09 | %(f) | $ | 483,918 | 0.93 | %(c) | 0.93 | %(c) | 1.26 | %(c) | 45 | % | |||||||||||||||
| (0.49 | ) | 34.91 | 25.49 | 319,778 | 0.96 | 0.96 | 1.67 | 81 | ||||||||||||||||||||||||
| (2.32 | ) | 28.27 | 9.64 | 94,347 | 1.01 | 1.01 | 1.91 | 108 | ||||||||||||||||||||||||
| (0.66 | ) | 28.11 | 1.95 | 64,857 | 0.97 | 0.97 | 1.89 | 129 | ||||||||||||||||||||||||
| (0.21 | ) | 28.21 | 8.46 | 10,500 | 0.96 | (c) | 0.97 | (c) | 2.25 | (c) | 116 | |||||||||||||||||||||
| $ | (0.82 | ) | $ | 36.38 | (f) | 6.69 | %(f) | $ | 135,599 | 1.68 | %(c) | 1.68 | %(c) | 0.50 | %(c) | 45 | % | |||||||||||||||
| (0.27 | ) | 34.93 | 24.55 | 113,799 | 1.70 | 1.70 | 0.94 | 81 | ||||||||||||||||||||||||
| (2.13 | ) | 28.30 | 8.81 | 36,917 | 1.76 | 1.76 | 1.16 | 108 | ||||||||||||||||||||||||
| (0.52 | ) | 28.15 | 1.26 | 27,465 | 1.74 | 1.74 | 1.17 | 129 | ||||||||||||||||||||||||
| — | (d) | 28.30 | 7.94 | 227 | 1.77 | (c) | 1.77 | (c) | 1.40 | (c) | 116 | |||||||||||||||||||||
| $ | (0.93 | ) | $ | 36.33 | (f) | 7.05 | %(f) | $ | 118,536 | 0.96 | %(c) | 0.96 | %(c) | 1.22 | %(c) | 45 | % | |||||||||||||||
| (0.45 | ) | 34.86 | 25.41 | 121,663 | 1.02 | 1.02 | 1.60 | 81 | ||||||||||||||||||||||||
| (2.32 | ) | 28.22 | 9.57 | 35,886 | 1.06 | 1.06 | 1.85 | 108 | ||||||||||||||||||||||||
| (0.65 | ) | 28.08 | 1.99 | 30,176 | 0.98 | 0.98 | 1.83 | 129 | ||||||||||||||||||||||||
| (0.25 | ) | 28.16 | 8.46 | 2,180 | 0.93 | (c) | 0.94 | (c) | 2.31 | (c) | 116 | |||||||||||||||||||||
| $ | (0.91 | ) | $ | 36.31 | (f) | 6.91 | %(f) | $ | 1,295 | 1.25 | %(c) | 1.25 | %(c) | 0.92 | %(c) | 45 | % | |||||||||||||||
| (0.28 | ) | 34.87 | 24.86 | 394 | 1.51 | 1.51 | 1.06 | 81 | ||||||||||||||||||||||||
| (2.26 | ) | 28.20 | 9.25 | 210 | 1.36 | 1.36 | 1.58 | 108 | ||||||||||||||||||||||||
| (0.59 | ) | 28.08 | 1.76 | 37 | 1.22 | 1.22 | 1.67 | 129 | ||||||||||||||||||||||||
| (0.20 | ) | 28.17 | 8.29 | 11 | 1.25 | (c) | 1.26 | (c) | 1.97 | (c) | 116 | |||||||||||||||||||||
| $ | (0.97 | ) | $ | 36.30 | (f) | 7.18 | %(f) | $ | 221,327 | 0.73 | %(c) | 0.73 | %(c) | 1.44 | %(c) | 45 | % | |||||||||||||||
| (0.54 | ) | 34.84 | 25.76 | 251,377 | 0.75 | 0.75 | 1.96 | 81 | ||||||||||||||||||||||||
| (2.36 | ) | 28.20 | 9.84 | 53,368 | 0.80 | 0.86 | 2.12 | 108 | ||||||||||||||||||||||||
| (0.69 | ) | 28.04 | 2.14 | 37,551 | 0.80 | 0.83 | 2.07 | 129 | ||||||||||||||||||||||||
| (0.28 | ) | 28.12 | 18.34 | 21,417 | 0.84 | (c) | 0.87 | (c) | 2.35 | (c) | 116 | |||||||||||||||||||||
| $ | (0.99 | ) | $ | 36.26 | (f) | 7.25 | %(f) | $ | 1,651,273 | 0.64 | %(c) | 0.64 | %(c) | 1.54 | %(c) | 45 | % | |||||||||||||||
| (0.56 | ) | 34.80 | 25.88 | 1,583,824 | 0.65 | 0.65 | 1.93 | 81 | ||||||||||||||||||||||||
| (2.40 | ) | 28.16 | 10.00 | 804,646 | 0.67 | 0.67 | 2.26 | 108 | ||||||||||||||||||||||||
| (0.72 | ) | 28.00 | 2.24 | 521,854 | 0.70 | 0.70 | 2.16 | 129 | ||||||||||||||||||||||||
| (0.66 | ) | 28.08 | 20.46 | 471,226 | 0.77 | 0.80 | 2.42 | 116 | ||||||||||||||||||||||||
| (0.36 | ) | 23.92 | 27.85 | 64,996 | 1.00 | (c)(e) | 1.00 | (c) | 3.34 | (c) | 84 | |||||||||||||||||||||
| (0.57 | ) | 19.01 | (21.30 | ) | 20,664 | 1.03 | (e) | 1.03 | 1.86 | 91 | ||||||||||||||||||||||
| $ | (0.95 | ) | $ | 36.31 | (f) | 7.13 | %(f) | $ | 4,363 | 0.88 | %(c) | 0.88 | %(c) | 1.28 | %(c) | 45 | % | |||||||||||||||
| (0.48 | ) | 34.84 | 25.55 | 12,951 | 0.90 | 0.90 | 1.65 | 81 | ||||||||||||||||||||||||
| (2.33 | ) | 28.20 | 9.70 | 2,199 | 0.92 | 0.92 | 2.00 | 108 | ||||||||||||||||||||||||
| (0.66 | ) | 28.04 | 2.00 | 1,352 | 0.97 | 0.97 | 1.90 | 129 | ||||||||||||||||||||||||
| (0.28 | ) | 28.14 | 8.45 | 11 | 0.98 | (c) | 0.99 | (c) | 2.23 | (c) | 116 | |||||||||||||||||||||
| (c) | Annualized. |
| (d) | Less than $(0.01) per share. |
| (e) | Ratio of expenses to average net assets net of reimbursement/recoupment offset was 0.99% and 0.98% for the period ended November 30, 2009 and the year ended March 31, 2009, respectively. |
| (f) | Payments from Affiliates increased the net asset value and total return by less than $0.01 and 0.01%, respectively. |
| See accompanying Notes to Financial Statements | | May 31, 2014 | | Semiannual Report | 205 |
Table of Contents
Financial Highlights (cont’d)
For a Share Outstanding for the Period ended:
| Net Asset Value, Beginning of Period |
Net Investment Income (a) |
Net Realized and Change in Unrealized Gain |
Total from Investment Operations |
Dividends from Net Investment Income |
Distributions |
|||||||||||||||||||||
| AllianzGI Global Fundamental Strategy: | ||||||||||||||||||||||||||
| Class A | ||||||||||||||||||||||||||
| 5/31/2014+ |
$ | 15.45 | $ | 0.15 | $ | 0.67 | $ | 0.82 | $ | (0.12 | ) | $ | (0.06 | ) | ||||||||||||
| 7/1/2013* - 11/30/2013 |
15.00 | 0.06 | 0.39 | 0.45 | — | — | ||||||||||||||||||||
| Class C | ||||||||||||||||||||||||||
| 5/31/2014+ |
$ | 15.40 | $ | 0.09 | $ | 0.67 | $ | 0.76 | $ | (0.06 | ) | $ | (0.06 | ) | ||||||||||||
| 7/1/2013* - 11/30/2013 |
15.00 | 0.01 | 0.39 | 0.40 | — | — | ||||||||||||||||||||
| Class D | ||||||||||||||||||||||||||
| 5/31/2014+ |
$ | 15.45 | $ | 0.29 | $ | 0.53 | $ | 0.82 | $ | (0.12 | ) | $ | (0.06 | ) | ||||||||||||
| 7/1/2013* - 11/30/2013 |
15.00 | 0.06 | 0.39 | 0.45 | — | — | ||||||||||||||||||||
| Class P | ||||||||||||||||||||||||||
| 5/31/2014+ |
$ | 15.46 | $ | 0.16 | $ | 0.67 | $ | 0.83 | $ | (0.13 | ) | $ | (0.06 | ) | ||||||||||||
| 7/1/2013* - 11/30/2013 |
15.00 | 0.07 | 0.39 | 0.46 | — | — | ||||||||||||||||||||
| Institutional Class | ||||||||||||||||||||||||||
| 5/31/2014+ |
$ | 15.47 | $ | 0.17 | $ | 0.67 | $ | 0.84 | $ | (0.14 | ) | $ | (0.06 | ) | ||||||||||||
| 7/1/2013* - 11/30/2013 |
15.00 | 0.08 | 0.39 | 0.47 | — | — | ||||||||||||||||||||
| AllianzGI Global Managed Volatility: | ||||||||||||||||||||||||||
| Class A | ||||||||||||||||||||||||||
| 5/31/2014+ |
$ | 17.96 | $ | 0.16 | $ | 0.80 | $ | 0.96 | $ | (0.58 | ) | $ | (0.33 | ) | ||||||||||||
| 11/30/2013 |
16.68 | 0.39 | 1.63 | 2.02 | (0.59 | ) | (0.15 | ) | ||||||||||||||||||
| 12/19/2011* - 11/30/2012 |
15.00 | 0.39 | 1.29 | 1.68 | — | — | ||||||||||||||||||||
| Class C | ||||||||||||||||||||||||||
| 5/31/2014+ |
$ | 17.62 | $ | 0.10 | $ | 0.77 | $ | 0.87 | $ | (0.54 | ) | $ | (0.33 | ) | ||||||||||||
| 11/30/2013 |
16.56 | 0.24 | 1.64 | 1.88 | (0.67 | ) | (0.15 | ) | ||||||||||||||||||
| 12/19/2011* - 11/30/2012 |
15.00 | 0.33 | 1.23 | 1.56 | — | — | ||||||||||||||||||||
| Class D | ||||||||||||||||||||||||||
| 5/31/2014+ |
$ | 17.88 | $ | 0.15 | $ | 0.81 | $ | 0.96 | $ | (0.51 | ) | $ | (0.33 | ) | ||||||||||||
| 11/30/2013 |
16.68 | 0.45 | 1.58 | 2.03 | (0.68 | ) | (0.15 | ) | ||||||||||||||||||
| 12/19/2011* - 11/30/2012 |
15.00 | 0.39 | 1.29 | 1.68 | — | — | ||||||||||||||||||||
| Class P | ||||||||||||||||||||||||||
| 5/31/2014+ |
$ | 18.06 | $ | 0.18 | $ | 0.80 | $ | 0.98 | $ | (0.60 | ) | $ | (0.33 | ) | ||||||||||||
| 11/30/2013 |
16.71 | 0.48 | 1.61 | 2.09 | (0.59 | ) | (0.15 | ) | ||||||||||||||||||
| 12/19/2011* - 11/30/2012 |
15.00 | 0.48 | 1.23 | 1.71 | — | — | ||||||||||||||||||||
| Institutional Class | ||||||||||||||||||||||||||
| 5/31/2014+ |
$ | 18.06 | $ | 0.19 | $ | 0.80 | $ | 0.99 | $ | (0.62 | ) | $ | (0.33 | ) | ||||||||||||
| 11/30/2013 |
16.73 | 0.50 | 1.60 | 2.10 | (0.62 | ) | (0.15 | ) | ||||||||||||||||||
| 12/19/2011* - 11/30/2012 |
15.00 | 0.49 | 1.24 | 1.73 | — | — | ||||||||||||||||||||
| + | Unaudited |
| * | Commencement of operations. |
| (a) | Calculated on average shares outstanding during the period. |
| (b) | Total return is calculated assuming a purchase of a share on the first day of the period and a sale of a share on the last day of each period reported. Dividends and distributions, if any, are assumed, for purposes of this calculation, to be reinvested. Total return does not reflect sales charges and includes the effect of fee waivers and reimbursements. Total return may reflect adjustments to conform to generally accepted accounting principles. Total return for a period of less than one year is not annualized. |
| (c) | Annualized. |
| 206 | Semiannual Report | | May 31, 2014 | | See accompanying Notes to Financial Statements |
Table of Contents
| Total Dividends and Distributions |
Net Asset Value, End of Period |
Total Return (b) | Net Assets, End of Period (000s) |
Ratio of Expenses to Average Net Assets with Fee Waiver/ Reimbursement |
Ratio of Expenses to Average Net Assets without Fee Waiver/ Reimbursement |
Ratio of Net Investment Income to Average Net Assets |
Portfolio Turnover Rate |
|||||||||||||||||||||||||
| $ | (0.18 | ) | $ | 16.09 | 5.37 | % | $ | 11 | 1.25 | %(c) | 2.20 | %(c) | 1.95 | %(c) | 6 | % | ||||||||||||||||
| — | 15.45 | 3.00 | 10 | 1.25 | (c) | 2.41 | (c) | 0.96 | (c) | 2 | ||||||||||||||||||||||
| $ | (0.12 | ) | $ | 16.04 | 4.99 | % | $ | 11 | 2.00 | %(c) | 2.95 | %(c) | 1.19 | %(c) | 6 | % | ||||||||||||||||
| — | 15.40 | 2.67 | 10 | 2.00 | (c) | 3.16 | (c) | 0.21 | (c) | 2 | ||||||||||||||||||||||
| $ | (0.18 | ) | $ | 16.09 | 5.37 | % | $ | 2,094 | 1.25 | %(c) | 2.25 | %(c) | 3.77 | %(c) | 6 | % | ||||||||||||||||
| — | 15.45 | 3.00 | 10 | 1.25 | (c) | 2.41 | (c) | 0.97 | (c) | 2 | ||||||||||||||||||||||
| $ | (0.19 | ) | $ | 16.10 | 5.44 | % | $ | 11 | 1.10 | %(c) | 1.96 | %(c) | 2.09 | %(c) | 6 | % | ||||||||||||||||
| — | 15.46 | 3.07 | 10 | 1.10 | (c) | 2.16 | (c) | 1.12 | (c) | 2 | ||||||||||||||||||||||
| $ | (0.20 | ) | $ | 16.11 | 5.49 | % | $ | 22,217 | 1.00 | %(c) | 1.97 | %(c) | 2.21 | %(c) | 6 | % | ||||||||||||||||
| — | 15.47 | 3.13 | 20,682 | 1.00 | (c) | 2.14 | (c) | 1.23 | (c) | 2 | ||||||||||||||||||||||
| $ | (0.91 | ) | $ | 18.01 | 5.75 | % | $ | 157 | 0.95 | %(c) | 2.42 | %(c) | 1.91 | %(c) | 43 | % | ||||||||||||||||
| (0.74 | ) | 17.96 | 12.66 | 117 | 0.95 | 2.63 | 2.28 | 92 | ||||||||||||||||||||||||
| — | 16.68 | 11.20 | 50 | 0.95 | (c) | 3.24 | (c) | 2.56 | (c) | 92 | ||||||||||||||||||||||
| $ | (0.87 | ) | $ | 17.62 | 5.33 | % | $ | 183 | 1.63 | %(c) | 3.10 | %(c) | 1.19 | %(c) | 43 | % | ||||||||||||||||
| (0.82 | ) | 17.62 | 11.90 | 184 | 1.64 | 3.26 | 1.40 | 92 | ||||||||||||||||||||||||
| — | 16.56 | 10.40 | 12 | 1.70 | (c) | 4.02 | (c) | 2.18 | (c) | 92 | ||||||||||||||||||||||
| $ | (0.84 | ) | $ | 18.00 | 5.74 | % | $ | 122 | 0.90 | %(c) | 2.61 | %(c) | 1.82 | %(c) | 43 | % | ||||||||||||||||
| (0.83 | ) | 17.88 | 12.74 | 57 | 0.90 | 2.84 | 2.61 | 92 | ||||||||||||||||||||||||
| — | 16.68 | 11.20 | 38 | 0.95 | (c) | 3.37 | (c) | 2.63 | (c) | 92 | ||||||||||||||||||||||
| $ | (0.93 | ) | $ | 18.11 | 5.85 | % | $ | 13 | 0.70 | %(c) | 2.16 | %(c) | 2.13 | %(c) | 43 | % | ||||||||||||||||
| (0.74 | ) | 18.06 | 13.03 | 13 | 0.70 | 2.38 | 2.78 | 92 | ||||||||||||||||||||||||
| — | 16.71 | 11.40 | 11 | 0.70 | (c) | 3.11 | (c) | 3.19 | (c) | 92 | ||||||||||||||||||||||
| $ | (0.95 | ) | $ | 18.10 | 5.90 | % | $ | 17,577 | 0.60 | %(c) | 2.08 | %(c) | 2.23 | %(c) | 43 | % | ||||||||||||||||
| (0.77 | ) | 18.06 | 13.09 | 14,156 | 0.60 | 2.32 | 2.92 | 92 | ||||||||||||||||||||||||
| — | 16.73 | 11.53 | 14,585 | 0.60 | (c) | 2.98 | (c) | 3.22 | (c) | 92 | ||||||||||||||||||||||
| See accompanying Notes to Financial Statements | | May 31, 2014 | | Semiannual Report | 207 |
Table of Contents
Financial Highlights (cont’d)
For a Share Outstanding for the Period ended:
| Net Asset Value, Beginning of Period |
Net Investment Income (Loss) (a) |
Net Realized and Change in Unrealized Gain |
Total from Investment Operations |
Dividends from Net Investment Income |
||||||||||||||||||
| AllianzGI Global Water: | ||||||||||||||||||||||
| Class A | ||||||||||||||||||||||
| 5/31/2014+ |
$ | 12.41 | $ | 0.06 | $ | 0.78 | $ | 0.84 | $ | (0.03 | ) | |||||||||||
| 11/30/2013 |
10.26 | 0.07 | 2.20 | 2.27 | (0.12 | ) | ||||||||||||||||
| 11/30/2012 |
8.89 | 0.12 | 1.30 | 1.42 | (0.05 | ) | ||||||||||||||||
| 11/30/2011 |
8.75 | 0.06 | 0.08 | 0.14 | — | (e) | ||||||||||||||||
| 11/30/2010 |
7.99 | 0.03 | 0.74 | 0.77 | (0.01 | ) | ||||||||||||||||
| 11/30/2009 |
6.28 | 0.06 | 1.84 | 1.90 | (0.19 | ) | ||||||||||||||||
| Class C | ||||||||||||||||||||||
| 5/31/2014+ |
$ | 12.11 | $ | 0.01 | $ | 0.76 | $ | 0.77 | $ | — | (e) | |||||||||||
| 11/30/2013 |
10.02 | (0.02 | ) | 2.16 | 2.14 | (0.05 | ) | |||||||||||||||
| 11/30/2012 |
8.70 | 0.05 | 1.27 | 1.32 | — | (e) | ||||||||||||||||
| 11/30/2011 |
8.62 | (0.01 | ) | 0.09 | 0.08 | — | (e) | |||||||||||||||
| 11/30/2010 |
7.93 | (0.03 | ) | 0.72 | 0.69 | — | (e) | |||||||||||||||
| 11/30/2009 |
6.24 | 0.01 | 1.84 | 1.85 | (0.16 | ) | ||||||||||||||||
| Class D | ||||||||||||||||||||||
| 5/31/2014+ |
$ | 12.38 | $ | 0.05 | $ | 0.77 | $ | 0.82 | $ | (0.02 | ) | |||||||||||
| 11/30/2013 |
10.25 | 0.07 | 2.19 | 2.26 | (0.13 | ) | ||||||||||||||||
| 11/30/2012 |
8.87 | 0.10 | 1.32 | 1.42 | (0.04 | ) | ||||||||||||||||
| 11/30/2011 |
8.73 | 0.04 | 0.10 | 0.14 | — | (e) | ||||||||||||||||
| 11/30/2010 |
7.98 | 0.03 | 0.73 | 0.76 | (0.01 | ) | ||||||||||||||||
| 11/30/2009 |
6.27 | 0.04 | 1.86 | 1.90 | (0.19 | ) | ||||||||||||||||
| Class P | ||||||||||||||||||||||
| 5/31/2014+ |
$ | 12.49 | $ | 0.08 | $ | 0.78 | $ | 0.86 | $ | (0.05 | ) | |||||||||||
| 11/30/2013 |
10.30 | 0.09 | 2.21 | 2.30 | (0.11 | ) | ||||||||||||||||
| 11/30/2012 |
8.93 | 0.14 | 1.30 | 1.44 | (0.07 | ) | ||||||||||||||||
| 11/30/2011 |
8.77 | 0.07 | 0.09 | 0.16 | — | (e) | ||||||||||||||||
| 11/30/2010 |
7.99 | 0.05 | 0.74 | 0.79 | (0.01 | ) | ||||||||||||||||
| 11/30/2009 |
6.29 | 0.08 | 1.83 | 1.91 | (0.21 | ) | ||||||||||||||||
| Institutional Class | ||||||||||||||||||||||
| 5/31/2014+ |
$ | 12.37 | $ | 0.08 | $ | 0.77 | $ | 0.85 | $ | (0.11 | ) | |||||||||||
| 11/30/2013 |
10.25 | 0.09 | 2.21 | 2.30 | (0.18 | ) | ||||||||||||||||
| 11/30/2012 |
8.88 | 0.12 | 1.32 | 1.44 | (0.07 | ) | ||||||||||||||||
| 11/30/2011 |
8.71 | 0.08 | 0.09 | 0.17 | — | (e) | ||||||||||||||||
| 11/30/2010 |
7.94 | 0.05 | 0.74 | 0.79 | (0.02 | ) | ||||||||||||||||
| 11/30/2009 |
6.29 | 0.09 | 1.82 | 1.91 | (0.26 | ) | ||||||||||||||||
| + | Unaudited |
| (a) | Calculated on average shares outstanding during the period. |
| (b) | Effective May 1, 2009, Fund redemption fees were eliminated. |
| (c) | Total return is calculated assuming a purchase of a share on the first day of the period and a sale of a share on the last day of each period reported. Dividends and distributions, if any, are assumed, for purposes of this calculation, to be reinvested. Total return does not reflect sales charges and includes the effect of fee waivers and reimbursements. Total return may reflect adjustments to conform to generally accepted accounting principles. Total return for a period of less than one year is not annualized. |
| (d) | Annualized. |
| (e) | Less than $(0.01) per share. |
| (f) | Less than $0.01 per share. |
| 208 | Semiannual Report | | May 31, 2014 | | See accompanying Notes to Financial Statements |
Table of Contents
| Fund Redemption Fees (a)(b) |
Net Asset Value, End of Period |
Total Return (c) | Net Assets, End of Period (000s) |
Ratio of Expenses to Average Net Assets with Fee Waiver/ Reimbursement |
Ratio of Expenses to Average Net Assets without Fee Waiver/ Reimbursement |
Ratio of Net Investment Income (Loss) to Average Net Assets |
Portfolio Turnover Rate |
|||||||||||||||||||||||||
| $ | — | $ | 13.22 | 6.77 | % | $ | 151,277 | 1.43 | %(d) | 1.43 | %(d) | 0.94 | %(d) | 17 | % | |||||||||||||||||
| — | 12.41 | 22.31 | 118,252 | 1.54 | 1.54 | 0.63 | 28 | |||||||||||||||||||||||||
| — | 10.26 | 16.12 | 59,611 | 1.57 | 1.60 | 1.27 | 73 | |||||||||||||||||||||||||
| — | 8.89 | 1.62 | 27,101 | 1.68 | 1.68 | 0.60 | 73 | |||||||||||||||||||||||||
| — | 8.75 | 9.63 | 22,774 | 1.80 | 1.80 | 0.41 | 40 | |||||||||||||||||||||||||
| — | (f) | 7.99 | 30.93 | 23,787 | 2.04 | 2.04 | 0.90 | 47 | ||||||||||||||||||||||||
| $ | — | $ | 12.88 | 6.36 | % | $ | 72,005 | 2.21 | %(d) | 2.21 | %(d) | 0.17 | %(d) | 17 | % | |||||||||||||||||
| — | 12.11 | 21.41 | 51,767 | 2.33 | 2.33 | (0.18 | ) | 28 | ||||||||||||||||||||||||
| — | 10.02 | 15.17 | 25,870 | 2.33 | 2.41 | 0.48 | 73 | |||||||||||||||||||||||||
| — | 8.70 | 0.93 | 20,842 | 2.44 | 2.44 | (0.15 | ) | 73 | ||||||||||||||||||||||||
| — | 8.62 | 8.70 | 22,225 | 2.56 | 2.60 | (0.37 | ) | 40 | ||||||||||||||||||||||||
| — | (f) | 7.93 | 30.19 | 22,393 | 2.79 | 2.79 | 0.15 | 47 | ||||||||||||||||||||||||
| $ | — | $ | 13.18 | 6.62 | % | $ | 22,311 | 1.60 | %(d) | 1.60 | %(d) | 0.74 | %(d) | 17 | % | |||||||||||||||||
| — | 12.38 | 22.30 | 17,624 | 1.60 | 1.60 | 0.62 | 28 | |||||||||||||||||||||||||
| — | 10.25 | 16.09 | 5,869 | 1.64 | 2.25 | 1.02 | 73 | |||||||||||||||||||||||||
| — | 8.87 | 1.60 | 5,214 | 1.72 | 2.00 | 0.47 | 73 | |||||||||||||||||||||||||
| — | 8.73 | 9.70 | 1,157 | 1.84 | 2.74 | 0.34 | 40 | |||||||||||||||||||||||||
| — | (f) | 7.98 | 31.11 | 156 | 2.40 | 2.40 | 0.55 | 47 | ||||||||||||||||||||||||
| $ | — | $ | 13.30 | 6.89 | % | $ | 60,881 | 1.20 | %(d) | 1.20 | %(d) | 1.19 | %(d) | 17 | % | |||||||||||||||||
| — | 12.49 | 22.58 | 42,448 | 1.34 | 1.34 | 0.81 | 28 | |||||||||||||||||||||||||
| — | 10.30 | 16.22 | 16,820 | 1.41 | 1.47 | 1.49 | 73 | |||||||||||||||||||||||||
| — | 8.93 | 1.85 | 16,118 | 1.49 | 1.52 | 0.79 | 73 | |||||||||||||||||||||||||
| — | 8.77 | 9.95 | 10,432 | 1.56 | 1.64 | 0.62 | 40 | |||||||||||||||||||||||||
| — | (f) | 7.99 | 31.26 | 12,016 | 1.78 | 1.78 | 1.16 | 47 | ||||||||||||||||||||||||
| $ | — | $ | 13.11 | 6.90 | % | $ | 23,887 | 1.11 | %(d) | 1.11 | %(d) | 1.22 | %(d) | 17 | % | |||||||||||||||||
| — | 12.37 | 22.77 | 14,429 | 1.19 | 1.19 | 0.77 | 28 | |||||||||||||||||||||||||
| — | 10.25 | 16.44 | 3,105 | 1.29 | 1.29 | 1.28 | 73 | |||||||||||||||||||||||||
| — | 8.88 | 1.99 | 1,267 | 1.37 | 1.39 | 0.91 | 73 | |||||||||||||||||||||||||
| — | 8.71 | 9.96 | 1,378 | 1.46 | 1.48 | 0.61 | 40 | |||||||||||||||||||||||||
| — | (f) | 7.94 | 31.42 | 544 | 1.68 | 1.68 | 1.26 | 47 | ||||||||||||||||||||||||
| See accompanying Notes to Financial Statements | | May 31, 2014 | | Semiannual Report | 209 |
Table of Contents
Financial Highlights (cont’d)
For a Share Outstanding for the Period ended:
| Net
Asset |
Net Investment Income (a) |
Net Realized and Change in Unrealized Gain (Loss) |
Total from Investment Operations |
Dividends from Net Investment Income |
Distributions from Net Realized Capital Gains |
|||||||||||||||||||||
| AllianzGI High Yield Bond: | ||||||||||||||||||||||||||
| Class A | ||||||||||||||||||||||||||
| 5/31/2014+ |
$ | 10.36 | $ | 0.32 | $ | 0.12 | $ | 0.44 | $ | (0.35 | ) | $ | (0.09 | ) | ||||||||||||
| 11/30/2013 |
10.16 | 0.67 | 0.22 | 0.89 | (0.68 | ) | (0.01 | ) | ||||||||||||||||||
| 11/30/2012 |
9.69 | 0.72 | 0.61 | 1.33 | (0.73 | ) | (0.13 | ) | ||||||||||||||||||
| 11/30/2011 |
10.03 | 0.72 | (0.28 | ) | 0.44 | (0.78 | ) | — | ||||||||||||||||||
| 4/12/2010* - 11/30/2010 |
9.65 | 0.49 | 0.19 | 0.68 | (0.30 | ) | — | |||||||||||||||||||
| Class C | ||||||||||||||||||||||||||
| 5/31/2014+ |
$ | 10.35 | $ | 0.28 | $ | 0.11 | $ | 0.39 | $ | (0.31 | ) | $ | (0.09 | ) | ||||||||||||
| 11/30/2013 |
10.15 | 0.59 | 0.22 | 0.81 | (0.60 | ) | (0.01 | ) | ||||||||||||||||||
| 11/30/2012 |
9.68 | 0.64 | 0.62 | 1.26 | (0.66 | ) | (0.13 | ) | ||||||||||||||||||
| 11/30/2011 |
10.02 | 0.65 | (0.29 | ) | 0.36 | (0.70 | ) | — | ||||||||||||||||||
| 4/12/2010* - 11/30/2010 |
9.65 | 0.45 | 0.19 | 0.64 | (0.27 | ) | — | |||||||||||||||||||
| Class D | ||||||||||||||||||||||||||
| 5/31/2014+ |
$ | 10.08 | $ | 0.30 | $ | 0.11 | $ | 0.41 | $ | (0.35 | ) | $ | (0.09 | ) | ||||||||||||
| 11/30/2013 |
9.91 | 0.64 | 0.22 | 0.86 | (0.68 | ) | (0.01 | ) | ||||||||||||||||||
| 11/30/2012 |
9.47 | 0.70 | 0.60 | 1.30 | (0.73 | ) | (0.13 | ) | ||||||||||||||||||
| 11/30/2011 |
9.79 | 0.72 | (0.28 | ) | 0.44 | (0.76 | ) | — | ||||||||||||||||||
| 4/12/2010* - 11/30/2010 |
9.65 | 0.48 | 0.18 | 0.66 | (0.52 | ) | — | |||||||||||||||||||
| Class R | ||||||||||||||||||||||||||
| 5/31/2014+ |
$ | 10.05 | $ | 0.29 | $ | 0.12 | $ | 0.41 | $ | (0.33 | ) | $ | (0.09 | ) | ||||||||||||
| 11/30/2013 |
9.88 | 0.63 | 0.21 | 0.84 | (0.66 | ) | (0.01 | ) | ||||||||||||||||||
| 11/30/2012 |
9.45 | 0.67 | 0.60 | 1.27 | (0.71 | ) | (0.13 | ) | ||||||||||||||||||
| 11/30/2011 |
9.80 | 0.68 | (0.28 | ) | 0.40 | (0.75 | ) | — | ||||||||||||||||||
| 4/12/2010* - 11/30/2010 |
9.65 | 0.47 | 0.18 | 0.65 | (0.50 | ) | — | |||||||||||||||||||
| Class P | ||||||||||||||||||||||||||
| 5/31/2014+ |
$ | 10.05 | $ | 0.32 | $ | 0.11 | $ | 0.43 | $ | (0.36 | ) | $ | (0.09 | ) | ||||||||||||
| 11/30/2013 |
9.87 | 0.66 | 0.23 | 0.89 | (0.70 | ) | (0.01 | ) | ||||||||||||||||||
| 11/30/2012 |
9.44 | 0.72 | 0.58 | 1.30 | (0.74 | ) | (0.13 | ) | ||||||||||||||||||
| 11/30/2011 |
9.78 | 0.72 | (0.27 | ) | 0.45 | (0.79 | ) | — | ||||||||||||||||||
| 4/12/2010* - 11/30/2010 |
9.65 | 0.50 | 0.17 | 0.67 | (0.54 | ) | — | |||||||||||||||||||
| Institutional Class | ||||||||||||||||||||||||||
| 5/31/2014+ |
$ | 10.08 | $ | 0.32 | $ | 0.11 | $ | 0.43 | $ | (0.36 | ) | $ | (0.09 | ) | ||||||||||||
| 11/30/2013 |
9.90 | 0.68 | 0.22 | 0.90 | (0.71 | ) | (0.01 | ) | ||||||||||||||||||
| 11/30/2012 |
9.46 | 0.73 | 0.60 | 1.33 | (0.76 | ) | (0.13 | ) | ||||||||||||||||||
| 11/30/2011 |
9.80 | 0.76 | (0.30 | ) | 0.46 | (0.80 | ) | — | ||||||||||||||||||
| 11/30/2010 |
9.17 | 0.83 | 0.61 | 1.44 | (0.81 | ) | — | |||||||||||||||||||
| 4/1/2009** - 11/30/2009 |
7.40 | 0.52 | 1.77 | 2.29 | (0.52 | ) | — | |||||||||||||||||||
| 3/31/2009 |
9.36 | 0.71 | (1.90 | ) | (1.19 | ) | (0.77 | ) | — | |||||||||||||||||
| Administrative Class | ||||||||||||||||||||||||||
| 5/31/2014+ |
$ | 10.04 | $ | 0.31 | $ | 0.11 | $ | 0.42 | $ | (0.35 | ) | $ | (0.09 | ) | ||||||||||||
| 11/30/2013 |
9.87 | 0.65 | 0.22 | 0.87 | (0.69 | ) | (0.01 | ) | ||||||||||||||||||
| 11/30/2012 |
9.43 | 0.70 | 0.61 | 1.31 | (0.74 | ) | (0.13 | ) | ||||||||||||||||||
| 11/30/2011 |
9.78 | 0.72 | (0.30 | ) | 0.42 | (0.77 | ) | — | ||||||||||||||||||
| 4/12/2010* - 11/30/2010 |
9.65 | 0.49 | 0.17 | 0.66 | (0.53 | ) | — | |||||||||||||||||||
| + | Unaudited |
| * | Commencement of operations. |
| ** | On November 13, 2009, the Board of Trustees approved a change in the Fund’s fiscal year from March 31 to November 30. |
| (a) | Calculated on average shares outstanding during the period. |
| (b) | Total return is calculated assuming a purchase of a share on the first day of the period and a sale of a share on the last day of each period reported. Dividends and distributions, if any, are assumed, for purposes of this calculation, to be reinvested. Total return does not reflect sales charges and includes the effect of fee waivers and reimbursements. Total return may reflect adjustments to conform to generally accepted accounting principles. Total return for a period of less than one year is not annualized. |
| 210 | Semiannual Report | | May 31, 2014 | | See accompanying Notes to Financial Statements |
Table of Contents
| Total Dividends and Distributions |
Net Asset Value, End of Period |
Total Return (b) | Net Assets, End of Period (000s) |
Ratio of Expenses to Average Net Assets with Fee Waiver/ Reimbursement |
Ratio of Expenses to Average Net Assets without Fee Waiver/ Reimbursement |
Ratio of Net Investment Income to Average Net Assets |
Portfolio Turnover Rate |
|||||||||||||||||||||||||
| $ | (0.44 | ) | $ | 10.36(e | ) | 4.26 | %(e) | $ | 59,167 | 0.93 | %(c) | 0.93 | %(c) | 6.14 | %(c) | 30 | % | |||||||||||||||
| (0.69 | ) | 10.36 | 8.98 | 73,920 | 0.91 | 0.91 | 6.49 | 67 | ||||||||||||||||||||||||
| (0.86 | ) | 10.16 | 14.34 | 109,668 | 0.89 | 0.90 | 7.21 | 86 | ||||||||||||||||||||||||
| (0.78 | ) | 9.69 | 4.29 | 61,339 | 1.05 | 1.05 | 7.19 | 168 | ||||||||||||||||||||||||
| (0.30 | ) | 10.03 | 7.07 | 1,296 | 1.11 | (c) | 1.47 | (c) | 7.70 | (c) | 144 | |||||||||||||||||||||
| $ | (0.40 | ) | $ | 10.34(e | ) | 3.78 | %(e) | $ | 26,055 | 1.70 | %(c) | 1.70 | %(c) | 5.38 | %(c) | 30 | % | |||||||||||||||
| (0.61 | ) | 10.35 | 8.14 | 27,525 | 1.70 | 1.70 | 5.68 | 67 | ||||||||||||||||||||||||
| (0.79 | ) | 10.15 | 13.54 | 30,692 | 1.68 | 1.68 | 6.43 | 86 | ||||||||||||||||||||||||
| (0.70 | ) | 9.68 | 3.53 | 12,443 | 1.82 | 1.87 | 6.56 | 168 | ||||||||||||||||||||||||
| (0.27 | ) | 10.02 | 6.73 | 311 | 1.87 | (c) | 2.21 | (c) | 7.12 | (c) | 144 | |||||||||||||||||||||
| $ | (0.44 | ) | $ | 10.05(e | ) | 4.07 | %(e) | $ | 74,880 | 1.02 | %(c) | 1.02 | %(c) | 6.02 | %(c) | 30 | % | |||||||||||||||
| (0.69 | ) | 10.08 | 8.92 | 108,011 | 1.00 | 1.02 | 6.40 | 67 | ||||||||||||||||||||||||
| (0.86 | ) | 9.91 | 14.33 | 43,921 | 0.96 | 1.07 | 7.14 | 86 | ||||||||||||||||||||||||
| (0.76 | ) | 9.47 | 4.42 | 20,378 | 1.07 | 1.12 | 7.36 | 168 | ||||||||||||||||||||||||
| (0.52 | ) | 9.79 | 7.09 | 169 | 1.11 | (c) | 1.47 | (c) | 7.84 | (c) | 144 | |||||||||||||||||||||
| $ | (0.42 | ) | $ | 10.04(e | ) | 4.17 | %(e) | $ | 3,007 | 1.22 | %(c) | 1.26 | %(c) | 5.86 | %(c) | 30 | % | |||||||||||||||
| (0.67 | ) | 10.05 | 8.72 | 2,851 | 1.15 | 1.32 | 6.24 | 67 | ||||||||||||||||||||||||
| (0.84 | ) | 9.88 | 14.05 | 2,111 | 1.15 | 1.25 | 6.95 | 86 | ||||||||||||||||||||||||
| (0.75 | ) | 9.45 | 4.02 | 342 | 1.33 | 1.37 | 7.23 | 168 | ||||||||||||||||||||||||
| (0.50 | ) | 9.80 | 6.97 | 11 | 1.36 | (c) | 1.63 | (c) | 7.74 | (c) | 144 | |||||||||||||||||||||
| $ | (0.45 | ) | $ | 10.03(e | ) | 4.30 | %(e) | $ | 86,751 | 0.72 | %(c) | 0.72 | %(c) | 6.35 | %(c) | 30 | % | |||||||||||||||
| (0.71 | ) | 10.05 | 9.27 | 77,649 | 0.74 | 0.74 | 6.64 | 67 | ||||||||||||||||||||||||
| (0.87 | ) | 9.87 | 14.48 | 19,497 | 0.74 | 0.79 | 7.39 | 86 | ||||||||||||||||||||||||
| (0.79 | ) | 9.44 | 4.57 | 11,096 | 0.88 | 0.88 | 7.49 | 168 | ||||||||||||||||||||||||
| (0.54 | ) | 9.78 | 7.22 | 11 | 0.97 | (c) | 1.14 | (c) | 8.13 | (c) | 144 | |||||||||||||||||||||
| $ | (0.45 | ) | $ | 10.06(e | ) | 4.33 | %(e) | $ | 174,620 | 0.63 | %(c) | 0.63 | %(c) | 6.45 | %(c) | 30 | % | |||||||||||||||
| (0.72 | ) | 10.08 | 9.35 | 139,306 | 0.62 | 0.62 | 6.76 | 67 | ||||||||||||||||||||||||
| (0.89 | ) | 9.90 | 14.68 | 121,362 | 0.63 | 0.63 | 7.47 | 86 | ||||||||||||||||||||||||
| (0.80 | ) | 9.46 | 4.66 | 70,174 | 0.61 | 0.77 | 7.65 | 168 | ||||||||||||||||||||||||
| (0.81 | ) | 9.80 | 16.23 | 93,782 | 0.63 | 0.93 | 8.65 | 144 | ||||||||||||||||||||||||
| (0.52 | ) | 9.17 | 31.50 | 69,667 | 0.61 | (c) | 0.61 | (c)(d) | 9.08 | (c) | 120 | |||||||||||||||||||||
| (0.77 | ) | 7.40 | (13.01 | ) | 49,233 | 0.64 | 0.64 | (d) | 8.56 | 55 | ||||||||||||||||||||||
| $ | (0.44 | ) | $ | 10.02(e | ) | 4.23 | %(e) | $ | 35,181 | 0.90 | %(c) | 0.90 | %(c) | 6.18 | %(c) | 30 | % | |||||||||||||||
| (0.70 | ) | 10.04 | 9.02 | 32,789 | 0.90 | 0.91 | 6.49 | 67 | ||||||||||||||||||||||||
| (0.87 | ) | 9.87 | 14.54 | 27,274 | 0.90 | 1.14 | 8.92 | 86 | ||||||||||||||||||||||||
| (0.77 | ) | 9.43 | 4.27 | 11 | 1.03 | 1.03 | 7.25 | 168 | ||||||||||||||||||||||||
| (0.53 | ) | 9.78 | 7.12 | 11 | 1.12 | (c) | 1.28 | (c) | 7.98 | (c) | 144 | |||||||||||||||||||||
| (c) | Annualized. |
| (d) | Ratio of expenses to average net assets net of reimbursement/recoupment offset was 0.61% and 0.61% for the period ended November 30, 2009 and the year ended March 31, 2009, respectively. |
| (e) | Payments from Affiliates increased net asset value and total return by less than $0.01 and 0.01%, respectively. |
| See accompanying Notes to Financial Statements | | May 31, 2014 | | Semiannual Report | 211 |
Table of Contents
Financial Highlights (cont’d)
For a Share Outstanding for the Period ended:
| Net Asset Value, Beginning of Period |
Net Investment Income (Loss) (a) |
Net Realized |
Total from Investment Operations |
Dividends from Net Investment Income |
Distributions from Net Realized Capital Gains |
|||||||||||||||||||||
| AllianzGI International Small-Cap: | ||||||||||||||||||||||||||
| Class A | ||||||||||||||||||||||||||
| 5/31/2014+ |
$ | 42.30 | $ | 0.11 | $ | 0.50 | $ | 0.61 | $ | (0.44 | ) | $ | (3.00 | ) | ||||||||||||
| 11/30/2013 |
31.89 | 0.09 | 10.32 | 10.41 | — | (d) | — | |||||||||||||||||||
| 11/30/2012 |
28.31 | 0.16 | 4.06 | 4.22 | (0.64 | ) | — | |||||||||||||||||||
| 11/30/2011 |
31.36 | 0.12 | (2.56 | ) | (2.44 | ) | (0.61 | ) | — | |||||||||||||||||
| 4/12/2010* - 11/30/2010 |
28.30 | (0.01 | ) | 3.07 | 3.06 | — | — | |||||||||||||||||||
| Class C | ||||||||||||||||||||||||||
| 5/31/2014+ |
$ | 41.78 | $ | (0.01 | ) | $ | 0.48 | $ | 0.47 | $ | (0.13 | ) | $ | (3.00 | ) | |||||||||||
| 11/30/2013 |
31.75 | (0.17 | ) | 10.22 | 10.05 | (0.02 | ) | — | ||||||||||||||||||
| 11/30/2012 |
28.01 | (0.07 | ) | 4.04 | 3.97 | (0.23 | ) | — | ||||||||||||||||||
| 11/30/2011 |
31.22 | 0.06 | (2.72 | ) | (2.66 | ) | (0.55 | ) | — | |||||||||||||||||
| 4/12/2010* - 11/30/2010 |
28.30 | (0.24 | ) | 3.16 | 2.92 | — | — | |||||||||||||||||||
| Class D | ||||||||||||||||||||||||||
| 5/31/2014+ |
$ | 43.24 | $ | 0.22 | $ | 0.41 | $ | 0.63 | $ | (0.62 | ) | $ | (3.00 | ) | ||||||||||||
| 11/30/2013 |
32.60 | 0.05 | 10.59 | 10.64 | — | (d) | — | |||||||||||||||||||
| 11/30/2012 |
28.33 | 0.24 | 4.03 | 4.27 | — | (d) | — | |||||||||||||||||||
| 11/30/2011 |
31.37 | 0.07 | (2.53 | ) | (2.46 | ) | (0.58 | ) | — | |||||||||||||||||
| 4/12/2010* - 11/30/2010 |
28.30 | 0.04 | 3.03 | 3.07 | — | — | ||||||||||||||||||||
| Class R | ||||||||||||||||||||||||||
| 5/31/2014+ |
$ | 42.23 | $ | 0.20 | $ | 0.37 | $ | 0.57 | $ | (0.48 | ) | $ | (3.00 | ) | ||||||||||||
| 11/30/2013 |
32.25 | 0.02 | 10.32 | 10.34 | (0.36 | ) | — | |||||||||||||||||||
| 11/30/2012 |
28.27 | 0.08 | 4.10 | 4.18 | (0.20 | ) | — | |||||||||||||||||||
| 11/30/2011 |
31.32 | 0.16 | (2.70 | ) | (2.54 | ) | (0.51 | ) | — | |||||||||||||||||
| 4/12/2010* - 11/30/2010 |
28.30 | 0.05 | 2.97 | 3.02 | — | — | ||||||||||||||||||||
| Class P | ||||||||||||||||||||||||||
| 5/31/2014+ |
$ | 41.97 | $ | 0.13 | $ | 0.51 | $ | 0.64 | $ | (0.40 | ) | $ | (3.00 | ) | ||||||||||||
| 11/30/2013 |
31.92 | 0.16 | 10.24 | 10.40 | (0.35 | ) | — | |||||||||||||||||||
| 11/30/2012 |
27.86 | 0.20 | 4.05 | 4.25 | (0.19 | ) | — | |||||||||||||||||||
| 11/30/2011 |
30.35 | 0.30 | (2.67 | ) | (2.37 | ) | (0.12 | ) | — | |||||||||||||||||
| 11/30/2010 |
25.86 | 0.20 | 4.45 | 4.65 | (0.16 | ) | — | |||||||||||||||||||
| 4/1/2009** - 11/30/2009 |
16.29 | 0.14 | 9.43 | 9.57 | — | — | ||||||||||||||||||||
| 3/31/2009 |
40.10 | 0.33 | (19.44 | ) | (19.11 | ) | — | (4.70 | ) | |||||||||||||||||
| Institutional Class | ||||||||||||||||||||||||||
| 5/31/2014+ |
$ | 42.94 | $ | 0.16 | $ | 0.52 | $ | 0.68 | $ | (0.35 | ) | $ | (3.00 | ) | ||||||||||||
| 11/30/2013 |
32.60 | 0.17 | 10.48 | 10.65 | (0.31 | ) | — | |||||||||||||||||||
| 11/30/2012 |
28.58 | 0.24 | 4.15 | 4.39 | (0.37 | ) | — | |||||||||||||||||||
| 11/30/2011 |
31.45 | 0.37 | (2.74 | ) | (2.37 | ) | (0.50 | ) | — | |||||||||||||||||
| 11/30/2010 |
26.91 | 0.24 | 4.94 | 5.18 | (0.64 | ) | — | |||||||||||||||||||
| 4/1/2009** - 11/30/2009 |
16.93 | 0.17 | 9.81 | 9.98 | — | — | ||||||||||||||||||||
| 3/31/2009 |
41.28 | 0.34 | (19.99 | ) | (19.65 | ) | — | (4.70 | ) | |||||||||||||||||
| + | Unaudited |
| * | Commencement of operations. |
| ** | On November 13, 2009, the Board of Trustees approved a change in the Fund’s fiscal year from March 31 to November 30. |
| (a) | Calculated on average shares outstanding during the period. |
| (b) | Total return is calculated assuming a purchase of a share on the first day of the period and a sale of a share on the last day of each period reported. Dividends and distributions, if any, are assumed, for purposes of this calculation, to be reinvested. Total return does not reflect sales charges and includes the effect of fee waivers and reimbursements. Total return may reflect adjustments to conform to generally accepted accounting principles. Total return for a period of less than one year is not annualized. |
| (c) | Annualized. |
| (d) | Less than $(0.01) per share. |
| (e) | Ratio of expenses to average net assets net of reimbursement/recoupment offset was 1.41% and 1.17% for the period ended November 30, 2009 and the year ended March 31, 2009, respectively. |
| (f) | Ratio of expenses to average net assets net of reimbursement/recoupment offset was 1.26% and 1.01% for the period ended November 30, 2009 and the year ended March 31, 2009, respectively. |
| 212 | Semiannual Report | | May 31, 2014 | | See accompanying Notes to Financial Statements |
Table of Contents
| Total Dividends and Distributions |
Net Asset Value, End of Period |
Total Return (b) | Net Assets, End of Period (000s) |
Ratio of Expenses to Average Net Assets with Fee Waiver/ Reimbursement |
Ratio of Expenses to Average Net Assets without Fee Waiver/ Reimbursement |
Ratio of Net Investment Income (Loss) to Average Net Assets |
Portfolio Turnover Rate |
|||||||||||||||||||||||||
| $ | (3.44 | ) | $ | 39.47 | 1.81 | % | $ | 5,004 | 1.45 | %(c) | 1.80 | %(c) | 0.54 | %(c) | 47 | % | ||||||||||||||||
| — | (d) | 42.30 | 32.64 | 4,569 | 1.45 | 1.83 | 0.23 | 92 | ||||||||||||||||||||||||
| (0.64 | ) | 31.89 | 15.13 | 2,773 | 1.50 | 1.76 | 0.53 | 117 | ||||||||||||||||||||||||
| (0.61 | ) | 28.31 | (8.03 | ) | 4,103 | 1.60 | 1.83 | 0.40 | 66 | |||||||||||||||||||||||
| — | 31.36 | 10.81 | 97 | 1.66 | (c) | 1.70 | (c) | (0.07 | )(c) | 57 | ||||||||||||||||||||||
| $ | (3.13 | ) | $ | 39.12 | 1.43 | % | $ | 1,064 | 2.20 | %(c) | 2.48 | %(c) | (0.03 | )%(c) | 47 | % | ||||||||||||||||
| (0.02 | ) | 41.78 | 31.67 | 702 | 2.20 | 2.43 | (0.46 | ) | 92 | |||||||||||||||||||||||
| (0.23 | ) | 31.75 | 14.26 | 531 | 2.26 | 2.37 | (0.24 | ) | 117 | |||||||||||||||||||||||
| (0.55 | ) | 28.01 | (8.75 | ) | 455 | 2.34 | 2.86 | 0.19 | 66 | |||||||||||||||||||||||
| — | 31.22 | 10.32 | 176 | 2.44 | (c) | 2.48 | (c) | (1.23 | )(c) | 57 | ||||||||||||||||||||||
| $ | (3.62 | ) | $ | 40.25 | 1.83 | % | $ | 1,452 | 1.45 | %(c) | 1.76 | %(c) | 1.09 | %(c) | 47 | % | ||||||||||||||||
| — | (d) | 43.24 | 32.65 | 339 | 1.45 | 1.73 | 0.13 | 92 | ||||||||||||||||||||||||
| — | (d) | 32.60 | 15.07 | 112 | 1.56 | 5.66 | 0.77 | 117 | ||||||||||||||||||||||||
| (0.58 | ) | 28.33 | (8.08 | ) | 1,440 | 1.61 | 2.83 | 0.22 | 66 | |||||||||||||||||||||||
| — | 31.37 | 10.85 | 38 | 1.66 | (c) | 1.83 | (c) | 0.22 | (c) | 57 | ||||||||||||||||||||||
| $ | (3.48 | ) | $ | 39.32 | 1.71 | % | $ | 81 | 1.70 | %(c) | 2.03 | %(c) | 1.02 | %(c) | 47 | % | ||||||||||||||||
| (0.36 | ) | 42.23 | 32.29 | 27 | 1.70 | 1.96 | 0.05 | 92 | ||||||||||||||||||||||||
| (0.20 | ) | 32.25 | 14.86 | 12 | 1.74 | 1.90 | 0.26 | 117 | ||||||||||||||||||||||||
| (0.51 | ) | 28.27 | (8.32 | ) | 10 | 1.82 | 1.84 | 0.51 | 66 | |||||||||||||||||||||||
| — | 31.32 | 10.67 | 11 | 1.91 | (c) | 2.35 | (c) | 0.27 | (c) | 57 | ||||||||||||||||||||||
| $ | (3.40 | ) | $ | 39.21 | 1.90 | % | $ | 30,726 | 1.29 | %(c) | 1.56 | %(c) | 0.65 | %(c) | 47 | % | ||||||||||||||||
| (0.35 | ) | 41.97 | 32.86 | 33,574 | 1.30 | 1.52 | 0.45 | 92 | ||||||||||||||||||||||||
| (0.19 | ) | 31.92 | 15.32 | 28,996 | 1.31 | 1.52 | 0.68 | 117 | ||||||||||||||||||||||||
| (0.12 | ) | 27.86 | (7.86 | ) | 34,772 | 1.32 | 1.47 | 0.95 | 66 | |||||||||||||||||||||||
| (0.16 | ) | 30.35 | 18.12 | 46,636 | 1.37 | 1.77 | 0.74 | 57 | ||||||||||||||||||||||||
| — | 25.86 | 58.75 | 66,137 | 1.41 | (c) | 1.41 | (c)(e) | 0.90 | (c) | 64 | ||||||||||||||||||||||
| (4.70 | ) | 16.29 | (48.16 | ) | 39,680 | 1.44 | 1.44 | (e) | 1.14 | 106 | ||||||||||||||||||||||
| $ | (3.35 | ) | $ | 40.27 | 1.94 | % | $ | 71,172 | 1.21 | %(c) | 1.47 | %(c) | 0.79 | %(c) | 47 | % | ||||||||||||||||
| (0.31 | ) | 42.94 | 32.96 | 71,875 | 1.21 | 1.44 | 0.46 | 92 | ||||||||||||||||||||||||
| (0.37 | ) | 32.60 | 15.50 | 88,301 | 1.20 | 1.38 | 0.80 | 117 | ||||||||||||||||||||||||
| (0.50 | ) | 28.58 | (7.74 | ) | 84,026 | 1.20 | 1.34 | 1.14 | 66 | |||||||||||||||||||||||
| (0.64 | ) | 31.45 | 18.22 | 89,186 | 1.23 | 1.70 | 0.86 | 57 | ||||||||||||||||||||||||
| — | 26.91 | 58.95 | 14,224 | 1.26 | (c) | 1.26 | (c)(f) | 1.09 | (c) | 64 | ||||||||||||||||||||||
| (4.70 | ) | 16.93 | (48.08 | ) | 6,828 | 1.29 | 1.29 | (f) | 1.27 | 106 | ||||||||||||||||||||||
| See accompanying Notes to Financial Statements | | May 31, 2014 | | Semiannual Report | 213 |
Table of Contents
Financial Highlights (cont’d)
For a Share Outstanding for the Period ended:
| Net Asset Value, Beginning of Period |
Net Investment Income (Loss) (a) |
Net Realized and Change in Unrealized Gain (Loss) |
Total from Investment Operations |
Dividends from Net Investment Income |
Distributions from Net Realized Capital Gains |
|||||||||||||||||||||
| AllianzGI Micro Cap: | ||||||||||||||||||||||||||
| Class A | ||||||||||||||||||||||||||
| 5/31/2014+ |
$ | 16.06 | $ | (0.11 | ) | $ | (0.05 | ) | $ | (0.16 | ) | $ | — | $ | (0.82 | ) | ||||||||||
| 11/30/2013 |
11.62 | (0.20 | ) | 5.57 | 5.37 | — | (0.93 | ) | ||||||||||||||||||
| 12/19/2011* - 11/30/2012 |
9.84 | (0.07 | ) | 1.85 | 1.78 | — | — | |||||||||||||||||||
| Class P | ||||||||||||||||||||||||||
| 5/31/2014+ |
$ | 16.08 | $ | (0.09 | ) | $ | (0.06 | ) | $ | (0.15 | ) | $ | — | $ | (0.82 | ) | ||||||||||
| 11/30/2013 |
11.61 | (0.17 | ) | 5.57 | 5.40 | — | (0.93 | ) | ||||||||||||||||||
| 11/30/2012 |
12.20 | (0.10 | ) | 1.47 | 1.37 | — | (1.96 | ) | ||||||||||||||||||
| 12/27/2010* - 11/30/2011 |
14.20 | (0.15 | ) | (1.64 | ) | (1.79 | ) | — | (0.21 | ) | ||||||||||||||||
| Institutional Class | ||||||||||||||||||||||||||
| 5/31/2014+ |
$ | 16.15 | $ | (0.09 | ) | $ | (0.06 | ) | $ | (0.15 | ) | $ | — | $ | (0.82 | ) | ||||||||||
| 11/30/2013 |
11.65 | (0.15 | ) | 5.58 | 5.43 | — | (0.93 | ) | ||||||||||||||||||
| 11/30/2012 |
12.22 | (0.10 | ) | 1.49 | 1.39 | — | (1.96 | ) | ||||||||||||||||||
| 11/30/2011 |
13.80 | (0.17 | ) | (0.16 | ) | (0.33 | ) | — | (1.25 | ) | ||||||||||||||||
| 11/30/2010 |
10.44 | (0.15 | ) | 3.51 | 3.36 | — | — | |||||||||||||||||||
| 4/1/2009** - 11/30/2009 |
7.58 | (0.07 | ) | 2.93 | 2.86 | — | — | |||||||||||||||||||
| 3/31/2009 |
11.60 | (0.07 | ) | (3.95 | ) | (4.02 | ) | — | — | (e) | ||||||||||||||||
| AllianzGI Multi-Asset Real Return: | ||||||||||||||||||||||||||
| Class A | ||||||||||||||||||||||||||
| 5/31/2014+ |
$ | 15.34 | $ | 0.08 | $ | 0.99 | $ | 1.07 | $ | (0.27 | ) | $ | (0.02 | ) | ||||||||||||
| 12/17/2012* - 11/30/2013 |
15.00 | 0.12 | 0.22 | 0.34 | — | — | ||||||||||||||||||||
| Class C | ||||||||||||||||||||||||||
| 5/31/2014+ |
$ | 15.24 | $ | 0.02 | $ | 0.99 | $ | 1.01 | $ | (0.24 | ) | $ | (0.02 | ) | ||||||||||||
| 12/17/2012* - 11/30/2013 |
15.00 | (0.03 | ) | 0.27 | 0.24 | — | — | |||||||||||||||||||
| Class D | ||||||||||||||||||||||||||
| 5/31/2014+ |
$ | 15.34 | $ | 0.07 | $ | 1.01 | $ | 1.08 | $ | (0.25 | ) | $ | (0.02 | ) | ||||||||||||
| 12/17/2012* - 11/30/2013 |
15.00 | 0.14 | 0.20 | 0.34 | — | — | ||||||||||||||||||||
| Class P | ||||||||||||||||||||||||||
| 5/31/2014+ |
$ | 15.36 | $ | 0.09 | $ | 1.00 | $ | 1.09 | $ | (0.27 | ) | $ | (0.02 | ) | ||||||||||||
| 12/17/2012* - 11/30/2013 |
15.00 | 0.16 | 0.20 | 0.36 | — | — | ||||||||||||||||||||
| Institutional Class | ||||||||||||||||||||||||||
| 5/31/2014+ |
$ | 15.37 | $ | 0.09 | $ | 1.01 | $ | 1.10 | $ | (0.29 | ) | $ | (0.02 | ) | ||||||||||||
| 12/17/2012* - 11/30/2013 |
15.00 | 0.18 | 0.19 | 0.37 | — | — | ||||||||||||||||||||
| + | Unaudited |
| * | Commencement of operations. |
| ** | On November 13, 2009, the Board of Trustees approved a change in the Fund’s fiscal year from March 31 to November 30. |
| (a) | Calculated on average shares outstanding during the period. |
| (b) | Total return is calculated assuming a purchase of a share on the first day of the period and a sale of a share on the last day of each period reported. Dividends and distributions, if any, are assumed, for purposes of this calculation, to be reinvested. Total return does not reflect sales charges and includes the effect of fee waivers and reimbursements. Total return may reflect adjustments to conform to generally accepted accounting principles. Total return for a period of less than one year is not annualized. |
| (c) | Annualized. |
| (d) | Ratio of expenses to average net assets net of reimbursement/recoupment offset was 1.63% and 0.91% for the period ended November 30, 2009 and the year ended March 31, 2009, respectively. |
| (e) | Less than $(0.01) per share. |
| (f) | Does not include expenses of the investment companies in which the Fund invests. |
| 214 | Semiannual Report | | May 31, 2014 | | See accompanying Notes to Financial Statements |
Table of Contents
| Total Dividends and Distributions |
Net Asset Value, End of Period |
Total Return (b) | Net Assets, End of Period (000s) |
Ratio of Expenses to Average Net Assets with Fee Waiver/ Reimbursement |
Ratio of Expenses to Average Net Assets without Fee Waiver/ Reimbursement |
Ratio of Net Investment Income (Loss) to Average Net Assets |
Portfolio Turnover Rate |
|||||||||||||||||||||||||
| $ | (0.82 | ) | $ | 15.08 | (0.85 | )% | $ | 4,151 | 1.71 | %(c) | 2.01 | %(c) | (1.42 | )%(c) | 22 | % | ||||||||||||||||
| (0.93 | ) | 16.06 | 50.11 | 1,065 | 1.80 | 2.07 | (1.45 | ) | 63 | |||||||||||||||||||||||
| — | 11.62 | 18.09 | 135 | 1.82 | (c) | 2.18 | (c) | (0.62 | )(c) | 62 | ||||||||||||||||||||||
| $ | (0.82 | ) | $ | 15.11 | (0.78 | )% | $ | 2,133 | 1.57 | %(c) | 1.80 | %(c) | (1.21 | )%(c) | 22 | % | ||||||||||||||||
| (0.93 | ) | 16.08 | 50.42 | 2,192 | 1.63 | 1.90 | (1.25 | ) | 63 | |||||||||||||||||||||||
| (1.96 | ) | 11.61 | 13.90 | 332 | 1.65 | 1.99 | (0.85 | ) | 62 | |||||||||||||||||||||||
| (0.21 | ) | 12.20 | (12.43 | ) | 426 | 1.65 | (c) | 1.85 | (c) | (1.35 | )(c) | 74 | ||||||||||||||||||||
| $ | (0.82 | ) | $ | 15.18 | (0.78 | )% | $ | 35,518 | 1.54 | %(c) | 1.79 | %(c) | (1.19 | )%(c) | 22 | % | ||||||||||||||||
| (0.93 | ) | 16.15 | 50.51 | 41,713 | 1.54 | 2.01 | (1.10 | ) | 63 | |||||||||||||||||||||||
| (1.96 | ) | 11.65 | 14.09 | 27,343 | 1.54 | 1.84 | (0.90 | ) | 62 | |||||||||||||||||||||||
| (1.25 | ) | 12.22 | (2.88 | ) | 46,514 | 1.54 | 1.65 | (1.24 | ) | 74 | ||||||||||||||||||||||
| — | 13.80 | 32.18 | 57,591 | 1.57 | 1.64 | (1.25 | ) | 112 | ||||||||||||||||||||||||
| — | 10.44 | 37.73 | 53,994 | 1.55 | (c) | 1.55 | (c)(d) | (1.14 | )(c) | 86 | ||||||||||||||||||||||
| — | (e) | 7.58 | (34.63 | ) | 40,178 | 1.58 | 1.58 | (d) | (0.64 | ) | 104 | |||||||||||||||||||||
| $ | (0.29 | ) | $ | 16.12 | 7.11 | % | $ | 117 | 0.85 | %(c)(f) | 5.51 | %(c)(f) | 1.06 | %(c)(f) | 10 | % | ||||||||||||||||
| — | 15.34 | 2.27 | 45 | 0.86 | (c)(f) | 8.42 | (c)(f) | 0.83 | (c)(f) | 46 | ||||||||||||||||||||||
| $ | (0.26 | ) | $ | 15.99 | 6.71 | % | $ | 112 | 1.60 | %(c)(f) | 6.20 | %(c)(f) | 0.21 | %(c)(f) | 10 | % | ||||||||||||||||
| — | 15.24 | 1.60 | 81 | 1.60 | (c)(f) | 9.55 | (c)(f) | (0.17 | )(c)(f) | 46 | ||||||||||||||||||||||
| $ | (0.27 | ) | $ | 16.15 | 7.11 | % | $ | 30 | 0.85 | %(c)(f) | 76.06 | %(c)(f) | 0.94 | %(c)(f) | 10 | % | ||||||||||||||||
| — | 15.34 | 2.27 | 10 | 0.86 | (c)(f) | 19.52 | (c)(f) | 0.96 | (c)(f) | 46 | ||||||||||||||||||||||
| $ | (0.29 | ) | $ | 16.16 | 7.20 | % | $ | 11 | 0.70 | %(c)(f) | 5.15 | %(c)(f) | 1.11 | %(c)(f) | 10 | % | ||||||||||||||||
| — | 15.36 | 2.40 | 10 | 0.71 | (c)(f) | 7.75 | (c)(f) | 1.11 | (c)(f) | 46 | ||||||||||||||||||||||
| $ | (0.31 | ) | $ | 16.16 | 7.27 | % | $ | 5,985 | 0.60 | %(c)(f) | 5.15 | %(c)(f) | 1.21 | %(c)(f) | 10 | % | ||||||||||||||||
| — | 15.37 | 2.47 | 5,155 | 0.61 | (c)(f) | 7.74 | (c)(f) | 1.21 | (c)(f) | 46 | ||||||||||||||||||||||
| See accompanying Notes to Financial Statements | | May 31, 2014 | | Semiannual Report | 215 |
Table of Contents
Financial Highlights (cont’d)
For a Share Outstanding for the Period ended:
| Net Asset Value, Beginning of Period |
Net Investment Income (a) |
Net Realized and Change in Unrealized Gain (Loss) |
Total from Investment Operations |
Dividends from Net Investment Income |
Distributions from Net Realized Capital Gains |
|||||||||||||||||||||
| AllianzGI NFJ Emerging Markets Value: | ||||||||||||||||||||||||||
| Class A | ||||||||||||||||||||||||||
| 5/31/2014+ |
$ | 15.42 | $ | 0.19 | $ | 0.41 | $ | 0.60 | $ | (0.22 | ) | $ | — | |||||||||||||
| 12/18/2012* - 11/30/2013 |
15.00 | 0.35 | 0.27 | 0.62 | (0.20 | ) | — | |||||||||||||||||||
| Class C | ||||||||||||||||||||||||||
| 5/31/2014+ |
$ | 15.35 | $ | 0.13 | $ | 0.42 | $ | 0.55 | $ | (0.19 | ) | $ | — | |||||||||||||
| 12/18/2012* - 11/30/2013 |
15.00 | 0.14 | 0.36 | 0.50 | (0.15 | ) | — | |||||||||||||||||||
| Class D | ||||||||||||||||||||||||||
| 5/31/2014+ |
$ | 15.45 | $ | 0.18 | $ | 0.43 | $ | 0.61 | $ | (0.22 | ) | $ | — | |||||||||||||
| 12/18/2012* - 11/30/2013 |
15.00 | 0.25 | 0.36 | 0.61 | (0.16 | ) | — | |||||||||||||||||||
| Class P | ||||||||||||||||||||||||||
| 5/31/2014+ |
$ | 15.45 | $ | 0.18 | $ | 0.44 | $ | 0.62 | $ | (0.23 | ) | $ | — | |||||||||||||
| 12/18/2012* - 11/30/2013 |
15.00 | 0.36 | 0.27 | 0.63 | (0.18 | ) | — | |||||||||||||||||||
| Institutional Class | ||||||||||||||||||||||||||
| 5/31/2014+ |
$ | 15.46 | $ | 0.20 | $ | 0.43 | $ | 0.63 | $ | (0.23 | ) | $ | — | |||||||||||||
| 12/18/2012* - 11/30/2013 |
15.00 | 0.39 | 0.26 | 0.65 | (0.19 | ) | — | |||||||||||||||||||
| AllianzGI NFJ Global Dividend Value: | ||||||||||||||||||||||||||
| Class A | ||||||||||||||||||||||||||
| 5/31/2014+ |
$ | 22.08 | $ | 0.36 | $ | 0.56 | $ | 0.92 | $ | (0.28 | ) | $ | (0.59 | ) | ||||||||||||
| 11/30/2013 |
18.27 | 0.54 | 3.75 | 4.29 | (0.44 | ) | (0.04 | ) | ||||||||||||||||||
| 11/30/2012 |
17.35 | 0.56 | 1.10 | 1.66 | (0.40 | ) | (0.34 | ) | ||||||||||||||||||
| 11/30/2011 |
17.91 | 0.55 | (0.19 | ) | 0.36 | (0.64 | ) | (0.28 | ) | |||||||||||||||||
| 11/30/2010 |
18.16 | 0.43 | 0.38 | 0.81 | (0.71 | ) | (0.35 | ) | ||||||||||||||||||
| 6/26/2009* - 11/30/2009 |
15.00 | 0.15 | 3.04 | 3.19 | (0.03 | ) | — | |||||||||||||||||||
| Class C | ||||||||||||||||||||||||||
| 5/31/2014+ |
$ | 21.82 | $ | 0.27 | $ | 0.56 | $ | 0.83 | $ | (0.20 | ) | $ | (0.59 | ) | ||||||||||||
| 11/30/2013 |
18.05 | 0.37 | 3.72 | 4.09 | (0.28 | ) | (0.04 | ) | ||||||||||||||||||
| 11/30/2012 |
17.19 | 0.42 | 1.07 | 1.49 | (0.29 | ) | (0.34 | ) | ||||||||||||||||||
| 11/30/2011 |
17.76 | 0.43 | (0.20 | ) | 0.23 | (0.52 | ) | (0.28 | ) | |||||||||||||||||
| 11/30/2010 |
18.12 | 0.28 | 0.41 | 0.69 | (0.70 | ) | (0.35 | ) | ||||||||||||||||||
| 6/26/2009* - 11/30/2009 |
15.00 | 0.10 | 3.02 | 3.12 | — | (d) | — | |||||||||||||||||||
| Class D | ||||||||||||||||||||||||||
| 5/31/2014+ |
$ | 22.30 | $ | 0.36 | $ | 0.56 | $ | 0.92 | $ | (0.28 | ) | $ | (0.59 | ) | ||||||||||||
| 11/30/2013 |
18.44 | 0.52 | 3.80 | 4.32 | (0.42 | ) | (0.04 | ) | ||||||||||||||||||
| 11/30/2012 |
17.38 | 0.60 | 1.05 | 1.65 | (0.25 | ) | (0.34 | ) | ||||||||||||||||||
| 11/30/2011 |
17.86 | 0.61 | (0.23 | ) | 0.38 | (0.58 | ) | (0.28 | ) | |||||||||||||||||
| 11/30/2010 |
18.17 | 0.43 | 0.37 | 0.80 | (0.76 | ) | (0.35 | ) | ||||||||||||||||||
| 6/26/2009* - 11/30/2009 |
15.00 | 0.15 | 3.04 | 3.19 | (0.02 | ) | — | |||||||||||||||||||
| + | Unaudited |
| * | Commencement of operations. |
| (a) | Calculated on average shares outstanding during the period. |
| (b) | Total return is calculated assuming a purchase of a share on the first day of the period and a sale of a share on the last day of each period reported. Dividends and distributions, if any, are assumed, for purposes of this calculation, to be reinvested. Total return does not reflect sales charges and includes the effect of fee waivers and reimbursements. Total return may reflect adjustments to conform to generally accepted accounting principles. Total return for a period of less than one year is not annualized. |
| (c) | Annualized. |
| (d) | Less than $(0.01) per share. |
| 216 | Semiannual Report | | May 31, 2014 | | See accompanying Notes to Financial Statements |
Table of Contents
| Total Dividends and Distributions |
Net Asset Value, End of Period |
Total Return (b) | Net Assets, End of Period (000s) |
Ratio of Expenses to Average Net Assets with Fee Waiver/ Reimbursement |
Ratio of Expenses to Average Net Assets without Fee Waiver/ Reimbursement |
Ratio of Net Investment Income to Average Net Assets |
Portfolio Turnover Rate |
|||||||||||||||||||||||||
| $ | (0.22 | ) | $ | 15.80 | 4.02 | % | $ | 29 | 1.55 | %(c) | 4.92 | %(c) | 2.50 | %(c) | 50 | % | ||||||||||||||||
| (0.20 | ) | 15.42 | 4.14 | 19 | 1.55 | (c) | 17.07 | (c) | 2.41 | (c) | 67 | |||||||||||||||||||||
| $ | (0.19 | ) | $ | 15.71 | 3.66 | % | $ | 43 | 2.30 | %(c) | 5.59 | %(c) | 1.76 | %(c) | 50 | % | ||||||||||||||||
| (0.15 | ) | 15.35 | 3.40 | 25 | 2.30 | (c) | 19.41 | (c) | 1.00 | (c) | 67 | |||||||||||||||||||||
| $ | (0.22 | ) | $ | 15.84 | 4.09 | % | $ | 1,497 | 1.55 | %(c) | 5.59 | %(c) | 2.39 | %(c) | 50 | % | ||||||||||||||||
| (0.16 | ) | 15.45 | 4.10 | 1,086 | 1.55 | (c) | 8.48 | (c) | 1.75 | (c) | 67 | |||||||||||||||||||||
| $ | (0.23 | ) | $ | 15.84 | 4.13 | % | $ | 11 | 1.40 | %(c) | 4.66 | %(c) | 2.42 | %(c) | 50 | % | ||||||||||||||||
| (0.18 | ) | 15.45 | 4.25 | 11 | 1.41 | (c) | 7.72 | (c) | 2.49 | (c) | 67 | |||||||||||||||||||||
| $ | (0.23 | ) | $ | 15.86 | 4.22 | % | $ | 8,220 | 1.30 | %(c) | 4.62 | %(c) | 2.70 | %(c) | 50 | % | ||||||||||||||||
| (0.19 | ) | 15.46 | 4.38 | 6,470 | 1.30 | (c) | 7.78 | (c) | 2.70 | (c) | 67 | |||||||||||||||||||||
| $ | (0.87 | ) | $ | 22.13 | 4.48 | % | $ | 11,877 | 1.20 | %(c) | 1.44 | %(c) | 3.41 | %(c) | 20 | % | ||||||||||||||||
| (0.48 | ) | 22.08 | 23.80 | 10,705 | 1.21 | 1.51 | 2.68 | 43 | ||||||||||||||||||||||||
| (0.74 | ) | 18.27 | 9.98 | 7,355 | 1.32 | 1.71 | 3.13 | 41 | ||||||||||||||||||||||||
| (0.92 | ) | 17.35 | 1.85 | 6,821 | 1.50 | 1.92 | 3.01 | 66 | ||||||||||||||||||||||||
| (1.06 | ) | 17.91 | 4.71 | 1,469 | 1.50 | 4.55 | 2.41 | 40 | ||||||||||||||||||||||||
| (0.03 | ) | 18.16 | 21.24 | 282 | 1.50 | (c) | 9.11 | (c) | 2.04 | (c) | 22 | |||||||||||||||||||||
| $ | (0.79 | ) | $ | 21.86 | 4.07 | % | $ | 5,932 | 1.99 | %(c) | 2.21 | %(c) | 2.60 | %(c) | 20 | % | ||||||||||||||||
| (0.32 | ) | 21.82 | 22.88 | 5,720 | 2.00 | 2.27 | 1.83 | 43 | ||||||||||||||||||||||||
| (0.63 | ) | 18.05 | 9.03 | 3,948 | 2.07 | 2.46 | 2.34 | 41 | ||||||||||||||||||||||||
| (0.80 | ) | 17.19 | 1.12 | 3,020 | 2.25 | 2.71 | 2.39 | 66 | ||||||||||||||||||||||||
| (1.05 | ) | 17.76 | 3.99 | 1,210 | 2.25 | 5.11 | 1.57 | 40 | ||||||||||||||||||||||||
| — | (d) | 18.12 | 20.80 | 89 | 2.25 | (c) | 9.86 | (c) | 1.29 | (c) | 22 | |||||||||||||||||||||
| $ | (0.87 | ) | $ | 22.35 | 4.40 | % | $ | 838 | 1.29 | %(c) | 1.41 | %(c) | 3.37 | %(c) | 20 | % | ||||||||||||||||
| (0.46 | ) | 22.30 | 23.72 | 753 | 1.31 | 1.55 | 2.53 | 43 | ||||||||||||||||||||||||
| (0.59 | ) | 18.44 | 9.83 | 480 | 1.38 | 3.04 | 3.31 | 41 | ||||||||||||||||||||||||
| (0.86 | ) | 17.38 | 1.91 | 558 | 1.50 | 3.74 | 3.27 | 66 | ||||||||||||||||||||||||
| (1.11 | ) | 17.86 | 4.68 | 203 | 1.50 | 4.53 | 2.44 | 40 | ||||||||||||||||||||||||
| (0.02 | ) | 18.17 | 21.27 | 35 | 1.50 | (c) | 9.11 | (c) | 2.04 | (c) | 22 | |||||||||||||||||||||
| See accompanying Notes to Financial Statements | | May 31, 2014 | | Semiannual Report | 217 |
Table of Contents
Financial Highlights (cont’d)
For a Share Outstanding for the Period ended:
| Net Asset Value, Beginning of Period |
Net Investment Income (a) |
Net Realized and Change in Unrealized Gain |
Total from Investment Operations |
Dividends from Net Investment Income |
Distributions from Net Realized Capital Gains |
|||||||||||||||||||||
| AllianzGI NFJ Global Dividend Value (cont’d) | ||||||||||||||||||||||||||
| Class P | ||||||||||||||||||||||||||
| 5/31/2014+ |
$ | 22.21 | $ | 0.38 | $ | 0.56 | $ | 0.94 | $ | (0.30 | ) | $ | (0.59 | ) | ||||||||||||
| 11/30/2013 |
18.36 | 0.57 | 3.78 | 4.35 | (0.46 | ) | (0.04 | ) | ||||||||||||||||||
| 11/30/2012 |
17.45 | 0.60 | 1.10 | 1.70 | (0.45 | ) | (0.34 | ) | ||||||||||||||||||
| 11/30/2011 |
17.82 | 0.42 | (0.02 | ) | 0.40 | (0.49 | ) | (0.28 | ) | |||||||||||||||||
| 11/30/2010 |
18.17 | 0.46 | 0.38 | 0.84 | (0.84 | ) | (0.35 | ) | ||||||||||||||||||
| 6/26/2009* - 11/30/2009 |
15.00 | 0.16 | 3.04 | 3.20 | (0.03 | ) | — | |||||||||||||||||||
| Institutional Class | ||||||||||||||||||||||||||
| 5/31/2014+ |
$ | 21.98 | $ | 0.39 | $ | 0.56 | $ | 0.95 | $ | (0.31 | ) | $ | (0.59 | ) | ||||||||||||
| 11/30/2013 |
18.18 | 0.60 | 3.73 | 4.33 | (0.49 | ) | (0.04 | ) | ||||||||||||||||||
| 11/30/2012 |
17.29 | 0.60 | 1.09 | 1.69 | (0.46 | ) | (0.34 | ) | ||||||||||||||||||
| 11/30/2011 |
17.83 | 0.64 | (0.21 | ) | 0.43 | (0.69 | ) | (0.28 | ) | |||||||||||||||||
| 11/30/2010 |
18.17 | 0.41 | 0.46 | 0.87 | (0.86 | ) | (0.35 | ) | ||||||||||||||||||
| 6/26/2009* - 11/30/2009 |
15.00 | 0.17 | 3.03 | 3.20 | (0.03 | ) | — | |||||||||||||||||||
| AllianzGI NFJ International Small-Cap Value: | ||||||||||||||||||||||||||
| Class A | ||||||||||||||||||||||||||
| 5/31/2014+ |
$ | 21.06 | $ | 0.23 | $ | 1.67 | $ | 1.90 | $ | (0.26 | ) | $ | (0.37 | ) | ||||||||||||
| 11/30/2013 |
17.10 | 0.35 | 4.03 | 4.38 | (0.33 | ) | (0.09 | ) | ||||||||||||||||||
| 6/1/2012* - 11/30/2012 |
15.00 | 0.07 | 2.03 | 2.10 | — | — | ||||||||||||||||||||
| Class C | ||||||||||||||||||||||||||
| 5/31/2014+ |
$ | 21.04 | $ | 0.17 | $ | 1.65 | $ | 1.82 | $ | (0.33 | ) | $ | (0.37 | ) | ||||||||||||
| 11/30/2013 |
17.04 | 0.16 | 4.09 | 4.25 | (0.16 | ) | (0.09 | ) | ||||||||||||||||||
| 6/1/2012* - 11/30/2012 |
15.00 | 0.09 | 1.95 | 2.04 | — | — | ||||||||||||||||||||
| Class D | ||||||||||||||||||||||||||
| 5/31/2014+ |
$ | 21.04 | $ | 0.22 | $ | 1.69 | $ | 1.91 | $ | (0.17 | ) | $ | (0.37 | ) | ||||||||||||
| 11/30/2013 |
17.11 | 0.42 | 3.95 | 4.37 | (0.35 | ) | (0.09 | ) | ||||||||||||||||||
| 6/1/2012* - 11/30/2012 |
15.00 | 0.13 | 1.98 | 2.11 | — | — | ||||||||||||||||||||
| Class P | ||||||||||||||||||||||||||
| 5/31/2014+ |
$ | 21.27 | $ | 0.26 | $ | 1.69 | $ | 1.95 | $ | (0.19 | ) | $ | (0.37 | ) | ||||||||||||
| 11/30/2013 |
17.11 | 0.39 | 4.05 | 4.44 | (0.19 | ) | (0.09 | ) | ||||||||||||||||||
| 6/1/2012* - 11/30/2012 |
15.00 | 0.16 | 1.95 | 2.11 | — | — | ||||||||||||||||||||
| Institutional Class | ||||||||||||||||||||||||||
| 5/31/2014+ |
$ | 21.28 | $ | 0.26 | $ | 1.69 | $ | 1.95 | $ | (0.32 | ) | $ | (0.37 | ) | ||||||||||||
| 11/30/2013 |
17.12 | 0.43 | 4.03 | 4.46 | (0.21 | ) | (0.09 | ) | ||||||||||||||||||
| 6/1/2012* - 11/30/2012 |
15.00 | 0.17 | 1.95 | 2.12 | — | — | ||||||||||||||||||||
| + | Unaudited |
| * | Commencement of operations. |
| (a) | Calculated on average shares outstanding during the period. |
| (b) | Total return is calculated assuming a purchase of a share on the first day of the period and a sale of a share on the last day of each period reported. Dividends and distributions, if any, are assumed, for purposes of this calculation, to be reinvested. Total return does not reflect sales charges and includes the effect of fee waivers and reimbursements. Total return may reflect adjustments to conform to generally accepted accounting principles. Total return for a period of less than one year is not annualized. |
| (c) | Annualized. |
| 218 | Semiannual Report | | May 31, 2014 | | See accompanying Notes to Financial Statements |
Table of Contents
| Total Dividends and Distributions |
Net Asset Value, End of Period |
Total Return (b) | Net Assets, End of Period (000s) |
Ratio of Expenses to Average Net Assets with Fee Waiver/ Reimbursement |
Ratio of Expenses to Average Net Assets without Fee Waiver/ Reimbursement |
Ratio of Net Investment Income to Average Net Assets |
Portfolio Turnover Rate |
|||||||||||||||||||||||||
| $ | (0.89 | ) | $ | 22.26 | 4.55 | % | $ | 1,910 | 1.04 | %(c) | 1.26 | %(c) | 3.60 | %(c) | 20 | % | ||||||||||||||||
| (0.50 | ) | 22.21 | 24.06 | 1,685 | 1.05 | 1.32 | 2.77 | 43 | ||||||||||||||||||||||||
| (0.79 | ) | 18.36 | 10.11 | 1,089 | 1.12 | 1.51 | 3.32 | 41 | ||||||||||||||||||||||||
| (0.77 | ) | 17.45 | 2.13 | 718 | 1.30 | 1.99 | 2.41 | 66 | ||||||||||||||||||||||||
| (1.19 | ) | 17.82 | 4.90 | 13 | 1.30 | 4.45 | 2.63 | 40 | ||||||||||||||||||||||||
| (0.03 | ) | 18.17 | 21.31 | 12 | 1.30 | (c) | 8.96 | (c) | 2.24 | (c) | 22 | |||||||||||||||||||||
| $ | (0.90 | ) | $ | 22.03 | 4.62 | % | $ | 54,044 | 0.95 | %(c) | 1.16 | %(c) | 3.65 | %(c) | 20 | % | ||||||||||||||||
| (0.53 | ) | 21.98 | 24.16 | 51,318 | 0.96 | 1.21 | 2.96 | 43 | ||||||||||||||||||||||||
| (0.80 | ) | 18.18 | 10.19 | 39,215 | 1.02 | 1.40 | 3.38 | 41 | ||||||||||||||||||||||||
| (0.97 | ) | 17.29 | 2.21 | 20,556 | 1.20 | 1.68 | 3.51 | 66 | ||||||||||||||||||||||||
| (1.21 | ) | 17.83 | 5.07 | 15,211 | 1.20 | 3.40 | 2.32 | 40 | ||||||||||||||||||||||||
| (0.03 | ) | 18.17 | 21.34 | 2,986 | 1.20 | (c) | 8.86 | (c) | 2.34 | (c) | 22 | |||||||||||||||||||||
| $ | (0.63 | ) | $ | 22.33 | 9.34 | % | $ | 2,759 | 1.45 | %(c) | 2.66 | %(c) | 2.15 | %(c) | 21 | % | ||||||||||||||||
| (0.42 | ) | 21.06 | 26.08 | 2,272 | 1.45 | 4.81 | 1.81 | 50 | ||||||||||||||||||||||||
| — | 17.10 | 14.00 | 1,049 | 1.45 | (c) | 4.22 | (c) | 0.82 | (c) | 19 | ||||||||||||||||||||||
| $ | (0.70 | ) | $ | 22.16 | 8.98 | % | $ | 1,224 | 2.20 | %(c) | 3.43 | %(c) | 1.58 | %(c) | 21 | % | ||||||||||||||||
| (0.25 | ) | 21.04 | 25.20 | 521 | 2.20 | 5.66 | 0.80 | 50 | ||||||||||||||||||||||||
| — | 17.04 | 13.60 | 11 | 2.20 | (c) | 9.92 | (c) | 1.08 | (c) | 19 | ||||||||||||||||||||||
| $ | (0.54 | ) | $ | 22.41 | 9.38 | % | $ | 1,109 | 1.45 | %(c) | 3.60 | %(c) | 2.09 | %(c) | 21 | % | ||||||||||||||||
| (0.44 | ) | 21.04 | 26.03 | 951 | 1.45 | 6.56 | 2.17 | 50 | ||||||||||||||||||||||||
| — | 17.11 | 14.07 | 84 | 1.45 | (c) | 7.85 | (c) | 1.59 | (c) | 19 | ||||||||||||||||||||||
| $ | (0.56 | ) | $ | 22.66 | 9.47 | % | $ | 24 | 1.30 | %(c) | 2.38 | %(c) | 2.38 | %(c) | 21 | % | ||||||||||||||||
| (0.28 | ) | 21.27 | 26.28 | 14 | 1.31 | 4.63 | 2.04 | 50 | ||||||||||||||||||||||||
| — | 17.11 | 14.07 | 12 | 1.30 | (c) | 8.92 | (c) | 1.98 | (c) | 19 | ||||||||||||||||||||||
| $ | (0.69 | ) | $ | 22.54 | 9.50 | % | $ | 16,644 | 1.20 | %(c) | 2.40 | %(c) | 2.39 | %(c) | 21 | % | ||||||||||||||||
| (0.30 | ) | 21.28 | 26.40 | 11,873 | 1.21 | 4.66 | 2.22 | 50 | ||||||||||||||||||||||||
| — | 17.12 | 14.13 | 3,551 | 1.20 | (c) | 8.90 | (c) | 2.08 | (c) | 19 | ||||||||||||||||||||||
| See accompanying Notes to Financial Statements | | May 31, 2014 | | Semiannual Report | 219 |
Table of Contents
Financial Highlights (cont’d)
For a Share Outstanding for the Period ended:
| Net
Asset |
Net Investment Income (Loss) (a) |
Net Realized and Change in Unrealized Gain |
Total from Investment Operations |
Dividends from Net Investment Income |
Distributions from Net Realized Capital Gains |
|||||||||||||||||||||
| AllianzGI NFJ International Value II: | ||||||||||||||||||||||||||
| Class A | ||||||||||||||||||||||||||
| 5/31/2014+ |
$ | 19.17 | $ | 0.36 | $ | 0.71 | $ | 1.07 | $ | (0.38 | ) | $ | (0.64 | ) | ||||||||||||
| 11/30/2013 |
16.36 | 0.34 | 2.71 | 3.05 | (0.22 | ) | (0.02 | ) | ||||||||||||||||||
| 12/1/2011* - 11/30/2012 |
15.00 | 0.29 | 1.33 | 1.62 | (0.26 | ) | — | |||||||||||||||||||
| Class C | ||||||||||||||||||||||||||
| 5/31/2014+ |
$ | 19.04 | $ | 0.29 | $ | 0.69 | $ | 0.98 | $ | (0.31 | ) | $ | (0.64 | ) | ||||||||||||
| 11/30/2013 |
16.32 | 0.18 | 2.73 | 2.91 | (0.17 | ) | (0.02 | ) | ||||||||||||||||||
| 12/1/2011* - 11/30/2012 |
15.00 | 0.22 | 1.28 | 1.50 | (0.18 | ) | — | |||||||||||||||||||
| Class D | ||||||||||||||||||||||||||
| 5/31/2014+ |
$ | 19.20 | $ | 0.36 | $ | 0.70 | $ | 1.06 | $ | (0.38 | ) | $ | (0.64 | ) | ||||||||||||
| 11/30/2013 |
16.36 | 0.33 | 2.73 | 3.06 | (0.20 | ) | (0.02 | ) | ||||||||||||||||||
| 12/1/2011* - 11/30/2012 |
15.00 | 0.34 | 1.28 | 1.62 | (0.26 | ) | — | |||||||||||||||||||
| Class P | ||||||||||||||||||||||||||
| 5/31/2014+ |
$ | 19.24 | $ | 0.37 | $ | 0.71 | $ | 1.08 | $ | (0.39 | ) | $ | (0.64 | ) | ||||||||||||
| 11/30/2013 |
16.38 | 0.36 | 2.73 | 3.09 | (0.21 | ) | (0.02 | ) | ||||||||||||||||||
| 12/1/2011* - 11/30/2012 |
15.00 | 0.38 | 1.28 | 1.66 | (0.28 | ) | — | |||||||||||||||||||
| Institutional Class | ||||||||||||||||||||||||||
| 5/31/2014+ |
$ | 19.26 | $ | 0.52 | $ | 0.57 | $ | 1.09 | $ | (0.42 | ) | $ | (0.64 | ) | ||||||||||||
| 11/30/2013 |
16.38 | 0.36 | 2.76 | 3.12 | (0.22 | ) | (0.02 | ) | ||||||||||||||||||
| 12/1/2011* - 11/30/2012 |
15.00 | 0.39 | 1.29 | 1.68 | (0.30 | ) | — | |||||||||||||||||||
| AllianzGI Short Duration High Income: | ||||||||||||||||||||||||||
| Class A | ||||||||||||||||||||||||||
| 5/31/2014+ |
$ | 15.92 | $ | 0.31 | $ | 0.07 | $ | 0.38 | $ | (0.38 | ) | $ | — | |||||||||||||
| 11/30/2013 |
15.97 | 0.63 | 0.09 | 0.72 | (0.76 | ) | (0.01 | ) | ||||||||||||||||||
| 11/30/2012 |
15.32 | 0.64 | 0.68 | 1.32 | (0.67 | ) | — | |||||||||||||||||||
| 10/3/2011* - 11/30/2011 |
15.00 | 0.12 | 0.25 | 0.37 | (0.05 | ) | — | |||||||||||||||||||
| Class C | ||||||||||||||||||||||||||
| 5/31/2014+ |
$ | 15.89 | $ | 0.29 | $ | 0.07 | $ | 0.36 | $ | (0.36 | ) | $ | — | |||||||||||||
| 11/30/2013 |
15.94 | 0.59 | 0.09 | 0.68 | (0.72 | ) | (0.01 | ) | ||||||||||||||||||
| 11/30/2012 |
15.31 | 0.58 | 0.64 | 1.22 | (0.59 | ) | — | |||||||||||||||||||
| 10/3/2011* - 11/30/2011 |
15.00 | 0.10 | 0.25 | 0.35 | (0.04 | ) | — | |||||||||||||||||||
| Class D | ||||||||||||||||||||||||||
| 5/31/2014+ |
$ | 15.92 | $ | 0.31 | $ | 0.07 | $ | 0.38 | $ | (0.38 | ) | $ | — | |||||||||||||
| 11/30/2013 |
15.97 | 0.63 | 0.09 | 0.72 | (0.76 | ) | (0.01 | ) | ||||||||||||||||||
| 11/30/2012 |
15.32 | 0.65 | 0.67 | 1.32 | (0.67 | ) | — | |||||||||||||||||||
| 10/3/2011* - 11/30/2011 |
15.00 | 0.12 | 0.25 | 0.37 | (0.05 | ) | — | |||||||||||||||||||
| + | Unaudited |
| * | Commencement of operations. |
| (a) | Calculated on average shares outstanding during the period. |
| (b) | Total return is calculated assuming a purchase of a share on the first day of the period and a sale of a share on the last day of each period reported. Dividends and distributions, if any, are assumed, for purposes of this calculation, to be reinvested. Total return does not reflect sales charges and includes the effect of fee waivers and reimbursements. Total return may reflect adjustments to conform to generally accepted accounting principles. Total return for a period of less than one year is not annualized. |
| (c) | Annualized. |
| 220 | Semiannual Report | | May 31, 2014 | | See accompanying Notes to Financial Statements |
Table of Contents
| Total Dividends and Distributions |
Net Asset Value, End of Period |
Total Return (b) | Net Assets, End of Period (000s) |
Ratio of Expenses to Average Net Assets with Fee Waiver/ Reimbursement |
Ratio of Expenses to Average Net Assets without Fee Waiver/ Reimbursement |
Ratio of Net Investment Income (Loss) to Average Net Assets |
Portfolio Turnover Rate |
|||||||||||||||||||||||||
| $ | (1.02 | ) | $ | 19.22 | 6.03 | % | $ | 107 | 1.20 | %(c) | 3.05 | %(c) | 3.97 | %(c) | 12 | % | ||||||||||||||||
| (0.24 | ) | 19.17 | 18.89 | 75 | 1.23 | 7.16 | 1.93 | 20 | ||||||||||||||||||||||||
| (0.26 | ) | 16.36 | 10.99 | 49 | 1.30 | (c) | 10.98 | (c) | 1.89 | (c) | 22 | |||||||||||||||||||||
| $ | (0.95 | ) | $ | 19.07 | 5.60 | % | $ | 48 | 1.95 | %(c) | 3.85 | %(c) | 3.14 | %(c) | 12 | % | ||||||||||||||||
| (0.19 | ) | 19.04 | 18.02 | 47 | 1.97 | 8.26 | 1.02 | 20 | ||||||||||||||||||||||||
| (0.18 | ) | 16.32 | 10.17 | 11 | 2.05 | (c) | 10.82 | (c) | 1.45 | (c) | 22 | |||||||||||||||||||||
| $ | (1.02 | ) | $ | 19.24 | 6.00 | % | $ | 14 | 1.20 | %(c) | 3.02 | %(c) | 3.92 | %(c) | 12 | % | ||||||||||||||||
| (0.22 | ) | 19.20 | 18.93 | 13 | 1.23 | 7.04 | 1.87 | 20 | ||||||||||||||||||||||||
| (0.26 | ) | 16.36 | 10.97 | 11 | 1.30 | (c) | 10.07 | (c) | 2.20 | (c) | 22 | |||||||||||||||||||||
| $ | (1.03 | ) | $ | 19.29 | 6.11 | % | $ | 24 | 1.03 | %(c) | 2.90 | %(c) | 4.09 | %(c) | 12 | % | ||||||||||||||||
| (0.23 | ) | 19.24 | 19.10 | 13 | 1.05 | 6.87 | 2.05 | 20 | ||||||||||||||||||||||||
| (0.28 | ) | 16.38 | 11.28 | 11 | 1.05 | (c) | 9.92 | (c) | 2.45 | (c) | 22 | |||||||||||||||||||||
| $ | (1.06 | ) | $ | 19.29 | 6.14 | % | $ | 31,064 | 0.95 | %(c) | 1.97 | %(c) | 5.69 | %(c) | 12 | % | ||||||||||||||||
| (0.24 | ) | 19.26 | 19.25 | 4,170 | 0.95 | 6.77 | 2.06 | 20 | ||||||||||||||||||||||||
| (0.30 | ) | 16.38 | 11.36 | 4,396 | 0.95 | (c) | 9.93 | (c) | 2.50 | (c) | 22 | |||||||||||||||||||||
| $ | (0.38 | ) | $ | 15.92 | 2.40 | % | $ | 207,335 | 0.85 | %(c) | 0.85 | %(c) | 3.93 | %(c) | 54 | % | ||||||||||||||||
| (0.77 | ) | 15.92 | 4.60 | 168,536 | 0.85 | 0.90 | 3.98 | 63 | ||||||||||||||||||||||||
| (0.67 | ) | 15.97 | 8.78 | 80,995 | 0.89 | 1.09 | 4.09 | 51 | ||||||||||||||||||||||||
| (0.05 | ) | 15.32 | 2.50 | 532 | 0.95 | (c) | 2.99 | (c) | 4.97 | (c) | 10 | |||||||||||||||||||||
| $ | (0.36 | ) | $ | 15.89 | 2.29 | % | $ | 84,329 | 1.10 | %(c) | 1.11 | %(c) | 3.69 | %(c) | 54 | % | ||||||||||||||||
| (0.73 | ) | 15.89 | 4.36 | 63,680 | 1.10 | 1.16 | 3.74 | 63 | ||||||||||||||||||||||||
| (0.59 | ) | 15.94 | 8.18 | 28,567 | 1.29 | 1.50 | 3.73 | 51 | ||||||||||||||||||||||||
| (0.04 | ) | 15.31 | 2.36 | 1,245 | 1.70 | (c) | 3.72 | (c) | 4.26 | (c) | 10 | |||||||||||||||||||||
| $ | (0.38 | ) | $ | 15.92 | 2.41 | % | $ | 37,432 | 0.85 | %(c) | 0.94 | %(c) | 3.96 | %(c) | 54 | % | ||||||||||||||||
| (0.77 | ) | 15.92 | 4.61 | 18,902 | 0.85 | 1.08 | 3.99 | 63 | ||||||||||||||||||||||||
| (0.67 | ) | 15.97 | 8.78 | 10,018 | 0.90 | 1.18 | 4.16 | 51 | ||||||||||||||||||||||||
| (0.05 | ) | 15.32 | 2.50 | 65 | 0.95 | (c) | 2.88 | (c) | 4.95 | (c) | 10 | |||||||||||||||||||||
| See accompanying Notes to Financial Statements | | May 31, 2014 | | Semiannual Report | 221 |
Table of Contents
Financial Highlights (cont’d)
For a Share Outstanding for the Period ended:
| Net
Asset |
Net Investment Income (Loss) (a) |
Net Realized and Change in Unrealized Gain |
Total from Investment Operations |
Dividends from Net Investment Income |
Distributions from Net Realized Capital Gains |
|||||||||||||||||||||
| AllianzGI Short Duration High Income (cont’d) | ||||||||||||||||||||||||||
| Class P | ||||||||||||||||||||||||||
| 5/31/2014+ |
$ | 15.92 | $ | 0.32 | $ | 0.07 | $ | 0.39 | $ | (0.39 | ) | $ | — | |||||||||||||
| 11/30/2013 |
15.96 | 0.66 | 0.10 | 0.76 | (0.79 | ) | (0.01 | ) | ||||||||||||||||||
| 11/30/2012 |
15.32 | 0.66 | 0.68 | 1.34 | (0.70 | ) | — | |||||||||||||||||||
| 10/3/2011* - 11/30/2011 |
15.00 | 0.10 | 0.28 | 0.38 | (0.06 | ) | — | |||||||||||||||||||
| Institutional Class | ||||||||||||||||||||||||||
| 5/31/2014+ |
$ | 15.94 | $ | 0.33 | $ | 0.07 | $ | 0.40 | $ | (0.40 | ) | $ | — | |||||||||||||
| 11/30/2013 |
15.99 | 0.67 | 0.09 | 0.76 | (0.80 | ) | (0.01 | ) | ||||||||||||||||||
| 11/30/2012 |
15.32 | 0.70 | 0.67 | 1.37 | (0.70 | ) | — | |||||||||||||||||||
| 10/3/2011* - 11/30/2011 |
15.00 | 0.11 | 0.27 | 0.38 | (0.06 | ) | — | |||||||||||||||||||
| AllianzGI Structured Return: | ||||||||||||||||||||||||||
| Class A | ||||||||||||||||||||||||||
| 5/31/2014+ |
$ | 15.87 | $ | (0.14 | ) | $ | 0.36 | $ | 0.22 | $ | — | $ | (0.68 | ) | ||||||||||||
| 12/3/2012* - 11/30/2013 |
15.00 | (0.28 | ) | 1.15 | 0.87 | — | — | |||||||||||||||||||
| Class C | ||||||||||||||||||||||||||
| 5/31/2014+ |
$ | 15.73 | $ | (0.19 | ) | $ | 0.36 | $ | 0.17 | $ | — | $ | (0.68 | ) | ||||||||||||
| 12/3/2012* - 11/30/2013 |
15.00 | (0.39 | ) | 1.12 | 0.73 | — | — | |||||||||||||||||||
| Class D | ||||||||||||||||||||||||||
| 5/31/2014+ |
$ | 15.89 | $ | (0.14 | ) | $ | 0.36 | $ | 0.22 | $ | — | $ | (0.68 | ) | ||||||||||||
| 12/3/2012* - 11/30/2013 |
15.00 | (0.28 | ) | 1.17 | 0.89 | — | — | |||||||||||||||||||
| Class P | ||||||||||||||||||||||||||
| 5/31/2014+ |
$ | 15.89 | $ | (0.13 | ) | $ | 0.36 | $ | 0.23 | $ | — | $ | (0.68 | ) | ||||||||||||
| 12/3/2012* - 11/30/2013 |
15.00 | (0.26 | ) | 1.15 | 0.89 | — | — | |||||||||||||||||||
| Institutional Class | ||||||||||||||||||||||||||
| 5/31/2014+ |
$ | 15.90 | $ | (0.12 | ) | $ | 0.37 | $ | 0.25 | $ | — | $ | (0.68 | ) | ||||||||||||
| 12/3/2012* - 11/30/2013 |
15.00 | (0.24 | ) | 1.14 | 0.90 | — | — | |||||||||||||||||||
| + | Unaudited |
| * | Commencement of operations. |
| ** | On November 13, 2009, the Board of Trustees approved a change in the Fund’s fiscal year from March 31 to November 30. |
| (a) | Calculated on average shares outstanding during the period. |
| (b) | Total return is calculated assuming a purchase of a share on the first day of the period and a sale of a share on the last day of each period reported. Dividends and distributions, if any, are assumed, for purposes of this calculation, to be reinvested. Total return does not reflect sales charges and includes the effect of fee waivers and reimbursements. Total return may reflect adjustments to conform to generally accepted accounting principles. Total return for a period of less than one year is not annualized. |
| (c) | Annualized. |
| 222 | Semiannual Report | | May 31, 2014 | | See accompanying Notes to Financial Statements |
Table of Contents
| Total Dividends and Distributions |
Net Asset Value, End of Period |
Total Return (b) | Net Assets, End of Period (000s) |
Ratio of Expenses to Average Net Assets with Fee Waiver/ Reimbursement |
Ratio of Expenses to Average Net Assets without Fee Waiver/ Reimbursement |
Ratio of Net Investment Income (Loss) to Average Net Assets |
Portfolio Turnover Rate |
|||||||||||||||||||||||||
| $ | (0.39 | ) | $ | 15.92 | 2.49 | % | $ | 166,996 | 0.70 | %(c) | 0.70 | %(c) | 4.09 | %(c) | 54 | % | ||||||||||||||||
| (0.80 | ) | 15.92 | 4.83 | 121,747 | 0.70 | 0.71 | 4.14 | 63 | ||||||||||||||||||||||||
| (0.70 | ) | 15.96 | 8.91 | 52,932 | 0.70 | 0.92 | 4.24 | 51 | ||||||||||||||||||||||||
| (0.06 | ) | 15.32 | 2.50 | 10 | 0.70 | (c) | 2.84 | (c) | 4.22 | (c) | 10 | |||||||||||||||||||||
| $ | (0.40 | ) | $ | 15.94 | 2.53 | % | $ | 228,369 | 0.60 | %(c) | 0.60 | %(c) | 4.19 | %(c) | 54 | % | ||||||||||||||||
| (0.81 | ) | 15.94 | 4.87 | 179,676 | 0.61 | 0.61 | 4.23 | 63 | ||||||||||||||||||||||||
| (0.70 | ) | 15.99 | 9.13 | 38,247 | 0.60 | 0.89 | 4.48 | 51 | ||||||||||||||||||||||||
| (0.06 | ) | 15.32 | 2.52 | 8,055 | 0.60 | (c) | 2.72 | (c) | 4.58 | (c) | 10 | |||||||||||||||||||||
| $ | (0.68 | ) | $ | 15.41 | 1.41 | % | $ | 2,261 | 1.90 | %(c) | 4.16 | %(c) | (1.86 | )%(c) | N/A | |||||||||||||||||
| — | 15.87 | 5.80 | 517 | 1.90 | (c) | 7.34 | (c) | (1.86 | )(c) | N/A | ||||||||||||||||||||||
| $ | (0.68 | ) | $ | 15.22 | 1.03 | % | $ | 117 | 2.65 | %(c) | 4.76 | %(c) | (2.60 | )%(c) | N/A | |||||||||||||||||
| — | 15.73 | 4.87 | 74 | 2.65 | (c) | 6.91 | (c) | (2.60 | )(c) | N/A | ||||||||||||||||||||||
| $ | (0.68 | ) | $ | 15.43 | 1.41 | % | $ | 1,160 | 1.90 | %(c) | 4.64 | %(c) | (1.85 | )%(c) | N/A | |||||||||||||||||
| — | 15.89 | 5.93 | 1,416 | 1.90 | (c) | 6.29 | (c) | (1.85 | )(c) | N/A | ||||||||||||||||||||||
| $ | (0.68 | ) | $ | 15.44 | 1.47 | % | $ | 62 | 1.75 | %(c) | 3.69 | %(c) | (1.70 | )%(c) | N/A | |||||||||||||||||
| — | 15.89 | 5.93 | 61 | 1.75 | (c) | 5.97 | (c) | (1.69 | )(c) | N/A | ||||||||||||||||||||||
| $ | (0.68 | ) | $ | 15.47 | 1.60 | % | $ | 13,207 | 1.65 | %(c) | 3.81 | %(c) | (1.60 | )%(c) | N/A | |||||||||||||||||
| — | 15.90 | 6.00 | 7,978 | 1.65 | (c) | 5.64 | (c) | (1.60 | )(c) | N/A | ||||||||||||||||||||||
| See accompanying Notes to Financial Statements | | May 31, 2014 | | Semiannual Report | 223 |
Table of Contents
Financial Highlights (cont’d)
For a Share Outstanding for the Period ended:
| Net
Asset |
Net Investment Income (Loss) (a) |
Net Realized and Change in Unrealized Gain (Loss) |
Total from Investment Operations |
Dividends from Net Investment Income |
Distributions from Net Realized Capital Gains |
|||||||||||||||||||||
| AllianzGI Ultra Micro Cap: | ||||||||||||||||||||||||||
| Class A | ||||||||||||||||||||||||||
| 5/31/2014+ |
$ | 24.34 | $ | (0.21) | $ | (0.24) | $ | (0.45) | $ | — | $ | (0.05) | ||||||||||||||
| 11/30/2013 |
15.53 | (0.29 | ) | 9.11 | 8.82 | — | (0.01 | ) | ||||||||||||||||||
| 12/19/2011* - 11/30/2012 |
12.82 | (0.14 | ) | 2.85 | 2.71 | — | — | |||||||||||||||||||
| Class P | ||||||||||||||||||||||||||
| 5/31/2014+ |
$ | 24.40 | $ | (0.20 | ) | $ | (0.24 | ) | $ | (0.44 | ) | $ | — | $ | (0.05 | ) | ||||||||||
| 11/30/2013 |
15.54 | (0.24 | ) | 9.11 | 8.87 | — | (0.01 | ) | ||||||||||||||||||
| 11/30/2012 |
13.26 | (0.20 | ) | 2.71 | 2.51 | — | (0.23 | ) | ||||||||||||||||||
| 12/27/2010* - 11/30/2011 |
13.80 | (0.29 | ) | (0.22 | ) | (0.51 | ) | — | (0.03 | ) | ||||||||||||||||
| Institutional Class | ||||||||||||||||||||||||||
| 5/31/2014+ |
$ | 24.49 | $ | (0.20 | ) | $ | (0.25 | ) | $ | (0.45 | ) | $ | — | $ | (0.05 | ) | ||||||||||
| 11/30/2013 |
15.59 | (0.26 | ) | 9.17 | 8.91 | — | (0.01 | ) | ||||||||||||||||||
| 11/30/2012 |
13.29 | (0.19 | ) | 2.72 | 2.53 | — | (0.23 | ) | ||||||||||||||||||
| 11/30/2011 |
13.25 | (0.29 | ) | 1.08 | 0.79 | — | (0.75 | ) | ||||||||||||||||||
| 11/30/2010 |
8.93 | (0.22 | ) | 4.54 | 4.32 | — | — | |||||||||||||||||||
| 4/1/2009** - 11/30/2009 |
5.78 | (0.10 | ) | 3.25 | 3.15 | — | — | |||||||||||||||||||
| 3/31/2009 |
9.28 | (0.16 | ) | (3.34 | ) | (3.50 | ) | — | — | |||||||||||||||||
| AllianzGI U.S. Equity Hedged: | ||||||||||||||||||||||||||
| Class A | ||||||||||||||||||||||||||
| 5/31/2014+ |
$ | 17.26 | $ | 0.06 | $ | 0.68 | $ | 0.74 | $ | (0.15 | ) | $ | (0.23 | ) | ||||||||||||
| 12/3/2012* - 11/30/2013 |
15.00 | 0.12 | 2.14 | 2.26 | — | — | ||||||||||||||||||||
| Class C | ||||||||||||||||||||||||||
| 5/31/2014+ |
$ | 17.14 | $ | (0.01 | ) | $ | 0.68 | $ | 0.67 | $ | (0.18 | ) | $ | (0.23 | ) | |||||||||||
| 12/3/2012* - 11/30/2013 |
15.00 | — | (e) | 2.14 | 2.14 | — | — | |||||||||||||||||||
| Class D | ||||||||||||||||||||||||||
| 5/31/2014+ |
$ | 17.26 | $ | 0.06 | $ | 0.70 | $ | 0.76 | $ | (0.08 | ) | $ | (0.23 | ) | ||||||||||||
| 12/3/2012* - 11/30/2013 |
15.00 | 0.12 | 2.14 | 2.26 | — | — | ||||||||||||||||||||
| Class P | ||||||||||||||||||||||||||
| 5/31/2014+ |
$ | 17.29 | $ | 0.07 | $ | 0.69 | $ | 0.76 | $ | (0.07 | ) | $ | (0.23 | ) | ||||||||||||
| 12/3/2012* - 11/30/2013 |
15.00 | 0.15 | 2.14 | 2.29 | — | — | ||||||||||||||||||||
| Institutional Class | ||||||||||||||||||||||||||
| 5/31/2014+ |
$ | 17.31 | $ | 0.08 | $ | 0.69 | $ | 0.77 | $ | (0.11 | ) | $ | (0.23 | ) | ||||||||||||
| 12/3/2012* - 11/30/2013 |
15.00 | 0.17 | 2.14 | 2.31 | — | — | ||||||||||||||||||||
| + | Unaudited |
| * | Commencement of operations. |
| ** | On November 13, 2009, the Board of Trustees approved a change in the Fund’s fiscal year from March 31 to November 30. |
| (a) | Calculated on average shares outstanding during the period. |
| (b) | Total return is calculated assuming a purchase of a share on the first day of the period and a sale of a share on the last day of each period reported. Dividends and distributions, if any, are assumed, for purposes of this calculation, to be reinvested. Total return does not reflect sales charges and includes the effect of fee waivers and reimbursements. Total return may reflect adjustments to conform to generally accepted accounting principles. Total return for a period of less than one year is not annualized. |
| (c) | Annualized. |
| (d) | Ratio of expenses to average net assets net of reimbursement/recoupment offset was 2.22% and 2.31% for the period ended November 30, 2009 and the year ended March 31, 2009, respectively. |
| (e) | Less than $(0.01) per share. |
| (f) | Payments from Affiliates increased the net asset value and total return by less than $0.01 and 0.01%, respectively. |
| 224 | Semiannual Report | | May 31, 2014 | | See accompanying Notes to Financial Statements |
Table of Contents
| Total Dividends and Distributions |
Net Asset Value, End of Period |
Total Return(b) | Net Assets, End of Period (000s) |
Ratio of Expenses to Average Net Assets with Fee Waiver/ Reimbursement |
Ratio of Expenses to Average Net Assets without Fee Waiver/ Reimbursement |
Ratio of Net Investment Income (Loss) to Average Net Assets |
Portfolio Turnover Rate |
|||||||||||||||||||||||||
| $ | (0.05 | ) | $ | 23.84 | (1.84 | )% | $ | 74,572 | 2.12 | %(c) | 2.12 | %(c) | (1.72 | )%(c) | 34 | % | ||||||||||||||||
| (0.01 | ) | 24.34 | 56.82 | 61,525 | 2.20 | 2.30 | (1.41 | ) | 59 | |||||||||||||||||||||||
| — | 15.53 | 21.14 | 6,862 | 2.36 | (c) | 3.36 | (c) | (0.96 | )(c) | 114 | ||||||||||||||||||||||
| $ | (0.05 | ) | $ | 23.91 | (1.80 | )% | $ | 1,437 | 2.00 | %(c) | 2.00 | %(c) | (1.60 | )%(c) | 34 | % | ||||||||||||||||
| (0.01 | ) | 24.40 | 57.10 | 858 | 2.01 | 2.07 | (1.19 | ) | 59 | |||||||||||||||||||||||
| (0.23 | ) | 15.54 | 19.26 | 252 | 2.18 | 3.08 | (1.38 | ) | 114 | |||||||||||||||||||||||
| (0.03 | ) | 13.26 | (3.64 | ) | 230 | 2.41 | (c) | 3.48 | (c) | (2.23 | )(c) | 101 | ||||||||||||||||||||
| $ | (0.05 | ) | $ | 23.99 | (1.83 | )% | $ | 57,239 | 2.00 | %(c) | 2.00 | %(c) | (1.61 | )%(c) | 34 | % | ||||||||||||||||
| (0.01 | ) | 24.49 | 57.18 | 62,641 | 2.00 | 2.00 | (1.24 | ) | 59 | |||||||||||||||||||||||
| (0.23 | ) | 15.59 | 19.37 | 9,296 | 2.08 | 3.15 | (1.32 | ) | 114 | |||||||||||||||||||||||
| (0.75 | ) | 13.29 | 6.04 | 9,757 | 2.24 | 3.53 | (2.06 | ) | 101 | |||||||||||||||||||||||
| — | 13.25 | 48.38 | 4,629 | 2.29 | 5.40 | (1.99 | ) | 123 | ||||||||||||||||||||||||
| — | 8.93 | 54.50 | 1,781 | 2.31 | (c) | 2.31 | (c)(d) | (1.81 | )(c) | 87 | ||||||||||||||||||||||
| — | 5.78 | (37.72 | ) | 1,084 | 2.40 | 2.40 | (d) | (2.05 | ) | 109 | ||||||||||||||||||||||
| $ | (0.38 | ) | $ | 17.62 | (f) | 4.41 | %(f) | $ | 1,542 | 1.25 | %(c) | 4.61 | %(c) | 0.68 | %(c) | 3 | % | |||||||||||||||
| — | 17.26 | 15.07 | 1,416 | 1.25 | (c) | 9.81 | (c) | 0.74 | (c) | 6 | ||||||||||||||||||||||
| $ | (0.41 | ) | $ | 17.40 | (f) | 4.07 | %(f) | $ | 175 | 2.00 | %(c) | 5.36 | %(c) | (0.06 | )%(c) | 3 | % | |||||||||||||||
| — | 17.14 | 14.27 | 122 | 2.00 | (c) | 11.10 | (c) | (0.01 | )(c) | 6 | ||||||||||||||||||||||
| $ | (0.31 | ) | $ | 17.71 | (f) | 4.40 | %(f) | $ | 317 | 1.25 | %(c) | 8.05 | %(c) | 0.68 | %(c) | 3 | % | |||||||||||||||
| — | 17.26 | 15.07 | 265 | 1.25 | (c) | 9.77 | (c) | 0.76 | (c) | 6 | ||||||||||||||||||||||
| $ | (0.30 | ) | $ | 17.75 | (f) | 4.47 | %(f) | $ | 12 | 1.10 | %(c) | 4.31 | %(c) | 0.83 | %(c) | 3 | % | |||||||||||||||
| — | 17.29 | 15.27 | 12 | 1.11 | (c) | 8.71 | (c) | 0.96 | (c) | 6 | ||||||||||||||||||||||
| $ | (0.34 | ) | $ | 17.74 | (f) | 4.56 | %(f) | $ | 5,716 | 1.00 | %(c) | 4.32 | %(c) | 0.93 | %(c) | 3 | % | |||||||||||||||
| — | 17.31 | 15.40 | 5,395 | 1.00 | (c) | 8.82 | (c) | 1.05 | (c) | 6 | ||||||||||||||||||||||
| See accompanying Notes to Financial Statements | | May 31, 2014 | | Semiannual Report | 225 |
Table of Contents
Financial Highlights (cont’d)
For a Share Outstanding for the Period ended:
| Net Asset Value, Beginning of Period |
Net Investment Loss (a) |
Net Realized and Change in Unrealized Gain (Loss) |
Total from Investment Operations |
Distributions from Net Realized Capital Gains |
||||||||||||||||||
| AllianzGI U.S. Small-Cap Growth: | ||||||||||||||||||||||
| Class A | ||||||||||||||||||||||
| 5/31/2014+ |
$ | 19.09 | $ | (0.10 | ) | $ | (0.08 | ) | $ | (0.18 | ) | $ | (1.23 | ) | ||||||||
| 11/30/2013 |
13.25 | (0.15 | ) | 6.27 | 6.12 | (0.28 | ) | |||||||||||||||
| 11/30/2012 |
13.34 | (0.08 | ) | 0.98 | 0.90 | (0.99 | ) | |||||||||||||||
| 12/20/2010* - 11/30/2011 |
13.77 | (0.11 | ) | (0.32 | ) | (0.43 | ) | — | ||||||||||||||
| Class C | ||||||||||||||||||||||
| 5/31/2014+ |
$ | 18.68 | $ | (0.16 | ) | $ | (0.08 | ) | $ | (0.24 | ) | $ | (1.23 | ) | ||||||||
| 11/30/2013 |
13.07 | (0.25 | ) | 6.14 | 5.89 | (0.28 | ) | |||||||||||||||
| 11/30/2012 |
13.25 | (0.18 | ) | 0.99 | 0.81 | (0.99 | ) | |||||||||||||||
| 12/20/2010* - 11/30/2011 |
13.77 | (0.22 | ) | (0.30 | ) | (0.52 | ) | — | ||||||||||||||
| Class D | ||||||||||||||||||||||
| 5/31/2014+ |
$ | 19.11 | $ | (0.09 | ) | $ | (0.09 | ) | $ | (0.18 | ) | $ | (1.23 | ) | ||||||||
| 11/30/2013 |
13.25 | (0.11 | ) | 6.25 | 6.14 | (0.28 | ) | |||||||||||||||
| 11/30/2012 |
13.34 | (0.09 | ) | 0.99 | 0.90 | (0.99 | ) | |||||||||||||||
| 12/20/2010* - 11/30/2011 |
13.77 | (0.11 | ) | (0.32 | ) | (0.43 | ) | — | ||||||||||||||
| Class R | ||||||||||||||||||||||
| 5/31/2014+ |
$ | 18.98 | $ | (0.12 | ) | $ | (0.08 | ) | $ | (0.20 | ) | $ | (1.23 | ) | ||||||||
| 11/30/2013 |
13.19 | (0.17 | ) | 6.24 | 6.07 | (0.28 | ) | |||||||||||||||
| 11/30/2012 |
13.31 | (0.11 | ) | 0.98 | 0.87 | (0.99 | ) | |||||||||||||||
| 12/20/2010* - 11/30/2011 |
13.77 | (0.15 | ) | (0.31 | ) | (0.46 | ) | — | ||||||||||||||
| Class P | ||||||||||||||||||||||
| 5/31/2014+ |
$ | 19.25 | $ | (0.08 | ) | $ | (0.09 | ) | $ | (0.17 | ) | $ | (1.23 | ) | ||||||||
| 11/30/2013 |
13.32 | (0.11 | ) | 6.32 | 6.21 | (0.28 | ) | |||||||||||||||
| 11/30/2012 |
13.37 | (0.04 | ) | 0.98 | 0.94 | (0.99 | ) | |||||||||||||||
| 12/20/2010* - 11/30/2011 |
13.77 | (0.09 | ) | (0.31 | ) | (0.40 | ) | — | ||||||||||||||
| Institutional Class | ||||||||||||||||||||||
| 5/31/2014+ |
$ | 19.30 | $ | (0.07 | ) | $ | (0.08 | ) | $ | (0.15 | ) | $ | (1.23 | ) | ||||||||
| 11/30/2013 |
13.35 | (0.08 | ) | 6.31 | 6.23 | (0.28 | ) | |||||||||||||||
| 11/30/2012 |
13.39 | (0.04 | ) | 0.99 | 0.95 | (0.99 | ) | |||||||||||||||
| 11/30/2011 |
12.84 | (0.07 | ) | 0.62 | 0.55 | — | ||||||||||||||||
| 11/30/2010 |
10.05 | (0.06 | ) | 2.85 | 2.79 | — | ||||||||||||||||
| 4/1/2009** - 11/30/2009 |
6.59 | (0.03 | ) | 3.49 | 3.46 | — | ||||||||||||||||
| 3/31/2009 |
11.45 | (0.04 | ) | (4.82 | ) | (4.86 | ) | — | ||||||||||||||
| + | Unaudited |
| * | Commencement of operations. |
| ** | On November 13, 2009, the Board of Trustees approved a change in the Fund’s fiscal year from March 31 to November 30. |
| (a) | Calculated on average shares outstanding during the period. |
| (b) | Total return is calculated assuming a purchase of a share on the first day of the period and a sale of a share on the last day of each period reported. Dividends and distributions, if any, are assumed, for purposes of this calculation, to be reinvested. Total return does not reflect sales charges and includes the effect of fee waivers and reimbursements. Total return may reflect adjustments to conform to generally accepted accounting principles. Total return for a period of less than one year is not annualized. |
| (c) | Annualized. |
| (d) | Ratio of expenses to average net assets net of reimbursement/recoupment offset was 1.16% and 0.90% for the period ended November 30, 2009 and the year ended March 31, 2009, respectively. |
| 226 | Semiannual Report | | May 31, 2014 | | See accompanying Notes to Financial Statements |
Table of Contents
| Net Asset Value, End of Period |
Total Return (b) | Net Assets, End of Period (000s) |
Ratio of Expenses to Average Net Assets with Fee Waiver/ Reimbursement |
Ratio of Expenses to Average Net Assets without Fee Waiver/ Reimbursement |
Ratio of Net Investment Loss to Average Net Assets |
Portfolio Turnover Rate |
||||||||||||||||||||||
| $ | 17.68 | (0.80 | )% | $ | 5,349 | 1.47 | %(c) | 1.85 | %(c) | (1.11 | )%(c) | 35 | % | |||||||||||||||
| 19.09 | 47.16 | 4,971 | 1.50 | 1.91 | (0.90 | ) | 81 | |||||||||||||||||||||
| 13.25 | 7.67 | 1,359 | 1.50 | 2.45 | (0.59 | ) | 92 | |||||||||||||||||||||
| 13.34 | (3.12 | ) | 837 | 1.50 | (c) | 2.70 | (c) | (0.92 | )(c) | 111 | ||||||||||||||||||
| $ | 17.21 | (1.16 | )% | $ | 653 | 2.21 | %(c) | 2.61 | %(c) | (1.85 | )%(c) | 35 | % | |||||||||||||||
| 18.68 | 46.03 | 606 | 2.21 | 2.73 | (1.57 | ) | 81 | |||||||||||||||||||||
| 13.07 | 6.99 | 228 | 2.22 | 3.16 | (1.35 | ) | 92 | |||||||||||||||||||||
| 13.25 | (3.78 | ) | 134 | 2.25 | (c) | 3.04 | (c) | (1.60 | )(c) | 111 | ||||||||||||||||||
| $ | 17.70 | (0.80 | )% | $ | 95 | 1.42 | %(c) | 1.87 | %(c) | (1.05 | )%(c) | 35 | % | |||||||||||||||
| 19.11 | 47.32 | 68 | 1.44 | 2.00 | (0.71 | ) | 81 | |||||||||||||||||||||
| 13.25 | 7.67 | 57 | 1.49 | 2.36 | (0.65 | ) | 92 | |||||||||||||||||||||
| 13.34 | (3.12 | ) | 27 | 1.50 | (c) | 2.31 | (c) | (0.86 | )(c) | 111 | ||||||||||||||||||
| $ | 17.55 | (0.92 | )% | $ | 26 | 1.66 | %(c) | 2.12 | %(c) | (1.30 | )%(c) | 35 | % | |||||||||||||||
| 18.98 | 46.99 | 26 | 1.67 | 2.16 | (1.03 | ) | 81 | |||||||||||||||||||||
| 13.19 | 7.44 | 10 | 1.70 | 2.60 | (0.84 | ) | 92 | |||||||||||||||||||||
| 13.31 | (3.34 | ) | 10 | 1.75 | (c) | 2.50 | (c) | (1.14 | )(c) | 111 | ||||||||||||||||||
| $ | 17.85 | (0.74 | )% | $ | 149 | 1.25 | %(c) | 1.70 | %(c) | (0.90 | )%(c) | 35 | % | |||||||||||||||
| 19.25 | 47.60 | 110 | 1.25 | 1.74 | (0.69 | ) | 81 | |||||||||||||||||||||
| 13.32 | 7.97 | 19 | 1.25 | 2.25 | (0.27 | ) | 92 | |||||||||||||||||||||
| 13.37 | (2.90 | ) | 15 | 1.25 | (c) | 2.13 | (c) | (0.65 | )(c) | 111 | ||||||||||||||||||
| $ | 17.92 | (0.62 | )% | $ | 29,872 | 1.16 | %(c) | 1.59 | %(c) | (0.80 | )%(c) | 35 | % | |||||||||||||||
| 19.30 | 47.64 | 29,116 | 1.16 | 1.69 | (0.48 | ) | 81 | |||||||||||||||||||||
| 13.35 | 8.05 | 20,140 | 1.15 | 2.09 | (0.29 | ) | 92 | |||||||||||||||||||||
| 13.39 | 4.28 | 20,862 | 1.15 | 1.99 | (0.53 | ) | 111 | |||||||||||||||||||||
| 12.84 | 27.76 | 20,079 | 1.19 | 1.71 | (0.57 | ) | 168 | |||||||||||||||||||||
| 10.05 | 52.50 | 13,942 | 1.18 | (c) | 1.18 | (c)(d) | (0.53 | )(c) | 97 | |||||||||||||||||||
| 6.59 | (42.45 | ) | 6,591 | 1.21 | 1.21 | (d) | (0.34 | ) | 146 | |||||||||||||||||||
| See accompanying Notes to Financial Statements | | May 31, 2014 | | Semiannual Report | 227 |
Table of Contents
May 31, 2014 (Unaudited)
| 228 | May 31, 2014 | | Semiannual Report |
Table of Contents
| Semiannual Report | | May 31, 2014 | 229 |
Table of Contents
Notes to Financial Statements (cont’d)
May 31, 2014 (Unaudited)
| 230 | May 31, 2014 | | Semiannual Report |
Table of Contents
A summary of the inputs used at May 31, 2014 in valuing each Fund’s assets and liabilities is listed below (refer to the Schedules of Investments and Notes 7(a), 7(b) and 7(c) for more detailed information on Investments in Securities and Other Financial Instruments):
| AllianzGI Retirement 2015: | ||||||||||||||||
| Investments in Securities – Assets | Level 1– Quoted Prices |
Level 2– Other Significant Observable Inputs |
Level 3– Significant Unobservable Inputs |
Value at 5/31/14 |
||||||||||||
| Mutual Funds |
$ | 24,506,301 | — | — | $ | 24,506,301 | ||||||||||
| Exchange-Traded Funds |
4,289,108 | — | — | 4,289,108 | ||||||||||||
| Totals |
$ | 28,795,409 | — | — | $ | 28,795,409 | ||||||||||
| AllianzGI Retirement 2020: | ||||||||||||||||
| Investments in Securities – Assets | Level 1– Quoted Prices |
Level 2– Other Significant Observable Inputs |
Level 3– Significant Unobservable Inputs |
Value at 5/31/14 |
||||||||||||
| Mutual Funds |
$ | 42,461,398 | — | — | $ | 42,461,398 | ||||||||||
| Exchange-Traded Funds |
7,306,727 | — | — | 7,306,727 | ||||||||||||
| Repurchase Agreements |
— | $ | 379,000 | — | 379,000 | |||||||||||
| Totals |
$ | 49,768,125 | $ | 379,000 | — | $ | 50,147,125 | |||||||||
| AllianzGI Retirement 2025: | ||||||||||||||||
| Investments in Securities – Assets | Level 1– Quoted Prices |
Level 2– Other Significant Observable Inputs |
Level 3– Significant Unobservable Inputs |
Value at 5/31/14 |
||||||||||||
| Mutual Funds |
$ | 50,306,859 | — | — | $ | 50,306,859 | ||||||||||
| Exchange-Traded Funds |
6,776,946 | — | — | 6,776,946 | ||||||||||||
| Repurchase Agreements |
— | $ | 553,000 | — | 553,000 | |||||||||||
| Totals |
$ | 57,083,805 | $ | 553,000 | — | $ | 57,636,805 | |||||||||
| AllianzGI Retirement 2030: | ||||||||||||||||
| Investments in Securities – Assets | Level 1– Quoted Prices |
Level 2– Other Significant Observable Inputs |
Level 3– Significant Unobservable Inputs |
Value at 5/31/14 |
||||||||||||
| Mutual Funds |
$ | 53,953,844 | — | — | $ | 53,953,844 | ||||||||||
| Exchange-Traded Funds |
5,560,502 | — | — | 5,560,502 | ||||||||||||
| Repurchase Agreements |
— | $ | 490,000 | — | 490,000 | |||||||||||
| Totals |
$ | 59,514,346 | $ | 490,000 | — | $ | 60,004,346 | |||||||||
| Semiannual Report | | May 31, 2014 | 231 |
Table of Contents
Notes to Financial Statements (cont’d)
May 31, 2014 (Unaudited)
| AllianzGI Retirement 2035: | ||||||||||||||||
| Investments in Securities – Assets | Level 1– Quoted Prices |
Level 2– Other Significant Observable Inputs |
Level 3– Significant Unobservable Inputs |
Value at 5/31/14 |
||||||||||||
| Mutual Funds |
$ | 45,083,089 | — | — | $ | 45,083,089 | ||||||||||
| Exchange-Traded Funds |
4,198,210 | — | — | 4,198,210 | ||||||||||||
| Repurchase Agreements |
— | $ | 403,000 | — | 403,000 | |||||||||||
| Totals |
$ | 49,281,299 | $ | 403,000 | — | $ | 49,684,299 | |||||||||
| AllianzGI Retirement 2040: | ||||||||||||||||
| Investments in Securities – Assets | Level 1– Quoted Prices |
Level 2– Other Significant Observable Inputs |
Level 3– Significant Unobservable Inputs |
Value at 5/31/14 |
||||||||||||
| Mutual Funds |
$ | 38,564,723 | — | — | $ | 38,564,723 | ||||||||||
| Exchange-Traded Funds |
3,477,745 | — | — | 3,477,745 | ||||||||||||
| Repurchase Agreements |
— | $ | 395,000 | — | 395,000 | |||||||||||
| Totals |
$ | 42,042,468 | $ | 395,000 | — | $ | 42,437,468 | |||||||||
| AllianzGI Retirement 2045: | ||||||||||||||||
| Investments in Securities – Assets | Level 1– Quoted Prices |
Level 2– Other Significant Observable Inputs |
Level 3– Significant Unobservable Inputs |
Value at 5/31/14 |
||||||||||||
| Mutual Funds |
$ | 23,225,512 | — | — | $ | 23,225,512 | ||||||||||
| Exchange-Traded Funds |
1,302,808 | — | — | 1,302,808 | ||||||||||||
| Repurchase Agreements |
— | $ | 264,000 | — | 264,000 | |||||||||||
| Totals |
$ | 24,528,320 | $ | 264,000 | — | $ | 24,792,320 | |||||||||
| AllianzGI Retirement 2050: | ||||||||||||||||
| Investments in Securities – Assets | Level 1– Quoted Prices |
Level 2– Other Significant Observable Inputs |
Level 3– Significant Unobservable Inputs |
Value at 5/31/14 |
||||||||||||
| Mutual Funds |
$ | 18,845,386 | — | — | $ | 18,845,386 | ||||||||||
| Exchange-Traded Funds |
974,139 | — | — | 974,139 | ||||||||||||
| Repurchase Agreements |
— | $ | 239,000 | — | 239,000 | |||||||||||
| Totals |
$ | 19,819,525 | $ | 239,000 | — | $ | 20,058,525 | |||||||||
| AllianzGI Retirement 2055: | ||||||||||||||||
| Investments in Securities – Assets | Level 1– Quoted Prices |
Level 2– Other Significant Observable Inputs |
Level 3– Significant Unobservable Inputs |
Value at 5/31/14 |
||||||||||||
| Mutual Funds |
$ | 6,329,591 | — | — | $ | 6,329,591 | ||||||||||
| Exchange-Traded Funds |
323,166 | — | — | 323,166 | ||||||||||||
| Totals |
$ | 6,652,757 | — | — | $ | 6,652,757 | ||||||||||
| AllianzGI Retirement Income: | ||||||||||||||||
| Investments in Securities – Assets | Level 1– Quoted Prices |
Level 2– Other Significant Observable Inputs |
Level 3– Significant Unobservable Inputs |
Value at 5/31/14 |
||||||||||||
| Mutual Funds |
$ | 25,416,922 | — | — | $ | 25,416,922 | ||||||||||
| Exchange-Traded Funds |
4,951,442 | — | — | 4,951,442 | ||||||||||||
| Repurchase Agreements |
— | $ | 282,000 | — | 282,000 | |||||||||||
| Totals |
$ | 30,368,364 | $ | 282,000 | — | $ | 30,650,364 | |||||||||
| 232 | May 31, 2014 | | Semiannual Report |
Table of Contents
| AllianzGI Global Allocation: | ||||||||||||||||
| Investments in Securities – Assets | Level 1– Quoted Prices |
Level 2– Other Significant Observable Inputs |
Level 3– Significant Unobservable Inputs |
Value at 5/31/14 |
||||||||||||
| Mutual Funds |
$ | 207,695,099 | — | — | $ | 207,695,099 | ||||||||||
| Exchange-Traded Funds |
10,329,757 | — | — | 10,329,757 | ||||||||||||
| Repurchase Agreements |
— | $ | 582,000 | — | 582,000 | |||||||||||
| Totals |
$ | 218,024,856 | $ | 582,000 | — | $ | 218,606,856 | |||||||||
| AllianzGI Global Growth Allocation: | ||||||||||||||||
| Investments in Securities – Assets | Level 1– Quoted Prices |
Level 2– Other Significant Observable Inputs |
Level 3– Significant Unobservable Inputs |
Value at 5/31/14 |
||||||||||||
| Mutual Funds |
$ | 6,176,937 | — | — | $ | 6,176,937 | ||||||||||
| Exchange-Traded Funds |
388,523 | — | — | 388,523 | ||||||||||||
| Totals |
$ | 6,565,460 | — | — | $ | 6,565,460 | ||||||||||
| AllianzGI Behavioral Advantage Large Cap: | ||||||||||||||||
| Investments in Securities – Assets | Level 1– Quoted Prices |
Level 2– Other Significant Observable Inputs |
Level 3– Significant Unobservable Inputs |
Value at 5/31/14 |
||||||||||||
| Common Stock |
$ | 81,323,042 | — | — | $ | 81,323,042 | ||||||||||
| AllianzGI Best Styles Global Equity: | ||||||||||||||||
| Investments in Securities – Assets | Level 1– Quoted Prices |
Level 2– Other Significant Observable Inputs |
Level 3– Significant Unobservable Inputs |
Value at 5/31/14 |
||||||||||||
| Common Stock: |
||||||||||||||||
| Australia |
— | $ | 217,708 | — | $ | 217,708 | ||||||||||
| Austria |
— | 105,236 | — | 105,236 | ||||||||||||
| Belgium |
$ | 19,404 | 144,773 | — | 164,177 | |||||||||||
| China |
15,250 | 849,197 | $ | 9,996 | 874,443 | |||||||||||
| Denmark |
— | 105,255 | — | 105,255 | ||||||||||||
| Finland |
48,289 | 111,169 | — | 159,458 | ||||||||||||
| France |
— | 921,668 | — | 921,668 | ||||||||||||
| Germany |
— | 1,237,576 | — | 1,237,576 | ||||||||||||
| Hong Kong |
9,955 | 194,274 | — | 204,229 | ||||||||||||
| Indonesia |
— | 98,582 | — | 98,582 | ||||||||||||
| Ireland |
20,681 | 181,187 | — | 201,868 | ||||||||||||
| Italy |
— | 311,783 | — | 311,783 | ||||||||||||
| Japan |
— | 3,949,250 | — | 3,949,250 | ||||||||||||
| Korea (Republic of) |
409,536 | 344,419 | — | 753,955 | ||||||||||||
| Malaysia |
— | 67,990 | — | 67,990 | ||||||||||||
| Netherlands |
79,511 | 338,155 | — | 417,666 | ||||||||||||
| New Zealand |
— | 11,707 | — | 11,707 | ||||||||||||
| Norway |
21,601 | 266,965 | — | 288,566 | ||||||||||||
| Philippines |
— | 89,796 | — | 89,796 | ||||||||||||
| Poland |
— | 16,886 | — | 16,886 | ||||||||||||
| Singapore |
— | 28,959 | — | 28,959 | ||||||||||||
| South Africa |
— | 104,690 | — | 104,690 | ||||||||||||
| Spain |
— | 215,814 | — | 215,814 | ||||||||||||
| Sweden |
— | 421,107 | — | 421,107 | ||||||||||||
| Switzerland |
163,738 | 593,702 | — | 757,440 | ||||||||||||
| Semiannual Report | | May 31, 2014 | 233 |
Table of Contents
Notes to Financial Statements (cont’d)
May 31, 2014 (Unaudited)
| AllianzGI Best Styles Global Equity (cont’d) | ||||||||||||||||
| Investments in Securities – Assets | Level 1– Quoted Prices |
Level 2– Other Significant Observable Inputs |
Level 3– Significant Unobservable Inputs |
Value at 5/31/14 |
||||||||||||
| Taiwan |
— | $ | 371,452 | — | $ | 371,452 | ||||||||||
| Thailand |
— | 37,097 | $ | 62,298 | 99,395 | |||||||||||
| Turkey |
— | 213,991 | — | 213,991 | ||||||||||||
| United Kingdom |
$ | 122,823 | 2,229,398 | — | 2,352,221 | |||||||||||
| All Other |
20,368,021 | — | — | 20,368,021 | ||||||||||||
| Preferred Stock: |
||||||||||||||||
| Brazil |
213,278 | — | — | 213,278 | ||||||||||||
| All Other |
— | 220,715 | — | 220,715 | ||||||||||||
| Repurchase Agreements |
— | 465,000 | — | 465,000 | ||||||||||||
| 21,492,087 | 14,465,501 | 72,294 | 36,029,882 | |||||||||||||
| Other Financial Instruments* – Assets |
||||||||||||||||
| Market Price |
39,093 | — | — | 39,093 | ||||||||||||
| Other Financial Instruments* – Liabilities |
||||||||||||||||
| Market Price |
(647 | ) | — | — | (647 | ) | ||||||||||
| Totals |
$ | 21,530,533 | $ | 14,465,501 | $ | 72,294 | $ | 36,068,328 | ||||||||
| AllianzGI China Equity: | ||||||||||||||||
| Investments in Securities – Assets | Level 1– Quoted Prices |
Level 2– Other Significant Observable Inputs |
Level 3– Significant Unobservable Inputs |
Value at 5/31/14 |
||||||||||||
| Common Stock: |
||||||||||||||||
| China |
$ | 218,797 | $ | 3,098,839 | $ | 95,751 | $ | 3,413,387 | ||||||||
| Hong Kong |
125,423 | 476,887 | — | 602,310 | ||||||||||||
| Totals |
$ | 344,220 | $ | 3,575,726 | $ | 95,751 | $ | 4,015,697 | ||||||||
| AllianzGI Convertible: | ||||||||||||||||
| Investments in Securities – Assets | Level 1– Quoted Prices |
Level 2– Other Significant Observable Inputs |
Level 3– Significant Unobservable Inputs |
Value at 5/31/14 |
||||||||||||
| Convertible Bonds |
— | $ | 2,184,906,077 | — | $ | 2,184,906,077 | ||||||||||
| Convertible Preferred Stock: |
||||||||||||||||
| Aerospace & Defense |
$ | 36,219,281 | — | — | 36,219,281 | |||||||||||
| Banks |
32,084,018 | 32,003,530 | — | 64,087,548 | ||||||||||||
| Insurance |
49,842,279 | — | — | 49,842,279 | ||||||||||||
| Machinery |
2,890,012 | 32,102,255 | — | 34,992,267 | ||||||||||||
| Telecommunications |
6,878,555 | — | — | 6,878,555 | ||||||||||||
| All Other |
— | 202,707,412 | — | 202,707,412 | ||||||||||||
| Repurchase Agreements |
— | 37,807,000 | — | 37,807,000 | ||||||||||||
| Totals |
$ | 127,914,145 | $ | 2,489,526,274 | — | $ | 2,617,440,419 | |||||||||
| AllianzGI Global Fundamental Strategy: | ||||||||||||||||
| Investments in Securities – Assets | Level 1– Quoted Prices |
Level 2– Other Significant Observable Inputs |
Level 3– Significant Unobservable Inputs |
Value at 5/31/14 |
||||||||||||
| Corporate Bonds & Notes |
— | $ | 8,413,563 | — | $ | 8,413,563 | ||||||||||
| Common Stock: |
||||||||||||||||
| Norway |
$ | 223,774 | 244,297 | — | 468,071 | |||||||||||
| United States |
3,060,757 | — | — | 3,060,757 | ||||||||||||
| All Other |
— | 4,830,120 | — | 4,830,120 | ||||||||||||
| 234 | May 31, 2014 | | Semiannual Report |
Table of Contents
| AllianzGI Global Fundamental Strategy (cont’d) | ||||||||||||||||
| Investments in Securities – Assets | Level 1– Quoted Prices |
Level 2– Other Significant Observable Inputs |
Level 3– Significant Unobservable Inputs |
Value at 5/31/14 |
||||||||||||
| Sovereign Debt Obligations |
— | $ | 5,675,598 | — | $ | 5,675,598 | ||||||||||
| Exchange-Traded Funds |
$ | 229,770 | — | — | 229,770 | |||||||||||
| Repurchase Agreements |
— | 2,465,000 | — | 2,465,000 | ||||||||||||
| Options Purchased: |
||||||||||||||||
| Market Price |
28,872 | — | — | 28,872 | ||||||||||||
| 3,543,173 | 21,628,578 | — | 25,171,751 | |||||||||||||
| Other Financial Instruments* – Assets |
||||||||||||||||
| Foreign Exchange Contracts |
— | 12,031 | — | 12,031 | ||||||||||||
| Other Financial Instruments* – Liabilities |
||||||||||||||||
| Foreign Exchange Contracts |
— | (464 | ) | — | (464 | ) | ||||||||||
| Interest Rate Contracts |
(2,115 | ) | — | — | (2,115 | ) | ||||||||||
| Market Price |
(42,723 | ) | — | — | (42,723 | ) | ||||||||||
| (44,838 | ) | (464 | ) | — | (45,302 | ) | ||||||||||
| Totals |
$ | 3,498,335 | $ | 21,640,145 | — | $ | 25,138,480 | |||||||||
| AllianzGI Global Managed Volatility: | ||||||||||||||||
| Investments in Securities – Assets | Level 1– Quoted Prices |
Level 2– Other Significant Observable Inputs |
Level 3– Significant Unobservable Inputs |
Value at 5/31/14 |
||||||||||||
| Common Stock: |
||||||||||||||||
| Australia |
— | $ | 196,433 | — | $ | 196,433 | ||||||||||
| China |
— | 490,323 | — | 490,323 | ||||||||||||
| France |
$ | 136,748 | 93,918 | — | 230,666 | |||||||||||
| Germany |
— | 259,928 | — | 259,928 | ||||||||||||
| Hong Kong |
— | 724,665 | — | 724,665 | ||||||||||||
| Israel |
— | 640,076 | — | 640,076 | ||||||||||||
| Japan |
— | 711,351 | — | 711,351 | ||||||||||||
| Netherlands |
— | 116,766 | — | 116,766 | ||||||||||||
| Norway |
70,885 | 62,711 | — | 133,596 | ||||||||||||
| Singapore |
142,952 | 514,639 | — | 657,591 | ||||||||||||
| Switzerland |
— | 235,036 | — | 235,036 | ||||||||||||
| United Kingdom |
— | 1,075,625 | — | 1,075,625 | ||||||||||||
| All Other |
12,292,054 | — | — | 12,292,054 | ||||||||||||
| Repurchase Agreements |
— | 225,000 | — | 225,000 | ||||||||||||
| Totals |
$ | 12,642,639 | $ | 5,346,471 | — | $ | 17,989,110 | |||||||||
| AllianzGI Global Water: | ||||||||||||||||
| Investments in Securities – Assets | Level 1– Quoted Prices |
Level 2– Other Significant Observable Inputs |
Level 3– Significant Unobservable Inputs |
Value at 5/31/14 |
||||||||||||
| Common Stock: |
||||||||||||||||
| Brazil |
$ | 6,999,243 | — | — | $ | 6,999,243 | ||||||||||
| Italy |
6,487,413 | — | — | 6,487,413 | ||||||||||||
| Switzerland |
18,349,596 | $ | 29,478,129 | — | 47,827,725 | |||||||||||
| United States |
98,035,413 | — | — | 98,035,413 | ||||||||||||
| All Other |
— | 152,565,259 | — | 152,565,259 | ||||||||||||
| Repurchase Agreements |
— | 15,757,000 | — | 15,757,000 | ||||||||||||
| Totals |
$ | 129,871,665 | $ | 197,800,388 | — | $ | 327,672,053 | |||||||||
| Semiannual Report | | May 31, 2014 | 235 |
Table of Contents
Notes to Financial Statements (cont’d)
May 31, 2014 (Unaudited)
| AllianzGI High Yield Bond: | ||||||||||||||||
| Investments in Securities – Assets | Level 1– Quoted Prices |
Level 2– Other Significant Observable Inputs |
Level 3– Significant Unobservable Inputs |
Value at 5/31/14 |
||||||||||||
| Corporate Bonds & Notes |
— | $ | 441,282,757 | — | $ | 441,282,757 | ||||||||||
| Repurchase Agreements |
— | 19,808,000 | — | 19,808,000 | ||||||||||||
| Totals |
— | $ | 461,090,757 | — | $ | 461,090,757 | ||||||||||
| AllianzGI International Small-Cap: | ||||||||||||||||
| Investments in Securities – Assets | Level 1– Quoted Prices |
Level 2– Other Significant Observable Inputs |
Level 3– Significant Unobservable Inputs |
Value at 5/31/14 |
||||||||||||
| Common Stock: |
||||||||||||||||
| Australia |
$ | 467,383 | $ | 1,584,739 | — | $ | 2,052,122 | |||||||||
| Finland |
2,225,925 | 1,204,335 | — | 3,430,260 | ||||||||||||
| Ireland |
1,495,884 | — | — | 1,495,884 | ||||||||||||
| Sweden |
78,310 | 7,599,027 | — | 7,677,337 | ||||||||||||
| Taiwan |
193,176 | 1,862,915 | — | 2,056,091 | ||||||||||||
| All Other |
— | 89,846,611 | — | 89,846,611 | ||||||||||||
| Repurchase Agreements |
— | 2,070,000 | — | 2,070,000 | ||||||||||||
| Totals |
$ | 4,460,678 | $ | 104,167,627 | — | $ | 108,628,305 | |||||||||
| AllianzGI Micro Cap: | ||||||||||||||||
| Investments in Securities – Assets | Level 1– Quoted Prices |
Level 2– Other Significant Observable Inputs |
Level 3– Significant Unobservable Inputs |
Value at 5/31/14 |
||||||||||||
| Common Stock |
$ | 41,086,916 | — | — | $ | 41,086,916 | ||||||||||
| Repurchase Agreements |
— | $ | 419,000 | — | 419,000 | |||||||||||
| Totals |
$ | 41,086,916 | $ | 419,000 | — | $ | 41,505,916 | |||||||||
| AllianzGI Multi-Asset Real Return: | ||||||||||||||||
| Investments in Securities – Assets | Level 1– Quoted Prices |
Level 2– Other Significant Observable Inputs |
Level 3– Significant Unobservable Inputs |
Value at 5/31/14 |
||||||||||||
| Mutual Funds |
$ | 3,353,852 | — | — | $ | 3,353,852 | ||||||||||
| Common Stock: |
||||||||||||||||
| Australia |
— | $ | 136,055 | — | 136,055 | |||||||||||
| France |
— | 70,180 | — | 70,180 | ||||||||||||
| Hong Kong |
— | 198,889 | — | 198,889 | ||||||||||||
| Japan |
— | 195,791 | — | 195,791 | ||||||||||||
| Netherlands |
— | 7,507 | — | 7,507 | ||||||||||||
| Singapore |
— | 66,817 | — | 66,817 | ||||||||||||
| Switzerland |
— | 8,846 | — | 8,846 | ||||||||||||
| United Kingdom |
— | 64,521 | — | 64,521 | ||||||||||||
| All Other |
779,875 | — | — | 779,875 | ||||||||||||
| U.S. Treasury Obligations |
— | 687,882 | — | 687,882 | ||||||||||||
| Exchange-Traded Funds |
581,709 | — | — | 581,709 | ||||||||||||
| Warrants |
277 | — | — | 277 | ||||||||||||
| 4,715,713 | 1,436,488 | — | 6,152,201 | |||||||||||||
| Other Financial Instruments* – Assets |
||||||||||||||||
| Interest Rate Contracts |
7,618 | — | — | 7,618 | ||||||||||||
| Market Price |
8,491 | — | — | 8,491 | ||||||||||||
| 16,109 | — | — | 16,109 | |||||||||||||
| 236 | May 31, 2014 | | Semiannual Report |
Table of Contents
| AllianzGI Multi-Asset Real Return (cont’d) | ||||||||||||||||
| Investments in Securities – Assets | Level 1– Quoted Prices |
Level 2– Other Significant Observable Inputs |
Level 3– Significant Unobservable Inputs |
Value at 5/31/14 |
||||||||||||
| Other Financial Instruments* – Liabilities |
||||||||||||||||
| Interest Rate Contracts |
$ | (3,678 | ) | — | — | $ | (3,678 | ) | ||||||||
| Totals |
$ | 4,728,144 | $ | 1,436,488 | — | $ | 6,164,632 | |||||||||
| AllianzGI NFJ Emerging Markets Value: | ||||||||||||||||
| Investments in Securities – Assets | Level 1– Quoted Prices |
Level 2– Other Significant Observable Inputs |
Level 3– Significant Unobservable Inputs |
Value at 5/31/14 |
||||||||||||
| Common Stock: |
||||||||||||||||
| Brazil |
$ | 588,550 | — | — | $ | 588,550 | ||||||||||
| Chile |
179,976 | — | — | 179,976 | ||||||||||||
| China |
258,888 | $ | 1,475,983 | — | 1,734,871 | |||||||||||
| Czech Republic |
61,021 | — | — | 61,021 | ||||||||||||
| Egypt |
60,306 | 66,227 | — | 126,533 | ||||||||||||
| Hong Kong |
56,484 | 245,864 | — | 302,348 | ||||||||||||
| India |
150,221 | 553,356 | — | 703,577 | ||||||||||||
| Korea (Republic of) |
67,282 | 1,062,031 | — | 1,129,313 | ||||||||||||
| Mexico |
270,898 | — | — | 270,898 | ||||||||||||
| Peru |
64,179 | — | — | 64,179 | ||||||||||||
| Russian Federation |
113,049 | — | $ | 492,676 | 605,725 | |||||||||||
| South Africa |
187,793 | 375,101 | — | 562,894 | ||||||||||||
| Taiwan |
72,904 | 921,849 | — | 994,753 | ||||||||||||
| Thailand |
61,931 | 157,889 | 206,453 | 426,273 | ||||||||||||
| All Other |
— | 1,252,359 | — | 1,252,359 | ||||||||||||
| Preferred Stock: |
||||||||||||||||
| Brazil |
338,972 | — | — | 338,972 | ||||||||||||
| Russian Federation |
— | — | 55,016 | 55,016 | ||||||||||||
| Equity-Linked Securities |
— | 108,256 | — | 108,256 | ||||||||||||
| Totals |
$ | 2,532,454 | $ | 6,218,915 | $ | 754,145 | $ | 9,505,514 | ||||||||
| AllianzGI NFJ Global Dividend Value: | ||||||||||||||||
| Investments in Securities – Assets | Level 1– Quoted Prices |
Level 2– Other Significant Observable Inputs |
Level 3– Significant Unobservable Inputs |
Value at 5/31/14 |
||||||||||||
| Common Stock: |
||||||||||||||||
| China |
— | $ | 2,881,856 | — | $ | 2,881,856 | ||||||||||
| France |
— | 3,018,811 | — | 3,018,811 | ||||||||||||
| Germany |
— | 1,475,246 | — | 1,475,246 | ||||||||||||
| Hong Kong |
— | 1,387,115 | — | 1,387,115 | ||||||||||||
| Israel |
$ | 1,433,916 | 1,300,027 | — | 2,733,943 | |||||||||||
| Japan |
— | 4,356,709 | — | 4,356,709 | ||||||||||||
| Korea (Republic of) |
— | 3,052,601 | — | 3,052,601 | ||||||||||||
| Spain |
— | 3,225,591 | — | 3,225,591 | ||||||||||||
| Switzerland |
— | 2,820,875 | — | 2,820,875 | ||||||||||||
| United Kingdom |
— | 5,793,305 | — | 5,793,305 | ||||||||||||
| All Other |
42,013,676 | — | — | 42,013,676 | ||||||||||||
| Repurchase Agreements |
— | 1,170,000 | — | 1,170,000 | ||||||||||||
| Totals |
$ | 43,447,592 | $ | 30,482,136 | — | $ | 73,929,728 | |||||||||
| Semiannual Report | | May 31, 2014 | 237 |
Table of Contents
Notes to Financial Statements (cont’d)
May 31, 2014 (Unaudited)
| AllianzGI NFJ International Small-Cap Value: | ||||||||||||||||
| Investments in Securities – Assets | Level 1– Quoted Prices |
Level 2– Other Significant Observable Inputs |
Level 3– Significant Unobservable Inputs |
Value at 5/31/14 |
||||||||||||
| Common Stock: |
||||||||||||||||
| Belgium |
$ | 208,971 | — | — | $ | 208,971 | ||||||||||
| Brazil |
497,129 | — | — | 497,129 | ||||||||||||
| Canada |
1,700,045 | — | — | 1,700,045 | ||||||||||||
| Finland |
144,990 | $ | 144,484 | — | 289,474 | |||||||||||
| Greece |
226,408 | — | — | 226,408 | ||||||||||||
| Hong Kong |
435,709 | 901,832 | — | 1,337,541 | ||||||||||||
| Israel |
137,280 | — | — | 137,280 | ||||||||||||
| Panama |
213,920 | — | — | 213,920 | ||||||||||||
| Russian Federation |
116,955 | — | — | 116,955 | ||||||||||||
| South Africa |
188,802 | 249,023 | — | 437,825 | ||||||||||||
| Switzerland |
348,855 | 314,632 | — | 663,487 | ||||||||||||
| United Kingdom |
546,102 | 3,198,269 | — | 3,744,371 | ||||||||||||
| United States |
102,816 | — | — | 102,816 | ||||||||||||
| All Other |
— | 11,271,310 | — | 11,271,310 | ||||||||||||
| Preferred Stock: |
||||||||||||||||
| Brazil |
202,475 | — | — | 202,475 | ||||||||||||
| Germany |
154,854 | 137,902 | — | 292,756 | ||||||||||||
| Rights |
18 | — | — | 18 | ||||||||||||
| Totals |
$ | 5,225,329 | $ | 16,217,452 | — | $ | 21,442,781 | |||||||||
| AllianzGI NFJ International Value II: | ||||||||||||||||
| Investments in Securities – Assets | Level 1– Quoted Prices |
Level 2– Other Significant Observable Inputs |
Level 3– Significant Unobservable Inputs |
Value at 5/31/14 |
||||||||||||
| Common Stock: |
||||||||||||||||
| Brazil |
$ | 864,123 | — | — | $ | 864,123 | ||||||||||
| Canada |
2,482,674 | — | — | 2,482,674 | ||||||||||||
| Hong Kong |
637,935 | $ | 1,558,818 | — | 2,196,753 | |||||||||||
| India |
794,584 | — | — | 794,584 | ||||||||||||
| Israel |
676,570 | — | — | 676,570 | ||||||||||||
| Mexico |
322,811 | — | — | 322,811 | ||||||||||||
| Norway |
287,710 | 1,277,582 | — | 1,565,292 | ||||||||||||
| Russian Federation |
1,410,941 | — | — | 1,410,941 | ||||||||||||
| South Africa |
337,740 | — | — | 337,740 | ||||||||||||
| Taiwan |
400,568 | — | — | 400,568 | ||||||||||||
| Turkey |
360,003 | — | — | 360,003 | ||||||||||||
| United Kingdom |
476,772 | 6,765,907 | — | 7,242,679 | ||||||||||||
| United States |
200,108 | — | — | 200,108 | ||||||||||||
| All Other |
— | 11,605,733 | — | 11,605,733 | ||||||||||||
| Repurchase Agreements |
— | 3,620,000 | — | 3,620,000 | ||||||||||||
| Totals |
$ | 9,252,539 | $ | 24,828,040 | — | $ | 34,080,579 | |||||||||
| 238 | May 31, 2014 | | Semiannual Report |
Table of Contents
| AllianzGI Short Duration High Income: | ||||||||||||||||
| Investments in Securities – Assets | Level 1– Quoted Prices |
Level 2– Other Significant Observable Inputs |
Level 3– Significant Unobservable Inputs |
Value at 5/31/14 |
||||||||||||
| Corporate Bonds & Notes |
— | $ | 583,703,781 | — | $ | 583,703,781 | ||||||||||
| Senior Loans |
— | 126,528,576 | — | 126,528,576 | ||||||||||||
| Repurchase Agreements |
— | 15,596,000 | — | 15,596,000 | ||||||||||||
| Totals |
— | $ | 725,828,357 | — | $ | 725,828,357 | ||||||||||
| AllianzGI Structured Return: | ||||||||||||||||
| Investments in Securities – Assets | Level 1– Quoted Prices |
Level 2– Other Significant Observable Inputs |
Level 3– Significant Unobservable Inputs |
Value at 5/31/14 |
||||||||||||
| Short-Term Investments |
— | $ | 16,637,207 | — | $ | 16,637,207 | ||||||||||
| Options Purchased: |
||||||||||||||||
| Market Price |
$ | 25,936 | 13,150 | — | 39,086 | |||||||||||
| 25,936 | 16,650,357 | — | 16,676,293 | |||||||||||||
| Investment in Securities – Liabilities |
||||||||||||||||
| Options Written, at value: |
||||||||||||||||
| Market Price |
(40,402 | ) | (7,952 | ) | — | (48,354 | ) | |||||||||
| Totals |
$ | (14,466 | ) | $ | 16,642,405 | — | $ | 16,627,939 | ||||||||
| AllianzGI Ultra Micro Cap: | ||||||||||||||||
| Investments in Securities – Assets | Level 1– Quoted Prices |
Level 2– Other Significant Observable Inputs |
Level 3– Significant Unobservable Inputs |
Value at 5/31/14 |
||||||||||||
| Common Stock |
$ | 132,808,429 | — | — | $ | 132,808,429 | ||||||||||
| Repurchase Agreements |
— | $ | 642,000 | — | 642,000 | |||||||||||
| Totals |
$ | 132,808,429 | $ | 642,000 | — | $ | 133,450,429 | |||||||||
| AllianzGI U.S. Equity Hedged: | ||||||||||||||||
| Investments in Securities – Assets | Level 1– Quoted Prices |
Level 2– Other Significant Observable Inputs |
Level 3– Significant Unobservable Inputs |
Value at 5/31/14 |
||||||||||||
| Common Stock |
$ | 7,351,158 | — | — | $ | 7,351,158 | ||||||||||
| Repurchase Agreements |
— | $ | 402,000 | — | 402,000 | |||||||||||
| Options Purchased: |
||||||||||||||||
| Market Price |
26,580 | — | — | 26,580 | ||||||||||||
| 7,377,738 | 402,000 | — | 7,779,738 | |||||||||||||
| Investment in Securities – Liabilities |
||||||||||||||||
| Options Written, at value: |
||||||||||||||||
| Market Price |
(19,760 | ) | — | — | (19,760 | ) | ||||||||||
| Totals |
$ | 7,357,978 | $ | 402,000 | — | $ | 7,759,978 | |||||||||
| AllianzGI U.S. Small-Cap Growth: | ||||||||||||||||
| Investments in Securities – Assets | Level 1– Quoted Prices |
Level 2– Other Significant Observable Inputs |
Level 3– Significant Unobservable Inputs |
Value at 5/31/14 |
||||||||||||
| Common Stock |
$ | 35,048,592 | — | — | $ | 35,048,592 | ||||||||||
| Repurchase Agreements |
— | $ | 702,000 | — | 702,000 | |||||||||||
| Totals |
$ | 35,048,592 | $ | 702,000 | — | $ | 35,750,592 | |||||||||
| Semiannual Report | | May 31, 2014 | 239 |
Table of Contents
Notes to Financial Statements (cont’d)
May 31, 2014 (Unaudited)
At May 31, 2014, the following Funds had transfers between Levels 1 and 2:
| Transfers | ||||||||
| Level 1 to Level 2 | Level 2 to Level 1 | |||||||
| AllianzGI China Equity |
$ | 16,519 | (a) | $ | 161,590 | (b) | ||
| AllianzGI Convertible |
32,102,255 | (c) | — | |||||
| AllianzGI Global Fundamental Strategy |
— | 223,774 | (b) | |||||
| AllianzGI Global Managed Volatility |
— | 142,952 | (b) | |||||
| AllianzGI Global Water |
8,274,350 | (a) | — | |||||
| AllianzGI International Small-Cap |
5,779,109 | (a) | — | |||||
| AllianzGI Multi-Asset Real Return |
4,750 | (a) | 7,181 | (b) | ||||
| AllianzGI NFJ Emerging Markets Value |
304,600 | (a) | 326,170 | (b) | ||||
| AllianzGI NFJ International Small-Cap Value |
453,619 | (a) | 372,604 | (b) | ||||
| AllianzGI NFJ International Value II |
384,760 | (a) | 287,710 | (b) | ||||
| (a) | This transfer was a result of securities trading outside the U.S. whose values were not adjusted by the application of a modeling tool at November 30, 2013, which was applied on May 31, 2014. |
| (b) | This transfer was a result of securities trading outside the U.S. whose values were adjusted by the application of a modeling tool at November 30, 2013, which was not applied on May 31, 2014. |
| (c) | This transfer was a result of securities with an exchange-traded closing price at November 30, 2013, which was not available on May 31, 2014. |
A roll forward of fair value measurements using significant unobservable inputs (Level 3) for the period or six months ended May 31, 2014, was as follows:
| AllianzGI Best Styles Global Equity: | ||||||||||||||||||||||||||||||||||||
| Investments in Securities – Assets | Beginning Balance 12/2/13** |
Purchases | Sales | Accrued Discount (Premiums) |
Net Realized Gain (Loss) |
Net Change in Unrealized Appreciation/ Depreciation |
Transfers into Level 3 |
Transfers out of Level 3 |
Ending Balance 5/31/14 |
|||||||||||||||||||||||||||
| Common Stock: |
||||||||||||||||||||||||||||||||||||
| China |
— | $ | 13,106 | — | — | — | $ | (3,110 | ) | — | — | $ | 9,996 | |||||||||||||||||||||||
| Thailand |
— | 63,228 | — | — | — | (930 | ) | — | — | 62,298 | ||||||||||||||||||||||||||
| Totals |
— | $ | 76,334 | — | — | — | $ | (4,040 | ) | — | — | $ | 72,294 | |||||||||||||||||||||||
| AllianzGI China Equity: | ||||||||||||||||||||||||||||||||||||
| Investments in Securities – Assets | Beginning Balance 11/30/13 |
Purchases | Sales | Accrued Discount (Premiums) |
Net Realized Gain (Loss) |
Net Change in Unrealized Appreciation/ Depreciation |
Transfers into Level 3*** |
Transfers out of Level 3 |
Ending Balance 5/31/14 |
|||||||||||||||||||||||||||
| Common Stock: |
||||||||||||||||||||||||||||||||||||
| China |
— | — | — | — | — | — | $ | 95,751 | — | $ | 95,751 | |||||||||||||||||||||||||
| AllianzGI Global Water: | ||||||||||||||||||||||||||||||||||||
| Investments in Securities – Assets | Beginning Balance 11/30/13 |
Purchases | Sales | Accrued Discount (Premiums) |
Net Realized Gain (Loss) |
Net Change in Unrealized Appreciation/ Depreciation |
Transfers into Level 3 |
Transfers out of Level 3 |
Ending Balance 5/31/14 |
|||||||||||||||||||||||||||
| Common Stock: |
||||||||||||||||||||||||||||||||||||
| Hong Kong |
$ | 41,766 | — | $ | (63,609 | ) | — | $ | (286,541 | ) | $ | 308,384 | — | — | — | |||||||||||||||||||||
| AllianzGI International Small-Cap: | ||||||||||||||||||||||||||||||||||||
| Investments in Securities – Assets | Beginning Balance 11/30/13 |
Purchases | Sales | Accrued Discount (Premiums) |
Net Realized Gain (Loss) |
Net Change in Unrealized Appreciation/ Depreciation |
Transfers into Level 3 |
Transfers out of Level 3**** |
Ending Balance 5/31/14 |
|||||||||||||||||||||||||||
| Common Stock: |
||||||||||||||||||||||||||||||||||||
| Australia |
$ | 35,913 | $ | 594,662 | $ | (112,832 | ) | — | $ | 21,616 | $ | 253,191 | — | $ | (792,550 | ) | — | |||||||||||||||||||
| 240 | May 31, 2014 | | Semiannual Report |
Table of Contents
| AllianzGI Multi-Asset Real Return: | ||||||||||||||||||||||||||||||||||||
| Investments in Securities – Assets | Beginning Balance 11/30/13 |
Purchases | Sales | Accrued Discount (Premiums) |
Net Realized Gain (Loss) |
Net Change in Unrealized Appreciation/ Depreciation |
Transfers into Level 3 |
Transfers out of Level 3 |
Ending Balance 5/31/14 |
|||||||||||||||||||||||||||
| Common Stock: |
||||||||||||||||||||||||||||||||||||
| Hong Kong |
$ | 550 | $ | 760 | $ | (852 | ) | — | $ | 92 | $ | (550 | ) | — | — | — | ||||||||||||||||||||
| AllianzGI NFJ Emerging Markets Value: | ||||||||||||||||||||||||||||||||||||
| Investments in Securities – Assets | Beginning Balance 11/30/13 |
Purchases | Sales | Accrued Discount (Premiums) |
Net Realized Gain (Loss) |
Net Change in Unrealized Appreciation/ Depreciation |
Transfers into Level 3 |
Transfers out of Level 3 |
Ending Balance 5/31/14 |
|||||||||||||||||||||||||||
| Common Stock: |
||||||||||||||||||||||||||||||||||||
| Russian Federation |
$ | 426,579 | $ | 144,905 | $ | (84,588 | ) | — | $ | (1,852 | ) | $ | 7,632 | — | — | $ | 492,676 | |||||||||||||||||||
| Thailand |
360,118 | 53,867 | (190,197 | ) | — | (42,148 | ) | 24,813 | — | — | 206,453 | |||||||||||||||||||||||||
| Preferred Stock |
48,596 | 11,300 | — | — | — | (4,880 | ) | — | — | 55,016 | ||||||||||||||||||||||||||
| Totals |
$ | 835,293 | $ | 210,072 | $ | (274,785 | ) | — | $ | (44,000 | ) | $ | 27,565 | — | — | $ | 754,145 | |||||||||||||||||||
| AllianzGI Short Duration High Income: | ||||||||||||||||||||||||||||||||||||
| Investments in Securities – Assets | Beginning Balance 11/30/13 |
Purchases | Sales | Accrued Discount (Premiums) |
Net Realized Gain (Loss) |
Net Change in Unrealized Appreciation/ Depreciation |
Transfers into Level 3 |
Transfers out of Level 3 |
Ending Balance 5/31/14 |
|||||||||||||||||||||||||||
| Senior Loans: |
||||||||||||||||||||||||||||||||||||
| Energy Equipment & Services |
$ | 675,000 | — | $ | (675,000 | ) | — | — | — | — | — | — | ||||||||||||||||||||||||
The following tables present additional information about valuation techniques and inputs used for investments that are measured at fair value and categorized within Level 3 at May 31, 2014:
| AllianzGI Best Styles Global Equity: | ||||||||||||
| Investments in Securities – Assets | Ending Balance at 5/31/14 |
Valuation Technique Used | Unobservable Inputs |
Input Values | ||||||||
| Common Stock |
$ | 9,996 | Last Exchange-Traded Closing Price | Trading Volume | HKD 1.25 | |||||||
| $ | 62,298 | Value of Foreign Security Traded on Foreign Exchange | Price of Non-Resident Shares on Foreign Exchange | THB 18.94-229.39 | ||||||||
| AllianzGI China Equity: | ||||||||||||
| Investments in Securities – Assets | Ending Balance at 5/31/14 |
Valuation Technique Used | Unobservable Inputs |
Input Values | ||||||||
| Common Stock |
$ | 95,751 | Last Exchange-Traded Closing Price | Trading Volume | HKD 7.07 | |||||||
| AllianzGI NFJ Emerging Markets Value: | ||||||||||||
| Investments in Securities – Assets | Ending Balance at 5/31/14 |
Valuation Technique Used | Unobservable Inputs |
Input Values | ||||||||
| Common Stock |
$ | 492,676 | Value of Foreign Security Traded on Foreign Exchange | Price of Non-Resident Shares on Foreign Exchange | $ | 1.24-$64.72 | ||||||
| $ | 206,453 | Value of Foreign Security Traded on Foreign Exchange | Price of Non-Resident Shares on Foreign Exchange | THB 34.07-153.64 | ||||||||
| Preferred Stock |
$ | 55,016 | Value of Foreign Security Traded on Foreign Exchange | Price of Non-Resident Shares on Foreign Exchange | $ | 2,292.34 | ||||||
HKD – Hong Kong Dollar
THB – Thai Baht
| * | Other financial instruments are derivatives, such as futures contracts and forward foreign currency contracts, which are valued at the unrealized appreciation (depreciation) of the instrument. |
| ** | Commencement of operations. |
| *** | Transferred out of Level 2 into Level 3 because an exchange-traded closing price was not available at May 31, 2014. |
| **** | Transferred out of Level 3 into Level 2 because the value of a security trading outside the U.S. was adjusted by the application of a modeling tool at May 31, 2014. |
| Semiannual Report | | May 31, 2014 | 241 |
Table of Contents
Notes to Financial Statements (cont’d)
May 31, 2014 (Unaudited)
| 242 | May 31, 2014 | | Semiannual Report |
Table of Contents
| Semiannual Report | | May 31, 2014 | 243 |
Table of Contents
Notes to Financial Statements (cont’d)
May 31, 2014 (Unaudited)
| 244 | May 31, 2014 | | Semiannual Report |
Table of Contents
| Semiannual Report | | May 31, 2014 | 245 |
Table of Contents
Notes to Financial Statements (cont’d)
May 31, 2014 (Unaudited)
| 246 | May 31, 2014 | | Semiannual Report |
Table of Contents
| AllianzGI Global Fundamental Strategy: | ||||||||||||||||
| Location | Market Price |
Interest Rate Contracts |
Foreign Exchange Contracts |
Total | ||||||||||||
| Asset derivatives: |
||||||||||||||||
| Investments, at value (options purchased) |
$ | 28,872 | — | — | $ | 28,872 | ||||||||||
| Unrealized appreciation of forward foreign currency contracts |
— | — | $ | 12,031 | 12,031 | |||||||||||
| Total asset derivatives |
$ | 28,872 | — | $ | 12,031 | $ | 40,903 | |||||||||
| Liability derivatives: |
||||||||||||||||
| Payable for variation margin on futures contracts* |
$ | (42,723 | ) | $ | (2,115 | ) | — | $ | (44,838 | ) | ||||||
| Unrealized depreciation of forward foreign currency contracts |
— | — | $ | (464 | ) | (464 | ) | |||||||||
| Total liability derivatives |
$ | (42,723 | ) | $ | (2,115 | ) | $ | (464 | ) | $ | (45,302 | ) | ||||
| * | Included in net unrealized depreciation of $44,838 on futures contracts as reported in Note 7(b). |
| AllianzGI Multi-Asset Real Return: | ||||||||||||
| Location | Market Price |
Interest Rate Contracts |
Total | |||||||||
| Asset derivatives: |
||||||||||||
| Receivable for variation margin on futures contracts* |
$ | 8,491 | $ | 3,940 | $ | 12,431 | ||||||
| * | Included in net unrealized appreciation of $12,431 on futures contracts as reported in Note 7(b). |
The effect of derivatives on the Statements of Operations for the period or six months ended May 31, 2014:
| AllianzGI Best Styles Global Equity: | ||||||||||||
| Location | Market Price |
Foreign Exchange Contracts |
Total | |||||||||
| Net realized gain (loss) on: |
||||||||||||
| Futures contracts |
$ | 91,663 | — | $ | 91,663 | |||||||
| Foreign currency transactions (forward foreign currency contracts) |
— | $ | (329 | ) | (329 | ) | ||||||
| Total net realized gain (loss) |
$ | 91,663 | $ | (329 | ) | $ | 91,334 | |||||
| Net change in unrealized appreciation/depreciation of: |
||||||||||||
| Futures contracts |
$ | 38,446 | — | $ | 38,446 | |||||||
| Semiannual Report | | May 31, 2014 | 247 |
Table of Contents
Notes to Financial Statements (cont’d)
May 31, 2014 (Unaudited)
| AllianzGI Global Fundamental Strategy: | ||||||||||||||||
| Location | Market Price |
Interest Rate Contracts |
Foreign Exchange Contracts |
Total | ||||||||||||
| Net realized gain (loss) on: |
||||||||||||||||
| Futures contracts |
— | $ | (8,361 | ) | — | $ | (8,361 | ) | ||||||||
| Options written |
$ | 35,097 | — | — | 35,097 | |||||||||||
| Foreign currency transactions (forward foreign currency contracts) |
— | — | $ | (17,637 | ) | (17,637 | ) | |||||||||
| Total net realized gain (loss) |
$ | 35,097 | $ | (8,361 | ) | $ | (17,637 | ) | $ | 9,099 | ||||||
| Net change in unrealized appreciation/depreciation of: |
||||||||||||||||
| Investments (options purchased) |
$ | 4,780 | — | — | $ | 4,780 | ||||||||||
| Futures contracts |
(42,723 | ) | $ | 3,624 | — | (39,099 | ) | |||||||||
| Options written |
12,316 | — | — | 12,316 | ||||||||||||
| Foreign currency transactions (forward foreign currency contracts) |
— | — | $ | 11,487 | 11,487 | |||||||||||
| Total net change in unrealized appreciation/depreciation |
$ | (25,627 | ) | $ | 3,624 | $ | 11,487 | $ | (10,516 | ) | ||||||
| AllianzGI Multi-Asset Real Return: | ||||||||||||
| Location | Market Price |
Interest Rate Contracts |
Total | |||||||||
| Net realized gain (loss) on: |
||||||||||||
| Futures contracts |
$ | 4,740 | $ | (9,312 | ) | $ | (4,572 | ) | ||||
| Net change in unrealized appreciation/depreciation of: |
||||||||||||
| Futures contracts |
$ | (5,229 | ) | $ | 3,899 | $ | (1,330 | ) | ||||
| 248 | May 31, 2014 | | Semiannual Report |
Table of Contents
The average volume (measured at each fiscal quarter-end) of derivative activity during the period or six months ended May 31, 2014:
| Options Purchased Contracts(1) |
Options Written Contracts(1) |
Forward Foreign Currency Contracts(2) |
Futures Contracts(1) |
|||||||||||||||||||||
| Purchased | Sold | Long | Short | |||||||||||||||||||||
| AllianzGI Best Styles Global Equity |
— | — | — | — | 36 | — | ||||||||||||||||||
| AllianzGI Global Fundamental Strategy |
20 | 85 | $ | 326,392 | $ | 2,288,263 | 3 | 9 | ||||||||||||||||
| AllianzGI Multi-Asset Real Return |
— | — | — | — | 5 | 12 | ||||||||||||||||||
| AllianzGI Structured Return |
1,126 | 1,102 | — | — | — | — | ||||||||||||||||||
| AllianzGI U.S. Equity Hedged |
37 | 37 | — | — | — | — | ||||||||||||||||||
| (1) | Number of contracts |
| (2) | U.S. $ value on origination date |
The following tables present by counterparty, the Funds’ derivative assets and liabilities net of related collateral held by the Funds at May 31, 2014 which has not been offset in the Statements of Assets and Liabilities, but would be available for offset to the extent of a default by the counterparty to the transaction.
Financial Assets and Derivative Assets, and Collateral Received at May 31, 2014:
| AllianzGI Global Fundamental Strategy: | ||||||||||||||||
| Gross Amounts Not Offset in the Statement of Assets and Liabilities | ||||||||||||||||
| Counterparty | Gross Asset Derivatives Presented in Statement of Assets and Liabilities |
Financial Instrument/ Derivative Offset |
Cash Collateral Received |
Net Amount | ||||||||||||
| Foreign Currency Exchange Contracts |
||||||||||||||||
| State Street Bank |
$ | 12,031 | $ | (464 | ) | — | $ | 11,567 | ||||||||
Financial Liabilities and Derivative Liabilities, and Collateral Received at May 31, 2014:
| AllianzGI Global Fundamental Strategy: | ||||||||||||||||
| Gross Amounts Not Offset in the Statement of Assets and Liabilities | ||||||||||||||||
| Counterparty | Gross Liability Derivatives Presented in Statement of Assets and Liabilities |
Financial Instrument/ Derivative Offset |
Cash Collateral Received (Pledged) |
Net Amount | ||||||||||||
| Foreign Currency Exchange Contracts |
||||||||||||||||
| State Street Bank |
$ | 464 | $ | (464 | ) | — | — | |||||||||
| Semiannual Report | | May 31, 2014 | 249 |
Table of Contents
Notes to Financial Statements (cont’d)
May 31, 2014 (Unaudited)
The Investment Management Fee and Administration Fee for all classes are charged at an annual rate as indicated in the following table:
| All Classes | Class A,C,D and R |
Class P and Administrative |
Class R6 | |||||||||||||||||
| Management Fee |
Effective Management Fee |
Administration |
||||||||||||||||||
| AllianzGI Retirement 2015 |
0.05 | % | 0.05 | % | 0.30 | % | 0.15 | % | 0.05 | % | ||||||||||
| AllianzGI Retirement 2020 |
0.05 | 0.05 | 0.30 | 0.15 | 0.05 | |||||||||||||||
| AllianzGI Retirement 2025 |
0.05 | 0.05 | 0.30 | 0.15 | 0.05 | |||||||||||||||
| AllianzGI Retirement 2030 |
0.05 | 0.05 | 0.30 | 0.15 | 0.05 | |||||||||||||||
| AllianzGI Retirement 2035 |
0.05 | 0.05 | 0.30 | 0.15 | 0.05 | |||||||||||||||
| AllianzGI Retirement 2040 |
0.05 | 0.05 | 0.30 | 0.15 | 0.05 | |||||||||||||||
| AllianzGI Retirement 2045 |
0.05 | 0.05 | 0.30 | 0.15 | 0.05 | |||||||||||||||
| AllianzGI Retirement 2050 |
0.05 | 0.05 | 0.30 | 0.15 | 0.05 | |||||||||||||||
| AllianzGI Retirement 2055 |
0.05 | 0.05 | 0.30 | 0.15 | 0.05 | |||||||||||||||
| AllianzGI Retirement Income |
0.05 | 0.05 | 0.30 | 0.15 | 0.05 | |||||||||||||||
| AllianzGI Global Allocation |
0.85 | 0.15 | N/A | N/A | N/A | |||||||||||||||
| AllianzGI Global Growth Allocation |
0.85 | 0.15 | N/A | N/A | N/A | |||||||||||||||
| AllianzGI Behavioral Advantage Large Cap |
0.40 | 0.40 | N/A | N/A | N/A | |||||||||||||||
| AllianzGI Best Styles Global Equity Fund |
0.30 | 0.30 | N/A | N/A | N/A | |||||||||||||||
| AllianzGI China Equity |
1.10 | 1.10 | N/A | N/A | N/A | |||||||||||||||
| AllianzGI Convertible |
0.57 | 0.57 | N/A | N/A | N/A | |||||||||||||||
| AllianzGI Global Fundamental Strategy |
0.75 | 0.75 | N/A | N/A | N/A | |||||||||||||||
| AllianzGI Global Managed Volatility |
0.40 | 0.40 | N/A | N/A | N/A | |||||||||||||||
| AllianzGI Global Water |
0.95 | 0.95 | N/A | N/A | N/A | |||||||||||||||
| AllianzGI High Yield Bond |
0.48 | 0.48 | N/A | N/A | N/A | |||||||||||||||
| AllianzGI International Small-Cap |
1.00 | 1.00 | N/A | N/A | N/A | |||||||||||||||
| AllianzGI Micro Cap |
1.25 | 1.25 | N/A | N/A | N/A | |||||||||||||||
| AllianzGI Multi-Asset Real Return |
0.75 | 0.75 | N/A | N/A | N/A | |||||||||||||||
| 250 | May 31, 2014 | | Semiannual Report |
Table of Contents
| All Classes | Class A,C,D and R |
Class P and Administrative |
Class R6 | |||||||||||||||||
| Management Fee |
Effective Management Fee |
Administration |
||||||||||||||||||
| AllianzGI NFJ Emerging Markets Value |
1.00 | % | 1.00 | % | N/A | N/A | N/A | |||||||||||||
| AllianzGI NFJ Global Dividend Value |
0.80 | 0.80 | N/A | N/A | N/A | |||||||||||||||
| AllianzGI NFJ International Small-Cap Value |
0.95 | 0.95 | N/A | N/A | N/A | |||||||||||||||
| AllianzGI NFJ International Value II |
0.80 | 0.80 | N/A | N/A | N/A | |||||||||||||||
| AllianzGI Short Duration High Income |
0.48 | 0.48 | N/A | N/A | N/A | |||||||||||||||
| AllianzGI Structured Return |
1.25 | * | 1.25 | * | N/A | N/A | N/A | |||||||||||||
| AllianzGI Ultra Micro Cap |
1.50 | 1.50 | N/A | N/A | N/A | |||||||||||||||
| AllianzGI U.S. Equity Hedged |
0.70 | 0.70 | N/A | N/A | N/A | |||||||||||||||
| AllianzGI U.S. Small-Cap Growth |
0.90 | 0.90 | N/A | N/A | N/A | |||||||||||||||
| * | Effective July 1, 2014, the management fee rate was decreased to 0.60% (See Note 14). |
| 6. | EXPENSE LIMITATION |
The Trust and the Investment Manager have entered into Expense Limitation and Management Fee Waiver Agreements as indicated below:
| Expense Limitation | ||||||||||||||||||||||||||||||||||||||||
| Management Fee Waiver %(1) |
Class A | Class B | Class C | Class D | Class R | Class P | Class R6 | Institutional Class |
Administrative Class |
|||||||||||||||||||||||||||||||
| AllianzGI Retirement 2015(2) |
N/A | 0.97 | % | N/A | 1.72 | % | 1.07 | % | 1.32 | % | 0.67 | % | 0.57 | % | N/A | 0.92 | % | |||||||||||||||||||||||
| AllianzGI Retirement 2020(2) |
N/A | 0.99 | N/A | 1.74 | 1.09 | 1.34 | 0.69 | 0.59 | N/A | 0.94 | ||||||||||||||||||||||||||||||
| AllianzGI Retirement 2025(2) |
N/A | 1.01 | N/A | N/A | N/A | 1.36 | 0.71 | 0.61 | N/A | 0.96 | ||||||||||||||||||||||||||||||
| AllianzGI Retirement 2030(2) |
N/A | 1.03 | N/A | 1.78 | 1.13 | 1.38 | 0.73 | 0.63 | * | N/A | 0.98 | |||||||||||||||||||||||||||||
| AllianzGI Retirement 2035(2) |
N/A | 1.06 | N/A | N/A | N/A | 1.41 | 0.76 | 0.66 | * | N/A | 1.01 | |||||||||||||||||||||||||||||
| AllianzGI Retirement 2040(2) |
N/A | 1.09 | N/A | 1.84 | 1.19 | 1.44 | 0.79 | 0.69 | * | N/A | 1.04 | |||||||||||||||||||||||||||||
| AllianzGI Retirement 2045(2) |
N/A | 1.10 | N/A | N/A | N/A | 1.45 | 0.80 | 0.70 | * | N/A | 1.05 | |||||||||||||||||||||||||||||
| AllianzGI Retirement 2050(2) |
N/A | 1.10 | N/A | 1.85 | 1.20 | 1.45 | 0.80 | 0.70 | * | N/A | 1.05 | |||||||||||||||||||||||||||||
| AllianzGI Retirement 2055(2) |
N/A | 1.10 | N/A | N/A | N/A | 1.45 | 0.80 | 0.70 | * | N/A | 1.05 | |||||||||||||||||||||||||||||
| AllianzGI Retirement Income(2) |
N/A | 0.95 | N/A | 1.70 | 1.05 | 1.30 | 0.65 | 0.55 | * | N/A | 0.90 | |||||||||||||||||||||||||||||
| AllianzGI Global Allocation(3) |
0.70 | % | 0.40 | 1.11 | % | 1.13 | 0.40 | 0.56 | 0.16 | N/A | 0.16 | % | 0.41 | |||||||||||||||||||||||||||
| AllianzGI Global Growth Allocation(3) |
0.70 | 0.40 | N/A | 1.18 | 0.40 | 0.63 | 0.23 | N/A | 0.13 | 0.38 | ||||||||||||||||||||||||||||||
| Semiannual Report | | May 31, 2014 | 251 |
Table of Contents
Notes to Financial Statements (cont’d)
May 31, 2014 (Unaudited)
| Expense Limitation | ||||||||||||||||||||||||||||||||||||||||
| Management Fee Waiver %(1) |
Class A | Class B | Class C | Class D | Class R | Class P | Class R6 | Institutional Class |
Administrative Class |
|||||||||||||||||||||||||||||||
| AllianzGI Behavioral Advantage Large Cap(4) |
N/A | 0.81 | % | N/A | 1.57 | % | 0.81 | % | N/A | 0.65 | % | N/A | 0.55 | % | N/A | |||||||||||||||||||||||||
| AllianzGI Best Styles Global Equity(6) |
N/A | N/A | N/A | N/A | N/A | N/A | N/A | 0.40 | % | N/A | N/A | |||||||||||||||||||||||||||||
| AllianzGI China Equity(4) |
N/A | 1.70 | N/A | 2.45 | 1.77 | N/A | 1.51 | N/A | 1.45 | N/A | ||||||||||||||||||||||||||||||
| AllianzGI Convertible |
N/A | N/A | N/A | N/A | N/A | N/A | N/A | N/A | N/A | N/A | ||||||||||||||||||||||||||||||
| AllianzGI Global Fundamental Strategy(4) |
N/A | 1.25 | N/A | 2.00 | 1.25 | N/A | 1.10 | N/A | 1.00 | N/A | ||||||||||||||||||||||||||||||
| AllianzGI Global Managed Volatility(4) |
N/A | 0.94 | N/A | 1.62 | 0.94 | N/A | 0.69 | N/A | 0.60 | N/A | ||||||||||||||||||||||||||||||
| AllianzGI Global Water |
N/A | N/A | N/A | N/A | N/A | N/A | N/A | N/A | N/A | N/A | ||||||||||||||||||||||||||||||
| AllianzGI High Yield Bond |
N/A | N/A | N/A | N/A | N/A | N/A | N/A | N/A | N/A | N/A | ||||||||||||||||||||||||||||||
| AllianzGI International Small-Cap(4) |
N/A | 1.45 | N/A | 2.19 | 1.45 | 1.70 | % | 1.28 | N/A | 1.21 | N/A | |||||||||||||||||||||||||||||
| AllianzGI Micro Cap(4) |
N/A | 1.62 | N/A | N/A | N/A | N/A | 1.44 | N/A | 1.54 | N/A | ||||||||||||||||||||||||||||||
| AllianzGI Multi-Asset Real Return(7) |
N/A | 0.85 | N/A | 1.60 | 0.85 | N/A | 0.70 | N/A | 0.60 | N/A | ||||||||||||||||||||||||||||||
| AllianzGI NFJ Emerging Markets Value(4) |
N/A | 1.55 | N/A | 2.30 | 1.55 | N/A | 1.39 | N/A | 1.30 | N/A | ||||||||||||||||||||||||||||||
| AllianzGI NFJ Global Dividend Value(4) |
N/A | 1.20 | N/A | 1.99 | 1.28 | N/A | 1.04 | N/A | 0.95 | N/A | ||||||||||||||||||||||||||||||
| AllianzGI NFJ International Small-Cap Value(4) |
N/A | 1.45 | N/A | 2.20 | 1.45 | N/A | 1.30 | N/A | 1.20 | N/A | ||||||||||||||||||||||||||||||
| AllianzGI NFJ International Value II(4) |
N/A | 1.20 | N/A | 1.95 | 1.20 | N/A | 1.00 | N/A | 0.95 | N/A | ||||||||||||||||||||||||||||||
| AllianzGI Short Duration High Income(4) |
N/A | 0.85 | N/A | 1.10 | 0.85 | N/A | 0.70 | N/A | 0.61 | N/A | ||||||||||||||||||||||||||||||
| AllianzGI Structured Return(5) |
N/A | 1.90 | N/A | 2.65 | 1.90 | N/A | 1.75 | N/A | 1.65 | N/A | ||||||||||||||||||||||||||||||
| AllianzGI Ultra Micro Cap |
N/A | N/A | N/A | N/A | N/A | N/A | N/A | N/A | N/A | N/A | ||||||||||||||||||||||||||||||
| AllianzGI U.S. Equity Hedged(4) |
N/A | 1.25 | N/A | 2.00 | 1.25 | N/A | 1.10 | N/A | 1.00 | N/A | ||||||||||||||||||||||||||||||
| AllianzGI U.S. Small-Cap Growth(4) |
N/A | 1.40 | N/A | 2.20 | 1.42 | 1.65 | 1.25 | N/A | 1.16 | N/A | ||||||||||||||||||||||||||||||
| (1) | The Investment Manager has contractually agreed to irrevocably waive a portion of its management fee with respect to the noted Funds. The waiver is calculated on the average daily net assets of each applicable Fund that are attributable to investments in either Underlying Funds or Other Acquired Funds based on the rates disclosed in the above table. This waiver with respect to investments in Underlying Funds and Other Acquired Funds for which the Investment Manager or an affiliated person thereof serves as investment adviser is terminable only by the Board of Trustees of the Trust, and the waiver with respect to investments in unaffiliated Other Acquired Funds will continue through at least March 31, 2015. This waiver does not apply to net assets of the Fund not invested in shares of Underlying Funds or Other Acquired Funds (e.g., direct investments in other securities and instruments). |
| (2) | The Investment Manager has contractually agreed, until March 31, 2015, to irrevocably waive its management and administrative fees and reimburse any additional other expenses or acquired fund fees and expenses, to the extent that Total Annual Fund Operating Expenses after Expense Reductions, excluding, interest, taxes, and extraordinary expenses, exceed the rates noted in the table above based on the Fund’s average net assets attributable to each share class. Under the Expense Limitation Agreement, the Investment Manager may recoup waived or reimbursed amounts for three years, provided total expenses, including such recoupment, do not exceed the annual expense limit. The Expense Limitation Agreement is terminable by the Trust upon 90 days’ prior written notice to the Investment Manager or at any time by mutual agreement of the parties. |
| (3) | Effective April 1, 2014, the Investment Manager has contractually agreed, until March 31, 2015, to irrevocably waive its management fee and/or reimburse the Fund, to the extent that, after the application of the fee waiver described in footnote (1) above, Total Annual Fund Operating Expenses, excluding interest, taxes, and extraordinary expenses, acquired fund expenses and certain credits and other expenses, exceed the rates noted in the table above based on the Fund’s average net assets attributable to each share class. Under the Expense Limitation Agreement, the Investment Manager may recoup waived or reimbursed amounts for three years, provided total expenses, including such recoupment, do not exceed the annual expense limit. The Expense Limitation Agreement is terminable by the Trust upon 90 days’ prior written notice to the Investment Manager or at any time by mutual agreement of the parties. |
| (4) | Effective April 1, 2014, the Investment Manager has contractually agreed, until March 31, 2015, to irrevocably waive its management fee and/or reimburse the Fund, to the extent that, Total Annual Fund Operating Expenses, excluding interest, taxes, and extraordinary expenses, and certain credits and other expenses, exceed the rates noted in the table above based upon the Fund’s average net assets attributable to each share class. Under the Expense Limitation Agreement, the Investment Manager may recoup waived or reimbursed amounts for three years, provided total expenses, including such recoupment, do not exceed the annual expense limit. The Expense Limitation Agreement is terminable by the Trust upon 90 days’ prior written notice to the Investment Manager or at any time by mutual agreement of the parties. |
| (5) | Effective April 1, 2014, the Investment Manager had contractually agreed, until March 31, 2015, to irrevocably waive its management fee and/or reimburse the Fund, to the extent that, Total Annual Fund Operating Expenses, excluding interest, taxes, and extraordinary expenses, and certain credits and other expenses, exceed the rates noted in the table above based upon the Fund’s average net assets attributable to each share class. Effective July 1, 2014, the Investment Manager has contractually agreed, until July 31, 2015, to waive its management fee and/or reimburse the Fund to the extent that Total Annual Fund Operating Expenses, excluding interest, taxes, extraordinary expenses, and certain credits and other expenses, exceed 1.15% for Class A shares, 1.90% for Class C shares, 1.15% for Class D shares, 1.00% for Class P shares and 0.90% for Institutional Class shares. Under the Expense Limitation Agreement, the Investment Manager may recoup waived or reimbursed amounts for three years, provided total expenses, including such recoupment, do not exceed the annual expense limit. (See Note 14) The Expense Limitation Agreement is terminable by the Trust upon 90 days’ prior written notice to the Investment Manager or at any time by mutual agreement of the parties. |
| (6) | The Investment Manager has contractually agreed, until March 31, 2015, to irrevocably waive its management fee and/or reimburse the Fund, to the extent that, Total Annual Fund Operating Expenses, including payment of organizational expenses, but excluding interest, taxes, and extraordinary expenses, and certain credits and other expenses, exceed the rates noted in the table above based upon the Fund’s average net assets attributable to each share class. Under the Expense Limitation Agreement, the Investment Manager may recoup waived or reimbursed amounts for three years, provided total expenses, including such recoupment, do not exceed the annual expense limit. The Expense Limitation Agreement is terminable by the Trust upon 90 days’ prior written notice to the Investment Manager or at any time by mutual agreement of the parties. |
| (7) | The Investment Manager has contractually agreed, until March 31, 2015, to irrevocably waive its management fee and/or reimburse the Fund, to the extent that, Total Annual Fund Operating Expenses, excluding interest, taxes, and extraordinary expenses, acquired fund expenses, and certain credits and other expenses, exceed the rates noted in the table above based upon the Fund’s average net assets attributable to each share class. Under the Expense Limitation Agreement, the Investment Manager may recoup waived or reimbursed amounts for three years, provided total expenses, including such recoupment, do not exceed the annual expense limit. The Expense Limitation Agreement is terminable by the Trust upon 90 days’ prior written notice to the Investment Manager or at any time by mutual agreement of the parties. |
| * | As a result of reimbursing expenses inclusive of acquired fund expenses, the Investment Manager reimbursed amounts in excess of the respective share class’ operating expenses. The aggregate excess reimbursement is accounted for as “Contribution from Investment Manager” on the Statements of Operations. |
| 252 | May 31, 2014 | | Semiannual Report |
Table of Contents
The Investment Manager, as per expense limitation agreements, may recoup waived/reimbursed amounts for a period of up to three years, provided total expenses, including such recoupment, do not exceed the annual expense limit. During the six months ended May 31, 2014, the Investment Manager recouped a total of $242,003 from the Funds as disclosed on the Statements of Operations. The following represents the amounts that still can be recouped by the Investment Manager as of May 31, 2014.
| Unrecouped Expenses Waived/Reimbursed through Year ended November 30, |
||||||||||||||||
| 2011 | 2012 | 2013 | Total | |||||||||||||
| AllianzGI Retirement 2015 |
$ | 115,844 | $ | 18,532 | $ | 30,313 | $ | 164,689 | ||||||||
| AllianzGI Retirement 2020 |
111,506 | 14,067 | 41,366 | 166,939 | ||||||||||||
| AllianzGI Retirement 2025 |
— | 7,439 | 40,739 | 48,178 | ||||||||||||
| AllianzGI Retirement 2030 |
114,098 | 30,870 | 64,152 | 209,120 | ||||||||||||
| AllianzGI Retirement 2035 |
— | 10,573 | 39,569 | 50,142 | ||||||||||||
| AllianzGI Retirement 2040 |
117,868 | 20,733 | 40,074 | 178,675 | ||||||||||||
| AllianzGI Retirement 2045 |
— | 9,262 | 21,258 | 30,520 | ||||||||||||
| AllianzGI Retirement 2050 |
114,967 | 19,237 | 24,243 | 158,447 | ||||||||||||
| AllianzGI Retirement 2055 |
— | 8,988 | 9,226 | 18,214 | ||||||||||||
| AllianzGI Retirement Income |
113,571 | 35,421 | 45,280 | 194,272 | ||||||||||||
| AllianzGI Global Allocation |
467,765 | 529,000 | 529,090 | 1,525,855 | ||||||||||||
| AllianzGI Global Growth Allocation |
207,323 | 211,891 | 215,351 | 634,565 | ||||||||||||
| AllianzGI Behavioral Advantage Large Cap |
132,104 | 235,009 | 179,849 | 546,962 | ||||||||||||
| AllianzGI Best Styles Global Equity |
— | — | — | — | ||||||||||||
| AllianzGI China Equity |
211,250 | 217,554 | 198,512 | 627,316 | ||||||||||||
| AllianzGI Convertible |
— | — | — | — | ||||||||||||
| AllianzGI Global Fundamental Strategy |
— | — | 172,001 | 172,001 | ||||||||||||
| AllianzGI Global Managed Volatility |
— | 286,597 | 263,268 | 549,865 | ||||||||||||
| AllianzGI Global Water |
— | 7,801 | — | 7,801 | ||||||||||||
| AllianzGI High Yield Bond |
143,147 | 10,221 | 16,069 | 169,437 | ||||||||||||
| AllianzGI International Small-Cap |
210,861 | 266,569 | 259,712 | 737,142 | ||||||||||||
| AllianzGI Micro Cap |
64,375 | 131,890 | 162,476 | 358,741 | ||||||||||||
| AllianzGI Multi-Asset Real Return |
— | — | 366,103 | 366,103 | ||||||||||||
| AllianzGI NFJ Emerging Markets Value |
— | — | 385,249 | 385,249 | ||||||||||||
| AllianzGI NFJ Global Dividend Value |
162,039 | 171,065 | 175,973 | 509,077 | ||||||||||||
| AllianzGI NFJ International Small-Cap Value |
— | 175,822 | 311,827 | 487,649 | ||||||||||||
| AllianzGI NFJ International Value II |
— | 302,633 | 242,764 | 545,397 | ||||||||||||
| AllianzGI Short Duration High Income |
51,803 | 149,011 | 149,472 | 350,286 | ||||||||||||
| AllianzGI Structured Return |
— | — | 317,508 | 317,508 | ||||||||||||
| AllianzGI Ultra Micro Cap |
1,323 | 119,979 | 266 | 121,568 | ||||||||||||
| AllianzGI U.S. Equity Hedged |
— | — | 375,759 | 375,759 | ||||||||||||
| AllianzGI U.S. Small-Cap Growth |
177,572 | 197,501 | 158,039 | 533,112 | ||||||||||||
| Semiannual Report | | May 31, 2014 | 253 |
Table of Contents
Notes to Financial Statements (cont’d)
May 31, 2014 (Unaudited)
(b) Futures contracts outstanding at May 31, 2014:
| AllianzGI Best Styles Global Equity: | ||||||||||||||||
| Type | Contracts | Market Value (000s) |
Expiration Date |
Unrealized Appreciation (Depreciation) |
||||||||||||
| Long: E-mini S&P 500 Index |
7 | $ | 673 | 6/20/14 | $ | 21,746 | ||||||||||
| Euro STOXX 50 Index |
4 | 177 | 6/20/14 | 8,784 | ||||||||||||
| FTSE 100 Index |
1 | 114 | 6/20/14 | 4,649 | ||||||||||||
| Mini MSCI Emerging Markets Index |
2 | 102 | 6/20/14 | 3,914 | ||||||||||||
| TOPIX Index |
1 | 118 | 6/12/14 | (647 | ) | |||||||||||
| $ | 38,446 | |||||||||||||||
| AllianzGI Global Fundamental Strategy: | ||||||||||||||||
| Type | Contracts | Market Value (000s) |
Expiration Date |
Unrealized Depreciation |
||||||||||||
| Short: 10-Year U.S. Treasury Note Futures |
(3 | ) | $ | (376 | ) | 9/19/14 | $ | (2,115 | ) | |||||||
| E-mini S&P 500 Index |
(3 | ) | (288 | ) | 6/20/14 | (14,895 | ) | |||||||||
| Euro STOXX 50 Index |
(10 | ) | (442 | ) | 6/20/14 | (27,828 | ) | |||||||||
| $ | (44,838 | ) | ||||||||||||||
| 254 | May 31, 2014 | | Semiannual Report |
Table of Contents
| AllianzGI Multi-Asset Real Return: | ||||||||||||||||
| Type | Contracts | Market Value (000s) |
Expiration Date |
Unrealized Appreciation (Depreciation) |
||||||||||||
| Long: Dow Jones U.S. Real Estate Index |
1 | $ | 28 | 6/20/14 | $ | 497 | ||||||||||
| Euro-Bund 10-Year Bond |
1 | 171 | 6/6/14 | 7,618 | ||||||||||||
| Mini MSCI Emerging Markets Index |
2 | 102 | 6/20/14 | 7,994 | ||||||||||||
| Short: 10-Year U.S. Treasury Note Futures |
(7 | ) | (879 | ) | 9/19/14 | (3,678 | ) | |||||||||
| $ | 12,431 | |||||||||||||||
(c) Forward foreign currency contracts outstanding at May 31, 2014:
| AllianzGI Global Fundamental Strategy: | ||||||||||||||||
| Counterparty | U.S.$ Value on Origination Date |
U.S.$ Value May 31, 2014 |
Unrealized Appreciation (Depreciation) |
|||||||||||||
| Purchased: |
||||||||||||||||
| 400,000 Euro settling 8/29/14 |
State Street Bank | $ | 545,180 | $ | 545,261 | $ | 81 | |||||||||
| 28,000,000 Indian Rupee settling 4/6/15 |
State Street Bank | 433,996 | 443,075 | 9,079 | ||||||||||||
| Sold: |
||||||||||||||||
| 250,000 British Pound settling 8/29/14 |
State Street Bank | 420,668 | 418,768 | 1,900 | ||||||||||||
| 500,000 Euro settling 8/29/14 |
State Street Bank | 681,373 | 681,576 | (203 | ) | |||||||||||
| 1,000,000 Euro settling 8/29/14 |
State Street Bank | 1,364,123 | 1,363,152 | 971 | ||||||||||||
| 487,994 Swiss Franc settling 8/29/14 |
State Street Bank | 545,180 | 545,441 | (261 | ) | |||||||||||
| $ | 11,567 | |||||||||||||||
At May 31, 2014, AllianzGI Best Styles Global Equity, AllianzGI Global Fundamental Strategy, AllianzGI Multi-Asset Real Return, AllianzGI Structured Return and AllianzGI U.S. Equity Hedged pledged $587,206, $116,897, $11,509, $164,030 and $2,773, respectively, in cash as collateral for derivatives.
Glossary:
FTSE— Financial Times Stock Exchange
MSCI— Morgan Stanley Capital International
TOPIX—Tokyo Stock Price Index
| 8. | INCOME TAX INFORMATION |
At May 31, 2014, the aggregate cost basis and the net unrealized appreciation (depreciation) of investments (before options written) for federal income tax purposes were:
| Federal Tax Cost Basis |
Unrealized Appreciation |
Unrealized Depreciation |
Net Unrealized Appreciation (Depreciation) |
|||||||||||||
| AllianzGI Retirement 2015 |
$ | 27,129,337 | $ | 1,678,203 | $ | 12,131 | $ | 1,666,072 | ||||||||
| AllianzGI Retirement 2020 |
47,621,651 | 2,556,084 | 30,610 | 2,525,474 | ||||||||||||
| AllianzGI Retirement 2025 |
54,867,414 | 2,805,216 | 35,825 | 2,769,391 | ||||||||||||
| AllianzGI Retirement 2030 |
56,124,424 | 3,923,728 | 43,806 | 3,879,922 | ||||||||||||
| AllianzGI Retirement 2035 |
46,490,596 | 3,219,311 | 25,608 | 3,193,703 | ||||||||||||
| AllianzGI Retirement 2040 |
38,889,271 | 3,551,253 | 3,056 | 3,548,197 | ||||||||||||
| AllianzGI Retirement 2045 |
22,708,719 | 2,085,583 | 1,982 | 2,083,601 | ||||||||||||
| AllianzGI Retirement 2050 |
17,854,049 | 2,204,703 | 227 | 2,204,476 | ||||||||||||
| AllianzGI Retirement 2055 |
5,815,619 | 837,235 | 97 | 837,138 | ||||||||||||
| AllianzGI Retirement Income |
28,853,606 | 1,811,919 | 15,161 | 1,796,758 | ||||||||||||
| AllianzGI Global Allocation |
191,408,477 | 27,228,002 | 29,623 | 27,198,379 | ||||||||||||
| AllianzGI Global Growth Allocation |
5,542,038 | 1,023,422 | — | 1,023,422 | ||||||||||||
| Semiannual Report | | May 31, 2014 | 255 |
Table of Contents
Notes to Financial Statements (cont’d)
May 31, 2014 (Unaudited)
| Federal Tax Cost Basis |
Unrealized Appreciation |
Unrealized Depreciation |
Net Unrealized Appreciation (Depreciation) |
|||||||||||||
| AllianzGI Behavioral Advantage Large Cap |
$ | 71,790,971 | $ | 10,122,617 | $ | 590,546 | $ | 9,532,071 | ||||||||
| AllianzGI Best Styles Global Equity Fund |
34,132,276 | 2,415,681 | 518,075 | 1,897,606 | ||||||||||||
| AllianzGI China Equity |
3,996,128 | 413,303 | 393,734 | 19,569 | ||||||||||||
| AllianzGI Convertible |
2,251,853,235 | 378,978,888 | 13,391,704 | 365,587,184 | ||||||||||||
| AllianzGI Global Fundamental Strategy |
24,069,137 | 1,308,268 | 205,654 | 1,102,614 | ||||||||||||
| AllianzGI Global Managed Volatility |
16,439,516 | 1,748,125 | 198,531 | 1,549,594 | ||||||||||||
| AllianzGI Global Water |
274,914,387 | 54,018,944 | 1,261,278 | 52,757,666 | ||||||||||||
| AllianzGI High Yield Bond |
441,902,185 | 21,832,710 | 2,644,138 | 19,188,572 | ||||||||||||
| AllianzGI International Small-Cap |
90,088,579 | 21,095,526 | 2,555,800 | 18,539,726 | ||||||||||||
| AllianzGI Micro Cap |
27,869,841 | 14,852,953 | 1,216,878 | 13,636,075 | ||||||||||||
| AllianzGI Multi-Asset Real Return |
5,710,848 | 551,328 | 109,975 | 441,353 | ||||||||||||
| AllianzGI NFJ Emerging Markets Value |
9,218,593 | 679,484 | 392,563 | 286,921 | ||||||||||||
| AllianzGI NFJ Global Dividend Value |
66,811,260 | 11,047,188 | 3,928,720 | 7,118,468 | ||||||||||||
| AllianzGI NFJ International Small-Cap Value |
19,101,774 | 2,970,480 | 629,473 | 2,341,007 | ||||||||||||
| AllianzGI NFJ International Value II |
31,992,583 | 2,436,474 | 348,478 | 2,087,996 | ||||||||||||
| AllianzGI Short Duration High Income |
723,751,658 | 4,408,547 | 2,331,848 | 2,076,699 | ||||||||||||
| AllianzGI Structured Return |
16,806,437 | 1,693 | 131,837 | (130,144 | ) | |||||||||||
| AllianzGI Ultra Micro Cap |
107,639,778 | 29,656,908 | 3,846,257 | 25,810,651 | ||||||||||||
| AllianzGI U.S. Equity Hedged |
6,389,347 | 1,521,101 | 130,710 | 1,390,391 | ||||||||||||
| AllianzGI U.S. Small-Cap Growth |
26,129,546 | 10,446,868 | 825,822 | 9,621,046 | ||||||||||||
Differences, if any, between book and tax cost basis were attributable to wash sale loss deferrals and the differing treatment of bond premium amortization.
| 256 | May 31, 2014 | | Semiannual Report |
Table of Contents
(THIS PAGE INTENTIONALLY LEFT BLANK)
| Semiannual Report | | May 31, 2014 | 257 |
Table of Contents
Notes to Financial Statements (cont’d)
May 31, 2014 (Unaudited)
| 9. | SHARES OF BENEFICIAL INTEREST |
The Trust may issue an unlimited number of shares of beneficial interest with $0.0001 par value. Changes in shares of beneficial interest were as follows:
| AllianzGI Retirement 2015 | AllianzGI Retirement 2020 | |||||||||||||||||||||||||||||||
| Six Months ended (unaudited) |
Year ended November 30, 2013 |
Six Months ended (unaudited) |
Year ended |
|||||||||||||||||||||||||||||
| Shares | Amount | Shares | Amount | Shares | Amount | Shares | Amount | |||||||||||||||||||||||||
| Shares sold: |
||||||||||||||||||||||||||||||||
| Class A |
313,643 | $ | 6,115,466 | 339,353 | $ | 6,590,045 | 601,099 | $ | 11,585,314 | 603,165 | $ | 11,502,340 | ||||||||||||||||||||
| Class C |
11,787 | 229,335 | 9,440 | 180,334 | 902 | 17,337 | 14,893 | 283,810 | ||||||||||||||||||||||||
| Class D |
— | — | 5,336 | 103,137 | 2,880 | 56,443 | 4,872 | 91,607 | ||||||||||||||||||||||||
| Class R |
540 | 10,585 | 2,422 | 46,614 | 3,109 | 60,055 | 5,741 | 108,954 | ||||||||||||||||||||||||
| Class P |
160,610 | 3,100,289 | 72,831 | 1,426,157 | 299,250 | 5,716,849 | 309,334 | 5,912,317 | ||||||||||||||||||||||||
| Class R6 |
287,897 | 5,672,718 | 72,899 | 1,421,553 | 126,881 | 2,470,269 | 62,648 | 1,201,673 | ||||||||||||||||||||||||
| Administrative Class |
9,996 | 195,627 | 236,281 | 4,647,163 | 20,574 | 398,581 | 457,658 | 8,868,219 | ||||||||||||||||||||||||
| Issued in reinvestment of dividends and distributions: |
|
|||||||||||||||||||||||||||||||
| Class A |
10,510 | 201,688 | 7,679 | 146,212 | 19,810 | 376,585 | 12,660 | 236,750 | ||||||||||||||||||||||||
| Class C |
736 | 14,041 | 1,957 | 36,887 | 225 | 4,276 | 194 | 3,612 | ||||||||||||||||||||||||
| Class D |
120 | 2,326 | 1,909 | 36,338 | 262 | 5,007 | 358 | 6,724 | ||||||||||||||||||||||||
| Class R |
76 | 1,463 | 691 | 13,152 | 772 | 14,703 | 1,332 | 24,921 | ||||||||||||||||||||||||
| Class P |
4,380 | 84,782 | 5,757 | 110,299 | 8,058 | 154,714 | 7,232 | 136,329 | ||||||||||||||||||||||||
| Class R6 |
9,220 | 178,596 | 11,467 | 219,816 | 8,358 | 160,647 | 10,236 | 193,174 | ||||||||||||||||||||||||
| Administrative Class |
3,808 | 73,602 | 21 | 397 | 7,237 | 138,300 | 240 | 4,513 | ||||||||||||||||||||||||
| Cost of shares redeemed: |
||||||||||||||||||||||||||||||||
| Class A |
(114,309 | ) | (2,221,842 | ) | (188,595 | ) | (3,639,746 | ) | (91,298 | ) | (1,752,217 | ) | (196,186 | ) | (3,738,689 | ) | ||||||||||||||||
| Class C |
(14,110 | ) | (271,061 | ) | (43,276 | ) | (822,629 | ) | (904 | ) | (17,286 | ) | (11,623 | ) | (219,671 | ) | ||||||||||||||||
| Class D |
(4,309 | ) | (84,800 | ) | (63,597 | ) | (1,225,620 | ) | (1,208 | ) | (23,241 | ) | (2,636 | ) | (50,334 | ) | ||||||||||||||||
| Class R |
(2,294 | ) | (44,557 | ) | (15,487 | ) | (301,376 | ) | (1,892 | ) | (35,804 | ) | (3,012 | ) | (56,238 | ) | ||||||||||||||||
| Class P |
(137,917 | ) | (2,705,973 | ) | (75,304 | ) | (1,455,480 | ) | (55,099 | ) | (1,079,542 | ) | (201,003 | ) | (3,841,134 | ) | ||||||||||||||||
| Class R6 |
(191,192 | ) | (3,814,089 | ) | (115,021 | ) | (2,243,140 | ) | (100,083 | ) | (1,953,776 | ) | (90,749 | ) | (1,746,394 | ) | ||||||||||||||||
| Administrative Class |
(21,841 | ) | (430,956 | ) | (51,879 | ) | (1,007,395 | ) | (33,220 | ) | (647,521 | ) | (87,446 | ) | (1,677,656 | ) | ||||||||||||||||
| Net increase resulting from Fund share transactions |
327,351 | $ | 6,307,240 | 214,884 | $ | 4,282,718 | 815,713 | $ | 15,649,693 | 897,908 | $ | 17,244,827 | ||||||||||||||||||||
| 258 | May 31, 2014 | | Semiannual Report |
Table of Contents
| AllianzGI Retirement 2025 | AllianzGI Retirement 2030 | |||||||||||||||||||||||||||||
| Six Months ended May 31, 2014 (unaudited) |
Year ended November 30, 2013 |
Six Months ended May 31, 2014 (unaudited) |
Year ended November 30, 2013 |
|||||||||||||||||||||||||||
| Shares | Amount | Shares | Amount | Shares | Amount | Shares | Amount | |||||||||||||||||||||||
| 691,190 | $ | 11,668,050 | 869,581 | $ | 14,411,889 | 507,331 | $ | 10,446,264 | 436,817 | $ | 8,660,866 | |||||||||||||||||||
| — | — | — | — | 1,420 | 28,996 | 14,764 | 291,091 | |||||||||||||||||||||||
| — | — | — | — | 1,501 | 30,356 | 18,337 | 367,695 | |||||||||||||||||||||||
| 32,520 | 545,499 | 16,658 | 275,121 | 7,714 | 158,686 | 28,801 | 576,076 | |||||||||||||||||||||||
| 631,238 | 10,486,837 | 131,727 | 2,202,601 | 505,377 | 10,289,071 | 223,730 | 4,460,149 | |||||||||||||||||||||||
| 204,371 | 3,464,176 | 39,346 | 655,355 | 189,584 | 3,947,112 | 149,676 | 3,028,841 | |||||||||||||||||||||||
| 39,297 | 666,055 | 672,665 | 11,362,396 | 22,375 | 464,979 | 495,163 | 10,095,568 | |||||||||||||||||||||||
| 25,283 | 421,464 | 15,518 | 252,174 | 21,055 | 427,836 | 12,325 | 238,512 | |||||||||||||||||||||||
| — | — | — | — | 495 | 10,033 | 604 | 11,625 | |||||||||||||||||||||||
| — | — | — | — | 637 | 13,023 | 549 | 10,676 | |||||||||||||||||||||||
| 1,097 | 18,248 | 1,448 | 23,496 | 896 | 18,290 | 1,572 | 30,514 | |||||||||||||||||||||||
| 4,784 | 80,183 | 6,306 | 102,792 | 8,988 | 184,881 | 7,920 | 154,924 | |||||||||||||||||||||||
| 6,502 | 108,975 | 7,183 | 117,165 | 12,548 | 258,616 | 14,466 | 283,260 | |||||||||||||||||||||||
| 11,996 | 200,811 | 69 | 1,137 | 9,758 | 200,325 | 50 | 982 | |||||||||||||||||||||||
| (137,711 | ) | (2,336,076 | ) | (133,589 | ) | (2,215,838 | ) | (92,122 | ) | (1,883,531 | ) | (501,231 | ) | (9,937,403 | ) | |||||||||||||||
| — | — | — | — | (3,477 | ) | (71,006 | ) | (10,256 | ) | (203,117 | ) | |||||||||||||||||||
| — | — | — | — | (1,239 | ) | (25,441 | ) | (14,044 | ) | (282,332 | ) | |||||||||||||||||||
| (16,530 | ) | (276,680 | ) | (50,850 | ) | (843,426 | ) | (4,454 | ) | (90,755 | ) | (27,867 | ) | (559,660 | ) | |||||||||||||||
| (115,019 | ) | (1,954,813 | ) | (115,589 | ) | (1,929,703 | ) | (33,505 | ) | (697,722 | ) | (116,414 | ) | (2,350,577 | ) | |||||||||||||||
| (32,389 | ) | (554,608 | ) | (71,932 | ) | (1,201,089 | ) | (214,832 | ) | (4,472,902 | ) | (104,884 | ) | (2,119,284 | ) | |||||||||||||||
| (27,664 | ) | (472,752 | ) | (48,964 | ) | (810,805 | ) | (56,658 | ) | (1,184,183 | ) | (67,647 | ) | 1,366,361 | ) | |||||||||||||||
|
|
1,318,965 |
|
$ | 22,065,369 | 1,339,577 | $ | 22,403,265 | 883,392 | $ | 18,052,928 | 562,431 | $ | 11,392,045 | |||||||||||||||||
| Semiannual Report | | May 31, 2014 | 259 |
Table of Contents
Notes to Financial Statements (cont’d)
May 31, 2014 (Unaudited)
| AllianzGI Retirement 2035 | AllianzGI Retirement 2040 | |||||||||||||||||||||||||||||||
| Six Months ended May 31, 2014 (unaudited) |
Year ended November 30, 2013 |
Six Months ended May 31, 2014 (unaudited) |
Year ended November 30, 2013 |
|||||||||||||||||||||||||||||
| Shares | Amount | Shares | Amount | Shares | Amount | Shares | Amount | |||||||||||||||||||||||||
| Shares sold: |
||||||||||||||||||||||||||||||||
| Class A |
453,281 | $ | 8,173,217 | 411,160 | $ | 7,045,369 | 395,456 | $ | 8,437,950 | 265,931 | $ | 5,292,401 | ||||||||||||||||||||
| Class C |
— | — | — | — | 2,319 | 49,491 | 5,701 | 115,381 | ||||||||||||||||||||||||
| Class D |
— | — | — | — | 715 | 15,359 | 2,510 | 50,598 | ||||||||||||||||||||||||
| Class R |
4,360 | 78,550 | 8,199 | 141,502 | 7,003 | 149,406 | 13,107 | 265,360 | ||||||||||||||||||||||||
| Class P |
535,259 | 9,476,744 | 107,100 | 1,859,117 | 358,133 | 7,529,264 | 153,985 | 3,118,212 | ||||||||||||||||||||||||
| Class R6 |
138,815 | 2,535,138 | 29,687 | 516,675 | 145,624 | 3,151,000 | 117,735 | 2,407,465 | ||||||||||||||||||||||||
| Administrative Class |
29,793 | 539,558 | 624,137 | 10,953,335 | 20,116 | 430,217 | 268,154 | 5,509,615 | ||||||||||||||||||||||||
| Issued in reinvestment of dividends and distributions: |
|
|||||||||||||||||||||||||||||||
| Class A |
16,679 | 297,724 | 6,767 | 112,357 | 14,155 | 299,227 | 5,559 | 107,358 | ||||||||||||||||||||||||
| Class C |
— | — | — | — | 230 | 4,849 | 258 | 4,979 | ||||||||||||||||||||||||
| Class D |
— | — | — | — | 198 | 4,183 | 298 | 5,762 | ||||||||||||||||||||||||
| Class R |
922 | 16,445 | 1,376 | 22,802 | 978 | 20,642 | 1,195 | 23,011 | ||||||||||||||||||||||||
| Class P |
6,302 | 113,126 | 6,969 | 116,059 | 5,342 | 113,845 | 3,587 | 69,656 | ||||||||||||||||||||||||
| Class R6 |
7,644 | 137,282 | 8,659 | 144,295 | 12,292 | 262,190 | 11,830 | 230,004 | ||||||||||||||||||||||||
| Administrative Class |
12,522 | 224,389 | 83 | 1,441 | 5,479 | 116,327 | 44 | 866 | ||||||||||||||||||||||||
| Cost of shares redeemed: |
||||||||||||||||||||||||||||||||
| Class A |
(62,036 | ) | (1,120,831 | ) | (40,516 | ) | (704,143 | ) | (69,061 | ) | (1,478,109 | ) | (111,633 | ) | (2,233,984 | ) | ||||||||||||||||
| Class C |
— | — | — | — | (662 | ) | (13,901 | ) | (1,010 | ) | (20,868 | ) | ||||||||||||||||||||
| Class D |
— | — | — | — | (2,172 | ) | (46,564 | ) | (4,608 | ) | (92,574 | ) | ||||||||||||||||||||
| Class R |
(2,345 | ) | (42,562 | ) | (9,070 | ) | (155,978 | ) | (1,752 | ) | (37,701 | ) | (2,746 | ) | (55,701 | ) | ||||||||||||||||
| Class P |
(67,001 | ) | (1,211,792 | ) | (61,753 | ) | (1,071,313 | ) | (43,742 | ) | (945,166 | ) | (58,310 | ) | (1,208,528 | ) | ||||||||||||||||
| Class R6 |
(16,014 | ) | (287,762 | ) | (19,236 | ) | (334,449 | ) | (164,128 | ) | (3,559,940 | ) | (63,127 | ) | (1,309,076 | ) | ||||||||||||||||
| Administrative Class |
(21,257 | ) | (385,295 | ) | (50,437 | ) | (882,821 | ) | (21,196 | ) | (451,380 | ) | (34,293 | ) | (714,490 | ) | ||||||||||||||||
| Net increase resulting from Fund share transactions |
1,036,924 | $ | 18,543,931 | 1,023,125 | $ | 17,764,248 | 665,327 | $ | 14,051,189 | 574,167 | $ | 11,565,447 | ||||||||||||||||||||
| 260 | May 31, 2014 | | Semiannual Report |
Table of Contents
| AllianzGI Retirement 2045 |
AllianzGI Retirement 2050 | |||||||||||||||||||||||||||||
| Six Months ended May 31, 2014 (unaudited) |
Year ended November 30, 2013 |
Six Months ended May 31, 2014 (unaudited) |
Year ended November 30, 2013 |
|||||||||||||||||||||||||||
| Shares | Amount | Shares | Amount | Shares | Amount | Shares | Amount | |||||||||||||||||||||||
| 225,987 | $ | 4,200,471 | 242,384 | $ | 4,226,932 | 109,419 | $ | 2,344,511 | 30,447 | $ | 610,616 | |||||||||||||||||||
| — | — | — | — | 479 | 10,119 | 2,441 | 50,382 | |||||||||||||||||||||||
| — | — | — | — | 1,266 | 27,166 | 6,501 | 131,630 | |||||||||||||||||||||||
| 2,246 | 41,691 | 4,475 | 78,591 | 2,320 | 49,640 | 7,563 | 151,084 | |||||||||||||||||||||||
| 344,556 | 6,262,649 | 58,550 | 1,030,558 | 190,685 | 4,024,716 | 36,217 | 734,226 | |||||||||||||||||||||||
| 43,334 | 810,532 | 22,228 | 394,677 | 74,049 | 1,598,956 | 128,943 | 2,638,528 | |||||||||||||||||||||||
| 10,537 | 196,718 | 88,050 | 1,560,963 | 5,926 | 127,584 | 57,615 | 1,183,558 | |||||||||||||||||||||||
| 9,861 | 181,542 | 4,486 | 74,602 | 3,210 | 68,062 | 980 | 18,646 | |||||||||||||||||||||||
| — | — | — | — | 119 | 2,510 | 79 | 1,486 | |||||||||||||||||||||||
| — | — | — | — | 392 | 8,335 | 347 | 6,607 | |||||||||||||||||||||||
| 377 | 6,943 | 557 | 9,250 | 500 | 10,614 | 660 | 12,530 | |||||||||||||||||||||||
| 3,077 | 56,921 | 3,149 | 52,530 | 1,750 | 37,456 | 1,415 | 27,124 | |||||||||||||||||||||||
| 6,249 | 115,794 | 7,280 | 121,489 | 11,459 | 245,688 | 12,077 | 231,563 | |||||||||||||||||||||||
| 1,984 | 36,633 | 38 | 651 | 1,445 | 30,843 | 33 | 629 | |||||||||||||||||||||||
| (36,284 | ) | (677,106 | ) | (19,411 | ) | (352,039 | ) | (5,212 | ) | (110,729 | ) | (54,766 | ) | (1,068,408 | ) | |||||||||||||||
| — | — | — | — | — | — | (40 | ) | (797 | ) | |||||||||||||||||||||
| — | — | — | — | (4,258 | ) | (92,429 | ) | (1,779 | ) | (35,285 | ) | |||||||||||||||||||
| (220 | ) | (4,163 | ) | (3,130 | ) | (55,001 | ) | (110 | ) | (2,379 | ) | (3,520 | ) | (71,730 | ) | |||||||||||||||
| (14,524 | ) | (271,731 | ) | (32,773 | ) | (581,041 | ) | (18,448 | ) | (399,250 | ) | (12,223 | ) | (247,808 | ) | |||||||||||||||
| (2,970 | ) | (55,219 | ) | (4,148 | ) | (75,514 | ) | (92,473 | ) | (2,011,594 | ) | (58,360 | ) | (1,213,335 | ) | |||||||||||||||
| (7,394 | ) | (138,772 | ) | (6,376 | ) | (115,274 | ) | (4,596 | ) | (97,615 | ) | (3,472 | ) | (72,436 | ) | |||||||||||||||
| 586,816 | $ | 10,762,903 | 365,359 | $ | 6,371,374 | 277,922 | $ | 5,872,204 | 151,158 | $ | 3,088,810 | |||||||||||||||||||
| Semiannual Report | | May 31, 2014 | 261 |
Table of Contents
Notes to Financial Statements (cont’d)
May 31, 2014 (Unaudited)
| AllianzGI Retirement 2055 | AllianzGI Retirement Income | |||||||||||||||||||||||||||||||
| Six Months ended May 31, 2014 (unaudited) |
Year ended November 30, 2013 |
Six Months ended May 31, 2014 (unaudited) |
Year ended November 30, 2013 |
|||||||||||||||||||||||||||||
| Shares | Amount | Shares | Amount | Shares | Amount | Shares | Amount | |||||||||||||||||||||||||
| Shares sold: |
||||||||||||||||||||||||||||||||
| Class A |
34,988 | $ | 643,494 | 7,089 | $ | 123,004 | 156,915 | $ | 2,973,471 | 76,446 | $ | 1,456,041 | ||||||||||||||||||||
| Class B |
— | — | — | — | — | — | — | — | ||||||||||||||||||||||||
| Class C |
— | — | — | — | 19,602 | 371,642 | 30,550 | 575,686 | ||||||||||||||||||||||||
| Class D |
— | — | — | — | 2,870 | 55,356 | 31,610 | 606,234 | ||||||||||||||||||||||||
| Class R |
1,852 | 33,996 | 1,870 | 32,596 | 3,166 | 62,319 | 1,521 | 29,649 | ||||||||||||||||||||||||
| Class P |
39,948 | 724,041 | 10,234 | 178,050 | 251,703 | 4,798,349 | 168,171 | 3,226,547 | ||||||||||||||||||||||||
| Institutional Class |
— | — | — | — | — | — | — | — | ||||||||||||||||||||||||
| Class R6 |
3,737 | 69,090 | 20,476 | 363,504 | 80,729 | 1,527,579 | 85,636 | 1,611,604 | ||||||||||||||||||||||||
| Administrative Class |
3,535 | 64,949 | 11,999 | 211,301 | 7,110 | 137,473 | 141,253 | 2,741,571 | ||||||||||||||||||||||||
| Issued in reinvestment of dividends and distributions: |
||||||||||||||||||||||||||||||||
| Class A |
899 | 16,284 | 79 | 1,290 | 2,282 | 43,360 | 10,998 | 207,020 | ||||||||||||||||||||||||
| Class B |
— | — | — | — | — | — | — | — | ||||||||||||||||||||||||
| Class C |
— | — | — | — | 751 | 14,168 | 10,949 | 204,425 | ||||||||||||||||||||||||
| Class D |
— | — | — | — | 338 | 6,462 | 3,276 | 61,972 | ||||||||||||||||||||||||
| Class R |
111 | 2,005 | 124 | 2,031 | 37 | 716 | 237 | 4,597 | ||||||||||||||||||||||||
| Class P |
419 | 7,625 | 202 | 3,316 | 3,259 | 62,745 | 12,790 | 243,413 | ||||||||||||||||||||||||
| Institutional Class |
— | — | — | — | — | — | — | — | ||||||||||||||||||||||||
| Class R6 |
7,562 | 137,930 | 11,280 | 184,908 | 4,492 | 84,779 | 24,141 | 451,103 | ||||||||||||||||||||||||
| Administrative Class |
377 | 6,840 | 39 | 636 | 806 | 15,482 | 1,624 | 30,372 | ||||||||||||||||||||||||
| Cost of shares redeemed: |
||||||||||||||||||||||||||||||||
| Class A |
(9,827 | ) | (178,197 | ) | (569 | ) | (10,028 | ) | (128,068 | ) | (2,452,747 | ) | (113,932 | ) | (2,155,720 | ) | ||||||||||||||||
| Class B |
— | — | — | — | — | — | — | — | ||||||||||||||||||||||||
| Class C |
— | — | — | — | (32,283 | ) | (607,803 | ) | (174,179 | ) | (3,264,397 | ) | ||||||||||||||||||||
| Class D |
— | — | — | — | (8,813 | ) | (169,057 | ) | (57,101 | ) | (1,074,324 | ) | ||||||||||||||||||||
| Class R |
(296 | ) | (5,421 | ) | (343 | ) | (6,079 | ) | (824 | ) | (16,098 | ) | (3,238 | ) | (63,934 | ) | ||||||||||||||||
| Class P |
(962 | ) | (17,963 | ) | (992 | ) | (17,648 | ) | (104,516 | ) | (2,031,672 | ) | (194,801 | ) | (3,706,715 | ) | ||||||||||||||||
| Institutional Class |
— | — | — | — | — | — | — | — | ||||||||||||||||||||||||
| Class R6 |
(512 | ) | (9,367 | ) | (1,691 | ) | (29,665 | ) | (46,318 | ) | (877,312 | ) | (197,843 | ) | (3,758,560 | ) | ||||||||||||||||
| Administrative Class |
(688 | ) | (12,763 | ) | (790 | ) | (13,833 | ) | (35,507 | ) | (683,763 | ) | (15,164 | ) | (283,956 | ) | ||||||||||||||||
| Net increase (decrease) resulting from Fund share transactions |
81,143 | $ | 1,482,543 | 59,007 | $ | 1,023,382 | 177,731 | $ | 3,315,449 | (157,056 | ) | $ | (2,857,372 | ) | ||||||||||||||||||
| 262 | May 31, 2014 | | Semiannual Report |
Table of Contents
| AllianzGI Global Allocation | AllianzGI Global Growth Allocation | |||||||||||||||||||||||||||||
| Six Months ended May 31, 2014 (unaudited) |
Year ended November 30, 2013 |
Six Months ended May 31, 2014 (unaudited) |
Year ended November 30, 2013 |
|||||||||||||||||||||||||||
| Shares | Amount | Shares | Amount | Shares | Amount | Shares | Amount | |||||||||||||||||||||||
| 358,832 | $ | 4,277,641 | 650,172 | $ | 7,485,478 | 9,478 | $ | 204,746 | 29,219 | $ | 677,830 | |||||||||||||||||||
| 1,748 | 21,371 | 6,790 | 80,274 | — | — | — | — | |||||||||||||||||||||||
| 130,921 | 1,578,303 | 306,134 | 3,563,605 | 4,129 | 88,141 | 8,519 | 191,618 | |||||||||||||||||||||||
| 46,979 | 553,897 | 84,238 | 964,066 | 2,005 | 44,285 | 13,390 | 311,015 | |||||||||||||||||||||||
| — | — | — | — | 2,561 | 59,784 | 3,818 | 88,855 | |||||||||||||||||||||||
| 34,369 | 411,354 | 140,168 | 1,610,906 | — | — | 879 | 20,000 | |||||||||||||||||||||||
| 929,439 | 11,029,693 | 1,462,202 | 16,475,092 | 8,672 | 195,243 | 19,000 | 433,953 | |||||||||||||||||||||||
| — | — | — | — | — | — | — | — | |||||||||||||||||||||||
| 1,039 | 12,748 | 5,944 | 68,916 | — | — | — | — | |||||||||||||||||||||||
| 65,914 | 783,979 | 202,512 | 2,264,319 | 8,814 | 188,793 | 1,479 | 31,867 | |||||||||||||||||||||||
| 1,705 | 20,714 | 9,534 | 108,471 | — | — | — | — | |||||||||||||||||||||||
| 43,642 | 525,888 | 156,805 | 1,773,598 | 8,817 | 186,660 | 1,968 | 41,928 | |||||||||||||||||||||||
| 1,586 | 18,787 | 1,173 | 13,150 | 2,566 | 54,605 | 212 | 4,545 | |||||||||||||||||||||||
| 18 | 211 | 51 | 563 | 759 | 16,173 | 35 | 753 | |||||||||||||||||||||||
| 665 | 7,908 | 1,957 | 21,872 | 275 | 5,885 | 32 | 692 | |||||||||||||||||||||||
| 87,568 | 1,031,014 | 220,253 | 2,440,727 | 21,630 | 463,530 | 9,653 | 207,625 | |||||||||||||||||||||||
| — | — | — | — | — | — | — | — | |||||||||||||||||||||||
| 25 | 304 | 4,830 | 54,859 | 128 | 2,753 | 31 | 658 | |||||||||||||||||||||||
| (564,426 | ) | (6,747,384 | ) | (1,358,968 | ) | (15,588,863 | ) | (18,395 | ) | (401,241 | ) | (14,440 | ) | (330,565 | ) | |||||||||||||||
| (63,080 | ) | (763,062 | ) | (161,681 | ) | (1,874,028 | ) | — | — | — | — | |||||||||||||||||||
| (585,062 | ) | (7,079,033 | ) | (1,129,703 | ) | (13,058,303 | ) | (8,085 | ) | (179,764 | ) | (9,425 | ) | (213,799 | ) | |||||||||||||||
| (21,591 | ) | (259,673 | ) | (9,214 | ) | (105,094 | ) | (11,465 | ) | (251,467 | ) | (1,572 | ) | (36,382 | ) | |||||||||||||||
| — | — | — | — | (1,674 | ) | (40,504 | ) | (1,097 | ) | (24,512 | ) | |||||||||||||||||||
| (43,830 | ) | (529,754 | ) | (98,504 | ) | (1,120,655 | ) | — | — | — | — | |||||||||||||||||||
| (613,040 | ) | (7,266,962 | ) | (1,084,456 | ) | (12,213,671 | ) | (9,983 | ) | (230,456 | ) | (122,046 | ) | (2,920,674 | ) | |||||||||||||||
| — | — | — | — | — | — | — | — | |||||||||||||||||||||||
| (432 | ) | (5,198 | ) | (155,060 | ) | (1,767,402 | ) | — | — | — | — | |||||||||||||||||||
| (187,011 | ) | $ | (2,377,254 | ) | (744,823 | ) | $ | (8,802,120 | ) | 20,232 | $ | 407,166 | (60,345 | ) | $ | (1,514,593 | ) | |||||||||||||
| Semiannual Report | | May 31, 2014 | 263 |
Table of Contents
Notes to Financial Statements (cont’d)
May 31, 2014 (Unaudited)
| AllianzGI Behavioral Advantage Large Cap | AllianzGI Best Styles Global Equity Fund |
|||||||||||||||||||||||
| Six Months ended May 31, 2014 (unaudited) |
Year ended November 30, 2013 |
Period from December 2, 2013** through May 31, 2014 (unaudited) |
||||||||||||||||||||||
| Shares | Amount | Shares | Amount | Shares | Amount | |||||||||||||||||||
| Shares sold: |
||||||||||||||||||||||||
| Class A |
92,071 | $ | 2,109,756 | 381,505 | $ | 8,441,306 | — | $ | — | |||||||||||||||
| Class C |
8,353 | 188,711 | 5,241 | 111,787 | — | — | ||||||||||||||||||
| Class D |
5,098 | 117,997 | 25,397 | 475,978 | — | — | ||||||||||||||||||
| Class R |
— | — | — | — | — | — | ||||||||||||||||||
| Class P |
— | — | — | — | — | — | ||||||||||||||||||
| Institutional Class |
1,278,249 | 29,552,861 | 1,247,607 | 25,277,771 | — | — | ||||||||||||||||||
| Administrative Class |
— | — | — | — | — | — | ||||||||||||||||||
| Class R6 |
— | — | — | — | 2,103,505 | 31,348,406 | ||||||||||||||||||
| Issued in reinvestment of dividends and distributions: |
|
|||||||||||||||||||||||
| Class A |
1,899 | 42,703 | 139 | 2,505 | — | — | ||||||||||||||||||
| Class C |
468 | 10,358 | 250 | 4,469 | — | — | ||||||||||||||||||
| Class D |
313 | 6,966 | 406 | 7,289 | — | — | ||||||||||||||||||
| Class R |
— | — | — | — | — | — | ||||||||||||||||||
| Class P |
32 | 714 | 51 | 920 | — | — | ||||||||||||||||||
| Institutional Class |
96,431 | 2,171,713 | 73,598 | 1,327,554 | — | — | ||||||||||||||||||
| Administrative Class |
— | — | — | — | — | — | ||||||||||||||||||
| Cost of shares redeemed: |
||||||||||||||||||||||||
| Class A |
(49,574 | ) | (1,147,712 | ) | (21,301 | ) | (478,932 | ) | — | — | ||||||||||||||
| Class C |
(1,081 | ) | (24,566 | ) | (162 | ) | (3,571 | ) | — | — | ||||||||||||||
| Class D |
(441 | ) | (10,188 | ) | (19,009 | ) | (388,643 | ) | — | — | ||||||||||||||
| Class R |
— | — | — | — | — | — | ||||||||||||||||||
| Class P |
— | — | — | — | — | — | ||||||||||||||||||
| Institutional Class |
(429,609 | ) | (10,001,361 | ) | (186,572 | ) | (4,005,345 | ) | — | — | ||||||||||||||
| Administrative Class |
— | — | — | — | — | — | ||||||||||||||||||
| Class R6 |
— | — | — | — | (139,354 | ) | (2,143,815 | ) | ||||||||||||||||
| Net increase (decrease) resulting from Fund share transactions |
1,002,209 | $ | 23,017,952 | 1,507,150 | $ | 30,773,088 | 1,964,151 | $ | 29,204,591 | |||||||||||||||
| * | Actual amount rounds to less than 1. |
| ** | Commencement of operations. |
| 264 | May 31, 2014 | | Semiannual Report |
Table of Contents
| AllianzGI China Equity |
AllianzGI Convertible | |||||||||||||||||||||||||||||
| Six Months ended May 31, 2014 (unaudited) |
Year ended November 30, 2013 |
Six Months ended May 31, 2014 (unaudited) |
Year ended November 30, 2013 |
|||||||||||||||||||||||||||
| Shares | Amount | Shares | Amount | Shares | Amount | Shares | Amount | |||||||||||||||||||||||
| 970 | $ | 14,997 | 2,710 | $ | 41,971 | 6,163,843 | $ | 217,562,661 | 8,591,634 | $ | 280,372,826 | |||||||||||||||||||
| 312 | 5,166 | 2,030 | 32,377 | 646,006 | 22,613,630 | 2,204,183 | 72,452,081 | |||||||||||||||||||||||
| 1,075 | 17,788 | 46,920 | 725,761 | 1,400,577 | 49,509,927 | 5,516,035 | 178,731,349 | |||||||||||||||||||||||
| — | — | — | — | 26,124 | 914,732 | 9,446 | 291,603 | |||||||||||||||||||||||
| — | — | — | — | 1,455,030 | 50,634,451 | 6,525,498 | 215,786,524 | |||||||||||||||||||||||
| 2,432 | 37,303 | 6,213 | 96,128 | 11,382,103 | 402,032,568 | 28,046,811 | 896,431,887 | |||||||||||||||||||||||
| — | — | — | — | 23,577 | 824,871 | 512,078 | 16,761,400 | |||||||||||||||||||||||
| — | — | — | — | — | — | — | — | |||||||||||||||||||||||
| 37 | 596 | 133 | 2,022 | 252,801 | 8,646,602 | 65,158 | 2,055,284 | |||||||||||||||||||||||
| — | * | 1 | — | * | 1 | 50,768 | 1,727,888 | 8,104 | 254,332 | |||||||||||||||||||||
| — | * | 1 | 733 | 11,196 | 99,535 | 3,397,277 | 26,167 | 828,429 | ||||||||||||||||||||||
| — | — | — | — | 335 | 11,534 | 36 | 1,142 | |||||||||||||||||||||||
| — | * | — | * | 15 | 226 | 121,834 | 4,152,177 | 30,015 | 942,805 | |||||||||||||||||||||
| 1,800 | 29,159 | 5,019 | 76,243 | 814,562 | 27,731,502 | 369,146 | 11,475,867 | |||||||||||||||||||||||
| — | — | — | — | 10,334 | 351,869 | 3,411 | 106,752 | |||||||||||||||||||||||
| (879 | ) | (13,725 | ) | (4,000 | ) | (62,748 | ) | (2,272,213 | ) | (80,126,492 | ) | (2,833,097 | ) | (90,812,118 | ) | |||||||||||||||
| (1,285 | ) | (19,677 | ) | (2,705 | ) | (40,672 | ) | (227,847 | ) | (8,086,060 | ) | (258,945 | ) | (8,315,914 | ) | |||||||||||||||
| (1,280 | ) | (20,715 | ) | (58,913 | ) | (908,783 | ) | (1,727,310 | ) | (60,693,508 | ) | (3,324,374 | ) | (105,812,204 | ) | |||||||||||||||
| — | — | — | — | (2,101 | ) | (74,843 | ) | (5,624 | ) | (175,584 | ) | |||||||||||||||||||
| — | — | (955 | ) | (15,129 | ) | (2,695,980 | ) | (96,208,453 | ) | (1,231,953 | ) | (39,106,476 | ) | |||||||||||||||||
| (1,827 | ) | (30,550 | ) | (4,470 | ) | (67,415 | ) | (12,172,276 | ) | (431,810,344 | ) | (11,470,946 | ) | (373,729,722 | ) | |||||||||||||||
| — | — | — | — | (285,473 | ) | (10,160,060 | ) | (221,785 | ) | (7,167,569 | ) | |||||||||||||||||||
| — | — | — | — | — | — | — | — | |||||||||||||||||||||||
| 1,355 | $ | 20,344 | (7,270 | ) | $ | (108,822 | ) | 3,064,229 | $ | 102,951,929 | 32,560,998 | $ | 1,051,372,694 | |||||||||||||||||
| Semiannual Report | | May 31, 2014 | 265 |
Table of Contents
Notes to Financial Statements (cont’d)
May 31, 2014 (Unaudited)
| AllianzGI Global Fundamental Strategy | AllianzGI Global Managed Volatility | |||||||||||||||||||||||||||||||
| Six Months ended May 31, 2014 (unaudited) |
Period from July 1, 2013** through November 30, 2013 |
Six Months ended May 31, 2014 (unaudited) |
Year ended November 30, 2013 |
|||||||||||||||||||||||||||||
| Shares | Amount | Shares | Amount | Shares | Amount | Shares | Amount | |||||||||||||||||||||||||
| Shares sold: |
||||||||||||||||||||||||||||||||
| Class A |
— | $ | — | — | $ | — | 2,260 | $ | 40,102 | 4,688 | $ | 84,338 | ||||||||||||||||||||
| Class C |
— | — | — | — | — | — | 9,622 | 161,779 | ||||||||||||||||||||||||
| Class D |
129,490 | 2,053,320 | — | — | 4,667 | 83,000 | 5,587 | 96,532 | ||||||||||||||||||||||||
| Class R |
— | — | — | — | — | — | — | — | ||||||||||||||||||||||||
| Class P |
— | — | — | — | — | — | — | — | ||||||||||||||||||||||||
| Institutional Class |
27,104 | 421,862 | 3,670 | 56,000 | 186,215 | 3,203,334 | 187,391 | 3,246,795 | ||||||||||||||||||||||||
| Administrative Class |
— | — | — | — | — | — | — | — | ||||||||||||||||||||||||
| Issued in reinvestment of dividends and distributions: |
|
|||||||||||||||||||||||||||||||
| Class A |
8 | 119 | — | — | 356 | 6,017 | 145 | 2,354 | ||||||||||||||||||||||||
| Class C |
5 | 81 | — | — | 545 | 9,036 | 155 | 2,491 | ||||||||||||||||||||||||
| Class D |
8 | 119 | — | — | 159 | 2,674 | 128 | 2,075 | ||||||||||||||||||||||||
| Class R |
— | — | — | — | — | — | — | — | ||||||||||||||||||||||||
| Class P |
8 | 127 | — | — | 39 | 658 | 30 | 492 | ||||||||||||||||||||||||
| Institutional Class |
17,464 | 265,591 | — | — | 48,480 | 821,489 | 42,843 | 690,065 | ||||||||||||||||||||||||
| Administrative Class |
— | — | — | — | — | — | — | — | ||||||||||||||||||||||||
| Cost of shares redeemed: |
|
|||||||||||||||||||||||||||||||
| Class A |
— | — | — | — | (452 | ) | (7,782 | ) | (1,278 | ) | (22,099 | ) | ||||||||||||||||||||
| Class C |
— | — | — | — | (594 | ) | (9,956 | ) | (79 | ) | (1,301 | ) | ||||||||||||||||||||
| Class D |
— | — | — | — | (1,208 | ) | (20,368 | ) | (4,834 | ) | (83,610 | ) | ||||||||||||||||||||
| Class R |
— | — | — | — | — | — | — | — | ||||||||||||||||||||||||
| Class P |
— | — | — | — | — | — | — | — | ||||||||||||||||||||||||
| Institutional Class |
(2,247 | ) | (34,787 | ) | — | — | (47,283 | ) | (821,136 | ) | (318,308 | ) | (5,478,653 | ) | ||||||||||||||||||
| Administrative Class |
— | — | — | — | — | — | — | — | ||||||||||||||||||||||||
| Net increase (decrease) resulting from Fund share transactions |
171,840 | $ | 2,706,432 | 3,670 | $ | 56,000 | 193,184 | $ | 3,307,068 | (73,910 | ) | $ | (1,298,742 | ) | ||||||||||||||||||
| ** | Commencement of operations. |
| 266 | May 31, 2014 | | Semiannual Report |
Table of Contents
| AllianzGI Global Water | AllianzGI High Yield Bond | |||||||||||||||||||||||||||||
| Six Months ended May 31, 2014 (unaudited) |
Year ended November 30, 2013 |
Six Months ended |
Year ended November 30, 2013 |
|||||||||||||||||||||||||||
| Shares | Amount | Shares | Amount | Shares | Amount | Shares | Amount | |||||||||||||||||||||||
| 2,741,773 | $ | 35,159,870 | 5,512,444 | $ | 62,211,861 | 1,735,054 | $ | 17,934,835 | 9,935,430 | $ | 102,263,468 | |||||||||||||||||||
| 1,580,573 | 19,709,185 | 2,018,617 | 22,399,195 | 187,513 | 1,935,940 | 589,098 | 6,095,119 | |||||||||||||||||||||||
| 623,272 | 7,947,317 | 1,334,896 | 14,821,546 | 3,690,641 | 37,094,564 | 10,223,893 | 103,127,026 | |||||||||||||||||||||||
| — | — | — | — | 55,487 | 555,855 | 165,963 | 1,667,040 | |||||||||||||||||||||||
| 1,592,795 | 20,467,291 | 2,464,550 | 27,959,201 | 1,245,690 | 12,476,311 | 7,088,977 | 71,077,404 | |||||||||||||||||||||||
| 887,767 | 11,068,862 | 1,071,185 | 12,109,835 | 5,535,224 | 55,578,777 | 7,108,742 | 71,681,301 | |||||||||||||||||||||||
| — | — | — | — | 540,484 | 5,409,944 | 922,461 | 9,275,763 | |||||||||||||||||||||||
| 16,615 | 206,530 | 40,634 | 423,408 | 227,680 | 2,345,392 | 301,981 | 3,119,863 | |||||||||||||||||||||||
| 2 | 24 | 5,991 | 61,406 | 76,839 | 790,808 | 124,329 | 1,283,135 | |||||||||||||||||||||||
| 2,130 | 26,435 | 7,190 | 74,782 | 372,705 | 3,731,201 | 485,325 | 4,881,638 | |||||||||||||||||||||||
| — | — | — | — | 8,186 | 81,799 | 9,516 | 95,433 | |||||||||||||||||||||||
| 3,092 | 38,644 | 3,988 | 41,753 | 35,775 | 357,370 | 51,149 | 513,053 | |||||||||||||||||||||||
| 14,188 | 174,654 | 5,276 | 54,605 | 664,379 | 6,653,959 | 882,805 | 8,877,726 | |||||||||||||||||||||||
| — | — | — | — | 147,211 | 1,468,517 | 207,370 | 2,078,136 | |||||||||||||||||||||||
| (845,015 | ) | (10,740,990 | ) | (1,838,617 | ) | (20,625,299 | ) | (3,385,623 | ) | (34,850,102 | ) | (13,899,036 | ) | (143,273,425 | ) | |||||||||||||||
| (264,808 | ) | (3,318,673 | ) | (332,044 | ) | (3,662,680 | ) | (404,935 | ) | (4,179,648 | ) | (1,078,374 | ) | (11,147,242 | ) | |||||||||||||||
| (357,046 | ) | (4,578,667 | ) | (490,851 | ) | (5,488,667 | ) | (7,332,776 | ) | (73,390,525 | ) | (4,425,118 | ) | (44,596,498 | ) | |||||||||||||||
| — | — | — | — | (47,596 | ) | (477,233 | ) | (105,584 | ) | (1,059,461 | ) | |||||||||||||||||||
| (417,422 | ) | (5,329,928 | ) | (704,028 | ) | (8,054,166 | ) | (361,386 | ) | (3,619,010 | ) | (1,388,602 | ) | (13,947,242 | ) | |||||||||||||||
| (246,827 | ) | (3,182,451 | ) | (212,810 | ) | (2,409,344 | ) | (2,667,761 | ) | (26,781,110 | ) | (6,427,655 | ) | (64,748,671 | ) | |||||||||||||||
| — | — | — | — | (442,617 | ) | (4,431,690 | ) | (627,488 | ) | (6,317,156 | ) | |||||||||||||||||||
|
|
5,331,089 |
|
$ | 67,648,103 | 8,886,421 | $ | 99,917,436 | (119,826 | ) | $ | (1,314,046 | ) | 10,145,182 | $ | 100,946,410 | |||||||||||||||
| Semiannual Report | | May 31, 2014 | 267 |
Table of Contents
Notes to Financial Statements (cont’d)
May 31, 2014 (Unaudited)
| AllianzGI International Small-Cap | AllianzGI Micro Cap | |||||||||||||||||||||||||||||||
| Six Months ended May 31, 2014 (unaudited) |
Year ended November 30, 2013 |
Six Months ended May 31, 2014 (unaudited) |
Year ended November 30, 2013 |
|||||||||||||||||||||||||||||
| Shares | Amount | Shares | Amount | Shares | Amount | Shares | Amount | |||||||||||||||||||||||||
| Shares sold: |
||||||||||||||||||||||||||||||||
| Class A |
33,178 | $ | 1,302,900 | 103,722 | $ | 4,131,418 | 278,842 | $ | 4,383,147 | 74,399 | $ | 1,015,030 | ||||||||||||||||||||
| Class C |
10,041 | 381,643 | 2,889 | 106,966 | — | — | — | — | ||||||||||||||||||||||||
| Class D |
30,230 | 1,202,915 | 6,102 | 248,611 | — | — | — | — | ||||||||||||||||||||||||
| Class R |
1,385 | 55,137 | 281 | 11,046 | — | — | — | — | ||||||||||||||||||||||||
| Class P |
30,558 | 1,188,564 | 250,454 | 8,238,161 | 36,790 | 572,391 | 198,960 | 2,717,307 | ||||||||||||||||||||||||
| Institutional Class |
389,821 | 15,619,801 | 691,638 | 25,366,913 | 335,474 | 5,312,164 | 740,624 | 9,794,170 | ||||||||||||||||||||||||
| Issued in reinvestment of dividends and distributions: |
|
|||||||||||||||||||||||||||||||
| Class A |
3,020 | 115,432 | — | * | 5 | 3,648 | 53,258 | 1,001 | 11,489 | |||||||||||||||||||||||
| Class C |
1,312 | 49,492 | 9 | 309 | — | — | — | — | ||||||||||||||||||||||||
| Class D |
735 | 28,741 | — | * | 11 | — | — | — | — | |||||||||||||||||||||||
| Class R |
60 | 2,285 | 4 | 153 | — | — | — | — | ||||||||||||||||||||||||
| Class P |
71,169 | 2,697,753 | 9,018 | 302,391 | 7,559 | 110,432 | 2,806 | 31,638 | ||||||||||||||||||||||||
| Institutional Class |
140,495 | 5,460,396 | 25,211 | 835,561 | 143,813 | 2,111,180 | 199,097 | 2,172,522 | ||||||||||||||||||||||||
| Administrative Class*** |
32 | 1,233 | — | * | 1 | — | — | — | — | |||||||||||||||||||||||
| Cost of shares redeemed: |
||||||||||||||||||||||||||||||||
| Class A |
(17,460 | ) | (684,456 | ) | (82,662 | ) | (3,357,604 | ) | (73,539 | ) | (1,109,872 | ) | (20,683 | ) | (284,391 | ) | ||||||||||||||||
| Class C |
(951 | ) | (36,898 | ) | (2,842 | ) | (100,112 | ) | — | — | — | — | ||||||||||||||||||||
| Class D |
(2,725 | ) | (109,414 | ) | (1,704 | ) | (66,604 | ) | — | — | — | — | ||||||||||||||||||||
| Class R |
(22 | ) | (868 | ) | (4 | ) | (132 | ) | — | — | — | — | ||||||||||||||||||||
| Class P |
(118,072 | ) | (4,571,959 | ) | (367,738 | ) | (12,280,239 | ) | (39,477 | ) | (605,681 | ) | (94,040 | ) | (1,282,966 | ) | ||||||||||||||||
| Institutional Class |
(436,830 | ) | (17,515,832 | ) | (1,751,653 | ) | (63,692,299 | ) | (722,149 | ) | (11,540,481 | ) | (703,397 | ) | (9,479,462 | ) | ||||||||||||||||
| Administrative Class*** |
(395 | ) | (15,734 | ) | — | — | — | — | — | — | ||||||||||||||||||||||
| Net increase (decrease) resulting from Fund share transactions |
135,581 | $ | 5,171,131 | (1,117,275 | ) | $ | (40,255,444 | ) | (29,039 | ) | $ | (713,462 | ) | 398,767 | $ | 4,695,337 | ||||||||||||||||
| * | Actual amount rounds to less than 1. |
| ** | Commencement of operations. |
| *** | The Administrative Class of AllianzGI International Small-Cap liquidated on May 21, 2014. |
| 268 | May 31, 2014 | | Semiannual Report |
Table of Contents
| AllianzGI Multi-Asset Real Return | AllianzGI NFJ Emerging Markets Value | |||||||||||||||||||||||||||||
| Six Months ended May 31, 2014 (unaudited) |
Period from December 17, 2012** through November 30, 2013 |
Six Months ended May 31, 2014 (unaudited) |
Period from December 18, 2012** through November 30, 2013 |
|||||||||||||||||||||||||||
| Shares | Amount | Shares | Amount | Shares | Amount | Shares | Amount | |||||||||||||||||||||||
| 5,807 | $ | 91,410 | 2,254 | $ | 34,886 | 707 | $ | 10,875 | 659 | $ | 10,519 | |||||||||||||||||||
| 1,614 | 25,670 | 4,638 | 67,431 | 1,090 | 16,000 | 967 | 14,000 | |||||||||||||||||||||||
| 1,163 | 18,423 | — | — | 26,616 | 400,992 | 89,929 | 1,341,066 | |||||||||||||||||||||||
| — | — | — | — | — | — | — | — | |||||||||||||||||||||||
| — | — | — | — | — | — | — | — | |||||||||||||||||||||||
| 29,542 | 457,280 | 2,314 | 35,411 | 132,108 | 1,967,448 | 231,737 | 3,637,469 | |||||||||||||||||||||||
| 56 | 850 | — | — | 18 | 272 | 18 | 258 | |||||||||||||||||||||||
| 91 | 1,364 | — | — | 21 | 315 | 7 | 99 | |||||||||||||||||||||||
| 12 | 176 | — | — | 1,034 | 15,551 | 340 | 4,846 | |||||||||||||||||||||||
| — | — | — | — | — | — | — | — | |||||||||||||||||||||||
| 12 | 192 | — | — | 10 | 153 | 8 | 122 | |||||||||||||||||||||||
| 7,211 | 109,319 | — | — | 6,368 | 95,709 | 5,130 | 73,371 | |||||||||||||||||||||||
| — | — | — | — | — | — | — | — | |||||||||||||||||||||||
| (1,533 | ) | (23,764 | ) | — | — | (154 | ) | (2,275 | ) | (100 | ) | (1,553 | ) | |||||||||||||||||
| — | — | — | — | — | — | — | — | |||||||||||||||||||||||
| — | — | — | — | (3,472 | ) | (51,639 | ) | (20,648 | ) | (323,055 | ) | |||||||||||||||||||
| — | — | — | — | — | — | — | — | |||||||||||||||||||||||
| — | — | — | — | — | — | — | — | |||||||||||||||||||||||
| (1,743 | ) | (27,308 | ) | (348 | ) | (5,234 | ) | (38,592 | ) | (588,312 | ) | (18,284 | ) | (280,040 | ) | |||||||||||||||
| — | — | — | — | — | — | — | — | |||||||||||||||||||||||
| 42,232 | $ | 653,612 | 8,858 | $ | 132,494 | 125,754 | $ | 1,865,089 | 289,763 | $ | 4,477,102 | |||||||||||||||||||
| Semiannual Report | | May 31, 2014 | 269 |
Table of Contents
Notes to Financial Statements (cont’d)
May 31, 2014 (Unaudited)
| AllianzGI NFJ Global Dividend Value | AllianzGI NFJ International Small-Cap Value | |||||||||||||||||||||||||||||||
| Six Months ended May 31, 2014 (unaudited) |
Year ended November 30, 2013 |
Six Months ended May 31, 2014 (unaudited) |
Year ended November 30, 2013 |
|||||||||||||||||||||||||||||
| Shares | Amount | Shares | Amount | Shares | Amount | Shares | Amount | |||||||||||||||||||||||||
| Shares sold: |
||||||||||||||||||||||||||||||||
| Class A |
92,566 | $ | 1,966,027 | 156,809 | $ | 3,135,257 | 34,897 | $ | 756,406 | 47,080 | $ | 949,567 | ||||||||||||||||||||
| Class C |
27,086 | 572,376 | 79,235 | 1,580,908 | 30,048 | 629,920 | 24,826 | 475,897 | ||||||||||||||||||||||||
| Class D |
5,404 | 115,513 | 12,092 | 249,792 | 9,236 | 201,014 | 122,827 | 2,408,829 | ||||||||||||||||||||||||
| Class P |
18,266 | 393,053 | 26,705 | 544,157 | 345 | 7,235 | — | — | ||||||||||||||||||||||||
| Institutional Class |
354,066 | 7,442,476 | 889,070 | 17,441,666 | 204,755 | 4,351,357 | 364,978 | 7,301,696 | ||||||||||||||||||||||||
| Issued in reinvestment of dividends and distributions: |
|
|||||||||||||||||||||||||||||||
| Class A |
9,883 | 206,933 | 5,523 | 108,140 | 3,324 | 67,600 | 1,443 | 25,477 | ||||||||||||||||||||||||
| Class C |
10,039 | 207,647 | 3,519 | 67,729 | 1,071 | 21,708 | 66 | 1,272 | ||||||||||||||||||||||||
| Class D |
1,411 | 29,834 | 627 | 12,397 | 1,219 | 24,795 | 340 | 6,209 | ||||||||||||||||||||||||
| Class P |
3,058 | 64,406 | 1,542 | 30,424 | 19 | 384 | 10 | 185 | ||||||||||||||||||||||||
| Institutional Class |
102,810 | 2,142,086 | 66,335 | 1,294,273 | 19,676 | 403,900 | 3,582 | 63,091 | ||||||||||||||||||||||||
| Cost of shares redeemed: |
||||||||||||||||||||||||||||||||
| Class A |
(50,553 | ) | (1,078,217 | ) | (80,230 | ) | (1,662,770 | ) | (22,574 | ) | (487,015 | ) | (1,985 | ) | (39,719 | ) | ||||||||||||||||
| Class C |
(27,858 | ) | (585,747 | ) | (39,317 | ) | (767,938 | ) | (601 | ) | (12,886 | ) | (812 | ) | (15,461 | ) | ||||||||||||||||
| Class D |
(3,097 | ) | (66,912 | ) | (4,979 | ) | (98,694 | ) | (6,191 | ) | (133,816 | ) | (82,841 | ) | (1,655,878 | ) | ||||||||||||||||
| Class P |
(11,437 | ) | (244,148 | ) | (11,673 | ) | (229,909 | ) | — | — | — | — | ||||||||||||||||||||
| Institutional Class |
(338,023 | ) | (7,179,577 | ) | (777,516 | ) | (16,122,964 | ) | (43,974 | ) | (957,173 | ) | (18,106 | ) | (367,353 | ) | ||||||||||||||||
| Net increase (decrease) resulting from Fund share transactions |
193,621 | $ | 3,985,750 | 327,742 | $ | 5,582,468 | 231,250 | $ | 4,873,429 | 461,408 | $ | 9,153,812 | ||||||||||||||||||||
| 270 | May 31, 2014 | | Semiannual Report |
Table of Contents
| AllianzGI NFJ International Value II | AllianzGI Short Duration High Income | |||||||||||||||||||||||||||||
| Six Months ended May 31, 2014 (unaudited) |
Year ended November 30, 2013 |
Six Months ended May 31, 2014 (unaudited) |
Year ended November 30, 2013 |
|||||||||||||||||||||||||||
| Shares | Amount | Shares | Amount | Shares | Amount | Shares | Amount | |||||||||||||||||||||||
| 4,069 | $ | 73,508 | 918 | $ | 16,009 | 5,862,179 | $ | 93,381,555 | 9,245,767 | $ | 147,457,855 | |||||||||||||||||||
| — | — | 9,102 | 160,912 | 1,636,719 | 26,025,409 | 2,632,258 | 41,876,500 | |||||||||||||||||||||||
| — | — | 2 | 32 | 1,379,954 | 21,980,417 | 1,053,388 | 16,780,609 | |||||||||||||||||||||||
| 517 | 10,000 | — | — | 5,008,567 | 79,785,703 | 8,229,104 | 131,186,076 | |||||||||||||||||||||||
| 1,375,259 | 24,901,623 | 9,647 | 164,731 | 4,678,018 | 74,584,733 | 10,250,970 | 163,728,556 | |||||||||||||||||||||||
| 233 | 4,186 | 44 | 738 | 236,090 | 3,753,184 | 344,340 | 5,467,728 | |||||||||||||||||||||||
| 135 | 2,405 | 8 | 131 | 81,992 | 1,301,013 | 104,122 | 1,650,508 | |||||||||||||||||||||||
| 40 | 714 | 9 | 152 | 38,972 | 619,506 | 46,673 | 741,285 | |||||||||||||||||||||||
| 40 | 724 | 10 | 159 | 115,795 | 1,840,507 | 138,088 | 2,191,585 | |||||||||||||||||||||||
| 21,022 | 377,585 | 3,813 | 64,024 | 320,640 | 5,102,248 | 347,265 | 5,515,412 | |||||||||||||||||||||||
| (2,666 | ) | (47,672 | ) | (60 | ) | (1,050 | ) | (3,664,237 | ) | (58,373,570 | ) | (4,076,260 | ) | (64,767,196 | ) | |||||||||||||||
| (84 | ) | (1,514 | ) | (7,301 | ) | (129,878 | ) | (419,804 | ) | (6,676,229 | ) | (521,072 | ) | (8,275,135 | ) | |||||||||||||||
| — | — | — | — | (255,246 | ) | (4,064,906 | ) | (539,985 | ) | (8,594,224 | ) | |||||||||||||||||||
| — | — | — | — | (2,282,088 | ) | (36,344,278 | ) | (4,033,691 | ) | (64,067,265 | ) | |||||||||||||||||||
| (2,782 | ) | (52,173 | ) | (65,288 | ) | (1,115,507 | ) | (1,945,242 | ) | (31,009,262 | ) | (1,715,578 | ) | (27,239,030 | ) | |||||||||||||||
| |
1,395,783 |
|
$ | 25,269,386 | (49,096 | ) | $ | (839,547 | ) | 10,792,309 | $ | 171,906,030 | 21,505,389 | $ | 343,653,264 | |||||||||||||||
| Semiannual Report | | May 31, 2014 | 271 |
Table of Contents
Notes to Financial Statements (cont’d)
May 31, 2014 (Unaudited)
| AllianzGI Structured Return | AllianzGI Ultra Micro Cap | |||||||||||||||||||||||||||||||
| Six Months ended May 31, 2014 |
Period from November 30, 2013 |
Six Months ended May 31, 2014 (unaudited) |
Year ended November 30, 2013 |
|||||||||||||||||||||||||||||
| Shares | Amount | Shares | Amount | Shares | Amount | Shares | Amount | |||||||||||||||||||||||||
| Shares sold: |
||||||||||||||||||||||||||||||||
| Class A |
135,956 | $ | 2,057,966 | 34,359 | $ | 543,218 | 1,105,713 | $ | 27,549,559 | 2,454,435 | $ | 51,344,593 | ||||||||||||||||||||
| Class C |
4,320 | 66,491 | 4,265 | 67,043 | — | — | — | — | ||||||||||||||||||||||||
| Class D |
7,819 | 119,550 | 136,002 | 2,095,760 | — | — | — | — | ||||||||||||||||||||||||
| Class R |
— | — | — | — | — | — | — | — | ||||||||||||||||||||||||
| Class P |
— | — | 3,150 | 50,000 | 27,935 | 706,220 | 27,501 | 572,135 | ||||||||||||||||||||||||
| Institutional Class |
368,177 | 5,578,494 | 134,593 | 2,063,286 | 921,002 | 23,078,388 | 3,066,770 | 63,021,267 | ||||||||||||||||||||||||
| Issued in reinvestment of dividends and distributions: |
|
|||||||||||||||||||||||||||||||
| Class A |
1,601 | 24,284 | — | — | 5,711 | 133,515 | 752 | 16,333 | ||||||||||||||||||||||||
| Class C |
324 | 4,872 | — | — | — | — | — | — | ||||||||||||||||||||||||
| Class D |
4,006 | 60,855 | — | — | — | — | — | — | ||||||||||||||||||||||||
| Class R |
— | — | — | — | — | — | — | — | ||||||||||||||||||||||||
| Class P |
172 | 2,607 | — | — | 78 | 1,822 | 14 | 314 | ||||||||||||||||||||||||
| Institutional Class |
22,151 | 336,705 | — | — | 5,397 | 126,941 | 901 | 19,672 | ||||||||||||||||||||||||
| Cost of shares redeemed: |
|
|||||||||||||||||||||||||||||||
| Class A |
(23,423 | ) | (357,222 | ) | (2,447 | ) | (38,784 | ) | (510,372 | ) | (12,370,608 | ) | (369,804 | ) | (7,746,956 | ) | ||||||||||||||||
| Class C |
(1,669 | ) | (24,806 | ) | (195 | ) | (3,030 | ) | — | — | — | — | ||||||||||||||||||||
| Class D |
(25,792 | ) | (390,975 | ) | (47,551 | ) | (726,334 | ) | — | — | — | — | ||||||||||||||||||||
| Class R |
— | — | — | — | — | — | — | — | ||||||||||||||||||||||||
| Class P |
— | — | — | — | (3,069 | ) | (74,261 | ) | (8,555 | ) | (172,955 | ) | ||||||||||||||||||||
| Institutional Class |
(38,019 | ) | (586,684 | ) | (32,977 | ) | (514,076 | ) | (1,098,652 | ) | (26,776,123 | ) | (1,105,860 | ) | (22,669,169 | ) | ||||||||||||||||
| Net increase resulting from Fund share transactions |
455,623 | $ | 6,892,137 | 229,199 | $ | 3,537,083 | 453,743 | $ | 12,375,453 | 4,066,154 | $ | 84,385,234 | ||||||||||||||||||||
| ** | Commencement of operations. |
| 272 | May 31, 2014 | | Semiannual Report |
Table of Contents
| AllianzGI U.S. Equity Hedged | AllianzGI U.S. Small-Cap Growth | |||||||||||||||||||||||||||||
| Six Months ended May 31, 2014 (unaudited) |
Period from December 3, 2012** November 30, 2013 |
Six Months ended May 31, 2014 (unaudited) |
Year ended November 30, 2013 |
|||||||||||||||||||||||||||
| Shares | Amount | Shares | Amount | Shares | Amount | Shares | Amount | |||||||||||||||||||||||
| 3,867 | $ | 66,291 | 81,379 | $ | 1,326,639 | 70,020 | $ | 1,254,458 | 197,402 | $ | 3,210,872 | |||||||||||||||||||
| 2,695 | 46,001 | 6,465 | 108,500 | 6,353 | 112,593 | 19,720 | 317,722 | |||||||||||||||||||||||
| 3,659 | 63,350 | 15,315 | 239,042 | 2,877 | 51,117 | 1,225 | 20,872 | |||||||||||||||||||||||
| — | — | — | — | 1,194 | 21,578 | 927 | 15,557 | |||||||||||||||||||||||
| — | — | — | — | 53,868 | 966,695 | 4,343 | 72,862 | |||||||||||||||||||||||
| 28,587 | 494,267 | 117,315 | 1,897,897 | 357,054 | 6,556,922 | 822,774 | 12,878,248 | |||||||||||||||||||||||
| 1,900 | 32,050 | — | — | 4,405 | 75,899 | 347 | 4,676 | |||||||||||||||||||||||
| 241 | 4,036 | — | — | 2,385 | 40,144 | 357 | 4,669 | |||||||||||||||||||||||
| 276 | 4,657 | — | — | 235 | 4,055 | 90 | 1,186 | |||||||||||||||||||||||
| — | — | — | — | 103 | 1,768 | 18 | 232 | |||||||||||||||||||||||
| 11 | 199 | — | — | 384 | 6,673 | 35 | 477 | |||||||||||||||||||||||
| 6,328 | 107,071 | — | — | 106,826 | 1,861,980 | 33,018 | 440,202 | |||||||||||||||||||||||
| (309 | ) | (5,270 | ) | — | — | (32,308 | ) | (582,494 | ) | (39,901 | ) | (660,566 | ) | |||||||||||||||||
| — | — | — | — | (3,226 | ) | (56,686 | ) | (5,072 | ) | (77,126 | ) | |||||||||||||||||||
| (1,373 | ) | (23,582 | ) | (636 | ) | (10,361 | ) | (1,325 | ) | (23,569 | ) | (2,079 | ) | (34,319 | ) | |||||||||||||||
| — | — | — | — | (1,195 | ) | (21,613 | ) | (340 | ) | (5,967 | ) | |||||||||||||||||||
| — | — | — | — | (51,563 | ) | (932,557 | ) | (106 | ) | (1,527 | ) | |||||||||||||||||||
| (24,372 | ) | (420,202 | ) | (5,598 | ) | (90,430 | ) | (305,137 | ) | (5,550,276 | ) | (856,009 | ) | (14,320,751 | ) | |||||||||||||||
|
|
21,510 |
|
$ | 368,868 | 214,240 | $ | 3,471,287 | 210,950 | $ | 3,786,687 | 176,749 | $ | 1,867,319 | |||||||||||||||||
| Semiannual Report | | May 31, 2014 | 273 |
Table of Contents
Notes to Financial Statements (cont’d)
May 31, 2014 (Unaudited)
| 10. | SIGNIFICANT ACCOUNT HOLDERS |
From time to time, a Fund may have a concentration of shareholders, which may include the Investment Manager or affiliates of the Investment Manager, holding a significant percentage of shares outstanding. Investment activities of these shareholders could have a material impact to a Fund.
At May 31, 2014, the significant account-holders, owners of 5% or greater of each respective Fund’s outstanding shares were as follows:
| Unaffiliated | Affiliated Approximate Ownership | |||||||||||||||||||||||||||||||||||||||||||
| Number of Account Holders |
Approximate Ownership |
AFI | AllianzGI Global Allocation |
AllianzGI Retirement 2020 |
AllianzGI Retirement 2025 |
AllianzGI Retirement 2030 |
AllianzGI Retirement 2035 |
AllianzGI Retirement 2040 |
AllianzGI Retirement 2045 |
AllianzGI Retirement 2050 |
||||||||||||||||||||||||||||||||||
| AllianzGI Retirement 2015 |
6 | 73 | % | 11 | % | — | — | — | — | — | — | — | — | |||||||||||||||||||||||||||||||
| AllianzGI Retirement 2020 |
5 | 83 | % | 6 | % | — | — | — | — | — | — | — | — | |||||||||||||||||||||||||||||||
| AllianzGI Retirement 2025 |
5 | 84 | % | 5 | % | — | — | — | — | — | — | — | — | |||||||||||||||||||||||||||||||
| AllianzGI Retirement 2030 |
5 | 82 | % | — | — | — | — | — | — | — | — | — | ||||||||||||||||||||||||||||||||
| AllianzGI Retirement 2035 |
5 | 79 | % | 8 | % | — | — | — | — | — | — | — | — | |||||||||||||||||||||||||||||||
| AllianzGI Retirement 2040 |
5 | 78 | % | 7 | % | — | — | — | — | — | — | — | — | |||||||||||||||||||||||||||||||
| AllianzGI Retirement 2045 |
4 | 67 | % | 17 | % | — | — | — | — | — | — | — | — | |||||||||||||||||||||||||||||||
| AllianzGI Retirement 2050 |
2 | 56 | % | 23 | % | — | — | — | — | — | — | — | — | |||||||||||||||||||||||||||||||
| AllianzGI Retirement 2055 |
2 | 22 | % | 63 | % | — | — | — | — | — | — | — | — | |||||||||||||||||||||||||||||||
| AllianzGI Retirement Income |
5 | 61 | % | 14 | % | — | — | — | — | — | — | — | — | |||||||||||||||||||||||||||||||
| AllianzGI Global Allocation |
7 | 76 | % | — | — | — | — | — | — | — | — | — | ||||||||||||||||||||||||||||||||
| AllianzGI Global Growth Allocation |
2 | 14 | % | 51 | % | — | — | — | — | — | — | — | — | |||||||||||||||||||||||||||||||
| AllianzGI Behavioral Advantage Large Cap |
4 | 42 | % | 22 | % | 11 | % | — | — | — | — | — | — | — | ||||||||||||||||||||||||||||||
| AllianzGI Best Styles Global Equity |
— | — | 15 | % | 24 | % | 5 | % | 7 | % | 9 | % | 10 | % | 9 | % | 6 | % | 5 | % | ||||||||||||||||||||||||
| AllianzGI China Equity |
— | — | 89 | % | — | — | — | — | — | — | — | — | ||||||||||||||||||||||||||||||||
| AllianzGI Convertible |
7 | 70 | % | — | — | — | — | — | — | — | — | — | ||||||||||||||||||||||||||||||||
| AllianzGI Global Fundamental Strategy |
1 | 9 | % | 90 | % | — | — | — | — | — | — | — | — | |||||||||||||||||||||||||||||||
| AllianzGI Global Managed Volatility |
— | — | 15 | % | 36 | % | — | 7 | % | 8 | % | 7 | % | 6 | % | — | — | |||||||||||||||||||||||||||
| AllianzGI Global Water |
8 | 84 | % | — | — | — | — | — | — | — | — | — | ||||||||||||||||||||||||||||||||
| AllianzGI High Yield Bond |
4 | 64 | % | — | — | — | — | — | — | — | — | — | ||||||||||||||||||||||||||||||||
| AllianzGI International Small-Cap |
3 | 59 | % | — | 8 | % | — | — | — | — | — | — | — | |||||||||||||||||||||||||||||||
| AllianzGI Micro Cap |
4 | 79 | % | — | — | — | — | — | — | — | — | — | ||||||||||||||||||||||||||||||||
| AllianzGI Multi-Asset Real Return |
1 | 8 | % | 89 | % | — | — | — | — | — | — | — | — | |||||||||||||||||||||||||||||||
| AllianzGI NFJ Emerging Markets Value |
1 | 59 | % | 34 | % | — | — | — | — | — | — | — | — | |||||||||||||||||||||||||||||||
| AllianzGI NFJ Global Dividend Value |
4 | 49 | % | — | 16 | % | — | — | — | — | — | — | — | |||||||||||||||||||||||||||||||
| AllianzGI NFJ International Small-Cap Value |
4 | 34 | % | 22 | % | 10 | % | — | — | — | — | — | — | — | ||||||||||||||||||||||||||||||
| AllianzGI NFJ International Value II |
1 | 84 | % | 14 | % | — | — | — | — | — | — | — | — | |||||||||||||||||||||||||||||||
| AllianzGI Short Duration High Income |
6 | 69 | % | — | — | — | — | — | — | — | — | — | ||||||||||||||||||||||||||||||||
| AllianzGI Structured Return |
4 | 58 | % | 39 | % | — | — | — | — | — | — | — | — | |||||||||||||||||||||||||||||||
| AllianzGI Ultra Micro Cap |
7 | 87 | % | — | — | — | — | — | — | — | — | — | ||||||||||||||||||||||||||||||||
| AllianzGI U.S. Equity-Hedged |
3 | 50 | % | 47 | % | — | — | — | — | — | — | — | — | |||||||||||||||||||||||||||||||
| AllianzGI U.S. Small-Cap Growth |
3 | 77 | % | — | — | — | — | — | — | — | — | — | ||||||||||||||||||||||||||||||||
| 274 | May 31, 2014 | | Semiannual Report |
Table of Contents
| 11. | AFFILIATED TRANSACTIONS |
An affiliate includes any company in which a Sub-Adviser owns 5% or more of a company’s outstanding voting securities at any point during the reporting period. The table below represents transactions in and earning from these affiliated issuers during the six months ended May 31, 2014.
| AllianzGI Best Styles Global Equity: | ||||||||||||||||||||||||||||
| Market Value 12/2/2013* |
Purchases at Cost |
Proceeds from Sales |
Unrealized Appreciation (Depreciation) |
Market Value 5/31/2014 |
Dividend Income |
Net Realized Gain(Loss) |
||||||||||||||||||||||
| Andersons, Inc. |
— | $ | 13,412 | $ | 29 | $ | (1,717 | ) | $ | 11,665 | $ | 50 | $ | (1 | ) | |||||||||||||
| Group 1 Automotive, Inc.† |
— | 6,079 | 5,720 | — | — | 15 | (359 | ) | ||||||||||||||||||||
| Home Loan Servicing Solutions Ltd. |
— | 14,260 | — | (590 | ) | 13,670 | 564 | — | ||||||||||||||||||||
| Jenoptik AG |
— | 11,436 | — | 1,087 | 12,523 | — | — | |||||||||||||||||||||
| Ju Teng International Holdings Ltd. |
— | 5,462 | 5,536 | — | — | — | 74 | |||||||||||||||||||||
| Mentor Graphics Corp. |
— | 39,565 | — | (1,402 | ) | 38,163 | 57 | — | ||||||||||||||||||||
| Olin Corp. |
— | 16,491 | — | 77 | 16,568 | 243 | — | |||||||||||||||||||||
| Sanderson Farms, Inc. |
— | 27,556 | — | 8,245 | 35,801 | 126 | — | |||||||||||||||||||||
| TAL International Group, Inc.† |
— | 22,648 | 18,602 | — | — | — | (4,046 | ) | ||||||||||||||||||||
| Trelleborg AB |
— | 12,636 | 13,677 | — | — | — | 1,041 | |||||||||||||||||||||
| Universal Corp.† |
— | 5,439 | 5,993 | — | — | 55 | 554 | |||||||||||||||||||||
| Westjet Airlines† |
— | 5,242 | 4,235 | — | — | 34 | (1,007 | ) | ||||||||||||||||||||
| j2 Global, Inc. |
— | 15,567 | — | 678 | 16,245 | 183 | — | |||||||||||||||||||||
| Totals |
— | $ | 195,793 | $ | 53,792 | $ | 6,378 | $ | 144,635 | $ | 1,327 | $ | (3,744 | ) | ||||||||||||||
| AllianzGI China Equity: | ||||||||||||||||||||||||||||
| Market Value 11/30/2013 |
Purchases at Cost |
Proceeds from Sales |
Unrealized Appreciation (Depreciation) |
Market Value 5/31/2014 |
Dividend Income |
Net Realized Gain(Loss) |
||||||||||||||||||||||
| Beijing Jingneng Clean Energy Co., Ltd.†† |
$ | 47,043 | $ | 22,316 | — | $ | 1,653 | $ | 63,426 | — | — | |||||||||||||||||
| China Everbright International Ltd.† |
276,691 | 19,188 | $ | 220,065 | 76,981 | 131,579 | $ | 561 | $ | 154,536 | ||||||||||||||||||
| China Suntien Green Energy Corp. Ltd. |
46,433 | 20,502 | — | (7,065 | ) | 57,207 | — | — | ||||||||||||||||||||
| Digital China Holdings Ltd. |
99,099 | 21,640 | — | (63,452 | ) | 95,751 | 2,411 | — | ||||||||||||||||||||
| Qingling Motors Co., Ltd. |
159,528 | — | — | 10,472 | 161,590 | — | — | |||||||||||||||||||||
| Tiangong International Co., Ltd.† |
140,329 | — | 41,156 | (18,897 | ) | 60,240 | 4,343 | (10,477 | ) | |||||||||||||||||||
| Totals |
$ | 769,123 | $ | 83,646 | $ | 261,221 | $ | (308 | ) | $ | 569,793 | $ | 7,315 | $ | 144,059 | |||||||||||||
| AllianzGI Global Water: | ||||||||||||||||||||||||||||
| Market Value 11/30/2013 |
Purchases at Cost |
Proceeds from Sales |
Unrealized Appreciation (Depreciation) |
Market Value 5/31/2014 |
Dividend Income |
Net Realized Gain(Loss) |
||||||||||||||||||||||
| China Everbright International Ltd.† |
$ | 3,393,922 | — | — | $ | 1,916,852 | $ | 3,886,040 | $ | 19,618 | — | |||||||||||||||||
| Norma Group SE |
— | $ | 3,144,910 | — | 188,137 | 3,333,047 | 43,020 | — | ||||||||||||||||||||
| Spectris PLC |
3,645,186 | — | — | 614,602 | 3,534,534 | 42,903 | — | |||||||||||||||||||||
| Totals |
$ | 7,039,108 | $ | 3,144,910 | — | $ | 2,719,591 | $ | 10,753,621 | $ | 105,541 | — | ||||||||||||||||
| AllianzGI International Small-Cap: | ||||||||||||||||||||||||||||
| Market Value 11/30/2013 |
Purchases at Cost |
Proceeds from Sales |
Unrealized Appreciation (Depreciation) |
Market Value 5/31/2014 |
Dividend Income |
Net Realized Gain(Loss) |
||||||||||||||||||||||
| AMS AG†† |
— | $ | 1,717,760 | — | $ | 112,232 | $ | 1,829,992 | — | — | ||||||||||||||||||
| Aareal Bank AG |
$ | 1,576,887 | 57,878 | $ | 133,066 | 1,104,682 | 1,943,809 | $ | 30,922 | $ | 35,522 | |||||||||||||||||
| Aveva Group PLC |
1,174,443 | 38,595 | 94,140 | 214,051 | 1,152,634 | 2,517 | (13,406 | ) | ||||||||||||||||||||
| Bechtle AG†† |
— | 1,698,865 | — | 130,453 | 1,829,317 | — | — | |||||||||||||||||||||
| Burckhardt Compression Holding AG† |
1,593,121 | 65,308 | 1,923,372 | — | — | — | 584,671 | |||||||||||||||||||||
| Semiannual Report | | May 31, 2014 | 275 |
Table of Contents
Notes to Financial Statements (cont’d)
May 31, 2014 (Unaudited)
| AllianzGI International Small-Cap (cont’d) | ||||||||||||||||||||||||||||
| Market Value 11/30/2013 |
Purchases at Cost |
Proceeds from Sales |
Unrealized Appreciation (Depreciation) |
Market Value 5/31/2014 |
Dividend Income |
Net Realized Gain(Loss) |
||||||||||||||||||||||
| CANCOM SE†† |
— | $ | 1,637,759 | $ | 44,804 | $ | 118,502 | $ | 1,711,863 | — | $ | 406 | ||||||||||||||||
| China Everbright International Ltd.† |
$ | 1,371,180 | 117,593 | 911,596 | 436,080 | 793,304 | $ | 3,631 | 543,367 | |||||||||||||||||||
| GameLoft SE†† |
— | 1,678,794 | — | (59,307 | ) | 1,619,487 | — | — | ||||||||||||||||||||
| Ju Teng International Holdings Ltd.†† |
1,103,899 | 118,519 | 206,083 | 522,708 | 1,180,079 | 29,877 | 24,219 | |||||||||||||||||||||
| Schoeller-Bleckmann Oilfield Equipment AG†† |
1,721,478 | 63,343 | 142,233 | 499,285 | 1,860,298 | 24,342 | (11,760 | ) | ||||||||||||||||||||
| SimCorp A/S |
2,325,489 | — | 133,170 | 988,063 | 2,122,534 | 33,824 | 7,378 | |||||||||||||||||||||
| Spectris PLC† |
1,026,442 | 34,637 | 1,021,172 | — | — | — | 57,968 | |||||||||||||||||||||
| Spirax-Sarco Engineering PLC† |
2,314,457 | 80,729 | 189,824 | 653,488 | 2,211,631 | 31,888 | (460 | ) | ||||||||||||||||||||
| Tiangong International Co., Ltd.† |
411,665 | — | 336,973 | — | — | — | (29,885 | ) | ||||||||||||||||||||
| Trelleborg AB |
1,458,571 | 103,848 | 116,544 | 305,442 | 1,625,373 | 31,260 | (3,272 | ) | ||||||||||||||||||||
| Unit 4 NV† |
1,347,794 | — | 1,375,398 | — | — | — | 1,075,027 | |||||||||||||||||||||
| Vacon PLC |
2,220,157 | 75,619 | 183,595 | 884,713 | 2,225,925 | 40,948 | 4,516 | |||||||||||||||||||||
| Totals |
$ | 19,645,583 | $ | 7,489,247 | $ | 6,811,970 | $ | 5,910,392 | $ | 22,106,246 | $ | 229,209 | $ | 2,274,291 | ||||||||||||||
| AllianzGI Micro Cap: | ||||||||||||||||||||||||||||
| Market Value 11/30/2013 |
Purchases at Cost |
Proceeds from Sales |
Unrealized Appreciation (Depreciation) |
Market Value 5/31/2014 |
Dividend Income |
Net Realized Gain(Loss) |
||||||||||||||||||||||
| Arctic Cat, Inc.†,†† |
$ | 315,112 | $ | 5,890 | $ | 239,433 | — | — | $ | 500 | $ | 141,024 | ||||||||||||||||
| Neenah Paper, Inc. |
344,318 | 18,013 | 34,539 | $ | 243,884 | $ | 378,484 | 3,638 | 14,103 | |||||||||||||||||||
| Totals |
$ | 659,430 | $ | 23,903 | $ | 273,972 | $ | 243,884 | $ | 378,484 | $ | 4,138 | $ | 155,127 | ||||||||||||||
| AllianzGI NFJ International Small-Cap Value: | ||||||||||||||||||||||||||||
| Market Value 11/30/2013 |
Purchases at Cost |
Proceeds from Sales |
Unrealized Appreciation (Depreciation) |
Market Value 5/31/2014 |
Dividend Income |
Net Realized Gain(Loss) |
||||||||||||||||||||||
| Norma Group SE |
$ | 70,666 | $ | 48,446 | — | $ | 41,581 | $ | 125,417 | $ | 1,619 | — | ||||||||||||||||
| AllianzGI U.S. Small-Cap Growth: | ||||||||||||||||||||||||||||
| Market Value 11/30/2013 |
Purchases at Cost |
Proceeds from Sales |
Unrealized Appreciation (Depreciation) |
Market Value 5/31/2014 |
Dividend Income |
Net Realized Gain(Loss) |
||||||||||||||||||||||
| Arctic Cat, Inc.†,†† |
$ | 191,318 | $ | 18,952 | $ | 155,799 | — | — | $ | 375 | $ | 7,240 | ||||||||||||||||
| Curtiss-Wright Corp.† |
258,573 | 58,630 | 11,687 | $ | 145,839 | $ | 377,925 | 729 | 487 | |||||||||||||||||||
| Mentor Graphics Corp.†† |
328,865 | 65,361 | 10,682 | 164,528 | 360,506 | 1,498 | (1,554 | ) | ||||||||||||||||||||
| Totals |
$ | 778,756 | $ | 142,943 | $ | 178,168 | $ | 310,367 | $ | 738,431 | $ | 2,602 | $ | 6,173 | ||||||||||||||
| † | Not affiliated at May 31, 2014. |
| †† | Not affiliated at November 30, 2013. |
| * | Commencement of operations |
Certain additional purchases of existing portfolio holdings that were not considered affiliated in prior years, resulted in the Funds owning in excess of 5% of the outstanding shares of certain issues at May 31, 2014. The percentages and market values of the affiliated transactions represent below include both acquisitions of new investments and prior year holdings that became affiliated during the reporting period.
| AllianzGI Best Styles Global Equity: | ||||||||||||
| Issuer Name | Sub-Adviser’s % Holding |
Market Value |
Market Value as a % of Fund’s Net Assets |
|||||||||
| Andersons, Inc. |
8.47 | % | $ | 11,665 | 0.03 | % | ||||||
| Home Loan Servicing Solutions Ltd. |
6.85 | % | 13,670 | 0.04 | % | |||||||
| 276 | May 31, 2014 | | Semiannual Report |
Table of Contents
| AllianzGI Best Styles Global Equity (cont’d) | ||||||||||||
| Issuer Name | Sub-Adviser’s % Holding |
Market Value |
Market Value as a % of Fund’s Net Assets |
|||||||||
| j2 Global, Inc. |
5.05 | % | $ | 16,245 | 0.04 | % | ||||||
| Jenoptik AG |
5.16 | % | 12,523 | 0.03 | % | |||||||
| Mentor Graphics Corp. |
5.09 | % | 38,163 | 0.10 | % | |||||||
| Olin Corp. |
5.39 | % | 16,568 | 0.05 | % | |||||||
| Sanderson Farms, Inc. |
5.84 | % | 35,801 | 0.10 | % | |||||||
| Totals |
$ | 144,635 | 0.39 | % | ||||||||
| AllianzGI China Equity: | ||||||||||||
| Issuer Name | Sub-Adviser’s % Holding |
Market Value |
Market Value as a % of Fund’s Net Assets |
|||||||||
| Beijing Jingneng Clean Energy Co., Ltd. |
6.35 | % | $ | 63,426 | 1.51 | % | ||||||
| China Suntien Green Energy Corp. Ltd. |
11.62 | % | 57,207 | 1.36 | % | |||||||
| Digital China Holdings Ltd. |
8.79 | % | 95,751 | 2.28 | % | |||||||
| Qingling Motors Co., Ltd. |
8.84 | % | 161,590 | 3.85 | % | |||||||
| Totals |
$ | 377,974 | 9.00 | % | ||||||||
| AllianzGI Global Water: | ||||||||||||
| Issuer Name | Sub-Adviser’s % Holding |
Market Value |
Market Value as a % of Fund’s Net Assets |
|||||||||
| Norma Group SE |
6.70 | % | $ | 3,333,047 | 1.01 | % | ||||||
| Spectris PLC |
5.49 | % | 3,534,534 | 1.07 | % | |||||||
| Totals |
$ | 6,867,581 | 2.08 | % | ||||||||
| AllianzGI International Small-Cap: | ||||||||||||
| Issuer Name | Sub-Adviser’s % Holding |
Market Value |
Market Value as a % of Fund’s Net Assets |
|||||||||
| Aareal Bank AG |
7.60 | % | $ | 1,943,809 | 1.78 | % | ||||||
| AMS AG |
5.27 | % | 1,829,992 | 1.67 | % | |||||||
| Aveva Group PLC |
8.61 | % | 1,152,634 | 1.05 | % | |||||||
| Bechtle AG |
7.32 | % | 1,829,317 | 1.67 | % | |||||||
| CANCOM SE |
16.28 | % | 1,711,863 | 1.56 | % | |||||||
| GameLoft SE |
6.41 | % | 1,619,487 | 1.48 | % | |||||||
| Ju Teng International Holdings Ltd. |
7.85 | % | 1,180,079 | 1.08 | % | |||||||
| Schoeller-Bleckmann Oilfield Equipment AG |
5.76 | % | 1,860,298 | 1.70 | % | |||||||
| SimCorp A/S |
13.23 | % | 2,122,534 | 1.94 | % | |||||||
| Trelleborg AB |
6.00 | % | 1,625,373 | 1.48 | % | |||||||
| Vacon PLC |
6.16 | % | 2,225,925 | 2.03 | % | |||||||
| Totals |
$ | 19,101,311 | 17.44 | % | ||||||||
| AllianzGI Micro Cap: | ||||||||||||
| Issuer Name | Sub-Adviser’s % Holding |
Market Value |
Market Value as a % of Fund’s Net Assets |
|||||||||
| Neenah Paper, Inc. |
6.17 | % | $ | 378,484 | 0.91 | % | ||||||
| Semiannual Report | | May 31, 2014 | 277 |
Table of Contents
Notes to Financial Statements (cont’d)
May 31, 2014 (Unaudited)
| AllianzGI NFJ International Small-Cap Value: | ||||||||||||
| Issuer Name | Sub-Adviser’s % Holding |
Market Value |
Market Value as a % of Fund’s Net Assets |
|||||||||
| Norma Group SE |
6.70 | % | $ | 125,417 | 0.58 | % | ||||||
| AllianzGI U.S. Small-Cap Growth: | ||||||||||||
| Issuer Name | Sub-Adviser’s % Holding |
Market Value |
Market Value as a % of Fund’s Net Assets |
|||||||||
| Mentors Graphics Corp. |
5.09 | % | $ | 360,506 | 1.00 | % | ||||||
The tables below show the transactions in and earnings from affiliates for the six months ended May 31, 2014:
| AllianzGI Retirement 2015: | ||||||||||||||||||||||||||||
| Market Value 11/30/2013 |
Purchases at Cost |
Proceeds from Sales |
Unrealized Appreciation (Depreciation) |
Market Value 5/31/2014 |
Dividend Income |
Net Realized Gain(Loss) |
||||||||||||||||||||||
| AllianzGI Behavioral Advantage Large Cap |
$ | 336,451 | $ | 447,493 | $ | 229,384 | $ | 57,772 | $ | 575,119 | $ | 3,306 | $ | 353 | ||||||||||||||
| AllianzGI Best Styles Global Equity |
— | 1,303,771 | 352,236 | 86,623 | 1,042,229 | — | 4,071 | |||||||||||||||||||||
| AllianzGI Emerging Markets Opportunities |
392,169 | 114,361 | 475,608 | — | — | 8,351 | (1,646 | ) | ||||||||||||||||||||
| AllianzGI Global Managed Volatility |
220,240 | 144,687 | 79,344 | 40,578 | 290,155 | 9,353 | (769 | ) | ||||||||||||||||||||
| AllianzGI Global Natural Resources |
280,678 | 188,559 | 269,339 | 75,886 | 230,916 | 2,446 | 20,684 | |||||||||||||||||||||
| AllianzGI Income & Growth |
889,009 | 287,208 | 318,587 | 140,929 | 868,525 | 11,847 | 7,268 | |||||||||||||||||||||
| AllianzGI International Managed Volatility |
— | 335,696 | 75,929 | 27,986 | 289,897 | — | 2,144 | |||||||||||||||||||||
| AllianzGI International Small-Cap |
292,230 | 175,617 | 182,804 | 39,177 | 270,836 | 2,383 | 4,089 | |||||||||||||||||||||
| AllianzGI NFJ Dividend Value |
776,229 | 342,293 | 584,578 | 218,123 | 580,761 | 8,870 | 66,440 | |||||||||||||||||||||
| AllianzGI NFJ Global Dividend Value |
329,686 | 103,193 | 146,510 | 69,781 | 289,244 | 3,930 | 14,642 | |||||||||||||||||||||
| AllianzGI NFJ International Small-Cap Value |
110,071 | 69,634 | 44,327 | 9,846 | 144,949 | 2,033 | 500 | |||||||||||||||||||||
| AllianzGI NFJ International Value |
554,557 | 370,346 | 236,510 | 89,495 | 722,258 | 3,912 | 1,221 | |||||||||||||||||||||
| AllianzGI NFJ Mid-Cap Value |
204,907 | 548,810 | 218,161 | 95,587 | 579,463 | 6,649 | 3,695 | |||||||||||||||||||||
| AllianzGI NFJ Small-Cap Value |
258,530 | — | 254,041 | — | — | — | 89,876 | |||||||||||||||||||||
| AllianzGI Short Duration High Income |
658,875 | 1,276,108 | 341,328 | 6,899 | 1,593,301 | 35,683 | (1,187 | ) | ||||||||||||||||||||
| AllianzGI U.S. Managed Volatility |
329,212 | 771,380 | 267,804 | 68,448 | 871,401 | 5,830 | 1,222 | |||||||||||||||||||||
| PIMCO 1-5 Year U.S. TIPS Index |
2,743,671 | 3,027,301 | 2,294,457 | 19,659 | 3,481,768 | 7,802 | (9,286 | ) | ||||||||||||||||||||
| PIMCO CommoditiesPLUS® Strategy |
440,214 | 194,147 | 234,090 | 28,813 | 431,598 | 682 | (4,505 | ) | ||||||||||||||||||||
| PIMCO Commodity RealReturn Strategy |
— | 491,517 | 50,204 | (9,944 | ) | 430,636 | — | (733 | ) | |||||||||||||||||||
| PIMCO Floating Income |
983,990 | 1,084,385 | 639,841 | 21,455 | 1,456,233 | 30,778 | (8,037 | ) | ||||||||||||||||||||
| PIMCO Foreign Bond (U.S. Dollar-Hedged) |
879,035 | 545,693 | 571,824 | 44,530 | 870,004 | 13,667 | (1,135 | ) | ||||||||||||||||||||
| PIMCO Income |
1,974,076 | 1,918,357 | 1,074,968 | 196,884 | 2,911,796 | 74,050 | 8,463 | |||||||||||||||||||||
| PIMCO International StocksPLUS® AR Strategy (U.S. Dollar-Hedged) |
552,298 | 395,499 | 253,981 | 48,222 | 722,891 | 16,273 | 1,199 | |||||||||||||||||||||
| PIMCO Mortgage Opportunities |
1,427,913 | 765,907 | 1,050,751 | 13,922 | 1,163,179 | 30,312 | 2,286 | |||||||||||||||||||||
| PIMCO Real Return |
2,529,844 | 3,322,276 | 3,402,233 | 256,562 | 2,597,685 | 17,930 | 47,207 | |||||||||||||||||||||
| PIMCO Senior Floating Rate |
— | 1,954,664 | 352,847 | (2,187 | ) | 1,597,406 | 23,074 | (2,224 | ) | |||||||||||||||||||
| PIMCO Short-Term |
2,628,314 | 1,547,051 | 1,858,749 | 31,449 | 2,317,957 | 11,679 | 579 | |||||||||||||||||||||
| Totals |
$ | 19,792,199 | $ | 21,725,953 | $ | 15,860,435 | $ | 1,676,495 | $ | 26,330,207 | $ | 330,840 | $ | 246,417 | ||||||||||||||
| 278 | May 31, 2014 | | Semiannual Report |
Table of Contents
| AllianzGI Retirement 2020: | ||||||||||||||||||||||||||||
| Market Value 11/30/2013 |
Purchases at Cost |
Proceeds from Sales |
Unrealized Appreciation (Depreciation) |
Market Value 5/31/2014 |
Dividend Income |
Net Realized Gain(Loss) |
||||||||||||||||||||||
| AllianzGI Behavioral Advantage Large Cap |
$ | 629,058 | $ | 824,277 | $ | 264,053 | $ | 123,970 | $ | 1,234,531 | $ | 7,085 | $ | 1,174 | ||||||||||||||
| AllianzGI Best Styles Global Equity |
— | 2,097,393 | 254,456 | 160,671 | 2,006,781 | — | 3,173 | |||||||||||||||||||||
| AllianzGI Emerging Markets Opportunities |
669,346 | 247,354 | 862,541 | — | — | 14,905 | (1,618 | ) | ||||||||||||||||||||
| AllianzGI Global Managed Volatility |
492,989 | 293,245 | 45,939 | 67,941 | 753,828 | 22,538 | (1,548 | ) | ||||||||||||||||||||
| AllianzGI Global Natural Resources |
494,549 | 278,158 | 331,614 | 120,779 | 502,676 | 4,534 | 26,115 | |||||||||||||||||||||
| AllianzGI Income & Growth |
1,327,442 | 297,369 | 139,189 | 162,129 | 1,504,268 | 19,279 | 2,233 | |||||||||||||||||||||
| AllianzGI International Managed Volatility |
— | 488,577 | 37,158 | 48,381 | 501,156 | — | 1,356 | |||||||||||||||||||||
| AllianzGI International Small-Cap |
497,566 | 246,184 | 247,197 | 59,234 | 473,703 | 3,824 | 11,184 | |||||||||||||||||||||
| AllianzGI NFJ Dividend Value |
1,157,014 | 502,923 | 735,146 | 291,024 | 1,003,794 | 14,616 | 68,371 | |||||||||||||||||||||
| AllianzGI NFJ Global Dividend Value |
664,056 | 154,872 | 80,978 | 142,432 | 748,557 | 9,682 | 3,637 | |||||||||||||||||||||
| AllianzGI NFJ International Small-Cap Value |
199,886 | 116,099 | 34,491 | 20,252 | 300,905 | 3,918 | 568 | |||||||||||||||||||||
| AllianzGI NFJ International Value |
894,487 | 549,799 | 158,068 | 123,554 | 1,349,775 | 6,790 | 747 | |||||||||||||||||||||
| AllianzGI NFJ Mid-Cap Value |
651,547 | 558,917 | 277,754 | 216,552 | 1,006,301 | 12,159 | 7,377 | |||||||||||||||||||||
| AllianzGI NFJ Small-Cap Value |
144,102 | — | 141,600 | — | — | — | 58,016 | |||||||||||||||||||||
| AllianzGI Short Duration High Income |
1,157,753 | 1,688,245 | 94,514 | 5,007 | 2,750,748 | 58,949 | (781 | ) | ||||||||||||||||||||
| AllianzGI U.S. Managed Volatility |
659,392 | 1,123,957 | 97,741 | 136,761 | 1,760,944 | 12,487 | 9 | |||||||||||||||||||||
| PIMCO 1-5 Year U.S. TIPS Index |
4,121,751 | 5,205,250 | 3,582,189 | 26,762 | 5,747,950 | 12,881 | (16,389 | ) | ||||||||||||||||||||
| PIMCO CommoditiesPLUS® Strategy |
988,915 | 468,333 | 513,025 | 68,813 | 1,040,741 | 1,631 | 8,778 | |||||||||||||||||||||
| PIMCO Commodity RealReturn Strategy |
— | 1,066,111 | — | (24,129 | ) | 1,041,982 | — | — | ||||||||||||||||||||
| PIMCO Floating Income |
1,823,422 | 1,203,303 | 562,858 | 31,539 | 2,515,105 | 55,869 | (10,956 | ) | ||||||||||||||||||||
| PIMCO Foreign Bond (U.S. Dollar-Hedged) |
729,928 | 1,056,468 | 316,432 | 54,895 | 1,502,173 | 19,032 | (1,077 | ) | ||||||||||||||||||||
| PIMCO Income |
2,986,303 | 2,571,207 | 1,160,388 | 202,604 | 4,530,641 | 111,812 | (8,151 | ) | ||||||||||||||||||||
| PIMCO International StocksPLUS® AR Strategy (U.S. Dollar-Hedged) |
827,471 | 559,786 | 185,038 | 80,446 | 1,251,747 | 26,632 | 170 | |||||||||||||||||||||
| PIMCO Mortgage Opportunities |
1,990,319 | 1,567,287 | 1,824,260 | 20,379 | 1,757,192 | 42,940 | (4,322 | ) | ||||||||||||||||||||
| PIMCO Real Return |
3,632,445 | 4,945,770 | 4,324,206 | 304,492 | 4,500,335 | 29,152 | (97,321 | ) | ||||||||||||||||||||
| PIMCO Senior Floating Rate |
— | 2,866,717 | 104,179 | (6,481 | ) | 2,755,484 | 37,898 | (573 | ) | |||||||||||||||||||
| PIMCO Short-Term |
2,977,911 | 2,353,173 | 2,583,184 | 23,965 | 2,749,227 | 12,815 | 1,982 | |||||||||||||||||||||
| Totals |
$ | 29,717,652 | $ | 33,330,774 | $ | 18,958,198 | $ | 2,461,972 | $ | 45,290,544 | $ | 541,428 | $ | 52,154 | ||||||||||||||
| AllianzGI Retirement 2025: | ||||||||||||||||||||||||||||
| Market Value |
Purchases at Cost |
Proceeds from Sales |
Unrealized Appreciation (Depreciation) |
Market Value |
Dividend Income |
Net Realized Gain(Loss) |
||||||||||||||||||||||
| AllianzGI Behavioral Advantage Large Cap |
$ | 1,178,110 | $ | 1,516,629 | $ | 723,432 | $ | 223,865 | $ | 2,033,305 | $ | 12,424 | $ | 2,261 | ||||||||||||||
| AllianzGI Best Styles Global Equity |
— | 2,642,250 | 227,651 | 195,248 | 2,609,450 | — | (397 | ) | ||||||||||||||||||||
| AllianzGI Emerging Markets Opportunities |
856,660 | 280,162 | 1,073,747 | — | — | 18,676 | (31,691 | ) | ||||||||||||||||||||
| AllianzGI Global Managed Volatility |
736,362 | 596,533 | 96,993 | 87,812 | 1,267,530 | 33,138 | (4,499 | ) | ||||||||||||||||||||
| AllianzGI Global Natural Resources |
663,264 | 513,128 | 400,381 | 165,095 | 870,578 | 6,062 | 21,854 | |||||||||||||||||||||
| AllianzGI Income & Growth |
1,356,132 | 528,397 | 172,536 | 116,888 | 1,732,715 | 21,078 | 55 | |||||||||||||||||||||
| AllianzGI International Managed Volatility |
— | 570,245 | 49,658 | 54,375 | 575,946 | — | 984 | |||||||||||||||||||||
| AllianzGI International Small-Cap |
684,996 | 434,680 | 219,633 | 83,734 | 866,919 | 5,754 | 2,608 | |||||||||||||||||||||
| AllianzGI NFJ Dividend Value |
1,189,139 | 644,534 | 778,907 | 282,709 | 1,148,404 | 15,244 | 40,507 | |||||||||||||||||||||
| AllianzGI NFJ Global Dividend Value |
744,836 | 347,309 | 80,754 | 162,537 | 1,032,566 | 11,331 | 1,354 | |||||||||||||||||||||
| AllianzGI NFJ International Small-Cap Value |
271,283 | 206,344 | 45,295 | 32,064 | 462,475 | 5,238 | (9 | ) | ||||||||||||||||||||
| AllianzGI NFJ International Value |
1,015,517 | 844,715 | 234,898 | 166,148 | 1,710,738 | 7,563 | 438 | |||||||||||||||||||||
| AllianzGI NFJ Mid-Cap Value |
780,199 | 534,975 | 226,459 | 259,340 | 1,169,175 | 11,661 | 4,200 | |||||||||||||||||||||
| AllianzGI Short Duration High Income |
1,522,853 | 1,714,668 | 101,505 | 2,745 | 3,136,614 | 64,317 | (919 | ) | ||||||||||||||||||||
| Semiannual Report | | May 31, 2014 | 279 |
Table of Contents
Notes to Financial Statements (cont’d)
May 31, 2014 (Unaudited)
| AllianzGI Retirement 2025 (cont’d) | ||||||||||||||||||||||||||||
| Market Value |
Purchases at Cost |
Proceeds from Sales |
Unrealized Appreciation (Depreciation) |
Market Value |
Dividend Income |
Net Realized Gain(Loss) |
||||||||||||||||||||||
| AllianzGI U.S. Managed Volatility |
$ | 670,782 | $ | 1,704,591 | $ | 178,472 | $ | 163,420 | $ | 2,304,768 | $ | 12,519 | $ | (571 | ) | |||||||||||||
| PIMCO 1-5 Year U.S. TIPS Index |
3,031,318 | 5,329,906 | 3,790,115 | 13,689 | 4,560,853 | 10,220 | (18,753 | ) | ||||||||||||||||||||
| PIMCO CommoditiesPLUS® Strategy |
1,180,814 | 565,125 | 627,620 | 86,395 | 1,240,323 | 1,935 | 19,328 | |||||||||||||||||||||
| PIMCO Commodity RealReturn Strategy |
— | 1,275,503 | 13,796 | (28,668 | ) | 1,232,856 | — | (183 | ) | |||||||||||||||||||
| PIMCO Floating Income |
1,865,790 | 1,633,941 | 685,784 | 43,224 | 2,872,587 | 61,238 | (13,585 | ) | ||||||||||||||||||||
| PIMCO Foreign Bond (U.S. Dollar-Hedged) |
845,846 | 1,210,354 | 373,233 | 29,178 | 1,713,555 | 20,339 | (2,507 | ) | ||||||||||||||||||||
| PIMCO Income |
2,703,734 | 3,165,584 | 1,121,074 | 148,111 | 4,888,949 | 115,758 | (12,288 | ) | ||||||||||||||||||||
| PIMCO International StocksPLUS® AR Strategy (U.S. Dollar-Hedged) |
1,016,487 | 866,325 | 216,290 | 104,251 | 1,736,571 | 32,280 | (1,967 | ) | ||||||||||||||||||||
| PIMCO Mortgage Opportunities |
2,027,310 | 1,711,993 | 1,757,412 | 20,708 | 2,006,366 | 45,515 | (10,897 | ) | ||||||||||||||||||||
| PIMCO Real Return |
3,712,884 | 5,359,335 | 4,708,122 | 188,505 | 4,622,373 | 30,169 | (202,264 | ) | ||||||||||||||||||||
| PIMCO Senior Floating Rate |
— | 3,243,431 | 95,526 | (7,157 | ) | 3,140,217 | 41,793 | (531 | ) | |||||||||||||||||||
| PIMCO Short-Term |
2,359,331 | 2,646,263 | 2,176,957 | 14,383 | 2,831,141 | 12,287 | 2,182 | |||||||||||||||||||||
| Totals |
$ | 30,413,647 | $ | 40,086,920 | $ | 20,176,250 | $ | 2,608,599 | $ | 51,766,974 | $ | 596,539 | $ | (205,290 | ) | |||||||||||||
| AllianzGI Retirement 2030: | ||||||||||||||||||||||||||||
| Market Value 11/30/2013 |
Purchases at Cost |
Proceeds from Sales |
Unrealized Appreciation (Depreciation) |
Market Value |
Dividend Income |
Net Realized Gain(Loss) |
||||||||||||||||||||||
| AllianzGI Behavioral Advantage Large Cap |
$ | 1,384,263 | $ | 1,156,488 | $ | 464,334 | $ | 270,830 | $ | 2,135,066 | $ | 13,953 | $ | (2,249 | ) | |||||||||||||
| AllianzGI Best Styles Global Equity |
— | 3,288,149 | 203,759 | 223,420 | 3,308,501 | — | 691 | |||||||||||||||||||||
| AllianzGI Emerging Markets Opportunities |
1,421,222 | 423,212 | 1,194,266 | 129,876 | 592,329 | 29,356 | (38,488 | ) | ||||||||||||||||||||
| AllianzGI Global Managed Volatility |
878,025 | 665,039 | 70,511 | 116,883 | 1,502,980 | 42,335 | (5,050 | ) | ||||||||||||||||||||
| AllianzGI Global Natural Resources |
800,062 | 520,895 | 515,905 | 217,589 | 904,024 | 6,804 | 28,377 | |||||||||||||||||||||
| AllianzGI Income & Growth |
1,811,917 | 1,083,046 | 506,587 | 170,722 | 2,401,885 | 28,189 | 12,563 | |||||||||||||||||||||
| AllianzGI International Managed Volatility |
521,775 | 1,133,730 | 87,396 | 145,438 | 1,677,428 | 19,136 | (570 | ) | ||||||||||||||||||||
| AllianzGI International Small-Cap |
1,011,338 | 487,615 | 248,620 | 187,454 | 1,199,762 | 8,621 | 5,200 | |||||||||||||||||||||
| AllianzGI NFJ Dividend Value |
1,604,348 | 927,104 | 1,334,880 | 380,623 | 1,321,171 | 19,646 | 102,276 | |||||||||||||||||||||
| AllianzGI NFJ Global Dividend Value |
1,007,783 | 258,599 | 93,717 | 214,276 | 1,190,681 | 14,622 | 4,422 | |||||||||||||||||||||
| AllianzGI NFJ International Small-Cap Value |
404,702 | 205,826 | 47,949 | 40,434 | 600,139 | 7,353 | (22 | ) | ||||||||||||||||||||
| AllianzGI NFJ International Value |
1,808,711 | 892,617 | 992,037 | 227,039 | 1,786,872 | 12,735 | 24,967 | |||||||||||||||||||||
| AllianzGI NFJ Mid-Cap Value |
972,250 | 1,087,027 | 676,336 | 337,455 | 1,506,944 | 19,414 | 23,894 | |||||||||||||||||||||
| AllianzGI NFJ Small-Cap Value |
314,934 | — | 309,466 | — | — | — | 128,715 | |||||||||||||||||||||
| AllianzGI Short Duration High Income |
2,006,727 | 1,395,930 | 121,792 | 9,108 | 3,281,462 | 68,487 | (1,343 | ) | ||||||||||||||||||||
| AllianzGI U.S. Managed Volatility |
1,400,074 | 1,597,986 | 687,994 | 193,691 | 2,408,699 | 24,599 | 5,140 | |||||||||||||||||||||
| AllianzGI U.S. Small-Cap Growth |
326,438 | 359,387 | 59,778 | 124,661 | 602,340 | — | (1,506 | ) | ||||||||||||||||||||
| PIMCO 1-5 Year U.S. TIPS Index |
2,006,566 | 4,058,973 | 2,768,820 | (1,839 | ) | 3,282,079 | 7,355 | (7,306 | ) | |||||||||||||||||||
| PIMCO CommoditiesPLUS® Strategy |
1,599,811 | 547,310 | 826,168 | 102,129 | 1,470,233 | 2,450 | 17,750 | |||||||||||||||||||||
| PIMCO Commodity RealReturn Strategy |
200,547 | 1,555,249 | 254,016 | (33,989 | ) | 1,470,052 | — | (17,292 | ) | |||||||||||||||||||
| PIMCO Floating Income |
2,212,295 | 1,390,794 | 665,210 | 49,295 | 3,004,215 | 68,682 | (13,594 | ) | ||||||||||||||||||||
| PIMCO Foreign Bond (U.S. Dollar-Hedged) |
1,006,020 | 829,374 | 365,861 | 52,253 | 1,497,431 | 19,416 | 1,418 | |||||||||||||||||||||
| PIMCO Income |
3,220,368 | 2,815,786 | 1,078,675 | 198,821 | 5,104,510 | 122,483 | (8,235 | ) | ||||||||||||||||||||
| PIMCO International StocksPLUS® AR Strategy (U.S. Dollar-Hedged) |
1,405,555 | 870,795 | 246,780 | 117,760 | 2,108,702 | 42,043 | (1,654 | ) | ||||||||||||||||||||
| PIMCO Mortgage Opportunities |
2,414,740 | 1,569,973 | 2,213,064 | 21,588 | 1,796,938 | 46,957 | (6,631 | ) | ||||||||||||||||||||
| PIMCO Real Return |
1,598,057 | 3,559,261 | 3,499,863 | 138,185 | 1,788,672 | 12,463 | 27,654 | |||||||||||||||||||||
| PIMCO Senior Floating Rate |
— | 3,424,704 | 128,966 | (7,979 | ) | 3,287,048 | 44,135 | (711 | ) | |||||||||||||||||||
| PIMCO Short-Term |
2,810,234 | 2,900,197 | 3,027,756 | 9,532 | 2,683,346 | 11,889 | 6,589 | |||||||||||||||||||||
| Totals |
$ | 36,148,762 | $ | 39,005,066 | $ | 22,690,506 | $ | 3,635,255 | $ | 53,913,509 | $ | 693,123 | $ | 285,005 | ||||||||||||||
| 280 | May 31, 2014 | | Semiannual Report |
Table of Contents
| AllianzGI Retirement 2035: | ||||||||||||||||||||||||||||
| Market Value 11/30/2013 |
Purchases at Cost |
Proceeds from Sales |
Unrealized Appreciation (Depreciation) |
Market Value 5/31/2014 |
Dividend Income |
Net Realized Gain(Loss) |
||||||||||||||||||||||
| AllianzGI Behavioral Advantage Large Cap |
$ | 1,288,627 | $ | 1,356,062 | $ | 585,712 | $ | 225,251 | $ | 2,104,930 | $ | 12,705 | $ | 12,893 | ||||||||||||||
| AllianzGI Best Styles Global Equity |
— | 3,585,528 | 48,830 | 238,317 | 3,776,046 | — | 1,031 | |||||||||||||||||||||
| AllianzGI Disciplined Equity |
147,300 | — | 145,604 | — | — | — | 37,820 | |||||||||||||||||||||
| AllianzGI Emerging Markets Opportunities |
1,132,234 | 389,395 | 969,463 | 48,929 | 502,612 | 23,631 | (48,799 | ) | ||||||||||||||||||||
| AllianzGI Global Managed Volatility |
732,104 | 498,625 | 13,511 | 70,793 | 1,244,739 | 31,350 | (1,077 | ) | ||||||||||||||||||||
| AllianzGI Global Natural Resources |
587,046 | 523,671 | 443,442 | 142,855 | 750,648 | 5,045 | 20,350 | |||||||||||||||||||||
| AllianzGI Income & Growth |
1,388,609 | 849,404 | 266,751 | 99,514 | 1,988,328 | 22,335 | 5,206 | |||||||||||||||||||||
| AllianzGI International Managed Volatility |
589,014 | 1,019,561 | 55,518 | 144,673 | 1,662,479 | 21,827 | (1,238 | ) | ||||||||||||||||||||
| AllianzGI International Small-Cap |
1,068,568 | 524,742 | 309,725 | 142,054 | 1,232,253 | 8,303 | 7,673 | |||||||||||||||||||||
| AllianzGI NFJ Dividend Value |
1,471,493 | 803,997 | 801,727 | 324,069 | 1,597,591 | 19,083 | 57,695 | |||||||||||||||||||||
| AllianzGI NFJ Global Dividend Value |
1,183,158 | 836,864 | 60,775 | 240,639 | 2,002,661 | 22,316 | (630 | ) | ||||||||||||||||||||
| AllianzGI NFJ International Small-Cap Value |
356,346 | 229,566 | 24,254 | 38,539 | 597,887 | 6,542 | 202 | |||||||||||||||||||||
| AllianzGI NFJ International Value |
1,533,641 | 795,123 | 890,109 | 194,189 | 1,500,342 | 10,911 | 11,974 | |||||||||||||||||||||
| AllianzGI NFJ Mid-Cap Value |
1,180,593 | 605,969 | 401,026 | 348,227 | 1,497,220 | 16,884 | 17,764 | |||||||||||||||||||||
| AllianzGI Short Duration High Income |
1,472,460 | 1,033,046 | 67,330 | 1,767 | 2,438,130 | 52,291 | (821 | ) | ||||||||||||||||||||
| AllianzGI U.S. Managed Volatility |
1,115,379 | 1,576,183 | 554,939 | 164,042 | 2,230,638 | 19,801 | 1,551 | |||||||||||||||||||||
| AllianzGI U.S. Small-Cap Growth |
359,343 | 380,486 | 83,956 | 88,278 | 630,775 | — | 953 | |||||||||||||||||||||
| PIMCO 1-5 Year U.S. TIPS Index |
1,470,225 | 2,772,919 | 2,265,402 | (1,102 | ) | 1,967,213 | 4,408 | (5,959 | ) | |||||||||||||||||||
| PIMCO CommoditiesPLUS® Strategy |
1,320,616 | 492,649 | 566,360 | 93,459 | 1,363,759 | 2,043 | 5,676 | |||||||||||||||||||||
| PIMCO Commodity RealReturn Strategy |
294,307 | 1,217,566 | 169,989 | (20,511 | ) | 1,332,454 | — | (20,110 | ) | |||||||||||||||||||
| PIMCO Floating Income |
1,623,246 | 1,513,840 | 707,523 | 46,394 | 2,481,817 | 52,045 | (13,504 | ) | ||||||||||||||||||||
| PIMCO Income |
2,215,217 | 2,124,433 | 968,947 | 107,292 | 3,470,183 | 81,445 | (16,112 | ) | ||||||||||||||||||||
| PIMCO International StocksPLUS® AR Strategy (U.S. Dollar-Hedged) |
1,178,659 | 890,227 | 125,434 | 102,901 | 2,018,239 | 35,867 | 169 | |||||||||||||||||||||
| PIMCO Mortgage Opportunities |
1,476,133 | 1,548,734 | 1,560,271 | 16,815 | 1,482,944 | 31,086 | (8,634 | ) | ||||||||||||||||||||
| PIMCO Real Return |
— | 2,399,332 | 1,479,985 | 41,269 | 999,367 | 5,276 | 38,751 | |||||||||||||||||||||
| PIMCO Senior Floating Rate |
— | 2,513,653 | 69,868 | (3,996 | ) | 2,439,436 | 31,781 | (353 | ) | |||||||||||||||||||
| PIMCO Short-Term |
1,325,591 | 1,689,760 | 1,785,906 | 954 | 1,228,443 | 4,410 | 5,940 | |||||||||||||||||||||
| Totals |
$ | 26,509,909 | $ | 32,171,335 | $ | 15,422,357 | $ | 2,895,611 | $ | 44,541,134 | $ | 521,385 | $ | 108,411 | ||||||||||||||
| AllianzGI Retirement 2040: | ||||||||||||||||||||||||||||
| Market Value 11/30/2013 |
Purchases at Cost |
Proceeds from Sales |
Unrealized Appreciation (Depreciation) |
Market Value 5/31/2014 |
Dividend Income |
Net Realized Gain(Loss) |
||||||||||||||||||||||
| AllianzGI Behavioral Advantage Large Cap |
$ | 1,215,745 | $ | 1,531,718 | $ | 615,096 | $ | 241,903 | $ | 2,185,287 | $ | 13,473 | $ | 3,061 | ||||||||||||||
| AllianzGI Best Styles Global Equity |
— | 3,255,328 | 69,214 | 232,923 | 3,419,029 | — | (8 | ) | ||||||||||||||||||||
| AllianzGI Disciplined Equity |
404,320 | 78,796 | 478,690 | — | — | — | 182,364 | |||||||||||||||||||||
| AllianzGI Emerging Markets Opportunities |
1,172,234 | 393,429 | 882,892 | 145,232 | 636,387 | 26,030 | (38,633 | ) | ||||||||||||||||||||
| AllianzGI Global Managed Volatility |
669,848 | 391,536 | 20,890 | 82,254 | 1,060,421 | 30,670 | (1,103 | ) | ||||||||||||||||||||
| AllianzGI Global Natural Resources |
537,124 | 488,270 | 458,035 | 160,891 | 642,276 | 4,886 | 24,397 | |||||||||||||||||||||
| AllianzGI Income & Growth |
1,486,763 | 471,294 | 75,097 | 191,906 | 1,905,578 | 23,572 | (228 | ) | ||||||||||||||||||||
| AllianzGI International Managed Volatility |
808,387 | 992,738 | 415,165 | 157,378 | 1,477,260 | 31,805 | (4,825 | ) | ||||||||||||||||||||
| AllianzGI International Small-Cap |
1,140,050 | 622,372 | 291,022 | 226,404 | 1,421,501 | 10,159 | 11,229 | |||||||||||||||||||||
| AllianzGI NFJ Dividend Value |
1,481,021 | 872,071 | 1,109,966 | 408,609 | 1,358,471 | 18,758 | 73,961 | |||||||||||||||||||||
| AllianzGI NFJ Global Dividend Value |
1,217,841 | 721,061 | 81,178 | 261,688 | 1,894,660 | 23,603 | (574 | ) | ||||||||||||||||||||
| AllianzGI NFJ International Small-Cap Value |
407,559 | 437,867 | 43,739 | 56,283 | 855,927 | 7,889 | 836 | |||||||||||||||||||||
| AllianzGI NFJ International Value |
1,538,181 | 878,788 | 813,952 | 205,695 | 1,684,657 | 11,659 | 21,979 | |||||||||||||||||||||
| AllianzGI NFJ Mid-Cap Value |
889,721 | 1,015,978 | 531,033 | 307,339 | 1,492,226 | 18,719 | 19,445 | |||||||||||||||||||||
| Semiannual Report | | May 31, 2014 | 281 |
Table of Contents
Notes to Financial Statements (cont’d)
May 31, 2014 (Unaudited)
| AllianzGI Retirement 2040 (cont’d) | ||||||||||||||||||||||||||||
| Market Value 11/30/2013 |
Purchases at Cost |
Proceeds from Sales |
Unrealized Appreciation (Depreciation) |
Market Value 5/31/2014 |
Dividend Income |
Net Realized Gain(Loss) |
||||||||||||||||||||||
| AllianzGI NFJ Small-Cap Value |
$ | 352,490 | — | $ | 346,370 | — | — | — | $ | 150,431 | ||||||||||||||||||
| AllianzGI Short Duration High Income |
1,347,229 | $ | 821,262 | 84,597 | $ | 6,123 | $ | 2,083,970 | $ | 47,183 | (717 | ) | ||||||||||||||||
| AllianzGI U.S. Managed Volatility |
1,074,220 | 1,429,569 | 469,060 | 202,695 | 2,119,571 | 20,335 | 1,430 | |||||||||||||||||||||
| AllianzGI U.S. Small-Cap Growth |
356,150 | 462,367 | 148,020 | 133,385 | 649,318 | — | 2,733 | |||||||||||||||||||||
| PIMCO 1-5 Year U.S. TIPS Index |
790,511 | 1,647,314 | 1,174,896 | (706 | ) | 1,259,710 | 2,823 | 1,972 | ||||||||||||||||||||
| PIMCO CommoditiesPLUS® Strategy |
1,208,304 | 505,373 | 467,269 | 93,790 | 1,364,704 | 1,976 | 7,909 | |||||||||||||||||||||
| PIMCO Commodity RealReturn Strategy |
538,554 | 1,172,960 | 355,476 | 2,805 | 1,360,584 | — | (41,754 | ) | ||||||||||||||||||||
| PIMCO Floating Income |
1,350,158 | 1,164,663 | 454,223 | 34,949 | 2,104,283 | 46,005 | (8,239 | ) | ||||||||||||||||||||
| PIMCO Income |
1,756,671 | 1,072,147 | 581,641 | 84,181 | 2,311,411 | 54,687 | (11,497 | ) | ||||||||||||||||||||
| PIMCO International StocksPLUS® AR Strategy (U.S. Dollar-Hedged) |
1,267,157 | 1,252,432 | 368,119 | 119,386 | 2,230,465 | 41,061 | (5,906 | ) | ||||||||||||||||||||
| PIMCO Mortgage Opportunities |
1,367,448 | 1,108,384 | 1,855,731 | 11,579 | 628,425 | 19,552 | (4,845 | ) | ||||||||||||||||||||
| PIMCO Real Return |
— | 1,278,415 | 1,316,627 | — | — | 2,421 | 38,212 | |||||||||||||||||||||
| PIMCO Senior Floating Rate |
— | 1,292,239 | 36,635 | (2,351 | ) | 1,253,029 | 17,579 | (224 | ) | |||||||||||||||||||
| PIMCO Short-Term |
— | 624,912 | — | — | 624,912 | 265 | — | |||||||||||||||||||||
| Totals |
$ | 24,377,686 | $ | 25,983,283 | $ | 13,544,633 | $ | 3,364,341 | $ | 38,024,062 | $ | 475,110 | $ | 421,406 | ||||||||||||||
| AllianzGI Retirement 2045: | ||||||||||||||||||||||||||||
| Market Value 11/30/2013 |
Purchases at Cost |
Proceeds from Sales |
Unrealized Appreciation (Depreciation) |
Market Value 5/31/2014 |
Dividend Income |
Net Realized Gain(Loss) |
||||||||||||||||||||||
| AllianzGI Behavioral Advantage Large Cap |
$ | 739,855 | $ | 703,975 | $ | 238,388 | $ | 150,450 | $ | 1,240,344 | $ | 7,381 | $ | (1,042 | ) | |||||||||||||
| AllianzGI Best Styles Global Equity |
— | 2,239,767 | 26,222 | 149,596 | 2,363,189 | — | 48 | |||||||||||||||||||||
| AllianzGI Disciplined Equity |
196,454 | — | 194,192 | — | — | — | 50,441 | |||||||||||||||||||||
| AllianzGI Emerging Markets Opportunities |
593,536 | 232,998 | 431,742 | 41,645 | 375,059 | 12,711 | (19,086 | ) | ||||||||||||||||||||
| AllianzGI Global Managed Volatility |
390,406 | 336,407 | 4,160 | 54,376 | 742,827 | 17,085 | (332 | ) | ||||||||||||||||||||
| AllianzGI Global Natural Resources |
271,611 | 338,978 | 161,181 | 87,697 | 497,951 | 2,406 | 4,298 | |||||||||||||||||||||
| AllianzGI Income & Growth |
723,553 | 397,366 | 19,442 | 67,650 | 1,113,627 | 12,616 | (214 | ) | ||||||||||||||||||||
| AllianzGI International Managed Volatility |
444,175 | 611,884 | 244,190 | 100,905 | 866,890 | 16,850 | (2,838 | ) | ||||||||||||||||||||
| AllianzGI International Small-Cap |
660,718 | 390,517 | 32,827 | 115,400 | 986,205 | 5,805 | 637 | |||||||||||||||||||||
| AllianzGI NFJ Dividend Value |
783,861 | 519,529 | 349,387 | 224,810 | 1,032,138 | 11,311 | 16,802 | |||||||||||||||||||||
| AllianzGI NFJ Global Dividend Value |
630,515 | 542,213 | 22,414 | 154,617 | 1,181,294 | 12,563 | 137 | |||||||||||||||||||||
| AllianzGI NFJ International Small-Cap Value |
198,194 | 277,101 | 10,985 | 32,704 | 495,658 | 3,713 | 43 | |||||||||||||||||||||
| AllianzGI NFJ International Value |
785,510 | 521,614 | 143,482 | 157,354 | 1,225,403 | 5,718 | 1,327 | |||||||||||||||||||||
| AllianzGI NFJ Mid-Cap Value |
591,983 | 468,896 | 19,893 | 227,838 | 1,112,491 | 8,626 | 49 | |||||||||||||||||||||
| AllianzGI Short Duration High Income |
654,841 | 585,531 | 11,966 | 2,401 | 1,228,349 | 25,710 | (123 | ) | ||||||||||||||||||||
| AllianzGI U.S. Managed Volatility |
589,065 | 894,965 | 305,095 | 102,602 | 1,232,614 | 10,649 | 803 | |||||||||||||||||||||
| AllianzGI U.S. Small-Cap Growth |
199,596 | 303,611 | 36,823 | 57,158 | 451,598 | — | 77 | |||||||||||||||||||||
| PIMCO CommoditiesPLUS® Strategy |
612,280 | 386,698 | 240,362 | 55,839 | 827,531 | 969 | 6,204 | |||||||||||||||||||||
| PIMCO Commodity RealReturn Strategy |
262,705 | 708,702 | 148,610 | (761 | ) | 823,378 | — | (22,644 | ) | |||||||||||||||||||
| PIMCO Floating Income |
656,517 | 669,503 | 238,074 | 28,516 | 1,111,758 | 23,917 | (2,531 | ) | ||||||||||||||||||||
| PIMCO Income |
656,430 | 468,226 | 159,139 | 35,473 | 992,078 | 22,697 | (3,365 | ) | ||||||||||||||||||||
| PIMCO International StocksPLUS® AR Strategy (U.S. Dollar-Hedged) |
627,849 | 779,789 | 52,721 | 72,454 | 1,411,001 | 20,039 | 75 | |||||||||||||||||||||
| PIMCO Mortgage Opportunities |
590,404 | 192,681 | 785,558 | — | — | 6,951 | 896 | |||||||||||||||||||||
| PIMCO Senior Floating Rate |
— | 495,296 | 2,626 | (1,221 | ) | 491,440 | 6,592 | (9 | ) | |||||||||||||||||||
| PIMCO Short-Term |
— | 367,085 | — | — | 367,085 | 157 | — | |||||||||||||||||||||
| Totals |
$ | 11,860,058 | $ | 13,433,332 | $ | 3,879,479 | $ | 1,917,503 | $ | 22,169,908 | $ | 234,466 | $ | 29,653 | ||||||||||||||
| 282 | May 31, 2014 | | Semiannual Report |
Table of Contents
| AllianzGI Retirement 2050: | ||||||||||||||||||||||||||||
| Market Value 11/30/2013 |
Purchases at Cost |
Proceeds from Sales |
Unrealized Appreciation (Depreciation) |
Market Value 5/31/2014 |
Dividend Income |
Net Realized Gain(Loss) |
||||||||||||||||||||||
| AllianzGI Behavioral Advantage Large Cap |
$ | 741,199 | $ | 547,347 | $ | 195,098 | $ | 144,409 | $ | 1,119,873 | $ | 6,930 | $ | 1,345 | ||||||||||||||
| AllianzGI Best Styles Global Equity |
— | 1,916,470 | 35,459 | 128,935 | 2,009,676 | — | (270 | ) | ||||||||||||||||||||
| AllianzGI Disciplined Equity |
268,357 | — | 265,267 | — | — | — | 126,739 | |||||||||||||||||||||
| AllianzGI Emerging Markets Opportunities |
664,343 | 204,899 | 443,074 | 130,169 | 405,291 | 12,960 | (14,153 | ) | ||||||||||||||||||||
| AllianzGI Global Managed Volatility |
399,350 | 195,366 | 7,644 | 57,474 | 599,078 | 15,969 | (568 | ) | ||||||||||||||||||||
| AllianzGI Global Natural Resources |
293,556 | 290,635 | 185,876 | 109,811 | 439,274 | 2,304 | 6,274 | |||||||||||||||||||||
| AllianzGI Income & Growth |
810,190 | 261,284 | 82,299 | 141,944 | 999,787 | 11,814 | 627 | |||||||||||||||||||||
| AllianzGI International Managed Volatility |
467,639 | 442,437 | 252,590 | 84,858 | 700,363 | 15,820 | 608 | |||||||||||||||||||||
| AllianzGI International Small-Cap |
681,498 | 298,589 | 142,995 | 185,469 | 805,283 | 5,677 | 9,194 | |||||||||||||||||||||
| AllianzGI NFJ Dividend Value |
875,740 | 370,273 | 476,001 | 286,827 | 834,341 | 10,221 | 34,609 | |||||||||||||||||||||
| AllianzGI NFJ Global Dividend Value |
671,616 | 326,755 | 23,124 | 158,985 | 993,944 | 11,774 | (466 | ) | ||||||||||||||||||||
| AllianzGI NFJ International Small-Cap Value |
228,596 | 174,332 | 10,587 | 27,586 | 418,339 | 3,922 | 30 | |||||||||||||||||||||
| AllianzGI NFJ International Value |
800,521 | 354,226 | 110,578 | 132,542 | 1,091,466 | 5,266 | 1,402 | |||||||||||||||||||||
| AllianzGI NFJ Mid-Cap Value |
293,815 | 663,011 | 24,639 | 146,634 | 998,807 | 8,763 | 7 | |||||||||||||||||||||
| AllianzGI NFJ Small-Cap Value |
383,686 | — | 377,024 | — | — | — | 164,018 | |||||||||||||||||||||
| AllianzGI Short Duration High Income |
321,682 | 504,925 | 34,307 | 3,186 | 792,012 | 17,490 | (233 | ) | ||||||||||||||||||||
| AllianzGI U.S. Managed Volatility |
669,891 | 722,039 | 380,571 | 128,800 | 1,054,069 | 11,010 | 1,633 | |||||||||||||||||||||
| AllianzGI U.S. Small-Cap Growth |
249,068 | 247,892 | 80,111 | 107,496 | 401,706 | — | 1,608 | |||||||||||||||||||||
| PIMCO CommoditiesPLUS® Strategy |
634,402 | 205,836 | 208,054 | 47,388 | 690,730 | 907 | 3,450 | |||||||||||||||||||||
| PIMCO Commodity RealReturn Strategy |
270,807 | 573,907 | 160,549 | (227 | ) | 685,083 | — | (23,616 | ) | |||||||||||||||||||
| PIMCO Floating Income |
604,739 | 396,829 | 223,466 | 16,957 | 795,624 | 18,402 | (1,945 | ) | ||||||||||||||||||||
| PIMCO Income |
536,357 | 245,353 | 101,970 | 32,932 | 699,395 | 16,739 | (1,457 | ) | ||||||||||||||||||||
| PIMCO International StocksPLUS® AR Strategy (U.S. Dollar-Hedged) |
671,855 | 542,438 | 52,878 | 60,165 | 1,203,658 | 18,940 | (357 | ) | ||||||||||||||||||||
| PIMCO Mortgage Opportunities |
536,645 | 88,549 | 626,543 | — | — | 4,365 | 448 | |||||||||||||||||||||
| PIMCO Short-Term |
— | 197,409 | — | — | 197,409 | 83 | — | |||||||||||||||||||||
| Totals |
$ | 12,075,552 | $ | 9,770,801 | $ | 4,500,704 | $ | 2,132,340 | $ | 17,935,208 | $ | 199,356 | $ | 308,927 | ||||||||||||||
| AllianzGI Retirement 2055: | ||||||||||||||||||||||||||||
| Market Value 11/30/2013 |
Purchases at Cost |
Proceeds from Sales |
Unrealized Appreciation (Depreciation) |
Market Value 5/31/2014 |
Dividend Income |
Net Realized Gain(Loss) |
||||||||||||||||||||||
| AllianzGI Behavioral Advantage Large Cap |
$ | 282,983 | $ | 166,471 | $ | 76,483 | $ | 49,929 | $ | 380,535 | $ | 2,519 | $ | 2,884 | ||||||||||||||
| AllianzGI Best Styles Global Equity |
— | 633,557 | 2,303 | 42,624 | 673,872 | — | (6 | ) | ||||||||||||||||||||
| AllianzGI Disciplined Equity |
100,885 | — | 99,724 | — | — | — | 25,903 | |||||||||||||||||||||
| AllianzGI Emerging Markets Opportunities |
256,180 | 51,814 | 165,989 | 22,857 | 133,807 | 4,680 | (564 | ) | ||||||||||||||||||||
| AllianzGI Global Managed Volatility |
150,382 | 51,249 | 3,584 | 22,872 | 200,680 | 5,765 | (247 | ) | ||||||||||||||||||||
| AllianzGI Global Natural Resources |
108,828 | 87,606 | 60,882 | 29,876 | 148,291 | 830 | 1,650 | |||||||||||||||||||||
| AllianzGI Income & Growth |
303,141 | 65,417 | 36,672 | 32,891 | 334,730 | 4,103 | 559 | |||||||||||||||||||||
| AllianzGI International Managed Volatility |
177,042 | 127,556 | 84,316 | 37,142 | 233,469 | 5,716 | 1,902 | |||||||||||||||||||||
| AllianzGI International Small-Cap |
255,363 | 100,438 | 62,992 | 54,795 | 281,198 | 2,053 | 5,799 | |||||||||||||||||||||
| AllianzGI NFJ Dividend Value |
328,553 | 82,509 | 151,125 | 89,901 | 280,559 | 3,582 | 21,734 | |||||||||||||||||||||
| AllianzGI NFJ Global Dividend Value |
251,212 | 93,919 | 18,068 | 70,866 | 332,002 | 4,165 | (61 | ) | ||||||||||||||||||||
| AllianzGI NFJ International Small-Cap Value |
85,549 | 48,513 | 330 | 8,839 | 141,970 | 1,416 | 2 | |||||||||||||||||||||
| AllianzGI NFJ International Value |
303,979 | 77,156 | 30,738 | 71,609 | 364,263 | 1,901 | 410 | |||||||||||||||||||||
| AllianzGI NFJ Mid-Cap Value |
252,539 | 70,495 | 7,338 | 104,106 | 336,106 | 3,164 | 142 | |||||||||||||||||||||
| AllianzGI Short Duration High Income |
125,175 | 145,827 | 6,278 | 1,518 | 264,547 | 5,849 | (41 | ) | ||||||||||||||||||||
| AllianzGI U.S. Managed Volatility |
250,525 | 207,864 | 116,013 | 37,922 | 354,419 | 3,975 | 686 | |||||||||||||||||||||
| Semiannual Report | | May 31, 2014 | 283 |
Table of Contents
Notes to Financial Statements (cont’d)
May 31, 2014 (Unaudited)
| AllianzGI Retirement 2055 (cont’d) | ||||||||||||||||||||||||||||
| Market Value 11/30/2013 |
Purchases at Cost |
Proceeds from Sales |
Unrealized Appreciation (Depreciation) |
Market Value 5/31/2014 |
Dividend Income |
Net Realized Gain(Loss) |
||||||||||||||||||||||
| AllianzGI U.S. Small-Cap Growth |
$ | 91,381 | $ | 64,671 | $ | 14,888 | $ | 29,488 | $ | 135,463 | — | $ | 228 | |||||||||||||||
| PIMCO CommoditiesPLUS® Strategy |
235,179 | 55,931 | 80,689 | 16,352 | 229,521 | $ | 318 | 1,191 | ||||||||||||||||||||
| PIMCO Commodity RealReturn Strategy |
101,072 | 185,378 | 57,743 | (97 | ) | 228,838 | — | (8,858 | ) | |||||||||||||||||||
| PIMCO Floating Income |
223,945 | 108,403 | 71,809 | 14,371 | 266,357 | 6,158 | (350 | ) | ||||||||||||||||||||
| PIMCO Income |
200,218 | 57,591 | 31,040 | 12,766 | 233,245 | 5,616 | (346 | ) | ||||||||||||||||||||
| PIMCO International StocksPLUS® AR Strategy (U.S. Dollar-Hedged) |
250,886 | 151,142 | 9,826 | 19,369 | 405,041 | 6,761 | (30 | ) | ||||||||||||||||||||
| PIMCO Mortgage Opportunities |
200,039 | 21,022 | 221,464 | — | — | 1,492 | (160 | ) | ||||||||||||||||||||
| PIMCO Short-Term |
— | 66,066 | — | — | 66,066 | 27 | — | |||||||||||||||||||||
| Totals |
$ | 4,535,056 | $ | 2,720,595 | $ | 1,410,294 | $ | 769,996 | $ | 6,024,979 | $ | 70,090 | $ | 52,427 | ||||||||||||||
| AllianzGI Retirement Income: | ||||||||||||||||||||||||||||
| Market Value 11/30/2013 |
Purchases at Cost |
Proceeds from Sales |
Unrealized Appreciation (Depreciation) |
Market Value 5/31/2014 |
Dividend Income |
Net Realized Gain(Loss) |
||||||||||||||||||||||
| AllianzGI Behavioral Advantage Large Cap |
$ | 227,996 | $ | 585,646 | $ | 293,515 | $ | 54,559 | $ | 543,507 | $ | 2,330 | $ | (1,663 | ) | |||||||||||||
| AllianzGI Best Styles Global Equity |
— | 1,038,653 | 188,889 | 81,407 | 932,965 | — | 1,794 | |||||||||||||||||||||
| AllianzGI Emerging Markets Opportunities |
479,291 | 62,752 | 507,285 | — | — | 8,808 | 9,024 | |||||||||||||||||||||
| AllianzGI Global Managed Volatility |
262,909 | 94,188 | 53,849 | 46,949 | 308,569 | 9,870 | 394 | |||||||||||||||||||||
| AllianzGI Global Natural Resources |
261,957 | 92,682 | 223,993 | 58,646 | 155,745 | 1,985 | 35,482 | |||||||||||||||||||||
| AllianzGI Income & Growth |
1,056,647 | 219,317 | 362,918 | 143,850 | 924,407 | 12,812 | 17,321 | |||||||||||||||||||||
| AllianzGI International Managed Volatility |
— | 328,653 | 53,580 | 29,694 | 307,581 | — | 2,814 | |||||||||||||||||||||
| AllianzGI International Small-Cap |
261,105 | 153,325 | 123,393 | 40,172 | 277,464 | 2,521 | 1,225 | |||||||||||||||||||||
| AllianzGI NFJ Dividend Value |
791,049 | 158,438 | 524,821 | 178,369 | 463,381 | 7,906 | 125,060 | |||||||||||||||||||||
| AllianzGI NFJ Global Dividend Value |
397,723 | 78,874 | 172,626 | 76,733 | 306,372 | 4,221 | 27,487 | |||||||||||||||||||||
| AllianzGI NFJ International Small-Cap Value |
132,242 | 44,921 | 32,065 | 10,805 | 155,716 | 2,146 | 746 | |||||||||||||||||||||
| AllianzGI NFJ International Value |
556,351 | 194,780 | 166,597 | 88,865 | 612,904 | 3,466 | 1,827 | |||||||||||||||||||||
| AllianzGI NFJ Mid-Cap Value |
99,450 | 451,392 | 122,105 | 57,161 | 465,365 | 5,363 | 3,216 | |||||||||||||||||||||
| AllianzGI NFJ Small-Cap Value |
322,438 | — | 316,840 | — | — | — | 100,659 | |||||||||||||||||||||
| AllianzGI Short Duration High Income |
790,527 | 1,053,374 | 177,381 | 12,231 | 1,668,056 | 35,515 | (488 | ) | ||||||||||||||||||||
| AllianzGI U.S. Managed Volatility |
395,076 | 470,450 | 128,409 | 72,885 | 771,179 | 6,153 | 1,507 | |||||||||||||||||||||
| PIMCO 1-5 Year U.S. TIPS Index |
3,298,666 | 2,776,426 | 2,080,083 | 22,480 | 3,998,953 | 8,961 | (10,983 | ) | ||||||||||||||||||||
| PIMCO CommoditiesPLUS® Strategy |
525,669 | 77,754 | 188,920 | 29,198 | 451,372 | 718 | (2,855 | ) | ||||||||||||||||||||
| PIMCO Commodity RealReturn Strategy |
— | 470,017 | 9,368 | (10,535 | ) | 450,017 | — | (96 | ) | |||||||||||||||||||
| PIMCO Floating Income |
661,020 | 1,289,754 | 444,164 | 23,969 | 1,530,097 | 25,896 | (6,066 | ) | ||||||||||||||||||||
| PIMCO Foreign Bond (U.S. Dollar-Hedged) |
1,452,209 | 549,201 | 1,101,893 | 40,805 | 916,741 | 17,675 | (1,942 | ) | ||||||||||||||||||||
| PIMCO Income |
2,642,952 | 1,164,295 | 846,927 | 275,399 | 3,058,764 | 84,431 | 8,072 | |||||||||||||||||||||
| PIMCO International StocksPLUS® AR Strategy (U.S. Dollar-Hedged) |
660,803 | 281,256 | 190,435 | 54,264 | 780,110 | 17,227 | (551 | ) | ||||||||||||||||||||
| PIMCO Mortgage Opportunities |
1,846,421 | 483,585 | 1,131,792 | 11,514 | 1,218,460 | 35,418 | 1,649 | |||||||||||||||||||||
| PIMCO Real Return |
3,274,921 | 2,481,655 | 3,204,020 | 276,045 | 2,692,711 | 20,049 | 13,050 | |||||||||||||||||||||
| PIMCO Senior Floating Rate |
— | 1,832,732 | 155,334 | (4,625 | ) | 1,671,623 | 24,671 | (1,150 | ) | |||||||||||||||||||
| PIMCO Short-Term |
3,426,639 | 1,440,667 | 1,835,366 | 45,852 | 3,032,535 | 15,210 | (299 | ) | ||||||||||||||||||||
| Totals |
$ | 23,824,061 | $ | 17,874,787 | $ | 14,636,568 | $ | 1,716,692 | $ | 27,694,594 | $ | 353,352 | $ | 325,234 | ||||||||||||||
| 284 | May 31, 2014 | | Semiannual Report |
Table of Contents
| AllianzGI Global Allocation: | ||||||||||||||||||||||||||||
| Market Value 11/30/2013 |
Purchases at Cost |
Proceeds from Sales |
Unrealized Appreciation (Depreciation) |
Market Value 5/31/2014 |
Dividend Income |
Net Realized Gain(Loss) |
||||||||||||||||||||||
| AllianzGI Behavioral Advantage Large Cap |
$ | 7,449,347 | $ | 2,681,922 | $ | 1,534,225 | $ | 1,318,898 | $ | 8,711,571 | $ | 60,680 | $ | 22,447 | ||||||||||||||
| AllianzGI Best Styles Global Equity |
— | 8,750,203 | 675,269 | 664,905 | 8,749,900 | — | 10,061 | |||||||||||||||||||||
| AllianzGI Emerging Markets Opportunities |
9,669,974 | 938,928 | 5,838,056 | 1,653,296 | 4,477,712 | 164,858 | 736,739 | |||||||||||||||||||||
| AllianzGI Global Managed Volatility |
6,378,835 | 559,340 | 393,235 | 1,051,711 | 6,579,207 | 221,906 | 6,843 | |||||||||||||||||||||
| AllianzGI Global Natural Resources |
4,203,259 | 320,124 | 498,128 | 1,568,476 | 4,366,184 | 29,618 | 28,645 | |||||||||||||||||||||
| AllianzGI Income & Growth |
6,445,359 | 289,514 | 2,369,593 | 1,007,845 | 4,393,737 | 60,273 | 467,368 | |||||||||||||||||||||
| AllianzGI International Managed Volatility |
6,440,234 | 2,584,076 | 806,573 | 1,902,170 | 8,680,774 | 192,695 | 31,599 | |||||||||||||||||||||
| AllianzGI International Small-Cap |
10,755,532 | 2,595,766 | 4,249,123 | 2,625,331 | 8,574,773 | 76,394 | 269,078 | |||||||||||||||||||||
| AllianzGI NFJ Dividend Value |
8,044,540 | 2,614,047 | 659,729 | 2,968,868 | 10,530,574 | 92,809 | 39,689 | |||||||||||||||||||||
| AllianzGI NFJ Global Dividend Value |
11,764,227 | 1,295,086 | 1,164,127 | 2,882,709 | 11,957,740 | 171,423 | 34,945 | |||||||||||||||||||||
| AllianzGI NFJ International Small-Cap Value |
2,142,374 | 112,171 | 196,272 | 139,387 | 2,186,221 | 32,431 | 3,663 | |||||||||||||||||||||
| AllianzGI NFJ International Value |
18,146,083 | 1,115,327 | 6,508,219 | 2,178,369 | 13,043,240 | 86,420 | 376,602 | |||||||||||||||||||||
| AllianzGI NFJ Mid-Cap Value |
100 | 8,799,544 | 2,876,713 | 439,859 | 6,406,819 | 98,258 | 44,086 | |||||||||||||||||||||
| AllianzGI NFJ Small-Cap Value |
8,629,862 | — | 8,531,466 | — | — | — | 3,975,885 | |||||||||||||||||||||
| AllianzGI Short Duration High Income |
7,489,831 | 3,917,750 | 548,036 | 91,698 | 10,855,868 | 226,523 | (557 | ) | ||||||||||||||||||||
| AllianzGI U.S. Managed Volatility |
6,608,615 | 2,701,868 | 636,321 | 1,414,518 | 8,977,544 | 95,138 | 10,395 | |||||||||||||||||||||
| AllianzGI U.S. Small-Cap Growth |
2,110,027 | 591,966 | 1,462,871 | 501,211 | 1,079,531 | — | 399,677 | |||||||||||||||||||||
| PIMCO CommoditiesPLUS® Strategy |
6,409,958 | 692,507 | 1,228,526 | 382,678 | 6,371,914 | 7,924 | (220,759 | ) | ||||||||||||||||||||
| PIMCO Floating Income |
10,727,175 | 816,754 | 852,949 | 166,412 | 10,908,606 | 242,822 | (13,196 | ) | ||||||||||||||||||||
| PIMCO Foreign Bond (U.S. Dollar-Hedged) |
6,417,119 | 794,712 | 4,025,560 | 476,350 | 3,259,644 | 73,609 | 266,845 | |||||||||||||||||||||
| PIMCO Income |
21,427,275 | 2,169,022 | 6,770,369 | 2,049,647 | 17,342,995 | 465,000 | 153,081 | |||||||||||||||||||||
| PIMCO International StocksPLUS® AR Strategy (U.S. Dollar-Hedged) |
10,746,258 | 1,175,851 | 1,214,928 | 864,204 | 10,979,000 | 255,119 | 18,709 | |||||||||||||||||||||
| PIMCO Mortgage Opportunities |
10,720,198 | 1,178,036 | 5,439,854 | 64,243 | 6,555,347 | 165,424 | (4,126 | ) | ||||||||||||||||||||
| PIMCO Senior Floating Rate |
— | 7,891,098 | 256,656 | (29,623 | ) | 7,603,497 | 96,326 | (1,322 | ) | |||||||||||||||||||
| PIMCO Short-Term |
14,906,740 | 2,142,214 | 1,780,386 | 184,281 | 15,284,875 | 75,860 | 1,063 | |||||||||||||||||||||
| Totals |
$ | 197,632,922 | $ | 56,727,826 | $ | 60,517,184 | $ | 26,567,443 | $ | 197,877,273 | $ | 2,991,510 | $ | 6,657,460 | ||||||||||||||
| AllianzGI Global Growth Allocation: | ||||||||||||||||||||||||||||
| Market Value 11/30/2013 |
Purchases at Cost |
Proceeds from Sales |
Unrealized Appreciation (Depreciation) |
Market Value 5/31/2014 |
Dividend Income |
Net Realized Gain(Loss) |
||||||||||||||||||||||
| AllianzGI Behavioral Advantage Large Cap |
$ | 435,813 | $ | 76,480 | $ | 193,215 | $ | 61,591 | $ | 319,931 | $ | 3,436 | $ | 16,848 | ||||||||||||||
| AllianzGI Best Styles Global Equity |
— | 543,424 | 47,509 | 32,523 | 529,097 | — | 659 | |||||||||||||||||||||
| AllianzGI Emerging Markets Opportunities |
336,314 | 33,664 | 209,775 | 67,179 | 152,086 | 5,650 | 59,531 | |||||||||||||||||||||
| AllianzGI Global Managed Volatility |
264,473 | 29,484 | 30,274 | 42,475 | 265,004 | 9,119 | 746 | |||||||||||||||||||||
| AllianzGI Global Natural Resources |
198,196 | 11,779 | 26,743 | 84,457 | 198,912 | 1,374 | 4,473 | |||||||||||||||||||||
| AllianzGI Income & Growth |
167,161 | 15,529 | 19,027 | 44,238 | 165,252 | 2,337 | 849 | |||||||||||||||||||||
| AllianzGI International Managed Volatility |
267,100 | 22,694 | 36,548 | 44,477 | 264,272 | 7,942 | 1,051 | |||||||||||||||||||||
| AllianzGI International Small-Cap |
270,124 | 77,461 | 78,772 | 132,999 | 252,547 | 2,326 | 6,086 | |||||||||||||||||||||
| AllianzGI NFJ Dividend Value |
134,361 | 6,802 | 16,930 | 67,190 | 132,327 | 1,527 | 4,975 | |||||||||||||||||||||
| AllianzGI NFJ Emerging Markets Value |
270,162 | 17,750 | 217,221 | 5,689 | 66,046 | 3,880 | (9,032 | ) | ||||||||||||||||||||
| AllianzGI NFJ Global Dividend Value |
267,056 | 28,706 | 33,875 | 65,912 | 263,152 | 3,837 | 1,454 | |||||||||||||||||||||
| AllianzGI NFJ International Small-Cap Value |
267,351 | 20,496 | 38,985 | 42,423 | 264,448 | 3,967 | 2,479 | |||||||||||||||||||||
| AllianzGI NFJ International Value |
403,684 | 37,961 | 59,034 | 83,133 | 395,421 | 2,286 | 2,405 | |||||||||||||||||||||
| AllianzGI NFJ Large Cap Value |
134,688 | 2,227 | 138,301 | — | — | 749 | 8,185 | |||||||||||||||||||||
| AllianzGI NFJ Mid-Cap Value |
1,926 | 319,261 | 44,173 | 20,783 | 298,480 | 3,530 | 1,001 | |||||||||||||||||||||
| AllianzGI NFJ Small-Cap Value |
540,579 | — | 534,415 | — | — | — | 236,341 | |||||||||||||||||||||
| Semiannual Report | | May 31, 2014 | 285 |
Table of Contents
Notes to Financial Statements (cont’d)
May 31, 2014 (Unaudited)
| AllianzGI Global Growth Allocation (cont’d) | ||||||||||||||||||||||||||||
| Market Value 11/30/2013 |
Purchases at Cost |
Proceeds from Sales |
Unrealized Appreciation (Depreciation) |
Market Value 5/31/2014 |
Dividend Income |
Net Realized Gain(Loss) |
||||||||||||||||||||||
| AllianzGI Short Duration High Income |
$ | 198,922 | $ | 23,036 | $ | 24,155 | $ | 3,223 | $ | 197,793 | $ | 4,939 | $ | 11 | ||||||||||||||
| AllianzGI U.S. Managed Volatility |
399,184 | 39,632 | 50,304 | 83,693 | 397,954 | 5,684 | 1,161 | |||||||||||||||||||||
| AllianzGI Ultra Micro Cap |
240,816 | 106,196 | 112,991 | 24,102 | 231,761 | — | 4,809 | |||||||||||||||||||||
| PIMCO CommoditiesPLUS® Strategy |
199,450 | 14,952 | 33,867 | 16,739 | 195,938 | 248 | 474 | |||||||||||||||||||||
| PIMCO Commodity RealReturn Strategy |
66,612 | 6,418 | 12,404 | 3,564 | 65,222 | — | (14 | ) | ||||||||||||||||||||
| PIMCO Income |
186,227 | 67,360 | 28,307 | 25,060 | 231,908 | 5,690 | 638 | |||||||||||||||||||||
| PIMCO International StocksPLUS® AR Strategy (U.S. Dollar-Hedged) |
399,319 | 44,474 | 57,366 | 36,339 | 396,033 | 9,467 | 1,172 | |||||||||||||||||||||
| PIMCO Mortgage Opportunities |
132,607 | 15,089 | 17,242 | 1,293 | 132,009 | 2,647 | (36 | ) | ||||||||||||||||||||
| PIMCO Short-Term |
204,666 | 338,921 | 50,366 | 2,133 | 494,253 | 2,044 | (27 | ) | ||||||||||||||||||||
| Totals |
$ | 5,986,791 | $ | 1,899,796 | $ | 2,111,799 | $ | 991,215 | $ | 5,909,846 | $ | 82,679 | $ | 346,239 | ||||||||||||||
| AllianzGI Multi-Asset Real Return: | ||||||||||||||||||||||||||||
| Market Value 11/30/2013 |
Purchases at Cost |
Proceeds from Sales |
Unrealized Appreciation (Depreciation) |
Market Value 5/31/2014 |
Dividend Income |
Net Realized Gain(Loss) |
||||||||||||||||||||||
| AllianzGI Global Natural Resources |
$ | 1,579,890 | $ | 10,980 | $ | 20,000 | $ | 307,708 | $ | 1,698,193 | $ | 10,980 | $ | 440 | ||||||||||||||
| PIMCO Commodity RealReturn Strategy |
1,113,208 | 448,182 | — | 79,555 | 1,655,659 | — | — | |||||||||||||||||||||
| Totals |
$ | 2,693,098 | $ | 459,162 | $ | 20,000 | $ | 387,263 | $ | 3,353,852 | $ | 10,980 | $ | 440 | ||||||||||||||
| 286 | May 31, 2014 | | Semiannual Report |
Table of Contents
On June 19, 2014, the following Funds declared per-share net investment income dividends to shareholders, payable June 19, 2014 to shareholders of record on June 18, 2014:
| Fund Name | Class A | Class B | Class C | Class D | Class R | Class P | Class R6 | Institutional Class |
Administrative Class |
|||||||||||||||||||||||||||
| AllianzGI Retirement Income |
$ | 0.11526 | NA | $ | 0.08250 | $ | 0.11211 | $ | 0.09977 | $ | 0.13150 | $ | 0.13569 | NA | $ | 0.11913 | ||||||||||||||||||||
| AllianzGI Global Allocation |
0.04464 | $ | 0.02067 | 0.02169 | 0.04498 | 0.04009 | 0.05171 | NA | $ | 0.05211 | 0.04630 | |||||||||||||||||||||||||
| AllianzGI Convertible |
0.12185 | NA | 0.04811 | 0.10655 | 0.09430 | 0.13516 | NA | 0.14380 | 0.06582 | |||||||||||||||||||||||||||
| AllianzGI High Yield Bond |
0.05734 | NA | 0.05059 | 0.05566 | 0.05104 | 0.05969 | NA | 0.06000 | 0.05653 | |||||||||||||||||||||||||||
| AllianzGI NFJ Emerging Markets Value |
0.08816 | NA | 0.02942 | 0.05979 | NA | 0.06430 | NA | 0.06594 | NA | |||||||||||||||||||||||||||
| AllianzGI NFJ Global Dividend Value |
0.27479 | NA | 0.23498 | 0.26843 | NA | 0.28221 | NA | 0.29183 | NA | |||||||||||||||||||||||||||
| AllianzGI NFJ International Value II |
0.12164 | NA | 0.09297 | 0.13018 | NA | 0.16335 | NA | 0.16426 | NA | |||||||||||||||||||||||||||
| AllianzGI Short Duration High Income |
0.06000 | NA | 0.05664 | 0.05992 | NA | 0.06351 | NA | 0.06378 | NA | |||||||||||||||||||||||||||
Effective July 1, 2014, AllianzGI Structured Alpha Fund changed its name to AllianzGI Structured Return Fund. In connection with this change, effective July 1, 2014, the Fund’s investment objective, principal investment strategies, management fee and operating expenses were revised as follows: The Fund seeks long-term capital appreciation. In pursuing its investment objective of long-term capital appreciation, the Fund combines long equity exposure with an in the-money short call overlay strategy. The management fee is now 0.60% and the expense limits are now 1.15% for Class A shares, 1.90% for Class C shares, 1.15% for Class D shares, 1.00% for Class P shares and 0.90% for Institutional Class shares.
On July 17, 2014, the following Funds declared per-share net investment income dividends to shareholders, payable July 17, 2014, to shareholders of record on July 16, 2014:
| Fund Name | Class A | Class C | Class D | Class R | Class P | Institutional Class |
Administrative Class |
|||||||||||||||||||||
| AllianzGI High Yield Bond |
$ | 0.05615 | $ | 0.05046 | $ | 0.05484 | $ | 0.05080 | $ | 0.05961 | $ | 0.06000 | $ | 0.05633 | ||||||||||||||
| AllianzGI Short Duration High Income |
0.06000 | 0.05785 | 0.06104 | NA | 0.06474 | 0.06499 | NA | |||||||||||||||||||||
It is expected that on or around September 2, 2014 that AllianzGI Emerging Markets Debt Fund will commence operations as a series of the Trust, offering Class A, Class C, Class P and Institutional Class shares. The Fund will seek long-term capital appreciation and current income. The Fund will seek to achieve its investment objective by normally investing at least 80% of its net assets (plus borrowings made for investment purposes) in a diversified portfolio of debt instruments issued by Sovereign, Quasi-Sovereign or Corporate issuers of emerging market countries. The Fund’s investments in derivatives and other synthetic instruments that have economic characteristics similar to these investments will be counted toward satisfaction of the Fund’s 80% investment policy. The instruments in which the Fund may invest may be denominated in non-U.S. currencies and the U.S. dollar.
There were no other subsequent events identified that require recognition or disclosure.
| Semiannual Report | | May 31, 2014 | 287 |
Table of Contents
Unaudited
Matters Relating to the Trustees’ Consideration of the Investment Management and Sub-Advisory Agreements
| 1 | Each of the Disciplined Equity Fund and Dynamic Emerging Multi-Asset Fund liquidated on May 16, 2014. |
| 2 | The Redwood Fund liquidated on May 29, 2014. |
| 3 | Effective July 1, 2014, the Fund changed its name from “AllianzGI Structured Alpha Fund” to “AllianzGI Structured Return Fund”. |
| 288 | May 31, 2014 | | Semiannual Report |
Table of Contents
| Semiannual Report | | May 31, 2014 | 289 |
Table of Contents
Unaudited
Matters Relating to the Trustees’ Consideration of the Investment Management and Sub-Advisory Agreements (cont’d)
| 290 | May 31, 2014 | | Semiannual Report |
Table of Contents
| Semiannual Report | | May 31, 2014 | 291 |
Table of Contents
Unaudited
Matters Relating to the Trustees’ Consideration of the Investment Management and Sub-Advisory Agreements (cont’d)
| 292 | May 31, 2014 | | Semiannual Report |
Table of Contents
Allianz Multi-Strategy Funds
This report, including the financial information herein, is transmitted to the shareholders of the Trust for their information. It is not a prospectus, circular or representation intended for use in the purchase of shares of each Fund or any securities mentioned in this report.
The financial information included herein is taken from the records of the Funds without examination by an independent registered public accounting firm, who did not express an opinion herein.
For Account Information
Contact your financial adviser, or if you receive account statements directly from Allianz Global Investors, you can also call (800) 988-8380 for Class A, B, C and R shares or (800) 498-5413 for Class P, Class R6, D Institutional Class and Administrative Class shares. Telephone representatives are available Monday-Friday 8:30 am to 6:00 pm Eastern Time. Or visit our website, us.allianzgi.com.
| (1) | Fuller & Thaler Asset Management, Inc. is an independently owned investment firm. |
Table of Contents
About Allianz Global Investors
Understand. Act. This two-word philosophy is at the core of what we do. To stand out as the investment partner our clients trust, we listen closely to understand their needs, then act decisively to deliver solutions. We are a diversified active investment manager with a strong parent company, a culture of risk management and $493 billion in AUM.* With 23 offices in 17 countries and over 500 investment professionals, we provide global investment and research capabilities with consultative local delivery.
For more information about any of our investment solutions or client services, call your financial advisor or visit us.allianzgi.com.
Investors should consider the investment objectives, risks, charges and expenses of the above mentioned Funds carefully before investing. This and other information is contained in the Fund’s prospectus, which may be obtained by contacting your financial advisor, by visiting us.allianzgi.com or by calling 1-800-988-8380 (retail classes: A, B, C & R) or 1-800-498-5413 (Class P, Class R6, D Institutional & Administrative classes). Please read the prospectus carefully before you invest or send money.
* Combined worldwide AUM as of March 31, 2014.
Allianz Global Investors Fund Management LLC serves as the investment manager for the Allianz Funds and the Allianz Multi-Strategy Funds. Allianz Funds and the Allianz Multi-Strategy Funds are distributed by Allianz Global Investors Distributors LLC. © 2014. For information about any product, contact your financial advisor.
us.allianzgi.com
| ©2014 Allianz Global Investors Distributors LLC | AZ750SA_053114 |
AGI-2014-06-02-9836
Table of Contents
| ITEM 2. | CODE OF ETHICS |
| (a) | Not required in this filing. |
| ITEM 3. | AUDIT COMMITTEE FINANCIAL EXPERT |
Not required in this filing.
| ITEM 4. | PRINCIPAL ACCOUNTANT FEES AND SERVICES |
Not required in this filing.
| ITEM 5. | AUDIT COMMITTEE OF LISTED REGISTRANT |
Disclosure not required for open-end management investment companies.
| ITEM 6. | SCHEDULE OF INVESTMENTS |
| (a) | Schedule of Investments is included as part of the report to shareholders filed under Item 1 of this form. |
| (b) | Not applicable. |
| ITEM 7. | DISCLOSURE OF PROXY VOTING POLICIES AND PROCEDURES FOR CLOSED-END MANAGEMENT INVESTMENT COMPANIES |
Disclosure not required for open-end management investment companies.
| ITEM 8. | PORTFOLIO MANAGERS OF CLOSED-END MANAGEMENT INVESTMENT COMPANIES |
Disclosure not required for open-end management investment companies.
| ITEM 9. | PURCHASES OF EQUITY SECURITIES BY CLOSED-END MANAGEMENT INVESTMENT COMPANY AND AFFILIATED COMPANIES. |
Disclosure not required for open-end management investment companies.
| ITEM 10. SUBMISSION | OF MATTERS TO A VOTE OF SECURITY HOLDERS |
There were no material changes to the procedures by which shareholders may recommend nominees to the Fund’s Board of Trustees since the Fund’s last provided disclosure in response to this item.
| ITEM 11. CONTROLS | AND PROCEDURES |
| (a) | The registrant’s President and Treasurer, Principal Financial & Accounting Officer have concluded that the registrant’s disclosure controls and procedures (as defined in Rule 30a-3(c) under the Act (17 CFR 270.30a-3(c))), are effective based on their evaluation of these controls and procedures as of a date within 90 days of the filing date of this document. |
| (b) | There were no significant changes in the registrant’s internal control over financial reporting (as defined in Rule 30a-3(d) under the Act (17 CFR 270.30a-3(d))) that occurred during the second fiscal quarter of the period covered by this report that has materially affected, or is reasonably likely to materially affect, the registrant’s internal control over financial reporting. |
| ITEM 12. EXHIBITS |
| (a) (1) | Not required in this filing. |
| (a) (2) | Exhibit 99.302 Cert. — Certification pursuant to Section 302 of the Sarbanes-Oxley Act of 2002 |
| (a) (3) | Not applicable |
| (b) | Exhibit 99.906 Cert. — Certification pursuant to Section 906 of the Sarbanes-Oxley Act of 2002 |
Table of Contents
Signatures
Pursuant to the requirements of the Securities Exchange Act of 1934 and the Investment Company Act of 1940, the registrant has duly caused this report to be signed on its behalf by the undersigned, thereunto duly authorized.
(Registrant) Allianz Funds Multi-Strategy Trust
| By: | /s/ Julian Sluyters | |
| Julian Sluyters, | ||
| President & Chief Executive Officer |
Date: July 31, 2014
| By | /s/ Lawrence G. Altadonna | |
| Lawrence G. Altadonna Treasurer, Principal Financial & Accounting Officer |
Date: July 31, 2014
Pursuant to the requirements of the Securities Exchange Act of 1934 and the Investment Company Act of 1940, this report has been signed below by the following persons on behalf of the registrant and in the capacities and on the dates indicated.
| By: | /s/ Julian Sluyters | |
| Julian Sluyters, | ||
| President & Chief Executive Officer |
Date: July 31, 2014
| By | /s/ Lawrence G. Altadonna | |
| Lawrence G. Altadonna Treasurer, Principal Financial & Accounting Officer |
Date: July 31, 2014