UNITED STATES
SECURITIES AND EXCHANGE COMMISSION
Washington, D.C. 20549
FORM N-CSR
CERTIFIED SHAREHOLDER REPORT OF REGISTERED MANAGEMENT INVESTMENT COMPANIES
Investment Company Act file number 811-22148
| Invesco Actively Managed Exchange-Traded Fund Trust | ||||
| (Exact name of registrant as specified in charter) | ||||
| 3500 Lacey Road Downers Grove, IL 60515 |
||||
| (Address of principal executive offices) (Zip code) | ||||
| Daniel E. Draper President 3500 Lacey Road Downers Grove, IL 60515 |
||||
| (Name and address of agent for service) | ||||
Registrant’s telephone number, including area code: 800-983-0903
Date of fiscal year end: October 31
Date of reporting period: October 31, 2018
Form N-CSR is to be used by management investment companies to file reports with the Commission not later than 10 days after the transmission to stockholders of any report that is required to be transmitted to stockholders under Rule 30e-1 under the Investment Company Act of 1940 (17 CFR 270.30e-1). The Commission may use the information provided on Form N-CSR in its regulatory, disclosure review, inspection, and policymaking roles.
A registrant is required to disclose the information specified by Form N-CSR, and the Commission will make this information public. A registrant is not required to respond to the collection of information contained in Form N-CSR unless the Form displays a currently valid Office of Management and Budget (“OMB”) control number. Please direct comments concerning the accuracy of the information collection burden estimate and any suggestions for reducing the burden to Secretary, Securities and Exchange Commission, 450 Fifth Street, NW, Washington, DC 20549-0609. The OMB has reviewed this collection of information under the clearance requirements of 44 U.S.C. § 3507.
Item 1. Reports to Stockholders.
The Registrant’s annual report transmitted to shareholders pursuant to Rule 30e-1 under the Investment Company Act of 1940 is as follows:

Invesco Annual Report to Shareholders
October 31, 2018
| PSR | Invesco Active U.S. Real Estate ETF | |
| PSMB | Invesco Balanced Multi-Asset Allocation ETF | |
| PSMC | Invesco Conservative Multi-Asset Allocation ETF | |
| PSMG | Invesco Growth Multi-Asset Allocation ETF | |
| PSMM | Invesco Moderately Conservative Multi-Asset Allocation ETF | |
| LALT | Invesco Multi-Strategy Alternative ETF | |
| PHDG | Invesco S&P 500® Downside Hedged ETF | |
| GSY | Invesco Ultra Short Duration ETF | |
| VRIG | Invesco Variable Rate Investment Grade ETF |
| The Market Environment | 3 | |||
| Manager’s Analysis | 5 | |||
| Actively Managed Funds | ||||
| Schedules of Investments | ||||
| 24 | ||||
| 25 | ||||
| 26 | ||||
| 27 | ||||
| Invesco Moderately Conservative Multi-Asset Allocation ETF (PSMM) |
28 | |||
| 29 | ||||
| 32 | ||||
| 37 | ||||
| 45 | ||||
| Statements of Assets and Liabilities | 52 | |||
| Statements of Operations | 54 | |||
| Statements of Changes in Net Assets | 56 | |||
| Financial Highlights | 60 | |||
| Notes to Financial Statements | 68 | |||
| Report of Independent Registered Public Accounting Firm | 90 | |||
| Fees and Expenses | 92 | |||
| 94 | ||||
| Trustees and Officers | 95 | |||
|
|
2 |
|
|
|
3 |
|
The Market Environment (continued)
|
|
4 |
|
| PSR | Manager’s Analysis | |
| Invesco Active U.S. Real Estate ETF (PSR) |
|
|
5 |
|
Invesco Active U.S. Real Estate ETF (PSR) (continued)
Growth of a $10,000 Investment Since Inception

Fund Performance History as of October 31, 2018
| 1 Year |
3 Years Average |
3 Years Cumulative |
5 Years Average |
5 Years Cumulative |
Fund Inception | |||||||||||||||||||||||||||
| Index | Average Annualized |
Cumulative | ||||||||||||||||||||||||||||||
| FTSE NAREIT All Equity REITs Index | 1.42 | % | 5.76 | % | 18.30 | % | 8.06 | % | 47.34 | % | 17.93 | % | 415.55 | % | ||||||||||||||||||
| Fund | ||||||||||||||||||||||||||||||||
| NAV Return | 1.02 | 5.30 | 16.77 | 7.99 | 46.86 | 17.10 | 380.67 | |||||||||||||||||||||||||
| Market Price Return | 0.87 | 5.20 | 16.44 | 7.94 | 46.52 | 17.15 | 382.79 | |||||||||||||||||||||||||
|
|
6 |
|
| PSMB | Manager’s Analysis | |
| Invesco Balanced Multi-Asset Allocation ETF (PSMB) |
|
|
7 |
|
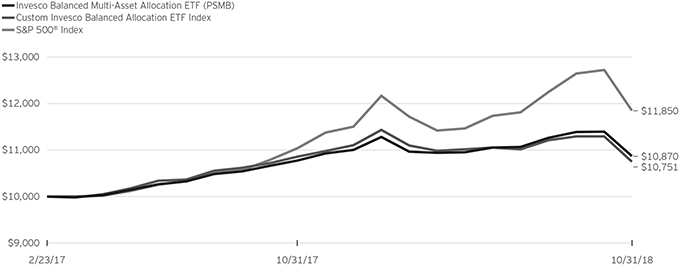
Invesco Balanced Multi-Asset Allocation ETF (PSMB) (continued)
Growth of a $10,000 Investment Since Inception
Fund Performance History as of October 31, 2018
| 1 Year |
Fund Inception | |||||||||||||||
| Index | Average Annualized |
Cumulative | ||||||||||||||
| Custom Invesco Balanced Allocation ETF Index | (0.98 | )% | 4.40 | % | 7.51 | % | ||||||||||
| S&P 500® Index | 7.35 | 10.62 | 18.50 | |||||||||||||
| Fund | ||||||||||||||||
| NAV Return | 0.89 | 5.09 | 8.70 | |||||||||||||
| Market Price Return | 1.12 | 5.17 | 8.85 | |||||||||||||
|
|
8 |
|
| PSMC | Manager’s Analysis | |
| Invesco Conservative Multi-Asset Allocation ETF (PSMC) |
|
|
9 |
|
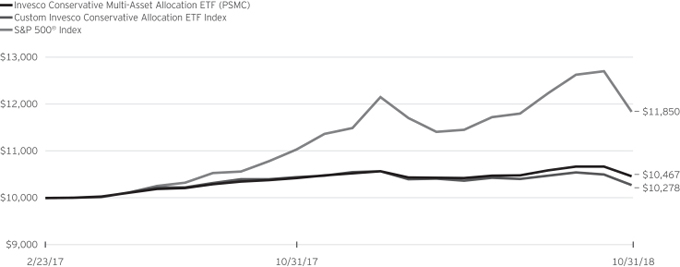
Invesco Conservative Multi-Asset Allocation ETF (PSMC) (continued)
Growth of a $10,000 Investment Since Inception
Fund Performance History as of October 31, 2018
| 1 Year |
Fund Inception | |||||||||||||||
| Index | Average Annualized |
Cumulative | ||||||||||||||
| Custom Invesco Conservative Allocation ETF Index | (1.65 | )% | 1.64 | % | 2.78 | % | ||||||||||
| S&P 500® Index | 7.35 | 10.62 | 18.50 | |||||||||||||
| Fund | ||||||||||||||||
| NAV Return | 0.39 | 2.75 | 4.67 | |||||||||||||
| Market Price Return | 0.31 | 2.65 | 4.50 | |||||||||||||
|
|
10 |
|
| PSMG | Manager’s Analysis | |
| Invesco Growth Multi-Asset Allocation ETF (PSMG) |
|
|
11 |
|
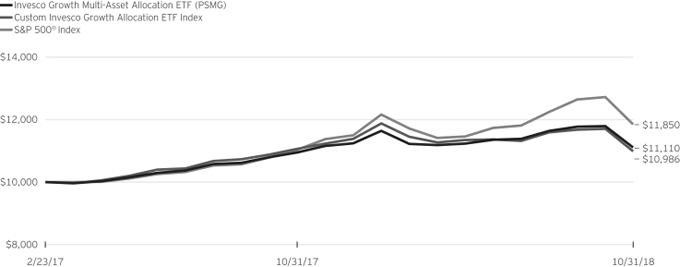
Invesco Growth Multi-Asset Allocation ETF (PSMG) (continued)
Growth of a $10,000 Investment Since Inception
Fund Performance History as of October 31, 2018
| 1 Year |
Fund Inception | |||||||||||||||
| Index | Average Annualized |
Cumulative | ||||||||||||||
| Custom Invesco Growth Allocation ETF Index | (0.72 | )% | 5.75 | % | 9.86 | % | ||||||||||
| S&P 500® Index | 7.35 | 10.62 | 18.50 | |||||||||||||
| Fund | ||||||||||||||||
| NAV Return | 1.43 | 6.46 | 11.10 | |||||||||||||
| Market Price Return | 1.58 | 6.64 | 11.42 | |||||||||||||
|
|
12 |
|
| PSMM | Manager’s Analysis | |
| Invesco Moderately Conservative Multi-Asset Allocation ETF (PSMM) |
|
|
13 |
|
Invesco Moderately Conservative Multi-Asset Allocation ETF (PSMM) (continued)
Growth of a $10,000 Investment Since Inception

Fund Performance History as of October 31, 2018
| 1 Year |
Fund Inception | |||||||||||||||
| Index | Average Annualized |
Cumulative | ||||||||||||||
| Custom Invesco Moderately Conservative Allocation ETF Index | (1.29 | )% | 3.03 | % | 5.15 | % | ||||||||||
| S&P 500® Index | 7.35 | 10.62 | 18.50 | |||||||||||||
| Fund | ||||||||||||||||
| NAV Return | 0.40 | 3.79 | 6.46 | |||||||||||||
| Market Price Return | 0.41 | 3.79 | 6.45 | |||||||||||||
|
|
14 |
|
| LALT | Manager’s Analysis | |
| Invesco Multi-Strategy Alternative ETF (LALT) |
|
|
15 |
|
Invesco Multi-Strategy Alternative ETF (LALT) (continued)
|
|
16 |
|
Invesco Multi-Strategy Alternative ETF (LALT) (continued)
Growth of a $10,000 Investment Since Inception

Fund Performance History as of October 31, 2018
| 3 Years Average |
3 Years Cumulative |
Fund Inception | ||||||||||||||||||||||
| Index | 1 Year | Average Annualized |
Cumulative | |||||||||||||||||||||
| Morgan Stanley Multi-Strategy Alternative Index | 5.06 | % | (0.48 | )% | (1.43 | )% | (2.63 | )% | (11.11 | )% | ||||||||||||||
| HFRI Macro (Total) Index | (3.11 | ) | (0.13 | ) | (0.39 | ) | 0.80 | 3.59 | ||||||||||||||||
| Bloomberg Barclays U.S. Aggregate Bond Index | (2.05 | ) | 1.04 | 3.15 | 1.41 | 6.40 | ||||||||||||||||||
| Fund | ||||||||||||||||||||||||
| NAV Return | 4.37 | (0.46 | ) | (1.37 | ) | (2.58 | ) | (10.91 | ) | |||||||||||||||
| Market Price Return | 3.88 | (0.59 | ) | (1.77 | ) | (2.68 | ) | (11.31 | ) | |||||||||||||||
|
|
17 |
|
| PHDG | Manager’s Analysis | |
| Invesco S&P 500® Downside Hedged ETF (PHDG) |
|
|
18 |
|
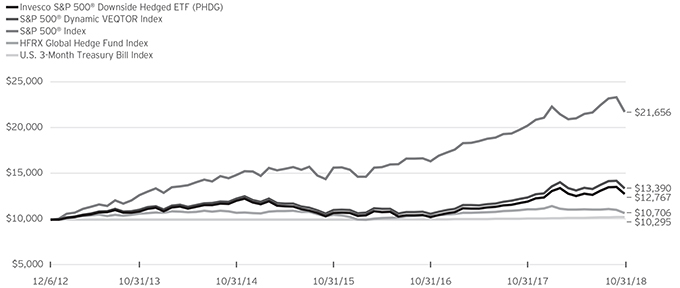
Invesco S&P 500® Downside Hedged ETF (PHDG) (continued)
Growth of a $10,000 Investment Since Inception
Fund Performance History as of October 31, 2018
| 1 Year |
3 Years Average |
3 Years Cumulative |
5 Years Average |
5 Years Cumulative |
Fund Inception | |||||||||||||||||||||||||||
| Index | Average Annualized |
Cumulative | ||||||||||||||||||||||||||||||
| S&P 500® Dynamic VEQTOR Index | 7.89 | % | 6.63 | % | 21.24 | % | 3.90 | % | 21.05 | % | 5.07 | % | 33.90 | % | ||||||||||||||||||
| S&P 500® Index | 7.35 | 11.52 | 38.70 | 11.34 | 71.11 | 13.99 | 116.56 | |||||||||||||||||||||||||
| HFRX Global Hedge Fund Index | (3.53 | ) | 0.61 | 1.85 | 0.14 | 0.72 | 1.16 | 7.06 | ||||||||||||||||||||||||
| U.S. 3-Month Treasury Bill Index | 1.75 | 0.93 | 2.83 | 0.57 | 2.89 | 0.49 | 2.95 | |||||||||||||||||||||||||
| Fund | ||||||||||||||||||||||||||||||||
| NAV Return | 6.61 | 5.93 | 18.86 | 3.21 | 17.14 | 4.23 | 27.67 | |||||||||||||||||||||||||
| Market Price Return | 6.33 | 5.81 | 18.46 | 3.11 | 16.54 | 4.18 | 27.33 | |||||||||||||||||||||||||
|
|
19 |
|
| GSY | Manager’s Analysis | |
| Invesco Ultra Short Duration ETF (GSY) |
|
|
20 |
|
Invesco Ultra Short Duration ETF (GSY) (continued)
Growth of a $10,000 Investment
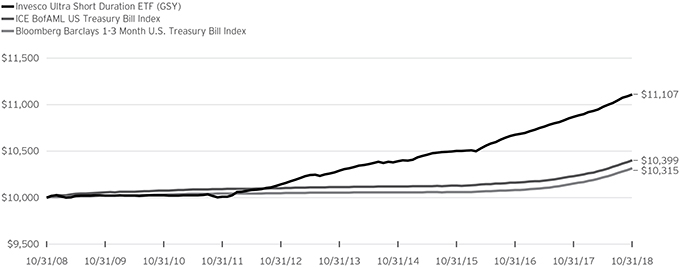
Fund Performance History as of October 31, 2018
| 1 Year | 3 Years Average |
3 Years Cumulative |
5 Years Average |
5 Years Cumulative |
10 Years Average |
10 Years Cumulative |
Fund Inception | |||||||||||||||||||||||||||||||||
| Index | Average Annualized |
Cumulative | ||||||||||||||||||||||||||||||||||||||
| ICE BofAML US Treasury Bill Index | 1.64 | % | 0.89 | % | 2.68 | % | 0.56 | % | 2.83 | % | 0.39 | % | 3.99 | % | 0.52 | % | 5.72 | % | ||||||||||||||||||||||
| Bloomberg Barclays 1-3 Month U.S. Treasury Bill Index | 1.62 | 0.84 | 2.55 | 0.51 | 2.60 | 0.31 | 3.15 | 0.41 | 4.53 | |||||||||||||||||||||||||||||||
| Fund | ||||||||||||||||||||||||||||||||||||||||
| NAV Return | 2.19 | 1.88 | 5.74 | 1.54 | 7.91 | 1.06 | 11.07 | 1.12 | 12.70 | |||||||||||||||||||||||||||||||
| Market Price Return | 2.23 | 1.90 | 5.80 | 1.54 | 7.93 | 1.06 | 11.13 | 1.13 | 12.74 | |||||||||||||||||||||||||||||||
|
|
21 |
|
| VRIG | Manager’s Analysis | |
| Invesco Variable Rate Investment Grade ETF (VRIG) |
|
|
22 |
|
Invesco Variable Rate Investment Grade ETF (VRIG) (continued)
Growth of a $10,000 Investment Since Inception
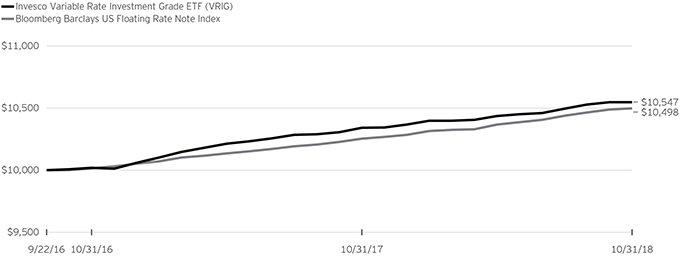
Fund Performance History as of October 31, 2018
| Fund Inception | ||||||||||||||||
| Index | 1 Year | Average Annualized |
Cumulative | |||||||||||||
| Bloomberg Barclays US Floating Rate Note Index | 2.38 | % | 2.33 | % | 4.98 | % | ||||||||||
| Fund | ||||||||||||||||
| NAV Return | 2.01 | 2.56 | 5.47 | |||||||||||||
| Market Price Return | 1.92 | 2.46 | 5.26 | |||||||||||||
|
|
23 |
|
Schedule of Investments(a)
Invesco Active U.S. Real Estate ETF (PSR)
October 31, 2018
See accompanying Notes to Financial Statements which are an integral part of the financial statements.
|
|
24 |
|
Schedule of Investments
Invesco Balanced Multi-Asset Allocation ETF (PSMB)
October 31, 2018
See accompanying Notes to Financial Statements which are an integral part of the financial statements.
|
|
25 |
|
Schedule of Investments
Invesco Conservative Multi-Asset Allocation ETF (PSMC)
October 31, 2018
See accompanying Notes to Financial Statements which are an integral part of the financial statements.
|
|
26 |
|
Schedule of Investments
Invesco Growth Multi-Asset Allocation ETF (PSMG)
October 31, 2018
See accompanying Notes to Financial Statements which are an integral part of the financial statements.
|
|
27 |
|
Schedule of Investments
Invesco Moderately Conservative Multi-Asset Allocation ETF (PSMM)
October 31, 2018
See accompanying Notes to Financial Statements which are an integral part of the financial statements.
|
|
28 |
|
|
|
Schedule of Investments(a)
Invesco Multi-Strategy Alternative ETF (LALT)
October 31, 2018
See accompanying Notes to Financial Statements which are an integral part of the financial statements.
|
|
29 |
|
Invesco Multi-Strategy Alternative ETF (LALT) (continued)
October 31, 2018
| Open Forward Foreign Currency Contracts | ||||||||||||||||||||||
| Counterparty |
Contract to | Unrealized Appreciation (Depreciation) |
||||||||||||||||||||
| Settlement Date | Deliver | Receive | ||||||||||||||||||||
| 11/21/2018 | Morgan Stanley | EUR | 674,204 | USD | 776,500 | $ | 11,314 | |||||||||||||||
| 11/21/2018 | Morgan Stanley | SEK | 1,392,188 | USD | 155,100 | 2,513 | ||||||||||||||||
| 11/21/2018 | Morgan Stanley | JPY | 9,013,925 | USD | 80,300 | 306 | ||||||||||||||||
| 11/21/2018 | Morgan Stanley | CHF | 301,307 | USD | 303,500 | 3,394 | ||||||||||||||||
|
|
|
|||||||||||||||||||||
| Subtotal-Appreciation |
17,527 | |||||||||||||||||||||
|
|
|
|||||||||||||||||||||
| 11/21/2018 | Morgan Stanley | USD | 165,600 | AUD | 232,105 | (1,056 | ) | |||||||||||||||
| 11/21/2018 | Morgan Stanley | USD | 174,200 | CAD | 226,827 | (1,414 | ) | |||||||||||||||
| 11/21/2018 | Morgan Stanley | USD | 257,400 | GBP | 196,628 | (5,926 | ) | |||||||||||||||
| 11/21/2018 | Morgan Stanley | USD | 160,900 | NOK | 1,321,898 | (3,486 | ) | |||||||||||||||
| 11/21/2018 | Morgan Stanley | USD | 557,400 | NZD | 848,733 | (3,053 | ) | |||||||||||||||
|
|
|
|||||||||||||||||||||
| Subtotal-Depreciation | (14,935 | ) | ||||||||||||||||||||
|
|
|
|||||||||||||||||||||
| Total Forward Foreign Currency Contracts—Currency Risk | $ | 2,592 | ||||||||||||||||||||
|
|
|
|||||||||||||||||||||
Currency Abbreviations:
See accompanying Notes to Financial Statements which are an integral part of the financial statements.
|
|
30 |
|
Invesco Multi-Strategy Alternative ETF (LALT) (continued)
October 31, 2018
| Open Futures Contracts |
||||||||||||||||||||
| Long Futures Contracts |
Number of Contracts |
Expiration Month |
Notional Value |
Value | Unrealized Appreciation (Depreciation) |
|||||||||||||||
| CBOE Volatility Index (VIX) Futures | 5 | January-19 | $ | 99,625 | $ | 13,228 | $ | 13,228 | ||||||||||||
| CBOE Volatility Index (VIX) Futures | 5 | February-19 | 98,875 | 3,288 | 3,288 | |||||||||||||||
|
|
|
|
|
|||||||||||||||||
| Subtotal-Equity Risk |
16,516 | 16,516 | ||||||||||||||||||
|
|
|
|
|
|||||||||||||||||
| Eurodollar Futures | 50 | September-19 | 12,108,125 | (10,771 | ) | (10,771 | ) | |||||||||||||
|
|
|
|
|
|||||||||||||||||
| Subtotal—Interest Rate Risk |
(10,771 | ) | (10,771 | ) | ||||||||||||||||
|
|
|
|
|
|||||||||||||||||
| Subtotal—Long Futures Contracts |
5,745 | 5,745 | ||||||||||||||||||
|
|
|
|
|
|||||||||||||||||
| Short Futures Contracts |
||||||||||||||||||||
| S&P 500 E-Mini Futures | 12 | December-18 | (1,626,660 | ) | 119,500 | 119,500 | ||||||||||||||
| CBOE Volatility Index (VIX) Futures | 2 | December-18 | (39,550 | ) | (5,240 | ) | (5,240 | ) | ||||||||||||
|
|
|
|
|
|||||||||||||||||
| Subtotal—Short Futures Contracts-Equity Risk |
114,260 | 114,260 | ||||||||||||||||||
|
|
|
|
|
|||||||||||||||||
| Total Futures Contracts | $ | 120,005 | $ | 120,005 | ||||||||||||||||
|
|
|
|
|
|||||||||||||||||
See accompanying Notes to Financial Statements which are an integral part of the financial statements.
|
|
31 |
|
Schedule of Investments(a)
Invesco S&P 500® Downside Hedged ETF (PHDG)
October 31, 2018
See accompanying Notes to Financial Statements which are an integral part of the financial statements.
|
|
32 |
|
Invesco S&P 500® Downside Hedged ETF (PHDG) (continued)
October 31, 2018
See accompanying Notes to Financial Statements which are an integral part of the financial statements.
|
|
33 |
|
Invesco S&P 500® Downside Hedged ETF (PHDG) (continued)
October 31, 2018
See accompanying Notes to Financial Statements which are an integral part of the financial statements.
|
|
34 |
|
Invesco S&P 500® Downside Hedged ETF (PHDG) (continued)
October 31, 2018
See accompanying Notes to Financial Statements which are an integral part of the financial statements.
|
|
35 |
|
Invesco S&P 500® Downside Hedged ETF (PHDG) (continued)
October 31, 2018
| Open Futures Contracts |
||||||||||||||||||
| Long Futures Contracts |
Number of Contracts |
Expiration Month |
Notional Value |
Value | Unrealized Appreciation |
|||||||||||||
| CBOE Volatility Index (VIX) Futures | 96 | November-18 | $ | 1,946,400 | $ | 174,040 | $ | 174,040 | ||||||||||
| CBOE Volatility Index (VIX) Futures | 240 | December-18 | 4,746,000 | 40,436 | 40,436 | |||||||||||||
|
|
|
|
|
|||||||||||||||
| Total Futures Contracts—Equity Risk | $ | 214,476 | $ | 214,476 | ||||||||||||||
|
|
|
|
|
|||||||||||||||
See accompanying Notes to Financial Statements which are an integral part of the financial statements.
|
|
36 |
|
Schedule of Investments
Invesco Ultra Short Duration ETF (GSY)
October 31, 2018
| Principal Amount |
Interest Rate |
Maturity Date |
Value | |||||||||||||
| Corporate Bonds and Notes—49.6% | ||||||||||||||||
| Advertising—0.1% | ||||||||||||||||
| $ | 2,000,000 | Interpublic Group of Cos., Inc. (The) | 3.500 | % | 10/01/2020 | $ | 1,998,706 | |||||||||
|
|
|
|||||||||||||||
| Aerospace/Defense—2.3% | ||||||||||||||||
| 10,000,000 | General Dynamics Corp. | 2.875 | 05/11/2020 | 9,965,313 | ||||||||||||
| 6,800,000 | Harris Corp. (3 mo. USD LIBOR + 0.48%)(a) | 2.786 | 02/27/2019 | 6,802,672 | ||||||||||||
| 10,000,000 | Northrop Grumman Corp. | 5.050 | 08/01/2019 | 10,134,079 | ||||||||||||
| 3,575,000 | United Technologies Corp. | 1.500 | 11/01/2019 | 3,518,923 | ||||||||||||
| 2,578,000 | United Technologies Corp. (3 mo. USD LIBOR + 0.65%)(a) | 2.965 | 08/16/2021 | 2,581,089 | ||||||||||||
| 4,631,000 | United Technologies Corp. | 3.350 | 08/16/2021 | 4,611,931 | ||||||||||||
|
|
|
|||||||||||||||
| 37,614,007 | ||||||||||||||||
|
|
|
|||||||||||||||
| Agriculture—0.5% | ||||||||||||||||
| 8,314,000 | Altria Group, Inc. | 2.625 | 01/14/2020 | 8,262,196 | ||||||||||||
|
|
|
|||||||||||||||
| Auto Manufacturers—1.1% | ||||||||||||||||
| 6,552,000 | General Motors Co. (3 mo. USD LIBOR + 0.80%)(a) | 3.143 | 08/07/2020 | 6,566,044 | ||||||||||||
| 1,500,000 | General Motors Financial Co., Inc. (3 mo. USD LIBOR + 1.45%)(a) | 3.791 | 05/09/2019 | 1,507,159 | ||||||||||||
| 10,000,000 | Hyundai Capital America (3 mo. USD LIBOR + 0.94%)(a)(b) | 3.348 | 07/08/2021 | 10,039,851 | ||||||||||||
|
|
|
|||||||||||||||
| 18,113,054 | ||||||||||||||||
|
|
|
|||||||||||||||
| Banks—19.8% | ||||||||||||||||
| 4,834,000 | ABN AMRO Bank NV (Netherlands) (3 mo. USD LIBOR + 0.57%)(a)(b) | 2.881 | 08/27/2021 | 4,839,946 | ||||||||||||
| 9,360,000 | Australia & New Zealand Banking Group Ltd. (Australia) (3 mo. USD LIBOR + 0.66%)(a)(b) | 3.026 | 09/23/2019 | 9,406,785 | ||||||||||||
| 4,737,000 | Australia & New Zealand Banking Group Ltd. (Australia) (3 mo. USD LIBOR + 0.46%)(a)(b) | 2.772 | 05/17/2021 | 4,741,211 | ||||||||||||
| 2,250,000 | Bank of America Corp., GMTN (3 mo. USD LIBOR + 0.66%)(a) | 3.129 | 07/21/2021 | 2,260,314 | ||||||||||||
| 8,850,000 | Bank of America Corp., MTN (3 mo. USD LIBOR + 0.65%)(a) | 3.046 | 10/01/2021 | 8,883,378 | ||||||||||||
| 7,250,000 | Bank of Nova Scotia (The) (Canada) (3 mo. USD LIBOR + 0.66%)(a) | 2.992 | 06/14/2019 | 7,272,318 | ||||||||||||
| 9,250,000 | BNZ International Funding Ltd. (New Zealand) (3 mo. USD LIBOR + 0.70%)(a)(b) | 3.012 | 02/21/2020 | 9,311,068 | ||||||||||||
| 2,250,000 | Capital One Financial Corp. (3 mo. USD LIBOR + 0.76%)(a) | 3.098 | 05/12/2020 | 2,261,322 | ||||||||||||
| 4,100,000 | Capital One Financial Corp. (3 mo. USD LIBOR + 0.45%)(a) | 2.970 | 10/30/2020 | 4,097,906 | ||||||||||||
| 5,050,000 | Capital One NA (3 mo. USD LIBOR + 0.77%)(a) | 3.099 | 09/13/2019 | 5,072,167 | ||||||||||||
| 2,000,000 | Citibank NA, BKNT (3 mo. USD LIBOR + 0.50%)(a) | 2.834 | 06/12/2020 | 2,009,546 | ||||||||||||
| 9,400,000 | Citigroup, Inc. (3 mo. USD LIBOR + 0.79%)(a) | 3.204 | 01/10/2020 | 9,451,841 | ||||||||||||
| 10,000,000 | Citizens Bank NA (3 mo. USD LIBOR + 0.54%)(a) | 2.861 | 03/02/2020 | 10,026,017 | ||||||||||||
| 6,150,000 | Commonwealth Bank of Australia, MTN (Australia) (3 mo. USD LIBOR + 0.40%)(a)(b) |
2.737 | 09/18/2020 | 6,169,372 | ||||||||||||
| 14,474,000 | Cooperatieve Rabobank UA, MTN (Netherlands) | 2.250 | 01/14/2020 | 13,995,975 | ||||||||||||
| 9,750,000 | Credit Agricole SA, MTN (France) (3 mo. USD LIBOR + 0.97%)(a)(b) | 3.297 | 06/10/2020 | 9,860,039 | ||||||||||||
| 7,500,000 | Fifth Third Bank (3 mo. USD LIBOR + 0.59%)(a) | 2.971 | 09/27/2019 | 7,516,780 | ||||||||||||
| 8,000,000 | Goldman Sachs Group, Inc. (The) (3 mo. USD LIBOR + 1.16%)(a) | 3.637 | 04/23/2020 | 8,090,083 | ||||||||||||
| 250,000 | Goldman Sachs Group, Inc. (The) (3 mo. USD LIBOR + 1.20%)(a) | 3.534 | 09/15/2020 | 253,543 | ||||||||||||
| 8,485,000 | Goldman Sachs Group, Inc. (The) (3 mo. USD LIBOR + 0.73%)(a) | 3.111 | 12/27/2020 | 8,514,691 | ||||||||||||
| 10,714,000 | HSBC Holdings PLC (United Kingdom) (3 mo. USD LIBOR + 0.65%)(a) | 2.984 | 09/11/2021 | 10,736,296 | ||||||||||||
| 10,000,000 | Huntington National Bank (The), BKNT (3 mo. USD LIBOR + 0.51%)(a) | 2.837 | 03/10/2020 | 10,031,149 | ||||||||||||
| 12,000,000 | ING Bank NV (Netherlands)(b) | 1.650 | 08/15/2019 | 11,869,278 | ||||||||||||
| 5,500,000 | JPMorgan Chase & Co. (3 mo. USD LIBOR + 0.84%)(a) | 3.206 | 03/22/2019 | 5,511,020 | ||||||||||||
| 5,400,000 | JPMorgan Chase & Co. (3 mo. USD LIBOR + 0.68%)(a) | 3.001 | 06/01/2021 | 5,410,041 | ||||||||||||
| 6,521,000 | Lloyds Bank PLC (United Kingdom) (3 mo. USD LIBOR + 0.49%)(a) | 2.833 | 05/07/2021 | 6,531,835 | ||||||||||||
| 3,000,000 | Macquarie Bank Ltd., MTN (Australia) (3 mo. USD LIBOR + 1.18%)(a)(b) | 3.616 | 01/15/2019 | 3,004,956 | ||||||||||||
| 3,342,000 | Mitsubishi UFJ Financial Group, Inc. (Japan) (3 mo. USD LIBOR + 1.88%)(a) | 4.201 | 03/01/2021 | 3,450,476 | ||||||||||||
| 6,000,000 | Mitsubishi UFJ Financial Group, Inc. (Japan) (3 mo. USD LIBOR + 0.65%)(a) | 3.158 | 07/26/2021 | 6,026,121 | ||||||||||||
| 6,850,000 | Mizuho Financial Group, Inc. (Japan) (3 mo. USD LIBOR + 1.14%)(a) | 3.474 | 09/13/2021 | 6,949,095 | ||||||||||||
| 6,500,000 | Morgan Stanley, GMTN (3 mo. USD LIBOR + 1.38%)(a) | 3.916 | 02/01/2019 | 6,518,540 | ||||||||||||
| 1,250,000 | Morgan Stanley, GMTN (3 mo. USD LIBOR + 0.55%)(a) | 2.891 | 02/10/2021 | 1,250,859 | ||||||||||||
| 2,900,000 | Morgan Stanley, Series 3NC2 (3 mo. USD LIBOR + 0.80%)(a) | 3.119 | 02/14/2020 | 2,903,568 | ||||||||||||
| 5,000,000 | National Australia Bank Ltd., MTN (Australia) (3 mo. USD LIBOR + 0.78%)(a)(b) | 3.216 | 01/14/2019 | 5,006,631 | ||||||||||||
| 5,000,000 | National Bank of Canada, BKNT (Canada) (3 mo. USD LIBOR + 0.84%)(a) | 3.172 | 12/14/2018 | 5,004,556 | ||||||||||||
| 3,000,000 | Nordea Bank Abp (Finland) (3 mo. USD LIBOR + 0.47%)(a)(b) | 2.787 | 05/29/2020 | 3,006,151 | ||||||||||||
| 9,000,000 | Nordea Bank Abp, MTN (Finland) (3 mo. USD LIBOR + 0.62%)(a)(b) | 3.006 | 09/30/2019 | 9,037,599 | ||||||||||||
| 5,000,000 | Royal Bank of Canada, GMTN (Canada) (3 mo. USD LIBOR + 0.24%)(a) | 2.748 | 10/26/2020 | 5,002,569 | ||||||||||||
| 10,000,000 | Royal Bank of Canada, GMTN (Canada) (3 mo. USD LIBOR + 0.39%)(a) | 2.910 | 04/30/2021 | 10,017,876 | ||||||||||||
See accompanying Notes to Financial Statements which are an integral part of the financial statements.
|
|
37 |
|
Invesco Ultra Short Duration ETF (GSY) (continued)
October 31, 2018
| Principal Amount |
Interest Rate |
Maturity Date |
Value | |||||||||||||
| Corporate Bonds and Notes (continued) | ||||||||||||||||
| Banks (continued) | ||||||||||||||||
| $ | 6,100,000 | Santander UK PLC (United Kingdom) (3 mo. USD LIBOR + 1.48%)(a) | 3.812 | % | 03/14/2019 | $ | 6,129,913 | |||||||||
| 6,772,000 | Standard Chartered PLC, MTN (United Kingdom) (3 mo. USD LIBOR + 1.13%)(a)(b) |
3.452 | 08/19/2019 | 6,815,113 | ||||||||||||
| 6,667,000 | Sumitomo Mitsui Banking Corp. (Japan) (3 mo. USD LIBOR + 0.37%)(a) | 2.806 | 10/16/2020 | 6,669,384 | ||||||||||||
| 1,000,000 | Sumitomo Mitsui Financial Group, Inc. (Japan) (3 mo. USD LIBOR + 1.68%)(a) | 4.007 | 03/09/2021 | 1,028,578 | ||||||||||||
| 2,300,000 | Sumitomo Mitsui Financial Group, Inc. (Japan) (3 mo. USD LIBOR + 1.14%)(a) | 3.590 | 10/19/2021 | 2,340,272 | ||||||||||||
| 2,300,000 | Sumitomo Mitsui Trust Bank Ltd. (Japan) (3 mo. USD LIBOR + 0.44%)(a)(b) | 2.779 | 09/19/2019 | 2,304,818 | ||||||||||||
| 9,200,000 | Sumitomo Mitsui Trust Bank Ltd. (Japan) (3 mo. USD LIBOR + 0.91%)(a)(b) | 3.355 | 10/18/2019 | 9,259,586 | ||||||||||||
| 8,277,000 | SunTrust Bank, BKNT (3 mo. USD LIBOR + 0.50%)(a) | 3.008 | 10/26/2021 | 8,280,450 | ||||||||||||
| 8,550,000 | UBS Group Funding Switzerland AG (Switzerland) (3 mo. USD LIBOR + 1.78%)(a)(b) |
4.216 | 04/14/2021 | 8,803,906 | ||||||||||||
| 2,500,000 | United Overseas Bank Ltd., MTN (Singapore) (3 mo. USD LIBOR + 0.48%)(a)(b) | 2.957 | 04/23/2021 | 2,503,096 | ||||||||||||
| 7,000,000 | Wells Fargo Bank NA, BKNT (3 mo. USD LIBOR + 0.60%)(a) | 2.912 | 05/24/2019 | 7,017,339 | ||||||||||||
| 6,000,000 | Westpac Banking Corp. (Australia) (3 mo. USD LIBOR + 0.71%)(a) | 3.048 | 05/13/2019 | 6,017,869 | ||||||||||||
|
|
|
|||||||||||||||
| 318,473,242 | ||||||||||||||||
|
|
|
|||||||||||||||
| Beverages—0.2% | ||||||||||||||||
| 3,650,000 | Molson Coors Brewing Co. | 1.450 | 07/15/2019 | 3,607,180 | ||||||||||||
|
|
|
|||||||||||||||
| Computers—1.3% | ||||||||||||||||
| 9,875,000 | Apple, Inc. | 2.000 | 11/13/2020 | 9,665,166 | ||||||||||||
| 4,298,000 | Hewlett Packard Enterprise Co.(b) | 2.100 | 10/04/2019 | 4,257,331 | ||||||||||||
| 7,059,000 | Hewlett Packard Enterprise Co. (3 mo. USD LIBOR + 0.72%)(a) | 3.059 | 10/05/2021 | 7,062,970 | ||||||||||||
|
|
|
|||||||||||||||
| 20,985,467 | ||||||||||||||||
|
|
|
|||||||||||||||
| Diversified Financial Services—1.0% | ||||||||||||||||
| 4,000,000 | AIG Global Funding (3 mo. USD LIBOR + 0.46%)(a)(b) | 2.833 | 06/25/2021 | 4,007,059 | ||||||||||||
| 6,260,000 | Air Lease Corp. | 3.500 | 01/15/2022 | 6,194,217 | ||||||||||||
| 5,000,000 | American Express Co. (3 mo. USD LIBOR + 0.53%)(a) | 2.837 | 05/17/2021 | 5,008,346 | ||||||||||||
|
|
|
|||||||||||||||
| 15,209,622 | ||||||||||||||||
|
|
|
|||||||||||||||
| Electric—2.0% | ||||||||||||||||
| 10,000,000 | Exelon Generation Co. LLC | 4.000 | 10/01/2020 | 10,084,902 | ||||||||||||
| 7,000,000 | NextEra Energy Capital Holdings, Inc. (3 mo. USD LIBOR + 0.32%)(a) | 2.636 | 09/03/2019 | 7,009,161 | ||||||||||||
| 7,200,000 | NextEra Energy Capital Holdings, Inc., Series H | 3.342 | 09/01/2020 | 7,200,770 | ||||||||||||
| 5,680,000 | Progress Energy, Inc. | 4.875 | 12/01/2019 | 5,792,746 | ||||||||||||
| 2,350,000 | Southern Co. (The) | 2.150 | 09/01/2019 | 2,330,048 | ||||||||||||
|
|
|
|||||||||||||||
| 32,417,627 | ||||||||||||||||
|
|
|
|||||||||||||||
| Environmental Control—0.4% | ||||||||||||||||
| 5,893,000 | Waste Management, Inc. | 4.750 | 06/30/2020 | 6,034,984 | ||||||||||||
|
|
|
|||||||||||||||
| Food—2.3% | ||||||||||||||||
| 8,100,000 | General Mills, Inc. (3 mo. USD LIBOR + 0.54%)(a) | 2.976 | 04/16/2021 | 8,096,002 | ||||||||||||
| 8,350,000 | Kraft Heinz Foods Co. (3 mo. USD LIBOR + 0.57%)(a) | 2.911 | 02/10/2021 | 8,368,086 | ||||||||||||
| 10,000,000 | Mondelez International Holdings Netherlands BV(b) | 1.625 | 10/28/2019 | 9,835,740 | ||||||||||||
| 10,000,000 | Tyson Foods, Inc. | 2.650 | 08/15/2019 | 9,973,801 | ||||||||||||
|
|
|
|||||||||||||||
| 36,273,629 | ||||||||||||||||
|
|
|
|||||||||||||||
| Healthcare-Products—0.3% | ||||||||||||||||
| 4,450,000 | Zimmer Biomet Holdings, Inc. (3 mo. USD LIBOR + 0.75%)(a) | 3.089 | 03/19/2021 | 4,452,582 | ||||||||||||
|
|
|
|||||||||||||||
| Healthcare-Services—1.5% | ||||||||||||||||
| 15,000,000 | Halfmoon Parent, Inc.(b) | 3.200 | 09/17/2020 | 14,926,767 | ||||||||||||
| 9,685,000 | UnitedHealth Group, Inc. | 2.700 | 07/15/2020 | 9,611,026 | ||||||||||||
|
|
|
|||||||||||||||
| 24,537,793 | ||||||||||||||||
|
|
|
|||||||||||||||
| Insurance—3.3% | ||||||||||||||||
| 3,050,000 | Assurant, Inc. (3 mo. USD LIBOR + 1.25%)(a) | 3.624 | 03/26/2021 | 3,054,425 | ||||||||||||
| 11,100,000 | Metropolitan Life Global Funding I (3 mo. USD LIBOR + 0.23%)(a)(b) | 2.638 | 01/08/2021 | 11,092,353 | ||||||||||||
| 5,402,000 | Metropolitan Life Global Funding I, MTN (SOFR + 0.57%)(a)(b) | 2.790 | 09/07/2020 | 5,408,180 | ||||||||||||
| 12,000,000 | New York Life Global Funding(b) | 1.950 | 09/28/2020 | 11,723,892 | ||||||||||||
| 6,665,000 | New York Life Global Funding (3 mo. USD LIBOR + 0.32%)(a)(b) | 2.661 | 08/06/2021 | 6,671,006 | ||||||||||||
See accompanying Notes to Financial Statements which are an integral part of the financial statements.
|
|
38 |
|
Invesco Ultra Short Duration ETF (GSY) (continued)
October 31, 2018
| Principal Amount |
Interest Rate |
Maturity Date |
Value | |||||||||||||
| Corporate Bonds and Notes (continued) | ||||||||||||||||
| Insurance (continued) | ||||||||||||||||
| $ | 4,560,000 | Pricoa Global Funding I(b) | 1.450 | % | 09/13/2019 | $ | 4,497,565 | |||||||||
| 7,500,000 | Principal Life Global Funding II (3 mo. USD LIBOR + 0.30%)(a)(b) | 2.674 | 06/26/2020 | 7,508,903 | ||||||||||||
| 3,470,000 | Principal Life Global Funding II(b) | 2.625 | 11/19/2020 | 3,419,721 | ||||||||||||
|
|
|
|||||||||||||||
| 53,376,045 | ||||||||||||||||
|
|
|
|||||||||||||||
| Machinery-Diversified—1.0% | ||||||||||||||||
| 6,667,000 | John Deere Capital Corp., GMTN (3 mo. USD LIBOR + 0.18%)(a) | 2.588 | 01/07/2020 | 6,670,247 | ||||||||||||
| 10,000,000 | John Deere Capital Corp., MTN (3 mo. USD LIBOR + 0.29%)(a) | 2.656 | 06/22/2020 | 10,023,408 | ||||||||||||
|
|
|
|||||||||||||||
| 16,693,655 | ||||||||||||||||
|
|
|
|||||||||||||||
| Media—2.4% | ||||||||||||||||
| 6,341,000 | CBS Corp. | 2.300 | 08/15/2019 | 6,301,602 | ||||||||||||
| 20,000,000 | Comcast Corp. (3 mo. USD LIBOR + 0.44%)(a) | 2.848 | 10/01/2021 | 20,015,694 | ||||||||||||
| 11,650,000 | Discovery Communications LLC (3 mo. USD LIBOR + 0.71%)(a) | 3.048 | 09/20/2019 | 11,693,160 | ||||||||||||
|
|
|
|||||||||||||||
| 38,010,456 | ||||||||||||||||
|
|
|
|||||||||||||||
| Miscellaneous Manufacturing—0.3% | ||||||||||||||||
| 5,000,000 | Siemens Financieringsmaatschappij NV (Germany) (3 mo. USD LIBOR + 0.34%)(a)(b) | 2.674 | 03/16/2020 | 5,009,295 | ||||||||||||
|
|
|
|||||||||||||||
| Oil & Gas—2.1% | ||||||||||||||||
| 12,735,000 | Chevron Corp. | 1.991 | 03/03/2020 | 12,561,689 | ||||||||||||
| 10,000,000 | EOG Resources, Inc. | 4.400 | 06/01/2020 | 10,171,546 | ||||||||||||
| 5,900,000 | EQT Corp. (3 mo. USD LIBOR + 0.77%)(a) | 3.166 | 10/01/2020 | 5,898,949 | ||||||||||||
| 3,050,000 | Phillips 66 (3 mo. USD LIBOR + 0.65%)(a)(b) | 3.086 | 04/15/2019 | 3,050,951 | ||||||||||||
| 1,900,000 | Phillips 66 (3 mo. USD LIBOR + 0.60%)(a) | 2.911 | 02/26/2021 | 1,901,416 | ||||||||||||
|
|
|
|||||||||||||||
| 33,584,551 | ||||||||||||||||
|
|
|
|||||||||||||||
| Packaging & Containers—0.2% | ||||||||||||||||
| 2,800,000 | Reynolds Group Issuer, Inc./Reynolds Group Issuer LLC/Reynolds Group Issuer Lu (3 mo. USD LIBOR + 3.50%)(a)(b) | 5.936 | 07/15/2021 | 2,835,000 | ||||||||||||
|
|
|
|||||||||||||||
| Pharmaceuticals—4.4% | ||||||||||||||||
| 13,183,000 | AbbVie, Inc. | 2.500 | 05/14/2020 | 13,015,671 | ||||||||||||
| 2,600,000 | Allergan Funding SCS (3 mo. USD LIBOR + 1.26%)(a) | 3.589 | 03/12/2020 | 2,629,371 | ||||||||||||
| 13,606,000 | Bayer US Finance II LLC (Germany) (3 mo. USD LIBOR + 0.63%)(a)(b) | 3.003 | 06/25/2021 | 13,616,286 | ||||||||||||
| 3,450,000 | CVS Health Corp. (3 mo. USD LIBOR + 0.63%)(a) | 2.957 | 03/09/2020 | 3,461,910 | ||||||||||||
| 5,000,000 | CVS Health Corp. | 3.125 | 03/09/2020 | 4,990,175 | ||||||||||||
| 3,250,000 | CVS Health Corp. (3 mo. USD LIBOR + 0.72%)(a) | 3.047 | 03/09/2021 | 3,268,405 | ||||||||||||
| 10,700,000 | Express Scripts Holding Co. (3 mo. USD LIBOR + 0.75%)(a) | 3.065 | 11/30/2020 | 10,702,949 | ||||||||||||
| 6,757,000 | GlaxoSmithKline Capital PLC (United Kingdom) (3 mo. USD LIBOR + 0.35%)(a) | 2.669 | 05/14/2021 | 6,772,655 | ||||||||||||
| 12,000,000 | Shire Acquisitions Investments Ireland DAC | 1.900 | 09/23/2019 | 11,854,203 | ||||||||||||
|
|
|
|||||||||||||||
| 70,311,625 | ||||||||||||||||
|
|
|
|||||||||||||||
| Pipelines—0.8% | ||||||||||||||||
| 12,500,000 | Enterprise Products Operating LLC | 5.250 | 01/31/2020 | 12,791,846 | ||||||||||||
|
|
|
|||||||||||||||
| REITs—0.3% | ||||||||||||||||
| 5,350,000 | AvalonBay Communities, Inc., MTN (3 mo. USD LIBOR + 0.43%)(a) | 2.866 | 01/15/2021 | 5,349,980 | ||||||||||||
|
|
|
|||||||||||||||
| Telecommunications—1.9% | ||||||||||||||||
| 9,500,000 | AT&T, Inc. (3 mo. USD LIBOR + 0.93%)(a) | 3.316 | 06/30/2020 | 9,584,464 | ||||||||||||
| 3,727,000 | AT&T, Inc. (3 mo. USD LIBOR + 0.95%)(a) | 3.386 | 07/15/2021 | 3,768,890 | ||||||||||||
| 9,500,000 | Deutsche Telekom International Finance BV (Germany) (3 mo. USD LIBOR + 0.58%)(a)(b) | 3.029 | 01/17/2020 | 9,531,762 | ||||||||||||
| 7,950,000 | Verizon Communications, Inc. (3 mo. USD LIBOR + 0.55%)(a) | 2.860 | 05/22/2020 | 7,988,257 | ||||||||||||
|
|
|
|||||||||||||||
| 30,873,373 | ||||||||||||||||
|
|
|
|||||||||||||||
| Trucking & Leasing—0.1% | ||||||||||||||||
| 1,775,000 | Aviation Capital Group LLC (3 mo. USD LIBOR + 0.67%)(a)(b) | 3.190 | 07/30/2021 | 1,781,654 | ||||||||||||
|
|
|
|||||||||||||||
| Total Corporate Bonds and Notes (Cost $797,956,103) |
798,597,569 | |||||||||||||||
|
|
|
|||||||||||||||
See accompanying Notes to Financial Statements which are an integral part of the financial statements.
|
|
39 |
|
Invesco Ultra Short Duration ETF (GSY) (continued)
October 31, 2018
| Principal Amount |
Interest Rate |
Maturity Date |
Value | |||||||||||||
| Asset-Backed Securities—9.5% | ||||||||||||||||
| $ | 1,800,000 | ABPCI Direct Lending Fund CLO I LLC, Class A1, Series 2017-1A (Cayman Islands) (3 mo. USD LIBOR + 1.78%)(a)(b) | 4.249 | % | 07/20/2029 | $ | 1,799,768 | |||||||||
| 481,032 | Accredited Mortgage Loan Trust, Class A3, Series 2007-1 (1 mo. USD LIBOR + 0.13%)(a) | 2.411 | 02/25/2037 | 481,506 | ||||||||||||
| 2,000,000 | ACIS CLO Ltd., Class A1, Series 2015-6A (Cayman Islands) (3 mo. USD LIBOR + 1.59%)(a)(b) | 4.131 | 05/01/2027 | 2,003,224 | ||||||||||||
| 2,000,000 | AMMC CLO Ltd., Class A2R, Series 2016-15A (Cayman Islands) (3 mo. USD LIBOR + 1.35%)(a)(b) | 3.677 | 12/09/2026 | 2,003,247 | ||||||||||||
| 5,740,793 | Avery Point V CLO Ltd., Class AR, Series 2017-5A (Cayman Islands) (3 mo. USD LIBOR + 0.98%)(a)(b) | 3.429 | 07/17/2026 | 5,731,556 | ||||||||||||
| 9,000,000 | Avery Point VI CLO Ltd., Class AR, Series 2018-6A (Cayman Islands) (3 mo. USD LIBOR + 1.05%)(a)(b) | 3.263 | 08/05/2027 | 9,014,055 | ||||||||||||
| 2,343,335 | Bear Stearns Asset Backed Securities I Trust, Class 2A, Series 2006-HE9 (1 mo. USD LIBOR + 0.14%)(a) | 2.421 | 11/25/2036 | 2,289,731 | ||||||||||||
| 2,000,000 | Cerberus Loan Funding XVI LP, Class A2, Series 2016-2A (Cayman Islands) (3 mo. USD LIBOR + 2.35%)(a)(b) | 4.786 | 11/15/2027 | 2,004,936 | ||||||||||||
| 2,258,018 | CIT Mortgage Loan Trust, Class 1A, Series 2007-1 (1 mo. USD LIBOR + 1.35%)(a)(b) |
3.631 | 10/25/2037 | 2,287,568 | ||||||||||||
| 497,711 | Countrywide Asset-Backed Certificates, Class M1, Series 2004-SD2 (1 mo. USD LIBOR + 0.62%)(a)(b) | 2.901 | 06/25/2033 | 494,990 | ||||||||||||
| 2,230,175 | Countrywide Asset-Backed Certificates, Class 1A1, Series 2006-6 (1 mo. USD LIBOR + 0.17%)(a) | 2.451 | 09/25/2036 | 2,201,411 | ||||||||||||
| 2,000,000 | Crown Point CLO III Ltd., Class A2R, Series 2017-3A (Cayman Islands) (3 mo. USD LIBOR + 1.45%)(a)(b) | 3.886 | 12/31/2027 | 1,996,876 | ||||||||||||
| 2,691,831 | CWABS, Inc. Asset-Backed Certificates Trust, Class M1, Series 2004-4 (1 mo. USD LIBOR + 0.72%)(a) | 3.001 | 07/25/2034 | 2,711,823 | ||||||||||||
| 2,000,000 | Fortress Credit Opportunities IX CLO Ltd., Class A1T, Series 2017-9A (Cayman Islands) (3 mo. USD LIBOR + 1.55%)(a)(b) | 3.864 | 11/15/2029 | 1,999,988 | ||||||||||||
| 1,500,000 | Fortress Credit Opportunities VII CLO Ltd., Class A1T, Series 2016-7A (Cayman Islands) (3 mo. USD LIBOR + 2.05%)(a)(b) | 4.384 | 12/15/2028 | 1,505,670 | ||||||||||||
| 1,000,000 | Golub Capital BDC CLO LLC, Class BR, Series 2018-1A (3 mo. USD LIBOR + 1.40%)(a)(b) | 3.890 | 04/25/2026 | 1,001,354 | ||||||||||||
| 3,000,000 | Golub Capital Partners CLO Ltd., Class A, Series 2016-33A (Cayman Islands) (3 mo. USD LIBOR + 2.48%)(a)(b) | 4.792 | 11/21/2028 | 3,008,265 | ||||||||||||
| 4,800,000 | Golub Capital Partners CLO Ltd., Class A1R, Series 2017-16A (Cayman Islands) (3 mo. USD LIBOR + 1.70%)(a)(b) | 4.060 | 07/25/2029 | 4,808,902 | ||||||||||||
| 5,000,000 | Golub Capital Partners CLO Ltd., Class A, Series 2018-36A (Cayman Islands) (3 mo. USD LIBOR + 1.30%)(a)(b) | 3.641 | 02/05/2031 | 4,987,297 | ||||||||||||
| 10,000,000 | Golub Capital Partners CLO Ltd., Class A1, Series 2018-39A (Cayman Islands) (3 mo. USD LIBOR + 1.15%)(a)(b) | 3.610 | 10/20/2028 | 10,002,402 | ||||||||||||
| 1,248,793 | GSAMP Trust, Class M1, Series 2005-HE6 (1 mo. USD LIBOR + 0.44%)(a) | 2.721 | 11/25/2035 | 1,254,780 | ||||||||||||
| 1,000,000 | Halcyon Loan Advisors Funding Ltd., Class B, Series 2012-1A (Cayman Islands) (3 mo. USD LIBOR + 3.00%)(a)(b) | 5.314 | 08/15/2023 | 1,001,387 | ||||||||||||
| 2,500,000 | HSI Asset Securitization Corp. Trust, Class M2, Series 2006-OPT2 (1 mo. USD LIBOR + 0.39%)(a) | 2.671 | 01/25/2036 | 2,482,439 | ||||||||||||
| 5,500,000 | Hunt CRE Ltd., Class A, Series 2017-FL1 (Cayman Islands) (1 mo. USD LIBOR + 1.00%)(a)(b) | 3.280 | 08/15/2034 | 5,497,453 | ||||||||||||
| 2,000,000 | KKR CLO Ltd., Class A1A, Series 2016-15 (Cayman Islands) (3 mo. USD LIBOR + 1.56%)(a)(b) | 4.005 | 10/18/2028 | 2,003,977 | ||||||||||||
| 2,000,000 | KKR CLO Ltd., Class A, Series 2018-21 (Cayman Islands) (3 mo. USD LIBOR + 1.00%)(a)(b) | 3.436 | 04/15/2031 | 1,984,729 | ||||||||||||
| 2,000,000 | KVK CLO Ltd., Class BR, Series 2017-2A (Cayman Islands) (3 mo. USD LIBOR + 1.75%)(a)(b) | 4.186 | 01/15/2026 | 2,001,708 | ||||||||||||
| 4,000,000 | KVK CLO Ltd., Class BR, Series 2017-2A (Cayman Islands) (3 mo. USD LIBOR + 1.65%)(a)(b) | 4.086 | 07/15/2026 | 4,002,970 | ||||||||||||
| 3,116,289 | Nationstar Home Equity Loan Trust, Class 1AV1, Series 2007-B (1 mo. USD LIBOR + 0.22%)(a) | 2.501 | 04/25/2037 | 3,078,392 | ||||||||||||
| 2,500,000 | Newstar Commercial Loan Funding LLC, Class BN, Series 2017-1A (3 mo. USD LIBOR + 2.50%)(a)(b) | 4.838 | 03/20/2027 | 2,510,010 | ||||||||||||
| 10,000,000 | NextGear Floorplan Master Owner Trust, Class A1, Series 2017-1A (1 mo. USD LIBOR + 0.85%)(a)(b) | 3.130 | 04/18/2022 | 10,065,500 | ||||||||||||
| 3,000,000 | Northwoods Capital XIV Ltd., Class AR, Series 2017-14A (Cayman Islands) (3 mo. USD LIBOR + 1.30%)(a)(b) | 3.638 | 11/12/2025 | 3,003,048 | ||||||||||||
| 7,500,000 | NXT Capital CLO LLC, Class A, Series 2017-1A (3 mo. USD LIBOR + 1.70%)(a)(b) | 4.169 | 04/20/2029 | 7,511,503 | ||||||||||||
| 6,750,000 | OCP CLO Ltd., Class A1RR, Series 2014-7A (Cayman Islands) (3 mo. USD LIBOR + 1.12%)(a)(b) | 3.589 | 07/20/2029 | 6,750,000 | ||||||||||||
| 2,830,000 | OZLM IX Ltd., Class A1R, Series 2017-9A (Cayman Islands) (3 mo. USD LIBOR + 1.22%)(a)(b) | 3.689 | 01/20/2027 | 2,832,175 | ||||||||||||
See accompanying Notes to Financial Statements which are an integral part of the financial statements.
|
|
40 |
|
Invesco Ultra Short Duration ETF (GSY) (continued)
October 31, 2018
| Principal Amount |
Interest Rate |
Maturity Date |
Value | |||||||||||||
| Asset-Backed Securities (continued) | ||||||||||||||||
| $ | 3,000,000 | OZLM VIII Ltd., Class A1AR, Series 2017-8A (Cayman Islands) (3 mo. USD LIBOR + 1.13%)(a)(b) | 3.579 | % | 10/17/2026 | $ | 3,001,604 | |||||||||
| 5,252,459 | Raspro Trust, Class B, Series 2005-1A (3 mo. USD LIBOR + 0.93%)(a)(b) | 3.394 | 03/23/2024 | 5,088,319 | ||||||||||||
| 2,000,000 | Recette CLO Ltd., Class BR, Series 2017-1A (Cayman Islands) (3 mo. USD LIBOR + 1.30%)(a)(b) | 3.769 | 10/20/2027 | 1,975,263 | ||||||||||||
| 2,500,000 | Sudbury Mill CLO Ltd., Class B1R, Series 2017-1A (Cayman Islands) (3 mo. USD LIBOR + 1.65%)(a)(b) | 4.099 | 01/17/2026 | 2,501,630 | ||||||||||||
| 11,000,000 | TICP CLO II-2 Ltd., Class A1, Series 2018-IIA (Cayman Islands) (3 mo. USD LIBOR + 0.84%)(a)(b) | 3.309 | 04/20/2028 | 10,896,233 | ||||||||||||
| 5,500,000 | Venture XII CLO Ltd., Class ARR, Series 2018-12A (Cayman Islands) (3 mo. USD LIBOR + 0.80%)(a)(b) | 3.111 | 02/28/2026 | 5,474,842 | ||||||||||||
| 1,500,000 | Venture XVI CLO Ltd., Class ARR, Series 2018-16A (Cayman Islands) (3 mo. USD LIBOR + 0.85%)(a)(b) | 3.286 | 01/15/2028 | 1,497,572 | ||||||||||||
| 3,600,000 | Woodmont Trust, Class A, Series 2017-2A (3 mo. USD LIBOR + 1.80%)(a)(b) | 4.245 | 07/18/2028 | 3,627,350 | ||||||||||||
|
|
|
|||||||||||||||
| Total Asset-Backed Securities (Cost $151,956,562) |
152,377,453 | |||||||||||||||
|
|
|
|||||||||||||||
| U.S. Treasury Securities— 4.5% | ||||||||||||||||
| 25,000,000 | U.S. Treasury Note | 2.500 | 05/31/2020 | 24,869,141 | ||||||||||||
| 20,000,000 | U.S. Treasury Note | 2.625 | 07/31/2020 | 19,920,703 | ||||||||||||
| 28,000,000 | U.S. Treasury Note | 2.625 | 08/31/2020 | 27,881,875 | ||||||||||||
|
|
|
|||||||||||||||
| Total U.S. Treasury Securities (Cost $72,892,031) |
72,671,719 | |||||||||||||||
|
|
|
|||||||||||||||
| Sovereign Debt Obligations—3.3% | ||||||||||||||||
| Japan—3.3% | ||||||||||||||||
| JPY | 3,000,000,000 | Japan Government Two Year Bond, Series 373(c) | 0.100 | 02/15/2019 | 26,603,385 | |||||||||||
| JPY | 1,100,000,000 | Japan Treasury Discount Bill, Series 740(c)(d) | 0.000 | 02/20/2019 | 9,755,013 | |||||||||||
| JPY | 1,900,000,000 | Japan Treasury Discount Bill, Series 787(c)(d) | 0.000 | 01/15/2019 | 16,844,736 | |||||||||||
|
|
|
|||||||||||||||
| Total Sovereign Debt Obligations (Cost $53,222,156) |
53,203,134 | |||||||||||||||
|
|
|
|||||||||||||||
| Commercial Mortgage-Backed Securities—2.6% | ||||||||||||||||
| $ 12,696,000 | Avis Budget Rental Car Funding AESOP LLC, Class A, Series 2014-1A(b) | 2.460 | 07/20/2020 | 12,660,743 | ||||||||||||
| 1,113,498 | BSPRT Issuer Ltd., Class A, Series 2017-FL1 (Cayman Islands) (1 mo. USD LIBOR + 1.35%)(a)(b) | 3.630 | 06/15/2027 | 1,115,763 | ||||||||||||
| 3,000,000 | CLNS Trust, Class A, Series 2017-IKPR (1 mo. USD LIBOR + 0.80%)(a)(b) | 3.087 | 06/11/2032 | 3,003,476 | ||||||||||||
| 12,200,000 | GS Mortgage Securities Corp. Trust, Class A, Series 2017-STAY (1 mo. USD LIBOR + 0.85%)(a)(b) | 3.130 | 07/15/2032 | 12,214,580 | ||||||||||||
| 6,434,621 | Ladder Capital Commercial Mortgage Trust, Class A, Series 2017-FL1 (1 mo. USD LIBOR + 0.88%)(a)(b) | 3.170 | 09/15/2034 | 6,439,277 | ||||||||||||
| 2,000,000 | PFP Ltd., Class B, Series 2017-3 (Cayman Islands) (1 mo. USD LIBOR + 1.75%)(a)(b) |
4.030 | 01/14/2035 | 2,004,850 | ||||||||||||
| 2,218,627 | Resource Capital Corp. Ltd., Class A, Series 2017-CRE5 (Cayman Islands) (1 mo. USD LIBOR + 0.80%)(a)(b) | 3.090 | 07/15/2034 | 2,219,632 | ||||||||||||
| 2,000,000 | TPG Real Estate Finance Issuer Ltd., Class A, Series 2018-FL1 (Cayman Islands) (1 mo. USD LIBOR + 0.75%)(a)(b) | 3.040 | 02/15/2035 | 2,001,541 | ||||||||||||
|
|
|
|||||||||||||||
| Total Commercial Mortgage-Backed Securities (Cost $41,652,720) |
41,659,862 | |||||||||||||||
|
|
|
|||||||||||||||
| Collateralized Mortgage Obligations—0.5% | ||||||||||||||||
| 277,576 | CSMC, Class 27A1, Series 2014-2R (1 mo. USD LIBOR + 0.20%)(a)(b) | 2.416 | 02/27/2046 | 264,421 | ||||||||||||
| 6,208,836 | FirstKey Master Funding Ltd., Class A6, Series 2017-R1 (Cayman Islands) (1 mo. USD LIBOR + 0.22%)(a)(b) | 2.481 | 11/03/2041 | 6,181,518 | ||||||||||||
| 1,340,165 | New Residential Mortgage Loan Trust, Class A1, Series 2017-5A (1 mo. USD LIBOR + 1.50%)(a)(b) | 3.781 | 06/25/2057 | 1,376,040 | ||||||||||||
|
|
|
|||||||||||||||
| Total Collateralized Mortgage Obligations (Cost $7,646,656) |
7,821,979 | |||||||||||||||
|
|
|
|||||||||||||||
See accompanying Notes to Financial Statements which are an integral part of the financial statements.
|
|
41 |
|
Invesco Ultra Short Duration ETF (GSY) (continued)
October 31, 2018
| Principal Amount |
Interest Rate |
Maturity Date |
Value | |||||||||||||
| Variable Rate Senior Loan Interests—0.3%(e)(f) | ||||||||||||||||
| Commercial Services—0.1% | ||||||||||||||||
| $ | 2,104,858 | Fly Funding II Sarl, Term Loan (Luxembourg) (3 mo. USD LIBOR + 2.00%)(a) | 4.350 | % | 02/09/2023 | $ | 2,103,543 | |||||||||
| Retail—0.1% | ||||||||||||||||
| 1,130,395 | Smart & Final Stores LLC, First Lien Term Loan (1 mo. USD LIBOR + 3.50%)(a) | 5.742 | 11/15/2022 | 1,095,426 | ||||||||||||
| Software—0.1% | ||||||||||||||||
| 2,484,625 | First Data Corp., Term Loan (1 mo. USD LIBOR + 2.00%)(a) | 4.287 | 04/26/2024 | 2,474,015 | ||||||||||||
|
|
|
|||||||||||||||
| Total Variable Rate Senior Loan Interests (Cost $5,684,993) |
5,672,984 | |||||||||||||||
|
|
|
|||||||||||||||
| Commercial Paper—26.5%(g) | ||||||||||||||||
| 6,000,000 | AT&T, Inc. | 2.900 | 05/28/2019 | 5,897,416 | ||||||||||||
| 20,000,000 | Arrow Electronics, Inc. | 2.870 | 11/26/2018 | 19,959,657 | ||||||||||||
| 10,000,000 | AutoNation, Inc. | 2.700 | 11/05/2018 | 9,996,229 | ||||||||||||
| 2,400,000 | AutoNation, Inc. | 2.700 | 11/06/2018 | 2,398,912 | ||||||||||||
| 10,000,000 | Aviation Capital Group LLC | 2.460 | 11/09/2018 | 9,993,800 | ||||||||||||
| 12,000,000 | Bell Canada, Inc. | 2.750 | 02/06/2019 | 11,911,604 | ||||||||||||
| 10,000,000 | Boston Scientific Corp. | 2.600 | 11/13/2018 | 9,991,178 | ||||||||||||
| 4,000,000 | Boston Scientific Corp. | 2.600 | 11/28/2018 | 3,992,250 | ||||||||||||
| 5,000,000 | Boston Scientific Corp. | 2.730 | 12/26/2018 | 4,979,863 | ||||||||||||
| 15,000,000 | Catholic Health Initiatives | 2.950 | 11/20/2018 | 14,981,125 | ||||||||||||
| 3,000,000 | Catholic Health Initiatives | 3.050 | 01/28/2019 | 2,981,955 | ||||||||||||
| 5,000,000 | Catholic Health Initiatives | 3.050 | 02/04/2019 | 4,967,320 | ||||||||||||
| 12,100,000 | Eni Finance USA, Inc. | 2.670 | 01/14/2019 | 12,033,198 | ||||||||||||
| 23,500,000 | Enable Midstream Partners LP | 2.850 | 11/02/2018 | 23,496,475 | ||||||||||||
| 5,000,000 | Enable Midstream Partners LP | 3.000 | 11/26/2018 | 4,989,914 | ||||||||||||
| 6,000,000 | Enbridge Energy Partners LP | 3.050 | 11/01/2018 | 5,999,605 | ||||||||||||
| 11,000,000 | Enbridge Energy Partners LP | 3.120 | 11/02/2018 | 10,998,549 | ||||||||||||
| 4,000,000 | Enbridge Energy Partners LP | 3.120 | 11/21/2018 | 3,994,220 | ||||||||||||
| 7,400,000 | Energy Transfer LP | 2.950 | 11/09/2018 | 7,394,940 | ||||||||||||
| 7,200,000 | Energy Transfer LP | 2.950 | 11/13/2018 | 7,192,837 | ||||||||||||
| 10,000,000 | Entergy Corp. | 2.510 | 11/21/2018 | 9,984,559 | ||||||||||||
| 10,000,000 | Entergy Corp. | 2.750 | 02/06/2019 | 9,921,437 | ||||||||||||
| 10,000,000 | Ford Motor Credit Co. LLC | 3.020 | 04/08/2019 | 9,860,124 | ||||||||||||
| 5,000,000 | Ford Motor Credit Co. LLC | 3.020 | 04/12/2019 | 4,927,873 | ||||||||||||
| 7,000,000 | General Motors Financial Co., Inc. | 2.650 | 11/08/2018 | 6,995,766 | ||||||||||||
| 20,000,000 | Glencore Funding LLC | 2.530 | 11/05/2018 | 19,993,028 | ||||||||||||
| 7,600,000 | Hitachi Capital America Corp. | 2.480 | 11/13/2018 | 7,593,295 | ||||||||||||
| 12,000,000 | Humana, Inc. | 2.800 | 01/07/2019 | 11,936,216 | ||||||||||||
| 19,400,000 | Keurig Dr Pepper, Inc. | 2.500 | 11/06/2018 | 19,392,276 | ||||||||||||
| 20,000,000 | Kinder Morgan, Inc. | 3.000 | 01/03/2019 | 19,896,782 | ||||||||||||
| 17,400,000 | Marriott International, Inc. | 2.450 | 11/26/2018 | 17,368,747 | ||||||||||||
| 5,000,000 | Marriott International, Inc. | 2.530 | 12/21/2018 | 4,981,803 | ||||||||||||
| 10,000,000 | Mondelez International, Inc. | 2.600 | 12/10/2018 | 9,971,911 | ||||||||||||
| 9,000,000 | Royal Caribbean Cruises Ltd. | 2.830 | 11/26/2018 | 8,983,893 | ||||||||||||
| 10,000,000 | Sempra Global | 2.500 | 11/27/2018 | 9,981,333 | ||||||||||||
| 7,000,000 | Sherwin-Williams Co. | 2.580 | 11/13/2018 | 6,994,313 | ||||||||||||
| 15,000,000 | Smithfield Foods, Inc. | 2.770 | 11/09/2018 | 14,989,763 | ||||||||||||
| 5,000,000 | Societe Generale SA | 2.810 | 08/26/2019 | 4,875,998 | ||||||||||||
| 15,000,000 | Suncor Energy, Inc. | 2.610 | 01/03/2019 | 14,930,187 | ||||||||||||
| 5,400,000 | United Technologies Corp. | 2.580 | 11/29/2018 | 5,389,155 | ||||||||||||
| 7,950,000 | VW Credit, Inc. | 2.630 | 02/19/2019 | 7,882,149 | ||||||||||||
| 13,000,000 | WGL Holdings, Inc. | 2.600 | 12/18/2018 | 12,955,228 | ||||||||||||
| 10,000,000 | WGL Holdings, Inc. | 2.700 | 01/10/2019 | 9,947,914 | ||||||||||||
|
|
|
|||||||||||||||
| Total Commercial Paper (Cost $427,922,772) |
427,904,797 | |||||||||||||||
|
|
|
|||||||||||||||
See accompanying Notes to Financial Statements which are an integral part of the financial statements.
|
|
42 |
|
Invesco Ultra Short Duration ETF (GSY) (continued)
October 31, 2018
| Repurchase Amount |
Interest Rate |
Maturity Date |
Value | |||||||||||||
| Repurchase Agreements—2.2% | ||||||||||||||||
| Repurchase Agreements—2.2% | ||||||||||||||||
| $ | 12,000,000 | Wells Fargo Securities LLC, agreement dated 07/13/2018, maturing value of $12,180,000 (collateralized by domestic non-agency asset-backed securities and a domestic collateralized debt obligation valued at $13,200,000; 0.000%-6.031%; 03/09/2025-08/27/2040)(h) | 3.000 | % | 01/09/2019 | $ | 12,000,000 | |||||||||
| — | Citigroup Global Markets, Inc., joint open agreement dated 08/16/2018, (collateralized by domestic non-agency asset-backed securities and domestic private label collateralized mortgage obligations valued at $16,500,000; 2.521%-6.254%; 06/10/2036-12/10/2049)(i) | 3.141 | — | 15,000,000 | ||||||||||||
| 8,000,000 | Wells Fargo Securities LLC, agreement dated 10/31/2018, maturing value of $8,060,200 (collateralized by domestic private label collateralized mortgage obligations valued at $8,800,000; 3.764%-4.712%; 09/26/2036-05/15/2048)(h) | 3.010 | 01/29/2019 | 8,000,000 | ||||||||||||
|
|
|
|||||||||||||||
| Total Repurchase Agreements (Cost $35,000,000) |
35,000,000 | |||||||||||||||
|
|
|
|||||||||||||||
| Total Investments in Securities (Cost $1,593,933,993)—99.0% |
1,594,909,497 | |||||||||||||||
| Other assets less liabilities—1.0% | 16,645,809 | |||||||||||||||
|
|
|
|||||||||||||||
| Net Assets—100.0% | $ | 1,611,555,306 | ||||||||||||||
|
|
|
|||||||||||||||
Investment Abbreviations:
BKNT—Bank Note
CLO—Collateralized Loan Obligation
GMTN—Global Medium-Term Note
JPY—Japanese Yen
LIBOR—London Interbank Offered Rate
MTN—Medium-Term Note
REIT—Real Estate Investment Trust
SOFR—Secured Overnight Financing Rate
USD—U.S. Dollar
Notes to Schedule of Investments:
| (a) | Variable rate coupon. Stated interest rate was in effect at October 31, 2018. |
| (b) | Security purchased or received in a transaction exempt from registration under the Securities Act of 1933, as amended (the “1933 Act”). The security may be resold pursuant to an exemption from registration under the 1933 Act, typically to qualified institutional buyers. The aggregate value of these securities at October 31, 2018 was $422,512,083, which represented 26.22% of the Fund’s Net Assets. |
| (c) | Foreign denominated security. Principal amount denominated in currency indicated. |
| (d) | Security traded at a premium. |
| (e) | Variable rate senior loan interests often require prepayments from excess cash flow or permit the borrower to repay at its election. The degree to which borrowers repay, whether as a contractual requirement or at their election, cannot be predicted with any accuracy. As a result, the actual remaining maturity may be substantially less than the stated maturities shown. However, it is anticipated that the variable rate senior loan interests will have an expected average life of three to five years. |
| (f) | Variable rate senior loan interests are, at present, not readily marketable, not registered under the 1933 Act and may be subject to contractual and legal restrictions on sale. Variable rate senior loan interests in the Fund’s portfolio generally have variable rates which adjust to a base, such as the London Interbank Offered Rate (“LIBOR”), on set dates, typically every 30 days, but not greater than one year, and/or have interest rates that float at margin above a widely recognized base lending rate such as the Prime Rate of a designated U.S. bank. |
| (g) | Security traded on a discount basis. The interest rate shown represents the discount rate at the time of purchase by the Fund. |
| (h) | The Fund may demand prepayment of the term repurchase agreement upon one to seven business days’ notice depending on the timing of the demand. |
| (i) | Either party may terminate the agreement upon demand. Interest rates, principal amount, and collateral are redetermined daily. |
See accompanying Notes to Financial Statements which are an integral part of the financial statements.
|
|
43 |
|
Invesco Ultra Short Duration ETF (GSY) (continued)
October 31, 2018
| Open Forward Foreign Currency Contracts | ||||||||||||||||||||||||||
| Counterparty |
Contract to | Unrealized Appreciation (Depreciation) |
||||||||||||||||||||||||
| Settlement Date | Deliver | Receive | ||||||||||||||||||||||||
| 2/15/2019 | JP Morgan | JPY | 3,001,500,000 | USD | 26,932,785 | $ | 80,259 | |||||||||||||||||||
|
|
|
|||||||||||||||||||||||||
| Subtotal—Appreciation | 80,259 | |||||||||||||||||||||||||
|
|
|
|||||||||||||||||||||||||
| 2/20/2019 | Bank of America | JPY | 1,100,000,000 | USD | 9,823,849 | (21,201 | ) | |||||||||||||||||||
| 1/15/2019 | JP Morgan | JPY | 1,900,000,000 | USD | 16,923,171 | (31,475 | ) | |||||||||||||||||||
|
|
|
|||||||||||||||||||||||||
| Subtotal—Depreciation | (52,676 | ) | ||||||||||||||||||||||||
|
|
|
|||||||||||||||||||||||||
| Total Forward Foreign Currency Contracts—Currency Risk | $ | 27,583 | ||||||||||||||||||||||||
|
|
|
|||||||||||||||||||||||||
Currency Abbreviations:
JPY—Japanese Yen
USD—U.S. Dollar
See accompanying Notes to Financial Statements which are an integral part of the financial statements.
|
|
44 |
|
Schedule of Investments
Invesco Variable Rate Investment Grade ETF (VRIG)
October 31, 2018
| Principal Amount |
Interest Rate |
Maturity Date |
Value | |||||||||||||
| Corporate Bonds and Notes—41.7% | ||||||||||||||||
| Aerospace/Defense—0.2% | ||||||||||||||||
| $ | 1,034,000 | Spirit AeroSystems, Inc. (3 mo. USD LIBOR + 0.80%)(a) | 3.134 | % | 06/15/2021 | $ | 1,035,447 | |||||||||
|
|
|
|||||||||||||||
| Auto Manufacturers—2.7% | ||||||||||||||||
| 2,000,000 | Daimler Finance North America LLC (Germany) (3 mo. USD LIBOR + 0.55%)(a)(b) | 3.132 | 05/04/2021 | 2,001,680 | ||||||||||||
| 2,000,000 | Fiat Chrysler Automobiles NV (United Kingdom) | 4.500 | 04/15/2020 | 2,012,500 | ||||||||||||
| 600,000 | Ford Motor Credit Co. LLC (3 mo. USD LIBOR + 0.83%)(a) | 3.168 | 08/12/2019 | 600,222 | ||||||||||||
| 3,150,000 | Ford Motor Credit Co. LLC (3 mo. USD LIBOR + 1.27%)(a) | 3.656 | 03/28/2022 | 3,113,124 | ||||||||||||
| 1,050,000 | Ford Motor Credit Co. LLC, Series 1 (3 mo. USD LIBOR + 0.83%)(a) | 3.164 | 03/12/2019 | 1,050,738 | ||||||||||||
| 2,250,000 | General Motors Financial Co., Inc. (3 mo. USD LIBOR + 1.31%)(a) | 3.696 | 06/30/2022 | 2,267,425 | ||||||||||||
| 1,000,000 | General Motors Financial Co., Inc. (3 mo. USD LIBOR + 0.99%)(a) | 3.398 | 01/05/2023 | 991,579 | ||||||||||||
|
|
|
|||||||||||||||
| 12,037,268 | ||||||||||||||||
|
|
|
|||||||||||||||
| Banks—18.6% | ||||||||||||||||
| 964,000 | ABN AMRO Bank NV (Netherlands) (3 mo. USD LIBOR + 0.57%)(a)(b) | 2.881 | 08/27/2021 | 965,186 | ||||||||||||
| 3,281,000 | Bank of America Corp. (3 mo. USD LIBOR + 1.00%)(a) | 3.487 | 04/24/2023 | 3,315,038 | ||||||||||||
| 1,250,000 | Bank of America Corp., GMTN (3 mo. USD LIBOR + 0.79%)(a) | 3.106 | 03/05/2024 | 1,241,987 | ||||||||||||
| 2,143,000 | Bank of Montreal, MTN (Canada) (3 mo. USD LIBOR + 0.34%)(a) | 2.776 | 07/13/2020 | 2,148,302 | ||||||||||||
| 4,000,000 | BPCE SA, MTN (France) (3 mo. USD LIBOR + 1.22%)(a)(b) | 3.530 | 05/22/2022 | 4,037,744 | ||||||||||||
| 1,000,000 | Capital One Financial Corp. (3 mo. USD LIBOR + 0.72%)(a) | 3.240 | 01/30/2023 | 991,829 | ||||||||||||
| 3,750,000 | Capital One NA, BKNT (3 mo. USD LIBOR + 1.15%)(a) | 3.670 | 01/30/2023 | 3,775,949 | ||||||||||||
| 1,500,000 | Citigroup, Inc. (3 mo. USD LIBOR + 0.95%)(a) | 3.437 | 07/24/2023 | 1,506,802 | ||||||||||||
| 4,500,000 | Citigroup, Inc. (3 mo. USD LIBOR + 1.43%)(a) | 3.751 | 09/01/2023 | 4,519,915 | ||||||||||||
| 4,250,000 | Cooperatieve Rabobank UA (Netherlands)(b)(c) | 11.000 | 4,477,375 | |||||||||||||
| 1,750,000 | Cooperatieve Rabobank UA (Netherlands) (3 mo. USD LIBOR + 0.43%)(a) | 2.938 | 04/26/2021 | 1,754,775 | ||||||||||||
| 1,500,000 | Goldman Sachs Group, Inc. (The) (3 mo. USD LIBOR + 1.36%)(a) | 3.850 | 04/23/2021 | 1,530,223 | ||||||||||||
| 2,500,000 | Goldman Sachs Group, Inc. (The), GMTN (3 mo. USD LIBOR + 1.00%)(a) | 3.487 | 07/24/2023 | 2,517,983 | ||||||||||||
| 250,000 | Goldman Sachs Group, Inc. (The), GMTN (3 mo. USD LIBOR + 1.75%)(a) | 4.259 | 10/28/2027 | 258,044 | ||||||||||||
| 2,143,000 | HSBC Holdings PLC (United Kingdom) (3 mo. USD LIBOR + 0.65%)(a) | 2.984 | 09/11/2021 | 2,147,460 | ||||||||||||
| 3,500,000 | ING Groep NV (Netherlands) (3 mo. USD LIBOR + 1.00%)(a) | 3.398 | 10/02/2023 | 3,501,005 | ||||||||||||
| 1,435,000 | JPMorgan Chase & Co., Series I (3 mo. USD LIBOR + 3.47%)(a)(c) | 5.990 | 1,440,111 | |||||||||||||
| 2,500,000 | JPMorgan Chase & Co., Series V(c) | 5.000 | 2,522,565 | |||||||||||||
| 1,957,000 | Lloyds Bank PLC (United Kingdom) (3 mo. USD LIBOR + 0.49%)(a) | 2.833 | 05/07/2021 | 1,960,252 | ||||||||||||
| 1,370,000 | Lloyds Banking Group PLC (United Kingdom)(c) | 7.500 | 1,376,661 | |||||||||||||
| 4,000,000 | Mizuho Financial Group, Inc. (Japan) (3 mo. USD LIBOR + 0.88%)(a) | 3.211 | 09/11/2022 | 4,010,166 | ||||||||||||
| 2,500,000 | Morgan Stanley, GMTN (3 mo. USD LIBOR + 1.40%)(a) | 3.869 | 04/21/2021 | 2,553,083 | ||||||||||||
| 2,500,000 | Morgan Stanley, GMTN (3 mo. USD LIBOR + 0.93%)(a) | 3.399 | 07/22/2022 | 2,511,901 | ||||||||||||
| 2,000,000 | National Australia Bank Ltd. (Australia) (3 mo. USD LIBOR + 0.60%)(a)(b) | 3.025 | 04/12/2023 | 2,000,634 | ||||||||||||
| 2,987,000 | Nordea Bank Abp (Finland) (3 mo. USD LIBOR + 0.94%)(a)(b) | 3.255 | 08/30/2023 | 2,986,299 | ||||||||||||
| 4,000,000 | Royal Bank of Scotland Group PLC (United Kingdom) (3 mo. USD LIBOR + 1.47%)(a) | 3.784 | 05/15/2023 | 4,022,738 | ||||||||||||
| 3,316,000 | Standard Chartered PLC (United Kingdom) (3 mo. USD LIBOR + 1.15%)(a)(b) | 3.558 | 01/20/2023 | 3,323,249 | ||||||||||||
| 3,500,000 | Sumitomo Mitsui Financial Group, Inc. (Japan) (3 mo. USD LIBOR + 0.74%)(a) | 3.185 | 10/18/2022 | 3,505,635 | ||||||||||||
| 2,250,000 | UBS Group Funding Switzerland AG (Switzerland) (3 mo. USD LIBOR + 1.53%)(a)(b) | 4.071 | 02/01/2022 | 2,309,283 | ||||||||||||
| 2,500,000 | UBS Group Funding Switzerland AG (Switzerland) (3 mo. USD LIBOR + 0.95%)(a)(b) | 3.264 | 08/15/2023 | 2,507,078 | ||||||||||||
| 1,100,000 | USB Realty Corp. (3 mo. USD LIBOR + 1.15%)(a)(b)(c) | 3.583 | 12/31/2049 | 990,000 | ||||||||||||
| 2,565,000 | Wells Fargo & Co. (3 mo. USD LIBOR + 1.23%)(a) | 3.757 | 10/31/2023 | 2,602,526 | ||||||||||||
| 1,000,000 | Wells Fargo & Co., Series K (3 mo. USD LIBOR + 3.77%)(a)(c) | 6.104 | 03/29/2049 | 1,010,833 | ||||||||||||
| 3,000,000 | Westpac Banking Corp. (Australia) (3 mo. USD LIBOR + 0.72%)(a) | 3.034 | 05/15/2023 | 3,008,348 | ||||||||||||
|
|
|
|||||||||||||||
| 83,330,979 | ||||||||||||||||
|
|
|
|||||||||||||||
| Beverages—0.2% | ||||||||||||||||
| 966,000 | Constellation Brands, Inc. (3 mo. USD LIBOR + 0.70%)(a) | 3.265 | 11/15/2021 | 965,797 | ||||||||||||
|
|
|
|||||||||||||||
| Building Materials—0.4% | ||||||||||||||||
| 750,000 | Vulcan Materials Co. (3 mo. USD LIBOR + 0.60%)(a) | 2.934 | 06/15/2020 | 750,758 | ||||||||||||
| 1,000,000 | Vulcan Materials Co. (3 mo. USD LIBOR + 0.65%)(a) | 2.971 | 03/01/2021 | 1,001,820 | ||||||||||||
|
|
|
|||||||||||||||
| 1,752,578 | ||||||||||||||||
|
|
|
|||||||||||||||
| Computers—0.7% | ||||||||||||||||
| 3,000,000 | Dell International LLC/EMC Corp.(b) | 5.875 | 06/15/2021 | 3,048,815 | ||||||||||||
|
|
|
|||||||||||||||
See accompanying Notes to Financial Statements which are an integral part of the financial statements.
|
|
45 |
|
Invesco Variable Rate Investment Grade ETF (VRIG) (continued)
October 31, 2018
| Principal Amount |
Interest Rate |
Maturity Date |
Value | |||||||||||||
| Corporate Bonds and Notes (continued) | ||||||||||||||||
| Diversified Financial Services—0.7% | ||||||||||||||||
| $ | 3,082,000 | BOC Aviation Ltd., MTN (Singapore) (3 mo. USD LIBOR + 1.13%)(a)(b) | 3.499 | % | 09/26/2023 | $ | 3,087,917 | |||||||||
|
|
|
|||||||||||||||
| Electric—0.6% | ||||||||||||||||
| 2,500,000 | Mississippi Power Co. (3 mo. USD LIBOR + 0.65%)(a) | 3.031 | 03/27/2020 | 2,500,284 | ||||||||||||
|
|
|
|||||||||||||||
| Food—1.6% | ||||||||||||||||
| 3,000,000 | ConAgra Brands, Inc. (3 mo. USD LIBOR + 0.75%)(a) | 3.219 | 10/22/2020 | 3,002,535 | ||||||||||||
| 3,937,000 | General Mills, Inc. (3 mo. USD LIBOR + 1.01%)(a) | 3.459 | 10/17/2023 | 3,944,893 | ||||||||||||
|
|
|
|||||||||||||||
| 6,947,428 | ||||||||||||||||
|
|
|
|||||||||||||||
| Healthcare-Products—1.7% | ||||||||||||||||
| 4,225,000 | Becton, Dickinson and Co. (3 mo. USD LIBOR + 1.03%)(a) | 3.353 | 06/06/2022 | 4,251,671 | ||||||||||||
| 3,500,000 | Zimmer Biomet Holdings, Inc. (3 mo. USD LIBOR + 0.75%)(a) | 3.089 | 03/19/2021 | 3,502,030 | ||||||||||||
|
|
|
|||||||||||||||
| 7,753,701 | ||||||||||||||||
|
|
|
|||||||||||||||
| Healthcare-Services—1.5% | ||||||||||||||||
| 2,343,000 | Halfmoon Parent, Inc. (3 mo. USD LIBOR + 0.89%)(a)(b) | 3.326 | 07/15/2023 | 2,342,649 | ||||||||||||
| 4,000,000 | HCA, Inc. | 6.500 | 02/15/2020 | 4,140,000 | ||||||||||||
|
|
|
|||||||||||||||
| 6,482,649 | ||||||||||||||||
|
|
|
|||||||||||||||
| Household Products/Wares—0.6% | ||||||||||||||||
| 2,750,000 | Reckitt Benckiser Treasury Services PLC (United Kingdom) (3 mo. USD LIBOR + 0.56%)(a)(b) | 2.926 | 06/24/2022 | 2,746,829 | ||||||||||||
|
|
|
|||||||||||||||
| Insurance—3.6% | ||||||||||||||||
| 5,300,000 | Athene Global Funding (3 mo. USD LIBOR + 1.23%)(a)(b) | 3.628 | 07/01/2022 | 5,395,159 | ||||||||||||
| 1,000,000 | Jackson National Life Global Funding (3 mo. USD LIBOR + 0.73%)(a)(b) | 3.111 | 06/27/2022 | 1,009,531 | ||||||||||||
| 4,500,000 | MetLife, Inc., Series C(c) | 5.250 | 4,533,750 | |||||||||||||
| 899,000 | Metropolitan Life Global Funding I, MTN (SOFRRATE + 0.57%)(a)(b) | 2.790 | 09/07/2020 | 900,029 | ||||||||||||
| 4,000,000 | Prudential Financial, Inc. | 5.625 | 06/15/2043 | 4,070,000 | ||||||||||||
|
|
|
|||||||||||||||
| 15,908,469 | ||||||||||||||||
|
|
|
|||||||||||||||
| Internet—0.3% | ||||||||||||||||
| 1,143,000 | Tencent Holdings Ltd., MTN (China) (3 mo. USD LIBOR + 0.61%)(a)(b) | 3.055 | 01/19/2023 | 1,137,408 | ||||||||||||
|
|
|
|||||||||||||||
| Oil & Gas—0.4% | ||||||||||||||||
| 1,500,000 | ConocoPhillips Co. (3 mo. USD LIBOR + 0.90%)(a) | 3.214 | 05/15/2022 | 1,527,165 | ||||||||||||
| 340,000 | Phillips 66 (3 mo. USD LIBOR + 0.60%)(a) | 2.911 | 02/26/2021 | 340,254 | ||||||||||||
|
|
|
|||||||||||||||
| 1,867,419 | ||||||||||||||||
|
|
|
|||||||||||||||
| Pharmaceuticals—2.7% | ||||||||||||||||
| 4,000,000 | AstraZeneca PLC (United Kingdom) (3 mo. USD LIBOR + 0.67%)(a) | 2.977 | 08/17/2023 | 3,981,595 | ||||||||||||
| 3,395,000 | Bayer US Finance II LLC (Germany) (3 mo. USD LIBOR + 0.63%)(a)(b) | 3.003 | 06/25/2021 | 3,397,567 | ||||||||||||
| 4,000,000 | Cardinal Health, Inc. (3 mo. USD LIBOR + 0.77%)(a) | 3.104 | 06/15/2022 | 3,997,540 | ||||||||||||
| 839,000 | CVS Health Corp. (3 mo. USD LIBOR + 0.72%)(a) | 3.047 | 03/09/2021 | 843,751 | ||||||||||||
|
|
|
|||||||||||||||
| 12,220,453 | ||||||||||||||||
|
|
|
|||||||||||||||
| Pipelines—2.6% | ||||||||||||||||
| 3,250,000 | Energy Transfer Operating LP, Series A(c) | 6.250 | 3,059,062 | |||||||||||||
| 3,000,000 | Enterprise Products Operating LLC, Series D | 4.875 | 08/16/2077 | 2,877,701 | ||||||||||||
| 2,000,000 | Plains All American Pipeline LP, Series B(c) | 6.125 | 1,885,000 | |||||||||||||
| 4,300,000 | TransCanada PipeLines Ltd. (Canada) (3 mo. USD LIBOR + 2.21%)(a) | 4.524 | 05/15/2067 | 3,902,250 | ||||||||||||
|
|
|
|||||||||||||||
| 11,724,013 | ||||||||||||||||
|
|
|
|||||||||||||||
| Semiconductors—0.3% | ||||||||||||||||
| 1,500,000 | QUALCOMM, Inc. (3 mo. USD LIBOR + 0.73%)(a) | 3.250 | 01/30/2023 | 1,500,646 | ||||||||||||
|
|
|
|||||||||||||||
| Telecommunications—2.3% | ||||||||||||||||
| 2,669,000 | AT&T, Inc. (3 mo. USD LIBOR + 0.89%)(a)(b) | 3.209 | 02/15/2023 | 2,656,880 | ||||||||||||
| 3,832,000 | AT&T, Inc. (3 mo. USD LIBOR + 1.18%)(a) | 3.514 | 06/12/2024 | 3,845,538 | ||||||||||||
| 2,250,000 | Verizon Communications, Inc. (3 mo. USD LIBOR + 1.00%)(a) | 3.334 | 03/16/2022 | 2,287,198 | ||||||||||||
| 1,627,000 | Verizon Communications, Inc. (3 mo. USD LIBOR + 1.10%)(a) | 3.414 | 05/15/2025 | 1,636,771 | ||||||||||||
|
|
|
|||||||||||||||
| 10,426,387 | ||||||||||||||||
|
|
|
|||||||||||||||
| Total Corporate Bonds and Notes (Cost $187,236,172) |
186,474,487 | |||||||||||||||
|
|
|
|||||||||||||||
See accompanying Notes to Financial Statements which are an integral part of the financial statements.
|
|
46 |
|
Invesco Variable Rate Investment Grade ETF (VRIG) (continued)
October 31, 2018
| Principal Amount |
Interest Rate |
Maturity Date |
Value | |||||||||||||
| U.S. Agency Mortgage Credit Risk Transfer—21.5% | ||||||||||||||||
| Structured Agency Credit Risk (STACR)—18.5%(d) | ||||||||||||||||
| $ | 5,103,085 | Federal Home Loan Mortgage Corp. (FHLMC), Class M1, Series 2017-DNA2 (1 mo. USD LIBOR + 1.20%)(a) | 3.481 | % | 10/25/2029 | $ | 5,155,438 | |||||||||
| 1,274,526 | Federal Home Loan Mortgage Corp. (FHLMC), Class M1, Series 2017-HQA1 (1 mo. USD LIBOR + 1.20%)(a) | 3.481 | 08/25/2029 | 1,283,400 | ||||||||||||
| 3,817,800 | Federal Home Loan Mortgage Corp. (FHLMC), Class M2, Series 2014-DN1 (1 mo. USD LIBOR + 2.20%)(a) | 4.481 | 02/25/2024 | 3,917,948 | ||||||||||||
| 845,926 | Federal Home Loan Mortgage Corp. (FHLMC), Class M2, Series 2014-DN2 (1 mo. USD LIBOR + 1.65%)(a) | 3.931 | 04/25/2024 | 855,288 | ||||||||||||
| 163,279 | Federal Home Loan Mortgage Corp. (FHLMC), Class M2, Series 2014-HQ1 (1 mo. USD LIBOR + 2.50%)(a) | 4.781 | 08/25/2024 | 163,768 | ||||||||||||
| 6,146,115 | Federal Home Loan Mortgage Corp. (FHLMC), Class M2, Series 2014-HQ2 (1 mo. USD LIBOR + 2.20%)(a) | 4.481 | 09/25/2024 | 6,318,158 | ||||||||||||
| 3,414,083 | Federal Home Loan Mortgage Corp. (FHLMC), Class M2, Series 2015-DNA1 (1 mo. USD LIBOR + 1.85%)(a) | 4.131 | 10/25/2027 | 3,468,978 | ||||||||||||
| 9,480,308 | Federal Home Loan Mortgage Corp. (FHLMC), Class M2, Series 2015-DNA3 (1 mo. USD LIBOR + 2.85%)(a) | 5.131 | 04/25/2028 | 9,786,614 | ||||||||||||
| 345,166 | Federal Home Loan Mortgage Corp. (FHLMC), Class M2, Series 2015-HQ1 (1 mo. USD LIBOR + 2.20%)(a) | 4.487 | 03/25/2025 | 346,086 | ||||||||||||
| 8,248,086 | Federal Home Loan Mortgage Corp. (FHLMC), Class M2, Series 2015-HQ2 (1 mo. USD LIBOR + 1.95%)(a) | 4.237 | 05/25/2025 | 8,466,663 | ||||||||||||
| 3,784,497 | Federal Home Loan Mortgage Corp. (FHLMC), Class M2, Series 2015-HQA1 (1 mo. USD LIBOR + 2.65%)(a) | 4.931 | 03/25/2028 | 3,846,423 | ||||||||||||
| 4,828,858 | Federal Home Loan Mortgage Corp. (FHLMC), Class M2, Series 2015-HQA2 (1 mo. USD LIBOR + 2.80%)(a) | 5.081 | 05/25/2028 | 4,958,608 | ||||||||||||
| 5,546,610 | Federal Home Loan Mortgage Corp. (FHLMC), Class M2, Series 2016-DNA1 (1 mo. USD LIBOR + 2.90%)(a) | 5.187 | 07/25/2028 | 5,670,281 | ||||||||||||
| 3,000,000 | Federal Home Loan Mortgage Corp. (FHLMC), Class M2, Series 2016-DNA4 (1 mo. USD LIBOR + 1.30%)(a) | 3.581 | 03/25/2029 | 3,022,737 | ||||||||||||
| 1,782,723 | Federal Home Loan Mortgage Corp. (FHLMC), Class M2, Series 2016-HQA1 (1 mo. USD LIBOR + 2.75%)(a) | 5.031 | 09/25/2028 | 1,819,234 | ||||||||||||
| 5,018,497 | Federal Home Loan Mortgage Corp. (FHLMC), Class M2, Series 2016-HQA2 (1 mo. USD LIBOR + 2.25%)(a) | 4.531 | 11/25/2028 | 5,120,821 | ||||||||||||
| 9,500,000 | Federal Home Loan Mortgage Corp. (FHLMC), Class M2, Series 2016-HQA3 (1 mo. USD LIBOR + 1.35%)(a) | 3.631 | 03/25/2029 | 9,641,413 | ||||||||||||
| 6,630,000 | Federal Home Loan Mortgage Corp. (FHLMC), Class M2, Series 2016-HQA4 (1 mo. USD LIBOR + 1.30%)(a) | 3.587 | 04/25/2029 | 6,709,429 | ||||||||||||
| 2,040,000 | Federal Home Loan Mortgage Corp. (FHLMC), Class M3, Series 2015-HQ1 (1 mo. USD LIBOR + 3.80%)(a) | 6.087 | 03/25/2025 | 2,162,614 | ||||||||||||
|
|
|
|||||||||||||||
| 82,713,901 | ||||||||||||||||
|
|
|
|||||||||||||||
| Connecticut Avenue Securities (CAS)—3.0%(e) | ||||||||||||||||
| 241,898 | Federal National Mortgage Association (FNMA), Class 2M1, Series 2016-C03 (1 mo. USD LIBOR + 2.20%)(a) | 4.481 | 10/25/2028 | 242,243 | ||||||||||||
| 219,198 | Federal National Mortgage Association (FNMA), Class 2M1, Series 2016-C05 (1 mo. USD LIBOR + 1.35%)(a) | 3.631 | 01/25/2029 | 219,747 | ||||||||||||
| 4,363,678 | Federal National Mortgage Association (FNMA), Class 2M1, Series 2017-C02 (1 mo. USD LIBOR + 1.15%)(a) | 3.431 | 09/25/2029 | 4,387,036 | ||||||||||||
| 3,896,617 | Federal National Mortgage Association (FNMA), Class 2M2, Series 2014-C02 (1 mo. USD LIBOR + 2.60%)(a) | 4.881 | 05/25/2024 | 4,125,583 | ||||||||||||
| 4,442,238 | Federal National Mortgage Association (FNMA), Class 2M2, Series 2014-C03 (1 mo. USD LIBOR + 2.90%)(a) | 5.181 | 07/25/2024 | 4,750,476 | ||||||||||||
|
|
|
|||||||||||||||
| 13,725,085 | ||||||||||||||||
|
|
|
|||||||||||||||
| Total U.S. Agency Mortgage Credit Risk Transfer (Cost $96,568,461) |
96,438,986 | |||||||||||||||
|
|
|
|||||||||||||||
| Commercial Mortgage-Backed Securities—12.1% | ||||||||||||||||
| 2,000,000 | BBCMS Mortgage Trust, Class A, Series 2017-GLKS (1 mo. USD LIBOR + 0.80%)(a)(b) | 3.080 | 11/15/2034 | 1,997,386 | ||||||||||||
| 1,000,000 | BX Commercial Mortgage Trust 2018-BIOA, Class A, Series 2018-BIOA (1 mo. USD LIBOR + 0.67%)(a)(b) | 2.951 | 03/15/2037 | 998,617 | ||||||||||||
See accompanying Notes to Financial Statements which are an integral part of the financial statements.
|
|
47 |
|
Invesco Variable Rate Investment Grade ETF (VRIG) (continued)
October 31, 2018
| Principal Amount |
Interest Rate |
Maturity Date |
Value | |||||||||||||
| Commercial Mortgage-Backed Securities (continued) | ||||||||||||||||
| $ | 1,500,000 | BX Commercial Mortgage Trust 2018-BIOA, Class C, Series 2018-BIOA (1 mo. USD LIBOR + 1.12%)(a)(b) | 3.401 | % | 03/15/2037 | $ | 1,501,192 | |||||||||
| 4,500,000 | BX Trust 2018-Gw, Class A, Series 2018-GW (1 mo. USD LIBOR + 0.80%)(a)(b) | 3.080 | 05/15/2035 | 4,499,657 | ||||||||||||
| 3,500,000 | BX Trust 2018-MCSF, Class A, Series 2018-MCSF (1 mo. USD LIBOR + 0.58%)(a)(b) | 2.856 | 04/15/2035 | 3,490,182 | ||||||||||||
| 1,350,000 | CGDBB Commercial Mortgage Trust, Class A, Series 2017-BIOC (1 mo. USD LIBOR + 0.79%)(a)(b) | 3.070 | 07/15/2032 | 1,351,162 | ||||||||||||
| 2,750,000 | CGDBB Commercial Mortgage Trust, Class B, Series 2017-BIOC (1 mo. USD LIBOR + 0.97%)(a)(b) | 3.250 | 07/15/2032 | 2,752,365 | ||||||||||||
| 2,000,000 | CLNS Trust, Class A, Series 2017-IKPR (1 mo. USD LIBOR + 0.80%)(a)(b) | 3.087 | 06/11/2032 | 2,002,317 | ||||||||||||
| 3,400,000 | Cold Storage Trust, Class A, Series 2017-ICE3 (1 mo. USD LIBOR + 1.00%)(a)(b) | 3.280 | 04/15/2036 | 3,405,745 | ||||||||||||
| 155,957 | Commercial Mortgage Trust, Class B, Series 2014-FL5 (1 mo. USD LIBOR + 2.15%)(a)(b) |
4.430 | 10/15/2031 | 155,752 | ||||||||||||
| 3,000,000 | CSWF Trust, Class B, Series 2018-TOP (1 mo. USD LIBOR + 1.30%)(a)(b) | 3.580 | 08/15/2035 | 3,007,667 | ||||||||||||
| 2,000,000 | DBGS Mortgage Trust, Class A, Series 2018-5BP (1 mo. USD LIBOR + 0.65%)(a)(b) | 2.925 | 06/15/2033 | 1,997,083 | ||||||||||||
| 3,000,000 | DBGS Mortgage Trust, Class B, Series 2018-5BP (1 mo. USD LIBOR + 0.83%)(a)(b) | 3.110 | 06/15/2033 | 2,985,988 | ||||||||||||
| 1,430,389 | DBGS Mortgage Trust, Class B, Series 2018-BIOD (1 mo. USD LIBOR + 0.89%)(a)(b) | 3.167 | 05/15/2035 | 1,428,067 | ||||||||||||
| 3,000,000 | GPT Mortgage Trust, Class B, Series 2018-GPP (1 mo. USD LIBOR + 1.28%)(a)(b) | 3.560 | 06/15/2035 | 3,002,714 | ||||||||||||
| 3,500,000 | GS Mortgage Securities Corp. Trust, Class B, Series 2018-CHLL (1 mo. USD LIBOR + 1.05%)(a)(b) | 3.330 | 02/15/2037 | 3,504,852 | ||||||||||||
| 800,000 | Hospitality Mortgage Trust, Class B, Series 2017-HIT (1 mo. USD LIBOR + 1.18%)(a)(b) | 3.461 | 05/08/2030 | 800,441 | ||||||||||||
| 500,000 | Hospitality Mortgage Trust, Class C, Series 2017-HIT (1 mo. USD LIBOR + 1.35%)(a)(b) | 3.631 | 05/08/2030 | 500,287 | ||||||||||||
| 3,000,000 | Morgan Stanley Capital I Inc., Class A, Series 2017-JWDR (1 mo. USD LIBOR + 0.85%)(a)(b) |
3.130 | 11/15/2034 | 3,000,141 | ||||||||||||
| 1,000,000 | Morgan Stanley Capital I Trust, Class B, Series 2017-CLS (1 mo. USD LIBOR + 0.85%)(a)(b) | 3.130 | 11/15/2034 | 998,357 | ||||||||||||
| 2,416,735 | Motel 6 Trust, Class A, Series 2017-MTL6 (1 mo. USD LIBOR + 0.92%)(a)(b) | 3.200 | 08/15/2034 | 2,418,088 | ||||||||||||
| 1,000,000 | Rosslyn Portfolio Trust, Class B, Series 2017-ROSS (1 mo. USD LIBOR + 1.25%)(a)(b) | 3.533 | 06/15/2033 | 1,002,740 | ||||||||||||
| 994,102 | Stonemont Portfolio Trust, Class A, Series 2017-MONT (1 mo. USD LIBOR + 0.85%)(a)(b) |
3.130 | 08/20/2030 | 994,755 | ||||||||||||
| 1,298,373 | Tharaldson Hotel Portfolio Trust, Class A, Series 2018-THL (1 mo. USD LIBOR + 0.75%)(a)(b) | 3.031 | 11/11/2034 | 1,299,190 | ||||||||||||
| 4,900,000 | Wells Fargo Commercial Mortgage Trust, Class A, Series 2018-BXI (1 mo. USD LIBOR + 0.73%)(a)(b) | 3.011 | 12/15/2036 | 4,903,549 | ||||||||||||
|
|
|
|||||||||||||||
| Total Commercial Mortgage-Backed Securities (Cost $53,946,488) |
53,998,294 | |||||||||||||||
|
|
|
|||||||||||||||
| U.S. Treasury Securities—10.8% | ||||||||||||||||
| 1,675,000 | U.S. Treasury Floating Rate Note (3 mo. U.S. Treasury Bill Money Market Yield Rate + 0.14%)(a) | 2.459 | 01/31/2019 | 1,675,842 | ||||||||||||
| 8,650,000 | U.S. Treasury Floating Rate Note (3 mo. U.S. Treasury Bill Money Market Yield Rate + 0.07%)(a) | 2.389 | 04/30/2019 | 8,655,980 | ||||||||||||
| 9,500,000 | U.S. Treasury Floating Rate Note (3 mo. U.S. Treasury Bill Money Market Yield Rate + 0.05%)(a) | 2.367 | 10/31/2019 | 9,508,330 | ||||||||||||
| 28,400,000 | U.S. Treasury Floating Rate Note (3 mo. U.S. Treasury Bill Money Market Yield Rate + 0.00%)(a) | 2.319 | 01/31/2020 | 28,407,063 | ||||||||||||
|
|
|
|||||||||||||||
| Total U.S. Treasury Securities (Cost $48,227,676) |
48,247,215 | |||||||||||||||
|
|
|
|||||||||||||||
| U.S. Government Sponsored Agency Mortgage-Backed Securities—6.2% | ||||||||||||||||
| Collateralized Mortgage Obligations—4.4% | ||||||||||||||||
| 420,568 | Federal Home Loan Mortgage Corp. (FHLMC), REMICs, Class JF, Series 2012-4091 (1 mo. USD LIBOR + 0.50%)(a) | 2.780 | 06/15/2041 | 424,736 | ||||||||||||
| 1,794,827 | Federal Home Loan Mortgage Corp. (FHLMC), REMICs, Class FA, Series 2016-4547 (1 mo. USD LIBOR + 0.45%)(a) | 2.554 | 09/15/2040 | 1,798,956 | ||||||||||||
| 2,152,437 | Federal Home Loan Mortgage Corp. (FHLMC), REMICs, Class FA, Series 2017-4683 (1 mo. USD LIBOR + 0.35%)(a) | 2.454 | 09/15/2038 | 2,156,773 | ||||||||||||
| 2,272,316 | Federal Home Loan Mortgage Corp. (FHLMC), REMICs, Class FA, Series 2018-4770 (1 mo. USD LIBOR + 0.32%)(a) | 2.424 | 08/15/2043 | 2,271,118 | ||||||||||||
| 5,547,833 | Federal Home Loan Mortgage Corp. (FHLMC), STRIPS, Class F4, Series 2014-330 (1 mo. USD LIBOR + 0.35%)(a) | 2.454 | 10/15/2037 | 5,553,988 | ||||||||||||
| 1,658,531 | Federal Home Loan Mortgage Corp. (FHLMC), STRIPS, Class F2, Series 2016-350 (1 mo. USD LIBOR + 0.35%)(a) | 2.454 | 09/15/2040 | 1,662,294 | ||||||||||||
| 176,249 | Federal National Mortgage Association (FNMA), REMICs, Class FJ, Series 2011-127 (1 mo. USD LIBOR + 0.35%)(a) | 2.631 | 09/25/2041 | 176,175 | ||||||||||||
| 2,348,027 | Federal National Mortgage Association (FNMA), REMICs, Class FB, Series 2014-92 (1 mo. USD LIBOR + 0.32%)(a) | 2.424 | 01/25/2045 | 2,345,511 | ||||||||||||
| 527,062 | Federal National Mortgage Association (FNMA), REMICs, Class FL, Series 2016-25 (1 mo. USD LIBOR + 0.50%)(a) | 2.781 | 05/25/2046 | 531,500 | ||||||||||||
| 754,087 | Federal National Mortgage Association (FNMA), REMICs, Class FM, Series 2017-100 (1 mo. USD LIBOR + 0.32%)(a) | 2.424 | 12/25/2047 | 754,099 | ||||||||||||
| 2,102,082 | Federal National Mortgage Association (FNMA), REMICs, Class AF, Series 2017-68 (1 mo. USD LIBOR + 0.30%)(a) | 2.404 | 09/25/2047 | 2,102,935 | ||||||||||||
|
|
|
|||||||||||||||
| 19,778,085 | ||||||||||||||||
|
|
|
|||||||||||||||
See accompanying Notes to Financial Statements which are an integral part of the financial statements.
|
|
48 |
|
Invesco Variable Rate Investment Grade ETF (VRIG) (continued)
October 31, 2018
| Principal Amount |
Interest Rate |
Maturity Date |
Value | |||||||||||||
| U.S. Government Sponsored Agency Mortgage-Backed Securities (continued) | ||||||||||||||||
| Federal Home Loan Mortgage Corp. (FHLMC)—0.5% | ||||||||||||||||
| $ | 424,867 | Federal Home Loan Mortgage Corp. (FHLMC) (12 mo. USD LIBOR + 1.55%)(a) | 3.604 | % | 06/01/2037 | $ | 440,976 | |||||||||
| 986,090 | Federal Home Loan Mortgage Corp. (FHLMC) (12 mo. USD LIBOR + 1.74%)(a) | 4.205 | 11/01/2038 | 1,031,586 | ||||||||||||
| 938,054 | Federal Home Loan Mortgage Corp. (FHLMC) (12 mo. USD LIBOR + 1.74%)(a) | 4.045 | 03/01/2043 | 978,612 | ||||||||||||
|
|
|
|||||||||||||||
| 2,451,174 | ||||||||||||||||
|
|
|
|||||||||||||||
| Federal National Mortgage Corp. (FNMA)—0.9% | ||||||||||||||||
| 61,490 | Federal National Mortgage Association (FNMA) (12 mo. USD LIBOR + 1.64%)(a) | 3.515 | 02/01/2035 | 61,831 | ||||||||||||
| 177,614 | Federal National Mortgage Association (FNMA) (6 mo. USD LIBOR + 1.57%)(a) | 4.065 | 07/01/2035 | 183,999 | ||||||||||||
| 1,846,803 | Federal National Mortgage Association (FNMA) (1-Year Treasury Constant Maturity + 2.37%)(a) | 4.276 | 07/01/2035 | 1,959,756 | ||||||||||||
| 699,479 | Federal National Mortgage Association (FNMA) (12 mo. USD LIBOR + 1.81%)(a) | 4.258 | 10/01/2036 | 732,641 | ||||||||||||
| 361,158 | Federal National Mortgage Association (FNMA) (12 mo. USD LIBOR + 1.75%)(a) | 3.851 | 03/01/2037 | 377,141 | ||||||||||||
| 676,880 | Federal National Mortgage Association (FNMA) (12 mo. USD LIBOR + 1.62%)(a) | 3.739 | 11/01/2037 | 707,061 | ||||||||||||
|
|
|
|||||||||||||||
| 4,022,429 | ||||||||||||||||
|
|
|
|||||||||||||||
| Government National Mortgage Association—0.4% | ||||||||||||||||
| 1,766,359 | Government National Mortgage Association (GNMA) (1-Year Treasury Constant Maturity + 1.50%)(a) | 2.500 | 10/20/2047 | 1,734,709 | ||||||||||||
|
|
|
|||||||||||||||
| Total U.S. Government Sponsored Agency Mortgage-Backed Securities (Cost $28,040,602) |
27,986,397 | |||||||||||||||
|
|
|
|||||||||||||||
| Asset-Backed Securities—5.1% | ||||||||||||||||
| 250,000 | Capital One Multi-Asset Execution Trust, Class A2, Series 2016-A2 (1 mo. USD LIBOR + 0.63%)(a) | 2.910 | 02/15/2024 | 252,498 | ||||||||||||
| 953,537 | Edsouth Indenture No. 9 LLC, Class A, Series 2015-1 (1 mo. USD LIBOR + 0.80%)(a)(b) | 3.081 | 10/25/2056 | 954,433 | ||||||||||||
| 1,106,896 | Home Equity Asset Trust, Class M2, Series 2004-5 (1 mo. USD LIBOR + 0.95%)(a) | 3.226 | 11/25/2034 | 1,109,662 | ||||||||||||
| 1,821,643 | Home Partners of America Trust, Class A, Series 2017-1 (1 mo. USD LIBOR + 0.82%)(a)(b) | 3.107 | 07/17/2034 | 1,823,836 | ||||||||||||
| 1,760,000 | Home Partners of America Trust, Class B, Series 2018-1 (1 mo. USD LIBOR + 1.10%)(a)(b) | 3.390 | 07/17/2037 | 1,752,897 | ||||||||||||
| 1,985,252 | Invitation Homes Trust, Class A, Series 2017-SFR2 (1 mo. USD LIBOR + 0.85%)(a)(b) | 3.140 | 12/17/2036 | 1,990,390 | ||||||||||||
| 5,620,000 | Invitation Homes Trust, Class C, Series 2017-SFR2 (1 mo. USD LIBOR + 1.45%)(a)(b) | 3.740 | 12/17/2036 | 5,644,637 | ||||||||||||
| 1,000,000 | Invitation Homes Trust, Class B, Series 2018-SFR1 (1 mo. USD LIBOR + 0.95%)(a)(b) | 3.240 | 03/17/2037 | 997,351 | ||||||||||||
| 2,000,000 | Invitation Homes Trust, Class B, Series 2018-SFR2 (1 mo. USD LIBOR + 1.08%)(a)(b) | 3.360 | 06/17/2037 | 2,010,793 | ||||||||||||
| 1,340,697 | Pennsylvania Higher Education Assistance Agency, Class A2, Series 2009-2 (3 mo. USD LIBOR + 1.10%)(a) | 3.590 | 01/25/2028 | 1,351,450 | ||||||||||||
| 5,083,042 | PHEAA Student Loan Trust, Class A, Series 2016-1A (1 mo. USD LIBOR + 1.15%)(a)(b) | 3.431 | 09/25/2065 | 5,134,241 | ||||||||||||
|
|
|
|||||||||||||||
| Total Asset-Backed Securities (Cost $23,058,488) |
23,022,188 | |||||||||||||||
|
|
|
|||||||||||||||
| Collateralized Mortgage Obligations—2.2% | ||||||||||||||||
| 376,222 | Adjustable Rate Mortgage Trust, Class 6A1, Series 2004-2(f) | 4.491 | 02/25/2035 | 379,852 | ||||||||||||
| 452,880 | Bear Stearns Adjustable Rate Mortgage Trust, Class 6A, Series 2003-7(f) | 4.510 | 10/25/2033 | 458,190 | ||||||||||||
| 336,050 | Bear Stearns Adjustable Rate Mortgage Trust, Class 4A1, Series 2003-8(f) | 4.371 | 01/25/2034 | 339,385 | ||||||||||||
| 332,634 | Merrill Lynch Mortgage Investors Trust, Class A1, Series 2003-F (1 mo. USD LIBOR + 0.64%)(a) | 2.921 | 10/25/2028 | 330,081 | ||||||||||||
| 128,783 | Merrill Lynch Mortgage Investors Trust, Class A5, Series 2005-A2(f) | 3.541 | 02/25/2035 | 134,181 | ||||||||||||
| 3,479,804 | OBX Trust, Class 2A1, Series 2018-EXP1 (1 mo. USD LIBOR + 0.85%)(a)(b) | 3.131 | 04/25/2048 | 3,489,847 | ||||||||||||
| 3,995,000 | OBX Trust, Class 2A2, Series 2018-EXP2 (1 mo. USD LIBOR + 0.95%)(a)(b) | 3.064 | 11/25/2048 | 3,989,862 | ||||||||||||
| 214,251 | Structured Adjustable Rate Mortgage Loan Trust, Class 3A2, Series 2004-16(f) | 4.205 | 11/25/2034 | 213,531 | ||||||||||||
| 175,677 | WaMu Mortgage Pass-Through Certificates Trust, Class A2, Series 2004-AR3(f) | 3.958 | 06/25/2034 | 179,676 | ||||||||||||
| 330,231 | Wells Fargo Mortgage Backed Securities Trust, Class 1A1, Series 2005-AR12(f) | 4.146 | 05/25/2035 | 338,846 | ||||||||||||
|
|
|
|||||||||||||||
| Total Collateralized Mortgage Obligations (Cost $9,829,546) |
9,853,451 | |||||||||||||||
|
|
|
|||||||||||||||
| Number of Shares |
||||||||||||||||
| Money Market Fund—0.0% | ||||||||||||||||
| 131,672 | Invesco Premier U.S. Government Money Portfolio—Institutional Class, 2.08%(g) (Cost $131,672) |
131,672 | ||||||||||||||
|
|
|
|||||||||||||||
| Total Investments in Securities (Cost $447,039,105)—99.6% |
446,152,690 | |||||||||||||||
| Other assets less liabilities—0.4% | 1,715,327 | |||||||||||||||
|
|
|
|||||||||||||||
| Net Assets—100.0% | $ | 447,868,017 | ||||||||||||||
|
|
|
|||||||||||||||
See accompanying Notes to Financial Statements which are an integral part of the financial statements.
|
|
49 |
|
Invesco Variable Rate Investment Grade ETF (VRIG) (continued)
October 31, 2018
See accompanying Notes to Financial Statements which are an integral part of the financial statements.
|
|
50 |
|
(This Page Intentionally Left Blank)
|
|
51 |
|
Statements of Assets and Liabilities
October 31, 2018
| Invesco Active U.S. Real Estate ETF (PSR) |
Invesco Balanced Multi-Asset Allocation ETF (PSMB) |
Invesco Conservative Multi-Asset Allocation ETF (PSMC) |
Invesco Growth Multi-Asset Allocation ETF (PSMG) |
Invesco Moderately Conservative Multi-Asset Allocation ETF (PSMM) |
||||||||||||||||
| Assets: | ||||||||||||||||||||
| Unaffiliated investments in securities, |
$ | 27,803,805 | $ | — | $ | — | $ | — | $ | — | ||||||||||
| Affiliated investments in securities, at value |
— | 2,620,431 | 1,248,936 | 2,891,876 | 1,282,201 | |||||||||||||||
| Other investments: |
||||||||||||||||||||
| Unrealized appreciation on forward foreign currency contracts outstanding |
— | — | — | — | — | |||||||||||||||
| Unrealized appreciation on futures contracts |
— | — | — | — | — | |||||||||||||||
| Cash |
— | — | — | — | — | |||||||||||||||
| Deposits with brokers: |
||||||||||||||||||||
| Cash collateral—futures contracts |
— | — | — | — | — | |||||||||||||||
| Receivables: |
||||||||||||||||||||
| Dividends and interest |
12,019 | — | — | — | — | |||||||||||||||
| Investments sold |
— | — | — | — | — | |||||||||||||||
| Foreign tax reclaims |
— | — | — | — | — | |||||||||||||||
| Securities lending |
— | 84 | 228 | 1,017 | 606 | |||||||||||||||
| Shares sold |
— | — | — | — | — | |||||||||||||||
| Other assets |
— | — | — | — | — | |||||||||||||||
|
|
|
|
|
|
|
|
|
|
|
|||||||||||
| Total Assets |
27,815,824 | 2,620,515 | 1,249,164 | 2,892,893 | 1,282,807 | |||||||||||||||
|
|
|
|
|
|
|
|
|
|
|
|||||||||||
| Liabilities: | ||||||||||||||||||||
| Other investments: |
||||||||||||||||||||
| Unrealized depreciation on forward foreign currency contracts outstanding |
— | — | — | — | — | |||||||||||||||
| Unrealized depreciation on futures contracts |
— | — | — | — | — | |||||||||||||||
| Due to custodian |
835 | — | 77 | 316 | 162 | |||||||||||||||
| Due to foreign custodian |
— | — | — | — | — | |||||||||||||||
| Payables: |
||||||||||||||||||||
| Investments purchased |
— | — | — | — | — | |||||||||||||||
| Collateral upon return of securities loaned |
— | — | — | 201,695 | 6,206 | |||||||||||||||
| Accrued unitary management fees |
8,224 | 113 | 53 | 116 | 55 | |||||||||||||||
| Accrued advisory fees |
— | — | — | — | — | |||||||||||||||
| Accrued trustees’ and officer’s fees |
— | — | — | — | — | |||||||||||||||
| Accrued expenses |
— | — | — | — | — | |||||||||||||||
|
|
|
|
|
|
|
|
|
|
|
|||||||||||
| Total Liabilities |
9,059 | 113 | 130 | 202,127 | 6,423 | |||||||||||||||
|
|
|
|
|
|
|
|
|
|
|
|||||||||||
| Net Assets | $ | 27,806,765 | $ | 2,620,402 | $ | 1,249,034 | $ | 2,690,766 | $ | 1,276,384 | ||||||||||
|
|
|
|
|
|
|
|
|
|
|
|||||||||||
| Net Assets Consist of: | ||||||||||||||||||||
| Shares of beneficial interest |
$ | 27,209,825 | $ | 2,609,391 | $ | 1,249,994 | $ | 2,660,374 | $ | 1,250,012 | ||||||||||
| Distributable earnings |
596,940 | 11,011 | (960) | 30,392 | 26,372 | |||||||||||||||
|
|
|
|
|
|
|
|
|
|
|
|||||||||||
| Net Assets | $ | 27,806,765 | $ | 2,620,402 | $ | 1,249,034 | $ | 2,690,766 | $ | 1,276,384 | ||||||||||
|
|
|
|
|
|
|
|
|
|
|
|||||||||||
| Shares outstanding (unlimited amount authorized, $0.01 par value) |
350,000 | 200,001 | 100,001 | 200,001 | 100,001 | |||||||||||||||
| Net asset value |
$ | 79.45 | $ | 13.10 | $ | 12.49 | $ | 13.45 | $ | 12.76 | ||||||||||
|
|
|
|
|
|
|
|
|
|
|
|||||||||||
| Market price |
$ | 79.30 | $ | 13.14 | $ | 12.49 | $ | 13.50 | $ | 12.78 | ||||||||||
|
|
|
|
|
|
|
|
|
|
|
|||||||||||
| Unaffiliated investments in securities, at cost |
$ | 26,488,263 | $ | — | $ | — | $ | — | $ | — | ||||||||||
|
|
|
|
|
|
|
|
|
|
|
|||||||||||
| Affiliated investments in securities, at cost |
$ | — | $ | 2,630,429 | $ | 1,254,691 | $ | 2,887,649 | $ | 1,266,831 | ||||||||||
|
|
|
|
|
|
|
|
|
|
|
|||||||||||
| Foreign currencies (due to foreign custodian), at cost |
$ | — | $ | — | $ | — | $ | — | $ | — | ||||||||||
|
|
|
|
|
|
|
|
|
|
|
|||||||||||
| (a) Includes securities on loan with an aggregate value of: |
$ | — | $ | — | $ | — | $ | 196,764 | $ | 6,054 | ||||||||||
|
|
|
|
|
|
|
|
|
|
|
|||||||||||
See accompanying Notes to Financial Statements which are an integral part of the financial statements.
|
|
52 |
|
| Invesco Multi-Strategy Alternative ETF (LALT) |
Invesco S&P 500® Downside Hedged ETF (PHDG) |
Invesco Ultra Short Duration ETF (GSY) |
Invesco Variable Rate Investment Grade ETF (VRIG) |
|||||||||||
| $ | 1,608,290 | $ | 19,860,670 | $ | 1,594,909,497 | $ | 446,021,018 | |||||||
| 2,398,450 | 4,585,044 | — | 131,672 | |||||||||||
| 17,527 | — | 80,259 | — | |||||||||||
| 136,016 | 214,476 | — | — | |||||||||||
| 23,917 | — | 9,780,152 | 36,654 | |||||||||||
| 214,853 | 1,844,247 | — | — | |||||||||||
| 5,310 | 26,556 | 4,870,228 | 1,539,174 | |||||||||||
| — | 34,985 | — | 298,019 | |||||||||||
| — | — | — | 6,187 | |||||||||||
| — | — | — | — | |||||||||||
| — | — | 20,081,998 | — | |||||||||||
| — | — | 20,415 | — | |||||||||||
|
|
|
|
|
|
|
|
|
|||||||
| 4,404,363 | 26,565,978 | 1,629,742,549 | 448,032,724 | |||||||||||
|
|
|
|
|
|
|
|
|
|||||||
|
|
14,935 |
|
— | 52,676 | — | |||||||||
| 16,011 | — | — | — | |||||||||||
| — | — | — | — | |||||||||||
| — | — | 1,276 | — | |||||||||||
| — | 35,361 | 17,318,550 | 55,643 | |||||||||||
| — | — | — | — | |||||||||||
| 3,310 | 7,871 | — | 109,064 | |||||||||||
| — | — | 272,263 | — | |||||||||||
| — | — | 6,432 | — | |||||||||||
| — | — | 536,046 | — | |||||||||||
|
|
|
|
|
|
|
|
|
|||||||
| 34,256 | 43,232 | 18,187,243 | 164,707 | |||||||||||
|
|
|
|
|
|
|
|
|
|||||||
| $ | 4,370,107 | $ | 26,522,746 | $ | 1,611,555,306 | $ | 447,868,017 | |||||||
|
|
|
|
|
|
|
|
|
|||||||
| $ | 5,768,246 | $ | 103,795,485 | $ | 1,608,663,248 | $ | 449,824,137 | |||||||
| (1,398,139 | ) | (77,272,739 | ) | 2,892,058 | (1,956,120) | |||||||||
|
|
|
|
|
|
|
|
|
|||||||
| $ | 4,370,107 | $ | 26,522,746 | $ | 1,611,555,306 | $ | 447,868,017 | |||||||
|
|
|
|
|
|
|
|
|
|||||||
| 200,000 | 950,000 | 32,100,000 | 17,900,001 | |||||||||||
| $ | 21.85 | $ | 27.92 | $ | 50.20 | $ | 25.02 | |||||||
|
|
|
|
|
|
|
|
|
|||||||
| $ | 21.77 | $ | 27.86 | $ | 50.22 | $ | 25.02 | |||||||
|
|
|
|
|
|
|
|
|
|||||||
| $ | 1,673,879 | $ | 20,273,215 | $ | 1,593,933,993 | $ | 446,907,433 | |||||||
|
|
|
|
|
|
|
|
|
|||||||
| $ | 2,398,450 | $ | 4,589,731 | $ | — | $ | 131,672 | |||||||
|
|
|
|
|
|
|
|
|
|||||||
| $ | — | $ | — | $ | (1,276 | ) | $ | — | ||||||
|
|
|
|
|
|
|
|
|
|||||||
| $ | — | $ | — | $ | — | $ | — | |||||||
|
|
|
|
|
|
|
|
|
|||||||
|
|
53 |
|
For the year ended October 31, 2018
| Invesco Active U.S. Real Estate ETF (PSR) |
Invesco Balanced Multi-Asset Allocation ETF (PSMB) |
Invesco Conservative Multi-Asset Allocation ETF (PSMC) |
Invesco Growth Multi-Asset Allocation ETF (PSMG) |
Invesco Moderately Conservative Multi-Asset Allocation ETF (PSMM) |
||||||||||||||||
| Year Ended October 31, 2018 |
Year Ended October 31, 2018 |
Year Ended October 31, 2018 |
Year Ended October 31, 2018 |
Year Ended October 31, 2018 |
||||||||||||||||
| Investment Income: | ||||||||||||||||||||
| Unaffiliated dividend income |
$ | 779,112 | $ | — | $ | 1,931 | $ | — | $ | 989 | ||||||||||
| Affiliated dividend income |
279 | 44,129 | 37,470 | 40,602 | 36,467 | |||||||||||||||
| Unaffiliated interest income |
— | — | — | — | — | |||||||||||||||
| Securities lending income |
— | 3,636 | 4,915 | 4,610 | 2,934 | |||||||||||||||
| Foreign withholding tax |
— | — | — | — | — | |||||||||||||||
|
|
|
|
|
|
|
|
|
|
|
|||||||||||
| Total Income |
779,391 | 47,765 | 44,316 | 45,212 | 40,390 | |||||||||||||||
|
|
|
|
|
|
|
|
|
|
|
|||||||||||
| Expenses: | ||||||||||||||||||||
| Unitary management fees |
132,808 | 876 | 638 | 884 | 656 | |||||||||||||||
| Advisory fees |
— | — | — | — | — | |||||||||||||||
| Accounting & administration fees |
— | — | — | — | — | |||||||||||||||
| Professional fees |
— | — | — | — | — | |||||||||||||||
| Printing fees |
— | — | — | — | — | |||||||||||||||
| Custodian & transfer agent fees |
— | — | — | — | — | |||||||||||||||
| Trustees’ and officer’s fees |
— | — | — | — | — | |||||||||||||||
| Insurance |
— | — | — | — | — | |||||||||||||||
| Listing fee and expenses |
— | — | — | — | — | |||||||||||||||
| Intraday valuation fees |
— | — | — | — | — | |||||||||||||||
| Line of credit fee |
— | — | — | — | — | |||||||||||||||
| Recapture (Note 3) |
— | — | — | — | — | |||||||||||||||
| Other expenses |
— | — | — | — | — | |||||||||||||||
|
|
|
|
|
|
|
|
|
|
|
|||||||||||
| Total Expenses |
132,808 | 876 | 638 | 884 | 656 | |||||||||||||||
|
|
|
|
|
|
|
|
|
|
|
|||||||||||
| Less: Waivers |
(31 | ) | (1 | ) | (1 | ) | — | (1 | ) | |||||||||||
|
|
|
|
|
|
|
|
|
|
|
|||||||||||
| Net Expenses |
132,777 | 875 | 637 | 884 | 655 | |||||||||||||||
|
|
|
|
|
|
|
|
|
|
|
|||||||||||
| Net Investment Income |
646,614 | 46,890 | 43,679 | 44,328 | 39,735 | |||||||||||||||
|
|
|
|
|
|
|
|
|
|
|
|||||||||||
| Realized and Unrealized Gain (Loss): | ||||||||||||||||||||
| Net realized gain (loss) from: |
||||||||||||||||||||
| Unaffiliated investment securities |
(698,123 | ) | — | (1,433 | ) | — | (733 | ) | ||||||||||||
| Affiliated investment securities |
— | 6,601 | (1,477 | ) | 9,854 | 3,856 | ||||||||||||||
| In-kind redemptions |
406,878 | — | — | — | — | |||||||||||||||
| Foreign currencies |
— | — | — | — | — | |||||||||||||||
| Forward foreign currency contracts |
— | — | — | — | — | |||||||||||||||
| Futures contracts |
— | — | — | — | — | |||||||||||||||
|
|
|
|
|
|
|
|
|
|
|
|||||||||||
| Net realized gain (loss) |
(291,245 | ) | 6,601 | (2,910 | ) | 9,854 | 3,123 | |||||||||||||
|
|
|
|
|
|
|
|
|
|
|
|||||||||||
| Change in net unrealized appreciation (depreciation) on: |
||||||||||||||||||||
| Unaffiliated investment securities |
(400,767 | ) | — | (395 | ) | — | (203 | ) | ||||||||||||
| Affiliated investment securities |
— | (82,789 | ) | (35,016 | ) | (92,178 | ) | (36,684 | ) | |||||||||||
| Foreign currencies |
— | — | — | — | — | |||||||||||||||
| Forward foreign currency contracts |
— | — | — | — | — | |||||||||||||||
| Futures contracts |
— | — | — | — | — | |||||||||||||||
|
|
|
|
|
|
|
|
|
|
|
|||||||||||
| Net change in unrealized appreciation (depreciation) |
(400,767 | ) | (82,789 | ) | (35,411 | ) | (92,178 | ) | (36,887 | ) | ||||||||||
|
|
|
|
|
|
|
|
|
|
|
|||||||||||
| Net realized and unrealized gain (loss) |
(692,012 | ) | (76,188 | ) | (38,321 | ) | (82,324 | ) | (33,764 | ) | ||||||||||
|
|
|
|
|
|
|
|
|
|
|
|||||||||||
| Net increase (decrease) in net assets resulting from operations |
$ | (45,398 | ) | $ | (29,298 | ) | $ | 5,358 | $ | (37,996 | ) | $ | 5,971 | |||||||
|
|
|
|
|
|
|
|
|
|
|
|||||||||||
| (a) | For the period June 1, 2018 through October 31, 2018. |
See accompanying Notes to Financial Statements which are an integral part of the financial statements.
|
|
54 |
|
| Invesco Multi-Strategy Alternative ETF (LALT) |
Invesco S&P 500® Downside Hedged ETF (PHDG) |
Invesco Ultra Short Duration ETF (GSY) |
Invesco Variable Rate Investment Grade ETF (VRIG) |
|||||||||||||||
| Year Ended October 31, 2018 |
Year Ended October 31, 2018 |
Five Months Ended October 31, 2018(a) |
Year Ended May 31, 2018 |
Year Ended October 31, 2018 |
||||||||||||||
| $ | 36,300 | $ | 427,147 | $ | — | $ | 178,573 | $ | — | |||||||||
| 35,962 | 30,166 | — | — | 40,643 | ||||||||||||||
| — | — | 16,424,258 | 22,264,242 | 8,742,573 | ||||||||||||||
| — | — | — | 4,869 | — | ||||||||||||||
| (435 | ) | (40 | ) | — | (4,430 | ) | (3,169 | ) | ||||||||||
|
|
|
|
|
|
|
|
|
|
|
|||||||||
| 71,827 | 457,273 | 16,424,258 | 22,443,254 | 8,780,047 | ||||||||||||||
|
|
|
|
|
|
|
|
|
|
|
|||||||||
| 41,358 | 97,636 | — | — | 910,467 | ||||||||||||||
| — | — | 1,136,082 | 2,233,867 | — | ||||||||||||||
| — | — | 110,580 | 171,435 | — | ||||||||||||||
| — | — | 57,214 | 130,697 | — | ||||||||||||||
| — | — | 31,500 | 68,361 | — | ||||||||||||||
| — | — | 9,760 | 248,068 | — | ||||||||||||||
| — | — | 6,744 | 35,354 | — | ||||||||||||||
| — | — | 3,363 | 5,841 | — | ||||||||||||||
| — | — | 3,143 | 7,399 | — | ||||||||||||||
| — | — | 965 | 20,551 | — | ||||||||||||||
| — | — | — | 172,450 | — | ||||||||||||||
| — | — | 60,365 | — | — | ||||||||||||||
| — | — | 5,701 | 12,152 | — | ||||||||||||||
|
|
|
|
|
|
|
|
|
|
|
|||||||||
| 41,358 | 97,636 | 1,425,417 | 3,106,175 | 910,467 | ||||||||||||||
|
|
|
|
|
|
|
|
|
|
|
|||||||||
| (2,975 | ) | (3,055 | ) | — | (90,345 | ) | (4,545 | ) | ||||||||||
|
|
|
|
|
|
|
|
|
|
|
|||||||||
| 38,383 | 94,581 | 1,425,417 | 3,015,830 | 905,922 | ||||||||||||||
|
|
|
|
|
|
|
|
|
|
|
|||||||||
| 33,444 | 362,692 | 14,998,841 | 19,427,424 | 7,874,125 | ||||||||||||||
|
|
|
|
|
|
|
|
|
|
|
|||||||||
| 159,763 | 3,443,221 | 78,686 | 13,337,772 | (260,131 | ) | |||||||||||||
| — | — | — | — | — | ||||||||||||||
| — | 637,035 | — | — | — | ||||||||||||||
| (1,215 | ) | — | 11,327 | 101,139 | — | |||||||||||||
| (63,733 | ) | — | — | (10,618,686 | ) | — | ||||||||||||
| (100,912 | ) | 148,050 | — | — | — | |||||||||||||
|
|
|
|
|
|
|
|
|
|
|
|||||||||
| (6,097 | ) | 4,228,306 | 90,013 | 2,820,225 | (260,131 | ) | ||||||||||||
|
|
|
|
|
|
|
|
|
|
|
|||||||||
| (50,595 | ) | (3,757,825 | ) | (1,772,863 | ) | (2,801,889 | ) | (1,489,063 | ) | |||||||||
| — | (6,476 | ) | — | — | — | |||||||||||||
| — | — | (20 | ) | (132 | ) | — | ||||||||||||
| 15,516 | — | 27,583 | 2,902,946 | — | ||||||||||||||
| 190,999 | 329,460 | — | — | — | ||||||||||||||
|
|
|
|
|
|
|
|
|
|
|
|||||||||
| 155,920 | (3,434,841 | ) | (1,745,300 | ) | 100,925 | (1,489,063 | ) | |||||||||||
|
|
|
|
|
|
|
|
|
|
|
|||||||||
| 149,823 | 793,465 | (1,655,287 | ) | 2,921,150 | (1,749,194 | ) | ||||||||||||
|
|
|
|
|
|
|
|
|
|
|
|||||||||
| $ | 183,267 | $ | 1,156,157 | $ | 13,343,554 | $ | 22,348,574 | $ | 6,124,931 | |||||||||
|
|
|
|
|
|
|
|
|
|
|
|||||||||
|
|
55 |
|
Statements of Changes in Net Assets
For the years ended October 31, 2018 and 2017
| Invesco Active U.S. Real Estate ETF (PSR) |
Invesco Balanced Multi-Asset Allocation ETF (PSMB) |
|||||||||||||||
| October 31, 2018 | October 31, 2017 | October 31, 2018 | October 31, 2017(a) | |||||||||||||
| Operations: | ||||||||||||||||
| Net investment income |
$ | 646,614 | $ | 259,438 | $ | 46,890 | $ | 18,400 | ||||||||
| Net realized gain (loss) |
(291,245 | ) | 855,798 | 6,601 | 2,900 | |||||||||||
| Net change in unrealized appreciation (depreciation) |
(400,767 | ) | 1,004,149 | (82,789 | ) | 72,791 | ||||||||||
|
|
|
|
|
|
|
|
|
|||||||||
| Net increase (decrease) in net assets resulting from operations |
(45,398 | ) | 2,119,385 | (29,298 | ) | 94,091 | ||||||||||
|
|
|
|
|
|
|
|
|
|||||||||
| Distributions to Shareholders from: | ||||||||||||||||
| Distributable earnings |
(457,566 | ) | (590,499 | ) | (41,471 | ) | (12,311 | ) | ||||||||
|
|
|
|
|
|
|
|
|
|||||||||
| Shareholder Transactions: | ||||||||||||||||
| Proceeds from shares sold |
8,200,189 | — | 1,359,379 | 1,250,012 | ||||||||||||
| Value of shares repurchased |
(3,910,636 | ) | (3,958,241 | ) | — | — | ||||||||||
|
|
|
|
|
|
|
|
|
|||||||||
| Net increase (decrease) in net assets resulting from shares transactions |
4,289,553 | (3,958,241 | ) | 1,359,379 | 1,250,012 | |||||||||||
|
|
|
|
|
|
|
|
|
|||||||||
| Increase (Decrease) in Net Assets |
3,786,589 | (2,429,355 | ) | 1,288,610 | 1,331,792 | |||||||||||
|
|
|
|
|
|
|
|
|
|||||||||
| Net Assets: | ||||||||||||||||
| Beginning of period |
24,020,176 | 26,449,531 | 1,331,792 | — | ||||||||||||
|
|
|
|
|
|
|
|
|
|||||||||
| End of period |
$ | 27,806,765 | $ | 24,020,176 | $ | 2,620,402 | $ | 1,331,792 | ||||||||
|
|
|
|
|
|
|
|
|
|||||||||
| Changes in Shares Outstanding: | ||||||||||||||||
| Shares sold |
100,000 | — | 100,000 | 100,001 | ||||||||||||
| Shares repurchased |
(50,000 | ) | (50,000 | ) | — | — | ||||||||||
| Shares outstanding, beginning of period |
300,000 | 350,000 | 100,001 | — | ||||||||||||
|
|
|
|
|
|
|
|
|
|||||||||
| Shares outstanding, end of period |
350,000 | 300,000 | 200,001 | 100,001 | ||||||||||||
|
|
|
|
|
|
|
|
|
|||||||||
| (a) | For the period February 21, 2017 (commencement of investment operations) through October 31, 2017. |
See accompanying Notes to Financial Statements which are an integral part of the financial statements.
|
|
56 |
|
| Invesco Conservative Multi-Asset Allocation ETF (PSMC) |
Invesco Growth Multi-Asset Allocation ETF (PSMG) |
Invesco Moderately Conservative Multi-Asset Allocation ETF (PSMM) |
Invesco Multi-Strategy Alternative ETF (LALT) |
|||||||||||||||||||||||||||
| October 31, 2018 | October 31, 2017(a) | October 31, 2018 | October 31, 2017(a) | October 31, 2018 | October 31, 2017(a) | October 31, 2018 | October 31, 2017 | |||||||||||||||||||||||
| $ | 43,679 | $ | 20,616 | $ | 44,328 | $ | 16,911 | $ | 39,735 | $ | 19,660 | $ | 33,444 | $ | 21,224 | |||||||||||||||
| (2,910 | ) | 1,755 | 9,854 | 2,904 | 3,123 | 2,501 | (6,097 | ) | (354,852 | ) | ||||||||||||||||||||
| (35,411 | ) | 29,656 | (92,178 | ) | 96,405 | (36,887 | ) | 52,257 | 155,920 | (88,998 | ) | |||||||||||||||||||
|
|
|
|
|
|
|
|
|
|
|
|
|
|
|
|
|
|||||||||||||||
| 5,358 | 52,027 | (37,996 | ) | 116,220 | 5,971 | 74,418 | 183,267 | (422,626 | ) | |||||||||||||||||||||
|
|
|
|
|
|
|
|
|
|
|
|
|
|
|
|
|
|||||||||||||||
| (43,324 | ) | (15,039 | ) | (37,124 | ) | (10,708 | ) | (40,004 | ) | (14,014 | ) | (19,198 | ) | (103,497 | ) | |||||||||||||||
|
|
|
|
|
|
|
|
|
|
|
|
|
|
|
|
|
|||||||||||||||
| — | 1,250,012 | 1,410,361 | 1,250,013 | — | 1,250,013 | — | — | |||||||||||||||||||||||
| — | — | — | — | — | — | — | (2,190,346 | ) | ||||||||||||||||||||||
|
|
|
|
|
|
|
|
|
|
|
|
|
|
|
|
|
|||||||||||||||
| — | 1,250,012 | 1,410,361 | 1,250,013 | — | 1,250,013 | — | (2,190,346 | ) | ||||||||||||||||||||||
|
|
|
|
|
|
|
|
|
|
|
|
|
|
|
|
|
|||||||||||||||
| (37,966 | ) | 1,287,000 | 1,335,241 | 1,355,525 | (34,033 | ) | 1,310,417 | 164,069 | (2,716,469 | ) | ||||||||||||||||||||
|
|
|
|
|
|
|
|
|
|
|
|
|
|
|
|
|
|||||||||||||||
| 1,287,000 | — | 1,355,525 | — | 1,310,417 | — | 4,206,038 | 6,922,507 | |||||||||||||||||||||||
|
|
|
|
|
|
|
|
|
|
|
|
|
|
|
|
|
|||||||||||||||
| $ | 1,249,034 | $ | 1,287,000 | $ | 2,690,766 | $ | 1,355,525 | $ | 1,276,384 | $ | 1,310,417 | $ | 4,370,107 | $ | 4,206,038 | |||||||||||||||
|
|
|
|
|
|
|
|
|
|
|
|
|
|
|
|
|
|||||||||||||||
| — | 100,001 | 100,000 | 100,001 | — | 100,001 | — | — | |||||||||||||||||||||||
| — | — | — | — | — | — | — | (100,000 | ) | ||||||||||||||||||||||
| 100,001 | — | 100,001 | — | 100,001 | — | 200,000 | 300,000 | |||||||||||||||||||||||
|
|
|
|
|
|
|
|
|
|
|
|
|
|
|
|
|
|||||||||||||||
| 100,001 | 100,001 | 200,001 | 100,001 | 100,001 | 100,001 | 200,000 | 200,000 | |||||||||||||||||||||||
|
|
|
|
|
|
|
|
|
|
|
|
|
|
|
|
|
|||||||||||||||
|
|
57 |
|
Statements of Changes in Net Assets (continued)
For the years ended October 31, 2018 and 2017
| Invesco S&P 500® Downside Hedged ETF (PHDG) |
Invesco Ultra Short Duration ETF (GSY) | |||||||||||||||||||
| October 31, 2018 | October 31, 2017 | Five Months Ended October 31, 2018(a) |
Year ended May 31, 2018 |
Year ended May 31, 2017 |
||||||||||||||||
| Operations: | ||||||||||||||||||||
| Net investment income |
$ | 362,692 | $ | 1,100,004 | $ | 14,998,841 | $ | 19,427,424 | $ | 12,910,998 | ||||||||||
| Net realized gain |
4,228,306 | 7,763,740 | 90,013 | 2,820,225 | 2,097,345 | |||||||||||||||
| Net change in unrealized appreciation (depreciation) |
(3,434,841 | ) | 1,736,826 | (1,745,300 | ) | 100,925 | 2,395,079 | |||||||||||||
|
|
|
|
|
|
|
|
|
|
|
|||||||||||
| Net increase in net assets resulting from operations |
1,156,157 | 10,600,570 | 13,343,554 | 22,348,574 | 17,403,422 | |||||||||||||||
|
|
|
|
|
|
|
|
|
|
|
|||||||||||
| Distributions to Shareholders from: | ||||||||||||||||||||
| Distributable earnings |
(438,757 | ) | (1,490,388 | ) | (15,247,637 | ) | (22,054,804 | ) | (12,249,300 | ) | ||||||||||
| Return of capital |
— | — | — | — | — | |||||||||||||||
|
|
|
|
|
|
|
|
|
|
|
|||||||||||
| Total distributions to shareholders |
(438,757 | ) | (1,490,388 | ) | (15,247,637 | ) | (22,054,804 | ) | (12,249,300 | ) | ||||||||||
|
|
|
|
|
|
|
|
|
|
|
|||||||||||
| Shareholder Transactions: | ||||||||||||||||||||
| Proceeds from shares sold |
5,899,570 | — | 798,720,129 | 391,813,223 | 481,151,350 | |||||||||||||||
| Value of shares repurchased |
(4,100,215 | ) | (91,677,862 | ) | (351,725,452 | ) | (301,733,842 | ) | (125,322,426 | ) | ||||||||||
|
|
|
|
|
|
|
|
|
|
|
|||||||||||
| Net increase (decrease) in net assets resulting from shares transactions |
1,799,355 | (91,677,862 | ) | 446,994,677 | 90,079,381 | 355,828,924 | ||||||||||||||
|
|
|
|
|
|
|
|
|
|
|
|||||||||||
| Increase (Decrease) in Net Assets |
2,516,755 | (82,567,680 | ) | 445,090,594 | 90,373,151 | 360,983,046 | ||||||||||||||
|
|
|
|
|
|
|
|
|
|
|
|||||||||||
| Net Assets: | ||||||||||||||||||||
| Beginning of period |
24,005,991 | 106,573,671 | 1,166,464,712 | 1,076,091,561 | 715,108,515 | |||||||||||||||
|
|
|
|
|
|
|
|
|
|
|
|||||||||||
| End of period |
$ | 26,522,746 | $ | 24,005,991 | $ | 1,611,555,306 | $ | 1,166,464,712 | $ | 1,076,091,561 | ||||||||||
|
|
|
|
|
|
|
|
|
|
|
|||||||||||
| Changes in Shares Outstanding: | ||||||||||||||||||||
| Shares sold |
200,000 | — | 15,900,000 | 7,800,000 | 9,600,000 | |||||||||||||||
| Shares repurchased |
(150,000 | ) | (3,650,000 | ) | (7,000,000 | ) | (6,000,000 | ) | (2,500,000 | ) | ||||||||||
| Shares outstanding, beginning of period |
900,000 | 4,550,000 | 23,200,000 | 21,400,000 | 14,300,000 | |||||||||||||||
|
|
|
|
|
|
|
|
|
|
|
|||||||||||
| Shares outstanding, end of period |
950,000 | 900,000 | 32,100,000 | 23,200,000 | 21,400,000 | |||||||||||||||
|
|
|
|
|
|
|
|
|
|
|
|||||||||||
| (a) | For the period June 1, 2018 through October 31, 2018. |
See accompanying Notes to Financial Statements which are an integral part of the financial statements.
|
|
58 |
|
| Invesco Variable Rate Investment Grade ETF (VRIG) |
||||||
| October 31, 2018 | October 31, 2017 | |||||
| $ | 7,874,125 | $ | 1,372,483 | |||
| (260,131 | ) | 53,310 | ||||
| (1,489,063 | ) | |
623,287 |
|||
|
|
|
|
|
|||
| 6,124,931 | |
2,049,080 |
||||
|
|
|
|
|
|||
| (8,510,280 | ) | (1,574,248 | ) | |||
| — | (16,962 | ) | ||||
|
|
|
|
|
|||
| (8,510,280 | ) | (1,591,210 | ) | |||
|
|
|
|
|
|||
| 316,705,784 | 83,133,772 | |||||
| — | — | |||||
|
|
|
|
|
|||
| 316,705,784 | |
83,133,772 |
||||
|
|
|
|
|
|||
| 314,320,435 | 83,591,642 | |||||
|
|
|
|
|
|||
| 133,547,582 | 49,955,940 | |||||
|
|
|
|
|
|||
| $ | 447,868,017 | $ | 133,547,582 | |||
|
|
|
|
|
|||
| 12,600,000 | 3,300,000 | |||||
| — | — | |||||
| 5,300,001 | 2,000,001 | |||||
|
|
|
|
|
|||
| 17,900,001 | 5,300,001 | |||||
|
|
|
|
|
|||
|
|
59 |
|
Invesco Active U.S. Real Estate ETF (PSR)
| Year Ended October 31, | ||||||||||||||||||||
| 2018 | 2017 | 2016 | 2015 | 2014 | ||||||||||||||||
| Per Share Operating Performance: | ||||||||||||||||||||
| Net asset value at beginning of year |
$ | 80.07 | $ | 75.57 | $ | 73.43 | $ | 70.66 | $ | 60.33 | ||||||||||
| Net investment income(a) |
2.05 | 0.75 | 1.73 | 1.51 | 0.92 | |||||||||||||||
| Net realized and unrealized gain (loss) on investments |
(1.24 | ) | 5.44 | 3.04 | 2.51 | 10.33 | ||||||||||||||
| Total from investment operations |
0.81 | 6.19 | 4.77 | 4.02 | 11.25 | |||||||||||||||
| Distributions to shareholders from: |
||||||||||||||||||||
| Net investment income |
(1.43 | ) | (1.69 | ) | (1.80 | ) | (1.25 | ) | (0.92 | ) | ||||||||||
| Net realized gains |
— | — | (0.83 | ) | — | — | ||||||||||||||
| Total distributions |
(1.43 | ) | (1.69 | ) | (2.63 | ) | (1.25 | ) | (0.92 | ) | ||||||||||
| Net asset value at end of year |
$ | 79.45 | $ | 80.07 | $ | 75.57 | $ | 73.43 | $ | 70.66 | ||||||||||
| Market price at end of year(b) |
$ | 79.30 | $ | 80.04 | $ | 75.55 | $ | 73.49 | $ | 70.63 | ||||||||||
| Net Asset Value Total Return(c) | 1.02 | % | 8.37 | % | 6.65 | % | 5.72 | % | 18.95 | % | ||||||||||
| Market Price Total Return(c) | 0.87 | % | 8.36 | % | 6.53 | % | 5.85 | % | 18.86 | % | ||||||||||
| Ratios/Supplemental Data: | ||||||||||||||||||||
| Net assets at end of year (000’s omitted) |
$ | 27,807 | $ | 24,020 | $ | 26,450 | $ | 55,069 | $ | 42,396 | ||||||||||
| Ratio to average net assets of: |
||||||||||||||||||||
| Expenses |
0.53 | % | 0.80 | % | 0.80 | % | 0.80 | % | 0.80 | % | ||||||||||
| Net investment income |
2.58 | % | 0.97 | % | 2.34 | % | 2.09 | % | 1.46 | % | ||||||||||
| Portfolio turnover rate(d) |
92 | % | 134 | % | 192 | % | 199 | % | 169 | % | ||||||||||
| (a) | Based on average shares outstanding. |
| (b) | The mean between the last bid and ask prices. |
| (c) | Net asset value total return is calculated assuming an initial investment made at the net asset value at the beginning of the period, reinvestment of all dividends and distributions at net asset value during the period, and the redemption on the last day of the period. Net asset value total return includes adjustments in accordance with accounting principles generally accepted in the United States of America and as such, the net asset value for financial reporting purposes and the returns based upon those net asset values may differ from the net asset value and returns for shareholder transactions. Market price total return is calculated assuming an initial investment made at the market price at the beginning of the period, reinvestment of all dividends and distributions at market price during the period, and sale at the market price on the last day of the period. Total investment returns calculated for a period of less than one year are not annualized. |
| (d) | Portfolio turnover rate is not annualized for periods less than one year, if applicable, and does not include securities received or delivered from processing creations or redemptions. |
Invesco Balanced Multi-Asset Allocation ETF (PSMB)
| Year Ended October 31, 2018 |
For the Period February 21, 2017(a) Through October 31, 2017 |
|||||||
| Per Share Operating Performance: | ||||||||
| Net asset value at beginning of period |
$ | 13.32 | $ | 12.50 | ||||
| Net investment income(b) |
0.36 | 0.18 | ||||||
| Net realized and unrealized gain on investments |
(0.23 | ) | 0.76 | |||||
| Total from investment operations |
0.13 | 0.94 | ||||||
| Distributions to shareholders from: |
||||||||
| Net investment income |
(0.32 | ) | (0.12 | ) | ||||
| Net realized gains |
(0.03 | ) | — | |||||
| Total distributions |
(0.35 | ) | (0.12 | ) | ||||
| Net asset value at end of period |
$ | 13.10 | $ | 13.32 | ||||
| Market price at end of period(c) |
$ | 13.14 | $ | 13.33 | ||||
| Net Asset Value Total Return(d) | 0.89 | % | 7.57 | %(e) | ||||
| Market Price Total Return(d) | 1.12 | % | 7.65 | %(e) | ||||
| Ratios/Supplemental Data: | ||||||||
| Net assets at end of period (000’s omitted) |
$ | 2,620 | $ | 1,332 | ||||
| Ratio to average net assets of: |
||||||||
| Expenses(f) |
0.05 | % | 0.05 | %(g) | ||||
| Net investment income |
2.68 | % | 2.08 | %(g) | ||||
| Portfolio turnover rate(h) |
26 | % | 6 | % | ||||
| (a) | Commencement of investment operations. |
| (b) | Based on average shares outstanding. |
| (c) | The mean between the last bid and ask prices. |
| (d) | Net asset value total return is calculated assuming an initial investment made at the net asset value at the beginning of the period, reinvestment of all dividends and distributions at net asset value during the period, and the redemption on the last day of the period. Net asset value total return includes adjustments in accordance with accounting principles generally accepted in the United States of America and as such, the net asset value for financial reporting purposes and the returns based upon those net asset values may differ from the net asset value and returns for shareholder transactions. Market price total return is calculated assuming an initial investment made at the market price at the beginning of the period, reinvestment of all dividends and distributions at market price during the period, and sale at the market price on the last day of the period. Total investment returns calculated for a period of less than one year are not annualized. |
| (e) | The net asset value total return from Fund Inception (February 23, 2017, the first day of trading on the Exchange) to October 31, 2017 was 7.74%. The market price total return from Fund Inception to October 31, 2017 was 7.65%. |
| (f) | In addition to the fees and expenses which the Fund bears directly, the Fund indirectly bears a pro rata share of the fees and expenses of the investment companies in which the Fund invests. Estimated investment companies’ expenses are not expenses that are incurred directly by the Fund. They are expenses that are incurred directly by the investment companies and are deducted from the value of the investment companies the Fund invests in. The effect of the estimated investment companies’ expenses that the Fund bears indirectly is included in the Fund’s total return. |
| (g) | Annualized. |
| (h) | Portfolio turnover rate is not annualized for periods less than one year, if applicable, and does not include securities received or delivered from processing creations or redemptions. |
See accompanying Notes to Financial Statements which are an integral part of the financial statements.
|
|
60 |
|
Financial Highlights (continued)
Invesco Conservative Multi-Asset Allocation ETF (PSMC)
| Year Ended October 31, 2018 |
For the Period February 21, 2017(a) Through October 31, 2017 |
|||||||
| Per Share Operating Performance: | ||||||||
| Net asset value at beginning of period |
$ | 12.87 | $ | 12.50 | ||||
| Net investment income(b) |
0.44 | 0.21 | ||||||
| Net realized and unrealized gain (loss) on investments |
(0.38 | ) | 0.31 | |||||
| Total from investment operations |
0.06 | 0.52 | ||||||
| Distributions to shareholders from: |
||||||||
| Net investment income |
(0.42 | ) | (0.15 | ) | ||||
| Net realized gains |
(0.02 | ) | — | |||||
| Total distributions |
(0.44 | ) | (0.15 | ) | ||||
| Net asset value at end of period |
$ | 12.49 | $ | 12.87 | ||||
| Market price at end of period(c) |
$ | 12.49 | $ | 12.88 | ||||
| Net Asset Value Total Return(d) | 0.39 | % | 4.18 | %(e) | ||||
| Market Price Total Return(d) | 0.31 | % | 4.26 | %(e) | ||||
| Ratios/Supplemental Data: | ||||||||
| Net assets at end of period (000’s omitted) |
$ | 1,249 | $ | 1,287 | ||||
| Ratio to average net assets of: |
||||||||
| Expenses(f) |
0.05 | % | 0.05 | %(g) | ||||
| Net investment income |
3.42 | % | 2.36 | %(g) | ||||
| Portfolio turnover rate(h) |
38 | % | 4 | % | ||||
| (a) | Commencement of investment operations. |
| (b) | Based on average shares outstanding. |
| (c) | The mean between the last bid and ask prices. |
| (d) | Net asset value total return is calculated assuming an initial investment made at the net asset value at the beginning of the period, reinvestment of all dividends and distributions at net asset value during the period, and the redemption on the last day of the period. Net asset value total return includes adjustments in accordance with accounting principles generally accepted in the United States of America and as such, the net asset value for financial reporting purposes and the returns based upon those net asset values may differ from the net asset value and returns for shareholder transactions. Market price total return is calculated assuming an initial investment made at the market price at the beginning of the period, reinvestment of all dividends and distributions at market price during the period, and sale at the market price on the last day of the period. Total investment returns calculated for a period of less than one year are not annualized. |
| (e) | The net asset value total return from Fund Inception (February 23, 2017, the first day of trading on the Exchange) to October 31, 2017 was 4.26%. The market price total return from Fund Inception to October 31, 2017 was 4.17%. |
| (f) | In addition to the fees and expenses which the Fund bears directly, the Fund indirectly bears a pro rata share of the fees and expenses of the investment companies in which the Fund invests. Estimated investment companies’ expenses are not expenses that are incurred directly by the Fund. They are expenses that are incurred directly by the investment companies and are deducted from the value of the investment companies the Fund invests in. The effect of the estimated investment companies’ expenses that the Fund bears indirectly is included in the Fund’s total return. |
| (g) | Annualized. |
| (h) | Portfolio turnover rate is not annualized for periods less than one year, if applicable, and does not include securities received or delivered from processing creations or redemptions. |
See accompanying Notes to Financial Statements which are an integral part of the financial statements.
|
|
61 |
|
Financial Highlights (continued)
Invesco Growth Multi-Asset Allocation ETF (PSMG)
| Year Ended October 31, 2018 |
For the Period February 21, 2017(a) Through October 31, 2017 |
|||||||
| Per Share Operating Performance: | ||||||||
| Net asset value at beginning of period |
$ | 13.56 | $ | 12.50 | ||||
| Net investment income(b) |
0.35 | 0.17 | ||||||
| Net realized and unrealized gain on investments |
(0.15 | ) | 1.00 | |||||
| Total from investment operations |
0.20 | 1.17 | ||||||
| Distributions to shareholders from: |
||||||||
| Net investment income |
(0.28 | ) | (0.11 | ) | ||||
| Net realized gains |
(0.03 | ) | — | |||||
| Total distributions |
(0.31 | ) | (0.11 | ) | ||||
| Net asset value at end of period |
$ | 13.45 | $ | 13.56 | ||||
| Market price at end of period(c) |
$ | 13.50 | $ | 13.59 | ||||
| Net Asset Value Total Return(d) | 1.43 | % | 9.36 | %(e) | ||||
| Market Price Total Return(d) | 1.58 | % | 9.60 | %(e) | ||||
| Ratios/Supplemental Data: | ||||||||
| Net assets at end of period (000’s omitted) |
$ | 2,691 | $ | 1,356 | ||||
| Ratio to average net assets of: |
||||||||
| Expenses(f) |
0.05 | % | 0.05 | %(g) | ||||
| Net investment income |
2.51 | % | 1.90 | %(g) | ||||
| Portfolio turnover rate(h) |
21 | % | 6 | % | ||||
| (a) | Commencement of investment operations. |
| (b) | Based on average shares outstanding. |
| (c) | The mean between the last bid and ask prices. |
| (d) | Net asset value total return is calculated assuming an initial investment made at the net asset value at the beginning of the period, reinvestment of all dividends and distributions at net asset value during the period, and the redemption on the last day of the period. Net asset value total return includes adjustments in accordance with accounting principles generally accepted in the United States of America and as such, the net asset value for financial reporting purposes and the returns based upon those net asset values may differ from the net asset value and returns for shareholder transactions. Market price total return is calculated assuming an initial investment made at the market price at the beginning of the period, reinvestment of all dividends and distributions at market price during the period, and sale at the market price on the last day of the period. Total investment returns calculated for a period of less than one year are not annualized. |
| (e) | The net asset value total return from Fund Inception (February 23, 2017, the first day of trading on the Exchange) to October 31, 2017 was 9.54%. The market price total return from Fund Inception to October 31, 2017 was 9.69%. |
| (f) | In addition to the fees and expenses which the Fund bears directly, the Fund indirectly bears a pro rata share of the fees and expenses of the investment companies in which the Fund invests. Estimated investment companies’ expenses are not expenses that are incurred directly by the Fund. They are expenses that are incurred directly by the investment companies and are deducted from the value of the investment companies the Fund invests in. The effect of the estimated investment companies’ expenses that the Fund bears indirectly is included in the Fund’s total return. |
| (g) | Annualized. |
| (h) | Portfolio turnover rate is not annualized for periods less than one year, if applicable, and does not include securities received or delivered from processing creations or redemptions. |
See accompanying Notes to Financial Statements which are an integral part of the financial statements.
|
|
62 |
|
Financial Highlights (continued)
Invesco Moderately Conservative Multi-Asset Allocation ETF (PSMM)
| Year Ended October 31, 2018 |
For the Period February 21, 2017(a) Through October 31, 2017 |
|||||||
| Per Share Operating Performance: | ||||||||
| Net asset value at beginning of period |
$ | 13.10 | $ | 12.50 | ||||
| Net investment income(b) |
0.40 | 0.20 | ||||||
| Net realized and unrealized gain (loss) on investments |
(0.34 | ) | 0.54 | |||||
| Total from investment operations |
0.06 | 0.74 | ||||||
| Distributions to shareholders from: |
||||||||
| Net investment income |
(0.37 | ) | (0.14 | ) | ||||
| Net realized gains |
(0.03 | ) | — | |||||
| Total distributions |
(0.40 | ) | (0.14 | ) | ||||
| Net asset value at end of period |
$ | 12.76 | $ | 13.10 | ||||
| Market price at end of period(c) |
$ | 12.78 | $ | 13.12 | ||||
| Net Asset Value Total Return(d) | 0.40 | % | 5.94 | %(e) | ||||
| Market Price Total Return(d) | 0.41 | % | 6.10 | %(e) | ||||
| Ratios/Supplemental Data: | ||||||||
| Net assets at end of period (000’s omitted) |
$ | 1,276 | $ | 1,310 | ||||
| Ratio to average net assets of: |
||||||||
| Expenses(f) |
0.05 | % | 0.05 | %(g) | ||||
| Net investment income |
3.03 | % | 2.23 | %(g) | ||||
| Portfolio turnover rate(h) |
32 | % | 5 | % | ||||
| (a) | Commencement of investment operations. |
| (b) | Based on average shares outstanding. |
| (c) | The mean between the last bid and ask prices. |
| (d) | Net asset value total return is calculated assuming an initial investment made at the net asset value at the beginning of the period, reinvestment of all dividends and distributions at net asset value during the period, and the redemption on the last day of the period. Net asset value total return includes adjustments in accordance with accounting principles generally accepted in the United States of America and as such, the net asset value for financial reporting purposes and the returns based upon those net asset values may differ from the net asset value and returns for shareholder transactions. Market price total return is calculated assuming an initial investment made at the market price at the beginning of the period, reinvestment of all dividends and distributions at market price during the period, and sale at the market price on the last day of the period. Total investment returns calculated for a period of less than one year are not annualized. |
| (e) | The net asset value total return from Fund Inception (February 23, 2017, the first day of trading on the Exchange) to October 31, 2017 was 6.03%. The market price total return from Fund Inception to October 31, 2017 was 6.02%. |
| (f) | In addition to the fees and expenses which the Fund bears directly, the Fund indirectly bears a pro rata share of the fees and expenses of the investment companies in which the Fund invests. Estimated investment companies’ expenses are not expenses that are incurred directly by the Fund. They are expenses that are incurred directly by the investment companies and are deducted from the value of the investment companies the Fund invests in. The effect of the estimated investment companies’ expenses that the Fund bears indirectly is included in the Fund’s total return. |
| (g) | Annualized. |
| (h) | Portfolio turnover rate is not annualized for periods less than one year, if applicable, and does not include securities received or delivered from processing creations or redemptions. |
See accompanying Notes to Financial Statements which are an integral part of the financial statements.
|
|
63 |
|
Financial Highlights (continued)
Invesco Multi-Strategy Alternative ETF (LALT)
| Year Ended October 31, | For the Period May 27, 2014(a) Through October 31, 2014 |
|||||||||||||||||||
| 2018 | 2017 | 2016 | 2015 | |||||||||||||||||
| Per Share Operating Performance: | ||||||||||||||||||||
| Net asset value at beginning of period |
$ | 21.03 | $ | 23.08 | $ | 22.59 | $ | 24.60 | $ | 25.00 | ||||||||||
| Net investment income (loss)(b) |
0.17 | 0.08 | 0.03 | (0.04 | ) | 0.01 | ||||||||||||||
| Net realized and unrealized gain (loss) on investments |
0.75 | (1.79 | ) | 0.46 | (1.97 | ) | (0.41 | ) | ||||||||||||
| Total from investment operations |
0.92 | (1.71 | ) | 0.49 | (2.01 | ) | (0.40 | ) | ||||||||||||
| Distributions to shareholders from: |
||||||||||||||||||||
| Net investment income |
(0.10 | ) | (0.34 | ) | — | — | — | |||||||||||||
| Net asset value at end of period |
$ | 21.85 | $ | 21.03 | $ | 23.08 | $ | 22.59 | $ | 24.60 | ||||||||||
| Market price at end of period(c) |
$ | 21.77 | $ | 21.05 | $ | 23.05 | $ | 22.60 | $ | 24.55 | ||||||||||
| Net Asset Value Total Return(d) | 4.37 | % | (7.50 | )% | 2.17 | % | (8.17 | )% | (1.60 | )%(e) | ||||||||||
| Market Price Total Return(d) | 3.88 | % | (7.29 | )% | 1.99 | % | (7.94 | )% | (1.80 | )%(e) | ||||||||||
| Ratios/Supplemental Data: | ||||||||||||||||||||
| Net assets at end of period (000’s omitted) |
$ | 4,370 | $ | 4,206 | $ | 6,923 | $ | 15,812 | $ | 22,140 | ||||||||||
| Ratio to average net assets of: |
||||||||||||||||||||
| Expenses, after Waivers(f) |
0.88 | % | 0.87 | % | 0.89 | % | 0.93 | % | 0.90 | %(g) | ||||||||||
| Expenses, prior to Waivers(f) |
0.95 | % | 0.95 | % | 0.95 | % | 0.95 | % | 0.95 | %(g) | ||||||||||
| Net investment income (loss), after Waivers |
0.77 | % | 0.37 | % | 0.14 | % | (0.15 | )% | 0.08 | %(g) | ||||||||||
| Portfolio turnover rate(h) |
151 | % | 169 | % | 163 | % | 154 | % | 63 | % | ||||||||||
| (a) | Commencement of investment operations. |
| (b) | Based on average shares outstanding. |
| (c) | The mean between the last bid and ask prices. |
| (d) | Net asset value total return is calculated assuming an initial investment made at the net asset value at the beginning of the period, reinvestment of all dividends and distributions at net asset value during the period, and the redemption on the last day of the period. Net asset value total return includes adjustments in accordance with accounting principles generally accepted in the United States of America and as such, the net asset value for financial reporting purposes and the returns based upon those net asset values may differ from the net asset value and returns for shareholder transactions. Market price total return is calculated assuming an initial investment made at the market price at the beginning of the period, reinvestment of all dividends and distributions at market price during the period, and sale at the market price on the last day of the period. Total investment returns calculated for a period of less than one year are not annualized. |
| (e) | The net asset value total return from Fund Inception (May 29, 2014, the first day of trading on the exchange) to October 31, 2014 was (1.64)%. The market price total return from Fund Inception to October 31, 2014 was (1.92)%. |
| (f) | In addition to the fees and expenses which the Fund bears directly, the Fund indirectly bears a pro rata share of the fees and expenses of the investment companies in which the Fund invests. Estimated investment companies’ expenses are not expenses that are incurred directly by the Fund. They are expenses that are incurred directly by the investment companies and are deducted from the value of the investment companies the Fund invests in. The effect of the estimated investment companies’ expenses that the Fund bears indirectly is included in the Fund’s total return. |
| (g) | Annualized. |
| (h) | Portfolio turnover rate is not annualized for periods less than one year, if applicable, and does not include securities received or delivered from processing creations or redemptions. |
See accompanying Notes to Financial Statements which are an integral part of the financial statements.
|
|
64 |
|
Financial Highlights (continued)
Invesco S&P 500® Downside Hedged ETF (PHDG)
| Year Ended October 31, | ||||||||||||||||||||
| 2018 | 2017 | 2016 | 2015 | 2014 | ||||||||||||||||
| Per Share Operating Performance: | ||||||||||||||||||||
| Net asset value at beginning of year |
$ | 26.67 | $ | 23.42 | $ | 24.89 | $ | 29.50 | $ | 27.15 | ||||||||||
| Net investment income(a) |
0.41 | 0.40 | 0.37 | 0.33 | 0.33 | |||||||||||||||
| Net realized and unrealized gain (loss) on investments |
1.36 | 3.37 | (1.37 | ) | (3.39 | ) | 2.49 | |||||||||||||
| Total from investment operations |
1.77 | 3.77 | (1.00 | ) | (3.06 | ) | 2.82 | |||||||||||||
| Distributions to shareholders from: |
||||||||||||||||||||
| Net investment income |
(0.52 | ) | (0.52 | ) | (0.47 | ) | (0.32 | ) | (0.47 | ) | ||||||||||
| Net realized gains |
— | — | — | (1.23 | ) | — | ||||||||||||||
| Total distributions |
(0.52 | ) | (0.52 | ) | (0.47 | ) | (1.55 | ) | (0.47 | ) | ||||||||||
| Net asset value at end of year |
$ | 27.92 | $ | 26.67 | $ | 23.42 | $ | 24.89 | $ | 29.50 | ||||||||||
| Market price at end of year(b) |
$ | 27.86 | $ | 26.68 | $ | 23.45 | $ | 24.92 | $ | 29.49 | ||||||||||
| Net Asset Value Total Return(c) | 6.61 | % | 16.27 | % | (4.10 | )% | (10.83 | )% | 10.50 | % | ||||||||||
| Market Price Total Return(c) | 6.33 | % | 16.16 | % | (4.09 | )% | (10.69 | )% | 10.14 | % | ||||||||||
| Ratios/Supplemental Data: | ||||||||||||||||||||
| Net assets at end of year (000’s omitted) |
$ | 26,523 | $ | 24,006 | $ | 106,574 | $ | 416,981 | $ | 529,465 | ||||||||||
| Ratio to average net assets of: |
||||||||||||||||||||
| Expenses, after Waivers(d) |
0.38 | % | 0.39 | % | 0.37 | % | 0.35 | % | 0.36 | % | ||||||||||
| Expenses, prior to Waivers(d) |
0.39 | % | 0.39 | % | 0.39 | % | 0.39 | % | 0.39 | % | ||||||||||
| Net investment income, after Waivers |
1.45 | % | 1.59 | % | 1.52 | % | 1.23 | % | 1.16 | % | ||||||||||
| Portfolio turnover rate(e) |
542 | % | 54 | % | 373 | % | 478 | % | 58 | % | ||||||||||
| (a) | Based on average shares outstanding. |
| (b) | The mean between the last bid and ask prices. |
| (c) | Net asset value total return is calculated assuming an initial investment made at the net asset value at the beginning of the period, reinvestment of all dividends and distributions at net asset value during the period, and the redemption on the last day of the period. Net asset value total return includes adjustments in accordance with accounting principles generally accepted in the United States of America and as such, the net asset value for financial reporting purposes and the returns based upon those net asset values may differ from the net asset value and returns for shareholder transactions. Market price total return is calculated assuming an initial investment made at the market price at the beginning of the period, reinvestment of all dividends and distributions at market price during the period, and sale at the market price on the last day of the period. Total investment returns calculated for a period of less than one year are not annualized. |
| (d) | In addition to the fees and expenses which the Fund bears directly, the Fund indirectly bears a pro rata share of the fees and expenses of the investment companies in which the Fund invests. Estimated investment companies’ expenses are not expenses that are incurred directly by the Fund. They are expenses that are incurred directly by the investment companies and are deducted from the value of the investment companies the Fund invests in. The effect of the estimated investment companies’ expenses that the Fund bears indirectly is included in the Fund’s total return. |
| (e) | Portfolio turnover rate is not annualized for periods less than one year, if applicable, and does not include securities received or delivered from processing creations or redemptions. |
See accompanying Notes to Financial Statements which are an integral part of the financial statements.
|
|
65 |
|
Financial Highlights (continued)
Invesco Ultra Short Duration ETF (GSY)
| Five Months Ended October 31, 2018 |
Year Ended May 31, | |||||||||||||||||||||||
| 2018 | 2017 | 2016 | 2015 | 2014 | ||||||||||||||||||||
| Per Share Operating Performance: | ||||||||||||||||||||||||
| Net asset value at beginning of period |
$ | 50.28 | $ | 50.28 | $ | 50.01 | $ | 50.10 | $ | 50.30 | $ | 50.21 | ||||||||||||
| Net investment income(a) |
0.55 | 0.87 | 0.70 | 0.60 | 0.63 | 0.54 | ||||||||||||||||||
| Net realized and unrealized gain (loss) on investments |
(0.06 | ) | 0.14 | 0.24 | (0.11 | ) | (0.12 | ) | 0.06 | |||||||||||||||
| Total from investment operations |
0.49 | 1.01 | 0.94 | 0.49 | 0.51 | 0.60 | ||||||||||||||||||
| Distributions to shareholders from: |
||||||||||||||||||||||||
| Net investment income |
(0.57 | ) | (1.01 | ) | (0.67 | ) | (0.58 | ) | (0.71 | ) | (0.49 | ) | ||||||||||||
| Capital gains |
— | — | — | — | — | (0.02 | ) | |||||||||||||||||
| Total distributions to shareholders |
(0.57 | ) | (1.01 | ) | (0.67 | ) | (0.58 | ) | (0.71 | ) | (0.51 | ) | ||||||||||||
| Net asset value at end of period |
$ | 50.20 | $ | 50.28 | $ | 50.28 | $ | 50.01 | $ | 50.10 | $ | 50.30 | ||||||||||||
| Market price at end of period |
$ | 50.22 | (b) | $ | 50.29 | (b) | $ | 50.29 | $ | 50.03 | $ | 50.11 | $ | 50.27 | ||||||||||
| Net Asset Value Total Return(c) | 0.98 | % | 2.02 | % | 1.90 | % | 0.98 | % | 1.01 | % | 1.22 | % | ||||||||||||
| Market Price Total Return(c) | 1.00 | % | 2.02 | % | ||||||||||||||||||||
| Ratios/Supplemental Data: | ||||||||||||||||||||||||
| Net assets at end of period (000’s omitted) |
$ | 1,611,555 | $ | 1,166,465 | $ | 1,076,092 | $ | 715,109 | $ | 440,913 | $ | 709,258 | ||||||||||||
| Ratio to average net assets of: |
||||||||||||||||||||||||
| Expenses, after Waivers |
0.25 | %(d) | 0.27 | % | 0.27 | % | 0.28 | % | 0.25 | % | 0.27 | % | ||||||||||||
| Expenses, prior to Waivers |
0.25 | %(d) | 0.28 | % | 0.28 | % | 0.28 | % | 0.25 | % | 0.29 | % | ||||||||||||
| Net investment income, after Waivers |
2.64 | %(d) | 1.74 | % | 1.40 | % | 1.21 | % | 1.25 | % | 1.09 | % | ||||||||||||
| Portfolio turnover rate(e) |
6 | % | 56 | % | 52 | % | 25 | % | 44 | % | 30 | % | ||||||||||||
| (a) | Based on average shares outstanding. |
| (b) | The mean between the last bid and ask prices. |
| (c) | Net asset value total return is calculated assuming an initial investment made at the net asset value at the beginning of the period, reinvestment of all dividends and distributions at net asset value during the period, and redemption on the last day of the period. Net asset value total return includes adjustments in accordance with accounting principles generally accepted in the United States of America and as such, the net asset value for financial reporting purposes and the returns based upon those net asset values may differ from the net asset value and returns for shareholder transactions. Market price total return is calculated assuming an initial investment made at the market price at the beginning of the period, reinvestment of all dividends and distributions at market price during the period, and sale at the market price on the last day of the period. Total investment returns calculated for a period of less than one year are not annualized. |
| (d) | Annualized. |
| (e) | Portfolio turnover rate is not annualized for periods less than one year, if applicable, and does not include securities received or delivered from processing creations or redemptions. |
See accompanying Notes to Financial Statements which are an integral part of the financial statements.
|
|
66 |
|
Financial Highlights (continued)
Invesco Variable Rate Investment Grade ETF (VRIG)
| Year Ended October 31, | For the Period September 20, 2016(a) Through October 31, 2016 |
|||||||||||
| 2018 | 2017 | |||||||||||
| Per Share Operating Performance: | ||||||||||||
| Net asset value at beginning of period |
$ | 25.20 | $ | 24.98 | $ | 25.00 | ||||||
| Net investment income(b) |
0.65 | 0.50 | 0.06 | |||||||||
| Net realized and unrealized gain (loss) on investments |
(0.15 | ) | 0.29 | (0.03 | ) | |||||||
| Total from investment operations |
0.50 | 0.79 | 0.03 | |||||||||
| Distributions to shareholders from: |
||||||||||||
| Net investment income |
(0.68 | ) | (0.56 | ) | (0.05 | ) | ||||||
| Return of capital |
— | (0.01 | ) | (0.00 | )(c) | |||||||
| Total distributions |
(0.68 | ) | (0.57 | ) | (0.05 | ) | ||||||
| Net asset value at end of period |
$ | 25.02 | $ | 25.20 | $ | 24.98 | ||||||
| Market price at end of period(d) |
$ | 25.02 | $ | 25.22 | $ | 25.04 | ||||||
| Net Asset Value Total Return(e) | 2.01 | % | 3.21 | % | 0.14 | %(f) | ||||||
| Market Price Total Return(e) | 1.92 | % | 3.04 | % | 0.38 | %(f) | ||||||
| Ratios/Supplemental Data: | ||||||||||||
| Net assets at end of period (000’s omitted) |
$ | 447,868 | $ | 133,548 | $ | 49,956 | ||||||
| Ratio to average net assets of: |
||||||||||||
| Expenses |
0.30 | % | 0.30 | % | 0.30 | %(g) | ||||||
| Net investment income |
2.59 | % | 1.98 | % | 2.03 | %(g) | ||||||
| Portfolio turnover rate(h) |
26 | % | 23 | % | 2 | % | ||||||
| (a) | Commencement of investment operations. |
| (b) | Based on average shares outstanding. |
| (c) | Amount represents less than $(0.005). |
| (d) | The mean between the last bid and ask prices. |
| (e) | Net asset value total return is calculated assuming an initial investment made at the net asset value at the beginning of the period, reinvestment of all dividends and distributions at net asset value during the period, and the redemption on the last day of the period. Net asset value total return includes adjustments in accordance with accounting principles generally accepted in the United States of America and as such, the net asset value for financial reporting purposes and the returns based upon those net asset values may differ from the net asset value and returns for shareholder transactions. Market price total return is calculated assuming an initial investment made at the market price at the beginning of the period, reinvestment of all dividends and distributions at market price during the period, and sale at the market price on the last day of the period. Total investment returns calculated for a period of less than one year are not annualized. |
| (f) | The net asset value total return from Fund Inception (September 22, 2016, the first day of trading on the exchange) to October 31, 2016 was 0.18%. The market price total return from Fund Inception to October 31, 2016 was 0.22%. |
| (g) | Annualized. |
| (h) | Portfolio turnover rate is not annualized for periods less than one year, if applicable, and does not include securities received or delivered from processing creations or redemptions. |
See accompanying Notes to Financial Statements which are an integral part of the financial statements.
|
|
67 |
|
Invesco Actively Managed Exchange-Traded Fund Trust
October 31, 2018
Note 1. Organization
Invesco Actively Managed Exchange-Traded Fund Trust (the “Trust”), formerly PowerShares Actively Managed Exchange-Traded Fund Trust, was organized as a Delaware statutory trust on November 6, 2007 and is authorized to have multiple series of portfolios. The Trust is an open-end management investment company registered under the Investment Company Act of 1940, as amended (the “1940 Act”). This report includes the following portfolios:
| Full Name |
Short Name | |
| Invesco Active U.S. Real Estate ETF (PSR) | “Active U.S. Real Estate ETF” | |
| Invesco Balanced Multi-Asset Allocation ETF (PSMB) | “Balanced Multi-Asset Allocation ETF” | |
| Invesco Conservative Multi-Asset Allocation ETF (PSMC) | “Conservative Multi-Asset Allocation ETF” | |
| Invesco Growth Multi-Asset Allocation ETF (PSMG) | “Growth Multi-Asset Allocation ETF” | |
| Invesco Moderately Conservative Multi-Asset Allocation ETF (PSMM) | “Moderately Conservative Multi-Asset Allocation ETF” | |
| Invesco Multi-Strategy Alternative ETF (LALT) | “Multi-Strategy Alternative ETF” | |
| Invesco S&P 500® Downside Hedged ETF (PHDG) | “S&P 500® Downside Hedged ETF” | |
| Invesco Ultra Short Duration ETF (GSY) | “Ultra Short Duration ETF” | |
| Invesco Variable Rate Investment Grade ETF (VRIG) | “Variable Rate Investment Grade ETF” |
Each portfolio (each, a “Fund”, and collectively, the “Funds”) represents a separate series of the Trust. The shares of the Funds are referred to herein as “Shares” or “Fund’s Shares.” Each Fund’s Shares are listed and traded on the following exchanges:
| Fund |
Exchange | |
| Active U.S. Real Estate ETF | NYSE Arca, Inc. | |
| Balanced Multi-Asset Allocation ETF | Cboe BZX Exchange, Inc. | |
| Conservative Multi-Asset Allocation ETF | Cboe BZX Exchange, Inc. | |
| Growth Multi-Asset Allocation ETF | Cboe BZX Exchange, Inc. | |
| Moderately Conservative Multi-Asset Allocation ETF | Cboe BZX Exchange, Inc. | |
| Multi-Strategy Alternative ETF | The NASDAQ Stock Market LLC | |
| S&P 500® Downside Hedged ETF | NYSE Arca, Inc. | |
| Ultra Short Duration ETF | NYSE Arca, Inc. | |
| Variable Rate Investment Grade ETF | The NASDAQ Stock Market LLC |
Effective June 4, 2018, the Funds’ names changed as part of an overall rebranding strategy whereby the PowerShares name was changed to the Invesco brand. This resulted in all references to the PowerShares name being changed to Invesco.
Ultra Short Duration ETF acquired all or substantially all of the assets and all of the stated liabilities included in the financial statements of a corresponding fund of the Claymore Exchange-Traded Fund Trust (the “Predecessor Fund”) after the close of business on April 6, 2018 (the “Reorganization”). Ultra Short Duration ETF adopted the performance and financial information of the Predecessor Fund. Information presented prior to the close of business on April 6, 2018 is that of the Predecessor Fund.
Effective October 31, 2018, the fiscal year-end changed for Ultra Short Duration ETF from May 31 to October 31.
The market price of each Share may differ to some degree from a Fund’s net asset value (“NAV”). Unlike conventional mutual funds, each Fund issues and redeems Shares on a continuous basis, at NAV, only in a large specified number of Shares, each called a “Creation Unit.” Creation Units for Active U.S. Real Estate ETF, Balanced Multi-Asset Allocation ETF, Conservative Multi-Asset Allocation ETF, Growth Multi-Asset Allocation ETF and Moderately Conservative Multi-Asset Allocation ETF are issued and redeemed principally in exchange for the deposit or delivery of a basket of securities (“Deposit Securities”). Creation Units for Multi-Strategy Alternative ETF and Ultra Short Duration ETF are issued and redeemed principally in exchange for the deposit or delivery of cash. Creation Units for S&P 500® Downside Hedged ETF and Variable Rate Investment Grade ETF are issued and redeemed partially in exchange for the deposit or delivery of cash and partially in exchange for Deposit Securities. Except when aggregated in Creation Units by authorized participants, the Shares are not individually redeemable securities of the Funds.
Balanced Multi-Asset Allocation ETF, Conservative Multi-Asset Allocation ETF, Growth Multi-Asset Allocation ETF and Moderately Conservative Multi-Asset Allocation ETF are each a “fund of funds,” in that each invests in other exchange-traded funds (“Underlying
|
|
68 |
|
Funds”) advised by Invesco Capital Management LLC (the “Adviser”), formerly Invesco PowerShares Capital Management LLC, or its affiliates, or other unaffiliated advisers. Each Underlying Fund’s accounting policies are outlined in that Underlying Fund’s financial statements and are publicly available.
The investment objective for Active U.S. Real Estate ETF is to seek to achieve high total return through growth of capital and current income. The investment objective for Balanced Multi-Asset Allocation ETF is to seek to provide current income and capital appreciation. The investment objective for Conservative Multi-Asset Allocation ETF is to seek total return consistent with a lower level of risk relative to the broad stock market. The investment objective for Growth Multi-Asset Allocation ETF is to seek to provide long-term capital appreciation. The investment objective for Moderately Conservative Multi-Asset Allocation ETF is to seek to provide current income and some capital appreciation. The investment objective for Multi-Strategy Alternative ETF is to seek a positive total return that has a low correlation to the broader securities markets. The investment objective for S&P 500® Downside Hedged ETF is to achieve positive total returns in rising or falling markets that are not directly correlated to broad equity or fixed income market returns. The investment objective of Ultra Short Duration ETF is to seek maximum current income, consistent with preservation of capital and daily liquidity. The investment objective for Variable Rate Investment Grade ETF is to seek to generate current income while maintaining low portfolio duration as a primary objective and capital appreciation as a secondary objective.
Note 2. Significant Accounting Policies
The following is a summary of the significant accounting policies followed by the Funds in preparation of their financial statements.
Each Fund is an investment company and accordingly follows the investment company accounting and reporting guidance in accordance with Financial Accounting Standards Board Accounting Standards Codification Topic 946, Financial Services—Investment Companies.
A. Security Valuation
Securities, including restricted securities, are valued according to the following policies:
Securities, including restricted securities in an Underlying Fund, if any, that are held as investments of a Fund, are valued in accordance with the Underlying Fund’s valuation policy. The policies of Underlying Funds affiliated with the Funds as a result of having the same investment adviser are the same as those set forth below.
A security listed or traded on an exchange (except convertible securities) is generally valued at its last sales price or official closing price as of the close of the customary trading session on the exchange where the security is principally traded or, lacking any sales or official closing price on a particular day, the security may be valued at the closing bid price on that day. Securities traded in the over-the-counter (“OTC”) market are valued based on prices furnished by independent pricing services or market makers. When such securities are valued by an independent pricing service they may be considered fair valued. Futures contracts are valued at the final settlement price set by an exchange on which they are principally traded. Listed options are valued at the mean between the last bid and asked prices from the exchange on which they are principally traded, or at the final settlement price set by such exchange. Swaps and options not listed on an exchange are valued by an independent source. For purposes of determining NAV per Share, futures and option contracts generally are valued 15 minutes after the close of the customary trading session of the New York Stock Exchange (“NYSE”).
Investment companies are valued using such company’s NAV per share, unless the shares are exchange-traded, in which case they are valued at the last sales price or official closing price as of the close of the customary trading session on the exchange where the security is principally traded.
Debt obligations (including convertible securities) and unlisted equities are fair valued using an evaluated quote provided by an independent pricing service. Evaluated quotes provided by the pricing service may be determined without exclusive reliance on quoted prices, and may reflect appropriate factors such as institution-size trading in similar groups of securities, developments related to specific securities, dividend rate (for unlisted equities), yield (for debt obligations), quality, type of issue, coupon rate (for debt obligations), maturity (for debt obligations), individual trading characteristics and other market data. Securities with a demand feature exercisable within one to seven days are valued at par. Pricing services generally value debt obligations assuming orderly transactions of institutional round lot size, but a Fund may hold or transact in the same securities in smaller, odd lot sizes. Odd lots often trade at lower prices than institutional round lots. Debt obligations are subject to interest rate and credit risks. In addition, all debt obligations involve some risk of default with respect to interest and/or principal payments.
Foreign securities’ (including foreign exchange contracts’) prices are converted into U.S. dollar amounts using the applicable exchange rates as of the close of the London world markets. If market quotations are available and reliable for foreign exchange-traded equity securities, the securities will be valued at the market quotations. Because trading hours for certain foreign securities end before the close of the NYSE, closing market quotations may become unreliable. If between the time trading ends on a particular security and the close of the customary trading session on the NYSE, events occur that the Adviser determines are significant and make the closing price unreliable, a Fund may fair value the security. If the event is likely to have affected the closing price of the security, the security will be
|
|
69 |
|
valued at fair value in good faith using procedures approved by the Board of Trustees. Adjustments to closing prices to reflect fair value may also be based on a screening process of an independent pricing service to indicate the degree of certainty, based on historical data, that the closing price in the principal market where a foreign security trades is not the current value as of the close of the NYSE. Foreign securities’ prices meeting the approved degree of certainty that the price is not reflective of current value will be priced at the indication of fair value from the independent pricing service. Multiple factors may be considered by the independent pricing service in determining adjustments to reflect fair value and may include information relating to sector indices, American Depositary Receipts and domestic and foreign index futures. Foreign securities may have additional risks including exchange rate changes, the potential for sharply devalued currencies and high inflation, political and economic upheaval, the relative lack of issuer information, relatively low market liquidity and the potential lack of strict financial and accounting controls and standards.
Securities for which market prices are not provided by any of the above methods may be valued based upon quotes furnished by independent sources. The last bid price may be used to value exchange-traded equity securities. The mean between the last bid and asked prices may be used to value debt obligations, including corporate loans, and unlisted equity securities.
Securities for which market quotations are not readily available or became unreliable are valued at fair value as determined in good faith following procedures approved by the Board of Trustees. Issuer-specific events, market trends, bid/asked quotes of brokers and information providers and other market data may be reviewed in the course of making a good faith determination of a security’s fair value.
Each Fund may invest in securities that are subject to interest rate risk, meaning the risk that the prices will generally fall as interest rates rise and, conversely, the prices will generally rise as interest rates fall. Specific securities differ in their sensitivity to changes in interest rates depending on their individual characteristics. Changes in interest rates may result in increased market volatility, which may affect the value and/or liquidity of certain Fund investments.
Valuations change in response to many factors, including the historical and prospective earnings of the issuer, the value of the issuer’s assets, general economic conditions, interest rates, investor perceptions and market liquidity. Because of the inherent uncertainties of valuation, the values reflected in the financial statements may materially differ from the value received upon actual sale of those investments.
B. Other Risks
Active Trading Risk. Active trading of portfolio securities may result in added expenses, a lower return and increased tax liability.
Authorized Participant Concentration Risk. Only Authorized Participants (“APs”) may engage in creation or redemption transactions directly with each Fund. Each Fund has a limited number of institutions that may act as APs, and such APs have no obligation to submit creation or redemption orders. Consequently, there is no assurance that those APs will establish or maintain an active trading market for the Shares. This risk may be heightened to the extent that securities underlying each Fund are traded outside a collateralized settlement system. In that case, APs may be required to post collateral on certain trades on an agency basis (i.e., on behalf of other market participants), which only a limited number of APs may be able to do. In addition, to the extent that APs exit the business or are unable to proceed with creation and/or redemption orders with respect to each Fund and no other AP is able to step forward to create or redeem Creation Units, this may result in a significantly diminished trading market for Fund Shares, which may be more likely to trade at a premium or discount to each Fund’s net asset value (“NAV”) and to face trading halts and/or delisting. This risk may be heightened for Funds that invest in non-U.S. securities, which may have lower trading volumes.
Currency Risk. Certain Fund’s investments and strategies will involve exposure to foreign currencies. Currency risk is the risk that changes in the exchange rate between currencies will adversely affect the value (in U.S. dollar terms) of an investment. As long as the Fund holds a foreign currency denominated security, its value will be affected by the value of the local currency relative to the U.S. dollar. When the Fund sells a foreign currency denominated security, its value may be worth less in U.S. dollars even if the security increases in value in its home country. U.S. dollar denominated securities of foreign issuers also may be affected by currency risk, as the value of these securities may also be affected by changes in the issuer’s local currency. Additionally, and as a result of the Fund’s use of currency investment strategies, the Fund’s net currency position may expose the Fund to losses independent of any securities positions.
Equity Risk. Equity risk is the risk that the value of equity securities will fall due to general market and economic conditions, perceptions regarding the industries in which the issuers of securities that a Fund holds participate or factors relating to specific companies in which the Fund invests. For example, an adverse event, such as an unfavorable earnings report, may depress the value of securities a Fund holds; the price of securities may be particularly sensitive to general movements in the stock market; or a drop in the stock market may depress the price of most or all of the securities a Fund holds. In addition, securities of an issuer in the Fund’s portfolio may decline in price if the issuer fails to make anticipated dividend payments because, among other reasons, the issuer of the security experiences a decline in its financial condition.
REIT Risk. For Active U.S. Real Estate ETF, although the Fund will not invest in real estate directly, the REITs in which the Fund invests are subject to risks inherent in the direct ownership of real estate. These risks include, but are not limited to, a possible lack of mortgage
|
|
70 |
|
funds and associated interest rate risks, overbuilding, property vacancies, increases in property taxes and operating expenses, changes in zoning laws, losses due to environmental damages and changes in neighborhood values and appeal to purchasers.
Non-Diversified Fund Risk. Because each Fund (except Multi-Strategy Alternative ETF and S&P 500® Downside Hedged ETF) is non-diversified and can invest a greater portion of its assets in securities of individual issuers than diversified funds, changes in the market value of a single investment could cause greater fluctuations in Share price than would occur in a diversified fund. This may increase each Fund’s volatility and cause the performance of a relatively small number of issuers to have a greater impact on each Fund’s performance.
Management Risk. The Funds are subject to management risk because they are actively managed portfolios. In managing a Fund’s portfolio securities, the Adviser or a sub-adviser (as applicable and as set forth below), applies investment techniques and risk analyses in making investment decisions, but there can be no guarantee that these will produce the desired results.
Cash Transaction Risk. Unlike most exchange-traded funds (“ETFs”), Multi-Strategy Alternative ETF and Ultra Short Duration ETF currently effect creations and redemptions principally for cash and S&P 500® Downside Hedged ETF and Variable Rate Investment Grade ETF currently effect creations and redemptions partially for cash and partially in-kind, rather than primarily in-kind, because of the nature of each of these Funds’ investments. As such, investments in each Fund’s Shares may be less tax efficient than investments in shares of conventional ETFs that utilize an entirely in-kind redemption process.
Foreign Investment Risk. Investments in the securities of non-U.S. issuers involve risks beyond those associated with investments in U.S. securities. Foreign securities may have relatively low market liquidity, greater market volatility, decreased publicly available information, and less reliable financial information about issuers, and inconsistent and potentially less stringent accounting, auditing and financial reporting requirements and standards of practice comparable to those applicable to domestic issuers. Foreign securities also are subject to the risks of expropriation, nationalization, political instability or other adverse political or economic developments and the difficulty of enforcing obligations in other countries. Investments in foreign securities also may be subject to dividend withholding or confiscatory taxes, currency blockage and/or transfer restrictions and higher transactional costs.
Emerging Markets Investment Risk. Investments in the securities of issuers in emerging market countries involve risks often not associated with investments in the securities of issuers in developed countries. Securities in emerging markets may be subject to greater price fluctuations than securities in more developed markets. Fluctuations in the value of the U.S. dollar relative to the values of other currencies may adversely affect investments in emerging market securities, and emerging market securities may have relatively low market liquidity, decreased publicly available information about issuers, and inconsistent and potentially less stringent accounting, auditing and financial reporting requirements and standards of practice comparable to those applicable to domestic issuers. Emerging market securities also are subject to the risks of expropriation, nationalization or other adverse political or economic developments and the difficulty of enforcing obligations in other countries. Investments in emerging market securities also may be subject to dividend withholding or confiscatory taxes, currency blockage and/or transfer restrictions. Emerging markets usually are subject to greater market volatility, lower trading volume, political and economic instability, uncertainty regarding the existence of trading markets and more governmental limitations on foreign investment than are more developed markets. Securities law in many emerging market countries is relatively new and unsettled. Therefore, laws regarding foreign investment in emerging market securities, securities regulation, title to securities, and shareholder rights may change quickly and unpredictably. In addition, the enforcement of systems of taxation at federal, regional and local levels in emerging market countries may be inconsistent and subject to sudden change.
Industry Concentration Risk. By concentrating its investments in an industry or sector, a Fund faces more risks than if it were diversified broadly over numerous industries or sectors. Such industry-based risks, any of which may adversely affect the companies in which the Fund invests, may include, but are not limited to, the following: general economic conditions or cyclical market patterns that could negatively affect supply and demand in a particular industry; competition for resources, adverse labor relations, political or world events; obsolescence of technologies; and increased competition or new product introductions that may affect the profitability or viability of companies in an industry. In addition, at times, such industry or sector may be out of favor and underperform other industries or the market as a whole.
Portfolio Turnover Risk. Each of the Active U.S. Real Estate ETF, Multi-Strategy Alternative ETF and S&P 500® Downside Hedged ETF may engage in frequent and active trading of its portfolio securities, resulting in a high portfolio turnover rate. A portfolio turnover rate of 200%, for example, is equivalent to a Fund buying and selling all of its securities two times during the course of a year. A high portfolio turnover rate (such as 100% or more) may increase a Fund’s transaction costs and may generate a greater amount of taxable capital gain distributions to a Fund’s shareholders.
Derivatives Risk. Derivatives involve risks different from, or possibly greater than, risks associated with other types of investments. Derivatives may be harder to value and may also be less tax efficient. To the extent that the Fund uses derivatives for hedging or to gain or limit exposure to a particular market or market segment, there may be imperfect correlation between the value of the derivative instrument and the value of the instrument being hedged or the relevant market or market segment, in which case a Fund may not realize the intended benefits. There is also the risk that during adverse market conditions, an instrument which would usually operate as
|
|
71 |
|
a hedge provides no hedging benefits at all. A Fund’s use of derivatives may be limited by the requirements for taxation of the Fund as a regulated investment company as well as regulatory changes.
VIX Index Risk. For Multi-Strategy Alternative ETF and S&P 500® Downside Hedged ETF, the Chicago Board Options Exchange (“CBOE”) can make methodological changes to the calculation of the Chicago Board Options Exchange Volatility Index (“VIX Index”) that could affect the value of the futures contracts on the VIX Index. There can be no assurance that the CBOE will not change the VIX Index calculation methodology in a way that may affect the value of each Fund’s Shares. Additionally, the CBOE may alter, discontinue or suspend calculation or dissemination of the VIX Index and/or the exercise settlement value. Any of these actions could adversely affect the value of each Fund’s Shares.
Small- and Mid-Capitalization Company Risk. Investing insecurities of small- and mid-capitalization companies involves greater risk than customarily is associated with investing in larger, more established companies. These companies’ securities may be more volatile and less liquid than those of more established companies. These securities may have returns that vary, sometimes significantly, from the overall securities market. Often small- and mid-capitalization companies and the industries in which they focus are still evolving and, as a result, they may be more sensitive to changing market conditions.
Tax Risk. Multi-Strategy Alternative ETF may purchase and sell interest rate futures, including Eurodollar interest rate futures or Euro Euribor interest rate futures, and VIX Index futures contracts. S&P 500® Downside Hedged ETF will gain most of its exposure to the futures markets by entering into VIX Index futures (and, to a lesser extent, S&P 500® Index futures (“S&P 500 Futures”)). To qualify as a regulated investment company (“RIC”) under Subchapter M of the Internal Revenue Code of 1986, as amended (the “Internal Revenue Code”), the Funds must meet a qualifying income test each taxable year. The S&P 500® Downside Hedged ETF has received a private letter ruling from the Internal Revenue Service (“IRS”) that income it derives from VIX Index futures contracts will constitute qualifying income for purposes of that test. Multi-Strategy Alternative ETF received an opinion of its counsel (which is not binding on the IRS or courts) stating that such income should be qualifying for purposes of that test. Failure to comply with the qualifying income test in any taxable year would have significant negative tax consequences to shareholders of the Funds. If the IRS were to determine that the income that the Funds derive from futures did not constitute qualifying income, the Funds likely would be required to reduce their exposure to such investments in order to maintain qualification as a RIC, which may result in difficulty in implementing their investment strategies.
Risk of Investing in Investment Companies. Because Multi-Strategy Alternative ETF and Ultra Short Duration ETF may invest in other investment companies generally and S&P 500® Downside Hedged ETF and Variable Rate Investment Grade ETF may invest in other ETFs specifically, each Fund’s investment performance may depend on the investment performance of the funds in which it invests. An investment in an investment company is subject to the risks associated with that investment company. Each Fund will pay indirectly a proportional share of the fees and expenses of the investment companies in which it invests (including costs and fees of the investment companies), while continuing to pay its own management fee to the Adviser. As a result, shareholders will absorb duplicate levels of fees with respect to a Fund’s investments in other investment companies.
Commodity Pool Risk. Multi-Strategy Alternative ETF and S&P 500® Downside Hedged ETF invest in futures contracts, which cause each to be deemed to be a commodity pool, thereby subjecting each Fund to regulation under the Commodity Exchange Act and rules of the Commodity Futures Trading Commission (“CFTC”). The Adviser is registered as a Commodity Pool Operator (“CPO”) and as a commodity trading advisor (“CTA”), and the Funds will be operated in accordance with CFTC rules. Registration as a CPO or CTA subjects the Adviser to additional laws, regulations and enforcement policies, all of which could increase compliance costs and may affect the operations and financial performance of these Funds. Registration as a commodity pool may have negative effects on the ability of each of these Funds to engage in their respective planned investment program.
Agency Debt Risk. Ultra Short Duration ETF and Variable Rate Investment Grade ETF invest in debt issued by government agencies, including the Federal National Mortgage Association (“Fannie Mae”) and the Federal Home Loan Mortgage Corporation (“Freddie Mac”). Instruments issued by government agencies generally are backed only by the general creditworthiness and reputation of the government agency issuing the instrument and are not backed by the full faith and credit of the U.S. government. As a result, there is uncertainty as to the current status of many obligations of Fannie Mae, Freddie Mac and other agencies that are placed under conservatorship of the federal government.
Call Risk. Call risk (also termed prepayment risk) is the risk that a borrower repays its debts earlier than expected (especially if interest rates decline), resulting in premature repayment of a debt instrument. If interest rates fall, issuers of callable securities with high interest coupons may “call” (or repay) their bonds before their maturity date in accordance with the terms of the security. If such a repayment were to occur, each Fund would receive the principal (par) amount of the security and would no longer own that security. Any reinvestment of the amount of principal received would be subject to reinvestment risk, and each Fund could be forced to reinvest in a lower yielding security, which could reduce each Fund’s net investment income. If each Fund purchases a debt security at a premium to its par value, and that security is called at par, the Fund can lose money.
Credit Risk. The issuer of instruments in which Ultra Short Duration ETF and Variable Rate Investment Grade ETF invest may be unable to meet interest and/or principal payments. An issuer’s securities may decrease in value if its financial strength weakens, which may
|
|
72 |
|
reduce its credit rating and possibly its ability to meet its contractual obligations. Even in the case of collateralized debt obligations, there is no assurance that the sale of collateral would raise enough cash to satisfy an issuer’s payment obligations or that the collateral can or will be liquidated.
Fund of Funds Risk. Because Balanced Multi-Asset Allocation ETF, Conservative Multi-Asset Allocation ETF, Growth Multi-Asset Allocation ETF and Moderately Conservative Multi-Asset Allocation ETF invest primarily in other funds, each Fund’s investment performance largely depends on the investment performance of those Underlying Funds. An investment in each Fund is subject to the risks associated with the Underlying Funds. In addition, at times, certain of the segments of the market represented by Underlying Funds in which the Funds invest may be out of favor and underperform other segments. Each Fund indirectly pays a proportional share of the expense of the Underlying Funds in which it invests (including operating expenses and management fees), in addition to the fees and expenses it already pays to the Adviser.
Portfolio Size Risk. Under normal market conditions, each of Balanced Multi-Asset Allocation ETF, Conservative Multi-Asset Allocation ETF, Growth Multi-Asset Allocation ETF and Moderately Conservative Multi-Asset Allocation ETF typically will hold a small number of positions (approximately 10-20 Underlying Funds). To the extent that a significant portion of a Fund’s total assets is invested in a limited number of holdings, the appreciation or depreciation of any one Underlying Fund may have a greater impact on such Fund’s NAV than it would if the Fund held a greater number of constituents.
Interest Rate Risk. Interest rate risk refers to the risk that bond prices generally fall as interest rates rise; conversely, bond prices generally rise as interest rates fall. Specific bonds differ in their sensitivity to changes in interest rates depending on their individual characteristics, including duration. “Duration risk” is related to interest rate risk; it refers to the risks associated with the sensitivity of a bond’s price to a one percent change in interest rates. Bonds with longer durations (i.e., a greater length of time until they reach maturity) face greater duration risk, meaning that they tend to exhibit greater volatility and are more sensitive to changes in interest rates than bonds with shorter durations. The Fund seeks to limit its exposure to interest rate risk and duration risk by constructing a portfolio of variable rate instruments that have an average duration of one year or less.
Liquidity Risk. Certain Funds may hold illiquid securities that it may be unable to sell at the preferred time or price and could lose its entire investment in such securities. The majority of each Fund’s assets are likely to be invested in securities that are less liquid than those traded on national exchanges. The risks of illiquidity are particularly important when each Fund’s operations require cash, and may in certain circumstances require that each Fund borrow to meet short-term cash requirements. Illiquid securities are also difficult to value. In the event each Fund voluntarily or involuntarily liquidates portfolio assets during periods of infrequent trading, it may not receive full value for those assets.
Mortgage- and Asset-Backed Securities Risk. Ultra Short Duration ETF and Variable Rate Investment Grade ETF may invest in mortgage- and asset-backed securities, which are subject to call (prepayment) risk, reinvestment risk and extension risk. In addition, these securities are susceptible to an unexpectedly high rate of defaults on the mortgages held by a mortgage pool, which may adversely affect their value. The risk of such defaults depends on the quality of the mortgages underlying such security, the credit quality of its issuer or guarantor, and the nature and structure of its credit support. For example, the risk of default generally is higher in the case of mortgage pools that include subprime mortgages, which are loans made to borrowers with weakened credit histories or with lower capacity to make timely mortgage payments.
High Yield Securities (Junk Bond) Risk. Compared to higher quality debt securities, high yield debt securities (commonly referred to as “junk bonds”) involve a greater risk of default or price changes due to changes in the credit quality of the issuer because they are generally unsecured and may be subordinated to other creditors’ claims. They are considered speculative with respect to the issuer’s capacity to pay interest and repay principal. High yield debt securities often are issued by smaller, less creditworthy companies or by highly leveraged (indebted) firms, which generally are less able than more financially stable firms to make scheduled payment of interest and principal. The values of junk bond often fluctuate more in response to company, political, regulatory or economic developments than higher quality bonds, and their values can decline significantly over short periods of time or during periods of economic difficulty when the bonds could be difficult to value or sell at a fair price.
Collateralized Loan Obligations (“CLOs”) and Collateralized Debt Obligations (“CDOs”) Risk. Ultra Short Duration ETF may invest in CLOs and CDOs. CLOs bear many of the same risks as other forms of asset-backed securities (“ABS”), including interest rate risk, credit risk and default risk. As they are backed by pools of loans, CLOs also bear similar risks to investing in loans directly. CLOs issue classes or “tranches’’ that vary in risk and yield. CLOs may experience substantial losses attributable to loan defaults. Losses caused by defaults on underlying assets are borne first by the holders of subordinate tranches. Ultra Short Duration ETF’s investment in CLOs may decrease in market value when the CLO experiences loan defaults or credit impairment, the disappearance of a subordinate tranche, or market anticipation of defaults and investor aversion to CLO securities as a class.
CDOs are structured similarly to CLOs and bear the same risks as CLOs including interest rate risk, credit risk and default risk. CDOs are subject to additional risks because they are backed by pools of assets other than loans including securities (such as other ABS), synthetic instruments or bonds and may be highly leveraged. Like CLOs, losses incurred by a CDO are borne first by holders of
|
|
73 |
|
subordinate tranches. Accordingly, the risks of CDOs depend largely on the type of underlying collateral and the tranche of CDOs in which the Fund invests. For example, CDOs that obtain their exposure through synthetic investments entail the risks associated with derivative instruments.
Commercial Paper Risk. Ultra Short Duration ETF may invest in commercial paper. The value of the Fund’s investment in commercial paper, which is an unsecured promissory note that generally has a maturity date between one and 270 days and is issued by a U.S. or foreign entity, is susceptible to changes in the issuer’s financial condition or credit quality. Investments in commercial paper are usually discounted from their value at maturity. Commercial paper can be fixed-rate or variable rate and can be adversely affected by changes in interest rates.
U.S. Government Obligations Risk. For Ultra Short Duration ETF and Variable Rate Investment Grade ETF, obligations of U.S. Government agencies and authorities generally are not backed by the full faith and credit of the U.S. Government, and no assurance can be given that the U.S. Government will provide financial support to its agencies and authorities if it is not obligated by law to do so.
C. Federal Income Taxes
Each Fund intends to comply with the provisions of the Internal Revenue Code of 1986, as amended (the “Internal Revenue Code”), applicable to regulated investment companies and to distribute substantially all of the Fund’s taxable earnings to its shareholders. As such, the Funds will not be subject to federal income taxes on otherwise taxable income (including net realized gains) that is distributed to the shareholders. Therefore, no provision for federal income taxes is recorded in the financial statements.
Each Fund recognizes the tax benefits of uncertain tax positions only when the position is more likely than not to be sustained. Management has analyzed each Fund’s uncertain tax positions and concluded that no liability for unrecognized tax benefits should be recorded related to uncertain tax positions. Management is not aware of any tax positions for which it is reasonably possible that the total amounts of unrecognized tax benefits will change materially in the next 12 months.
Income and capital gain distributions are determined in accordance with federal income tax regulations, which may differ from accounting principles generally accepted in the United States of America (“GAAP”). These differences are primarily due to differing book and tax treatments for in-kind transactions, losses deferred due to wash sales, and passive foreign investment company adjustments, if any.
The Funds file U.S. federal tax returns and tax returns in certain other jurisdictions. Generally, a Fund is subject to examinations by such taxing authorities for up to three years after the filing of the return for the tax period.
D. Investment Transactions and Investment Income
Investment transactions are accounted for on a trade date basis. Realized gains and losses from the sale or disposition of securities are computed on the specific identified cost basis. Interest income is recorded on the accrual basis from settlement date. Bond premiums and discounts are amortized and/or accreted over the lives of the respective securities. Pay-in-kind interest income and non-cash dividend income received in the form of securities in-lieu of cash are recorded at the fair value of the securities received. Dividend income (net of withholding tax, if any) is recorded on the ex-dividend date. Realized gains, dividends and interest received by a Fund may give rise to withholding and other taxes imposed by foreign countries. Tax conventions between certain countries and the United States may reduce or eliminate such taxes.
The Funds may periodically participate in litigation related to each Fund’s investments. As such, the Funds may receive proceeds from litigation settlements. Any proceeds received are included in the Statements of Operations as realized gain (loss) for investments no longer held and as unrealized gain (loss) for investments still held.
Brokerage commissions and mark ups are considered transaction costs and are recorded as an increase to the cost basis of securities purchased and/or a reduction of proceeds on a sale of securities. Such transaction costs are included in the determination of net realized and unrealized gain (loss) from investment securities reported in the Statements of Operations and the Statements of Changes in Net Assets and the net realized and unrealized gains (losses) on securities per share in the Financial Highlights. Transaction costs are included in the calculation of each Fund’s NAV and, accordingly, they reduce each Fund’s total returns. These transaction costs are not considered operating expenses and are not reflected in net investment income reported in the Statements of Operations and the Statements of Changes in Net Assets, or the net investment income per share and the ratios of expenses and net investment income reported in the Financial Highlights, nor are they limited by any expense limitation arrangements between each Fund and the Adviser.
E. Country Determination
For the purposes of making investment selection decisions and presentation in the Schedule of Investments, the Adviser may determine the country in which an issuer is located and/or credit risk exposure based on various factors. These factors include the laws of the country under which the issuer is organized, where the issuer maintains a principal office, the country in which the issuer derives 50% or more of its total revenues and the country that has the primary market for the issuer’s securities, as well as other criteria. Among the other criteria that may be evaluated for making this determination are the country in which the issuer maintains 50% or more of its
|
|
74 |
|
assets, the type of security, financial guarantees and enhancements, the nature of the collateral and the sponsor organization. Country of issuer and/or credit risk exposure has been determined to be the United States of America, unless otherwise noted.
F. Expenses
Each Fund (except Ultra Short Duration ETF) has agreed to pay an annual unitary management fee to the Adviser. Out of the unitary management fee, the Adviser has agreed to pay for substantially all expenses of the Funds, including payments to the Affiliated Sub-Advisers (as defined below) for each Fund (except S&P 500® Downside Hedged ETF), and for each Fund, the cost of transfer agency, custody, fund administration, legal, audit and other services, except for advisory fees, distribution fees, if any, brokerage expenses, taxes, interest, acquired fund fees and expenses, if any, litigation expenses and other extraordinary expenses.
Ultra Short Duration ETF is responsible for all of its expenses, including the investment advisory fees, cost of transfer agency, custody, fund administration, legal, audit and other services, interest, taxes, acquired fund fees and expense, if any, brokerage commissions and other expenses connected with executions of portfolio transactions, any distribution fees or expenses, litigation expenses, fees payable to the Trust’s Board members who are not “interested persons” (as defined in the 1940 Act) of the Trust (the “Independent Trustees”), expenses incurred in connection with the Board members’ services, including travel expenses and legal fees of counsel for the Independent Trustees, acquired fund fees and expenses, if any, and extraordinary expenses.
Expenses of the Trust that are excluded from a Fund’s unitary management fee and are directly identifiable to a specific Fund are applied to that Fund. Expenses of the Trust that are excluded from each Fund’s unitary management fee and that are not readily identifiable to a specific Fund are allocated in such a manner as deemed equitable, taking into consideration the nature and type of expense and the relative net assets of each Fund.
To the extent a Fund invests in other investment companies, the expenses shown in the accompanying financial statements reflect the expenses of the Fund and do not include any expenses of the investment companies in which it invests. The effects of such investment companies’ expenses are included in the realized and unrealized gain or loss on the investments in the investment companies.
G. Dividends and Distributions to Shareholders
Each Fund (except Multi-Strategy Alternative ETF, Variable Rate Investment Grade ETF and Ultra Short Duration ETF) declares and pays dividends from net investment income, if any, to their shareholders quarterly and record such dividends on ex-dividend date. Multi-Strategy Alternative ETF declares and pays dividends from net investment income, if any, to its shareholders annually and records such dividends on ex-dividend date. Variable Rate Investment Grade ETF and Ultra Short Duration ETF each declares and pays dividends from net investment income, if any, to its shareholders monthly and records such dividends on ex-dividend date. Generally, each Fund distributes net realized taxable capital gains, if any, annually in cash and records them on ex-dividend date. Such distributions on a tax basis are determined in conformity with federal income tax regulations which may differ from GAAP. Distributions in excess of tax basis earnings and profits, if any, are reported in such Fund’s financial statements as a tax return of capital at fiscal year-end.
H. Accounting Estimates
The preparation of the financial statements in accordance with GAAP requires management to make estimates and assumptions that affect the reported amounts and disclosures in the financial statements, including estimates and assumptions related to taxation. Actual results could differ from these estimates. In addition, the Funds monitor for material events or transactions that may occur or become known after the period-end date and before the date the financial statements are released to print.
I. Securities Lending
During the fiscal year or period ended October 31, 2018, Balanced Multi-Asset Allocation ETF, Conservative Multi-Asset Allocation ETF, Growth Multi-Asset Allocation ETF, Moderately Conservative Multi-Asset Allocation ETF participated in securities lending. Each Fund loaned portfolio securities having a market value up to one-third of each Fund’s total assets. Such loans are secured by cash collateral equal to no less than 102% (105% for international securities) of the market value of the loaned securities determined daily by the securities lending provider. Cash collateral received in connection with these loans is generally invested in an affiliated money market fund and is shown as such on the Schedules of Investments. Each Fund bears the risk of loss with respect to the investment of collateral. It is the policy of these Funds to obtain additional collateral from or return excess collateral to the borrower by the end of the next business day, following the valuation date of the securities loaned. Therefore, the value of the collateral held may be temporarily less than the value of the securities on loan. When loaning securities, each Fund retains certain benefits of owning the securities, including the economic equivalent of dividends or interest generated by the security. Lending securities entails a risk of loss to each Fund if, and to the extent that, the market value of the securities loaned were to increase, and the borrower did not increase the collateral accordingly, and the borrower failed to return the securities. The securities loaned are subject to termination at the option of the borrower or each Fund. Upon termination, the borrower will return to each Fund the securities loaned and each Fund will return the collateral. Upon the failure of the borrower to return the securities, collateral may be liquidated and the securities may be purchased on the open market to replace the loaned securities. Each Fund could experience delays and costs in gaining access to the collateral and the securities may lose value during the delay which could result in potential losses to each Fund. Some of these losses may be indemnified by the lending agent. Each Fund bears the risk of any deficiency in the amount of the collateral available for return to the borrower due to any loss on the collateral invested. Dividends received on cash collateral investments for securities lending transactions,
|
|
75 |
|
which are net of compensation to counterparties, are included in Securities lending income on the Statements of Operations. The aggregate value of securities out on loan, if any, is shown on the Statements of Assets and Liabilities.
J. Repurchase Agreements
The Funds may enter into repurchase agreements with financial institutions. In a repurchase agreement, each Fund buys a security and the seller simultaneously agrees to repurchase the security on a specified future date at an agreed-upon price. The repurchase price reflects an agreed-upon interest rate during the time each Fund’s money is invested in the security. Because the security constitutes collateral for the repurchase obligation, a repurchase agreement can be considered a collateralized loan. Each Fund follows certain procedures designed to minimize the risks inherent in such agreements. These procedures include effecting repurchase transactions only with large, well-capitalized and well-established financial institutions whose condition will be continually monitored. In addition, the value of the collateral underlying the repurchase agreement will always be at least equal to the repurchase price, including any accrued interest earned on the repurchase agreement. In the event of a default or bankruptcy by a selling financial institution, each Fund will seek to liquidate such collateral. However, the exercising of each Fund’s right to liquidate such collateral could involve certain costs or delays and, to the extent that proceeds from any sale upon a default of the obligation to repurchase were less than the repurchase price, each Fund could suffer a loss. It is the current policy of each Fund not to invest in repurchase agreements that do not mature within seven days if any such investment, together with any other illiquid assets held by each Fund, amounts to more than 15% of each Fund’s net assets. The investments of each Fund in repurchase agreements, at times, may be substantial when, in the view of the Adviser, liquidity or other considerations so warrant.
K. Commercial Mortgage-Backed Securities
Variable Rate Investment Grade ETF and Ultra Short Duration ETF may invest in both single and multi-issuer Commercial Mortgage-Backed Securities (“CMBS”). This includes both investment grade and non-investment grade CMBS as well as other non-rated CMBS. A CMBS is a type of mortgage-backed security that is secured by one or more mortgage loans on interests in commercial real estate property. CMBS differ from conventional debt securities because principal is paid back over the life of the security rather than at maturity. Investments in CMBS are subject to the various risks which relate to the pool of underlying assets in which the CMBS represents an interest. Securities backed by commercial real estate assets are subject to securities market risks as well as risks similar to those of direct ownership of commercial real estate loans. Risks include the ability of a borrower to meet its obligations on the loan which could lead to default or foreclosure of the property. Such actions may impact the amount of proceeds ultimately derived from the loan, and the timing of receipt of such proceeds.
Management estimates future expected cash flows at the time of purchase based on the anticipated repayment dates on the CMBS. Subsequent changes in expected cash flow projection may result in a prospective change in the timing or character of income recognized on these securities, or the amortized cost of these securities. Each Fund amortizes premiums and/or accretes discounts based on the projected cash flows. Realized and unrealized gains and losses on CMBS are included in the Statements of Operations as Net realized gain (loss) from investment securities and Change in net unrealized appreciation (depreciation) of investment securities, respectively.
L. Foreign Currency Translations
Foreign currency is valued at the close of the NYSE based on quotations posted by banks and major currency dealers. Portfolio securities and other assets and liabilities denominated in foreign currencies are translated into U.S. dollar amounts at date of valuation. Purchases and sales of portfolio securities (net of foreign taxes withheld on disposition) and income items denominated in foreign currencies are translated into U.S. dollar amounts on the respective dates of such transactions. The Funds do not separately account for the portion of the results of operations resulting from changes in foreign exchange rates on investments and the fluctuations arising from changes in market prices of securities held. The combined results of changes in foreign exchange rates and the fluctuation of market prices on investments (net of estimated foreign tax withholding) are included with the net realized and unrealized gain or loss from investments in the Statements of Operations. Reported net realized foreign currency gains or losses arise from (1) sales of foreign currencies, (2) currency gains or losses realized between the trade and settlement dates on securities transactions, and (3) the difference between the amounts of dividends, interest, and foreign withholding taxes recorded on each Fund’s books and the U.S. dollar equivalent of the amounts actually received or paid. Net unrealized foreign currency gains and losses arise from changes in the fair values of assets and liabilities, other than investments in securities at fiscal period-end, resulting from changes in exchange rates.
The Funds may invest in foreign securities, which may be subject to foreign taxes on income, gains on investments or currency repatriation, a portion of which may be recoverable. Foreign taxes, if any, are recorded based on the tax regulations and rates that exist in the foreign markets in which each Fund invests.
M. Forward Foreign Currency Contracts
Multi-Strategy Alternative ETF and Ultra Short Duration ETF may engage in foreign currency transactions either on a spot (i.e. for prompt delivery and settlement) basis at the rate prevailing in the currency exchange market at the time or through forward foreign currency contracts to manage or minimize currency or exchange rate risk.
|
|
76 |
|
Each Fund also enters into forward foreign currency contracts for the purchase or sale of a security denominated in a foreign currency in order to “lock in” the U.S. dollar price of that security, or the Fund also enters into forward foreign currency contracts that do not provide for physical settlement of the two currencies, but instead are settled by a single cash payment calculated as the difference between the agreed upon exchange rate and the spot rate at settlement based upon an agreed upon notional amount (non-deliverable forwards). The Fund sets aside liquid assets in an amount equal to the daily mark-to-market obligation for forward foreign currency contracts.
A forward foreign currency contract is an obligation between two parties (“Counterparties”) to purchase or sell a specific currency for an agreed-upon price at a future date. The use of forward foreign currency contracts does not eliminate fluctuations in the price of the underlying securities the Fund owns or intends to acquire but establishes a rate of exchange in advance. Fluctuations in the value of these contracts are measured by the difference in the contract date and reporting date exchange rates and are recorded as unrealized appreciation (depreciation) until the contracts are closed. When the contracts are closed, realized gains (losses) are recorded. Realized and unrealized gains (losses) on the contracts are included in the Statements of Operations. The primary risks associated with forward foreign currency contracts include failure of the Counterparty to meet the terms of the contract and the value of the foreign currency changing unfavorably. These risks may be in excess of the amounts reflected in the Statements of Assets and Liabilities.
N. Futures Contracts
Multi-Strategy Alternative ETF and S&P 500® Downside Hedged ETF entered into futures contracts to simulate full investment in securities or manage exposure to equity and market price movements and/or currency risks and provide exposure to markets and indexes.
A futures contract is an agreement between Counterparties to purchase or sell a specified underlying security or index for a specified price at a future date. Multi-Strategy Alternative ETF and S&P 500® Downside Hedged ETF will only enter into futures contracts that are traded on a U.S. exchange and that are standardized as to maturity date and underlying financial instrument. Initial margin deposits required upon entering into futures contracts are satisfied by the segregation of specific securities or cash as collateral at the futures commission merchant broker. During the period the futures contracts are open, changes in the value of the contracts are recognized as unrealized gains or losses by recalculating the value of the contracts on a daily basis. Subsequent or variation margin payments are received or made depending upon whether unrealized gains or losses are incurred. These amounts are reflected as a receivable or payable on the Statements of Assets and Liabilities. When the contracts are closed or expire, each Fund recognizes a realized gain or loss equal to the difference between the proceeds from, or cost of, the closing transaction and the Fund’s basis in the contract. The net realized gain (loss) and the change in unrealized gain (loss) on futures contracts held during the period is included on the Statements of Operations.
The primary risks associated with futures contracts are market risk, leverage risk and the absence of a liquid secondary market. If a Fund were unable to liquidate a futures contract and/or enter into an offsetting closing transaction, the Fund would continue to be subject to market risk with respect to the value of the contracts and may be required to continue to maintain the margin deposits on the futures contracts until the position expired or matured. As futures contracts approach expiration, they may be replaced by similar contracts that have a later expiration. This process is referred to as “rolling.” If the market for these contracts is in “contango,” meaning that the prices of futures contracts in the nearer months are lower than the price of contracts in the distant months, the sale of the near-term month contract would be at a lower price than the longer-term contract, resulting in a cost to “roll” the futures contract. The actual realization of a potential roll cost will depend on the difference in price of the near and distant contracts. The contracts included in the VIX Index historically have traded in “contango” markets, resulting in a roll cost, which could adversely affect the value of Shares of the S&P 500® Downside Hedged ETF. Futures have minimal Counterparty risk since the exchange’s clearinghouse, as Counterparty to all exchange-traded futures contracts, guarantees the futures against default. Risks may exceed amounts recognized in the Statements of Assets and Liabilities.
O. Structured Securities
Multi-Strategy Alternative ETF and S&P 500® Downside Hedged ETF may invest in structured securities. Structured securities are a type of derivative security whose value is determined by reference to changes in the value of underlying securities, currencies, interest rates, commodities, indices or other financial indicators (“reference instruments”). Most structured securities are fixed-income securities that have maturities of three years or less. Structured securities may be positively or negatively indexed (i.e., their principal value or interest rates may increase or decrease if the underlying reference instrument appreciates) and may have return characteristics similar to direct investments in the underlying reference instrument.
Structured securities may entail a greater degree of market risk than other types of debt securities because the investor bears the risk of the reference instruments. In addition to the credit risk of structured securities and the normal risks of price changes in response to changes in interest rates, the principal amount of structured notes or indexed securities may decrease as a result of changes in the value of the underlying reference instruments. Changes in the daily value of structured securities are recorded as unrealized gains (losses) in the Statements of Operations. When the structured securities mature or are sold, the Fund recognizes a realized gain (loss) on the Statements of Operations.
|
|
77 |
|
P. Distributions from Distributable Earnings
In accordance with the Securities and Exchange Commission’s issuance of Disclosure Update and Simplification, the Funds have presented the total, rather than the components of distributions to shareholders, except for tax return of capital distributions, if any, in the Statements of Changes in Net Assets.
For the year ended October 31, 2017, distributions from distributable earnings for each Fund (except Ultra Short Duration ETF) consisted of distributions from net investment income. For the years ended May 31, 2018 and May 31, 2017, distributions from distributable earnings for Ultra Short Duration ETF consisted of distributions from net investment income.
Note 3. Investment Advisory Agreement and Other Agreements
The Trust has entered into an Investment Advisory Agreements with the Adviser on behalf of each Fund, pursuant to which the Adviser has overall responsibility for the selection and ongoing monitoring of the Funds’ investments, managing the Funds’ business affairs, providing certain clerical, bookkeeping and other administrative services, and for each Fund (except S&P 500® Downside Hedged ETF), oversight of Invesco Advisers, Inc., Invesco Asset Management Deutschland GmbH, Invesco Asset Management Limited, Invesco Asset Management (Japan) Limited, Invesco Hong Kong Limited, Invesco Senior Secured Management, Inc. and Invesco Canada Ltd. (collectively, the “Affiliated Sub-Advisers”).
Pursuant to an Investment Management Agreement, each Fund listed below accrues daily and pays monthly to the Adviser an annual unitary management fee. Out of the unitary management fee, the Adviser has agreed to pay for substantially all expenses of the Funds, including payments to the Affiliated Sub-Advisers for each Fund (except S&P 500® Downside Hedged ETF), and for each Fund the cost of transfer agency, custody, fund administration, legal, audit and other services, except for advisory fees, distribution fees, if any, brokerage expenses, taxes, interest, acquired fund fees and expenses, if any, litigation expenses and other extraordinary expenses. The unitary management fee is paid by each Fund to the Adviser at the following annual rates:
|
% of Average | ||
| Active U.S. Real Estate ETF | 0.35%* | |
| Balanced Multi-Asset Allocation ETF | 0.05% | |
| Conservative Multi-Asset Allocation ETF | 0.05% | |
| Growth Multi-Asset Allocation ETF | 0.05% | |
| Moderately Conservative Multi-Asset Allocation ETF | 0.05% | |
| Multi-Strategy Alternative ETF | 0.95% | |
| S&P 500® Downside Hedged ETF | 0.39% | |
| Variable Rate Investment Grade ETF | 0.30% |
| * | Prior to April 1, 2018, the unitary management fee was 0.80% of average daily net assets. |
Pursuant to another Investment Advisory Agreement, Ultra Short Duration ETF accrues daily and pays monthly to the Adviser an annual management fee equal to 0.20% of the Fund’s average daily net assets.
The Adviser has entered into an Investment Sub-Advisory Agreement with the Affiliated Sub-Advisers for each of Active U.S. Real Estate ETF, Balanced Multi-Asset Allocation ETF, Conservative Multi-Asset Allocation ETF, Growth Multi-Asset Allocation ETF, Moderately Conservative Multi-Asset Allocation ETF, Multi-Strategy Alternative ETF, Ultra Short Duration ETF and Variable Rate Investment Grade ETF. The sub-advisory fee for these Funds is paid by the Adviser to the Affiliated Sub-Advisers at 40% of the Adviser’s compensation of the sub-advised assets of each Fund.
Prior to the Reorganization, the Predecessor Fund to Ultra Short Duration ETF was managed by Guggenheim Funds Investment Advisors LLC (“GFIA”) and the Predecessor Fund paid GFIA an investment advisory fee calculated at the same annualized rate as disclosed above for the Fund. GFIA had entered into a sub-advisory agreement with Guggenheim Partners Investment Management, LLC (“GPIM”) for the Predecessor Fund to Ultra Short Duration ETF. Pursuant to this sub-advisory agreement, GFIA paid GPIM on a monthly basis 50% of the net advisory fees GFIA received from the Fund.
Effective as of the Reorganization, the Adviser has agreed to waive fees and/or pay Fund expenses for Ultra Short Duration ETF to the extent necessary to prevent the operating expenses of the Fund (excluding interest expenses, brokerage commissions and other trading expenses, offering costs, taxes, acquired fund fees and expenses, if any, taxes and extraordinary expenses) from exceeding 0.27% of the Fund’s average daily net assets per year (the “Expense Cap”), through at least December 31, 2020. Prior to the Reorganization, GFIA limited expenses for the Predecessor Fund to the same expense cap.
|
|
78 |
|
Additionally, through at least August 31, 2020, the Adviser has contractually agreed to waive a portion of the Ultra Short Duration ETF’s management fee and/or reimburse Fund expenses for the Fund in an amount equal to 100% of the net advisory fees that an affiliated person of the Adviser (an “Affiliated Person”) or the Adviser receives that are attributable to the Fund’s investments in any other fund managed by such Affiliated Person or the Adviser. This waiver will have the effect of reducing the Acquired Fund Fees and Expense that are indirectly borne by the Fund. The Adviser cannot discontinue this waiver prior to its expiration.
Additionally, through at least August 31, 2020, the Adviser has contractually agreed to waive a portion of all Fund’s, except for Ultra Short Duration ETF, management fee in an amount equal to 100% of the net advisory fees an affiliate of the Adviser receives that are attributable to certain of the Fund’s investments in money market funds managed by that affiliate (excluding investments of cash collateral from securities lending). There is no guarantee that the Adviser will extend the waiver of these fees past that date.
Prior to the Reorganization, GFIA voluntarily agreed to waive the Management Fee and/or reimburse fund expenses of the Predecessor Fund to Ultra Short Duration ETF in an amount equal to the Predecessor Fund’s management fee attributable to the Predecessor Fund’s assets invested in affiliated funds.
For the fiscal year or period ended October 31, 2018, the Adviser waived fees for each Fund in the following amounts:
| Active U.S. Real Estate ETF | $ | 31 | ||
| Balanced Multi-Asset Allocation ETF | 1 | |||
| Conservative Multi-Asset Allocation ETF | 1 | |||
| Growth Multi-Asset Allocation ETF | — | |||
| Moderately Conservative Multi-Asset Allocation ETF | 1 | |||
| Multi-Strategy Alternative ETF | 2,975 | |||
| S&P 500® Downside Hedged ETF | 3,055 | |||
| Ultra Short Duration ETF | — | * | ||
| Variable Rate Investment Grade ETF | 4,545 |
* For the period June 1, 2018 to October 31, 2018
For the period after the close of business April 6, 2018 to May 31, 2018, the Adviser waived fees in the amount of $60,365 for Ultra Short Duration ETF. For the period June 1, 2017 to April 6, 2018, GFIA waived fees in the amount of $29,980 for the Predecessor Fund to Ultra Short Duration ETF.
The fees waived and/or expenses borne by the Adviser for Ultra Short Duration ETF pursuant to the Expense Cap are subject to recapture by the Adviser up to three years from the date the fees were waived or the expenses were incurred, but no recapture payment will be made by the Fund if it would result in the Fund exceeding (i) the Expense Cap or (ii) the expense cap in effect at the time the fees and/or expenses subject to recapture were waived and/or borne by the Adviser. Amounts waived by GFIA prior to the Reorganization are not subject to recapture.
There are no amounts available for potential recapture by the Adviser as of October 31, 2018.
The Trust has entered into a Distribution Agreement with Invesco Distributors, Inc. (the “Distributor”), which serves as the distributor of Creation Units for each Fund. The Distributor does not maintain a secondary market in the Shares. The Funds are not charged any fees pursuant to the Distribution Agreement. The Distributor is an affiliate of the Adviser. Prior to the Reorganization, the Board of Trustees for the Predecessor Fund adopted a distribution and service plan pursuant to Rule 12b-1 under the 1940 Act. No 12b-1 fees were paid by the Predecessor Fund under this plan.
The Trust has entered into service agreements whereby The Bank of New York Mellon, a wholly-owned subsidiary of The Bank of New York Mellon Corporation, serves as the administrator, custodian, fund accountant and transfer agent for each Fund. Prior to the Reorganization, GFIA engaged external service providers to perform these services for the Predecessor Fund.
Note 4. Investments in Affiliates
The Adviser also serves as the adviser for each Underlying Fund listed within the tables below, and therefore the following Underlying Funds are considered to be affiliated with the Funds. The tables below show certain Funds’ transactions in, and earnings from, investments in affiliates (excluding affiliated money market funds) for the fiscal year ended October 31, 2018.
|
|
79 |
|
Balanced Multi-Asset Allocation ETF
| Value October 31, 2017 |
Purchases at Cost |
Proceeds from Sales |
Change in Unrealized Appreciation (Depreciation) |
Realized Gain (Loss) |
Value October 31, 2018 |
Dividend Income |
||||||||||||||||||||||
| Invesco 1-30 Laddered Treasury ETF | $ | 93,436 | $ | 125,597 | $ | (6,948 | ) | $ | (9,924 | ) | $ | (368 | ) | $ | 201,793 | $ | 2,910 | |||||||||||
| Invesco Emerging Markets Sovereign Debt ETF | 53,316 | 61,108 | (5,701 | ) | (8,307 | ) | (455 | ) | 99,961 | 3,224 | ||||||||||||||||||
| Invesco FTSE RAFI Developed Markets ex-U.S. ETF | 107,186 | 151,698 | (11,487 | ) | (22,087 | ) | 537 | 225,847 | 4,002 | |||||||||||||||||||
| Invesco FTSE RAFI Emerging Markets ETF | 33,020 | 29,378 | (11,868 | ) | (3,421 | ) | 1,063 | 48,172 | 1,355 | |||||||||||||||||||
| Invesco FTSE RAFI US 1000 ETF | 192,113 | 191,539 | (39,932 | ) | (1,563 | ) | 2,260 | 344,417 | 4,679 | |||||||||||||||||||
| Invesco FTSE RAFI US 1500 Small-Mid ETF | 59,835 | 139,701 | (8,764 | ) | (9,980 | ) | 453 | 181,245 | 1,185 | |||||||||||||||||||
| Invesco Fundamental High Yield® Corporate Bond ETF | 66,599 | 55,720 | (19,774 | ) | (2,980 | ) | (539 | ) | 99,026 | 3,163 | ||||||||||||||||||
| Invesco Fundamental Investment Grade Corporate Bond ETF | 93,304 | 172,993 | (8,493 | ) | (5,746 | ) | (350 | ) | 251,708 | 4,391 | ||||||||||||||||||
| Invesco Ladder Rite 0-5 Year Corporate Bond ETF* | 186,377 | 7,495 | (190,168 | ) | 726 | (4,430 | ) | — | 1,910 | |||||||||||||||||||
| Invesco Russell Top 200 Pure Growth ETF | 132,780 | 194,250 | (37,254 | ) | 108 | 4,181 | 294,065 | 1,361 | ||||||||||||||||||||
| Invesco S&P 500® Low Volatility ETF | 127,306 | 106,017 | (44,168 | ) | 70 | 2,495 | 191,720 | 3,078 | ||||||||||||||||||||
| Invesco S&P Emerging Markets Low Volatility ETF | 19,975 | 33,314 | (1,624 | ) | (3,639 | ) | 136 | 48,162 | 1,543 | |||||||||||||||||||
| Invesco S&P International Developed Low Volatility ETF | 66,480 | 120,205 | (971 | ) | (12,339 | ) | 34 | 173,409 | 3,892 | |||||||||||||||||||
| Invesco S&P MidCap Low Volatility ETF | 60,115 | 31,798 | (37,008 | ) | (2,000 | ) | 1,808 | 54,713 | 1,290 | |||||||||||||||||||
| Invesco Senior Loan ETF | 39,951 | 27,950 | (17,513 | ) | (20 | ) | (160 | ) | 50,208 | 1,634 | ||||||||||||||||||
| Invesco Variable Rate Investment Grade ETF | — | 370,025 | (12,315 | ) | (1,687 | ) | (64 | ) | 355,959 | 4,504 | ||||||||||||||||||
|
|
|
|
|
|
|
|
|
|
|
|
|
|
|
|||||||||||||||
| Total Investments in Affiliates | $ | 1,331,793 | $ | 1,818,788 | $ | (453,988 | ) | $ | (82,789 | ) | $ | 6,601 | $ | 2,620,405 | $ | 44,121 | ||||||||||||
|
|
|
|
|
|
|
|
|
|
|
|
|
|
|
|||||||||||||||
| * | At October 31, 2018, this security was no longer held. |
Conservative Multi-Asset Allocation ETF
| Value October 31, 2017 |
Purchases at Cost |
Proceeds from Sales |
Change in Unrealized Appreciation (Depreciation) |
Realized Gain (Loss) |
Value October 31, 2018 |
Dividend Income |
||||||||||||||||||||||
| Invesco 1-30 Laddered Treasury ETF | $ | 64,463 | $ | 23,345 | $ | (2,915 | ) | $ | (4,370 | ) | $ | (63 | ) | $ | 80,460 | $ | 1,579 | |||||||||||
| Invesco Emerging Markets Sovereign Debt ETF | 77,219 | 8,469 | (3,600 | ) | (9,148 | ) | (222 | ) | 72,718 | 3,409 | ||||||||||||||||||
| Invesco FTSE RAFI Developed Markets ex-U.S. ETF | 32,353 | 9,100 | (3,870 | ) | (4,096 | ) | 336 | 33,823 | 1,050 | |||||||||||||||||||
| Invesco FTSE RAFI US 1000 ETF | 89,595 | 5,887 | (24,903 | ) | 1,004 | 1,942 | 73,525 | 1,640 | ||||||||||||||||||||
| Invesco Fundamental High Yield® Corporate Bond ETF | 103,042 | 10,390 | (1,794 | ) | (4,646 | ) | (45 | ) | 106,947 | 4,386 | ||||||||||||||||||
| Invesco Fundamental Investment Grade Corporate Bond ETF | 193,146 | 13,656 | (2,237 | ) | (8,766 | ) | (99 | ) | 195,700 | 5,404 | ||||||||||||||||||
| Invesco Ladder Rite 0-5 Year Corporate Bond ETF* | 282,942 | 2,409 | (279,847 | ) | 1,114 | (6,618 | ) | — | 2,862 | |||||||||||||||||||
| Invesco Preferred ETF | 77,089 | 29,730 | (2,883 | ) | (5,602 | ) | (68 | ) | 98,266 | 4,925 | ||||||||||||||||||
| Invesco Pure BetaSM 0-5 Yr US TIPS ETF | — | 93,373 | (1,050 | ) | (1,313 | ) | (18 | ) | 90,992 | 1,828 | ||||||||||||||||||
| Invesco Russell Top 200 Pure Growth ETF | 60,813 | 13,073 | (16,134 | ) | 4,373 | 2,369 | 64,494 | 477 | ||||||||||||||||||||
|
|
80 |
|
| Value October 31, 2017 |
Purchases at Cost |
Proceeds from Sales |
Change in Unrealized Appreciation (Depreciation) |
Realized Gain (Loss) |
Value October 31, 2018 |
Dividend Income |
||||||||||||||||||||||
| Invesco S&P 500® Low Volatility ETF | $ | 55,045 | $ | 1,522 | $ | (11,495 | ) | $ | 637 | $ | 985 | $ | 46,694 | $ | 1,072 | |||||||||||||
| Invesco S&P International Developed Low Volatility ETF | 19,275 | 11,716 | (1,023 | ) | (2,334 | ) | 84 | 27,718 | 970 | |||||||||||||||||||
| Invesco Senior Loan ETF | 102,953 | 9,349 | (4,238 | ) | (476 | ) | (39 | ) | 107,549 | 4,139 | ||||||||||||||||||
| Invesco Variable Rate Investment Grade ETF | — | 256,097 | (4,633 | ) | (1,393 | ) | (21 | ) | 250,050 | 3,721 | ||||||||||||||||||
|
|
|
|
|
|
|
|
|
|
|
|
|
|
|
|||||||||||||||
| Total Investments in Affiliates | $ | 1,157,935 | $ | 488,116 | $ | (360,622 | ) | $ | (35,016 | ) | $ | (1,477 | ) | $ | 1,248,936 | $ | 37,462 | |||||||||||
|
|
|
|
|
|
|
|
|
|
|
|
|
|
|
|||||||||||||||
| * | At October 31, 2018, this security was no longer held. |
Growth Multi-Asset Allocation ETF
| Value October 31, 2017 |
Purchases at Cost |
Proceeds from Sales |
Change in Unrealized Appreciation (Depreciation) |
Realized Gain (Loss) |
Value October 31, 2018 |
Dividend Income |
||||||||||||||||||||||
| Invesco 1-30 Laddered Treasury ETF | $ | 54,360 | $ | 105,601 | $ | (6,668 | ) | $ | (5,663 | ) | $ | (374 | ) | $ | 147,256 | $ | 1,854 | |||||||||||
| Invesco Emerging Markets Sovereign Debt ETF | 33,915 | 20,460 | (19,477 | ) | (2,824 | ) | (1,044 | ) | 31,030 | 1,310 | ||||||||||||||||||
| Invesco FTSE RAFI Developed Markets ex-U.S. ETF | 156,835 | 194,923 | (19,453 | ) | (31,631 | ) | 935 | 301,609 | 5,539 | |||||||||||||||||||
| Invesco FTSE RAFI Emerging Markets ETF | 47,045 | 52,199 | (11,173 | ) | (6,376 | ) | 889 | 82,584 | 2,235 | |||||||||||||||||||
| Invesco FTSE RAFI US 1000 ETF | 249,563 | 236,962 | (57,582 | ) | (3,350 | ) | 3,282 | 428,875 | 5,939 | |||||||||||||||||||
| Invesco FTSE RAFI US 1500 Small-Mid ETF | 87,978 | 140,417 | (8,744 | ) | (10,011 | ) | 466 | 210,106 | 1,467 | |||||||||||||||||||
| Invesco Fundamental Investment Grade Corporate Bond ETF | 71,228 | 102,384 | (7,622 | ) | (3,678 | ) | (335 | ) | 161,977 | 2,789 | ||||||||||||||||||
| Invesco Ladder Rite 0-5 Year Corporate Bond ETF* | 112,015 | 5,711 | (115,480 | ) | 441 | (2,687 | ) | — | 1,154 | |||||||||||||||||||
| Invesco Russell Top 200 Pure Growth ETF | 170,622 | 260,321 | (42,390 | ) | 302 | 5,060 | 393,915 | 1,808 | ||||||||||||||||||||
| Invesco S&P 500® Low Volatility ETF | 161,971 | 140,489 | (55,450 | ) | 1,172 | 2,854 | 251,036 | 3,768 | ||||||||||||||||||||
| Invesco S&P Emerging Markets Low Volatility ETF | 30,504 | 55,469 | (2,722 | ) | (6,670 | ) | 101 | 76,682 | 2,446 | |||||||||||||||||||
| Invesco S&P International Developed Low Volatility ETF | 94,710 | 175,083 | (486 | ) | (18,873 | ) | 15 | 250,449 | 5,638 | |||||||||||||||||||
| Invesco S&P MidCap Low Volatility ETF | 44,175 | 39,814 | (14,106 | ) | (529 | ) | 562 | 69,916 | 1,170 | |||||||||||||||||||
| Invesco S&P SmallCap Low Volatility ETF | 40,644 | 48,452 | (4,834 | ) | (3,609 | ) | 180 | 80,833 | 1,141 | |||||||||||||||||||
| Invesco Variable Rate Investment Grade ETF | — | 214,478 | (9,636 | ) | (879 | ) | (50 | ) | 203,913 | 2,340 | ||||||||||||||||||
|
|
|
|
|
|
|
|
|
|
|
|
|
|
|
|||||||||||||||
| Total Investments in Affiliates | $ | 1,355,565 | $ | 1,792,763 | $ | (375,823 | ) | $ | (92,178 | ) | $ | 9,854 | $ | 2,690,181 | $ | 40,598 | ||||||||||||
|
|
|
|
|
|
|
|
|
|
|
|
|
|
|
|||||||||||||||
| * | At October 31, 2018, this security was no longer held. |
|
|
81 |
|
Moderately Conservative Multi-Asset Allocation ETF
| Value October 31, 2017 |
Purchases at Cost |
Proceeds from Sales |
Change in Unrealized Appreciation (Depreciation) |
Realized Gain (Loss) |
Value October 31, 2018 |
Dividend Income |
||||||||||||||||||||||
| Invesco 1-30 Laddered Treasury ETF | $ | 91,871 | $ | 7,030 | $ (6,812) | $ | (5,523 | ) | $ | (236 | ) | $ | 86,330 | $ | 1,944 | |||||||||||||
| Invesco Emerging Markets Sovereign Debt ETF | 65,460 | 19,493 | (2,367 | ) | (8,488 | ) | (204 | ) | 73,894 | 3,218 | ||||||||||||||||||
| Invesco FTSE RAFI Developed Markets ex-U.S. ETF | 81,689 | 19,048 | (8,298 | ) | (9,997 | ) | 716 | 83,158 | 2,620 | |||||||||||||||||||
| Invesco FTSE RAFI US 1000 ETF | 132,927 | 7,237 | (21,245 | ) | 2,528 | 1,726 | 123,173 | 2,604 | ||||||||||||||||||||
| Invesco FTSE RAFI US 1500 Small-Mid ETF | 39,299 | 5,788 | (5,430 | ) | 271 | 349 | 40,277 | 482 | ||||||||||||||||||||
| Invesco Fundamental High Yield® Corporate Bond ETF | 78,638 | 20,627 | (2,530 | ) | (3,703 | ) | (70 | ) | 92,962 | 3,613 | ||||||||||||||||||
| Invesco Fundamental Investment Grade Corporate Bond ETF | 170,455 | 8,670 | (22,276 | ) | (7,000 | ) | (680 | ) | 149,169 | 4,445 | ||||||||||||||||||
| Invesco Ladder Rite 0-5 Year Corporate Bond ETF* | 196,444 | 4,645 | (197,231 | ) | 772 | (4,630 | ) | — | 1,997 | |||||||||||||||||||
| Invesco Preferred ETF | 52,330 | 28,523 | (1,804 | ) | (4,076 | ) | (61 | ) | 74,912 | 3,597 | ||||||||||||||||||
| Invesco Pure BetaSM 0-5 Yr US TIPS ETF | — | 71,146 | (1,318 | ) | (991 | ) | (24 | ) | 68,813 | 1,391 | ||||||||||||||||||
| Invesco Russell Top 200 Pure Growth ETF | 92,371 | 26,897 | (23,926 | ) | 6,960 | 3,473 | 105,775 | 762 | ||||||||||||||||||||
| Invesco S&P 500® Low Volatility ETF | 88,686 | 1,804 | (26,529 | ) | 221 | 2,140 | 66,322 | 1,639 | ||||||||||||||||||||
| Invesco S&P International Developed Low Volatility ETF | 49,635 | 26,234 | (1,413 | ) | (5,720 | ) | 130 | 68,866 | 2,438 | |||||||||||||||||||
| Invesco S&P MidCap Low Volatility ETF | 39,401 | 1,058 | (23,278 | ) | (775 | ) | 1,292 | 17,698 | 753 | |||||||||||||||||||
| Invesco Senior Loan ETF | 65,522 | 2,189 | (4,587 | ) | (264 | ) | (43 | ) | 62,817 | 2,533 | ||||||||||||||||||
| Invesco Variable Rate Investment Grade ETF | — | 167,006 | (4,256 | ) | (899 | ) | (22 | ) | 161,829 | 2,425 | ||||||||||||||||||
|
|
|
|
|
|
|
|
|
|
|
|
|
|
|
|||||||||||||||
| Total Investments in Affiliates | $ | 1,244,728 | $ | 417,395 | $(353,300) | $(36,684) | $ | 3,856 | $ | 1,275,995 | $ | 36,461 | ||||||||||||||||
|
|
|
|
|
|
|
|
|
|
|
|
|
|
|
|||||||||||||||
The Adviser is a wholly-owned subsidiary of Invesco Ltd. and therefore, Invesco Ltd. is considered to be affiliated with the Funds. The table below shows S&P 500® Downside Hedged ETF’s transactions in, and earnings from, investments in affiliates (excluding affiliated money market funds) for the fiscal year ended October 31, 2018.
S&P 500® Downside Hedged ETF
| Value October 31, 2017 |
Purchases at Cost |
Proceeds from Sales |
Change in Unrealized Appreciation (Depreciation) |
Realized Gain |
Value October 31, 2018 |
Dividend Income |
||||||||||||||||||||||
| Invesco Ltd. | $ | 16,463 | $ | — | $ | — | $ | (6,476 | ) | $ | — | $ | 9,987 | $ | 543 | |||||||||||||
Note 5. Additional Valuation Information
GAAP defines fair value as the price that would be received to sell an asset or paid to transfer a liability in an orderly transaction between market participants at the measurement date, under current market conditions. GAAP establishes a hierarchy that prioritizes the inputs to valuation methods, giving the highest priority to readily available unadjusted quoted prices in an active market for identical assets (Level 1) and the lowest priority to significant unobservable inputs (Level 3), generally when market prices are not readily available or are unreliable. Based on the valuation inputs, the securities or other investments are tiered into one of three levels. Changes in valuation methods may result in transfers in or out of an investment’s assigned level:
| Level 1 — | Prices are determined using quoted prices in an active market for identical assets. |
| Level 2 — | Prices are determined using other significant observable inputs. Observable inputs are inputs that other market participants may use in pricing a security. These may include quoted prices for similar securities, interest rates, prepayment speeds, credit risk, yield curves, loss severities, default rates, discount rates, volatilities and others. |
|
|
82 |
|
| Level 3 — | Prices are determined using significant unobservable inputs. In situations where quoted prices or observable inputs are unavailable (for example, when there is little or no market activity for an investment at the end of the period), unobservable inputs may be used. Unobservable inputs reflect a Fund’s own assumptions about the factors market participants would use in determining fair value of the securities or instruments and would be based on the best available information. |
Except for certain Funds listed below, as of October 31, 2018, all of the securities in each Fund were valued based on Level 1 inputs (see the Schedules of Investments for security categories). The level assigned to the securities valuations may not be an indication of the risk or liquidity associated with investing in those securities. Because of the inherent uncertainties of valuation, the values reflected in the financial statements may materially differ from the value received upon actual sale of those investments.
| Investments in Securities | ||||||||||||||||
| Level 1 | Level 2 | Level 3 | Total | |||||||||||||
| Multi-Strategy Alternative Portfolio | ||||||||||||||||
| Investments in Securities | ||||||||||||||||
| Equity Securities |
$ | 1,608,290 | $ | — | $ | — | $ | 1,608,290 | ||||||||
| Money Market Fund |
2,398,450 | — | — | 2,398,450 | ||||||||||||
| Other Investments-Assets(a) |
||||||||||||||||
| Forward Foreign Currency Contracts |
— | 2,592 | — | 2,592 | ||||||||||||
| Futures |
120,005 | — | — | 120,005 | ||||||||||||
|
|
|
|
|
|
|
|
|
|||||||||
| Total Investments |
$ | 4,126,745 | $ | 2,592 | $ | — | $ | 4,129,337 | ||||||||
|
|
|
|
|
|
|
|
|
|||||||||
| S&P 500® Downside Hedged ETF | ||||||||||||||||
| Equity Securities |
$ | 19,870,657 | $ | — | $ | — | $ | 19,870,657 | ||||||||
| Money Market Fund |
4,575,057 | — | — | 4,575,057 | ||||||||||||
| Other Investments-Assets(a) |
||||||||||||||||
| Futures |
214,476 | — | — | 214,476 | ||||||||||||
|
|
|
|
|
|
|
|
|
|||||||||
| Total Investments |
$ | 24,660,190 | $ | — | $ | — | $ | 24,660,190 | ||||||||
|
|
|
|
|
|
|
|
|
|||||||||
| Ultra Short Duration ETF | ||||||||||||||||
| Corporate Bonds and Notes |
$ | — | $ | 798,597,569 | $ | — | $ | 798,597,569 | ||||||||
| Asset-Backed Securities |
— | 152,377,453 | — | 152,377,453 | ||||||||||||
| U.S. Treasury Securities |
— | 72,671,719 | — | 72,671,719 | ||||||||||||
| Sovereign Debt Obligations |
— | 53,203,134 | — | 53,203,134 | ||||||||||||
| Commercial Mortgage-Backed Securities |
— | 41,659,862 | — | 41,659,862 | ||||||||||||
| Collateralized Mortgage Obligations |
— | 7,821,979 | — | 7,821,979 | ||||||||||||
| Variable Rate Senior Loan Interests |
— | 5,672,984 | — | 5,672,984 | ||||||||||||
| Commercial Paper |
— | 427,904,797 | — | 427,904,797 | ||||||||||||
| Repurchase Agreements |
— | 35,000,000 | — | 35,000,000 | ||||||||||||
|
|
|
|
|
|
|
|
|
|||||||||
| Total Investments in Securities |
— | 1,594,909,497 | — | 1,594,909,497 | ||||||||||||
|
|
|
|
|
|
|
|
|
|||||||||
| Other Investments-Assets(a) |
||||||||||||||||
| Forward Foreign Currency Contracts |
$ | — | $ | 80,259 | $ | — | $ | 80,259 | ||||||||
|
|
|
|
|
|
|
|
|
|||||||||
| Other Investments-Liabilities(a) |
||||||||||||||||
| Forward Foreign Currency Contracts |
— | (52,676 | ) | — | (52,676 | ) | ||||||||||
|
|
|
|
|
|
|
|
|
|||||||||
| Total Other Investments |
— | 27,583 | — | 27,583 | ||||||||||||
|
|
|
|
|
|
|
|
|
|||||||||
| Total Investments |
$ | — | $ | 1,594,937,080 | $ | — | $ | 1,594,937,080 | ||||||||
|
|
|
|
|
|
|
|
|
|||||||||
| Variable Rate Investment Grade ETF | ||||||||||||||||
| Investments in Securities | ||||||||||||||||
| Corporate Bonds and Notes |
$ | — | $ | 186,474,487 | $ | — | $ | 186,474,487 | ||||||||
| U.S. Agency Mortgage Credit Risk Transfer |
— | 96,438,986 | — | 96,438,986 | ||||||||||||
| Commercial Mortgage-Backed Securities |
— | 53,998,294 | — | 53,998,294 | ||||||||||||
| U.S. Treasury Securities |
— | 48,247,215 | — | 48,247,215 | ||||||||||||
| U.S. Government Sponsored Agency Mortgage-Backed Securities |
— | 27,986,397 | — | 27,986,397 | ||||||||||||
| Asset-Backed Securities |
— | 23,022,188 | — | 23,022,188 | ||||||||||||
| Collateralized Mortgage Obligations |
— | 9,853,451 | — | 9,853,451 | ||||||||||||
| Money Market Fund |
131,672 | — | — | 131,672 | ||||||||||||
|
|
|
|
|
|
|
|
|
|||||||||
| Total Investments |
$ | 131,672 | $ | 446,021,018 | $ | — | $ | 446,152,690 | ||||||||
|
|
|
|
|
|
|
|
|
|||||||||
| (a) | Unrealized appreciation (depreciation). |
|
|
83 |
|
Note 6. Derivative Investments
The Funds may enter into an International Swaps and Derivatives Association Master Agreement (“ISDA Master Agreement”) under which a Fund may trade OTC derivatives. An OTC transaction entered into under an ISDA Master Agreement typically involves a collateral posting arrangement, payment netting provisions and close-out netting provisions. These netting provisions allow for reduction of credit risk through netting of contractual obligations. The enforceability of the netting provisions of the ISDA Master Agreement depends on the governing law of the ISDA Master Agreement, among other factors.
For financial reporting purposes, the Funds do not offset OTC derivative assets or liabilities that are subject to ISDA Master Agreements in the Statements of Assets and Liabilities.
Value of Derivative Investments at Period-End
The table below summarizes the value of each Fund’s derivative investments, detailed by primary risk exposure, held as of October 31, 2018:
| Value | ||||||||||||||||||||||||||||||||||||||||||||||||
| Invesco Multi-Strategy Alternative ETF | Invesco S&P 500® Downside Hedged ETF | Invesco Ultra Short Duration ETF | ||||||||||||||||||||||||||||||||||||||||||||||
| Derivative Assets |
Currency Risk |
Equity Risk |
Interest Rate Risk |
Total | Currency Risk |
Equity Risk |
Interest Rate Risk |
Total | Currency Risk |
Equity Risk |
Interest Rate Risk |
Total | ||||||||||||||||||||||||||||||||||||
| Unrealized appreciation on forward foreign currency contracts outstanding(a) |
$ | 17,527 | $ | — | $ | — | $ | 17,527 | $ | — | $ | — | $ | — | $ | — | $ | 80,259 | $ | — | $ | — | $ | 80,259 | ||||||||||||||||||||||||
| Unrealized appreciation on futures contracts—Exchange-Traded(b) | — | 136,016 | — | 136,016 | — | 214,476 | — | 214,476 | — | — | — | — | ||||||||||||||||||||||||||||||||||||
| Total Derivative Assets | 17,527 | 136,016 | — | 153,543 | — | 214,476 | — | 214,476 | 80,259 | — | — | 80,259 | ||||||||||||||||||||||||||||||||||||
| Derivatives not subject to master netting agreements | — | (136,016 | ) | — | (136,016 | ) | — | (214,476 | ) | — | (214,476 | ) | — | — | — | — | ||||||||||||||||||||||||||||||||
|
|
|
|
|
|
|
|
|
|
|
|
|
|
|
|
|
|
|
|
|
|
|
|
|
|||||||||||||||||||||||||
| Total Derivative Assets subject to master netting agreements | $ | 17,527 | $ | — | $ | — | $ | 17,527 | $ | — | $ | — | $ | — | $ | — | $ | 80,259 | $ | — | $ | — | $ | 80,259 | ||||||||||||||||||||||||
|
|
|
|
|
|
|
|
|
|
|
|
|
|
|
|
|
|
|
|
|
|
|
|
|
|||||||||||||||||||||||||
| Value | ||||||||||||||||||||||||||||||||||||||||||||||||
| Invesco Multi-Strategy Alternative ETF | Invesco S&P 500® Downside Hedged ETF | Invesco Ultra Short Duration ETF | ||||||||||||||||||||||||||||||||||||||||||||||
| Derivative Liabilities |
Currency Risk |
Equity Risk |
Interest Rate Risk |
Total | Currency Risk |
Equity Risk |
Interest Rate Risk |
Total | Currency Risk |
Equity Risk |
Interest Rate Risk |
Total | ||||||||||||||||||||||||||||||||||||
| Unrealized depreciation forward foreign currency contracts outstanding(a) | $ | (14,935 | ) | $ | — | $ | — | $ | (14,935 | ) | $ | — | $ | — | $ | — | $ | — | $ | (52,676 | ) | $ | — | $ | — | $ | (52,676 | ) | ||||||||||||||||||||
| Unrealized depreciation on futures contracts—Exchange-Traded(b) | — | (5,240 | ) | (10,771 | ) | (16,011 | ) | — | — | — | — | — | — | — | — | |||||||||||||||||||||||||||||||||
| Total Derivative Liabilities | (14,935 | ) | (5,240 | ) | (10,771 | ) | (30,946 | ) | — | — | — | — | (52,676 | ) | — | — | (52,676 | ) | ||||||||||||||||||||||||||||||
| Derivatives not subject to master netting agreements | — | 5,240 | 10,771 | 16,011 | — | — | — | — | — | — | — | — | ||||||||||||||||||||||||||||||||||||
|
|
|
|
|
|
|
|
|
|
|
|
|
|
|
|
|
|
|
|
|
|
|
|
|
|||||||||||||||||||||||||
| Total Derivative Liabilities subject to master netting agreements | $ | (14,935 | ) | $ | — | $ | — | $ | (14,935 | ) | $ | — | $ | — | $ | — | $ | — | $ | (52,676 | ) | $ | — | $ | — | $ | (52,676 | ) | ||||||||||||||||||||
|
|
|
|
|
|
|
|
|
|
|
|
|
|
|
|
|
|
|
|
|
|
|
|
|
|||||||||||||||||||||||||
| (a) | Values are disclosed on the Statements of Assets and Liabilities under the caption Unrealized appreciation on forward foreign currency contracts outstanding and Unrealized depreciation on forward foreign currency contracts outstanding. |
| (b) | Values are disclosed on the Statements of Assets and Liabilities under the caption Unrealized appreciation on futures contracts and Unrealized depreciation on futures contracts. |
Offsetting Assets and Liabilities
The table below reflects the Fund’s exposure to Counterparties subject to either an ISDA Master Agreement or other agreement for OTC derivative transactions as of October 31, 2018:
Multi-Strategy Alternative ETF
| Financial Derivative Assets |
Financial Derivative Liabilities |
Collateral (Received)/Pledged |
||||||||||||||||||||||
| Counterparty |
Forward foreign currency contracts |
Forward foreign currency contracts |
Net Value of Derivatives |
Non-Cash | Cash | Net Amount | ||||||||||||||||||
| Morgan Stanley | $ | 17,527 | $ | (14,935 | ) | $ | 2,592 | $ | — | $ | — | $ | 2,592 | |||||||||||
|
|
84 |
|
Ultra Short Duration ETF
| Financial Derivative Assets |
Financial Derivative Liabilities |
Collateral (Received)/Pledged |
||||||||||||||||||||||
| Counterparty |
Forward foreign currency contracts |
Forward foreign currency contracts |
Net Value of Derivatives |
Non-Cash | Cash | Net Amount | ||||||||||||||||||
| JP Morgan | $ | 80,259 | $ | (31,475) | $ | 48,784 | $ | — | $ | — | $ | 48,784 | ||||||||||||
| Bank of America | — | (21,201 | ) | (21,201 | ) | — | — | (21,201 | ) | |||||||||||||||
|
|
|
|
|
|
|
|
|
|
|
|
|
|||||||||||||
| Total | $ | 80,259 | $ | (52,676 | ) | $ | 27,583 | $ | — | $ | — | $ | 27,583 | |||||||||||
|
|
|
|
|
|
|
|
|
|
|
|
|
|||||||||||||
Effect of Derivative Investments for the Fiscal Year or Period Ended October 31, 2018.
The table below summarizes each Fund’s gains (losses) on derivative investments, detailed by primary risk exposure, recognized in earnings during the period:
| Location of Gain (Loss) on Statements of Operations | ||||||||||||||||||||||||||||||||||||||||||||||||
| Invesco Multi-Strategy Alternative ETF | Invesco S&P 500® Downside Hedged ETF | Invesco Ultra Short Duration ETF | ||||||||||||||||||||||||||||||||||||||||||||||
| Currency Risk |
Equity Risk |
Interest Rate Risk |
Total | Currency Risk |
Equity Risk |
Interest Rate Risk |
Total | Currency Risk |
Equity Risk |
Interest Rate Risk |
Total | |||||||||||||||||||||||||||||||||||||
| Realized Gain (Loss): | ||||||||||||||||||||||||||||||||||||||||||||||||
| Forward foreign currency contracts |
$ | (63,733 | ) | $ | — | $ | — | $ | (63,733 | ) | $ | — | $ | — | $ | — | $ | — | $ | — | $ | — | $ | — | $ | — | ||||||||||||||||||||||
| Futures contracts |
— | (199,101 | ) | 98,189 | (100,912 | ) | — | 148,050 | — | 148,050 | — | — | — | — | ||||||||||||||||||||||||||||||||||
| Change in Net Unrealized Appreciation (Depreciation): | ||||||||||||||||||||||||||||||||||||||||||||||||
| Forward foreign currency contracts |
15,516 | — | — | 15,516 | — | — | — | — | 27,583 | — | — | 27,583 | ||||||||||||||||||||||||||||||||||||
| Futures contracts |
— | 205,482 | (14,483 | ) | 190,999 | — | 329,460 | — | 329,460 | — | — | — | — | |||||||||||||||||||||||||||||||||||
|
|
|
|
|
|
|
|
|
|
|
|
|
|
|
|
|
|
|
|
|
|
|
|
|
|||||||||||||||||||||||||
| Total | $ | (48,217 | ) | $ | 6,381 | $ | 83,706 | $ | 41,870 | $ | — | $ | 477,510 | $ | — | $ | 477,510 | $ | 27,583 | $ | — | $ | — | $ | 27,583 | |||||||||||||||||||||||
|
|
|
|
|
|
|
|
|
|
|
|
|
|
|
|
|
|
|
|
|
|
|
|
|
|||||||||||||||||||||||||
The table below summarizes the average notional value of futures contracts and forward foreign currency contracts outstanding during the period.
| Average Notional Value | ||||||||||||
| Multi-Strategy Alternative ETF |
S&P 500 Downside Hedged ETF |
Ultra Short Duration ETF |
||||||||||
| Forward foreign currency contracts | $ | 3,011,081 | $ | — | $ | 8,942,037 | ||||||
| Futures contracts | 14,248,120 | 1,541,123 | — | |||||||||
Note 7. Distributions to Shareholders and Tax Components of Net Assets
Tax Character of Distributions to Shareholder Paid during the Fiscal Years ended October 31, 2018 and 2017:
| 2018 | 2017 | |||||||||||||||||||||||
| Ordinary Income |
Long-Term Capital Gains |
Return of Capital |
Ordinary Income |
Long-Term Capital Gains |
Return of Capital |
|||||||||||||||||||
| Active U.S. Real Estate Fund | $ | 457,566 | $ | — | $ | — | $ | 589,233 | $ | 1,266 | $ | — | ||||||||||||
| Balanced Multi-Asset Allocation ETF | 41,471 | — | — | 12,311 | — | — | ||||||||||||||||||
| Conservative Multi-Asset Allocation ETF | 43,324 | — | — | 15,039 | — | — | ||||||||||||||||||
| Growth Multi-Asset Allocation ETF | 37,124 | — | — | 10,708 | — | — | ||||||||||||||||||
| Moderately Conservative Multi-Asset Allocation ETF | 40,004 | — | — | 14,014 | — | — | ||||||||||||||||||
| Multi-Strategy Alternative ETF | 19,198 | — | — | 103,497 | — | — | ||||||||||||||||||
| S&P 500® Downside Hedged ETF | 438,757 | — | — | 1,490,388 | — | — | ||||||||||||||||||
| Variable Rate Investment Grade ETF | 8,510,280 | — | — | 1,574,248 | — | 16,962 | ||||||||||||||||||
|
|
85 |
|
Tax Character of Distributions to Shareholder Paid for Ultra Short Duration ETF during the Period June 1, 2018 to October 31, 2018, Fiscal Year ended May 31, 2018 and Fiscal Year ended May 31, 2017:
| October 31, 2018 | May 31, 2018 | May 31, 2017 | ||||||||||||||||||||||||||||||||||
| Ordinary Income |
Long-Term Capital Gains |
Return of Capital |
Ordinary Income |
Long-Term Capital Gains |
Return of Capital |
Ordinary Income |
Long-Term Capital Gains |
Return of Capital |
||||||||||||||||||||||||||||
| Ultra Short Duration ETF | $ | 15,247,637 | $ | — | $ | — | $ | 22,054,804 | $ | — | $ | — | $ | 12,249,300 | $ | — | $ | — | ||||||||||||||||||
Tax Components of Net Assets at Fiscal Year-End:
| Undistributed Ordinary Income |
Undistributed Long-Term Capital Gains |
Net Unrealized Appreciation (Depreciation)— Investments |
Net Unrealized Appreciation (Depreciation)— Foreign Currencies |
Capital Loss Carryforwards |
Shares of Beneficial Interest |
Total Net Assets |
||||||||||||||||||||||
| Active U.S. Real Estate Fund | $ | 128,523 | $ | — | $ | 975,662 | $ | — | $ | (507,245 | ) | $ | 27,209,825 | $ | 27,806,765 | |||||||||||||
| Balanced Multi-Asset Allocation ETF | 20,587 | 1,798 | (11,374 | ) | — | — | 2,609,391 | 2,620,402 | ||||||||||||||||||||
| Conservative Multi-Asset Allocation ETF | 7,719 | — | (6,105 | ) | — | (2,574 | ) | 1,249,994 | 1,249,034 | |||||||||||||||||||
| Growth Multi-Asset Allocation ETF | 23,410 | 3,583 | 3,399 | — | — | 2,660,374 | 2,690,766 | |||||||||||||||||||||
| Moderately Conservative Multi-Asset Allocation ETF | 11,546 | — | 14,826 | — | — | 1,250,012 | 1,276,384 | |||||||||||||||||||||
| Multi-Strategy Alternative ETF | — | (82,519 | ) | — | (1,315,620 | ) | 5,768,246 | 4,370,107 | ||||||||||||||||||||
| S&P 500® Downside Hedged ETF | 54,928 | — | — | (77,327,667 | ) | 103,795,485 | 26,522,746 | |||||||||||||||||||||
| Ultra Short Duration ETF | 1,708,667 | 207,907 | 975,504 | (20 | ) | — | 1,608,663,248 | 1,611,555,306 | ||||||||||||||||||||
| Variable Rate Investment Grade ETF | — | (908,425 | ) | — | (1,047,695 | ) | 449,824,137 | 447,868,017 | ||||||||||||||||||||
Capital loss carryforwards are calculated and reported as of a specific date. Results of transactions and other activity after that date may affect the amount of capital loss carryforwards actually available for the Funds to utilize. The ability to utilize capital loss carryforwards in the future may be limited under the Internal Revenue Code and related regulations based on the results of future transactions.
The following table presents available capital loss carryforwards and expiration dates for each Fund as of October 31, 2018:
| Post-effective/no expiration | ||||||||||||
| Short-Term | Long-Term | Total* | ||||||||||
| Active U.S. Real Estate Fund | $ | 507,245 | $ | — | $ | 507,245 | ||||||
| Balanced Multi-Asset Allocation ETF | — | — | — | |||||||||
| Conservative Multi-Asset Allocation ETF | — | 2,574 | 2,574 | |||||||||
| Growth Multi-Asset Allocation ETF | — | — | — | |||||||||
| Moderately Conservative Multi-Asset Allocation ETF | — | — | — | |||||||||
| Multi-Strategy Alternative ETF | 288,950 | 1,026,670 | 1,315,620 | |||||||||
| S&P 500® Downside Hedged ETF | 24,741,508 | 52,586,159 | 77,327,667 | |||||||||
| Ultra Short Duration ETF | — | — | — | |||||||||
| Variable Rate Investment Grade ETF | 747,871 | 299,824 | 1,047,695 | |||||||||
| * | Capital loss carryforwards as of the date listed above are reduced for limitations, if any, to the extent required by the Internal Revenue Code and may be further limited depending upon a variety of factors, including the realization of net unrealized gains or losses as of the date of any reorganization. |
|
|
86 |
|
Note 8. Investment Transactions
For the fiscal year or period ended October 31, 2018, the cost of securities purchased and proceeds from sales of securities (other than short-term securities, U.S. Treasury obligations, money market funds and in-kind transactions, if any) were as follows:
| Purchases | Sales | |||||||
| Active U.S. Real Estate ETF | $ | 23,218,334 | $ | 22,877,142 | ||||
| Balanced Multi-Asset Allocation ETF | 459,569 | 453,991 | ||||||
| Conservative Multi-Asset Allocation ETF | 490,603 | 490,393 | ||||||
| Growth Multi-Asset Allocation ETF | 382,457 | 375,823 | ||||||
| Moderately Conservative Multi-Asset Allocation ETF | 419,448 | 420,163 | ||||||
| Multi-Strategy Alternative ETF | 2,614,463 | 2,797,632 | ||||||
| S&P 500® Downside Hedged ETF | 115,447,785 | 118,650,072 | ||||||
| Ultra Short Duration ETF* | 415,161,084 | 45,550,245 | ||||||
| Variable Rate Investment Grade ETF | 347,322,419 | 65,566,794 | ||||||
| * | For the period June 1, 2018 through October 31, 2018. |
For the period June 1, 2018 to October 31, 2018, the cost of securities purchased and proceeds from sales of U.S. Treasury obligations (other than short-term securities, money market funds and in-kind transactions), for Ultra Short Duration ETF amounted to $72,892,031 and $0, respectively. For the fiscal year ended October 31, 2018, the cost of securities purchased and proceeds from sales of U.S. Treasury obligations (other than short-term securities, money market funds and in-kind transactions), for Variable Rate Investment Grade ETF amounted to $47,910,060 and $12,475,954, respectively.
For the fiscal year or period ended October 31, 2018, in-kind transactions associated with creations and redemptions were as follows:
| Cost of Securities Received |
Value of Securities Delivered |
|||||||
| Active U.S. Real Estate ETF | $ | 8,187,169 | $ | 3,912,194 | ||||
| Balanced Multi-Asset Allocation ETF | 1,359,218 | — | ||||||
| Conservative Multi-Asset Allocation ETF | — | — | ||||||
| Growth Multi-Asset Allocation ETF | 1,410,305 | — | ||||||
| Moderately Conservative Multi-Asset Allocation ETF | — | — | ||||||
| Multi-Strategy Alternative ETF | — | — | ||||||
| S&P 500® Downside Hedged ETF | 5,160,091 | 4,000,912 | ||||||
| Ultra Short Duration ETF* | — | — | ||||||
| Variable Rate Investment Grade ETF | — | — | ||||||
| * | For the period June 1, 2018 through October 31, 2018. |
Gains (losses) on in-kind transactions are generally not considered taxable gains (losses) for federal income tax purposes.
At October 31, 2018, the aggregate cost of investments, including any derivatives, on a tax basis includes adjustments for financial reporting purposes as of the most recently completed federal income tax reporting period-end:
| Gross Unrealized Appreciation |
Gross Unrealized (Depreciation) |
Net Unrealized Appreciation (Depreciation) |
Cost | |||||||||||||
| Active U.S. Real Estate Fund | $ | 1,768,859 | $ | (793,197 | ) | $ | 975,662 | $ | 26,828,143 | |||||||
| Balanced Multi-Asset Allocation ETF | 40,502 | (51,876 | ) | (11,374 | ) | 2,631,805 | ||||||||||
| Conservative Multi-Asset Allocation ETF | 24,485 | (30,590 | ) | (6,105 | ) | 1,255,041 | ||||||||||
| Growth Multi-Asset Allocation ETF | 52,126 | (48,727 | ) | 3,399 | 2,888,477 | |||||||||||
| Moderately Conservative Multi-Asset Allocation ETF | 41,932 | (27,106 | ) | 14,826 | 1,267,375 | |||||||||||
| Multi-Strategy Alternative ETF | 92,329 | (174,848 | ) | (82,519 | ) | 4,211,856 | ||||||||||
| S&P 500® Downside Hedged ETF | — | — | — | 24,445,714 | ||||||||||||
| Ultra Short Duration ETF | 2,395,945 | (1,420,441 | ) | 975,504 | 1,593,961,576 | |||||||||||
| Variable Rate Investment Grade ETF | 595,363 | (1,503,788 | ) | (908,425 | ) | 447,061,115 | ||||||||||
|
|
87 |
|
Note 9. Reclassification of Permanent Differences
Primarily as a result of differing book/tax treatment of in-kind transactions, distributions, paydowns, and foreign currency transactions, amounts were reclassified between undistributed net investment income, undistributed net realized gain (loss) and Shares of beneficial interest. These reclassifications had no effect on the net assets of each Fund. For the fiscal year or period ended October 31, 2018, the reclassifications were as follows:
| Undistributed Net Investment Income |
Undistributed Net Realized Gain (Loss) |
Shares of Beneficial Interest |
||||||||||
| Active U.S. Real Estate Fund | $ | (60,525 | ) | $ | (351,948 | ) | $ | 412,473 | ||||
| Balanced Multi-Asset Allocation ETF | — | — | — | |||||||||
| Conservative Multi-Asset Allocation ETF | 18 | — | (18 | ) | ||||||||
| Growth Multi-Asset Allocation ETF | — | — | — | |||||||||
| Moderately Conservative Multi-Asset Allocation ETF | 1 | — | (1 | ) | ||||||||
| Multi-Strategy Alternative ETF | (48,959 | ) | 64,948 | (15,989 | ) | |||||||
| S&P 500® Downside Hedged ETF | — | — | — | |||||||||
| Ultra Short Duration ETF* | 17,861 | (17,861 | ) | — | ||||||||
| Variable Rate Investment Grade ETF | 636,155 | (648,227 | ) | 12,072 | ||||||||
| * | For the period June 1, 2018 through October 31, 2018. |
Note 10. Trustees’ and Officer’s Fees
Trustees’ and Officer’s Fees include amounts accrued by the Funds to pay remuneration to each Independent Trustee and an Officer of the Trust. The Adviser, as a result of each Fund’s unitary management fee, pays for such compensation for each Fund except for Ultra Short Duration ETF. The Trustee who is an “interested person” of the Trust does not receive any Trustees’ fees.
The Trust has adopted a deferred compensation plan (the “Plan”). Under the Plan, each Independent Trustee who has executed a Deferred Fee Agreement (a “Participating Trustee”) may defer receipt of all or a portion of his compensation (“Deferral Fees”). Such Deferral Fees are deemed to be invested in select Invesco Funds. The Deferral Fees payable to the Participating Trustee are valued as of the date such Deferral Fees would have been paid to the Participating Trustee. The value increases with contributions or with increases in the value of the Shares selected, and the value decreases with distributions or with declines in the value of the Shares selected. Obligations under the Plan represent unsecured claims against the general assets of the Funds.
Note 11. Borrowing
The Predecessor Fund to Ultra Short Duration ETF (the “Withdrawing Borrower”), was party to a 364-day committed, $1,000,000,000 line of credit facility with a syndicate administered by Citibank, N.A, which was in place through October 6, 2017, at which time the line of credit was renewed with an increased commitment amount of $1,065,000,000. The Withdrawing Borrower was permitted to borrow up to the lesser of (1) $1,065,000,000 or (2) the limits set by the prospectus for borrowings. Fees related to borrowings, if any, varied under this arrangement between the greater of Citibank’s “base rate”, LIBOR plus 1% or the federal funds rate plus 1/2 of 1%, The Withdrawing Borrower that participated in the line of credit paid upfront costs to renew the line of credit and a commitment fee of 0.15% on the amount of the commitment that had not been utilized. In case of borrowings from the line of credit, the Withdrawing Borrower paid the associated interest expenses. Effective April 16, 2018, the Withdrawing Borrower withdrew as borrowers under the line of credit facility and all rights and obligations of the Withdrawing Borrower terminated.
Expenses under the line of credit facility are shown in the Statements of Operations as Line of Credit Fee. There were no outstanding borrowings under this agreement during the current fiscal period.
Note 12. Capital
Shares are issued and redeemed by each Fund only in Creation Units of (i) 100,000 Shares for each of Balanced Multi-Asset Allocation ETF, Conservative Multi-Asset Allocation ETF, Growth Multi-Asset Allocation ETF, Moderately Conservative Multi-Asset Allocation ETF Multi-Strategy Alternative ETF and Ultra Short Duration ETF; and (ii) 50,000 Shares, for each of Active U.S. Real Estate ETF, S&P 500® Downside Hedged ETF and Variable Rate Investment Grade ETF. Only Authorized Participants are permitted to purchase or redeem Creation Units from the Funds. For Active U.S. Real Estate ETF, Balanced Multi-Asset Allocation ETF, Conservative Multi-Asset Allocation ETF, Growth Multi-Asset Allocation ETF and Moderately Conservative Multi-Asset Allocation ETF, such transactions are principally permitted in exchange for Deposit Securities, with a balancing cash component to equate the transaction to the NAV per Share of the Fund of the Trust on the transaction date. For Multi-Strategy Alternative ETF and Ultra Short Duration ETF, Creation Units are issued and redeemed principally in exchange for the deposit or delivery of cash. For S&P 500® Downside Hedged ETF and Variable Rate Investment Grade ETF, Creation Units are issued and redeemed partially in exchange for the deposit or delivery of cash and partially in exchange for Deposit Securities. However, for all Funds, cash in an amount equivalent to the value of certain securities may be substituted, generally when the securities are not available in sufficient quantity for delivery, not eligible for trading by the Authorized Participant or as a result of other market circumstances.
|
|
88 |
|
To the extent that the Funds permit transactions in exchange for Deposit Securities, each Fund may issue Shares in advance of receipt of Deposit Securities subject to various conditions, including a requirement to maintain on deposit with the Trust cash at least equal to 105% of the market value of the missing Deposit Securities. In accordance with the Trust’s Participant Agreement, Creation Units will be issued to an Authorized Participant, notwithstanding the fact that the corresponding Deposit Securities have not been received in part or in whole, in reliance on the undertaking of the Authorized Participant to deliver the missing Deposit Securities as soon as possible, which undertaking shall be secured by the Authorized Participant’s delivery and maintenance of collateral consisting of cash in the form of U.S. dollars in immediately available funds having a value (marked-to-market daily) at least equal to 105%, which the Adviser may change from time to time, of the value of the missing Deposit Securities.
Certain transaction fees may be charged by the Funds for creations and redemptions, which are treated as increases in capital.
Transactions in each Fund’s Shares are disclosed in detail in the Statements of Changes in Net Assets.
Note 13. Indemnifications
Under the Trust’s organizational documents, its Officers and Trustees are indemnified against certain liabilities arising out of the performance of their duties to the Trust. Each Independent Trustee is also indemnified against certain liabilities arising out of the performance of his duties to the Trust pursuant to an Indemnification Agreement between such trustee and the Trust. Additionally, in the normal course of business, the Trust enters into contracts with service providers that contain general indemnification clauses. The Trust’s maximum exposure under these arrangements is unknown, as this would involve future claims that may be made against the Trust that have not yet occurred. However, based on experience, the Trust believes the risk of loss to be remote.
Note 14. Subsequent Event
At a meeting held on December 13, 2018, the Board of Trustees of the Trust approved the termination and winding down of Multi-Strategy Alternative ETF, with the liquidation payment to shareholders expected to take place on or about February 27, 2019. Investors who have elected not to sell their shares before market close on February 20, 2019 will receive cash equal to the amount of the net asset value of their shares, which will include any capital gains and dividends, on or about February 27, 2019.
|
|
89 |
|
Report of Independent Registered Public Accounting Firm
To the Board of Trustees of Invesco Actively Managed Exchange-Traded Fund Trust and Shareholders of Invesco Active U.S. Real Estate ETF, Invesco Balanced Multi-Asset Allocation ETF, Invesco Conservative Multi-Asset Allocation ETF, Invesco Growth Multi-Asset Allocation ETF, Invesco Moderately Conservative Multi-Asset Allocation ETF, Invesco Multi-Strategy Alternative ETF, Invesco S&P 500® Downside Hedged ETF, Invesco Ultra Short Duration ETF and Invesco Variable Rate Investment Grade ETF
Opinions on the Financial Statements
We have audited the accompanying statements of assets and liabilities, including the schedules of investments, of each of the funds listed in the table below (nine of the funds constituting Invesco Actively Managed Exchange-Traded Fund Trust, hereafter collectively referred to as the “Funds”) as of October 31, 2018, the related statements of operations and changes in net assets for each of the periods indicated in the table below, including the related notes, and the financial highlights for each of the periods indicated in the table below (collectively referred to as the “financial statements”). In our opinion, the financial statements present fairly, in all material respects, the financial position of each of the Funds as of October 31, 2018, the results of each of their operations, the changes in each of their net assets, and each of the financial highlights for each of the periods indicated in the table below, in conformity with accounting principles generally accepted in the United States of America.
| Invesco Active U.S. Real Estate ETF(1) |
| Invesco Balanced Multi-Asset Allocation ETF(2) |
| Invesco Conservative Multi-Asset Allocation ETF(2) |
| Invesco Growth Multi-Asset Allocation ETF(2) |
| Invesco Moderately Conservative Multi-Asset Allocation ETF(2) |
| Invesco Multi-Strategy Alternative ETF(1) |
| Invesco S&P 500® Downside Hedged ETF(1) |
| Invesco Ultra Short Duration ETF(3) |
| Invesco Variable Rate Investment Grade ETF(1) |
| (1) | Statements of operations for the year ended October 31, 2018 and statements of changes in net assets for each of the two years in the period ended October 31, 2018 and the financial highlights for each of the periods indicated therein. |
| (2) | Statements of operations for the year ended October 31, 2018 and statements of changes in net assets and the financial highlights for the year ended October 31, 2018 and for the period February 21, 2017 (commencement of investment operations) through October 31, 2017 |
| (3) | Statements of operations and changes in net assets and the financial highlights for the period June 1, 2018 through October 31, 2018 and for the year ended May 31, 2018 |
The financial statements of Invesco Ultra Short Duration ETF (Predecessor Fund Guggenheim Ultra Short Duration ETF) as of and for the year ended May 31, 2017 and the financial highlights for each of the periods ended on or prior to May 31, 2017 (not presented herein, other than the statement of changes in net assets and the financial highlights) were audited by other auditors whose report dated July 31, 2017 expressed an unqualified opinion on those financial statements and financial highlights.
Basis for Opinions
These financial statements are the responsibility of the Funds’ management. Our responsibility is to express an opinion on the Funds’ financial statements based on our audits. We are a public accounting firm registered with the Public Company Accounting Oversight Board (United States) (“PCAOB”) and are required to be independent with respect to the Funds in accordance with the U.S. federal securities laws and the applicable rules and regulations of the Securities and Exchange Commission and the PCAOB.
We conducted our audits of these financial statements in accordance with the standards of the PCAOB. Those standards require that we plan and perform the audit to obtain reasonable assurance about whether the financial statements are free of material misstatement, whether due to error or fraud.
Our audits included performing procedures to assess the risks of material misstatement of the financial statements, whether due to error or fraud, and performing procedures that respond to those risks. Such procedures included examining, on a test basis, evidence regarding the amounts and disclosures in the financial statements. Our audits also included evaluating the accounting principles used and significant estimates made by management, as well as evaluating the overall presentation of the financial statements. Our procedures included confirmation of securities owned as of October 31, 2018 by correspondence with the custodian, transfer agent, and brokers; when replies were not received from brokers, we performed other auditing procedures. We believe that our audits provide a reasonable basis for our opinions.
|
|
90 |
|
Report of Independent Registered Public Accounting Firm (continued)
Subsequent Event
As discussed in Note 14 to the financial statements, the Board of Trustees approved a plan of liquidation for the Invesco Multi-Strategy Alternative ETF on December 13, 2018.
PricewaterhouseCoopers LLP
Chicago, Illinois
December 26, 2018
We have served as the auditor of one or more of the investment companies in the Invesco group of investment companies since at least 1995. We have not been able to determine the specific year we began serving as auditor.
|
|
91 |
|
As a shareholder of all Funds, except for Ultra Short Duration Fund ETF, a Fund of the Invesco Actively Managed Exchange-Traded Fund Trust, you incur a unitary management fee. In addition to the unitary management fee, a shareholder may pay distribution fees, if any, brokerage expenses, taxes, interest, including acquired fund fees and expenses, if any, litigation expenses and other extraordinary expenses. As a shareholder of the Invesco Ultra Short Duration ETF, you incur advisory fees and other Fund expenses. The expense examples below are intended to help you understand your ongoing costs (in dollars) of investing in the Funds and to compare these costs with the ongoing costs of investing in other funds.
The example is based on an investment of $1,000 invested at the beginning of the period and held through the six-month period ended October 31, 2018.
In addition to the fees and expenses which the Invesco Balanced Multi-Asset Allocation ETF, Invesco Conservative Multi-Asset Allocation ETF, Invesco Growth Multi-Asset Allocation ETF, Invesco Moderately Conservative Multi-Asset Allocation ETF, Invesco Multi-Strategy Alternative ETF and the S&P 500 Downside Hedged ETF (collectively, the “Portfolios”) bear directly, the Portfolios indirectly bear a pro rata share of the fees and expenses of the investment companies in which the Portfolios invest. The amount of fees and expenses incurred indirectly by the Portfolios will vary because the investment companies have varied expenses and fee levels and the Portfolios may own different proportions of the investment companies at different times. Estimated investment companies’ expenses are not expenses that are incurred directly by the Portfolios. They are expenses that are incurred directly by the investment companies and are deducted from the value of the investment companies the Portfolios invest in. The effect of the estimated investment companies’ expenses that the Portfolios bear indirectly is included in each Portfolio’s total return.
Actual Expenses
The first line in the following table provides information about actual account values and actual expenses. You may use the information in this line, together with the amount you invested, to estimate the expenses that you paid over the period. Simply divide your account value by $1,000 (for example, an $8,600 account value divided by $1,000 = 8.6), then multiply the result by the number in the first line under the heading “Expenses Paid During the Six-Month Period” to estimate the expenses you paid on your account during this period.
Hypothetical Example for Comparison Purposes
The second line in the following table provides information about hypothetical account values and hypothetical expenses based on each Fund’s actual expense ratio and an assumed annualized rate of return of 5% per year before expenses, which is not the Fund’s actual return. The hypothetical account values and expenses may not be used to estimate the actual ending account balance or expenses you paid for the period. You may use this information to compare the ongoing costs of investing in the Funds and other funds. To do so, compare this 5% hypothetical example with the 5% hypothetical examples that appear in the shareholder reports of the other funds.
Please note that the expenses shown in the table are meant to highlight your ongoing costs only and do not reflect any transactional costs, such as sales charges and brokerage commissions. Therefore, the second line in the table is useful in comparing ongoing costs only, and will not help you determine the relative total costs of owning different funds. In addition, expenses shown in the table do not
|
|
92 |
|
Fees and Expenses (continued)
include the expenses of the underlying funds, which are borne indirectly by a Fund. If transaction costs and indirect expenses were included, your costs would have been higher.
| Beginning Account Value May 1, 2018 |
Ending Account Value October 31, 2018 |
Annualized Expense Ratio Based on the Six-Month Period |
Expenses Paid During the Six-Month Period(1) |
|||||||||||||
| Invesco Active U.S. Real Estate ETF (PSR) | ||||||||||||||||
| Actual |
$ | 1,000.00 | $ | 1,045.60 | 0.35 | % | $ | 1.80 | ||||||||
| Hypothetical (5% return before expenses) |
1,000.00 | 1,023.44 | 0.35 | 1.79 | ||||||||||||
| Invesco Balanced Multi-Asset Allocation ETF (PSMB) | ||||||||||||||||
| Actual |
1,000.00 | 992.30 | 0.05 | 0.25 | ||||||||||||
| Hypothetical (5% return before expenses) |
1,000.00 | 1,024.95 | 0.05 | 0.26 | ||||||||||||
| Invesco Conservative Multi-Asset Allocation ETF (PSMC) | ||||||||||||||||
| Actual |
1,000.00 | 1,003.60 | 0.05 | 0.25 | ||||||||||||
| Hypothetical (5% return before expenses) |
1,000.00 | 1,024.95 | 0.05 | 0.26 | ||||||||||||
| Invesco Growth Multi-Asset Allocation ETF (PSMG) | ||||||||||||||||
| Actual |
1,000.00 | 988.50 | 0.05 | 0.25 | ||||||||||||
| Hypothetical (5% return before expenses) |
1,000.00 | 1,024.95 | 0.05 | 0.26 | ||||||||||||
| Invesco Moderately Conservative Multi-Asset Allocation ETF (PSMM) | ||||||||||||||||
| Actual |
1,000.00 | 997.90 | 0.05 | 0.25 | ||||||||||||
| Hypothetical (5% return before expenses) |
1,000.00 | 1,024.95 | 0.05 | 0.26 | ||||||||||||
| Invesco Multi-Strategy Alternative ETF (LALT) | ||||||||||||||||
| Actual |
1,000.00 | 985.10 | 0.89 | 4.45 | ||||||||||||
| Hypothetical (5% return before expenses) |
1,000.00 | 1,020.72 | 0.89 | 4.53 | ||||||||||||
| Invesco S&P 500® Downside Hedged ETF (PHDG) | ||||||||||||||||
| Actual |
1,000.00 | 1,016.20 | 0.38 | 1.93 | ||||||||||||
| Hypothetical (5% return before expenses) |
1,000.00 | 1,023.29 | 0.38 | 1.94 | ||||||||||||
| Invesco Ultra Short Duration ETF (GSY) | ||||||||||||||||
| Actual |
1,000.00 | 1,011.88 | 0.25 | 1.27 | ||||||||||||
| Hypothetical (5% return before expenses) |
1,000.00 | 1,023.95 | 0.25 | 1.28 | ||||||||||||
| Invesco Variable Rate Investment Grade ETF (VRIG) | ||||||||||||||||
| Actual |
1,000.00 | 1,010.70 | 0.30 | 1.52 | ||||||||||||
| Hypothetical (5% return before expenses) |
1,000.00 | 1,023.69 | 0.30 | 1.53 | ||||||||||||
|
|
93 |
|
Form 1099-DIV, Form 1042-S and other year-end tax information provide shareholders with actual calendar year amounts that should be included in their tax returns. Shareholders should consult their tax advisers.
The following distribution information is being provided as required by the Internal Revenue Code or to meet a specific state’s requirement.
Each Fund designates the following amounts or, if subsequently determined to be different, the maximum amount allowable for its fiscal year ended October 31, 2018:
| Qualified Dividend Income* |
Dividends-Received Deduction* |
Qualified Interest Income* | |||||||||||||
| Invesco Active U.S. Real Estate Fund | 5 | % | 5 | % | 0 | % | |||||||||
| Invesco Balanced Multi-Asset Allocation ETF | 42 | % | 45 | % | 0 | % | |||||||||
| Invesco Conservative Multi-Asset Allocation ETF | 22 | % | 23 | % | 0 | % | |||||||||
| Invesco Growth Multi-Asset Allocation ETF | 64 | % | 70 | % | 0 | % | |||||||||
| Invesco Moderately Conservative Multi-Asset Allocation ETF | 33 | % | 36 | % | 0 | % | |||||||||
| Invesco Multi-Strategy Alternative ETF | 100 | % | 100 | % | 0 | % | |||||||||
| Invesco S&P 500® Downside Hedged ETF | 0 | % | 0 | % | 0 | % | |||||||||
| Invesco Ultra Short Duration ETF | 0 | % | 0 | % | 72 | % | |||||||||
| Invesco Variable Rate Investment Grade ETF | 0 | % | 0 | % | 0 | % | |||||||||
| * | The above percentages are based on ordinary income dividends paid to shareholders during the fiscal year. |
|
|
94 |
|
The Independent Trustees of the Trust, their term of office and length of time served, their principal business occupations during at least the past five years, the number of portfolios in the Fund Complex (as defined below) overseen by each Independent Trustee and the other directorships, if any, held by each Independent Trustee are shown below.
As of October 31, 2018
| Name, Address and Year of Birth of Independent Trustees |
Position(s) Held with Trust |
Term of Office and Length of Time Served* |
Principal Occupation(s) During Past 5 Years |
Number of Portfolios in Fund Complex** Overseen by Independent Trustees |
Other Directorships Held by Independent Trustees During the Past 5 Years | |||||
| Ronn R. Bagge—1958 c/o Invesco Capital Management LLC 3500 Lacey Road, Suite 700 Downers Grove, IL 60515 |
Chairman of the Nominating and Governance Committee and Trustee | Chairman of the Nominating and Governance Committee and Trustee since 2008 | Founder and Principal, YQA Capital Management LLC (1998-Present); formerly, Owner/CEO of Electronic Dynamic Balancing Co., Inc. (high-speed rotating equipment service provider). | 234 | Trustee and Investment Oversight Committee member, Mission Aviation Fellowship (2017–Present) | |||||
| Todd J. Barre—1957 c/o Invesco Capital Management LLC 3500 Lacey Road, Suite 700 Downers Grove, IL 60515 |
Trustee | Since 2010 | Assistant Professor of Business, Trinity Christian College (2010-2016); formerly, Vice President and Senior Investment Strategist (2001-2008), Director of Open Architecture and Trading (2007-2008), Head of Fundamental Research (2004-2007) and Vice President and Senior Fixed Income Strategist (1994-2001), BMO Financial Group/Harris Private Bank. | 234 | None | |||||
| Marc M. Kole—1960 c/o Invesco Capital Management LLC 3500 Lacey Road, Suite 700 Downers Grove, IL 60515 |
Chairman of the Audit Committee and Trustee | Chairman of the Audit Committee and Trustee since 2008 | Senior Director of Finance, By The Hand Club for Kids (2015-Present); formerly, Chief Financial Officer, Hope Network (social services) (2008-2012); Assistant Vice President and Controller, Priority Health (health insurance) (2005-2008); Senior Vice President of Finance, United Healthcare (2004-2005); Chief Accounting Officer, Senior Vice President of Finance, Oxford Health Plans (2000-2004); Audit Partner, Arthur Andersen LLP (1996-2000). | 234 | None | |||||
| Yung Bong Lim—1964 c/o Invesco Capital Management LLC 3500 Lacey Road, Suite 700 Downers Grove, IL 60515 |
Chairman of the Investment Oversight Committee and Trustee | Chairman of the Investment Oversight Committee since 2014; Trustee since 2013 | Managing Partner, RDG Funds LLC (2008-Present); formerly, Managing Director, Citadel LLC (1999-2007). | 234 | None | |||||
| * | This is the date the Independent Trustee began serving the Trust. Each Independent Trustee serves an indefinite term, until his successor is elected. |
| ** | Fund Complex includes all open- and closed-end funds (including all of their portfolios) advised by the Adviser and any affiliated person of the Adviser. |
|
|
95 |
|
Trustees and Officers (continued)
| Name, Address and Year of Birth of Independent Trustees |
Position(s) Held with Trust |
Term of Office and Length of Time Served* |
Principal Occupation(s) During Past 5 Years |
Number of Portfolios in Fund Complex** Overseen by Independent Trustees |
Other Directorships Held by Independent Trustees During the Past 5 Years | |||||
| Gary R. Wicker—1961 c/o Invesco Capital Management LLC 3500 Lacey Road, Suite 700 Downers Grove, IL 60515 |
Trustee | Since 2013 | Senior Vice President of Global Finance and Chief Financial Officer at RBC Ministries (publishing company) (2013-Present); formerly, Executive Vice President and Chief Financial Officer, Zondervan Publishing (a division of Harper Collins/NewsCorp) (2007-2012); Senior Vice President and Group Controller (2005-2006), Senior Vice President and Chief Financial Officer (2003-2004), Chief Financial Officer (2001-2003), Vice President, Finance and Controller (1999-2001) and Assistant Controller (1997-1999), divisions of The Thomson Corporation (information services provider). | 234 | None | |||||
| Donald H. Wilson—1959 c/o Invesco Capital Management LLC 3500 Lacey Road, Suite 700 Downers Grove, IL 60515 |
Chairman of the Board and Trustee | Chairman since 2012; Trustee since 2008 | Chairman, President and Chief Executive Officer, McHenry Bancorp Inc. and McHenry Savings Bank (subsidiary) (2018-Present); Chairman and Chief Executive Officer, Stone Pillar Advisors, Ltd. (2010-Present); President and Chief Executive Officer, Stone Pillar Investments, Ltd. (2016-Present); formerly, Chairman, President and Chief Executive Officer, Community Financial Shares, Inc. and Community Bank—Wheaton/Glen Ellyn (subsidiary) (2013-2015); Chief Operating Officer, AMCORE Financial, Inc. (bank holding company) (2007-2009); Executive Vice President and Chief Financial Officer, AMCORE Financial, Inc. (2006-2007); Senior Vice President and Treasurer, Marshall & Ilsley Corp. (bank holding company) (1995-2006). | 234 | None | |||||
| * | This is the date the Independent Trustee began serving the Trust. Each Independent Trustee serves an indefinite term, until his successor is elected. |
| ** | Fund Complex includes all open- and closed-end funds (including all of their portfolios) advised by the Adviser and any affiliated person of the Adviser. |
|
|
96 |
|
Trustees and Officers (continued)
The Interested Trustee and the executive officers of the Trust, their term of office and length of time served, their principal business occupations during at least the past five years, the number of portfolios in the Fund Complex (as defined below) overseen by the Interested Trustee and the other directorships, if any, held by the Interested Trustee are shown below.
| Name, Address and Year of Birth of Interested Trustee |
Position(s) Held with Trust |
Term of Office and Length of Time Served* |
Principal Occupation(s) During Past 5 Years |
Number of Portfolios in Fund Complex** Overseen by Interested Trustee |
Other Directorships Held by Interested Trustee During the Past 5 Years | |||||
| Kevin M. Carome—1956 Invesco Ltd. Two Peachtree Pointe, 1555 Peachtree St., N.E., Suite 1800 Atlanta, GA 30309 |
Trustee | Since 2010 | Senior Managing Director, Secretary and General Counsel, Invesco Ltd. (2007-Present); Director, Invesco Advisers, Inc. (2009-Present); Director (2006-Present) and Executive Vice President (2008-Present), Invesco Group Services, Inc., Invesco Holding Company (US), Inc. and Invesco North American Holdings, Inc.; Director, Invesco Holding Company Limited (2007-Present); Executive Vice President (2008-Present), Invesco Investments (Bermuda) Ltd.; Manager, Horizon Flight Works LLC, Director and Executive Vice President, Invesco Finance, Inc. and Director, Invesco Finance PLC (2011-Present); Director and Secretary (2012-Present), Invesco Services (Bahamas) Private Limited; and Director and Executive Vice President (2014-Present), INVESCO Asset Management (Bermuda) Ltd.; formerly, Director and Chairman, INVESCO Funds Group, Inc., Senior Vice President, Secretary and General Counsel, Invesco Advisers, Inc. (2003-2006); Director, Invesco Investments (Bermuda) Ltd. (2008-2016); Senior Vice President and General Counsel, Liberty Financial Companies, Inc. (2000-2001); General Counsel of certain investment management subsidiaries of Liberty Financial Companies, Inc. (1998-2000); Associate General Counsel, Liberty Financial Companies, Inc. (1993-1998); Associate, Ropes & Gray LLP. | 234 | None |
| * | This is the date the Interested Trustee began serving the Trust. The Interested Trustee serves an indefinite term, until his successor is elected. |
| ** | Fund Complex includes all open- and closed-end funds (including all of their portfolios) advised by the Adviser and any affiliated person of the Adviser. |
|
|
97 |
|
Trustees and Officers (continued)
| Name, Address and Year of Birth of Executive Officers |
Position(s) Held with Trust |
Length of Time Served* |
Principal Occupation(s) During Past 5 Years | |||
| Daniel E. Draper—1968 Invesco Capital Management LLC 3500 Lacey Road, Suite 700 Downers Grove, IL 60515 |
President and Principal Executive Officer |
Since 2015 | President and Principal Executive Officer, Invesco Exchange-Traded Fund Trust, Invesco Exchange-Traded Fund Trust II, Invesco India Exchange-Traded Fund Trust, Invesco Actively Managed Exchange-Traded Fund Trust and Invesco Actively Managed Exchange-Traded Commodity Fund Trust (2015-Present) and Invesco Exchange-Traded Self-Indexed Fund Trust (2016-Present); Chief Executive Officer and Principal Executive Officer (2016-Present) and Managing Director (2013-Present), Invesco Capital Management LLC; Senior Vice President, Invesco Distributors, Inc. (2014-Present); formerly, Vice President, Invesco Exchange-Traded Fund Trust, Invesco Exchange-Traded Fund Trust II, Invesco India Exchange-Traded Fund Trust, Invesco Actively Managed Exchange-Traded Fund Trust (2013-2015) and Invesco Actively Managed Exchange-Traded Commodity Fund Trust (2014-2015); Managing Director, Credit Suisse Asset Management (2010-2013) and Lyxor Asset Management/Societe Generale (2007-2010). | |||
| Kelli Gallegos—1970 Invesco Capital Management LLC 3500 Lacey Road, Suite 700 Downers Grove, IL 60515 |
Vice President and Treasurer | Since 2018 | Vice President and Treasurer, Invesco Exchange-Traded Fund Trust, Invesco Exchange-Traded Fund Trust II, Invesco India Exchange-Traded Fund Trust, Invesco Actively Managed Exchange-Traded Fund Trust, Invesco Actively Managed Exchange-Traded Commodity Fund Trust and Invesco Exchange-Traded Self-Indexed Fund Trust (2018-Present); Principal Financial and Accounting Officer-Pooled Investments, Invesco Capital Management LLC (2018-Present); Vice President, Principal Financial Officer (2016-Present) and Assistant Treasurer (2008-Present), The Invesco Funds; formerly, Assistant Treasurer Invesco Exchange-Traded Fund Trust, Invesco Exchange-Traded Fund Trust II, Invesco India Exchange-Traded Fund Trust and Invesco Actively Managed Exchange-Traded Fund Trust (2012-2018), Invesco Actively Managed Exchange-Traded Commodity Fund Trust (2014-2018) and Invesco Exchange-Traded Self-Indexed Fund Trust (2016-2018); Assistant Treasurer, Invesco Capital Management LLC (2013-2018); and Assistant Vice President, The Invesco Funds (2008-2016). | |||
| Peter Hubbard—1981 Invesco Capital Management LLC 3500 Lacey Road, Suite 700 Downers Grove, IL 60515 |
Vice President | Since 2009 | Vice President, Invesco Exchange-Traded Fund Trust, Invesco Exchange-Traded Fund Trust II, Invesco India Exchange-Traded Fund Trust, Invesco Actively Managed Exchange-Traded Fund Trust (2009-Present), Invesco Actively Managed Exchange-Traded Commodity Fund Trust (2014-Present) and Invesco Exchange-Traded Self-Indexed Fund Trust (2016-Present); Vice President and Director of Portfolio Management, Invesco Capital Management LLC (2010-Present); formerly, Vice President of Portfolio Management, Invesco Capital Management LLC (2008-2010); Portfolio Manager, Invesco Capital Management LLC (2007-2008); Research Analyst, Invesco Capital Management LLC (2005-2007); Research Analyst and Trader, Ritchie Capital, a hedge fund operator (2003-2005). | |||
| Sheri Morris—1964 Invesco Capital Management LLC 3500 Lacey Road, Suite 700 Downers Grove, IL 60515 |
Vice President | Since 2012 | President and Principal Executive Officer, The Invesco Funds (2016-Present); Treasurer, The Invesco Funds (2008-Present); Vice President, Invesco Advisers, Inc. (formerly known as Invesco Institutional (N.A.), Inc.) (registered investment adviser) (2009-Present) and Vice President, Invesco Exchange-Traded Fund Trust, Invesco Exchange-Traded Fund Trust II, Invesco India Exchange-Traded Fund Trust, Invesco Actively Managed Exchange-Traded Fund Trust (2012-Present), Invesco Actively Managed Exchange-Traded Commodity Fund Trust (2014-Present) and Invesco Exchange-Traded Self-Indexed Fund Trust (2016-Present); formerly, Vice President and Principal Financial Officer, The Invesco Funds (2008-2016); Treasurer, Invesco Exchange-Traded Fund Trust, Invesco Exchange-Traded Fund Trust II, Invesco India Exchange-Traded Fund Trust and Invesco Actively Managed Exchange-Traded Fund Trust (2011-2013); Vice President, Invesco Aim Advisers, Inc., Invesco Aim Capital Management, Inc. and Invesco Aim Private Asset Management, Inc.; Assistant Vice President and Assistant Treasurer, The Invesco Funds and Assistant Vice President, Invesco Advisers, Inc., Invesco Aim Capital Management, Inc. and Invesco Aim Private Asset Management, Inc. | |||
| * | This is the date each Officer began serving the Trust. Each Officer serves an indefinite term, until his or her successor is elected. |
|
|
98 |
|
Trustees and Officers (continued)
| Name, Address and Year of Birth of Executive Officers |
Position(s) Held with Trust |
Length of Time Served* |
Principal Occupation(s) During Past 5 Years | |||
| Anna Paglia—1974 Invesco Capital Management LLC 3500 Lacey Road, Suite 700 Downers Grove, IL 60515 |
Secretary | Since 2011 | Secretary, Invesco Exchange-Traded Fund Trust, Invesco Exchange-Traded Fund Trust II, Invesco India Exchange-Traded Fund Trust, Invesco Actively Managed Exchange-Traded Fund Trust (2011-Present), Invesco Actively Managed Exchange-Traded Commodity Fund Trust (2014-Present) and Invesco Exchange-Traded Self-Indexed Fund Trust (2015-Present); Head of Legal (2010-Present) and Secretary (2015-Present), Invesco Capital Management LLC; Manager and Assistant Secretary, Invesco Indexing LLC (2017-Present); formerly, Partner, K&L Gates LLP (formerly, Bell Boyd & Lloyd LLP) (2007-2010); Associate Counsel at Barclays Global Investors Ltd. (2004-2006). | |||
| Rudolf E. Reitmann—1971 Invesco Capital Management LLC 3500 Lacey Road, Suite 700 Downers Grove, IL 60515 |
Vice President | Since 2013 | Vice President, Invesco Exchange-Traded Fund Trust, Invesco Exchange-Traded Fund Trust II, Invesco India Exchange-Traded Fund Trust, Invesco Actively Managed Exchange-Traded Fund Trust (2013-Present), Invesco Actively Managed Exchange-Traded Commodity Fund Trust (2014-Present) and Invesco Exchange-Traded Self-Indexed Fund Trust (2016-Present); Head of Global Exchange Traded Funds Services, Invesco Capital Management LLC (2013-Present); Vice President, Invesco Capital Markets, Inc. (2018-Present). | |||
| David Warren—1957 Invesco Canada Ltd. 5140 Yonge Street, Suite 800 Toronto, Ontario M2N 6X7 |
Vice President | Since 2009 | Vice President, Invesco Exchange-Traded Fund Trust, Invesco Exchange-Traded Fund Trust II, Invesco India Exchange-Traded Fund Trust, and Invesco Actively Managed Exchange-Traded Fund Trust (2009-Present), Invesco Actively Managed Exchange-Traded Commodity Fund Trust (2014-Present) and Invesco Exchange-Traded Self-Indexed Fund Trust (2016-Present); Managing Director—Chief Administrative Officer, Americas, Invesco Capital Management LLC; Senior Vice President, Invesco Advisers, Inc. (2009-Present); Director, Invesco Inc. (2009-Present); Director, Executive Vice President and Chief Financial Officer, Invesco Canada Ltd. (formerly, Invesco Trimark Ltd.) (2011-Present); Chief Administrative Officer, North American Retail, Invesco Ltd. (2007-Present); Director, Invesco Corporate Class Inc. (2014-Present); Director, Invesco Global Direct Real Estate Feeder GP Ltd. (2015-Present); Director, Invesco Canada Holdings Inc. (2002-Present); Director, Invesco Financial Services Ltd. / Services Financiers Invesco Ltée and Trimark Investments Ltd./Placements Trimark Ltée (2014-Present); Director, Invesco IP Holdings (Canada) Ltd. (2016-Present); Director, Invesco Global Direct Real Estate GP Ltd. (2015-Present); formerly, Senior Vice President, Invesco Management Group, Inc. (2007-2018); Executive Vice President and Chief Financial Officer, Invesco Inc. (2009-2015); Director, Executive Vice President and Chief Financial Officer, Invesco Canada Ltd. (formerly, Invesco Trimark Ltd.) (2000-2011). | |||
| Melanie Zimdars—1976 Invesco Capital Management LLC 3500 Lacey Road, Suite 700 Downers Grove, IL 60515 |
Chief Compliance Officer |
Since 2017 | Chief Compliance Officer of Invesco Capital Management LLC (2017-Present); Chief Compliance Officer of Invesco Exchange-Traded Fund Trust, Invesco Exchange-Traded Fund Trust II, Invesco India Exchange-Traded Fund Trust, Invesco Actively Managed Exchange-Traded Fund Trust, Invesco Actively Managed Exchange-Traded Commodity Fund Trust and Invesco Exchange-Traded Self-Indexed Fund Trust (2017-Present); formerly, Vice President and Deputy Chief Compliance Officer at ALPS Holding, Inc. (2009-2017); Mutual Fund Treasurer/Chief Financial Officer at Wasatch Advisors, Inc. (2005-2008); Compliance Officer, U.S. Bancorp Fund Services, LLC (2001-2005). | |||
Availability of Additional Information About the Trustees
The Statement of Additional Information includes additional information about the Trustees and is available, without charge, upon request at (800) 983-0903.
| * | This is the date each Officer began serving the Trust. Each Officer serves an indefinite term, until his or her successor is elected. |
|
|
99 |
|
(This Page Intentionally Left Blank)
(This Page Intentionally Left Blank)
(This Page Intentionally Left Blank)
Proxy Voting Policies and Procedures
A description of the Trust’s proxy voting policies and procedures that the Funds use to determine how to vote proxies relating to portfolio securities is available, without charge and upon request, by calling (800) 983-0903. This information is also available on the Securities and Exchange Commission’s (the “Commission”) website at www.sec.gov.
Information regarding how each Fund voted proxies for portfolio securities, if applicable, during the most recent 12-month period ended June 30, is available, without charge and upon request, by (i) calling (800) 983-0903; or (ii) accessing the Trust’s Form N-PX on the Commission’s website at www.sec.gov.
Quarterly Portfolios
The Trust files its complete schedule of portfolio holdings for the Funds with the Commission for the first and third quarters of each fiscal year on Form N-Q (or any successor Form). The Trust’s Forms N-Q will be (or any successor Form) are available on the Commission’s website at www.sec.gov.
Frequency Distribution of Discounts and Premiums
A table showing the number of days the market price of each Fund’s shares was greater than the Fund’s net asset value, and the number of days it was less than the Fund’s net asset value (i.e., premium or discount) for the most recently completed calendar year, and the calendar quarters since that year end (or the life of the Fund, if shorter) may be found at the Fund’s website www.invesco.com/ETFs.
| ©2018 Invesco Capital Management LLC 3500 Lacey Road, Suite 700 Downers Grove, IL 60515 |
P-PS-AR-10 | invesco.com/ETFs |
Item 2. Code of Ethics.
The Registrant has adopted a Code of Ethics that applies to the Registrant’s principal executive officer and principal financial officer. This Code is filed as an exhibit to this report on Form N-CSR under Item 12(a)(1). No substantive amendments to this Code were made during the reporting period. There were no waivers for the fiscal year ended October 31, 2018.
Item 3. Audit Committee Financial Expert.
The Registrant’s Board of Trustees (the “Board”) has determined that the Registrant has three “audit committee financial experts” serving on its audit committee: Mr. Marc M. Kole, Mr. Gary R. Wicker and Mr. Donald H. Wilson. Each of these audit committee members is “independent,” meaning that he is not an “interested person” of the Registrant (as that term is defined in Section 2(a)(19) of the Investment Company Act of 1940, as amended) and he does not accept any consulting, advisory, or other compensatory fee from the Registrant (except in his capacity as a Board or committee member).
An “audit committee financial expert” is not an “expert” for any purpose, including for purposes of Section 11 of the Securities Act of 1933, as a result of being designated as an “audit committee financial expert.” Further, the designation of a person as an “audit committee financial expert” does not mean that a person has any greater duties, obligations, or liability than those imposed on a person without the “audit committee financial expert” designation. Similarly, the designation of a person as an “audit committee financial expert” does not affect the duties, obligations, or liability of any other member of the audit committee or Board of Trustees.
Item 4. Principal Accountant Fees and Services.
(a) to (d)
Fees Billed by PwC to the Registrant
PricewaterhouseCoopers LLP (“PwC”), the Registrant’s independent registered public accounting firm, billed the Registrant aggregate fees for services rendered to the Registrant for the last two fiscal years as shown in the following table. The Audit Committee pre-approved all audit and non-audit services provided to the Registrant.
|
Fees Billed by PwC for Services Year End 2018 |
Fees Billed by PwC for Services Rendered to the Registrant for Fiscal Year End 2017 | |||
| Audit Fees |
$ 209,250 | $ 151,425 | ||
| Audit-Related Fees |
$ 0 | $ 0 | ||
| Tax Fees(1) |
$ 58,160 | $ 58,160 | ||
| All Other Fees |
$ 0 | $ 0 | ||
| Total Fees |
$ 267,410 | $ 209,585 | ||
(1) Tax fees for the fiscal year ended October 31, 2018 include fees billed for reviewing tax returns, 2018 excise tax returns and excise tax distributions calculations. Tax fees for the fiscal year ended October 31, 2017 included fees billed for reviewing tax returns, 2017 excise tax returns and excise tax distribution calculations.
Fees Billed by PwC Related to Invesco and Invesco Affiliates
PwC billed Invesco Capital Management LLC (“Invesco” or “Adviser”), the Registrant’s adviser, and any entity controlling, controlled by or under common control with Invesco that provides ongoing services to the Registrant (“Affiliates”), aggregate fees for pre-approved non-audit services rendered to Invesco and Affiliates for the last two fiscal years as shown in the following table. The Audit Committee pre-approved all non-audit services provided to Invesco and Affiliates that were required to be pre-approved.
| Fees Billed for Non- to be Pre-Approved by the Registrant’s Audit Committee |
Fees Billed for Non- to be Pre-Approved by the Registrant’s Audit Committee | |||
| Audit-Related Fees(1) |
$ 662,000 | $ 662,000 | ||
| Tax Fees |
$ 0 | $ 0 | ||
| All Other Fees(2) |
$ 0 | $ 689,000 | ||
| Total Fees |
$ 662,000 | $ 1,351,000 | ||
(1) Audit-Related Fees for the fiscal year end 2018 include fees billed related to reviewing controls at a service organization. Audit-Related Fees for the fiscal year end 2017 include fees billed related to reviewing controls at a service organization.
(2) All Other Fees for the fiscal year end 2017 include fees billed related to assessments of the company’s current state analysis against regulatory requirements and the identification of structural and organizational alternatives, informed by industry practices, for certain of the company’s administrative activities and functions.
(e) (1) Audit Committee Pre Approval Policies and Procedures
Pre-Approval of Audit and Non-Audit Services Policies and Procedures
As Adopted by the Audit Committee of the Invesco ETFs
| Applicable to | Invesco Exchange-Traded Fund Trust, Invesco Exchange-Traded Fund Trust II, Invesco India Exchange-Traded Fund Trust, Invesco Actively Managed Exchange-Traded Fund Trust, Invesco Actively Managed Exchange-Traded Commodity Fund Trust and Invesco Exchange-Traded Self-Indexed Fund Trust (collectively the “Funds”)
| |||
| Risk Addressed by Policy
|
Approval of Audit and Non-Audit Services | |||
| Relevant Law and Other Sources
|
Sarbanes-Oxley Act of 2002; Regulation S-X. | |||
| Last Reviewed by Compliance for Accuracy
|
June 15, 2018 | |||
| Approved/Adopted Date
|
June 2009 | |||
Statement of Principles
Under the Sarbanes-Oxley Act of 2002 and rules adopted by the Securities and Exchange Commission (“SEC”) (“Rules”), the Audit Committee of the Funds’ (the “Audit Committee”) Board of Trustees (the “Board”) is responsible for the appointment, compensation and oversight of the work of independent accountants (an “Auditor”). As part of this responsibility and to assure that the Auditor’s independence is not impaired, the Audit Committee pre-approves the audit and non-audit services provided to the Funds by each Auditor, as well as all non-audit services provided by the Auditor to the Funds’ investment adviser and to affiliates of the adviser that provide ongoing services to the Funds (“Service Affiliates”) if the services directly impact the Funds’ operations or financial reporting. The SEC Rules also specify the types of services that an Auditor may not provide to its audit client. The following policies and procedures comply with the requirements for pre-approval and provide a mechanism by which management of the Funds may request and secure pre-approval of audit and non-audit services in an orderly manner with minimal disruption to normal business operations.
Proposed services either may be pre-approved without consideration of specific case-by-case services by the Audit Committee (“general pre-approval”) or require the specific pre-approval of the Audit Committee (“specific pre-approval”). As set forth in these policies and procedures, unless a type of service has received general pre-approval, it will require specific pre-approval by the Audit Committee. Additionally, any fees exceeding 110% of estimated pre-approved fee levels provided at the time the service was pre-approved will also require specific approval by the Audit Committee before payment is made. The Audit Committee will also consider the impact of additional fees on the Auditor’s independence when determining whether to approve any additional fees for previously pre-approved services.
The Audit Committee will annually review and generally pre-approve the services that may be provided by each Auditor without obtaining specific pre-approval from the Audit Committee. The term of any general pre-approval runs from the date of such pre-approval through June 30th of the following year, unless the Audit Committee considers a different period and states otherwise. The Audit Committee will add to or subtract from the list of general pre-approved services from time to time, based on subsequent determinations.
The purpose of these policies and procedures is to set forth the guidelines to assist the Audit Committee in fulfilling its responsibilities.
Delegation
The Chairman of the Audit Committee (or, in his or her absence, any member of the Audit Committee) may grant specific pre-approval for non-prohibited services. All such delegated pre-approvals shall be presented to the Audit Committee no later than the next Audit Committee meeting.
Audit Services
The annual Audit services engagement terms will be subject to specific pre-approval of the Audit Committee. Audit services include the annual financial statement audit and other procedures such as tax provision work that is required to be performed by the independent auditor to be able to form an opinion on the Funds’ financial statements. The Audit Committee will obtain, review and consider sufficient information concerning the proposed Auditor to make a reasonable evaluation of the Auditor’s qualifications and independence.
In addition to the annual Audit services engagement, the Audit Committee may grant either general or specific pre-approval of other Audit services, which are those services that only the independent auditor reasonably can provide. Other Audit services may include services such as issuing consents for the inclusion of audited financial statements with SEC registration statements, periodic reports and other documents filed with the SEC or other documents issued in connection with securities offerings.
Non-Audit Services
The Audit Committee may provide either general or specific pre-approval of any non-audit services to the Funds and its Service Affiliates if the Audit Committee believes that the provision of the service will not impair the independence of the Auditor, is consistent with the SEC’s Rules on auditor independence, and otherwise conforms to the Audit Committee’s general principles and policies as set forth herein.
Audit-Related Services
“Audit-related services” are assurance and related services that are reasonably related to the performance of the audit or review of the Funds’ financial statements or that are traditionally performed by the independent auditor. Audit-related services include, among others, accounting consultations related to accounting, financial reporting or disclosure matters not classified as “Audit services”; and assistance with understanding and implementing new accounting and financial reporting guidance from rulemaking authorities.
Tax Services
“Tax services” include, but are not limited to, the review and signing of the Funds’ federal tax returns, the review of required distributions by the Funds and consultations regarding tax matters such as the tax treatment of new investments or the impact of new regulations. The Audit Committee will scrutinize carefully the retention of the Auditor in connection with a transaction initially recommended by the Auditor, the major business purpose of which may be tax avoidance or the tax treatment of which may not be supported in the Internal Revenue Code and related regulations. The Audit Committee will consult with the Funds’ Treasurer (or his or her designee) and may consult with outside counsel or advisors as necessary to ensure the consistency of Tax services rendered by the Auditor with the foregoing policy.
No Auditor shall represent any Fund or any Service Affiliate before a tax court, district court or federal court of claims.
Under rules adopted by the Public Company Accounting Oversight Board and approved by the SEC, in connection with seeking Audit Committee pre-approval of permissible Tax services, the Auditor shall:
1. Describe in writing to the Audit Committee, which writing may be in the form of the proposed engagement letter:
| a. | The scope of the service, the fee structure for the engagement, and any side letter or amendment to the engagement letter, or any other agreement between the Auditor and the Fund, relating to the service; and |
| b. | Any compensation arrangement or other agreement, such as a referral agreement, a referral fee or fee-sharing arrangement, between the Auditor and any person (other than the Fund) with respect to the promoting, marketing, or recommending of a transaction covered by the service; |
2. Discuss with the Audit Committee the potential effects of the services on the independence of the Auditor; and
3. Document the substance of its discussion with the Audit Committee.
All Other Auditor Services
The Audit Committee may pre-approve non-audit services classified as “All other services” that are not categorically prohibited by the SEC, as listed in Exhibit 1 to this policy.
Pre-Approval Fee Levels or Established Amounts
Pre-approval of estimated fees or established amounts for services to be provided by the Auditor under general or specific pre-approval policies will be set periodically by the Audit Committee. Any proposed fees exceeding 110% of the maximum estimated pre-approved fees or established amounts for pre-approved audit and non-audit services will be reported to the Audit Committee at the quarterly Audit Committee meeting and will require specific approval by the Audit Committee before payment is made. The Audit Committee will always factor in the overall relationship of fees for audit and non-audit services in determining whether to pre-approve any such services and in determining whether to approve any additional fees exceeding 110% of the maximum pre-approved fees or established amounts for previously pre-approved services.
Procedures
On an annual basis, the Auditor will submit to the Audit Committee for general pre-approval, a list of non-audit services that the Funds or Service Affiliates of the Funds may request from the Auditor. The list will describe the non-audit services in reasonable detail and will include an estimated range of fees and such other information as the Audit Committee may request.
Each request for services to be provided by the Auditor under the general pre-approval of the Audit Committee will be submitted to the Funds’ Treasurer (or his or her designee) and must include a detailed description of the services to be rendered. The Treasurer or his or her designee will ensure that such services are included within the list of services that have received the general pre-approval of the Audit Committee.
Each request to provide services that require specific approval by the Audit Committee shall be submitted to the Audit Committee jointly by the Funds’ Treasurer or his or her designee and the Auditor, and must include a joint statement that, in their view, such request is consistent with the pre-approval policies and procedures and the SEC Rules.
Each request to provide Tax services under either the general or specific pre-approval of the Audit Committee will describe in writing: (i) the scope of the service, the fee structure for the engagement, and any side letter or amendment to the engagement letter, or any other agreement between the Auditor and the audit client, relating to the service; and (ii) any compensation arrangement or other agreement between the Auditor and any person (other than the audit client) with respect to the promoting, marketing, or recommending of a transaction covered by the service. The Auditor will discuss with the Audit Committee the potential effects of the services on the Auditor’s independence and will document the substance of the discussion.
Non-audit services pursuant to the de minimis exception provided by the SEC Rules will be promptly brought to the attention of the Audit Committee for approval, including documentation that each of the conditions for this exception, as set forth in the SEC Rules, has been satisfied.
On at least an annual basis, the Auditor will prepare a summary of all the services provided to any entity in the investment company complex as defined in section 2-01(f)(14) of Regulation S-X in sufficient detail as to the nature of the engagement and the fees associated with those services.
The Audit Committee has designated the Funds’ Treasurer to monitor the performance of all services provided by the Auditor and to ensure such services are in compliance with these policies and procedures. The Funds’ Treasurer will report to the Audit Committee on a periodic basis as to the results of such monitoring. Both the Funds’ Treasurer and management will immediately report to the Chairman of the Audit Committee any breach of these policies and procedures that comes to the attention of the Funds’ Treasurer or senior management.
Adopted: June 26, 2009
Amended: June 15, 2018
Exhibit 1 to Pre-Approval of Audit and Non-Audit Services Policies and Procedures
Conditionally Prohibited Non-Audit Services (not prohibited if the Fund can reasonably conclude that the results of the service would not be subject to audit procedures in connection with the audit of the Fund’s financial statements)
| • | Bookkeeping or other services related to the accounting records or financial statements of the audit client |
| • | Financial information systems design and implementation |
| • | Appraisal or valuation services, fairness opinions, or contribution-in-kind reports |
| • | Actuarial services |
| • | Internal audit outsourcing services |
Categorically Prohibited Non-Audit Services
| • | Management functions |
| • | Human resources |
| • | Broker-dealer, investment adviser, or investment banking services |
| • | Legal services |
| • | Expert services unrelated to the audit |
| • | Any service or product provided for a contingent fee or a commission |
| • | Services related to marketing, planning, or opining in favor of the tax treatment of confidential transactions or aggressive tax position transactions, a significant purpose of which is tax avoidance |
| • | Tax services for persons in financial reporting oversight roles at the Fund |
| • | Any other service that the Public Company Oversight Board determines by regulation is impermissible. |
| (e)(2) | There were no amounts that were pre-approved by the Audit Committee pursuant to the de minimus exception under Rule 2-01 of Regulation S-X. |
| (f) | Not applicable. |
| (g) | In addition to the amounts shown in the tables above, PwC billed Invesco and Affiliates aggregate fees of $2,977,000 for the fiscal year ended October 31, 2018 and $3,068,000 for the fiscal year ended October 31, 2017 for non-audit services not required to be pre-approved by the Registrant’s Audit Committee. In total, PwC billed the Registrant, Invesco and Affiliates aggregate non-audit fees of $3,697,000 for the fiscal year ended 2018, and $4,477,000 for the fiscal year ended 2017. |
| (h) | With respect to the non-audit services above billed to Invesco and Affiliates that were not required to be pre-approved by the Registrant’s Audit Committee, the Audit Committee received information from PwC about such services, including by way of comparison, that PwC provided audit services to entities within the Investment Company Complex, as defined by Rule 2-01(f)(14) of Regulation S-X, of approximately $25 million and non-audit services of approximately $18 million for the fiscal year ended 2018. The Audit Committee considered this information in evaluating PwC’s independence. |
PwC informed the Audit Committee of the Board (the “Audit Committee”) that it has identified an issue related to its independence under Rule 2-01(c)(1)(ii)(A) of Regulation S-X (referred to as the “Loan Rule”). The Loan Rule prohibits accounting firms, such as PwC, from being deemed independent if they have certain financial relationships with their audit clients or certain affiliates of those clients. The Registrant is required under various securities laws to have its financial statements audited by an independent accounting firm.
The Loan Rule specifically provides that an accounting firm would not be independent if it receives a loan from a lender that is a record or beneficial owner of more than ten percent of an audit client’s equity securities. For purposes of the Loan Rule, audit clients include the Registrant as well as all registered investment companies advised by the Adviser and its affiliates, including other subsidiaries of the Adviser’s parent company, Invesco Ltd. (collectively, the “Invesco Fund Complex”). PwC informed the Audit Committee it has relationships with lenders who hold, as record owner, more than
ten percent of the shares of certain funds within the Invesco Fund Complex. These relationships call into question PwC’s independence under the Loan Rule with respect to those funds, as well as all other funds in the Invesco Fund Complex.
On June 20, 2016, the SEC Staff issued a “no-action” letter to another mutual fund complex (see Fidelity Management & Research Company et al., No-Action Letter) related to the audit independence issue described above. In that letter, the SEC confirmed that it would not recommend enforcement action against a fund that relied on audit services performed by an audit firm that was not in compliance with the Loan Rule in certain specified circumstances. On May 2, 2018, the SEC proposed amendments to the Loan Rule that, if adopted as proposed, would address many of the issues that led to the issuance of the no-action letter.
In an August 18, 2016 letter, and in subsequent communications, PwC affirmed to the Audit Committee that, as of the date of the letter and the subsequent communications, respectively, PwC is an independent accountant with respect to the Registrant within the meaning of PCAOB Rule 3520. In its letter and in its subsequent communications, PwC also informed the Audit Committee that, after evaluating the facts and circumstances and the applicable independence rules, PwC has concluded that with regard to its compliance with the independence criteria set forth in the rules and regulations of the SEC related to the Loan Rule, it believes that it remains objective and impartial despite matters that may ultimately be determined to be inconsistent with these criteria and therefore it can continue to serve as the Registrant’s registered public accounting firm. PwC has advised the Audit Committee that this conclusion is based in part on the following considerations: (1) the lenders to PwC have no influence over any fund, or other entity within the Invesco Fund Complex, or its investment adviser; (2) none of the officers or trustees of the Invesco Fund Complex whose shares are owned by PwC lenders are associated with those lenders; (3) PwC understands that the shares held by PwC lenders are held for the benefit of and on behalf of its policy owners/end investors; (4) investments in funds such as the Invesco Fund Complex funds are passive; (5) the PwC lenders are part of various syndicates of unrelated lenders; (6) there have been no changes to the loans in question since the origination of each respective note; (7) the debts are in good standing and no lender has the right to take action against PwC, as borrower, in connection with the financings; (8) the debt balances with each lender are immaterial to PwC and to each lender; and (9) the PwC audit engagement team has no involvement in PwC’s treasury function and PwC’s treasury function has no oversight of or ability to influence the PwC audit engagement team. In addition, PwC has communicated that the lending relationships appear to be consistent with the lending relationships described in the no-action letter and that they are not aware of other relationships that would be implicated by the Loan Rule. In addition to relying on PwC’s August 18, 2016 letter and subsequent communications regarding its independence, the Registrant intends to rely upon the no-action letter.
If in the future the independence of PwC is called into question under the Loan Rule by circumstances that are not addressed in the SEC’s no-action letter, the Registrant may need to take other action in order for the Registrant’s filings with the SEC containing financial statements to be deemed compliant with applicable securities laws. Such additional actions could result in additional costs, impair the ability of the Registrant to issue new shares or have other material adverse effects on the Registrant. The SEC no-action relief was initially set to expire 18 months from issuance, but has been extended by the SEC without an expiration date, except that the no-action letter will be withdrawn upon the effectiveness of any amendments to the Loan Rule designed to address the concerns expressed in the letter.
PwC advised the Registrant’s Audit Committee that PwC had identified two matters for consideration under the SEC’s auditor independence rules. PwC stated that a PwC manager and a PwC Senior
Manager each held financial interests in investment companies within the Invesco Fund complex that were inconsistent with the requirements of Rule 2-01(c)(1) of Regulation S-X.
PwC advised the Audit Committee that it believes its objectivity and impartiality had not been adversely affected by these matters as they related to the audit of the Registrant. In reaching this conclusion, PwC noted, among other things, that during the time of its audit, the engagement team was not aware of the investments, neither individual was in the chain of command of the audit or the audit partners of Invesco or the Registrant, the services each individual provided were not relied upon by the audit engagement team with respect to the audit of the Registrant and the investments were not material to the net worth of either individual or their immediate family members.
Item 5. Audit Committee of Listed Registrants.
| (a) | The Registrant has a separately designated Audit Committee established in accordance with Section 3(a)(58)(A) of the Securities Exchange Act of 1934, as amended, which consists solely of independent trustees. The Audit Committee members are Marc M. Kole, Gary R. Wicker, and Donald H. Wilson. |
| (b) | Not applicable. |
Item 6. Schedule of Investments.
| (a) | The Schedules of Investments are included as a part of the report to shareholders filed under Item 1 of this Form N-CSR. |
| (b) | Not applicable. |
Item 7. Disclosure of Proxy Voting Policies and Procedures for Closed-End Management Investment Companies.
Not applicable.
Item 8. Portfolio Managers of Closed-End Management Investment Companies.
Not applicable.
Item 9. Purchases of Equity Securities by Closed-End Management Investment Company and Affiliated Purchasers.
Not applicable.
Item 10. Submission of Matters to a Vote of Security Holders.
There have been no material changes to the procedures by which shareholders may recommend nominees to the Board that would require disclosure herein.
Item 11. Controls and Procedures.
| (a) | Based on their evaluation of the Registrant’s disclosure controls and procedures (as defined in Rule 30a-3(c) under the Investment Company Act of 1940) as of a date within 90 days of the filing date of this report, the Registrant’s President (principal executive officer) and Treasurer (principal financial officer) have concluded that such disclosure controls and procedures are effective. |
| (b) | There were no changes in the Registrant’s internal control over financial reporting (as defined in Rule 30a-3(d) under the 1940 Act (17 CFR 270.30a-3(d))) that occurred during the Registrant’s last fiscal quarter that has materially affected, or is reasonably likely to materially affect, the Registrant’s internal control over financial reporting. |
Item 12. Disclosure of Securities Lending Activities for Closed-End Management Investment Companies.
Not applicable.
Item 13. Exhibits.
| (a)(1) | Code of Ethics is attached as Exhibit 99.CODEETH. | |||
| (a)(2) | Certifications of the Registrant’s President and Treasurer pursuant to Rule 30a-2(a) under the Investment Company Act of 1940 and Section 302 of the Sarbanes-Oxley Act of 2002 are attached as Exhibit 99.CERT. | |||
| (a)(3) | Not applicable. | |||
| (a)(4) | Not applicable. | |||
| (b) | Certifications of the Registrant’s President and Treasurer pursuant to Rule 30a-2(b) under the Investment Company Act of 1940 and Section 906 of the Sarbanes-Oxley Act of 2002 are attached as Exhibit 99.906CERT. | |||
SIGNATURES
Pursuant to the requirements of the Securities Exchange Act of 1934 and the Investment Company Act of 1940, the Registrant has duly caused this report to be signed on its behalf by the undersigned, thereunto duly authorized.
(Registrant) Invesco Actively Managed Exchange-Traded Fund Trust
| By: /s/ Daniel E. Draper |
| Name: Daniel E. Draper |
| Title: President |
Date: January 4, 2019
Pursuant to the requirements of the Securities Exchange Act of 1934 and the Investment Company Act of 1940, this report has been signed below by the following persons on behalf of the Registrant and in the capacities and on the dates indicated.
| By: /s/ Daniel E. Draper |
| Name: Daniel E. Draper |
| Title: President |
Date: January 4, 2019
| By: /s/ Kelli Gallegos |
| Name: Kelli Gallegos |
| Title: Treasurer |
Date: January 4, 2019