UNITED STATES
SECURITIES AND EXCHANGE COMMISSION
Washington, D.C. 20549
SECURITIES AND EXCHANGE COMMISSION
Washington, D.C. 20549
FORM N-CSR
CERTIFIED SHAREHOLDER REPORT OF REGISTERED
MANAGEMENT INVESTMENT COMPANIES
Investment Company Act file number 811-01209
Bridges Investment Fund, Inc.
(Exact name of registrant as specified in charter)
(Exact name of registrant as specified in charter)
1125 South 103rd Street, Suite 580
Omaha, NE 68124
(Address of principal executive offices) (Zip code)
(Address of principal executive offices) (Zip code)
Edson A. Bridges III
1125 South 103rd Street, Suite 580
Omaha, NE 68124
(Name and address of agent for service)
(Name and address of agent for service)
(402) 397-4700
Registrant's telephone number, including area code
Date of fiscal year end: December 31, 2019
Date of reporting period: June 30, 2019
Item 1. Reports to Stockholders.
|
|
|
|

Semi-Annual
Shareholder Report
2019
Beginning on January 1, 2021, as permitted by regulations adopted by the SEC, paper copies of the Fund’s shareholder reports will no longer be sent by mail, unless you specifically request paper copies of the reports from the Fund (defined herein)
or from your financial intermediary, such as a broker-dealer or bank. Instead, the reports will be made available on the Fund’s website (www.bridgesfund.com), and you will be notified by mail each time a report is posted and provided with a
website link to access the report.
If you already elected to receive shareholder reports electronically, you will not be affected by this change and you need not take any action. You may elect to receive shareholder reports and other communications from the Fund by contacting your
financial intermediary (such as a broker-dealer or bank) or, if you are a direct investor, by calling 1-866-934-4700 or by sending an e-mail request to fund@bridgesinv.com.
You may elect to receive all future reports in paper free of charge. If you invest through a financial intermediary, you can contact your financial intermediary to request that you continue to receive paper copies of your shareholder reports. If
you invest directly with the Fund, you can call 1-866-934-4700 or by send an e-mail request to fund@bridgesinv.com to let the Fund know you wish to continue receiving paper copies of your shareholder reports. Your election to receive reports
in paper will apply to all funds held in your account if you invest through your financial intermediary.
1125 South 103rd Street - Suite 580 – Omaha, NE 68124
P: (402) 397-4700 F: (402) 397-1555 www.bridgesfund.com
|
|
|
|
(This Page Intentionally Left Blank.)
Contents of Report
|
Page 1
|
Shareholder Letter
|
|
Exhibit 1
|
Portfolio Transactions During the
|
|
Page 3
|
Period from January 1, 2019 through
|
|
June 30, 2019
|
|
|
|
|
|
Exhibit 2
|
Selected Historical Financial Information
|
|
Pages 4-5
|
|
|
Pages 6-7
|
Expense Example
|
|
Page 8
|
Allocation of Portfolio Holdings
|
|
Pages 9-23
|
Financial Statements
|
|
Pages 24-30
|
Additional Disclosures
|
IMPORTANT NOTICES
Must be preceded or accompanied by a Prospectus.
Earnings growth is not representative of the Fund’s future performance.
Opinions expressed herein are those of Edson L. Bridges III and are subject to change. They are not guarantees and should not be considered investment advice.
Mutual fund investing involves risk. Principal loss is possible. Small and medium capitalization companies tend to have limited liquidity and greater price volatility than large-capitalization
companies. Investments in debt securities typically decrease in value when interest rates rise. This risk is usually greater for longer-term debt securities. The Fund invests in foreign securities which involve political, economic and currency risks,
greater volatility and differences in accounting methods.
The S&P 500 Index is a broadly based unmanaged composite of 500 stocks which is widely recognized as representative of price changes for the U.S. equity market in general.
The Russell 1000 Growth Index is an unmanaged composite of stocks that measures the performance of the stocks of companies with higher price-to- book ratios and higher forecasted growth values from a universe of the
1,000 largest U.S. companies based on total market capitalization. You cannot invest directly in a specific index.
The Russell 2000 Index is a small-cap stock market index of the bottom 2,000 stocks in the Russell 3000 Index, which is a capitalization-weighted stock market index, maintained by FTSE Russell, that seeks to be a
benchmark of the entire U.S stock market.
Forward earnings are an estimate of a next period’s earnings of a company, usually to completion of the current fiscal year and sometimes of the following fiscal year.
Earnings per share is the portion of a company’s profit allocated to each outstanding share of common stock. Earnings per share serves as an indicator of a company’s profitability.
Fund holdings are subject to change and should not be considered a recommendation to buy or sell any security. For a complete list of Fund holdings, please refer to the Schedule of Investments in this report.

July 22, 2019
Dear Shareholder:
Bridges Investment Fund had a total return of 4.69% in the second quarter of 2019, which bettered the 4.30% advance in the S&P 500 and the 4.64% rise in the Russell 1000 Growth Index over that
same period. For the twelve-month period ended June 30, 2019, the Fund had a total return of 8.71% versus a 10.42% total return for the S&P 500 and a 11.56% total return for the Russell 1000 Growth Index. For the three-year period ended June 30,
2019, the Fund had an average annual total return of 15.40% versus 14.19% for the S&P 500 and 18.07% for the Russell 1000 Growth Index. For the five-year period ended June 30, 2019, the Fund had an average annual total return of 9.08% versus
10.71% for the S&P 500 and 13.39% for the Russell 1000 Growth Index. For the ten-year period ended June 30, 2019, the Fund had an average annual total return of 12.90% versus 14.70% for the S&P 500 and 16.28% for the Russell 1000 Growth
Index.
Performance data quoted represents past performance. Past performance does not guarantee future results. The investment return and principal value of the investment will fluctuate
so that an investor’s shares, when redeemed, may be worth more or less than their original cost. Current performance of the Fund may be lower or higher than the performance stated above. Performance data current to the most recent month end may be
obtained by calling 866-934-4700. The gross expense ratio of the Fund is 0.79%
The second quarter of 2019 saw a material increase in equity market volatility.
In April, the S&P 500 returned 4.05%. In May, the S&P 500 declined 6.35%. In June, the S&P 500 had a total return of 7.05%, resulting in a total return for the second quarter of 4.30%.
mall and midcap stocks were positive during the second quarter as well, as the Russell 2000 had a total return of 2.09%.
U.S. equities posted an all-time high on June 20, as the S&P 500 closed at 2,952, eclipsing the high made in September of 2018 of 2,942. The S&P 500 closed the quarter 25% above its December
24, 2018 low.
The equity market rally in the first half of 2019 was driven by: 1) A more dovish stance by the Fed; 2) rising investor optimism regarding the probabilities of a resolution to the trade conflict
with China, and 3) decent U. S. corporate earnings performance within the context of increasing signs of economic softness around the global economy.
These three factors remain the most important risk factors for equity investors to consider during the second half of 2019. The strong price performance for stocks during the first half of 2019
discounts an expectation of second half interest rate cuts by the Fed, the achievement of a reasonable trade deal with China, and continued solid corporate earnings performance during the remainder of 2019 and into 2020.
|
Shareholder Letter
|
July 22, 2019
|
Disappointment around these factors would likely result in meaningful pullback in stock prices.
We expect that stock price volatility will remain elevated for the duration of 2019, because of the uncertainty inherent in the outcomes around Fed policy, trade negotiations, and corporate earnings
progress.
Despite strong returns for stocks during the first half of the year, aggregate valuations for stocks, as measured by the S&P 500, are close to our estimate of fair value for year-end 2019. At
present, the consensus earnings estimate for the S&P 500 for 2019 is $166 per share (down from $178 at the end of the third quarter of 2018), and $178 per share for year-end 2020.
We believe the S&P 500 is fairly valued at 18x forward earnings, which would imply a fair value estimate of 3,000 for the Index at year-end 2019, and 3,200 for year-end 2020, about 9% above
current levels (the Index closed the second quarter at 2,942).
Longer-term, we believe equities are reasonably attractive relative to the current 10-year Treasury yield of 2.00%. The current equity risk premium – the earnings yield of the S&P 500 relative
to the 10-year Treasury yield – is 3.6%, somewhat above its historic average level, implying that stocks are relatively more attractive than bonds.
During the second quarter, we established new positions in Delta Air Lines, Palo Alto Networks, Schwab, and SVB Financial. We added to our positions in Adobe, Blackrock, Boeing, FedEx, Iqvia, Lowes,
Old Dominion, and UnitedHealth Group.
We eliminated positions in Allergan, Altria, Biogen, Cigna, Cognizant Technology, Gilead Sciences, Philip Morris International, Qualcomm, and XPO Logistics, and trimmed our position in Celgene.
In our view, these transactions significantly upgrade the long-term business value growth potential of our portfolio.
We will continue to look for opportunities to upgrade the Fund’s portfolio during periods of equity market volatility.
Our focus remains on identifying and owning strong business franchises that are well-managed, have attractive opportunities for long-term business value growth, and that trade at sensible valuations.
We appreciate your continued investment in the Fund.
|
Sincerely,
|
|
 |
|
|
Edson L. Bridges III, CFA
|
|
|
President and Chief Executive Officer
|
2
Exhibit 1
BRIDGES INVESTMENT FUND, INC.
PORTFOLIO TRANSACTIONS
DURING THE PERIOD FROM
JANUARY 1, 2019 THROUGH JUNE 30, 2019
(Unaudited)
|
Bought or
|
Held After
|
|||||||
|
Securities
|
Received
|
Transactions
|
||||||
|
Common Stock Unless
|
$1,000 Par
|
$1,000 Par
|
||||||
|
Described Otherwise
|
Value (M)
|
Value (M)
|
||||||
|
or Shares
|
or Shares
|
|||||||
|
Adobe, Inc.
|
6,000
|
6,000
|
||||||
|
Autodesk, Inc.
|
4,000
|
4,000
|
||||||
|
BlackRock, Inc.
|
500
|
10,000
|
||||||
|
Boeing Co.
|
1,500
|
4,000
|
||||||
|
Delta Air Lines, Inc.
|
30,000
|
30,000
|
||||||
|
Fedex Corp.
|
10,000
|
20,000
|
||||||
|
IQVIA Holdings, Inc.
|
2,000
|
10,000
|
||||||
|
Lowes Companies, Inc.
|
1,000
|
10,000
|
||||||
|
Microsoft Corp.
|
10,000
|
35,000
|
||||||
|
Old Dominion Freight Line, Inc.
|
3,000
|
15,000
|
||||||
|
Palo Alto Networks, Inc.
|
6,500
|
6,500
|
||||||
|
SVB Financial Group
|
8,000
|
8,000
|
||||||
|
The Charles Schwab Corp.
|
40,000
|
40,000
|
||||||
|
UnitedHealth Group, Inc.
|
2,000
|
10,000
|
||||||
|
Sold or
|
Held After
|
|||||||
|
Securities
|
Exchanged
|
Transactions
|
||||||
|
Common Stock Unless
|
$1,000 Par
|
$1,000 Par
|
||||||
|
Described Otherwise
|
Value (M)
|
Value (M)
|
||||||
|
or Shares
|
or Shares
|
|||||||
|
Allergan, Plc
|
15,000
|
—
|
||||||
|
Altria Group, Inc.
|
15,000
|
—
|
||||||
|
Apple, Inc.
|
2,000
|
65,000
|
||||||
|
Biogen, Inc.
|
3,500
|
—
|
||||||
|
Celgene Corp.
|
24,000
|
20,000
|
||||||
|
Cigna Corp.
|
6,085
|
—
|
||||||
|
Cognizant Technology Solutions Corp. – Class A
|
10,000
|
—
|
||||||
|
Gilead Sciences, Inc.
|
17,000
|
—
|
||||||
|
MasterCard, Inc.
|
5,000
|
57,000
|
||||||
|
Philip Morris International, Inc.
|
7,000
|
—
|
||||||
|
Qualcomm, Inc.
|
35,000
|
—
|
||||||
|
XPO Logistics, Inc.
|
20,000
|
—
|
||||||
3
Exhibit 2
BRIDGES INVESTMENT FUND, INC.
SELECTED HISTORICAL FINANCIAL INFORMATION
(Unaudited)
– – – – – – – – – Year End Statistics – – – – – – – – – –
|
Valuation
|
Net
|
Shares
|
Net Asset
|
Dividend/
|
Capital
|
|||||||||||||||||
|
Date
|
Assets
|
Outstanding
|
Value/Share
|
Share
|
Gains/Share
|
|||||||||||||||||
|
07-01-63
|
$
|
109,000
|
10,900
|
$
|
10.00
|
$
|
—
|
$
|
—
|
|||||||||||||
|
12-31-63
|
159,187
|
15,510
|
10.13
|
.07
|
—
|
|||||||||||||||||
|
12-31-64
|
369,149
|
33,643
|
10.97
|
.28
|
—
|
|||||||||||||||||
|
12-31-65
|
621,241
|
51,607
|
12.04
|
.285
|
.028
|
|||||||||||||||||
|
12-31-66
|
651,282
|
59,365
|
10.97
|
.295
|
—
|
|||||||||||||||||
|
12-31-67
|
850,119
|
64,427
|
13.20
|
.295
|
—
|
|||||||||||||||||
|
12-31-68
|
1,103,734
|
74,502
|
14.81
|
.315
|
—
|
|||||||||||||||||
|
12-31-69
|
1,085,186
|
84,807
|
12.80
|
.36
|
—
|
|||||||||||||||||
|
12-31-70
|
1,054,162
|
90,941
|
11.59
|
.37
|
—
|
|||||||||||||||||
|
12-31-71
|
1,236,601
|
93,285
|
13.26
|
.37
|
—
|
|||||||||||||||||
|
12-31-72
|
1,272,570
|
93,673
|
13.59
|
.35
|
.08
|
|||||||||||||||||
|
12-31-73
|
1,025,521
|
100,282
|
10.23
|
.34
|
.07
|
|||||||||||||||||
|
12-31-74
|
757,545
|
106,909
|
7.09
|
.35
|
—
|
|||||||||||||||||
|
12-31-75
|
1,056,439
|
111,619
|
9.46
|
.35
|
—
|
|||||||||||||||||
|
12-31-76
|
1,402,661
|
124,264
|
11.29
|
.38
|
—
|
|||||||||||||||||
|
12-31-77
|
1,505,147
|
145,252
|
10.36
|
.428
|
.862
|
|||||||||||||||||
|
12-31-78
|
1,574,097
|
153,728
|
10.24
|
.481
|
.049
|
|||||||||||||||||
|
12-31-79
|
1,872,059
|
165,806
|
11.29
|
.474
|
.051
|
|||||||||||||||||
|
12-31-80
|
2,416,997
|
177,025
|
13.65
|
.55
|
.0525
|
|||||||||||||||||
|
12-31-81
|
2,315,441
|
185,009
|
12.52
|
.63
|
.0868
|
|||||||||||||||||
|
12-31-82
|
2,593,411
|
195,469
|
13.27
|
.78
|
.19123
|
|||||||||||||||||
|
12-31-83
|
3,345,988
|
229,238
|
14.60
|
.85
|
.25
|
|||||||||||||||||
|
12-31-84
|
3,727,899
|
278,241
|
13.40
|
.80
|
.50
|
|||||||||||||||||
|
12-31-85
|
4,962,325
|
318,589
|
15.58
|
.70
|
.68
|
|||||||||||||||||
|
12-31-86
|
6,701,786
|
407,265
|
16.46
|
.688
|
.86227
|
|||||||||||||||||
|
12-31-87
|
7,876,275
|
525,238
|
15.00
|
.656
|
1.03960
|
|||||||||||||||||
|
12-31-88
|
8,592,807
|
610,504
|
14.07
|
.85
|
1.10967
|
|||||||||||||||||
|
12-31-89
|
10,895,182
|
682,321
|
15.97
|
.67
|
.53769
|
|||||||||||||||||
|
12-31-90
|
11,283,448
|
744,734
|
15.15
|
.67
|
.40297
|
|||||||||||||||||
|
12-31-91
|
14,374,679
|
831,027
|
17.30
|
.66
|
.29292
|
|||||||||||||||||
|
12-31-92
|
17,006,789
|
971,502
|
17.51
|
.635
|
.15944
|
|||||||||||||||||
|
12-31-93
|
17,990,556
|
1,010,692
|
17.80
|
.6225
|
.17075
|
|||||||||||||||||
|
12-31-94
|
18,096,297
|
1,058,427
|
17.10
|
.59
|
.17874
|
|||||||||||||||||
|
12-31-95
|
24,052,746
|
1,116,620
|
21.54
|
.575
|
.19289
|
|||||||||||||||||
|
12-31-96
|
29,249,488
|
1,190,831
|
24.56
|
.55
|
.25730
|
|||||||||||||||||
|
12-31-97
|
36,647,535
|
1,262,818
|
29.02
|
.5075
|
.30571
|
|||||||||||||||||
|
12-31-98
|
48,433,113
|
1,413,731
|
34.26
|
.44
|
2.11648
|
|||||||||||||||||
4
Exhibit 2
(Continued)
BRIDGES INVESTMENT FUND, INC.
SELECTED HISTORICAL FINANCIAL INFORMATION
(Unaudited)
– – – – – – – – – Year End Statistics – – – – – – – – – –
|
Valuation
|
Net
|
Shares
|
Net Asset
|
Dividend/
|
Capital
|
|||||||||||||||||
|
Date
|
Assets
|
Outstanding
|
Value/Share
|
Share
|
Gains/Share
|
|||||||||||||||||
|
12-31-99
|
$
|
69,735,684
|
1,508,154
|
$
|
46.24
|
$
|
.30
|
$
|
.91088
|
|||||||||||||
|
12-31-00
|
71,411,520
|
1,850,301
|
38.59
|
.40
|
.80880716
|
|||||||||||||||||
|
12-31-01
|
60,244,912
|
1,940,494
|
31.05
|
.26
|
—
|
|||||||||||||||||
|
12-31-02
|
45,854,541
|
1,989,769
|
23.05
|
.20
|
—
|
|||||||||||||||||
|
12-31-03
|
62,586,435
|
2,016,560
|
31.04
|
.24
|
—
|
|||||||||||||||||
|
12-31-04
|
74,281,648
|
2,230,038
|
33.31
|
.305
|
—
|
|||||||||||||||||
|
12-31-05
|
80,715,484
|
2,305,765
|
35.01
|
.2798
|
—
|
|||||||||||||||||
|
12-31-06
|
82,754,479
|
2,336,366
|
35.42
|
.2695
|
—
|
|||||||||||||||||
|
12-31-07
|
77,416,617
|
2,258,380
|
34.28
|
.2364
|
2.5735
|
|||||||||||||||||
|
12-31-08
|
49,448,417
|
2,257,410
|
21.91
|
.2603
|
—
|
|||||||||||||||||
|
12-31-09
|
67,435,343
|
2,303,377
|
29.28
|
.17
|
—
|
|||||||||||||||||
|
12-31-10
|
75,014,486
|
2,307,301
|
32.51
|
.126
|
—
|
|||||||||||||||||
|
12-31-11
|
73,779,028
|
2,266,478
|
32.55
|
.1586
|
—
|
|||||||||||||||||
|
12-31-12
|
83,361,384
|
2,256,216
|
36.95
|
.207
|
—
|
|||||||||||||||||
|
12-31-13
|
110,155,511
|
2,335,264
|
47.17
|
.2408
|
1.62945
|
|||||||||||||||||
|
12-31-14
|
122,102,388
|
2,463,893
|
49.56
|
.265
|
1.71490
|
|||||||||||||||||
|
12-31-15
|
116,368,311
|
2,378,851
|
48.92
|
.2725
|
.5244
|
|||||||||||||||||
|
12-31-16
|
122,877,447
|
2,381,534
|
51.60
|
.2929
|
.47505
|
|||||||||||||||||
|
12-31-17
|
144,610,324
|
2,387,530
|
60.57
|
.2033
|
2.11478
|
|||||||||||||||||
|
12-31-18
|
151,571,438
|
2,640,626
|
57.40
|
.2798
|
.6652
|
|||||||||||||||||
– – – – – Current Six Months Compared to Same Six Months in Prior Year – – – – –
|
Valuation
|
Net
|
Shares
|
Net Asset
|
Dividend/
|
Capital
|
|||||||||||||||||
|
Date
|
Assets
|
Outstanding
|
Value/Share
|
Share
|
Gains/Share
|
|||||||||||||||||
|
06-30-18
|
$
|
161,540,573
|
2,534,573
|
$
|
63.73
|
$
|
.09
|
$
|
—
|
|||||||||||||
|
06-30-19
|
180,336,911
|
2,645,716
|
68.16
|
.15
|
—
|
|||||||||||||||||
5
BRIDGES INVESTMENT FUND, INC.
EXPENSE EXAMPLE
JUNE 30, 2019
(Unaudited)
As a shareholder of the Bridges Investment Fund, Inc., you incur ongoing costs, including management fees; services fees; and other Fund expenses. This example is intended to help you understand your ongoing costs (in
dollars) of investing in the Fund and to compare costs with the ongoing costs of investing in other mutual funds.
The Example is based on an investment of $1,000 invested at the beginning of the period and held the entire period (January 1, 2019 – June 30, 2019).
ACTUAL EXPENSES
The first line of the table below provides information about actual account values and actual expenses. Although the Fund charges no sales load or transactions fees, you will be assessed fees for outgoing wire transfers
(including redemption requests), returned checks or stop payment orders at prevailing rates charged by U.S. Bank Global Fund Services, the Fund’s transfer agent. To the extent that the Fund invests in shares of other investment companies as part of
its investment strategy, you will indirectly bear your proportionate share of any fees and expenses charged by the underlying funds in which a Fund invests in addition to the expenses of the Fund. Actual expenses of the underlying funds are expected
to vary among the various underlying funds. These expenses are not included in the example below. The example includes, but is not limited to, management fees, shareholder servicing fees, fund accounting, custody and transfer agent fees. However,
the example below does not include portfolio trading commissions and related expenses, interest expense or dividends on short positions taken by the Fund and other extraordinary expenses as determined under generally accepted accounting principles.
You may use the information in this line, together with the amount you invested, to estimate the expenses that you paid over the period. Simply divide your account value by $1,000 (for example, an $8,600 account value divided by $1,000 = 8.6), then
multiply the result by the number in the first line under the heading entitled “Expenses Paid During Period” to estimate the expenses you paid on your account during this period.
HYPOTHETICAL EXAMPLE FOR COMPARISON PURPOSES
The second line of the table below provides information about hypothetical account values and hypothetical expenses based on the Fund’s actual expense ratios and an assumed rate of return of 5% per year before expenses,
which is not the Fund’s actual return. The hypothetical account values and expenses may not be used to estimate the actual ending account balance or expenses you paid for the period. You may use this information to compare the ongoing costs of
investing in the Fund and other funds. To do so, compare this 5% hypothetical example with the 5% hypothetical examples that appear in the shareholder reports of the other funds.
6
Please note that the expenses shown in the table are meant to highlight your ongoing costs only and do not reflect any transactional costs, such as sales charges (loads), redemption fees, or exchange fees. Therefore,
the second line of the table is useful in comparing ongoing costs only, and will not help you determine the relative costs of owning different funds. In addition, if these transactional costs were included, your costs would have been higher.
|
Expenses Paid
|
|||
|
Beginning
|
Ending
|
During Period*
|
|
|
Account Value
|
Account Value
|
January 1, 2019 –
|
|
|
January 1, 2019
|
June 30, 2019
|
June 30, 2019
|
|
|
Actual
|
$1,000.00
|
$1,190.10
|
$4.26
|
|
Hypothetical
|
|||
|
(5% annualized return
|
|||
|
before expenses)
|
$1,000.00
|
$1,020.90
|
$3.93
|
|
*
|
Expenses are equal to the Fund’s annualized expense ratio of 0.79%, multiplied by the average account value over the period, multiplied by 181/365 to reflect the one-half year period.
|
7
BRIDGES INVESTMENT FUND, INC.
ALLOCATION OF PORTFOLIO HOLDINGS
PERCENTAGE OF TOTAL INVESTMENTS
JUNE 30, 2019
(Unaudited)
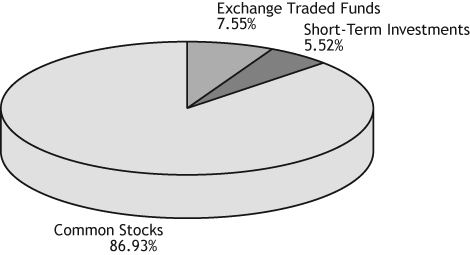
COMPONENTS OF PORTFOLIO HOLDINGS
|
Common Stocks
|
$
|
157,045,487
|
||
|
Exchange Traded Funds
|
13,641,400
|
|||
|
Short-Term Investments
|
9,974,351
|
|||
|
Total
|
$
|
180,661,238
|
8
BRIDGES INVESTMENT FUND, INC.
SCHEDULE OF INVESTMENTS
JUNE 30, 2019
(Unaudited)
|
Title of Security
|
Shares
|
Cost
|
Value
|
|||||||||
|
COMMON STOCKS – 87.09%
|
||||||||||||
|
Administrative and Support Services – 5.03%
|
||||||||||||
|
Booking Holdings, Inc. (a)
|
2,700
|
$
|
1,768,506
|
$
|
5,061,717
|
|||||||
|
PayPal Holdings, Inc. (a)
|
35,000
|
871,561
|
4,006,100
|
|||||||||
|
$
|
2,640,067
|
$
|
9,067,817
|
|||||||||
|
Air Transportation – 0.94%
|
||||||||||||
|
Delta Air Lines, Inc.
|
30,000
|
$
|
1,565,766
|
$
|
1,702,500
|
|||||||
|
Amusement, Gambling, and
|
||||||||||||
|
Recreation Industries – 2.32%
|
||||||||||||
|
The Walt Disney Co.
|
30,000
|
$
|
1,588,580
|
$
|
4,189,200
|
|||||||
|
Beverage and Tobacco
|
||||||||||||
|
Product Manufacturing – 0.95%
|
||||||||||||
|
PepsiCo, Inc.
|
13,000
|
$
|
632,331
|
$
|
1,704,690
|
|||||||
|
Broadcasting (except Internet) – 1.41%
|
||||||||||||
|
Comcast Corp. – Class A
|
60,000
|
$
|
1,381,050
|
$
|
2,536,800
|
|||||||
|
Building Material and Garden
|
||||||||||||
|
Equipment and Supplies Dealers – 1.83%
|
||||||||||||
|
The Home Depot, Inc.
|
11,000
|
$
|
1,466,586
|
$
|
2,287,670
|
|||||||
|
Lowe’s Companies, Inc.
|
10,000
|
812,074
|
1,009,100
|
|||||||||
|
$
|
2,278,660
|
$
|
3,296,770
|
|||||||||
|
Chemical Manufacturing – 2.41%
|
||||||||||||
|
Ecolab, Inc.
|
15,000
|
$
|
1,436,988
|
$
|
2,961,600
|
|||||||
|
Johnson & Johnson
|
10,000
|
866,300
|
1,392,800
|
|||||||||
|
$
|
2,303,288
|
$
|
4,354,400
|
|||||||||
|
Computer and Electronic
|
||||||||||||
|
Product Manufacturing – 12.92%
|
||||||||||||
|
Alphabet, Inc. – Class A (a)
|
4,000
|
$
|
847,060
|
$
|
4,331,200
|
|||||||
|
Alphabet, Inc. – Class C (a)
|
4,010
|
844,083
|
4,334,449
|
|||||||||
|
Apple, Inc.
|
65,000
|
1,105,345
|
12,864,801
|
|||||||||
|
Thermo Fisher Scientific, Inc.
|
6,000
|
879,267
|
1,762,080
|
|||||||||
|
$
|
3,675,755
|
$
|
23,292,530
|
|||||||||
See accompanying Notes to the Financial Statements.
Percentages are stated as a percent of net assets.
|
(a)
|
Non Income Producing.
|
9
BRIDGES INVESTMENT FUND, INC.
SCHEDULE OF INVESTMENTS
(Continued)
JUNE 30, 2019
(Unaudited)
|
Title of Security
|
Shares
|
Cost
|
Value
|
|||||||||
|
COMMON STOCKS (Continued)
|
||||||||||||
|
Couriers and Messengers – 1.82%
|
||||||||||||
|
FedEx Corp.
|
20,000
|
$
|
3,525,050
|
$
|
3,283,800
|
|||||||
|
Credit Intermediation and
|
||||||||||||
|
Related Activities – 6.88%
|
||||||||||||
|
Ameriprise Financial, Inc.
|
10,000
|
$
|
971,393
|
$
|
1,451,600
|
|||||||
|
Capital One Financial Corp.
|
30,000
|
864,556
|
2,722,200
|
|||||||||
|
JPMorgan Chase & Co.
|
30,000
|
1,721,192
|
3,354,000
|
|||||||||
|
SVB Financial Group (a)
|
8,000
|
1,790,396
|
1,796,720
|
|||||||||
|
Wells Fargo & Co.
|
65,000
|
1,722,623
|
3,075,800
|
|||||||||
|
$
|
7,070,160
|
$
|
12,400,320
|
|||||||||
|
Data Processing, Hosting and
|
||||||||||||
|
Related Services – 1.01%
|
||||||||||||
|
Fiserv, Inc. (a)
|
20,000
|
$
|
971,166
|
$
|
1,823,200
|
|||||||
|
Electrical Equipment, Appliance, and
|
||||||||||||
|
Component Manufacturing – 0.92%
|
||||||||||||
|
Eaton Corp. Plc
|
20,000
|
$
|
863,312
|
$
|
1,665,600
|
|||||||
|
Food Services and Drinking Places – 1.39%
|
||||||||||||
|
Starbucks Corp.
|
30,000
|
$
|
561,001
|
$
|
2,514,900
|
|||||||
|
Insurance Carriers and
|
||||||||||||
|
Related Activities – 3.72%
|
||||||||||||
|
Berkshire Hathaway, Inc. – Class B (a)
|
20,000
|
$
|
678,649
|
$
|
4,263,400
|
|||||||
|
UnitedHealth Group, Inc.
|
10,000
|
2,439,168
|
2,440,100
|
|||||||||
|
$
|
3,117,817
|
$
|
6,703,500
|
|||||||||
|
Machinery Manufacturing – 1.62%
|
||||||||||||
|
Roper Technologies, Inc.
|
8,000
|
$
|
335,931
|
$
|
2,930,080
|
|||||||
|
Mining (except Oil and Gas) – 1.02%
|
||||||||||||
|
Martin Marietta Materials, Inc.
|
8,000
|
$
|
1,469,187
|
$
|
1,840,880
|
|||||||
|
Nonstore Retailers – 5.25%
|
||||||||||||
|
Amazon.com, Inc. (a)
|
5,000
|
$
|
1,231,664
|
$
|
9,468,150
|
|||||||
See accompanying Notes to the Financial Statements.
Percentages are stated as a percent of net assets.
|
(a)
|
Non Income Producing.
|
10
BRIDGES INVESTMENT FUND, INC.
SCHEDULE OF INVESTMENTS
(Continued)
JUNE 30, 2019
(Unaudited)
|
Title of Security
|
Shares
|
Cost
|
Value
|
|||||||||
|
COMMON STOCKS (Continued)
|
||||||||||||
|
Oil and Gas Extraction – 2.13%
|
||||||||||||
|
Continental Resources, Inc. (a)
|
47,000
|
$
|
1,375,415
|
$
|
1,978,230
|
|||||||
|
EOG Resources, Inc.
|
20,000
|
2,044,419
|
1,863,200
|
|||||||||
|
$
|
3,419,834
|
$
|
3,841,430
|
|||||||||
|
Other Information Services – 2.35%
|
||||||||||||
|
Facebook, Inc. – Class A (a)
|
22,000
|
$
|
2,108,799
|
$
|
4,246,000
|
|||||||
|
Petroleum and Coal
|
||||||||||||
|
Products Manufacturing – 1.52%
|
||||||||||||
|
Chevron Corp.
|
22,000
|
$
|
1,206,019
|
$
|
2,737,680
|
|||||||
|
Professional, Scientific, and
|
||||||||||||
|
Technical Services – 15.15%
|
||||||||||||
|
Amgen, Inc.
|
10,000
|
$
|
1,609,946
|
$
|
1,842,800
|
|||||||
|
Celgene Corp. (a)
|
20,000
|
1,056,495
|
1,848,800
|
|||||||||
|
IQVIA Holdings, Inc. (a)
|
10,000
|
1,144,668
|
1,609,000
|
|||||||||
|
MasterCard, Inc. – Class A
|
57,000
|
983,398
|
15,078,210
|
|||||||||
|
Visa, Inc. – Class A
|
40,000
|
1,087,480
|
6,942,000
|
|||||||||
|
$
|
5,881,987
|
$
|
27,320,810
|
|||||||||
|
Publishing Industries (except Internet) – 4.68%
|
||||||||||||
|
Adobe, Inc. (a)
|
6,000
|
$
|
1,567,424
|
$
|
1,767,900
|
|||||||
|
Autodesk, Inc. (a)
|
4,000
|
653,344
|
651,600
|
|||||||||
|
Microsoft Corp.
|
35,000
|
3,890,069
|
4,688,600
|
|||||||||
|
Palo Alto Networks, Inc. (a)
|
6,500
|
1,463,555
|
1,324,440
|
|||||||||
|
|
$
|
7,574,392
|
$
|
8,432,540
|
||||||||
|
Rail Transportation – 2.63%
|
||||||||||||
|
Union Pacific Corp.
|
28,000
|
$
|
806,918
|
$
|
4,735,080
|
|||||||
See accompanying Notes to the Financial Statements.
Percentages are stated as a percent of net assets.
|
(a)
|
Non Income Producing.
|
11
BRIDGES INVESTMENT FUND, INC.
SCHEDULE OF INVESTMENTS
(Continued)
JUNE 30, 2019
(Unaudited)
|
Title of Security
|
Shares
|
Cost
|
Value
|
|||||||||
|
COMMON STOCKS (Continued)
|
||||||||||||
|
Securities, Commodity Contracts,
|
||||||||||||
|
and Other Financial Investments
|
||||||||||||
|
and Related Activities – 5.14%
|
||||||||||||
|
BlackRock, Inc.
|
10,000
|
$
|
2,494,205
|
$
|
4,693,000
|
|||||||
|
S&P Global, Inc.
|
13,000
|
2,334,390
|
2,961,270
|
|||||||||
|
The Charles Schwab Corp.
|
40,000
|
1,749,024
|
1,607,600
|
|||||||||
|
$
|
6,577,619
|
$
|
9,261,870
|
|||||||||
|
Transportation Equipment
|
||||||||||||
|
Manufacturing – 0.81%
|
||||||||||||
|
Boeing Co.
|
4,000
|
$
|
1,343,458
|
$
|
1,456,040
|
|||||||
|
Truck Transportation – 1.24%
|
||||||||||||
|
Old Dominion Freight Line, Inc.
|
15,000
|
$
|
2,058,036
|
$
|
2,238,900
|
|||||||
|
TOTAL COMMON STOCKS
|
$
|
66,187,847
|
$
|
157,045,487
|
||||||||
|
EXCHANGE TRADED FUNDS – 7.56%
|
||||||||||||
|
Funds, Trusts, and Other
|
||||||||||||
|
Financial Vehicles – 7.56%
|
||||||||||||
|
iShares Core S&P Mid-Cap ETF
|
40,000
|
$
|
3,684,766
|
$
|
7,770,400
|
|||||||
|
iShares Core S&P Small-Cap ETF
|
75,000
|
2,746,435
|
5,871,000
|
|||||||||
|
TOTAL EXCHANGE TRADED FUNDS
|
$
|
6,431,201
|
$
|
13,641,400
|
||||||||
|
SHORT-TERM INVESTMENT – 5.53%
|
||||||||||||
|
Mutual Funds – 5.53%
|
||||||||||||
|
First American Treasury Obligations
|
||||||||||||
|
Fund – Class X, 2.248% (b)
|
9,974,351
|
$
|
9,974,351
|
$
|
9,974,351
|
|||||||
|
TOTAL SHORT-TERM INVESTMENT
|
$
|
9,974,351
|
$
|
9,974,351
|
||||||||
|
TOTAL INVESTMENTS – 100.18%
|
$
|
82,593,399
|
$
|
180,661,238
|
||||||||
|
LIABILITIES IN EXCESS
|
||||||||||||
|
OF OTHER ASSETS – (0.18)%
|
(324,327
|
)
|
||||||||||
|
TOTAL NET ASSETS – 100.00%
|
$
|
180,336,911
|
||||||||||
See accompanying Notes to the Financial Statements.
Percentages are stated as a percent of net assets.
|
(a)
|
Non-income producing.
|
|
(b)
|
The rate shown is the annualized seven day yield as of June 30, 2019.
|
12
BRIDGES INVESTMENT FUND, INC.
STATEMENT OF ASSETS AND LIABILITIES
JUNE 30, 2019
(Unaudited)
|
ASSETS:
|
||||
|
Investments in securities, at fair value (cost: $82,593,399)
|
$
|
180,661,238
|
||
|
Receivables
|
||||
|
Fund shares issued
|
2,734
|
|||
|
Dividends and interest
|
38,809
|
|||
|
Prepaid expenses
|
11,626
|
|||
|
TOTAL ASSETS:
|
$
|
180,714,407
|
||
|
LIABILITIES:
|
||||
|
Payables
|
||||
|
Distributions to shareholders
|
$
|
73,948
|
||
|
Payable for capital shares redeemed
|
18,393
|
|||
|
Payable to Adviser
|
222,011
|
|||
|
Accrued expenses
|
63,144
|
|||
|
TOTAL LIABILITIES:
|
$
|
377,496
|
||
|
TOTAL NET ASSETS
|
$
|
180,336,911
|
||
|
NET ASSETS CONSIST OF:
|
||||
|
Capital Stock
|
$
|
77,780,244
|
||
|
Total distributable earnings
|
102,556,667
|
|||
|
TOTAL NET ASSETS
|
$
|
180,336,911
|
||
|
SHARES OUTSTANDING
|
||||
|
($0.0001 par value; 100,000,000 shares authorized)
|
2,645,716
|
|||
|
NET ASSET VALUE, OFFERING AND REDEMPTION PRICE PER SHARE
|
$
|
68.16
|
||
See accompanying Notes to the Financial Statements.
13
BRIDGES INVESTMENT FUND, INC.
STATEMENT OF OPERATIONS
FOR THE SIX MONTHS ENDED JUNE 30, 2019
(Unaudited)
|
INVESTMENT INCOME:
|
||||
|
Dividend income
|
$
|
951,855
|
||
|
Interest income
|
102,408
|
|||
|
Total investment income
|
$
|
1,054,263
|
||
|
EXPENSES:
|
||||
|
Advisory fees
|
$
|
432,764
|
||
|
Administration fees
|
75,014
|
|||
|
Dividend disbursing and transfer agent fees
|
49,391
|
|||
|
Fund accounting fees
|
28,298
|
|||
|
Other
|
20,229
|
|||
|
Independent director’s expenses and fees
|
25,812
|
|||
|
Professional services
|
18,444
|
|||
|
Custody fees
|
10,207
|
|||
|
Printing and supplies
|
7,784
|
|||
|
Total expenses
|
$
|
667,943
|
||
|
NET INVESTMENT INCOME:
|
$
|
386,320
|
||
|
NET REALIZED AND UNREALIZED GAIN ON INVESTMENTS:
|
||||
|
Net realized gain on investments
|
3,034,835
|
|||
|
Net change in unrealized appreciation of investments
|
25,472,519
|
|||
|
NET REALIZED AND UNREALIZED GAIN ON INVESTMENTS:
|
28,507,354
|
|||
|
NET INCREASE IN NET ASSETS RESULTING FROM OPERATIONS
|
$
|
28,893,674
|
||
See accompanying Notes to the Financial Statements.
14
BRIDGES INVESTMENT FUND, INC.
STATEMENTS OF CHANGES IN NET ASSETS
|
Six Months Ended
|
Year Ended
|
|||||||
|
June 30, 2019
|
December 31,
|
|||||||
|
(Unaudited)
|
2018
|
|||||||
|
OPERATIONS:
|
||||||||
|
Net investment income
|
$
|
386,320
|
$
|
649,216
|
||||
|
Net realized gain on investments
|
3,034,835
|
3,216,011
|
||||||
|
Net change in unrealized
|
||||||||
|
appreciation of investments
|
25,472,519
|
(10,380,404
|
)
|
|||||
|
Net increase/(decrease) in
|
||||||||
|
net assets resulting
|
||||||||
|
from operations
|
$
|
28,893,674
|
$
|
(6,515,177
|
)
|
|||
|
Distributions to shareholders:
|
||||||||
|
Distributions to shareholders
|
(397,310
|
)
|
(2,453,611
|
)
|
||||
|
Total distributions
|
$
|
(397,310
|
)
|
$
|
(2,453,611
|
)
|
||
|
Capital Share Transactions:
|
||||||||
|
Net increase in net assets
|
||||||||
|
from capital share transactions
|
269,109
|
15,929,902
|
||||||
|
Total Increase in net assets
|
$
|
28,765,473
|
$
|
6,961,114
|
||||
|
NET ASSETS:
|
||||||||
|
Beginning of the Period
|
$
|
151,571,438
|
$
|
144,610,324
|
||||
|
End of the Period
|
$
|
180,336,911
|
$
|
151,571,438
|
||||
See accompanying Notes to the Financial Statements.
15
BRIDGES INVESTMENT FUND, INC.
FINANCIAL HIGHLIGHTS
For a Fund share outstanding throughout the period
|
For the Six
|
||||||||||||||||||||||||
|
Months Ended
|
||||||||||||||||||||||||
|
June 30, 2019
|
Years Ended December 31,
|
|||||||||||||||||||||||
|
(Unaudited)
|
2018
|
2017
|
2016
|
2015
|
2014
|
|||||||||||||||||||
|
Net asset value,
|
||||||||||||||||||||||||
|
beginning of period
|
$
|
57.40
|
$
|
60.57
|
$
|
51.60
|
$
|
48.92
|
$
|
49.56
|
$
|
47.17
|
||||||||||||
|
Income from
|
||||||||||||||||||||||||
|
investment operations:
|
||||||||||||||||||||||||
|
Net investment income(1)
|
0.15
|
0.29
|
0.20
|
0.29
|
0.27
|
0.26
|
||||||||||||||||||
|
Net realized and
|
||||||||||||||||||||||||
|
unrealized gain/
|
||||||||||||||||||||||||
|
(loss) on investments
|
10.76
|
(2.51
|
)
|
11.08
|
3.15
|
(0.12
|
)
|
4.11
|
||||||||||||||||
|
Total from investment
|
||||||||||||||||||||||||
|
operations
|
10.91
|
(2.22
|
)
|
11.28
|
3.44
|
0.15
|
4.37
|
|||||||||||||||||
|
Less dividends
|
||||||||||||||||||||||||
|
and distributions:
|
||||||||||||||||||||||||
|
Dividends from net
|
||||||||||||||||||||||||
|
investment income
|
(0.15
|
)
|
(0.28
|
)
|
(0.20
|
)
|
(0.29
|
)
|
(0.27
|
)
|
(0.27
|
)
|
||||||||||||
|
Dividends from
|
||||||||||||||||||||||||
|
net realized gain
|
—
|
(0.67
|
)
|
(2.11
|
)
|
(0.47
|
)
|
(0.52
|
)
|
(1.71
|
)
|
|||||||||||||
|
Total distributions
|
(0.15
|
)
|
(0.95
|
)
|
(2.31
|
)
|
(0.76
|
)
|
(0.79
|
)
|
(1.98
|
)
|
||||||||||||
|
Net asset value,
|
||||||||||||||||||||||||
|
end of period
|
$
|
68.16
|
$
|
57.40
|
$
|
60.57
|
$
|
51.60
|
$
|
48.92
|
$
|
49.56
|
||||||||||||
|
Total return
|
19.01
|
%(2)
|
-3.76
|
%
|
21.98
|
%
|
7.09
|
%
|
0.33
|
%
|
9.37
|
%
|
||||||||||||
|
Supplemental data and ratios:
|
||||||||||||||||||||||||
|
Net assets, end of period
|
||||||||||||||||||||||||
|
(in thousands)
|
$
|
180,337
|
$
|
151,571
|
$
|
144,610
|
$
|
122,877
|
$
|
116,368
|
$
|
122,102
|
||||||||||||
|
Ratio of net expenses
|
||||||||||||||||||||||||
|
to average net assets:
|
0.79
|
%(3)
|
0.77
|
%
|
0.79
|
%
|
0.82
|
%
|
0.80
|
%
|
0.80
|
%
|
||||||||||||
|
Ratio of net investment
|
||||||||||||||||||||||||
|
income to average
|
||||||||||||||||||||||||
|
net assets:
|
0.46
|
%(3)
|
0.40
|
%
|
0.35
|
%
|
0.60
|
%
|
0.54
|
%
|
0.55
|
%
|
||||||||||||
|
Portfolio turnover rate
|
8.5
|
%(2)
|
2.8
|
%
|
4.7
|
%
|
10.7
|
%
|
13.2
|
%
|
13.6
|
%
|
||||||||||||
See accompanying Notes to the Financial Statements.
|
(1)
|
Net investment income per share is calculated using the ending balances prior to consideration of adjustment for permanent book-to-tax differences.
|
|
(2)
|
Not Annualized.
|
|
(3)
|
Annualized
|
16
BRIDGES INVESTMENT FUND, INC.
NOTES TO FINANCIAL STATEMENTS
JUNE 30, 2019
(Unaudited)
|
(1)
|
SUMMARY OF SIGNIFICANT ACCOUNTING POLICIES
|
|
|
Bridges Investment Fund, Inc. (the “Fund”) is registered under the Investment Company Act of 1940 as a diversified, open-end management investment company. The primary investment objective of the Fund is
long-term capital appreciation. In pursuit of that objective, the Fund invests primarily in common stocks. The following is a summary of significant accounting policies consistently followed by the Fund in the preparation of its financial
statements. The policies are in conformity with accounting principles generally accepted in the United States of America (“GAAP”). The Fund is an investment company and accordingly follows the investment company accounting and reporting
guidance of the Financial Accounting Standards Board (“FASB”) Accounting Standards Codification Topic 946 Financial Services – Investment Companies.
|
||
|
A.
|
Investments –
|
|
|
Security transactions are recorded on trade date. Dividend income is recognized on the ex-dividend date, and interest income is recognized on an accrual basis. Discount and premium on fixed income securities is
accreted or amortized into interest income using the effective interest method. Withholding taxes on foreign dividends, if any, have been provided for in accordance with the Fund’s understanding of the applicable country’s tax rules and
rates.
|
||
|
The net realized gain (loss) from the sales of securities is determined for income tax and accounting purposes on the basis of the cost of specific securities.
|
||
|
Securities owned are reflected in the accompanying Statement of Assets and Liabilities and the Schedule of Investments at fair value based on quoted market prices. Bonds and other fixed-income securities (other
than repurchase agreements and demand notes) are valued using market quotations or a matrix method provided by an independent pricing service. Other securities traded on a national securities exchange are valued at the last reported sale
price at the close of regular trading on each day the exchange is open for trading. Securities listed on the NASDAQ National Market System for which market quotations are readily available are valued using the NASDAQ Official Closing Price
(“NOCP”). If no sales were reported on that day, quoted market price represents the closing bid price.
|
||
|
Investments in registered open-end management investment companies will be valued based upon the Net Asset Values (“NAVs”) of such investments and are categorized as Level 1 of the fair value hierarchy.
|
||
17
|
Securities for which prices are not readily available are valued by the Fund’s valuation committee (the “Valuation Committee”) at a fair value determined in good faith under procedures established by and under
the general supervision of the Fund’s Board of Directors (the “Board”).
|
||
|
The Valuation Committee concludes that a price determined under the Fund’s valuation procedures is not readily available if, among other things, the Valuation Committee believes that the value of the security
might be materially affected by an intervening significant event. A significant event may be related to a single issuer, to an entire market sector, or to the entire market. These events may include, among other things: issuer-specific
events including rating agency action, earnings announcements and corporate actions, significant fluctuations in domestic or foreign markets, natural disasters, armed conflicts, and government actions. In the event that the market quotations
are not readily available, the fair value of such securities will be determined in good faith, taking into consideration: (i) fundamental analytical data relating to the investment; (ii) the nature and duration of restrictions on disposition
of the securities; and (iii) an evaluation of the forces which influence the market in which these securities are purchased and sold. The members of the Valuation Committee shall continuously monitor for significant events that might
necessitate the use of fair value procedures.
|
||
|
B.
|
Federal Income Taxes –
|
|
|
It is the Fund’s policy to comply with the requirements of the Internal Revenue Code applicable to Regulated Investment Companies (“RICs”) to distribute all of its taxable income to shareholders. Therefore, no
Federal income tax provision for the Fund is required. Under applicable foreign tax law, a withholding tax may be imposed on interest, dividends, and capital gains earned on foreign securities.
|
||
|
The character of distributions made during the year from net investment income or net realized gains may differ from its ultimate characterization for federal income tax purposes. In addition, due to the timing
of dividend distributions, the fiscal year in which amounts are distributed may differ from the year that the income or realized gains or losses were recorded by the Fund. The Fund has not reclassified the components of its capital accounts
for the year ended December 31, 2018.
|
||
|
The Fund has not recorded any liability for material unrecognized tax benefits as of December 31, 2018. It is the Fund’s policy to recognize accrued interest and penalties related to uncertain benefits in income
tax expense as appropriate.
|
||
|
C.
|
Distribution To Shareholders –
|
|
|
The Fund records and pays dividends to shareholders on a quarterly basis on the ex-dividend date. Distribution of net realized gains, if any, are recorded and made on an annual basis to shareholders on the
ex-dividend date.
|
18
|
D.
|
Use of Estimates –
|
|
|
The preparation of financial statements in conformity with GAAP requires management to make estimates and assumptions that affect the reported amounts of assets and liabilities and disclosure of contingent assets
and liabilities at the date of the financial statements and the reported amounts of increases and decreases in Net Assets from operations during the reporting period. Actual results could differ from those estimates.
|
||
|
E.
|
Fair Value Measurements –
|
|
|
GAAP defines fair value as the price that a Fund would receive upon selling an investment in a timely transaction to an independent buyer in the principal or most advantageous market of the investment. A
three-tier hierarchy is used to maximize the use of observable market data “inputs” and minimize the use of unobservable “inputs” and to establish classification of fair value measurements for disclosure purposes. Inputs refer broadly to the
assumptions that market participants would use in pricing the asset or liability, including assumptions about risk. Inputs may be observable or unobservable. Observable inputs are inputs that reflect the assumptions market participants
would use in pricing the asset or liability developed based on market data obtained from sources independent of the reporting entity. Unobservable inputs are inputs that reflect the reporting entity’s own assumptions about the assumptions
market participants would use in pricing the asset or liability developed based on the best information available in the circumstances. The three-tier hierarchy of inputs is summarized in the three broad Levels listed below:
|
|
Level 1 –
|
Unadjusted quoted prices in active markets for identical investments.
|
||
|
Level 2 –
|
Observable inputs other than quoted prices included in Level 1 that are observable for the asset or liability, either directly or indirectly. These inputs may include quoted prices for
the identical instrument on an inactive market, prices for similar instruments, interest rates, prepayment speeds, credit risk, yield curves, default rates and similar data.
|
||
|
Level 3 –
|
Unobservable inputs for the asset or liability, to the extent relevant observable inputs are not available; representing the Fund’s own assumptions about the assumptions a market
participant would use in valuing the asset or liability, and would be based on the best information available.
|
|
The valuation techniques used by the Fund to measure fair value for the six months ended June 30, 2019, maximized the use of observable inputs and minimized the use of
unobservable inputs. During the six months ended June 30, 2019, no securities held by the Fund were deemed Level 3.
|
19
|
The following is a summary of the inputs used as of June 30, 2019, in valuing the Fund’s investments carried at fair value:
|
|
Level 1
|
Level 2
|
Level 3
|
Total
|
|||||||||||||||
|
Investments
|
||||||||||||||||||
|
Common Stocks
|
$
|
157,045,487
|
$
|
—
|
$
|
—
|
$
|
157,045,487
|
||||||||||
|
Exchange Traded Funds
|
13,641,400
|
—
|
—
|
13,641,400
|
||||||||||||||
|
Short-Term Investments
|
9,974,351
|
—
|
—
|
9,974,351
|
||||||||||||||
|
Total Investments
|
||||||||||||||||||
|
in Securities
|
$
|
180,661,238
|
$
|
—
|
$
|
—
|
$
|
180,661,238
|
||||||||||
|
Refer to the Schedule of Investments for further information on the classification of investments.
|
|
(2)
|
INVESTMENT ADVISORY CONTRACT AND OTHER TRANSACTIONS WITH AFFILIATES
|
|
Under an Investment Advisory Contract, Bridges Investment Management, Inc. (the “Investment Adviser”) furnishes investment advisory services for the Fund. In return, the Fund has agreed to pay the Investment
Adviser a management fee computed on a quarterly basis at the rate of 1/8 of 1% of the average month-end net asset value of the Fund during the quarter, equivalent to 1/2 of 1% per annum. Certain officers and directors of the Fund are also
officers and directors of the Investment Adviser. These officers do not receive any compensation from the Fund other than that which is received indirectly through the Investment Adviser. For the six months ended June 30, 2019, the Fund
incurred $432,764 in advisory fees.
|
|
|
The contract between the Fund and the Investment Adviser provides that total expenses of the Fund in any year, exclusive of taxes, but including fees paid to the Investment Adviser, shall not exceed, in total, a
maximum of 1 and 1/2% of the average month end net asset value of the Fund for the year. Amounts, if any, expended in excess of this limitation are reimbursed by the Investment Adviser as specifically identified in the Investment Advisory
Contract. There were no amounts reimbursed during the six months ended June 30, 2019.
|
|
|
The Fund has entered into a Board-approved contract with the Investment Adviser in which the Investment Adviser acts as primary administrator to the Fund at an annual rate of $42,000, through quarterly payments
of $10,500, and U.S. Bancorp Fund Services, LLC, doing business as U.S. Bank Global Fund Services, acts as sub-administrator to the Fund. These administrative expenses are shown as Administration fees on the Statement of Operations. As of
June 30, 2019, $10,500 was due to the Investment Adviser for its services as primary administrator. This liability is included in the Accrued expenses on the Statement of Assets and Liabilities.
|
|
|
Quasar Distributors, LLC (the “Distributor”), a registered broker-dealer, acts as the Fund’s principal underwriter in a continuous public offering of the Fund’s shares. The Distributor is an affiliate of U.S.
Bancorp Fund Services, LLC.
|
20
|
(3)
|
SECURITY TRANSACTIONS
|
|
The cost of long-term investment purchases during the six months ended June 30, 2019 and 2018, was:
|
|
2019
|
2018
|
||||||||
|
Non U.S. government securities
|
$
|
13,972,657
|
$
|
1,169,950
|
|||||
|
Net proceeds from sales of long-term investments during the six months ended June 30, 2019 and 2018, were:
|
|
2019
|
2018
|
||||||||
|
Non U.S. government securities
|
$
|
13,620,539
|
$
|
950,083
|
|||||
|
There were no long-term U.S. government transactions for the six months ended June 30, 2019 and 2018.
|
|
|
(4)
|
NET ASSET VALUE
|
|
The NAV per share represents the effective price for all subscriptions and redemptions.
|
|
|
(5)
|
CAPITAL STOCK
|
|
Shares of capital stock issued and redeemed during the six months ended June 30, 2019 and 2018, were as follows:
|
|
2019
|
2018
|
||||||||
|
Shares sold
|
91,330
|
174,746
|
|||||||
|
Shares issued to shareholders in
|
|||||||||
|
reinvestment of net investment income
|
4,372
|
3,077
|
|||||||
|
95,702
|
177,823
|
||||||||
|
Shares redeemed
|
(90,612
|
)
|
(30,780
|
)
|
|||||
|
Net increase
|
5,090
|
147,043
|
|||||||
|
|
Value of capital stock issued and redeemed during the six months ended June 30, 2019 and 2018, were as follows: |
|
2019
|
2018
|
||||||||
|
Net proceeds from shares sold
|
$
|
5,759,033
|
$
|
10,922,405
|
|||||
|
Reinvestment of distributions
|
289,213
|
194,239
|
|||||||
|
|
6,048,246
|
11,116,644
|
|||||||
|
Cost of shares redeemed
|
(5,779,137
|
)
|
(1,962,331
|
)
|
|||||
|
Net increase
|
$
|
269,109
|
$
|
9,154,313
|
|||||
|
(6)
|
DISTRIBUTIONS TO SHAREHOLDERS
|
|
On March 29, 2019 and June 28, 2019, the Fund declared and paid ordinary income distributions to shareholders of record on March 28, 2019 and June 27, 2019,
respectively. These distributions were calculated at $0.085 and $0.065 per share, respectively.
|
21
|
(7)
|
FEDERAL INCOME TAX INFORMATION
|
|
The tax character of distributions during the years ended December 31, 2018 and 2017 were as follows:
|
|
Ordinary
|
Long-Term
|
Return of
|
|||||||||||
|
Income
|
Capital Gain
|
Capital
|
|||||||||||
|
12/31/18
|
$
|
720,658
|
$
|
1,732,953
|
$
|
—
|
|||||||
|
12/31/17
|
$
|
397,152
|
$
|
4,901,133
|
$
|
80,347
|
|||||||
|
As of December 31, 2018, the components of the tax basis cost of investments and net unrealized appreciation were as follows:
|
|
Federal tax cost of investments
|
$
|
81,915,124
|
|||
|
Unrealized appreciation
|
$
|
74,615,857
|
|||
|
Unrealized depreciation
|
(2,020,537
|
)
|
|||
|
Net unrealized appreciation
|
$
|
72,595,320
|
|
As of December 31, 2018, the components of distributable earnings on a tax basis were as follows:
|
|
Net unrealized appreciation
|
$
|
72,595,320
|
|||
|
Undistributed ordinary income
|
$
|
6,958
|
|||
|
Undistributed long term gains
|
1,458,025
|
||||
|
Accumulated gain
|
1,464,983
|
||||
|
Other accumulated gain/(loss)
|
—
|
||||
|
Total distributable earnings
|
$
|
74,060,303
|
|
As of December 31, 2018, the Fund did not have any capital loss carryovers.
|
|
(8)
|
NEW ACCOUNTING PRONOUNCEMENTS
|
|
In August 2018, FASB issued ASU 2018-13, Fair Value Measurement (Topic 820): Disclosure Framework – Changes to the Disclosure Requirements for Fair Value Measurement (“ASU 2018-13”). The primary focus of ASU
2018-13 is to improve the effectiveness of the disclosure requirements for fair value measurements. The changes affect all companies that are required to include fair value measurement disclosures. In general, the amendments in ASU 2018-13
are effective for all entities for fiscal years and interim periods within those fiscal years, beginning after December 15, 2019. An entity is permitted to early adopt the removed or modified disclosures upon the issuance of ASU 2018-13 and
may delay adoption of the additional disclosures, which are required for public companies only, until their effective date. Management has chosen to adopt this disclosure in this report.
|
|
|
In August 2018, the Securities and Exchange Commission issued Final Rule Release No. 33-10532, Disclosure Update and Simplification, which in part amends certain disclosure requirements of Regulation S-X that
have become redundant, duplicative, overlapping, outdated, or superseded, in light of other Commission disclosure requirements, U.S. Generally Accepted Accounting Principles, or changes in the information environment. The amendments are
intended to facilitate the disclosure of information to investors and simplify
|
22
|
compliance without significantly altering the total mix of information provided to investors. Management has chosen to adopt this disclosure in this report.
|
|
|
(9)
|
SUBSEQUENT EVENTS
|
|
In preparing these financial statements, the Fund has evaluated events and transactions for potential recognition or disclosure through the date the financial statements were issued, and has concluded that there
are no subsequent events of note through the date of issuance.
|
23
ADDITIONAL DISCLOSURES
Availability of Quarterly Portfolio Holdings Schedules
The Fund files its complete schedule of portfolio holdings with the SEC for the First and Third Quarters of each fiscal year on Form N-Q, which is available on the SEC’s website at http://www.sec.gov
or can be reviewed and copied at the SEC’s Public Reference Room in Washington, D.C. (information on the operation of the Public Reference Room may be obtained by calling 1-800-SEC-0330.) These reports can also be obtained from the Fund by sending an
e-mail to fund@bridgesinv.com or calling 1-800-939-8401.
Proxy Voting Policies and Procedures and Proxy Voting Record
A description of the policies and/procedures that the Fund uses to determine how to vote proxies relating to portfolio securities, and a report on how the Fund voted such proxies during the 12-month
period ended June 30, 2019 can be obtained by request and without charge from the Fund by sending an e-mail to fund@bridgesinv.com or calling 1-800-939-8401, or from the SEC’s website at http://www.sec.gov.
24
Disclosure Regarding Fund Directors and Officers
**Disinterested Persons Also Known as Independent Directors**
|
Name, Age,
|
|
|
Position with
|
|
|
Fund and Term
|
|
|
of Office
|
Principal Occupation(s) and Directorships*
|
|
Daniel J. Brabec
Age: 60
Director
(2015 – present)
|
Mr. Brabec is a Director of Spectrum Financial Services, Inc. in Omaha, Nebraska since February 1999 and serves as Senior Vice
President of Spectrum. He has directly managed real estate and commercial credit assets for a number of affiliates of
Spectrum Financial Services, Inc. since January 2009. Prior to that, he served as a Director of Great Western Bank, Omaha, Nebraska and was its Chief Executive Officer and President
from 2001 until its sale in 2008, and served as Controller for Great Western Bancorporation in an interim role from 1999 to 2001. He began his career in banking in 1985 joining Pioneer Bank, St Louis, Missouri after three years with Control
Data Corporation and served as Executive Vice President, Security Officer and Director of Rushmore Bank and Trust, Rapid City, South Dakota from 1993 to 1999. Mr. Brabec has been determined to be an “audit committee financial expert” within
the meaning of the Sarbanes Oxley Act of 2002 and the regulations related thereto by the Fund’s Board of Directors.
|
|
Nathan Phillips
|
Mr. Dodge is the President of NP Dodge Company since April 2014, and prior to that position, served as the Executive Vice
President. He has worked at NP Dodge Company since October, 1993. Mr. Dodge is also a principal officer and
director of a number of subsidiary and affiliated companies in the property management, insurance, and real estate syndication fields.
Mr. Dodge became a Director of Lauritzen Corp. in 2008 and of First State Bank of Loomis in 2003.
|
|
Dodge III
|
|
|
Age: 56
|
|
|
Director
|
|
|
(2010 – present)
|
|
|
Jeffrey C. Royal
|
Mr. Royal is the President of Dundee Bank, a community bank located in Omaha, Nebraska. He has served in that position
since January 2006. Prior to joining Dundee Bank, he was Second Vice President of First National Bank of Omaha.
Mr. Royal became a Director of Nicholas Financial, Inc. in 2017, a publicly traded company, a Director of Boston Omaha Corporation in 2019, a publicly traded company, and also serves as the Chairperson and a director of Mackey Banco, Inc. (the
holding company for Dundee Bank) and as a director of Brunswick State Bank, Tri-Valley Bank, and Eagle State Bank. |
|
Age: 43
|
|
|
Director
(2018 - present)
|
25
|
Name, Age,
|
|
|
Position with
|
|
|
Fund and Term
|
|
|
of Office
|
Principal Occupation(s) and Directorships*
|
|
Robert Slezak
|
Mr. Slezak was elected Chairperson on October 14, 2016, and prior to that time, served as Vice Chairperson commencing
|
|
Age: 61
|
April 10, 2012. Mr. Slezak is currently a private investor, and has been since November 1999. Prior to that, Mr. Slezak served
|
|
as Vice President, Chief Financial Officer and Treasurer of the Ameritrade Holding Corporation from January 1989 to
|
|
|
Director
|
November 1999 and as a director from October 1996 to September 2002. Mr. Slezak currently serves as a member of
|
|
(2008 – present)
|
the board of directors of The Pegasus Companies, Inc. (formerly, Xanadoo Company), a developer of solar power
|
|
projects. Mr. Slezak has been determined to be an “audit committee financial expert” within the meaning of the
|
|
|
Chairperson
|
Sarbanes Oxley Act of 2002 and the regulations related thereto by the Fund’s Board of Directors.
|
|
(2016 – present)
|
Mr. Slezak has been designated as the Lead Independent Director of the Fund.
|
|
|
|
|
Vice Chairperson
|
|
|
(2012 – 2016)
|
|
|
Kelly A. Walters
|
Kelly A. Walters is currently a partner with Kuehl Capital Holdings LLC and the Chief Executive Officer of Quarter Circle
|
|
Age: 58
|
Capital, an affiliate of Kuehl Capital Holdings. Prior to those positions, Mr. Walters was the President and Chief Executive
|
|
Officer of Condor Hospitality Trust, Inc. (formerly, Supertel Hospitality, Inc.), a NASDAQ listed hospitality real estate
|
|
|
Director
(2013 – present)
|
investment trust based in Norfolk, Nebraska (Condor), from April 2009 through February 2015. Prior to joining Condor, Mr. Walters was the Senior Vice President of Capital Markets at Investors Real Estate Trust from October 2006 to March
2009. Prior to IRET, Mr. Walters was a Senior Vice President and Chief Investment Officer of Magnum Resources, Inc., a privately held real estate investment and operating company, from 1996 to 2006. Prior to Magnum, Mr. Walters was a
Deputy Manager of Brown Brothers Harriman from 1993 to 1996, an Investment Manager at Peter Kiewit Sons, Inc. from 1985 to 1993, and a stockbroker at Piper, Jaffray and Hopwood from 1983 to 1985. Mr. Walters has been determined to be an
“audit committee financial expert” within the meaning of the Sarbanes Oxley Act of 2002 and the regulations related thereto by the Fund’s Board of Directors.
|
26
|
Name, Age,
|
|
|
Position with
|
|
|
Fund and Term
|
|
|
of Office
|
Principal Occupation(s) and Directorships*
|
|
Lyn Wallin
|
Ms. Wallin Ziegenbein is an attorney and currently serves as the Executive Director Emerita of the Peter Kiewit Foundation,
|
|
Ziegenbein
|
a private foundation awarding charitable grants throughout Nebraska and portions of Iowa and Wyoming, since April 2013,
|
|
Age: 67
|
and has served as the Executive Director of the Peter Kiewit Foundation since March, 1983. Commencing in 2017,
Ms. Wallin Ziegenbein also serves as the Manager of Future Forward, LLC, an Omaha based investor group, and
|
|
Director
(2013 – present)
|
New North Makerhood, Inc., a nonprofit organization, together these entities are developing property in downtown Omaha, Nebraska for the purpose of creating an “arts and trades” district. Ms. Wallin Ziegenbein has served on the Board of
Directors of Assurity Life Insurance Company since 1984 and served on the Board of Lamp Rynearson Engineering until December 31, 2017. Previously, Ms. Wallin Ziegenbein served on the Federal Reserve Bank of Kansas City’s Omaha Branch Board
of Directors from 2006 to 2011. Ms. Wallin Ziegenbein’s prior experience also includes serving as a director of Norwest Bank Nebraska and Lincoln Telephone and Telegraph. Ms. Wallin Ziegenbein also served as an Assistant United States
Attorney for Nebraska from 1978 to 1982.
|
|
*
|
Except as otherwise indicated, each individual has held the position shown or other positions in the same company for the last five years.
|
The address for all Fund Directors is, 1125 South 103rd Street; Suite 580, Omaha, Nebraska 68124.
27
Interested Person Directors and Officers
The following Directors and Officers are interested persons of the Fund. The determination of an interested person is based on the definition in Section 2(a)(19) of the Investment Company Act of 1940 and Securities and
Exchange Commission Release (Release No. IC-24083, dated October 14, 1999), providing additional guidance to investment companies about the types of professional and business relationships that may be considered to be material for purposes of Section
2(a)(19).
|
Name, Age,
|
||
|
Position with
|
||
|
Fund and Term
|
||
|
of Office
|
Principal Occupation(s) and Directorships*
|
|
|
Edson L.
|
Since December 2000, Mr. Bridges has been President, Chief Executive Officer, and Director of Bridges Investment
|
|
|
Bridges III, CFA
|
Management, Inc. Since August of 1983, Mr. Bridges was a full-time member of the professional staff of Bridges Investment
|
|
|
Age: 61
|
Counsel, Inc. where he has served as Executive Vice President since 1993. Mr. Bridges is also a Director of that firm.
|
|
|
Mr. Bridges has been responsible for securities research and the investment management for an expanding base of
|
||
|
President
|
discretionary management accounts, including the Fund, for more than 15 years. Mr. Bridges was elected President of
|
|
|
(1997 – present)
|
Bridges Investment Fund, Inc. on April 11, 1997, and he assumed the position of Portfolio Manager at the close of
|
|
|
business on that date. Mr. Bridges became Chief Executive and Investment Officer of the Fund on April 13, 2004.
|
||
|
Chief Executive
Officer
(2004 - present)
|
Mr. Bridges is Chairperson, and a director of Bridges Investor Services, Inc., Chairperson of the Board and a director of Bridges Trust Company, and since 2017, a director of Bridges Holding Company. Mr. Bridges served as a Director of
Stratus Fund, Inc., an open-end, regulated investment company located in Lincoln, Nebraska from 1990 to 2016, and was previously Chairperson of the Audit Committee of the Stratus Fund.
|
|
|
Director
|
|
|
|
(1991 – present)
|
|
|
|
|
||
|
Robert W.
|
Mr. Bridges is an Executive Director, Portfolio Manager, and Co-Head of Behavioral Finance at Sterling Capital Management
|
|
|
Bridges, CFA
|
LLC. Sterling Capital Management LLC, located in Charlotte, North Carolina, is an investment management company
|
|
|
Age: 53
|
founded in 1970. Mr. Bridges commenced his career with Sterling Capital Management, LLC in 1996 and served in a
|
|
|
Director
(2007 – present)
|
variety of capacities including client service, systems integration, and compliance before assuming his current position in 2000. Mr. Bridges has been a Director of Bridges Investment Counsel, Inc. since December 2006, a Director of
Bridges Trust Company since 2007, and a Director of Bridges Holding Company since 2017. Prior to joining Sterling, Mr. Bridges served in accounting, research analysis and several other roles for Bridges Investment Counsel, Inc. for six
years. Mr. Bridges earned his B.S. in Business from Wake Forest University, and became a CFA charter holder in 2003.
|
|
28
Additional Officers of the Fund
|
Name, Age,
|
|
|
Position with
|
|
|
Fund and Term
|
|
|
of Office
|
Principal Occupation(s) and Directorships*
|
|
Edson L.
|
Mr. Bridges was elected Chairperson Emeritus on April 15, 2006. Mr. Bridges had previously served as Chairperson,
|
|
Bridges II, CFA
|
Vice-Chairperson, Chief Executive Officer, and President of the Fund. Mr. Bridges was replaced by Edson L. Bridges III as Chief
|
|
Age: 87
|
Executive Officer of the Fund on April 13, 2004. Mr. Bridges currently is the Continuity and Research Officer for Bridges
|
|
Investment Management and served as a director from 2000 – 2017. In September, 1959, Mr. Bridges became associated with
|
|
|
Chairperson
|
the predecessor firm to Bridges Investment Counsel, Inc. (BIC) and is presently the President, Director, CEO, and Chief
|
|
Emeritus
|
Compliance Officer of Bridges Investment Counsel, Inc. BIC voluntarily withdrew its registration as an SEC registered
|
|
(2006 – present)
|
investment advisor as of December 26, 2017, which registration commenced January 1946. Mr. Bridges is also
|
|
President and Director of Bridges Investor Services, Inc. During his tenure, Mr. Bridges also served as President, Director, and
|
|
|
Vice-Chairperson
|
Chief Executive Officer of Provident Trust Company (n/k/a Bridges Trust Company), originally chartered to conduct
|
|
(2005 – 2006)
|
business on March 11, 1992 and is currently the Continuity and Research Officer for Bridges Trust Company.
|
|
|
|
|
Chairperson
|
|
|
(1997-2005)
|
|
|
|
|
|
Chief Executive
|
|
|
Officer
|
|
|
(1997 - 2004)
|
|
|
|
|
|
President
|
|
|
(1970-1997)
|
|
|
Director
|
|
|
(1963 – 2007)
|
|
|
Nancy K. Dodge
|
Ms. Dodge has been an employee of Bridges Investment Management, Inc. since 1994, where she serves as a Vice
|
|
Age: 58
|
President. After joining Bridges Investment Counsel, Inc. in January of 1980, her career progressed through the accounting
|
|
department of that Firm, to her present position as Vice President. Ms. Dodge is the person primarily responsible for
|
|
|
Treasurer
|
overseeing day to day operations for the Fund, and she is also the key person for handling relations with shareholders, the
|
|
(1986 – present)
|
custodian bank, transfer agent, and the independent registered public accounting firm. She was appointed Chief
|
|
Compliance Officer of the Fund, as of November 21, 2006, and Services, Inc., and a Vice President and Trust Officer
|
|
|
Chief Compliance
|
for Bridges Trust Company.
|
|
Officer
|
|
|
(2006 – present)
|
|
|
|
|
|
Secretary
|
|
|
(2017 – present)
|
|
29
|
Name, Age,
|
|
|
Position with
|
|
|
Fund and Term
|
|
|
of Office
|
Principal Occupation(s) and Directorships*
|
|
Brian
|
Mr. Kirkpatrick has been an employee of Bridges Investment Management since 1994. Mr. Kirkpatrick serves as a Senior
|
|
Kirkpatrick, CFA
|
Vice President, Director of Research, Chief Compliance Officer, and Director of Bridges Investment Management. Having joined
|
|
Age: 48
|
Bridges Investment Counsel, Inc. on August 24, 1992, he is a Senior Vice President of Bridges Investment Counsel, and has
|
|
been a full-time member of the professional staff of Bridges Investment Counsel, Inc., responsible for securities research,
|
|
|
Executive
|
and the investment management for an expanding base of discretionary management accounts, including the Fund,
|
|
Vice President
|
for more than 15 years. Mr. Kirkpatrick was appointed Sub Portfolio Manager of the Fund on April 12, 2005.
|
|
(2006 – present)
|
|
|
|
|
|
Vice President
|
|
|
(2000 – 2006)
|
|
|
Trinh Wu
|
Ms. Wu has been an employee of Bridges Investment Management and has served Bridges Investment Counsel, Inc.
|
|
Age: 62
|
since February 1, 1997. Ms. Wu has functioned as the lead accountant for the day to day operation of the Fund. Ms. Wu
|
|
currently is the Senior Accountant of Bridges Investment Counsel, Inc. Prior to her employment at Bridges
|
|
|
Controller
(2001 – present)
|
Investment Management, Inc., Ms. Wu performed operating and accounting activities for 17 years in the Estate and Trust Department of the predecessor institutions to U.S. Bank, N.A. Nebraska. Ms. Wu was elected to the position of
Controller of the Fund at the October 16, 2001 meeting of the Board of Directors. Ms. Wu is also Vice President Operations for Bridges Trust Company.
|
|
*
|
Except as otherwise indicated, each individual has held the position shown or other positions in the same company for the last five years.
|
The address for all Fund Officers is, 1125 South 103rd Street; Suite 580; Omaha, Nebraska 68124.
The Statement of Additional Information (SAI) includes additional information about Fund directors and is available at the Fund’s website, www.bridgesfund.com,
or by calling 1-800-939-8401.
30
(This Page Intentionally Left Blank.)
|
|
|
|
1125 South 103rd Street, Suite 580
Omaha, Nebraska 68124
Telephone 402-397-4700
Facsimile 402-397-1555
Directors
|
Daniel J. Brabec
|
Jeffrey C. Royal
|
|
Edson L. Bridges III
|
Robert T. Slezak
|
|
Robert W. Bridges
|
Kelly A. Walters
|
|
Nathan Phillips Dodge III
|
Lyn Wallin Ziegenbein
|
|
Officers
|
|
|
Robert T. Slezak
|
Chairperson and Lead Independent Director
|
|
Lyn Wallin Ziegenbein
|
Vice Chairperson
|
|
Edson L. Bridges II
|
Chairperson Emeritus
|
|
Edson L. Bridges III
|
President and Chief Executive and
|
|
Investment Officer
|
|
|
Brian M. Kirkpatrick
|
Executive Vice President
|
|
Nancy K. Dodge
|
Secretary, Treasurer and Chief Compliance
|
|
Officer
|
|
|
Trinh Wu
|
Controller
|
Independent Registered Public Accounting Firm
Cohen & Company, Ltd.
342 North Water Street, Suite 830
Milwaukee, Wisconsin 53202
|
Corporate Counsel
|
Counsel to Independent Directors
|
|
Baird Holm LLP
|
Husch Blackwell LLP
|
|
Attorneys at Law
|
13330 California Street
|
|
1700 Farnam Street
|
Suite 200
|
|
Suite 1500
|
Omaha, Nebraska 68154
|
|
Omaha, Nebraska 68102
|
Distributor
Quasar Distributors, LLC
777 East Wisconsin Avenue
6th Floor
Milwaukee, Wisconsin 53202
|
|
|
|
Item 2. Code of Ethics.
Not applicable for semi-annual reports.
Item 3. Audit Committee Financial Expert.
Not applicable for semi-annual reports.
Item 4. Principal Accountant Fees and Services.
Not applicable for semi-annual reports.
Item 5. Audit Committee of Listed Registrants.
Not applicable to registrants who are not listed issuers (as defined in Rule 10A-3 under the Securities Exchange Act of 1934).
Item 6. Investments.
(a) Schedule of Investments is included as part of the report to shareholders filed under Item 1 of this Form.
(b) Not Applicable.
Item 7. Disclosure of Proxy Voting Policies and Procedures for Closed-End Management Investment Companies.
Not applicable to open-end investment companies.
Item 8. Portfolio Managers of Closed-End Management Investment Companies.
Not applicable to open-end investment companies.
Item 9. Purchases of Equity Securities by Closed‑End Management Investment Company and Affiliated Purchasers.
Not applicable to open-end investment companies.
Item 10. Submission of Matters to a Vote of Security Holders.
There have been no material changes to the procedures by which shareholders may recommend nominees to the registrant’s board of directors.
Item 11. Controls and Procedures.
|
(a)
|
The Registrant’s President and Treasurer have reviewed the Registrant's disclosure controls and procedures (as defined in Rule 30a-3(c) under the Investment Company Act of 1940 (the “Act”)) as of a date within 90 days of the filing of
this report, as required by Rule 30a-3(b) under the Act and Rules 13a-15(b) or 15d‑15(b) under the Securities Exchange Act of 1934. Based on their review, such officers have concluded that the disclosure controls and procedures are
effective in ensuring that information required to be disclosed in this report is appropriately recorded, processed, summarized and reported and made known to them by others within the Registrant and by the Registrant’s service provider.
|
|
(b)
|
There were no changes in the Registrant's internal control over financial reporting (as defined in Rule 30a-3(d) under the Act) that occurred during the second fiscal quarter of the period covered by this report that has materially
affected, or is reasonably likely to materially affect, the Registrant's internal control over financial reporting.
|
Item 12. Exhibits.
|
(a)
|
(1) Any code of ethics or amendment thereto, that is the subject of the disclosure required by Item 2, to the extent that the registrant intends to satisfy Item 2 requirements through filing an
exhibit. Incorporated by reference to the Registrant’s Form N-CSR filed March 3, 2008.
|
(2) A separate certification for each principal executive and principal financial officer pursuant to Section 302 of the Sarbanes-Oxley Act of 2002. Filed herewith.
(3) Any written solicitation to purchase securities under Rule 23c‑1 under the Act sent or given during the period covered by the report by or on behalf of the registrant to 10 or
more persons. Not applicable to open-end investment companies.
|
(b)
|
Certifications pursuant to Section 906 of the Sarbanes‑Oxley Act of 2002. Furnished herewith.
|
SIGNATURES
Pursuant to the requirements of the Securities Exchange Act of 1934 and the Investment Company Act of 1940, the registrant has duly caused this report to be signed on its behalf by the undersigned, thereunto duly
authorized.
(Registrant) Bridges Investment Fund
By (Signature and Title)* /s/Edson L. Bridges III
Edson L. Bridges III, President, CEO, CIO
Date September 9, 2019
Pursuant to the requirements of the Securities Exchange Act of 1934 and the Investment Company Act of 1940, this report has been signed below by the following persons on behalf of the registrant and in the capacities
and on the dates indicated.
By (Signature and Title)* /s/Edson L. Bridges III
Edson L. Bridges III, President, CEO, CIO
Date September 9, 2019
By (Signature and Title)* /s/Brian M. Kirkpatrick
Brian M. Kirkpatrick, Executive Vice President
Date September 9, 2019
By (Signature and Title)* /s/Nancy K. Dodge
Nancy K. Dodge, Secretary, Treasurer, CCO,
Principal Financial Officer
Date September 9, 2019
* Print the name and title of each signing officer under his or her signature.