UNITED STATES
SECURITIES AND EXCHANGE COMMISSION
Washington, D.C. 20549
SECURITIES AND EXCHANGE COMMISSION
Washington, D.C. 20549
FORM N-CSR
CERTIFIED SHAREHOLDER REPORT OF REGISTERED
MANAGEMENT INVESTMENT COMPANIES
Investment Company Act file number 811-01209
Bridges Investment Fund, Inc.
(Exact name of registrant as specified in charter)
(Exact name of registrant as specified in charter)
8401 West Dodge Road, Suite 256
Omaha, NE 68114
(Address of principal executive offices) (Zip code)
(Address of principal executive offices) (Zip code)
Edson L. Bridges III
8401 West Dodge Road, Suite 256
Omaha, NE 68114
(Name and address of agent for service)
(Name and address of agent for service)
(402) 397-4700
Registrant's telephone number, including area code
Date of fiscal year end: December 31, 2017
Date of reporting period: December 31, 2017
Item 1. Reports to Stockholders.

Fifty-Fifth
Annual Shareholder Report
2017
8401 West Dodge Road - Suite 256 - Omaha, NE 68114
P: (402) 397-4700 F: (402) 397-8617 www.bridgesfund.com
(This Page Intentionally Left Blank.)
Contents of Report
|
Page 1
|
Shareholder Letter
|
|
Exhibit 1
|
Portfolio Transactions During the
|
|
Page 4
|
Period from July 1, 2017 through
|
|
December 31, 2017
|
|
|
Exhibit 2
|
Selected Historical Financial Information
|
|
Pages 5-6
|
|
|
Pages 7-8
|
Expense Example
|
|
Page 9
|
Allocation of Portfolio Holdings
|
|
Pages 10-24
|
Financial Statements and Report of
|
|
Independent Registered Public
|
|
|
Accounting Firm
|
|
|
Page 25
|
Privacy Policy
|
|
Pages 26-27
|
Additional Disclosures
|
|
MD&A 1 – 11
|
Management Discussion and Analysis
|
IMPORTANT NOTICES
Must be preceded or accompanied by a Prospectus.
Opinions expressed herein are those of Edson L. Bridges III and are subject to change. They are not guarantees and should not be considered investment advice.
Fund holdings and sector allocations are subject to change at any time and should not be considered a recommendation to buy or sell any security. Current and future portfolio holdings are subject to risk. Please refer to the Schedule of Investments for complete fund holdings.
The S&P 500 Index is a broadly based unmanaged composite of 500 stocks which is widely recognized as representative of price changes for the U.S. equity market in general. The Russell 1000 Growth Index is an unmanaged composite of stocks that measures the performance of the stocks of companies with higher price-to-book ratios and higher forecasted growth values from a universe of the 1,000 largest U.S. companies based on total market capitalization. You cannot invest directly in a specific index.
Free Cash Flow is a measure of financial performance calculated as operating cash flow minus capital expenditures. Free cash flow (FCF) represents the cash that a company is able to generate after laying out the money required to maintain or expand its asset base.
Cash Flow is the net amount of cash and cash-equivalents moving into and out of a business.
The Price-to-Earnings Ratio or P/E ratio is a ratio for valuing a company that measures its current share price relative to its per-share earnings.
Earnings growth for a Fund holding does not guarantee a corresponding increase in market value of the holding or the Fund.
Mutual fund investing involves risk. Principal loss is possible. Small and medium capitalization companies tend to have limited liquidity and greater price volatility than large-capitalization companies. Investments in debt securities typically decrease in value when interest rates rise. This risk is usually greater for longer-term debt securities.
The Fund invests in foreign securities which involve political, economic and currency risks, greater volatility and differences in accounting methods.
While the fund is no-load, management fees and other expenses still apply.
The Bridges Investment Fund, Inc. is distributed by Quasar Distributors.

January 15, 2018
Dear Shareholder:
Performance
Bridges Investment Fund had a total return of 21.98% for the one year period ending December 31, 2017. By comparison, the S&P 500 had a total return of 21.83%, while the Russell 1000 Growth Index finished up 30.21% for the year. The Fund had annualized total returns of 9.44%, 13.78%, and 7.81% for the 3, 5, and 10 year periods ending December 31, 2017, compared to total returns of 11.41%, 15.79%, and 8.50% for the S&P 500, and 13.79%,17.33%, and 10.00% for the Russell 1000 Growth Index over the same periods of time. Three, five, and ten year periods are annualized. The Fund’s gross expense ratio is 0.84%, as disclosed in the most recent Prospectus.
Performance data quoted represents past performance. Past performance does not guarantee future results. The investment return and principal value of an investment will fluctuate so that an investor’s shares, when redeemed, may be worth more or less than their original cost. Current performance of the Fund may be lower or higher than the performance stated above. Performance data current to the most recent month end may be obtained by calling 866-934-4700.
Review of 2017 and Outlook for 2018
U.S. equities enjoyed strong total returns in 2017, propelled by 1) better than expected corporate earnings growth, 2) a benign interest rate environment, 3) anticipation of corporate income tax cut legislation (which happened in December), and 4) an expansion of equity valuation metrics.
The year was notable for the lack of normal stock price volatility – stock prices essentially worked gradually higher throughout the year.
Stock price gains were broad. Technology was the strongest sector in the market; large cap stocks and growth-oriented companies were generally stronger than smaller cap companies and value-oriented stocks.
We remain positive on the outlook for equities in 2018.
Our constructive stance on stocks is based on the following factors:
|
1.
|
We expect corporate earnings to continue to show positive growth, which should be helped by corporate income tax cuts.
|
|
|
2.
|
Valuations for stocks are close to our estimate of fair value, given expected earnings growth over the next several years, and a relatively low interest rate environment.
|
We have established a 2018 year-end fair value target range of 2,700-3,100 for the S&P 500 (about 19.0x estimated 2018 earnings of $150-157), which implies upside of roughly 8-10% from the S&P’s 2017 year-end level of 2,674. Our preliminary year-end 2019 fair value target range is 2,875-3,325 (19.0x estimated 2019 earnings of $164-170). Our single point year-end fair value estimates for the S&P 500 for 2018 and 2019 are 3,000 and 3,200, respectively.
|
Shareholder Letter
|
January 15, 2018
|
Risks to our generally constructive outlook for equities include: 1) a significant slowdown in corporate earnings growth; 2) faster than anticipated inflation (consensus inflation expectations are currently the lowest in many years); 3) investor unwillingness to pay high-teens or low 20’s multiples for stocks (essentially, a change in prevailing investor sentiment from “constructive” to “concerned”); 4) a deterioration in the domestic political climate around the 2018 mid-term elections; 5) slow or no progress by the Trump Administration against stated policy objectives and/or an exodus of the Administration’s key leaders; and 6) a resumption/worsening of global terrorist activity.
We expect a return to more normal levels of stock price volatility over the 2018-19 time frame. While this increases risk to equity investors in the short run, it also creates more opportunities to add to strong companies at relatively more attractive valuations. We would not be surprised to see the stock market both 20% lower and 20% higher than 2017 year-end levels over the course of 2018.
The strong gains in stocks over the past five years have lowered implied returns over the next three to five years, but we believe that stocks remain attractive relative to bonds.
Longer term, we believe equities are currently priced to return between 5-9% annually over the next 5 to 10 years, assuming long term earnings growth of 5-7% and a P/E range of 15-20x (versus a long historic average P/E of 16x for the S&P 500). We expect corporate earnings growth will be higher than long-term trend during 2018 (+10% for the S&P 500 versus 2017), driven by improving economic conditions world-wide, and corporate tax cuts in the U.S. This may support higher equity valuations than normal as long as earnings momentum remains positive.
We continue to favor equities that have strong business franchises and an ability to grow revenues, cash flows, earnings, dividends, and underlying business value at solid rates despite a continued sluggish and highly competitive global economic environment. We believe that companies that are able to achieve solid growth in business value should be able to generate total returns for their shareholders that are commensurate with business value growth.
Our Portfolio
The Fund’s portfolio continues to be comprised primarily of companies with strong balance sheets, high levels of profitability, and a demonstrated ability to grow business value over the long run despite periodically challenging economic conditions.
The following table summarizes the changes we made in the Fund in 2017:
|
NEW BUYS:
|
ADDS:
|
TRIMS:
|
SELLS:
|
|
Boeing
|
Celgene
|
Altria
|
Apache
|
|
Goldman Sachs
|
Facebook
|
Ameriprise Financial
|
Bioverativ
|
|
IQVIA
|
FedEx
|
Apple
|
DaVita
|
|
Martin Marietta
|
Gilead Sciences
|
Capital One
|
Goldman Sachs
|
|
Materials
|
Home Depot
|
Eaton
|
Level 3
|
|
iShares Core S&P
|
Express Scripts
|
T Rowe Price
|
|
|
Small Cap ETF
|
Gilead Sciences
|
||
|
Thermo Fisher
|
MasterCard
|
||
|
Scientific
|
Philip Morris
|
||
|
Visa
|
International | ||
|
|
Union Pacific
|
||
|
Visa
|
|||
|
Wells Fargo
|
|||
2
|
Shareholder Letter
|
January 15, 2018
|
The companies that were the most additive to the Fund’s return in 2017 included Alphabet, Amazon, Apple, Blackrock, Facebook, MasterCard, PayPal, and Visa.
The companies that were the largest drag on performance in 2017 included Allergan, Celgene, Disney, Express Scripts, Gilead Sciences, Qualcomm, and Starbucks.
We believe the Fund’s holdings are both 1) well-positioned to grow their business value over the next several years, and 2) valued at levels that are reasonably attractive over the long-run given our assessment of their business value growth potential.
We believe the Fund’s holdings are attractively valued looking out over the next several years. At present, the Fund’s portfolio trades at 28.6x estimated 2018 earnings and 25.2x estimated 2019 earnings, and have projected long term annual earnings growth of 12-14%. This compares with the 17.8x 2018 P/E, 16.2x 2019 P/E, and 5-7% long term annual earnings growth projected for the S&P 500. The Fund’s holding in Amazon (P/E of 169x 2018 estimated earnings, P/E of 95x estimated 2019 earnings) skews the aggregate portfolio valuation metrics materially higher.
The Fund’s investment process continues to emphasize the following core tenets:
|
1.
|
A focus on high quality companies with good prospects for growing their business value at attractive rates of growth over time
|
|
|
2.
|
A strong valuation discipline
|
|
|
3.
|
A long term approach to equity investing
|
Our investment management approach is based on the premise that over the long run, good businesses produce good investment returns for their shareholders. We seek to identify and own high quality, undervalued businesses that are growing business value for their shareholders at attractive rates.
Over time, we expect to benefit from our investment approach in two ways: 1) as our companies move from undervalued toward our estimate of fair value (positive change in valuation), and 2) from the growth in our companies’ underlying business value over time (increasing revenues, earnings, dividends, and free cash flow).
We remain confident that our investment approach should be effective over the long run, as stock prices tend to track underlying changes in business value over the long-run.
The Fund will hold its 55th annual meeting on Tuesday, April 3, 2018. Fund management will provide its outlook for the capital markets and the Fund for 2018 and beyond. We appreciate your continued investment in the Fund, and encourage all shareholders to attend this year’s annual meeting.
|
Sincerely,
|
|
 |
|
|
Edson L. Bridges III, CFA
|
|
|
President and Chief Executive Officer
|
|
3
Exhibit 1
BRIDGES INVESTMENT FUND, INC.
PORTFOLIO TRANSACTIONS
DURING THE PERIOD FROM
JULY 1, 2017 THROUGH DECEMBER 31, 2017
(Unaudited)
|
Bought or
|
Held After
|
|||||||
|
Securities
|
Received
|
Transactions
|
||||||
|
Common Stock Unless
|
$1,000 Par
|
$1,000 Par
|
||||||
|
Described Otherwise
|
Value (M)
|
Value (M)
|
||||||
|
or Shares
|
or Shares
|
|||||||
|
Boeing Co.
|
2,000
|
2,000
|
||||||
|
IQVIA Holdings, Inc.
|
5,000
|
5,000
|
||||||
|
Martin Marietta Materials, Inc.
|
3,000
|
3,000
|
||||||
|
Sold or
|
Held After
|
|||||||
|
Securities
|
Exchanged
|
Transactions
|
||||||
|
Common Stock Unless
|
$1,000 Par
|
$1,000 Par
|
||||||
|
Described Otherwise
|
Value (M)
|
Value (M)
|
||||||
|
or Shares
|
or Shares
|
|||||||
|
Apache Corp.
|
20,000
|
—
|
||||||
|
Capital One Financial Corp.
|
5,000
|
30,000
|
||||||
|
Spectra Energy Capital, LLC(1)
|
||||||||
|
8.000% due 10/01/2019
|
250,000
|
—
|
||||||
|
Gilead Sciences, Inc.
|
3,000
|
17,000
|
||||||
|
The Goldman Sachs Group, Inc.
|
6,000
|
—
|
||||||
|
Level 3 Communications, Inc.
|
20,000
|
—
|
||||||
|
(1)
|
Called in Full on 07/06/2017.
|
4
Exhibit 2
BRIDGES INVESTMENT FUND, INC.
SELECTED HISTORICAL FINANCIAL INFORMATION
(Unaudited)
– – – – – – – – – – – Year End Statistics – – – – – – – – – – –
|
Valuation
|
Net
|
Shares
|
Net Asset
|
Dividend/
|
Capital
|
|||||||||||||||||
|
Date
|
Assets
|
Outstanding
|
Value/Share
|
Share
|
Gains/Share
|
|||||||||||||||||
|
07-01-63
|
$
|
109,000
|
10,900
|
$
|
10.00
|
$
|
—
|
$
|
—
|
|||||||||||||
|
12-31-63
|
159,187
|
15,510
|
10.13
|
.07
|
—
|
|||||||||||||||||
|
12-31-64
|
369,149
|
33,643
|
10.97
|
.28
|
—
|
|||||||||||||||||
|
12-31-65
|
621,241
|
51,607
|
12.04
|
.285
|
.028
|
|||||||||||||||||
|
12-31-66
|
651,282
|
59,365
|
10.97
|
.295
|
—
|
|||||||||||||||||
|
12-31-67
|
850,119
|
64,427
|
13.20
|
.295
|
—
|
|||||||||||||||||
|
12-31-68
|
1,103,734
|
74,502
|
14.81
|
.315
|
—
|
|||||||||||||||||
|
12-31-69
|
1,085,186
|
84,807
|
12.80
|
.36
|
—
|
|||||||||||||||||
|
12-31-70
|
1,054,162
|
90,941
|
11.59
|
.37
|
—
|
|||||||||||||||||
|
12-31-71
|
1,236,601
|
93,285
|
13.26
|
.37
|
—
|
|||||||||||||||||
|
12-31-72
|
1,272,570
|
93,673
|
13.59
|
.35
|
.08
|
|||||||||||||||||
|
12-31-73
|
1,025,521
|
100,282
|
10.23
|
.34
|
.07
|
|||||||||||||||||
|
12-31-74
|
757,545
|
106,909
|
7.09
|
.35
|
—
|
|||||||||||||||||
|
12-31-75
|
1,056,439
|
111,619
|
9.46
|
.35
|
—
|
|||||||||||||||||
|
12-31-76
|
1,402,661
|
124,264
|
11.29
|
.38
|
—
|
|||||||||||||||||
|
12-31-77
|
1,505,147
|
145,252
|
10.36
|
.428
|
.862
|
|||||||||||||||||
|
12-31-78
|
1,574,097
|
153,728
|
10.24
|
.481
|
.049
|
|||||||||||||||||
|
12-31-79
|
1,872,059
|
165,806
|
11.29
|
.474
|
.051
|
|||||||||||||||||
|
12-31-80
|
2,416,997
|
177,025
|
13.65
|
.55
|
.0525
|
|||||||||||||||||
|
12-31-81
|
2,315,441
|
185,009
|
12.52
|
.63
|
.0868
|
|||||||||||||||||
|
12-31-82
|
2,593,411
|
195,469
|
13.27
|
.78
|
.19123
|
|||||||||||||||||
|
12-31-83
|
3,345,988
|
229,238
|
14.60
|
.85
|
.25
|
|||||||||||||||||
|
12-31-84
|
3,727,899
|
278,241
|
13.40
|
.80
|
.50
|
|||||||||||||||||
|
12-31-85
|
4,962,325
|
318,589
|
15.58
|
.70
|
.68
|
|||||||||||||||||
|
12-31-86
|
6,701,786
|
407,265
|
16.46
|
.688
|
.86227
|
|||||||||||||||||
|
12-31-87
|
7,876,275
|
525,238
|
15.00
|
.656
|
1.03960
|
|||||||||||||||||
|
12-31-88
|
8,592,807
|
610,504
|
14.07
|
.85
|
1.10967
|
|||||||||||||||||
|
12-31-89
|
10,895,182
|
682,321
|
15.97
|
.67
|
.53769
|
|||||||||||||||||
|
12-31-90
|
11,283,448
|
744,734
|
15.15
|
.67
|
.40297
|
|||||||||||||||||
|
12-31-91
|
14,374,679
|
831,027
|
17.30
|
.66
|
.29292
|
|||||||||||||||||
|
12-31-92
|
17,006,789
|
971,502
|
17.51
|
.635
|
.15944
|
|||||||||||||||||
|
12-31-93
|
17,990,556
|
1,010,692
|
17.80
|
.6225
|
.17075
|
|||||||||||||||||
|
12-31-94
|
18,096,297
|
1,058,427
|
17.10
|
.59
|
.17874
|
|||||||||||||||||
|
12-31-95
|
24,052,746
|
1,116,620
|
21.54
|
.575
|
.19289
|
|||||||||||||||||
|
12-31-96
|
29,249,488
|
1,190,831
|
24.56
|
.55
|
.25730
|
|||||||||||||||||
|
12-31-97
|
36,647,535
|
1,262,818
|
29.02
|
.5075
|
.30571
|
|||||||||||||||||
|
12-31-98
|
48,433,113
|
1,413,731
|
34.26
|
.44
|
2.11648
|
|||||||||||||||||
5
Exhibit 2
(Continued)
BRIDGES INVESTMENT FUND, INC.
SELECTED HISTORICAL FINANCIAL INFORMATION
(Unaudited)
– – – – – – – – – – – Year End Statistics – – – – – – – – – – –
|
Valuation
|
Net
|
Shares
|
Net Asset
|
Dividend/
|
Capital
|
|||||||||||||||||
|
Date
|
Assets
|
Outstanding
|
Value/Share
|
Share
|
Gains/Share
|
|||||||||||||||||
|
12-31-99
|
$
|
69,735,684
|
1,508,154
|
$
|
46.24
|
$
|
.30
|
$
|
.91088
|
|||||||||||||
|
12-31-00
|
71,411,520
|
1,850,301
|
38.59
|
.40
|
.80880716
|
|||||||||||||||||
|
12-31-01
|
60,244,912
|
1,940,494
|
31.05
|
.26
|
—
|
|||||||||||||||||
|
12-31-02
|
45,854,541
|
1,989,769
|
23.05
|
.20
|
—
|
|||||||||||||||||
|
12-31-03
|
62,586,435
|
2,016,560
|
31.04
|
.24
|
—
|
|||||||||||||||||
|
12-31-04
|
74,281,648
|
2,230,038
|
33.31
|
.305
|
—
|
|||||||||||||||||
|
12-31-05
|
80,715,484
|
2,305,765
|
35.01
|
.2798
|
—
|
|||||||||||||||||
|
12-31-06
|
82,754,479
|
2,336,366
|
35.42
|
.2695
|
—
|
|||||||||||||||||
|
12-31-07
|
77,416,617
|
2,258,380
|
34.28
|
.2364
|
2.5735
|
|||||||||||||||||
|
12-31-08
|
49,448,417
|
2,257,410
|
21.91
|
.2603
|
—
|
|||||||||||||||||
|
12-31-09
|
67,435,343
|
2,303,377
|
29.28
|
.17
|
—
|
|||||||||||||||||
|
12-31-10
|
75,014,486
|
2,307,301
|
32.51
|
.126
|
—
|
|||||||||||||||||
|
12-31-11
|
73,779,028
|
2,266,478
|
32.55
|
.1586
|
—
|
|||||||||||||||||
|
12-31-12
|
83,361,384
|
2,256,216
|
36.95
|
.207
|
—
|
|||||||||||||||||
|
12-31-13
|
110,155,511
|
2,335,264
|
47.17
|
.2408
|
1.62945
|
|||||||||||||||||
|
12-31-14
|
122,102,388
|
2,463,893
|
49.56
|
.265
|
1.71490
|
|||||||||||||||||
|
12-31-15
|
116,368,311
|
2,378,851
|
48.92
|
.2725
|
.5244
|
|||||||||||||||||
|
12-31-16
|
122,877,447
|
2,381,534
|
51.60
|
.2929
|
.47505
|
|||||||||||||||||
|
12-31-17
|
144,610,324
|
2,387,530
|
60.57
|
.2033
|
2.11478
|
|||||||||||||||||
6
BRIDGES INVESTMENT FUND, INC.
EXPENSE EXAMPLE
DECEMBER 31, 2017
(Unaudited)
As a shareholder of the Bridges Investment Fund, Inc., you incur ongoing costs, including management fees; services fees; and other Fund expenses. This example is intended to help you understand your ongoing costs (in dollars) of investing in the Fund and to compare costs with the ongoing costs of investing in other mutual funds.
The Example is based on an investment of $1,000 invested at the beginning of the period and held the entire period (July 1, 2017 – December 31, 2017).
ACTUAL EXPENSES
The first line of the table below provides information about actual account values and actual expenses. Although the Fund charges no sales load or transactions fees, you will be assessed fees for outgoing wire transfers (including redemption requests), returned checks or stop payment orders at prevailing rates charged by U.S. Bancorp Fund Services, LLC, the Fund’s transfer agent. To the extent that the Fund invests in shares of other investment companies as part of its investment strategy, you will indirectly bear your proportionate share of any fees and expenses charged by the underlying funds in which a Fund invests in addition to the expenses of the Fund. Actual expenses of the underlying funds are expected to vary among the various underlying funds. These expenses are not included in the example below. The example includes, but is not limited to, management fees, shareholder servicing fees, fund accounting, custody and transfer agent fees. However, the example below does not include portfolio trading commissions and related expenses, interest expense or dividends on short positions taken by the Fund and other extraordinary expenses as determined under generally accepted accounting principles. You may use the information in this line, together with the amount you invested, to estimate the expenses that you paid over the period. Simply divide your account value by $1,000 (for example, an $8,600 account value divided by $1,000 = 8.6), then multiply the result by the number in the first line under the heading entitled “Expenses Paid During Period” to estimate the expenses you paid on your account during this period.
HYPOTHETICAL EXAMPLE FOR COMPARISON PURPOSES
The second line of the table below provides information about hypothetical account values and hypothetical expenses based on the Fund’s actual expense ratios and an assumed rate of return of 5% per year before expenses, which is not the Fund’s actual return. The hypothetical account values and expenses may not be used to estimate the actual ending account balance or expenses you paid for the period. You may use this information to compare the ongoing costs of investing in the Fund and other funds. To do so, compare this 5% hypothetical example with the 5% hypothetical examples that appear in the shareholder reports of the other funds.
7
Please note that the expenses shown in the table are meant to highlight your ongoing costs only and do not reflect any transactional costs, such as sales charges (loads), redemption fees, or exchange fees. Therefore, the second line of the table is useful in comparing ongoing costs only, and will not help you determine the relative costs of owning different funds. In addition, if these transactional costs were included, your costs would have been higher.
|
Expenses Paid
|
|||
|
Beginning
|
Ending
|
During Period*
|
|
|
Account Value
|
Account Value
|
July 1, 2017 –
|
|
|
July 1, 2017
|
December 31, 2017
|
December 31, 2017
|
|
|
Actual
|
$1,000
|
$1,107.20
|
$4.14
|
|
Hypothetical
|
|||
|
(5% annualized return
|
|||
|
before expenses)
|
$1,000
|
$1,021.27
|
$3.97
|
|
*
|
Expenses are equal to the Fund’s annualized expense ratio of 0.78%, multiplied by the average account value over the period, multiplied by 184/365 to reflect the one-half year period.
|
8
BRIDGES INVESTMENT FUND, INC.
ALLOCATION OF PORTFOLIO HOLDINGS
PERCENTAGE OF TOTAL INVESTMENTS
DECEMBER 31, 2017
(Unaudited)
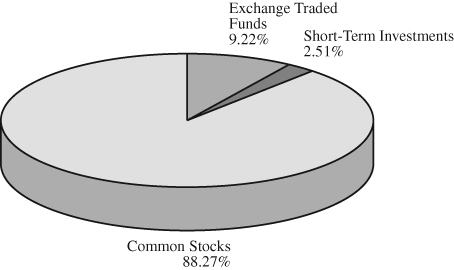
COMPONENTS OF PORTFOLIO HOLDINGS
|
Common Stocks
|
$
|
127,800,313
|
||
|
Exchange Traded Funds
|
13,351,950
|
|||
|
Short-Term Investments
|
3,635,843
|
|||
|
Total
|
$
|
144,788,106
|
9
BRIDGES INVESTMENT FUND, INC.
SCHEDULE OF INVESTMENTS
DECEMBER 31, 2017
|
Title of Security
|
Shares
|
Cost
|
Value
|
|||||||||
|
COMMON STOCKS – 88.38%
|
||||||||||||
|
Administrative and Support Services – 1.78%
|
||||||||||||
|
PayPal Holdings, Inc. (a)
|
35,000
|
$
|
871,561
|
$
|
2,576,700
|
|||||||
|
Amusement, Gambling, and
|
||||||||||||
|
Recreation Industries – 2.23%
|
||||||||||||
|
The Walt Disney Co.
|
30,000
|
$
|
1,588,580
|
$
|
3,225,300
|
|||||||
|
Beverage and Tobacco
|
||||||||||||
|
Product Manufacturing – 2.33%
|
||||||||||||
|
Altria Group, Inc.
|
15,000
|
$
|
451,341
|
$
|
1,071,150
|
|||||||
|
PepsiCo, Inc.
|
13,000
|
632,331
|
1,558,960
|
|||||||||
|
Philip Morris International, Inc.
|
7,000
|
338,718
|
739,550
|
|||||||||
|
$
|
1,422,390
|
$
|
3,369,660
|
|||||||||
|
Broadcasting (except Internet) – 1.66%
|
||||||||||||
|
Comcast Corp.
|
60,000
|
$
|
1,381,050
|
$
|
2,403,000
|
|||||||
|
Building Material and Garden
|
||||||||||||
|
Equipment and Supplies Dealers – 1.76%
|
||||||||||||
|
Home Depot, Inc.
|
10,000
|
$
|
1,294,810
|
$
|
1,895,300
|
|||||||
|
Lowe’s Companies, Inc.
|
7,000
|
534,185
|
650,580
|
|||||||||
|
$
|
1,828,995
|
$
|
2,545,880
|
|||||||||
|
Chemical Manufacturing – 4.90%
|
||||||||||||
|
Allergan Plc
|
15,000
|
$
|
2,160,150
|
$
|
2,453,700
|
|||||||
|
Ecolab, Inc.
|
15,000
|
1,436,988
|
2,012,700
|
|||||||||
|
Gilead Sciences, Inc.
|
17,000
|
1,306,095
|
1,217,880
|
|||||||||
|
Johnson & Johnson
|
10,000
|
866,300
|
1,397,200
|
|||||||||
|
$
|
5,769,533
|
$
|
7,081,480
|
|||||||||
|
Computer and Electronic
|
||||||||||||
|
Product Manufacturing – 10.18%
|
||||||||||||
|
Apple, Inc.
|
67,000
|
$
|
1,138,677
|
$
|
11,338,410
|
|||||||
|
QUALCOMM, Inc.
|
35,000
|
1,482,755
|
2,240,700
|
|||||||||
|
Thermo Fisher Scientific, Inc.
|
6,000
|
879,267
|
1,139,280
|
|||||||||
|
$
|
3,500,699
|
$
|
14,718,390
|
|||||||||
See accompanying Notes to the Financial Statements.
Percentages are stated as a percent of net assets.
|
(a)
|
Non Income Producing. |
10
BRIDGES INVESTMENT FUND, INC.
SCHEDULE OF INVESTMENTS
(Continued)
DECEMBER 31, 2017
|
Title of Security
|
Shares
|
Cost
|
Value
|
|||||||||
|
COMMON STOCKS (Continued)
|
||||||||||||
|
Couriers and Messengers – 2.20%
|
||||||||||||
|
FedEx Corp.
|
8,000
|
$
|
1,337,963
|
$
|
1,996,320
|
|||||||
|
United Parcel Service, Inc. – Class B
|
10,000
|
985,007
|
1,191,500
|
|||||||||
|
$
|
2,322,970
|
$
|
3,187,820
|
|||||||||
|
Credit Intermediation and
|
||||||||||||
|
Related Activities – 8.18%
|
||||||||||||
|
Ameriprise Financial, Inc.
|
10,000
|
$
|
971,393
|
$
|
1,694,700
|
|||||||
|
Capital One Financial Corp.
|
30,000
|
864,556
|
2,987,400
|
|||||||||
|
JPMorgan Chase & Co.
|
30,000
|
1,721,192
|
3,208,200
|
|||||||||
|
Wells Fargo & Co.
|
65,000
|
1,722,622
|
3,943,550
|
|||||||||
|
$
|
5,279,763
|
$
|
11,833,850
|
|||||||||
|
Data Processing, Hosting and
|
||||||||||||
|
Related Services – 0.91%
|
||||||||||||
|
Fiserv, Inc. (a)
|
10,000
|
$
|
971,166
|
$
|
1,311,300
|
|||||||
|
Electrical Equipment, Appliance, and
|
||||||||||||
|
Component Manufacturing – 1.09%
|
||||||||||||
|
Eaton Corp. Plc
|
20,000
|
$
|
944,512
|
$
|
1,580,200
|
|||||||
|
Food Services and Drinking Places – 1.19%
|
||||||||||||
|
Starbucks Corp.
|
30,000
|
$
|
561,001
|
$
|
1,722,900
|
|||||||
|
Health and Personal Care Stores – 1.29%
|
||||||||||||
|
Express Scripts Holding Co. (a)
|
25,000
|
$
|
951,440
|
$
|
1,866,000
|
|||||||
|
Insurance Carriers and Related Activities – 2.74%
|
||||||||||||
|
Berkshire Hathaway, Inc. – Class B (a)
|
20,000
|
$
|
678,649
|
$
|
3,964,400
|
|||||||
|
Machinery Manufacturing – 1.43%
|
||||||||||||
|
Roper Technologies, Inc.
|
8,000
|
$
|
335,931
|
$
|
2,072,000
|
|||||||
|
Mining (except Oil and Gas) – 0.46%
|
||||||||||||
|
Martin Marietta Materials, Inc.
|
3,000
|
$
|
614,287
|
$
|
663,120
|
|||||||
|
Nonstore Retailers – 4.04%
|
||||||||||||
|
Amazon.com, Inc.(a)
|
5,000
|
$
|
1,231,664
|
$
|
5,847,350
|
|||||||
See accompanying Notes to the Financial Statements.
Percentages are stated as a percent of net assets.
|
(a)
|
Non Income Producing.
|
11
BRIDGES INVESTMENT FUND, INC.
SCHEDULE OF INVESTMENTS
(Continued)
DECEMBER 31, 2017
|
Title of Security
|
Shares
|
Cost
|
Value
|
|||||||||
|
COMMON STOCKS (Continued)
|
||||||||||||
|
Oil and Gas Extraction – 2.77%
|
||||||||||||
|
Continental Resources, Inc. (a)
|
45,000
|
$
|
1,294,799
|
$
|
2,383,650
|
|||||||
|
EOG Resources, Inc.
|
15,000
|
1,564,500
|
1,618,650
|
|||||||||
|
$
|
2,859,299
|
$
|
4,002,300
|
|||||||||
|
Other Information Services – 8.50%
|
||||||||||||
|
Alphabet, Inc. – Class A (a)
|
4,000
|
$
|
847,060
|
$
|
4,213,600
|
|||||||
|
Alphabet, Inc. – Class C (a)
|
4,010
|
844,083
|
4,196,064
|
|||||||||
|
Facebook, Inc. (a)
|
22,000
|
2,108,798
|
3,882,120
|
|||||||||
|
$
|
3,799,941
|
$
|
12,291,784
|
|||||||||
|
Petroleum and Coal
|
||||||||||||
|
Products Manufacturing – 1.90%
|
||||||||||||
|
Chevron Corp.
|
22,000
|
$
|
1,206,019
|
$
|
2,754,180
|
|||||||
|
Professional, Scientific, and
|
||||||||||||
|
Technical Services – 20.63%
|
||||||||||||
|
Amgen, Inc.
|
10,000
|
$
|
1,609,946
|
$
|
1,739,000
|
|||||||
|
Biogen, Inc. (a)
|
3,500
|
756,617
|
1,114,995
|
|||||||||
|
Celgene Corp. (a)
|
50,000
|
2,585,087
|
5,218,000
|
|||||||||
|
Cognizant Technology
|
||||||||||||
|
Solutions Corp. – Class A
|
10,000
|
545,270
|
710,200
|
|||||||||
|
IQVIA Holdings, Inc. (a)
|
5,000
|
508,729
|
489,500
|
|||||||||
|
MasterCard, Inc.
|
70,000
|
1,245,377
|
10,595,200
|
|||||||||
|
Priceline Group, Inc. (a)
|
3,100
|
1,807,093
|
5,386,994
|
|||||||||
|
Visa, Inc. – Class A
|
40,000
|
1,087,480
|
4,560,800
|
|||||||||
|
$
|
10,145,599
|
$
|
29,814,689
|
|||||||||
|
Rail Transportation – 2.60%
|
||||||||||||
|
Union Pacific Corp.
|
28,000
|
$
|
806,918
|
$
|
3,754,800
|
|||||||
|
Securities, Commodity Contracts,
|
||||||||||||
|
and Other Financial Investments
|
||||||||||||
|
and Related Activities – 3.20%
|
||||||||||||
|
BlackRock, Inc.
|
9,000
|
$
|
2,079,709
|
$
|
4,623,390
|
|||||||
|
Transportation Equipment Manufacturing – 0.41%
|
||||||||||||
|
Boeing Co.
|
2,000
|
$
|
593,662
|
$
|
589,820
|
|||||||
|
TOTAL COMMON STOCKS
|
$
|
51,745,338
|
$
|
127,800,313
|
||||||||
See accompanying Notes to the Financial Statements.
Percentages are stated as a percent of net assets.
|
(a)
|
Non Income Producing. |
12
BRIDGES INVESTMENT FUND, INC.
SCHEDULE OF INVESTMENTS
(Continued)
DECEMBER 31, 2017
|
Title of Security
|
Shares
|
Cost
|
Value
|
|||||||||
|
EXCHANGE TRADED FUNDS – 9.23%
|
||||||||||||
|
Funds, Trusts, and Other Financial Vehicles – 9.23%
|
||||||||||||
|
iShares Core S&P Mid-Cap ETF
|
40,000
|
$
|
3,684,766
|
$
|
7,591,200
|
|||||||
|
iShares Core S&P Small-Cap ETF
|
75,000
|
2,746,435
|
5,760,750
|
|||||||||
|
TOTAL EXCHANGE TRADED FUNDS
|
$
|
6,431,201
|
$
|
13,351,950
|
||||||||
|
SHORT-TERM INVESTMENTS – 2.51%
|
||||||||||||
|
Mutual Funds – 2.51%
|
||||||||||||
|
SEI Daily Income Trust Treasury –
|
||||||||||||
|
Class F, 1.051% (b)
|
3,635,843
|
$
|
3,635,843
|
$
|
3,635,843
|
|||||||
|
TOTAL SHORT-TERM INVESTMENTS
|
$
|
3,635,843
|
$
|
3,635,843
|
||||||||
|
TOTAL INVESTMENTS – 100.12%
|
$
|
61,812,382
|
$
|
144,788,106
|
||||||||
|
LIABILITIES IN EXCESS
|
||||||||||||
|
OF OTHER ASSETS – (0.12)%
|
(177,782
|
)
|
||||||||||
|
TOTAL NET ASSETS – 100.00%
|
$
|
144,610,324
|
||||||||||
See accompanying Notes to the Financial Statements.
Percentages are stated as a percent of net assets.
|
(a)
|
Non Income Producing.
|
|
(b)
|
The rate shown is the annualized seven day yield as of December 31, 2017.
|
13
BRIDGES INVESTMENT FUND, INC.
STATEMENT OF ASSETS AND LIABILITIES
DECEMBER 31, 2017
|
ASSETS:
|
||||
|
Investments in securities, at fair value (cost: $61,812,382)
|
$
|
144,788,106
|
||
|
Receivables
|
||||
|
Fund shares issued
|
5,648
|
|||
|
Dividends and interest
|
68,094
|
|||
|
Prepaid expenses
|
13,734
|
|||
|
TOTAL ASSETS:
|
$
|
144,875,582
|
||
|
LIABILITIES:
|
||||
|
Payables
|
||||
|
Distributions to shareholders
|
$
|
12,780
|
||
|
Payable for capital shares redeemed
|
1,000
|
|||
|
Payable to Adviser
|
178,445
|
|||
|
Accrued expenses
|
73,033
|
|||
|
TOTAL LIABILITIES:
|
$
|
265,258
|
||
|
TOTAL NET ASSETS
|
$
|
144,610,324
|
||
|
NET ASSETS CONSIST OF:
|
||||
|
Capital Stock
|
$
|
61,581,233
|
||
|
Accumulated undistributed net investment income
|
78,400
|
|||
|
Accumulated net realized loss on investments
|
(25,033
|
)
|
||
|
Unrealized appreciation on investments
|
82,975,724
|
|||
|
TOTAL NET ASSETS
|
$
|
144,610,324
|
||
|
SHARES OUTSTANDING
|
||||
|
($0.0001 par value; 100,000,000 shares authorized)
|
2,387,530
|
|||
|
NET ASSET VALUE, OFFERING AND
|
||||
|
REDEMPTION PRICE PER SHARE
|
$
|
60.57
|
||
See accompanying Notes to the Financial Statements.
14
BRIDGES INVESTMENT FUND, INC.
STATEMENT OF OPERATIONS
FOR THE YEAR ENDED DECEMBER 31, 2017
|
INVESTMENT INCOME:
|
||||
|
Dividend income
|
$
|
1,477,384
|
||
|
Interest income
|
46,495
|
|||
|
Total investment income
|
$
|
1,523,879
|
||
|
EXPENSES:
|
||||
|
Advisory fees
|
$
|
674,684
|
||
|
Administration fees
|
132,922
|
|||
|
Fund accounting fees
|
52,969
|
|||
|
Independent director’s expenses and fees
|
48,500
|
|||
|
Dividend disbursing and transfer agent fees
|
43,981
|
|||
|
Other
|
43,136
|
|||
|
Professional services
|
30,075
|
|||
|
Custody fees
|
16,742
|
|||
|
Printing and supplies
|
10,595
|
|||
|
Total expenses
|
$
|
1,053,604
|
||
|
NET INVESTMENT INCOME:
|
$
|
470,275
|
||
|
NET REALIZED AND UNREALIZED GAIN ON INVESTMENTS:
|
||||
|
Net realized gain on investments
|
3,908,751
|
|||
|
Net change in unrealized appreciation of investments
|
22,198,167
|
|||
|
|
||||
|
NET REALIZED AND UNREALIZED GAIN ON INVESTMENTS:
|
26,106,918
|
|||
|
NET INCREASE IN NET ASSETS RESULTING FROM OPERATIONS
|
$
|
26,577,193
|
||
See accompanying Notes to the Financial Statements.
15
BRIDGES INVESTMENT FUND, INC.
STATEMENTS OF CHANGES IN NET ASSETS
FOR THE YEARS ENDED DECEMBER 31, 2017 AND 2016
|
2017
|
2016
|
|||||||
|
OPERATIONS:
|
||||||||
|
Net investment income
|
$
|
470,275
|
$
|
694,644
|
||||
|
Net realized gain on investments
|
3,908,751
|
2,092,279
|
||||||
|
Capital gain distribution from regulated
|
||||||||
|
investment company
|
—
|
494
|
||||||
|
Net change in unrealized
|
||||||||
|
appreciation of investments
|
22,198,167
|
5,399,700
|
||||||
|
Net increase in net assets
|
||||||||
|
resulting from operations
|
$
|
26,577,193
|
$
|
8,187,117
|
||||
|
Net equalization of debits/credits:
|
—
|
(622
|
)
|
|||||
|
Distributions to shareholders:
|
||||||||
|
From net investment income
|
(477,481
|
)
|
(695,169
|
)
|
||||
|
From net realized gains
|
(4,901,151
|
)
|
(1,125,424
|
)
|
||||
|
Total distributions
|
$
|
(5,378,632
|
)
|
$
|
(1,820,593
|
)
|
||
|
Capital Share Transactions:
|
||||||||
|
Net increase in net assets
|
||||||||
|
from capital share transactions
|
534,316
|
143,234
|
||||||
|
Total Increase in Net Assets
|
$
|
21,732,877
|
$
|
6,509,136
|
||||
|
NET ASSETS:
|
||||||||
|
Beginning of the Year
|
$
|
122,877,447
|
$
|
116,368,311
|
||||
|
End of the Year (including accumulated undistributed
|
||||||||
|
net investment income of $78,400
|
||||||||
|
and $5,277, respectively)
|
$
|
144,610,324
|
$
|
122,877,447
|
||||
See accompanying Notes to the Financial Statements.
16
BRIDGES INVESTMENT FUND, INC.
FINANCIAL HIGHLIGHTS
For a Fund share outstanding throughout the year
|
Years Ended December 31,
|
||||||||||||||||||||
|
2017
|
2016
|
2015
|
2014
|
2013
|
||||||||||||||||
|
Net asset value, beginning of year
|
$
|
51.60
|
$
|
48.92
|
$
|
49.56
|
$
|
47.17
|
$
|
36.95
|
||||||||||
|
Income from investment operations:
|
||||||||||||||||||||
|
Net investment income1
|
0.20
|
0.29
|
0.27
|
0.26
|
0.24
|
|||||||||||||||
|
Net realized and unrealized
|
||||||||||||||||||||
|
gain/(loss) on investments
|
11.08
|
3.15
|
(0.12
|
)
|
4.11
|
11.85
|
||||||||||||||
|
Total from
|
||||||||||||||||||||
|
investment operations
|
11.28
|
3.44
|
0.15
|
4.37
|
12.09
|
|||||||||||||||
|
Less dividends and distributions:
|
||||||||||||||||||||
|
Dividends from net
|
||||||||||||||||||||
|
investment income
|
(0.20
|
)
|
(0.29
|
)
|
(0.27
|
)
|
(0.27
|
)
|
(0.24
|
)
|
||||||||||
|
Dividends from net realized gain
|
(2.11
|
)
|
(0.47
|
)
|
(0.52
|
)
|
(1.71
|
)
|
(1.63
|
)
|
||||||||||
|
Total distributions
|
(2.31
|
)
|
(0.76
|
)
|
(0.79
|
)
|
(1.98
|
)
|
(1.87
|
)
|
||||||||||
|
Net asset value, end of year
|
$
|
60.57
|
$
|
51.60
|
$
|
48.92
|
$
|
49.56
|
$
|
47.17
|
||||||||||
|
Total return
|
21.98
|
%
|
7.09
|
%
|
0.33
|
%
|
9.37
|
%
|
32.99
|
%
|
||||||||||
|
Supplemental data and ratios:
|
||||||||||||||||||||
|
Net assets, end of year
|
||||||||||||||||||||
|
(in thousands)
|
$
|
144,610
|
$
|
122,877
|
$
|
116,368
|
$
|
122,102
|
$
|
110,156
|
||||||||||
|
Ratio of net expenses to
|
||||||||||||||||||||
|
average net assets
|
0.79
|
%
|
0.82
|
%
|
0.80
|
%
|
0.80
|
%
|
0.85
|
%
|
||||||||||
|
Ratio of net investment income
|
||||||||||||||||||||
|
to average net assets
|
0.35
|
%
|
0.60
|
%
|
0.54
|
%
|
0.55
|
%
|
0.57
|
%
|
||||||||||
|
Portfolio turnover rate
|
4.7
|
%
|
10.7
|
%
|
13.2
|
%
|
13.6
|
%
|
12.0
|
%
|
||||||||||
See accompanying Notes to the Financial Statements.
|
1
|
Net investment income per share is calculated using the ending balances prior to consideration of adjustment for permanent book-to-tax differences.
|
17
BRIDGES INVESTMENT FUND, INC.
NOTES TO FINANCIAL STATEMENTS
DECEMBER 31, 2017
|
(1)
|
SUMMARY OF SIGNIFICANT ACCOUNTING POLICIES
|
|
Bridges Investment Fund, Inc. (the “Fund”) is registered under the Investment Company Act of 1940 as a diversified, open-end management investment company. The primary investment objective of the Fund is long-term capital appreciation. In pursuit of that objective, the Fund invests primarily in common stocks. The following is a summary of significant accounting policies consistently followed by the Fund in the preparation of its financial statements. The policies are in conformity with accounting principles generally accepted in the United States of America (“GAAP”). The Fund is an investment company and accordingly follows the investment company accounting and reporting guidance of the Financial Accounting Standards Board (“FASB”) Accounting Standards Codification Topic 946 Financial Services – Investment Companies.
|
|
A.
|
Investments –
|
|
|
Security transactions are recorded on trade date. Dividend income is recognized on the ex-dividend date, and interest income is recognized on an accrual basis. Discount and premium on fixed income securities is accreted or amortized into interest income using the effective interest method. Withholding taxes on foreign dividends, if any, have been provided for in accordance with the Fund’s understanding of the applicable country’s tax rules and rates.
|
||
|
The net realized gain (loss) from the sales of securities is determined for income tax and accounting purposes on the basis of the cost of specific securities.
|
||
|
Securities owned are reflected in the accompanying Statement of Assets and Liabilities and the Schedule of Investments at fair value based on quoted market prices. Bonds and other fixed-income securities (other than repurchase agreements and demand notes) are valued using the bid price provided by an independent pricing service. Other securities traded on a national securities exchange are valued at the last reported sale price at the close of regular trading on each day the exchange is open for trading. Securities listed on the NASDAQ National Market System for which market quotations are readily available are valued using the NASDAQ Official Closing Price (“NOCP”). If no sales were reported on that day, quoted market price represents the closing bid price.
|
||
|
Investments in registered open-end management investment companies will be valued based upon the Net Asset Values (“NAVs”) of such investments and are categorized as Level 1 of the fair value hierarchy.
|
||
|
Securities for which prices are not readily available are valued by the Fund’s valuation committee (the “Valuation Committee”) at a fair value determined in good faith under procedures established by and under the general supervision of the Fund’s Board of Directors (the “Board”).
|
||
|
The Valuation Committee concludes that a price determined under the Fund’s valuation procedures is not readily available if, among other things, the Valuation
|
18
|
Committee believes that the value of the security might be materially affected by an intervening significant event. A significant event may be related to a single issuer, to an entire market sector, or to the entire market. These events may include, among other things: issuer–specific events including rating agency action, earnings announcements and corporate actions, significant fluctuations in domestic or foreign markets, natural disasters, armed conflicts, and government actions. In the event that the market quotations are not readily available, the fair value of such securities will be determined in good faith, taking into consideration: (i) fundamental analytical data relating to the investment; (ii) the nature and duration of restrictions on disposition of the securities; and (iii) an evaluation of the forces which influence the market in which these securities are purchased and sold. The members of the Valuation Committee shall continuously monitor for significant events that might necessitate the use of fair value procedures.
|
||
|
B.
|
Federal Income Taxes –
|
|
|
It is the Fund’s policy to comply with the requirements of the Internal Revenue Code applicable to Regulated Investment Companies (“RICs”) to distribute all of its taxable income to shareholders. Therefore, no Federal income tax provision for the Fund is required. Under applicable foreign tax law, a withholding tax may be imposed on interest, dividends, and capital gains earned on foreign securities.
|
||
|
The character of distributions made during the year from net investment income or net realized gains may differ from its ultimate characterization for federal income tax purposes. In addition, due to the timing of dividend distributions, the fiscal year in which amounts are distributed may differ from the year that the income or realized gains or losses were recorded by the Fund. The Fund has reclassified the components of its capital accounts for the year ended December 31, 2017, by increasing accumulated undistributed net investment income by $80,329, increasing accumulated net realized loss by $18 and decreasing capital stock by $80,347.
|
||
|
The Fund has not recorded any liability for material unrecognized tax benefits as of December 31, 2017. It is the Fund’s policy to recognize accrued interest and penalties related to uncertain benefits in income tax expense as appropriate.
|
||
|
C.
|
Distribution To Shareholders –
|
|
|
The Fund records and pays dividends to shareholders on a quarterly basis on the ex-dividend date. Distribution of net realized gains, if any, are recorded and made on an annual basis to shareholders on the ex-dividend date.
|
||
|
D.
|
Equalization –
|
|
|
Until July 1, 2016, the Fund used the accounting practice of equalization by which a portion of the proceeds from sales and costs of redemption of capital shares, equivalent on a per share basis to the amount of undistributed net investment income on the date of the transactions, was credited or charged to undistributed income. As a result, undistributed net investment income per share was unaffected by sales or redemption of capital shares. This practice was eliminated effective July 1, 2016.
|
||
|
E.
|
Use of Estimates –
|
|
|
The preparation of financial statements in conformity with GAAP requires management to make estimates and assumptions that affect the reported amounts of assets and liabilities and disclosure of contingent assets and liabilities at the date of
|
19
|
the financial statements and the reported amounts of increases and decreases in Net Assets from operations during the reporting period. Actual results could differ from those estimates.
|
||
|
In preparing these financial statements, the Fund has evaluated events and transactions for potential recognition or disclosure through the date the financial statements were issued.
|
||
|
F.
|
Fair Value Measurements –
|
|
|
GAAP defines fair value as the price that a Fund would receive upon selling an investment in a timely transaction to an independent buyer in the principal or most advantageous market of the investment. A three-tier hierarchy is used to maximize the use of observable market data “inputs” and minimize the use of unobservable “inputs” and to establish classification of fair value measurements for disclosure purposes. Inputs refer broadly to the assumptions that market participants would use in pricing the asset or liability, including assumptions about risk. Inputs may be observable or unobservable. Observable inputs are inputs that reflect the assumptions market participants would use in pricing the asset or liability developed based on market data obtained from sources independent of the reporting entity. Unobservable inputs are inputs that reflect the reporting entity’s own assumptions about the assumptions market participants would use in pricing the asset or liability developed based on the best information available in the circumstances. The three-tier hierarchy of inputs is summarized in the three broad Levels listed below:
|
|
Level 1 –
|
Unadjusted quoted prices in active markets for identical investments.
|
||
|
Level 2 –
|
Observable inputs other than quoted prices included in Level 1 that are observable for the asset or liability, either directly or indirectly. These inputs may include quoted prices for the identical instrument on an inactive market, prices for similar instruments, interest rates, prepayment speeds, credit risk, yield curves, default rates and similar data.
|
||
|
Level 3 –
|
Unobservable inputs for the asset or liability, to the extent relevant observable inputs are not available; representing the Fund’s own assumptions about the assumptions a market participant would use in valuing the asset or liability, and would be based on the best information available.
|
|
The valuation techniques used by the Fund to measure fair value for the year ended December 31, 2017, maximized the use of observable inputs and minimized the use of unobservable inputs. During the year ended December 31, 2017, no securities held by the Fund were deemed Level 3.
|
20
|
The following is a summary of the inputs used as of December 31, 2017, in valuing the Fund’s investments carried at fair value:
|
|
Level 1
|
Level 2
|
Level 3
|
Total
|
|||||||||||||||
|
Investments
|
||||||||||||||||||
|
Common Stocks
|
$
|
127,800,313
|
$
|
—
|
$
|
—
|
$
|
127,800,313
|
||||||||||
|
Exchange Traded Funds
|
13,351,950
|
—
|
—
|
13,351,950
|
||||||||||||||
|
Short-Term Investments
|
3,635,843
|
—
|
—
|
3,635,843
|
||||||||||||||
|
Total Investments
|
||||||||||||||||||
|
in Securities
|
$
|
144,788,106
|
$
|
—
|
$
|
—
|
$
|
144,788,106
|
||||||||||
|
There were no transfers between Levels 1 and 2 during the year ended December 31, 2017. Transfers between levels are recognized at the end of the reporting period. Refer to the Schedule of Investments for further information on the classification of investments.
|
|
(2)
|
INVESTMENT ADVISORY CONTRACT AND OTHER TRANSACTIONS WITH AFFILIATES
|
|
|
|
|
Under an Investment Advisory Contract, Bridges Investment Management, Inc. (the “Investment Adviser”) furnishes investment advisory services for the Fund. In return, the Fund has agreed to pay the Investment Adviser a management fee computed on a quarterly basis at the rate of 1/8 of 1% of the average month-end net asset value of the Fund during the quarter, equivalent to 1/2 of 1% per annum. Certain officers and directors of the Fund are also officers and directors of the Investment Adviser. These officers do not receive any compensation from the Fund other than that which is received indirectly through the Investment Adviser. For the year ended December 31, 2017, the Fund incurred $674,684 in advisory fees.
|
|
|
The contract between the Fund and the Investment Adviser provides that total expenses of the Fund in any year, exclusive of taxes, but including fees paid to the Investment Adviser, shall not exceed, in total, a maximum of 1 and 1/2% of the average month end net asset value of the Fund for the year. Amounts, if any, expended in excess of this limitation are reimbursed by the Investment Adviser as specifically identified in the Investment Advisory Contract. There were no amounts reimbursed during the year ended December 31, 2017.
|
|
|
The Fund has entered into a Board-approved contract with the Investment Adviser in which the Investment Adviser acts as primary administrator to the Fund at an annual rate of $42,000 and U.S. Bancorp Fund Services, LLC acts as sub-administrator to the Fund. These administrative expenses are shown as Administration fees on the Statement of Operations. As of December 31, 2017, $10,500 was due to the Investment Adviser for its services as primary administrator. This liability is included in the Accrued expenses on the Statement of Assets and Liabilities.
|
|
|
Effective, July 31, 2017, the Investment Adviser entered into an agreement with Bridges Holding Company (“BHC”), under the terms of which BHC acquired all of the equity of the Investment Adviser. The change in control of the Investment Adviser resulted in the termination of the existing investment advisory agreement. The terms of the new investment advisory agreement are substantially identical to the previous investment advisory agreement. For more information, see the Additional Disclosures section.
|
|
21
|
Quasar Distributors, LLC (the “Distributor”), a registered broker-dealer, acts as the Fund’s principal underwriter in a continuous public offering of the Fund’s shares. The Distributor is an affiliate of U.S. Bancorp Fund Services, LLC.
|
|
|
(3)
|
SECURITY TRANSACTIONS
|
|
The cost of long-term investment purchases during the years ended December 31, 2017 and 2016, was:
|
|
2017
|
2016
|
||||||||
|
Non U.S. government securities
|
$
|
6,131,388
|
$
|
13,375,903
|
|||||
|
Net proceeds from sales of long-term investments during the years ended December 31, 2017 and 2016, were:
|
|
2017
|
2016
|
||||||||
|
Non U.S. government securities
|
$
|
11,827,740
|
$
|
11,941,380
|
|||||
|
There were no long-term U.S. government transactions for the years ended December 31, 2017 and 2016.
|
|
(4)
|
NET ASSET VALUE
|
|
The NAV per share represents the effective price for all subscriptions and redemptions.
|
|
|
(5)
|
CAPITAL STOCK
|
|
Shares of capital stock issued and redeemed during the year ended December 31, 2017 and 2016, were as follows:
|
|
2017
|
2016
|
||||||||
|
Shares sold
|
58,623
|
38,411
|
|||||||
|
Shares issued to shareholders in
|
|||||||||
|
reinvestment of net investment income
|
80,953
|
31,999
|
|||||||
|
139,576
|
70,410
|
||||||||
|
Shares redeemed
|
(133,580
|
)
|
(67,727
|
)
|
|||||
|
Net increase
|
5,996
|
2,683
|
|||||||
|
Value of capital stock issued and redeemed during the year ended December 31, 2017 and 2016, were as follows:
|
|
2017
|
2016
|
||||||||
|
Net proceeds from shares sold
|
$
|
3,365,936
|
$
|
1,860,005
|
|||||
|
Reinvestment of distributions
|
4,807,312
|
1,612,536
|
|||||||
|
8,173,248
|
3,472,541
|
||||||||
|
Cost of shares redeemed
|
(7,638,932
|
)
|
(3,329,307
|
)
|
|||||
|
Net increase
|
$
|
534,316
|
$
|
143,234
|
|||||
22
|
(6)
|
DISTRIBUTIONS TO SHAREHOLDERS
|
|
On March 31, 2017, June 30, 2017, September 29, 2017 and December 29, 2017, cash distributions were declared and paid on March 31, 2017, June 30, 2017, September 29, 2017 and December 29, 2017, to shareholders of record on March 30, 2017, June 29, 2017, September 28, 2017 and December 28, 2017, respectively. These distributions were calculated as $0.06, $0.034, $0.065 and $0.0443 per share, respectively.
|
|
|
Additionally, on December 1, 2017, the Fund declared and paid a long-term capital gain distribution of $2.11478 per share to shareholders of record on November 30, 2017.
|
|
|
(7)
|
FEDERAL INCOME TAX INFORMATION
|
|
The tax character of distributions during the years ended December 31, 2017 and 2016 were as follows:
|
|
Ordinary
|
Long-Term
|
Return of
|
|||||||||||
|
Income
|
Capital Gain
|
Capital
|
|||||||||||
|
12/31/17
|
$
|
397,152
|
$
|
4,901,133
|
$
|
80,347
|
|||||||
|
12/31/16
|
$
|
695,169
|
$
|
1,125,424
|
$
|
—
|
|||||||
|
As of December 31, 2017, the components of the tax basis cost of investments and net unrealized appreciation were as follows:
|
|
Federal tax cost of investments
|
$
|
61,733,982
|
|||
|
Unrealized appreciation
|
$
|
83,209,414
|
|||
|
Unrealized depreciation
|
(155,290
|
)
|
|||
|
Net unrealized appreciation
|
$
|
83,054,124
|
|
As of December 31, 2017, the components of distributable earnings on a tax basis were as follows:
|
|
Net unrealized appreciation
|
$
|
83,054,124
|
|||
|
Undistributed ordinary income
|
$
|
—
|
|||
|
Undistributed long term gains
|
—
|
||||
|
Distributable earnings
|
—
|
||||
|
Other accumulated loss
|
(25,033
|
)
|
|||
|
Total accumulated capital earnings
|
$
|
83,029,091
|
|
As of December 31, 2017, the Fund did not have any capital loss carryovers. The Fund deferred, on a tax basis, post-October losses of $25,033.
|
|
|
(8)
|
SUBSEQUENT EVENTS
|
|
In preparing this report, the Fund has concluded that there are no subsequent events of note through the date of issuance.
|
23
REPORT OF INDEPENDENT REGISTERED PUBLIC ACCOUNTING FIRM
To the Shareholders and Board of Directors of Bridges Investment Fund, Inc.
Opinion on the Financial Statements
We have audited the accompanying statement of assets and liabilities, including the schedule of investments, of Bridges Investment Fund, Inc. (the “Fund”) as of December 31, 2017, and the related statement of operations for the year then ended, the statements of changes in net assets for each of the two years in the period then ended, including the related notes, and the financial highlights for each of the five years in the period then ended (collectively referred to as the “financial statements”). In our opinion, the financial statements present fairly, in all material respects, the financial position of Bridges Investment Fund, Inc. as of December 31, 2017, the results of its operations for the year then ended, the changes in its net assets for each of the two years in the period then ended, and the financial highlights for each of the five years in the period then ended, in conformity with accounting principles generally accepted in the United States of America.
Basis for Opinion
These financial statements are the responsibility of the Fund’s management. Our responsibility is to express an opinion on the Fund’s financial statements based on our audits. We are a public accounting firm registered with the Public Company Accounting Oversight Board (United States) (“PCAOB”) and are required to be independent with respect to the Fund in accordance with the U.S. federal securities laws and the applicable rules and regulations of the Securities and Exchange Commission and the PCAOB.
We conducted our audits in accordance with the standards of the PCAOB. Those standards require that we plan and perform the audit to obtain reasonable assurance about whether the financial statements are free of material misstatement, whether due to error or fraud.
Our audits include performing procedures to assess the risks of material misstatement of the financial statements, whether due to error or fraud, and performing procedures that respond to those risks. Such procedures include examining, on a test basis, evidence regarding the amounts and disclosures in the financial statements and confirmation of securities owned as of December 31, 2017, by correspondence with the custodian. Our audits also included evaluating the accounting principles used and significant estimates made by management, as well as evaluating the overall presentation of the financial statements. We believe that our audits provide a reasonable basis for our opinion.
We have served as the Fund’s auditor since 2011.

COHEN & COMPANY, LTD.
Milwaukee, Wisconsin
February 20, 2018
24
PRIVACY POLICY NOTICE
(Unaudited)
Protecting your privacy is important to Bridges Investment Fund, Inc. and our employees. We want you to understand what information we collect and how we use it. In order to provide our shareholders with a broad range of financial products and services as effectively and conveniently as possible, we use technology to manage and maintain shareholder information. The following policy serves as a standard for all Bridges Investment Fund, Inc. employees for the collection, use, retention, and security of nonpublic personal information.
What Information We Collect
In order to serve you better, we may collect nonpublic personal information about you from the following sources:
|
•
|
Information we receive from you in connection with opening an account or establishing and maintaining a shareholder relationship with us, whether in writing or oral;
|
|
•
|
Information about your transactions with us or our affiliates; and
|
|
•
|
Information we receive from third parties such as your accountants, attorneys, life insurance agents, family members, financial institutions, custodians, trustees and credit bureaus.
|
“Nonpublic personal information” is nonpublic information about you that we obtain in connection with providing a financial product or service to you. For example, nonpublic personal information includes the contents of your application, account balance, transaction history and the existence of a relationship with us.
What Information We Disclose
We do not disclose any nonpublic personal information about you to anyone, except as permitted by law. We are permitted to disclose nonpublic personal information about you to other third parties in certain circumstances. For example, we may disclose nonpublic personal information about you to third parties to assist us in servicing your account with us.
If you decide to close your account(s) or become an inactive shareholder, we will adhere to the privacy policies and practices as described in this notice.
Our Security Procedures
We also take steps to safeguard shareholder information. We restrict access to your personal and account information to those who need to know that information to provide products and services to you. Violators of these standards will be subject to disciplinary measures. We maintain physical, electronic, and procedural safeguards that comply with federal standards to guard your nonpublic personal information.
25
ADDITIONAL DISCLOSURES
RESULTS OF A SPECIAL MEETING OF SHAREHOLDERS (Unaudited)
The independent directors of the Board approved a new investment advisory agreement between Bridges Investment Management, Inc. (“BIM”) and the Fund on April 18, 2017, which approval was subject to shareholder approval and the anticipated closing of the change of control transaction of BIM. On June 23, 2017, a total of 1,618,867 shares were present in person or by proxy out of 2,350,544 shares issued and outstanding and entitled to vote at the Special Meeting.
The purpose of the meeting was to consider and act upon the following proposals:
|
1.)
|
To approve a new Investment Advisory Agreement between the Fund and Bridges Investment Management, Inc.
|
|
|
|
|
2.)
|
Vote on directors (Daniel J. Brabec, Edson L. Bridges III, Robert W. Bridges, Nathan P. Dodge III, Adam M. Koslosky, Robert Slezak, Kelly A. Walters and Lyn Wallin Ziegenbein)
|
The tabulation of the shareholder votes rendered the following results (in shares):
|
Broker
|
|||||
|
Proposal
|
For
|
Against
|
Abstain
|
Non-Vote
|
|
|
1.)
|
To Approve an Investment
|
||||
|
Advisory Agreement
|
1,604,327
|
—
|
4,961
|
9,579
|
|
|
2.)
|
Vote on Directors:
|
||||
|
|
Daniel J. Brabec
|
1,618,867
|
—
|
—
|
—
|
|
Edson L. Bridges III
|
1,618,867
|
—
|
—
|
—
|
|
|
Robert W. Bridges
|
1,618,867
|
—
|
—
|
—
|
|
|
Nathan P. Dodge III
|
1,618,867
|
—
|
—
|
—
|
|
|
Adam M. Koslosky
|
1,618,867
|
—
|
—
|
—
|
|
|
Robert Slezak
|
1,618,867
|
—
|
—
|
—
|
|
|
Kelly A. Walters
|
1,618,867
|
—
|
—
|
—
|
|
|
|
Lyn Wallin Ziegenbein
|
1,618,867
|
—
|
—
|
—
|
Accordingly, the proposals were approved by the Fund’s shareholders.
INVESTMENT ADVISORY AGREEMENT DISCLOSURE (Unaudited)
The new investment advisory agreement became effective on July 31, 2017 (the date on which the change of control transaction closed). Thereafter, the term of the agreement shall continue for successive annual periods subject to the requisite approvals. The new investment advisory agreement did not change any of the material terms of the prior investment advisory agreement.
As required by the terms of the investment advisory agreement, the independent directors of the Board vote for the continuance of the agreement no less than annually. On November 21, 2017, the Fund’s investment advisory agreement with BIM was approved by the independent directors of the Board for a period commencing on July 31, 2018 through July 30, 2019.
In approving the continuance of the investment advisory agreement, the independent directors of the Board reviewed the financial resources of BIM, the investment performance record, types of securities purchased, and asset size of the Fund in comparison with funds of similar size and comparable investment objectives, the operating costs relative to other funds, and other factors including the quality of investment advice and other services set forth in a special study prepared annually for the Board by the investment manager. In addition, the
26
independent directors of the Board reviewed the expertise, personnel, and the resources BIM is willing to commit to the management of the Fund, its compliance program, the cost of comparable services and the benefits to be received by BIM.
With respect to BIM’s financial resources, BIM provided the Fund’s Board of Directors information showing (as of December 31, 2016) total assets of $7,477,806, no long-term debt, and total shareholders’ equity of $6,777,829 with a current ratio (current assets to current liabilities) of 11.1x and an equity to total assets ratio of 90.64%.
The directors reviewed and focused on the Fund’s past performance and operations in their evaluation and decision. Based on information gathered from a leading mutual fund evaluator, the directors compared the Fund’s performance criteria to funds with similar investment objectives. The total fund comparison universe varied depending on the time frame of the comparison and other investment parameters included, but with respect to funds with a growth investment objective, the Fund ranked, on percentile terms, in the 78th percentile over a trailing 12-month period, 86th over a 3-year period, 85th over a 5-year period, and 63rd over a 10-year period (as of October 31, 2017).
The directors reviewed the asset allocation of the Fund, including the percentage of Fund assets invested in stocks (95.14% as of October 31, 2017) and bonds (0.00% as of October 31, 2017). They also reviewed a number of current ratios for the Fund’s portfolio, including the current price/earnings ratio of Fund stocks (23.4x as of October 31, 2017) price/cash ratio (15.3x) and price/book ratio (3.4x), as well as the Fund’s turnover ratio, which at 11% for the trailing twelve months, was still well below the average turnover ratio average of 59% for a comparison group of large cap growth funds. The directors also reviewed the Fund’s expense ratio, which was 0.84% for the period ending October 31, 2017, compared to an average of 1.65% for a peer group of funds selected as the comparison group.
The Board also reviewed the extent to which economies of scale would be realized as the Fund grows, and the expected impact of any growth in Fund assets on the Fund’s fee structure, including fees and expenses which are not directly related to the size of the Fund, and provisions in agreements with service providers which carry a lower basis charge if the Fund asset base increases.
With respect to the Fund’s compliance program, the directors were provided information concerning both the historical practices to ensure compliance by Fund personnel, as well as current actions taken to strengthen the Fund compliance structure.
The Board noted that Edson L. Bridges III has more than 34 years of experience with the Fund’s portfolio and thus is very familiar with the Fund’s history and operations. The Board of Directors further noted that Edson L. Bridges III has been responsible for the day-to-day management of the Fund’s portfolio since April 11, 1997, with Brian Kirkpatrick as the back-up person in this position.
At each Board of Directors meeting, the Board reviews the brokerage commissions and fees paid with respect to securities transactions undertaken for the Fund’s portfolio during the prior three-month period for the cost efficiency of the services provided by the brokerage firms involved, all of which brokerage firms are non-affiliated with the Fund and BIM. The Fund’s Board of Directors reviewed in May 2017 an annual disclosure for 2016 on soft dollar commission arrangements of BIM and the benefits that BIM and its clients may receive from the Fund’s portfolio transactions. The Board has regularly reviewed the brokerage commissions paid on each portfolio security transaction since 1995, and the actions taken by the management during the prior quarter with respect to portfolio transactions and commission levels have been approved by the Board of Directors.
27
MANAGEMENT’S DISCUSSION AND ANALYSIS
(Unaudited)
Introduction
The following information is provided in response to Item 22 in the Form N-1A to be filed annually under the Investment Company Act of 1940 with the Securities and Exchange Commission in Washington, D.C. The Form N-1A prescribes certain information that is to be included in the Prospectus for the Fund.
Item 22(b)(3)
The Directors, as a group, were paid a total of $48,500 by Bridges Investment Management, Inc. for their attendance at Audit and Administration/Nominating Committee meetings in addition to Board of Directors and Independent Board meetings held during 2017. These fees were reimbursed by the Fund in the calendar quarter that followed the date such payment was made.
The Officers, as a group, were not paid any compensation by the Fund for their services during 2017. During the most recent fiscal year ended December 31, 2017, the Fund paid its investment adviser, Bridges Investment Management, Inc., $674,684 in fees under the investment advisory contract.
Item 22(b)(5)
Officers and Directors
The Board is responsible for managing the Fund’s business affairs and for exercising all the Fund’s powers except those reserved for the shareholders. The following tables give information about each Board member and the senior officers of the Fund. Where required, the tables separately list Board members who are “interested persons” of the Fund (i.e., “Interested” Board members) and those who are not (i.e., “Independent” Board members). In addition, the Fund’s Statement of Additional Information includes additional information about Fund directors and is available, from the Fund’s website at http://www.bridgesfund.com or by calling 1.800.939.8401.
**The determination of an interested person is based on the definition in Section 2(a)(19) of the Investment Company Act of 1940, and Securities and Exchange Commission Release (Release No. IC-24083, dated October 14, 1999), providing additional guidance to investment companies about the types of professional and business relationships that may be considered to be material for purposes of Section 2(a)(19). Interested persons include a director or officer of the Fund who has a significant or material business or professional relationship with the Fund’s investment adviser, Bridges Investment Management, Inc. Those individuals who are not “interested persons” are disinterested persons for this disclosure. Bridges Investment Fund, Inc. considers these proposed Board members to be “independent directors” exercising care, diligence and good business judgement with respect to the governance of the Fund.**
MD&A–2
Disclosure Regarding Fund Directors and Officers
**Disinterested Persons
Also Known as Independent Directors**
|
Name, Age,
|
||
|
Position with
|
||
|
Fund and Term
|
||
|
of Office
|
Principal Occupation(s) and Directorships*
|
|
|
Daniel J. Brabec
|
Mr. Brabec is a Director of Spectrum Financial Services, Inc. in
|
|
|
Age: 59
|
Omaha, Nebraska since February 1999 and serves as Senior Vice
|
|
|
President of Spectrum. He has directly managed real estate and
|
||
|
Director
|
commercial credit assets for a number of affiliates of Spectrum
|
|
|
(2015 – present)
|
Financial Services, Inc. since January 2009. Prior to that, he served as
|
|
|
a Director of Great Western Bank, Omaha, Nebraska and was its Chief
|
||
|
Executive Officer and President from 2001 until its sale in 2008, and
|
||
|
served as Controller for Great Western Bancorporation in an interim
|
||
|
role from 1999 to 2001. He began his career in banking in 1985
|
||
|
joining Pioneer Bank, St Louis, Missouri after three years with Control
|
||
|
Data Corporation and served as Executive Vice President, Security
|
||
|
Officer and Director of Rushmore Bank and Trust, Rapid City, South
|
||
|
Dakota from 1993 to 1999. Mr. Brabec has been determined to be an
|
||
|
“audit committee financial expert” within the meaning of the Sarbanes
|
||
|
Oxley Act of 2002 and the regulations related thereto by the Fund’s
|
||
|
Board of Directors.
|
||
|
Nathan Phillips
|
Mr. Dodge is the President of N.P. Dodge Company since April 2014,
|
|
|
Dodge III
|
and prior to that position, served as the Executive Vice President. He
|
|
|
Age: 54
|
has worked at N.P. Dodge Company since October, 1993. Mr. Dodge
|
|
|
is also a principal officer and director of a number of subsidiary and
|
||
|
Director
|
affiliated companies in the property management, insurance, and real
|
|
|
(2010 – present)
|
estate syndication fields. Mr. Dodge became a Director of Lauritzen
|
|
|
Corp. in 2008 and of First State Bank of Loomis in 2003.
|
||
|
Adam M. Koslosky
|
Mr. Koslosky was elected the Vice Chairman on October 14, 2016. He
|
|
|
Age: 61
|
served as Vice Chairman of Magnolia Metal Corporation until 2015
|
|
|
and previously served as President and Chief Executive Officer.
|
||
|
Director
|
Magnolia Metal Corporation is a bronze bearing manufacturer located
|
|
|
(2007 – present)
|
in Omaha, Nebraska. Mr. Koslosky commenced his career with
|
|
|
Magnolia Metal Corporation in 1978. Mr. Koslosky also is a general
|
||
|
Vice Chairman
|
partner of Mack Investments, Ltd. and Tax Matter Partner and Manager
|
|
|
(2016 – present)
|
of TriStone Property Group, LLC, both privately held investment and
|
|
|
development companies located in Omaha, Nebraska. He has been a
|
||
|
Director of Nebraska Methodist Hospital Foundation since 1993. Mr.
|
||
|
Koslosky has been determined to be an “audit committee financial
|
||
|
expert” within the meaning of the Sarbanes Oxley Act of 2002 and the
|
||
|
regulations related thereto by the Fund’s Board of Directors. Mr.
|
||
|
Koslosky serves as the Chairman of the Fund’s Audit Committee.
|
MD&A–3
|
Name, Age,
|
||
|
Position with
|
||
|
Fund and Term
|
||
|
of Office
|
Principal Occupation(s) and Directorships*
|
|
|
Robert Slezak
|
Mr. Slezak was elected Chairman on October 14, 2016, and prior to
|
|
|
Age: 60
|
that time, served as Vice Chairman commencing April 10, 2012.
|
|
|
Mr. Slezak is currently a private investor, and has been since November
|
||
|
Director
|
1999. Prior to that, Mr. Slezak served as Vice President, Chief
|
|
|
(2008 – present)
|
Financial Officer and Treasurer of the Ameritrade Holding Corporation
|
|
|
|
from January 1989 to November 1999 and as a director from October
|
|
|
Chairman
|
1996 to September 2002. Mr. Slezak currently serves as a member of
|
|
|
(2016 – present)
|
the board of directors of The Pegasus Companies, Inc. (formerly,
|
|
|
Xanadoo Company), a developer of solar power projects. Mr. Slezak
|
||
|
Vice Chairman
|
has been determined to be an “audit committee financial expert” within
|
|
|
(2012 – 2016)
|
the meaning of the Sarbanes Oxley Act of 2002 and the regulations
|
|
|
related thereto by the Fund’s Board of Directors. Mr. Slezak has been
|
||
|
designated as the Lead Independent Director of the Fund.
|
||
|
Kelly A. Walters
|
Kelly A. Walters is currently a partner with Kuehl Capital Holdings
|
|
|
Age: 57
|
LLC and the Chief Executive Officer of Quarter Circle Capital, an
|
|
|
affiliate of Kuehl Capital Holdings. Prior to those positions,
|
||
|
Director
|
Mr. Walters was the President and Chief Executive Officer of Condor
|
|
|
(2013 – present)
|
Hospitality Trust, Inc. (formerly, Supertel Hospitality, Inc.), a
|
|
|
NASDAQ listed hospitality real estate investment trust based in
|
||
|
Norfolk, Nebraska (Condor), from April 2009 through February 2015.
|
||
|
Prior to joining Condor, Mr. Walters was the Senior Vice President
|
||
|
of Capital Markets at Investors Real Estate Trust from October 2006
|
||
|
to March 2009. Prior to IRET, Mr. Walters was a Senior Vice President
|
||
|
and Chief Investment Officer of Magnum Resources, Inc., a privately
|
||
|
held real estate investment and operating company, from 1996 to 2006.
|
||
|
Prior to Magnum, Mr. Walters was a Deputy Manager of Brown
|
||
|
Brothers Harriman from 1993 to 1996, an Investment Manager at
|
||
|
Peter Kiewit Sons, Inc. from 1985 to 1993, and a stockbroker at
|
||
|
Piper, Jaffrey and Hopwood from 1983 to 1985.
|
MD&A–4
|
Name, Age,
|
||
|
Position with
|
||
|
Fund and Term
|
||
|
of Office
|
Principal Occupation(s) and Directorships*
|
|
|
Lyn Wallin
|
Ms. Wallin Ziegenbein is an attorney and currently serves as the
|
|
|
Ziegenbein
|
Executive Director Emerita of the Peter Kiewit Foundation, a private
|
|
|
Age: 65
|
foundation awarding charitable grants throughout Nebraska and
|
|
|
portions of Iowa and Wyoming, since April 2013, and has served as the
|
||
|
Director
|
Executive Director of the Peter Kiewit Foundation since March, 1983.
|
|
|
(2013 – present)
|
Commencing in 2017, Ms. Wallin Ziegenbein also serves as the
|
|
|
Manager of Future Forward, LLC, an Omaha based investor group, and
|
||
|
New North Makerhood, Inc., a nonprofit organization, together these
|
||
|
entities are developing property in downtown Omaha, Nebraska for the
|
||
|
purpose of creating an “arts and trades” district. Ms. Wallin
|
||
|
Ziegenbein has served on the Board of Directors of Assurity Life
|
||
|
Insurance Company since 1984 and served on the Board of Lamp
|
||
|
Rynearson Engineering until December 31, 2017. Previously,
|
||
|
Ms. Wallin Ziegenbein served on the Federal Reserve Bank of Kansas
|
||
|
City’s Omaha Branch Board of Directors from 2006 to 2011.
|
||
|
Ms. Wallin Ziegenbein’s prior experience also includes serving as a
|
||
|
director of Norwest Bank Nebraska and Lincoln Telephone and
|
||
|
Telegraph. Ms. Wallin Ziegenbein also served as an Assistant United
|
||
|
States Attorney for Nebraska from 1978 to 1982.
|
||
|
*
|
Except as otherwise indicated, each individual has held the position shown or other positions in the same company for the last five years.
|
The address for all Fund Directors is, 8401 West Dodge Road, Suite 256, Omaha, Nebraska 68114
MD&A–5
Interested Person Directors and Officers
The following Directors and Officers are interested persons of the Fund. The determination of an interested person is based on the definition in Section 2(a)(19) of the Investment Company Act of 1940 and Securities and Exchange Commission Release (Release No. IC-24083, dated October 14, 1999), providing additional guidance to investment companies about the types of professional and business relationships that may be considered to be material for purposes of Section 2(a)(19).
|
Name, Age,
|
||
|
Position with
|
||
|
Fund and Term
|
||
|
of Office
|
Principal Occupation(s) and Directorships*
|
|
|
Edson L.
|
Since December 2000, Mr. Bridges has been President, Chief
|
|
|
Bridges III, CFA
|
Executive Officer, and Director of Bridges Investment Management,
|
|
|
Age: 59
|
Inc. Since August of 1983, Mr. Bridges was a full-time member of the
|
|
|
professional staff of Bridges Investment Counsel, Inc. where he has
|
||
|
President
|
served as Executive Vice President since 1993. Mr. Bridges is also a
|
|
|
(1997 – present)
|
Director of that firm. Mr. Bridges has been responsible for securities
|
|
|
research and the investment management for an expanding base of
|
||
|
Chief Executive
|
discretionary management accounts, including the Fund, for more than
|
|
|
Officer
|
15 years. Mr. Bridges was elected President of Bridges Investment
|
|
|
(2004 – present)
|
Fund, Inc. on April 11, 1997, and he assumed the position of Portfolio
|
|
|
Manager at the close of business on that date. Mr. Bridges became
|
||
|
Director
|
Chief Executive and Investment Officer of the Fund on April 13, 2004.
|
|
|
(1991 – present)
|
Mr. Bridges is Chairman, and a director of Bridges Investor Services,
|
|
|
Inc., Chairman of the Board and a director of Bridges Trust Company,
|
||
|
and since 2017, a director of Bridges Holding Company. Mr. Bridges
|
||
|
served as a Director of Stratus Fund, Inc., an open-end, regulated
|
||
|
investment company located in Lincoln, Nebraska from 1990 to 2016,
|
||
|
and was previously Chairman of the Audit Committee of the
|
||
|
Stratus Fund.
|
||
|
Robert W.
|
Mr. Bridges is an Executive Director, Portfolio Manager, and Co-Head
|
|
|
Bridges, CFA
|
of Behavioral Finance at Sterling Capital Management LLC. Sterling
|
|
|
Age: 52
|
Capital Management LLC, located in Charlotte, North Carolina, is an
|
|
|
investment management company founded in 1970. Mr. Bridges
|
||
|
Director
|
commenced his career with Sterling Capital Management, LLC in
|
|
|
(2007 – present)
|
1996 and served in a variety of capacities including client service,
|
|
|
systems integration, and compliance before assuming his current
|
||
|
position in 2000. Mr. Bridges has been a Director of Bridges
|
||
|
Investment Counsel, Inc. since December 2006, a Director of Bridges
|
||
|
Trust Company since 2007, and a Director of Bridges Holding
|
||
|
Company since 2017. Prior to joining Sterling, Mr. Bridges served in
|
||
|
accounting, research analysis and several other roles for Bridges
|
||
|
Investment Counsel, Inc. for six years. Mr. Bridges earned his B.S. in
|
||
|
Business from Wake Forest University, and became a CFA charter
|
||
|
holder in 2003.
|
MD&A–6
Additional Officers of the Fund
|
Name, Age,
|
||
|
Position with
|
||
|
Fund and Term
|
||
|
of Office
|
Principal Occupation(s) and Directorships*
|
|
|
Edson L.
|
Mr. Bridges was elected Chairman Emeritus on April 15, 2006.
|
|
|
Bridges II, CFA
|
Mr. Bridges had previously served as Chairman, Vice-Chairman, Chief
|
|
|
Age: 85
|
Executive Officer, and President of the Fund. Mr. Bridges was
|
|
|
replaced by Edson L. Bridges III as Chief Executive Officer of the
|
||
|
Chairman Emeritus
|
Fund on April 13, 2004. Mr. Bridges currently is the Continuity and
|
|
|
(2006 – present)
|
Research Officer for Bridges Investment Management and served as a
|
|
|
director from 2000 – 2017. In September, 1959, Mr. Bridges became
|
||
|
Vice-Chairman
|
associated with the predecessor firm to Bridges Investment Counsel,
|
|
|
(2005 – 2006)
|
Inc. and is presently the President, Director, CEO, and Chief
|
|
|
Compliance Officer of Bridges Investment Counsel, Inc. Mr. Bridges
|
||
|
Chairman
|
is also President and Director of Bridges Investor Services, Inc..
|
|
|
(1997 – 2005)
|
During his tenure, Mr. Bridges also served as President, Director, and
|
|
|
Chief Executive Officer of Bridges Trust Company, chartered to
|
||
|
Chief Executive
|
conduct business on March 11, 1992.
|
|
|
Officer
|
||
|
(1997 – 2004)
|
||
|
President
|
||
|
(1970 – 1997)
|
||
|
Director
|
||
|
(1963 – 2007)
|
||
|
Nancy K. Dodge
|
Ms. Dodge has been an employee of Bridges Investment Management,
|
|
|
Age: 56
|
Inc. since 1994, where she serves as a Vice President. After joining
|
|
|
Bridges Investment Counsel, Inc. in January of 1980, her career
|
||
|
Treasurer
|
progressed through the accounting department of that Firm, to her
|
|
|
(1986 – present)
|
present position as Vice President. Ms. Dodge is the person primarily
|
|
|
responsible for overseeing day to day operations for the Fund, and she
|
||
|
Chief Compliance
|
is also the key person for handling relations with shareholders, the
|
|
|
Officer
|
custodian bank, transfer agent, and the independent registered public
|
|
|
(2006 – present)
|
accounting firm. She was appointed Chief Compliance Officer of the
|
|
|
Fund, as of November 21, 2006, and Secretary of the Fund as of
|
||
|
Secretary
|
October 1, 2017. Ms. Dodge is a Vice President and Director of
|
|
|
(2017 – present)
|
Bridges Investor Services, Inc., and a Vice President and Trust Officer
|
|
|
for Bridges Trust Company.
|
MD&A–7
|
Name, Age,
|
||
|
Position with
|
||
|
Fund and Term
|
||
|
of Office
|
Principal Occupation(s) and Directorships*
|
|
|
Brian
|
Mr. Kirkpatrick has been an employee of Bridges Investment
|
|
|
Kirkpatrick, CFA
|
Management since 1994. Mr. Kirkpatrick serves as a Senior Vice
|
|
|
Age: 46
|
President, Director of Research, Chief Compliance Officer, and
|
|
|
Director of Bridges Investment Management. Having joined Bridges
|
||
|
Executive
|
Investment Counsel, Inc. on August 24, 1992, he is a Senior Vice
|
|
|
Vice President
|
President of Bridges Investment Counsel, and has been a full-time
|
|
|
(2006 – present)
|
member of the professional staff of Bridges Investment Counsel, Inc.,
|
|
|
responsible for securities research, and the investment management for
|
||
|
Vice President
|
an expanding base of discretionary management accounts, including
|
|
|
(2000 – 2006)
|
the Fund, for more than 15 years. Mr. Kirkpatrick was appointed Sub
|
|
|
Portfolio Manager of the Fund on April 12, 2005.
|
||
|
Mary Ann Mason
|
Ms. Mason was an employee of Bridges Investment Management from
|
|
|
Age: 66
|
1994 – 2017, where she last served as Senior Vice President, Corporate
|
|
|
Secretary, and Treasurer. Ms. Mason retired in September 2017. She
|
||
|
Secretary
|
joined Bridges Investment Counsel, Inc. in June 1981, and until
|
|
|
(1987 – 2017)
|
September 2017, served as its Senior Vice President, Corporate
|
|
|
Secretary and Treasurer and the Secretary, Treasurer and Director of
|
||
|
Bridges Investor Services, Inc. Ms. Mason also acted as Vice
|
||
|
President, Secretary and Treasurer for Bridges Trust Company until
|
||
|
her retirement.
|
||
|
Trinh Wu
|
Ms. Wu has been an employee of Bridges Investment Management and
|
|
|
Age: 61
|
has served Bridges Investment Counsel, Inc. since February 1, 1997.
|
|
|
Ms. Wu has functioned as the lead accountant for the day to day
|
||
|
Controller
|
operation of the Fund. Ms. Wu currently is the Senior Accountant of
|
|
|
(2001 – present)
|
Bridges Investment Counsel, Inc. Prior to her employment at Bridges
|
|
|
Investment Management, Inc., Ms. Wu performed operating and
|
||
|
accounting activities for 17 years in the Estate and Trust Department
|
||
|
of the predecessor institutions to U.S. Bank, N.A. Nebraska. Ms. Wu
|
||
|
was elected to the position of Controller of the Fund at the October 16,
|
||
|
2001 meeting of the Board of Directors. Ms. Wu is also Vice President,
|
||
|
Accounting and Internal Audits, for Bridges Trust Company.
|
||
|
*
|
Except as otherwise indicated, each individual has held the position shown or other positions in the same company for the last five years.
|
The address for all Fund Officers is, 8401 West Dodge Road, Suite 256, Omaha, Nebraska 68114
The Statement of Additional Information (SAI) includes additional information about Fund directors and is available at the Fund’s website, www.bridgesfund.com, or by calling 1-800-939-8401.
MD&A–8
Item 22(b)(7)(i)
This item requires a discussion of those factors, including relevant market conditions and the investment strategies and techniques pursued by the Fund’s investment adviser that materially affected the performance of the Fund during the most recently completed fiscal year. The investment performance for 2017, the most recently completed fiscal year, was a 21.98% total return with cash and capital gain distributions reinvested in shares of capital stock in the Fund.
The relevant market conditions and the investment strategies pursued by the Fund’s investment adviser that materially affected the performance of the Fund during the most recently completed fiscal year are fully described on pages one through three of the Shareholder Letter, which is a part of the Annual Report.
Item 22(b)(7)(ii)
The Fund is required to provide a line graph comparing the initial account value and subsequent account values at the end of each of the most recently completed ten fiscal years of the Fund, assuming a $10,000 investment in the Fund at the beginning of the first fiscal year to the same investment over the same periods in an appropriate broad-based securities market index. In a table placed within or contiguous to the graph, the Fund’s average annual total returns for the one, five, and ten-year periods ended on the last day of the most recent fiscal year, computed in accordance with applicable SEC regulations and guidelines, are provided.
This line graph appears on page MD&A-9. The information on the line graph is set forth without amplifying commentary. However, the interpretative discussion that precedes and follows in this section of the Annual Shareholder Report for 2017 is an integral part of the overall presentation concerning investment performance.
The assumptions for the preparation of data to compute performance for the Standard & Poor’s 500 Composite Index, the Russell 1000 Growth Index, and for Bridges Investment Fund, Inc., along with other items of information and analysis, appear on pages MD&A-10.
The Standard & Poor’s 500 Composite Stock Index was chosen as the appropriate broad-based market index for comparison with our Fund for the purpose of benchmarking the results of a 100% common stock investment as an alternative to an investment in our Fund. Common stocks have ranged between 87.3% to 98.3% of total market value in the Fund’s portfolio over the last decade. This observation means that our Fund’s investment record in the typical year is unlikely to match, exactly, results of a securities investment in the Standard & Poor’s 500 Composite Index because the same degree of risk/reward has not been assumed by the Fund. Nevertheless, the S&P 500 has the best data for tracking the general price trends for large capitalization and widely owned stocks; a representative list of which is held by our Fund.
MD&A–9
|
AVERAGE ANNUAL TOTAL RETURN
|
||
|
1 YEAR
|
5 YEAR
|
10 YEAR
|
|
21.98%
|
13.78%
|
7.81%
|
The Fund’s past performance is not an indication of how the Fund will perform in the future. The performance information presented does not reflect the deduction of taxes that a shareholder would pay on Fund distributions or the redemption of Fund shares.
|
|
|
COMPARISON OF CHANGE IN VALUE OF $10,000 INVESTMENT IN
|
|
BRIDGES INVESTMENT FUND, INC. AND THE STANDARD AND
|
|
POORS 500 INDEX AND THE RUSSELL 1000 GROWTH INDEX
|
|
|
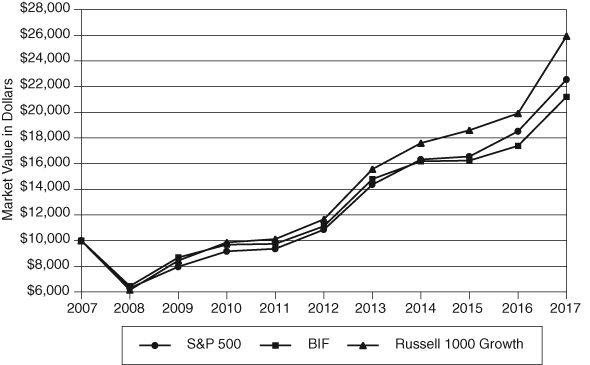 |
|
|
INFORMATION SUPPORTING AND SETTING
QUALIFICATIONS FOR INVESTMENT RETURNS
Assumptions
|
1.
|
The initial investment was made at the public offering price last calculated on the business day before the first day of the first fiscal year.
|
|
2.
|
The subsequent account values are based on the net asset values of the Fund last calculated on the last business day of the first and each subsequent fiscal year.
|
|
3.
|
The calculation for the final account value assumes the account was closed and the redemption was at the price last calculated on the last business day of the most recent fiscal year.
|
|
4.
|
All dividends and capital gains distributions by the Fund were reinvested at the price on the reinvestment dates. The dividend for the Standard & Poor’s 500 Composite Index for the previous quarter was invested at the month-end price closest to the reinvestment date for the Fund. The Russell 1000 Growth Index is a total return index that reinvests dividends continuously as they are paid.
|
MD&A–10
Appropriate Index
The Fund is to select an “appropriate broad-based securities market index” that is administered by an organization that is not an affiliated person of the Fund or its investment adviser. The securities index chosen must be adjusted to reflect reinvestment of dividends on securities in the index, but not the expenses of the Fund.
Use of Additional Indexes
In addition to the required comparison to a broadly-based index, mutual fund registrants with the Securities and Exchange Commission are encouraged to compare their performances to other more narrowly-based indexes that reflect the market sectors in which they invest. Management chose the Russell 1000 Growth Index as an additional index for comparison because the Fund’s Investment Manager invests primarily in large capitalization companies that have or are expected to have higher-than-average growth rates in revenues and earnings.
Item 22(d)(3)
The Fund files its complete schedule of portfolio holdings with the SEC for the First and Third Quarters of each fiscal year on Form N-Q, which is available on the SEC’s website at http://www.sec.gov or can be reviewed and copied at the SEC’s Public Reference Room in Washington, D.C. (information on the operation of the Public Reference Room may be obtained by calling 1-800-SEC-0330.) These reports can also be obtained from the Fund by sending an e-mail to fund@bridgesinv.com or calling 1-800-939-8401.
Item 22(d)(4) & (5)
A description of the policies and procedures that the Fund uses to determine how to vote proxies relating to portfolio securities, and a report on how the Fund voted such proxies during the 12-month period ended June 30, 2017 can be obtained at the Fund’s website at www.bridgesfund.com or by calling 1-800-939-8401, or from the SEC’s website at http://www.sec.gov.
Additional Disclosures
Shareholder Notification of Federal Tax Status (Unaudited) – The Bridges Investment Fund designates 100% of dividends declared during the fiscal year ended December 31, 2017 as dividends qualifying for the dividends received deduction available to corporate shareholders.
The Bridges Investment Fund designates 100% of dividends declared from the net investment income during the fiscal year ended December 31, 2017 as qualified income under the Jobs and Growth Tax Relief Reconciliation Act of 2003.
The Bridges Investment Fund designates 0% of ordinary distributions as short-term gain distributions under Internal Revenue code Section871(k)(2)(c).
Information to Be Filed in N-CSR Report – The Securities and Exchange Commission requires specific certifications by the Fund’s principal officers with every report on Form N-CSR. The Fund’s President, Executive Vice-President, and Chief Compliance Officer/Treasurer will provide his or her certification on a separate document, which certification will be filed as an exhibit to the Fund’s Form N-CSR. Form N-CSR includes certain additional items of information to be reported, including; Item 2. Code of Ethics; Item 3.
MD&A–11
Audit Committee Financial Expert; Item 4. Principal Accountant Fees and Services; Item 6. Schedule of Investments; Item 10. Submission of Matters to Vote of Security Holders; Item 11. Controls and Procedures; and Item 12. Exhibits. The Fund’s report on Form N-CSR is available, without charge, at the SEC’s website at http://sec.gov, and is also available, without charge, upon request to the offices of the Fund at 1.800.939.8401.
|
Respectfully Submitted,
|
|
|
|
|
Edson L. Bridges III
|
|
|
President and
|
|
|
Chief Executive and Investment Officer
|
(This Page Intentionally Left Blank.)
BRIDGES INVESTMENT FUND, INC.
8401 West Dodge Road
Omaha, Nebraska 68114
Telephone 402-397-4700
Facsimile 402-397-8617
|
Directors
|
|||
|
Daniel J. Brabec
|
Adam M. Koslosky
|
||
|
Edson L. Bridges III
|
Robert T. Slezak
|
||
|
Robert W. Bridges
|
Kelly A. Walters
|
||
|
Nathan Phillips Dodge III
|
Lyn Wallin Ziegenbein
|
||
|
Officers
|
|
|
Robert T. Slezak
|
Chairman and Lead Independent Director
|
|
Adam M. Koslosky
|
Vice Chairman
|
|
Edson L. Bridges II
|
Chairman Emeritus
|
|
Edson L. Bridges III
|
President and Chief Executive and
|
|
Investment Officer
|
|
|
Brian M. Kirkpatrick
|
Executive Vice President
|
|
Nancy K. Dodge
|
Secretary, Treasurer and Chief Compliance
|
|
Officer
|
|
|
Trinh Wu
|
Controller |
Independent Registered Public Accounting Firm
Cohen & Company, Ltd.
342 North Water Street, Suite 830
Milwaukee, Wisconsin 53202
|
Corporate Counsel
|
Counsel to Independent Directors
|
|
Baird, Holm, LLP
|
Husch Blackwell LLP
|
|
Attorneys at Law
|
13330 California Street
|
|
1500 Woodmen Tower
|
Suite 200
|
|
Omaha, Nebraska 68102
|
Omaha, Nebraska 68154
|
|
Distributor
|
|
|
Quasar Distributors, LLC
|
|
|
615 East Michigan Street
|
|
|
Milwaukee, Wisconsin 53202
|
Item 2. Code of Ethics.
The registrant has adopted a code of ethics that applies to the registrant’s president and treasurer. The registrant has not made any amendments to its code of ethics during the period covered by this report. The registrant has not granted any waivers from any provisions of the code of ethics during the period covered by this report. The registrant undertakes to provide to any person without charge, upon request, a copy of its code of ethics by mail when they provide a written request to the office of the Fund, Attention: Nancy Dodge, 256 Durham Plaza, 8401 West Dodge Road, Omaha, Nebraska, 68114.
Item 3. Audit Committee Financial Expert.
The registrant’s Board of Directors has determined that there are three audit committee financial experts serving on its audit committee. Adam M. Koslosky, Daniel J. Brabec, and Robert T. Slezak are the “audit committee financial experts” and are considered to be “independent” as each term is defined in Item 3 of Form N‑CSR.
Item 4. Principal Accountant Fees and Services.
The registrant has engaged its principal accountant to perform audit services, audit-related services, tax services and other services during the past two fiscal years. “Audit services” refer to performing an audit of the registrant's annual financial statements or services that are normally provided by the accountant in connection with statutory and regulatory filings or engagements for those fiscal years. “Audit-related services” refer to the assurance and related services by the principal accountant that are reasonably related to the performance of the audit. “Tax services” refer to professional services rendered by the principal accountant for tax compliance, tax advice, and tax planning. The following table details the aggregate fees billed or expected to be billed for each of the last two fiscal years for audit fees, audit-related fees, tax fees and other fees by the principal accountant.
|
FYE 12/31/2017
|
FYE 12/31/2016
|
|
|
Audit Fees
|
$13,500
|
$13,500
|
|
Audit-Related Fees
|
$ -
|
$ -
|
|
Tax Fees
|
$3,000
|
$3,000
|
|
All Other Fees
|
$ -
|
$ -
|
The audit committee has adopted pre-approval policies and procedures that require the audit committee to pre‑approve all audit and non‑audit services of the registrant, including services provided to any entity affiliated with the registrant.
The percentage of fees billed by Cohen Fund Audit Services, Ltd. to non-audit services pursuant to waiver of pre-approval requirement was as follows:
|
FYE 12/31/2017
|
FYE 12/31/2016
|
|
|
Audit-Related Fees
|
0%
|
0%
|
|
Tax Fees
|
0%
|
0%
|
|
All Other Fees
|
0%
|
0%
|
All of the principal accountant’s hours spent on auditing the registrant’s financial statements were attributed to work performed by full‑time permanent employees of the principal accountant. The following table indicates the non-audit fees billed or expected to be billed by the registrant’s accountant for services to the registrant and to the registrant’s investment adviser (and any other controlling entity, etc.—not sub-adviser) for the last two years. The audit committee of the Board of Directors has considered whether the provision of non-audit services that were rendered to the registrant's investment adviser is compatible with maintaining the principal accountant's independence and has concluded that the provision of such non-audit services by the accountant has not compromised the accountant’s independence.
|
Non-Audit Related Fees
|
FYE 12/31/2017
|
FYE 12/31/2016
|
|
Registrant
|
$ -
|
$ -
|
|
Registrant’s Investment Adviser
|
$ -
|
$ -
|
Item 5. Audit Committee of Listed Registrants.
Not applicable to registrants who are not listed issuers (as defined in Rule 10A-3 under the Securities Exchange Act of 1934).
Item 6. Investments.
|
(a)
|
Schedule of Investments is included as part of the report to shareholders filed under Item 1 of this Form.
|
|
(b)
|
Not applicable.
|
Item 7. Disclosure of Proxy Voting Policies and Procedures for Closed-End Management Investment Companies.
Not applicable to open-end investment companies.
Item 8. Portfolio Managers of Closed-End Management Investment Companies.
Not applicable to open-end investment companies.
Item 9. Purchases of Equity Securities by Closed‑End Management Investment Company and Affiliated Purchasers.
Not applicable to open-end investment companies.
Item 10. Submission of Matters to a Vote of Security Holders.
There have been no material changes to the procedures by which shareholders may recommend nominees to the registrant’s Board of Directors.
Item 11. Controls and Procedures.
|
(c)
|
The registrant’s president, executive vice president, and treasurer/principal financial officer have reviewed the registrant's disclosure controls and procedures (as defined in Rule 30a-3(c) under the Investment Company Act of 1940 (the “Act”)) as of a date within 90 days of the filing of this report, as required by Rule 30a-3(b) under the Act and Rules 13a-15(b) or 15d‑15(b) under the Securities Exchange Act of 1934. Based on their review, such officers have concluded that the disclosure controls and procedures are effective in ensuring that information required to be disclosed in this report is appropriately recorded, processed, summarized and reported and made known to them by others within the registrant and by the registrant’s service provider.
|
|
(d)
|
There were no changes in the registrant's internal control over financial reporting (as defined in Rule 30a-3(d) under the Act) that occurred during the second fiscal quarter of the period covered by this report that has materially affected, or is reasonably likely to materially affect, the registrant's internal control over financial reporting.
|
Item 12. Exhibits.
|
(a)
|
(1) Any code of ethics or amendment thereto, that is the subject of the disclosure required by Item 2, to the extent that the registrant intends to satisfy Item 2 requirements through filing an exhibit. Incorporated by reference to the Registrant’s Form N-CSR filed March 3, 2008.
|
(2) A separate certification for each principal executive and principal financial officer pursuant to Section 302 of the Sarbanes-Oxley Act of 2002. Filed herewith.
(3) Any written solicitation to purchase securities under Rule 23c‑1 under the Act sent or given during the period covered by the report by or on behalf of the registrant to 10 or more persons. Not applicable to open-end investment companies.
|
(b)
|
Certifications pursuant to Section 906 of the Sarbanes‑Oxley Act of 2002. Furnished herewith.
|
SIGNATURES
Pursuant to the requirements of the Securities Exchange Act of 1934 and the Investment Company Act of 1940, the registrant has duly caused this report to be signed on its behalf by the undersigned, thereunto duly authorized.
(Registrant) Bridges Investment Fund, Inc.
By (Signature and Title)* /s/Edson L. Bridges III
Edson L. Bridges III, President, CEO, CIO
Date February 23, 2018
Pursuant to the requirements of the Securities Exchange Act of 1934 and the Investment Company Act of 1940, this report has been signed below by the following persons on behalf of the registrant and in the capacities and on the dates indicated.
By (Signature and Title)* /s/Edson L. Bridges III
Edson L. Bridges III, President, CEO, CIO
Date February 23, 2018
By (Signature and Title)* /s/Brian M. Kirkpatrick
Brian M. Kirkpatrick, Executive Vice President
Date February 23, 2018
By (Signature and Title)* /s/Nancy K. Dodge
Nancy K. Dodge, Secretary, Treasurer, CCO, Principal Financial Officer
Date February 23, 2018
* Print the name and title of each signing officer under his or her signature.