Fund Performance History
IQ Hedge Macro Tracker
ETF
(as of April 30, 2018)
|
|
|
|
1
Year
|
|
3
Year
|
|
5
Year
|
|
Since
Inception1
|
|
|
|
|
Average
Annual
|
|
Average
Annual
|
|
Average
Annual
|
|
Average
Annual
|
|
Cumulative
|
IQ Hedge Macro Tracker ETF Market Price2 |
|
|
|
|
3.54 |
% |
|
|
1.14 |
% |
|
|
0.16 |
% |
|
|
1.41 |
% |
|
|
13.28 |
% |
IQ Hedge Macro Tracker ETF NAV |
|
|
|
|
3.50 |
% |
|
|
1.22 |
% |
|
|
0.19 |
% |
|
|
1.42 |
% |
|
|
13.34 |
% |
IQ Hedge Macro Index |
|
|
|
|
4.20 |
% |
|
|
2.10 |
% |
|
|
0.98 |
% |
|
|
2.15 |
% |
|
|
20.84 |
% |
HFRI Macro (Total) Index3 |
|
|
|
|
0.82 |
% |
|
|
–0.47 |
% |
|
|
0.74 |
% |
|
|
1.21 |
% |
|
|
11.33 |
% |
MSCI World Index |
|
|
|
|
13.22 |
% |
|
|
7.55 |
% |
|
|
9.28 |
% |
|
|
11.15 |
% |
|
|
156.04 |
% |
1 |
|
Fund Inception Date:
6/09/2009. |
2 |
|
Beginning on May 31, 2016, the price used to calculate
the Market Price returns is the mean between the day’s last bid and ask prices. Prior to May 31, 2016, market price returns were calculated using
the day’s NYSE Arca closing price. The market price returns do not represent returns an investor would receive if shares were traded at other
times. |
3 |
|
Data shown above for the HFRI Fund of Funds Composite Index is
from 5/31/2009 to 4/30/2018. |
9
Management’s Discussion of
Fund Performance (unaudited) (continued)
How did IQ Hedge Market Neutral Tracker ETF perform
during the 12 months ended April 30, 2018?
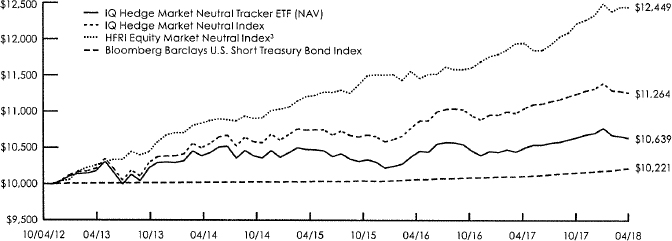
For the 12 months ended April 30, 2018 (the
“reporting period”), IQ Hedge Market Neutral Tracker ETF returned 1.29% at NAV (net asset value) and 1.31% at market
price.1 To compare, the Fund’s Underlying Index, the IQ Hedge Market Neutral Index,2 returned 1.91% for the same time
period. The HFRI Equity Market Neutral Index2 and the Bloomberg Barclays U.S. Short Treasury Bond Index2 returned 4.19%
and 1.09%, respectively, for the same period.
What factors affected the Fund’s performance
during the reporting period?
While the Fund’s exposure to bonds was the largest
asset class allocation during the reporting period, its performance was driven primarily by its allocation to equities. Within the equity asset
class, the Fund’s long positions were the dominant source of its performance, driven by U.S. large-cap growth strategies, via
underlying ETFs. Its short positioning overall detracted, especially its short exposure to emerging markets equities, via underlying
ETFs. The Fund’s net exposure to currencies did not have a significant effect on the Fund’s performance during the reporting
period.
During the reporting period, how was the Fund’s
performance materially affected by investments in derivatives?
The Fund used derivative positions exclusively to help it
track its Underlying Index, which contains both long and short weights. Primarily, the Fund used total return swaps on the ETFs at the weights
in which they are included in the Underlying Index.
How were the Fund’s assets allocated during the
reporting period and why?
The Fund’s allocations are driven by quantitative
models that determine the weights across the various hedge fund strategies represented in the Fund as well as the weights of the assets within
these strategies. Given the rules-based nature of the process, there is no subjectivity involved in the allocation decision
process.
During the reporting period, the Fund adjusted its
allocations between the Equity Market Neutral hedge fund strategy and the Fixed Income Arbitrage hedge fund strategy. The initial months of the
reporting period were dominated by the Fixed Income Arbitrage hedge fund strategy. The emphasis was then reversed to the Equity Market
Neutral hedge fund strategy for a single month, and the Fund subsequently maintained a near equal allocation between the two strategies for the
remainder of the reporting period, with the Equity Market Neutral hedge fund strategy just more than 50% of the allocation.
At the asset class level, the Fund was net long—and
dominated by—its allocation to bonds. The Fund was anchored by an allocation to short-term U.S. Treasuries, however floating rate
securities, investment grade corporate bonds and mortgage-backed securities rounded out the Fund’s bond exposure. The Fund’s
allocation to equities was smaller, but returns for the reporting period were dominated by this asset class, with U.S. large-cap growth
equities providing most of the positive contribution followed by U.S. small-cap growth equities, all via underlying ETFs.
How did the Fund’s allocations change over the
course of the reporting period?
The Fund’s asset class allocations were adjusted as
determined by the underlying proprietary quantitative models. During the reporting period, bonds remained the dominant asset, followed by
equities and then currencies. The Fund’s Underlying Index adjusted its composition from a 130/30 to 110/10 long/short extension
structure3 effective at the September 2017 rebalance and thus the Fund did so similarly.
1 |
|
The price used to calculate the
market price returns is the mean between the day’s last bid and ask prices and does not represent returns an investor would receive if
shares were traded at other times. |
2 |
|
See page 11 for more
information on this index. |
3 |
|
A 130/30 extension structure implies a strategy
allowing the simultaneous holding of both long and short positions on different securities in the portfolio, shorting stocks up to 30% of the
portfolio value and then using the proceeds of the short to take a long position in the stocks believed to potentially outperform the market.
The “130” portion stands for 130% exposure to its long portfolio and the “30” portion stands for 30% exposure to its short
portfolio. The same concept applies to a 110/10 extension structure, simply using different percentages in the ratio. |
10
Management’s Discussion of Fund Performance
(unaudited) (continued)
During the reporting period, which underlying ETFs had
the highest total returns and which underlying ETFs had the lowest total returns?
In terms of total return, the best-performing underlying
ETFs in the Fund were iShares Russell 2000 Growth ETF (IWO) and iShares S&P Small Cap 600 Growth ETF (IJT). During the reporting period,
iShares 3-7 Treasury Bond ETF (IEI) and Invesco DB US Dollar Index Bullish Fund (UUP) recorded the lowest total returns.
Which underlying ETFs were the strongest positive
contributors to the Fund’s performance and which underlying ETFs were particularly weak?
On the basis of impact, which takes weightings and total
returns into consideration, the underlying ETFs that made the greatest positive contributions to the Fund’s performance during the
reporting period were iShares Russell 1000 Growth ETF (IWF) and SPDR S&P Bank ETF (KBE). The weakest contributors were iShares iBoxx
Investment Grade Corporate Bond ETF (LQD) and Vanguard FTSE Emerging Markets ETF (VWO).
The opinions expressed are those of the portfolio
managers as of the date of this report and are subject to change. There is no guarantee that any forecast made will come to pass. This material
does not constitute investment advice and is not intended as an endorsement of any specific investment.
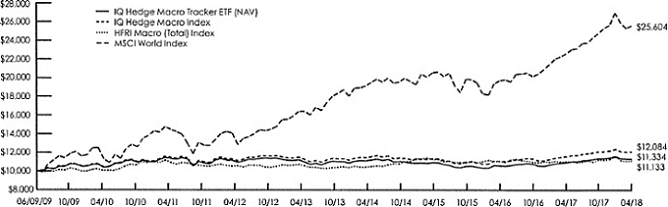
Hypothetical Growth of a $10,000 Investment
(Since
Inception Through 4/30/2018)
This chart illustrates the performance of a hypothetical $10,000 investment made on the Fund’s inception, and is not intended to
imply any future performance.
Fund Performance History
IQ Hedge Market Neutral Tracker ETF
(as of April 30, 2018)
|
|
|
|
1
Year
|
|
3
Year
|
|
5
Year
|
|
Since
Inception1
|
|
|
|
|
Average
Annual
|
|
Average
Annual
|
|
Average
Annual
|
|
Average
Annual
|
|
Cumulative
|
IQ Hedge Market Neutral Tracker ETF Market Price2 |
|
|
|
|
1.31 |
% |
|
|
0.57 |
% |
|
|
0.60 |
% |
|
|
1.12 |
% |
|
|
6.38 |
% |
IQ Hedge Market Neutral Tracker ETF NAV |
|
|
|
|
1.29 |
% |
|
|
0.53 |
% |
|
|
0.63 |
% |
|
|
1.12 |
% |
|
|
6.39 |
% |
IQ Hedge Market Neutral Index |
|
|
|
|
1.91 |
% |
|
|
1.57 |
% |
|
|
1.71 |
% |
|
|
2.16 |
% |
|
|
12.64 |
% |
HFRI Equity Market Neutral Index3 |
|
|
|
|
4.19 |
% |
|
|
3.51 |
% |
|
|
3.86 |
% |
|
|
4.06 |
% |
|
|
24.49 |
% |
Bloomberg Barclays U.S. Short Treasury Bond Index |
|
|
|
|
1.09 |
% |
|
|
0.61 |
% |
|
|
0.42 |
% |
|
|
0.39 |
% |
|
|
2.21 |
% |
1 |
|
Fund Inception Date: 10/04/2012. |
2 |
|
Beginning on May 31, 2016, the price used
to calculate the Market Price returns is the mean between the day’s last bid and ask prices. Prior to May 31, 2016, market price returns were
calculated using the day’s NYSE Arca closing price. The market price returns do not represent returns an investor would receive if shares were
traded at other times. |
3 |
|
Data shown above for the HFRI Equity Market Neutral
Index is from 9/30/2012 to 4/30/2018. |
11
Management’s Discussion of
Fund Performance (unaudited) (continued)
How did IQ Hedge Long/Short Tracker ETF perform during
the 12 months ended April 30, 2018?
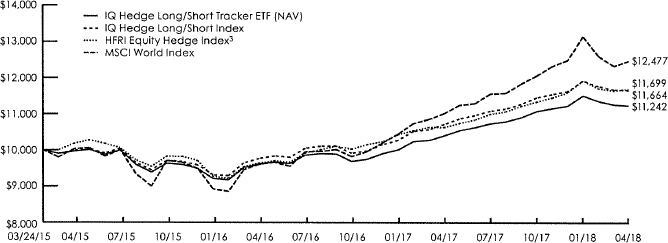
For the 12 months ended April 30, 2018 (the
“reporting period”), IQ Hedge Long/Short Tracker ETF returned 8.02% at NAV (net asset value) and 8.23% at market price.1 To
compare, the Fund’s Underlying Index, the IQ Hedge Long/Short Index,2 returned 8.78% for the same time period. The HFRI Equity
Hedge Index2 and the MSCI World Index returned 9.95% and 13.22%, respectively, for the same
period.
What factors affected the Fund’s performance
during the reporting period?
The Fund maintains exposures to equity, fixed income,
real estate and volatility ETFs. During the reporting period, the Fund’s primary exposures were to international equity, U.S. equity and
investment grade corporate bond ETFs.
The Fund’s exposure to equities as a whole —
and to U.S. large-cap core and international small-cap equity ETFs in particular — was the primary positive contributor to returns during
the reporting period. U.S. large-cap growth equity ETFs and international equity core ETFs were also strong performers.
Exposure to long volatility ETFs detracted from Fund
performance during the reporting period.
During the reporting period, how was the Fund’s
performance materially affected by investments in derivatives?
The Fund used derivative positions exclusively to help it
track its Underlying Index, which contains both long and short weights. Primarily, the Fund used total return swaps on the ETFs at the weights
in which they are included in the Underlying Index.
How were the Fund’s assets allocated during the
reporting period and why?
The Fund’s allocations are driven by quantitative
models that determine the weights across the various hedge fund strategies represented in the Fund as well as the weights of the assets within
these strategies. Given the rules-based nature of the process, there is no subjectivity involved in the allocation decision
process.
During the reporting period, the equity asset class was
the primary exposure for the Fund. The Fund had short positions in U.S. small-cap value equities, U.S. large-cap growth equities and emerging
markets equities, via underlying ETFs. International small-cap equities, U.S. preferred securities and international core equities, via
underlying ETFs, were the Fund’s largest allocations within the asset class.
Via underlying ETFs, bonds remained within the asset
class’ historically average range within the Fund during the reporting period, with investment grade corporate bonds comprising the
majority of the allocation. The Fund also had an allocation to floating rate bonds during the reporting period. The Fund maintained a short
exposure to real estate for the majority of the reporting period, and maintained a modest Fund allocation to volatility
throughout.
How did the Fund’s allocations change over the
course of the reporting period?
At the asset class level, the Fund was predominantly net
long equities, via underlying ETFs, reducing the position in the final month of the reporting period. The Fund maintained a complementary
exposure to bonds, via underlying ETFs, increasing the position in the final month of the reporting period. The Fund also maintained a
small long exposure to volatility, via underlying ETFs, to help guard against large volatility spikes. The Fund was short real
estate.
The Fund’s Underlying Index adjusted its composition
from a 130/30 to 110/10 long/short extension structure3 effective at the September 2017 rebalance.
1 |
|
The price used to calculate the market price
returns is the mean between the day’s last bid and ask prices and does not represent returns an investor would receive if shares were
traded at other times. |
2 |
|
See page 13 for more information on
this index. |
3 |
|
A 130/30 extension structure implies a strategy
allowing the simultaneous holding of both long and short positions on different securities in the portfolio, shorting stocks up to 30% of the
portfolio value and then using the proceeds of the short to take a long position in the stocks believed to potentially outperform the market.
The “130” portion stands for 130% exposure to its long portfolio and the “30” portion stands for 30% exposure to its short
portfolio. The same concept applies to a 110/10 extension structure, simply using different percentages in the ratio. |
12
Management’s Discussion of
Fund Performance (unaudited) (continued)
During the reporting period, which underlying ETFs had
the highest total returns and which underlying ETFs had the lowest total returns?
In terms of total return, the best-performing underlying
ETFs in the Fund were Technology Select Sector SPDR Fund (XLK) and Invesco S&P 500 Pure Growth ETF (RPG). During the reporting period, iPath
S&P 500 VIX Short-Term Futures ETN Class A (VXX) and Vanguard Real Estate (VNQ) recorded the lowest total returns.
Which underlying ETFs were the strongest positive
contributors to the Fund’s performance and which underlying ETFs were particularly weak?
On the basis of impact, which takes weightings and total
returns into consideration, the underlying ETFs that made the greatest positive contributions to the Fund’s performance during the
reporting period were Financial Select Sector SPDR Fund (XLF) and iShares MSCI EAFE Small Cap ETF (SCZ). The weakest contributors were iPath
S&P 500 VIX Short-Term Futures ETN Class A (VXX) and Vanguard FTSE Emerging Markets ETF (VWO).
The opinions expressed are those of the portfolio
managers as of the date of this report and are subject to change. There is no guarantee that any forecast made will come to pass. This material
does not constitute investment advice and is not intended as an endorsement of any specific investment.
Hypothetical Growth of a $10,000 Investment
(Since
Inception Through 4/30/2018)
This chart illustrates the performance of a hypothetical $10,000 investment made on the Fund’s inception, and is not intended to
imply any future performance.
Fund Performance History
IQ Hedge Long/Short Tracker ETF
(as of April 30, 2018)
|
|
|
|
1
Year
|
|
3
Year
|
|
Since
Inception1
|
|
|
|
|
Average
Annual
|
|
Average
Annual
|
|
Average
Annual
|
|
Cumulative
|
IQ Hedge Long/Short Tracker ETF Market Price2 |
|
|
|
|
8.23 |
% |
|
|
2.68 |
% |
|
|
3.87 |
% |
|
|
12.52 |
% |
IQ Hedge Long/Short Tracker ETF NAV |
|
|
|
|
8.02 |
% |
|
|
4.10 |
% |
|
|
3.84 |
% |
|
|
12.42 |
% |
IQ Hedge Long/Short Index |
|
|
|
|
8.78 |
% |
|
|
5.33 |
% |
|
|
5.08 |
% |
|
|
16.64 |
% |
HFRI Equity Hedge Index3 |
|
|
|
|
9.95 |
% |
|
|
4.73 |
% |
|
|
5.22 |
% |
|
|
16.99 |
% |
MSCI World Index |
|
|
|
|
13.22 |
% |
|
|
7.55 |
% |
|
|
7.38 |
% |
|
|
24.77 |
% |
1 |
|
Fund Inception Date:
03/24/2015. |
2 |
|
Beginning on May 31, 2016, the price used
to calculate the Market Price returns is the mean between the day’s last bid and ask prices. Prior to May 31, 2016, market price returns were
calculated using the day’s NYSE Arca closing price. The market price returns do not represent returns an investor would receive if shares were
traded at other times. |
3 |
|
Data shown above for the HFRI Equity Hedge Index is
from 3/31/2015 to 4/30/2018. |
13
Management’s Discussion of
Fund Performance (unaudited) (continued)
How did IQ Hedge Event-Driven Tracker ETF perform
during the 12 months ended April 30, 2018?
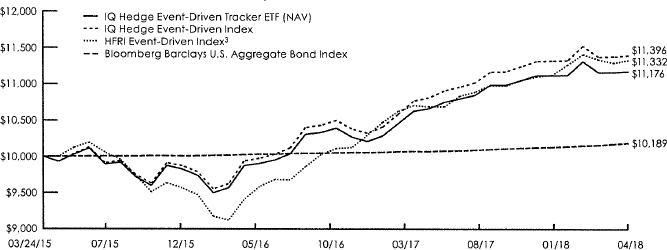
For the 12 months ended April 30, 2018 (the
“reporting period”), IQ Hedge Event-Driven ETF returned 3.93% at NAV (net asset value) and 3.94% at market price.1 To
compare, the Fund’s Underlying Index, the IQ Hedge Event-Driven Index,2 returned 4.44% for the same time period. The HFRI
Event-Driven Index2 and the Bloomberg Barclays U.S. Aggregate Bond Index2 returned 5.99%, and 1.09%, respectively, for the
same period.
What factors affected the Fund’s performance
during the reporting period?
The Fund maintained exposures to equities and fixed
income, via underlying ETFs. During the reporting period, the Fund’s long positions as a whole contributed positively, while short
positions overall detracted slightly from performance.
The Fund was predominantly invested in fixed income
during the reporting period. Via underlying ETFs, convertible bonds were the primary source of performance, while investment grade corporate
bonds were the largest weight within the asset class.
Within equities, U.S. small-cap growth, via underlying
ETFs, was the dominant weight and contributed most to the Fund’s performance. The Fund held a short exposure to U.S. preferred securities
during the reporting period.
During the reporting period, how was the Fund’s
performance materially affected by investments in derivatives?
The Fund used derivative positions exclusively to help it
track its Underlying Index, which contains both long and short weights. Primarily, the Fund used total return swaps on the ETFs at the weights
in which they are included in the Underlying Index.
How were the Fund’s assets allocated during the
reporting period and why?
The Fund’s allocations are driven by quantitative
models that determine the weights across the various hedge fund strategies represented in the Fund as well as the weights of the assets within
these strategies. Given the rules-based nature of the process, there is no subjectivity involved in the allocation decision
process.
At the asset class level, the Fund was net long in bonds,
particularly investment grade corporate bonds and convertible bonds. The Fund was also net long within equities, with long positions in U.S.
growth-oriented equities.
How did the Fund’s allocations change over the
course of the reporting period?
The Fund’s asset class allocations were adjusted as
determined by the underlying proprietary quantitative models. During the reporting period, bonds and equities were the sole asset classes to
which the Fund was allocated, with bonds the majority exposure. Investment grade corporate bonds and convertible bonds were the largest
allocations within the asset class. Within the equity asset class, the Fund had long positions in U.S. small-cap growth equities and U.S.
large-cap value equities and a short position in U.S. preferred securities, via underlying ETFs. It should be noted that the Fund’s
Underlying Index adjusted its construction from a 130/30 to 110/10 long/short extension structure3 effective in the September 2017
rebalance and thus the Fund did so similarly.
During the reporting period, which underlying ETFs had
the highest total returns and which underlying ETFs had the lowest total returns?
In terms of total return, the best-performing underlying
ETFs in the Fund were iShares Russell 2000 Growth ETF (IWO) and Vanguard Small-Cap Growth ETF (VBK). During the reporting period, Invesco
Preferred ETF (PGX) and Vanguard Short-Term Bond ETF (BSV) recorded the lowest total returns.
1 |
|
The price used to calculate the market price
returns is the mean between the day’s last bid and ask prices and does not represent returns an investor would receive if shares were
traded at other times. |
2 |
|
See page 15 for more information on
this index. |
3 |
|
A 130/30 extension structure implies a strategy
allowing the simultaneous holding of both long and short positions on different securities in the portfolio, shorting stocks up to 30% of the
portfolio value and then using the proceeds of the short to take a long position in the stocks believed to potentially outperform the market.
The “130” portion stands for 130% exposure to its long portfolio and the “30” portion stands for 30% exposure to its short
portfolio. The same concept applies to a 110/10 extension structure, simply using different percentages in the ratio. |
14
Management’s Discussion of
Fund Performance (unaudited) (continued)
Which underlying ETFs were the strongest positive
contributors to the Fund’s performance and which underlying ETFs were particularly weak?
On the basis of impact, which takes weightings and total
returns into consideration, the underlying ETFs that made the greatest positive contributions to the Fund’s performance during the
reporting period were SPDR Bloomberg Barclays Convertible Securities ETF (CWB) and Invesco Senior Load ETF (BKLN). The weakest
contributors were iShares U.S. Preferred Stock ETF (PFF) and Vanguard Short-Term Bond ETF (BSV).
The opinions expressed are those of the portfolio
managers as of the date of this report and are subject to change. There is no guarantee that any forecast made will come to pass. This material
does not constitute investment advice and is not intended as an endorsement of any specific investment.
Hypothetical Growth of a $10,000 Investment
(Since
Inception Through 4/30/2018)
This chart illustrates the performance of a hypothetical $10,000 investment made on the Fund’s inception, and is not intended to
imply any future performance.
Fund Performance History
IQ Hedge Event-Driven Tracker ETF
(as of April 30, 2018)
|
|
|
|
1
Year
|
|
3
Year
|
|
Since
Inception1
|
|
|
|
|
Average
Annual
|
|
Average
Annual
|
|
Average
Annual
|
|
Cumulative
|
IQ Hedge Event-Driven Tracker ETF Market Price2 |
|
|
|
|
3.94 |
% |
|
|
3.71 |
% |
|
|
3.66 |
% |
|
|
11.81 |
% |
IQ Hedge Event-Driven Tracker ETF NAV |
|
|
|
|
3.93 |
% |
|
|
3.67 |
% |
|
|
3.65 |
% |
|
|
11.76 |
% |
IQ Hedge Event-Driven Index |
|
|
|
|
4.44 |
% |
|
|
4.31 |
% |
|
|
4.30 |
% |
|
|
13.96 |
% |
HFRI Event-Driven Index3 |
|
|
|
|
5.99 |
% |
|
|
3.82 |
% |
|
|
4.14 |
% |
|
|
13.32 |
% |
Bloomberg Barclays U.S. Aggregate Bond Index |
|
|
|
|
1.09 |
% |
|
|
0.61 |
% |
|
|
0.60 |
% |
|
|
1.89 |
% |
1 |
|
Fund Inception Date:
03/24/2015. |
2 |
|
Beginning on May 31, 2016, the
price used to calculate the Market Price returns is the mean between the day’s last bid and ask prices. Prior to May 31, 2016, market price
returns were calculated using the day’s NYSE Arca closing price. The market price returns do not represent returns an investor would receive if
shares were traded at other times. |
3 |
|
Data shown above for the HFRI
Event-Driven Index is from 3/31/2015 to 4/30/2018. |
15
Management’s Discussion of
Fund Performance (unaudited) (continued)
How did IQ Global Resources ETF perform during the 12
months ended April 30, 2018?
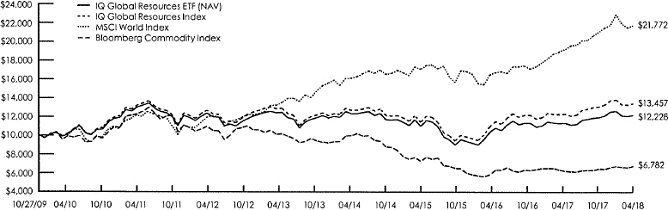
For the 12 months ended April 30, 2018 (the
“reporting period”), IQ Global Resources ETF returned 7.50% at NAV (net asset value) and 6.55% at market price.1 To
compare, the Fund’s Underlying Index, the IQ Global Resources Index,2 returned 9.08% for the same time period. The
MSCI® World Index2 and the Bloomberg Commodity Index2 returned 13.22% and 8.02%, respectively,
during the same period.
The Fund invests in a representative sample of securities
included in the Index that collectively has an investment profile similar to the Index. Due to the use of representative sampling, the Fund may
or may not hold all of the securities that are included in the Index.
What factors affected the Fund’s performance
during the reporting period?
The Fund seeks to invest in multi-cap equities with
significant exposure to global commodities and resources. During the reporting period, the U.S. dollar weakened relative to other global
currencies. Global commodities prices overall fluctuated during the reporting period, but oil prices hit their highest levels in
years.
From a sector and industry perspective, the Fund’s
largest detractors from performance were grains food and fiber and water. The Fund’s exposure to timber and industrial metals generated the
greatest positive sector returns.
The Fund also utilized U.S. and international equity
market hedges, which, in aggregate, contributed negatively to performance during the reporting period.
During the reporting period, how was the Fund’s
performance materially affected by investments in derivatives?
The Fund used derivatives in limited quantities and
solely to replicate the economic exposures that are reflected in the Underlying Index. Primarily, the Fund used total return swaps during the
reporting period. The use of derivatives had a negative impact on the Fund’s performance during the reporting period.
During the reporting period, which industries had the
highest total returns and which industries had the lowest total returns?
In terms of total return, the best-performing industries
in the Underlying Index were timber, industrial metals and energy. During the reporting period, grains food and fiber, precious metals and
livestock recorded the lowest total returns.
During the reporting period, which industries made the
strongest contributions to the Fund’s absolute performance and which industries made the weakest contributions?
On the basis of impact, which takes weightings and total
returns into account, the industries that made the strongest positive contributions to the Fund’s absolute performance were timber,
industrial metals and coal. The industries that made the weakest contributions to the Fund’s absolute performance were grains food and
fiber, water and livestock.
During the reporting period, which individual stocks
had the highest total returns and which stocks had the lowest total returns?
Within the Underlying Index, the stocks with the highest
total return during the reporting period were Kirkland Lake Gold, Evraz and MMG. Canada’s Kirkland Lake Gold operates as a gold mining and
exploration company. Evraz is a Russian mining company focused on iron ore and coal. Australia’s MMG explores, develops and mines base
metals globally.
The Underlying Index components with the lowest total
returns for the reporting period were Westmoreland Coal, Eldorado Gold and Noble Group. U.S.-based Westmoreland Coal operates as a coal mining
company. Canada’s Eldorado Gold acquires, explores and develops mineral properties. Noble Group is a Hong Kong-based company that
markets and processes raw material by sourcing bulk commodities from specific regions around the world.
1 |
|
The price used to calculate the market price
returns is the mean between the day’s last bid and ask prices and does not represent returns an investor would receive if shares were
traded at other times. |
2 |
|
See page 17 for more information on
this index. |
16
Management’s Discussion of
Fund Performance (unaudited) (continued)
Which individual stocks made the strongest
contributions to the Fund’s absolute performance during the reporting period and which stocks made the weakest
contributions?
On the basis of impact, which takes weightings and total
returns into consideration, the stocks that made the strongest contributions to the Fund’s absolute performance during the reporting period
were China Shenhua Energy, Stora Enso and UPM-Kymmene. China Shenhua Energy focuses on coal and power businesses in China. Stora Enso is
a paper, packaging and forest products company based in Finland. UPM-Kymmene, also based in Finland, manufactures forest
products.
The weakest contributors were General Mills, a U.S.-based
grains food and fiber company; NH Foods, a Japan-based company that breeds and raises livestock and produces and sells meat products; and
Nutrien, a Canada-based grains, food and fiber company.
Were there any changes in the Underlying Index during
the reporting period?
The Underlying Index is reconstituted annually, meaning
that components are added or removed, with periodic monthly rebalances. In turn, the Fund rebalances its sector weights each month according to
a proprietary rotation methodology that overweights sectors with high price momentum and low valuation and underweights sectors with the
opposite characteristics. The Underlying Index adjusted the minimum and maximum weights an individual sector can be distributed based on the
sector’s model output score.
The opinions expressed are those of the portfolio
managers as of the date of this report and are subject to change. There is no guarantee that any forecast made will come to pass. This material
does not constitute investment advice and is not intended as an endorsement of any specific investment.
Hypothetical Growth of a $10,000
Investment
(Since Inception Through 4/30/2018)
This chart illustrates the performance of a hypothetical
$10,000 investment made on the Fund’s inception, and is not intended to imply any future performance.
Fund Performance History
IQ Global Resources ETF
(as of April 30, 2018)
|
|
|
|
1
Year
|
|
3
Year
|
|
5
Year
|
|
Since
Inception1
|
|
|
|
|
Average
Annual
|
|
Average
Annual
|
|
Average
Annual
|
|
Average
Annual
|
|
Cumulative
|
IQ Global Resources ETF Market Price2 |
|
|
|
|
6.55 |
% |
|
|
1.59 |
% |
|
|
0.60 |
% |
|
|
2.34 |
% |
|
|
21.80 |
% |
IQ Global Resources ETF NAV |
|
|
|
|
7.50 |
% |
|
|
1.69 |
% |
|
|
0.55 |
% |
|
|
2.39 |
% |
|
|
22.28 |
% |
IQ Global Resources Index |
|
|
|
|
9.08 |
% |
|
|
3.59 |
% |
|
|
1.77 |
% |
|
|
3.55 |
% |
|
|
34.57 |
% |
MSCI World Index |
|
|
|
|
13.22 |
% |
|
|
7.55 |
% |
|
|
9.28 |
% |
|
|
9.57 |
% |
|
|
117.72 |
% |
Bloomberg Commodity Index |
|
|
|
|
8.02 |
% |
|
|
–4.17 |
% |
|
|
–7.32 |
% |
|
|
–4.46 |
% |
|
|
–32.18 |
% |
1 |
|
Fund Inception Date:
10/27/2009. |
2 |
|
Beginning on May 31, 2016, the price used
to calculate the Market Price returns is the mean between the day’s last bid and ask prices. Prior to May 31, 2016, market price returns were
calculated using the day’s NYSE Arca closing price. The market price returns do not represent returns an investor would receive if shares were
traded at other times. |
17
Management’s Discussion of
Fund Performance (unaudited) (continued)
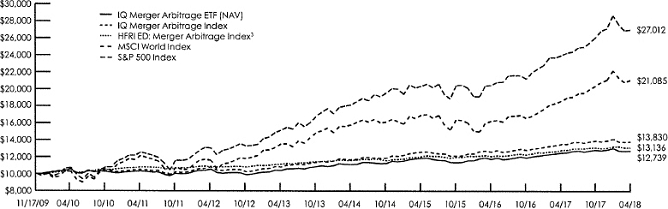
How did IQ Merger Arbitrage ETF perform during the 12
months ended April 30, 2018?
For the 12 months ended April 30, 2018 (the
“reporting period”), IQ Merger Arbitrage ETF returned 1.69% at NAV (net asset value) and 1.59% at market
price.1 To compare, the Fund’s Underlying Index, the IQ Merger Arbitrage Index,2 returned 2.29% for the same time
period. The S&P 500® Index2, MSCI World Index2, and the HFRI Event
Driven: Merger Arbitrage Index2 returned 12.60%, 13.22% and 2.55%, respectively, for the same period.
What factors affected the Fund’s performance
during the reporting period?
The Underlying Index seeks to capture the premium
discount of merger targets. Through a proprietary merger selection process, the Underlying Index will select target companies satisfying all
required selection criteria and will hold securities until the premium has been realized through a successful merger or when any of the
selection criteria are violated during the monthly reconstitution. Key risks of the strategy include potential withdrawal or cancellation
of a pending merger, the failure to meet selection criteria pertaining to liquidity, deal age or size requirements, and the risks associated
with deal payment through the use of the acquiring company’s stock. Any or all of these conditions can result in under-realization of the
deal premium.
During the reporting period, global merger and
acquisition activity exceeded $5.4 trillion, with 35% completing successfully and 33% remaining open. The remaining deals were either
terminated/withdrawn or did not progress past proposal. During the reporting period the majority of deals within the Underlying Index
completed successfully. Less than 5% of Underlying Index constituents failed to complete successfully, and were removed from the
Underlying Index and approximately 15% of Underlying Index constituents were removed due to failing to meet criteria necessary to remain in the
Underlying Index.
During the reporting period, how was the Fund’s
performance materially affected by investments in derivatives?
The Fund used derivative positions exclusively to help it
treat its Underlying Index. The Fund uses hedges to dampen potential downward price performance of the acquiring company’s stock used in
stock-based transactions. In cases when the acquiring company’s economic sector performs positively, the hedge will detract from
performance; if the acquiring company’s economic sector performs negatively, the hedge will contribute to performance. The Fund only hedges
the exposure to stock-based transactions.
During the reporting period, which sectors had the
highest total returns and which sectors had the lowest total returns?
In terms of total return, the best-performing sectors in
the Underlying Index were materials, real estate and utilities. During the reporting period, telecommunication services, health care and energy
recorded the lowest total returns.
During the reporting period, which sectors made the
strongest contributions to the Fund’s absolute performance and which sectors made the weakest contributions?
On the basis of impact, which takes weightings and total
returns into account, the sectors that made the strongest positive contributions to the Fund’s absolute performance were materials,
utilities and consumer discretionary. The sectors that made the weakest contributions to the Fund’s absolute performance were health
care, telecommunication services and information technology.
During the reporting period, which individual stocks
had the highest total returns and which stocks had the lowest total returns?
Within the Underlying Index, the stocks with the highest
total returns during the reporting period were Stada Arzneimittel, Huntsman and Zodiac Aerospace. Stada Arzneimittel is a pharmaceutical
manufacturer. Huntsman manufactures different types of agricultural chemicals. Zodiac Aerospace manufactures and sells aeronautical
equipment for airplanes, helicopters and weapons systems manufacturers.
The Underlying Index components with the lowest total
returns for the reporting period were Akorn, Neos Therapeutics and Vocus Group. Akorn develops and manufactures branded prescription
pharmaceuticals. Neos Therapeutics operates as a drug delivery and contract manufacturing company. Vocus Group owns and operates
independent data networks.
1 |
|
The price used to calculate the market price
returns is the mean between the day’s last bid and ask prices and does not represent returns an investor would receive if shares were
traded at other times. |
2 |
|
See page 19 for more information on
this index. |
18
Management’s Discussion of
Fund Performance (unaudited) (continued)
Which individual stocks made the strongest
contributions to the Fund’s absolute performance during the reporting period and which stocks made the weakest
contributions?
On the basis of impact, which takes weightings and total
returns into consideration, the stocks that made the strongest contributions to the Fund’s absolute performance during the reporting period
were Huntsman, mentioned earlier; C.R. Bard and Dynegy. C.R. Bard manufactures and distributes medical equipment, and Dynegy offers
electric energy distribution throughout the U.S.
The weakest contributors were Akorn, mentioned earlier;
Cavium, a provider of semiconductor processors; and Neos Therapeutics, also already mentioned.
Were there any changes in the Underlying Index during
the reporting period?
The Underlying Index is reconstituted, meaning that
components were added to or removed from the Underlying Index, and rebalanced monthly. Intra-month removal of deals occurs only for completed
transactions. All other deals are removed at the monthly rebalance. The timing of the rebalance can have both positive and potentially
adverse effects, depending on the circumstance of the deal, the number of competing offers, and if new acquirers attempt to acquire existing
targets. The Fund’s hedges are also reset at this time.
The opinions expressed are those of the portfolio
managers as of the date of this report and are subject to change. There is no guarantee that any forecast made will come to pass. This material
does not constitute investment advice and is not intended as an endorsement of any specific investment.
Hypothetical Growth of a $10,000 Investment
(Since
Inception Through 4/30/2018)
This chart illustrates the performance of a hypothetical
$10,000 investment made on the Fund’s inception, and is not intended to imply any future performance.
Fund Performance History
IQ Merger Arbitrage ETF
(as of April 30, 2018)
|
|
|
|
1
Year
|
|
3
Year
|
|
5
Year
|
|
Since
Inception1
|
|
|
|
|
Average
Annual
|
|
Average
Annual
|
|
Average
Annual
|
|
Average
Annual
|
|
Cumulative
|
IQ Merger Arbitrage ETF Market Price2 |
|
|
|
|
1.59 |
% |
|
|
2.38 |
% |
|
|
4.30 |
% |
|
|
2.92 |
% |
|
|
27.51 |
% |
IQ Merger Arbitrage ETF NAV |
|
|
|
|
1.69 |
% |
|
|
2.41 |
% |
|
|
4.15 |
% |
|
|
2.91 |
% |
|
|
27.39 |
% |
IQ Merger Arbitrage Index |
|
|
|
|
2.29 |
% |
|
|
3.19 |
% |
|
|
5.01 |
% |
|
|
3.91 |
% |
|
|
38.30 |
% |
HFRI ED: Merger Arbitrage Index3 |
|
|
|
|
2.55 |
% |
|
|
2.94 |
% |
|
|
3.34 |
% |
|
|
3.29 |
% |
|
|
31.36 |
% |
MSCI World Index |
|
|
|
|
13.22 |
% |
|
|
7.55 |
% |
|
|
9.28 |
% |
|
|
9.22 |
% |
|
|
110.85 |
% |
S&P 500 Index |
|
|
|
|
12.60 |
% |
|
|
9.88 |
% |
|
|
12.26 |
% |
|
|
12.47 |
% |
|
|
170.12 |
% |
1 |
|
Fund Inception Date:
11/17/2009. |
2 |
|
Beginning on May 31, 2016, the price used
to calculate the Market Price returns is the mean between the day’s last bid and ask prices. Prior to May 31, 2016, market price returns were
calculated using the day’s NYSE Arca closing price. The market price returns do not represent returns an investor would receive if shares were
traded at other times. |
3 |
|
Data shown above for the HFRI ED: Merger Arbitrage
Index is from 11/30/2009 to 4/30/2018. |
19
Management’s Discussion of
Fund Performance (unaudited) (continued)
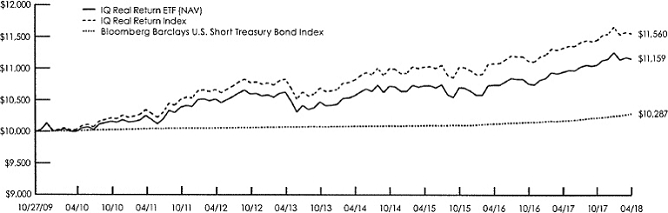
How did IQ Real Return ETF perform during the 12
months ended April 30, 2018?
For the 12 months ended April 30, 2018 (the
“reporting period”), IQ Real Return ETF returned 1.89% at NAV (net asset value) and 1.81% at market price.1 To compare, the
Fund’s Underlying Index, the IQ Real Return Index,2 returned 2.03% for the same time period. The Bloomberg Barclays U.S.
Short Treasury Bond Index2 returned 1.09% for the same period.
What factors affected the Fund’s performance
during the reporting period?
The Fund’s core allocation to short-term U.S.
Treasury bonds, via underlying ETFs, generated positive performance during the reporting period, while its satellite positions in U.S. equities
were the primary source of return. Also, via underlying ETFs, the Fund’s exposure to currencies added value. However, positions in real
estate and commodities, via underlying ETFs, detracted slightly from the Fund’s performance during the reporting
period.
During the reporting period, how was the Fund’s
performance materially affected by investments in derivatives?
The Fund did not use derivatives during the reporting
period.
How were the Fund’s assets allocated during the
reporting period and why?
The Fund’s allocations are driven by quantitative
models. Given the rules-based nature of the process, there is no subjectivity involved in the allocation decision process.
During the reporting period, the Fund had core positions
in short-term U.S. Treasury bonds and investment grade corporate bonds, via underlying ETFs. The Fund had a smaller allocation to long-term U.S.
Treasury bonds. Via underlying ETFs, the Fund’s relatively smaller exposure to U.S. equities contributed positively, while exposure to
emerging markets equities detracted from the Fund’s performance. The yen was the sole currency exposure that added value to the
Fund’s performance during the reporting period. U.S. real estate investment trusts (REITs) overall were a slight
detractor.
How did the Fund’s allocations change over the
course of the reporting period?
Based on the proprietary quantitative models and via
shifts in its underlying ETF positions, the Fund’s short-term U.S. Treasury bond allocation decreased and its real estate allocation
increased during the reporting period. Long-term U.S. Treasury bonds, via underlying ETF positions, were held briefly during the reporting
period, while positions in intermediate-term U.S. Treasuries and equities, via underlying ETFs, maintained rather consistent allocation
levels throughout.
During the reporting period, which underlying ETFs had
the highest total returns and which underlying ETFs had the lowest total returns?
In terms of total return, the best-performing underlying
ETFs in the Fund were iShares Core S&P 500 ETF (IVV) and SPDR S&P 500 ETF Trust (SPV). During the reporting period. Vanguard FTSE
Emerging Markets ETF (VWO) and iShares MSCI Emerging Markets ETF (EEM) recorded the lowest total returns.
Which underlying ETFs were the strongest positive
contributors to the Fund’s performance and which underlying ETFs were particularly weak?
On the basis of impact, which takes weightings and total
returns into consideration, the underlying ETFs that made the greatest positive contributions to the Fund’s performance during the
reporting period were SPDR S&P 500 ETF Trust (SPY) and iShares Core S&P 500 ETF (IVV). The weakest contributors were Vanguard FTSE
Emerging Markets ETF (VWO) and iShares MSCI Emerging Markets ETF (EEM).
The opinions expressed are those of the portfolio
managers as of the date of this report and are subject to change. There is no guarantee that any forecast made will come to pass. This material
does not constitute investment advice and is not intended as an endorsement of any specific investment.
1 |
|
The price used to calculate the market price
returns is the mean between the day’s last bid and ask prices and does not represent returns an investor would receive if shares were
traded at other times. |
2 |
|
See page 21 for more information on
this index. |
20
Management’s Discussion of
Fund Performance (unaudited) (continued)
Hypothetical Growth of a $10,000 Investment
(Since
Inception Through 4/30/2018)
This chart illustrates the performance of a hypothetical $10,000 investment made on the Fund’s inception, and is not intended to
imply any future performance.
Fund Performance History
IQ Real Return ETF
(as of
April 30, 2018)
|
|
|
|
1
Year
|
|
3
Year
|
|
5
Year
|
|
Since
Inception1
|
|
|
|
|
Average
Annual
|
|
Average
Annual
|
|
Average
Annual
|
|
Average
Annual
|
|
Cumulative
|
IQ Real Return ETF Market Price2 |
|
|
|
|
1.81 |
% |
|
|
1.18 |
% |
|
|
0.99 |
% |
|
|
1.30 |
% |
|
|
11.61 |
% |
IQ Real Return ETF NAV |
|
|
|
|
1.89 |
% |
|
|
1.31 |
% |
|
|
0.98 |
% |
|
|
1.30 |
% |
|
|
11.59 |
% |
IQ Real Return Index |
|
|
|
|
2.03 |
% |
|
|
1.57 |
% |
|
|
1.30 |
% |
|
|
1.72 |
% |
|
|
15.60 |
% |
Bloomberg Barclays U.S. Short Treasury Bond Index |
|
|
|
|
1.09 |
% |
|
|
0.61 |
% |
|
|
0.42 |
% |
|
|
0.33 |
% |
|
|
2.87 |
% |
1 |
|
Fund Inception Date:
10/27/2009. |
2 |
|
Beginning on May 31,
2016, the price used to calculate the Market Price returns is the mean between the day’s last bid and ask prices. Prior to May 31, 2016, market
price returns were calculated using the day’s NYSE Arca closing price. The market price returns do not represent returns an investor would receive
if shares were traded at other times. |
21
Management’s Discussion of
Fund Performance (unaudited) (continued)
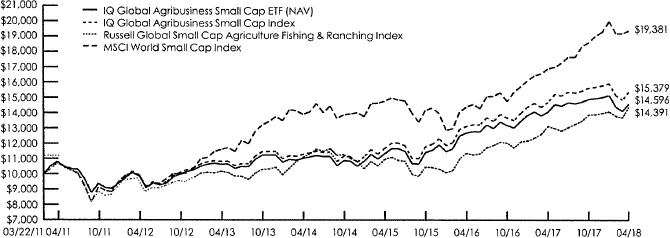
How did IQ Global Agribusiness Small Cap ETF perform
during the 12 months ended April 30, 2018?
For the 12 months ended April 30, 2018 (the
“reporting period”), IQ Global Agribusiness Small Cap ETF returned 3.75% at NAV (net asset value) and 3.30% at market
price.1 To compare, the Fund’s Underlying Index, the IQ Global Agribusiness Small Cap Index,2 returned 4.56% for the
same time period. The Russell Global Small Cap Agriculture Fishing & Ranching Index2 and the MSCI World Small Cap
Index2 returned 9.51% and 14.66%, respectively, for the same period.
What factors affected the Fund’s performance
during the reporting period?
The Underlying Index applies size, liquidity and business
operations rules to select small capitalization agribusiness companies and uses a float-adjusted market capitalization weighting
methodology.
The Fund focuses on global, small capitalization stocks.
The selection of small-cap stocks focuses on capital appreciation of the underlying equity. Global investing also exposes the strategy to
currency fluctuations. During the reporting period, the Underlying Index’s and the Fund’s overall performance was positively affected
by currency exposure. The Underlying Index’s and the Fund’s currency exposure to the Japanese yen and to the euro were the two
largest positive contributors to its currency performance.
During the reporting period, how was the Fund’s
performance materially affected by investments in derivatives?
The Fund did not use derivatives during the reporting
period.
During the reporting period, which sectors had the
highest total returns and which sectors had the lowest total returns?
The Underlying Index is organized into five sectors. In
terms of total return, the best-performing sectors in the Underlying Index were agricultural supplies and logistics and crop production and
farming. During the reporting period, agricultural chemicals, livestock operations and agricultural machinery were the weakest
sectors.
During the reporting period, which sectors made the
strongest contributions to the Fund’s absolute performance and which sectors made the weakest contributions?
On the basis of impact, which takes weightings and total
returns into account, the sectors that made the strongest positive contributions to the Fund’s absolute performance were crop production
and farming and agricultural supplies and logistics. The sectors that made the weakest contributions were agricultural chemicals,
livestock operations and agricultural machinery.
During the reporting period, which individual stocks
had the highest total returns and which stocks had the lowest total returns?
Within the Underlying Index, the stocks with the highest
total returns during the reporting period were Elders, Costa Group Holdings and Nisshin Seifun Group. Elders, based in Australia, brokers and
processes a wide range of farm products. Costa Group Holdings, also based in Australia, grows and markets fruits and vegetables. Nisshin
Seifun Group, based in Japan, produces and sells grains and fodder along with specialized foods.
The Underlying Index components with the lowest total
returns for the reporting period were CVR Partners, LP; Khon Kaen Sugar Industry; and Australian Agriculture Company. U.S.-based CVR Partners,
LP was formed to own, operate and grow its nitrogen fertilizer business. Thailand-based Khon Kaen Sugar Industry produces sugar, energy
and agricultural products. Australia’s Australian Agriculture Company is an integrated cattle and beef producer.
1 |
|
The price used to calculate the market price
returns is the mean between the day’s last bid and ask prices and does not represent returns an investor would receive if shares were
traded at other times. |
2 |
|
See page 23 for more information on
this index. |
22
Management’s Discussion of
Fund Performance (unaudited) (continued)
Which individual stocks made the strongest
contributions to the Fund’s absolute performance during the reporting period and which stocks made the weakest
contributions?
On the basis of impact, which takes weightings and total
returns into consideration, the stocks that made the strongest contributions to the Fund’s absolute performance during the reporting period
were Nissin Seifun Group and Costa Group Holdings, each already mentioned, as well as Nichirei, a Japanese producer and distributor of
meat products.
The weakest contributors were Japan-based NH Foods, which
breeds and raises livestock and produces and sells meat products; U.S.-based Platform Specialty Products, which produces specialty chemicals;
and Argentina-based Adecoagro, which is involved in farming crops and other agricultural products.
Were there any changes in the Underlying Index during
the reporting period?
The Underlying Index is reconstituted, meaning that
components are added or removed, and rebalanced quarterly in accordance with the rules of the Underlying Index.
The opinions expressed are those of the portfolio
managers as of the date of this report and are subject to change. There is no guarantee that any forecast made will come to pass. This material
does not constitute investment advice and is not intended as an endorsement of any specific investment.
Hypothetical Growth of a $10,000 Investment
(Since
Inception Through 4/30/2018)
This chart illustrates the performance of a hypothetical $10,000 investment made on the Fund’s inception, and is not intended to
imply any future performance.
Fund Performance History
IQ
Global Agribusiness Small Cap ETF
(as of April 30, 2018)
|
|
|
|
1
Year
|
|
3
Year
|
|
5
Year
|
|
Since
Inception1
|
|
|
|
|
Average
Annual
|
|
Average
Annual
|
|
Average
Annual
|
|
Average
Annual
|
|
Cumulative
|
IQ Global Agribusiness Small Cap ETF Market Price2 |
|
|
|
|
3.30 |
% |
|
|
8.68 |
% |
|
|
6.51 |
% |
|
|
5.43 |
% |
|
|
45.60 |
% |
IQ Global Agribusiness Small Cap ETF NAV |
|
|
|
|
3.75 |
% |
|
|
8.79 |
% |
|
|
6.52 |
% |
|
|
5.46 |
% |
|
|
45.96 |
% |
IQ Global Agribusiness Small Cap Index |
|
|
|
|
4.56 |
% |
|
|
9.60 |
% |
|
|
7.29 |
% |
|
|
6.24 |
% |
|
|
53.79 |
% |
Russell Global Small Cap Agriculture Fishing & Ranching Index |
|
|
|
|
9.51 |
% |
|
|
9.52 |
% |
|
|
7.17 |
% |
|
|
5.25 |
% |
|
|
43.91 |
% |
MSCI World Small Cap Index |
|
|
|
|
14.66 |
% |
|
|
9.48 |
% |
|
|
10.80 |
% |
|
|
9.75 |
% |
|
|
93.81 |
% |
1 |
|
Fund Inception Date:
3/22/2011. |
2 |
|
Beginning on May 31, 2016, the price used
to calculate the Market Price returns is the mean between the day’s last bid and ask prices. Prior to May 31, 2016, market price returns were
calculated using the day’s NYSE Arca closing price. The market price returns do not represent returns an investor would receive if shares were
traded at other times. |
23
Management’s Discussion of
Fund Performance (unaudited) (continued)
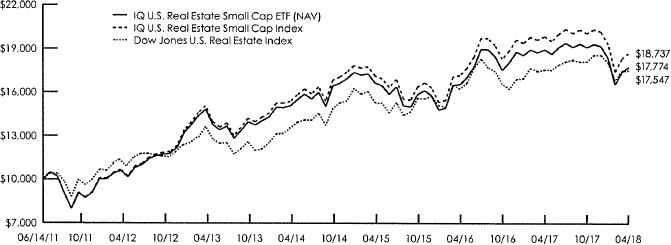
How did IQ U.S. Real Estate Small Cap ETF perform
during the 12 months ended April 30, 2018?
For the 12 months ended April 30, 2018 (the
“reporting period”), IQ U.S. Real Estate Small Cap ETF returned -6.37% at NAV (net asset value) and -6.49% at market
price.1 To compare, the Fund’s Underlying Index, the IQ U.S. Real Estate Small Cap Index,2 returned -5.74% for the
same time period. The Dow Jones U.S. Real Estate Index2 returned -0.17% for the same period.
What factors affected the Fund’s performance
during the reporting period?
The Underlying Index seeks to capture the performance of
the small-cap U.S. real estate equity market. The investable universe is limited to, at most, 100 companies that satisfy the market
capitalization and liquidity requirements of the Underlying Index selection criteria, and Underlying Index components are weighted by their
float-adjusted market capitalization.
The Underlying Index classifies real estate investment
trusts (REITs) as residential, hotel, retail, office, diversified, specialized or mortgage REITs. Over time, mortgage REITs have shown interest
rate sensitivity. Office REITs and retail REITs are affected by the overall economic environment. Virtually all publicly-traded U.S. REITs
exhibit sensitivity to the broad U.S. equity market. Other factors that affect REITs are the metropolitan markets in which they operate
and the various types of properties that comprise the REIT’s portfolio.
During the reporting period, the Underlying Index’s
hotel REIT sector outperformed the other sectors, posting the largest positive contribution to return. Retail REITs as a sector overall posted
the greatest negative contribution for the reporting period.
During the reporting period, how was the Fund’s
performance materially affected by investments in derivatives?
The Fund did not use derivatives during the reporting
period.
During the reporting period, which sectors had the
highest total returns and which sectors had the lowest total returns?
In terms of total return, the best-performing sector in
the Underlying Index was hotel REITs. Hotel REITs was the only sector in the Underlying Index that posted a positive total return. During the
reporting period, retail, specialized and office REITs recorded the lowest total returns.
During the reporting period, which sectors made the
strongest contributions to the Fund’s absolute performance and which sectors made the weakest contributions?
On the basis of impact, which takes weightings and total
returns into account, the sector that made the strongest positive contribution to the Fund’s absolute performance was hotel REITs. The
sectors that made the weakest contributions to the Fund’s absolute performance were retail, specialized and office
REITs.
During the reporting period, which individual stocks
had the highest total returns and which stocks had the lowest total returns?
Within the Underlying Index, the stocks with the highest
total returns during the reporting period were Chesapeake Lodging Trust, a hotel REIT that invests primarily in hotels, airports and convention
markets in the U.S.; Rexford Industrial Realty, an industrial REIT that specializes in owning and operating industrial properties in
California; and Xenia Hotels and Resorts, a hotel REIT that operates in the U.S.
The Underlying Index components with the lowest total
returns for the reporting period were RAIT Financial Trust, a mortgage REIT that provides debt financing to owners of commercial real estate;
CBL & Associates Properties, a retail REIT that owns regional shopping malls and shopping centers; and Government Properties Income Trust,
an office REIT that invests in properties leased to government tenants.
1 |
|
The price used to calculate the market price
returns is the mean between the day’s last bid and ask prices and does not represent returns an investor would receive if shares were
traded at other times. |
2 |
|
See page 25 for more information on
this index. |
24
Management’s Discussion of
Fund Performance (unaudited) (continued)
Which individual stocks made the strongest
contributions to the Fund’s absolute performance during the reporting period and which stocks made the weakest
contributions?
On the basis of impact, which takes weightings and total
returns into consideration, the stocks that made the strongest contributions to the Fund’s absolute performance during the reporting period
were Chesapeake Lodging Trust, Rexford Industrial Realty and Xenia Hotels and Resorts, each mentioned earlier.
The weakest contributors were QTS Realty Trust, a data
center REIT; Mack-Cali Realty, an office REIT; and CBL & Associates Properties, already mentioned.
Were there any changes in the Underlying Index during
the reporting period?
The Underlying Index is reconstituted, meaning that
components were added to or removed from the Underlying Index, and rebalanced quarterly, with weights reflecting the then-current float-adjusted
market capitalizations.
During the reporting period, several Underlying Index
constituents were removed in relation to merger activity. These included Parkway, First Potomac Realty Trust, Monogram Residential Trust, Felcor
Lodging Trust, Care Capital Properties and Silver Bay Realty Trust.
The opinions expressed are those of the portfolio
managers as of the date of this report and are subject to change. There is no guarantee that any forecast made will come to pass. This material
does not constitute investment advice and is not intended as an endorsement of any specific investment.
Hypothetical Growth of a $10,000 Investment
(Since
Inception Through 4/30/2018)
This chart illustrates the performance of a hypothetical $10,000 investment made on the Fund’s inception, and is not intended to
imply any future performance.
Fund Performance History
IQ U.S. Real Estate Small Cap ETF
(as of April 30, 2018)
|
|
|
|
1
Year
|
|
3
Year
|
|
5
Year
|
|
Since
Inception1
|
|
|
|
|
Average
Annual
|
|
Average
Annual
|
|
Average
Annual
|
|
Average
Annual
|
|
Cumulative
|
IQ U.S. Real Estate Small Cap ETF Market Price2 |
|
|
|
|
–6.49 |
% |
|
|
2.10 |
% |
|
|
3.67 |
% |
|
|
8.41 |
% |
|
|
74.34 |
% |
IQ U.S. Real Estate Small Cap ETF NAV |
|
|
|
|
–6.37 |
% |
|
|
2.20 |
% |
|
|
3.69 |
% |
|
|
8.72 |
% |
|
|
77.74 |
% |
IQ U.S. Real Estate Small Cap Index |
|
|
|
|
–5.74 |
% |
|
|
3.01 |
% |
|
|
4.45 |
% |
|
|
9.55 |
% |
|
|
87.37 |
% |
Dow Jones U.S. Real Estate Index |
|
|
|
|
–0.17 |
% |
|
|
4.68 |
% |
|
|
5.15 |
% |
|
|
8.51 |
% |
|
|
75.47 |
% |
1 |
|
Fund Inception Date:
6/14/2011. |
2 |
|
Beginning on May 31, 2016, the price used
to calculate the Market Price returns is the mean between the day’s last bid and ask prices. Prior to May 31, 2016, market price returns were
calculated using the day’s NYSE Arca closing price. The market price returns do not represent returns an investor would receive if shares were
traded at other times. |
25
Management’s Discussion of
Fund Performance (unaudited) (continued)
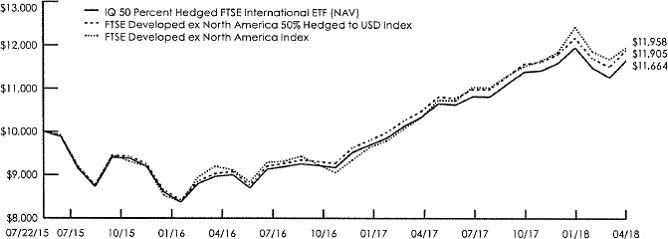
How did IQ 50 Percent Hedged FTSE International ETF
perform during the 12 months ended April 30, 2018?
For the 12 months ended April 30, 2018 (the
“reporting period”), IQ 50 Percent Hedged FTSE International ETF returned 12.84% at NAV (net asset value) and 12.28% at market
price.1 To compare, the Fund’s Underlying Index, the FTSE Developed ex North America 50% Hedged to USD Index2,
returned 13.64% for the same time period. The FTSE Developed ex North America Index2 returned 15.74% for the same
period.
The Fund invests in a representative sample of securities
included in the Underlying Index that collectively has an investment profile similar to the Underlying Index. Due to the use of representative
sampling, the Fund may or may not hold all of the securities that are included in the Underlying Index.
What factors affected the Fund’s performance
during the reporting period?
The Fund was impacted during the reporting period by the
currency effect of investing in international developed equity markets and then converting back to U.S. dollars. The Fund’s strategy is
meant to track the FTSE Developed ex North America Index with a 50% currency hedge to the U.S. dollar. During the reporting period as a
whole, most currencies of major developed nations appreciated against the U.S. dollar.
Local market economies were also a primary influence on
the performance of the local international developed equity markets. Local market monetary and interest rate policies also had an
influence.
During the reporting period, how was the Fund’s
performance materially affected by investments in derivatives?
The Underlying Index uses currency forwards to hedge 50%
of its respective currency exposure of its underlying constituents. During the reporting period, this hedge detracted from fund performance. The
hedge is reset monthly using 30-day forward contracts.
During the reporting period, which sectors had the
highest total returns and which sectors had the lowest total returns?
In terms of total return, the best-performing sectors in
the Underlying Index were energy, information technology and materials. During the reporting period, health care, telecommunication services and
consumer staples recorded the lowest total returns.
During the reporting period, which sectors made the
strongest contributions to the Fund’s absolute performance and which sectors made the weakest contributions?
On the basis of impact, which takes weightings and total
returns into account, the sectors that made the strongest positive contributions to the Fund’s absolute performance were financials,
consumer discretionary and information technology. The sectors that made the weakest contributions to the Fund’s absolute performance
were telecommunication services, real estate and utilities.
During the reporting period, which individual stocks
had the highest total returns and which stocks had the lowest total returns?
Within the Underlying Index, the stocks with the highest
total returns during the reporting period were Celltrion, a South Korea-based producer and seller of biosimilar products; Shiseido, a
Japan-based manufacturer of cosmetic and toiletry products; and Wirecard, a German-based Internet payment and processing services
company.
The Underlying Index constituents with the lowest total
returns for the reporting period were Provident Financial, a U.K. financial services company specializing in the provision of personal credit
products; Altice, a Netherlands-based cable-based services provider; and Capita, a U.K. customer services, human resource, software and
strategic services provider.
1 |
|
The price used to calculate the market price
returns is the mean between the day’s last bid and ask prices and does not represent returns an investor would receive if shares were
traded at other times. |
2 |
|
See page 27 for more information on
this index. |
26
Management’s Discussion of
Fund Performance (unaudited) (continued)
Which individual stocks made the strongest
contributions to the Fund’s absolute performance during the reporting period and which stocks made the weakest
contributions?
On the basis of impact, which takes weightings and total
returns into consideration, the stocks that made the strongest contributions to the Fund’s absolute performance during the reporting period
were Samsung Electronics, a South Korea-based manufacturer of consumer and industrial electronic equipment; HSBC Holdings, a U.K.-based
international banking and financial services company; and Royal Dutch Shell, a Netherlands-based petroleum and other chemicals producer and
refiner.
The weakest contributors were the U.K.’s British
American Tobacco, which manufactures, markets and sells tobacco products; Switzerland’s Roche Holdings, which develops and manufactures
pharmaceutical products; and Australia’s Commonwealth Bank of Australia, which provides banking and life insurance
services.
Were there any changes in the Underlying Index during
the reporting period?
The Underlying Index was reconstituted, meaning that
components were added to or removed from the Underlying Index, by FTSE in September 2017 and March 2018. Throughout the reporting period, FTSE
made incremental adjustments to underlying constituent weights based on company shares available for purchase by
investors.
The opinions expressed are those of the portfolio
managers as of the date of this report and are subject to change. There is no guarantee that any forecast made will come to pass. This material
does not constitute investment advice and is not intended as an endorsement of any specific investment.
Hypothetical Growth of a $10,000 Investment
(Since Inception Through 4/30/2018)
This chart illustrates the performance of a hypothetical
$10,000 investment made on the Fund’s inception, and is not intended to imply any future performance.
Fund Performance History
IQ 50 Percent Hedged FTSE
International ETF
(as of April 30, 2018)
|
|
|
|
1
Year
|
|
Since
Inception1
|
|
|
|
|
Average
Annual
|
|
Average
Annual
|
|
Cumulative
|
IQ 50 Percent Hedged FTSE International ETF Market Price2 |
|
|
|
|
12.28 |
% |
|
|
5.65 |
% |
|
|
16.49 |
% |
IQ 50 Percent Hedged FTSE International ETF NAV |
|
|
|
|
12.84 |
% |
|
|
5.70 |
% |
|
|
16.64 |
% |
FTSE Developed ex North America 50% Hedged to USD Index |
|
|
|
|
13.64 |
% |
|
|
6.48 |
% |
|
|
19.05 |
% |
FTSE Developed ex North America Index |
|
|
|
|
15.74 |
% |
|
|
6.65 |
% |
|
|
19.58 |
% |
1 |
|
Fund Inception Date: 7/22/2015. |
2 |
|
Beginning on May 31, 2016, the price used
to calculate the Market Price returns is the mean between the day’s last bid and ask prices. Prior to May 31, 2016, market price returns were
calculated using the day’s NYSE Arca closing price. The market price returns do not represent returns an investor would receive if shares were
traded at other times. |
27
Management’s Discussion of Fund Performance
(unaudited) (continued)
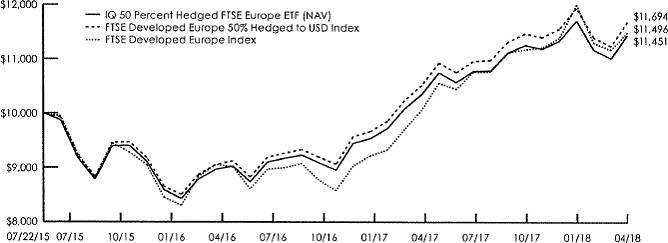
How did IQ 50 Percent Hedged FTSE Europe ETF perform
during the 12 months ended April 30, 2018?
For the 12 months ended April 30, 2018 (the
“reporting period”), IQ 50 Percent Hedged FTSE Europe ETF returned 10.58% at NAV (net asset value) and
9.59% at market price.1 To compare, the Fund’s Underlying Index, the FTSE Developed Europe 50% Hedged to USD
Index2, returned 11.14% for the same time period. The FTSE Developed Europe Index2 returned 14.18% for the same
period.
The Fund invests in a representative sample of securities
included in the Underlying Index that collectively has an investment profile similar to the Underlying Index. Due to the use of representative
sampling, the Fund may or may not hold all of the securities that are included in the Underlying Index.
What factors affected the Fund’s performance
during the reporting period?
The Fund was impacted during the reporting period by the
currency effect of investing in developed European equity markets and then converting back to U.S. dollars. The Fund’s strategy is meant to
track the FTSE Developed Europe Index with a 50% currency hedge to the U.S. dollar. During the reporting period as a whole, most
currencies of major developed European nations appreciated against the U.S. dollar.
During the reporting period, how was the Fund’s
performance materially affected by investments in derivatives?
The Underlying Index uses currency forwards to hedge 50%
of its respective currency exposure of its underlying constituents. During the reporting period, this hedge detracted from fund performance. The
hedge is reset monthly using 30-day forward contracts.
During the reporting period, which sectors had the
highest total returns and which sectors had the lowest total returns?
In terms of total return, the best-performing sectors in
the Underlying Index were energy, information technology and materials. During the reporting period, health care, consumer staples and
telecommunication services recorded the lowest total returns.
During the reporting period, which sectors made the
strongest contributions to the Fund’s absolute performance and which sectors made the weakest contributions?
On the basis of impact, which takes weightings and total
returns into account, the sectors that made the strongest positive contributions to the Fund’s absolute performance were financials, energy
and consumer discretionary. The sectors that made the weakest contributions to the Fund’s absolute performance were
telecommunication services, health care and utilities.
During the reporting period, which individual stocks
had the highest total returns and which stocks had the lowest total returns?
Within the Underlying Index, the stocks with the highest
total returns during the reporting period were Wirecard, a German-based Internet payment and processing services company; Neste, a Finland-based
oil refining company; and Aker BP, a Norway-based oil and gas exploration and production company.
The Underlying Index constituents with the lowest total
returns for the reporting period were Provident Financial, a U.K. financial services company specializing in the provision of personal credit
products; Altice, a Netherlands-based cable-based services provider; and Capita, a U.K. customer services, human resource, software and
strategic services provider.
1 |
|
The price used to calculate the market price
returns is the mean between the day’s last bid and ask prices and does not represent returns an investor would receive if shares were
traded at other times. |
2 |
|
See page 29 for more information on
this index. |
28
Management’s Discussion of Fund Performance
(unaudited) (continued)
Which individual stocks made the strongest
contributions to the Fund’s absolute performance during the reporting period and which stocks made the weakest
contributions?
On the basis of impact, which takes weightings and total
returns into consideration, the stocks that made the strongest contributions to the Fund’s absolute performance during the reporting period
were Royal Dutch Shell, a Netherlands-based petroleum and other chemicals producer and refiner; HSBC Holdings, a U.K.-based international
banking and financial services company; and BP, a U.K.-based international oil and petrochemicals company.
The weakest contributors were the U.K.’s British
American Tobacco, which manufactures, markets and sells tobacco products; Switzerland’s Roche Holdings, which develops and manufactures
pharmaceutical products; and France’s Sanofi, which operates as a pharmaceutical company.
Were there any changes in the Underlying Index
during the reporting period?
The Underlying Index was reconstituted, meaning that
components were added to or removed from the Underlying Index, by FTSE in September 2017 and March 2018. Throughout the reporting period, FTSE
made incremental adjustments to underlying constituent weights based on company shares available for purchase by
investors.
The opinions expressed are those of the portfolio
managers as of the date of this report and are subject to change. There is no guarantee that any forecast made will come to pass. This material
does not constitute investment advice and is not intended as an endorsement of any specific investment.
Hypothetical Growth of a $10,000 Investment
(Since
Inception Through 4/30/2018)
This chart illustrates the performance of a hypothetical
$10,000 investment made on the Fund’s inception, and is not intended to imply any future performance.
Fund Performance History
IQ 50 Percent Hedged FTSE Europe ETF
(as of April 30, 2018)
|
|
|
|
1
Year
|
|
Since
Inception1
|
|
|
|
|
Average
Annual
|
|
Average
Annual
|
|
Cumulative
|
IQ 50 Percent Hedged FTSE Europe ETF Market Price2 |
|
|
|
|
9.59 |
% |
|
|
4.83 |
% |
|
|
14.00 |
% |
IQ 50 Percent Hedged FTSE Europe ETF NAV |
|
|
|
|
10.58 |
% |
|
|
5.00 |
% |
|
|
14.51 |
% |
FTSE Developed Europe 50% Hedged to USD Index |
|
|
|
|
11.14 |
% |
|
|
5.80 |
% |
|
|
16.94 |
% |
FTSE Developed Europe Index |
|
|
|
|
14.18 |
% |
|
|
5.15 |
% |
|
|
14.96 |
% |
1 |
|
Fund Inception Date: 7/22/2015. |
2 |
|
Beginning on May 31, 2016, the
price used to calculate the Market Price returns is the mean between the day’s last bid and ask prices. Prior to May 31, 2016, market price
returns were calculated using the day’s NYSE Arca closing price. The market price returns do not represent returns an investor would receive if
shares were traded at other times. |
29
Management’s Discussion of
Fund Performance (unaudited) (continued)
How did IQ 50 Percent Hedged FTSE Japan ETF perform
during the 12 months ended April 30, 2018?
For the 12 months ended April 30, 2018 (the
“reporting period”), IQ 50 Percent Hedged FTSE Japan ETF returned 19.11% at NAV (net asset value) and 18.29% at market
price.1 To compare, the Fund’s Underlying Index, the FTSE Japan 50% Hedged to USD Index2, returned 19.60% for the
same time period. The FTSE Japan Index2 returned 19.74% for the same period.
The Fund invests in a representative sample of securities
included in the Underlying Index that collectively has an investment profile similar to the Underlying Index. Due to the use of representative
sampling, the Fund may or may not hold all of the securities that are included in the Underlying Index.
What factors affected the Fund’s performance
during the reporting period?
The Fund was impacted during the reporting period by the
currency effect of investing in the Japanese equity market and then converting back to U.S. dollars. The Fund’s strategy is meant to track
the FTSE Japan Index with a 50% currency hedge to the U.S. dollar. During the reporting period as a whole, the yen depreciated against the
U.S. dollar.
Local market economies were also a primary influence on
the performance of the local Japanese equity market.
During the reporting period, how was the Fund’s
performance materially affected by investments in derivatives?
The Underlying Index uses currency forwards to hedge 50%
of its respective currency exposure of its underlying constituents. During the reporting period, this hedge detracted from fund performance. The
hedge is reset monthly using 30-day forward contracts.
During the reporting period, which sectors had the
highest total returns and which sectors had the lowest total returns?
In terms of total return, the best-performing sectors in
the Underlying Index were energy, information technology and consumer staples. During the reporting period, telecommunication services,
utilities and financials recorded the lowest total returns.
During the reporting period, which sectors made the
strongest contributions to the Fund’s absolute performance and which sectors made the weakest contributions?
On the basis of impact, which takes weightings and total
returns into account, the sectors that made the strongest positive contributions to the Fund’s absolute performance were industrials,
consumer discretionary and information technology. The sectors that made the weakest contributions to the Fund’s absolute performance
were utilities, telecommunication services and energy.
During the reporting period, which individual stocks
had the highest total returns and which stocks had the lowest total returns?
Within the Underlying Index, the stocks with the highest
total returns during the reporting period were Shiseido, a manufacturer of cosmetic and toiletry products; GMO Payment Gateway, a credit card
services company for electronic commerce firms; and Yaskawa Electric, a manufacturer and marketer of industrial robotic
products.
The Underlying Index constituents with the lowest total
returns for the reporting period were Japan Display, a manufacturer of small and medium-sized displays; Suruga Bank, a regional bank providing
deposits, loans and foreign exchange transactions; and GREE, a social network service operator providing online communities and games to
members.
1 |
|
The price used to calculate the market price
returns is the mean between the day’s last bid and ask prices and does not represent returns an investor would receive if shares were
traded at other times. |
2 |
|
See page 31 for more information on
this index. |
30
Management’s Discussion of
Fund Performance (unaudited) (continued)
Which individual stocks made the strongest
contributions to the Fund’s absolute performance during the reporting period and which stocks made the weakest
contributions?
On the basis of impact, which takes weightings and total
returns into consideration, the stocks that made the strongest contributions to the Fund’s absolute performance during the reporting period
were Toyota Motor, a manufacturer of cars, trucks and buses; Keyence, a developer, manufacturer and seller of sensors and measuring
instruments used for factory automation; and Sony, a manufacturer of audio, home video consoles and other information technology products. The
weakest contributors were Japan Tobacco, which manufactures, markets and sells tobacco products internationally; Dentsu, which provides
advertising services; and Subaru, which manufactures and distributes automobiles.
Were there any changes in the Underlying Index during
the reporting period?
The Underlying Index was reconstituted, meaning that
components were added to or removed from the Underlying Index, by FTSE in September 2017 and March 2018. Throughout the reporting period, FTSE
made incremental adjustments to underlying constituent weights based on company shares available for purchase by
investors.
The opinions expressed are those of the portfolio
managers as of the date of this report and are subject to change. There is no guarantee that any forecast made will come to pass. This material
does not constitute investment advice and is not intended as an endorsement of any specific investment.
Hypothetical Growth of a $10,000 Investment
(Since
Inception Through 4/30/2018)
This chart illustrates the performance of a hypothetical $10,000 investment made on the Fund’s inception, and is not intended to
imply any future performance.
Fund Performance History
IQ 50 Percent Hedged FTSE
Japan ETF
(as of April 30, 2018)
|
|
|
|
1
Year
|
|
Since
Inception1
|
|
|
|
|
Average
Annual
|
|
Average
Annual
|
|
Cumulative
|
IQ 50 Percent Hedged FTSE Japan ETF Market Price2 |
|
|
|
|
18.29 |
% |
|
|
5.24 |
% |
|
|
15.25 |
% |
IQ 50 Percent Hedged FTSE Japan ETF NAV |
|
|
|
|
19.11 |
% |
|
|
5.44 |
% |
|
|
15.86 |
% |
FTSE Japan 50% Hedged to USD Index |
|
|
|
|
19.60 |
% |
|
|
6.10 |
% |
|
|
17.87 |
% |
FTSE Japan Index |
|
|
|
|
19.74 |
% |
|
|
8.18 |
% |
|
|
24.40 |
% |
1 |
|
Fund Inception Date: 7/22/2015. |
2 |
|
Beginning on May 31, 2016, the price used
to calculate the Market Price returns is the mean between the day’s last bid and ask prices. Prior to May 31, 2016, market price returns were
calculated using the day’s NYSE Arca closing price. The market price returns do not represent returns an investor would receive if shares were
traded at other times. |
31
Management’s Discussion of
Fund Performance (unaudited) (continued)
How did IQ Leaders GTAA Tracker ETF perform during the
12 months ended April 30, 2018?
For the 12 months ended April 30, 2018 (the
“reporting period”), IQ Leaders GTAA Tracker ETF returned 8.43% at NAV (net asset value) and 8.40% at market price.1 To
compare, the Fund’s Underlying Index, the IQ Leaders GTAA Tracker Index2, returned 8.83% for the same time period. The MSCI All
Country World Index (Net)2 returned 13.48% for the same period.
What factors affected the Fund’s performance
during the reporting period?
Overall, the Fund’s long positions contributed
positively to the Fund’s performance during the reporting period, while its short positions detracted.
Within the Fund’s long positions, equities were the
primary driver of performance, with U.S. large-cap core equities and international core equities, via underlying ETFs, the major sources of
return. Long positions in fixed income, via underlying ETFs, provided more modest positive returns, with high yield corporate bonds and
investment grade corporate bonds contributing positively and aggregate bonds and convertible debt detracting.
Short exposures to certain equity and fixed income
categories detracted from the Fund’s performance during the reporting period. More specifically, short positions in U.S. large-cap core
equities and U.S. small-cap core equities, via underlying ETFs, detracted from the Fund’s performance. However, via underlying ETFs, timing
of short exposures to investment grade corporate bonds and intermediate-term U.S. Treasury bonds added to performance. Timing of short
exposure to convertible debt, however, detracted.
During the reporting period, how was the Fund’s
performance materially affected by investments in derivatives?
The Fund used derivative positions exclusively to help it
track its Underlying Index, which contains both long and short weights. Primarily, the Fund used total return swaps on the ETFs at the weights
in which they are included in the Underlying Index.
How were the Fund’s assets allocated during the
reporting period and why?
The Fund’s allocations are driven by quantitative
models. Given the rules-based nature of the process, there is no subjectivity involved in the allocation decision process.
At the asset class level, the Fund was allocated to
equities, fixed income and real estate. Net exposure to equities was no more than approximately 60%, while net exposure to fixed income was at
most approximately 50%. Real estate exposure was held short throughout the reporting period at a maximum exposure near 5%.
Within equities, U.S. large-cap and international were
the primary Fund exposures during the reporting period. High yield bonds and aggregate fixed income were the primary exposures in fixed income.
The Fund’s short exposure within real estate was to U.S. real estate investment trusts (REITs).
How did the Fund’s allocations change over the
course of the reporting period?
The Fund’s asset class allocations were adjusted as
determined by the underlying proprietary quantitative models.
During the reporting period, the Fund’s total equity
exposure ranged from 50% to 60% of Fund assets during the reporting period. Real estate was a net short exposure, while bonds held the remaining
exposure. Within the Fund’s equity allocation, U.S. large-cap core equities was the largest position at the start of the reporting
period, and international core equities took its place near the end of the reporting period. Emerging markets equities exposure was
reduced during the reporting period, while the Fund held a short exposure to U.S. small-cap core equities through most of the reporting
period.
Within the Fund’s fixed income allocation, high
yield bonds was the largest exposure at the start of the reporting period, but aggregate bonds assumed the largest exposure during the latter
half of the reporting period. The Fund maintained a short exposure to convertible debt for most of the reporting period before reversing to
a positive, or long, allocation at the end of the reporting period. Intermediate-term U.S. Treasuries held a near consistent allocation
except for a brief time in the final third of the reporting period.
1 |
|
The price used to calculate the market price
returns is the mean between the day’s last bid and ask prices and does not represent returns an investor would receive if shares were
traded at other times. |
2 |
|
See page 33 for more information on
this index. |
32
Management’s Discussion of
Fund Performance (unaudited) (continued)
During the reporting period, which underlying ETFs had
the highest total returns and which underlying ETFs had the lowest total returns?
In terms of total return, the best-performing underlying
ETFs in the Fund were Vanguard Energy ETF (VDE) and Vanguard Information Technology Index Fund (VGT). During the reporting period, Vanguard
Consumer Staples ETF (VDC) and Vanguard Industrials ETF (VIS) recorded the lowest total returns.
Which underlying ETFs were the strongest positive
contributors to the Fund’s performance and which underlying ETFs were particularly weak?
On the basis of impact, which takes weightings and total
returns into consideration, the underlying ETFs that made the greatest positive contributions to the Fund’s performance during the
reporting period were Vanguard FTSE Developed Markets ETF (VEA) and Consumer Discretionary Select Sector SPDR Fund (XLY). The weakest
contributors were Industrial Select Sector SPDR Fund (XLI) and SPDR Bloomberg Barclays Convertible Securities ETF (CWB).
The opinions expressed are those of the portfolio
managers as of the date of this report and are subject to change. There is no guarantee that any forecast made will come to pass. This material
does not constitute investment advice and is not intended as an endorsement of any specific investment.
Hypothetical Growth of a $10,000 Investment
(Since
Inception Through 4/30/2018)
This chart illustrates the performance of a hypothetical $10,000 investment made on the Fund’s inception, and is not intended to
imply any future performance.
Fund Performance History
IQ Leaders GTAA Tracker
ETF
(as of April 30, 2018)
|
|
|
|
1
Year
|
|
Since
Inception1
|
|
|
|
|
Average
Annual
|
|
Average
Annual
|
|
Cumulative
|
IQ Leaders GTAA Tracker ETF Market Price2 |
|
|
|
|
8.40 |
% |
|
|
9.68 |
% |
|
|
27.01 |
% |
IQ Leaders GTAA Tracker ETF NAV |
|
|
|
|
8.43 |
% |
|
|
9.67 |
% |
|
|
26.97 |
% |
IQ Leaders GTAA Tracker Index |
|
|
|
|
8.83 |
% |
|
|
10.31 |
% |
|
|
28.86 |
% |
MSCI All Country World Index |
|
|
|
|
13.48 |
% |
|
|
14.63 |
% |
|
|
42.29 |
% |
1 |
|
Fund Inception Date: 9/30/2015. |
2 |
|
Beginning on May 31, 2016, the price used
to calculate the Market Price returns is the mean between the day’s last bid and ask prices. Prior to May 31, 2016, market price returns were
calculated using the day’s NYSE Arca closing price. The market price returns do not represent returns an investor would receive if shares were
traded at other times. |
33
Management’s Discussion of
Fund Performance (unaudited) (continued)
How did IQ Enhanced Core Bond U.S. ETF perform during
the 12 months ended April 30, 2018?
For the 12 months ended April 30, 2018 (the
“reporting period”), IQ Enhanced Core Bond U.S. ETF returned -2.66% at NAV (net asset value) and -2.71% at market price.1
To compare, the Fund’s Underlying Index, the IQ Enhanced Core Bond U.S. Index,2 returned -2.39% for the same time period. The
Bloomberg Barclays U.S. Aggregate Bond Index2 returned -0.32% for the same period.
What factors affected the Fund’s performance
during the reporting period?
The Fund’s long-only strategy rotates among five
bond sectors: investment grade corporate bonds, mortgage-backed securities, long-term U.S. Treasuries, intermediate-term U.S. Treasuries and
short-term U.S. Treasuries. The Fund’s largest average weighting during the reporting period was in investment grade corporate
bonds, followed by short-term U.S. Treasuries. Intermediate-term U.S. Treasuries were the smallest allocation within the Fund during the
reporting period.
During the reporting period, how was the Fund’s
performance materially affected by investments in derivatives?
The Fund did not use derivatives during the reporting
period.
How were the Fund’s assets allocated during the
reporting period and why?
The Fund’s allocations are driven by quantitative
models that determine the weights across the various aggregate bond sectors based on short-term and long-term momentum signals. The underlying
ETF allocations are constrained to a maximum limit of active weight and active risk versus the broad U.S. bond market. Given the
rules-based nature of the process, there is no subjectivity involved in the allocation decision process.
At the asset class level, the Fund was invested primarily
in investment grade corporate bonds and short-term U.S. Treasuries, via underlying ETFs. The Fund also had allocations to mortgage-backed
securities and long-term U.S. Treasuries via underlying ETFs. The Fund’s exposure to intermediate-term U.S. Treasuries was minimal during
the reporting period.
How did the Fund’s allocations change over the
course of the reporting period?
The Fund’s asset class allocations were adjusted as
determined by the Underlying Index’s proprietary quantitative models.
During most of the reporting period, the Fund’s
allocation, via underlying ETFs, to investment grade corporate bonds was held at or near the maximum allowable weight, before the Underlying
Index began a steady reduction in that weighting during the last quarter of the reporting period. Also, while short-term U.S. Treasuries
were, on average, a significant allocation within the Fund, via underlying ETFs, the sector did experience varying allocations of between 0%
and 50% during the reporting period. Long-term U.S. Treasuries, via underlying ETFs, also experienced varying exposures during the reporting
period, with occasions of notable allocations countered by spans with 0% allocation.
The Fund’s allocation to mortgage-backed securities,
via underlying ETFs, was minimal during the first half of the reporting period, but the allocation increased and subsequently rose to moderate
levels during the latter half of the reporting period.
Intermediate-term U.S. Treasuries, via underlying ETFs,
were a minimal exposure for the reporting period overall, and were a Fund holding for only two months of the reporting
period.
During the reporting period, which underlying ETFs had
the highest total returns and which underlying ETFs had the lowest total returns?
In terms of total return, the best-performing underlying
ETFs in the Fund were iShares U.S. Credit Bond ETF (CRED) and Schwab Short Term U.S. Treasury ETF (SCHO). During the reporting period, SPDR
Portfolio Long Term Treasury ETF (SPTL) and Vanguard Long-Term Treasury ETF (VGLT) recorded the lowest total returns.
1 |
|
The price used to calculate the market price
returns is the mean between the day’s last bid and ask prices and does not represent returns an investor would receive if shares were
traded at other times. |
2 |
|
See page 35 for more information on
this index. |
34
Management’s Discussion of
Fund Performance (unaudited) (continued)
Which underlying ETFs were the strongest positive
contributors to the Fund’s performance and which underlying ETFs were particularly weak?
On the basis of impact, which takes weightings and total
returns into consideration, the underlying ETFs that made the greatest positive contributions to the Fund’s performance during the
reporting period were iShares iBoxx $ Investment Grade Corporate Bond ETF (LQD) and iShares U.S. Credit Bond ETF (CRED). The weakest
contributors were SPDR Portfolio Long Term Treasury ETF (SPTL) and Vanguard Long-Term Treasury ETF (VGLT).
The opinions expressed are those of the portfolio
managers as of the date of this report and are subject to change. There is no guarantee that any forecast made will come to pass. This material
does not constitute investment advice and is not intended as an endorsement of any specific investment.
Hypothetical Growth of a $10,000 Investment
(Since
Inception Through 4/30/2018)
This chart illustrates the performance of a hypothetical $10,000 investment made on the Fund’s inception, and is not intended to
imply any future performance.
Fund Performance History
IQ Enhanced Core Bond U.S.
ETF
(as of April 30, 2018)
|
|
|
|
1
Year
|
|
Since
Inception1
|
|
|
|
|
Average
Annual
|
|
Average
Annual
|
|
Cumulative
|
IQ Enhanced Core Bond U.S. ETF Market Price2 |
|
|
|
|
–2.71 |
% |
|
|
–1.53 |
% |
|
|
–2.99 |
% |
IQ Enhanced Core Bond U.S. ETF NAV |
|
|
|
|
–2.66 |
% |
|
|
–1.51 |
% |
|
|
–2.96 |
% |
IQ Enhanced Core Bond U.S. Index |
|
|
|
|
–2.39 |
% |
|
|
–1.23 |
% |
|
|
–2.41 |
% |
Bloomberg Barclays U.S. Aggregate Bond Index |
|
|
|
|
–0.32 |
% |
|
|
0.13 |
% |
|
|
0.25 |
% |
1 |
|
Fund Inception Date: 5/10/2016. |
2 |
|
Beginning on May 31, 2016,
the price used to calculate the Market Price returns is the mean between the day’s last bid and ask prices. Prior to May 31, 2016, market price
returns were calculated using the day’s NYSE Arca closing price. The market price returns do not represent returns an investor would receive if
shares were traded at other times. |
35
Management’s Discussion of
Fund Performance (unaudited) (continued)
How did IQ Enhanced Core Plus Bond U.S. ETF perform
during the 12 months ended April 30, 2018?
For the 12 months ended April 30, 2018 (the
“reporting period”), IQ Enhanced Core Plus Bond U.S. ETF returned -1.44% at NAV (net asset value) and -1.56% at market
price.1 To compare, the Fund’s Underlying Index, the IQ Enhanced Core Plus Bond U.S. Index,2 returned -1.23% for the
same time period. The Bloomberg Barclays U.S. Aggregate Bond Index2 returned -0.32% for the same period.
What factors affected the Fund’s performance
during the reporting period?
The Fund’s long-only strategy rotates among seven
bond sectors: high yield corporate bonds, U.S. dollar-denominated emerging markets debt, investment grade corporate bonds, mortgage-backed
securities, long-term U.S. Treasuries, intermediate-term U.S. Treasuries and short-term U.S. Treasuries.
The largest sector contributors to the Fund’s
performance during the reporting period were high yield corporate bonds and emerging markets debt. The Fund’s largest average weighting
during the reporting period was in investment grade corporate bonds, which detracted from overall performance. Exposure to long-term U.S.
Treasuries also detracted from the Fund’s performance during the reporting period.
During the reporting period, how was the Fund’s
performance materially affected by investments in derivatives?
The Fund did not use derivatives during the reporting
period.
How were the Fund’s assets allocated during the
reporting period and why?
The Fund’s allocations are driven by quantitative
models that determine the weights across the various aggregate bond sectors based on short-term and long-term momentum signals. The underlying
ETF allocations are constrained to a maximum limit of active weight and active risk versus the broad U.S. bond market. Given the
rules-based nature of the process, there is no subjectivity involved in the allocation decision process.
At the asset class level, the Fund was invested primarily
in investment grade corporate bonds, via underlying ETFs. The Fund also had allocations, at relatively equal levels, to high yield corporate
bonds, mortgage-backed securities and short-term U.S. Treasuries, via underlying ETFs. More minimal allocations were held in long-term U.S.
Treasuries, emerging markets debt and intermediate-term U.S. Treasuries, via underlying ETFs, during the reporting
period.
How did the Fund’s allocations change over the
course of the reporting period?
The Fund’s asset class allocations were adjusted as
determined by the Underlying Index’s proprietary quantitative models.
During the reporting period, the Fund’s primary
allocation, via underlying ETFs, was to investment grade corporate bonds, at times reaching the maximum allowable allocation. Mortgage-backed
securities and short-term U.S. Treasuries were also primary allocations, but their levels saw some variance, at times receiving a 0%
exposure. On average, allocations to the intermediate-term and long-term segments of the U.S. Treasury yield curve, or spectrum of maturities,
were minimal, also at times receiving a 0% exposure.
During the reporting period, which underlying ETFs had
the highest total returns and which underlying ETFs had the lowest total returns?
In terms of total return, the best-performing underlying
ETFs in the Fund were iShares JP Morgan USD Emerging Markets Bond ETF (EMB) and iShares 7-10 Year Treasury Bond ETF (IEF). During the reporting
period, iShares 10-20 Year Treasury Bond ETF (TLH) and SPDR Bloomberg Barclays Mortgaged Backed Bond ETF (MGB) recorded the lowest total
returns.
1 |
|
The price used to calculate the market price
returns is the mean between the day’s last bid and ask prices and does not represent returns an investor would receive if shares were
traded at other times. |
2 |
|
See page 37 for more information on
this index. |
36
Management’s Discussion of Fund Performance
(unaudited) (continued)
Which underlying ETFs were the strongest positive
contributors to the Fund’s performance and which underlying ETFs were particularly weak?
On the basis of impact, which takes weightings and total
returns into consideration, the underlying ETFs that made the greatest positive contributions to the Fund’s performance during the
reporting period were SPDR Bloomberg Barclays High Yield Bond ETF (JNK) and iShares iBoxx $ High Yield Corporate Bond ETF (HYG). The
weakest contributors were Vanguard Long-Term Treasury ETF (VGLT) and Vanguard Intermediate-Term Corporate Bond ETF
(VCIT).
The opinions expressed are those of the portfolio
managers as of the date of this report and are subject to change. There is no guarantee that any forecast made will come to pass. This material
does not constitute investment advice and is not intended as an endorsement of any specific investment.
Hypothetical Growth of a $10,000 Investment
(Since
Inception Through 4/30/2018)
This chart illustrates the performance of a hypothetical $10,000 investment made on the Fund’s inception, and is not intended to
imply any future performance.
Fund Performance History
IQ Enhanced Core Plus Bond
U.S. ETF
(as of April 30, 2018)
|
|
|
|
1
Year
|
|
Since
Inception1
|
|
|
|
|
Average
Annual
|
|
Average
Annual
|
|
Cumulative
|
IQ Enhanced Core Plus Bond U.S. ETF Market Price2 |
|
|
|
|
–1.56 |
% |
|
|
0.51 |
% |
|
|
1.01 |
% |
IQ Enhanced Core Plus Bond U.S. ETF NAV |
|
|
|
|
–1.44 |
% |
|
|
0.56 |
% |
|
|
1.10 |
% |
IQ Enhanced Core Plus Bond U.S. Index |
|
|
|
|
–1.23 |
% |
|
|
0.77 |
% |
|
|
1.53 |
% |
Bloomberg Barclays U.S. Aggregate Bond Index |
|
|
|
|
–0.32 |
% |
|
|
0.13 |
% |
|
|
0.25 |
% |
1 |
|
Fund Inception Date: 5/10/2016. |
2 |
|
Beginning on May 31, 2016, the price used
to calculate the Market Price returns is the mean between the day’s last bid and ask prices. Prior to May 31, 2016, market price returns
were calculated using the day’s NYSE Arca closing price. The market price returns do not represent returns an investor would receive if
shares were traded at other times. |
37
Management’s Discussion of Fund Performance
(unaudited) (continued)
How did IQ S&P High Yield Low Volatility Bond ETF
perform during the 12 months ended April 30, 2018?
For the 12 months ended April 30, 2018 (the
“reporting period”), IQ S&P High Yield Low Volatility Bond ETF returned 0.39% at NAV (net asset value) and
-0.36% at market price.1 To compare, the Fund’s Underlying Index, the S&P U.S. High Yield Low Volatility
Corporate Bond Index,2 returned 0.88% for the same time period. The Merrill Lynch U.S. High Yield Master II Index2
returned 3.20% for the same period.
What factors affected the Fund’s performance
during the reporting period?
The Fund seeks investment results that track the price
and yield performance of its Underlying Index, the S&P High Yield Low Volatility Corporate Bond Index. The Underlying Index is comprised of
U.S. dollar-denominated high yield corporate bonds that have been selected in accordance with a rules-based methodology. The concept
behind this methodology is that duration times spread (DTS) is an effective volatility measure of credit risk for corporate bonds. Overlaying
the marginal contribution to risk (MCR) approach on the DTS of a corporate bond portfolio and measuring individual bonds’ credit risk in a
portfolio context allows for a meaningful way to screen out riskier bonds. As such, the total return volatility for bonds in the S&P High
Yield Low Volatility Corporate Bond Index, in aggregate, is expected to be lower relative to the aggregate group of bonds in the broad U.S.
dollar-denominated high yield corporate bond market. The Underlying Index is a market value-weighted index.
During the reporting period, the U.S. Federal Reserve
(the Fed) raised the targeted federal funds rate three times—by 0.25% each time—to a range of 1.50% to 1.75%. The U.S. Treasury yield
curve, or spectrum of maturities, flattened, meaning the difference in yields between longer maturities and shorter maturities narrowed. The
difference in yields between U.S. Treasury securities maturing in two years and five years compressed by approximately 25 basis points during
the reporting period. (A basis point is 1/100th of a percentage point.) The difference in yields between U.S. Treasury securities
maturing in five years and ten years narrowed by approximately 33 basis points, and the difference in yields between U.S. Treasury securities
maturing in 10 years and 30 years narrowed by approximately 50 basis points during the reporting period. The option-adjusted spread
(OAS)3 of the overall U.S. high yield corporate bond market, as represented by the ICE BofAML U.S. High Yield Index2,
compressed by approximately 35 basis points and had an excess return over similar-duration matched U.S. Treasuries of 4.36%. The bulk of this
spread compression came from bonds rated CCC and lower, i.e. those considered of lower quality, whose OAS compressed by 128 basis points and had
an excess return over similar duration-matched U.S. Treasuries of 7.25% during the reporting period. Given the underlying strategy of the
Fund, lower quality bonds had a smaller weighting in the Fund during the reporting period relative to the ICE BofAML U.S. High Yield
Index.
During the reporting period, how was the Fund’s
performance materially affected by investments in derivatives?
The Fund did not use derivatives during the reporting
period.
During the reporting period, which sectors had the
highest total returns and which sectors had the lowest total returns?
In terms of total return, the best-performing sectors in
the Underlying Index were information technology, transportation and utilities. During the reporting period, financials, media and real estate
recorded the lowest total returns.
During the reporting period, which sectors made the
strongest contributions to the Fund’s absolute performance and which sectors made the weakest contributions?
On the basis of impact, which takes weightings and total
returns into account, the sectors that made the strongest positive contributions to the Fund’s absolute performance were consumer
discretionary, information technology and materials. The sectors that made the weakest contributions to the Fund’s absolute performance
were financials, real estate and transportation.
During the reporting period, which individual
securities had the highest total returns and which securities had the lowest total returns?
Within the Underlying Index, the securities with the
highest total returns during the reporting period were high yield bonds issued by energy exploration and production company Continental
Resources, Italian telecommunications company Telecom Italia and utility provider AES.
The Underlying Index components with the lowest total
returns for the reporting period were high yield bonds issued by metals and mining company Freeport-McMoRan and auto manufacturer Jaguar Land
Rover Auto Manufacturers.
1 |
|
The price used to calculate the market price
returns is the mean between the day’s last bid and ask prices and does not represent returns an investor would receive if shares were
traded at other times. |
2 |
|
See page 39 for more information on
this index. |
3 |
|
Option-adjusted spread (OAS) is the measurement
of the spread of a fixed income security rate and the risk-free rate of return, which is adjusted to take into account an embedded option.
Typically, an analyst uses the Treasury securities yield for the risk-free rate. The spread is added to the fixed income security price to make
the risk-free bond price the same as the bond.
|
38
Management’s Discussion of Fund Performance
(unaudited) (continued)
Which individual securities made the strongest
contributions to the Fund’s absolute performance during the reporting period and which securities made the weakest
contributions?
On the basis of impact, which takes weightings and total
returns into consideration, the securities that made the strongest contributions to the Fund’s absolute performance during the reporting
period were issued by auto manufacturers Fiat Chrysler Automobiles and ZF North America and by wireless telecommunications company SBA
Communications. The weakest contributors were issued by aerospace and defense company Park Aerospace Holdings, metals and mining company
Freeport-McMoRan and fast-food retailers Burger King Worldwide and Tim Hortons subsidiary New Red Finance.
Were there any changes in the Underlying Index during
the reporting period?
The security selection embedded in the Underlying Index
is designed to measure the performance of U.S. high yield bonds that exhibit low volatility characteristics, as measured by MCR, and meet both
liquidity and maturity criteria. Bonds that meet the criteria of the S&P U.S. High Yield Low Volatility Corporate Bond Index are market
value weighted, subject to an issuer-weighted cap whereby any issuer that exceeds 3% of the market value weight of the S&P U.S. High
Yield Low Volatility Corporate Bond Index is capped at 3%. The excess market value over the 3% cap is redistributed on a pro-rata basis to all
of the index bonds of the other issuers that are below the 3% cap. This process is then repeated until no issuer exceeds the 3%
limit.
The opinions expressed are those of the portfolio
managers as of the date of this report and are subject to change. There is no guarantee that any forecast made will come to pass. This material
does not constitute investment advice and is not intended as an endorsement of any specific investment.
Hypothetical Growth of a $10,000 Investment
(Since
Inception Through 4/30/2018)
This chart illustrates the performance of a hypothetical $10,000 investment made on the Fund’s inception, and is not intended to
imply any future performance.
Fund Performance History
IQ S&P High Yield Low
Volatility Bond ETF
(as of April 30, 2018)
|
|
|
|
1
Year
|
|
Since
Inception1
|
|
|
|
|
Average
Annual
|
|
Average
Annual
|
|
Cumulative
|
IQ S&P High Yield Low Volatility Bond ETF Market Price2 |
|
|
|
|
–0.36 |
% |
|
|
1.30 |
% |
|
|
1.57 |
% |
IQ S&P High Yield Low Volatility Bond ETF NAV |
|
|
|
|
0.39 |
% |
|
|
1.49 |
% |
|
|
1.80 |
% |
S&P U.S. High Yield Low Volatility Corporate Bond Index |
|
|
|
|
0.88 |
% |
|
|
1.91 |
% |
|
|
2.30 |
% |
Merrill Lynch U.S. High Yield Master II Index |
|
|
|
|
3.20 |
% |
|
|
4.16 |
% |
|
|
5.04 |
% |
1 |
|
Fund Inception Date: 2/15/2017. |
2 |
|
The price used to calculate the Market Price returns
is determined by using the mid price between bid and ask price listed on the NYSE Arca and does not represent returns an investor would
receive. |
39
Management’s Discussion of Fund Performance
(unaudited) (continued)
How did IQ Chaikin U.S. Small Cap ETF perform during
the period since its inception on May 16, 2017 through April 30, 2018 (the “reporting period”)?
For the reporting period, IQ Chaikin U.S. Small Cap ETF
returned 8.33% at NAV (net asset value) and 8.36% at market price.1 To compare, the Fund’s Underlying Index, the NASDAQ Chaikin
Power US Small Cap Index,2 returned 9.05% for the same time period. The NASDAQ US 1500 Index2 and the Russell 2000
Index2 returned 12.47% and 11.99%, respectively, for the same period.
What factors affected the Fund’s performance
during the reporting period?
The Underlying Index seeks to capture the performance of
the U.S. large cap universe by selecting stocks that exhibit characteristics indicating the potential to outperform peers. The Underlying Index
utilizes the Chaikin Power Gauge, which is a proprietary 20-factor quantitative stock selection model that combines value, growth,
technical and sentiment indicators. Some major themes affecting the U.S. equity markets during the reporting period were corporate tax
reform, rising interest rates, higher inflation and heightened volatility.
During the reporting period, how was the Fund’s
performance materially affected by investments in derivatives?
The Fund did not use derivatives during the reporting
period.
During the reporting period, which sectors had the
highest total returns and which sectors had the lowest total returns?
In terms of total return, the best-performing sectors in
the Underlying Index were energy, real estate and utilities. During the reporting period, telecommunication services, consumer staples and
information technology were the sectors that recorded the lowest total returns.
During the reporting period, which sectors made the
strongest contributions to the Fund’s absolute performance and which sectors made the weakest contributions?
On the basis of impact, which takes weightings and total
returns into account, the sectors that made the strongest positive contributions to the Fund’s absolute performance were financials,
consumer discretionary and industrials. The sectors that made the weakest contributions to the Fund’s absolute performance were
consumer staples, telecommunication services and health care.
During the reporting period, which individual stocks
had the highest total returns and which stocks had the lowest total returns?
Within the Underlying Index, the stocks
with the highest total returns during the reporting period were Quorum Health, which
provides health care consulting services; Atara Biotherapeutics, which operates as a
biotechnology company; and Overstock.com, which offers discounted brand merchandise for
sale over the Internet.
The Underlying Index constituents with the lowest total
returns for the reporting period were FTD, which provides floral, gift and related products and services to consumers; Aceto, which markets,
sells and distributes human health products; and Community Health Systems, which owns, leases and operates hospitals.
Which individual stocks made the strongest
contributions to the Fund’s absolute performance during the reporting period and which stocks made the weakest
contributions?
On the basis of impact, which takes
weightings and total returns into consideration, the stocks that made the strongest contributions
to the Fund’s absolute performance during the reporting period were Overstock.com,
mentioned earlier; Comtech Telecommunications, which designs, develops and manufactures
technology electronic products and systems; and Spartan Motors, which develops and manufactures
custom chassis for a variety of specialty vehicles.
The weakest contributors were FTD and Community Health
Systems, each already mentioned, as well as IDT, which offers consumer services focused primarily on the telecommunications
industry.
1 |
|
The price used to calculate the market price
returns is the mean between the day’s last bid and ask prices and does not represent returns an investor would receive if shares were
traded at other times. |
2 |
|
See page 41 for more information on
this index. |
40
Management’s Discussion of Fund Performance
(unaudited) (continued)
Were there any changes in the Underlying Index during
the reporting period?
The Underlying Index was reconstituted, meaning that
components were added to or removed from the Underlying Index, in April 2018.
The opinions expressed are those of the portfolio
managers as of the date of this report and are subject to change. There is no guarantee that any forecast made will come to pass. This material
does not constitute investment advice and is not intended as an endorsement of any specific investment.
Hypothetical Growth of a $10,000 Investment
(Since
Inception Through 4/30/2018)
This chart illustrates the performance of a hypothetical $10,000 investment made on the Fund’s inception, and is not intended to
imply any future performance.
Fund Performance History
IQ Chaikin U.S. Small Cap
ETF
(as of April 30, 2018)
|
|
|
|
Since
Inception1
|
|
|
|
|
Cumulative
|
IQ Chaikin U.S. Small Cap ETF Market Price2 |
|
|
|
|
8.36 |
% |
IQ Chaikin U.S. Small Cap ETF NAV |
|
|
|
|
8.33 |
% |
NASDAQ Chaikin Power US Small Cap Index |
|
|
|
|
9.05 |
% |
NASDAQ US 1500 Index |
|
|
|
|
12.47 |
% |
Russell 2000 Index |
|
|
|
|
11.99 |
% |
1 |
|
Fund Inception Date: 5/16/2017. |
2 |
|
The price used to calculate the Market Price returns
is determined by using the mid price between bid and ask price listed on the NYSE Arca and does not represent returns an investor would
receive. |
41
Management’s Discussion of Fund Performance
(unaudited) (continued)
How did IQ Chaikin U.S. Large Cap ETF perform during
the period since its inception on December 13, 2017 through April 30, 2018 (the “reporting
period”)?
For the reporting period, IQ Chaikin U.S. Large Cap ETF
returned 1.31% at NAV (net asset value) and 1.32% at market price.1 To compare, the Fund’s Underlying Index, the NASDAQ Chaikin
Power US Large Cap Index,2 returned 1.43% for the same time period. The NASDAQ US 300 Total Return Index2 and the S&P
500 Index2 returned -0.13% and -0.14%, respectively, for the same period.
What factors affected the Fund’s performance
during the reporting period?
The Underlying Index seeks to capture the performance of
the U.S. large cap universe by selecting stocks that exhibit characteristics indicating the potential to outperform peers. The Underlying Index
utilizes the Chaikin Power Gauge, which is a proprietary 20-factor quantitative stock selection model that combines value, growth,
technical and sentiment indicators. Some major themes affecting the U.S. equity markets during the reporting period were corporate tax
reform, rising interest rates, higher inflation and heightened volatility.
During the reporting period, how was the Fund’s
performance materially affected by investments in derivatives?
The Fund did not use derivatives during the reporting
period.
During the reporting period, which sectors had the
highest total returns and which sectors had the lowest total returns?
In terms of total return, the best-performing sectors in
the Underlying Index were energy, health care and information technology. During the reporting period, industrials, telecommunication services
and utilities were the sectors that recorded the lowest total returns.
During the reporting period, which sectors made the
strongest contributions to the Fund’s absolute performance and which sectors made the weakest contributions?
On the basis of impact, which takes weightings and total
returns into account, the sectors that made the strongest positive contributions to the Fund’s absolute performance were energy,
information technology and health care. The sectors that made the weakest contributions to the Fund’s absolute performance were
industrials, financials and utilities.
During the reporting period, which individual stocks
had the highest total returns and which stocks had the lowest total returns?
Within the Underlying Index, the stocks with the highest
total returns during the reporting period were Andeavor and Valero Energy, each a refiner and marketer of petroleum products, as well as Hewlett
Packard Enterprises, a provider of information technology solutions.
The Underlying Index constituents with the lowest total
returns for the reporting period were General Electric, a globally diversified technology, industrial and financial services company; Ameriprise
Financial, a financial planning and services firm; and Stanley Black and Decker, a diversified provider of hand tools and power
tools.
Which individual stocks made the strongest
contributions to the Fund’s absolute performance during the reporting period and which stocks made the weakest
contributions?
On the basis of impact, which takes weightings and total
returns into consideration, the stocks that made the strongest contributions to the Fund’s absolute performance during the reporting period
were Andeavor, Valero Energy and Hewlett Packard Enterprises, each mentioned earlier.
The weakest contributors were Ameriprise Financial,
Stanley Black and Decker and General Electric, each already mentioned.
1 |
|
The price used to calculate the market price
returns is the mean between the day’s last bid and ask prices and does not represent returns an investor would receive if shares were
traded at other times. |
2 |
|
See page 43 for more information on
this index. |
42
Management’s Discussion of Fund Performance
(unaudited) (continued)
Were there any changes in the Underlying Index during
the reporting period?
The Underlying Index was reconstituted, meaning that
components were added to or removed from the Underlying Index, in April 2018.
The opinions expressed are those of the portfolio
managers as of the date of this report and are subject to change. There is no guarantee that any forecast made will come to pass. This material
does not constitute investment advice and is not intended as an endorsement of any specific investment.
Hypothetical Growth of a $10,000 Investment
(Since
Inception Through 4/30/2018)
This chart illustrates the performance of a hypothetical $10,000 investment made on the Fund’s inception, and is not intended to
imply any future performance.
Fund Performance History
IQ Chaikin U.S. Large Cap
ETF
(as of April 30, 2018)
|
|
|
|
Since
Inception1
|
|
|
|
|
Cumulative
|
IQ Chaikin U.S. Large Cap ETF Market Price2 |
|
|
|
|
1.32 |
% |
IQ Chaikin U.S. Large Cap ETF NAV |
|
|
|
|
1.31 |
% |
NASDAQ Chaikin Power US Large Cap Index |
|
|
|
|
1.43 |
% |
NASDAQ US 300 Total Return Index |
|
|
|
|
–0.13 |
% |
S&P 500 Index |
|
|
|
|
–0.14 |
% |
1 |
|
Fund Inception Date:
12/13/2017. |
2 |
|
The price used to calculate the Market Price returns
is determined by using the mid price between bid and ask price listed on the NYSE Arca and does not represent returns an investor would
receive. |
43
Fund
Expenses
(unaudited)
As a shareholder of a fund, you incur two
types of costs: (1) transaction costs on purchases and sales and (2) ongoing costs, including Advisory fees and other fund expenses. This
example is intended to help you understand your ongoing costs (in dollars) of investing in a fund and to compare these costs with the
ongoing costs of investing in other funds. Shareholders may pay brokerage commissions on their purchase and sale of the Fund, which are not reflected
in the example.
The examples are based on an investment of $1,000 invested
at the beginning of the period and held for the entire period as indicated below.
Actual Expenses
The first line of the table below provides information about
actual account values and actual expenses. You may use the information together with the amount you invested, in a particular fund, to
estimate the expenses that you paid over the period. Simply divide your account value by $1,000 (for example, an $8,600 account value divided by $1,000
= 8.6), then multiply the result by the number in the first line under the heading entitled “Expenses Paid During the Period
11/01/2017 to 04/30/2018” to estimate the expenses you paid on your account during this period. Each Fund will indirectly bear its pro rata share
of the expenses incurred by the underlying ETF investments in which each Fund invests. These expenses are not included in the table.
Hypothetical Example for Comparison
Purposes
The second line of the table below also provides information
about hypothetical account values and hypothetical expenses based on each Fund’s actual expense ratio and an assumed annual rate of return of 5%
before expenses, which are not the Funds’ actual returns. The hypothetical account values and expenses may not be used to estimate the actual
ending account balance or expenses you paid for the period. You may use this information to compare the ongoing costs of investing in the Fund and
other funds. To do so, compare this 5% hypothetical example with the 5% hypothetical examples that appear in the shareholder reports of other funds.
The Funds will indirectly bear their pro rata share of the expenses incurred by the underlying fund investments in which the Funds invest. These
expenses are not included in the table.
Please note that the expenses shown in the table are meant
to highlight your ongoing costs only and do not reflect any transactional costs. Therefore, the hypothetical example is useful in comparing ongoing
costs only, and will not help you determine the relative total costs of owning different funds. In addition, if these transactional costs were
included, your costs would have been higher.
44
Fund Expenses (unaudited) (continued)
|
|
|
|
Beginning
Account
Value
11/01/2017
|
|
Ending
Account
Value
04/30/2018
|
|
Annualized
Expense
Ratios for
the
Period 11/01/2017
to 04/30/2018
|
|
Expenses1
Paid During
the Period
11/01/2017 to
04/30/2018
|
IQ Hedge Multi-Strategy Tracker ETF |
|
|
|
|
|
|
|
|
|
|
|
|
|
|
|
|
|
|
Actual |
|
|
|
$ |
1,000.00 |
|
|
$ |
1,008.20 |
|
|
|
0.54 |
% |
|
$ |
2.69 |
|
Hypothetical (assuming a 5% return before expenses) |
|
|
|
$ |
1,000.00 |
|
|
$ |
1,022.12 |
|
|
|
0.54 |
% |
|
$ |
2.71 |
|
IQ Hedge Macro Tracker ETF |
|
|
|
|
|
|
|
|
|
|
|
|
|
|
|
|
|
|
Actual |
|
|
|
$ |
1,000.00 |
|
|
$ |
996.20 |
|
|
|
0.75 |
% |
|
$ |
3.71 |
|
Hypothetical (assuming a 5% return before expenses) |
|
|
|
$ |
1,000.00 |
|
|
$ |
1,021.08 |
|
|
|
0.75 |
% |
|
$ |
3.76 |
|
IQ Hedge Market Neutral Tracker ETF |
|
|
|
|
|
|
|
|
|
|
|
|
|
|
|
|
|
|
Actual |
|
|
|
$ |
1,000.00 |
|
|
$ |
999.10 |
|
|
|
0.76 |
% |
|
$ |
3.77 |
|
Hypothetical (assuming a 5% return before expenses) |
|
|
|
$ |
1,000.00 |
|
|
$ |
1,021.03 |
|
|
|
0.76 |
% |
|
$ |
3.81 |
|
IQ Hedge Long/Short Tracker ETF |
|
|
|
|
|
|
|
|
|
|
|
|
|
|
|
|
|
|
Actual |
|
|
|
$ |
1,000.00 |
|
|
$ |
1,014.50 |
|
|
|
0.76 |
% |
|
$ |
3.80 |
|
Hypothetical (assuming a 5% return before expenses) |
|
|
|
$ |
1,000.00 |
|
|
$ |
1,021.03 |
|
|
|
0.76 |
% |
|
$ |
3.81 |
|
IQ Hedge Event-Driven Tracker ETF |
|
|
|
|
|
|
|
|
|
|
|
|
|
|
|
|
|
|
Actual |
|
|
|
$ |
1,000.00 |
|
|
$ |
1,004.80 |
|
|
|
0.76 |
% |
|
$ |
3.78 |
|
Hypothetical (assuming a 5% return before expenses) |
|
|
|
$ |
1,000.00 |
|
|
$ |
1,021.03 |
|
|
|
0.76 |
% |
|
$ |
3.81 |
|
IQ Global Resources ETF |
|
|
|
|
|
|
|
|
|
|
|
|
|
|
|
|
|
|
Actual |
|
|
|
$ |
1,000.00 |
|
|
$ |
1,021.70 |
|
|
|
0.76 |
% |
|
$ |
3.81 |
|
Hypothetical (assuming a 5% return before expenses) |
|
|
|
$ |
1,000.00 |
|
|
$ |
1,021.03 |
|
|
|
0.76 |
% |
|
$ |
3.81 |
|
IQ Merger Arbitrage ETF |
|
|
|
|
|
|
|
|
|
|
|
|
|
|
|
|
|
|
Actual |
|
|
|
$ |
1,000.00 |
|
|
$ |
992.10 |
|
|
|
0.76 |
% |
|
$ |
3.75 |
|
Hypothetical (assuming a 5% return before expenses) |
|
|
|
$ |
1,000.00 |
|
|
$ |
1,021.03 |
|
|
|
0.76 |
% |
|
$ |
3.81 |
|
IQ Real Return ETF
|
|
|
|
|
|
|
|
|
|
|
|
|
|
|
|
|
|
|
Actual |
|
|
|
$ |
1,000.00 |
|
|
$ |
1,008.70 |
|
|
|
0.49 |
% |
|
$ |
2.44 |
|
Hypothetical (assuming a 5% return before expenses) |
|
|
|
$ |
1,000.00 |
|
|
$ |
1,022.36 |
|
|
|
0.49 |
% |
|
$ |
2.46 |
|
IQ Global Agribusiness Small Cap ETF
|
|
|
|
|
|
|
|
|
|
|
|
|
|
|
|
|
|
|
Actual |
|
|
|
$ |
1,000.00 |
|
|
$ |
978.60 |
|
|
|
0.76 |
% |
|
$ |
3.73 |
|
Hypothetical (assuming a 5% return before expenses) |
|
|
|
$ |
1,000.00 |
|
|
$ |
1,021.03 |
|
|
|
0.76 |
% |
|
$ |
3.81 |
|
IQ U.S. Real Estate Small Cap ETF
|
|
|
|
|
|
|
|
|
|
|
|
|
|
|
|
|
|
|
Actual |
|
|
|
$ |
1,000.00 |
|
|
$ |
929.10 |
|
|
|
0.70 |
% |
|
$ |
3.35 |
|
Hypothetical (assuming a 5% return before expenses) |
|
|
|
$ |
1,000.00 |
|
|
$ |
1,021.32 |
|
|
|
0.70 |
% |
|
$ |
3.51 |
|
IQ 50 Percent Hedged FTSE International ETF
|
|
|
|
|
|
|
|
|
|
|
|
|
|
|
|
|
|
|
Actual |
|
|
|
$ |
1,000.00 |
|
|
$ |
1,024.30 |
|
|
|
0.20 |
% |
|
$ |
1.00 |
|
Hypothetical (assuming a 5% return before expenses) |
|
|
|
$ |
1,000.00 |
|
|
$ |
1,023.80 |
|
|
|
0.20 |
% |
|
$ |
1.00 |
|
IQ 50 Percent Hedged FTSE Europe ETF
|
|
|
|
|
|
|
|
|
|
|
|
|
|
|
|
|
|
|
Actual |
|
|
|
$ |
1,000.00 |
|
|
$ |
1,016.80 |
|
|
|
0.30 |
% |
|
$ |
1.50 |
|
Hypothetical (assuming a 5% return before expenses) |
|
|
|
$ |
1,000.00 |
|
|
$ |
1,023.31 |
|
|
|
0.30 |
% |
|
$ |
1.51 |
|
IQ 50 Percent Hedged FTSE Japan ETF
|
|
|
|
|
|
|
|
|
|
|
|
|
|
|
|
|
|
|
Actual |
|
|
|
$ |
1,000.00 |
|
|
$ |
1,037.60 |
|
|
|
0.30 |
% |
|
$ |
1.52 |
|
Hypothetical (assuming a 5% return before expenses) |
|
|
|
$ |
1,000.00 |
|
|
$ |
1,023.31 |
|
|
|
0.30 |
% |
|
$ |
1.51 |
|
IQ Leaders GTAA Tracker ETF
|
|
|
|
|
|
|
|
|
|
|
|
|
|
|
|
|
|
|
Actual |
|
|
|
$ |
1,000.00 |
|
|
$ |
1,014.70 |
|
|
|
0.46 |
% |
|
$ |
2.30 |
|
Hypothetical (assuming a 5% return before expenses) |
|
|
|
$ |
1,000.00 |
|
|
$ |
1,022.51 |
|
|
|
0.46 |
% |
|
$ |
2.31 |
|
IQ Enhanced Core Bond U.S. ETF
|
|
|
|
|
|
|
|
|
|
|
|
|
|
|
|
|
|
|
Actual |
|
|
|
$ |
1,000.00 |
|
|
$ |
956.50 |
|
|
|
0.21 |
% |
|
$ |
1.02 |
|
Hypothetical (assuming a 5% return before expenses) |
|
|
|
$ |
1,000.00 |
|
|
$ |
1,023.75 |
|
|
|
0.21 |
% |
|
$ |
1.05 |
|
IQ Enhanced Core Plus Bond U.S. ETF
|
|
|
|
|
|
|
|
|
|
|
|
|
|
|
|
|
|
|
Actual |
|
|
|
$ |
1,000.00 |
|
|
$ |
966.70 |
|
|
|
0.21 |
% |
|
$ |
1.02 |
|
Hypothetical (assuming a 5% return before expenses) |
|
|
|
$ |
1,000.00 |
|
|
$ |
1,023.75 |
|
|
|
0.21 |
% |
|
$ |
1.05 |
|
45
Fund Expenses (unaudited) (continued)
|
|
|
|
Beginning
Account
Value
11/01/2017
|
|
Ending
Account
Value
04/30/2018
|
|
Annualized
Expense
Ratios for
the
Period 11/01/2017
to 04/30/2018
|
|
Expenses1
Paid During
the Period
11/01/2017 to
04/30/2018
|
IQ S&P High Yield Low Volatility Bond ETF
|
|
|
|
|
|
|
|
|
|
|
|
|
|
|
|
|
|
|
Actual |
|
|
|
$ |
1,000.00 |
|
|
$ |
979.20 |
|
|
|
0.40 |
% |
|
$ |
1.96 |
|
Hypothetical (assuming a 5% return before expenses) |
|
|
|
$ |
1,000.00 |
|
|
$ |
1,022.81 |
|
|
|
0.40 |
% |
|
$ |
2.01 |
|
IQ Chaikin U.S. Small Cap ETF
|
|
|
|
|
|
|
|
|
|
|
|
|
|
|
|
|
|
|
Actual |
|
|
|
$ |
1,000.00 |
|
|
$ |
982.40 |
|
|
|
0.35 |
% |
|
$ |
1.72 |
|
Hypothetical (assuming a 5% return before expenses) |
|
|
|
$ |
1,000.00 |
|
|
$ |
1,023.06 |
|
|
|
0.35 |
% |
|
$ |
1.76 |
|
IQ Chaikin U.S. Large Cap ETF*
|
|
|
|
|
|
|
|
|
|
|
|
|
|
|
|
|
|
|
Actual |
|
|
|
$ |
1,000.00 |
|
|
$ |
1,013.10 |
|
|
|
0.25 |
% |
|
$ |
0.96 |
|
Hypothetical (assuming a 5% return before expenses) |
|
|
|
$ |
1,000.00 |
|
|
$ |
1,023.55 |
|
|
|
0.25 |
% |
|
$ |
1.25 |
|
* |
|
Fund commenced operations on December 13, 2017. Expenses are
calculated using the Fund’s annualized expense ratio, multiplied by the ending value for the period, multiplied by 139/365 (to reflect
commencement of operation). |
1 |
|
Unless otherwise indicated, expenses are calculated using the
Fund’s annualized expense ratio, multiplied by the average account value for the period, multiplied by 181/365. |
46
Portfolio
Summaries
April 30,
2018
SCHEDULES OF INVESTMENTS SUMMARY
TABLE
IQ Hedge Multi-Strategy Tracker ETF
Net Assets ($ mil): $1,124.3
Industry
|
|
|
|
% of
Net
Assets
|
U.S. Short Term Treasury Bond Funds |
|
|
|
|
30.2 |
% |
Investment Grade Corporate Bond Funds |
|
|
|
|
17.2 |
|
Money Market Fund |
|
|
|
|
12.6 |
|
International Small Cap Equity Funds |
|
|
|
|
7.7 |
|
Floating Rate Funds |
|
|
|
|
5.5 |
|
U.S. Large Cap Growth Funds |
|
|
|
|
4.0 |
|
International Bond Funds |
|
|
|
|
3.8 |
|
U.S. Multi Cap Funds |
|
|
|
|
3.7 |
|
U.S. Small Cap Growth Funds |
|
|
|
|
3.7 |
|
High Yield Corporate Bond Funds |
|
|
|
|
3.5 |
|
BRIC Equity Funds |
|
|
|
|
3.4 |
|
U.S. Large Cap Core Funds |
|
|
|
|
3.3 |
|
Convertible Bond Fund |
|
|
|
|
3.3 |
|
International Equity Core Fund |
|
|
|
|
2.3 |
|
Emerging Markets Small Cap Equity Fund |
|
|
|
|
2.1 |
|
International Large Cap Growth Fund |
|
|
|
|
1.5 |
|
U.S. Medium Term Treasury Bond Fund |
|
|
|
|
0.9 |
|
Europe Equity Fund |
|
|
|
|
0.7 |
|
Treasury Inflation-Protected Securities Funds |
|
|
|
|
0.7 |
|
Japan Equity Fund |
|
|
|
|
0.5 |
|
Volatility Fund |
|
|
|
|
0.4 |
|
U.S. Intermediate Term Treasury Bonds Funds |
|
|
|
|
0.4 |
|
Gold Fund |
|
|
|
|
0.4 |
|
Japanese Yen Fund |
|
|
|
|
0.3 |
|
Australian Dollar Fund |
|
|
|
|
0.3 |
|
British Pound Fund |
|
|
|
|
0.2 |
|
Total Investments |
|
|
|
|
112.6 |
|
Other Assets and Liabilities, Net |
|
|
|
|
(12.6 |
) |
Total Net Assets |
|
|
|
|
100.0 |
% |
IQ Hedge Macro Tracker ETF
Net Assets ($ mil): $6.6
Industry
|
|
|
|
% of
Net
Assets
|
U.S. Short Term Treasury Bond Funds |
|
|
|
|
42.8 |
% |
Money Market Fund |
|
|
|
|
29.0 |
|
U.S. Multi Cap Funds |
|
|
|
|
10.0 |
|
BRIC Equity Funds |
|
|
|
|
9.3 |
|
International Bond Funds |
|
|
|
|
4.9 |
|
International Small Cap Equity Funds |
|
|
|
|
4.4 |
|
Europe Equity Fund |
|
|
|
|
4.4 |
|
Treasury Inflation-Protected Securities Funds |
|
|
|
|
4.2 |
|
Japan Equity Fund |
|
|
|
|
3.2 |
|
U.S. Medium Term Treasury Bond Fund |
|
|
|
|
2.9 |
|
Emerging Small Cap Equity Fund |
|
|
|
|
2.4 |
|
U.S. Large Cap Value Funds |
|
|
|
|
2.2 |
|
U.S. Dollar Fund |
|
|
|
|
2.1 |
|
Gold Fund |
|
|
|
|
2.1 |
|
Japanese Yen Fund |
|
|
|
|
2.0 |
|
U.S. Intermediate Term Treasury Bond Funds |
|
|
|
|
1.2 |
|
U.S. Large Cap Growth Funds |
|
|
|
|
1.0 |
|
U.S. Large Cap Core Fund |
|
|
|
|
0.9 |
|
Total Investments |
|
|
|
|
129.0 |
|
Other Assets and Liabilities, Net |
|
|
|
|
(29.0 |
) |
Total Net Assets |
|
|
|
|
100.0 |
% |
IQ Hedge Market Neutral Tracker ETF
Net Assets ($ mil): $12.8
Industry
|
|
|
|
% of
Net
Assets
|
U.S. Short Term Treasury Bond Funds |
|
|
|
|
38.1 |
% |
Floating Rate Funds |
|
|
|
|
19.7 |
|
Money Market Funds |
|
|
|
|
15.0 |
|
Investment Grade Corporate Bond Funds |
|
|
|
|
12.1 |
|
Mortgage Backed Securities Funds |
|
|
|
|
7.3 |
|
International Small Cap Equity Funds |
|
|
|
|
6.4 |
|
U.S. Large Cap Growth Funds |
|
|
|
|
4.6 |
|
U.S. Small Cap Growth Funds |
|
|
|
|
3.7 |
|
Euro Funds |
|
|
|
|
2.4 |
|
U.S. Large Cap Core Funds |
|
|
|
|
1.5 |
|
High Yield Municipal Bond Funds |
|
|
|
|
1.4 |
|
Convertible Bond Funds |
|
|
|
|
1.4 |
|
High Yield Corporate Bond |
|
|
|
|
1.1 |
|
U.S. Preferred Funds |
|
|
|
|
0.3 |
|
Total Investments |
|
|
|
|
115.0 |
|
Other Assets and Liabilities, Net |
|
|
|
|
(15.0 |
) |
Total Net Assets |
|
|
|
|
100.0 |
% |
See notes to financial
statements.
47
Portfolio Summaries (continued)
April
30, 2018
IQ Hedge Long/Short Tracker ETF
Net Assets ($ mil): $8.8
Industry
|
|
|
|
% of
Net
Assets
|
Investment Grade Corporate Bond Funds |
|
|
|
|
26.5 |
% |
U.S. Large Cap Core Funds |
|
|
|
|
15.8 |
|
Money Market Funds |
|
|
|
|
12.1 |
|
International Small Cap Equity Funds |
|
|
|
|
11.6 |
|
International Equity Core Funds |
|
|
|
|
11.3 |
|
U.S. Short Term Treasury Bond Funds |
|
|
|
|
8.4 |
|
International Large Cap Growth Funds |
|
|
|
|
7.2 |
|
Floating Rate Funds |
|
|
|
|
7.2 |
|
U.S. Large Cap Growth Funds |
|
|
|
|
6.5 |
|
U.S. Small Cap Growth Funds |
|
|
|
|
2.4 |
|
U.S. Preferred Funds |
|
|
|
|
2.1 |
|
Volatility Funds |
|
|
|
|
1.0 |
|
Total Investments |
|
|
|
|
112.1 |
|
Other Assets and Liabilities, Net |
|
|
|
|
(12.1 |
) |
Total Net Assets |
|
|
|
|
100.0 |
% |
IQ Hedge Event-Driven Tracker ETF
Net Assets ($ mil): $3.1
Industry
|
|
|
|
% of
Net
Assets
|
Money Market Funds |
|
|
|
|
32.8 |
% |
Investment Grade Corporate Bond Funds |
|
|
|
|
30.5 |
|
Floating Rate Funds |
|
|
|
|
23.8 |
|
Convertible Bond Funds |
|
|
|
|
21.9 |
|
High Yield Corporate Bond Funds |
|
|
|
|
16.9 |
|
U.S. Small Cap Growth Funds |
|
|
|
|
6.6 |
|
U.S. Short Term Treasury Bond Funds |
|
|
|
|
0.0 |
(a) |
Total Investments |
|
|
|
|
132.5 |
|
Other Assets and Liabilities, Net |
|
|
|
|
(32.5 |
) |
Total Net Assets |
|
|
|
|
100.0 |
% |
IQ Global Resources ETF
Net Assets ($ mil): $238.7
Industry
|
|
|
|
% of
Net
Assets
|
Water |
|
|
|
|
15.6 |
% |
Livestock |
|
|
|
|
15.2 |
|
Industrial Metals |
|
|
|
|
13.8 |
|
Grains Food Fiber |
|
|
|
|
13.4 |
|
Money Market Funds |
|
|
|
|
11.3 |
|
Coal |
|
|
|
|
9.1 |
|
Timber |
|
|
|
|
8.3 |
|
Energy |
|
|
|
|
7.3 |
|
Precious Metals |
|
|
|
|
6.8 |
|
Livestock Operations |
|
|
|
|
0.3 |
|
Crop Production and Farming |
|
|
|
|
0.3 |
|
Total Investments |
|
|
|
|
101.4 |
|
Other Assets and Liabilities, Net |
|
|
|
|
(1.4 |
) |
Total Net Assets |
|
|
|
|
100.0 |
% |
IQ Merger Arbitrage ETF
Net Assets ($ mil): $525.4
Industry
|
|
|
|
% of
Net
Assets
|
Money Market Funds |
|
|
|
|
24.6 |
% |
Industrials |
|
|
|
|
17.4 |
|
Health Care |
|
|
|
|
13.9 |
|
Information Technology |
|
|
|
|
12.7 |
|
Consumer Discretionary |
|
|
|
|
7.5 |
|
Consumer Staples |
|
|
|
|
6.8 |
|
U.S. Short Term Treasury Bond Funds |
|
|
|
|
5.7 |
|
Energy |
|
|
|
|
5.6 |
|
Real Estate |
|
|
|
|
3.3 |
|
Utilities |
|
|
|
|
3.1 |
|
Financials |
|
|
|
|
2.5 |
|
Materials |
|
|
|
|
2.3 |
|
Total Investments |
|
|
|
|
105.4 |
|
Other Assets and Liabilities, Net |
|
|
|
|
(5.4 |
) |
Total Net Assets |
|
|
|
|
100.0 |
% |
See notes to financial
statements.
48
Portfolio Summaries (continued)
April
30, 2018
IQ Real Return ETF
Net Assets ($ mil): $45.3
Industry
|
|
|
|
% of
Net
Assets
|
U.S. Short Term Treasury Bond Funds |
|
|
|
|
59.1 |
% |
U.S. Large Cap Core Funds |
|
|
|
|
10.0 |
|
U.S. Medium Term Treasury Bond Funds |
|
|
|
|
7.5 |
|
U.S. Small Cap Core Funds |
|
|
|
|
7.3 |
|
Gold Funds |
|
|
|
|
6.0 |
|
Money Market Funds |
|
|
|
|
4.7 |
|
Japanese Yen Funds |
|
|
|
|
3.8 |
|
Emerging Equity Funds |
|
|
|
|
3.7 |
|
U.S. Long Term Treasury Bond Funds |
|
|
|
|
2.5 |
|
Total Investments |
|
|
|
|
104.6 |
|
Other Assets and Liabilities, Net |
|
|
|
|
(4.6 |
) |
Total Net Assets |
|
|
|
|
100.0 |
% |
IQ Global Agribusiness Small Cap ETF
Net Assets ($ mil): $11.9
Industry
|
|
|
|
% of
Net
Assets
|
Crop Production and Farming |
|
|
|
|
47.6 |
% |
Livestock Operations |
|
|
|
|
20.8 |
|
Agricultural Chemicals |
|
|
|
|
15.1 |
|
Agricultural Machinery |
|
|
|
|
8.4 |
|
Agricultural Supplies and Logistics |
|
|
|
|
7.6 |
|
Money Market Funds |
|
|
|
|
2.3 |
|
Total Investments |
|
|
|
|
101.8 |
|
Other Assets and Liabilities, Net |
|
|
|
|
(1.8 |
) |
Total Net Assets |
|
|
|
|
100.0 |
% |
IQ U.S. Real Estate Small Cap ETF
Net Assets ($ mil): $82.1
Industry
|
|
|
|
% of
Net
Assets
|
Diversified REITs |
|
|
|
|
17.8 |
% |
Specialized REITs |
|
|
|
|
17.0 |
|
Retail REITs |
|
|
|
|
16.5 |
|
Hotel REITs |
|
|
|
|
16.4 |
|
Office REITs |
|
|
|
|
15.2 |
|
Mortgage REITs |
|
|
|
|
13.1 |
|
Money Market Funds |
|
|
|
|
4.9 |
|
Residential REITs |
|
|
|
|
4.0 |
|
Total Investments |
|
|
|
|
104.9 |
|
Other Assets and Liabilities, Net |
|
|
|
|
(4.9 |
) |
Total Net Assets |
|
|
|
|
100.0 |
% |
IQ 50 Percent Hedged FTSE International
ETF
Net Assets ($ mil): $578.5
Industry
|
|
|
|
% of
Net
Assets
|
Financials |
|
|
|
|
20.4 |
% |
Industrials |
|
|
|
|
14.5 |
|
Consumer Discretionary |
|
|
|
|
12.3 |
|
Consumer Staples |
|
|
|
|
10.3 |
|
Health Care |
|
|
|
|
9.8 |
|
Materials |
|
|
|
|
8.5 |
|
Information Technology |
|
|
|
|
8.3 |
|
Energy |
|
|
|
|
5.5 |
|
Telecommunication Services |
|
|
|
|
3.5 |
|
Real Estate |
|
|
|
|
3.2 |
|
Utilities |
|
|
|
|
3.1 |
|
Money Market Funds |
|
|
|
|
1.7 |
|
Total Investments |
|
|
|
|
101.1 |
|
Other Assets and Liabilities, Net |
|
|
|
|
(1.1 |
) |
Total Net Assets |
|
|
|
|
100.0 |
% |
IQ 50 Percent Hedged FTSE Europe ETF
Net Assets ($ mil): $168.7
Industry
|
|
|
|
% of
Net
Assets
|
Financials |
|
|
|
|
21.0 |
% |
Industrials |
|
|
|
|
13.3 |
|
Consumer Staples |
|
|
|
|
12.5 |
|
Health Care |
|
|
|
|
11.8 |
|
Consumer Discretionary |
|
|
|
|
11.1 |
|
Materials |
|
|
|
|
8.5 |
|
Energy |
|
|
|
|
7.9 |
|
Information Technology |
|
|
|
|
4.9 |
|
Utilities |
|
|
|
|
3.7 |
|
Telecommunication Services |
|
|
|
|
3.6 |
|
Money Market Funds |
|
|
|
|
3.0 |
|
Real Estate |
|
|
|
|
1.6 |
|
Total Investments |
|
|
|
|
102.9 |
|
Other Assets and Liabilities, Net |
|
|
|
|
(2.9 |
) |
Total Net Assets |
|
|
|
|
100.0 |
% |
See notes to financial
statements.
49
Portfolio Summaries (continued)
April
30, 2018
IQ 50 Percent Hedged FTSE Japan ETF
Net Assets ($ mil): $34.7
Industry
|
|
|
|
% of
Net
Assets
|
Industrials |
|
|
|
|
21.6 |
% |
Consumer Discretionary |
|
|
|
|
19.6 |
|
Financials |
|
|
|
|
12.4 |
|
Information Technology |
|
|
|
|
12.0 |
|
Consumer Staples |
|
|
|
|
8.7 |
|
Health Care |
|
|
|
|
7.3 |
|
Materials |
|
|
|
|
6.6 |
|
Telecommunication Services |
|
|
|
|
4.4 |
|
Real Estate |
|
|
|
|
3.1 |
|
Utilities |
|
|
|
|
1.9 |
|
Energy |
|
|
|
|
1.1 |
|
Money Market Fund |
|
|
|
|
0.1 |
|
Total Investments |
|
|
|
|
98.8 |
|
Other Assets and Liabilities, Net |
|
|
|
|
1.2 |
|
Total Net Assets |
|
|
|
|
100.0 |
% |
IQ Leaders GTAA Tracker ETF
Net Assets ($ mil): $49.5
Industry
|
|
|
|
% of
Net
Assets
|
International Equity Core Funds |
|
|
|
|
28.2 |
% |
U.S. Large Cap Core Funds |
|
|
|
|
25.1 |
|
Aggregate Bond Funds |
|
|
|
|
22.8 |
|
Money Market Funds |
|
|
|
|
15.8 |
|
Convertible Bond Funds |
|
|
|
|
9.0 |
|
Emerging Equity Funds |
|
|
|
|
6.1 |
|
U.S. Medium Term Treasury Bond Funds |
|
|
|
|
4.7 |
|
High Yield Corporate Bond Funds |
|
|
|
|
4.0 |
|
Total Investments |
|
|
|
|
115.7 |
|
Other Assets and Liabilities, Net |
|
|
|
|
(15.7 |
) |
Total Net Assets |
|
|
|
|
100.0 |
% |
IQ Enhanced Core Bond U.S. ETF
Net Assets ($ mil): $51.1
Industry
|
|
|
|
% of
Net
Assets
|
Investment Grade Corporate Bond Funds |
|
|
|
|
36.7 |
% |
U.S. Long Term Treasury Bond Funds |
|
|
|
|
30.1 |
|
Mortgage Backed Securities Funds |
|
|
|
|
28.6 |
|
U.S. Intermediate Term Treasury Bond Funds |
|
|
|
|
3.6 |
|
Money Market Funds |
|
|
|
|
1.2 |
|
U.S. Medium Term Treasury Bond Funds |
|
|
|
|
0.8 |
|
Total Investments |
|
|
|
|
101.0 |
|
Other Assets and Liabilities, Net |
|
|
|
|
(1.0 |
) |
Total Net Assets |
|
|
|
|
100.0 |
% |
IQ Enhanced Core Plus Bond U.S. ETF
Net Assets ($ mil): $334.0
Industry
|
|
|
|
% of
Net
Assets
|
Investment Grade Corporate Bond Funds |
|
|
|
|
38.0 |
% |
Mortgage Backed Securities Funds |
|
|
|
|
24.1 |
|
High Yield Corporate Bond Funds |
|
|
|
|
22.2 |
|
Money Market Funds |
|
|
|
|
22.2 |
|
U.S. Long Term Treasury Bond Funds |
|
|
|
|
15.5 |
|
Total Investments |
|
|
|
|
122.0 |
|
Other Assets and Liabilities, Net |
|
|
|
|
(22.0 |
) |
Total Net Assets |
|
|
|
|
100.0 |
% |
IQ S&P High Yield Low Volatility Bond
ETF
Net Assets ($ mil): $107.2
Industry
|
|
|
|
% of
Net
Assets
|
Consumer Discretionary |
|
|
|
|
12.9 |
% |
Materials |
|
|
|
|
12.4 |
|
Energy |
|
|
|
|
11.6 |
|
Health Care |
|
|
|
|
10.9 |
|
Media |
|
|
|
|
10.2 |
|
Industrials |
|
|
|
|
10.1 |
|
Telecommunication Services |
|
|
|
|
9.9 |
|
Information Technology |
|
|
|
|
8.1 |
|
Financials |
|
|
|
|
5.0 |
|
Utilities |
|
|
|
|
3.5 |
|
Money Market Fund |
|
|
|
|
1.4 |
|
Consumer Staples |
|
|
|
|
1.2 |
|
Real Estate |
|
|
|
|
1.0 |
|
Transportation |
|
|
|
|
0.5 |
|
Total Investments |
|
|
|
|
98.7 |
|
Other Assets and Liabilities, Net |
|
|
|
|
1.3 |
|
Total Net Assets |
|
|
|
|
100.0 |
% |
See notes to financial
statements.
50
Portfolio Summaries (continued)
April
30, 2018
IQ Chaikin U.S. Small Cap ETF
Net Assets ($ mil): $465.3
Industry
|
|
|
|
% of
Net
Assets
|
Industrials |
|
|
|
|
31.0 |
% |
Financials |
|
|
|
|
27.2 |
|
Consumer Services |
|
|
|
|
10.5 |
|
Consumer Goods |
|
|
|
|
9.4 |
|
Technology |
|
|
|
|
8.1 |
|
Basic Materials |
|
|
|
|
7.1 |
|
Health Care |
|
|
|
|
3.8 |
|
Oil & Gas |
|
|
|
|
2.0 |
|
Money Market Funds |
|
|
|
|
0.9 |
|
Utilities |
|
|
|
|
0.5 |
|
Telecommunications |
|
|
|
|
0.4 |
|
Total Investments |
|
|
|
|
100.9 |
|
Other Assets and Liabilities, Net |
|
|
|
|
(0.9 |
) |
Total Net Assets |
|
|
|
|
100.0 |
% |
IQ Chaikin U.S. Large Cap ETF
Net Assets ($ mil): $320.0
Industry
|
|
|
|
% of
Net
Assets
|
Financials |
|
|
|
|
40.7 |
% |
Industrials |
|
|
|
|
13.4 |
|
Technology |
|
|
|
|
9.9 |
|
Health Care |
|
|
|
|
9.3 |
|
Oil & Gas |
|
|
|
|
8.7 |
|
Consumer Goods |
|
|
|
|
7.3 |
|
Consumer Services |
|
|
|
|
4.7 |
|
Utilities |
|
|
|
|
3.1 |
|
Basic Materials |
|
|
|
|
1.5 |
|
Telecommunications |
|
|
|
|
1.4 |
|
Total Investments |
|
|
|
|
100.0 |
|
Other Assets and Liabilities, Net |
|
|
|
|
— |
(a) |
Total Net Assets |
|
|
|
|
100.0 |
% |
See notes to financial
statements.
51
Schedules
of Investments — IQ Hedge Multi-Strategy Tracker ETF
April
30, 2018
|
|
|
|
Shares
|
|
Value
|
|
|
|
|
|
|
|
|
|
|
|
Exchange Traded Note — 0.4%
|
|
|
|
|
|
|
|
|
|
|
| |
|
|
|
|
|
|
|
|
|
|
Volatility Fund — 0.4%
|
|
|
|
|
|
|
|
|
|
|
iPATH S&P 500 VIX Short-Term Futures ETN*(a)
(Cost $3,333,724) |
|
|
|
|
106,979 |
|
|
$ |
4,447,117 |
|
| |
|
|
|
|
|
|
|
|
|
|
Exchange Traded Vehicles — 1.2%
|
|
|
|
|
|
|
|
|
|
|
| |
|
|
|
|
|
|
|
|
|
|
Australian Dollar Fund — 0.3%
|
|
|
|
|
|
|
|
|
|
|
CurrencyShares Australian Dollar Trust |
|
|
|
|
43,629 |
|
|
|
3,286,573 |
|
| |
|
|
|
|
|
|
|
|
|
|
British Pound Fund — 0.2%
|
|
|
|
|
|
|
|
|
|
|
CurrencyShares British Pound Sterling Trust*(a) |
|
|
|
|
16,878 |
|
|
|
2,256,082 |
|
| |
|
|
|
|
|
|
|
|
|
|
Gold Fund — 0.4%
|
|
|
|
|
|
|
|
|
|
|
PowerShares DB Gold Fund*(a) |
|
|
|
|
98,151 |
|
|
|
4,079,155 |
|
| |
|
|
|
|
|
|
|
|
|
|
Japanese Yen Fund — 0.3%
|
|
|
|
|
|
|
|
|
|
|
CurrencyShares Japanese Yen Trust*(a) |
|
|
|
|
42,702 |
|
|
|
3,742,830 |
|
| |
|
|
|
|
|
|
|
|
|
|
Total Exchange Traded Vehicles
(Cost $13,630,593) |
|
|
|
|
|
|
|
|
13,364,640 |
|
| |
|
|
|
|
|
|
|
|
|
|
Investment Companies — 98.4%
|
|
|
|
|
|
|
|
|
|
|
| |
|
|
|
|
|
|
|
|
|
|
BRIC Equity Funds — 3.4%
|
|
|
|
|
|
|
|
|
|
|
iShares China Large-Cap ETF(a) |
|
|
|
|
406,688 |
|
|
|
19,085,868 |
|
iShares MSCI China ETF(a) |
|
|
|
|
214,001 |
|
|
|
14,305,967 |
|
SPDR S&P China ETF |
|
|
|
|
45,618 |
|
|
|
4,943,166 |
|
Total BRIC Equity Funds |
|
|
|
|
|
|
|
|
38,335,001 |
|
| |
|
|
|
|
|
|
|
|
|
|
Convertible Bond Fund — 3.3%
|
|
|
|
|
|
|
|
|
|
|
SPDR Bloomberg Barclays Convertible Securities ETF(a) |
|
|
|
|
715,996 |
|
|
|
36,830,834 |
|
| |
|
|
|
|
|
|
|
|
|
|
Emerging Markets Small Cap Equity Fund — 2.1%
|
|
|
|
|
|
|
|
|
|
|
SPDR S&P Emerging Markets SmallCap ETF(a) |
|
|
|
|
466,771 |
|
|
|
23,861,334 |
|
| |
|
|
|
|
|
|
|
|
|
|
Europe Equity Fund — 0.7%
|
|
|
|
|
|
|
|
|
|
|
Xtrackers MSCI Europe Hedged Equity ETF(a) |
|
|
|
|
287,305 |
|
|
|
8,245,654 |
|
| |
|
|
|
|
|
|
|
|
|
|
Floating Rate Funds — 5.5%
|
|
|
|
|
|
|
|
|
|
|
PowerShares Senior Loan Portfolio |
|
|
|
|
2,027,214 |
|
|
|
46,848,916 |
|
SPDR Blackstone / GSO Senior Loan ETF(a) |
|
|
|
|
309,510 |
|
|
|
14,683,154 |
|
Total Floating Rate Funds |
|
|
|
|
|
|
|
|
61,532,070 |
|
| |
|
|
|
|
|
|
|
|
|
|
High Yield Corporate Bond
Funds — 3.5%
|
|
|
|
|
|
|
|
|
|
|
iShares iBoxx $ High Yield Corporate Bond ETF(a) |
|
|
|
|
266,970 |
|
|
|
22,879,329 |
|
SPDR Bloomberg Barclays High Yield Bond ETF(a) |
|
|
|
|
403,318 |
|
|
|
14,467,017 |
|
Xtrackers USD High Yield Corporate Bond ETF |
|
|
|
|
33,470 |
|
|
|
1,657,434 |
|
Total High Yield Corporate Bond Funds |
|
|
|
|
|
|
|
|
39,003,780 |
|
| |
|
|
|
|
|
|
|
|
|
|
International Bond Funds — 3.8%
|
|
|
|
|
|
|
|
|
|
|
iShares J.P. Morgan USD Emerging Markets Bond ETF |
|
|
|
|
153,590 |
|
|
|
16,916,403 |
|
|
|
|
|
Shares
|
|
Value
|
Investment Companies (continued)
|
|
|
|
|
|
|
|
|
|
|
| |
|
|
|
|
|
|
|
|
|
|
International Bond Funds (continued)
|
|
|
|
|
|
|
|
|
|
|
PowerShares Emerging Markets Sovereign Debt Portfolio(a) |
|
|
|
|
254,452 |
|
|
$ |
6,989,796 |
|
SPDR Bloomberg Barclays Emerging Markets Local Bond ETF |
|
|
|
|
68,461 |
|
|
|
2,008,646 |
|
VanEck Vectors J.P. Morgan EM Local Currency Bond ETF |
|
|
|
|
857,649 |
|
|
|
16,063,766 |
|
|
|
|
|
|
|
|
|
|
|
|
WisdomTree Emerging Markets Local Debt Fund(a) |
|
|
|
|
16,902 |
|
|
|
636,698 |
|
Total International Bond Funds |
|
|
|
|
|
|
|
|
42,615,309 |
|
| |
|
|
|
|
|
|
|
|
|
|
International Equity Core
Fund — 2.3%
|
|
|
|
|
|
|
|
|
|
|
Xtrackers MSCI EAFE Hedged Equity ETF(a) |
|
|
|
|
831,105 |
|
|
|
26,512,250 |
|
| |
|
|
|
|
|
|
|
|
|
|
International Large Cap Growth Fund — 1.5%
|
|
|
|
|
|
|
|
|
|
|
iShares MSCI EAFE Growth ETF |
|
|
|
|
209,179 |
|
|
|
16,910,030 |
|
| |
|
|
|
|
|
|
|
|
|
|
International Small Cap Equity Funds — 7.7%
|
|
|
|
|
|
|
|
|
|
|
iShares MSCI EAFE Small-Cap ETF(a) |
|
|
|
|
859,746 |
|
|
|
56,416,532 |
|
SPDR S&P International
Small Cap ETF |
|
|
|
|
137,706 |
|
|
|
4,900,957 |
|
Vanguard FTSE All World ex-U.S. Small-Cap ETF |
|
|
|
|
215,196 |
|
|
|
25,739,594 |
|
Total International Small Cap Equity Funds |
|
|
|
|
|
|
|
|
87,057,083 |
|
| |
|
|
|
|
|
|
|
|
|
|
Investment Grade Corporate Bond Funds — 17.2%
|
|
|
|
|
|
|
|
|
|
|
iShares iBoxx $ Investment Grade Corporate Bond ETF(b) |
|
|
|
|
716,237 |
|
|
|
82,524,827 |
|
iShares U.S. Credit Bond ETF |
|
|
|
|
36,167 |
|
|
|
3,891,931 |
|
SPDR Portfolio Short Term Corporate Bond ETF(a) |
|
|
|
|
296,683 |
|
|
|
8,950,926 |
|
Vanguard Intermediate-Term Corporate Bond ETF(a) |
|
|
|
|
577,410 |
|
|
|
48,311,895 |
|
Vanguard Short-Term Corporate Bond ETF(a) |
|
|
|
|
635,944 |
|
|
|
49,705,383 |
|
Total Investment Grade Corporate Bond Funds |
|
|
|
|
|
|
|
|
193,384,962 |
|
| |
|
|
|
|
|
|
|
|
|
|
Japan Equity Fund — 0.5%
|
|
|
|
|
|
|
|
|
|
|
Xtrackers MSCI Japan Hedged Equity ETF(a) |
|
|
|
|
136,781 |
|
|
|
5,952,709 |
|
| |
|
|
|
|
|
|
|
|
|
|
Treasury Inflation-Protected Securities Funds — 0.7%
|
|
|
|
|
|
|
|
|
|
|
iShares 0-5 Year TIPS Bond ETF(a) |
|
|
|
|
18,315 |
|
|
|
1,828,386 |
|
PIMCO 1-5 Year U.S. TIPS Index Exchange-Traded Fund(a) |
|
|
|
|
19,543 |
|
|
|
1,011,937 |
|
Vanguard Short-Term Inflation-Protected Securities ETF |
|
|
|
|
102,975 |
|
|
|
5,034,448 |
|
Total Treasury Inflation-Protected Securities Funds |
|
|
|
|
|
|
|
|
7,874,771 |
|
| |
|
|
|
|
|
|
|
|
|
|
U.S. Large Cap Core Funds — 3.3%
|
|
|
|
|
|
|
|
|
|
|
Financial Select Sector SPDR Fund |
|
|
|
|
916,177 |
|
|
|
25,149,059 |
|
First Trust Dow Jones Internet Index Fund*(a) |
|
|
|
|
20,113 |
|
|
|
2,490,794 |
|
See notes to financial
statements.
52
Schedules of Investments —
IQ Hedge Multi-Strategy Tracker ETF (continued)
April
30, 2018
|
|
|
|
Shares
|
|
Value
|
Investment Companies (continued)
|
|
|
|
|
|
|
|
|
|
|
| |
|
|
|
|
|
|
|
|
|
|
U.S. Large Cap Core Funds (continued)
|
|
|
|
|
|
|
|
|
|
|
|
|
|
|
|
|
|
|
|
|
|
Health Care Select Sector
SPDR Fund |
|
|
|
|
52,461 |
|
|
$ |
4,315,442 |
|
Technology Select Sector
SPDR Fund |
|
|
|
|
76,184 |
|
|
|
4,987,004 |
|
Total U.S. Large Cap Core Funds |
|
|
|
|
|
|
|
|
36,942,299 |
|
| |
|
|
|
|
|
|
|
|
|
|
U.S. Large Cap Growth Funds — 4.0%
|
|
|
|
|
|
|
|
|
|
|
iShares Russell 1000 Growth ETF |
|
|
|
|
139,796 |
|
|
|
19,075,164 |
|
iShares S&P 500 Growth ETF(a) |
|
|
|
|
61,758 |
|
|
|
9,600,281 |
|
SPDR Portfolio S&P 500 Growth ETF(a) |
|
|
|
|
27,316 |
|
|
|
917,545 |
|
Vanguard Growth ETF(a) |
|
|
|
|
109,827 |
|
|
|
15,625,087 |
|
Total U.S. Large Cap
Growth Funds |
|
|
|
|
|
|
|
|
45,218,077 |
|
| |
|
|
|
|
|
|
|
|
|
|
U.S. Medium Term Treasury Bond Fund — 0.9%
|
|
|
|
|
|
|
|
|
|
|
iShares 3-7 Year Treasury
Bond ETF(a) |
|
|
|
|
84,268 |
|
|
|
10,071,711 |
|
| |
|
|
|
|
|
|
|
|
|
|
U.S. Intermediate Term Treasury Bond Funds — 0.4%
|
|
|
|
|
|
|
|
|
|
|
Schwab Intermediate-Term U.S. Treasury ETF(a) |
|
|
|
|
35,474 |
|
|
|
1,845,357 |
|
Vanguard Intermediate-Term Treasury ETF |
|
|
|
|
37,589 |
|
|
|
2,342,171 |
|
Total U.S. Medium Term Treasury Bond Funds |
|
|
|
|
|
|
|
|
4,187,528 |
|
| |
|
|
|
|
|
|
|
|
|
|
U.S. Multi Cap Funds — 3.7%
|
|
|
|
|
|
|
|
|
|
|
iShares Core S&P Total U.S. Stock Market ETF |
|
|
|
|
75,166 |
|
|
|
4,558,818 |
|
Schwab U.S. Broad Market ETF(a) |
|
|
|
|
63,272 |
|
|
|
4,051,306 |
|
Vanguard Total Stock Market ETF(a) |
|
|
|
|
239,031 |
|
|
|
32,587,096 |
|
Total U.S. Multi Cap Funds |
|
|
|
|
|
|
|
|
41,197,220 |
|
| |
|
|
|
|
|
|
|
|
|
|
U.S. Short Term Treasury Bond Funds — 30.2%
|
|
|
|
|
|
|
|
|
|
|
Goldman Sachs Treasury Access 0-1 Year ETF |
|
|
|
|
219,093 |
|
|
|
21,922,446 |
|
iShares Short Treasury Bond ETF(b) |
|
|
|
|
2,193,070 |
|
|
|
242,027,205 |
|
PowerShares Treasury Collateral Portfolio ETF |
|
|
|
|
92,123 |
|
|
|
9,745,010 |
|
SPDR Bloomberg Barclays 1-3 Month T-Bill ETF(a) |
|
|
|
|
715,944 |
|
|
|
65,537,514 |
|
Total U.S. Short Term Treasury Bond Funds |
|
|
|
|
|
|
|
|
339,232,175 |
|
| |
|
|
|
|
|
|
|
|
|
|
U.S. Small Cap Growth Funds — 3.7%
|
|
|
|
|
|
|
|
|
|
|
iShares Russell 2000 Growth ETF(a) |
|
|
|
|
91,250 |
|
|
|
17,427,838 |
|
iShares S&P Small-Cap 600 Growth ETF(a) |
|
|
|
|
55,663 |
|
|
|
9,710,410 |
|
|
|
|
|
Shares
|
|
Value
|
Investment Companies (continued)
|
|
|
|
|
|
|
|
|
|
|
| |
|
|
|
|
|
|
|
|
|
|
U.S. Small Cap Growth Funds (continued)
|
|
|
|
|
|
|
|
|
|
|
Vanguard Small-Cap Growth ETF(a) |
|
|
|
|
85,233 |
|
|
$ |
14,009,748 |
|
Total U.S. Small Cap
Growth Funds |
|
|
|
|
|
|
|
|
41,147,996 |
|
Total Investment Companies
|
|
|
|
|
|
|
|
|
|
|
(Cost $1,076,499,320) |
|
|
|
|
|
|
|
|
1,106,112,793 |
|
| |
|
|
|
|
|
|
|
|
|
|
Short-Term Investment — 0.1%
|
|
|
|
|
|
|
|
|
|
|
| |
|
|
|
|
|
|
|
|
|
|
Money Market Fund — 0.1%
|
|
|
|
|
|
|
|
|
|
|
Morgan Stanley Institutional Liquidity Funds Treasury Portfolio — Institutional Class,
1.58%(c)
|
|
|
|
|
|
|
|
|
|
|
(Cost $1,614,375) |
|
|
|
|
1,614,375 |
|
|
|
1,614,375 |
|
| |
|
|
|
|
|
|
|
|
|
|
Investment of Cash Collateral For Securities Loaned — 12.5%
|
|
|
|
|
|
|
|
|
|
|
| |
|
|
|
|
|
|
|
|
|
|
Money Market Fund — 12.5%
|
|
|
|
|
|
|
|
|
|
|
Dreyfus Government Cash Management Fund, Institutional Shares, 1.61%(c)
|
|
|
|
|
|
|
|
|
|
|
(Cost $140,959,766) |
|
|
|
|
140,959,766 |
|
|
|
140,959,766 |
|
| |
|
|
|
|
|
|
|
|
|
|
Total Investments — 112.6%
|
|
|
|
|
|
|
|
|
|
|
(Cost $1,236,037,778) |
|
|
|
|
|
|
|
|
1,266,498,691 |
|
| |
|
|
|
|
|
|
|
|
|
|
Other Assets and Liabilities,
Net — (12.6)% |
|
|
|
|
|
|
|
|
(142,220,563 |
) |
| |
|
|
|
|
|
|
|
|
|
|
Net Assets — 100.0% |
|
|
|
|
|
|
|
$ |
1,124,278,128 |
|
* |
|
Non-income producing securities. |
(a) |
|
All or a portion of the security was on loan. In
addition, “Other Assets and Liabilities, Net” may include pending sales that are also on loan. The aggregate market value of securities on
loan was $173,134,325; total market value of collateral held by the Fund was $177,517,591. Market value of the collateral held includes non-cash U.S.
Treasury securities collateral having a value of $36,557,825. |
(b) |
|
All or a portion of these securities have been
segregated as collateral for swap contracts. The total value of securities segregated amounted to $2,822,768. |
(c) |
|
Reflects the 1-day yield at April 30,
2018. |
See notes to financial
statements.
53
Schedules of Investments —
IQ Hedge Multi-Strategy Tracker ETF (continued)
April
30, 2018
Total Return Swap contracts
outstanding at April 30, 2018:
Total Return Benchmark
| |
Counterparties
| |
Annual
Financing
Rate
Received
(Paid) %
| |
Expiration
Date
| |
Payment
Frequency
Received/
(Paid)
| |
Notional
Amount
Long
(Short)
| |
Value/
Unrealized
Appreciation/
(Depreciation)(d)
|
| CurrencyShares Australian Dollar Trust | |
Morgan Stanley | |
| 2.20 | | |
5/21/2018 | |
Monthly | |
$ | 165,274 | | |
$ | — | |
| CurrencyShares Australian Dollar Trust | |
Bank of
America Merrill Lynch | |
| 2.38 | | |
3/29/2019 | |
Monthly | |
| 165,274 | | |
| — | |
| CurrencyShares British Pound Sterling Trust | |
Morgan Stanley | |
| 2.20 | | |
5/21/2018 | |
Monthly | |
| 113,486 | | |
| — | |
| CurrencyShares British Pound Sterling Trust | |
Bank of
America Merrill Lynch | |
| 2.38 | | |
3/29/2019 | |
Monthly | |
| 113,486 | | |
| — | |
| CurrencyShares Euro Trust | |
Morgan Stanley | |
| (1.50 | ) | |
5/21/2018 | |
Monthly | |
| (2,829,635 | ) | |
| — | |
| CurrencyShares Euro Trust | |
Bank of
America Merrill Lynch | |
| 2.38 | | |
3/29/2019 | |
Monthly | |
| (2,829,635 | ) | |
| — | |
| CurrencyShares Japanese Yen Trust | |
Morgan Stanley | |
| 2.20 | | |
5/21/2018 | |
Monthly | |
| 188,185 | | |
| — | |
| CurrencyShares Japanese Yen Trust | |
Bank of
America Merrill Lynch | |
| 2.38 | | |
3/29/2019 | |
Monthly | |
| 188,185 | | |
| — | |
| Energy Select Sector SPDR Fund | |
Morgan Stanley | |
| 1.30 | | |
5/21/2018 | |
Monthly | |
| (1,508,676 | ) | |
| — | |
| Energy Select Sector SPDR Fund | |
Bank of
America Merrill Lynch | |
| 2.38 | | |
3/29/2019 | |
Monthly | |
| (1,508,676 | ) | |
| — | |
Financial Select Sector
SPDR Fund | |
Morgan Stanley | |
| 2.20 | | |
5/21/2018 | |
Monthly | |
| 2,529,161 | | |
| — | |
| First Trust Dow Jones Internet Index Fund | |
Morgan Stanley | |
| 2.20 | | |
5/21/2018 | |
Monthly | |
| 125,202 | | |
| — | |
| First Trust Dow Jones Internet Index Fund | |
Bank of
America Merrill Lynch | |
| 2.38 | | |
3/29/2019 | |
Monthly | |
| 125,202 | | |
| — | |
| Goldman Sachs Treasury Access 0-1 Year ETF | |
Morgan Stanley | |
| 2.20 | | |
5/21/2018 | |
Monthly | |
| 1,102,361 | | |
| — | |
| Goldman Sachs Treasury Access 0-1 Year ETF | |
Bank of
America Merrill Lynch | |
| 2.38 | | |
3/29/2019 | |
Monthly | |
| 1,102,361 | | |
| — | |
| Health Care Select Sector SPDR Fund | |
Morgan Stanley | |
| 2.20 | | |
5/21/2018 | |
Monthly | |
| 434,004 | | |
| — | |
| iPath Bloomberg Commodity Index Total Return ETN | |
Morgan Stanley | |
| 1.30 | | |
5/21/2018 | |
Monthly | |
| (286,735 | ) | |
| — | |
| iPath Bloomberg Commodity Index Total Return ETN | |
Bank of
America Merrill Lynch | |
| 2.38 | | |
3/29/2019 | |
Monthly | |
| (286,735 | ) | |
| — | |
| iPATH S&P 500 VIX Short-Term Futures ETN | |
Morgan Stanley | |
| 2.20 | | |
5/21/2018 | |
Monthly | |
| 223,605 | | |
| — | |
| iPATH S&P 500 VIX Short-Term Futures ETN | |
Bank of
America Merrill Lynch | |
| 2.38 | | |
3/29/2019 | |
Monthly | |
| 223,605 | | |
| — | |
| iShares 0-5 Year TIPS Bond ETF | |
Morgan Stanley | |
| 2.20 | | |
5/21/2018 | |
Monthly | |
| 91,943 | | |
| — | |
| iShares 0-5 Year TIPS Bond ETF | |
Bank of
America Merrill Lynch | |
| 2.38 | | |
3/29/2019 | |
Monthly | |
| 91,943 | | |
| — | |
iShares 3-7 Year Treasury
Bond ETF | |
Morgan Stanley | |
| 2.20 | | |
5/21/2018 | |
Monthly | |
| 506,406 | | |
| — | |
iShares 3-7 Year Treasury
Bond ETF | |
Bank of
America Merrill Lynch | |
| 2.38 | | |
3/29/2019 | |
Monthly | |
| 506,406 | | |
| — | |
| iShares China Large-Cap ETF | |
Morgan Stanley | |
| 2.20 | | |
5/21/2018 | |
Monthly | |
| 1,919,437 | | |
| — | |
| iShares Core MSCI EAFE ETF | |
Morgan Stanley | |
| 1.30 | | |
5/21/2018 | |
Monthly | |
| (755,231 | ) | |
| — | |
| iShares Core MSCI EAFE ETF | |
Bank of
America Merrill Lynch | |
| 2.38 | | |
3/29/2019 | |
Monthly | |
| (755,231 | ) | |
| — | |
| iShares Core MSCI Emerging Markets ETF | |
Morgan Stanley | |
| 1.30 | | |
5/21/2018 | |
Monthly | |
| (1,929,432 | ) | |
| — | |
| iShares Core MSCI Emerging Markets ETF | |
Bank of
America Merrill Lynch | |
| 2.38 | | |
3/29/2019 | |
Monthly | |
| (1,929,432 | ) | |
| — | |
| iShares Core S&P Total U.S. Stock Market ETF | |
Morgan Stanley | |
| 2.20 | | |
5/21/2018 | |
Monthly | |
| 229,196 | | |
| — | |
| iShares Core S&P Total U.S. Stock Market ETF | |
Bank of
America Merrill Lynch | |
| 2.38 | | |
3/29/2019 | |
Monthly | |
| 229,196 | | |
| — | |
| iShares Edge MSCI Min Vol Emerging Markets ETF | |
Morgan Stanley | |
| 1.30 | | |
5/21/2018 | |
Monthly | |
| (2,635,073 | ) | |
| — | |
| iShares Edge MSCI Min Vol Emerging Markets ETF | |
Bank of
America Merrill Lynch | |
| 2.38 | | |
3/29/2019 | |
Monthly | |
| (2,635,073 | ) | |
| — | |
iShares Edge MSCI Min
Vol USA ETF | |
Morgan Stanley | |
| 1.00 | | |
5/21/2018 | |
Monthly | |
| (3,167,831 | ) | |
| — | |
See notes to financial
statements.
54
Schedules of Investments —
IQ Hedge Multi-Strategy Tracker ETF (continued)
April 30, 2018
Total Return Swap contracts
outstanding at April 30, 2018 (continued):
Total Return Benchmark
| |
Counterparties
| |
Annual
Financing
Rate
Received
(Paid) %
| |
Expiration
Date
| |
Payment
Frequency
Received/
(Paid)
| |
Notional
Amount
Long
(Short)
| |
Value/
Unrealized
Appreciation/
(Depreciation)(d)
|
iShares Edge MSCI Min
Vol USA ETF | |
Bank of
America Merrill Lynch | |
| 2.38 | | |
3/29/2019 | |
Monthly | |
$ | (3,167,831 | ) | |
$ | — | |
| iShares Europe ETF | |
Morgan Stanley | |
| (2.50 | ) | |
5/21/2018 | |
Monthly | |
| (216,342 | ) | |
| — | |
| iShares Europe ETF | |
Bank of
America Merrill Lynch | |
| 2.38 | | |
3/29/2019 | |
Monthly | |
| (216,342 | ) | |
| — | |
| iShares Floating Rate Bond ETF | |
Morgan Stanley | |
| 1.30 | | |
5/21/2018 | |
Monthly | |
| (4,708,946 | ) | |
| — | |
| iShares Floating Rate Bond ETF | |
Bank of
America Merrill Lynch | |
| 2.38 | | |
3/29/2019 | |
Monthly | |
| (4,708,946 | ) | |
| — | |
| iShares iBoxx $ High Yield Corporate Bond ETF | |
Morgan Stanley | |
| 2.20 | | |
5/21/2018 | |
Monthly | |
| 1,150,437 | | |
| — | |
| iShares iBoxx $ High Yield Corporate Bond ETF | |
Bank of
America Merrill Lynch | |
| 2.38 | | |
3/29/2019 | |
Monthly | |
| 1,150,437 | | |
| — | |
| iShares iBoxx $ Investment Grade Corporate Bond ETF | |
Morgan Stanley | |
| 2.20 | | |
5/21/2018 | |
Monthly | |
| 4,149,648 | | |
| — | |
| iShares iBoxx $ Investment Grade Corporate Bond ETF | |
Bank of
America Merrill Lynch | |
| 2.38 | | |
3/29/2019 | |
Monthly | |
| 4,149,648 | | |
| — | |
| iShares J.P. Morgan USD Emerging Markets Bond ETF | |
Morgan Stanley | |
| 2.20 | | |
5/21/2018 | |
Monthly | |
| 850,611 | | |
| — | |
| iShares J.P. Morgan USD Emerging Markets Bond ETF | |
Bank of
America Merrill Lynch | |
| 2.38 | | |
3/29/2019 | |
Monthly | |
| 850,611 | | |
| — | |
| iShares MBS ETF | |
Morgan Stanley | |
| 1.30 | | |
5/21/2018 | |
Monthly | |
| (3,289,116 | ) | |
| — | |
| iShares MBS ETF | |
Bank of
America Merrill Lynch | |
| 2.38 | | |
3/29/2019 | |
Monthly | |
| (3,289,116 | ) | |
| — | |
| iShares MSCI All Country Asia ex Japan ETF | |
Morgan Stanley | |
| 1.30 | | |
5/21/2018 | |
Monthly | |
| (738,558 | ) | |
| — | |
| iShares MSCI All Country Asia ex Japan ETF | |
Bank of
America Merrill Lynch | |
| 2.38 | | |
3/29/2019 | |
Monthly | |
| (738,558 | ) | |
| — | |
| iShares MSCI China ETF | |
Morgan Stanley | |
| 2.20 | | |
5/21/2018 | |
Monthly | |
| 1,438,746 | | |
| — | |
| iShares MSCI EAFE Growth ETF | |
Morgan Stanley | |
| 2.20 | | |
5/21/2018 | |
Monthly | |
| 850,275 | | |
| — | |
| iShares MSCI EAFE Growth ETF | |
Bank of
America Merrill Lynch | |
| 2.38 | | |
3/29/2019 | |
Monthly | |
| 850,275 | | |
| — | |
| iShares MSCI EAFE Small-Cap ETF | |
Morgan Stanley | |
| 2.20 | | |
5/21/2018 | |
Monthly | |
| 2,836,818 | | |
| — | |
| iShares MSCI EAFE Small-Cap ETF | |
Bank of
America Merrill Lynch | |
| 2.38 | | |
3/29/2019 | |
Monthly | |
| 2,836,818 | | |
| — | |
| iShares MSCI Eurozone ETF | |
Morgan Stanley | |
| 1.30 | | |
5/21/2018 | |
Monthly | |
| (1,110,555 | ) | |
| — | |
| iShares MSCI Eurozone ETF | |
Bank of
America Merrill Lynch | |
| 2.38 | | |
3/29/2019 | |
Monthly | |
| (1,110,555 | ) | |
| — | |
| iShares MSCI Japan ETF | |
Morgan Stanley | |
| 1.30 | | |
5/21/2018 | |
Monthly | |
| (1,424,070 | ) | |
| — | |
| iShares MSCI Japan ETF | |
Bank of
America Merrill Lynch | |
| 2.38 | | |
3/29/2019 | |
Monthly | |
| (1,424,070 | ) | |
| — | |
iShares MSCI Pacific ex
Japan ETF | |
Morgan Stanley | |
| 1.30 | | |
5/21/2018 | |
Monthly | |
| (397,117 | ) | |
| — | |
iShares MSCI Pacific ex
Japan ETF | |
Bank of
America Merrill Lynch | |
| 2.38 | | |
3/29/2019 | |
Monthly | |
| (397,117 | ) | |
| — | |
| iShares Russell 1000 Growth ETF | |
Morgan Stanley | |
| 2.20 | | |
5/21/2018 | |
Monthly | |
| 959,107 | | |
| — | |
| iShares Russell 1000 Growth ETF | |
Bank of
America Merrill Lynch | |
| 2.38 | | |
3/29/2019 | |
Monthly | |
| 959,107 | | |
| — | |
| iShares Russell 1000 Value ETF | |
Morgan Stanley | |
| 1.30 | | |
5/21/2018 | |
Monthly | |
| (541,771 | ) | |
| — | |
| iShares Russell 1000 Value ETF | |
Bank of
America Merrill Lynch | |
| 2.38 | | |
3/29/2019 | |
Monthly | |
| (539,605 | ) | |
| — | |
| iShares Russell 2000 ETF | |
Morgan Stanley | |
| 1.30 | | |
5/21/2018 | |
Monthly | |
| (1,564,324 | ) | |
| — | |
| iShares Russell 2000 ETF | |
Bank of
America Merrill Lynch | |
| 2.38 | | |
3/29/2019 | |
Monthly | |
| (1,564,324 | ) | |
| — | |
| iShares Russell 2000 Growth ETF | |
Morgan Stanley | |
| 2.20 | | |
5/21/2018 | |
Monthly | |
| 876,453 | | |
| — | |
| iShares Russell 2000 Growth ETF | |
Bank of
America Merrill Lynch | |
| 2.38 | | |
3/29/2019 | |
Monthly | |
| 876,453 | | |
| — | |
| iShares Russell 2000 Value ETF | |
Morgan Stanley | |
| 1.30 | | |
5/21/2018 | |
Monthly | |
| (1,583,651 | ) | |
| — | |
| iShares Russell 2000 Value ETF | |
Bank of
America Merrill Lynch | |
| 2.38 | | |
3/29/2019 | |
Monthly | |
| (1,583,651 | ) | |
| — | |
| iShares S&P 500 Growth ETF | |
Morgan Stanley | |
| 2.20 | | |
5/21/2018 | |
Monthly | |
| 482,828 | | |
| — | |
| iShares S&P 500 Growth ETF | |
Bank of
America Merrill Lynch | |
| 2.38 | | |
3/29/2019 | |
Monthly | |
| 482,828 | | |
| — | |
| iShares S&P 500 Value ETF | |
Morgan Stanley | |
| 0.50 | | |
5/21/2018 | |
Monthly | |
| (219,011 | ) | |
| — | |
| iShares S&P 500 Value ETF | |
Bank of
America Merrill Lynch | |
| 2.38 | | |
3/29/2019 | |
Monthly | |
| (219,011 | ) | |
| — | |
| iShares S&P Small-Cap 600 Growth ETF | |
Morgan Stanley | |
| 2.20 | | |
5/21/2018 | |
Monthly | |
| 488,286 | | |
| — | |
| iShares S&P Small-Cap 600 Growth ETF | |
Bank of
America Merrill Lynch | |
| 2.38 | | |
3/29/2019 | |
Monthly | |
| 488,286 | | |
| — | |
| iShares S&P Small-Cap 600 Value ETF | |
Morgan Stanley | |
| 1.30 | | |
5/21/2018 | |
Monthly | |
| (924,377 | ) | |
| — | |
| iShares S&P Small-Cap 600 Value ETF | |
Bank of
America Merrill Lynch | |
| 2.38 | | |
3/29/2019 | |
Monthly | |
| (924,377 | ) | |
| — | |
See notes to financial
statements.
55
Schedules of Investments —
IQ Hedge Multi-Strategy Tracker ETF (continued)
April
30, 2018
Total Return Swap contracts
outstanding at April 30, 2018 (continued):
Total Return Benchmark
| |
Counterparties
| |
Annual
Financing
Rate
Received
(Paid) %
| |
Expiration
Date
| |
Payment
Frequency
Received/
(Paid)
| |
Notional
Amount
Long
(Short)
| |
Value/
Unrealized
Appreciation/
(Depreciation)(d)
|
| iShares Short Treasury Bond ETF | |
Morgan Stanley | |
| 2.20 | | |
5/21/2018 | |
Monthly | |
$ | 12,169,949 | | |
$ | — | |
| iShares Short Treasury Bond ETF | |
Bank of
America Merrill Lynch | |
| 2.38 | | |
3/29/2019 | |
Monthly | |
| 12,169,949 | | |
| — | |
| iShares Silver Trust | |
Morgan Stanley | |
| 0.75 | | |
5/21/2018 | |
Monthly | |
| (172,241 | ) | |
| — | |
| iShares Silver Trust | |
Bank of
America Merrill Lynch | |
| 2.38 | | |
3/29/2019 | |
Monthly | |
| (172,241 | ) | |
| — | |
| iShares U.S. Credit Bond ETF | |
Morgan Stanley | |
| 2.20 | | |
5/21/2018 | |
Monthly | |
| 195,743 | | |
| — | |
| iShares U.S. Credit Bond ETF | |
Bank of
America Merrill Lynch | |
| 2.38 | | |
3/29/2019 | |
Monthly | |
| 195,743 | | |
| — | |
| iShares U.S. Preferred Stock ETF | |
Morgan Stanley | |
| 0.35 | | |
5/21/2018 | |
Monthly | |
| (805,275 | ) | |
| — | |
| iShares U.S. Preferred Stock ETF | |
Bank of
America Merrill Lynch | |
| 2.38 | | |
3/29/2019 | |
Monthly | |
| (805,275 | ) | |
| — | |
| iShares U.S. Real Estate ETF | |
Morgan Stanley | |
| 0.88 | | |
5/21/2018 | |
Monthly | |
| (142,128 | ) | |
| — | |
| iShares U.S. Real Estate ETF | |
Bank of
America Merrill Lynch | |
| 2.38 | | |
3/29/2019 | |
Monthly | |
| (142,128 | ) | |
| — | |
Materials Select Sector
SPDR Fund | |
Morgan Stanley | |
| 1.30 | | |
5/21/2018 | |
Monthly | |
| (395,820 | ) | |
| — | |
Materials Select Sector
SPDR Fund | |
Bank of
America Merrill Lynch | |
| 2.38 | | |
3/29/2019 | |
Monthly | |
| (395,820 | ) | |
| — | |
| PIMCO 1-5 Year U.S. TIPS Index Exchange-Traded Fund | |
Morgan Stanley | |
| 2.20 | | |
5/21/2018 | |
Monthly | |
| 50,900 | | |
| — | |
| PIMCO 1-5 Year U.S. TIPS Index Exchange-Traded Fund | |
Bank of
America Merrill Lynch | |
| 2.38 | | |
3/29/2019 | |
Monthly | |
| 50,900 | | |
| — | |
| PowerShares DB Commodity Index Tracking Fund | |
Morgan Stanley | |
| 1.30 | | |
5/21/2018 | |
Monthly | |
| (719,082 | ) | |
| — | |
| PowerShares DB Commodity Index Tracking Fund | |
Bank of
America Merrill Lynch | |
| 2.38 | | |
3/29/2019 | |
Monthly | |
| (719,082 | ) | |
| — | |
| PowerShares DB Gold Fund | |
Morgan Stanley | |
| 2.20 | | |
5/21/2018 | |
Monthly | |
| 205,099 | | |
| — | |
| PowerShares DB Gold Fund | |
Bank of
America Merrill Lynch | |
| 2.38 | | |
3/29/2019 | |
Monthly | |
| 205,099 | | |
| — | |
| PowerShares DB U.S. Dollar Index Bullish Fund | |
Morgan Stanley | |
| (1.00 | ) | |
5/21/2018 | |
Monthly | |
| (4,803,245 | ) | |
| — | |
| PowerShares DB U.S. Dollar Index Bullish Fund | |
Bank of
America Merrill Lynch | |
| 2.38 | | |
3/29/2019 | |
Monthly | |
| (4,803,245 | ) | |
| — | |
| PowerShares Emerging Markets Sovereign Debt Portfolio | |
Morgan Stanley | |
| 2.20 | | |
5/21/2018 | |
Monthly | |
| 351,479 | | |
| — | |
| PowerShares Emerging Markets Sovereign Debt Portfolio | |
Bank of
America Merrill Lynch | |
| 2.38 | | |
3/29/2019 | |
Monthly | |
| 351,479 | | |
| — | |
| PowerShares KBW Bank Portfolio | |
Morgan Stanley | |
| 1.30 | | |
5/21/2018 | |
Monthly | |
| (245,221 | ) | |
| — | |
| PowerShares KBW Bank Portfolio | |
Bank of
America Merrill Lynch | |
| 2.38 | | |
3/29/2019 | |
Monthly | |
| (245,221 | ) | |
| — | |
| PowerShares Preferred Portfolio | |
Morgan Stanley | |
| (0.25 | ) | |
5/21/2018 | |
Monthly | |
| (248,716 | ) | |
| — | |
| PowerShares Preferred Portfolio | |
Bank of
America Merrill Lynch | |
| 2.38 | | |
3/29/2019 | |
Monthly | |
| (248,716 | ) | |
| — | |
| PowerShares S&P 500 Low Volatility Portfolio | |
Morgan Stanley | |
| 1.30 | | |
5/21/2018 | |
Monthly | |
| (1,526,476 | ) | |
| — | |
| PowerShares S&P 500 Low Volatility Portfolio | |
Bank of
America Merrill Lynch | |
| 2.38 | | |
3/29/2019 | |
Monthly | |
| (1,526,476 | ) | |
| — | |
PowerShares Senior Loan
Portfolio | |
Morgan Stanley | |
| 2.20 | | |
5/21/2018 | |
Monthly | |
| 2,355,741 | | |
| — | |
PowerShares Senior Loan
Portfolio | |
Bank of
America Merrill Lynch | |
| 2.38 | | |
3/29/2019 | |
Monthly | |
| 2,355,741 | | |
| — | |
| PowerShares Treasury Collateral Portfolio ETF | |
Morgan Stanley | |
| 2.20 | | |
5/21/2018 | |
Monthly | |
| 489,985 | | |
| — | |
| PowerShares Treasury Collateral Portfolio ETF | |
Bank of
America Merrill Lynch | |
| 2.38 | | |
3/29/2019 | |
Monthly | |
| 489,985 | | |
| — | |
| Schwab Intermediate-Term U.S. Treasury ETF | |
Morgan Stanley | |
| 2.20 | | |
5/21/2018 | |
Monthly | |
| 92,804 | | |
| — | |
| Schwab Intermediate-Term U.S. Treasury ETF | |
Bank of
America Merrill Lynch | |
| 2.38 | | |
3/29/2019 | |
Monthly | |
| 92,804 | | |
| — | |
| Schwab U.S. Broad Market ETF | |
Morgan Stanley | |
| 2.20 | | |
5/21/2018 | |
Monthly | |
| 203,743 | | |
| — | |
| Schwab U.S. Broad Market ETF | |
Bank of
America Merrill Lynch | |
| 2.38 | | |
3/29/2019 | |
Monthly | |
| 203,743 | | |
| — | |
| Schwab U.S. Small-Cap ETF | |
Morgan Stanley | |
| (2.45 | ) | |
5/21/2018 | |
Monthly | |
| (259,292 | ) | |
| — | |
| Schwab U.S. Small-Cap ETF | |
Bank of
America Merrill Lynch | |
| 2.38 | | |
3/29/2019 | |
Monthly | |
| (259,292 | ) | |
| — | |
| SPDR Blackstone / GSO Senior Loan ETF | |
Morgan Stanley | |
| 2.20 | | |
5/21/2018 | |
Monthly | |
| 738,309 | | |
| — | |
| SPDR Blackstone / GSO Senior Loan ETF | |
Bank of
America Merrill Lynch | |
| 2.38 | | |
3/29/2019 | |
Monthly | |
| 738,309 | | |
| — | |
See notes to financial
statements.
56
Schedules of Investments —
IQ Hedge Multi-Strategy Tracker ETF (continued)
April
30, 2018
Total Return Swap contracts
outstanding at April 30, 2018 (continued):
Total Return Benchmark
| |
Counterparties
| |
Annual
Financing
Rate
Received
(Paid) %
| |
Expiration
Date
| |
Payment
Frequency
Received/
(Paid)
| |
Notional
Amount
Long
(Short)
| |
Value/
Unrealized
Appreciation/
(Depreciation)(d)
|
| SPDR Bloomberg Barclays 1-3 Month T-Bill ETF | |
Morgan Stanley | |
| 2.20 | | |
5/21/2018 | |
Monthly | |
$ | 3,295,440 | | |
$ | — | |
| SPDR Bloomberg Barclays 1-3 Month T-Bill ETF | |
Bank of
America Merrill Lynch | |
| 2.38 | | |
3/29/2019 | |
Monthly | |
| 3,295,440 | | |
| — | |
| SPDR Bloomberg Barclays Convertible Securities ETF | |
Morgan Stanley | |
| 2.20 | | |
5/21/2018 | |
Monthly | |
| 1,851,994 | | |
| — | |
| SPDR Bloomberg Barclays Convertible Securities ETF | |
Bank of
America Merrill Lynch | |
| 2.38 | | |
3/29/2019 | |
Monthly | |
| 1,851,994 | | |
| — | |
| SPDR Bloomberg Barclays Emerging Markets Local Bond ETF | |
Morgan Stanley | |
| 2.20 | | |
5/21/2018 | |
Monthly | |
| 101,018 | | |
| — | |
| SPDR Bloomberg Barclays Emerging Markets Local Bond ETF | |
Bank of
America Merrill Lynch | |
| 2.38 | | |
3/29/2019 | |
Monthly | |
| 101,018 | | |
| — | |
| SPDR Bloomberg Barclays High Yield Bond ETF | |
Morgan Stanley | |
| 2.20 | | |
5/21/2018 | |
Monthly | |
| 727,444 | | |
| — | |
| SPDR Bloomberg Barclays High Yield Bond ETF | |
Bank of
America Merrill Lynch | |
| 2.38 | | |
3/29/2019 | |
Monthly | |
| 727,444 | | |
| — | |
| SPDR Bloomberg Barclays Short Term High Yield Bond ETF | |
Morgan Stanley | |
| 1.30 | | |
5/21/2018 | |
Monthly | |
| (874,725 | ) | |
| — | |
| SPDR Bloomberg Barclays Short Term High Yield Bond ETF | |
Bank of
America Merrill Lynch | |
| 2.38 | | |
3/29/2019 | |
Monthly | |
| (874,725 | ) | |
| — | |
SPDR Dow Jones International
Real Estate ETF | |
Morgan Stanley | |
| 0.10 | | |
5/21/2018 | |
Monthly | |
| (2,662,485 | ) | |
| — | |
SPDR Dow Jones International
Real Estate ETF | |
Bank of
America Merrill Lynch | |
| 2.38 | | |
3/29/2019 | |
Monthly | |
| (2,662,485 | ) | |
| — | |
| SPDR Dow Jones REIT ETF | |
Morgan Stanley | |
| (0.25 | ) | |
5/21/2018 | |
Monthly | |
| (91,060 | ) | |
| — | |
| SPDR Dow Jones REIT ETF | |
Bank of
America Merrill Lynch | |
| 2.38 | | |
3/29/2019 | |
Monthly | |
| (91,060 | ) | |
| — | |
SPDR Portfolio S&P 500
Growth ETF | |
Morgan Stanley | |
| 2.20 | | |
5/21/2018 | |
Monthly | |
| 46,153 | | |
| — | |
SPDR Portfolio S&P 500
Growth ETF | |
Bank of
America Merrill Lynch | |
| 2.38 | | |
3/29/2019 | |
Monthly | |
| 46,153 | | |
| — | |
| SPDR Portfolio Short Term Corporate Bond ETF | |
Morgan Stanley | |
| 2.20 | | |
5/21/2018 | |
Monthly | |
| 450,076 | | |
| — | |
| SPDR Portfolio Short Term Corporate Bond ETF | |
Bank of
America Merrill Lynch | |
| 2.38 | | |
3/29/2019 | |
Monthly | |
| 450,076 | | |
| — | |
| SPDR S&P Bank ETF | |
Morgan Stanley | |
| 1.00 | | |
5/21/2018 | |
Monthly | |
| (875,654 | ) | |
| — | |
| SPDR S&P Bank ETF | |
Bank of
America Merrill Lynch | |
| 2.38 | | |
3/29/2019 | |
Monthly | |
| (875,654 | ) | |
| — | |
| SPDR S&P China ETF | |
Morgan Stanley | |
| 2.20 | | |
5/21/2018 | |
Monthly | |
| 497,047 | | |
| — | |
| SPDR S&P Emerging Markets SmallCap ETF | |
Morgan Stanley | |
| 2.20 | | |
5/21/2018 | |
Monthly | |
| 1,199,838 | | |
| — | |
| SPDR S&P Emerging Markets SmallCap ETF | |
Bank of
America Merrill Lynch | |
| 2.38 | | |
3/29/2019 | |
Monthly | |
| 1,199,838 | | |
| — | |
| SPDR S&P International Small Cap ETF | |
Morgan Stanley | |
| 2.20 | | |
5/21/2018 | |
Monthly | |
| 246,425 | | |
| — | |
| SPDR S&P International Small Cap ETF | |
Bank of
America Merrill Lynch | |
| 2.38 | | |
3/29/2019 | |
Monthly | |
| 246,425 | | |
| — | |
| Technology Select Sector SPDR Fund | |
Morgan Stanley | |
| 2.20 | | |
5/21/2018 | |
Monthly | |
| 501,555 | | |
| — | |
| VanEck Vectors High-Yield Municipal Index ETF | |
Morgan Stanley | |
| (0.25 | ) | |
5/21/2018 | |
Monthly | |
| (1,118,662 | ) | |
| — | |
| VanEck Vectors High-Yield Municipal Index ETF | |
Bank of
America Merrill Lynch | |
| 2.38 | | |
3/29/2019 | |
Monthly | |
| (1,118,662 | ) | |
| — | |
| VanEck Vectors J.P. Morgan EM Local Currency Bond ETF | |
Morgan Stanley | |
| 2.20 | | |
5/21/2018 | |
Monthly | |
| 807,750 | | |
| — | |
| VanEck Vectors J.P. Morgan EM Local Currency Bond ETF | |
Bank of
America Merrill Lynch | |
| 2.38 | | |
3/29/2019 | |
Monthly | |
| 807,750 | | |
| — | |
| Vanguard FTSE All World ex-U.S. Small-Cap ETF | |
Morgan Stanley | |
| 2.20 | | |
5/21/2018 | |
Monthly | |
| 1,294,300 | | |
| — | |
See notes to financial
statements.
57
Schedules of Investments —
IQ Hedge Multi-Strategy Tracker ETF (continued)
April
30, 2018
Total Return Swap contracts
outstanding at April 30, 2018 (continued):
Total Return Benchmark
| |
Counterparties
| |
Annual
Financing
Rate
Received
(Paid) %
| |
Expiration
Date
| |
Payment
Frequency
Received/
(Paid)
| |
Notional
Amount
Long
(Short)
| |
Value/
Unrealized
Appreciation/
(Depreciation)(d)
|
| Vanguard FTSE All World ex-U.S. Small-Cap ETF | |
Bank of America Merrill Lynch | |
| 2.38 | | |
3/29/2019 | |
Monthly | |
$ | 1,294,300 | | |
$ | — | |
| Vanguard FTSE Developed Markets ETF | |
Morgan Stanley | |
| 1.30 | | |
5/21/2018 | |
Monthly | |
| (950,779 | ) | |
| — | |
| Vanguard FTSE Developed Markets ETF | |
Bank of
America Merrill Lynch | |
| 2.38 | | |
3/29/2019 | |
Monthly | |
| (950,779 | ) | |
| — | |
| Vanguard FTSE Emerging Markets ETF | |
Morgan Stanley | |
| 1.30 | | |
5/21/2018 | |
Monthly | |
| (2,642,451 | ) | |
| — | |
| Vanguard FTSE Emerging Markets ETF | |
Bank of
America Merrill Lynch | |
| 2.38 | | |
3/29/2019 | |
Monthly | |
| (2,642,451 | ) | |
| — | |
| Vanguard FTSE Europe ETF | |
Morgan Stanley | |
| 1.30 | | |
5/21/2018 | |
Monthly | |
| (1,468,784 | ) | |
| — | |
| Vanguard FTSE Europe ETF | |
Bank of
America Merrill Lynch | |
| 2.38 | | |
3/29/2019 | |
Monthly | |
| (1,468,784 | ) | |
| — | |
| Vanguard FTSE Pacific ETF | |
Morgan Stanley | |
| 0.50 | | |
5/21/2018 | |
Monthly | |
| (736,978 | ) | |
| — | |
| Vanguard FTSE Pacific ETF | |
Bank of
America Merrill Lynch | |
| 2.38 | | |
3/29/2019 | |
Monthly | |
| (736,978 | ) | |
| — | |
| Vanguard Growth ETF | |
Morgan Stanley | |
| 2.20 | | |
5/21/2018 | |
Monthly | |
| 785,757 | | |
| — | |
| Vanguard Growth ETF | |
Bank of
America Merrill Lynch | |
| 2.38 | | |
3/29/2019 | |
Monthly | |
| 785,757 | | |
| — | |
| Vanguard Intermediate-Term Corporate Bond ETF | |
Morgan Stanley | |
| 2.20 | | |
5/21/2018 | |
Monthly | |
| 2,429,275 | | |
| — | |
| Vanguard Intermediate-Term Corporate Bond ETF | |
Bank of
America Merrill Lynch | |
| 2.38 | | |
3/29/2019 | |
Monthly | |
| 2,429,275 | | |
| — | |
| Vanguard Intermediate-Term Treasury ETF | |
Morgan Stanley | |
| 2.20 | | |
5/21/2018 | |
Monthly | |
| 117,785 | | |
| — | |
| Vanguard Intermediate-Term Treasury ETF | |
Bank of
America Merrill Lynch | |
| 2.38 | | |
3/29/2019 | |
Monthly | |
| 117,766 | | |
| — | |
| Vanguard Mortgage-Backed Securities ETF | |
Morgan Stanley | |
| 1.30 | | |
5/21/2018 | |
Monthly | |
| (1,374,079 | ) | |
| — | |
| Vanguard Mortgage-Backed Securities ETF | |
Bank of
America Merrill Lynch | |
| 2.38 | | |
3/29/2019 | |
Monthly | |
| (1,374,079 | ) | |
| — | |
| Vanguard Real Estate ETF | |
Morgan Stanley | |
| 1.15 | | |
5/21/2018 | |
Monthly | |
| (1,126,056 | ) | |
| — | |
| Vanguard Real Estate ETF | |
Bank of
America Merrill Lynch | |
| 2.38 | | |
3/29/2019 | |
Monthly | |
| (1,126,056 | ) | |
| — | |
| Vanguard Short-Term Corporate Bond ETF | |
Morgan Stanley | |
| 2.20 | | |
5/21/2018 | |
Monthly | |
| 2,499,322 | | |
| — | |
| Vanguard Short-Term Corporate Bond ETF | |
Bank of
America Merrill Lynch | |
| 2.38 | | |
3/29/2019 | |
Monthly | |
| 2,499,322 | | |
| — | |
| Vanguard Short-Term Inflation-Protected Securities ETF | |
Morgan Stanley | |
| 2.20 | | |
5/21/2018 | |
Monthly | |
| 253,152 | | |
| — | |
| Vanguard Short-Term Inflation-Protected Securities ETF | |
Bank of
America Merrill Lynch | |
| 2.38 | | |
3/29/2019 | |
Monthly | |
| 253,152 | | |
| — | |
| Vanguard Small-Cap ETF | |
Morgan Stanley | |
| 1.30 | | |
5/21/2018 | |
Monthly | |
| (807,251 | ) | |
| — | |
| Vanguard Small-Cap ETF | |
Bank of
America Merrill Lynch | |
| 2.38 | | |
3/29/2019 | |
Monthly | |
| (807,251 | ) | |
| — | |
| Vanguard Small-Cap Growth ETF | |
Morgan Stanley | |
| 2.20 | | |
5/21/2018 | |
Monthly | |
| 704,490 | | |
| — | |
| Vanguard Small-Cap Growth ETF | |
Bank of
America Merrill Lynch | |
| 2.38 | | |
3/29/2019 | |
Monthly | |
| 704,490 | | |
| — | |
| Vanguard Small-Cap Value ETF | |
Morgan Stanley | |
| 1.30 | | |
5/21/2018 | |
Monthly | |
| (2,245,363 | ) | |
| — | |
| Vanguard Small-Cap Value ETF | |
Bank of
America Merrill Lynch | |
| 2.38 | | |
3/29/2019 | |
Monthly | |
| (2,245,363 | ) | |
| — | |
Vanguard Total Stock
Market ETF | |
Morgan Stanley | |
| 2.20 | | |
5/21/2018 | |
Monthly | |
| 1,638,550 | | |
| — | |
| Vanguard Total Stock Market ETF | |
Bank of
America Merrill Lynch | |
| 2.38 | | |
3/29/2019 | |
Monthly | |
| 1,638,550 | | |
| — | |
| Vanguard Value ETF | |
Morgan Stanley | |
| 1.30 | | |
5/21/2018 | |
Monthly | |
| (535,353 | ) | |
| — | |
| Vanguard Value ETF | |
Bank of
America Merrill Lynch | |
| 2.38 | | |
3/29/2019 | |
Monthly | |
| (535,353 | ) | |
| — | |
| WisdomTree Emerging Markets Local Debt Fund | |
Morgan Stanley | |
| 2.20 | | |
5/21/2018 | |
Monthly | |
| 32,020 | | |
| — | |
| WisdomTree Emerging Markets Local Debt Fund | |
Bank of
America Merrill Lynch | |
| 2.38 | | |
3/29/2019 | |
Monthly | |
| 32,020 | | |
| — | |
| Xtrackers MSCI EAFE Hedged Equity ETF | |
Morgan Stanley | |
| 2.20 | | |
5/21/2018 | |
Monthly | |
| 1,333,133 | | |
| — | |
| Xtrackers MSCI EAFE Hedged Equity ETF | |
Bank of
America Merrill Lynch | |
| 2.38 | | |
3/29/2019 | |
Monthly | |
| 1,333,133 | | |
| — | |
| Xtrackers MSCI Europe Hedged Equity ETF | |
Morgan Stanley | |
| 2.20 | | |
5/21/2018 | |
Monthly | |
| 414,629 | | |
| — | |
See notes to financial
statements.
58
Schedules of Investments —
IQ Hedge Multi-Strategy Tracker ETF (continued)
April
30, 2018
Total Return Swap contracts
outstanding at April 30, 2018 (continued):
Total Return Benchmark
| |
Counterparties
| |
Annual
Financing
Rate
Received
(Paid) %
| |
Expiration
Date
| |
Payment
Frequency
Received/
(Paid)
| |
Notional
Amount
Long
(Short)
| |
Value/
Unrealized
Appreciation/
(Depreciation)(d)
|
| Xtrackers MSCI Europe Hedged Equity ETF | |
Bank of
America Merrill Lynch | |
| 2.38 | | |
3/29/2019 | |
Monthly | |
$ | 414,629 | | |
$ | — | |
| Xtrackers MSCI Japan Hedged Equity ETF | |
Morgan Stanley | |
| 2.20 | | |
5/21/2018 | |
Monthly | |
| 299,331 | | |
| — | |
| Xtrackers MSCI Japan Hedged Equity ETF | |
Bank of
America Merrill Lynch | |
| 2.38 | | |
3/29/2019 | |
Monthly | |
| 299,331 | | |
| — | |
| Xtrackers USD High Yield Corporate Bond ETF | |
Morgan Stanley | |
| 2.20 | | |
5/21/2018 | |
Monthly | |
| 83,342 | | |
| — | |
| Xtrackers USD High Yield Corporate Bond ETF | |
Bank of America Merrill Lynch | |
| 2.38 | | |
3/29/2019 | |
Monthly | |
| 83,342 | | |
| — | |
| | |
| |
| | | |
| |
| |
| | | |
$ | — | |
The total value of securities segregated as collateral for
swap contracts with counterparty Morgan Stanley amounted to $1,195,408 and with Bank of America Merrill Lynch amounted to $1,627,360 at April 30, 2018.
The Fund either receives fees from, or pays to the counterparty, the total return of the benchmark and the agreed-upon financing rate.
(d) |
|
Reflects the value at reset date of April 30,
2018. |
The following is a summary of the inputs used to value the
Fund’s investments as of April 30, 2018. For more information on the valuation techniques, and their aggregation into the levels used in the table
below, please refer to Note 2.
Asset Valuation Inputs
Description
|
|
|
|
Level 1
|
|
Level 2
|
|
Level 3
|
|
Total
|
Investments in Securities:(e)
|
|
|
|
|
|
|
|
|
|
|
|
|
|
|
|
|
|
|
Exchange Traded Note |
|
|
|
$ |
4,447,117 |
|
|
$ |
— |
|
|
$ |
— |
|
|
$ |
4,447,117 |
|
Exchange Traded Vehicles |
|
|
|
|
13,364,640 |
|
|
|
— |
|
|
|
— |
|
|
|
13,364,640 |
|
Investment Companies |
|
|
|
|
1,106,112,793 |
|
|
|
— |
|
|
|
— |
|
|
|
1,106,112,793 |
|
Short-Term Investment:
|
|
|
|
|
|
|
|
|
|
|
|
|
|
|
|
|
|
|
Money Market Fund |
|
|
|
|
1,614,375 |
|
|
|
— |
|
|
|
— |
|
|
|
1,614,375 |
|
Investment of Cash Collateral for Securities Loaned:
|
|
|
|
|
|
|
|
|
|
|
|
|
|
|
|
|
|
|
Money Market Fund |
|
|
|
|
140,959,766 |
|
|
|
— |
|
|
|
— |
|
|
|
140,959,766 |
|
Total Investments in Securities |
|
|
|
|
1,266,498,691 |
|
|
|
— |
|
|
|
— |
|
|
|
1,266,498,691 |
|
Other Financial Instruments:(f)
|
|
|
|
|
|
|
|
|
|
|
|
|
|
|
|
|
|
|
Swap Contracts |
|
|
|
|
— |
|
|
|
— |
|
|
|
— |
|
|
|
— |
|
Total Investments in Securities and Other Financial Instruments |
|
|
|
$ |
1,266,498,691 |
|
|
$ |
— |
|
|
$ |
— |
|
|
$ |
1,266,498,691 |
|
| Liability Valuation Inputs
|
|
|
|
|
|
|
|
|
|
|
| |
|
|
|
|
|
|
|
|
|
|
Description
|
|
|
|
Level 1
|
|
Level 2
|
|
Level 3
|
|
Total
|
Other Financial Instruments:(f)
|
|
|
|
|
|
|
|
|
|
|
|
|
|
|
|
|
|
|
Swap Contracts |
|
|
|
$ |
— |
|
|
$ |
— |
|
|
$ |
— |
|
|
$ |
— |
|
Total Other Financial Instruments |
|
|
|
$ |
— |
|
|
$ |
— |
|
|
$ |
— |
|
|
$ |
— |
|
(e) |
|
For a complete listing of investments and their
industries, see the Schedules of Investments. |
(f) |
|
Reflects the unrealized appreciation (depreciation)
of the instruments. |
The Fund recognizes transfers between
the levels as of the beginning of the period.
For the year ended April 30, 2018, the Fund did not have any
transfers between any levels within the fair value hierarchy. (See Note 2)
See notes to financial
statements.
59
Schedules of Investments —
IQ Hedge Multi-Strategy Tracker ETF (continued)
April
30, 2018
A summary of the Fund’s transactions with affiliated
funds during the year ended April 30, 2018 is as follows:
Affiliated Holdings
| |
|
|
|
Shares at
4/30/2017
|
|
Value
($) at
4/30/2017
|
|
Purchases
Cost
($)
|
|
Sales
Proceeds
($)
|
|
Net
Realized
Gain/(Loss)
($)
|
|
Net
Change in
Unrealized
Appreciation/
(Depreciation)
($)
|
|
Income
Distributions
($)
|
|
Capital
Gain
Distributions
($)
|
|
Shares at
4/30/2018
|
|
Value
($) at
4/30/2018
|
| CurrencyShares Euro Trust |
|
|
|
175,373 |
|
18,505,359 |
|
|
11,114,326 |
|
|
|
(29,788,918 |
) |
|
|
518,113 |
|
|
|
(348,880 |
) |
|
|
— |
|
|
|
— |
|
|
|
— |
|
|
|
— |
|
SPDR S&P Emerging Markets SmallCap
ETF |
|
|
|
579,096 |
|
26,736,862 |
|
|
8,624,136 |
|
|
|
(14,199,113 |
) |
|
|
670,846 |
|
|
|
(111,323 |
) |
|
|
608,524 |
|
|
|
— |
|
|
|
— |
|
|
|
— |
|
| |
|
|
|
754,469 |
|
45,242,221 |
|
|
19,738,462 |
|
|
|
(43,988,031 |
) |
|
|
1,188,959 |
|
|
|
(460,203 |
) |
|
|
608,524 |
|
|
|
— |
|
|
|
— |
|
|
|
— |
|
For
more information on the determination, please refer to Note 6.
See notes to financial
statements.
60
Schedules of Investments —
IQ Hedge Macro Tracker ETF
April
30, 2018
|
|
|
|
Shares
|
|
Value
|
|
|
|
|
|
|
|
|
|
|
|
Exchange Traded Vehicles — 6.2%
|
|
|
|
|
|
|
|
|
|
|
| |
Gold Fund — 2.1%
|
|
|
|
|
|
|
|
|
|
|
PowerShares DB Gold Fund*(a) |
|
|
|
|
3,295 |
|
|
$ |
136,940 |
|
| |
Japanese Yen Fund — 2.0%
|
|
|
|
|
|
|
|
|
|
|
CurrencyShares Japanese
Yen Trust* |
|
|
|
|
1,498 |
|
|
|
131,300 |
|
| |
U.S. Dollar Fund — 2.1%
|
|
|
|
|
|
|
|
|
|
|
PowerShares DB U.S. Dollar Index Bullish Fund*(a) |
|
|
|
|
5,861 |
|
|
|
141,426 |
|
| |
Total Exchange Traded Vehicles
|
|
|
|
|
|
|
|
|
|
|
(Cost $419,472) |
|
|
|
|
|
|
|
|
409,666 |
|
| |
Investment Companies — 93.8%
|
|
|
|
|
|
|
|
|
|
|
| |
BRIC Equity Funds — 9.3%
|
|
|
|
|
|
|
|
|
|
|
iShares China Large-Cap ETF(a) |
|
|
|
|
6,483 |
|
|
|
304,247 |
|
iShares MSCI China ETF(a) |
|
|
|
|
3,412 |
|
|
|
228,092 |
|
SPDR S&P China ETF(a) |
|
|
|
|
727 |
|
|
|
78,778 |
|
Total BRIC Equity Funds |
|
|
|
|
|
|
|
|
611,117 |
|
| |
Emerging Small Cap Equity
Fund — 2.4%
|
|
|
|
|
|
|
|
|
|
|
SPDR S&P Emerging Markets SmallCap ETF(a) |
|
|
|
|
3,164 |
|
|
|
161,744 |
|
| |
Europe Equity Fund — 4.4%
|
|
|
|
|
|
|
|
|
|
|
Xtrackers MSCI Europe Hedged Equity ETF |
|
|
|
|
10,083 |
|
|
|
289,382 |
|
| |
International Bond Funds — 4.9%
|
|
|
|
|
|
|
|
|
|
|
iShares JP Morgan USD Emerging Markets Bond ETF |
|
|
|
|
1,041 |
|
|
|
114,656 |
|
PowerShares Emerging Markets Sovereign Debt Portfolio(a) |
|
|
|
|
1,725 |
|
|
|
47,386 |
|
SPDR Bloomberg Barclays Emerging Markets Local Bond ETF |
|
|
|
|
581 |
|
|
|
17,047 |
|
VanEck Vectors J.P. Morgan EM Local Currency Bond ETF |
|
|
|
|
7,284 |
|
|
|
136,429 |
|
WisdomTree Emerging Markets Local Debt Fund(a) |
|
|
|
|
144 |
|
|
|
5,424 |
|
Total International Bond Funds |
|
|
|
|
|
|
|
|
320,942 |
|
| |
International Small Cap Equity
Funds — 4.4%
|
|
|
|
|
|
|
|
|
|
|
iShares MSCI EAFE Small-Cap ETF |
|
|
|
|
2,881 |
|
|
|
189,051 |
|
SPDR S&P International Small Cap ETF |
|
|
|
|
461 |
|
|
|
16,407 |
|
Vanguard FTSE All World ex-U.S. Small-Cap ETF |
|
|
|
|
721 |
|
|
|
86,239 |
|
Total International Small Cap Equity Funds |
|
|
|
|
|
|
|
|
291,697 |
|
| |
Japan Equity Fund — 3.2%
|
|
|
|
|
|
|
|
|
|
|
Xtrackers MSCI Japan Hedged Equity ETF |
|
|
|
|
4,800 |
|
|
|
208,896 |
|
|
|
|
|
|
|
|
|
|
|
|
|
|
|
|
Shares
|
|
Value
|
Investment Companies (continued)
|
|
|
|
|
|
|
|
|
|
|
| |
Treasury Inflation-Protected Securities Funds — 4.2%
|
|
|
|
|
|
|
|
|
|
|
iShares 0-5 Year TIPS Bond ETF(a) |
|
|
|
|
643 |
|
|
$ |
64,191 |
|
PIMCO 1-5 Year U.S. TIPS Index Exchange-Traded Fund(a) |
|
|
|
|
686 |
|
|
|
35,521 |
|
Vanguard Short-Term Inflation-Protected Securities ETF(a) |
|
|
|
|
3,614 |
|
|
|
176,688 |
|
Total Treasury Inflation-Protected Securities Funds |
|
|
|
|
|
|
|
|
276,400 |
|
| |
U.S. Large Cap Core Fund — 0.9%
|
|
|
|
|
|
|
|
|
|
|
Energy Select Sector SPDR Fund |
|
|
|
|
799 |
|
|
|
58,974 |
|
| |
U.S. Large Cap Growth Funds — 1.0%
|
|
|
|
|
|
|
|
|
|
|
iShares Russell 1000 Growth ETF |
|
|
|
|
200 |
|
|
|
27,290 |
|
iShares S&P 500 Growth ETF |
|
|
|
|
88 |
|
|
|
13,680 |
|
SPDR Portfolio S&P 500 Growth ETF |
|
|
|
|
39 |
|
|
|
1,310 |
|
Vanguard Growth ETF(a) |
|
|
|
|
157 |
|
|
|
22,336 |
|
Total U.S. Large Cap Growth Funds |
|
|
|
|
|
|
|
|
64,616 |
|
| |
U.S. Large Cap Value Funds — 2.2%
|
|
|
|
|
|
|
|
|
|
|
iShares Russell 1000 Value ETF |
|
|
|
|
493 |
|
|
|
59,328 |
|
iShares S&P 500 Value ETF |
|
|
|
|
218 |
|
|
|
23,956 |
|
SPDR Portfolio S&P 500 Value ETF |
|
|
|
|
76 |
|
|
|
2,245 |
|
Vanguard Value ETF(a) |
|
|
|
|
566 |
|
|
|
58,643 |
|
Total U.S. Large Cap Value Funds |
|
|
|
|
|
|
|
|
144,172 |
|
| |
U.S. Medium Term Treasury Bond Fund — 2.9%
|
|
|
|
|
|
|
|
|
|
|
iShares 3-7 Year Treasury Bond ETF |
|
|
|
|
1,620 |
|
|
|
193,622 |
|
| |
U.S. Intermediate Term Treasury Bond Funds — 1.2%
|
|
|
|
|
|
|
|
|
|
|
Schwab Intermediate-Term U.S. Treasury ETF(a) |
|
|
|
|
682 |
|
|
|
35,478 |
|
Vanguard Intermediate-Term Treasury ETF |
|
|
|
|
723 |
|
|
|
45,050 |
|
Total U.S. Intermediate Term Treasury Bond Funds |
|
|
|
|
|
|
|
|
80,528 |
|
| |
U.S. Multi Cap Funds — 10.0%
|
|
|
|
|
|
|
|
|
|
|
iShares Core S&P Total U.S. Stock Market ETF |
|
|
|
|
1,198 |
|
|
|
72,659 |
|
Schwab U.S. Broad Market ETF |
|
|
|
|
1,009 |
|
|
|
64,606 |
|
Vanguard Total Stock Market ETF(a) |
|
|
|
|
3,811 |
|
|
|
519,554 |
|
Total U.S. Multi Cap Funds |
|
|
|
|
|
|
|
|
656,819 |
|
| |
U.S. Short Term Treasury Bond Funds — 42.8%
|
|
|
|
|
|
|
|
|
|
|
Goldman Sachs Treasury Access 0-1 Year ETF |
|
|
|
|
1,819 |
|
|
|
182,009 |
|
iShares Short Treasury Bond ETF(a)(b) |
|
|
|
|
18,211 |
|
|
|
2,009,766 |
|
PowerShares Treasury Collateral Portfolio ETF |
|
|
|
|
765 |
|
|
|
80,924 |
|
SPDR Bloomberg Barclays 1-3 Month T-Bill ETF(a) |
|
|
|
|
5,945 |
|
|
|
544,205 |
|
Total U.S. Short Term Treasury Bond Funds |
|
|
|
|
|
|
|
|
2,816,904 |
|
| |
Total Investment Companies
|
|
|
|
|
|
|
|
|
|
|
(Cost $5,998,699) |
|
|
|
|
|
|
|
|
6,175,813 |
|
See notes to financial
statements.
61
Schedules of Investments —
IQ Hedge Macro Tracker ETF (continued)
April
30, 2018
| |
|
|
|
Shares
|
|
Value
|
| |
|
|
|
|
|
|
|
|
|
|
| Short-Term Investment — 0.1% |
|
|
|
|
|
|
|
|
|
|
| |
|
|
|
|
|
|
|
|
|
|
| Money Market Fund — 0.1% |
|
|
|
|
|
|
|
|
|
|
| Morgan Stanley Institutional Liquidity Funds Treasury Portfolio — Institutional Class, 1.58%(c) |
|
|
|
|
|
|
|
|
|
|
| (Cost $4,416) |
|
|
|
|
4,416 |
|
|
$ |
4,416 |
|
| |
|
|
|
|
|
|
|
|
|
|
| Investment of Cash Collateral For Securities Loaned — 28.9% |
|
|
|
|
|
|
|
|
|
|
| |
|
|
|
|
|
|
|
|
|
|
| Money Market Fund — 28.9% |
|
|
|
|
|
|
|
|
|
|
| Dreyfus Government Cash Management Fund, Institutional Shares, 1.61%(c) |
|
|
|
|
|
|
|
|
|
|
| (Cost $1,906,306) |
|
|
|
|
1,906,306 |
|
|
|
1,906,306 |
|
| |
|
|
|
|
|
|
|
|
|
|
| Total Investments — 129.0% |
|
|
|
|
|
|
|
|
|
|
| (Cost $8,328,893) |
|
|
|
|
|
|
|
|
8,496,201 |
|
| |
|
|
|
|
|
|
|
|
|
|
| Other Assets and Liabilities, Net — (29.0)% |
|
|
|
|
|
|
|
|
(1,908,542 |
) |
| |
|
|
|
|
|
|
|
|
|
|
| Net Assets — 100.0% |
|
|
|
|
|
|
|
$ |
6,587,659 |
|
* |
|
Non-income producing securities. |
(a) |
|
All or a portion of the security was on loan. In
addition, “Other Assets and Liabilities, Net” may include pending sales that are also on loan. The aggregate market value of securities on
loan was $2,096,159; total market value of collateral held by the Fund was $2,146,688. Market value of the collateral held includes non-cash U.S.
Treasury securities collateral having a value of $240,382. |
(b) |
|
All or a portion of these securities have been
segregated as collateral for swap contracts. The total value of securities segregated amounted to $261,553. |
(c) |
|
Reflects the 1-day yield at April 30,
2018. |
See notes to financial
statements.
62
Schedules of Investments —
IQ Hedge Macro Tracker ETF (continued)
April
30, 2018
Total Return Swap contracts outstanding at April 30,
2018:
Total Return Benchmark
| |
Counterparty
| |
Annual
Financing
Rate
Received
(Paid) %
| |
Expiration
Date
| |
Payment
Frequency
Received/
(Paid)
| |
Notional
Amount
Long
(Short)
| |
Value/
Unrealized
Appreciation/
(Depreciation)(d)
|
| CurrencyShares Euro Trust | |
Morgan
Stanley | |
| (1.50 | ) | |
5/04/2020 | |
Monthly | |
$ | (29,474 | ) | |
$ | — | |
| CurrencyShares Japanese Yen Trust | |
Morgan
Stanley | |
| 2.20 | | |
5/21/2018 | |
Monthly | |
| 13,060 | | |
| — | |
| Energy Select Sector SPDR Fund | |
Morgan
Stanley | |
| 2.20 | | |
5/21/2018 | |
Monthly | |
| 5,831 | | |
| — | |
| Goldman Sachs Treasury Access 0-1 Year ETF | |
Morgan
Stanley | |
| 2.20 | | |
5/21/2018 | |
Monthly | |
| 18,111 | | |
| — | |
| iPath Bloomberg Commodity Index Total Return ETN | |
Morgan
Stanley | |
| 1.30 | | |
5/04/2020 | |
Monthly | |
| (14,269 | ) | |
| — | |
| iShares 0-5 Year TIPS Bond ETF | |
Morgan
Stanley | |
| 2.20 | | |
5/21/2018 | |
Monthly | |
| 6,389 | | |
| — | |
| iShares 3-7 Year Treasury Bond ETF | |
Morgan
Stanley | |
| 2.20 | | |
5/21/2018 | |
Monthly | |
| 19,243 | | |
| — | |
| iShares China Large-Cap ETF | |
Morgan
Stanley | |
| 2.20 | | |
5/21/2018 | |
Monthly | |
| 30,223 | | |
| — | |
| iShares Core MSCI Emerging Markets ETF | |
Morgan
Stanley | |
| 1.30 | | |
5/04/2020 | |
Monthly | |
| (42,638 | ) | |
| — | |
| iShares Core S&P Total U.S. Stock Market ETF | |
Morgan
Stanley | |
| 2.20 | | |
5/21/2018 | |
Monthly | |
| 7,217 | | |
| — | |
| iShares Core U.S. Credit Bond ETF | |
Morgan
Stanley | |
| (5.00 | ) | |
5/04/2020 | |
Monthly | |
| (1,076 | ) | |
| — | |
| iShares Edge MSCI Min Vol Emerging Markets ETF | |
Morgan
Stanley | |
| 1.30 | | |
5/04/2020 | |
Monthly | |
| (101,920 | ) | |
| — | |
| iShares Europe ETF | |
Morgan
Stanley | |
| (2.50 | ) | |
5/04/2020 | |
Monthly | |
| (1,714 | ) | |
| — | |
| iShares iBoxx $ Investment Grade Corporate Bond ETF | |
Morgan
Stanley | |
| 1.25 | | |
5/04/2020 | |
Monthly | |
| (22,353 | ) | |
| — | |
| iShares J.P. Morgan USD Emerging Markets Bond ETF | |
Morgan
Stanley | |
| 2.20 | | |
5/21/2018 | |
Monthly | |
| 11,344 | | |
| — | |
| iShares MSCI China ETF | |
Morgan
Stanley | |
| 2.20 | | |
5/21/2018 | |
Monthly | |
| 22,662 | | |
| — | |
| iShares MSCI EAFE Small-Cap ETF | |
Morgan
Stanley | |
| 2.20 | | |
5/21/2018 | |
Monthly | |
| 18,767 | | |
| — | |
| iShares MSCI Eurozone ETF | |
Morgan
Stanley | |
| 1.30 | | |
5/04/2020 | |
Monthly | |
| (8,777 | ) | |
| — | |
| iShares MSCI Japan ETF | |
Morgan
Stanley | |
| 1.30 | | |
5/04/2020 | |
Monthly | |
| (43,297 | ) | |
| — | |
| iShares Russell 1000 Growth ETF | |
Morgan
Stanley | |
| 2.20 | | |
5/21/2018 | |
Monthly | |
| 2,729 | | |
| — | |
| iShares Russell 1000 Value ETF | |
Morgan
Stanley | |
| 2.20 | | |
5/21/2018 | |
Monthly | |
| 5,897 | | |
| — | |
| iShares Russell 2000 ETF | |
Morgan
Stanley | |
| 1.30 | | |
5/04/2020 | |
Monthly | |
| (62,248 | ) | |
| — | |
| iShares S&P 500 Growth ETF | |
Morgan
Stanley | |
| 2.20 | | |
5/21/2018 | |
Monthly | |
| 1,399 | | |
| — | |
| iShares S&P 500 Value ETF | |
Morgan
Stanley | |
| 2.20 | | |
5/21/2018 | |
Monthly | |
| 2,418 | | |
| — | |
| iShares Short Treasury Bond ETF | |
Morgan
Stanley | |
| 2.20 | | |
5/21/2018 | |
Monthly | |
| 199,752 | | |
| — | |
| iShares Silver Trust | |
Morgan
Stanley | |
| 0.75 | | |
5/04/2020 | |
Monthly | |
| (18,856 | ) | |
| — | |
| Materials Select Sector SPDR Fund | |
Morgan
Stanley | |
| 1.30 | | |
5/04/2020 | |
Monthly | |
| (43,328 | ) | |
| — | |
| PIMCO 1-5 Year U.S. TIPS Index Exchange-Traded Fund | |
Morgan
Stanley | |
| 2.20 | | |
5/21/2018 | |
Monthly | |
| 3,521 | | |
| — | |
| PowerShares DB Commodity Index Tracking Fund | |
Morgan
Stanley | |
| 1.30 | | |
5/04/2020 | |
Monthly | |
| (35,770 | ) | |
| — | |
| PowerShares DB Gold Fund | |
Morgan
Stanley | |
| 2.20 | | |
5/21/2018 | |
Monthly | |
| 13,590 | | |
| — | |
| PowerShares DB U.S. Dollar Index Bullish Fund | |
Morgan
Stanley | |
| 2.20 | | |
5/21/2018 | |
Monthly | |
| 14,068 | | |
| — | |
| PowerShares Emerging Markets Sovereign Debt Portfolio | |
Morgan
Stanley | |
| 2.20 | | |
5/21/2018 | |
Monthly | |
| 4,697 | | |
| — | |
| PowerShares Treasury Collateral Portfolio ETF | |
Morgan
Stanley | |
| 2.20 | | |
5/21/2018 | |
Monthly | |
| 8,039 | | |
| — | |
| Schwab Intermediate-Term U.S. Treasury ETF | |
Morgan
Stanley | |
| 2.20 | | |
5/21/2018 | |
Monthly | |
| 3,537 | | |
| — | |
| Schwab U.S. Broad Market ETF | |
Morgan
Stanley | |
| 2.20 | | |
5/21/2018 | |
Monthly | |
| 6,403 | | |
| — | |
| Schwab U.S. Small-Cap ETF | |
Morgan
Stanley | |
| (2.45 | ) | |
5/04/2020 | |
Monthly | |
| (10,299 | ) | |
| — | |
| SPDR Bloomberg Barclays 1-3 Month T-Bill ETF | |
Morgan
Stanley | |
| 2.20 | | |
5/21/2018 | |
Monthly | |
| 54,100 | | |
| — | |
| SPDR Bloomberg Barclays Emerging Markets Local Bond ETF | |
Morgan
Stanley | |
| 2.20 | | |
5/21/2018 | |
Monthly | |
| 1,702 | | |
| — | |
| SPDR Dow Jones International Real Estate ETF | |
Morgan
Stanley | |
| 0.10 | | |
5/04/2020 | |
Monthly | |
| (105,943 | ) | |
| — | |
| SPDR Portfolio S&P 500 Growth ETF | |
Morgan
Stanley | |
| 2.20 | | |
5/21/2018 | |
Monthly | |
| 134 | | |
| — | |
| SPDR Portfolio S&P 500 Value ETF | |
Morgan
Stanley | |
| 2.20 | | |
5/21/2018 | |
Monthly | |
| 236 | | |
| — | |
See notes to financial
statements.
63
Schedules
of Investments — IQ Hedge Macro Tracker ETF (continued)
April
30, 2018
Total Return Swap contracts outstanding at April 30, 2018
(continued):
Total Return Benchmark
| |
Counterparty
| |
Annual
Financing
Rate
Received
(Paid) %
| |
Expiration
Date
| |
Payment
Frequency
Received/
(Paid)
| |
Notional
Amount
Long
(Short)
| |
Value/
Unrealized
Appreciation/
(Depreciation)(d)
|
| SPDR S&P China ETF | |
Morgan
Stanley | |
| 2.20 | | |
5/21/2018 | |
Monthly | |
$ | 7,802 | | |
$ | — | |
| SPDR S&P Emerging Markets SmallCap ETF | |
Morgan
Stanley | |
| 2.20 | | |
5/21/2018 | |
Monthly | |
| 16,052 | | |
| — | |
| SPDR S&P International Small Cap ETF | |
Morgan
Stanley | |
| 2.20 | | |
5/21/2018 | |
Monthly | |
| 1,637 | | |
| — | |
| VanEck Vectors J.P. Morgan EM Local Currency Bond ETF | |
Morgan
Stanley | |
| 2.20 | | |
5/21/2018 | |
Monthly | |
| 13,561 | | |
| — | |
| Vanguard FTSE All World ex-U.S. Small-Cap ETF | |
Morgan
Stanley | |
| 2.20 | | |
5/21/2018 | |
Monthly | |
| 8,612 | | |
| — | |
| Vanguard FTSE Emerging Markets ETF | |
Morgan
Stanley | |
| 1.30 | | |
5/04/2020 | |
Monthly | |
| (58,425 | ) | |
| — | |
| Vanguard FTSE Europe ETF | |
Morgan
Stanley | |
| 1.30 | | |
5/04/2020 | |
Monthly | |
| (11,642 | ) | |
| — | |
| Vanguard Growth ETF | |
Morgan
Stanley | |
| 2.20 | | |
5/21/2018 | |
Monthly | |
| 2,276 | | |
| — | |
| Vanguard Intermediate-Term Corporate Bond ETF | |
Morgan
Stanley | |
| 1.30 | | |
5/04/2020 | |
Monthly | |
| (13,053 | ) | |
| — | |
| Vanguard Intermediate-Term Treasury ETF | |
Morgan
Stanley | |
| 2.20 | | |
5/21/2018 | |
Monthly | |
| 4,487 | | |
| — | |
| Vanguard Short-Term Inflation-Protected Securities ETF | |
Morgan
Stanley | |
| 2.20 | | |
5/21/2018 | |
Monthly | |
| 17,552 | | |
| — | |
| Vanguard Small-Cap ETF | |
Morgan
Stanley | |
| 1.30 | | |
5/04/2020 | |
Monthly | |
| (32,148 | ) | |
| — | |
| Vanguard Total Stock Market ETF | |
Morgan
Stanley | |
| 2.20 | | |
5/21/2018 | |
Monthly | |
| 51,669 | | |
| — | |
| Vanguard Value ETF | |
Morgan
Stanley | |
| 2.20 | | |
5/21/2018 | |
Monthly | |
| 5,802 | | |
| — | |
| WisdomTree Emerging Markets Local Debt Fund | |
Morgan
Stanley | |
| 2.20 | | |
5/21/2018 | |
Monthly | |
| 527 | | |
| — | |
| Xtrackers MSCI Europe Hedged Equity ETF | |
Morgan
Stanley | |
| 2.20 | | |
5/21/2018 | |
Monthly | |
| 28,757 | | |
| — | |
| Xtrackers MSCI Japan Hedged Equity ETF | |
Morgan
Stanley | |
| 2.20 | | |
5/21/2018 | |
Monthly | |
| 20,759 | | |
| — | |
| | |
| |
| | | |
| |
| |
| | | |
$ | — | |
The
total value of securities segregated as collateral for swap contracts with counterparty Morgan Stanley amounted
to $261,553 at April 30, 2018. The Fund either receives fees from, or pays to the counterparty, the total return
of the benchmark and the agreed-upon financing rate.
(d) |
|
Reflects the value at reset date of April 30,
2018. |
See notes
to financial statements.
64
Schedules of Investments —
IQ Hedge Macro Tracker ETF (continued)
April
30, 2018
The
following is a summary of the inputs used to value the Fund’s investments as of April 30, 2018. For more
information on the valuation techniques, and their aggregation into the levels used in the table below, please
refer to Note 2.
Asset Valuation Inputs
Description
|
|
|
|
Level 1
|
|
Level 2
|
|
Level 3
|
|
Total
|
| Investments in Securities:(e) |
|
|
|
|
|
|
|
|
|
|
|
|
|
|
|
|
|
|
| Exchange Traded Vehicles |
|
|
|
$ |
409,666 |
|
|
$ |
— |
|
|
$ |
— |
|
|
$ |
409,666 |
|
| Investment Companies |
|
|
|
|
6,175,813 |
|
|
|
— |
|
|
|
— |
|
|
|
6,175,813 |
|
| Short-Term Investment: |
|
|
|
|
|
|
|
|
|
|
|
|
|
|
|
|
|
|
| Money Market Fund |
|
|
|
|
4,416 |
|
|
|
— |
|
|
|
— |
|
|
|
4,416 |
|
| Investment of Cash Collateral for Securities Loaned: |
|
|
|
|
|
|
|
|
|
|
|
|
|
|
|
|
|
|
| Money Market Fund |
|
|
|
|
1,906,306 |
|
|
|
— |
|
|
|
— |
|
|
|
1,906,306 |
|
| Total Investments in Securities |
|
|
|
|
8,496,201 |
|
|
|
— |
|
|
|
— |
|
|
|
8,496,201 |
|
| Other Financial Instruments:(f) |
|
|
|
|
|
|
|
|
|
|
|
|
|
|
|
|
|
|
| Swap Contracts |
|
|
|
|
— |
|
|
|
— |
|
|
|
— |
|
|
|
— |
|
| Total Investments in Securities and Other Financial Instruments |
|
|
|
$ |
8,496,201 |
|
|
$ |
— |
|
|
$ |
— |
|
|
$ |
8,496,201 |
|
| |
|
|
|
|
|
|
|
|
|
|
| Liability Valuation Inputs
|
|
|
|
|
|
|
|
|
|
|
| |
|
|
|
|
|
|
|
|
|
|
Description
|
|
|
|
Level 1
|
|
Level 2
|
|
Level 3
|
|
Total
|
| Other Financial Instruments:(f) |
|
|
|
|
|
|
|
|
|
|
|
|
|
|
|
|
|
|
| Swap Contracts |
|
|
|
$ |
— |
|
|
$ |
— |
|
|
$ |
— |
|
|
$ |
— |
|
| Total Other Financial Instruments |
|
|
|
$ |
— |
|
|
$ |
— |
|
|
$ |
— |
|
|
$ |
— |
|
(e) |
|
For a complete listing of investments and their
industries, see the Schedules of Investments. |
(f) |
|
Reflects the unrealized appreciation (depreciation)
of the instruments. |
The
Fund recognizes transfers between the levels as of the beginning of the period.
For
the year ended April 30, 2018, the Fund did not have any transfers between any levels
within the fair value hierarchy. (See Note 2)
See notes
to financial statements.
65
Schedules of Investments —
IQ Hedge Market Neutral Tracker ETF
April
30, 2018
|
|
|
|
Shares
|
|
Value
|
|
|
|
|
|
|
|
|
|
|
|
Exchange Traded Vehicle — 2.4%
|
|
|
|
|
|
|
|
|
|
|
| |
Euro Fund — 2.4%
|
|
|
|
|
|
|
|
|
|
|
CurrencyShares Euro Trust*(a)
(Cost $293,465) |
|
|
|
|
2,648 |
|
|
$ |
307,274 |
|
| |
Investment Companies — 97.6%
|
|
|
|
|
|
|
|
|
|
|
| |
Convertible Bond Fund — 1.4%
|
|
|
|
|
|
|
|
|
|
|
SPDR Bloomberg Barclays Convertible Securities ETF(a) |
|
|
|
|
3,473 |
|
|
|
178,651 |
|
| |
Floating Rate Funds — 19.7%
|
|
|
|
|
|
|
|
|
|
|
iShares Floating Rate Bond ETF(a) |
|
|
|
|
21,238 |
|
|
|
1,083,775 |
|
PowerShares Senior Loan Portfolio |
|
|
|
|
47,443 |
|
|
|
1,096,408 |
|
SPDR Blackstone / GSO Senior Loan ETF |
|
|
|
|
7,244 |
|
|
|
343,655 |
|
Total Floating Rate Funds |
|
|
|
|
|
|
|
|
2,523,838 |
|
| |
High Yield Corporate Bond
Fund — 1.1%
|
|
|
|
|
|
|
|
|
|
|
SPDR Bloomberg Barclays Short Term High Yield Bond ETF |
|
|
|
|
5,286 |
|
|
|
144,942 |
|
| |
High Yield Municipal Bond
Fund — 1.4%
|
|
|
|
|
|
|
|
|
|
|
VanEck Vectors High-Yield Municipal Index ETF(a) |
|
|
|
|
5,964 |
|
|
|
185,361 |
|
| |
International Small Cap Equity
Funds — 6.4%
|
|
|
|
|
|
|
|
|
|
|
iShares MSCI EAFE Small-Cap ETF |
|
|
|
|
8,071 |
|
|
|
529,619 |
|
SPDR S&P International Small
Cap ETF |
|
|
|
|
1,293 |
|
|
|
46,018 |
|
Vanguard FTSE All World ex-U.S. Small-Cap ETF |
|
|
|
|
2,020 |
|
|
|
241,612 |
|
Total International Small Cap Equity Funds |
|
|
|
|
|
|
|
|
817,249 |
|
| |
Investment Grade Corporate Bond Funds — 12.1%
|
|
|
|
|
|
|
|
|
|
|
iShares iBoxx $ Investment Grade Corporate Bond ETF |
|
|
|
|
8,239 |
|
|
|
949,298 |
|
iShares U.S. Credit Bond ETF |
|
|
|
|
416 |
|
|
|
44,766 |
|
Vanguard Intermediate-Term Corporate Bond ETF |
|
|
|
|
6,642 |
|
|
|
555,736 |
|
Total Investment Grade Corporate Bond Funds |
|
|
|
|
|
|
|
|
1,549,800 |
|
| |
Mortgage Backed Securities Funds — 7.3%
|
|
|
|
|
|
|
|
|
|
|
iShares MBS ETF(a) |
|
|
|
|
6,312 |
|
|
|
655,249 |
|
Vanguard Mortgage-Backed Securities ETF |
|
|
|
|
5,344 |
|
|
|
273,719 |
|
Total Mortgage Backed Securities Funds |
|
|
|
|
|
|
|
|
928,968 |
|
| |
U.S. Large Cap Core Funds — 1.5%
|
|
|
|
|
|
|
|
|
|
|
PowerShares KBW Bank Portfolio |
|
|
|
|
736 |
|
|
|
40,649 |
|
SPDR S&P Bank ETF(a) |
|
|
|
|
3,025 |
|
|
|
145,079 |
|
Total U.S. Large Cap Core Funds |
|
|
|
|
|
|
|
|
185,728 |
|
| |
U.S. Large Cap Growth Funds — 4.6%
|
|
|
|
|
|
|
|
|
|
|
iShares Russell 1000 Growth ETF |
|
|
|
|
1,805 |
|
|
|
246,292 |
|
iShares S&P 500 Growth ETF(a) |
|
|
|
|
798 |
|
|
|
124,049 |
|
SPDR Portfolio S&P 500 Growth ETF |
|
|
|
|
353 |
|
|
|
11,858 |
|
Vanguard Growth ETF(a) |
|
|
|
|
1,418 |
|
|
|
201,739 |
|
Total U.S. Large Cap Growth Funds |
|
|
|
|
|
|
|
|
583,938 |
|
|
|
|
|
Shares
|
|
Value
|
Investment Companies (continued)
|
|
|
|
|
|
|
|
|
|
|
| |
U.S. Preferred Funds — 0.3%
|
|
|
|
|
|
|
|
|
|
|
|
|
|
|
|
|
|
|
|
|
|
iShares U.S. Preferred Stock ETF |
|
|
|
|
771 |
|
|
$ |
28,627 |
|
PowerShares Preferred Portfolio |
|
|
|
|
615 |
|
|
|
8,844 |
|
Total U.S. Preferred Funds |
|
|
|
|
|
|
|
|
37,471 |
|
| |
U.S. Short Term Treasury Bond Funds — 38.1%
|
|
|
|
|
|
|
|
|
|
|
Goldman Sachs Treasury Access 0-1 Year ETF |
|
|
|
|
3,146 |
|
|
|
314,789 |
|
iShares Short Treasury Bond ETF(b) |
|
|
|
|
31,491 |
|
|
|
3,475,347 |
|
PowerShares Treasury Collateral Portfolio ETF |
|
|
|
|
1,323 |
|
|
|
139,950 |
|
SPDR Bloomberg Barclays 1-3 Month T-Bill ETF |
|
|
|
|
10,281 |
|
|
|
941,123 |
|
Total U.S. Short Term Treasury Bond Funds |
|
|
|
|
|
|
|
|
4,871,209 |
|
| |
U.S. Small Cap Growth Funds — 3.7%
|
|
|
|
|
|
|
|
|
|
|
iShares Russell 2000 Growth ETF(a) |
|
|
|
|
1,049 |
|
|
|
200,348 |
|
iShares S&P Small-Cap 600 Growth ETF(a) |
|
|
|
|
640 |
|
|
|
111,648 |
|
Vanguard Small-Cap Growth ETF(a) |
|
|
|
|
980 |
|
|
|
161,083 |
|
Total U.S. Small Cap Growth Funds |
|
|
|
|
|
|
|
|
473,079 |
|
| |
Total Investment Companies
|
|
|
|
|
|
|
|
|
|
|
(Cost $12,341,029) |
|
|
|
|
|
|
|
|
12,480,234 |
|
| |
Short-Term Investment — 0.1%
|
|
|
|
|
|
|
|
|
|
|
| |
Money Market Fund — 0.1%
|
|
|
|
|
|
|
|
|
|
|
Morgan Stanley Institutional Liquidity Funds Treasury Portfolio — Institutional Class,
1.58%(c)
|
|
|
|
|
|
|
|
|
|
|
(Cost $17,484) |
|
|
|
|
17,484 |
|
|
|
17,484 |
|
| |
Investment of Cash Collateral For Securities Loaned — 14.9%
|
|
|
|
|
|
|
|
|
|
|
| |
Money Market Fund — 14.9%
|
|
|
|
|
|
|
|
|
|
|
Dreyfus Government Cash Management Fund, Institutional Shares, 1.61%(c)
|
|
|
|
|
|
|
|
|
|
|
(Cost $1,911,647) |
|
|
|
|
1,911,647 |
|
|
|
1,911,647 |
|
| |
Total Investments — 115.0%
|
|
|
|
|
|
|
|
|
|
|
(Cost $14,563,625) |
|
|
|
|
|
|
|
|
14,716,639 |
|
| |
Other Assets and Liabilities,
Net — (15.0)% |
|
|
|
|
|
|
|
|
(1,926,348 |
) |
| |
Net Assets — 100.0% |
|
|
|
|
|
|
|
$ |
12,790,291 |
|
* |
|
Non-income producing securities. |
(a) |
|
All or a portion of the security was on loan. In
addition, “Other Assets and Liabilities, Net” may include pending sales that are also on loan. The aggregate market value of securities on
loan was $1,865,262; total market value of collateral held by the Fund was $1,911,647. |
(b) |
|
All or a portion of these securities have been
segregated as collateral for swap contracts. The total value of securities segregated amounted to $522,334. |
(c) |
|
Reflects the 1-day yield at April 30,
2018. |
See notes
to financial statements.
66
Schedules
of Investments — IQ Hedge Market Neutral Tracker ETF (continued)
April
30, 2018
Total Return Swap contracts outstanding at April 30,
2018:
Total
Return Benchmark
| |
Counterparty
| |
Annual
Financing
Rate
Received
(Paid) %
| |
Expiration
Date
| |
Payment
Frequency
Received/
(Paid)
| |
Notional
Amount
Long
(Short)
| |
Value/
Unrealized
Appreciation/
(Depreciation)(d)
|
| CurrencyShares Australian Dollar Trust | |
Morgan
Stanley | |
| (2.00 | ) | |
5/04/2020 | |
Monthly | |
$ | (63,127 | ) | |
$ | — | |
| CurrencyShares British Pound Sterling Trust | |
Morgan
Stanley | |
| (5.40 | ) | |
5/04/2020 | |
Monthly | |
| (43,309 | ) | |
| — | |
| CurrencyShares Euro Trust | |
Morgan
Stanley | |
| 2.20 | | |
5/21/2018 | |
Monthly | |
| 30,519 | | |
| — | |
| Goldman Sachs Treasury Access 0-1 Year ETF | |
Morgan
Stanley | |
| 2.20 | | |
5/21/2018 | |
Monthly | |
| 31,219 | | |
| — | |
| iShares 3-7 Year Treasury Bond ETF | |
Morgan
Stanley | |
| 0.75 | | |
5/04/2020 | |
Monthly | |
| (87,489 | ) | |
| — | |
| iShares Core MSCI Emerging Markets ETF | |
Morgan
Stanley | |
| 1.30 | | |
5/04/2020 | |
Monthly | |
| (26,094 | ) | |
| — | |
| iShares Edge MSCI Min Vol USA ETF | |
Morgan
Stanley | |
| 1.00 | | |
5/04/2020 | |
Monthly | |
| (113,864 | ) | |
| — | |
| iShares Europe ETF | |
Morgan
Stanley | |
| (2.50 | ) | |
5/04/2020 | |
Monthly | |
| (12,043 | ) | |
| — | |
| iShares Floating Rate Bond ETF | |
Morgan
Stanley | |
| 2.20 | | |
5/21/2018 | |
Monthly | |
| 107,571 | | |
| — | |
| iShares iBoxx $ High Yield Corporate Bond ETF | |
Morgan
Stanley | |
| (1.13 | ) | |
5/04/2020 | |
Monthly | |
| (73,359 | ) | |
| — | |
| iShares iBoxx $ Investment Grade Corporate Bond ETF | |
Morgan
Stanley | |
| 2.20 | | |
5/21/2018 | |
Monthly | |
| 94,250 | | |
| — | |
| iShares MBS ETF | |
Morgan
Stanley | |
| 2.20 | | |
5/21/2018 | |
Monthly | |
| 65,089 | | |
| — | |
| iShares MSCI All Country Asia ex Japan ETF | |
Morgan
Stanley | |
| 1.30 | | |
5/04/2020 | |
Monthly | |
| (44,301 | ) | |
| — | |
| iShares MSCI EAFE Small-Cap ETF | |
Morgan
Stanley | |
| 2.20 | | |
5/21/2018 | |
Monthly | |
| 52,562 | | |
| — | |
| iShares MSCI Eurozone ETF | |
Morgan
Stanley | |
| 1.30 | | |
5/04/2020 | |
Monthly | |
| (61,796 | ) | |
| — | |
| iShares MSCI Japan ETF | |
Morgan
Stanley | |
| 1.30 | | |
5/04/2020 | |
Monthly | |
| (61,671 | ) | |
| — | |
| iShares MSCI Pacific ex Japan ETF | |
Morgan
Stanley | |
| 1.30 | | |
5/04/2020 | |
Monthly | |
| (23,801 | ) | |
| — | |
| iShares Russell 1000 Growth ETF | |
Morgan
Stanley | |
| 2.20 | | |
5/21/2018 | |
Monthly | |
| 24,425 | | |
| — | |
| iShares Russell 1000 Value ETF | |
Morgan
Stanley | |
| 1.30 | | |
5/04/2020 | |
Monthly | |
| (10,710 | ) | |
| — | |
| iShares Russell 2000 Growth ETF | |
Morgan
Stanley | |
| 2.20 | | |
5/21/2018 | |
Monthly | |
| 19,863 | | |
| — | |
| iShares Russell 2000 Value ETF | |
Morgan
Stanley | |
| 1.30 | | |
5/04/2020 | |
Monthly | |
| (56,976 | ) | |
| — | |
| iShares S&P 500 Growth ETF | |
Morgan
Stanley | |
| 2.20 | | |
5/21/2018 | |
Monthly | |
| 12,281 | | |
| — | |
| iShares S&P 500 Value ETF | |
Morgan
Stanley | |
| 0.50 | | |
5/04/2020 | |
Monthly | |
| (4,396 | ) | |
| — | |
| iShares S&P Small-Cap 600 Growth ETF | |
Morgan
Stanley | |
| 2.20 | | |
5/21/2018 | |
Monthly | |
| 11,165 | | |
| — | |
| iShares S&P Small-Cap 600 Value ETF | |
Morgan
Stanley | |
| 1.30 | | |
5/04/2020 | |
Monthly | |
| (33,156 | ) | |
| — | |
| iShares Short Treasury Bond ETF | |
Morgan
Stanley | |
| 2.20 | | |
5/21/2018 | |
Monthly | |
| 344,985 | | |
| — | |
| iShares U.S. Credit Bond ETF | |
Morgan
Stanley | |
| 2.20 | | |
5/21/2018 | |
Monthly | |
| 4,412 | | |
| — | |
| iShares U.S. Preferred Stock ETF | |
Morgan
Stanley | |
| 2.20 | | |
5/21/2018 | |
Monthly | |
| 2,859 | | |
| — | |
| PowerShares DB U.S. Dollar Index Bullish Fund | |
Morgan
Stanley | |
| (1.00 | ) | |
5/04/2020 | |
Monthly | |
| (172,650 | ) | |
| — | |
| PowerShares KBW Bank Portfolio | |
Morgan
Stanley | |
| 2.20 | | |
5/21/2018 | |
Monthly | |
| 4,032 | | |
| — | |
| PowerShares Preferred Portfolio | |
| |
| 2.20 | | |
5/21/2018 | |
Monthly | |
| 877 | | |
| — | |
| PowerShares S&P 500 Low Volatility Portfolio | |
Morgan
Stanley | |
| 1.30 | | |
5/04/2020 | |
Monthly | |
| (54,848 | ) | |
| — | |
| PowerShares Senior Loan Portfolio | |
Morgan
Stanley | |
| 2.20 | | |
5/21/2018 | |
Monthly | |
| 108,825 | | |
| — | |
| PowerShares Treasury Collateral Portfolio ETF | |
Morgan
Stanley | |
| 2.20 | | |
5/21/2018 | |
Monthly | |
| 13,858 | | |
| — | |
| Schwab Intermediate-Term U.S. Treasury ETF | |
| |
| (12.70 | ) | |
5/04/2020 | |
Monthly | |
| (16,022 | ) | |
| — | |
| SPDR Blackstone / GSO Senior Loan ETF | |
Morgan
Stanley | |
| 2.20 | | |
5/21/2018 | |
Monthly | |
| 34,109 | | |
| — | |
| SPDR Bloomberg Barclays 1-3 Month T-Bill ETF | |
Morgan
Stanley | |
| 2.20 | | |
5/21/2018 | |
Monthly | |
| 93,371 | | |
| — | |
| SPDR Bloomberg Barclays Convertible Securities ETF | |
Morgan
Stanley | |
| 2.20 | | |
5/21/2018 | |
Monthly | |
| 17,747 | | |
| — | |
| SPDR Bloomberg Barclays High Yield Bond ETF | |
Morgan
Stanley | |
| (0.75 | ) | |
5/04/2020 | |
Monthly | |
| (46,380 | ) | |
| — | |
| SPDR Bloomberg Barclays Short Term High Yield Bond ETF | |
| |
| 2.20 | | |
5/21/2018 | |
Monthly | |
| 14,396 | | |
| — | |
| SPDR Portfolio S&P 500 Growth ETF | |
Morgan
Stanley | |
| 2.20 | | |
5/21/2018 | |
Monthly | |
| 1,142 | | |
| — | |
See
notes to financial statements.
67
Schedules of Investments —
IQ Hedge Market Neutral Tracker ETF (continued)
April
30, 2018
Total Return Swap contracts outstanding at April 30, 2018
(continued):
Total Return
Benchmark
| |
Counterparty
| |
Annual
Financing
Rate
Received
(Paid) %
| |
Expiration
Date
| |
Payment
Frequency
Received/
(Paid)
| |
Notional
Amount
Long
(Short)
| |
Value/
Unrealized
Appreciation/
(Depreciation)(d)
|
| SPDR S&P Bank ETF | |
Morgan
Stanley | |
| 2.20 | | |
5/21/2018 | |
Monthly | |
$ | 14,388 | | |
$ | — | |
| SPDR S&P International Small Cap ETF | |
Morgan
Stanley | |
| 2.20 | | |
5/21/2018 | |
Monthly | |
| 4,556 | | |
| — | |
| VanEck Vectors High-Yield Municipal Index ETF | |
Morgan
Stanley | |
| 2.20 | | |
5/21/2018 | |
Monthly | |
| 18,399 | | |
| — | |
| Vanguard FTSE All World ex-U.S. Small-Cap ETF | |
Morgan
Stanley | |
| 2.20 | | |
5/21/2018 | |
Monthly | |
| 23,922 | | |
| — | |
| Vanguard FTSE Emerging Markets ETF | |
Morgan
Stanley | |
| 1.30 | | |
5/04/2020 | |
Monthly | |
| (35,767 | ) | |
| — | |
| Vanguard FTSE Europe ETF | |
Morgan
Stanley | |
| 1.30 | | |
5/04/2020 | |
Monthly | |
| (81,675 | ) | |
| — | |
| Vanguard FTSE Pacific ETF | |
Morgan
Stanley | |
| 0.50 | | |
5/04/2020 | |
Monthly | |
| (44,213 | ) | |
| — | |
| Vanguard Growth ETF | |
Morgan
Stanley | |
| 2.20 | | |
5/21/2018 | |
Monthly | |
| 20,060 | | |
| — | |
| Vanguard Intermediate-Term Corporate Bond ETF | |
Morgan
Stanley | |
| 2.20 | | |
5/21/2018 | |
Monthly | |
| 55,139 | | |
| — | |
| Vanguard Intermediate-Term Treasury ETF | |
| |
| 1.30 | | |
5/04/2020 | |
Monthly | |
| (20,316 | ) | |
| — | |
| Vanguard Mortgage-Backed Securities ETF | |
Morgan
Stanley | |
| 2.20 | | |
5/21/2018 | |
Monthly | |
| 27,147 | | |
| — | |
| Vanguard Small-Cap Growth ETF | |
Morgan
Stanley | |
| 2.20 | | |
5/21/2018 | |
Monthly | |
| 15,944 | | |
| — | |
| Vanguard Small-Cap Value ETF | |
Morgan
Stanley | |
| 1.30 | | |
5/04/2020 | |
Monthly | |
| (80,693 | ) | |
| — | |
| Vanguard Value ETF | |
Morgan
Stanley | |
| 1.30 | | |
5/04/2020 | |
Monthly | |
| (10,568 | ) | |
| — | |
| Xtrackers USD High Yield Corporate Bond ETF | |
| |
| 1.30 | | |
5/04/2020 | |
Monthly | |
| (5,299 | ) | |
| — | |
| | |
| |
| | | |
| |
| |
| | | |
$ | — | |
The total value of securities segregated as collateral for
swap contracts with counterparty Morgan Stanley amounted to $522,334 at April 30, 2018. The Fund either receives fees from, or pays to the
counterparty, the total return of the benchmark and the agreed-upon financing rate.
(d) |
|
Reflects the value at reset date of April 30,
2018. |
The following is a summary of the inputs used to value the
Fund’s investments as of April 30, 2018. For more information on the valuation techniques, and their aggregation into the levels used in the table
below, please refer to Note 2.
Asset Valuation Inputs
Description
|
|
|
|
Level 1
|
|
Level 2
|
|
Level 3
|
|
Total
|
| Investments in Securities:(e) |
|
|
|
|
|
|
|
|
|
|
|
|
|
|
|
|
|
|
| Exchange Traded Vehicle |
|
|
|
$ |
307,274 |
|
|
$ |
— |
|
|
$ |
— |
|
|
$ |
307,274 |
|
| Investment Companies |
|
|
|
|
12,480,234 |
|
|
|
— |
|
|
|
— |
|
|
|
12,480,234 |
|
| Short-Term Investment: |
|
|
|
|
|
|
|
|
|
|
|
|
|
|
|
|
|
|
| Money Market Fund |
|
|
|
|
17,484 |
|
|
|
— |
|
|
|
— |
|
|
|
17,484 |
|
| Investment of Cash Collateral for Securities Loaned: |
|
|
|
|
|
|
|
|
|
|
|
|
|
|
|
|
|
|
| Money Market Fund |
|
|
|
|
1,911,647 |
|
|
|
— |
|
|
|
— |
|
|
|
1,911,647 |
|
| Total Investments in Securities |
|
|
|
$ |
14,716,639 |
|
|
$ |
— |
|
|
$ |
— |
|
|
$ |
14,716,639 |
|
| Other Financial Instruments:(f) |
|
|
|
|
|
|
|
|
|
|
|
|
|
|
|
|
|
|
| Swap Contracts |
|
|
|
|
— |
|
|
|
— |
|
|
|
— |
|
|
|
— |
|
| Total Investments in Securities and Other Financial Instruments |
|
|
|
$ |
14,716,639 |
|
|
$ |
— |
|
|
$ |
— |
|
|
$ |
14,716,639 |
|
| |
|
|
|
|
|
|
|
|
|
|
| Liability Valuation Inputs
|
|
|
|
|
|
|
|
|
|
|
| |
|
|
|
|
|
|
|
|
|
|
Description
|
|
|
|
Level 1
|
|
Level 2
|
|
Level 3
|
|
Total
|
| Other Financial Instruments:(f) |
|
|
|
|
|
|
|
|
|
|
|
|
|
|
|
|
|
|
| Swap Contracts |
|
|
|
$ |
— |
|
|
$ |
— |
|
|
$ |
— |
|
|
$ |
— |
|
| Total Other Financial Instruments |
|
|
|
$ |
— |
|
|
$ |
— |
|
|
$ |
— |
|
|
$ |
— |
|
(e) |
|
For a complete listing of investments and their
industries, see the Schedules of Investments. |
(f) |
|
Reflects the unrealized appreciation (depreciation)
of the instruments. |
The Fund recognizes transfers between the levels as of the beginning
of the period.
For the year ended April 30, 2018, the Fund did not have any transfers
between any levels within the fair value hierarchy. (See Note 2)
See notes
to financial statements.
68
Schedules of Investments —
IQ Hedge Long/Short Tracker ETF
April
30, 2018
|
|
|
|
Shares
|
|
Value
|
|
|
|
|
|
|
|
|
|
|
|
Exchange Traded Note — 1.0%
|
|
|
|
|
|
|
|
|
|
|
| |
Volatility Fund — 1.0%
|
|
|
|
|
|
|
|
|
|
|
iPATH S&P 500 VIX Short-Term Futures ETN*(a)
(Cost $59,670) |
|
|
|
|
2,189 |
|
|
$ |
90,998 |
|
| |
Investment Companies — 99.0%
|
|
|
|
|
|
|
|
|
|
|
| |
Floating Rate Funds — 7.2%
|
|
|
|
|
|
|
|
|
|
|
PowerShares Senior Loan Portfolio |
|
|
|
|
20,735 |
|
|
|
479,186 |
|
SPDR Blackstone / GSO Senior Loan ETF |
|
|
|
|
3,166 |
|
|
|
150,195 |
|
Total Floating Rate Funds |
|
|
|
|
|
|
|
|
629,381 |
|
| |
International Equity Core
Fund — 11.3%
|
|
|
|
|
|
|
|
|
|
|
Xtrackers MSCI EAFE Hedged Equity ETF |
|
|
|
|
31,131 |
|
|
|
993,079 |
|
| |
International Large Cap Growth Fund — 7.2%
|
|
|
|
|
|
|
|
|
|
|
iShares MSCI EAFE Growth ETF |
|
|
|
|
7,835 |
|
|
|
633,381 |
|
| |
International Small Cap Equity Funds — 11.6%
|
|
|
|
|
|
|
|
|
|
|
iShares MSCI EAFE Small-Cap ETF |
|
|
|
|
10,024 |
|
|
|
657,775 |
|
SPDR S&P International Small
Cap ETF |
|
|
|
|
1,606 |
|
|
|
57,158 |
|
Vanguard FTSE All World ex-U.S. Small-Cap ETF |
|
|
|
|
2,509 |
|
|
|
300,101 |
|
Total International Small Cap Equity Funds |
|
|
|
|
|
|
|
|
1,015,034 |
|
| |
Investment Grade Corporate Bond Funds — 26.5%
|
|
|
|
|
|
|
|
|
|
|
iShares iBoxx $ Investment Grade Corporate Bond ETF |
|
|
|
|
12,326 |
|
|
|
1,420,202 |
|
iShares U.S. Credit Bond ETF |
|
|
|
|
622 |
|
|
|
66,933 |
|
Vanguard Intermediate-Term Corporate Bond ETF(a) |
|
|
|
|
9,937 |
|
|
|
831,429 |
|
Total Investment Grade Corporate Bond Funds |
|
|
|
|
|
|
|
|
2,318,564 |
|
| |
U.S. Large Cap Core Funds — 15.8%
|
|
|
|
|
|
|
|
|
|
|
Financial Select Sector SPDR Fund |
|
|
|
|
34,317 |
|
|
|
942,002 |
|
First Trust Dow Jones Internet Index Fund* |
|
|
|
|
753 |
|
|
|
93,251 |
|
Health Care Select Sector
SPDR Fund |
|
|
|
|
1,965 |
|
|
|
161,641 |
|
Technology Select Sector SPDR Fund(b) |
|
|
|
|
2,854 |
|
|
|
186,823 |
|
Total U.S. Large Cap Core Funds |
|
|
|
|
|
|
|
|
1,383,717 |
|
| |
U.S. Large Cap Growth Funds — 6.5%
|
|
|
|
|
|
|
|
|
|
|
iShares Russell 1000 Growth ETF |
|
|
|
|
1,773 |
|
|
|
241,926 |
|
iShares S&P 500 Growth ETF |
|
|
|
|
783 |
|
|
|
121,717 |
|
SPDR Portfolio S&P 500 Growth ETF |
|
|
|
|
346 |
|
|
|
11,622 |
|
Vanguard Growth ETF |
|
|
|
|
1,393 |
|
|
|
198,182 |
|
Total U.S. Large Cap Growth Funds |
|
|
|
|
|
|
|
|
573,447 |
|
| |
U.S. Preferred Funds — 2.1%
|
|
|
|
|
|
|
|
|
|
|
iShares U.S. Preferred Stock ETF(a) |
|
|
|
|
3,786 |
|
|
|
140,574 |
|
PowerShares Preferred Portfolio |
|
|
|
|
3,020 |
|
|
|
43,428 |
|
Total U.S. Preferred Funds |
|
|
|
|
|
|
|
|
184,002 |
|
|
|
|
|
Shares
|
|
Value
|
|
|
|
|
|
|
|
|
|
|
|
Investment Companies (continued)
|
|
|
|
|
|
|
|
|
|
|
| |
U.S. Short Term Treasury Bond Funds — 8.4%
|
|
|
|
|
|
|
|
|
|
|
Goldman Sachs Treasury Access 0-1 Year ETF |
|
|
|
|
477 |
|
|
$ |
47,729 |
|
iShares Short Treasury Bond ETF |
|
|
|
|
4,777 |
|
|
|
527,190 |
|
PowerShares Treasury Collateral Portfolio ETF |
|
|
|
|
201 |
|
|
|
21,262 |
|
SPDR Bloomberg Barclays 1-3 Month T-Bill ETF |
|
|
|
|
1,559 |
|
|
|
142,711 |
|
Total U.S. Short Term Treasury Bond Funds |
|
|
|
|
|
|
|
|
738,892 |
|
| |
U.S. Small Cap Growth Funds — 2.4%
|
|
|
|
|
|
|
|
|
|
|
iShares Russell 2000 Growth ETF(a) |
|
|
|
|
465 |
|
|
|
88,810 |
|
iShares S&P Small-Cap 600 Growth ETF(a) |
|
|
|
|
284 |
|
|
|
49,544 |
|
Vanguard Small-Cap Growth ETF(a) |
|
|
|
|
435 |
|
|
|
71,501 |
|
Total U.S. Small Cap Growth Funds |
|
|
|
|
|
|
|
|
209,855 |
|
| |
Total Investment Companies
|
|
|
|
|
|
|
|
|
|
|
(Cost $8,604,743) |
|
|
|
|
|
|
|
|
8,679,352 |
|
| |
Short-Term Investment — 0.2%
|
|
|
|
|
|
|
|
|
|
|
| |
Money Market Fund — 0.2%
|
|
|
|
|
|
|
|
|
|
|
Morgan Stanley Institutional Liquidity Funds Treasury Portfolio — Institutional Class,
1.58%(c)
|
|
|
|
|
|
|
|
|
|
|
(Cost $14,016) |
|
|
|
|
14,016 |
|
|
|
14,016 |
|
| |
Investment of Cash Collateral For Securities Loaned — 11.9%
|
|
|
|
|
|
|
|
|
|
|
| |
Money Market Fund — 11.9%
|
|
|
|
|
|
|
|
|
|
|
Dreyfus Government Cash Management Fund, Institutional Shares, 1.61%(c)
|
|
|
|
|
|
|
|
|
|
|
(Cost $1,040,224) |
|
|
|
|
1,040,224 |
|
|
|
1,040,224 |
|
| |
Total Investments — 112.1%
|
|
|
|
|
|
|
|
|
|
|
(Cost $9,718,653) |
|
|
|
|
|
|
|
|
9,824,590 |
|
| |
Other Assets and Liabilities,
Net — (12.1)% |
|
|
|
|
|
|
|
|
(1,060,420 |
) |
| |
Net Assets — 100.0% |
|
|
|
|
|
|
|
$ |
8,764,170 |
|
* |
|
Non-income producing securities. |
(a) |
|
All or a portion of the security was on loan. In
addition, “Other Assets and Liabilities, Net” may include pending sales that are also on loan. The aggregate market value of securities on
loan was $1,017,227; total market value of collateral held by the Fund was $1,040,224. |
(b) |
|
All or a portion of these securities have been
segregated as collateral for swap contracts. The total value of securities segregated amounted to $12,961. |
(c) |
|
Reflects the 1-day yield at April 30,
2018. |
See notes to financial
statements.
69
Schedules of Investments —
IQ Hedge Long/Short Tracker ETF (continued)
April
30, 2018
Total Return Swap contracts outstanding at April 30,
2018:
Total Return
Benchmark
| |
Counterparty
| |
Annual
Financing
Rate
Received
(Paid) %
| |
Expiration
Date
| |
Payment
Frequency
Received/
(Paid)
| |
Notional
Amount
Long
(Short)
| |
Value/
Unrealized
Appreciation/
(Depreciation)(d)
|
| Energy
Select Sector SPDR Fund | |
Morgan
Stanley | |
| 1.30 | | |
3/28/2019 | |
Monthly | |
$ | (160,020 | ) | |
$ | — | |
Financial Select
Sector
SPDR Fund | |
Morgan
Stanley | |
| 2.20 | | |
3/28/2019 | |
Monthly | |
| 93,357 | | |
| — | |
| First Trust Dow
Jones Internet Index Fund | |
| |
| 2.20 | | |
3/28/2019 | |
Monthly | |
| 9,288 | | |
| — | |
| Goldman Sachs
Treasury Access 0-1 Year ETF | |
| |
| 2.20 | | |
3/28/2019 | |
Monthly | |
| 4,703 | | |
| — | |
| Health Care Select
Sector SPDR Fund | |
Morgan
Stanley | |
| 2.20 | | |
3/28/2019 | |
Monthly | |
| 16,041 | | |
| — | |
| iPATH S&P
500 VIX Short-Term Futures ETN | |
Morgan
Stanley | |
| 2.20 | | |
3/28/2019 | |
Monthly | |
| 9,021 | | |
| — | |
| iShares Core
MSCI EAFE ETF | |
Morgan
Stanley | |
| 1.30 | | |
3/28/2019 | |
Monthly | |
| (65,507 | ) | |
| — | |
| iShares Core
MSCI Emerging Markets ETF | |
Morgan
Stanley | |
| 1.30 | | |
3/28/2019 | |
Monthly | |
| (59,977 | ) | |
| — | |
| iShares iBoxx
$ Investment Grade Corporate Bond ETF | |
Morgan
Stanley | |
| 2.20 | | |
3/28/2019 | |
Monthly | |
| 140,684 | | |
| — | |
| iShares MSCI
EAFE Growth ETF | |
| |
| 2.20 | | |
3/28/2019 | |
Monthly | |
| 62,732 | | |
| — | |
| iShares MSCI
EAFE Small-Cap ETF | |
Morgan
Stanley | |
| 2.20 | | |
3/28/2019 | |
Monthly | |
| 65,161 | | |
| — | |
| iShares Russell
1000 Growth ETF | |
Morgan
Stanley | |
| 2.20 | | |
3/28/2019 | |
Monthly | |
| 24,015 | | |
| — | |
| iShares Russell
1000 Value ETF | |
Morgan
Stanley | |
| 1.30 | | |
3/28/2019 | |
Monthly | |
| (61,373 | ) | |
| — | |
| iShares Russell
2000 Growth ETF | |
Morgan
Stanley | |
| 2.20 | | |
3/28/2019 | |
Monthly | |
| 8,786 | | |
| — | |
| iShares Russell
2000 Value ETF | |
Morgan
Stanley | |
| 1.30 | | |
3/28/2019 | |
Monthly | |
| (49,280 | ) | |
| — | |
| iShares S&P
500 Growth ETF | |
Morgan
Stanley | |
| 2.20 | | |
3/28/2019 | |
Monthly | |
| 12,125 | | |
| — | |
| iShares S&P
500 Value ETF | |
Morgan
Stanley | |
| 0.50 | | |
3/28/2019 | |
Monthly | |
| (24,835 | ) | |
| — | |
| iShares S&P
Small-Cap 600 Growth ETF | |
Morgan
Stanley | |
| 2.20 | | |
3/28/2019 | |
Monthly | |
| 4,885 | | |
| — | |
| iShares S&P
Small-Cap 600 Value ETF | |
Morgan
Stanley | |
| 1.30 | | |
3/28/2019 | |
Monthly | |
| (28,705 | ) | |
| — | |
| iShares Short
Treasury Bond ETF | |
Morgan
Stanley | |
| 2.20 | | |
3/28/2019 | |
Monthly | |
| 52,200 | | |
| — | |
| iShares U.S.
Credit Bond ETF | |
Morgan
Stanley | |
| 2.20 | | |
3/28/2019 | |
Monthly | |
| 6,672 | | |
| — | |
| iShares U.S.
Preferred Stock ETF | |
Morgan
Stanley | |
| 2.20 | | |
3/28/2019 | |
Monthly | |
| 13,924 | | |
| — | |
| iShares U.S.
Real Estate ETF | |
Morgan
Stanley | |
| 0.88 | | |
3/28/2019 | |
Monthly | |
| (15,431 | ) | |
| — | |
| PowerShares Preferred
Portfolio | |
| |
| 2.20 | | |
3/28/2019 | |
Monthly | |
| 4,300 | | |
| — | |
| PowerShares Senior
Loan Portfolio | |
Morgan
Stanley | |
| 2.20 | | |
3/28/2019 | |
Monthly | |
| 47,491 | | |
| — | |
| PowerShares Treasury
Collateral Portfolio ETF | |
| |
| 2.20 | | |
3/28/2019 | |
Monthly | |
| 2,116 | | |
| — | |
| SPDR Blackstone
/ GSO Senior Loan ETF | |
Morgan
Stanley | |
| 2.20 | | |
3/28/2019 | |
Monthly | |
| 14,896 | | |
| — | |
| SPDR Bloomberg
Barclays 1-3 Month T-Bill ETF | |
Morgan
Stanley | |
| 2.20 | | |
3/28/2019 | |
Monthly | |
| 14,189 | | |
| — | |
| SPDR Dow Jones
REIT ETF | |
Morgan
Stanley | |
| (0.25 | ) | |
3/28/2019 | |
Monthly | |
| (9,875 | ) | |
| — | |
| SPDR Portfolio
S&P 500 Growth ETF | |
| |
| 2.20 | | |
3/28/2019 | |
Monthly | |
| 1,108 | | |
| — | |
| SPDR S&P
International Small Cap ETF | |
Morgan
Stanley | |
| 2.20 | | |
3/28/2019 | |
Monthly | |
| 5,659 | | |
| — | |
| Technology Select
Sector SPDR Fund | |
Morgan
Stanley | |
| 2.20 | | |
3/28/2019 | |
Monthly | |
| 18,525 | | |
| — | |
| Vanguard FTSE
All World ex-U.S. Small-Cap ETF | |
Morgan
Stanley | |
| 2.20 | | |
3/28/2019 | |
Monthly | |
| 29,783 | | |
| — | |
| Vanguard FTSE
Developed Markets ETF | |
Morgan
Stanley | |
| 1.30 | | |
3/28/2019 | |
Monthly | |
| (82,450 | ) | |
| — | |
| Vanguard FTSE
Emerging Markets ETF | |
Morgan
Stanley | |
| 1.30 | | |
3/28/2019 | |
Monthly | |
| (82,178 | ) | |
| — | |
| Vanguard Growth
ETF | |
Morgan
Stanley | |
| 2.20 | | |
3/28/2019 | |
Monthly | |
| 19,633 | | |
| — | |
| Vanguard Intermediate-Term
Corporate Bond ETF | |
| |
| 2.20 | | |
3/28/2019 | |
Monthly | |
| 82,415 | | |
| — | |
| Vanguard Real
Estate ETF | |
Morgan
Stanley | |
| 1.15 | | |
3/28/2019 | |
Monthly | |
| (122,048 | ) | |
| — | |
| Vanguard Small-Cap
Growth ETF | |
Morgan
Stanley | |
| 2.20 | | |
3/28/2019 | |
Monthly | |
| 7,068 | | |
| — | |
See
notes to financial statements.
70
Schedules of Investments —
IQ Hedge Long/Short Tracker ETF (continued)
April
30, 2018
Total Return Swap contracts outstanding at April 30,
2018 (continued):
Total Return
Benchmark
| |
Counterparties
| |
Annual
Financing
Rate
Received
(Paid) %
| |
Expiration
Date
| |
Payment
Frequency
Received/
(Paid)
| |
Notional
Amount
Long
(Short)
| |
Value/
Unrealized
Appreciation/
(Depreciation)(d)
|
| Vanguard Small-Cap Value ETF | |
Morgan Stanley | |
| 1.30 | | |
3/28/2019 | |
Monthly | |
$ | (69,778 | ) | |
$ | — | |
| Vanguard Value ETF | |
Morgan Stanley | |
| 1.30 | | |
3/28/2019 | |
Monthly | |
| (60,612 | ) | |
| — | |
| Xtrackers MSCI EAFE Hedged Equity ETF | |
Morgan Stanley | |
| 2.20 | | |
3/28/2019 | |
Monthly | |
| 98,412 | | |
| — | |
| | |
| |
| | | |
| |
| |
| | | |
$ | — | |
The total value of securities segregated as collateral for swap contracts with counterparty Morgan Stanley amounted to $12,961
at April 30, 2018. The Fund either receives from, or pays to the counterparty, the total return of the benchmark and the agreed-upon
financing rate.
(d) |
|
Reflects the value at reset date of April 30,
2018. |
The following is a summary of the inputs used to value the
Fund’s investments as of April 30, 2018. For more information on the valuation techniques, and their aggregation into the levels used in the table
below, please refer to Note 2.
Asset Valuation Inputs
Description
|
|
|
|
Level 1
|
|
Level 2
|
|
Level 3
|
|
Total
|
Investments in Securities:(e)
|
|
|
|
|
|
|
|
|
|
|
|
|
|
|
|
|
|
|
Exchange Traded Notes |
|
|
|
$ |
90,998 |
|
|
$ |
— |
|
|
$ |
— |
|
|
$ |
90,998 |
|
Investment Companies |
|
|
|
|
8,679,352 |
|
|
|
— |
|
|
|
— |
|
|
|
8,679,352 |
|
Short-Term Investment:
|
|
|
|
|
|
|
|
|
|
|
|
|
|
|
|
|
|
|
Money Market Fund |
|
|
|
|
14,016 |
|
|
|
— |
|
|
|
— |
|
|
|
14,016 |
|
Investment of Cash Collateral for Securities Loaned:
|
|
|
|
|
|
|
|
|
|
|
|
|
|
|
|
|
|
|
Money Market Fund |
|
|
|
|
1,040,224 |
|
|
|
— |
|
|
|
— |
|
|
|
1,040,224 |
|
Total Investments in Securities |
|
|
|
$ |
9,824,590 |
|
|
$ |
— |
|
|
$ |
— |
|
|
$ |
9,824,590 |
|
Other Financial Instruments:(f)
|
|
|
|
|
|
|
|
|
|
|
|
|
|
|
|
|
|
|
Swap Contracts |
|
|
|
|
— |
|
|
|
— |
|
|
|
— |
|
|
|
— |
|
Total Investments in Securities and Other Financial Instruments |
|
|
|
$ |
9,824,590 |
|
|
$ |
— |
|
|
$ |
— |
|
|
$ |
9,824,590 |
|
| |
|
|
|
|
|
|
|
|
|
|
Liability Valuation Inputs
|
|
|
|
|
|
|
|
|
|
|
Description
|
|
|
|
Level 1
|
|
Level 2
|
|
Level 3
|
|
Total
|
Other Financial Instruments:(f)
|
|
|
|
|
|
|
|
|
|
|
|
|
|
|
|
|
|
|
Swap Contracts |
|
|
|
|
— |
|
|
|
— |
|
|
|
— |
|
|
|
— |
|
Total Other Financial Instruments |
|
|
|
$ |
— |
|
|
$ |
— |
|
|
$ |
— |
|
|
$ |
— |
|
(e) |
|
For a complete listing of investments and their
industries, see the Schedules of Investments. |
(f) |
|
Reflects the unrealized appreciation (depreciation)
of the instruments. |
The
Fund recognizes transfers between the levels as of the beginning of the period.
For
the year ended April 30, 2018, the Fund did not have any transfers between any levels
within the fair value hierarchy. (See Note 2)
See notes to financial
statements.
71
Schedules of Investments —
IQ Hedge Event-Driven Tracker ETF
April
30, 2018
|
|
|
|
Shares
|
|
Value
|
|
|
|
|
|
|
|
|
|
|
|
Investment Companies — 99.7%
|
|
|
|
|
|
|
|
|
|
|
| |
Convertible Bond Fund — 21.9%
|
|
|
|
|
|
|
|
|
|
|
SPDR Bloomberg Barclays Convertible Securities ETF(a)(b) |
|
|
|
|
13,380 |
|
|
$ |
688,267 |
|
| |
Floating Rate Funds — 23.8%
|
|
|
|
|
|
|
|
|
|
|
PowerShares Senior Loan Portfolio |
|
|
|
|
24,576 |
|
|
|
567,951 |
|
SPDR Blackstone / GSO Senior Loan ETF(a) |
|
|
|
|
3,752 |
|
|
|
177,995 |
|
Total Floating Rate Funds |
|
|
|
|
|
|
|
|
745,946 |
|
| |
High Yield Corporate Bond
Funds — 16.9%
|
|
|
|
|
|
|
|
|
|
|
iShares iBoxx $ High Yield Corporate Bond ETF(a) |
|
|
|
|
3,626 |
|
|
|
310,748 |
|
SPDR Bloomberg Barclays High Yield Bond ETF(a) |
|
|
|
|
5,478 |
|
|
|
196,496 |
|
Xtrackers USD High Yield Corporate Bond ETF |
|
|
|
|
455 |
|
|
|
22,532 |
|
Total High Yield Corporate Bond Funds |
|
|
|
|
|
|
|
|
529,776 |
|
| |
Investment Grade Corporate Bond Funds — 30.5%
|
|
|
|
|
|
|
|
|
|
|
SPDR Portfolio Short Term Corporate Bond ETF |
|
|
|
|
4,838 |
|
|
|
145,963 |
|
Vanguard Short-Term Corporate Bond ETF |
|
|
|
|
10,370 |
|
|
|
810,519 |
|
Total Investment Grade Corporate Bond Funds |
|
|
|
|
|
|
|
|
956,482 |
|
| |
U.S. Short Term Treasury Bond Funds — 0.0%(c)
|
|
|
|
|
|
|
|
|
|
|
Goldman Sachs Treasury Access 0-1 Year ETF |
|
|
|
|
1 |
|
|
|
100 |
|
iShares Short Treasury Bond ETF |
|
|
|
|
12 |
|
|
|
1,324 |
|
SPDR Bloomberg Barclays 1-3 Month T-Bill ETF |
|
|
|
|
4 |
|
|
|
366 |
|
Total U.S. Short Term Treasury Bond Funds |
|
|
|
|
|
|
|
|
1,790 |
|
|
|
|
|
|
|
|
|
|
|
|
|
|
|
|
Shares
|
|
Value
|
|
|
|
|
|
|
|
|
|
|
|
U.S. Small Cap Growth Funds — 6.6%
|
|
|
|
|
|
|
|
|
|
|
iShares Russell 2000 Growth ETF(a) |
|
|
|
|
463 |
|
|
$ |
88,428 |
|
iShares S&P Small-Cap 600 Growth ETF(a) |
|
|
|
|
282 |
|
|
|
49,195 |
|
Vanguard Small-Cap Growth ETF(a) |
|
|
|
|
432 |
|
|
|
71,008 |
|
Total U.S. Small Cap Growth Funds |
|
|
|
|
|
|
|
|
208,631 |
|
| |
Total Investment Companies
|
|
|
|
|
|
|
|
|
|
|
(Cost $3,084,385) |
|
|
|
|
|
|
|
|
3,130,892 |
|
| |
Short-Term Investment — 0.3%
|
|
|
|
|
|
|
|
|
|
|
| |
Money Market Fund — 0.3%
|
|
|
|
|
|
|
|
|
|
|
Morgan Stanley Institutional Liquidity Funds Treasury Portfolio — Institutional Class,
1.58%(d)
|
|
|
|
|
|
|
|
|
|
|
(Cost $8,575) |
|
|
|
|
8,575 |
|
|
|
8,575 |
|
| |
Investment of Cash Collateral For Securities Loaned — 32.5%
|
|
|
|
|
|
|
|
|
|
|
| |
Money Market Fund — 32.5%
|
|
|
|
|
|
|
|
|
|
|
Dreyfus Government Cash Management Fund, Institutional Shares, 1.61%(d)
|
|
|
|
|
|
|
|
|
|
|
| (Cost $1,021,562) |
|
|
|
|
1,021,562 |
|
|
|
1,021,562 |
|
| |
Total Investments — 132.5%
|
|
|
|
|
|
|
|
|
|
|
(Cost $4,114,522) |
|
|
|
|
|
|
|
|
4,161,029 |
|
| |
Other Assets and Liabilities,
Net — (32.5)% |
|
|
|
|
|
|
|
|
(1,022,053 |
) |
| |
Net Assets — 100.0% |
|
|
|
|
|
|
|
$ |
3,138,976 |
|
(a) |
|
All or a portion of the security was on loan. In
addition, “Other Assets and Liabilities, Net” may include pending sales that are also on loan. The aggregate market value of securities on
loan was $1,013,117; total market value of collateral held by the Fund was $1,037,887. Market value of the collateral held includes non-cash U.S.
Treasury securities collateral having a value of $16,325. |
(b) |
|
All or a portion of these securities have been
segregated as collateral for swap contracts. The total value of securities segregated amounted to $5,144. |
(d) |
|
Reflects the 1-day yield at April 30,
2018. |
See notes to financial statements.
72
Schedules of Investments —
IQ Hedge Event-Driven Tracker ETF (continued)
April
30, 2018
Total Return Swap contracts outstanding at April 30,
2018:
Total Return Benchmark
| |
Counterparty
| |
Annual
Financing
Rate
Received
(Paid) %
| |
Expiration
Date
| |
Payment
Frequency
Received/
(Paid)
| |
Notional
Amount
Long
(Short)
| |
Value/
Unrealized
Appreciation/
(Depreciation)(e)
|
| iShares iBoxx $ High Yield Corporate Bond ETF | |
Morgan
Stanley | |
| 2.20 | | |
3/28/2019 | |
Monthly | |
$ | 9,341 | | |
$ | — | |
| iShares Russell 2000 Growth ETF | |
Morgan
Stanley | |
| 2.20 | | |
3/28/2019 | |
Monthly | |
| 2,674 | | |
| — | |
| iShares S&P Small-Cap 600 Growth ETF | |
Morgan
Stanley | |
| 2.20 | | |
3/28/2019 | |
Monthly | |
| 1,396 | | |
| — | |
| iShares U.S. Preferred Stock ETF | |
Morgan
Stanley | |
| 0.35 | | |
3/28/2019 | |
Monthly | |
| (71,030 | ) | |
| — | |
| PowerShares Preferred Portfolio | |
Morgan
Stanley | |
| (0.25 | ) | |
3/28/2019 | |
Monthly | |
| (21,930 | ) | |
| — | |
| PowerShares Senior Loan Portfolio | |
Morgan
Stanley | |
| 2.20 | | |
3/28/2019 | |
Monthly | |
| 17,101 | | |
| — | |
| SPDR Blackstone / GSO Senior Loan ETF | |
Morgan
Stanley | |
| 2.20 | | |
3/28/2019 | |
Monthly | |
| 5,361 | | |
| — | |
| SPDR Bloomberg Barclays Convertible Securities ETF | |
Morgan
Stanley | |
| 2.20 | | |
3/28/2019 | |
Monthly | |
| 20,730 | | |
| — | |
| SPDR Bloomberg Barclays High Yield Bond ETF | |
Morgan
Stanley | |
| 2.20 | | |
3/28/2019 | |
Monthly | |
| 5,919 | | |
| — | |
| SPDR Portfolio Short Term Corporate Bond ETF | |
Morgan
Stanley | |
| 2.20 | | |
3/28/2019 | |
Monthly | |
| 4,405 | | |
| — | |
| Vanguard Short-Term Corporate Bond ETF | |
Morgan
Stanley | |
| 2.20 | | |
3/28/2019 | |
Monthly | |
| 24,386 | | |
| — | |
| Vanguard Small-Cap Growth ETF | |
Morgan
Stanley | |
| 2.20 | | |
3/28/2019 | |
Monthly | |
| 2,137 | | |
| — | |
| Xtrackers USD High Yield Corporate Bond ETF | |
Morgan
Stanley | |
| 2.20 | | |
3/28/2019 | |
Monthly | |
| 693 | | |
| — | |
| | |
| |
| | | |
| |
| |
| | | |
$ | — | |
The
total value of securities segregated as collateral for swap contracts with counterparty Morgan Stanley amounted
to $5,144 at April 30, 2018. The Fund either receives fees from, or pays to the counterparty, the total return
of the benchmark and the agreed-upon financing rate.
(e) |
|
Reflects the value at reset date of April 30,
2018. |
The
following is a summary of the inputs used to value the Fund’s investments as of April 30, 2018. For more
information on the valuation techniques, and their aggregation into the levels used in the table below, please
refer to Note 2.
Asset Valuation Inputs
Description
|
|
|
|
Level 1
|
|
Level 2
|
|
Level 3
|
|
Total
|
Investments in Securities:(f)
|
|
|
|
|
|
|
|
|
|
|
|
|
|
|
|
|
|
|
Investment Companies |
|
|
|
$ |
3,130,892 |
|
|
$ |
— |
|
|
$ |
— |
|
|
$ |
3,130,892 |
|
Short-Term Investment:
|
|
|
|
|
|
|
|
|
|
|
|
|
|
|
|
|
|
|
Money Market Fund |
|
|
|
|
8,575 |
|
|
|
— |
|
|
|
— |
|
|
|
8,575 |
|
Investment of Cash Collateral for Securities Loaned:
|
|
|
|
|
|
|
|
|
|
|
|
|
|
|
|
|
|
|
Money Market Fund |
|
|
|
|
1,021,562 |
|
|
|
— |
|
|
|
— |
|
|
|
1,021,562 |
|
Total Investments in Securities |
|
|
|
|
4,161,029 |
|
|
|
— |
|
|
|
— |
|
|
|
4,161,029 |
|
Other Financial Instruments:(g)
|
|
|
|
|
|
|
|
|
|
|
|
|
|
|
|
|
|
|
Swap Contracts |
|
|
|
|
— |
|
|
|
— |
|
|
|
— |
|
|
|
— |
|
Total Investments in Securities and Other Financial Instruments |
|
|
|
$ |
4,161,029 |
|
|
$ |
— |
|
|
$ |
— |
|
|
$ |
4,161,029 |
|
| |
|
|
|
|
|
|
|
|
|
|
| Liability Valuation Inputs
|
|
|
|
|
|
|
|
|
|
|
| |
|
|
|
|
|
|
|
|
|
|
Description
|
|
|
|
Level 1
|
|
Level 2
|
|
Level 3
|
|
Total
|
Other Financial Instruments:(g)
|
|
|
|
|
|
|
|
|
|
|
|
|
|
|
|
|
|
|
Swap Contracts |
|
|
|
$ |
— |
|
|
$ |
— |
|
|
$ |
— |
|
|
$ |
— |
|
Total Other Financial Instruments |
|
|
|
$ |
— |
|
|
$ |
— |
|
|
$ |
— |
|
|
$ |
— |
|
(f) |
|
For a complete listing of investments and their
industries, see the Schedules of Investments. |
(g) |
|
Reflects the unrealized appreciation (depreciation)
of the instruments. |
The Fund recognizes transfers between the levels
as of the beginning of the period.
For
the year ended April 30, 2018, the Fund did not have any transfers between any levels
within the fair value hierarchy. (See Note 2)
See notes to financial
statements.
73
Schedules of Investments —
IQ Global Resources ETF
April
30, 2018
|
|
|
|
Shares
|
|
Value
|
|
|
|
|
|
|
|
|
|
|
|
Common Stocks — 90.1%
|
|
|
|
|
|
|
|
|
|
|
| |
Argentina — 0.1%
|
|
|
|
|
|
|
|
|
|
|
Adecoagro SA* |
|
|
|
|
15,786 |
|
|
$ |
121,868 |
|
| |
Australia — 5.1%
|
|
|
|
|
|
|
|
|
|
|
Aurizon Holdings Ltd. |
|
|
|
|
378,210 |
|
|
|
1,284,713 |
|
BHP Billiton Ltd. |
|
|
|
|
200,498 |
|
|
|
4,684,154 |
|
Evolution Mining Ltd. |
|
|
|
|
160,256 |
|
|
|
388,311 |
|
Fortescue Metals Group Ltd. |
|
|
|
|
194,384 |
|
|
|
669,092 |
|
GrainCorp Ltd., Class A |
|
|
|
|
29,839 |
|
|
|
200,238 |
|
Independence Group NL |
|
|
|
|
55,560 |
|
|
|
216,827 |
|
Mineral Resources Ltd. |
|
|
|
|
11,718 |
|
|
|
159,216 |
|
Newcrest Mining Ltd. |
|
|
|
|
72,660 |
|
|
|
1,160,022 |
|
Northern Star Resources Ltd. |
|
|
|
|
57,108 |
|
|
|
275,460 |
|
OceanaGold Corp. |
|
|
|
|
59,820 |
|
|
|
161,455 |
|
OZ
Minerals Ltd. |
|
|
|
|
18,647 |
|
|
|
130,200 |
|
Regis Resources Ltd. |
|
|
|
|
47,748 |
|
|
|
170,121 |
|
Sandfire Resources NL |
|
|
|
|
9,877 |
|
|
|
59,198 |
|
Saracen Mineral Holdings Ltd.* |
|
|
|
|
77,434 |
|
|
|
110,473 |
|
South32 Ltd. |
|
|
|
|
321,346 |
|
|
|
902,353 |
|
St. Barbara Ltd. |
|
|
|
|
48,908 |
|
|
|
157,641 |
|
Washington H Soul Pattinson & Co., Ltd.(a) |
|
|
|
|
45,494 |
|
|
|
666,561 |
|
Whitehaven Coal Ltd. |
|
|
|
|
194,994 |
|
|
|
680,023 |
|
Woodside Petroleum Ltd. |
|
|
|
|
5,629 |
|
|
|
136,904 |
|
Total Australia |
|
|
|
|
|
|
|
|
12,212,962 |
|
| |
Canada — 6.6%
|
|
|
|
|
|
|
|
|
|
|
Agnico Eagle Mines Ltd. |
|
|
|
|
22,418 |
|
|
|
944,845 |
|
Alamos Gold, Inc., Class A(a) |
|
|
|
|
37,793 |
|
|
|
204,597 |
|
B2Gold Corp.* |
|
|
|
|
93,744 |
|
|
|
269,835 |
|
Barrick Gold Corp. |
|
|
|
|
112,866 |
|
|
|
1,521,373 |
|
Canadian Natural Resources Ltd. |
|
|
|
|
7,312 |
|
|
|
264,201 |
|
Canfor Corp.* |
|
|
|
|
32,762 |
|
|
|
753,658 |
|
Centerra Gold, Inc.* |
|
|
|
|
28,108 |
|
|
|
171,900 |
|
Detour Gold Corp.* |
|
|
|
|
17,195 |
|
|
|
124,474 |
|
Enbridge, Inc. |
|
|
|
|
9,812 |
|
|
|
297,663 |
|
First Majestic Silver Corp.*(a) |
|
|
|
|
16,071 |
|
|
|
104,553 |
|
Goldcorp, Inc. |
|
|
|
|
83,564 |
|
|
|
1,110,754 |
|
Hudbay Minerals, Inc. |
|
|
|
|
16,009 |
|
|
|
112,018 |
|
IAMGOLD Corp.* |
|
|
|
|
44,626 |
|
|
|
244,374 |
|
Imperial Oil Ltd. |
|
|
|
|
4,982 |
|
|
|
155,179 |
|
Kinross Gold Corp.* |
|
|
|
|
118,884 |
|
|
|
460,902 |
|
Kirkland Lake Gold Ltd. |
|
|
|
|
20,376 |
|
|
|
356,038 |
|
Labrador Iron Ore Royalty Corp. |
|
|
|
|
3,951 |
|
|
|
67,342 |
|
Lundin Mining Corp. |
|
|
|
|
45,526 |
|
|
|
301,861 |
|
Maple Leaf Foods, Inc. |
|
|
|
|
64,813 |
|
|
|
1,564,774 |
|
New Gold, Inc.* |
|
|
|
|
55,430 |
|
|
|
130,149 |
|
Norbord, Inc. |
|
|
|
|
22,397 |
|
|
|
926,315 |
|
Osisko Gold Royalties Ltd. |
|
|
|
|
15,324 |
|
|
|
149,779 |
|
Pan American Silver Corp. |
|
|
|
|
14,771 |
|
|
|
238,511 |
|
Pretium Resources, Inc.* |
|
|
|
|
17,917 |
|
|
|
120,756 |
|
SEMAFO, Inc.* |
|
|
|
|
31,215 |
|
|
|
96,912 |
|
SSR Mining, Inc.* |
|
|
|
|
11,576 |
|
|
|
118,744 |
|
Stella-Jones, Inc. |
|
|
|
|
17,867 |
|
|
|
648,505 |
|
Suncor Energy, Inc. |
|
|
|
|
9,804 |
|
|
|
375,503 |
|
Teck Resources Ltd., Class B |
|
|
|
|
35,329 |
|
|
|
888,220 |
|
TransCanada Corp. |
|
|
|
|
5,237 |
|
|
|
222,397 |
|
West Fraser Timber Co. Ltd. |
|
|
|
|
19,287 |
|
|
|
1,308,468 |
|
Westshore Terminals Investment Corp. |
|
|
|
|
13,365 |
|
|
|
231,134 |
|
Wheaton Precious Metals Corp. |
|
|
|
|
42,817 |
|
|
|
890,107 |
|
Yamana Gold, Inc. |
|
|
|
|
91,663 |
|
|
|
263,845 |
|
Total Canada |
|
|
|
|
|
|
|
|
15,639,686 |
|
|
|
|
|
|
|
|
|
|
|
|
|
|
|
|
Shares
|
|
Value
|
Common Stocks (continued)
|
|
|
|
|
|
|
|
|
|
|
| |
Chile — 0.3%
|
|
|
|
|
|
|
|
|
|
|
Antofagasta PLC |
|
|
|
|
61,706 |
|
|
$ |
826,450 |
|
| |
China — 10.2%
|
|
|
|
|
|
|
|
|
|
|
Aluminum Corp. of China Ltd., Class H*(a) |
|
|
|
|
1,187,962 |
|
|
|
679,635 |
|
Beijing Enterprises Water Group Ltd.*(a) |
|
|
|
|
2,969,971 |
|
|
|
1,740,753 |
|
China Agri-Industries Holdings Ltd. |
|
|
|
|
684,536 |
|
|
|
288,703 |
|
China Coal Energy Co., Ltd., Class H(a) |
|
|
|
|
4,325,022 |
|
|
|
1,884,697 |
|
China Modern Dairy Holdings Ltd.*(a) |
|
|
|
|
3,129,112 |
|
|
|
534,261 |
|
China Petroleum & Chemical Corp., Class H |
|
|
|
|
842,166 |
|
|
|
823,039 |
|
China Resources Power Holdings Co., Ltd. |
|
|
|
|
914,196 |
|
|
|
1,761,239 |
|
China Shenhua Energy Co., Ltd., Class H |
|
|
|
|
4,882,054 |
|
|
|
12,105,217 |
|
CNOOC Ltd. |
|
|
|
|
268,493 |
|
|
|
450,211 |
|
Jiangxi Copper Co., Ltd., Class H |
|
|
|
|
336,813 |
|
|
|
483,231 |
|
MMG Ltd.* |
|
|
|
|
501,551 |
|
|
|
377,685 |
|
PetroChina Co., Ltd., Class H |
|
|
|
|
1,862,106 |
|
|
|
1,373,758 |
|
Shougang Fushan Resources Group Ltd.(a) |
|
|
|
|
1,007,579 |
|
|
|
250,346 |
|
Yanzhou Coal Mining Co., Ltd., Class H |
|
|
|
|
1,316,164 |
|
|
|
1,670,308 |
|
Total China |
|
|
|
|
|
|
|
|
24,423,083 |
|
| |
Denmark — 0.1%
|
|
|
|
|
|
|
|
|
|
|
Orsted A/S‡ |
|
|
|
|
2,534 |
|
|
|
167,285 |
|
| |
Finland — 4.1%
|
|
|
|
|
|
|
|
|
|
|
Stora Enso OYJ, Class R |
|
|
|
|
205,550 |
|
|
|
4,081,556 |
|
UPM-Kymmene OYJ |
|
|
|
|
138,753 |
|
|
|
4,975,593 |
|
Valmet OYJ |
|
|
|
|
38,958 |
|
|
|
741,808 |
|
Total Finland |
|
|
|
|
|
|
|
|
9,798,957 |
|
| |
France — 3.5%
|
|
|
|
|
|
|
|
|
|
|
Suez |
|
|
|
|
200,141 |
|
|
|
2,892,050 |
|
TOTAL SA |
|
|
|
|
15,881 |
|
|
|
1,004,077 |
|
Veolia Environnement SA* |
|
|
|
|
181,461 |
|
|
|
4,309,183 |
|
Vilmorin & Cie SA |
|
|
|
|
2,723 |
|
|
|
192,790 |
|
Total France |
|
|
|
|
|
|
|
|
8,398,100 |
|
| |
Germany — 0.8%
|
|
|
|
|
|
|
|
|
|
|
Aurubis AG |
|
|
|
|
2,815 |
|
|
|
252,088 |
|
BayWa AG |
|
|
|
|
4,578 |
|
|
|
160,127 |
|
GEA Group AG |
|
|
|
|
25,168 |
|
|
|
985,522 |
|
Innogy SE‡ |
|
|
|
|
3,352 |
|
|
|
147,942 |
|
Suedzucker AG |
|
|
|
|
26,696 |
|
|
|
444,784 |
|
Total Germany |
|
|
|
|
|
|
|
|
1,990,463 |
|
| |
Hong Kong — 0.5%
|
|
|
|
|
|
|
|
|
|
|
C.P. Pokphand Co., Ltd. |
|
|
|
|
12,284,865 |
|
|
|
1,111,363 |
|
Hong Kong & China Gas Co., Ltd. |
|
|
|
|
84,118 |
|
|
|
176,205 |
|
Total Hong Kong |
|
|
|
|
|
|
|
|
1,287,568 |
|
| |
India — 0.1%
|
|
|
|
|
|
|
|
|
|
|
Vedanta Resources PLC |
|
|
|
|
17,079 |
|
|
|
171,300 |
|
| |
Indonesia — 0.1%
|
|
|
|
|
|
|
|
|
|
|
Sakari Resources Ltd.*(b)(c) |
|
|
|
|
240,456 |
|
|
|
214,241 |
|
| |
Ireland — 0.1%
|
|
|
|
|
|
|
|
|
|
|
Greencore Group PLC |
|
|
|
|
92,365 |
|
|
|
201,960 |
|
|
|
|
|
|
|
|
|
|
|
|
See notes to financial
statements.
74
Schedules of Investments —
IQ Global Resources ETF (continued)
April
30, 2018
|
|
|
|
Shares
|
|
Value
|
Common Stocks (continued)
|
|
|
|
|
|
|
|
|
|
|
| |
|
|
|
|
|
|
|
|
|
|
Italy — 0.2%
|
|
|
|
|
|
|
|
|
|
|
Eni SpA |
|
|
|
|
21,915 |
|
|
$ |
428,939 |
|
Snam SpA |
|
|
|
|
21,106 |
|
|
|
101,618 |
|
Total Italy |
|
|
|
|
|
|
|
|
530,557 |
|
| |
|
|
|
|
|
|
|
|
|
|
Japan — 5.1%
|
|
|
|
|
|
|
|
|
|
|
Daio Paper Corp. |
|
|
|
|
38,823 |
|
|
|
544,604 |
|
Doutor Nichires Holdings Co. Ltd. |
|
|
|
|
6,753 |
|
|
|
141,201 |
|
Dowa Holdings Co., Ltd. |
|
|
|
|
3,960 |
|
|
|
149,461 |
|
Fuji Oil Holdings, Inc. |
|
|
|
|
11,284 |
|
|
|
362,470 |
|
Fujicco Co. Ltd. |
|
|
|
|
4,669 |
|
|
|
107,525 |
|
Hokuto Corp. |
|
|
|
|
4,451 |
|
|
|
78,587 |
|
Inpex Corp. |
|
|
|
|
8,599 |
|
|
|
110,213 |
|
Itoham Yonekyu Holdings, Inc. |
|
|
|
|
151,683 |
|
|
|
1,379,251 |
|
Kurita Water Industries Ltd. |
|
|
|
|
37,397 |
|
|
|
1,213,245 |
|
Mitsui Mining & Smelting Co., Ltd. |
|
|
|
|
3,660 |
|
|
|
155,698 |
|
Mitsui Sugar Co., Ltd. |
|
|
|
|
3,780 |
|
|
|
151,304 |
|
NH
Foods Ltd. |
|
|
|
|
54,936 |
|
|
|
2,402,273 |
|
Nichirei Corp. |
|
|
|
|
18,270 |
|
|
|
528,440 |
|
Nippon Coke & Engineering Co. Ltd. |
|
|
|
|
57,596 |
|
|
|
61,583 |
|
Nippon Flour Mills Co., Ltd. |
|
|
|
|
10,611 |
|
|
|
173,286 |
|
Nippon Paper Industries Co., Ltd. |
|
|
|
|
30,043 |
|
|
|
575,738 |
|
Nisshin Oillio Group Ltd. (The) |
|
|
|
|
4,625 |
|
|
|
133,139 |
|
Nisshin Seifun Group, Inc. |
|
|
|
|
39,809 |
|
|
|
870,578 |
|
Pacific Metals Co., Ltd.*(a) |
|
|
|
|
1,251 |
|
|
|
44,015 |
|
Prima Meat Packers Ltd. |
|
|
|
|
127,923 |
|
|
|
782,093 |
|
S
Foods, Inc. |
|
|
|
|
16,451 |
|
|
|
692,318 |
|
Sumitomo Metal Mining Co., Ltd. |
|
|
|
|
18,177 |
|
|
|
780,403 |
|
UACJ Corp.(a) |
|
|
|
|
3,087 |
|
|
|
80,373 |
|
Yamazaki Baking Co., Ltd. |
|
|
|
|
28,591 |
|
|
|
626,559 |
|
Total Japan |
|
|
|
|
|
|
|
|
12,144,357 |
|
| |
|
|
|
|
|
|
|
|
|
|
Jersey — 0.4%
|
|
|
|
|
|
|
|
|
|
|
Centamin PLC |
|
|
|
|
109,369 |
|
|
|
236,127 |
|
Randgold Resources Ltd. |
|
|
|
|
8,963 |
|
|
|
724,416 |
|
Total Jersey |
|
|
|
|
|
|
|
|
960,543 |
|
| |
|
|
|
|
|
|
|
|
|
|
Kazakhstan — 0.1%
|
|
|
|
|
|
|
|
|
|
|
KAZ Minerals PLC* |
|
|
|
|
27,968 |
|
|
|
354,554 |
|
| |
|
|
|
|
|
|
|
|
|
|
Mexico — 0.5%
|
|
|
|
|
|
|
|
|
|
|
Fresnillo PLC |
|
|
|
|
69,952 |
|
|
|
1,228,442 |
|
| |
|
|
|
|
|
|
|
|
|
|
Monaco — 0.1%
|
|
|
|
|
|
|
|
|
|
|
Endeavour Mining Corp.* |
|
|
|
|
9,741 |
|
|
|
166,485 |
|
| |
|
|
|
|
|
|
|
|
|
|
Netherlands — 1.1%
|
|
|
|
|
|
|
|
|
|
|
ForFarmers NV |
|
|
|
|
54,375 |
|
|
|
764,700 |
|
Royal Dutch Shell PLC, Class B |
|
|
|
|
49,771 |
|
|
|
1,783,382 |
|
Total Netherlands |
|
|
|
|
|
|
|
|
2,548,082 |
|
| |
|
|
|
|
|
|
|
|
|
|
Norway — 1.2%
|
|
|
|
|
|
|
|
|
|
|
Norsk Hydro ASA |
|
|
|
|
129,331 |
|
|
|
808,168 |
|
Statoil ASA(a) |
|
|
|
|
20,104 |
|
|
|
515,706 |
|
Yara International ASA |
|
|
|
|
35,674 |
|
|
|
1,509,591 |
|
Total Norway |
|
|
|
|
|
|
|
|
2,833,465 |
|
| |
|
|
|
|
|
|
|
|
|
|
Peru — 1.1%
|
|
|
|
|
|
|
|
|
|
|
Hochschild Mining PLC |
|
|
|
|
48,308 |
|
|
|
139,661 |
|
Southern Copper Corp. |
|
|
|
|
48,746 |
|
|
|
2,574,276 |
|
Total Peru |
|
|
|
|
|
|
|
|
2,713,937 |
|
| |
|
|
|
|
|
|
|
|
|
|
Portugal — 0.5%
|
|
|
|
|
|
|
|
|
|
|
Navigator Co. SA (The) |
|
|
|
|
186,525 |
|
|
|
1,090,739 |
|
|
|
|
|
|
|
|
|
|
|
|
|
|
|
|
Shares
|
|
Value
|
Common Stocks (continued)
|
|
|
|
|
|
|
|
|
|
|
| |
|
|
|
|
|
|
|
|
|
|
Russia — 0.4%
|
|
|
|
|
|
|
|
|
|
|
Evraz PLC |
|
|
|
|
89,636 |
|
|
$ |
565,694 |
|
Polymetal International PLC |
|
|
|
|
40,843 |
|
|
|
410,325 |
|
Total Russia |
|
|
|
|
|
|
|
|
976,019 |
|
| |
|
|
|
|
|
|
|
|
|
|
Singapore — 1.5%
|
|
|
|
|
|
|
|
|
|
|
First Resources Ltd. |
|
|
|
|
206,554 |
|
|
|
263,643 |
|
Golden Agri-Resources Ltd. |
|
|
|
|
1,674,053 |
|
|
|
436,198 |
|
Olam International Ltd. |
|
|
|
|
426,436 |
|
|
|
734,318 |
|
Wilmar International Ltd. |
|
|
|
|
834,776 |
|
|
|
2,055,338 |
|
Total Singapore |
|
|
|
|
|
|
|
|
3,489,497 |
|
| |
|
|
|
|
|
|
|
|
|
|
Spain — 0.3%
|
|
|
|
|
|
|
|
|
|
|
Ebro Foods SA |
|
|
|
|
20,116 |
|
|
|
486,083 |
|
Gas Natural SDG SA |
|
|
|
|
6,034 |
|
|
|
152,439 |
|
Repsol SA |
|
|
|
|
9,383 |
|
|
|
179,684 |
|
Total Spain |
|
|
|
|
|
|
|
|
818,206 |
|
| |
|
|
|
|
|
|
|
|
|
|
Sweden — 1.5%
|
|
|
|
|
|
|
|
|
|
|
AAK AB |
|
|
|
|
5,541 |
|
|
|
491,167 |
|
Boliden AB |
|
|
|
|
17,154 |
|
|
|
598,026 |
|
Holmen AB, B Shares |
|
|
|
|
44,420 |
|
|
|
1,100,466 |
|
Sandvik AB |
|
|
|
|
78,677 |
|
|
|
1,349,828 |
|
Total Sweden |
|
|
|
|
|
|
|
|
3,539,487 |
|
| |
|
|
|
|
|
|
|
|
|
|
Switzerland — 2.2%
|
|
|
|
|
|
|
|
|
|
|
Bell Food Group AG |
|
|
|
|
2,050 |
|
|
|
807,657 |
|
Ferrexpo PLC |
|
|
|
|
36,844 |
|
|
|
119,307 |
|
Glencore PLC* |
|
|
|
|
902,869 |
|
|
|
4,361,187 |
|
Total Switzerland |
|
|
|
|
|
|
|
|
5,288,151 |
|
| |
|
|
|
|
|
|
|
|
|
|
United Kingdom — 8.0%
|
|
|
|
|
|
|
|
|
|
|
Acacia Mining PLC(a) |
|
|
|
|
38,930 |
|
|
|
77,213 |
|
Anglo American PLC(a) |
|
|
|
|
87,919 |
|
|
|
2,070,002 |
|
BP
PLC |
|
|
|
|
120,306 |
|
|
|
891,484 |
|
Cranswick PLC |
|
|
|
|
26,068 |
|
|
|
1,046,265 |
|
Johnson Matthey PLC |
|
|
|
|
12,115 |
|
|
|
549,656 |
|
Pennon Group PLC |
|
|
|
|
135,194 |
|
|
|
1,288,942 |
|
Pentair PLC |
|
|
|
|
56,638 |
|
|
|
3,810,605 |
|
Rio Tinto PLC |
|
|
|
|
83,262 |
|
|
|
4,525,308 |
|
Severn Trent PLC |
|
|
|
|
76,100 |
|
|
|
2,033,437 |
|
Tate & Lyle PLC |
|
|
|
|
60,883 |
|
|
|
481,843 |
|
United Utilities Group PLC |
|
|
|
|
219,633 |
|
|
|
2,248,265 |
|
Total United Kingdom |
|
|
|
|
|
|
|
|
19,023,020 |
|
| |
|
|
|
|
|
|
|
|
|
|
United States — 34.0%
|
|
|
|
|
|
|
|
|
|
|
Alcoa Corp.* |
|
|
|
|
11,596 |
|
|
|
593,715 |
|
Allegheny Technologies, Inc.*(a) |
|
|
|
|
7,830 |
|
|
|
208,043 |
|
American Water Works Co., Inc. |
|
|
|
|
57,011 |
|
|
|
4,936,012 |
|
Anadarko Petroleum Corp. |
|
|
|
|
3,013 |
|
|
|
202,835 |
|
Andersons, Inc. (The) |
|
|
|
|
3,670 |
|
|
|
119,825 |
|
Aqua America, Inc.(a) |
|
|
|
|
56,697 |
|
|
|
1,992,900 |
|
Arch Coal, Inc., Class A(a) |
|
|
|
|
3,941 |
|
|
|
318,551 |
|
Archer-Daniels-Midland Co. |
|
|
|
|
72,066 |
|
|
|
3,270,355 |
|
Bunge Ltd. |
|
|
|
|
18,107 |
|
|
|
1,307,869 |
|
Century Aluminum Co.*(a) |
|
|
|
|
5,425 |
|
|
|
94,775 |
|
CF
Industries Holdings, Inc. |
|
|
|
|
29,955 |
|
|
|
1,162,254 |
|
Chevron Corp. |
|
|
|
|
11,414 |
|
|
|
1,428,006 |
|
Cleveland-Cliffs, Inc.*(a) |
|
|
|
|
18,914 |
|
|
|
140,342 |
|
Cloud Peak Energy, Inc.*(a) |
|
|
|
|
15,096 |
|
|
|
48,156 |
|
Coeur Mining, Inc.* |
|
|
|
|
17,851 |
|
|
|
135,132 |
|
Conagra Brands, Inc. |
|
|
|
|
51,429 |
|
|
|
1,906,473 |
|
Concho Resources, Inc.* |
|
|
|
|
854 |
|
|
|
134,257 |
|
ConocoPhillips |
|
|
|
|
6,948 |
|
|
|
455,094 |
|
See notes to financial
statements.
75
Schedules of Investments —
IQ Global Resources ETF (continued)
April
30, 2018
|
|
|
|
Shares
|
|
Value
|
|
|
|
|
|
|
|
|
|
|
|
Common Stocks (continued)
|
|
|
|
|
|
|
|
|
|
|
| |
United States (continued)
|
|
|
|
|
|
|
|
|
|
|
CONSOL Energy, Inc.*(a) |
|
|
|
|
5,245 |
|
|
$ |
164,955 |
|
Continental Resources, Inc.* |
|
|
|
|
2,220 |
|
|
|
146,653 |
|
Devon Energy Corp. |
|
|
|
|
3,080 |
|
|
|
111,896 |
|
Domtar Corp. |
|
|
|
|
15,738 |
|
|
|
690,898 |
|
Energy Transfer Partners LP |
|
|
|
|
7,003 |
|
|
|
126,194 |
|
EOG Resources, Inc. |
|
|
|
|
3,411 |
|
|
|
403,078 |
|
Exxon Mobil Corp. |
|
|
|
|
25,160 |
|
|
|
1,956,190 |
|
Ferroglobe PLC* |
|
|
|
|
10,436 |
|
|
|
117,927 |
|
Flowserve Corp.(a) |
|
|
|
|
41,417 |
|
|
|
1,839,329 |
|
FMC Corp. |
|
|
|
|
17,421 |
|
|
|
1,388,976 |
|
Freeport-McMoRan, Inc. |
|
|
|
|
89,614 |
|
|
|
1,363,029 |
|
Fresh Del Monte Produce, Inc. |
|
|
|
|
6,324 |
|
|
|
310,825 |
|
General Mills, Inc.(a) |
|
|
|
|
73,188 |
|
|
|
3,201,243 |
|
Hain Celestial Group, Inc. (The)* |
|
|
|
|
13,272 |
|
|
|
386,613 |
|
Halliburton Co. |
|
|
|
|
5,122 |
|
|
|
271,415 |
|
Hecla Mining Co.(a) |
|
|
|
|
38,228 |
|
|
|
146,413 |
|
Hormel Foods Corp.(a) |
|
|
|
|
264,816 |
|
|
|
9,599,580 |
|
IDEX Corp.(a) |
|
|
|
|
24,349 |
|
|
|
3,254,487 |
|
Ingredion, Inc. |
|
|
|
|
9,344 |
|
|
|
1,131,465 |
|
JM
Smucker Co. (The) |
|
|
|
|
14,452 |
|
|
|
1,648,684 |
|
KapStone Paper and Packaging Corp. |
|
|
|
|
25,278 |
|
|
|
870,069 |
|
Kellogg Co.(a) |
|
|
|
|
44,444 |
|
|
|
2,617,752 |
|
Kinder Morgan, Inc. |
|
|
|
|
13,240 |
|
|
|
209,457 |
|
Lamb Weston Holdings, Inc. |
|
|
|
|
19,015 |
|
|
|
1,242,060 |
|
Louisiana-Pacific Corp. |
|
|
|
|
37,120 |
|
|
|
1,051,610 |
|
Marathon Petroleum Corp. |
|
|
|
|
2,831 |
|
|
|
212,070 |
|
McEwen Mining, Inc.*(a) |
|
|
|
|
32,447 |
|
|
|
67,490 |
|
Neenah, Inc.(a) |
|
|
|
|
4,299 |
|
|
|
335,322 |
|
Newmont Mining Corp. |
|
|
|
|
50,816 |
|
|
|
1,996,561 |
|
Occidental Petroleum Corp. |
|
|
|
|
4,586 |
|
|
|
354,314 |
|
ONEOK, Inc. |
|
|
|
|
2,480 |
|
|
|
149,346 |
|
Phillips 66 |
|
|
|
|
2,788 |
|
|
|
310,332 |
|
Pilgrim’s Pride Corp.*(a) |
|
|
|
|
125,814 |
|
|
|
2,717,582 |
|
Pioneer Natural Resources Co. |
|
|
|
|
1,004 |
|
|
|
202,356 |
|
Post Holdings, Inc.*(a) |
|
|
|
|
8,882 |
|
|
|
706,741 |
|
Rexnord Corp.* |
|
|
|
|
33,060 |
|
|
|
909,481 |
|
Royal Gold, Inc. |
|
|
|
|
6,286 |
|
|
|
558,197 |
|
Sanderson Farms, Inc. |
|
|
|
|
11,512 |
|
|
|
1,279,674 |
|
Schlumberger Ltd. |
|
|
|
|
8,168 |
|
|
|
559,998 |
|
Seaboard Corp. |
|
|
|
|
590 |
|
|
|
2,364,159 |
|
SunCoke Energy, Inc.* |
|
|
|
|
12,229 |
|
|
|
140,511 |
|
Tahoe Resources, Inc. |
|
|
|
|
31,071 |
|
|
|
156,815 |
|
Tyson Foods, Inc., Class A |
|
|
|
|
144,063 |
|
|
|
10,098,816 |
|
Valero Energy Corp. |
|
|
|
|
2,561 |
|
|
|
284,092 |
|
Warrior Met Coal, Inc. |
|
|
|
|
10,116 |
|
|
|
235,197 |
|
Watts Water Technologies, Inc., Class A |
|
|
|
|
8,733 |
|
|
|
650,609 |
|
Williams Cos., Inc. (The) |
|
|
|
|
4,957 |
|
|
|
127,544 |
|
Xylem, Inc. |
|
|
|
|
57,053 |
|
|
|
4,159,164 |
|
Total United States |
|
|
|
|
|
|
|
|
81,281,763 |
|
|
|
|
|
|
|
|
|
|
|
|
|
|
|
|
Shares
|
|
Value
|
Common Stocks (continued)
|
|
|
|
|
|
|
|
|
|
|
| |
Zambia — 0.3%
|
|
|
|
|
|
|
|
|
|
|
First Quantum Minerals Ltd. |
|
|
|
|
42,922 |
|
|
$ |
619,413 |
|
| |
Total Common Stocks
|
|
|
|
|
|
|
|
|
|
|
(Cost $206,717,751) |
|
|
|
|
|
|
|
|
215,060,640 |
|
| |
Short-Term Investment — 9.3%
|
|
|
|
|
|
|
|
|
|
|
| |
Money Market Fund — 9.3%
|
|
|
|
|
|
|
|
|
|
|
Morgan Stanley Institutional Liquidity Funds Treasury Portfolio — Institutional Class,
1.58%(d)
|
|
|
|
|
|
|
|
|
|
|
(Cost $22,190,357) |
|
|
|
|
22,190,357 |
|
|
|
22,190,357 |
|
| |
Investment of Cash Collateral For Securities Loaned — 2.0%
|
|
|
|
|
|
|
|
|
|
|
| |
Money Market Fund — 2.0%
|
|
|
|
|
|
|
|
|
|
|
Dreyfus Government Cash Management Fund, Institutional Shares, 1.61%(d)
|
|
|
|
|
|
|
|
|
|
|
(Cost $4,839,696) |
|
|
|
|
4,839,696 |
|
|
|
4,839,696 |
|
| |
Total Investments — 101.4%
|
|
|
|
|
|
|
|
|
|
|
(Cost $233,747,804) |
|
|
|
|
|
|
|
|
242,090,693 |
|
| |
Other Assets and Liabilities,
Net — (1.4)% |
|
|
|
|
|
|
|
|
(3,378,218 |
) |
| |
Net Assets — 100.0% |
|
|
|
|
|
|
|
$ |
238,712,475 |
|
‡ |
|
May be sold to institutional investors only under
Rule 144A or securities offered pursuant to section 4 (a) (2) of the Securities Act of 1933, as amended. |
* |
|
Non-income producing securities. |
(a) |
|
All or a portion of the security was on loan. In
addition, “Other Assets and Liabilities, Net” may include pending sales that are also on loan. The aggregate market value of securities on
loan was $20,754,674; total market value of collateral held by the Fund was $21,571,329. Market value of the collateral held includes
non-cash U.S. Treasury securities collateral having a value of $16,731,633. |
(b) |
|
Security has been deemed illiquid because it may not
be able to be resold within seven days at approximately the price shown. At April 30, 2018, the total value of this security was
$214,241. |
(c) |
|
Security fair valued as determined in good faith in
accordance with the procedures established by the Board of Trustees. The security is fair valued using significant unobservable inputs. The
valuation technique can be found at the end of the Schedules of Investments for the Fund. |
(d) |
|
Reflects the 1-day yield at April 30,
2018. |
See notes to financial
statements.
76
Schedules of Investments —
IQ Global Resources ETF (continued)
April
30, 2018
Total Return Swap contracts outstanding at April 30,
2018:
Total Return Benchmark
| |
Counterparty
| |
Annual
Financing
Rate
Received
(Paid) %
| |
Expiration
Date
| |
Payment
Frequency
Received/
(Paid)
| |
Notional
Amount
Long
(Short)
| |
Value/
Unrealized
Appreciation/
(Depreciation)(e)
|
| iShares MSCI EAFE ETF | |
Morgan Stanley | |
| 1.30 | | |
5/04/2020 | |
Monthly | |
$ | (24,046,295 | ) | |
$ | — | |
| SPDR S&P 500 ETF Trust | |
Morgan Stanley | |
| 1.30 | | |
5/04/2020 | |
Monthly | |
| (23,808,545 | ) | |
| — | |
| | |
| |
| | | |
| |
| |
| | | |
$ | — | |
Cash posted has been segregated as collateral for swaps in
the amount of $1,150,028 at April 30, 2018.
The Fund either receives fees from, or pays to the
counterparty, the total return of the benchmark and the agreed-upon financing rate.
(e) |
|
Reflects the value at reset date of April 30,
2018. |
See notes to financial
statements.
77
Schedules of Investments —
IQ Global Resources ETF (continued)
April
30, 2018
The following is a summary of the inputs used to value the
Fund’s investments as of April 30, 2018. For more information on the valuation techniques, and their aggregation into the levels used in the table
below, please refer to Note 2.
Asset Valuation Inputs
Description
|
|
|
|
Level
1
|
|
Level
2
|
|
Level
3
|
|
Total
|
Investments in Securities:(f)
|
|
|
|
|
|
|
|
|
|
|
|
|
|
|
|
|
|
|
Common Stocks
|
|
|
|
|
|
|
|
|
|
|
|
|
|
|
|
|
|
|
Argentina |
|
|
|
$ |
121,868 |
|
|
$ |
— |
|
|
$ |
— |
|
|
$ |
121,868 |
|
Australia |
|
|
|
|
12,212,962 |
|
|
|
— |
|
|
|
— |
|
|
|
12,212,962 |
|
Canada |
|
|
|
|
15,639,686 |
|
|
|
— |
|
|
|
— |
|
|
|
15,639,686 |
|
Chile |
|
|
|
|
826,450 |
|
|
|
— |
|
|
|
— |
|
|
|
826,450 |
|
China |
|
|
|
|
24,423,083 |
|
|
|
— |
|
|
|
— |
|
|
|
24,423,083 |
|
Denmark |
|
|
|
|
167,285 |
|
|
|
— |
|
|
|
— |
|
|
|
167,285 |
|
Finland |
|
|
|
|
9,798,957 |
|
|
|
— |
|
|
|
— |
|
|
|
9,798,957 |
|
France |
|
|
|
|
8,398,100 |
|
|
|
— |
|
|
|
— |
|
|
|
8,398,100 |
|
Germany |
|
|
|
|
1,990,463 |
|
|
|
— |
|
|
|
— |
|
|
|
1,990,463 |
|
Hong Kong |
|
|
|
|
1,287,568 |
|
|
|
— |
|
|
|
— |
|
|
|
1,287,568 |
|
India |
|
|
|
|
171,300 |
|
|
|
— |
|
|
|
— |
|
|
|
171,300 |
|
Indonesia |
|
|
|
|
— |
|
|
|
— |
|
|
|
214,241 |
|
|
|
214,241 |
|
Ireland |
|
|
|
|
201,960 |
|
|
|
— |
|
|
|
— |
|
|
|
201,960 |
|
Italy |
|
|
|
|
530,557 |
|
|
|
— |
|
|
|
— |
|
|
|
530,557 |
|
Japan |
|
|
|
|
12,144,357 |
|
|
|
— |
|
|
|
— |
|
|
|
12,144,357 |
|
Jersey |
|
|
|
|
960,543 |
|
|
|
— |
|
|
|
— |
|
|
|
960,543 |
|
Kazakhstan |
|
|
|
|
354,554 |
|
|
|
— |
|
|
|
— |
|
|
|
354,554 |
|
Mexico |
|
|
|
|
1,228,442 |
|
|
|
— |
|
|
|
— |
|
|
|
1,228,442 |
|
Monaco |
|
|
|
|
166,485 |
|
|
|
— |
|
|
|
— |
|
|
|
166,485 |
|
Netherlands |
|
|
|
|
2,548,082 |
|
|
|
— |
|
|
|
— |
|
|
|
2,548,082 |
|
Norway |
|
|
|
|
2,833,465 |
|
|
|
— |
|
|
|
— |
|
|
|
2,833,465 |
|
Peru |
|
|
|
|
2,713,937 |
|
|
|
— |
|
|
|
— |
|
|
|
2,713,937 |
|
Portugal |
|
|
|
|
1,090,739 |
|
|
|
— |
|
|
|
— |
|
|
|
1,090,739 |
|
Russia |
|
|
|
|
976,019 |
|
|
|
— |
|
|
|
— |
|
|
|
976,019 |
|
Singapore |
|
|
|
|
3,489,497 |
|
|
|
— |
|
|
|
— |
|
|
|
3,489,497 |
|
Spain |
|
|
|
|
818,206 |
|
|
|
— |
|
|
|
— |
|
|
|
818,206 |
|
Sweden |
|
|
|
|
3,539,487 |
|
|
|
— |
|
|
|
— |
|
|
|
3,539,487 |
|
Switzerland |
|
|
|
|
5,288,151 |
|
|
|
— |
|
|
|
— |
|
|
|
5,288,151 |
|
United Kingdom |
|
|
|
|
19,023,020 |
|
|
|
— |
|
|
|
— |
|
|
|
19,023,020 |
|
United States |
|
|
|
|
81,281,763 |
|
|
|
— |
|
|
|
— |
|
|
|
81,281,763 |
|
Zambia |
|
|
|
|
619,413 |
|
|
|
— |
|
|
|
— |
|
|
|
619,413 |
|
Total Common Stocks |
|
|
|
|
214,846,399 |
|
|
|
— |
|
|
|
214,241 |
(g) |
|
|
215,060,640 |
|
Short-Term Investment:
|
|
|
|
|
|
|
|
|
|
|
|
|
|
|
|
|
|
|
Money Market Fund |
|
|
|
|
22,190,357 |
|
|
|
— |
|
|
|
— |
|
|
|
22,190,357 |
|
Investment of Cash Collateral for Securities Loaned:
|
|
|
|
|
|
|
|
|
|
|
|
|
|
|
|
|
|
|
Money Market Fund |
|
|
|
|
4,839,696 |
|
|
|
— |
|
|
|
— |
|
|
|
4,839,696 |
|
Total Investments in Securities |
|
|
|
$ |
241,876,452 |
|
|
$ |
— |
|
|
$ |
214,241 |
(g) |
|
$ |
242,090,693 |
|
Other Financial Instruments:(h)
|
|
|
|
|
|
|
|
|
|
|
|
|
|
|
|
|
|
|
Swap Contracts |
|
|
|
|
— |
|
|
|
— |
|
|
|
— |
|
|
|
— |
|
Total Investments in Securities and Other Financial Instruments |
|
|
|
$ |
241,876,452 |
|
|
$ |
— |
|
|
$ |
214,241 |
(g) |
|
$ |
242,090,693 |
|
| |
|
|
|
|
|
|
|
|
|
|
| Liability Valuation Inputs
|
|
|
|
|
|
|
|
|
|
|
| |
|
|
|
|
|
|
|
|
|
|
Description
|
|
|
|
Level 1
|
|
Level 2
|
|
Level 3
|
|
Total
|
Other Financial Instruments:(h)
|
|
|
|
|
|
|
|
|
|
|
|
|
|
|
|
|
|
|
Swap Contracts |
|
|
|
|
— |
|
|
|
— |
|
|
|
— |
|
|
|
— |
|
Total Other Financial Instruments |
|
|
|
$ |
— |
|
|
$ |
— |
|
|
$ |
— |
|
|
$ |
— |
|
(f) |
|
For a complete listing of investments and their
countries, see the Schedules of Investments. |
(g) |
|
The Level 3 security, valued at $214,241 has been
deemed illiquid and has been fair valued in good faith in accordance with procedures established by the Board of Trustees. |
(h) |
|
Reflects the unrealized appreciation (depreciation)
of the instruments. |
The Fund recognizes transfers between the levels as of the
beginning of the period.
For the year ended April 30, 2018, the Fund did not have any
transfers between any levels within the fair value hierarchy. (See Note 2)
See notes to financial
statements.
78
Schedules of Investments —
IQ Global Resources ETF (continued)
April
30, 2018
The following is a reconciliation of investments in which
significant unobservable inputs (Level 3) were used in determining value:
Investments
in Securities
|
|
Balance
as of
April 30,
2017
|
|
Accrued
Discounts
(Premiums)
|
|
Realized
Gain
(Loss)
|
|
Change in
Unrealized
Appreciation
(Depreciation)
|
|
Purchases
|
|
Sales
|
|
Transfers
into
Level 3
|
|
Transfers
out of
Level 3
|
|
Balance
as of
April 30,
2018
|
|
Change in
Unrealized
Appreciation
(Depreciation)
from Investments
Still Held at
April 30,
2018(i)
|
Common Stock:
|
|
|
|
|
|
|
|
|
|
|
|
|
|
|
|
|
|
|
|
|
|
|
|
|
|
|
|
|
|
|
|
|
|
|
|
|
|
|
|
|
Sakari
Resources Ltd.(j) |
|
$ |
182,256 |
|
|
$ |
— |
|
|
$ |
— |
|
|
$ |
31,985 |
|
|
$ |
— |
|
|
$ |
— |
|
|
$ |
— |
|
|
$ |
— |
|
|
$ |
214,241 |
|
|
$ |
31,985 |
|
Total |
|
$ |
182,256 |
|
|
$ |
— |
|
|
$ |
— |
|
|
$ |
31,985 |
|
|
$ |
— |
|
|
$ |
— |
|
|
$ |
— |
|
|
$ |
— |
|
|
$ |
214,241 |
|
|
$ |
31,985 |
|
Information about Level 3 fair value measurements as of
April 30, 2018.
|
Security Type
|
|
|
|
Fair Value
|
|
Valuation Technique
|
|
Unobservable Inputs
|
| Common Stock |
|
|
|
$ |
214,241 |
|
|
Peer Analysis |
|
Comparable Securities |
(i) |
|
Included in “Net change in unrealized
appreciation (depreciation) on investments” in the Statements of Operations. |
(j) |
|
Security
has been deemed illiquid and has been fair valued in good faith in accordance with procedures established by the Board of
Trustees. |
See notes to financial
statements.
79
Schedules of Investments —
IQ Merger Arbitrage ETF
April
30, 2018
|
|
|
|
Shares
|
|
Value
|
|
|
|
|
|
|
|
|
|
|
|
| |
Common Stocks — 75.1%
|
|
|
|
|
|
|
|
|
|
|
| |
Consumer Discretionary — 7.5%
|
|
|
|
|
|
|
|
|
|
|
Capella Education Co. |
|
|
|
|
38,844 |
|
|
$ |
3,563,937 |
|
Finish Line, Inc. (The), Class A |
|
|
|
|
518,855 |
|
|
|
7,040,862 |
|
Mantra Group Ltd. |
|
|
|
|
631,746 |
|
|
|
1,883,649 |
|
Pinnacle Entertainment, Inc.* |
|
|
|
|
138,346 |
|
|
|
4,443,674 |
|
Tribune Media Co., Class A |
|
|
|
|
325,449 |
|
|
|
12,298,718 |
|
UBM PLC(a) |
|
|
|
|
371,069 |
|
|
|
4,947,369 |
|
Yoox Net-A-Porter Group SpA* |
|
|
|
|
115,144 |
|
|
|
5,271,139 |
|
Total Consumer Discretionary |
|
|
|
|
|
|
|
|
39,449,348 |
|
| |
Consumer Staples — 6.8%
|
|
|
|
|
|
|
|
|
|
|
Dr
Pepper Snapple Group, Inc.(a) |
|
|
|
|
195,971 |
|
|
|
23,508,681 |
|
Rite Aid Corp.*(a)(b) |
|
|
|
|
7,264,484 |
|
|
|
12,131,688 |
|
Total Consumer Staples |
|
|
|
|
|
|
|
|
35,640,369 |
|
| |
Energy — 5.6%
|
|
|
|
|
|
|
|
|
|
|
RSP Permian, Inc.* |
|
|
|
|
555,657 |
|
|
|
27,566,144 |
|
Sakari Resources Ltd.*(c)(d) |
|
|
|
|
425 |
|
|
|
379 |
|
Tallgrass Energy Partners LP |
|
|
|
|
39,816 |
|
|
|
1,640,817 |
|
Total Energy |
|
|
|
|
|
|
|
|
29,207,340 |
|
| |
Financials — 2.5%
|
|
|
|
|
|
|
|
|
|
|
Infinity Property & Casualty Corp. |
|
|
|
|
43,197 |
|
|
|
5,702,004 |
|
NEX Group PLC |
|
|
|
|
399,499 |
|
|
|
5,436,469 |
|
Stewart Information Services Corp. |
|
|
|
|
53,647 |
|
|
|
2,237,616 |
|
Total Financials |
|
|
|
|
|
|
|
|
13,376,089 |
|
| |
Health Care — 13.9%
|
|
|
|
|
|
|
|
|
|
|
Ablynx NV* |
|
|
|
|
93,318 |
|
|
|
5,048,799 |
|
Aetna, Inc. |
|
|
|
|
162,911 |
|
|
|
29,169,215 |
|
Express Scripts Holding Co.* |
|
|
|
|
423,525 |
|
|
|
32,060,843 |
|
NxStage Medical, Inc.* |
|
|
|
|
194,381 |
|
|
|
5,174,422 |
|
Sirtex Medical Ltd. |
|
|
|
|
71,586 |
|
|
|
1,503,300 |
|
Total Health Care |
|
|
|
|
|
|
|
|
72,956,579 |
|
| |
Industrials — 17.4%
|
|
|
|
|
|
|
|
|
|
|
Aecon Group, Inc. |
|
|
|
|
373,997 |
|
|
|
5,265,920 |
|
Chicago Bridge & Iron Co. NV(a) |
|
|
|
|
598,512 |
|
|
|
9,037,531 |
|
General Cable Corp. |
|
|
|
|
117,582 |
|
|
|
3,486,306 |
|
Orbital ATK, Inc. |
|
|
|
|
213,379 |
|
|
|
28,247,112 |
|
Orient Overseas International Ltd. |
|
|
|
|
323,859 |
|
|
|
3,082,505 |
|
Rockwell Collins, Inc. |
|
|
|
|
317,682 |
|
|
|
42,105,572 |
|
Total Industrials |
|
|
|
|
|
|
|
|
91,224,946 |
|
| |
Information Technology — 12.7%
|
|
|
|
|
|
|
|
|
|
|
Blackhawk Network Holdings, Inc.* |
|
|
|
|
153,293 |
|
|
|
6,882,856 |
|
Cavium, Inc.* |
|
|
|
|
233,722 |
|
|
|
17,531,487 |
|
Fidessa Group PLC |
|
|
|
|
33,322 |
|
|
|
1,803,715 |
|
Gemalto NV |
|
|
|
|
45,152 |
|
|
|
2,721,085 |
|
Microsemi Corp.* |
|
|
|
|
294,267 |
|
|
|
19,036,132 |
|
MuleSoft, Inc., Class A* |
|
|
|
|
315,424 |
|
|
|
14,061,602 |
|
Oclaro, Inc.* |
|
|
|
|
620,820 |
|
|
|
4,916,894 |
|
Total Information Technology |
|
|
|
|
|
|
|
|
66,953,771 |
|
|
|
|
|
|
|
|
|
|
|
|
|
|
|
|
Shares
|
|
Value
|
Common Stocks (continued)
|
|
|
|
|
|
|
|
|
|
|
| |
Materials — 2.3%
|
|
|
|
|
|
|
|
|
|
|
A.
Schulman, Inc.(a) |
|
|
|
|
135,314 |
|
|
$ |
5,804,971 |
|
KapStone Paper and Packaging Corp. |
|
|
|
|
175,808 |
|
|
|
6,051,311 |
|
Total Materials |
|
|
|
|
|
|
|
|
11,856,282 |
|
| |
Real Estate — 3.3%
|
|
|
|
|
|
|
|
|
|
|
Canadian Real Estate Investment Trust(a) |
|
|
|
|
36,452 |
|
|
|
1,435,958 |
|
GGP, Inc. |
|
|
|
|
487,358 |
|
|
|
9,742,286 |
|
Intu Properties PLC |
|
|
|
|
919,397 |
|
|
|
2,473,145 |
|
Westfield Corp. |
|
|
|
|
554,874 |
|
|
|
3,853,388 |
|
Total Real Estate |
|
|
|
|
|
|
|
|
17,504,777 |
|
| |
Utilities — 3.1%
|
|
|
|
|
|
|
|
|
|
|
Avista Corp. |
|
|
|
|
158,759 |
|
|
|
8,233,241 |
|
SCANA Corp. |
|
|
|
|
219,744 |
|
|
|
8,079,987 |
|
Total Utilities |
|
|
|
|
|
|
|
|
16,313,228 |
|
| |
Total Common Stocks
|
|
|
|
|
|
|
|
|
|
|
(Cost $397,363,801) |
|
|
|
|
|
|
|
|
394,482,729 |
|
| |
Rights — 0.0%(e)
|
|
|
|
|
|
|
|
|
|
|
| |
Health Care — 0.0%(e)
|
|
|
|
|
|
|
|
|
|
|
Dyax Corp. Contingent Value Right (CVR), expires 12/31/2019* (c)(d)
(Cost $0) |
|
|
|
|
23,351 |
|
|
|
25,920 |
|
| |
Investment Companies — 5.7%
|
|
|
|
|
|
|
|
|
|
|
| |
U.S. Short Term Treasury Bond Funds — 5.7%
|
|
|
|
|
|
|
|
|
|
|
iShares Short Treasury Bond ETF(a) |
|
|
|
|
213,020 |
|
|
|
23,508,887 |
|
SPDR Bloomberg Barclays 1-3 Month T-Bill ETF(a) |
|
|
|
|
68,480 |
|
|
|
6,268,659 |
|
Total U.S. Short Term Treasury Bond Funds |
|
|
|
|
|
|
|
|
29,777,546 |
|
| |
Total Investment Companies
|
|
|
|
|
|
|
|
|
|
|
(Cost $29,775,416) |
|
|
|
|
|
|
|
|
29,777,546 |
|
| |
Short-Term Investment — 19.6%
|
|
|
|
|
|
|
|
|
|
|
| |
Money Market Fund — 19.6%
|
|
|
|
|
|
|
|
|
|
|
Morgan Stanley Institutional Liquidity Funds Treasury Portfolio — Institutional Class,
1.58%(f)
|
|
|
|
|
|
|
|
|
|
|
(Cost $102,940,823) |
|
|
|
|
102,940,823 |
|
|
|
102,940,823 |
|
See notes to financial
statements.
80
Schedules of Investments —
IQ Merger Arbitrage ETF (continued)
April
30, 2018
|
|
|
|
Shares
|
|
Value
|
|
|
|
|
|
|
|
|
|
|
|
Investment of Cash Collateral For Securities Loaned — 5.0%
|
|
|
|
|
|
|
|
|
|
|
| |
Money Market Fund — 5.0%
|
|
|
|
|
|
|
|
|
|
|
Dreyfus Government Cash Management Fund, Institutional Shares, 1.61%(f)
|
|
|
|
|
|
|
|
|
|
|
| (Cost $26,324,770) |
|
|
|
|
26,324,770 |
|
|
$ |
26,324,770 |
|
| |
Total Investments — 105.4%
|
|
|
|
|
|
|
|
|
|
|
(Cost $556,404,810) |
|
|
|
|
|
|
|
|
553,551,788 |
|
| |
Other Assets and Liabilities,
Net — (5.4)% |
|
|
|
|
|
|
|
|
(28,165,908 |
) |
| |
Net Assets — 100.0% |
|
|
|
|
|
|
|
$ |
525,385,880 |
|
* |
|
Non-income producing securities. |
(a) |
|
All or a portion of the security was on loan. In
addition, “Other Assets and Liabilities, Net” may include pending sales that are also on loan. The aggregate market value of securities on
loan was $49,063,687; total market value of collateral held by the Fund was $49,913,465. Market value of the collateral held includes non-cash U.S.
Treasury securities collateral having a value of $23,588,695. |
(b) |
|
All or a portion of these securities have been
segregated as collateral for swap contracts. The total value of securities segregated amounted to $8,879,390. |
(c) |
|
Securities have been deemed illiquid because they
may not be able to be resold within seven days at approximately the price shown. At April 30, 2018, the value of these
securities was $26,299. |
(d) |
|
Securities are fair valued as
determined in good faith in accordance with the procedures established by the Board of Trustees. The securities are fair valued using
significant unobservable inputs. The valuation technique can be found at the end of the Schedules of Investments for the
Fund. |
(f) |
|
Reflects the 1-day yield at April 30,
2018. |
See notes to financial
statements.
81
Schedules of Investments —
IQ Merger Arbitrage ETF (continued)
April
30, 2018
Total Return Swap contracts outstanding at April 30,
2018:
Total Return
Benchmark
| |
Counterparty
| |
Annual
Financing
Rate
Received
(Paid) %
| |
Expiration
Date
| |
Payment
Frequency
Received/
(Paid)
| |
Notional
Amount
Long
(Short)
| |
Value/
Unrealized
Appreciation/
(Depreciation)(g)
|
| Consumer Discretionary Select Sector SPDR Fund | |
Morgan
Stanley | |
| 1.37 | | |
1/10/2019 | |
Monthly | |
$ | (7,746,183 | ) | |
$ | — | |
| Consumer Staples Select Sector SPDR Fund | |
Morgan Stanley | |
| 1.30 | | |
1/10/2019 | |
Monthly | |
| (21,071,552 | ) | |
| — | |
| Energy Select Sector SPDR Fund | |
Morgan Stanley | |
| 1.30 | | |
1/10/2019 | |
Monthly | |
| (39,585,779 | ) | |
| — | |
| Financial Select Sector SPDR Fund | |
Morgan Stanley | |
| 1.30 | | |
1/10/2019 | |
Monthly | |
| (6,881,742 | ) | |
| — | |
| Health Care Select Sector SPDR Fund | |
Morgan Stanley | |
| 1.30 | | |
1/10/2019 | |
Monthly | |
| (14,547,352 | ) | |
| — | |
| Industrial Select Sector SPDR Fund | |
Morgan Stanley | |
| 1.30 | | |
1/10/2019 | |
Monthly | |
| (13,873,823 | ) | |
| — | |
| Technology Select Sector SPDR Fund | |
Morgan Stanley | |
| 1.30 | | |
1/10/2019 | |
Monthly | |
| (15,086,173 | ) | |
| — | |
| Utilities Select Sector SPDR Fund | |
Morgan Stanley | |
| 1.37 | | |
1/10/2019 | |
Monthly | |
| (8,565,869 | ) | |
| — | |
| Vanguard FTSE Europe ETF | |
Morgan Stanley | |
| 1.30 | | |
1/10/2019 | |
Monthly | |
| (9,273,825 | ) | |
| — | |
| Vanguard Real Estate ETF | |
Morgan Stanley | |
| 1.15 | | |
1/10/2019 | |
Monthly | |
| (10,876,837 | ) | |
| — | |
| | |
| |
| | | |
| |
| |
| | | |
$ | — | |
The total value
of securities segregated as collateral for swap contracts with counterparty Morgan Stanley amounted to $8,879,390
at April 30, 2018. The Fund either receives fees from, or pays to the counterparty, the total return of the
benchmark and the agreed-upon financing rate.
(g) |
|
Reflects the value at reset date of April 30,
2018. |
See notes to financial
statements.
82
Schedules of Investments —
IQ Merger Arbitrage ETF (continued)
April
30, 2018
The following is a summary of the inputs used to value the
Fund’s investments as of April 30, 2018. For more information on the valuation techniques, and their aggregation into the levels used in the table
below, please refer to Note 2.
Asset Valuation Inputs
Description
|
|
|
|
Level
1
|
|
Level
2
|
|
Level
3
|
|
Total
|
Investments in Securities:(h)
|
|
|
|
|
|
|
|
|
|
|
|
|
|
|
|
|
|
|
Common Stocks
|
|
|
|
|
|
|
|
|
|
|
|
|
|
|
|
|
|
|
Consumer Discretionary |
|
|
|
$ |
39,449,348 |
|
|
$ |
— |
|
|
$ |
— |
|
|
$ |
39,449,348 |
|
Consumer Staples |
|
|
|
|
35,640,369 |
|
|
|
— |
|
|
|
— |
|
|
|
35,640,369 |
|
Energy |
|
|
|
|
29,206,961 |
|
|
|
— |
|
|
|
379 |
|
|
|
29,207,340 |
|
Financials |
|
|
|
|
13,376,089 |
|
|
|
— |
|
|
|
— |
|
|
|
13,376,089 |
|
Health Care |
|
|
|
|
72,956,579 |
|
|
|
— |
|
|
|
— |
|
|
|
72,956,579 |
|
Industrials |
|
|
|
|
91,224,946 |
|
|
|
— |
|
|
|
— |
|
|
|
91,224,946 |
|
Information Technology |
|
|
|
|
66,953,771 |
|
|
|
— |
|
|
|
— |
|
|
|
66,953,771 |
|
Materials |
|
|
|
|
11,856,282 |
|
|
|
— |
|
|
|
— |
|
|
|
11,856,282 |
|
Real Estate |
|
|
|
|
17,504,777 |
|
|
|
— |
|
|
|
— |
|
|
|
17,504,777 |
|
Utilities |
|
|
|
|
16,313,228 |
|
|
|
— |
|
|
|
— |
|
|
|
16,313,228 |
|
Total Common Stocks |
|
|
|
|
394,482,350 |
|
|
|
— |
|
|
|
379 |
(i) |
|
|
394,482,729 |
|
Investment Companies |
|
|
|
|
29,777,546 |
|
|
|
— |
|
|
|
— |
|
|
|
29,777,546 |
|
Rights |
|
|
|
|
— |
|
|
|
— |
|
|
|
25,920 |
(i) |
|
|
25,920 |
|
Short-Term Investment:
|
|
|
|
|
|
|
|
|
|
|
|
|
|
|
|
|
|
|
Money Market Fund |
|
|
|
|
102,940,823 |
|
|
|
— |
|
|
|
— |
|
|
|
102,940,823 |
|
Investment of Cash Collateral for Securities Loaned:
|
|
|
|
|
|
|
|
|
|
|
|
|
|
|
|
|
|
|
Money Market Fund |
|
|
|
|
26,324,770 |
|
|
|
— |
|
|
|
— |
|
|
|
26,324,770 |
|
Total Investments in Securities |
|
|
|
$ |
553,525,489 |
|
|
$ |
— |
|
|
$ |
26,299 |
(i) |
|
$ |
553,551,788 |
|
Other Financial Instruments:(j)
|
|
|
|
|
|
|
|
|
|
|
|
|
|
|
|
|
|
|
Swap Contracts |
|
|
|
|
— |
|
|
|
— |
|
|
|
— |
|
|
|
— |
|
Total Investments in Securities and Other Financial Instruments |
|
|
|
$ |
553,525,489 |
|
|
$ |
— |
|
|
$ |
26,299 |
(i) |
|
$ |
553,551,788 |
|
| |
|
|
|
|
|
|
|
|
|
|
| Liability Valuation Inputs
|
|
|
|
|
|
|
|
|
|
|
| |
|
|
|
|
|
|
|
|
|
|
Description
|
|
|
|
Level
1
|
|
Level
2
|
|
Level
3
|
|
Total
|
Other Financial Instruments:(j)
|
|
|
|
|
|
|
|
|
|
|
|
|
|
|
|
|
|
|
Swap Contracts |
|
|
|
|
— |
|
|
|
— |
|
|
|
— |
|
|
|
— |
|
Total Other Financial Instruments |
|
|
|
$ |
— |
|
|
$ |
— |
|
|
$ |
— |
|
|
$ |
— |
|
(h) |
|
For a complete listing of
investments and their industries, see the Schedules of Investments. |
(i) |
|
The Level 3 securities, valued in total at $26,299
have been deemed illiquid and have been fair valued in good faith in accordance with procedures established by the Board of Trustees. |
(j) |
|
Reflects the unrealized appreciation (depreciation)
of the instruments. |
The Fund recognizes transfers between the levels as of the beginning of the period.
For
the year ended April 30, 2018, the Fund did not have any transfers between any levels
within the fair value hierarchy. (See Note 2)
See notes
to financial statements.
83
Schedules of Investments —
IQ Merger Arbitrage ETF (continued)
April
30, 2018
The
following is a reconciliation of investments in which significant unobservable inputs
(Level 3) were used in determining value:
Investments
in Securities |
|
Balance
as of
April 30,
2017 |
|
Accrued
Discounts
(Premiums) |
|
Realized
Gain
(Loss) |
|
Change in
Unrealized
Appreciation
(Depreciation) |
|
Purchases |
|
Sales |
|
Transfers
into
Level 3 |
|
Transfers
out of
Level 3 |
|
Balance
as of
April 30,
2018 |
|
Change in
Unrealized
Appreciation
(Depreciation)
from
Investments
Still Held at
April 30,
2018(k) |
Common Stock:
|
|
|
|
|
|
|
|
|
|
|
|
|
|
|
|
|
|
|
|
|
|
|
|
|
|
|
|
|
|
|
|
|
|
|
|
|
|
|
|
|
Sakari
Resources Ltd.(l) |
|
$ |
322 |
|
|
$ |
— |
|
|
$ |
— |
|
|
$ |
57 |
|
|
$ |
— |
|
|
$ |
— |
|
|
$ |
— |
|
|
$ |
— |
|
|
$ |
379 |
|
|
$ |
57 |
|
Rights:
|
|
|
|
|
|
|
|
|
|
|
|
|
|
|
|
|
|
|
|
|
|
|
|
|
|
|
|
|
|
|
|
|
|
|
|
|
|
|
|
|
Dyax Corp. CVR(l) |
|
|
25,920 |
|
|
|
— |
|
|
|
— |
|
|
|
— |
|
|
|
— |
|
|
|
— |
|
|
|
— |
|
|
|
— |
|
|
|
25,920 |
|
|
|
— |
|
Total |
|
$ |
26,242 |
|
|
$ |
— |
|
|
$ |
— |
|
|
$ |
57 |
|
|
$ |
— |
|
|
$ |
— |
|
|
$ |
— |
|
|
$ |
— |
|
|
$ |
26,299 |
|
|
$ |
57 |
|
Information
about Level 3 fair value measurements as of April 30, 2018.
Security
Type
|
|
|
|
Fair
Value
|
|
Valuation
Technique
|
|
Unobservable
Inputs
|
| Common Stock |
|
|
|
$ |
379 |
|
|
Peer Analysis |
|
Comparable Securities |
| Rights |
|
|
|
|
25,920 |
|
|
Issuer Specific Facts |
|
Contingent Payment Terms |
(k) |
|
Included in “Net change in unrealized
appreciation (depreciation) on investments” in the Statements of Operations. |
(l) |
|
Security has been deemed illiquid and has been fair
valued in good faith in accordance with procedures established by the Board of Trustees. |
See
notes to financial statements.
84
Schedules of Investments —
IQ Real Return ETF
April
30, 2018
|
|
|
|
Shares
|
|
Value
|
|
|
|
|
|
|
|
|
|
|
|
Exchange Traded Vehicles — 9.8%
|
|
|
|
|
|
|
|
|
|
|
| |
Gold Fund — 6.0%
|
|
|
|
|
|
|
|
|
|
|
PowerShares DB Gold Fund* |
|
|
|
|
65,329 |
|
|
$ |
2,715,073 |
|
| |
Japanese Yen Fund — 3.8%
|
|
|
|
|
|
|
|
|
|
|
CurrencyShares Japanese
Yen Trust* |
|
|
|
|
19,813 |
|
|
|
1,736,610 |
|
| |
Total Exchange Traded Vehicles
|
|
|
|
|
|
|
|
|
|
|
(Cost $4,522,132) |
|
|
|
|
|
|
|
|
4,451,683 |
|
| |
Investment Companies — 90.1%
|
|
|
|
|
|
|
|
|
|
|
| |
Emerging Equity Funds — 3.7%
|
|
|
|
|
|
|
|
|
|
|
iShares MSCI Emerging Markets ETF |
|
|
|
|
13,939 |
|
|
|
654,018 |
|
Vanguard FTSE Emerging
Markets ETF |
|
|
|
|
22,768 |
|
|
|
1,040,042 |
|
Total Emerging Equity Funds |
|
|
|
|
|
|
|
|
1,694,060 |
|
| |
U.S. Large Cap Core Funds — 10.0%
|
|
|
|
|
|
|
|
|
|
|
iShares Core S&P 500 ETF(a) |
|
|
|
|
6,047 |
|
|
|
1,610,377 |
|
SPDR S&P 500 ETF Trust(a) |
|
|
|
|
11,048 |
|
|
|
2,922,306 |
|
Total U.S. Large Cap Core Funds |
|
|
|
|
|
|
|
|
4,532,683 |
|
| |
U.S. Long Term Treasury Bond
Fund — 2.5%
|
|
|
|
|
|
|
|
|
|
|
iShares 20+ Year Treasury Bond ETF |
|
|
|
|
9,381 |
|
|
|
1,117,277 |
|
| |
U.S. Medium Term Treasury Bond Funds — 7.5%
|
|
|
|
|
|
|
|
|
|
|
iShares 3-7 Year Treasury Bond ETF |
|
|
|
|
9,445 |
|
|
|
1,128,866 |
|
iShares 7-10 Year Treasury Bond ETF |
|
|
|
|
22,108 |
|
|
|
2,248,384 |
|
Total U.S. Medium Term Treasury Bond Funds |
|
|
|
|
|
|
|
|
3,377,250 |
|
| |
U.S. Short Term Treasury Bond Funds — 59.1%
|
|
|
|
|
|
|
|
|
|
|
Goldman Sachs Treasury Access 0-1 Year ETF |
|
|
|
|
11,218 |
|
|
|
1,122,473 |
|
iShares Short Treasury Bond ETF |
|
|
|
|
103,001 |
|
|
|
11,367,190 |
|
PIMCO Enhanced Short Maturity Active Exchange-Traded Fund |
|
|
|
|
102,578 |
|
|
|
10,421,925 |
|
PowerShares Treasury Collateral Portfolio ETF |
|
|
|
|
4,710 |
|
|
|
498,236 |
|
|
|
|
|
|
|
|
|
|
|
|
|
|
|
|
Shares
|
|
Value
|
Investment Companies (continued)
|
|
|
|
|
|
|
|
|
|
|
| |
U.S. Short Term Treasury Bond Funds (continued)
|
|
|
|
|
|
|
|
|
|
|
SPDR Bloomberg Barclays 1-3 Month T-Bill ETF(a) |
|
|
|
|
36,661 |
|
|
$ |
3,355,948 |
|
Total U.S. Short Term Treasury Bond Funds |
|
|
|
|
|
|
|
|
26,765,772 |
|
| |
U.S. Small Cap Core Fund — 7.3%
|
|
|
|
|
|
|
|
|
|
|
iShares Russell 2000 ETF(a) |
|
|
|
|
21,681 |
|
|
|
3,324,131 |
|
| |
Total Investment Companies
|
|
|
|
|
|
|
|
|
|
|
(Cost $40,847,629) |
|
|
|
|
|
|
|
|
40,811,173 |
|
| |
Short-Term Investment — 0.1%
|
|
|
|
|
|
|
|
|
|
|
| |
Money Market Fund — 0.1%
|
|
|
|
|
|
|
|
|
|
|
Morgan Stanley Institutional Liquidity Funds Treasury Portfolio — Institutional Class,
1.58%(b)
|
|
|
|
|
|
|
|
|
|
|
(Cost $65,052) |
|
|
|
|
65,052 |
|
|
|
65,052 |
|
| |
Investment of Cash Collateral For Securities Loaned — 4.6%
|
|
|
|
|
|
|
|
|
|
|
| |
Money Market Fund — 4.6%
|
|
|
|
|
|
|
|
|
|
|
Dreyfus Government Cash Management Fund, Institutional Shares, 1.61%(b)
|
|
|
|
|
|
|
|
|
|
|
(Cost $2,070,277) |
|
|
|
|
2,070,277 |
|
|
|
2,070,277 |
|
| |
Total Investments — 104.6%
|
|
|
|
|
|
|
|
|
|
|
(Cost $47,505,090) |
|
|
|
|
|
|
|
|
47,398,185 |
|
| |
Other Assets and Liabilities,
Net — (4.6)% |
|
|
|
|
|
|
|
|
(2,078,753 |
) |
| |
Net Assets — 100.0% |
|
|
|
|
|
|
|
$ |
45,319,432 |
|
* |
|
Non-income producing securities. |
(a) |
|
All or a portion of the security was on loan. In
addition, “Other Assets and Liabilities, Net” may include pending sales that are also on loan. The aggregate market value of securities on
loan was $7,265,170; total market value of collateral held by the Fund was $7,462,404. Market value of the collateral held includes non-cash U.S.
Treasury securities collateral having a value of $5,392,127. |
(b) |
|
Reflects the 1-day yield at April 30, 2018.
|
The
following is a summary of the inputs used to value the Fund’s investments as of April 30, 2018. For more
information on the valuation techniques, and their aggregation into the levels used in the table below, please
refer to Note 2.
Asset Valuation Inputs
Description
|
|
|
|
Level
1
|
|
Level
2
|
|
Level
3
|
|
Total
|
Investments in Securities:(c)
|
|
|
|
|
|
|
|
|
|
|
|
|
|
|
|
|
|
|
Exchange Traded Vehicles |
|
|
|
$ |
4,451,683 |
|
|
$ |
— |
|
|
$ |
— |
|
|
$ |
4,451,683 |
|
Investment Companies |
|
|
|
|
40,811,173 |
|
|
|
— |
|
|
|
— |
|
|
|
40,811,173 |
|
Short-Term Investment:
|
|
|
|
|
|
|
|
|
|
|
|
|
|
|
|
|
|
|
Money Market Fund |
|
|
|
|
65,052 |
|
|
|
— |
|
|
|
— |
|
|
|
65,052 |
|
Investment of Cash Collateral for Securities Loaned:
|
|
|
|
|
|
|
|
|
|
|
|
|
|
|
|
|
|
|
Money Market Fund |
|
|
|
|
2,070,277 |
|
|
|
— |
|
|
|
— |
|
|
|
2,070,277 |
|
Total Investments in Securities |
|
|
|
$ |
47,398,185 |
|
|
$ |
— |
|
|
$ |
— |
|
|
$ |
47,398,185 |
|
(c) |
|
For a complete listing of investments and their
industries, see the Schedules of Investments. |
The
Fund recognizes transfers between the levels as of the beginning of the period.
For
the year ended April 30, 2018, the Fund did not have any transfers between any levels
within the fair value hierarchy. (See Note 2)
See
notes to financial statements.
85
Schedules of Investments —
IQ Global Agribusiness Small Cap ETF
April
30, 2018
|
|
|
|
Shares
|
|
Value
|
|
|
|
|
|
|
|
|
|
|
|
Common Stocks — 99.5%
|
|
|
|
|
|
|
|
|
|
|
| |
Argentina — 1.6%
|
|
|
|
|
|
|
|
|
|
|
Adecoagro SA* |
|
|
|
|
25,190 |
|
|
$ |
194,467 |
|
| |
Australia — 13.2%
|
|
|
|
|
|
|
|
|
|
|
Australian Agricultural Co., Ltd.*(a) |
|
|
|
|
68,120 |
|
|
|
56,562 |
|
Bega Cheese Ltd.(a) |
|
|
|
|
34,285 |
|
|
|
184,007 |
|
Costa Group Holdings Ltd. |
|
|
|
|
59,524 |
|
|
|
326,204 |
|
Elders Ltd. |
|
|
|
|
22,954 |
|
|
|
137,228 |
|
GrainCorp Ltd., Class A |
|
|
|
|
46,992 |
|
|
|
315,345 |
|
Inghams Group Ltd. |
|
|
|
|
40,400 |
|
|
|
114,360 |
|
Nufarm Ltd. |
|
|
|
|
50,583 |
|
|
|
348,225 |
|
Select Harvests Ltd.(a) |
|
|
|
|
18,917 |
|
|
|
89,247 |
|
Total Australia |
|
|
|
|
|
|
|
|
1,571,178 |
|
| |
Canada — 3.6%
|
|
|
|
|
|
|
|
|
|
|
Maple Leaf Foods, Inc. |
|
|
|
|
16,645 |
|
|
|
401,859 |
|
Village Farms International, Inc.* |
|
|
|
|
6,570 |
|
|
|
26,137 |
|
Total Canada |
|
|
|
|
|
|
|
|
427,996 |
|
| |
China — 2.0%
|
|
|
|
|
|
|
|
|
|
|
China BlueChemical Ltd., Class H |
|
|
|
|
368,945 |
|
|
|
97,781 |
|
China Huishan Dairy Holdings Co., Ltd.*(b)(c) |
|
|
|
|
938,079 |
|
|
|
— |
|
First Tractor Co., Ltd., Class H |
|
|
|
|
81,651 |
|
|
|
28,610 |
|
Leyou Technologies Holdings Ltd.* |
|
|
|
|
263,388 |
|
|
|
67,456 |
|
Sinofert Holdings Ltd.* |
|
|
|
|
367,170 |
|
|
|
43,977 |
|
Total China |
|
|
|
|
|
|
|
|
237,824 |
|
| |
Indonesia — 5.0%
|
|
|
|
|
|
|
|
|
|
|
PT
Astra Agro Lestari Tbk |
|
|
|
|
81,457 |
|
|
|
74,797 |
|
PT
Charoen Pokphand
Indonesia Tbk |
|
|
|
|
1,510,433 |
|
|
|
399,525 |
|
PT
Perusahaan Perkebunan London Sumatra Indonesia Tbk |
|
|
|
|
574,326 |
|
|
|
52,014 |
|
PT
Sawit Sumbermas Sarana Tbk |
|
|
|
|
669,678 |
|
|
|
63,057 |
|
Total Indonesia |
|
|
|
|
|
|
|
|
589,393 |
|
| |
Japan — 39.4%
|
|
|
|
|
|
|
|
|
|
|
Feed One Co. Ltd. |
|
|
|
|
26,769 |
|
|
|
59,691 |
|
Fuji Oil Holdings, Inc. |
|
|
|
|
10,904 |
|
|
|
350,263 |
|
Itoham Yonekyu Holdings, Inc. |
|
|
|
|
30,541 |
|
|
|
277,709 |
|
Kumiai Chemical Industry Co., Ltd.(a) |
|
|
|
|
24,471 |
|
|
|
155,648 |
|
Megmilk Snow Brand Co., Ltd. |
|
|
|
|
10,315 |
|
|
|
310,605 |
|
Morinaga Milk Industry Co., Ltd. |
|
|
|
|
8,534 |
|
|
|
375,519 |
|
NH
Foods Ltd. |
|
|
|
|
21,678 |
|
|
|
947,948 |
|
Nichirei Corp. |
|
|
|
|
25,334 |
|
|
|
732,759 |
|
Nihon Nohyaku Co., Ltd.(a) |
|
|
|
|
10,050 |
|
|
|
65,301 |
|
Nippon Soda Co. Ltd. |
|
|
|
|
26,764 |
|
|
|
154,090 |
|
Nisshin Seifun Group, Inc. |
|
|
|
|
48,897 |
|
|
|
1,069,322 |
|
Prima Meat Packers Ltd. |
|
|
|
|
29,530 |
|
|
|
180,540 |
|
Total Japan |
|
|
|
|
|
|
|
|
4,679,395 |
|
| |
Netherlands — 4.3%
|
|
|
|
|
|
|
|
|
|
|
ForFarmers NV |
|
|
|
|
7,161 |
|
|
|
100,708 |
|
OCI NV* |
|
|
|
|
17,391 |
|
|
|
414,143 |
|
Total Netherlands |
|
|
|
|
|
|
|
|
514,851 |
|
| |
Singapore — 5.8%
|
|
|
|
|
|
|
|
|
|
|
First Resources Ltd. |
|
|
|
|
98,939 |
|
|
|
126,284 |
|
Golden Agri-Resources Ltd. |
|
|
|
|
1,316,859 |
|
|
|
343,126 |
|
Japfa Ltd. |
|
|
|
|
55,169 |
|
|
|
20,000 |
|
Olam International Ltd. |
|
|
|
|
111,835 |
|
|
|
192,579 |
|
Total Singapore |
|
|
|
|
|
|
|
|
681,989 |
|
|
|
|
|
Shares
|
|
Value
|
|
|
|
|
|
|
|
|
|
|
|
|
|
|
|
|
|
|
|
|
|
|
Common Stocks (continued)
|
|
|
|
|
|
|
|
|
|
|
| |
Spain — 2.1%
|
|
|
|
|
|
|
|
|
|
|
Ebro Foods SA |
|
|
|
|
10,248 |
|
|
$ |
247,633 |
|
| |
Thailand — 1.7%
|
|
|
|
|
|
|
|
|
|
|
GFPT PCL |
|
|
|
|
74,611 |
|
|
|
29,078 |
|
Khon Kaen Sugar Industry PCL |
|
|
|
|
220,085 |
|
|
|
21,758 |
|
Thai Vegetable Oil PCL |
|
|
|
|
113,736 |
|
|
|
127,034 |
|
Thaifoods Group PCL |
|
|
|
|
172,755 |
|
|
|
26,931 |
|
Total Thailand |
|
|
|
|
|
|
|
|
204,801 |
|
| |
United Kingdom — 1.9%
|
|
|
|
|
|
|
|
|
|
|
Dairy Crest Group PLC |
|
|
|
|
29,226 |
|
|
|
218,380 |
|
| |
United States — 18.9%
|
|
|
|
|
|
|
|
|
|
|
AGCO Corp. |
|
|
|
|
13,809 |
|
|
|
865,548 |
|
Cal-Maine Foods, Inc.*(a) |
|
|
|
|
5,972 |
|
|
|
290,837 |
|
CVR Partners LP(a) |
|
|
|
|
15,493 |
|
|
|
44,000 |
|
Platform Specialty Products Corp.* |
|
|
|
|
46,272 |
|
|
|
465,959 |
|
Sanderson Farms, Inc. |
|
|
|
|
4,199 |
|
|
|
466,761 |
|
Titan International, Inc. |
|
|
|
|
10,420 |
|
|
|
107,326 |
|
Total United States |
|
|
|
|
|
|
|
|
2,240,431 |
|
| |
Total Common Stocks
|
|
|
|
|
|
|
|
|
|
|
(Cost $9,756,112) |
|
|
|
|
|
|
|
|
11,808,338 |
|
| |
Short-Term Investment — 0.2%
|
|
|
|
|
|
|
|
|
|
|
| |
Money Market Fund — 0.2%
|
|
|
|
|
|
|
|
|
|
|
Morgan Stanley Institutional Liquidity Funds Treasury Portfolio — Institutional Class,
1.58%(d)
|
|
|
|
|
|
|
|
|
|
|
(Cost $27,598) |
|
|
|
|
27,598 |
|
|
|
27,598 |
|
| |
Investment of Cash Collateral For Securities Loaned — 2.1%
|
|
|
|
|
|
|
|
|
|
|
| |
Money Market Fund — 2.1%
|
|
|
|
|
|
|
|
|
|
|
Dreyfus Government Cash Management Fund, Institutional Shares, 1.61%(d)
|
|
|
|
|
|
|
|
|
|
|
(Cost $246,668) |
|
|
|
|
246,668 |
|
|
|
246,668 |
|
| |
Total Investments — 101.8%
|
|
|
|
|
|
|
|
|
|
|
(Cost $10,030,378) |
|
|
|
|
|
|
|
|
12,082,604 |
|
| |
Other Assets and Liabilities,
Net — (1.8)% |
|
|
|
|
|
|
|
|
(209,879 |
) |
| |
Net Assets — 100.0% |
|
|
|
|
|
|
|
$ |
11,872,725 |
|
* |
|
Non-income producing securities. |
(a) |
|
All or a portion of the security was on loan. In
addition, “Other Assets and Liabilities, Net” may include pending sales that are also on loan. The aggregate market value of securities on
loan was $740,685; total market value of collateral held by the Fund was $785,159. Market value of the collateral held includes non-cash U.S. Treasury
securities collateral having a value of $538,491. |
(b) |
|
Security has been deemed illiquid because it may not
be able to be resold within seven days at approximately the price shown. At April 30, 2018, the value of this security was $ —. |
(c) |
|
Security fair valued as determined in good faith in
accordance with the procedures established by the Board of Trustees. The security is fair valued using significant unobservable
inputs. The valuation technique can be found at the end of the Schedules of Investments for the Fund. |
(d) |
|
Reflects the 1-day yield at April 30,
2018. |
See notes to financial
statements.
86
Schedules
of Investments — IQ Global Agribusiness Small Cap ETF (continued)
April
30, 2018
The
following is a summary of the inputs used to value the Fund’s investments as of April 30, 2018. For more
information on the valuation techniques, and their aggregation into the levels used in the table below, please
refer to Note 2.
Asset Valuation Inputs
Description
|
|
|
|
Level 1
|
|
Level 2
|
|
Level 3
|
|
Total
|
Investments in Securities:(e)
|
|
|
|
|
|
|
|
|
|
|
|
|
|
|
|
|
|
|
Common Stocks |
|
|
|
$ |
11,808,338 |
|
|
$ |
— |
|
|
$ |
— |
(f) |
|
$ |
11,808,338 |
|
Short-Term Investment:
|
|
|
|
|
|
|
|
|
|
|
|
|
|
|
|
|
|
|
Money Market Fund |
|
|
|
|
27,598 |
|
|
|
— |
|
|
|
— |
|
|
|
27,598 |
|
Investment of Cash Collateral for Securities Loaned:
|
|
|
|
|
|
|
|
|
|
|
|
|
|
|
|
|
|
|
Money Market Fund |
|
|
|
|
246,668 |
|
|
|
— |
|
|
|
— |
|
|
|
246,668 |
|
Total Investments in Securities |
|
|
|
$ |
12,082,604 |
|
|
$ |
— |
|
|
$ |
— |
|
|
$ |
12,082,604 |
|
(e) |
|
For a complete listing of investments and their
countries, see the Schedules of Investments. |
(f) |
|
The Level 3 security, valued at $ — has been
deemed illiquid and has been fair valued in good faith in accordance with procedures established by the Board of Trustees. |
The
Fund recognizes transfers between the levels as of the beginning of the period.
For
the year ended April 30, 2018, the Fund did not have any transfers between any levels
within the fair value hierarchy. (See Note 2)
The
following is a reconciliation of investments in which significant unobservable inputs
(Level 3) were used in determining value:
Investments
in Securities
|
|
Balance
as of
April 30,
2017
|
|
Accrued
Discounts
(Premiums)
|
|
Realized
Gain
(Loss)
|
|
Change in
Unrealized
Appreciation
(Depreciation)
|
|
Purchases
|
|
Sales
|
|
Transfers
into
Level 3
|
|
Transfers
out of
Level 3
|
|
Balance
as of
April 30,
2018
|
|
Change in
Unrealized
Appreciation
(Depreciation)
from Investments
Still Held at
April 30,
2018(g)
|
Common Stock:
|
|
|
|
|
|
|
|
|
|
|
|
|
|
|
|
|
|
|
|
|
|
|
|
|
|
|
|
|
|
|
|
|
|
|
|
|
|
|
|
|
China Huishan Dairy Holdings Co., Ltd.(h) |
|
$ |
— |
(i) |
|
$ |
— |
|
|
$ |
— |
|
|
$ |
— |
|
|
$ |
— |
|
|
$ |
— |
|
|
$ |
— |
|
|
$ |
— |
|
|
$ |
— |
(i) |
|
$ |
— |
|
Total |
|
$ |
— |
(i) |
|
$ |
— |
|
|
$ |
— |
|
|
$ |
— |
|
|
$ |
— |
|
|
$ |
— |
|
|
$ |
— |
|
|
$ |
— |
|
|
$ |
— |
(i) |
|
$ |
— |
|
|
|
|
|
|
|
|
|
|
|
|
|
|
|
|
|
|
|
|
|
|
|
|
|
|
|
|
|
|
|
|
|
|
|
|
|
|
|
|
|
|
Information about Level 3 fair value measurements as of
April 30, 2018.
|
Security Type
|
|
|
|
Fair Value
|
|
Valuation Technique
|
|
Unobservable Inputs
|
| Common Stock |
|
|
|
$ |
— |
|
|
Issuer Specific facts |
|
Company Announcements |
(g) |
|
Included in “Net change in unrealized
appreciation (depreciation) on investments” in the Statements of Operations. |
(h) |
|
Security has been deemed illiquid and has been fair
valued in good faith in accordance with procedures established by the Board of Trustees. |
(i) |
|
Includes a Level 3 security valued at
$ — . |
See notes to financial
statements.
87
Schedules of Investments —
IQ U.S. Real Estate Small Cap ETF
April
30, 2018
|
|
|
|
Shares
|
|
Value
|
|
|
|
|
|
|
|
|
|
|
|
Common Stocks — 100.0%
|
|
|
|
|
|
|
|
|
|
|
| |
Diversified REITs — 17.8%
|
|
|
|
|
|
|
|
|
|
|
American Assets Trust, Inc. |
|
|
|
|
35,739 |
|
|
$ |
1,199,758 |
|
Empire State Realty Trust, Inc., Class A |
|
|
|
|
150,530 |
|
|
|
2,622,233 |
|
Granite Point Mortgage Trust, Inc. |
|
|
|
|
38,964 |
|
|
|
648,361 |
|
Industrial Logistics Properties Trust |
|
|
|
|
18,611 |
|
|
|
381,898 |
|
Investors Real Estate Trust(a) |
|
|
|
|
110,023 |
|
|
|
586,423 |
|
Kennedy-Wilson Holdings, Inc.(a) |
|
|
|
|
118,628 |
|
|
|
2,248,001 |
|
Monmouth Real Estate Investment Corp. |
|
|
|
|
66,883 |
|
|
|
1,045,381 |
|
New Senior Investment Group, Inc.(a) |
|
|
|
|
74,503 |
|
|
|
642,216 |
|
Preferred Apartment Communities, Inc., Class A |
|
|
|
|
35,976 |
|
|
|
529,207 |
|
Redwood Trust, Inc. |
|
|
|
|
69,045 |
|
|
|
1,059,150 |
|
Resource Capital Corp.(a) |
|
|
|
|
27,076 |
|
|
|
264,262 |
|
Select Income REIT |
|
|
|
|
58,375 |
|
|
|
1,106,790 |
|
Washington Real Estate Investment Trust(a) |
|
|
|
|
72,409 |
|
|
|
2,079,586 |
|
Winthrop Realty Trust*(a)(b)(c) |
|
|
|
|
29,107 |
|
|
|
164,454 |
|
Total Diversified REITs |
|
|
|
|
|
|
|
|
14,577,720 |
|
| |
Hotel REITs — 16.4%
|
|
|
|
|
|
|
|
|
|
|
Ashford Hospitality Trust, Inc.(a) |
|
|
|
|
86,670 |
|
|
|
596,290 |
|
Braemar Hotels & Resorts, Inc. |
|
|
|
|
28,130 |
|
|
|
292,552 |
|
Chatham Lodging Trust |
|
|
|
|
41,682 |
|
|
|
794,042 |
|
Chesapeake Lodging Trust |
|
|
|
|
54,706 |
|
|
|
1,616,015 |
|
DiamondRock Hospitality Co. |
|
|
|
|
183,579 |
|
|
|
2,028,548 |
|
Hersha Hospitality Trust(a) |
|
|
|
|
35,723 |
|
|
|
670,878 |
|
MGM Growth Properties LLC, Class A(a) |
|
|
|
|
65,646 |
|
|
|
1,836,119 |
|
Pebblebrook Hotel Trust(a) |
|
|
|
|
62,983 |
|
|
|
2,203,775 |
|
Summit Hotel Properties, Inc.(a) |
|
|
|
|
95,105 |
|
|
|
1,377,120 |
|
Xenia Hotels & Resorts, Inc. |
|
|
|
|
99,179 |
|
|
|
2,042,096 |
|
Total Hotel REITs |
|
|
|
|
|
|
|
|
13,457,435 |
|
| |
Mortgage REITs — 13.1%
|
|
|
|
|
|
|
|
|
|
|
AG
Mortgage Investment Trust, Inc. |
|
|
|
|
25,806 |
|
|
|
456,250 |
|
Anworth Mortgage Asset Corp. |
|
|
|
|
89,653 |
|
|
|
424,059 |
|
Apollo Commercial Real Estate Finance, Inc.(a) |
|
|
|
|
99,223 |
|
|
|
1,787,998 |
|
Arbor Realty Trust, Inc.(a) |
|
|
|
|
44,718 |
|
|
|
391,730 |
|
ARMOUR Residential REIT, Inc. |
|
|
|
|
38,372 |
|
|
|
868,358 |
|
Capstead Mortgage Corp. |
|
|
|
|
85,382 |
|
|
|
751,361 |
|
Dynex Capital, Inc. |
|
|
|
|
49,619 |
|
|
|
326,493 |
|
Front Yard Residential Corp.(a) |
|
|
|
|
42,532 |
|
|
|
417,664 |
|
Invesco Mortgage Capital, Inc.(a) |
|
|
|
|
103,405 |
|
|
|
1,678,263 |
|
iStar, Inc.*(a) |
|
|
|
|
59,998 |
|
|
|
608,380 |
|
MTGE Investment Corp. |
|
|
|
|
42,011 |
|
|
|
762,500 |
|
New York Mortgage Trust, Inc.(a) |
|
|
|
|
102,772 |
|
|
|
622,798 |
|
Orchid Island Capital, Inc. |
|
|
|
|
47,661 |
|
|
|
333,627 |
|
PennyMac Mortgage Investment Trust |
|
|
|
|
54,781 |
|
|
|
963,598 |
|
Western Asset Mortgage Capital Corp.(a) |
|
|
|
|
37,463 |
|
|
|
372,757 |
|
Total Mortgage REITs |
|
|
|
|
|
|
|
|
10,765,836 |
|
|
|
|
|
|
|
|
|
|
|
|
|
|
|
|
Shares
|
|
Value
|
|
|
|
|
|
|
|
|
|
|
|
Common Stocks (continued)
|
|
|
|
|
|
|
|
|
|
|
| |
Office REITs — 15.2%
|
|
|
|
|
|
|
|
|
|
|
Brandywine Realty Trust |
|
|
|
|
164,053 |
|
|
$ |
2,642,894 |
|
Easterly Government Properties, Inc.(a) |
|
|
|
|
41,562 |
|
|
|
856,593 |
|
Franklin Street Properties Corp. |
|
|
|
|
95,768 |
|
|
|
745,075 |
|
Global Net Lease, Inc. |
|
|
|
|
62,468 |
|
|
|
1,162,530 |
|
Government Properties Income Trust |
|
|
|
|
90,456 |
|
|
|
1,129,795 |
|
Lexington Realty Trust(a) |
|
|
|
|
200,796 |
|
|
|
1,614,400 |
|
Mack-Cali Realty Corp. |
|
|
|
|
76,661 |
|
|
|
1,316,269 |
|
Rexford Industrial Realty, Inc.(a) |
|
|
|
|
72,606 |
|
|
|
2,218,113 |
|
Tier REIT, Inc. |
|
|
|
|
43,827 |
|
|
|
833,151 |
|
Total Office REITs |
|
|
|
|
|
|
|
|
12,518,820 |
|
| |
Residential REITs — 4.0%
|
|
|
|
|
|
|
|
|
|
|
Bluerock Residential Growth REIT, Inc.(a) |
|
|
|
|
22,474 |
|
|
|
202,041 |
|
Education Realty Trust, Inc. |
|
|
|
|
70,141 |
|
|
|
2,308,341 |
|
Independence Realty Trust, Inc.(a) |
|
|
|
|
78,558 |
|
|
|
738,445 |
|
Total Residential REITs |
|
|
|
|
|
|
|
|
3,248,827 |
|
| |
Retail REITs — 16.5%
|
|
|
|
|
|
|
|
|
|
|
Acadia Realty Trust(a) |
|
|
|
|
75,628 |
|
|
|
1,784,821 |
|
CBL & Associates Properties, Inc.(a) |
|
|
|
|
156,122 |
|
|
|
652,590 |
|
Cedar Realty Trust, Inc. |
|
|
|
|
81,676 |
|
|
|
317,720 |
|
Four Corners Property Trust, Inc. |
|
|
|
|
56,783 |
|
|
|
1,286,703 |
|
Getty Realty Corp. |
|
|
|
|
29,893 |
|
|
|
748,820 |
|
Kite Realty Group Trust(a) |
|
|
|
|
77,325 |
|
|
|
1,138,224 |
|
Pennsylvania Real Estate Investment Trust(a) |
|
|
|
|
63,395 |
|
|
|
613,663 |
|
Ramco-Gershenson
Properties Trust(a) |
|
|
|
|
71,217 |
|
|
|
851,043 |
|
Retail Opportunity Investments Corp.(a) |
|
|
|
|
102,451 |
|
|
|
1,762,157 |
|
Seritage Growth Properties, Class A(a) |
|
|
|
|
28,620 |
|
|
|
1,018,013 |
|
Tanger Factory Outlet Centers, Inc. |
|
|
|
|
85,961 |
|
|
|
1,886,844 |
|
Washington Prime Group, Inc.(a) |
|
|
|
|
172,051 |
|
|
|
1,113,170 |
|
Whitestone REIT |
|
|
|
|
35,095 |
|
|
|
380,781 |
|
Total Retail REITs |
|
|
|
|
|
|
|
|
13,554,549 |
|
| |
Specialized REITs — 17.0%
|
|
|
|
|
|
|
|
|
|
|
CareTrust REIT, Inc. |
|
|
|
|
69,682 |
|
|
|
920,499 |
|
InfraREIT, Inc.(a) |
|
|
|
|
36,231 |
|
|
|
772,083 |
|
National Storage Affiliates Trust(a) |
|
|
|
|
46,420 |
|
|
|
1,221,774 |
|
Physicians Realty Trust(a) |
|
|
|
|
168,227 |
|
|
|
2,513,311 |
|
QTS Realty Trust, Inc., Class A(a) |
|
|
|
|
40,609 |
|
|
|
1,437,153 |
|
Sabra Health Care REIT, Inc. |
|
|
|
|
163,724 |
|
|
|
2,997,787 |
|
STAG Industrial, Inc. |
|
|
|
|
90,230 |
|
|
|
2,216,951 |
|
Terreno Realty Corp. |
|
|
|
|
50,275 |
|
|
|
1,867,716 |
|
Total Specialized REITs |
|
|
|
|
|
|
|
|
13,947,274 |
|
| |
Total Common Stocks
|
|
|
|
|
|
|
|
|
|
|
(Cost $91,478,350) |
|
|
|
|
|
|
|
|
82,070,461 |
|
See notes to financial
statements.
88
Schedules of Investments —
IQ U.S. Real Estate Small Cap ETF (continued)
April
30, 2018
|
|
|
|
Shares
|
|
Value
|
|
|
|
|
|
|
|
|
|
|
|
Short-Term Investment — 0.2%
|
|
|
|
|
|
|
|
|
|
|
| |
Money Market Fund — 0.2%
|
|
|
|
|
|
|
|
|
|
|
Morgan Stanley Institutional Liquidity Funds Treasury Portfolio — Institutional Class,
1.58%(d)
|
|
|
|
|
|
|
|
|
|
|
(Cost $199,787) |
|
|
|
|
199,787 |
|
|
$ |
199,787 |
|
| |
Investment of Cash Collateral For Securities Loaned — 4.7%
|
|
|
|
|
|
|
|
|
|
|
| |
Money Market Fund — 4.7%
|
|
|
|
|
|
|
|
|
|
|
Dreyfus Government Cash Management Fund, Institutional Shares, 1.61%(d)
|
|
|
|
|
|
|
|
|
|
|
(Cost $3,865,903) |
|
|
|
|
3,865,903 |
|
|
|
3,865,903 |
|
| |
Total Investments — 104.9%
|
|
|
|
|
|
|
|
|
|
|
(Cost $95,544,040) |
|
|
|
|
|
|
|
|
86,136,151 |
|
| |
Other Assets and Liabilities,
Net — (4.9)% |
|
|
|
|
|
|
|
|
(4,046,996 |
) |
| |
Net Assets — 100.0% |
|
|
|
|
|
|
|
$ |
82,089,155 |
|
* |
|
Non-income producing securities. |
(a) |
|
All or a portion of the security was on loan. In
addition, “Other Assets and Liabilities, Net” may include pending sales that are also on loan. The aggregate market value of securities on
loan was $22,892,721; total market value of collateral held by the Fund was $23,498,982. Market value of the collateral held includes non-cash U.S.
Treasury securities collateral having a value of $19,633,079. |
(b) |
|
Security has been deemed illiquid because it may not
be able to be resold within seven days at approximately the price shown. At April 30, 2018, the value of this security was $164,454. |
(c) |
|
Security fair valued as determined in good faith in
accordance with the procedures established by the Board of Trustees. The security is fair valued using significant unobservable inputs. The
valuation technique can be found at the end of the Schedules of Investments for the Fund. |
(d) |
|
Reflects the 1-day yield at April 30,
2018. |
See notes to financial
statements.
89
Schedules
of Investments — IQ U.S. Real Estate Small Cap ETF (continued)
April
30, 2018
The
following is a summary of the inputs used to value the Fund’s investments as of
April 30, 2018. For more information on the valuation techniques, and their aggregation
into the levels used in the table below, please refer to Note 2.
Asset Valuation Inputs
Description
|
|
|
|
Level 1
|
|
Level 2
|
|
Level 3
|
|
Total
|
Investments in Securities:(e)
|
|
|
|
|
|
|
|
|
|
|
|
|
|
|
|
|
|
|
Common Stocks
|
|
|
|
|
|
|
|
|
|
|
|
|
|
|
|
|
|
|
Diversified REITs |
|
|
|
$ |
14,413,266 |
|
|
$ |
— |
|
|
$ |
164,454 |
|
|
$ |
14,577,720 |
|
Hotel REITs |
|
|
|
|
13,457,435 |
|
|
|
— |
|
|
|
— |
|
|
|
13,457,435 |
|
Mortgage REITs |
|
|
|
|
10,765,836 |
|
|
|
— |
|
|
|
— |
|
|
|
10,765,836 |
|
Office REITs |
|
|
|
|
12,518,820 |
|
|
|
— |
|
|
|
— |
|
|
|
12,518,820 |
|
Residential REITs |
|
|
|
|
3,248,827 |
|
|
|
— |
|
|
|
— |
|
|
|
3,248,827 |
|
Retail REITs |
|
|
|
|
13,554,549 |
|
|
|
— |
|
|
|
— |
|
|
|
13,554,549 |
|
Specialized REITs |
|
|
|
|
13,947,274 |
|
|
|
— |
|
|
|
— |
|
|
|
13,947,274 |
|
Total Common Stocks |
|
|
|
|
81,906,007 |
|
|
|
— |
|
|
|
164,454 |
(f) |
|
|
82,070,461 |
|
Short-Term Investment:
|
|
|
|
|
|
|
|
|
|
|
|
|
|
|
|
|
|
|
Money Market Fund |
|
|
|
|
199,787 |
|
|
|
— |
|
|
|
— |
|
|
|
199,787 |
|
Investment of Cash Collateral for Securities Loaned:
|
|
|
|
|
|
|
|
|
|
|
|
|
|
|
|
|
|
|
Money Market Fund |
|
|
|
|
3,865,903 |
|
|
|
— |
|
|
|
— |
|
|
|
3,865,903 |
|
Total Investments in Securities |
|
|
|
$ |
85,971,697 |
|
|
$ |
— |
|
|
$ |
164,454 |
(f) |
|
$ |
86,136,151 |
|
(e) |
|
For a complete listing of investments and their
industries, see the Schedules of Investments. |
(f) |
|
The Level 3 security, valued at $164,454, has been
deemed illiquid and has been fair valued in good faith in accordance with procedures established by the Board of Trustees. |
The Fund recognizes
transfers between the levels as of the beginning of the period.
For
the year ended April 30, 2018, the Fund did not have any transfers between any levels
within the fair value hierarchy. (See Note 2)
The
following is a reconciliation of investments in which significant unobservable inputs
(Level 3) were used in determining value:
Investments
in Securities
|
|
Balance
as of
April 30,
2017
|
|
Accrued
Discounts
(Premiums)
|
|
Realized
Gain
(Loss)
|
|
Change in
Unrealized
Appreciation
(Depreciation)
|
|
Purchases
|
|
Sales
|
|
Transfers
into
Level 3
|
|
Transfers
out of
Level 3
|
|
Balance
as of
April 30,
2018
|
|
Change in
Unrealized
Appreciation
(Depreciation)
from Investments
Still Held at
April 30,
2018(g)
|
Common Stock:
|
|
|
|
|
|
|
|
|
|
|
|
|
|
|
|
|
|
|
|
|
|
|
|
|
|
|
|
|
|
|
|
|
|
|
|
|
|
|
|
|
Winthrop Realty
Trust(h) |
|
$ |
227,908 |
|
|
$ |
— |
|
|
$ |
— |
|
|
$ |
(19,793 |
) |
|
$ |
— |
|
|
$ |
(43,661 |
) |
|
$ |
— |
|
|
$ |
— |
|
|
$ |
164,454 |
|
|
$ |
(19,793 |
) |
Total |
|
$ |
227,908 |
|
|
$ |
— |
|
|
$ |
— |
|
|
$ |
(19,793 |
) |
|
$ |
— |
|
|
$ |
(43,661 |
) |
|
$ |
— |
|
|
$ |
— |
|
|
$ |
164,454 |
|
|
$ |
(19,793 |
) |
|
|
|
|
|
|
|
|
|
|
|
|
|
|
|
|
|
|
|
|
|
|
|
|
|
|
|
|
|
|
|
|
|
|
|
|
|
|
|
|
|
Information about Level 3 fair value measurements as of
April 30, 2018.
|
Security Type
|
|
|
|
Fair Value
|
|
Valuation Technique
|
|
Unobservable Inputs
|
| Common Stock |
|
|
|
$ |
164,454 |
|
|
Peer Analysis |
|
Comparable Securities |
(g) |
|
Included in “Net change in unrealized
appreciation (depreciation) on investments” in the Statements of Operations. |
(h) |
|
Security has been deemed illiquid and has been fair
valued in good faith in accordance with procedures established by the Board of Trustees. |
See notes to financial
statements.
90
Schedules of Investments —
IQ 50 Percent Hedged FTSE International ETF
April
30, 2018
|
|
|
|
Shares
|
|
Value
|
|
|
|
|
|
|
|
|
|
|
|
Common Stocks — 98.7%
|
|
|
|
|
|
|
|
|
|
|
| |
Australia — 6.4%
|
|
|
|
|
|
|
|
|
|
|
AGL Energy Ltd. |
|
|
|
|
26,530 |
|
|
$ |
435,169 |
|
Alumina Ltd. |
|
|
|
|
123,186 |
|
|
|
245,486 |
|
Amcor Ltd. |
|
|
|
|
45,762 |
|
|
|
474,281 |
|
AMP Ltd. |
|
|
|
|
114,501 |
|
|
|
349,182 |
|
APA Group |
|
|
|
|
48,723 |
|
|
|
307,101 |
|
Aristocrat Leisure Ltd. |
|
|
|
|
27,103 |
|
|
|
548,702 |
|
ASX Ltd. |
|
|
|
|
11,271 |
|
|
|
498,819 |
|
Aurizon Holdings Ltd. |
|
|
|
|
87,158 |
|
|
|
296,060 |
|
Australia & New Zealand Banking Group Ltd. |
|
|
|
|
101,243 |
|
|
|
2,051,200 |
|
Bank of Queensland Ltd. |
|
|
|
|
25,016 |
|
|
|
189,966 |
|
Bendigo & Adelaide Bank Ltd. |
|
|
|
|
27,166 |
|
|
|
217,776 |
|
BHP Billiton Ltd. |
|
|
|
|
113,669 |
|
|
|
2,655,603 |
|
BHP Billiton PLC |
|
|
|
|
71,954 |
|
|
|
1,530,194 |
|
BlueScope Steel Ltd. |
|
|
|
|
21,017 |
|
|
|
261,926 |
|
Boral Ltd. |
|
|
|
|
60,995 |
|
|
|
316,769 |
|
Brambles Ltd. |
|
|
|
|
61,046 |
|
|
|
454,815 |
|
Caltex Australia Ltd. |
|
|
|
|
11,634 |
|
|
|
272,415 |
|
Challenger Ltd. |
|
|
|
|
33,725 |
|
|
|
274,939 |
|
Coca-Cola Amatil Ltd. |
|
|
|
|
33,797 |
|
|
|
237,003 |
|
Commonwealth Bank of Australia |
|
|
|
|
61,776 |
|
|
|
3,349,081 |
|
Computershare Ltd. |
|
|
|
|
26,574 |
|
|
|
341,009 |
|
CSL Ltd. |
|
|
|
|
17,032 |
|
|
|
2,190,251 |
|
Dexus |
|
|
|
|
50,973 |
|
|
|
365,146 |
|
Fortescue Metals Group Ltd. |
|
|
|
|
56,066 |
|
|
|
192,986 |
|
Goodman Group |
|
|
|
|
73,245 |
|
|
|
501,471 |
|
GPT Group (The) |
|
|
|
|
88,296 |
|
|
|
322,587 |
|
Incitec Pivot Ltd. |
|
|
|
|
85,226 |
|
|
|
244,465 |
|
Insurance Australia Group Ltd. |
|
|
|
|
101,935 |
|
|
|
607,870 |
|
Macquarie Group Ltd. |
|
|
|
|
11,773 |
|
|
|
965,911 |
|
Medibank Pvt Ltd. |
|
|
|
|
129,419 |
|
|
|
286,237 |
|
Mirvac Group |
|
|
|
|
182,474 |
|
|
|
308,539 |
|
National Australia Bank Ltd. |
|
|
|
|
95,118 |
|
|
|
2,078,604 |
|
Newcrest Mining Ltd. |
|
|
|
|
28,050 |
|
|
|
447,820 |
|
Oil Search Ltd. |
|
|
|
|
57,435 |
|
|
|
339,902 |
|
Orica Ltd. |
|
|
|
|
18,068 |
|
|
|
271,136 |
|
Origin Energy Ltd.* |
|
|
|
|
71,472 |
|
|
|
526,019 |
|
QBE Insurance Group Ltd. |
|
|
|
|
53,554 |
|
|
|
402,635 |
|
Ramsay Health Care Ltd. |
|
|
|
|
5,637 |
|
|
|
275,262 |
|
Santos Ltd.* |
|
|
|
|
73,251 |
|
|
|
339,502 |
|
Scentre Group |
|
|
|
|
193,111 |
|
|
|
587,452 |
|
SEEK Ltd. |
|
|
|
|
20,226 |
|
|
|
296,649 |
|
Sonic Healthcare Ltd. |
|
|
|
|
19,411 |
|
|
|
346,089 |
|
South32 Ltd. |
|
|
|
|
192,815 |
|
|
|
541,433 |
|
Stockland |
|
|
|
|
108,423 |
|
|
|
338,830 |
|
Suncorp Group Ltd. |
|
|
|
|
53,387 |
|
|
|
564,994 |
|
Sydney Airport |
|
|
|
|
54,214 |
|
|
|
291,784 |
|
Telstra Corp. Ltd. |
|
|
|
|
143,091 |
|
|
|
343,479 |
|
Transurban Group |
|
|
|
|
83,812 |
|
|
|
733,879 |
|
Treasury Wine Estates Ltd. |
|
|
|
|
33,569 |
|
|
|
483,225 |
|
Vicinity Centres |
|
|
|
|
133,491 |
|
|
|
245,868 |
|
Wesfarmers Ltd. |
|
|
|
|
40,157 |
|
|
|
1,326,778 |
|
Westfield Corp. |
|
|
|
|
75,914 |
|
|
|
527,194 |
|
Westpac Banking Corp. |
|
|
|
|
117,540 |
|
|
|
2,541,085 |
|
Woodside Petroleum Ltd. |
|
|
|
|
37,031 |
|
|
|
900,641 |
|
Woolworths Group Ltd. |
|
|
|
|
48,906 |
|
|
|
1,028,499 |
|
Total Australia |
|
|
|
|
|
|
|
|
37,071,718 |
|
| |
Austria — 0.3%
|
|
|
|
|
|
|
|
|
|
|
ams AG* |
|
|
|
|
2,267 |
|
|
|
188,661 |
|
ANDRITZ AG |
|
|
|
|
4,362 |
|
|
|
234,839 |
|
Erste Group Bank AG* |
|
|
|
|
12,996 |
|
|
|
637,491 |
|
|
|
|
|
|
|
|
|
|
|
|
|
|
|
|
Shares
|
|
Value
|
Common Stocks (continued)
|
|
|
|
|
|
|
|
|
|
|
| |
Austria (continued)
|
|
|
|
|
|
|
|
|
|
|
OMV AG |
|
|
|
|
7,911 |
|
|
$ |
492,240 |
|
Total Austria |
|
|
|
|
|
|
|
|
1,553,231 |
|
| |
Belgium — 1.0%
|
|
|
|
|
|
|
|
|
|
|
Ageas |
|
|
|
|
8,674 |
|
|
|
465,833 |
|
Anheuser-Busch InBev SA/NV(a) |
|
|
|
|
26,351 |
|
|
|
2,633,578 |
|
Groupe Bruxelles Lambert SA |
|
|
|
|
3,790 |
|
|
|
434,829 |
|
KBC Group NV |
|
|
|
|
10,257 |
|
|
|
897,217 |
|
Proximus SADP |
|
|
|
|
6,544 |
|
|
|
201,061 |
|
Solvay SA |
|
|
|
|
3,099 |
|
|
|
432,831 |
|
UCB SA |
|
|
|
|
5,128 |
|
|
|
388,839 |
|
Umicore SA |
|
|
|
|
9,600 |
|
|
|
536,556 |
|
Total Belgium |
|
|
|
|
|
|
|
|
5,990,744 |
|
| |
Chile — 0.0%(b)
|
|
|
|
|
|
|
|
|
|
|
Antofagasta PLC |
|
|
|
|
13,367 |
|
|
|
179,029 |
|
| |
China — 0.3%
|
|
|
|
|
|
|
|
|
|
|
AAC Technologies Holdings, Inc. |
|
|
|
|
25,842 |
|
|
|
376,357 |
|
BOC Hong Kong Holdings Ltd. |
|
|
|
|
147,200 |
|
|
|
766,173 |
|
China Mengniu Dairy Co., Ltd.* |
|
|
|
|
109,836 |
|
|
|
356,872 |
|
Want Want China Holdings Ltd. |
|
|
|
|
294,364 |
|
|
|
261,423 |
|
Total China |
|
|
|
|
|
|
|
|
1,760,825 |
|
| |
Denmark — 1.5%
|
|
|
|
|
|
|
|
|
|
|
AP
Moller — Maersk A/S, Class A |
|
|
|
|
167 |
|
|
|
256,323 |
|
AP
Moller — Maersk A/S, Class B |
|
|
|
|
240 |
|
|
|
387,478 |
|
Carlsberg A/S, Class B(a) |
|
|
|
|
4,281 |
|
|
|
479,982 |
|
Chr Hansen Holding A/S |
|
|
|
|
4,628 |
|
|
|
421,174 |
|
Coloplast A/S, Class B |
|
|
|
|
6,088 |
|
|
|
517,317 |
|
Danske Bank A/S |
|
|
|
|
24,979 |
|
|
|
872,512 |
|
DSV A/S |
|
|
|
|
8,128 |
|
|
|
646,244 |
|
Genmab A/S* |
|
|
|
|
2,266 |
|
|
|
460,061 |
|
ISS A/S |
|
|
|
|
7,853 |
|
|
|
275,068 |
|
Novo Nordisk A/S, Class B |
|
|
|
|
62,477 |
|
|
|
2,956,352 |
|
Novozymes A/S, Class B |
|
|
|
|
8,739 |
|
|
|
413,096 |
|
Orsted A/S‡ |
|
|
|
|
2,823 |
|
|
|
186,364 |
|
Pandora A/S(a) |
|
|
|
|
3,936 |
|
|
|
438,748 |
|
Vestas Wind Systems A/S |
|
|
|
|
7,759 |
|
|
|
503,540 |
|
Total Denmark |
|
|
|
|
|
|
|
|
8,814,259 |
|
| |
Finland — 1.0%
|
|
|
|
|
|
|
|
|
|
|
Elisa OYJ |
|
|
|
|
5,914 |
|
|
|
262,375 |
|
Fortum OYJ |
|
|
|
|
16,387 |
|
|
|
378,354 |
|
Kone OYJ, Class B |
|
|
|
|
13,602 |
|
|
|
678,064 |
|
Neste OYJ |
|
|
|
|
4,506 |
|
|
|
380,546 |
|
Nokia OYJ |
|
|
|
|
200,850 |
|
|
|
1,207,995 |
|
Nokian Renkaat OYJ |
|
|
|
|
5,995 |
|
|
|
240,835 |
|
Sampo OYJ, Class A |
|
|
|
|
16,790 |
|
|
|
907,784 |
|
Stora Enso OYJ, Class R |
|
|
|
|
20,944 |
|
|
|
415,880 |
|
UPM-Kymmene OYJ |
|
|
|
|
21,446 |
|
|
|
769,040 |
|
Wartsila OYJ Abp |
|
|
|
|
20,163 |
|
|
|
429,970 |
|
Total Finland |
|
|
|
|
|
|
|
|
5,670,843 |
|
| |
France — 9.6%
|
|
|
|
|
|
|
|
|
|
|
Accor SA |
|
|
|
|
8,942 |
|
|
|
506,370 |
|
Aeroports de Paris |
|
|
|
|
922 |
|
|
|
203,186 |
|
Air Liquide SA |
|
|
|
|
15,387 |
|
|
|
2,008,710 |
|
Airbus SE |
|
|
|
|
19,765 |
|
|
|
2,325,918 |
|
Alstom SA |
|
|
|
|
7,077 |
|
|
|
322,437 |
|
Arkema SA |
|
|
|
|
3,470 |
|
|
|
454,881 |
|
Atos SE |
|
|
|
|
3,856 |
|
|
|
521,322 |
|
AXA SA |
|
|
|
|
65,758 |
|
|
|
1,884,525 |
|
See notes to financial
statements.
91
Schedules of Investments —
IQ 50 Percent Hedged FTSE International ETF (continued)
April
30, 2018
|
|
|
|
Shares
|
|
Value
|
|
|
|
|
|
|
|
|
|
|
|
Common Stocks (continued)
|
|
|
|
|
|
|
|
|
|
|
| |
France (continued)
|
|
|
|
|
|
|
|
|
|
|
BNP Paribas SA |
|
|
|
|
38,814 |
|
|
$ |
3,000,345 |
|
Bouygues SA |
|
|
|
|
8,349 |
|
|
|
426,187 |
|
Bureau Veritas SA |
|
|
|
|
12,289 |
|
|
|
321,450 |
|
Capgemini SE |
|
|
|
|
5,602 |
|
|
|
771,590 |
|
Carrefour SA |
|
|
|
|
20,557 |
|
|
|
423,098 |
|
Cie de Saint-Gobain |
|
|
|
|
18,729 |
|
|
|
984,221 |
|
Cie Generale des Etablissements Michelin |
|
|
|
|
7,061 |
|
|
|
994,299 |
|
Credit Agricole SA |
|
|
|
|
39,632 |
|
|
|
652,890 |
|
Danone SA |
|
|
|
|
19,891 |
|
|
|
1,612,327 |
|
Dassault Systemes SE |
|
|
|
|
5,285 |
|
|
|
684,827 |
|
Edenred |
|
|
|
|
12,566 |
|
|
|
432,694 |
|
Electricite de France SA |
|
|
|
|
13,166 |
|
|
|
185,318 |
|
Engie SA |
|
|
|
|
58,819 |
|
|
|
1,033,997 |
|
Essilor International SA |
|
|
|
|
7,442 |
|
|
|
1,016,480 |
|
Eutelsat Communications SA |
|
|
|
|
8,643 |
|
|
|
187,338 |
|
Getlink |
|
|
|
|
19,686 |
|
|
|
278,042 |
|
Hermes International |
|
|
|
|
1,195 |
|
|
|
773,587 |
|
Iliad SA |
|
|
|
|
1,065 |
|
|
|
213,533 |
|
Ingenico Group SA |
|
|
|
|
2,472 |
|
|
|
216,235 |
|
Ipsen SA |
|
|
|
|
1,631 |
|
|
|
265,042 |
|
JCDecaux SA |
|
|
|
|
4,194 |
|
|
|
150,090 |
|
Kering |
|
|
|
|
2,926 |
|
|
|
1,695,478 |
|
Klepierre SA |
|
|
|
|
8,473 |
|
|
|
347,242 |
|
Legrand SA |
|
|
|
|
10,942 |
|
|
|
852,698 |
|
L’Oreal SA |
|
|
|
|
8,495 |
|
|
|
2,040,927 |
|
LVMH Moet Hennessy Louis Vuitton SE |
|
|
|
|
8,943 |
|
|
|
3,125,865 |
|
Natixis SA |
|
|
|
|
31,666 |
|
|
|
260,619 |
|
Orange SA |
|
|
|
|
66,658 |
|
|
|
1,217,304 |
|
Orpea |
|
|
|
|
2,259 |
|
|
|
290,263 |
|
Pernod Ricard SA |
|
|
|
|
7,320 |
|
|
|
1,216,495 |
|
Peugeot SA |
|
|
|
|
15,777 |
|
|
|
389,241 |
|
Publicis Groupe SA |
|
|
|
|
8,126 |
|
|
|
608,705 |
|
Renault SA |
|
|
|
|
6,989 |
|
|
|
758,618 |
|
Rexel SA |
|
|
|
|
15,672 |
|
|
|
243,313 |
|
Rubis SCA |
|
|
|
|
3,700 |
|
|
|
288,337 |
|
Safran SA |
|
|
|
|
10,462 |
|
|
|
1,231,912 |
|
Sanofi |
|
|
|
|
39,003 |
|
|
|
3,100,248 |
|
Schneider Electric SE* |
|
|
|
|
19,629 |
|
|
|
1,785,321 |
|
SCOR SE |
|
|
|
|
7,773 |
|
|
|
316,018 |
|
Societe Generale SA |
|
|
|
|
26,359 |
|
|
|
1,447,602 |
|
Sodexo SA |
|
|
|
|
3,002 |
|
|
|
297,778 |
|
Suez |
|
|
|
|
13,299 |
|
|
|
192,171 |
|
Teleperformance |
|
|
|
|
2,395 |
|
|
|
384,564 |
|
Thales SA |
|
|
|
|
4,109 |
|
|
|
521,272 |
|
TOTAL SA |
|
|
|
|
78,948 |
|
|
|
4,991,493 |
|
Ubisoft Entertainment SA* |
|
|
|
|
3,385 |
|
|
|
324,154 |
|
Unibail-Rodamco SE |
|
|
|
|
3,697 |
|
|
|
888,429 |
|
Valeo SA |
|
|
|
|
9,529 |
|
|
|
638,277 |
|
Veolia Environnement SA* |
|
|
|
|
18,176 |
|
|
|
431,628 |
|
Vinci SA |
|
|
|
|
17,164 |
|
|
|
1,723,289 |
|
Vivendi SA |
|
|
|
|
40,390 |
|
|
|
1,068,214 |
|
Total France |
|
|
|
|
|
|
|
|
55,528,414 |
|
| |
Germany — 8.3%
|
|
|
|
|
|
|
|
|
|
|
adidas AG |
|
|
|
|
7,524 |
|
|
|
1,853,551 |
|
Allianz SE |
|
|
|
|
15,402 |
|
|
|
3,655,862 |
|
BASF SE |
|
|
|
|
33,141 |
|
|
|
3,456,333 |
|
Bayer AG |
|
|
|
|
29,934 |
|
|
|
3,590,584 |
|
Bayerische Motoren Werke AG |
|
|
|
|
12,254 |
|
|
|
1,369,044 |
|
Beiersdorf AG |
|
|
|
|
4,341 |
|
|
|
492,591 |
|
|
|
|
|
|
|
|
|
|
|
|
|
|
|
|
Shares
|
|
Value
|
Common Stocks (continued)
|
|
|
|
|
|
|
|
|
|
|
| |
Germany (continued)
|
|
|
|
|
|
|
|
|
|
|
Brenntag AG |
|
|
|
|
6,680 |
|
|
$ |
383,523 |
|
Commerzbank AG* |
|
|
|
|
39,954 |
|
|
|
516,997 |
|
Continental AG |
|
|
|
|
3,871 |
|
|
|
1,034,539 |
|
Covestro AG‡ |
|
|
|
|
4,651 |
|
|
|
424,597 |
|
Daimler AG |
|
|
|
|
33,862 |
|
|
|
2,679,739 |
|
Delivery Hero AG‡* |
|
|
|
|
4,479 |
|
|
|
214,296 |
|
Deutsche Bank AG |
|
|
|
|
68,638 |
|
|
|
942,564 |
|
Deutsche Boerse AG |
|
|
|
|
6,759 |
|
|
|
911,758 |
|
Deutsche Lufthansa AG |
|
|
|
|
6,944 |
|
|
|
202,780 |
|
Deutsche Post AG |
|
|
|
|
33,241 |
|
|
|
1,449,839 |
|
Deutsche Telekom AG |
|
|
|
|
111,607 |
|
|
|
1,954,557 |
|
Deutsche Wohnen SE |
|
|
|
|
14,577 |
|
|
|
689,331 |
|
E.ON SE |
|
|
|
|
74,279 |
|
|
|
814,156 |
|
Fresenius Medical Care AG & Co. KGaA |
|
|
|
|
7,821 |
|
|
|
796,389 |
|
Fresenius SE & Co. KGaA |
|
|
|
|
15,492 |
|
|
|
1,185,562 |
|
GEA Group AG |
|
|
|
|
7,554 |
|
|
|
295,798 |
|
Hannover Rueck SE |
|
|
|
|
2,513 |
|
|
|
354,022 |
|
HeidelbergCement AG |
|
|
|
|
5,746 |
|
|
|
564,132 |
|
Henkel AG & Co. KGaA |
|
|
|
|
3,756 |
|
|
|
448,127 |
|
HUGO BOSS AG |
|
|
|
|
3,154 |
|
|
|
296,469 |
|
Infineon Technologies AG |
|
|
|
|
45,039 |
|
|
|
1,157,974 |
|
K+S AG |
|
|
|
|
8,149 |
|
|
|
240,332 |
|
LANXESS AG |
|
|
|
|
4,474 |
|
|
|
332,762 |
|
LEG Immobilien AG |
|
|
|
|
2,194 |
|
|
|
253,256 |
|
Linde AG* |
|
|
|
|
6,870 |
|
|
|
1,527,676 |
|
Merck KGaA |
|
|
|
|
4,790 |
|
|
|
470,043 |
|
METRO AG |
|
|
|
|
7,008 |
|
|
|
101,732 |
|
MTU Aero Engines AG |
|
|
|
|
2,715 |
|
|
|
469,077 |
|
Muenchener Rueckversicherungs-Gesellschaft AG |
|
|
|
|
4,730 |
|
|
|
1,085,523 |
|
OSRAM Licht AG |
|
|
|
|
4,876 |
|
|
|
281,422 |
|
ProSiebenSat.1 Media SE |
|
|
|
|
9,702 |
|
|
|
352,831 |
|
RWE AG |
|
|
|
|
20,026 |
|
|
|
480,884 |
|
SAP SE |
|
|
|
|
32,605 |
|
|
|
3,640,732 |
|
Siemens AG |
|
|
|
|
26,857 |
|
|
|
3,427,871 |
|
Symrise AG |
|
|
|
|
5,660 |
|
|
|
458,857 |
|
thyssenkrupp AG |
|
|
|
|
18,680 |
|
|
|
487,494 |
|
TUI AG |
|
|
|
|
16,991 |
|
|
|
385,089 |
|
United Internet AG |
|
|
|
|
5,088 |
|
|
|
330,603 |
|
Volkswagen AG |
|
|
|
|
988 |
|
|
|
202,213 |
|
Vonovia SE |
|
|
|
|
16,458 |
|
|
|
827,396 |
|
Wirecard AG |
|
|
|
|
5,096 |
|
|
|
696,355 |
|
Zalando SE‡* |
|
|
|
|
4,912 |
|
|
|
253,707 |
|
Total Germany |
|
|
|
|
|
|
|
|
48,040,969 |
|
| |
Hong Kong — 3.2%
|
|
|
|
|
|
|
|
|
|
|
AIA Group Ltd. |
|
|
|
|
436,814 |
|
|
|
3,934,985 |
|
ASM Pacific Technology Ltd. |
|
|
|
|
13,367 |
|
|
|
183,944 |
|
Bank of East Asia Ltd. (The) |
|
|
|
|
68,309 |
|
|
|
301,149 |
|
CK
Asset Holdings Ltd. |
|
|
|
|
102,858 |
|
|
|
891,853 |
|
CK
Hutchison Holdings Ltd. |
|
|
|
|
104,854 |
|
|
|
1,243,832 |
|
CK
Infrastructure Holdings Ltd. |
|
|
|
|
31,603 |
|
|
|
250,062 |
|
CLP Holdings Ltd. |
|
|
|
|
66,630 |
|
|
|
691,918 |
|
Galaxy Entertainment Group Ltd. |
|
|
|
|
83,752 |
|
|
|
740,597 |
|
Hang Lung Properties Ltd. |
|
|
|
|
96,000 |
|
|
|
228,005 |
|
Hang Seng Bank Ltd. |
|
|
|
|
30,343 |
|
|
|
771,696 |
|
Henderson Land Development Co., Ltd. |
|
|
|
|
49,103 |
|
|
|
313,141 |
|
Hong Kong & China Gas Co., Ltd. |
|
|
|
|
333,385 |
|
|
|
698,353 |
|
Hong Kong Exchanges and Clearing Ltd. |
|
|
|
|
45,717 |
|
|
|
1,498,221 |
|
See notes to financial
statements.
92
Schedules of Investments —
IQ 50 Percent Hedged FTSE International ETF (continued)
April
30, 2018
|
|
|
|
Shares
|
|
Value
|
|
|
|
|
|
|
|
|
|
|
|
Common Stocks (continued)
|
|
|
|
|
|
|
|
|
|
|
| |
Hong Kong (continued)
|
|
|
|
|
|
|
|
|
|
|
Hongkong Land Holdings Ltd. |
|
|
|
|
51,626 |
|
|
$ |
374,288 |
|
Hopewell Holdings Ltd. |
|
|
|
|
59,927 |
|
|
|
213,418 |
|
Hysan Development Co., Ltd. |
|
|
|
|
50,627 |
|
|
|
295,766 |
|
Jardine Matheson Holdings Ltd. |
|
|
|
|
7,842 |
|
|
|
476,245 |
|
Jardine Strategic Holdings Ltd. |
|
|
|
|
7,620 |
|
|
|
289,560 |
|
Link REIT |
|
|
|
|
92,017 |
|
|
|
816,027 |
|
MTR Corp. Ltd. |
|
|
|
|
61,347 |
|
|
|
345,887 |
|
New World Development Co., Ltd. |
|
|
|
|
260,432 |
|
|
|
384,928 |
|
Power Assets Holdings Ltd. |
|
|
|
|
55,838 |
|
|
|
415,855 |
|
Sino Land Co., Ltd. |
|
|
|
|
149,380 |
|
|
|
258,476 |
|
Sun Hung Kai Properties Ltd. |
|
|
|
|
53,508 |
|
|
|
864,500 |
|
Swire Pacific Ltd., Class A |
|
|
|
|
24,754 |
|
|
|
246,018 |
|
Techtronic Industries Co., Ltd. |
|
|
|
|
61,494 |
|
|
|
363,562 |
|
WH
Group Ltd.‡ |
|
|
|
|
317,247 |
|
|
|
331,061 |
|
Wharf Real Estate Investment Co., Ltd. |
|
|
|
|
49,340 |
|
|
|
370,918 |
|
Wheelock & Co., Ltd. |
|
|
|
|
38,498 |
|
|
|
287,205 |
|
Yue Yuen Industrial Holdings Ltd. |
|
|
|
|
44,511 |
|
|
|
126,757 |
|
Total Hong Kong |
|
|
|
|
|
|
|
|
18,208,227 |
|
| |
Ireland — 0.6%
|
|
|
|
|
|
|
|
|
|
|
AIB Group PLC |
|
|
|
|
24,344 |
|
|
|
145,356 |
|
Bank of Ireland Group PLC |
|
|
|
|
34,145 |
|
|
|
307,342 |
|
CRH PLC(c) |
|
|
|
|
28,899 |
|
|
|
1,027,342 |
|
James Hardie Industries PLC |
|
|
|
|
19,251 |
|
|
|
343,091 |
|
Kerry Group PLC, Class A(a) |
|
|
|
|
5,417 |
|
|
|
553,037 |
|
Kingspan Group PLC |
|
|
|
|
5,791 |
|
|
|
262,376 |
|
Paddy Power Betfair PLC |
|
|
|
|
3,123 |
|
|
|
308,845 |
|
Smurfit Kappa Group PLC |
|
|
|
|
8,948 |
|
|
|
381,321 |
|
Total Ireland |
|
|
|
|
|
|
|
|
3,328,710 |
|
| |
Israel — 0.4%
|
|
|
|
|
|
|
|
|
|
|
Bank Hapoalim BM |
|
|
|
|
79,611 |
|
|
|
545,654 |
|
Bank Leumi Le-Israel BM |
|
|
|
|
108,273 |
|
|
|
640,989 |
|
Bezeq The Israeli Telecommunication Corp. Ltd. |
|
|
|
|
171,958 |
|
|
|
217,080 |
|
Nice Ltd.* |
|
|
|
|
5,297 |
|
|
|
502,626 |
|
Teva Pharmaceutical Industries Ltd. |
|
|
|
|
33,969 |
|
|
|
620,296 |
|
Total Israel |
|
|
|
|
|
|
|
|
2,526,645 |
|
| |
Italy — 2.3%
|
|
|
|
|
|
|
|
|
|
|
Assicurazioni Generali SpA(a) |
|
|
|
|
47,642 |
|
|
|
963,572 |
|
Atlantia SpA |
|
|
|
|
22,813 |
|
|
|
757,973 |
|
Banco BPM SpA* |
|
|
|
|
64,095 |
|
|
|
233,596 |
|
Enel SpA |
|
|
|
|
283,551 |
|
|
|
1,804,744 |
|
Eni SpA |
|
|
|
|
94,066 |
|
|
|
1,841,138 |
|
Ferrari NV |
|
|
|
|
4,756 |
|
|
|
586,399 |
|
Intesa Sanpaolo SpA |
|
|
|
|
507,312 |
|
|
|
1,935,033 |
|
Leonardo SpA |
|
|
|
|
19,601 |
|
|
|
227,583 |
|
Luxottica Group SpA |
|
|
|
|
6,457 |
|
|
|
403,798 |
|
Mediobanca SpA |
|
|
|
|
34,800 |
|
|
|
423,186 |
|
Prysmian SpA |
|
|
|
|
13,141 |
|
|
|
387,080 |
|
Recordati SpA |
|
|
|
|
7,306 |
|
|
|
261,724 |
|
Snam SpA |
|
|
|
|
100,019 |
|
|
|
481,559 |
|
Telecom Italia SpA*(a) |
|
|
|
|
415,771 |
|
|
|
411,010 |
|
Telecom Italia SpA-RSP |
|
|
|
|
237,608 |
|
|
|
204,686 |
|
Terna Rete Elettrica Nazionale SpA |
|
|
|
|
71,038 |
|
|
|
427,166 |
|
UniCredit SpA |
|
|
|
|
81,419 |
|
|
|
1,768,109 |
|
Unione di Banche Italiane SpA(a) |
|
|
|
|
45,877 |
|
|
|
236,957 |
|
Total Italy |
|
|
|
|
|
|
|
|
13,355,313 |
|
|
|
|
|
|
|
|
|
|
|
|
|
|
|
|
Shares
|
|
Value
|
Common Stocks (continued)
|
|
|
|
|
|
|
|
|
|
|
| |
Japan — 23.7%
|
|
|
|
|
|
|
|
|
|
|
Aeon Co., Ltd. |
|
|
|
|
28,103 |
|
|
$ |
561,803 |
|
Air Water, Inc. |
|
|
|
|
12,174 |
|
|
|
235,192 |
|
Aisin Seiki Co., Ltd. |
|
|
|
|
7,348 |
|
|
|
398,877 |
|
Ajinomoto Co., Inc. |
|
|
|
|
21,752 |
|
|
|
398,762 |
|
Alfresa Holdings Corp. |
|
|
|
|
10,263 |
|
|
|
226,597 |
|
Alps Electric Co., Ltd. |
|
|
|
|
8,325 |
|
|
|
184,721 |
|
Amada Holdings Co., Ltd. |
|
|
|
|
22,939 |
|
|
|
276,086 |
|
Aozora Bank Ltd. |
|
|
|
|
7,365 |
|
|
|
297,831 |
|
Asahi Glass Co., Ltd. |
|
|
|
|
9,480 |
|
|
|
393,321 |
|
Asahi Group Holdings Ltd. |
|
|
|
|
15,872 |
|
|
|
802,992 |
|
Asahi Kasei Corp. |
|
|
|
|
55,050 |
|
|
|
758,400 |
|
Asics Corp. |
|
|
|
|
9,199 |
|
|
|
174,186 |
|
Astellas Pharma, Inc. |
|
|
|
|
78,942 |
|
|
|
1,158,249 |
|
Bandai Namco Holdings, Inc. |
|
|
|
|
10,097 |
|
|
|
342,795 |
|
Bridgestone Corp. |
|
|
|
|
23,594 |
|
|
|
989,471 |
|
Brother Industries Ltd. |
|
|
|
|
12,955 |
|
|
|
278,931 |
|
Canon, Inc. |
|
|
|
|
38,791 |
|
|
|
1,343,549 |
|
Casio Computer Co., Ltd. |
|
|
|
|
11,429 |
|
|
|
170,560 |
|
Central Japan Railway Co.(c) |
|
|
|
|
6,717 |
|
|
|
1,348,618 |
|
Chiba Bank Ltd. (The) |
|
|
|
|
33,844 |
|
|
|
273,412 |
|
Chubu Electric Power Co., Inc. |
|
|
|
|
26,610 |
|
|
|
416,689 |
|
Chugai Pharmaceutical Co., Ltd. |
|
|
|
|
9,194 |
|
|
|
485,641 |
|
Concordia Financial Group Ltd. |
|
|
|
|
54,063 |
|
|
|
314,719 |
|
Credit Saison Co., Ltd. |
|
|
|
|
9,505 |
|
|
|
170,512 |
|
Dai Nippon Printing Co., Ltd. |
|
|
|
|
14,989 |
|
|
|
322,998 |
|
Daicel Corp. |
|
|
|
|
17,429 |
|
|
|
201,646 |
|
Daifuku Co., Ltd. |
|
|
|
|
3,569 |
|
|
|
191,782 |
|
Dai-ichi Life Holdings, Inc. |
|
|
|
|
42,200 |
|
|
|
838,408 |
|
Daiichi Sankyo Co., Ltd. |
|
|
|
|
27,377 |
|
|
|
938,211 |
|
Daikin Industries Ltd. |
|
|
|
|
10,398 |
|
|
|
1,216,782 |
|
Daito Trust Construction Co., Ltd. |
|
|
|
|
3,070 |
|
|
|
512,158 |
|
Daiwa House Industry Co., Ltd. |
|
|
|
|
24,806 |
|
|
|
909,043 |
|
Daiwa Securities Group, Inc. |
|
|
|
|
67,942 |
|
|
|
417,680 |
|
Denso Corp. |
|
|
|
|
17,594 |
|
|
|
925,484 |
|
Dentsu, Inc. |
|
|
|
|
8,857 |
|
|
|
419,276 |
|
Disco Corp. |
|
|
|
|
960 |
|
|
|
169,146 |
|
Don Quijote Holdings Co., Ltd. |
|
|
|
|
5,411 |
|
|
|
291,751 |
|
East Japan Railway Co.(c) |
|
|
|
|
13,671 |
|
|
|
1,310,567 |
|
Eisai Co., Ltd. |
|
|
|
|
10,420 |
|
|
|
699,428 |
|
Electric Power Development Co., Ltd. |
|
|
|
|
7,785 |
|
|
|
211,869 |
|
FANUC Corp.(c) |
|
|
|
|
7,251 |
|
|
|
1,561,193 |
|
Fast Retailing Co., Ltd. |
|
|
|
|
2,007 |
|
|
|
884,235 |
|
FUJIFILM Holdings Corp. |
|
|
|
|
15,416 |
|
|
|
620,585 |
|
Fujitsu Ltd. |
|
|
|
|
76,983 |
|
|
|
468,476 |
|
Fukuoka Financial Group, Inc. |
|
|
|
|
42,127 |
|
|
|
225,601 |
|
Hamamatsu Photonics K.K. |
|
|
|
|
7,014 |
|
|
|
270,496 |
|
Hankyu Hanshin Holdings, Inc. |
|
|
|
|
10,465 |
|
|
|
412,671 |
|
Hino Motors Ltd. |
|
|
|
|
16,732 |
|
|
|
204,439 |
|
Hirose Electric Co., Ltd. |
|
|
|
|
2,019 |
|
|
|
284,514 |
|
Hitachi Ltd.(c) |
|
|
|
|
172,292 |
|
|
|
1,262,136 |
|
Honda Motor Co., Ltd.(c) |
|
|
|
|
63,568 |
|
|
|
2,188,354 |
|
Hoya Corp. |
|
|
|
|
15,780 |
|
|
|
845,349 |
|
Idemitsu Kosan Co., Ltd. |
|
|
|
|
5,966 |
|
|
|
233,624 |
|
IHI Corp. |
|
|
|
|
7,240 |
|
|
|
237,529 |
|
Inpex Corp. |
|
|
|
|
38,946 |
|
|
|
499,171 |
|
Isetan Mitsukoshi Holdings Ltd. |
|
|
|
|
15,654 |
|
|
|
174,243 |
|
Isuzu Motors Ltd. |
|
|
|
|
26,483 |
|
|
|
405,141 |
|
ITOCHU Corp. |
|
|
|
|
55,602 |
|
|
|
1,114,835 |
|
J
Front Retailing Co., Ltd. |
|
|
|
|
12,159 |
|
|
|
197,233 |
|
See notes to financial
statements.
93
Schedules of Investments —
IQ 50 Percent Hedged FTSE International ETF (continued)
April
30, 2018
|
|
|
|
Shares
|
|
Value
|
|
|
|
|
|
|
|
|
|
|
|
Common Stocks (continued)
|
|
|
|
|
|
|
|
|
|
|
| |
Japan (continued)
|
|
|
|
|
|
|
|
|
|
|
Japan Exchange Group, Inc. |
|
|
|
|
22,082 |
|
|
$ |
409,655 |
|
Japan Tobacco, Inc.(c) |
|
|
|
|
44,457 |
|
|
|
1,193,036 |
|
JFE Holdings, Inc. |
|
|
|
|
21,008 |
|
|
|
432,831 |
|
JGC Corp. |
|
|
|
|
12,603 |
|
|
|
309,244 |
|
JTEKT Corp. |
|
|
|
|
12,170 |
|
|
|
197,411 |
|
JXTG Holdings, Inc. |
|
|
|
|
138,738 |
|
|
|
905,775 |
|
Kajima Corp. |
|
|
|
|
34,230 |
|
|
|
330,022 |
|
Kansai Electric Power Co., Inc. (The) |
|
|
|
|
28,345 |
|
|
|
396,325 |
|
Kansai Paint Co., Ltd. |
|
|
|
|
12,930 |
|
|
|
291,154 |
|
Kao Corp. |
|
|
|
|
18,816 |
|
|
|
1,350,694 |
|
Kawasaki Heavy Industries Ltd. |
|
|
|
|
7,258 |
|
|
|
243,426 |
|
KDDI Corp.(c) |
|
|
|
|
64,979 |
|
|
|
1,744,056 |
|
Keikyu Corp. |
|
|
|
|
13,441 |
|
|
|
246,526 |
|
Keio Corp. |
|
|
|
|
6,028 |
|
|
|
275,991 |
|
Keisei Electric Railway Co., Ltd. |
|
|
|
|
7,871 |
|
|
|
256,792 |
|
Keyence Corp.(c) |
|
|
|
|
3,373 |
|
|
|
2,064,335 |
|
Kikkoman Corp. |
|
|
|
|
8,841 |
|
|
|
383,373 |
|
Kintetsu Group Holdings Co., Ltd. |
|
|
|
|
7,871 |
|
|
|
320,451 |
|
Kirin Holdings Co., Ltd. |
|
|
|
|
35,045 |
|
|
|
984,174 |
|
Koito Manufacturing Co., Ltd. |
|
|
|
|
5,893 |
|
|
|
395,829 |
|
Komatsu Ltd. |
|
|
|
|
35,145 |
|
|
|
1,204,421 |
|
Konami Holdings Corp. |
|
|
|
|
4,119 |
|
|
|
202,515 |
|
Konica Minolta, Inc. |
|
|
|
|
22,802 |
|
|
|
195,877 |
|
Kubota Corp. |
|
|
|
|
44,896 |
|
|
|
758,832 |
|
Kuraray Co., Ltd. |
|
|
|
|
20,230 |
|
|
|
336,843 |
|
Kurita Water Industries Ltd. |
|
|
|
|
9,003 |
|
|
|
292,078 |
|
Kyocera Corp. |
|
|
|
|
12,530 |
|
|
|
801,325 |
|
Kyowa Hakko Kirin Co., Ltd. |
|
|
|
|
13,322 |
|
|
|
289,024 |
|
Kyushu Electric Power Co., Inc. |
|
|
|
|
19,511 |
|
|
|
241,068 |
|
Lion Corp. |
|
|
|
|
11,268 |
|
|
|
243,226 |
|
LIXIL Group Corp. |
|
|
|
|
12,434 |
|
|
|
278,735 |
|
M3, Inc. |
|
|
|
|
10,063 |
|
|
|
381,185 |
|
Makita Corp. |
|
|
|
|
11,640 |
|
|
|
523,361 |
|
Marubeni Corp. |
|
|
|
|
72,631 |
|
|
|
547,064 |
|
Marui Group Co., Ltd. |
|
|
|
|
12,151 |
|
|
|
252,625 |
|
Mazda Motor Corp. |
|
|
|
|
22,551 |
|
|
|
313,560 |
|
MEIJI Holdings Co., Ltd. |
|
|
|
|
5,714 |
|
|
|
458,478 |
|
MINEBEA MITSUMI, Inc. |
|
|
|
|
15,420 |
|
|
|
309,598 |
|
Miraca Holdings, Inc. |
|
|
|
|
4,369 |
|
|
|
170,488 |
|
MISUMI Group, Inc. |
|
|
|
|
14,238 |
|
|
|
394,253 |
|
Mitsubishi Chemical Holdings Corp. |
|
|
|
|
54,018 |
|
|
|
513,152 |
|
Mitsubishi Corp. |
|
|
|
|
50,530 |
|
|
|
1,397,800 |
|
Mitsubishi Electric Corp. |
|
|
|
|
74,991 |
|
|
|
1,151,678 |
|
Mitsubishi Estate Co., Ltd. |
|
|
|
|
46,061 |
|
|
|
842,926 |
|
Mitsubishi Heavy Industries Ltd. |
|
|
|
|
12,167 |
|
|
|
481,009 |
|
Mitsubishi Materials Corp. |
|
|
|
|
6,228 |
|
|
|
190,098 |
|
Mitsubishi Motors Corp. |
|
|
|
|
29,510 |
|
|
|
220,061 |
|
Mitsubishi UFJ Financial Group, Inc.(c) |
|
|
|
|
460,019 |
|
|
|
3,082,348 |
|
Mitsui & Co., Ltd. |
|
|
|
|
65,006 |
|
|
|
1,174,177 |
|
Mitsui Chemicals, Inc. |
|
|
|
|
6,795 |
|
|
|
194,986 |
|
Mitsui Fudosan Co., Ltd. |
|
|
|
|
35,254 |
|
|
|
905,795 |
|
Mitsui OSK Lines Ltd. |
|
|
|
|
6,551 |
|
|
|
194,270 |
|
Mizuho Financial Group, Inc. |
|
|
|
|
870,300 |
|
|
|
1,577,953 |
|
MS&AD Insurance Group Holdings, Inc. |
|
|
|
|
20,120 |
|
|
|
675,171 |
|
Murata Manufacturing Co., Ltd. |
|
|
|
|
7,102 |
|
|
|
898,905 |
|
Nabtesco Corp. |
|
|
|
|
8,614 |
|
|
|
311,340 |
|
NEC Corp. |
|
|
|
|
10,396 |
|
|
|
285,492 |
|
Nexon Co., Ltd.* |
|
|
|
|
14,198 |
|
|
|
206,693 |
|
NGK Insulators Ltd. |
|
|
|
|
13,126 |
|
|
|
241,348 |
|
NGK Spark Plug Co., Ltd. |
|
|
|
|
10,133 |
|
|
|
261,138 |
|
NH
Foods Ltd. |
|
|
|
|
5,923 |
|
|
|
259,004 |
|
|
|
|
|
|
|
|
|
|
|
|
|
|
|
|
Shares
|
|
Value
|
Common Stocks (continued)
|
|
|
|
|
|
|
|
|
|
|
| |
Japan (continued)
|
|
|
|
|
|
|
|
|
|
|
Nidec Corp. |
|
|
|
|
8,838 |
|
|
$ |
1,384,358 |
|
Nihon M&A Center, Inc. |
|
|
|
|
5,202 |
|
|
|
152,602 |
|
Nikon Corp. |
|
|
|
|
18,549 |
|
|
|
323,431 |
|
Nintendo Co., Ltd. |
|
|
|
|
3,935 |
|
|
|
1,660,306 |
|
Nippon Express Co., Ltd. |
|
|
|
|
3,732 |
|
|
|
282,053 |
|
Nippon Paint Holdings Co., Ltd. |
|
|
|
|
7,075 |
|
|
|
289,660 |
|
Nippon Shinyaku Co., Ltd. |
|
|
|
|
3,277 |
|
|
|
244,371 |
|
Nippon Steel & Sumitomo Metal Corp. |
|
|
|
|
30,473 |
|
|
|
664,182 |
|
Nippon Telegraph & Telephone Corp.(c) |
|
|
|
|
25,070 |
|
|
|
1,192,500 |
|
Nippon Yusen K.K. |
|
|
|
|
8,328 |
|
|
|
177,634 |
|
Nissan Chemical Industries Ltd. |
|
|
|
|
8,858 |
|
|
|
394,633 |
|
Nissan Motor Co., Ltd. |
|
|
|
|
66,504 |
|
|
|
699,834 |
|
Nisshin Seifun Group, Inc. |
|
|
|
|
15,774 |
|
|
|
344,959 |
|
Nissin Foods Holdings Co., Ltd. |
|
|
|
|
4,700 |
|
|
|
345,762 |
|
Nitori Holdings Co., Ltd. |
|
|
|
|
3,234 |
|
|
|
546,167 |
|
Nitto Denko Corp. |
|
|
|
|
6,466 |
|
|
|
481,589 |
|
Nomura Holdings, Inc.(c) |
|
|
|
|
128,695 |
|
|
|
743,414 |
|
Nomura Research Institute Ltd. |
|
|
|
|
5,990 |
|
|
|
309,285 |
|
NSK Ltd. |
|
|
|
|
21,733 |
|
|
|
291,958 |
|
NTT Data Corp. |
|
|
|
|
28,956 |
|
|
|
311,986 |
|
NTT DOCOMO, Inc. |
|
|
|
|
47,712 |
|
|
|
1,236,130 |
|
Obayashi Corp. |
|
|
|
|
32,665 |
|
|
|
376,726 |
|
Obic Co., Ltd. |
|
|
|
|
3,731 |
|
|
|
312,664 |
|
Odakyu Electric Railway Co., Ltd. |
|
|
|
|
14,437 |
|
|
|
311,499 |
|
Oji Holdings Corp. |
|
|
|
|
47,125 |
|
|
|
331,608 |
|
Olympus Corp. |
|
|
|
|
12,720 |
|
|
|
474,857 |
|
Omron Corp. |
|
|
|
|
8,874 |
|
|
|
481,714 |
|
Ono Pharmaceutical Co., Ltd. |
|
|
|
|
18,534 |
|
|
|
429,284 |
|
Oriental Land Co., Ltd. |
|
|
|
|
7,790 |
|
|
|
777,042 |
|
ORIX Corp. |
|
|
|
|
49,642 |
|
|
|
872,846 |
|
Osaka Gas Co., Ltd. |
|
|
|
|
15,785 |
|
|
|
339,574 |
|
Otsuka Holdings Co., Ltd. |
|
|
|
|
16,991 |
|
|
|
890,038 |
|
Panasonic Corp.(c) |
|
|
|
|
78,998 |
|
|
|
1,178,202 |
|
PeptiDream, Inc.* |
|
|
|
|
4,425 |
|
|
|
179,548 |
|
Pigeon Corp. |
|
|
|
|
4,686 |
|
|
|
219,686 |
|
Rakuten, Inc. |
|
|
|
|
29,521 |
|
|
|
210,485 |
|
Recruit Holdings Co., Ltd. |
|
|
|
|
45,984 |
|
|
|
1,061,929 |
|
Renesas Electronics Corp.* |
|
|
|
|
17,133 |
|
|
|
179,746 |
|
Resona Holdings, Inc. |
|
|
|
|
93,755 |
|
|
|
533,442 |
|
Ricoh Co., Ltd. |
|
|
|
|
32,059 |
|
|
|
313,778 |
|
Rohm Co., Ltd. |
|
|
|
|
4,556 |
|
|
|
425,518 |
|
Ryohin Keikaku Co., Ltd. |
|
|
|
|
1,145 |
|
|
|
392,915 |
|
Santen Pharmaceutical Co., Ltd. |
|
|
|
|
19,039 |
|
|
|
321,014 |
|
SBI Holdings, Inc. |
|
|
|
|
11,584 |
|
|
|
292,921 |
|
SCREEN Holdings Co., Ltd. |
|
|
|
|
1,462 |
|
|
|
120,380 |
|
Secom Co., Ltd. |
|
|
|
|
8,176 |
|
|
|
612,836 |
|
Seiko Epson Corp. |
|
|
|
|
13,637 |
|
|
|
256,103 |
|
Sekisui Chemical Co., Ltd. |
|
|
|
|
20,367 |
|
|
|
361,087 |
|
Sekisui House Ltd. |
|
|
|
|
24,678 |
|
|
|
452,064 |
|
Seven & i Holdings Co., Ltd.(c) |
|
|
|
|
28,284 |
|
|
|
1,241,989 |
|
Sharp Corp. |
|
|
|
|
5,258 |
|
|
|
154,485 |
|
Shima Seiki Manufacturing Ltd. |
|
|
|
|
1,443 |
|
|
|
91,782 |
|
Shimadzu Corp. |
|
|
|
|
14,392 |
|
|
|
391,415 |
|
Shimano, Inc. |
|
|
|
|
3,229 |
|
|
|
429,058 |
|
Shimizu Corp. |
|
|
|
|
29,037 |
|
|
|
287,650 |
|
Shin-Etsu Chemical Co., Ltd. |
|
|
|
|
15,725 |
|
|
|
1,581,482 |
|
Shionogi & Co., Ltd. |
|
|
|
|
12,162 |
|
|
|
626,189 |
|
Shiseido Co., Ltd.(c) |
|
|
|
|
14,993 |
|
|
|
974,459 |
|
Shizuoka Bank Ltd. (The) |
|
|
|
|
26,722 |
|
|
|
271,555 |
|
Showa Denko K.K. |
|
|
|
|
4,843 |
|
|
|
161,765 |
|
See notes to financial
statements.
94
Schedules of Investments —
IQ 50 Percent Hedged FTSE International ETF (continued)
April
30, 2018
|
|
|
|
Shares
|
|
Value
|
|
|
|
|
|
|
|
|
|
|
|
Common Stocks (continued)
|
|
|
|
|
|
|
|
|
|
|
| |
Japan (continued)
|
|
|
|
|
|
|
|
|
|
|
SMC Corp. |
|
|
|
|
2,332 |
|
|
$ |
889,112 |
|
SoftBank Group Corp.(c) |
|
|
|
|
30,517 |
|
|
|
2,370,802 |
|
Sompo Holdings, Inc. |
|
|
|
|
14,635 |
|
|
|
613,888 |
|
Sony Corp. |
|
|
|
|
44,879 |
|
|
|
2,214,728 |
|
Sotetsu Holdings, Inc. |
|
|
|
|
6,494 |
|
|
|
186,348 |
|
Stanley Electric Co., Ltd. |
|
|
|
|
8,089 |
|
|
|
293,104 |
|
Start Today Co., Ltd. |
|
|
|
|
7,343 |
|
|
|
212,053 |
|
Subaru Corp. |
|
|
|
|
22,848 |
|
|
|
768,177 |
|
SUMCO Corp. |
|
|
|
|
8,390 |
|
|
|
207,172 |
|
Sumitomo Chemical Co., Ltd. |
|
|
|
|
63,681 |
|
|
|
366,053 |
|
Sumitomo Corp. |
|
|
|
|
47,043 |
|
|
|
846,710 |
|
Sumitomo Electric Industries Ltd. |
|
|
|
|
31,005 |
|
|
|
475,878 |
|
Sumitomo Metal Mining Co., Ltd. |
|
|
|
|
10,207 |
|
|
|
438,222 |
|
Sumitomo Mitsui Financial Group, Inc.(c) |
|
|
|
|
48,925 |
|
|
|
2,034,350 |
|
Sumitomo Mitsui Trust Holdings, Inc. |
|
|
|
|
14,523 |
|
|
|
616,622 |
|
Sumitomo Realty & Development Co., Ltd. |
|
|
|
|
16,915 |
|
|
|
672,272 |
|
Suntory Beverage & Food Ltd. |
|
|
|
|
6,001 |
|
|
|
295,594 |
|
Suzuki Motor Corp. |
|
|
|
|
15,691 |
|
|
|
844,740 |
|
Sysmex Corp. |
|
|
|
|
6,092 |
|
|
|
538,913 |
|
T&D Holdings, Inc. |
|
|
|
|
26,008 |
|
|
|
441,845 |
|
Taiheiyo Cement Corp. |
|
|
|
|
7,028 |
|
|
|
266,219 |
|
Taisei Corp. |
|
|
|
|
10,166 |
|
|
|
549,062 |
|
Taisho Pharmaceutical Holdings Co., Ltd. |
|
|
|
|
2,743 |
|
|
|
262,957 |
|
Takashimaya Co., Ltd. |
|
|
|
|
20,055 |
|
|
|
172,280 |
|
Takeda Pharmaceutical Co., Ltd. |
|
|
|
|
28,620 |
|
|
|
1,208,618 |
|
TDK Corp. |
|
|
|
|
5,094 |
|
|
|
439,920 |
|
Teijin Ltd. |
|
|
|
|
11,061 |
|
|
|
208,332 |
|
Terumo Corp. |
|
|
|
|
14,218 |
|
|
|
805,589 |
|
Tobu Railway Co., Ltd. |
|
|
|
|
10,185 |
|
|
|
324,840 |
|
Toho Co., Ltd. |
|
|
|
|
7,615 |
|
|
|
254,703 |
|
Tohoku Electric Power Co., Inc. |
|
|
|
|
19,372 |
|
|
|
249,796 |
|
Tokio Marine Holdings, Inc.(c) |
|
|
|
|
26,468 |
|
|
|
1,251,017 |
|
Tokyo Electric Power Co., Holdings, Inc.* |
|
|
|
|
58,849 |
|
|
|
280,195 |
|
Tokyo Electron Ltd.(c) |
|
|
|
|
5,894 |
|
|
|
1,134,093 |
|
Tokyo Gas Co., Ltd. |
|
|
|
|
17,713 |
|
|
|
474,613 |
|
Tokyu Corp. |
|
|
|
|
23,860 |
|
|
|
401,428 |
|
Toppan Printing Co., Ltd. |
|
|
|
|
27,938 |
|
|
|
233,870 |
|
Toray Industries, Inc. |
|
|
|
|
61,786 |
|
|
|
577,065 |
|
Toshiba Corp.* |
|
|
|
|
196,383 |
|
|
|
525,842 |
|
Tosoh Corp. |
|
|
|
|
10,861 |
|
|
|
192,754 |
|
TOTO Ltd. |
|
|
|
|
7,576 |
|
|
|
429,947 |
|
Toyo Suisan Kaisha Ltd. |
|
|
|
|
5,856 |
|
|
|
230,654 |
|
Toyota Industries Corp. |
|
|
|
|
6,948 |
|
|
|
410,816 |
|
Toyota Motor Corp.(c) |
|
|
|
|
89,814 |
|
|
|
5,894,031 |
|
Toyota Tsusho Corp. |
|
|
|
|
10,203 |
|
|
|
366,907 |
|
Tsuruha Holdings, Inc. |
|
|
|
|
2,113 |
|
|
|
303,747 |
|
Unicharm Corp. |
|
|
|
|
16,494 |
|
|
|
463,505 |
|
USS Co., Ltd. |
|
|
|
|
13,705 |
|
|
|
288,190 |
|
West Japan Railway Co. |
|
|
|
|
7,305 |
|
|
|
517,375 |
|
Yahoo Japan Corp. |
|
|
|
|
62,542 |
|
|
|
257,198 |
|
Yakult Honsha Co., Ltd. |
|
|
|
|
5,931 |
|
|
|
422,772 |
|
Yamada Denki Co., Ltd. |
|
|
|
|
37,096 |
|
|
|
194,591 |
|
Yamaguchi Financial Group, Inc. |
|
|
|
|
15,928 |
|
|
|
199,127 |
|
Yamaha Corp. |
|
|
|
|
6,414 |
|
|
|
310,076 |
|
Yamaha Motor Co., Ltd. |
|
|
|
|
12,457 |
|
|
|
398,442 |
|
Yamato Holdings Co., Ltd. |
|
|
|
|
15,302 |
|
|
|
393,999 |
|
Yaskawa Electric Corp. |
|
|
|
|
7,791 |
|
|
|
318,262 |
|
Total Japan |
|
|
|
|
|
|
|
|
137,196,532 |
|
|
|
|
|
|
|
|
|
|
|
|
|
|
|
|
Shares
|
|
Value
|
Common Stocks (continued)
|
|
|
|
|
|
|
|
|
|
|
| |
Jersey — 0.1%
|
|
|
|
|
|
|
|
|
|
|
Randgold Resources Ltd. |
|
|
|
|
3,662 |
|
|
$ |
295,973 |
|
| |
Kazakhstan — 0.0%(b)
|
|
|
|
|
|
|
|
|
|
|
KAZ Minerals PLC* |
|
|
|
|
10,507 |
|
|
|
133,199 |
|
| |
Luxembourg — 0.3%
|
|
|
|
|
|
|
|
|
|
|
ArcelorMittal* |
|
|
|
|
21,270 |
|
|
|
721,997 |
|
Eurofins Scientific SE |
|
|
|
|
457 |
|
|
|
247,251 |
|
RTL Group SA |
|
|
|
|
2,027 |
|
|
|
167,146 |
|
SES SA(a) |
|
|
|
|
14,201 |
|
|
|
219,618 |
|
Tenaris SA |
|
|
|
|
21,153 |
|
|
|
397,923 |
|
Total Luxembourg |
|
|
|
|
|
|
|
|
1,753,935 |
|
| |
Macau — 0.2%
|
|
|
|
|
|
|
|
|
|
|
Sands China Ltd. |
|
|
|
|
95,649 |
|
|
|
557,569 |
|
Wynn Macau Ltd. |
|
|
|
|
77,486 |
|
|
|
289,773 |
|
Total Macau |
|
|
|
|
|
|
|
|
847,342 |
|
| |
Netherlands — 4.2%
|
|
|
|
|
|
|
|
|
|
|
ABN AMRO Group NV‡ |
|
|
|
|
9,708 |
|
|
|
301,792 |
|
Aegon NV |
|
|
|
|
67,250 |
|
|
|
494,984 |
|
Akzo Nobel NV |
|
|
|
|
9,557 |
|
|
|
864,852 |
|
Altice NV, Class A* |
|
|
|
|
24,877 |
|
|
|
238,588 |
|
ASML Holding NV |
|
|
|
|
13,187 |
|
|
|
2,509,373 |
|
ASR Nederland NV |
|
|
|
|
3,288 |
|
|
|
155,565 |
|
EXOR NV |
|
|
|
|
5,081 |
|
|
|
377,785 |
|
Gemalto NV |
|
|
|
|
3,645 |
|
|
|
219,666 |
|
Heineken Holding NV |
|
|
|
|
4,320 |
|
|
|
439,475 |
|
Heineken NV |
|
|
|
|
8,494 |
|
|
|
895,911 |
|
ING Groep NV |
|
|
|
|
139,389 |
|
|
|
2,353,694 |
|
Koninklijke Ahold Delhaize NV |
|
|
|
|
47,743 |
|
|
|
1,153,950 |
|
Koninklijke DSM NV |
|
|
|
|
7,390 |
|
|
|
766,252 |
|
Koninklijke KPN NV |
|
|
|
|
123,017 |
|
|
|
383,017 |
|
Koninklijke Philips NV |
|
|
|
|
34,045 |
|
|
|
1,448,298 |
|
NN
Group NV |
|
|
|
|
13,986 |
|
|
|
670,677 |
|
Randstad NV |
|
|
|
|
4,506 |
|
|
|
290,609 |
|
Royal Dutch Shell PLC, Class A(c) |
|
|
|
|
154,885 |
|
|
|
5,399,403 |
|
Royal Dutch Shell PLC, Class B(c) |
|
|
|
|
135,292 |
|
|
|
4,847,750 |
|
Wolters Kluwer NV(a) |
|
|
|
|
12,321 |
|
|
|
667,349 |
|
Total Netherlands |
|
|
|
|
|
|
|
|
24,478,990 |
|
| |
New Zealand — 0.2%
|
|
|
|
|
|
|
|
|
|
|
Auckland International Airport Ltd. |
|
|
|
|
63,997 |
|
|
|
287,689 |
|
Fisher & Paykel Healthcare
Corp. Ltd. |
|
|
|
|
41,201 |
|
|
|
370,135 |
|
Fletcher Building Ltd. |
|
|
|
|
55,445 |
|
|
|
246,510 |
|
Spark New Zealand Ltd. |
|
|
|
|
105,758 |
|
|
|
257,829 |
|
Total New Zealand |
|
|
|
|
|
|
|
|
1,162,163 |
|
| |
Norway — 0.6%
|
|
|
|
|
|
|
|
|
|
|
DNB ASA(a) |
|
|
|
|
43,770 |
|
|
|
822,555 |
|
Norsk Hydro ASA |
|
|
|
|
52,537 |
|
|
|
328,295 |
|
Orkla ASA |
|
|
|
|
38,474 |
|
|
|
357,024 |
|
Schibsted ASA, Class A |
|
|
|
|
7,084 |
|
|
|
207,451 |
|
Statoil ASA(a) |
|
|
|
|
37,546 |
|
|
|
963,127 |
|
Telenor ASA |
|
|
|
|
25,993 |
|
|
|
576,894 |
|
Yara International ASA |
|
|
|
|
7,327 |
|
|
|
310,051 |
|
Total Norway |
|
|
|
|
|
|
|
|
3,565,397 |
|
| |
Portugal — 0.1%
|
|
|
|
|
|
|
|
|
|
|
EDP — Energias de Portugal SA(a) |
|
|
|
|
91,768 |
|
|
|
341,049 |
|
Galp Energia SGPS SA |
|
|
|
|
13,473 |
|
|
|
259,065 |
|
Jeronimo Martins SGPS SA |
|
|
|
|
11,138 |
|
|
|
195,664 |
|
Total Portugal |
|
|
|
|
|
|
|
|
795,778 |
|
See notes to financial
statements.
95
Schedules of Investments —
IQ 50 Percent Hedged FTSE International ETF (continued)
April
30, 2018
|
|
|
|
Shares
|
|
Value
|
|
|
|
|
|
|
|
|
|
|
|
Common Stocks (continued)
|
|
|
|
|
|
|
|
|
|
|
| |
Russia — 0.0%(b)
|
|
|
|
|
|
|
|
|
|
|
Polymetal International PLC |
|
|
|
|
22,016 |
|
|
$ |
221,181 |
|
| |
Singapore — 1.3%
|
|
|
|
|
|
|
|
|
|
|
Ascendas Real Estate Investment Trust |
|
|
|
|
162,943 |
|
|
|
328,581 |
|
CapitaLand Commercial Trust |
|
|
|
|
264,397 |
|
|
|
363,432 |
|
CapitaLand Ltd. |
|
|
|
|
107,201 |
|
|
|
304,426 |
|
CapitaLand Mall Trust |
|
|
|
|
179,903 |
|
|
|
285,334 |
|
City Developments Ltd. |
|
|
|
|
23,821 |
|
|
|
227,946 |
|
ComfortDelGro Corp. Ltd. |
|
|
|
|
126,778 |
|
|
|
215,438 |
|
DBS Group Holdings Ltd. |
|
|
|
|
63,655 |
|
|
|
1,482,663 |
|
Genting Singapore PLC |
|
|
|
|
262,175 |
|
|
|
231,672 |
|
Keppel Corp. Ltd. |
|
|
|
|
63,568 |
|
|
|
393,204 |
|
Oversea-Chinese Banking Corp. Ltd. |
|
|
|
|
113,774 |
|
|
|
1,185,817 |
|
Singapore Exchange Ltd. |
|
|
|
|
56,240 |
|
|
|
327,913 |
|
Singapore Press Holdings Ltd. |
|
|
|
|
113,070 |
|
|
|
232,280 |
|
Singapore Technologies Engineering Ltd. |
|
|
|
|
83,431 |
|
|
|
219,912 |
|
Singapore Telecommunications Ltd. |
|
|
|
|
249,076 |
|
|
|
662,171 |
|
United Overseas Bank Ltd. |
|
|
|
|
46,350 |
|
|
|
1,055,088 |
|
Total Singapore |
|
|
|
|
|
|
|
|
7,515,877 |
|
| |
South Africa — 0.1%
|
|
|
|
|
|
|
|
|
|
|
Mediclinic International PLC |
|
|
|
|
22,500 |
|
|
|
207,945 |
|
Mondi PLC |
|
|
|
|
16,969 |
|
|
|
473,522 |
|
Total South Africa |
|
|
|
|
|
|
|
|
681,467 |
|
| |
South Korea — 4.9%
|
|
|
|
|
|
|
|
|
|
|
Amorepacific Corp. |
|
|
|
|
1,467 |
|
|
|
479,362 |
|
AMOREPACIFIC Group |
|
|
|
|
1,406 |
|
|
|
188,248 |
|
Celltrion Healthcare Co., Ltd.* |
|
|
|
|
1,759 |
|
|
|
147,894 |
|
Celltrion, Inc.* |
|
|
|
|
2,863 |
|
|
|
726,439 |
|
Coway Co., Ltd. |
|
|
|
|
3,271 |
|
|
|
267,977 |
|
DB
Insurance Co., Ltd. |
|
|
|
|
3,546 |
|
|
|
208,832 |
|
E-Mart Inc. |
|
|
|
|
1,174 |
|
|
|
296,784 |
|
GS
Holdings Corp. |
|
|
|
|
2,703 |
|
|
|
155,137 |
|
Hana Financial Group, Inc. |
|
|
|
|
12,993 |
|
|
|
580,886 |
|
Hankook Tire Co., Ltd. |
|
|
|
|
4,630 |
|
|
|
214,366 |
|
Hotel Shilla Co., Ltd. |
|
|
|
|
1,499 |
|
|
|
162,805 |
|
Hyundai Heavy Industries Co., Ltd.* |
|
|
|
|
1,500 |
|
|
|
167,829 |
|
Hyundai Heavy Industries Holdings Co., Ltd.* |
|
|
|
|
412 |
|
|
|
162,979 |
|
Hyundai Mobis Co., Ltd. |
|
|
|
|
2,605 |
|
|
|
604,878 |
|
Hyundai Motor Co. |
|
|
|
|
6,486 |
|
|
|
971,640 |
|
Hyundai Steel Co. |
|
|
|
|
4,377 |
|
|
|
248,346 |
|
Industrial Bank of Korea |
|
|
|
|
17,059 |
|
|
|
269,130 |
|
Kakao Corp. |
|
|
|
|
1,706 |
|
|
|
177,301 |
|
Kangwon Land, Inc. |
|
|
|
|
8,128 |
|
|
|
219,933 |
|
KB
Financial Group, Inc. |
|
|
|
|
16,385 |
|
|
|
938,872 |
|
Kia Motors Corp. |
|
|
|
|
11,637 |
|
|
|
360,643 |
|
Korea Aerospace Industries Ltd.* |
|
|
|
|
3,543 |
|
|
|
143,306 |
|
Korea Electric Power Corp. |
|
|
|
|
10,508 |
|
|
|
368,451 |
|
Korea Zinc Co., Ltd. |
|
|
|
|
581 |
|
|
|
235,816 |
|
KT&G Corp. |
|
|
|
|
5,242 |
|
|
|
480,003 |
|
LG
Chem Ltd. |
|
|
|
|
1,949 |
|
|
|
656,936 |
|
LG
Corp. |
|
|
|
|
5,147 |
|
|
|
390,826 |
|
LG
Display Co., Ltd. |
|
|
|
|
9,812 |
|
|
|
215,431 |
|
LG
Electronics, Inc. |
|
|
|
|
4,527 |
|
|
|
432,334 |
|
LG
Household & Health Care Ltd. |
|
|
|
|
461 |
|
|
|
591,330 |
|
Lotte Chemical Corp. |
|
|
|
|
692 |
|
|
|
268,235 |
|
NAVER Corp. |
|
|
|
|
1,088 |
|
|
|
729,374 |
|
NCSoft Corp. |
|
|
|
|
762 |
|
|
|
256,842 |
|
POSCO |
|
|
|
|
2,701 |
|
|
|
942,018 |
|
|
|
|
|
|
|
|
|
|
|
|
|
|
|
|
Shares
|
|
Value
|
Common Stocks (continued)
|
|
|
|
|
|
|
|
|
|
|
| |
South Korea (continued)
|
|
|
|
|
|
|
|
|
|
|
Samsung Biologics Co., Ltd.‡* |
|
|
|
|
632 |
|
|
$ |
288,766 |
|
Samsung C&T Corp. |
|
|
|
|
2,909 |
|
|
|
381,312 |
|
Samsung Electro-Mechanics Co., Ltd. |
|
|
|
|
2,082 |
|
|
|
230,998 |
|
Samsung Electronics Co., Ltd(d). |
|
|
|
|
3,344 |
|
|
|
8,296,990 |
|
Samsung Fire & Marine Insurance Co., Ltd. |
|
|
|
|
1,607 |
|
|
|
402,483 |
|
Samsung Life Insurance Co., Ltd. |
|
|
|
|
3,285 |
|
|
|
359,857 |
|
Samsung SDI Co., Ltd. |
|
|
|
|
2,114 |
|
|
|
363,203 |
|
Samsung SDS Co., Ltd. |
|
|
|
|
1,435 |
|
|
|
329,175 |
|
Shinhan Financial Group Co., Ltd. |
|
|
|
|
19,321 |
|
|
|
861,987 |
|
SillaJen, Inc.* |
|
|
|
|
1,980 |
|
|
|
155,908 |
|
SK
Holdings Co., Ltd. |
|
|
|
|
1,418 |
|
|
|
390,330 |
|
SK
Hynix, Inc. |
|
|
|
|
19,101 |
|
|
|
1,511,197 |
|
SK
Innovation Co., Ltd. |
|
|
|
|
2,768 |
|
|
|
509,257 |
|
SK
Telecom Co., Ltd. |
|
|
|
|
1,221 |
|
|
|
261,222 |
|
S-Oil Corp. |
|
|
|
|
2,674 |
|
|
|
275,399 |
|
Woori Bank |
|
|
|
|
22,774 |
|
|
|
342,234 |
|
Total South Korea |
|
|
|
|
|
|
|
|
28,221,501 |
|
| |
Spain — 3.0%
|
|
|
|
|
|
|
|
|
|
|
Abertis Infraestructuras SA |
|
|
|
|
27,921 |
|
|
|
615,985 |
|
ACS Actividades de Construccion y Servicios SA |
|
|
|
|
11,009 |
|
|
|
465,936 |
|
Aena SME SA‡ |
|
|
|
|
2,561 |
|
|
|
529,417 |
|
Amadeus IT Group SA |
|
|
|
|
15,698 |
|
|
|
1,151,255 |
|
Banco Bilbao Vizcaya Argentaria SA |
|
|
|
|
237,767 |
|
|
|
1,933,327 |
|
Banco de Sabadell SA |
|
|
|
|
223,741 |
|
|
|
439,682 |
|
Banco Santander SA |
|
|
|
|
562,308 |
|
|
|
3,650,310 |
|
Bankia SA |
|
|
|
|
56,476 |
|
|
|
248,850 |
|
Bankinter SA |
|
|
|
|
36,646 |
|
|
|
384,313 |
|
CaixaBank SA |
|
|
|
|
135,387 |
|
|
|
660,677 |
|
Enagas SA |
|
|
|
|
11,181 |
|
|
|
326,104 |
|
Endesa SA |
|
|
|
|
11,874 |
|
|
|
277,885 |
|
Ferrovial SA |
|
|
|
|
20,388 |
|
|
|
436,862 |
|
Gas Natural SDG SA |
|
|
|
|
11,532 |
|
|
|
291,338 |
|
Grifols SA |
|
|
|
|
21,461 |
|
|
|
605,446 |
|
Iberdrola SA |
|
|
|
|
191,315 |
|
|
|
1,483,037 |
|
Industria de Diseno Textil SA(a) |
|
|
|
|
37,052 |
|
|
|
1,154,073 |
|
Red Electrica Corp. SA |
|
|
|
|
17,727 |
|
|
|
370,099 |
|
Repsol SA |
|
|
|
|
43,187 |
|
|
|
827,029 |
|
Telefonica SA |
|
|
|
|
156,777 |
|
|
|
1,597,361 |
|
Total Spain |
|
|
|
|
|
|
|
|
17,448,986 |
|
| |
Sweden — 2.4%
|
|
|
|
|
|
|
|
|
|
|
Alfa Laval AB |
|
|
|
|
14,163 |
|
|
|
352,658 |
|
Assa Abloy AB, B Shares |
|
|
|
|
33,060 |
|
|
|
696,517 |
|
Atlas Copco AB, A Shares |
|
|
|
|
21,905 |
|
|
|
862,120 |
|
Atlas Copco AB, B Shares |
|
|
|
|
13,090 |
|
|
|
467,575 |
|
Boliden AB |
|
|
|
|
10,201 |
|
|
|
355,629 |
|
Electrolux AB |
|
|
|
|
8,722 |
|
|
|
230,744 |
|
Essity AB, B Shares |
|
|
|
|
21,685 |
|
|
|
553,100 |
|
Hennes & Mauritz AB, B Shares |
|
|
|
|
32,283 |
|
|
|
553,201 |
|
Hexagon AB, B Shares |
|
|
|
|
9,643 |
|
|
|
560,293 |
|
Industrivarden AB, A Shares |
|
|
|
|
18,752 |
|
|
|
413,732 |
|
Investor AB, B Shares |
|
|
|
|
16,379 |
|
|
|
717,694 |
|
Kinnevik AB, B Shares |
|
|
|
|
10,924 |
|
|
|
396,203 |
|
Lundin Petroleum AB* |
|
|
|
|
9,516 |
|
|
|
263,614 |
|
Nordea Bank AB |
|
|
|
|
105,439 |
|
|
|
1,077,907 |
|
Sandvik AB |
|
|
|
|
39,419 |
|
|
|
676,295 |
|
Securitas AB, B Shares |
|
|
|
|
14,200 |
|
|
|
230,630 |
|
Skandinaviska Enskilda Banken AB, A Shares |
|
|
|
|
50,177 |
|
|
|
473,476 |
|
See notes to financial
statements.
96
Schedules of Investments —
IQ 50 Percent Hedged FTSE International ETF (continued)
April
30, 2018
|
|
|
|
Shares
|
|
Value
|
|
|
|
|
|
|
|
|
|
|
|
Common Stocks (continued)
|
|
|
|
|
|
|
|
|
|
|
| |
Sweden (continued)
|
|
|
|
|
|
|
|
|
|
|
Skanska AB, B Shares |
|
|
|
|
13,810 |
|
|
$ |
270,577 |
|
SKF AB, B Shares |
|
|
|
|
15,835 |
|
|
|
322,478 |
|
Svenska Cellulosa AB SCA, B Shares |
|
|
|
|
21,685 |
|
|
|
241,380 |
|
Svenska Handelsbanken AB, A Shares |
|
|
|
|
50,198 |
|
|
|
562,668 |
|
Swedbank AB, A Shares |
|
|
|
|
36,479 |
|
|
|
796,713 |
|
Swedish Match AB |
|
|
|
|
8,282 |
|
|
|
373,225 |
|
Telefonaktiebolaget LM Ericsson, B Shares |
|
|
|
|
104,689 |
|
|
|
804,655 |
|
Telia Co. AB |
|
|
|
|
88,408 |
|
|
|
436,630 |
|
Trelleborg AB, B Shares |
|
|
|
|
13,034 |
|
|
|
306,060 |
|
Volvo AB, B Shares |
|
|
|
|
53,817 |
|
|
|
918,391 |
|
Total Sweden |
|
|
|
|
|
|
|
|
13,914,165 |
|
| |
Switzerland — 7.6%
|
|
|
|
|
|
|
|
|
|
|
ABB Ltd. |
|
|
|
|
70,158 |
|
|
|
1,647,108 |
|
Adecco Group AG |
|
|
|
|
6,221 |
|
|
|
414,398 |
|
Baloise Holding AG |
|
|
|
|
2,048 |
|
|
|
326,265 |
|
Chocoladefabriken Lindt & Spruengli AG* |
|
|
|
|
47 |
|
|
|
302,919 |
|
Cie Financiere Richemont SA |
|
|
|
|
18,896 |
|
|
|
1,805,037 |
|
Clariant AG* |
|
|
|
|
11,131 |
|
|
|
258,738 |
|
Coca-Cola HBC AG* |
|
|
|
|
8,660 |
|
|
|
291,517 |
|
Credit Suisse Group AG* |
|
|
|
|
85,580 |
|
|
|
1,451,981 |
|
Dufry AG* |
|
|
|
|
1,528 |
|
|
|
217,415 |
|
EMS-Chemie Holding AG |
|
|
|
|
440 |
|
|
|
273,361 |
|
Ferguson PLC |
|
|
|
|
8,920 |
|
|
|
685,557 |
|
Geberit AG |
|
|
|
|
1,561 |
|
|
|
669,563 |
|
Givaudan SA |
|
|
|
|
388 |
|
|
|
869,756 |
|
Glencore PLC*(c) |
|
|
|
|
407,810 |
|
|
|
1,969,871 |
|
Julius Baer Group Ltd.* |
|
|
|
|
8,475 |
|
|
|
507,181 |
|
Kuehne + Nagel International AG |
|
|
|
|
1,550 |
|
|
|
242,701 |
|
LafargeHolcim Ltd.* |
|
|
|
|
15,712 |
|
|
|
878,691 |
|
Logitech International SA |
|
|
|
|
3,475 |
|
|
|
129,466 |
|
Lonza Group AG* |
|
|
|
|
3,117 |
|
|
|
768,938 |
|
Nestle SA |
|
|
|
|
108,712 |
|
|
|
8,454,035 |
|
Novartis AG |
|
|
|
|
76,509 |
|
|
|
5,928,114 |
|
Partners Group Holding AG |
|
|
|
|
844 |
|
|
|
619,422 |
|
PSP Swiss Property AG |
|
|
|
|
2,414 |
|
|
|
226,427 |
|
Roche Holding AG |
|
|
|
|
25,080 |
|
|
|
5,595,432 |
|
Schindler Holding AG — Participating Certificate |
|
|
|
|
2,358 |
|
|
|
489,751 |
|
SGS SA |
|
|
|
|
229 |
|
|
|
559,140 |
|
Sika AG |
|
|
|
|
100 |
|
|
|
730,377 |
|
Sonova Holding AG |
|
|
|
|
2,314 |
|
|
|
383,836 |
|
STMicroelectronics NV |
|
|
|
|
22,641 |
|
|
|
495,670 |
|
Swatch Group AG (The) |
|
|
|
|
1,256 |
|
|
|
607,128 |
|
Swiss Life Holding AG* |
|
|
|
|
1,383 |
|
|
|
486,893 |
|
Swiss Prime Site AG* |
|
|
|
|
3,419 |
|
|
|
321,384 |
|
Swiss Re AG |
|
|
|
|
11,066 |
|
|
|
1,058,195 |
|
Swisscom AG(a) |
|
|
|
|
823 |
|
|
|
396,576 |
|
UBS Group AG* |
|
|
|
|
120,288 |
|
|
|
2,037,812 |
|
Vifor Pharma AG |
|
|
|
|
2,771 |
|
|
|
440,186 |
|
Zurich Insurance Group AG |
|
|
|
|
5,077 |
|
|
|
1,628,907 |
|
Total Switzerland |
|
|
|
|
|
|
|
|
44,169,748 |
|
| |
United Arab Emirates — 0.1%
|
|
|
|
|
|
|
|
|
|
|
NMC Health PLC |
|
|
|
|
4,910 |
|
|
|
241,296 |
|
|
|
|
|
|
|
|
|
|
|
|
|
|
|
|
Shares
|
|
Value
|
Common Stocks (continued)
|
|
|
|
|
|
|
|
|
|
|
| |
United Kingdom — 14.5%
|
|
|
|
|
|
|
|
|
|
|
3i Group PLC |
|
|
|
|
40,211 |
|
|
$ |
521,502 |
|
Admiral Group PLC |
|
|
|
|
11,093 |
|
|
|
304,509 |
|
Anglo American PLC(a) |
|
|
|
|
36,059 |
|
|
|
848,988 |
|
Ashtead Group PLC |
|
|
|
|
20,324 |
|
|
|
569,103 |
|
Associated British Foods PLC |
|
|
|
|
13,086 |
|
|
|
487,369 |
|
AstraZeneca PLC(c) |
|
|
|
|
45,343 |
|
|
|
3,186,985 |
|
Auto Trader Group PLC‡ |
|
|
|
|
27,179 |
|
|
|
132,146 |
|
Aviva PLC(c) |
|
|
|
|
143,208 |
|
|
|
1,043,439 |
|
BAE Systems PLC |
|
|
|
|
110,654 |
|
|
|
931,221 |
|
Barclays PLC(c) |
|
|
|
|
601,416 |
|
|
|
1,716,776 |
|
Barratt Developments PLC |
|
|
|
|
39,299 |
|
|
|
302,037 |
|
Berkeley Group Holdings PLC |
|
|
|
|
5,187 |
|
|
|
290,916 |
|
BP
PLC |
|
|
|
|
673,465 |
|
|
|
4,990,471 |
|
British American Tobacco PLC(c) |
|
|
|
|
79,926 |
|
|
|
4,402,341 |
|
British Land Co. PLC (The) |
|
|
|
|
38,618 |
|
|
|
357,653 |
|
BT
Group PLC(c) |
|
|
|
|
301,669 |
|
|
|
1,036,474 |
|
Bunzl PLC |
|
|
|
|
13,597 |
|
|
|
395,344 |
|
Burberry Group PLC |
|
|
|
|
17,475 |
|
|
|
438,902 |
|
Capita PLC(a) |
|
|
|
|
28,167 |
|
|
|
74,313 |
|
Centrica PLC |
|
|
|
|
197,422 |
|
|
|
418,212 |
|
CNH Industrial NV |
|
|
|
|
34,763 |
|
|
|
430,086 |
|
Cobham PLC* |
|
|
|
|
59,962 |
|
|
|
95,060 |
|
Compass Group PLC(c) |
|
|
|
|
54,886 |
|
|
|
1,179,317 |
|
Croda International PLC |
|
|
|
|
6,261 |
|
|
|
384,698 |
|
DCC PLC |
|
|
|
|
3,550 |
|
|
|
342,271 |
|
Diageo PLC(c) |
|
|
|
|
88,035 |
|
|
|
3,139,292 |
|
Direct Line Insurance Group PLC |
|
|
|
|
60,314 |
|
|
|
310,944 |
|
DS
Smith PLC |
|
|
|
|
46,945 |
|
|
|
337,782 |
|
Experian PLC |
|
|
|
|
35,232 |
|
|
|
808,942 |
|
Fiat Chrysler Automobiles NV* |
|
|
|
|
37,951 |
|
|
|
851,479 |
|
G4S PLC |
|
|
|
|
66,940 |
|
|
|
238,705 |
|
GlaxoSmithKline PLC(c) |
|
|
|
|
171,045 |
|
|
|
3,442,895 |
|
Hammerson PLC |
|
|
|
|
39,004 |
|
|
|
294,935 |
|
Hargreaves Lansdown PLC |
|
|
|
|
11,614 |
|
|
|
286,258 |
|
HSBC Holdings PLC |
|
|
|
|
701,128 |
|
|
|
7,005,177 |
|
IMI PLC |
|
|
|
|
13,784 |
|
|
|
207,320 |
|
Imperial Brands PLC(c) |
|
|
|
|
34,125 |
|
|
|
1,224,169 |
|
Informa PLC |
|
|
|
|
41,173 |
|
|
|
419,084 |
|
InterContinental Hotels Group PLC |
|
|
|
|
7,535 |
|
|
|
476,262 |
|
International Consolidated Airlines Group SA |
|
|
|
|
37,155 |
|
|
|
322,508 |
|
Intertek Group PLC |
|
|
|
|
7,542 |
|
|
|
509,114 |
|
ITV PLC |
|
|
|
|
139,856 |
|
|
|
292,124 |
|
J
Sainsbury PLC |
|
|
|
|
68,675 |
|
|
|
292,282 |
|
Johnson Matthey PLC |
|
|
|
|
7,836 |
|
|
|
355,519 |
|
Just Eat PLC* |
|
|
|
|
22,847 |
|
|
|
243,502 |
|
Kingfisher PLC |
|
|
|
|
88,804 |
|
|
|
371,590 |
|
Land Securities Group PLC |
|
|
|
|
28,010 |
|
|
|
381,320 |
|
Legal & General Group PLC |
|
|
|
|
214,410 |
|
|
|
797,357 |
|
Lloyds Banking Group PLC(c) |
|
|
|
|
2,527,002 |
|
|
|
2,250,534 |
|
London Stock Exchange Group PLC |
|
|
|
|
11,095 |
|
|
|
657,113 |
|
Marks & Spencer Group PLC |
|
|
|
|
63,692 |
|
|
|
252,388 |
|
Meggitt PLC |
|
|
|
|
37,766 |
|
|
|
245,728 |
|
Melrose Industries PLC |
|
|
|
|
215,850 |
|
|
|
677,846 |
|
Micro Focus International PLC |
|
|
|
|
17,396 |
|
|
|
300,224 |
|
National Grid PLC(c) |
|
|
|
|
118,697 |
|
|
|
1,377,871 |
|
Next PLC |
|
|
|
|
5,491 |
|
|
|
397,513 |
|
Old Mutual PLC |
|
|
|
|
179,777 |
|
|
|
623,001 |
|
See notes to financial
statements.
97
Schedules of Investments —
IQ 50 Percent Hedged FTSE International ETF (continued)
April
30, 2018
|
|
|
|
Shares
|
|
Value
|
|
|
|
|
|
|
|
|
|
|
|
|
Common Stocks (continued)
|
|
|
|
|
|
|
|
|
|
|
| |
United Kingdom (continued)
|
|
|
|
|
|
|
|
|
|
|
|
Pearson PLC |
|
|
|
|
31,657 |
|
|
$ |
363,560 |
|
|
Persimmon PLC |
|
|
|
|
12,262 |
|
|
|
458,538 |
|
|
Prudential PLC(c) |
|
|
|
|
90,737 |
|
|
|
2,342,686 |
|
|
Reckitt Benckiser Group PLC(c) |
|
|
|
|
22,521 |
|
|
|
1,768,720 |
|
|
RELX NV |
|
|
|
|
33,440 |
|
|
|
711,685 |
|
|
RELX PLC |
|
|
|
|
38,395 |
|
|
|
822,072 |
|
|
Rio Tinto Ltd. |
|
|
|
|
14,474 |
|
|
|
872,526 |
|
|
Rio Tinto PLC |
|
|
|
|
40,903 |
|
|
|
2,223,087 |
|
|
Rolls-Royce Holdings PLC, Class C*(d)(e) |
|
|
|
|
4,129,147 |
|
|
|
5,687 |
|
|
Rolls-Royce Holdings PLC* |
|
|
|
|
58,980 |
|
|
|
682,383 |
|
|
Royal Bank of Scotland Group PLC* |
|
|
|
|
116,489 |
|
|
|
433,525 |
|
|
Royal Mail PLC |
|
|
|
|
39,455 |
|
|
|
315,843 |
|
|
RSA Insurance Group PLC |
|
|
|
|
45,868 |
|
|
|
415,321 |
|
|
Sage Group PLC (The) |
|
|
|
|
44,459 |
|
|
|
388,968 |
|
|
Schroders PLC |
|
|
|
|
4,904 |
|
|
|
222,967 |
|
|
Severn Trent PLC |
|
|
|
|
9,225 |
|
|
|
246,497 |
|
|
Sky PLC |
|
|
|
|
36,764 |
|
|
|
697,776 |
|
|
Smith & Nephew PLC |
|
|
|
|
34,212 |
|
|
|
657,822 |
|
|
Smiths Group PLC |
|
|
|
|
18,316 |
|
|
|
403,010 |
|
|
SSE PLC(c) |
|
|
|
|
35,855 |
|
|
|
682,005 |
|
| St
James’s Place PLC |
|
|
|
|
22,290 |
|
|
|
348,918 |
|
|
Standard Chartered PLC |
|
|
|
|
99,312 |
|
|
|
1,049,159 |
|
|
Standard Life Aberdeen PLC |
|
|
|
|
103,401 |
|
|
|
520,258 |
|
|
Tate & Lyle PLC |
|
|
|
|
25,822 |
|
|
|
204,362 |
|
|
Taylor Wimpey PLC |
|
|
|
|
126,813 |
|
|
|
334,922 |
|
|
TechnipFMC PLC |
|
|
|
|
18,767 |
|
|
|
617,421 |
|
|
Tesco PLC(c) |
|
|
|
|
357,756 |
|
|
|
1,162,409 |
|
|
Travis Perkins PLC |
|
|
|
|
11,605 |
|
|
|
202,839 |
|
|
Unilever NV(c) |
|
|
|
|
53,098 |
|
|
|
3,044,058 |
|
|
Unilever PLC |
|
|
|
|
40,729 |
|
|
|
2,287,399 |
|
|
United Utilities Group PLC |
|
|
|
|
26,588 |
|
|
|
272,167 |
|
|
Vodafone Group PLC(c) |
|
|
|
|
956,340 |
|
|
|
2,787,226 |
|
|
Weir Group PLC (The) |
|
|
|
|
10,646 |
|
|
|
313,207 |
|
|
Whitbread PLC |
|
|
|
|
6,680 |
|
|
|
393,882 |
|
| Wm
Morrison Supermarkets PLC |
|
|
|
|
95,240 |
|
|
|
318,896 |
|
|
WPP PLC(c) |
|
|
|
|
44,525 |
|
|
|
765,048 |
|
Total United Kingdom |
|
|
|
|
|
|
|
|
83,607,760 |
|
| |
United States — 0.5%
|
|
|
|
|
|
|
|
|
|
|
|
Carnival PLC |
|
|
|
|
6,409 |
|
|
|
417,096 |
|
|
QIAGEN NV* |
|
|
|
|
8,610 |
|
|
|
283,887 |
|
|
Samsonite International SA |
|
|
|
|
59,223 |
|
|
|
268,638 |
|
|
Shire PLC(c) |
|
|
|
|
31,732 |
|
|
|
1,689,677 |
|
Total United States |
|
|
|
|
|
|
|
|
2,659,298 |
|
| |
Total Common Stocks
|
|
|
|
|
|
|
|
|
|
|
(Cost $543,607,913) |
|
|
|
|
|
|
|
|
570,939,515 |
|
| |
Preferred Stocks — 0.7%
|
|
|
|
|
|
|
|
|
|
|
| |
Germany — 0.5%
|
|
|
|
|
|
|
|
|
|
|
|
FUCHS PETROLUB SE, 2.01% |
|
|
|
|
5,651 |
|
|
|
304,098 |
|
|
Henkel AG & Co. KGaA, 1.72% |
|
|
|
|
6,843 |
|
|
|
871,417 |
|
Porsche Automobil Holding
SE, 1.44% |
|
|
|
|
6,470 |
|
|
|
553,447 |
|
|
Volkswagen AG, 2.30% |
|
|
|
|
6,477 |
|
|
|
1,344,735 |
|
Total Germany |
|
|
|
|
|
|
|
|
3,073,697 |
|
|
|
|
|
|
|
|
|
|
|
|
|
|
|
|
|
Shares
|
|
Value
|
Preferred Stocks (continued)
|
|
|
|
|
|
|
|
|
|
|
| |
South Korea — 0.2%
|
|
|
|
|
|
|
|
|
|
|
|
Samsung Electronics Co., Ltd., 2.60%(d) |
|
|
|
|
499 |
|
|
$ |
992,814 |
|
| |
Total Preferred Stocks
|
|
|
|
|
|
|
|
|
|
|
(Cost $3,576,730) |
|
|
|
|
|
|
|
|
4,066,511 |
|
| |
Right — 0.0%(b)
|
|
|
|
|
|
|
|
|
|
|
| |
New Zealand — 0.0%(b)
|
|
|
|
|
|
|
|
|
|
|
Fletcher Building Ltd., expires
5/14/18*(d)(e)
(Cost $0) |
|
|
|
|
10,154 |
|
|
|
— |
|
| |
Short-Term Investment — 0.1%
|
|
|
|
|
|
|
|
|
|
|
| |
Money Market Fund — 0.1%
|
|
|
|
|
|
|
|
|
|
|
Morgan Stanley Institutional Liquidity Funds Treasury Portfolio — Institutional Class,
1.58%(f)
|
|
|
|
|
|
|
|
|
|
|
(Cost $312,496) |
|
|
|
|
312,496 |
|
|
|
312,496 |
|
| |
Investment of Cash Collateral For Securities Loaned — 1.6%
|
|
|
|
|
|
|
|
|
|
|
| |
Money Market Fund — 1.6%
|
|
|
|
|
|
|
|
|
|
|
Dreyfus Government Cash Management Fund, Institutional Shares, 1.61%(f)
|
|
|
|
|
|
|
|
|
|
|
(Cost $9,366,228) |
|
|
|
|
9,366,228 |
|
|
|
9,366,228 |
|
| |
Total Investments — 101.1%
|
|
|
|
|
|
|
|
|
|
|
(Cost $556,863,367) |
|
|
|
|
|
|
|
|
584,684,750 |
|
| |
Other Assets and Liabilities,
Net — (1.1)% |
|
|
|
|
|
|
|
|
(6,167,716 |
) |
| |
|
Net Assets — 100.0% |
|
|
|
|
|
|
|
$ |
578,517,034 |
|
* |
|
Non-income producing securities. |
‡ |
|
May be sold to institutional investors only under
Rule 144A or securities offered pursuant to section 4 (a) (2) of the Securities Act of 1933, as amended. |
(a) |
|
All or a portion of the security was on loan. In
addition, “Other Assets and Liabilities, Net” may include pending sales that are also on loan. The aggregate market value of securities on
loan was $11,269,536; total market value of collateral held by the Fund was $11,886,014. Market value of the collateral held includes non-cash U.S.
Treasury securities collateral having a value of $2,519,786. |
(c) |
|
All or a portion of these securities have been
segregated as collateral for Forward foreign currency contracts. The total value of securities segregated amounted to $40,515,515. |
(d) |
|
Securities have been deemed illiquid
because it may not be able to be resold within seven days at approximately the price shown. At April 30, 2018, the value of these
securities were $9,295,491. |
(e) |
|
Securities are fair valued as
determined in good faith in accordance with the procedures established by the Board of Trustees. The securities are fair valued using
significant unobservable inputs. The valuation technique can be found at the end of the Schedules of Investments for the
Fund. |
(f) |
|
Reflects the 1-day yield at April 30,
2018. |
See notes to financial
statements.
98
Schedules of Investments —
IQ 50 Percent Hedged FTSE International ETF (continued)
April
30, 2018
Forward
Foreign Currency Contracts Outstanding as of April 30, 2018:
Purchased Contracts
|
|
Settlement Date
|
|
Counterparty
|
|
Currency
Amount
Purchased
|
|
Value at
Settlement
Date
|
|
Value at
April 30, 2018
|
|
Unrealized
Appreciation
|
| Australian Dollar |
|
05/08/18 |
|
Morgan
Stanley |
|
|
22,986,403 |
|
|
$ |
17,345,627 |
|
|
$ |
17,351,528 |
|
|
$ |
5,901 |
|
| Swiss Franc |
|
05/08/18 |
|
Morgan
Stanley |
|
|
19,632,412 |
|
|
|
19,834,526 |
|
|
|
19,846,435 |
|
|
|
11,909 |
|
| Danish Krone |
|
05/08/18 |
|
Morgan
Stanley |
|
|
27,644,850 |
|
|
|
4,485,549 |
|
|
|
4,485,850 |
|
|
|
301 |
|
| Euro |
|
05/08/18 |
|
Morgan
Stanley |
|
|
68,131,997 |
|
|
|
82,318,305 |
|
|
|
82,367,193 |
|
|
|
48,888 |
|
| British Pound |
|
05/08/18 |
|
Morgan
Stanley |
|
|
32,923,216 |
|
|
|
45,350,249 |
|
|
|
45,364,348 |
|
|
|
14,099 |
|
| British Pound |
|
06/07/18 |
|
Morgan
Stanley |
|
|
8,542 |
|
|
|
11,764 |
|
|
|
11,787 |
|
|
|
23 |
|
| Hong Kong Dollar |
|
05/08/18 |
|
Morgan
Stanley |
|
|
75,408,709 |
|
|
|
9,607,808 |
|
|
|
9,610,471 |
|
|
|
2,663 |
|
| Israeli Shekel |
|
05/08/18 |
|
Morgan
Stanley |
|
|
4,331,896 |
|
|
|
1,203,902 |
|
|
|
1,204,602 |
|
|
|
700 |
|
| Japanese Yen |
|
05/08/18 |
|
Morgan
Stanley |
|
|
7,192,379,172 |
|
|
|
65,732,452 |
|
|
|
65,765,130 |
|
|
|
32,678 |
|
| South Korean Won |
|
05/08/18 |
|
Morgan
Stanley |
|
|
15,147,473,050 |
|
|
|
14,159,164 |
|
|
|
14,185,200 |
|
|
|
26,036 |
|
| Norwegian Krone |
|
05/08/18 |
|
Morgan
Stanley |
|
|
13,680,695 |
|
|
|
1,707,485 |
|
|
|
1,708,194 |
|
|
|
709 |
|
| New Zealand Dollar |
|
05/08/18 |
|
Morgan
Stanley |
|
|
780,926 |
|
|
|
549,909 |
|
|
|
550,222 |
|
|
|
313 |
|
| Swedish Krona |
|
05/08/18 |
|
Morgan
Stanley |
|
|
58,658,752 |
|
|
|
6,710,353 |
|
|
|
6,713,397 |
|
|
|
3,044 |
|
| Singapore Dollar |
|
05/08/18 |
|
Morgan
Stanley |
|
|
4,606,259 |
|
|
|
3,478,309 |
|
|
|
3,479,498 |
|
|
|
1,189 |
|
| Unrealized Appreciation |
|
|
|
|
|
|
|
|
|
$ |
272,495,402 |
|
|
$ |
272,643,855 |
|
|
$ |
148,453 |
|
Sold Contracts
|
|
Settlement Date
|
|
Counterparty
|
|
Currency
Amount Sold
|
|
Value at
Settlement
Date
|
|
Value
at
April 30, 2018
|
|
Unrealized
Appreciation
|
| Australian Dollar |
|
05/08/18 |
|
Morgan
Stanley |
|
|
(22,986,402 |
) |
|
$ |
(17,643,728 |
) |
|
$ |
(17,351,527 |
) |
|
$ |
292,201 |
|
| Swiss Franc |
|
05/08/18 |
|
Morgan
Stanley |
|
|
(19,690,916 |
) |
|
|
(20,620,120 |
) |
|
|
(19,905,577 |
) |
|
|
714,543 |
|
| Danish Krone |
|
05/08/18 |
|
Morgan
Stanley |
|
|
(27,644,850 |
) |
|
|
(4,572,870 |
) |
|
|
(4,485,850 |
) |
|
|
87,020 |
|
| Euro |
|
05/08/18 |
|
Morgan
Stanley |
|
|
(68,338,898 |
) |
|
|
(84,280,484 |
) |
|
|
(82,617,323 |
) |
|
|
1,663,161 |
|
| British Pound |
|
05/08/18 |
|
Morgan
Stanley |
|
|
(33,061,314 |
) |
|
|
(46,438,715 |
) |
|
|
(45,554,630 |
) |
|
|
884,085 |
|
| Hong Kong Dollar |
|
05/08/18 |
|
Morgan
Stanley |
|
|
(75,408,709 |
) |
|
|
(9,620,851 |
) |
|
|
(9,610,471 |
) |
|
|
10,380 |
|
| Israeli Shekel |
|
05/08/18 |
|
Morgan
Stanley |
|
|
(4,331,896 |
) |
|
|
(1,236,253 |
) |
|
|
(1,204,602 |
) |
|
|
31,651 |
|
| Japanese Yen |
|
05/08/18 |
|
Morgan
Stanley |
|
|
(7,192,379,172 |
) |
|
|
(67,803,444 |
) |
|
|
(65,765,130 |
) |
|
|
2,038,314 |
|
| South Korean Won |
|
05/08/18 |
|
Morgan
Stanley |
|
|
(15,147,473,050 |
) |
|
|
(14,251,683 |
) |
|
|
(14,185,200 |
) |
|
|
66,483 |
|
| Norwegian Krone |
|
05/08/18 |
|
Morgan
Stanley |
|
|
(13,680,695 |
) |
|
|
(1,745,673 |
) |
|
|
(1,708,194 |
) |
|
|
37,479 |
|
| New Zealand Dollar |
|
05/08/18 |
|
Morgan
Stanley |
|
|
(780,925 |
) |
|
|
(563,493 |
) |
|
|
(550,221 |
) |
|
|
13,272 |
|
| Swedish Krona |
|
05/08/18 |
|
Morgan
Stanley |
|
|
(58,658,752 |
) |
|
|
(7,027,017 |
) |
|
|
(6,713,397 |
) |
|
|
313,620 |
|
| Singapore Dollar |
|
05/08/18 |
|
Morgan
Stanley |
|
|
(4,606,259 |
) |
|
|
(3,516,532 |
) |
|
|
(3,479,498 |
) |
|
|
37,034 |
|
| Unrealized Appreciation |
|
|
|
|
|
|
|
|
|
$ |
(279,320,863 |
) |
|
$ |
(273,131,620 |
) |
|
$ |
6,189,243 |
|
| Total Unrealized Appreciation |
$ |
6,337,696 |
|
Purchased Contracts
|
|
Settlement Date
|
|
Counterparty
|
|
Currency
Amount Purchased
|
|
Value at
Settlement
Date
|
|
Value at
April 30, 2018
|
|
Unrealized
(Depreciation)
|
| Swiss Franc |
|
05/08/18 |
|
Morgan Stanley |
|
|
58,504 |
|
|
$ |
61,390 |
|
|
$ |
59,142 |
|
|
$ |
(2,248 |
) |
| Euro |
|
05/08/18 |
|
Morgan Stanley |
|
|
206,901 |
|
|
|
255,118 |
|
|
|
250,130 |
|
|
|
(4,988 |
) |
| British Pound |
|
05/08/18 |
|
Morgan Stanley |
|
|
138,098 |
|
|
|
194,135 |
|
|
|
190,283 |
|
|
|
(3,852 |
) |
| Unrealized Depreciation |
|
|
|
|
|
|
|
|
|
$ |
510,643 |
|
|
$ |
499,555 |
|
|
$ |
(11,088 |
) |
Sold Contracts
|
|
Settlement
Date
|
|
Counterparty
|
|
Currency
Amount Sold
|
|
Value
at
Settlement
Date
|
|
Value at
April 30, 2018
|
|
Unrealized
(Depreciation)
|
| Australian Dollar |
|
06/07/18 |
|
Morgan Stanley |
|
|
(24,347,324 |
) |
|
$ |
(18,372,600 |
) |
|
$ |
(18,380,337 |
) |
|
$ |
(7,737 |
) |
| Swiss Franc |
|
06/07/18 |
|
Morgan Stanley |
|
|
(20,252,198 |
) |
|
|
(20,509,593 |
) |
|
|
(20,527,044 |
) |
|
|
(17,451 |
) |
| Danish Krone |
|
06/07/18 |
|
Morgan Stanley |
|
|
(27,177,224 |
) |
|
|
(4,418,463 |
) |
|
|
(4,420,594 |
) |
|
|
(2,131 |
) |
| Euro |
|
06/07/18 |
|
Morgan Stanley |
|
|
(72,242,658 |
) |
|
|
(87,467,830 |
) |
|
|
(87,540,413 |
) |
|
|
(72,583 |
) |
| British Pound |
|
06/07/18 |
|
Morgan Stanley |
|
|
(35,497,213 |
) |
|
|
(48,957,046 |
) |
|
|
(48,983,456 |
) |
|
|
(26,410 |
) |
| Hong Kong Dollar |
|
06/07/18 |
|
Morgan Stanley |
|
|
(78,266,435 |
) |
|
|
(9,978,551 |
) |
|
|
(9,982,264 |
) |
|
|
(3,713 |
) |
| Israeli Shekel |
|
06/07/18 |
|
Morgan Stanley |
|
|
(4,545,307 |
) |
|
|
(1,264,859 |
) |
|
|
(1,266,261 |
) |
|
|
(1,402 |
) |
| Japanese Yen |
|
06/07/18 |
|
Morgan Stanley |
|
|
(7,508,291,568 |
) |
|
|
(68,745,288 |
) |
|
|
(68,797,965 |
) |
|
|
(52,677 |
) |
| South Korean Won |
|
06/07/18 |
|
Morgan Stanley |
|
|
(15,660,799,625 |
) |
|
|
(14,648,583 |
) |
|
|
(14,678,194 |
) |
|
|
(29,611 |
) |
| Norwegian Krone |
|
06/07/18 |
|
Morgan Stanley |
|
|
(14,281,375 |
) |
|
|
(1,784,062 |
) |
|
|
(1,785,125 |
) |
|
|
(1,063 |
) |
| New Zealand Dollar |
|
06/07/18 |
|
Morgan Stanley |
|
|
(824,697 |
) |
|
|
(580,620 |
) |
|
|
(581,007 |
) |
|
|
(387 |
) |
| Swedish Krona |
|
06/07/18 |
|
Morgan Stanley |
|
|
(60,825,774 |
) |
|
|
(6,972,922 |
) |
|
|
(6,977,950 |
) |
|
|
(5,028 |
) |
| Singapore Dollar |
|
06/07/18 |
|
Morgan Stanley |
|
|
(4,975,698 |
) |
|
$ |
(3,759,136 |
) |
|
$ |
(3,761,046 |
) |
|
$ |
(1,910 |
) |
| Unrealized Depreciation |
|
|
|
|
|
|
|
$ |
(287,459,553 |
) |
|
$ |
(287,681,656 |
) |
|
$ |
(222,103 |
) |
| Total Unrealized Depreciation |
$ |
(233,191 |
) |
| |
|
|
|
|
|
|
|
|
|
|
|
|
|
|
|
|
|
|
|
|
|
|
|
|
| Net Unrealized Appreciation (Depreciation) |
|
|
|
|
|
|
|
|
|
|
$ |
6,104,505 |
|
Cash
posted has been segregated as collateral for forward foreign currency contracts in the
amount of $20,000 at April 30, 2018.
See
notes to financial statements.
99
Schedules of Investments —
IQ 50 Percent Hedged FTSE International ETF (continued)
April
30, 2018
The
following is a summary of the inputs used to value the Fund’s investments as of
April 30, 2018. For more information on the valuation techniques, and their aggregation
into the levels used in the table below, please refer to Note 2.
Asset Valuation Inputs
Description
|
|
|
|
Level 1
|
|
Level 2
|
|
Level 3
|
|
Total
|
| Investments in Securities:(g) |
|
|
|
|
|
|
|
|
|
|
|
|
|
|
|
|
|
|
Common Stocks
|
|
|
|
|
|
|
|
|
|
|
|
|
|
|
|
|
|
|
Australia |
|
|
|
$ |
37,071,718 |
|
|
$ |
— |
|
|
$ |
— |
|
|
$ |
37,071,718 |
|
Austria |
|
|
|
|
1,553,231 |
|
|
|
— |
|
|
|
— |
|
|
|
1,553,231 |
|
Belgium |
|
|
|
|
5,990,744 |
|
|
|
— |
|
|
|
— |
|
|
|
5,990,744 |
|
Chile |
|
|
|
|
179,029 |
|
|
|
— |
|
|
|
— |
|
|
|
179,029 |
|
China |
|
|
|
|
1,760,825 |
|
|
|
— |
|
|
|
— |
|
|
|
1,760,825 |
|
Denmark |
|
|
|
|
8,814,259 |
|
|
|
— |
|
|
|
— |
|
|
|
8,814,259 |
|
Finland |
|
|
|
|
5,670,843 |
|
|
|
— |
|
|
|
— |
|
|
|
5,670,843 |
|
France |
|
|
|
|
55,528,414 |
|
|
|
— |
|
|
|
— |
|
|
|
55,528,414 |
|
Germany |
|
|
|
|
48,040,969 |
|
|
|
— |
|
|
|
— |
|
|
|
48,040,969 |
|
Hong Kong |
|
|
|
|
18,208,227 |
|
|
|
— |
|
|
|
— |
|
|
|
18,208,227 |
|
Ireland |
|
|
|
|
3,328,710 |
|
|
|
— |
|
|
|
— |
|
|
|
3,328,710 |
|
Israel |
|
|
|
|
2,526,645 |
|
|
|
— |
|
|
|
— |
|
|
|
2,526,645 |
|
Italy |
|
|
|
|
13,355,313 |
|
|
|
— |
|
|
|
— |
|
|
|
13,355,313 |
|
Japan |
|
|
|
|
137,196,532 |
|
|
|
— |
|
|
|
— |
|
|
|
137,196,532 |
|
Jersey |
|
|
|
|
295,973 |
|
|
|
— |
|
|
|
— |
|
|
|
295,973 |
|
Kazakhstan |
|
|
|
|
133,199 |
|
|
|
— |
|
|
|
— |
|
|
|
133,199 |
|
Luxembourg |
|
|
|
|
1,753,935 |
|
|
|
— |
|
|
|
— |
|
|
|
1,753,935 |
|
Macau |
|
|
|
|
847,342 |
|
|
|
— |
|
|
|
— |
|
|
|
847,342 |
|
Netherlands |
|
|
|
|
24,478,990 |
|
|
|
— |
|
|
|
— |
|
|
|
24,478,990 |
|
New Zealand |
|
|
|
|
1,162,163 |
|
|
|
— |
|
|
|
— |
|
|
|
1,162,163 |
|
Norway |
|
|
|
|
3,565,397 |
|
|
|
— |
|
|
|
— |
|
|
|
3,565,397 |
|
Portugal |
|
|
|
|
795,778 |
|
|
|
— |
|
|
|
— |
|
|
|
795,778 |
|
Russia |
|
|
|
|
221,181 |
|
|
|
— |
|
|
|
— |
|
|
|
221,181 |
|
Singapore |
|
|
|
|
7,515,877 |
|
|
|
— |
|
|
|
— |
|
|
|
7,515,877 |
|
South Africa |
|
|
|
|
681,467 |
|
|
|
— |
|
|
|
— |
|
|
|
681,467 |
|
South Korea |
|
|
|
|
19,924,511 |
|
|
|
8,296,990 |
|
|
|
— |
|
|
|
28,221,501 |
|
Spain |
|
|
|
|
17,448,986 |
|
|
|
— |
|
|
|
— |
|
|
|
17,448,986 |
|
Sweden |
|
|
|
|
13,914,165 |
|
|
|
— |
|
|
|
— |
|
|
|
13,914,165 |
|
Switzerland |
|
|
|
|
44,169,748 |
|
|
|
— |
|
|
|
— |
|
|
|
44,169,748 |
|
United Arab Emirates |
|
|
|
|
241,296 |
|
|
|
— |
|
|
|
— |
|
|
|
241,296 |
|
United Kingdom |
|
|
|
|
83,602,073 |
|
|
|
— |
|
|
|
5,687 |
|
|
|
83,607,760 |
|
United States |
|
|
|
|
2,659,298 |
|
|
|
— |
|
|
|
— |
|
|
|
2,659,298 |
|
Total Common Stocks |
|
|
|
|
562,636,838 |
|
|
|
8,296,990 |
|
|
|
5,687 |
(h) |
|
|
570,939,515 |
|
Preferred Stocks
|
|
|
|
|
|
|
|
|
|
|
|
|
|
|
|
|
|
|
Germany |
|
|
|
|
3,073,697 |
|
|
|
— |
|
|
|
— |
|
|
|
3,073,697 |
|
South Korea |
|
|
|
|
— |
|
|
|
992,814 |
|
|
|
— |
|
|
|
992,814 |
|
Total Preferred Stocks |
|
|
|
|
3,073,697 |
|
|
|
992,814 |
|
|
|
— |
|
|
|
4,066,511 |
|
Rights |
|
|
|
|
— |
|
|
|
— |
|
|
|
— |
(h)(l) |
|
|
— |
|
Short-Term Investment:
|
|
|
|
|
|
|
|
|
|
|
|
|
|
|
|
|
|
|
Money Market Fund |
|
|
|
|
312,496 |
|
|
|
— |
|
|
|
— |
|
|
|
312,496 |
|
Investment of Cash Collateral for Securities Loaned:
|
|
|
|
|
|
|
|
|
|
|
|
|
|
|
|
|
|
|
Money Market Fund |
|
|
|
|
9,366,228 |
|
|
|
— |
|
|
|
— |
|
|
|
9,366,228 |
|
Total Investments in Securities |
|
|
|
|
575,389,259 |
|
|
|
9,289,804 |
|
|
|
5,687 |
(h) |
|
|
584,684,750 |
|
Other Financial Instruments:(i)
|
|
|
|
|
|
|
|
|
|
|
|
|
|
|
|
|
|
|
Forward Foreign Currency Contracts |
|
|
|
|
— |
|
|
|
6,337,696 |
|
|
|
— |
|
|
|
6,337,696 |
|
Total Investments in Securities and Other Financial Instruments |
|
|
|
$ |
575,389,259 |
|
|
$ |
15,627,500 |
|
|
$ |
5,687 |
(h) |
|
$ |
591,022,446 |
|
See notes to financial
statements.
100
Schedules of Investments —
IQ 50 Percent Hedged FTSE International ETF (continued)
April
30, 2018
Liability Valuation Inputs
Description
|
|
|
|
Level 1
|
|
Level 2
|
|
Level 3
|
|
Total
|
Other Financial Instruments:(i)
|
|
|
|
|
|
|
|
|
|
|
|
|
|
|
|
|
|
|
Forward Foreign Currency Contracts |
|
|
|
$ |
— |
|
|
$ |
233,191 |
|
|
$ |
— |
|
|
$ |
233,191 |
|
Total Other Financial Instruments |
|
|
|
$ |
— |
|
|
$ |
233,191 |
|
|
$ |
— |
|
|
$ |
233,191 |
|
(g) |
|
For a complete listing of investments and their
countries, see the Schedules of Investments. |
(h) |
|
The Level 3 securities,
valued at $5,687, has been deemed illiquid and has been fair valued in good faith in accordance with procedures established by the Board of
Trustees. |
(i) |
|
Reflects the unrealized appreciation (depreciation)
of the instruments. |
The Fund recognizes
transfers between the levels as of the beginning of the period.
For the year ended
April 30, 2018, the Fund transferred common stock valued at $129,488 from Level 3 to Level 1 as a result of
the company trading activity resuming and common stock and preferred stock valued at $3,237,712 from Level
1 to Level 2 as a result of a halt in the company’s trading.
The following
is a reconciliation of investments in which significant unobservable inputs (Level 3) were used in determining
value:
Investments in Securities
|
|
Balance
as of
April 30,
2017
|
|
Accrued
Discounts
(Premiums)
|
|
Realized
Gain
(Loss)
|
|
Change in
Unrealized
Appreciation
(Depreciation)
|
|
Purchases
|
|
Sales
|
|
Transfers
into
Level 3
|
|
Transfers
out of
Level 3
|
|
Balance
as of
April 30,
2018
|
|
Change in
Unrealized
Appreciation
(Depreciation)
from Investments
Still Held at
April 30, 2018(j)
|
| Common Stocks: |
|
|
|
|
|
|
|
|
|
|
|
|
|
|
|
|
|
|
|
|
|
|
|
|
|
|
|
|
|
|
|
|
|
|
|
|
|
|
|
|
| Rolls-Royce Holdings PLC, Class C(k) |
|
$ |
— |
|
|
$ |
— |
|
|
$ |
— |
|
|
$ |
(66 |
) |
|
$ |
5,753 |
|
|
$ |
— |
|
|
$ |
— |
|
|
$ |
— |
|
|
$ |
5,687 |
|
|
$ |
(66 |
) |
| Hyundai Heavy Industries Co. Ltd. |
|
|
129,488 |
|
|
|
— |
|
|
|
— |
|
|
|
— |
|
|
|
— |
|
|
|
— |
|
|
|
— |
|
|
|
(129,488 |
) |
|
|
— |
|
|
|
— |
|
| Rights: |
|
|
|
|
|
|
|
|
|
|
|
|
|
|
|
|
|
|
|
|
|
|
|
|
|
|
|
|
|
|
|
|
|
|
|
|
|
|
|
|
| Fletcher Building Ltd.(k) |
|
|
— |
(l) |
|
|
— |
|
|
|
— |
|
|
|
— |
|
|
|
— |
|
|
|
— |
|
|
|
— |
|
|
|
— |
|
|
|
— |
(l) |
|
|
— |
|
| Total |
|
$ |
129,488 |
|
|
$ |
— |
|
|
$ |
— |
|
|
$ |
(66 |
) |
|
$ |
5,753 |
|
|
$ |
— |
|
|
$ |
— |
|
|
$ |
(129,488 |
) |
|
$ |
5,687 |
|
|
$ |
(66 |
) |
Information about
Level 3 fair value measurements as of April 30, 2018.
|
Security Type
|
|
|
|
Fair Value
|
|
Valuation Technique
|
|
Unobservable Inputs
|
| Common Stocks |
|
|
|
$ |
5,687 |
|
|
Peer Analysis |
|
Comparable Securities |
| Rights |
|
|
|
|
— |
(l) |
|
Issuer Specific Facts |
|
Contingent Payment Terms |
(j) |
|
Included in “Net change in unrealized
appreciation (depreciation) on investments” in the Statements of Operations. |
(k) |
|
Security has been deemed illiquid and has been fair
valued in good faith in accordance with procedures established by the Board of Trustees. |
(l) |
|
Includes a Level 3 security valued at
$ —. |
See
notes to financial statements.
101
Schedules of Investments — IQ 50 Percent Hedged
FTSE Europe ETF
April 30, 2018
|
|
|
|
Shares
|
|
Value
|
|
|
|
|
|
|
|
|
|
|
|
Common Stocks — 98.9%
|
|
|
|
|
|
|
|
|
|
|
| |
Australia — 0.5%
|
|
|
|
|
|
|
|
|
|
|
BHP Billiton PLC |
|
|
|
|
36,176 |
|
|
$ |
769,329 |
|
| |
Austria — 0.5%
|
|
|
|
|
|
|
|
|
|
|
ams AG* |
|
|
|
|
939 |
|
|
|
78,144 |
|
ANDRITZ AG |
|
|
|
|
1,226 |
|
|
|
66,005 |
|
Erste Group Bank AG* |
|
|
|
|
4,993 |
|
|
|
244,921 |
|
OMV AG |
|
|
|
|
2,467 |
|
|
|
153,502 |
|
Raiffeisen Bank International AG* |
|
|
|
|
2,248 |
|
|
|
76,049 |
|
Telekom Austria AG* |
|
|
|
|
2,346 |
|
|
|
22,392 |
|
Vienna Insurance Group AG Wiener Versicherung Gruppe |
|
|
|
|
659 |
|
|
|
21,482 |
|
voestalpine AG |
|
|
|
|
1,972 |
|
|
|
104,142 |
|
Total Austria |
|
|
|
|
|
|
|
|
766,637 |
|
| |
Belgium — 1.7%
|
|
|
|
|
|
|
|
|
|
|
Ackermans & van Haaren NV |
|
|
|
|
387 |
|
|
|
70,042 |
|
Ageas |
|
|
|
|
3,295 |
|
|
|
176,956 |
|
Anheuser-Busch InBev SA/NV(a) |
|
|
|
|
13,215 |
|
|
|
1,320,737 |
|
bpost SA |
|
|
|
|
1,717 |
|
|
|
37,693 |
|
Colruyt SA |
|
|
|
|
1,116 |
|
|
|
62,941 |
|
Groupe Bruxelles Lambert SA |
|
|
|
|
1,251 |
|
|
|
143,528 |
|
KBC Group NV |
|
|
|
|
4,796 |
|
|
|
419,524 |
|
Proximus SADP |
|
|
|
|
2,433 |
|
|
|
74,753 |
|
Sofina SA |
|
|
|
|
262 |
|
|
|
45,836 |
|
Solvay SA |
|
|
|
|
1,205 |
|
|
|
168,300 |
|
Telenet Group Holding NV* |
|
|
|
|
826 |
|
|
|
48,462 |
|
UCB SA |
|
|
|
|
2,097 |
|
|
|
159,008 |
|
Umicore SA |
|
|
|
|
3,569 |
|
|
|
199,476 |
|
Total Belgium |
|
|
|
|
|
|
|
|
2,927,256 |
|
| |
Chile — 0.0%(b)
|
|
|
|
|
|
|
|
|
|
|
Antofagasta PLC |
|
|
|
|
6,024 |
|
|
|
80,682 |
|
| |
Denmark — 2.6%
|
|
|
|
|
|
|
|
|
|
|
AP
Moller — Maersk A/S, Class A |
|
|
|
|
76 |
|
|
|
116,650 |
|
AP
Moller — Maersk A/S, Class B |
|
|
|
|
113 |
|
|
|
182,437 |
|
Carlsberg A/S, Class B(a) |
|
|
|
|
1,832 |
|
|
|
205,402 |
|
Chr Hansen Holding A/S |
|
|
|
|
1,532 |
|
|
|
139,421 |
|
Coloplast A/S, Class B |
|
|
|
|
2,306 |
|
|
|
195,948 |
|
Danske Bank A/S |
|
|
|
|
12,016 |
|
|
|
419,717 |
|
DSV A/S |
|
|
|
|
3,194 |
|
|
|
253,950 |
|
Genmab A/S* |
|
|
|
|
959 |
|
|
|
194,703 |
|
H
Lundbeck A/S |
|
|
|
|
1,016 |
|
|
|
59,148 |
|
ISS A/S |
|
|
|
|
3,208 |
|
|
|
112,367 |
|
Jyske Bank A/S |
|
|
|
|
1,205 |
|
|
|
72,476 |
|
Novo Nordisk A/S, Class B |
|
|
|
|
30,607 |
|
|
|
1,448,294 |
|
Novozymes A/S, Class B |
|
|
|
|
3,728 |
|
|
|
176,224 |
|
Orsted A/S‡ |
|
|
|
|
2,820 |
|
|
|
186,166 |
|
Pandora A/S(a) |
|
|
|
|
1,852 |
|
|
|
206,444 |
|
Rockwool International A/S, Class B |
|
|
|
|
108 |
|
|
|
32,645 |
|
Tryg A/S |
|
|
|
|
2,073 |
|
|
|
49,248 |
|
Vestas Wind Systems A/S |
|
|
|
|
3,545 |
|
|
|
230,062 |
|
William Demant Holding A/S* |
|
|
|
|
1,966 |
|
|
|
76,897 |
|
Total Denmark |
|
|
|
|
|
|
|
|
4,358,199 |
|
| |
Finland — 1.7%
|
|
|
|
|
|
|
|
|
|
|
Elisa OYJ |
|
|
|
|
2,489 |
|
|
|
110,425 |
|
Fortum OYJ |
|
|
|
|
7,508 |
|
|
|
173,350 |
|
Huhtamaki OYJ |
|
|
|
|
1,587 |
|
|
|
64,885 |
|
Kesko OYJ, Class B |
|
|
|
|
1,160 |
|
|
|
68,254 |
|
Kone OYJ, Class B |
|
|
|
|
6,625 |
|
|
|
330,258 |
|
Metso OYJ |
|
|
|
|
1,796 |
|
|
|
64,208 |
|
Neste OYJ |
|
|
|
|
2,189 |
|
|
|
184,868 |
|
|
|
|
|
|
|
|
|
|
|
|
|
|
|
|
Shares
|
|
Value
|
Common Stocks (continued)
|
|
|
|
|
|
|
|
|
|
|
| |
Finland (continued)
|
|
|
|
|
|
|
|
|
|
|
Nokia OYJ |
|
|
|
|
94,005 |
|
|
$ |
565,385 |
|
Nokian Renkaat OYJ |
|
|
|
|
2,322 |
|
|
|
93,281 |
|
Orion OYJ, Class B |
|
|
|
|
1,735 |
|
|
|
52,783 |
|
Sampo OYJ, Class A |
|
|
|
|
8,148 |
|
|
|
440,537 |
|
Stora Enso OYJ, Class R |
|
|
|
|
8,263 |
|
|
|
164,076 |
|
UPM-Kymmene OYJ |
|
|
|
|
9,280 |
|
|
|
332,775 |
|
Wartsila OYJ Abp |
|
|
|
|
8,063 |
|
|
|
171,941 |
|
Total Finland |
|
|
|
|
|
|
|
|
2,817,026 |
|
| |
France — 16.4%
|
|
|
|
|
|
|
|
|
|
|
Accor SA |
|
|
|
|
3,514 |
|
|
|
198,992 |
|
Aeroports de Paris |
|
|
|
|
493 |
|
|
|
108,645 |
|
Air France-KLM* |
|
|
|
|
3,669 |
|
|
|
36,075 |
|
Air Liquide SA |
|
|
|
|
7,305 |
|
|
|
953,638 |
|
Airbus SE |
|
|
|
|
9,509 |
|
|
|
1,119,006 |
|
ALD SA‡* |
|
|
|
|
1,387 |
|
|
|
23,494 |
|
Alstom SA |
|
|
|
|
2,680 |
|
|
|
122,104 |
|
Amundi SA‡ |
|
|
|
|
849 |
|
|
|
72,296 |
|
Arkema SA |
|
|
|
|
1,239 |
|
|
|
162,420 |
|
Atos SE |
|
|
|
|
1,581 |
|
|
|
213,747 |
|
AXA SA |
|
|
|
|
32,917 |
|
|
|
943,351 |
|
BioMerieux |
|
|
|
|
710 |
|
|
|
56,273 |
|
BNP Paribas SA |
|
|
|
|
18,788 |
|
|
|
1,452,324 |
|
Bollore SA |
|
|
|
|
17,050 |
|
|
|
84,830 |
|
Bouygues SA |
|
|
|
|
3,561 |
|
|
|
181,776 |
|
Bureau Veritas SA |
|
|
|
|
4,431 |
|
|
|
115,904 |
|
Capgemini SE |
|
|
|
|
2,687 |
|
|
|
370,093 |
|
Carrefour SA |
|
|
|
|
9,557 |
|
|
|
196,699 |
|
Casino Guichard Perrachon SA |
|
|
|
|
971 |
|
|
|
50,399 |
|
Cie de Saint-Gobain |
|
|
|
|
8,620 |
|
|
|
452,986 |
|
Cie Generale des Etablissements Michelin |
|
|
|
|
3,074 |
|
|
|
432,867 |
|
Cie Plastic Omnium SA |
|
|
|
|
959 |
|
|
|
46,161 |
|
CNP Assurances* |
|
|
|
|
2,763 |
|
|
|
70,905 |
|
Credit Agricole SA |
|
|
|
|
19,807 |
|
|
|
326,297 |
|
Danone SA |
|
|
|
|
10,179 |
|
|
|
825,090 |
|
Dassault Aviation SA |
|
|
|
|
40 |
|
|
|
79,983 |
|
Dassault Systemes SE |
|
|
|
|
2,249 |
|
|
|
291,424 |
|
Edenred |
|
|
|
|
4,039 |
|
|
|
139,078 |
|
Eiffage SA |
|
|
|
|
1,290 |
|
|
|
153,832 |
|
Electricite de France SA |
|
|
|
|
8,414 |
|
|
|
118,431 |
|
Elior Group SA‡ |
|
|
|
|
2,249 |
|
|
|
46,003 |
|
Elis SA |
|
|
|
|
3,294 |
|
|
|
78,880 |
|
Engie SA |
|
|
|
|
28,635 |
|
|
|
503,383 |
|
Essilor International SA |
|
|
|
|
3,537 |
|
|
|
483,108 |
|
Eurazeo SA |
|
|
|
|
755 |
|
|
|
66,408 |
|
Eutelsat Communications SA |
|
|
|
|
2,954 |
|
|
|
64,028 |
|
Faurecia |
|
|
|
|
1,276 |
|
|
|
104,525 |
|
Fonciere Des Regions |
|
|
|
|
691 |
|
|
|
77,350 |
|
Gecina SA |
|
|
|
|
805 |
|
|
|
139,665 |
|
Getlink |
|
|
|
|
7,857 |
|
|
|
110,971 |
|
Hermes International |
|
|
|
|
538 |
|
|
|
348,276 |
|
ICADE* |
|
|
|
|
605 |
|
|
|
60,195 |
|
Iliad SA |
|
|
|
|
416 |
|
|
|
83,408 |
|
Imerys SA |
|
|
|
|
627 |
|
|
|
57,270 |
|
Ingenico Group SA |
|
|
|
|
971 |
|
|
|
84,937 |
|
Ipsen SA |
|
|
|
|
595 |
|
|
|
96,689 |
|
JCDecaux SA |
|
|
|
|
1,243 |
|
|
|
44,483 |
|
Kering |
|
|
|
|
1,291 |
|
|
|
748,073 |
|
Klepierre SA |
|
|
|
|
3,498 |
|
|
|
143,356 |
|
Lagardere SCA |
|
|
|
|
1,971 |
|
|
|
56,391 |
|
Legrand SA |
|
|
|
|
4,633 |
|
|
|
361,044 |
|
See notes to financial
statements.
102
Schedules of Investments —
IQ 50 Percent Hedged FTSE Europe ETF (continued)
April 30, 2018
|
|
|
|
Shares
|
|
Value
|
|
|
|
|
|
|
|
|
|
|
|
Common Stocks (continued)
|
|
|
|
|
|
|
|
|
|
|
| |
France (continued)
|
|
|
|
|
|
|
|
|
|
|
L’Oreal SA |
|
|
|
|
4,183 |
|
|
$ |
1,004,968 |
|
LVMH Moet Hennessy Louis Vuitton SE |
|
|
|
|
4,329 |
|
|
|
1,513,124 |
|
Natixis SA |
|
|
|
|
14,533 |
|
|
|
119,610 |
|
Orange SA |
|
|
|
|
33,315 |
|
|
|
608,396 |
|
Orpea |
|
|
|
|
784 |
|
|
|
100,738 |
|
Pernod Ricard SA |
|
|
|
|
3,681 |
|
|
|
611,737 |
|
Peugeot SA |
|
|
|
|
7,662 |
|
|
|
189,033 |
|
Publicis Groupe SA |
|
|
|
|
3,567 |
|
|
|
267,198 |
|
Remy Cointreau SA |
|
|
|
|
421 |
|
|
|
58,037 |
|
Renault SA |
|
|
|
|
3,207 |
|
|
|
348,103 |
|
Rexel SA |
|
|
|
|
5,258 |
|
|
|
81,632 |
|
Rubis SCA |
|
|
|
|
1,330 |
|
|
|
103,645 |
|
Safran SA |
|
|
|
|
5,061 |
|
|
|
595,938 |
|
Sanofi |
|
|
|
|
19,001 |
|
|
|
1,510,341 |
|
Sartorius Stedim Biotech |
|
|
|
|
411 |
|
|
|
38,435 |
|
Schneider Electric SE* |
|
|
|
|
9,206 |
|
|
|
837,316 |
|
SCOR SE |
|
|
|
|
2,709 |
|
|
|
110,137 |
|
SEB SA |
|
|
|
|
470 |
|
|
|
90,232 |
|
Societe BIC SA |
|
|
|
|
441 |
|
|
|
44,996 |
|
Societe Generale SA |
|
|
|
|
12,753 |
|
|
|
700,378 |
|
Sodexo SA |
|
|
|
|
1,543 |
|
|
|
153,055 |
|
Suez |
|
|
|
|
6,422 |
|
|
|
92,798 |
|
Teleperformance |
|
|
|
|
995 |
|
|
|
159,767 |
|
Thales SA |
|
|
|
|
1,731 |
|
|
|
219,596 |
|
TOTAL SA |
|
|
|
|
39,279 |
|
|
|
2,483,418 |
|
Ubisoft Entertainment SA* |
|
|
|
|
1,520 |
|
|
|
145,558 |
|
Unibail-Rodamco SE |
|
|
|
|
1,725 |
|
|
|
414,536 |
|
Valeo SA |
|
|
|
|
4,139 |
|
|
|
277,241 |
|
Veolia Environnement SA* |
|
|
|
|
8,500 |
|
|
|
201,851 |
|
Vinci SA |
|
|
|
|
8,082 |
|
|
|
811,444 |
|
Vivendi SA |
|
|
|
|
18,581 |
|
|
|
491,421 |
|
Wendel SA |
|
|
|
|
483 |
|
|
|
73,062 |
|
Worldline SA‡* |
|
|
|
|
681 |
|
|
|
34,376 |
|
Total France |
|
|
|
|
|
|
|
|
27,649,680 |
|
| |
Germany — 14.2%
|
|
|
|
|
|
|
|
|
|
|
1&1 Drillisch AG |
|
|
|
|
791 |
|
|
|
57,437 |
|
adidas AG |
|
|
|
|
3,443 |
|
|
|
848,189 |
|
Allianz SE |
|
|
|
|
7,608 |
|
|
|
1,805,857 |
|
Axel Springer SE |
|
|
|
|
764 |
|
|
|
62,630 |
|
BASF SE |
|
|
|
|
15,931 |
|
|
|
1,661,472 |
|
Bayer AG |
|
|
|
|
14,404 |
|
|
|
1,727,760 |
|
Bayerische Motoren Werke AG |
|
|
|
|
5,589 |
|
|
|
624,415 |
|
Beiersdorf AG |
|
|
|
|
1,736 |
|
|
|
196,991 |
|
Brenntag AG |
|
|
|
|
2,691 |
|
|
|
154,500 |
|
Carl Zeiss Meditec AG |
|
|
|
|
405 |
|
|
|
27,549 |
|
CECONOMY AG |
|
|
|
|
2,789 |
|
|
|
31,324 |
|
Commerzbank AG* |
|
|
|
|
18,106 |
|
|
|
234,288 |
|
Continental AG |
|
|
|
|
1,881 |
|
|
|
502,704 |
|
Covestro AG‡ |
|
|
|
|
2,644 |
|
|
|
241,375 |
|
Daimler AG |
|
|
|
|
16,773 |
|
|
|
1,327,366 |
|
Delivery Hero AG‡* |
|
|
|
|
1,861 |
|
|
|
89,039 |
|
Deutsche Bank AG |
|
|
|
|
32,321 |
|
|
|
443,845 |
|
Deutsche Boerse AG |
|
|
|
|
3,254 |
|
|
|
438,950 |
|
Deutsche Lufthansa AG |
|
|
|
|
4,082 |
|
|
|
119,203 |
|
Deutsche Post AG |
|
|
|
|
16,853 |
|
|
|
735,060 |
|
Deutsche Telekom AG |
|
|
|
|
56,196 |
|
|
|
984,152 |
|
Deutsche Wohnen SE |
|
|
|
|
6,178 |
|
|
|
292,151 |
|
E.ON SE |
|
|
|
|
35,852 |
|
|
|
392,966 |
|
Evonik Industries AG |
|
|
|
|
2,602 |
|
|
|
92,677 |
|
Fielmann AG |
|
|
|
|
418 |
|
|
|
34,392 |
|
|
|
|
|
|
|
|
|
|
|
|
|
|
|
|
Shares
|
|
Value
|
Common Stocks (continued)
|
|
|
|
|
|
|
|
|
|
|
| |
Germany (continued)
|
|
|
|
|
|
|
|
|
|
|
Fraport AG Frankfurt Airport Services Worldwide |
|
|
|
|
610 |
|
|
$ |
59,255 |
|
Fresenius Medical Care AG & Co. KGaA |
|
|
|
|
3,696 |
|
|
|
376,353 |
|
Fresenius SE & Co. KGaA |
|
|
|
|
7,040 |
|
|
|
538,753 |
|
FUCHS PETROLUB SE |
|
|
|
|
576 |
|
|
|
29,716 |
|
GEA Group AG |
|
|
|
|
2,904 |
|
|
|
113,714 |
|
Hannover Rueck SE |
|
|
|
|
1,045 |
|
|
|
147,215 |
|
Hapag-Lloyd AG‡* |
|
|
|
|
628 |
|
|
|
27,012 |
|
HeidelbergCement AG |
|
|
|
|
2,588 |
|
|
|
254,085 |
|
Hella GmbH & Co. KGaA |
|
|
|
|
763 |
|
|
|
47,245 |
|
Henkel AG & Co. KGaA |
|
|
|
|
2,034 |
|
|
|
242,676 |
|
HOCHTIEF AG |
|
|
|
|
333 |
|
|
|
60,993 |
|
HUGO BOSS AG |
|
|
|
|
1,116 |
|
|
|
104,902 |
|
Infineon Technologies AG |
|
|
|
|
19,671 |
|
|
|
505,751 |
|
Innogy SE‡ |
|
|
|
|
2,226 |
|
|
|
98,246 |
|
K+S AG |
|
|
|
|
3,334 |
|
|
|
98,327 |
|
KION Group AG |
|
|
|
|
1,226 |
|
|
|
102,651 |
|
LANXESS AG |
|
|
|
|
1,594 |
|
|
|
118,557 |
|
LEG Immobilien AG |
|
|
|
|
1,101 |
|
|
|
127,090 |
|
Linde AG* |
|
|
|
|
3,233 |
|
|
|
718,919 |
|
MAN SE |
|
|
|
|
613 |
|
|
|
70,730 |
|
Merck KGaA |
|
|
|
|
2,250 |
|
|
|
220,792 |
|
METRO AG |
|
|
|
|
2,890 |
|
|
|
41,953 |
|
MTU Aero Engines AG |
|
|
|
|
895 |
|
|
|
154,631 |
|
Muenchener Rueckversicherungs-Gesellschaft AG |
|
|
|
|
2,386 |
|
|
|
547,581 |
|
OSRAM Licht AG |
|
|
|
|
1,667 |
|
|
|
96,212 |
|
ProSiebenSat.1 Media SE |
|
|
|
|
3,986 |
|
|
|
144,958 |
|
Puma SE |
|
|
|
|
34 |
|
|
|
16,616 |
|
Rational AG |
|
|
|
|
57 |
|
|
|
35,777 |
|
Rheinmetall AG |
|
|
|
|
744 |
|
|
|
97,666 |
|
RWE AG |
|
|
|
|
8,424 |
|
|
|
202,285 |
|
SAP SE |
|
|
|
|
15,818 |
|
|
|
1,766,266 |
|
Siemens AG |
|
|
|
|
13,233 |
|
|
|
1,688,983 |
|
Siemens Healthineers AG‡* |
|
|
|
|
2,271 |
|
|
|
88,584 |
|
STADA Arzneimittel AG |
|
|
|
|
386 |
|
|
|
39,100 |
|
Suedzucker AG |
|
|
|
|
1,332 |
|
|
|
22,193 |
|
Symrise AG |
|
|
|
|
2,105 |
|
|
|
170,653 |
|
Talanx AG |
|
|
|
|
651 |
|
|
|
29,401 |
|
Telefonica Deutschland Holding AG |
|
|
|
|
11,459 |
|
|
|
54,839 |
|
thyssenkrupp AG |
|
|
|
|
8,097 |
|
|
|
211,308 |
|
TUI AG |
|
|
|
|
7,567 |
|
|
|
171,501 |
|
Uniper SE |
|
|
|
|
3,401 |
|
|
|
105,480 |
|
United Internet AG |
|
|
|
|
2,028 |
|
|
|
131,773 |
|
Volkswagen AG |
|
|
|
|
509 |
|
|
|
104,177 |
|
Vonovia SE |
|
|
|
|
8,450 |
|
|
|
424,808 |
|
Wacker Chemie AG |
|
|
|
|
258 |
|
|
|
46,601 |
|
Wirecard AG |
|
|
|
|
1,989 |
|
|
|
271,792 |
|
Zalando SE‡* |
|
|
|
|
1,826 |
|
|
|
94,314 |
|
Total Germany |
|
|
|
|
|
|
|
|
23,948,726 |
|
| |
Ireland — 0.9%
|
|
|
|
|
|
|
|
|
|
|
AIB Group PLC |
|
|
|
|
11,820 |
|
|
|
70,576 |
|
Bank of Ireland Group PLC |
|
|
|
|
15,972 |
|
|
|
143,766 |
|
CRH PLC(c) |
|
|
|
|
14,547 |
|
|
|
517,137 |
|
Glanbia PLC |
|
|
|
|
3,380 |
|
|
|
57,213 |
|
Kerry Group PLC, Class A(a) |
|
|
|
|
2,534 |
|
|
|
258,703 |
|
Kingspan Group PLC |
|
|
|
|
2,589 |
|
|
|
117,301 |
|
Paddy Power Betfair PLC |
|
|
|
|
1,437 |
|
|
|
142,110 |
|
Smurfit Kappa Group PLC |
|
|
|
|
4,125 |
|
|
|
175,788 |
|
Total Ireland |
|
|
|
|
|
|
|
|
1,482,594 |
|
See notes to financial
statements.
103
Schedules of Investments —
IQ 50 Percent Hedged FTSE Europe ETF (continued)
April 30, 2018
|
|
|
|
Shares
|
|
Value
|
|
|
|
|
|
|
|
|
|
|
|
Common Stocks (continued)
|
|
|
|
|
|
|
|
|
|
|
| |
Italy — 3.9%
|
|
|
|
|
|
|
|
|
|
|
A2A SpA |
|
|
|
|
26,484 |
|
|
$ |
53,357 |
|
Assicurazioni Generali SpA(a) |
|
|
|
|
22,778 |
|
|
|
460,691 |
|
Atlantia SpA |
|
|
|
|
9,254 |
|
|
|
307,469 |
|
Banca Mediolanum SpA |
|
|
|
|
4,281 |
|
|
|
34,448 |
|
Banco BPM SpA* |
|
|
|
|
26,391 |
|
|
|
96,183 |
|
Buzzi Unicem SpA |
|
|
|
|
1,221 |
|
|
|
30,920 |
|
Buzzi Unicem SpA-RSP |
|
|
|
|
687 |
|
|
|
9,877 |
|
Davide Campari-Milano SpA |
|
|
|
|
9,860 |
|
|
|
74,098 |
|
Enel SpA |
|
|
|
|
135,324 |
|
|
|
861,309 |
|
Eni SpA |
|
|
|
|
43,545 |
|
|
|
852,299 |
|
Ferrari NV |
|
|
|
|
2,188 |
|
|
|
269,773 |
|
FinecoBank Banca Fineco SpA |
|
|
|
|
6,817 |
|
|
|
81,572 |
|
Intesa Sanpaolo SpA |
|
|
|
|
235,789 |
|
|
|
899,366 |
|
Intesa Sanpaolo SpA-RSP |
|
|
|
|
16,008 |
|
|
|
63,554 |
|
Italgas SpA |
|
|
|
|
8,397 |
|
|
|
54,439 |
|
Leonardo SpA |
|
|
|
|
6,736 |
|
|
|
78,210 |
|
Luxottica Group SpA |
|
|
|
|
2,703 |
|
|
|
169,036 |
|
Mediaset SpA*(a) |
|
|
|
|
5,913 |
|
|
|
23,540 |
|
Mediobanca SpA |
|
|
|
|
10,085 |
|
|
|
122,639 |
|
Moncler SpA |
|
|
|
|
2,799 |
|
|
|
126,613 |
|
Parmalat SpA |
|
|
|
|
3,267 |
|
|
|
11,920 |
|
Pirelli & C SpA‡* |
|
|
|
|
6,333 |
|
|
|
55,122 |
|
Poste Italiane SpA‡ |
|
|
|
|
8,032 |
|
|
|
78,663 |
|
Prysmian SpA |
|
|
|
|
3,682 |
|
|
|
108,457 |
|
Recordati SpA |
|
|
|
|
1,708 |
|
|
|
61,186 |
|
Saipem SpA* |
|
|
|
|
9,784 |
|
|
|
37,520 |
|
Salvatore Ferragamo SpA(a) |
|
|
|
|
740 |
|
|
|
21,923 |
|
Snam SpA |
|
|
|
|
41,165 |
|
|
|
198,196 |
|
Telecom Italia SpA*(a) |
|
|
|
|
198,609 |
|
|
|
196,335 |
|
Telecom Italia SpA-RSP |
|
|
|
|
104,996 |
|
|
|
90,448 |
|
Terna Rete Elettrica Nazionale SpA |
|
|
|
|
24,560 |
|
|
|
147,684 |
|
UniCredit SpA |
|
|
|
|
38,769 |
|
|
|
841,914 |
|
Unione di Banche Italiane SpA(a) |
|
|
|
|
17,090 |
|
|
|
88,271 |
|
UnipolSai SpA |
|
|
|
|
13,068 |
|
|
|
35,209 |
|
Total Italy |
|
|
|
|
|
|
|
|
6,642,241 |
|
| |
Jersey — 0.1%
|
|
|
|
|
|
|
|
|
|
|
Randgold Resources Ltd. |
|
|
|
|
1,623 |
|
|
|
131,176 |
|
| |
Jordan — 0.0%(b)
|
|
|
|
|
|
|
|
|
|
|
Hikma Pharmaceuticals PLC |
|
|
|
|
2,392 |
|
|
|
42,435 |
|
| |
Kazakhstan — 0.0%(b)
|
|
|
|
|
|
|
|
|
|
|
KAZ Minerals PLC* |
|
|
|
|
3,991 |
|
|
|
50,594 |
|
| |
Luxembourg — 0.4%
|
|
|
|
|
|
|
|
|
|
|
ArcelorMittal* |
|
|
|
|
10,458 |
|
|
|
354,990 |
|
Eurofins Scientific SE |
|
|
|
|
171 |
|
|
|
92,517 |
|
RTL Group SA |
|
|
|
|
657 |
|
|
|
54,176 |
|
SES SA(a) |
|
|
|
|
6,111 |
|
|
|
94,506 |
|
Tenaris SA |
|
|
|
|
8,133 |
|
|
|
152,995 |
|
Total Luxembourg |
|
|
|
|
|
|
|
|
749,184 |
|
| |
Mexico — 0.0%(b)
|
|
|
|
|
|
|
|
|
|
|
Fresnillo PLC |
|
|
|
|
3,163 |
|
|
|
55,546 |
|
| |
Netherlands — 7.2%
|
|
|
|
|
|
|
|
|
|
|
Aalberts Industries NV |
|
|
|
|
1,673 |
|
|
|
82,551 |
|
ABN AMRO Group NV‡ |
|
|
|
|
7,204 |
|
|
|
223,951 |
|
Aegon NV |
|
|
|
|
30,662 |
|
|
|
225,683 |
|
Akzo Nobel NV |
|
|
|
|
4,390 |
|
|
|
397,269 |
|
Altice NV, Class A* |
|
|
|
|
8,922 |
|
|
|
85,568 |
|
Altice NV, Class B* |
|
|
|
|
970 |
|
|
|
9,288 |
|
ASML Holding NV |
|
|
|
|
7,069 |
|
|
|
1,345,170 |
|
|
|
|
|
|
|
|
|
|
|
|
|
|
|
|
Shares
|
|
Value
|
Common Stocks (continued)
|
|
|
|
|
|
|
|
|
|
|
| |
Netherlands (continued)
|
|
|
|
|
|
|
|
|
|
|
ASR Nederland NV |
|
|
|
|
2,467 |
|
|
$ |
116,721 |
|
Boskalis Westminster NV |
|
|
|
|
1,386 |
|
|
|
41,144 |
|
EXOR NV |
|
|
|
|
1,858 |
|
|
|
138,147 |
|
Gemalto NV |
|
|
|
|
1,431 |
|
|
|
86,239 |
|
GrandVision NV‡ |
|
|
|
|
835 |
|
|
|
20,581 |
|
Heineken Holding NV |
|
|
|
|
1,839 |
|
|
|
187,082 |
|
Heineken NV |
|
|
|
|
4,100 |
|
|
|
432,451 |
|
ING Groep NV |
|
|
|
|
67,652 |
|
|
|
1,142,358 |
|
Koninklijke Ahold Delhaize NV |
|
|
|
|
21,561 |
|
|
|
521,130 |
|
Koninklijke DSM NV |
|
|
|
|
3,050 |
|
|
|
316,247 |
|
Koninklijke KPN NV |
|
|
|
|
52,800 |
|
|
|
164,394 |
|
Koninklijke Philips NV |
|
|
|
|
16,133 |
|
|
|
686,309 |
|
Koninklijke Vopak NV |
|
|
|
|
1,135 |
|
|
|
56,086 |
|
NN
Group NV |
|
|
|
|
5,871 |
|
|
|
281,535 |
|
OCI NV* |
|
|
|
|
1,650 |
|
|
|
39,293 |
|
Philips Lighting NV‡ |
|
|
|
|
1,885 |
|
|
|
57,483 |
|
Randstad NV |
|
|
|
|
1,915 |
|
|
|
123,505 |
|
Royal Dutch Shell PLC, Class A(c) |
|
|
|
|
80,068 |
|
|
|
2,791,228 |
|
Royal Dutch Shell PLC, Class B(c) |
|
|
|
|
65,236 |
|
|
|
2,337,520 |
|
Wolters Kluwer NV(a) |
|
|
|
|
4,771 |
|
|
|
258,415 |
|
Total Netherlands |
|
|
|
|
|
|
|
|
12,167,348 |
|
| |
Norway — 1.1%
|
|
|
|
|
|
|
|
|
|
|
Aker BP ASA |
|
|
|
|
1,855 |
|
|
|
61,177 |
|
DNB ASA(a) |
|
|
|
|
18,725 |
|
|
|
351,893 |
|
Gjensidige Forsikring ASA |
|
|
|
|
2,849 |
|
|
|
45,236 |
|
Marine Harvest ASA |
|
|
|
|
7,029 |
|
|
|
153,239 |
|
Norsk Hydro ASA |
|
|
|
|
23,206 |
|
|
|
145,010 |
|
Orkla ASA |
|
|
|
|
13,511 |
|
|
|
125,377 |
|
Schibsted ASA, Class A |
|
|
|
|
1,366 |
|
|
|
40,003 |
|
Schibsted ASA, Class B |
|
|
|
|
1,677 |
|
|
|
45,216 |
|
Statoil ASA(a) |
|
|
|
|
16,963 |
|
|
|
435,133 |
|
Telenor ASA |
|
|
|
|
11,832 |
|
|
|
262,602 |
|
Yara International ASA |
|
|
|
|
3,036 |
|
|
|
128,472 |
|
Total Norway |
|
|
|
|
|
|
|
|
1,793,358 |
|
| |
Portugal — 0.2%
|
|
|
|
|
|
|
|
|
|
|
EDP — Energias de Portugal SA(a) |
|
|
|
|
39,441 |
|
|
|
146,579 |
|
Galp Energia SGPS SA |
|
|
|
|
8,954 |
|
|
|
172,172 |
|
Jeronimo Martins SGPS SA |
|
|
|
|
4,241 |
|
|
|
74,503 |
|
Total Portugal |
|
|
|
|
|
|
|
|
393,254 |
|
| |
Russia — 0.1%
|
|
|
|
|
|
|
|
|
|
|
Evraz PLC |
|
|
|
|
8,314 |
|
|
|
52,470 |
|
Polymetal International PLC |
|
|
|
|
4,412 |
|
|
|
44,324 |
|
Total Russia |
|
|
|
|
|
|
|
|
96,794 |
|
| |
South Africa — 0.2%
|
|
|
|
|
|
|
|
|
|
|
Investec PLC |
|
|
|
|
11,063 |
|
|
|
87,982 |
|
Mediclinic International PLC |
|
|
|
|
6,708 |
|
|
|
61,995 |
|
Mondi PLC |
|
|
|
|
6,378 |
|
|
|
177,979 |
|
Total South Africa |
|
|
|
|
|
|
|
|
327,956 |
|
| |
Spain — 5.1%
|
|
|
|
|
|
|
|
|
|
|
Abertis Infraestructuras SA |
|
|
|
|
10,795 |
|
|
|
238,156 |
|
Acciona SA |
|
|
|
|
438 |
|
|
|
36,736 |
|
Acerinox SA |
|
|
|
|
2,425 |
|
|
|
34,118 |
|
ACS Actividades de Construccion y Servicios SA |
|
|
|
|
4,234 |
|
|
|
179,197 |
|
Aena SME SA‡ |
|
|
|
|
1,110 |
|
|
|
229,462 |
|
Amadeus IT Group SA |
|
|
|
|
7,195 |
|
|
|
527,665 |
|
Banco Bilbao Vizcaya Argentaria SA |
|
|
|
|
115,949 |
|
|
|
942,802 |
|
Banco de Sabadell SA |
|
|
|
|
97,532 |
|
|
|
191,664 |
|
See notes to financial
statements.
104
Schedules of Investments —
IQ 50 Percent Hedged FTSE Europe ETF (continued)
April 30, 2018
|
|
|
|
Shares
|
|
Value
|
|
|
|
|
|
|
|
|
|
|
|
Common Stocks (continued)
|
|
|
|
|
|
|
|
|
|
|
| |
Spain (continued)
|
|
|
|
|
|
|
|
|
|
|
Banco Santander SA |
|
|
|
|
276,776 |
|
|
$ |
1,796,734 |
|
Bankia SA |
|
|
|
|
21,156 |
|
|
|
93,220 |
|
Bankinter SA |
|
|
|
|
11,920 |
|
|
|
125,007 |
|
CaixaBank SA |
|
|
|
|
62,468 |
|
|
|
304,839 |
|
Cellnex Telecom SA‡ |
|
|
|
|
2,661 |
|
|
|
71,502 |
|
Corp. Financiera Alba SA |
|
|
|
|
348 |
|
|
|
21,695 |
|
Distribuidora Internacional de Alimentacion SA |
|
|
|
|
10,495 |
|
|
|
48,818 |
|
EDP Renovaveis SA |
|
|
|
|
2,606 |
|
|
|
25,063 |
|
Enagas SA |
|
|
|
|
3,945 |
|
|
|
115,060 |
|
Endesa SA |
|
|
|
|
5,514 |
|
|
|
129,043 |
|
Ferrovial SA |
|
|
|
|
8,251 |
|
|
|
176,798 |
|
Gas Natural SDG SA |
|
|
|
|
5,377 |
|
|
|
135,842 |
|
Grifols SA |
|
|
|
|
5,757 |
|
|
|
162,413 |
|
Grupo Catalana Occidente SA |
|
|
|
|
758 |
|
|
|
33,473 |
|
Iberdrola SA |
|
|
|
|
99,212 |
|
|
|
769,072 |
|
Industria de Diseno Textil SA(a) |
|
|
|
|
18,281 |
|
|
|
569,405 |
|
Mapfre SA |
|
|
|
|
16,928 |
|
|
|
58,985 |
|
Mediaset Espana Comunicacion SA |
|
|
|
|
3,035 |
|
|
|
29,166 |
|
Merlin Properties Socimi SA |
|
|
|
|
5,833 |
|
|
|
90,207 |
|
Red Electrica Corp. SA |
|
|
|
|
7,501 |
|
|
|
156,603 |
|
Repsol SA |
|
|
|
|
20,647 |
|
|
|
395,389 |
|
Siemens Gamesa Renewable Energy SA(a) |
|
|
|
|
3,837 |
|
|
|
66,131 |
|
Telefonica SA |
|
|
|
|
78,930 |
|
|
|
804,198 |
|
Zardoya Otis SA |
|
|
|
|
3,044 |
|
|
|
31,151 |
|
Total Spain |
|
|
|
|
|
|
|
|
8,589,614 |
|
| |
Sweden — 4.1%
|
|
|
|
|
|
|
|
|
|
|
Alfa Laval AB |
|
|
|
|
5,458 |
|
|
|
135,904 |
|
Arjo AB, B Shares* |
|
|
|
|
3,828 |
|
|
|
11,318 |
|
Assa Abloy AB, B Shares |
|
|
|
|
16,266 |
|
|
|
342,697 |
|
Atlas Copco AB, A Shares |
|
|
|
|
10,941 |
|
|
|
430,607 |
|
Atlas Copco AB, B Shares |
|
|
|
|
6,568 |
|
|
|
234,609 |
|
Boliden AB |
|
|
|
|
4,762 |
|
|
|
166,014 |
|
Electrolux AB |
|
|
|
|
3,855 |
|
|
|
101,986 |
|
Essity AB, B Shares |
|
|
|
|
10,290 |
|
|
|
262,458 |
|
Fastighets AB Balder, B Shares* |
|
|
|
|
1,662 |
|
|
|
43,037 |
|
Getinge AB, B Shares |
|
|
|
|
3,828 |
|
|
|
35,754 |
|
Hennes & Mauritz AB, B Shares |
|
|
|
|
16,429 |
|
|
|
281,527 |
|
Hexagon AB, B Shares |
|
|
|
|
4,347 |
|
|
|
252,576 |
|
Husqvarna AB, B Shares |
|
|
|
|
6,382 |
|
|
|
61,637 |
|
ICA Gruppen AB |
|
|
|
|
1,336 |
|
|
|
41,640 |
|
Industrivarden AB, A Shares |
|
|
|
|
3,617 |
|
|
|
79,803 |
|
Industrivarden AB, C Shares |
|
|
|
|
2,867 |
|
|
|
60,714 |
|
Investment AB Latour, B Shares |
|
|
|
|
2,059 |
|
|
|
22,655 |
|
Investor AB, B Shares |
|
|
|
|
7,887 |
|
|
|
345,592 |
|
Kinnevik AB, B Shares |
|
|
|
|
4,033 |
|
|
|
146,273 |
|
L
E Lundbergforetagen AB, B Shares |
|
|
|
|
632 |
|
|
|
43,010 |
|
Lundin Petroleum AB* |
|
|
|
|
3,033 |
|
|
|
84,021 |
|
Nordea Bank AB |
|
|
|
|
55,298 |
|
|
|
565,313 |
|
Saab AB, B Shares |
|
|
|
|
718 |
|
|
|
29,523 |
|
Sandvik AB |
|
|
|
|
18,682 |
|
|
|
320,519 |
|
Securitas AB, B Shares |
|
|
|
|
5,586 |
|
|
|
90,725 |
|
Skandinaviska Enskilda Banken AB, A Shares |
|
|
|
|
24,852 |
|
|
|
234,506 |
|
Skandinaviska Enskilda Banken AB, C Shares(a) |
|
|
|
|
348 |
|
|
|
3,519 |
|
Skanska AB, B Shares |
|
|
|
|
6,190 |
|
|
|
121,280 |
|
SKF AB, B Shares |
|
|
|
|
6,602 |
|
|
|
134,449 |
|
Svenska Cellulosa AB SCA, B Shares |
|
|
|
|
10,290 |
|
|
|
114,540 |
|
|
|
|
|
|
|
|
|
|
|
|
|
|
|
|
Shares
|
|
Value
|
Common Stocks (continued)
|
|
|
|
|
|
|
|
|
|
|
| |
Sweden (continued)
|
|
|
|
|
|
|
|
|
|
|
Svenska Handelsbanken AB, A Shares |
|
|
|
|
25,414 |
|
|
$ |
284,865 |
|
Svenska Handelsbanken AB, B Shares(a) |
|
|
|
|
605 |
|
|
|
7,238 |
|
Swedbank AB, A Shares |
|
|
|
|
18,245 |
|
|
|
398,477 |
|
Swedish Match AB |
|
|
|
|
3,092 |
|
|
|
139,340 |
|
Tele2 AB, B Shares |
|
|
|
|
6,044 |
|
|
|
78,808 |
|
Telefonaktiebolaget LM Ericsson, A Shares(a) |
|
|
|
|
626 |
|
|
|
4,804 |
|
Telefonaktiebolaget LM Ericsson, B Shares |
|
|
|
|
51,405 |
|
|
|
395,107 |
|
Telia Co. AB |
|
|
|
|
47,299 |
|
|
|
233,601 |
|
Trelleborg AB, B Shares |
|
|
|
|
4,225 |
|
|
|
99,210 |
|
Volvo AB, B Shares |
|
|
|
|
25,795 |
|
|
|
440,194 |
|
Total Sweden |
|
|
|
|
|
|
|
|
6,879,850 |
|
| |
Switzerland — 13.0%
|
|
|
|
|
|
|
|
|
|
|
ABB Ltd. |
|
|
|
|
33,577 |
|
|
|
788,291 |
|
Adecco Group AG |
|
|
|
|
2,890 |
|
|
|
192,511 |
|
Aryzta AG* |
|
|
|
|
1,451 |
|
|
|
30,811 |
|
Baloise Holding AG |
|
|
|
|
802 |
|
|
|
127,766 |
|
Banque Cantonale Vaudoise |
|
|
|
|
48 |
|
|
|
38,404 |
|
Barry Callebaut AG |
|
|
|
|
33 |
|
|
|
59,573 |
|
Chocoladefabriken Lindt & Spruengli AG* |
|
|
|
|
2 |
|
|
|
152,339 |
|
Chocoladefabriken Lindt & Spruengli AG* |
|
|
|
|
18 |
|
|
|
116,012 |
|
Cie Financiere Richemont SA |
|
|
|
|
8,862 |
|
|
|
846,541 |
|
Clariant AG* |
|
|
|
|
3,392 |
|
|
|
78,846 |
|
Coca-Cola HBC AG* |
|
|
|
|
3,393 |
|
|
|
114,217 |
|
Credit Suisse Group AG* |
|
|
|
|
44,448 |
|
|
|
754,121 |
|
DKSH Holding AG |
|
|
|
|
449 |
|
|
|
36,196 |
|
Dufry AG* |
|
|
|
|
558 |
|
|
|
79,396 |
|
EMS-Chemie Holding AG |
|
|
|
|
122 |
|
|
|
75,796 |
|
Ferguson PLC |
|
|
|
|
4,332 |
|
|
|
332,941 |
|
Flughafen Zurich AG |
|
|
|
|
330 |
|
|
|
69,340 |
|
Geberit AG |
|
|
|
|
632 |
|
|
|
271,085 |
|
Georg Fischer AG |
|
|
|
|
71 |
|
|
|
88,795 |
|
Givaudan SA |
|
|
|
|
160 |
|
|
|
358,662 |
|
Glencore PLC* |
|
|
|
|
202,798 |
|
|
|
979,588 |
|
Helvetia Holding AG |
|
|
|
|
112 |
|
|
|
66,811 |
|
Julius Baer Group Ltd.* |
|
|
|
|
3,758 |
|
|
|
224,895 |
|
Kuehne + Nagel International AG |
|
|
|
|
871 |
|
|
|
136,382 |
|
LafargeHolcim Ltd.* |
|
|
|
|
8,357 |
|
|
|
467,364 |
|
Logitech International SA |
|
|
|
|
2,511 |
|
|
|
93,551 |
|
Lonza Group AG* |
|
|
|
|
1,290 |
|
|
|
318,232 |
|
Nestle SA |
|
|
|
|
53,964 |
|
|
|
4,196,534 |
|
Novartis AG |
|
|
|
|
37,881 |
|
|
|
2,935,117 |
|
OC
Oerlikon Corp. AG* |
|
|
|
|
3,318 |
|
|
|
54,065 |
|
Pargesa Holding SA |
|
|
|
|
483 |
|
|
|
45,450 |
|
Partners Group Holding AG |
|
|
|
|
288 |
|
|
|
211,367 |
|
PSP Swiss Property AG |
|
|
|
|
673 |
|
|
|
63,126 |
|
Roche Holding AG |
|
|
|
|
12,076 |
|
|
|
2,694,196 |
|
Roche Holding AG |
|
|
|
|
463 |
|
|
|
105,986 |
|
Schindler Holding AG — Participating Certificate |
|
|
|
|
704 |
|
|
|
146,219 |
|
Schindler Holding AG — Registered |
|
|
|
|
324 |
|
|
|
65,167 |
|
SGS SA |
|
|
|
|
85 |
|
|
|
207,541 |
|
Sika AG |
|
|
|
|
37 |
|
|
|
270,239 |
|
Sonova Holding AG |
|
|
|
|
882 |
|
|
|
146,302 |
|
STMicroelectronics NV |
|
|
|
|
10,876 |
|
|
|
238,104 |
|
See notes to financial
statements.
105
Schedules of Investments —
IQ 50 Percent Hedged FTSE Europe ETF (continued)
April 30, 2018
|
|
|
|
Shares
|
|
Value
|
|
|
|
|
|
|
|
|
|
|
|
Common Stocks (continued)
|
|
|
|
|
|
|
|
|
|
|
| |
Switzerland (continued)
|
|
|
|
|
|
|
|
|
|
|
Straumann Holding AG |
|
|
|
|
174 |
|
|
$ |
119,088 |
|
Sulzer AG |
|
|
|
|
217 |
|
|
|
25,188 |
|
Swatch Group AG (The) — Bearer |
|
|
|
|
523 |
|
|
|
252,809 |
|
Swatch Group AG (The) — Registered |
|
|
|
|
798 |
|
|
|
71,464 |
|
Swiss Life Holding AG* |
|
|
|
|
592 |
|
|
|
208,417 |
|
Swiss Prime Site AG* |
|
|
|
|
1,230 |
|
|
|
115,619 |
|
Swiss Re AG |
|
|
|
|
5,302 |
|
|
|
507,008 |
|
Swisscom AG(a) |
|
|
|
|
389 |
|
|
|
187,446 |
|
Temenos Group AG* |
|
|
|
|
1,023 |
|
|
|
129,490 |
|
UBS Group AG* |
|
|
|
|
60,467 |
|
|
|
1,024,378 |
|
Vifor Pharma AG |
|
|
|
|
901 |
|
|
|
143,128 |
|
Zurich Insurance Group AG |
|
|
|
|
2,614 |
|
|
|
838,677 |
|
Total Switzerland |
|
|
|
|
|
|
|
|
21,900,591 |
|
| |
United Arab Emirates — 0.0%(b)
|
|
|
|
|
|
|
|
|
|
|
NMC Health PLC |
|
|
|
|
1,420 |
|
|
|
69,784 |
|
| |
United Kingdom — 24.3%
|
|
|
|
|
|
|
|
|
|
|
3i Group PLC |
|
|
|
|
16,570 |
|
|
|
214,898 |
|
Admiral Group PLC |
|
|
|
|
3,504 |
|
|
|
96,187 |
|
Anglo American PLC(a)(c) |
|
|
|
|
17,178 |
|
|
|
404,446 |
|
Ashmore Group PLC(a) |
|
|
|
|
6,573 |
|
|
|
37,282 |
|
Ashtead Group PLC |
|
|
|
|
8,647 |
|
|
|
242,129 |
|
Associated British Foods PLC |
|
|
|
|
6,050 |
|
|
|
225,323 |
|
AstraZeneca PLC |
|
|
|
|
22,041 |
|
|
|
1,549,177 |
|
Auto Trader Group PLC‡ |
|
|
|
|
16,206 |
|
|
|
78,794 |
|
Aviva PLC(c) |
|
|
|
|
69,618 |
|
|
|
507,249 |
|
B&M European Value Retail SA |
|
|
|
|
14,807 |
|
|
|
82,659 |
|
Babcock International Group PLC |
|
|
|
|
4,339 |
|
|
|
43,974 |
|
BAE Systems PLC(c) |
|
|
|
|
55,385 |
|
|
|
466,098 |
|
Barclays PLC(c) |
|
|
|
|
295,480 |
|
|
|
843,465 |
|
Barratt Developments PLC |
|
|
|
|
17,418 |
|
|
|
133,868 |
|
Bellway PLC |
|
|
|
|
2,139 |
|
|
|
97,694 |
|
Berkeley Group Holdings PLC |
|
|
|
|
2,187 |
|
|
|
122,659 |
|
BP
PLC |
|
|
|
|
335,318 |
|
|
|
2,484,754 |
|
British American Tobacco PLC |
|
|
|
|
39,796 |
|
|
|
2,191,972 |
|
British Land Co. PLC (The) |
|
|
|
|
17,126 |
|
|
|
158,609 |
|
BT
Group PLC(c) |
|
|
|
|
145,740 |
|
|
|
500,733 |
|
Bunzl PLC |
|
|
|
|
5,838 |
|
|
|
169,745 |
|
Burberry Group PLC |
|
|
|
|
7,217 |
|
|
|
181,262 |
|
Capita PLC(a) |
|
|
|
|
11,345 |
|
|
|
29,932 |
|
Capital & Counties Properties PLC |
|
|
|
|
12,534 |
|
|
|
49,771 |
|
Centrica PLC |
|
|
|
|
97,305 |
|
|
|
206,127 |
|
CNH Industrial NV |
|
|
|
|
16,721 |
|
|
|
206,872 |
|
Cobham PLC* |
|
|
|
|
41,025 |
|
|
|
65,038 |
|
Compass Group PLC |
|
|
|
|
27,488 |
|
|
|
590,625 |
|
ConvaTec Group PLC‡ |
|
|
|
|
22,522 |
|
|
|
67,377 |
|
Croda International PLC |
|
|
|
|
2,207 |
|
|
|
135,606 |
|
CYBG PLC |
|
|
|
|
15,155 |
|
|
|
63,080 |
|
DCC PLC |
|
|
|
|
1,547 |
|
|
|
149,153 |
|
Derwent London PLC |
|
|
|
|
1,742 |
|
|
|
76,539 |
|
Diageo PLC |
|
|
|
|
42,199 |
|
|
|
1,504,799 |
|
Direct Line Insurance Group PLC |
|
|
|
|
23,951 |
|
|
|
123,478 |
|
Dixons Carphone PLC |
|
|
|
|
17,103 |
|
|
|
47,820 |
|
DS
Smith PLC |
|
|
|
|
17,268 |
|
|
|
124,248 |
|
easyJet PLC |
|
|
|
|
3,805 |
|
|
|
83,329 |
|
Experian PLC |
|
|
|
|
15,943 |
|
|
|
366,058 |
|
Fiat Chrysler Automobiles NV* |
|
|
|
|
18,950 |
|
|
|
425,167 |
|
G4S PLC |
|
|
|
|
26,940 |
|
|
|
96,067 |
|
GlaxoSmithKline PLC(c) |
|
|
|
|
84,100 |
|
|
|
1,692,814 |
|
Halma PLC |
|
|
|
|
6,585 |
|
|
|
110,924 |
|
Hammerson PLC |
|
|
|
|
13,804 |
|
|
|
104,381 |
|
|
|
|
|
|
|
|
|
|
|
|
|
|
|
|
Shares
|
|
Value
|
Common Stocks (continued)
|
|
|
|
|
|
|
|
|
|
|
| |
United Kingdom (continued)
|
|
|
|
|
|
|
|
|
|
|
Hargreaves Lansdown PLC |
|
|
|
|
4,573 |
|
|
$ |
112,714 |
|
Hiscox Ltd. |
|
|
|
|
4,813 |
|
|
|
98,709 |
|
Howden Joinery Group PLC |
|
|
|
|
10,163 |
|
|
|
66,729 |
|
HSBC Holdings PLC(c) |
|
|
|
|
349,166 |
|
|
|
3,488,621 |
|
IMI PLC |
|
|
|
|
4,665 |
|
|
|
70,165 |
|
Imperial Brands PLC |
|
|
|
|
16,613 |
|
|
|
595,959 |
|
Inchcape PLC |
|
|
|
|
7,253 |
|
|
|
72,577 |
|
Informa PLC |
|
|
|
|
14,285 |
|
|
|
145,402 |
|
Inmarsat PLC |
|
|
|
|
7,852 |
|
|
|
40,675 |
|
InterContinental Hotels Group PLC |
|
|
|
|
3,304 |
|
|
|
208,835 |
|
International Consolidated Airlines Group SA |
|
|
|
|
17,869 |
|
|
|
155,104 |
|
Intertek Group PLC |
|
|
|
|
2,808 |
|
|
|
189,551 |
|
Intu Properties PLC |
|
|
|
|
15,196 |
|
|
|
40,877 |
|
ITV PLC |
|
|
|
|
64,838 |
|
|
|
135,430 |
|
J
Sainsbury PLC |
|
|
|
|
28,031 |
|
|
|
119,300 |
|
John Wood Group PLC |
|
|
|
|
11,436 |
|
|
|
89,562 |
|
Johnson Matthey PLC(c) |
|
|
|
|
3,305 |
|
|
|
149,948 |
|
Just Eat PLC* |
|
|
|
|
9,987 |
|
|
|
106,441 |
|
Kingfisher PLC |
|
|
|
|
37,735 |
|
|
|
157,898 |
|
Land Securities Group PLC |
|
|
|
|
12,399 |
|
|
|
168,797 |
|
Legal & General Group PLC(c) |
|
|
|
|
102,933 |
|
|
|
382,792 |
|
Lloyds Banking Group PLC(c) |
|
|
|
|
1,241,638 |
|
|
|
1,105,796 |
|
London Stock Exchange Group PLC |
|
|
|
|
5,442 |
|
|
|
322,308 |
|
Marks & Spencer Group PLC |
|
|
|
|
28,282 |
|
|
|
112,071 |
|
Meggitt PLC |
|
|
|
|
13,467 |
|
|
|
87,624 |
|
Melrose Industries PLC(c) |
|
|
|
|
83,477 |
|
|
|
262,148 |
|
Merlin Entertainments PLC‡ |
|
|
|
|
12,037 |
|
|
|
60,978 |
|
Micro Focus International PLC |
|
|
|
|
7,446 |
|
|
|
128,505 |
|
National Grid PLC |
|
|
|
|
58,987 |
|
|
|
684,739 |
|
Next PLC |
|
|
|
|
2,384 |
|
|
|
172,586 |
|
Old Mutual PLC |
|
|
|
|
82,688 |
|
|
|
286,548 |
|
Pearson PLC |
|
|
|
|
13,651 |
|
|
|
156,773 |
|
Pennon Group PLC |
|
|
|
|
7,232 |
|
|
|
68,950 |
|
Persimmon PLC |
|
|
|
|
5,344 |
|
|
|
199,839 |
|
Prudential PLC |
|
|
|
|
44,993 |
|
|
|
1,161,648 |
|
Reckitt Benckiser Group PLC(c) |
|
|
|
|
10,832 |
|
|
|
850,707 |
|
RELX NV |
|
|
|
|
15,374 |
|
|
|
327,196 |
|
RELX PLC(c) |
|
|
|
|
18,258 |
|
|
|
390,920 |
|
Rentokil Initial PLC |
|
|
|
|
31,999 |
|
|
|
135,307 |
|
Rightmove PLC |
|
|
|
|
1,579 |
|
|
|
99,281 |
|
Rio Tinto PLC(c) |
|
|
|
|
20,277 |
|
|
|
1,102,059 |
|
Rolls-Royce Holdings PLC* |
|
|
|
|
28,578 |
|
|
|
330,640 |
|
Rolls-Royce Holdings PLC, Class C*(d)(e) |
|
|
|
|
1,989,349 |
|
|
|
2,740 |
|
Royal Bank of Scotland Group PLC* |
|
|
|
|
56,084 |
|
|
|
208,722 |
|
Royal Mail PLC |
|
|
|
|
15,948 |
|
|
|
127,666 |
|
RPC Group PLC |
|
|
|
|
6,968 |
|
|
|
75,896 |
|
RSA Insurance Group PLC |
|
|
|
|
17,727 |
|
|
|
160,513 |
|
Sage Group PLC (The) |
|
|
|
|
18,818 |
|
|
|
164,637 |
|
Schroders PLC |
|
|
|
|
1,943 |
|
|
|
88,341 |
|
Segro PLC |
|
|
|
|
17,351 |
|
|
|
154,431 |
|
Severn Trent PLC |
|
|
|
|
4,109 |
|
|
|
109,795 |
|
Sky PLC |
|
|
|
|
17,982 |
|
|
|
341,296 |
|
Smith & Nephew PLC |
|
|
|
|
15,232 |
|
|
|
292,878 |
|
Smiths Group PLC |
|
|
|
|
6,885 |
|
|
|
151,492 |
|
Spirax-Sarco Engineering PLC |
|
|
|
|
1,276 |
|
|
|
101,320 |
|
SSE PLC |
|
|
|
|
17,762 |
|
|
|
337,855 |
|
St
James’s Place PLC |
|
|
|
|
9,067 |
|
|
|
141,931 |
|
Standard Chartered PLC(c) |
|
|
|
|
46,891 |
|
|
|
495,369 |
|
Standard Life Aberdeen PLC |
|
|
|
|
47,154 |
|
|
|
237,253 |
|
Tate & Lyle PLC |
|
|
|
|
7,964 |
|
|
|
63,029 |
|
|
|
|
|
|
|
|
|
|
|
|
See
notes to financial statements.
106
Schedules of Investments —
IQ 50 Percent Hedged FTSE Europe ETF (continued)
April 30, 2018
|
|
|
|
Shares
|
|
Value
|
Common Stocks (continued)
|
|
|
|
|
|
|
|
|
|
|
| |
United Kingdom (continued)
|
|
|
|
|
|
|
|
|
|
|
Taylor Wimpey PLC |
|
|
|
|
56,516 |
|
|
$ |
149,263 |
|
TechnipFMC PLC |
|
|
|
|
7,965 |
|
|
|
262,043 |
|
Tesco PLC(c) |
|
|
|
|
166,845 |
|
|
|
542,108 |
|
Travis Perkins PLC |
|
|
|
|
4,372 |
|
|
|
76,416 |
|
Unilever NV |
|
|
|
|
26,320 |
|
|
|
1,508,901 |
|
Unilever PLC(c) |
|
|
|
|
20,107 |
|
|
|
1,129,238 |
|
United Utilities Group PLC |
|
|
|
|
11,873 |
|
|
|
121,538 |
|
Vodafone Group PLC |
|
|
|
|
463,684 |
|
|
|
1,351,394 |
|
Weir Group PLC (The) |
|
|
|
|
4,168 |
|
|
|
122,623 |
|
Whitbread PLC |
|
|
|
|
3,188 |
|
|
|
187,978 |
|
William Hill PLC |
|
|
|
|
14,673 |
|
|
|
59,174 |
|
Wm
Morrison Supermarkets PLC |
|
|
|
|
37,493 |
|
|
|
125,539 |
|
WPP PLC |
|
|
|
|
21,304 |
|
|
|
366,055 |
|
Total United Kingdom |
|
|
|
|
|
|
|
|
41,052,325 |
|
| |
United States — 0.7%
|
|
|
|
|
|
|
|
|
|
|
Carnival PLC(c) |
|
|
|
|
3,052 |
|
|
|
198,623 |
|
QIAGEN NV* |
|
|
|
|
3,841 |
|
|
|
126,645 |
|
Shire PLC |
|
|
|
|
15,488 |
|
|
|
824,710 |
|
Total United States |
|
|
|
|
|
|
|
|
1,149,978 |
|
| |
Total Common Stocks
|
|
|
|
|
|
|
|
|
|
|
(Cost $151,373,537) |
|
|
|
|
|
|
|
|
166,892,157 |
|
| |
Preferred Stocks — 1.0%
|
|
|
|
|
|
|
|
|
|
|
| |
Germany — 0.9%
|
|
|
|
|
|
|
|
|
|
|
Bayerische Motoren Werke AG, 4.36%
|
|
|
|
|
960 |
|
|
|
93,022 |
|
FUCHS PETROLUB SE, 2.01% |
|
|
|
|
1,193 |
|
|
|
64,199 |
|
Henkel AG & Co. KGaA, 1.72% |
|
|
|
|
3,039 |
|
|
|
386,999 |
|
Porsche Automobil Holding SE, 1.44% |
|
|
|
|
2,667 |
|
|
|
228,137 |
|
RWE AG, 9.18% |
|
|
|
|
562 |
|
|
|
11,421 |
|
Sartorius AG, 0.40% |
|
|
|
|
595 |
|
|
|
91,873 |
|
Volkswagen AG, 2.30% |
|
|
|
|
3,189 |
|
|
|
662,090 |
|
Total Germany |
|
|
|
|
|
|
|
|
1,537,741 |
|
| |
Spain — 0.1%
|
|
|
|
|
|
|
|
|
|
|
Grifols SA, 1.73%, Class B |
|
|
|
|
4,471 |
|
|
|
92,804 |
|
| |
Total Preferred Stocks
|
|
|
|
|
|
|
|
|
|
|
(Cost $1,340,532) |
|
|
|
|
|
|
|
|
1,630,545 |
|
|
|
|
|
|
|
|
|
|
|
|
| |
|
|
|
|
Shares
|
|
Value
|
Short-Term Investment — 0.3%
|
|
|
|
|
|
|
|
|
|
|
| |
Money Market Fund — 0.3%
|
|
|
|
|
|
|
|
|
|
|
Morgan Stanley Institutional Liquidity Funds Treasury Portfolio — Institutional Class,
1.58%(f)
|
|
|
|
|
|
|
|
|
|
|
(Cost $565,759) |
|
|
|
|
565,759 |
|
|
$ |
565,759 |
|
| |
Investment of Cash Collateral For Securities Loaned — 2.7%
|
|
|
|
|
|
|
|
|
|
|
| |
Money Market Fund — 2.7%
|
|
|
|
|
|
|
|
|
|
|
Dreyfus Government Cash Management Fund, Institutional Shares, 1.61%(f)
|
|
|
|
|
|
|
|
|
|
|
(Cost $4,501,909) |
|
|
|
|
4,501,909 |
|
|
|
4,501,909 |
|
| |
Total Investments — 102.9%
|
|
|
|
|
|
|
|
|
|
|
(Cost $157,781,737) |
|
|
|
|
|
|
|
|
173,590,370 |
|
| |
Other Assets and Liabilities,
Net — (2.9)% |
|
|
|
|
|
|
|
|
(4,853,159 |
) |
| |
Net Assets — 100.0% |
|
|
|
|
|
|
|
$ |
168,737,211 |
|
‡ |
|
May be sold to institutional investors only under
Rule 144A or securities offered pursuant to section 4 (a) (2) of the Securities Act of 1933, as amended. |
* |
|
Non-income producing securities. |
(a) |
|
All or a portion of the security was on loan. In
addition, “Other Assets and Liabilities, Net” may include pending sales that are also on loan. The aggregate market value of securities on
loan was $4,262,780; total market value of collateral held by the Fund was $4,501,909. |
(c) |
|
All or a portion of these securities have been
segregated as collateral for Forward foreign currency contracts. The total value of securities segregated amounted to
$12,441,355. |
(d) |
|
Security has been deemed illiquid because it may not
be able to be resold within seven days at approximately the price shown. At April 30, 2018, the value of this security was $2,740. |
(e) |
|
Security fair valued as determined in good faith in
accordance with the procedures established by the Board of Trustees. The security is fair valued using significant unobservable inputs. The
valuation technique can be found at the end of the Schedules of Investments for the Fund. |
(f) |
|
Reflects the 1-day yield at April 30,
2018. |
See notes to financial
statements.
107
Schedules of Investments —
IQ 50 Percent Hedged FTSE Europe ETF (continued)
April 30, 2018
Forward Foreign Currency Contracts
Outstanding as of April 30, 2018:
Purchased Contracts
|
|
|
|
Settlement Date
|
|
Counterparty
|
|
Currency
Amount
Purchased
|
|
Value at
Settlement
Date
|
|
Value at
April 30, 2018
|
|
Unrealized
Appreciation
|
| Swiss Franc |
|
|
|
05/08/18 |
|
Morgan Stanley |
|
|
9,686,835 |
|
|
$ |
9,786,560 |
|
|
$ |
9,792,436 |
|
|
$ |
5,876 |
|
| Danish Krone |
|
|
|
05/08/18 |
|
Morgan Stanley |
|
|
13,618,298 |
|
|
|
2,209,654 |
|
|
|
2,209,802 |
|
|
|
148 |
|
| Euro |
|
|
|
05/08/18 |
|
Morgan Stanley |
|
|
33,692,236 |
|
|
|
40,707,566 |
|
|
|
40,731,742 |
|
|
|
24,176 |
|
| British Pound |
|
|
|
05/08/18 |
|
Morgan Stanley |
|
|
16,286,553 |
|
|
|
22,433,994 |
|
|
|
22,440,968 |
|
|
|
6,974 |
|
| British Pound |
|
|
|
06/07/18 |
|
Morgan Stanley |
|
|
4,975 |
|
|
|
6,851 |
|
|
|
6,865 |
|
|
|
14 |
|
| Norwegian Krone |
|
|
|
05/08/18 |
|
Morgan Stanley |
|
|
6,801,583 |
|
|
|
848,904 |
|
|
|
849,257 |
|
|
|
353 |
|
| Swedish Krona |
|
|
|
05/08/18 |
|
Morgan Stanley |
|
|
28,932,623 |
|
|
|
3,309,789 |
|
|
|
3,311,290 |
|
|
|
1,501 |
|
| Unrealized Appreciation |
|
|
|
|
|
|
|
|
$ |
79,303,318 |
|
|
$ |
79,342,360 |
|
|
$ |
39,042 |
|
| |
|
|
|
|
|
|
|
|
|
|
|
|
|
|
Sold Contracts
|
|
|
|
Settlement Date
|
|
Counterparty
|
|
Currency
Amount
Sold
|
|
Value at
Settlement
Date
|
|
Value at
April 30, 2018
|
|
Unrealized
Appreciation
|
| Swiss Franc |
|
|
|
05/08/18 |
|
Morgan Stanley |
|
|
(9,716,025 |
) |
|
$ |
(10,174,519 |
) |
|
$ |
(9,821,944 |
) |
|
$ |
352,575 |
|
| Danish Krone |
|
|
|
05/08/18 |
|
Morgan Stanley |
|
|
(13,618,298 |
) |
|
|
(2,252,670 |
) |
|
|
(2,209,802 |
) |
|
|
42,868 |
|
| Euro |
|
|
|
05/08/18 |
|
Morgan Stanley |
|
|
(33,792,552 |
) |
|
|
(41,675,425 |
) |
|
|
(40,853,017 |
) |
|
|
822,408 |
|
| British Pound |
|
|
|
05/08/18 |
|
Morgan Stanley |
|
|
(16,355,370 |
) |
|
|
(22,973,145 |
) |
|
|
(22,535,790 |
) |
|
|
437,355 |
|
| Norwegian Krone |
|
|
|
05/08/18 |
|
Morgan Stanley |
|
|
(6,801,583 |
) |
|
|
(867,890 |
) |
|
|
(849,257 |
) |
|
|
18,633 |
|
| Swedish Krona |
|
|
|
05/08/18 |
|
Morgan Stanley |
|
|
(28,932,623 |
) |
|
|
(3,465,979 |
) |
|
|
(3,311,291 |
) |
|
|
154,688 |
|
| Unrealized Appreciation |
|
|
|
|
|
|
|
|
$ |
(81,409,628 |
) |
|
$ |
(79,581,101 |
) |
|
$ |
1,828,527 |
|
| Total Unrealized Appreciation |
$ |
1,867,569 |
|
Purchased Contracts
|
|
|
|
Settlement Date
|
|
Counterparty
|
|
Currency
Amount
Purchased
|
|
Value at
Settlement
Date
|
|
Value at
April 30, 2018
|
|
Unrealized
(Depreciation)
|
| Swiss Franc |
|
|
|
05/08/18 |
|
Morgan Stanley |
|
|
29,190 |
|
|
$ |
30,630 |
|
|
$ |
29,508 |
|
|
$ |
(1,122 |
) |
| Euro |
|
|
|
05/08/18 |
|
Morgan Stanley |
|
|
100,316 |
|
|
|
123,694 |
|
|
|
121,276 |
|
|
|
(2,418 |
) |
| British Pound |
|
|
|
05/08/18 |
|
Morgan Stanley |
|
|
68,817 |
|
|
|
96,741 |
|
|
|
94,822 |
|
|
|
(1,919 |
) |
| Unrealized Depreciation |
|
|
|
|
|
|
|
|
$ |
251,065 |
|
|
$ |
245,606 |
|
|
$ |
(5,459 |
) |
Sold Contracts
|
|
|
|
Settlement
Date
|
|
Counterparty
|
|
Currency
Amount
Sold
|
|
Value
at
Settlement
Date
|
|
Value
at
April 30, 2018
|
|
Unrealized
(Depreciation)
|
| Swiss Franc |
|
|
|
06/07/18 |
|
Morgan Stanley |
|
|
(10,054,902 |
) |
|
$ |
(10,182,695 |
) |
|
$ |
(10,191,359 |
) |
|
$ |
(8,664 |
) |
| Danish Krone |
|
|
|
06/07/18 |
|
Morgan Stanley |
|
|
(13,437,745 |
) |
|
|
(2,184,704 |
) |
|
|
(2,185,758 |
) |
|
|
(1,054 |
) |
| Euro |
|
|
|
06/07/18 |
|
Morgan Stanley |
|
|
(35,856,196 |
) |
|
|
(43,412,906 |
) |
|
|
(43,448,930 |
) |
|
|
(36,024 |
) |
| British Pound |
|
|
|
06/07/18 |
|
Morgan Stanley |
|
|
(17,621,803 |
) |
|
|
(24,303,638 |
) |
|
|
(24,316,749 |
) |
|
|
(13,111 |
) |
| Norwegian Krone |
|
|
|
06/07/18 |
|
Morgan Stanley |
|
|
(7,183,386 |
) |
|
|
(897,365 |
) |
|
|
(897,899 |
) |
|
|
(534 |
) |
| Swedish Krona |
|
|
|
06/07/18 |
|
Morgan Stanley |
|
|
(30,075,265 |
) |
|
|
(3,447,757 |
) |
|
|
(3,450,243 |
) |
|
|
(2,486 |
) |
| Unrealized Depreciation |
|
|
|
|
|
|
|
|
|
|
|
$ |
(84,429,065 |
) |
|
$ |
(84,490,938 |
) |
|
$ |
(61,873 |
) |
| Total Unrealized Depreciation |
$ |
(67,332 |
) |
| |
|
|
|
|
|
|
|
|
|
|
|
|
|
|
|
|
|
|
|
|
|
|
|
|
|
|
| Net Unrealized Appreciation (Depreciation) |
|
|
|
|
|
|
$ |
1,800,237 |
|
See notes to financial
statements.
108
Schedules of Investments —
IQ 50 Percent Hedged FTSE Europe ETF (continued)
April 30, 2018
The
following is a summary of the inputs used to value the Fund’s investments as of
April 30, 2018. For more information on the valuation techniques, and their aggregation
into the levels used in the table below, please refer to Note 2.
Asset Valuation Inputs
Description
|
|
|
|
Level 1
|
|
Level 2
|
|
Level 3
|
|
Total
|
Investments in Securities:(g)
|
|
|
|
|
|
|
|
|
|
|
|
|
|
|
|
|
|
|
|
Common Stocks |
|
|
|
|
|
|
|
|
|
|
|
|
|
|
|
|
|
|
Australia |
|
|
|
$ |
769,329 |
|
|
$ |
— |
|
|
$ |
— |
|
|
$ |
769,329 |
|
Austria |
|
|
|
|
766,637 |
|
|
|
— |
|
|
|
— |
|
|
|
766,637 |
|
Belgium |
|
|
|
|
2,927,256 |
|
|
|
— |
|
|
|
— |
|
|
|
2,927,256 |
|
Chile |
|
|
|
|
80,682 |
|
|
|
— |
|
|
|
— |
|
|
|
80,682 |
|
Denmark |
|
|
|
|
4,358,199 |
|
|
|
— |
|
|
|
— |
|
|
|
4,358,199 |
|
Finland |
|
|
|
|
2,817,026 |
|
|
|
— |
|
|
|
— |
|
|
|
2,817,026 |
|
France |
|
|
|
|
27,649,680 |
|
|
|
— |
|
|
|
— |
|
|
|
27,649,680 |
|
Germany |
|
|
|
|
23,948,726 |
|
|
|
— |
|
|
|
— |
|
|
|
23,948,726 |
|
Ireland |
|
|
|
|
1,482,594 |
|
|
|
— |
|
|
|
— |
|
|
|
1,482,594 |
|
Italy |
|
|
|
|
6,642,241 |
|
|
|
— |
|
|
|
— |
|
|
|
6,642,241 |
|
Jersey |
|
|
|
|
131,176 |
|
|
|
— |
|
|
|
— |
|
|
|
131,176 |
|
Jordan |
|
|
|
|
42,435 |
|
|
|
— |
|
|
|
— |
|
|
|
42,435 |
|
Kazakhstan |
|
|
|
|
50,594 |
|
|
|
— |
|
|
|
— |
|
|
|
50,594 |
|
Luxembourg |
|
|
|
|
749,184 |
|
|
|
— |
|
|
|
— |
|
|
|
749,184 |
|
Mexico |
|
|
|
|
55,546 |
|
|
|
— |
|
|
|
— |
|
|
|
55,546 |
|
Netherlands |
|
|
|
|
12,167,348 |
|
|
|
— |
|
|
|
— |
|
|
|
12,167,348 |
|
Norway |
|
|
|
|
1,793,358 |
|
|
|
— |
|
|
|
— |
|
|
|
1,793,358 |
|
Portugal |
|
|
|
|
393,254 |
|
|
|
— |
|
|
|
— |
|
|
|
393,254 |
|
Russia |
|
|
|
|
96,794 |
|
|
|
— |
|
|
|
— |
|
|
|
96,794 |
|
South Africa |
|
|
|
|
327,956 |
|
|
|
— |
|
|
|
— |
|
|
|
327,956 |
|
Spain |
|
|
|
|
8,589,614 |
|
|
|
— |
|
|
|
— |
|
|
|
8,589,614 |
|
Sweden |
|
|
|
|
6,879,850 |
|
|
|
— |
|
|
|
— |
|
|
|
6,879,850 |
|
Switzerland |
|
|
|
|
21,900,591 |
|
|
|
— |
|
|
|
— |
|
|
|
21,900,591 |
|
United Arab Emirates |
|
|
|
|
69,784 |
|
|
|
— |
|
|
|
— |
|
|
|
69,784 |
|
United Kingdom |
|
|
|
|
41,049,585 |
|
|
|
— |
|
|
|
2,740 |
|
|
|
41,052,325 |
|
United States |
|
|
|
|
1,149,978 |
|
|
|
— |
|
|
|
— |
|
|
|
1,149,978 |
|
Total Common Stocks |
|
|
|
|
166,889,417 |
|
|
|
— |
|
|
|
2,740 |
(h) |
|
|
166,892,157 |
|
Preferred Stocks |
|
|
|
|
1,630,545 |
|
|
|
— |
|
|
|
— |
|
|
|
1,630,545 |
|
Short-Term Investment:
|
|
|
|
|
|
|
|
|
|
|
|
|
|
|
|
|
|
|
Money Market Fund |
|
|
|
|
565,759 |
|
|
|
— |
|
|
|
— |
|
|
|
565,759 |
|
Investment of Cash Collateral for Securities Loaned:
|
|
|
|
|
|
|
|
|
|
|
|
|
|
|
|
|
|
|
Money Market Fund |
|
|
|
|
4,501,909 |
|
|
|
— |
|
|
|
— |
|
|
|
4,501,909 |
|
Total Investments in Securities |
|
|
|
|
173,587,630 |
|
|
|
— |
|
|
|
2,740 |
(h) |
|
|
173,590,370 |
|
Other Financial Instruments:(i)
|
|
|
|
|
|
|
|
|
|
|
|
|
|
|
|
|
|
|
| Forward Foreign Currency Contracts |
|
|
|
|
— |
|
|
|
1,867,569 |
|
|
|
— |
|
|
|
1,867,569 |
|
Total Investments in Securities and Other Financial Instruments |
|
|
|
$ |
173,587,630 |
|
|
$ |
1,867,569 |
|
|
$ |
2,740 |
(h) |
|
$ |
175,457,939 |
|
| |
|
|
|
|
|
|
|
|
|
|
| Liability Valuation Inputs
|
|
|
|
|
|
|
|
|
|
|
| |
|
|
|
|
|
|
|
|
|
|
Description
|
|
|
|
Level 1
|
|
Level 2
|
|
Level 3
|
|
Total
|
Other Financial Instruments:(i)
|
|
|
|
|
|
|
|
|
|
|
|
|
|
|
|
|
|
|
Forward Foreign Currency Contracts |
|
|
|
$ |
— |
|
|
$ |
67,332 |
|
|
$ |
— |
|
|
$ |
67,332 |
|
Total Other Financial Instruments |
|
|
|
$ |
— |
|
|
$ |
67,332 |
|
|
$ |
— |
|
|
$ |
67,332 |
|
(g) |
|
For a complete listing of investments and their
countries, see the Schedules of Investments. |
(h) |
|
The Level 3 security, valued at $2,740, has been
deemed illiquid and has been fair valued in good faith in accordance with procedures established by the Board of Trustees. |
(i) |
|
Reflects the unrealized appreciation (depreciation)
of the instruments. |
The
Fund recognizes transfers between the levels as of the beginning of the period.
For
the year ended April 30, 2018, the Fund did not have any transfers between any levels
within the fair value hierarchy. (See Note 2)
See
notes to financial statements.
109
Schedules of Investments —
IQ 50 Percent Hedged FTSE Europe ETF (continued)
April 30, 2018
The
following is a reconciliation of investments in which significant unobservable inputs
(Level 3) were used in determining value:
Investments in Securities
|
|
|
|
Balance
as of
April 30,
2017
|
|
Accrued
Discounts
(Premiums)
|
|
Realized
Gain
(Loss)
|
|
Change in
Unrealized
Appreciation
(Depreciation)
|
|
Purchases
|
|
Sales
|
|
Transfers
into
Level 3
|
|
Transfers
out of
Level 3
|
|
Balance
as of
April 30,
2018
|
|
Change in
Unrealized
Appreciation
(Depreciation)
from
Investments
Still Held at
April 30, 2018(j)
|
Common Stock:
|
|
|
|
|
|
|
|
|
|
|
|
|
|
|
|
|
|
|
|
|
|
|
|
|
|
|
|
|
|
|
|
|
|
|
|
|
|
|
|
|
|
|
Rolls-Royce Holdings PLC, Class C(k) |
|
|
|
$ |
— |
|
|
$ |
— |
|
|
$ |
— |
|
|
$ |
(32 |
) |
|
$ |
2,772 |
|
|
$ |
— |
|
|
$ |
— |
|
|
$ |
— |
|
|
$ |
2,740 |
|
|
$ |
(32 |
) |
Total |
|
|
|
$ |
— |
|
|
$ |
— |
|
|
$ |
— |
|
|
$ |
(32 |
) |
|
$ |
2,772 |
|
|
$ |
— |
|
|
$ |
— |
|
|
$ |
— |
|
|
$ |
2,740 |
|
|
$ |
(32 |
) |
Information
about Level 3 fair value measurements as of April 30, 2018.
|
Security Type
|
|
|
|
Fair Value
|
|
Valuation Technique
|
|
Unobservable Inputs
|
| Common Stock |
|
|
|
$ |
2,740 |
|
|
Peer Analysis |
|
Comparable Securities |
(j) |
|
Included in “Net change in unrealized
appreciation (depreciation) on investments” in the Statements of Operations. |
(k) |
|
Security has been deemed illiquid and has been fair
valued in good faith in accordance with procedures established by the Board of Trustees. |
See notes to financial
statements.
110
Schedules of Investments — IQ 50 Percent Hedged
FTSE Japan ETF
April 30, 2018
|
|
|
|
Shares
|
|
Value
|
|
|
|
|
|
|
|
|
|
|
|
Common Stocks — 98.7%
|
|
|
|
|
|
|
|
|
|
|
| |
Consumer Discretionary — 19.6%
|
|
|
|
|
|
|
|
|
|
|
ABC-Mart, Inc. |
|
|
|
|
222 |
|
|
$ |
14,628 |
|
Aisin Seiki Co., Ltd. |
|
|
|
|
1,478 |
|
|
|
80,231 |
|
Aoyama Trading Co., Ltd. |
|
|
|
|
391 |
|
|
|
15,061 |
|
Asics Corp. |
|
|
|
|
1,510 |
|
|
|
28,592 |
|
ASKUL Corp. |
|
|
|
|
174 |
|
|
|
5,478 |
|
Autobacs Seven Co., Ltd. |
|
|
|
|
522 |
|
|
|
9,875 |
|
Bandai Namco Holdings, Inc. |
|
|
|
|
1,664 |
|
|
|
56,493 |
|
Benesse Holdings, Inc. |
|
|
|
|
601 |
|
|
|
21,914 |
|
Bic Camera, Inc. |
|
|
|
|
1,291 |
|
|
|
21,213 |
|
Bridgestone Corp. |
|
|
|
|
5,328 |
|
|
|
223,442 |
|
Canon Marketing Japan, Inc. |
|
|
|
|
387 |
|
|
|
8,400 |
|
Casio Computer Co., Ltd. |
|
|
|
|
1,850 |
|
|
|
27,608 |
|
CyberAgent, Inc. |
|
|
|
|
818 |
|
|
|
45,152 |
|
Daiichikosho Co., Ltd. |
|
|
|
|
352 |
|
|
|
18,497 |
|
Denso Corp. |
|
|
|
|
4,225 |
|
|
|
222,244 |
|
Dentsu, Inc. |
|
|
|
|
1,880 |
|
|
|
88,996 |
|
Don Quijote Holdings Co., Ltd. |
|
|
|
|
1,002 |
|
|
|
54,026 |
|
Exedy Corp. |
|
|
|
|
251 |
|
|
|
8,510 |
|
Fast Retailing Co., Ltd. |
|
|
|
|
444 |
|
|
|
195,616 |
|
Fuji Media Holdings, Inc. |
|
|
|
|
395 |
|
|
|
6,480 |
|
Fujitsu General Ltd. |
|
|
|
|
475 |
|
|
|
7,770 |
|
H2O Retailing Corp. |
|
|
|
|
730 |
|
|
|
13,783 |
|
Hakuhodo DY Holdings, Inc. |
|
|
|
|
2,023 |
|
|
|
28,304 |
|
Haseko Corp. |
|
|
|
|
2,367 |
|
|
|
37,314 |
|
Heiwa Corp. |
|
|
|
|
447 |
|
|
|
8,889 |
|
Hikari Tsushin, Inc. |
|
|
|
|
192 |
|
|
|
31,162 |
|
HIS Co., Ltd. |
|
|
|
|
273 |
|
|
|
9,992 |
|
Honda Motor Co., Ltd. |
|
|
|
|
15,226 |
|
|
|
524,161 |
|
Iida Group Holdings Co., Ltd. |
|
|
|
|
1,209 |
|
|
|
23,655 |
|
Isetan Mitsukoshi Holdings Ltd. |
|
|
|
|
3,046 |
|
|
|
33,905 |
|
Isuzu Motors Ltd. |
|
|
|
|
4,650 |
|
|
|
71,136 |
|
Izumi Co., Ltd. |
|
|
|
|
337 |
|
|
|
22,266 |
|
J
Front Retailing Co., Ltd. |
|
|
|
|
2,106 |
|
|
|
34,162 |
|
Koito Manufacturing Co., Ltd. |
|
|
|
|
976 |
|
|
|
65,557 |
|
Komeri Co., Ltd. |
|
|
|
|
238 |
|
|
|
6,360 |
|
K’s Holdings Corp. |
|
|
|
|
1,453 |
|
|
|
21,007 |
|
Marui Group Co., Ltd. |
|
|
|
|
1,777 |
|
|
|
36,945 |
|
Mazda Motor Corp. |
|
|
|
|
4,874 |
|
|
|
67,771 |
|
Mitsubishi Motors Corp. |
|
|
|
|
5,355 |
|
|
|
39,933 |
|
NGK Spark Plug Co., Ltd. |
|
|
|
|
1,634 |
|
|
|
42,110 |
|
NHK Spring Co., Ltd. |
|
|
|
|
1,379 |
|
|
|
15,223 |
|
Nifco, Inc. |
|
|
|
|
715 |
|
|
|
25,189 |
|
Nikon Corp. |
|
|
|
|
2,971 |
|
|
|
51,804 |
|
Nippon Television Holdings, Inc. |
|
|
|
|
434 |
|
|
|
7,611 |
|
Nissan Motor Co., Ltd. |
|
|
|
|
16,692 |
|
|
|
175,653 |
|
Nissan Shatai Co., Ltd. |
|
|
|
|
530 |
|
|
|
5,677 |
|
Nitori Holdings Co., Ltd. |
|
|
|
|
638 |
|
|
|
107,747 |
|
NOK Corp. |
|
|
|
|
964 |
|
|
|
19,822 |
|
Oriental Land Co., Ltd. |
|
|
|
|
1,641 |
|
|
|
163,688 |
|
PALTAC Corp. |
|
|
|
|
270 |
|
|
|
13,522 |
|
Panasonic Corp. |
|
|
|
|
18,439 |
|
|
|
275,005 |
|
Rakuten, Inc. |
|
|
|
|
6,754 |
|
|
|
48,156 |
|
Resorttrust, Inc. |
|
|
|
|
559 |
|
|
|
11,617 |
|
Rinnai Corp. |
|
|
|
|
313 |
|
|
|
31,150 |
|
Ryohin Keikaku Co., Ltd. |
|
|
|
|
201 |
|
|
|
68,975 |
|
Sankyo Co., Ltd. |
|
|
|
|
437 |
|
|
|
15,355 |
|
Sanrio Co., Ltd. |
|
|
|
|
502 |
|
|
|
9,253 |
|
Sega Sammy Holdings, Inc. |
|
|
|
|
1,688 |
|
|
|
27,705 |
|
Sekisui Chemical Co., Ltd. |
|
|
|
|
3,080 |
|
|
|
54,605 |
|
Sekisui House Ltd. |
|
|
|
|
5,014 |
|
|
|
91,849 |
|
Sharp Corp.(a) |
|
|
|
|
1,234 |
|
|
|
36,256 |
|
Shimachu Co., Ltd. |
|
|
|
|
373 |
|
|
|
12,050 |
|
|
|
|
|
|
|
|
|
|
|
|
|
|
|
|
Shares
|
|
Value
|
Common Stocks (continued)
|
|
|
|
|
|
|
|
|
|
|
| |
Consumer Discretionary (continued)
|
|
|
|
|
|
|
|
|
|
|
Shimamura Co., Ltd. |
|
|
|
|
187 |
|
|
$ |
21,789 |
|
Shimano, Inc. |
|
|
|
|
676 |
|
|
|
89,824 |
|
Shochiku Co., Ltd. |
|
|
|
|
85 |
|
|
|
12,491 |
|
SKY Perfect JSAT Holdings, Inc. |
|
|
|
|
1,042 |
|
|
|
4,752 |
|
Skylark Co., Ltd. |
|
|
|
|
1,626 |
|
|
|
23,924 |
|
Sony Corp. |
|
|
|
|
10,925 |
|
|
|
539,136 |
|
Stanley Electric Co., Ltd. |
|
|
|
|
1,265 |
|
|
|
45,837 |
|
Start Today Co., Ltd. |
|
|
|
|
1,520 |
|
|
|
43,895 |
|
Subaru Corp. |
|
|
|
|
5,299 |
|
|
|
178,159 |
|
Sumitomo Electric Industries Ltd. |
|
|
|
|
6,508 |
|
|
|
99,887 |
|
Sumitomo Forestry Co., Ltd. |
|
|
|
|
1,148 |
|
|
|
19,063 |
|
Sumitomo Rubber Industries Ltd. |
|
|
|
|
1,548 |
|
|
|
27,685 |
|
Suzuki Motor Corp. |
|
|
|
|
3,554 |
|
|
|
191,333 |
|
Takashimaya Co., Ltd. |
|
|
|
|
2,522 |
|
|
|
21,665 |
|
Toho Co., Ltd. |
|
|
|
|
976 |
|
|
|
32,645 |
|
Tokai Rika Co., Ltd. |
|
|
|
|
421 |
|
|
|
8,426 |
|
Tokyo Broadcasting System Holdings, Inc. |
|
|
|
|
298 |
|
|
|
6,629 |
|
Toyo Tire & Rubber Co., Ltd. |
|
|
|
|
858 |
|
|
|
14,663 |
|
Toyoda Gosei Co., Ltd. |
|
|
|
|
628 |
|
|
|
15,920 |
|
Toyota Boshoku Corp. |
|
|
|
|
518 |
|
|
|
10,921 |
|
Toyota Industries Corp. |
|
|
|
|
1,367 |
|
|
|
80,827 |
|
Toyota Motor Corp. |
|
|
|
|
22,400 |
|
|
|
1,469,997 |
|
TS
Tech Co., Ltd. |
|
|
|
|
436 |
|
|
|
17,751 |
|
TV
Asahi Holdings Corp. |
|
|
|
|
183 |
|
|
|
4,301 |
|
USS Co., Ltd. |
|
|
|
|
1,834 |
|
|
|
38,566 |
|
Wacoal Holdings Corp. |
|
|
|
|
507 |
|
|
|
15,383 |
|
Yamada Denki Co., Ltd.(a) |
|
|
|
|
6,235 |
|
|
|
32,706 |
|
Yamaha Corp. |
|
|
|
|
1,386 |
|
|
|
67,004 |
|
Yamaha Motor Co., Ltd. |
|
|
|
|
2,382 |
|
|
|
76,189 |
|
Yokohama Rubber Co., Ltd. (The) |
|
|
|
|
892 |
|
|
|
21,072 |
|
Zensho Holdings Co., Ltd. |
|
|
|
|
786 |
|
|
|
18,302 |
|
Total Consumer Discretionary |
|
|
|
|
|
|
|
|
6,797,292 |
|
| |
Consumer Staples — 8.7%
|
|
|
|
|
|
|
|
|
|
|
Aeon Co., Ltd. |
|
|
|
|
6,026 |
|
|
|
120,465 |
|
Ain Holdings, Inc. |
|
|
|
|
236 |
|
|
|
15,744 |
|
Ajinomoto Co., Inc. |
|
|
|
|
4,334 |
|
|
|
79,452 |
|
Ariake Japan Co., Ltd. |
|
|
|
|
152 |
|
|
|
13,057 |
|
Asahi Group Holdings Ltd. |
|
|
|
|
3,294 |
|
|
|
166,649 |
|
Calbee, Inc. |
|
|
|
|
640 |
|
|
|
21,582 |
|
Ci:z Holdings Co., Ltd. |
|
|
|
|
183 |
|
|
|
8,813 |
|
Coca-Cola Bottlers Japan Holdings, Inc. |
|
|
|
|
1,006 |
|
|
|
43,301 |
|
Cosmos Pharmaceutical Corp. |
|
|
|
|
75 |
|
|
|
16,868 |
|
Ezaki Glico Co., Ltd. |
|
|
|
|
442 |
|
|
|
23,872 |
|
FamilyMart UNY Holdings Co., Ltd. |
|
|
|
|
694 |
|
|
|
67,418 |
|
Fuji Oil Holdings, Inc. |
|
|
|
|
383 |
|
|
|
12,303 |
|
House Foods Group, Inc. |
|
|
|
|
633 |
|
|
|
22,300 |
|
Ito En Ltd. |
|
|
|
|
485 |
|
|
|
19,369 |
|
Itoham Yonekyu Holdings, Inc. |
|
|
|
|
1,145 |
|
|
|
10,411 |
|
Japan Tobacco, Inc. |
|
|
|
|
10,342 |
|
|
|
277,535 |
|
Kagome Co., Ltd. |
|
|
|
|
669 |
|
|
|
24,119 |
|
Kao Corp. |
|
|
|
|
4,166 |
|
|
|
299,054 |
|
Kewpie Corp. |
|
|
|
|
944 |
|
|
|
22,007 |
|
Kikkoman Corp. |
|
|
|
|
1,503 |
|
|
|
65,175 |
|
Kirin Holdings Co., Ltd. |
|
|
|
|
7,242 |
|
|
|
203,378 |
|
Kobayashi Pharmaceutical Co., Ltd. |
|
|
|
|
523 |
|
|
|
44,115 |
|
Kose Corp. |
|
|
|
|
246 |
|
|
|
45,524 |
|
Kusuri no Aoki Holdings Co., Ltd. |
|
|
|
|
135 |
|
|
|
9,265 |
|
Lawson, Inc. |
|
|
|
|
410 |
|
|
|
27,090 |
|
Lion Corp. |
|
|
|
|
2,154 |
|
|
|
46,495 |
|
See notes to financial
statements.
111
Schedules of Investments —
IQ 50 Percent Hedged FTSE Japan ETF (continued)
April 30, 2018
|
|
|
|
Shares
|
|
Value
|
|
|
|
|
|
|
|
|
|
|
|
Common Stocks (continued)
|
|
|
|
|
|
|
|
|
|
|
| |
Consumer Staples (continued)
|
|
|
|
|
|
|
|
|
|
|
Matsumotokiyoshi Holdings Co., Ltd. |
|
|
|
|
670 |
|
|
$ |
29,910 |
|
Megmilk Snow Brand Co., Ltd. |
|
|
|
|
354 |
|
|
|
10,660 |
|
MEIJI Holdings Co., Ltd. |
|
|
|
|
1,167 |
|
|
|
93,637 |
|
Mitsubishi Shokuhin Co., Ltd. |
|
|
|
|
119 |
|
|
|
3,475 |
|
Morinaga & Co., Ltd. |
|
|
|
|
348 |
|
|
|
16,951 |
|
Morinaga Milk Industry Co., Ltd. |
|
|
|
|
343 |
|
|
|
15,093 |
|
NH
Foods Ltd. |
|
|
|
|
878 |
|
|
|
38,394 |
|
Nichirei Corp. |
|
|
|
|
913 |
|
|
|
26,408 |
|
Nisshin Seifun Group, Inc. |
|
|
|
|
2,188 |
|
|
|
47,849 |
|
Nissin Foods Holdings Co., Ltd. |
|
|
|
|
589 |
|
|
|
43,331 |
|
Noevir Holdings Co., Ltd. |
|
|
|
|
129 |
|
|
|
9,290 |
|
Pigeon Corp. |
|
|
|
|
922 |
|
|
|
43,225 |
|
Pola Orbis Holdings, Inc. |
|
|
|
|
636 |
|
|
|
27,782 |
|
Sapporo Holdings Ltd. |
|
|
|
|
534 |
|
|
|
15,275 |
|
Seven & i Holdings Co., Ltd. |
|
|
|
|
6,670 |
|
|
|
292,889 |
|
Shiseido Co., Ltd. |
|
|
|
|
3,358 |
|
|
|
218,251 |
|
Sugi Holdings Co., Ltd. |
|
|
|
|
309 |
|
|
|
18,016 |
|
Sundrug Co., Ltd. |
|
|
|
|
561 |
|
|
|
28,864 |
|
Suntory Beverage & Food Ltd. |
|
|
|
|
1,071 |
|
|
|
52,755 |
|
Takara Holdings, Inc. |
|
|
|
|
1,501 |
|
|
|
18,134 |
|
Toyo Suisan Kaisha Ltd. |
|
|
|
|
769 |
|
|
|
30,289 |
|
Tsuruha Holdings, Inc. |
|
|
|
|
308 |
|
|
|
44,275 |
|
Unicharm Corp. |
|
|
|
|
3,310 |
|
|
|
93,016 |
|
Welcia Holdings Co., Ltd. |
|
|
|
|
427 |
|
|
|
21,969 |
|
Yakult Honsha Co., Ltd. |
|
|
|
|
1,029 |
|
|
|
73,349 |
|
Yamazaki Baking Co., Ltd. |
|
|
|
|
1,085 |
|
|
|
23,777 |
|
Total Consumer Staples |
|
|
|
|
|
|
|
|
3,042,225 |
|
| |
Energy — 1.1%
|
|
|
|
|
|
|
|
|
|
|
Cosmo Energy Holdings Co., Ltd. |
|
|
|
|
554 |
|
|
|
18,302 |
|
Idemitsu Kosan Co., Ltd. |
|
|
|
|
1,251 |
|
|
|
48,988 |
|
Inpex Corp. |
|
|
|
|
7,896 |
|
|
|
101,203 |
|
Japan Petroleum Exploration Co., Ltd. |
|
|
|
|
261 |
|
|
|
6,791 |
|
JXTG Holdings, Inc. |
|
|
|
|
27,534 |
|
|
|
179,760 |
|
Showa Shell Sekiyu K.K. |
|
|
|
|
1,635 |
|
|
|
23,115 |
|
Total Energy |
|
|
|
|
|
|
|
|
378,159 |
|
| |
Financials — 12.4%
|
|
|
|
|
|
|
|
|
|
|
77 Bank Ltd. (The) |
|
|
|
|
604 |
|
|
|
14,953 |
|
Acom Co., Ltd.(a) |
|
|
|
|
3,242 |
|
|
|
14,695 |
|
AEON Financial Service Co., Ltd. |
|
|
|
|
984 |
|
|
|
23,075 |
|
Aiful Corp.* |
|
|
|
|
2,481 |
|
|
|
8,389 |
|
Aozora Bank Ltd. |
|
|
|
|
998 |
|
|
|
40,358 |
|
Aplus Financial Co., Ltd.* |
|
|
|
|
782 |
|
|
|
843 |
|
Awa Bank Ltd. (The) |
|
|
|
|
1,616 |
|
|
|
10,574 |
|
Bank of Kyoto Ltd. (The) |
|
|
|
|
611 |
|
|
|
36,741 |
|
Chiba Bank Ltd. (The) |
|
|
|
|
5,536 |
|
|
|
44,723 |
|
Chugoku Bank Ltd. (The) |
|
|
|
|
1,476 |
|
|
|
17,144 |
|
Concordia Financial Group Ltd. |
|
|
|
|
10,016 |
|
|
|
58,307 |
|
Credit Saison Co., Ltd. |
|
|
|
|
1,371 |
|
|
|
24,595 |
|
Dai-ichi Life Holdings, Inc. |
|
|
|
|
9,815 |
|
|
|
194,999 |
|
Daishi Bank Ltd. (The) |
|
|
|
|
275 |
|
|
|
12,340 |
|
Daiwa Securities Group, Inc. |
|
|
|
|
13,464 |
|
|
|
82,771 |
|
Fukuoka Financial Group, Inc. |
|
|
|
|
6,246 |
|
|
|
33,449 |
|
Gunma Bank Ltd. (The) |
|
|
|
|
3,629 |
|
|
|
21,225 |
|
Hachijuni Bank Ltd. (The) |
|
|
|
|
3,512 |
|
|
|
18,583 |
|
Hiroshima Bank Ltd. (The) |
|
|
|
|
2,510 |
|
|
|
19,130 |
|
Hitachi Capital Corp. |
|
|
|
|
361 |
|
|
|
9,666 |
|
Hokuhoku Financial Group, Inc. |
|
|
|
|
1,087 |
|
|
|
16,113 |
|
Iyo Bank Ltd. (The) |
|
|
|
|
2,327 |
|
|
|
18,437 |
|
Jafco Co., Ltd. |
|
|
|
|
264 |
|
|
|
11,605 |
|
|
|
|
|
|
|
|
|
|
|
|
|
|
|
|
Shares
|
|
Value
|
Common Stocks (continued)
|
|
|
|
|
|
|
|
|
|
|
| |
Financials (continued)
|
|
|
|
|
|
|
|
|
|
|
Japan Exchange Group, Inc. |
|
|
|
|
4,598 |
|
|
$ |
85,300 |
|
Japan Post Bank Co., Ltd. |
|
|
|
|
3,487 |
|
|
|
47,417 |
|
Japan Post Holdings Co., Ltd. |
|
|
|
|
11,469 |
|
|
|
139,399 |
|
Japan Post Insurance Co., Ltd. |
|
|
|
|
553 |
|
|
|
13,605 |
|
Keiyo Bank Ltd. (The) |
|
|
|
|
1,999 |
|
|
|
9,152 |
|
Kyushu Financial Group, Inc. |
|
|
|
|
3,305 |
|
|
|
16,249 |
|
Matsui Securities Co., Ltd. |
|
|
|
|
871 |
|
|
|
8,501 |
|
Mebuki Financial Group, Inc. |
|
|
|
|
8,690 |
|
|
|
33,751 |
|
Mitsubishi UFJ Financial Group, Inc. |
|
|
|
|
111,288 |
|
|
|
745,683 |
|
Mitsubishi UFJ Lease & Finance Co., Ltd. |
|
|
|
|
3,730 |
|
|
|
23,759 |
|
Mizuho Financial Group, Inc. |
|
|
|
|
219,739 |
|
|
|
398,412 |
|
MS&AD Insurance Group Holdings, Inc. |
|
|
|
|
4,317 |
|
|
|
144,867 |
|
Nishi-Nippon Financial Holdings, Inc. |
|
|
|
|
1,324 |
|
|
|
15,911 |
|
Nomura Holdings, Inc. |
|
|
|
|
28,368 |
|
|
|
163,869 |
|
North Pacific Bank Ltd. |
|
|
|
|
2,389 |
|
|
|
8,078 |
|
Orient Corp. |
|
|
|
|
4,851 |
|
|
|
7,492 |
|
ORIX Corp. |
|
|
|
|
11,100 |
|
|
|
195,169 |
|
Resona Holdings, Inc. |
|
|
|
|
18,905 |
|
|
|
107,565 |
|
San-In Godo Bank Ltd. (The) |
|
|
|
|
1,283 |
|
|
|
12,088 |
|
SBI Holdings, Inc. |
|
|
|
|
1,819 |
|
|
|
45,997 |
|
Seven Bank Ltd. |
|
|
|
|
5,607 |
|
|
|
18,857 |
|
Shiga Bank Ltd. (The) |
|
|
|
|
2,153 |
|
|
|
10,900 |
|
Shinsei Bank Ltd.(a) |
|
|
|
|
1,397 |
|
|
|
21,806 |
|
Shizuoka Bank Ltd. (The) |
|
|
|
|
4,420 |
|
|
|
44,917 |
|
Sompo Holdings, Inc. |
|
|
|
|
3,053 |
|
|
|
128,063 |
|
Sony Financial Holdings, Inc. |
|
|
|
|
1,488 |
|
|
|
27,183 |
|
Sumitomo Mitsui Financial Group, Inc. |
|
|
|
|
11,556 |
|
|
|
480,510 |
|
Sumitomo Mitsui Trust Holdings, Inc. |
|
|
|
|
3,229 |
|
|
|
137,098 |
|
Suruga Bank Ltd. |
|
|
|
|
1,486 |
|
|
|
20,207 |
|
T&D Holdings, Inc. |
|
|
|
|
4,833 |
|
|
|
82,107 |
|
Tokai Tokyo Financial Holdings, Inc. |
|
|
|
|
1,948 |
|
|
|
14,153 |
|
Tokio Marine Holdings, Inc. |
|
|
|
|
6,043 |
|
|
|
285,624 |
|
Tokyo Century Corp. |
|
|
|
|
397 |
|
|
|
24,816 |
|
Yamaguchi Financial Group, Inc. |
|
|
|
|
1,936 |
|
|
|
24,203 |
|
Zenkoku Hosho Co., Ltd. |
|
|
|
|
429 |
|
|
|
17,740 |
|
Total Financials |
|
|
|
|
|
|
|
|
4,293,163 |
|
| |
Health Care — 7.3%
|
|
|
|
|
|
|
|
|
|
|
Alfresa Holdings Corp. |
|
|
|
|
1,521 |
|
|
|
33,582 |
|
Asahi Intecc Co., Ltd. |
|
|
|
|
850 |
|
|
|
29,790 |
|
Astellas Pharma, Inc. |
|
|
|
|
17,461 |
|
|
|
256,190 |
|
Chugai Pharmaceutical Co., Ltd. |
|
|
|
|
1,870 |
|
|
|
98,776 |
|
Daiichi Sankyo Co., Ltd. |
|
|
|
|
5,539 |
|
|
|
189,822 |
|
Eisai Co., Ltd. |
|
|
|
|
2,282 |
|
|
|
153,176 |
|
Hisamitsu Pharmaceutical Co., Inc. |
|
|
|
|
616 |
|
|
|
48,019 |
|
Hoya Corp. |
|
|
|
|
3,187 |
|
|
|
170,731 |
|
Kaken Pharmaceutical Co., Ltd. |
|
|
|
|
294 |
|
|
|
17,410 |
|
Kissei Pharmaceutical Co., Ltd. |
|
|
|
|
271 |
|
|
|
7,665 |
|
KYORIN Holdings, Inc. |
|
|
|
|
390 |
|
|
|
7,641 |
|
Kyowa Hakko Kirin Co., Ltd. |
|
|
|
|
2,164 |
|
|
|
46,948 |
|
M3, Inc. |
|
|
|
|
1,718 |
|
|
|
65,078 |
|
Medipal Holdings Corp. |
|
|
|
|
1,339 |
|
|
|
28,768 |
|
Miraca Holdings, Inc. |
|
|
|
|
444 |
|
|
|
17,326 |
|
Mitsubishi Tanabe Pharma Corp. |
|
|
|
|
1,890 |
|
|
|
35,995 |
|
Mochida Pharmaceutical Co., Ltd. |
|
|
|
|
109 |
|
|
|
7,690 |
|
Nihon Kohden Corp. |
|
|
|
|
637 |
|
|
|
18,250 |
|
Nippon Shinyaku Co., Ltd. |
|
|
|
|
438 |
|
|
|
32,662 |
|
Nipro Corp.(a) |
|
|
|
|
1,009 |
|
|
|
14,560 |
|
Olympus Corp. |
|
|
|
|
2,431 |
|
|
|
90,753 |
|
See notes to financial
statements.
112
Schedules of Investments —
IQ 50 Percent Hedged FTSE Japan ETF (continued)
April 30, 2018
|
|
|
|
Shares
|
|
Value
|
|
|
|
|
|
|
|
|
|
|
|
Common Stocks (continued)
|
|
|
|
|
|
|
|
|
|
|
| |
Health Care (continued)
|
|
|
|
|
|
|
|
|
|
|
Ono Pharmaceutical Co., Ltd. |
|
|
|
|
3,820 |
|
|
$ |
88,479 |
|
Otsuka Holdings Co., Ltd. |
|
|
|
|
3,623 |
|
|
|
189,783 |
|
PeptiDream, Inc.* |
|
|
|
|
708 |
|
|
|
28,728 |
|
Rohto Pharmaceutical Co., Ltd. |
|
|
|
|
827 |
|
|
|
24,147 |
|
Santen Pharmaceutical Co., Ltd. |
|
|
|
|
3,093 |
|
|
|
52,151 |
|
Sawai Pharmaceutical Co., Ltd. |
|
|
|
|
323 |
|
|
|
13,992 |
|
Shionogi & Co., Ltd. |
|
|
|
|
2,458 |
|
|
|
126,556 |
|
Sumitomo Dainippon Pharma Co., Ltd. |
|
|
|
|
1,418 |
|
|
|
25,852 |
|
Suzuken Co., Ltd. |
|
|
|
|
674 |
|
|
|
29,011 |
|
Sysmex Corp. |
|
|
|
|
1,245 |
|
|
|
110,136 |
|
Taisho Pharmaceutical Holdings Co., Ltd. |
|
|
|
|
389 |
|
|
|
37,291 |
|
Takeda Pharmaceutical Co., Ltd. |
|
|
|
|
6,518 |
|
|
|
275,254 |
|
Terumo Corp. |
|
|
|
|
2,652 |
|
|
|
150,262 |
|
Tsumura & Co. |
|
|
|
|
559 |
|
|
|
20,332 |
|
Total Health Care |
|
|
|
|
|
|
|
|
2,542,806 |
|
| |
Industrials — 21.6%
|
|
|
|
|
|
|
|
|
|
|
Aica Kogyo Co., Ltd. |
|
|
|
|
447 |
|
|
|
16,830 |
|
Amada Holdings Co., Ltd. |
|
|
|
|
2,784 |
|
|
|
33,507 |
|
ANA Holdings, Inc. |
|
|
|
|
963 |
|
|
|
38,194 |
|
Asahi Glass Co., Ltd. |
|
|
|
|
1,605 |
|
|
|
66,591 |
|
Central Japan Railway Co. |
|
|
|
|
1,568 |
|
|
|
314,818 |
|
Chiyoda Corp.(a) |
|
|
|
|
1,308 |
|
|
|
13,471 |
|
COMSYS Holdings Corp. |
|
|
|
|
887 |
|
|
|
24,723 |
|
Dai Nippon Printing Co., Ltd. |
|
|
|
|
2,515 |
|
|
|
54,196 |
|
Daifuku Co., Ltd. |
|
|
|
|
823 |
|
|
|
44,224 |
|
Daikin Industries Ltd. |
|
|
|
|
2,292 |
|
|
|
268,212 |
|
DMG Mori Co., Ltd. |
|
|
|
|
859 |
|
|
|
16,148 |
|
East Japan Railway Co. |
|
|
|
|
3,220 |
|
|
|
308,684 |
|
Ebara Corp. |
|
|
|
|
859 |
|
|
|
32,892 |
|
FANUC Corp. |
|
|
|
|
1,680 |
|
|
|
361,716 |
|
Fuji Electric Co., Ltd. |
|
|
|
|
5,352 |
|
|
|
38,346 |
|
Fujikura Ltd. |
|
|
|
|
2,336 |
|
|
|
16,011 |
|
Fukuyama Transporting Co., Ltd. |
|
|
|
|
283 |
|
|
|
11,832 |
|
Furukawa Electric Co., Ltd. |
|
|
|
|
525 |
|
|
|
25,908 |
|
Glory Ltd. |
|
|
|
|
469 |
|
|
|
16,158 |
|
GS
Yuasa Corp. |
|
|
|
|
3,299 |
|
|
|
17,788 |
|
Hankyu Hanshin Holdings, Inc. |
|
|
|
|
1,903 |
|
|
|
75,042 |
|
Hino Motors Ltd. |
|
|
|
|
2,289 |
|
|
|
27,968 |
|
Hitachi Construction Machinery Co., Ltd. |
|
|
|
|
904 |
|
|
|
32,922 |
|
Hitachi Transport System Ltd. |
|
|
|
|
367 |
|
|
|
9,830 |
|
Hoshizaki Corp. |
|
|
|
|
447 |
|
|
|
41,544 |
|
IHI Corp. |
|
|
|
|
1,110 |
|
|
|
36,417 |
|
ITOCHU Corp. |
|
|
|
|
12,219 |
|
|
|
244,994 |
|
Japan Airlines Co., Ltd. |
|
|
|
|
1,008 |
|
|
|
39,703 |
|
Japan Airport Terminal Co., Ltd. |
|
|
|
|
396 |
|
|
|
16,267 |
|
Japan Steel Works Ltd. (The) |
|
|
|
|
535 |
|
|
|
17,601 |
|
JGC Corp. |
|
|
|
|
1,841 |
|
|
|
45,173 |
|
JTEKT Corp. |
|
|
|
|
1,930 |
|
|
|
31,307 |
|
Kajima Corp. |
|
|
|
|
7,816 |
|
|
|
75,356 |
|
Kamigumi Co., Ltd. |
|
|
|
|
882 |
|
|
|
19,909 |
|
Kandenko Co., Ltd. |
|
|
|
|
887 |
|
|
|
10,505 |
|
Kawasaki Heavy Industries Ltd. |
|
|
|
|
1,244 |
|
|
|
41,722 |
|
Kawasaki Kisen Kaisha Ltd.* |
|
|
|
|
705 |
|
|
|
16,300 |
|
Keihan Holdings Co., Ltd. |
|
|
|
|
835 |
|
|
|
27,013 |
|
Keikyu Corp. |
|
|
|
|
2,121 |
|
|
|
38,902 |
|
Keio Corp. |
|
|
|
|
982 |
|
|
|
44,961 |
|
Keisei Electric Railway Co., Ltd. |
|
|
|
|
1,188 |
|
|
|
38,759 |
|
Kinden Corp. |
|
|
|
|
1,114 |
|
|
|
19,445 |
|
|
|
|
|
|
|
|
|
|
|
|
|
|
|
|
Shares
|
|
Value
|
Common Stocks (continued)
|
|
|
|
|
|
|
|
|
|
|
| |
Industrials (continued)
|
|
|
|
|
|
|
|
|
|
|
Kintetsu Group Holdings Co., Ltd. |
|
|
|
|
1,533 |
|
|
$ |
62,413 |
|
Kokuyo Co., Ltd. |
|
|
|
|
719 |
|
|
|
12,971 |
|
Komatsu Ltd. |
|
|
|
|
7,904 |
|
|
|
270,870 |
|
Kubota Corp. |
|
|
|
|
9,663 |
|
|
|
163,324 |
|
Kurita Water Industries Ltd. |
|
|
|
|
939 |
|
|
|
30,463 |
|
Kyowa Exeo Corp. |
|
|
|
|
759 |
|
|
|
19,768 |
|
Kyudenko Corp. |
|
|
|
|
333 |
|
|
|
15,612 |
|
Kyushu Railway Co. |
|
|
|
|
1,369 |
|
|
|
43,913 |
|
LIXIL Group Corp. |
|
|
|
|
2,222 |
|
|
|
49,811 |
|
Mabuchi Motor Co., Ltd. |
|
|
|
|
440 |
|
|
|
22,196 |
|
Maeda Corp. |
|
|
|
|
1,138 |
|
|
|
14,061 |
|
Maeda Road Construction Co., Ltd. |
|
|
|
|
495 |
|
|
|
10,694 |
|
Makita Corp. |
|
|
|
|
2,108 |
|
|
|
94,781 |
|
Marubeni Corp. |
|
|
|
|
13,529 |
|
|
|
101,902 |
|
MINEBEA MITSUMI, Inc. |
|
|
|
|
3,585 |
|
|
|
71,978 |
|
MISUMI Group, Inc. |
|
|
|
|
2,355 |
|
|
|
65,210 |
|
Mitsubishi Corp. |
|
|
|
|
11,125 |
|
|
|
307,748 |
|
Mitsubishi Electric Corp. |
|
|
|
|
17,095 |
|
|
|
262,537 |
|
Mitsubishi Heavy Industries Ltd. |
|
|
|
|
2,472 |
|
|
|
97,728 |
|
Mitsubishi Logistics Corp. |
|
|
|
|
577 |
|
|
|
13,351 |
|
Mitsui & Co., Ltd. |
|
|
|
|
14,510 |
|
|
|
262,088 |
|
Mitsui E&S Holdings Co., Ltd.* |
|
|
|
|
627 |
|
|
|
10,772 |
|
Mitsui OSK Lines Ltd. |
|
|
|
|
943 |
|
|
|
27,965 |
|
Miura Co., Ltd. |
|
|
|
|
836 |
|
|
|
25,479 |
|
MonotaRO Co., Ltd. |
|
|
|
|
499 |
|
|
|
17,443 |
|
Nabtesco Corp. |
|
|
|
|
994 |
|
|
|
35,927 |
|
Nagase & Co., Ltd. |
|
|
|
|
942 |
|
|
|
16,124 |
|
Nagoya Railroad Co., Ltd. |
|
|
|
|
1,553 |
|
|
|
40,746 |
|
Nankai Electric Railway Co., Ltd. |
|
|
|
|
931 |
|
|
|
24,801 |
|
NGK Insulators Ltd. |
|
|
|
|
2,259 |
|
|
|
41,536 |
|
Nidec Corp. |
|
|
|
|
2,027 |
|
|
|
317,503 |
|
Nihon M&A Center, Inc. |
|
|
|
|
1,085 |
|
|
|
31,829 |
|
Nippo Corp. |
|
|
|
|
433 |
|
|
|
9,936 |
|
Nippon Express Co., Ltd. |
|
|
|
|
625 |
|
|
|
47,236 |
|
Nippon Yusen K.K. |
|
|
|
|
1,370 |
|
|
|
29,222 |
|
Nishi-Nippon Railroad Co., Ltd. |
|
|
|
|
645 |
|
|
|
17,919 |
|
Nisshinbo Holdings, Inc. |
|
|
|
|
1,155 |
|
|
|
16,329 |
|
NSK Ltd. |
|
|
|
|
3,885 |
|
|
|
52,191 |
|
NTN Corp.(a) |
|
|
|
|
3,623 |
|
|
|
15,992 |
|
Obayashi Corp. |
|
|
|
|
5,748 |
|
|
|
66,292 |
|
Odakyu Electric Railway Co., Ltd. |
|
|
|
|
2,604 |
|
|
|
56,185 |
|
OKUMA Corp. |
|
|
|
|
256 |
|
|
|
14,669 |
|
OSG Corp. |
|
|
|
|
657 |
|
|
|
14,578 |
|
Park24 Co., Ltd. |
|
|
|
|
891 |
|
|
|
25,242 |
|
Penta-Ocean Construction Co., Ltd. |
|
|
|
|
2,422 |
|
|
|
19,146 |
|
Persol Holdings Co., Ltd. |
|
|
|
|
1,441 |
|
|
|
34,278 |
|
Pilot Corp. |
|
|
|
|
212 |
|
|
|
11,586 |
|
Recruit Holdings Co., Ltd. |
|
|
|
|
10,348 |
|
|
|
238,971 |
|
Sankyu, Inc. |
|
|
|
|
424 |
|
|
|
20,614 |
|
Sanwa Holdings Corp. |
|
|
|
|
1,691 |
|
|
|
21,774 |
|
Secom Co., Ltd. |
|
|
|
|
1,675 |
|
|
|
125,550 |
|
Seibu Holdings, Inc. |
|
|
|
|
1,843 |
|
|
|
31,142 |
|
Seino Holdings Co., Ltd. |
|
|
|
|
1,260 |
|
|
|
23,640 |
|
SG
Holdings Co., Ltd. |
|
|
|
|
693 |
|
|
|
15,497 |
|
Shima Seiki Manufacturing Ltd.(a) |
|
|
|
|
256 |
|
|
|
16,283 |
|
Shimizu Corp. |
|
|
|
|
4,834 |
|
|
|
47,887 |
|
SMC Corp. |
|
|
|
|
501 |
|
|
|
191,014 |
|
Sohgo Security Services Co., Ltd. |
|
|
|
|
569 |
|
|
|
28,132 |
|
Sojitz Corp. |
|
|
|
|
10,696 |
|
|
|
35,287 |
|
Sotetsu Holdings, Inc.(a) |
|
|
|
|
663 |
|
|
|
19,025 |
|
Sumitomo Corp. |
|
|
|
|
9,689 |
|
|
|
174,389 |
|
Sumitomo Heavy Industries Ltd. |
|
|
|
|
963 |
|
|
|
36,874 |
|
See notes to financial
statements.
113
Schedules of Investments —
IQ 50 Percent Hedged FTSE Japan ETF (continued)
April 30, 2018
|
|
|
|
Shares
|
|
Value
|
|
|
|
|
|
|
|
|
|
|
|
Common Stocks (continued)
|
|
|
|
|
|
|
|
|
|
|
| |
Industrials (continued)
|
|
|
|
|
|
|
|
|
|
|
Tadano Ltd. |
|
|
|
|
975 |
|
|
$ |
15,058 |
|
Taisei Corp. |
|
|
|
|
1,817 |
|
|
|
98,135 |
|
THK Co., Ltd. |
|
|
|
|
974 |
|
|
|
34,091 |
|
Tobu Railway Co., Ltd. |
|
|
|
|
1,721 |
|
|
|
54,890 |
|
Toda Corp. |
|
|
|
|
1,973 |
|
|
|
16,300 |
|
Tokyu Corp. |
|
|
|
|
4,208 |
|
|
|
70,797 |
|
Toppan Forms Co., Ltd. |
|
|
|
|
337 |
|
|
|
3,760 |
|
Toppan Printing Co., Ltd. |
|
|
|
|
4,462 |
|
|
|
37,352 |
|
Toshiba Corp.* |
|
|
|
|
50,809 |
|
|
|
136,048 |
|
TOTO Ltd. |
|
|
|
|
1,230 |
|
|
|
69,804 |
|
Toyota Tsusho Corp. |
|
|
|
|
1,903 |
|
|
|
68,433 |
|
Ushio, Inc. |
|
|
|
|
999 |
|
|
|
14,096 |
|
West Japan Railway Co. |
|
|
|
|
1,586 |
|
|
|
112,328 |
|
Yamato Holdings Co., Ltd. |
|
|
|
|
3,036 |
|
|
|
78,172 |
|
Total Industrials |
|
|
|
|
|
|
|
|
7,521,577 |
|
| |
Information Technology — 12.0%
|
|
|
|
|
|
|
|
|
|
|
Advantest Corp. |
|
|
|
|
1,513 |
|
|
|
36,226 |
|
Alps Electric Co., Ltd. |
|
|
|
|
1,608 |
|
|
|
35,679 |
|
Azbil Corp. |
|
|
|
|
551 |
|
|
|
25,681 |
|
Brother Industries Ltd. |
|
|
|
|
2,013 |
|
|
|
43,341 |
|
Canon, Inc. |
|
|
|
|
8,892 |
|
|
|
307,980 |
|
Capcom Co., Ltd. |
|
|
|
|
790 |
|
|
|
15,183 |
|
Citizen Watch Co., Ltd. |
|
|
|
|
2,315 |
|
|
|
17,348 |
|
COLOPL, Inc. |
|
|
|
|
397 |
|
|
|
3,008 |
|
DeNA Co., Ltd. |
|
|
|
|
943 |
|
|
|
17,968 |
|
Disco Corp. |
|
|
|
|
236 |
|
|
|
41,582 |
|
FUJIFILM Holdings Corp. |
|
|
|
|
3,297 |
|
|
|
132,724 |
|
Fujitsu Ltd. |
|
|
|
|
16,752 |
|
|
|
101,943 |
|
GMO Payment Gateway, Inc. |
|
|
|
|
139 |
|
|
|
13,782 |
|
Gree, Inc. |
|
|
|
|
804 |
|
|
|
4,445 |
|
GungHo Online Entertainment, Inc. |
|
|
|
|
3,199 |
|
|
|
9,677 |
|
Hamamatsu Photonics K.K. |
|
|
|
|
1,106 |
|
|
|
42,653 |
|
Hirose Electric Co., Ltd. |
|
|
|
|
288 |
|
|
|
40,584 |
|
Hitachi High-Technologies Corp. |
|
|
|
|
546 |
|
|
|
25,497 |
|
Hitachi Ltd. |
|
|
|
|
39,987 |
|
|
|
292,927 |
|
Horiba Ltd. |
|
|
|
|
328 |
|
|
|
23,890 |
|
Ibiden Co., Ltd. |
|
|
|
|
922 |
|
|
|
15,259 |
|
Itochu Techno-Solutions Corp. |
|
|
|
|
823 |
|
|
|
17,073 |
|
Japan Aviation Electronics Industry Ltd. |
|
|
|
|
381 |
|
|
|
6,518 |
|
Japan Display, Inc.*(a) |
|
|
|
|
3,035 |
|
|
|
4,022 |
|
Kakaku.com, Inc. |
|
|
|
|
1,136 |
|
|
|
21,708 |
|
Keyence Corp. |
|
|
|
|
780 |
|
|
|
477,374 |
|
Koei Tecmo Holdings Co., Ltd. |
|
|
|
|
416 |
|
|
|
8,588 |
|
Konami Holdings Corp. |
|
|
|
|
810 |
|
|
|
39,825 |
|
Konica Minolta, Inc. |
|
|
|
|
3,859 |
|
|
|
33,150 |
|
Kyocera Corp. |
|
|
|
|
2,698 |
|
|
|
172,544 |
|
LINE Corp.* |
|
|
|
|
337 |
|
|
|
12,304 |
|
Murata Manufacturing Co., Ltd. |
|
|
|
|
1,639 |
|
|
|
207,449 |
|
NEC Corp. |
|
|
|
|
2,221 |
|
|
|
60,993 |
|
Nexon Co., Ltd.* |
|
|
|
|
3,483 |
|
|
|
50,705 |
|
Nintendo Co., Ltd. |
|
|
|
|
930 |
|
|
|
392,398 |
|
Nippon Electric Glass Co., Ltd. |
|
|
|
|
705 |
|
|
|
20,327 |
|
Nomura Research Institute Ltd. |
|
|
|
|
885 |
|
|
|
45,696 |
|
NS
Solutions Corp. |
|
|
|
|
279 |
|
|
|
8,083 |
|
NTT Data Corp. |
|
|
|
|
5,377 |
|
|
|
57,934 |
|
OBIC Business Consultants Co., Ltd. |
|
|
|
|
63 |
|
|
|
4,617 |
|
Obic Co., Ltd. |
|
|
|
|
571 |
|
|
|
47,851 |
|
Omron Corp. |
|
|
|
|
1,704 |
|
|
|
92,500 |
|
Oracle Corp. Japan |
|
|
|
|
276 |
|
|
|
22,700 |
|
Otsuka Corp. |
|
|
|
|
874 |
|
|
|
40,735 |
|
|
|
|
|
|
|
|
|
|
|
|
|
|
|
|
Shares
|
|
Value
|
Common Stocks (continued)
|
|
|
|
|
|
|
|
|
|
|
| |
Information Technology (continued)
|
|
|
|
|
|
|
|
|
|
|
Renesas Electronics Corp.* |
|
|
|
|
5,951 |
|
|
$ |
62,433 |
|
Ricoh Co., Ltd. |
|
|
|
|
5,806 |
|
|
|
56,826 |
|
Rohm Co., Ltd. |
|
|
|
|
757 |
|
|
|
70,702 |
|
SCREEN Holdings Co., Ltd. |
|
|
|
|
335 |
|
|
|
27,584 |
|
SCSK Corp. |
|
|
|
|
356 |
|
|
|
15,258 |
|
Seiko Epson Corp. |
|
|
|
|
2,352 |
|
|
|
44,171 |
|
Shimadzu Corp. |
|
|
|
|
2,296 |
|
|
|
62,444 |
|
Square Enix Holdings Co., Ltd. |
|
|
|
|
660 |
|
|
|
27,504 |
|
SUMCO Corp. |
|
|
|
|
1,995 |
|
|
|
49,262 |
|
Taiyo Yuden Co., Ltd. |
|
|
|
|
947 |
|
|
|
16,867 |
|
TDK Corp. |
|
|
|
|
1,036 |
|
|
|
89,469 |
|
TIS, Inc. |
|
|
|
|
685 |
|
|
|
27,168 |
|
Tokyo Electron Ltd. |
|
|
|
|
1,348 |
|
|
|
259,375 |
|
Topcon Corp. |
|
|
|
|
889 |
|
|
|
17,711 |
|
Trend Micro, Inc. |
|
|
|
|
979 |
|
|
|
58,691 |
|
Ulvac, Inc. |
|
|
|
|
411 |
|
|
|
22,123 |
|
Yahoo Japan Corp. |
|
|
|
|
11,169 |
|
|
|
45,931 |
|
Yaskawa Electric Corp. |
|
|
|
|
1,891 |
|
|
|
77,247 |
|
Yokogawa Electric Corp. |
|
|
|
|
2,069 |
|
|
|
45,644 |
|
Total Information Technology |
|
|
|
|
|
|
|
|
4,168,881 |
|
| |
Materials — 6.6%
|
|
|
|
|
|
|
|
|
|
|
Air Water, Inc. |
|
|
|
|
1,302 |
|
|
|
25,154 |
|
Asahi Kasei Corp. |
|
|
|
|
10,768 |
|
|
|
148,346 |
|
Daicel Corp. |
|
|
|
|
2,492 |
|
|
|
28,831 |
|
Daido Steel Co., Ltd. |
|
|
|
|
299 |
|
|
|
16,231 |
|
Denka Co., Ltd. |
|
|
|
|
758 |
|
|
|
27,085 |
|
DIC Corp. |
|
|
|
|
697 |
|
|
|
23,695 |
|
Dowa Holdings Co., Ltd. |
|
|
|
|
387 |
|
|
|
14,606 |
|
FP
Corp. |
|
|
|
|
195 |
|
|
|
12,047 |
|
Hitachi Chemical Co., Ltd. |
|
|
|
|
847 |
|
|
|
18,624 |
|
Hitachi Metals Ltd. |
|
|
|
|
1,683 |
|
|
|
19,318 |
|
JFE Holdings, Inc. |
|
|
|
|
4,391 |
|
|
|
90,469 |
|
JSR Corp. |
|
|
|
|
1,599 |
|
|
|
30,175 |
|
Kaneka Corp. |
|
|
|
|
2,458 |
|
|
|
24,282 |
|
Kansai Paint Co., Ltd. |
|
|
|
|
1,652 |
|
|
|
37,199 |
|
Kobe Steel Ltd. |
|
|
|
|
2,539 |
|
|
|
26,266 |
|
Kuraray Co., Ltd. |
|
|
|
|
3,008 |
|
|
|
50,085 |
|
Lintec Corp. |
|
|
|
|
426 |
|
|
|
12,322 |
|
Maruichi Steel Tube Ltd. |
|
|
|
|
525 |
|
|
|
17,968 |
|
Mitsubishi Chemical Holdings Corp. |
|
|
|
|
11,162 |
|
|
|
106,035 |
|
Mitsubishi Gas Chemical Co., Inc. |
|
|
|
|
1,573 |
|
|
|
37,002 |
|
Mitsubishi Materials Corp. |
|
|
|
|
1,065 |
|
|
|
32,507 |
|
Mitsui Chemicals, Inc. |
|
|
|
|
1,554 |
|
|
|
44,593 |
|
Mitsui Mining & Smelting Co., Ltd. |
|
|
|
|
467 |
|
|
|
19,866 |
|
Nippon Kayaku Co., Ltd. |
|
|
|
|
1,429 |
|
|
|
17,904 |
|
Nippon Paint Holdings Co., Ltd.(a) |
|
|
|
|
1,317 |
|
|
|
53,920 |
|
Nippon Paper Industries Co., Ltd. |
|
|
|
|
802 |
|
|
|
15,369 |
|
Nippon Shokubai Co., Ltd. |
|
|
|
|
270 |
|
|
|
18,358 |
|
Nippon Steel & Sumitomo Metal Corp. |
|
|
|
|
6,736 |
|
|
|
146,816 |
|
Nissan Chemical Industries Ltd. |
|
|
|
|
1,201 |
|
|
|
53,506 |
|
Nisshin Steel Co., Ltd. |
|
|
|
|
387 |
|
|
|
5,149 |
|
Nitto Denko Corp. |
|
|
|
|
1,330 |
|
|
|
99,059 |
|
NOF Corp. |
|
|
|
|
600 |
|
|
|
17,903 |
|
Oji Holdings Corp. |
|
|
|
|
7,515 |
|
|
|
52,881 |
|
Rengo Co., Ltd. |
|
|
|
|
1,780 |
|
|
|
15,323 |
|
Shin-Etsu Chemical Co., Ltd. |
|
|
|
|
3,525 |
|
|
|
354,513 |
|
Showa Denko K.K. |
|
|
|
|
1,078 |
|
|
|
36,007 |
|
Sumitomo Chemical Co., Ltd. |
|
|
|
|
12,875 |
|
|
|
74,008 |
|
Sumitomo Metal Mining Co., Ltd. |
|
|
|
|
2,029 |
|
|
|
87,112 |
|
Sumitomo Osaka Cement Co., Ltd. |
|
|
|
|
3,178 |
|
|
|
14,550 |
|
See notes to financial
statements.
114
Schedules of Investments —
IQ 50 Percent Hedged FTSE Japan ETF (continued)
April 30, 2018
|
|
|
|
Shares
|
|
Value
|
|
|
|
|
|
|
|
|
|
|
|
Common Stocks (continued)
|
|
|
|
|
|
|
|
|
|
|
| |
Materials (continued)
|
|
|
|
|
|
|
|
|
|
|
Taiheiyo Cement Corp. |
|
|
|
|
1,032 |
|
|
$ |
39,092 |
|
Taiyo Nippon Sanso Corp. |
|
|
|
|
1,222 |
|
|
|
18,125 |
|
Teijin Ltd. |
|
|
|
|
1,515 |
|
|
|
28,535 |
|
Tokai Carbon Co., Ltd. |
|
|
|
|
1,670 |
|
|
|
20,985 |
|
Tokuyama Corp. |
|
|
|
|
581 |
|
|
|
17,336 |
|
Toray Industries, Inc. |
|
|
|
|
13,096 |
|
|
|
122,313 |
|
Tosoh Corp. |
|
|
|
|
2,426 |
|
|
|
43,055 |
|
Toyo Seikan Group Holdings Ltd. |
|
|
|
|
1,356 |
|
|
|
21,352 |
|
Toyobo Co., Ltd. |
|
|
|
|
746 |
|
|
|
14,548 |
|
Ube Industries Ltd. |
|
|
|
|
902 |
|
|
|
27,532 |
|
Yamato Kogyo Co., Ltd. |
|
|
|
|
297 |
|
|
|
8,821 |
|
Zeon Corp. |
|
|
|
|
1,254 |
|
|
|
16,285 |
|
Total Materials |
|
|
|
|
|
|
|
|
2,303,063 |
|
| |
Real Estate — 3.1%
|
|
|
|
|
|
|
|
|
|
|
Aeon Mall Co., Ltd. |
|
|
|
|
1,012 |
|
|
|
20,513 |
|
Daikyo, Inc. |
|
|
|
|
245 |
|
|
|
5,340 |
|
Daito Trust Construction Co., Ltd. |
|
|
|
|
612 |
|
|
|
102,098 |
|
Daiwa House Industry Co., Ltd. |
|
|
|
|
5,615 |
|
|
|
205,768 |
|
Hulic Co., Ltd. |
|
|
|
|
3,038 |
|
|
|
32,677 |
|
Ichigo, Inc. |
|
|
|
|
1,749 |
|
|
|
7,800 |
|
Leopalace21 Corp. |
|
|
|
|
2,023 |
|
|
|
17,582 |
|
Mitsubishi Estate Co., Ltd. |
|
|
|
|
10,218 |
|
|
|
186,991 |
|
Mitsui Fudosan Co., Ltd. |
|
|
|
|
8,178 |
|
|
|
210,121 |
|
Nomura Real Estate Holdings, Inc. |
|
|
|
|
1,008 |
|
|
|
25,038 |
|
NTT Urban Development Corp. |
|
|
|
|
919 |
|
|
|
10,842 |
|
Open House Co., Ltd. |
|
|
|
|
253 |
|
|
|
14,150 |
|
Relo Group, Inc. |
|
|
|
|
885 |
|
|
|
19,944 |
|
Sumitomo Realty & Development Co., Ltd. |
|
|
|
|
3,736 |
|
|
|
148,484 |
|
Tokyo Tatemono Co., Ltd. |
|
|
|
|
1,757 |
|
|
|
26,766 |
|
Tokyu Fudosan Holdings Corp. |
|
|
|
|
4,380 |
|
|
|
34,504 |
|
Total Real Estate |
|
|
|
|
|
|
|
|
1,068,618 |
|
| |
Telecommunication Services — 4.4%
|
|
|
|
|
|
|
|
|
|
|
KDDI Corp. |
|
|
|
|
15,574 |
|
|
|
418,011 |
|
Nippon Telegraph & Telephone Corp. |
|
|
|
|
5,715 |
|
|
|
271,844 |
|
NTT DOCOMO, Inc. |
|
|
|
|
10,868 |
|
|
|
281,570 |
|
SoftBank Group Corp. |
|
|
|
|
7,372 |
|
|
|
572,715 |
|
Total Telecommunication
Services |
|
|
|
|
|
|
|
|
1,544,140 |
|
|
|
|
|
|
|
|
|
|
|
|
|
|
|
|
Shares
|
|
Value
|
Common Stocks (continued)
|
|
|
|
|
|
|
|
|
|
|
| |
Utilities — 1.9%
|
|
|
|
|
|
|
|
|
|
|
Chubu Electric Power Co., Inc. |
|
|
|
|
5,975 |
|
|
$ |
93,563 |
|
Chugoku Electric Power Co., Inc. (The) |
|
|
|
|
2,460 |
|
|
|
30,799 |
|
Electric Power Development Co., Ltd. |
|
|
|
|
1,409 |
|
|
|
38,346 |
|
Hokkaido Electric Power Co., Inc. |
|
|
|
|
1,504 |
|
|
|
9,979 |
|
Hokuriku Electric Power Co.*(a) |
|
|
|
|
1,447 |
|
|
|
14,771 |
|
Kansai Electric Power Co., Inc. (The) |
|
|
|
|
6,210 |
|
|
|
86,829 |
|
Kyushu Electric Power Co., Inc. |
|
|
|
|
3,958 |
|
|
|
48,903 |
|
Osaka Gas Co., Ltd. |
|
|
|
|
3,370 |
|
|
|
72,497 |
|
Shikoku Electric Power Co., Inc. |
|
|
|
|
1,314 |
|
|
|
16,704 |
|
Toho Gas Co., Ltd. |
|
|
|
|
770 |
|
|
|
23,362 |
|
Tohoku Electric Power Co., Inc. |
|
|
|
|
4,024 |
|
|
|
51,888 |
|
Tokyo Electric Power Co., Holdings, Inc.* |
|
|
|
|
13,298 |
|
|
|
63,315 |
|
Tokyo Gas Co., Ltd. |
|
|
|
|
3,620 |
|
|
|
96,997 |
|
Total Utilities |
|
|
|
|
|
|
|
|
647,953 |
|
| |
Total Common Stocks
|
|
|
|
|
|
|
|
|
|
|
(Cost $27,897,697) |
|
|
|
|
|
|
|
|
34,307,877 |
|
| |
Investment of Cash Collateral For Securities Loaned — 0.1%
|
|
|
|
|
|
|
|
|
|
|
| |
Money Market Fund — 0.1%
|
|
|
|
|
|
|
|
|
|
|
Dreyfus Government Cash Management Fund, Institutional Shares, 1.61%(b)
|
|
|
|
|
|
|
|
|
|
|
(Cost $36,157) |
|
|
|
|
36,157 |
|
|
|
36,157 |
|
| |
Total Investments — 98.8%
|
|
|
|
|
|
|
|
|
|
|
(Cost $27,933,854) |
|
|
|
|
|
|
|
|
34,344,034 |
|
| |
Other Assets and Liabilities,
Net — 1.2% |
|
|
|
|
|
|
|
|
402,449 |
|
| |
Net Assets — 100.0% |
|
|
|
|
|
|
|
$ |
34,746,483 |
|
* |
|
Non-income producing securities. |
(a) |
|
All or a portion of the security was on loan. In
addition, “Other Assets and Liabilities, Net” may include pending sales that are also on loan. The aggregate market value of securities on
loan was $246,157; total market value of collateral held by the Fund was $260,055. Market value of the collateral held includes non-cash U.S. Treasury
securities collateral having a value of $223,898. |
(b) |
|
Reflects the 1-day yield at April 30,
2018. |
See notes to financial
statements.
115
Schedules of Investments —
IQ 50 Percent Hedged FTSE Japan ETF (continued)
April 30, 2018
Forward Foreign Currency Contracts
Outstanding as of April 30, 2018:
|
Purchased Contracts
|
|
|
|
Settlement Date
|
|
Counterparty
|
|
Currency
Amount
Purchased
|
|
Value at
Settlement
Date
|
|
Value at
April 30, 2018
|
|
Unrealized
Appreciation
|
| Japanese Yen |
|
|
|
05/08/18 |
|
Merrill Lynch |
|
|
1,797,754,947 |
|
|
$ |
16,438,090 |
|
|
$ |
16,438,175 |
|
|
$ |
85 |
|
| Unrealized Appreciation |
|
|
|
|
|
|
|
|
$ |
16,438,090 |
|
|
$ |
16,438,175 |
|
|
$ |
85 |
|
|
Sold Contracts
|
|
|
|
Settlement Date
|
|
Counterparty
|
|
Currency
Amount Sold
|
|
Value at
Settlement
Date
|
|
Value at
April 30, 2018
|
|
Unrealized
Appreciation
|
| Japanese Yen |
|
|
|
05/08/18 |
|
Merrill Lynch |
|
|
(1,855,818,747 |
) |
|
$ |
(17,492,047 |
) |
|
$ |
(16,969,094 |
) |
|
$ |
522,953 |
|
| Unrealized Appreciation |
|
|
|
|
|
|
|
|
$ |
(17,492,047 |
) |
|
$ |
(16,969,094 |
) |
|
$ |
522,953 |
|
| Total Unrealized Appreciation |
$ |
523,038 |
|
|
Purchased Contracts
|
|
|
|
Settlement Date
|
|
Counterparty
|
|
Currency
Amount
Purchased
|
|
Value at
Settlement
Date
|
|
Value at
April 30, 2018
|
|
Unrealized
(Depreciation)
|
| Japanese Yen |
|
|
|
05/08/18 |
|
Merrill Lynch |
|
|
58,063,800 |
|
|
$ |
542,171 |
|
|
$ |
530,920 |
|
|
$ |
(11,251 |
) |
| Unrealized Depreciation |
|
|
|
|
|
|
|
|
$ |
542,171 |
|
|
$ |
530,920 |
|
|
$ |
(11,251 |
) |
|
Sold Contracts
|
|
|
|
Settlement Date
|
|
Counterparty
|
|
Currency
Amount Sold
|
|
Value at
Settlement
Date
|
|
Value at
April 30, 2018
|
|
Unrealized
(Depreciation)
|
| Japanese Yen |
|
|
|
06/07/18 |
|
Merrill Lynch |
|
|
(1,877,501,512 |
) |
|
$ |
(17,192,733 |
) |
|
$ |
(17,203,419 |
) |
|
$ |
(10,686 |
) |
| Unrealized Depreciation |
|
|
|
|
|
|
|
|
$ |
(17,192,733 |
) |
|
$ |
(17,203,419 |
) |
|
$ |
(10,686 |
) |
| Total Unrealized Depreciation |
$ |
(21,937 |
) |
| |
|
|
|
|
|
|
|
|
|
|
|
|
|
|
|
|
|
|
|
|
|
|
|
|
|
|
| Net Unrealized Appreciation (Depreciation) |
|
|
|
|
|
|
$ |
501,101 |
|
As
of 4/30/2018, there was no collateral segregated by the counterparty for Forward foreign
currency contracts.
The
following is a summary of the inputs used to value the Fund’s investments as of
April 30, 2018. For more information on the valuation techniques, and their aggregation
into the levels used in the table below, please refer to Note 2.
Asset Valuation Inputs
Description
|
|
|
|
Level 1
|
|
Level 2
|
|
Level 3
|
|
Total
|
Investments in Securities:(c)
|
|
|
|
|
|
|
|
|
|
|
|
|
|
|
|
|
|
|
Common Stocks |
|
|
|
$ |
34,307,877 |
|
|
$ |
— |
|
|
$ |
— |
|
|
$ |
34,307,877 |
|
Investment of Cash Collateral for Securities Loaned:
|
|
|
|
|
|
|
|
|
|
|
|
|
|
|
|
|
|
|
Money Market Fund |
|
|
|
|
36,157 |
|
|
|
— |
|
|
|
— |
|
|
|
36,157 |
|
Total Investments in Securities |
|
|
|
|
34,344,034 |
|
|
|
— |
|
|
|
— |
|
|
|
34,344,034 |
|
Other Financial Instruments:(d)
|
|
|
|
|
|
|
|
|
|
|
|
|
|
|
|
|
|
|
Forward Foreign Currency Contracts |
|
|
|
|
— |
|
|
|
523,038 |
|
|
|
— |
|
|
|
523,038 |
|
Total Investments in Securities and Other Financial Instruments |
|
|
|
$ |
34,344,034 |
|
|
$ |
523,038 |
|
|
$ |
— |
|
|
$ |
34,867,072 |
|
| |
|
|
|
|
|
|
|
|
|
|
| Liability Valuation Inputs
|
|
|
|
|
|
|
|
|
|
|
| |
|
|
|
|
|
|
|
|
|
|
Description
|
|
|
|
Level 1
|
|
Level 2
|
|
Level 3
|
|
Total
|
Other Financial Instruments:(d)
|
|
|
|
|
|
|
|
|
|
|
|
|
|
|
|
|
|
|
Forward Foreign Currency Contracts |
|
|
|
$ |
— |
|
|
$ |
21,937 |
|
|
$ |
— |
|
|
$ |
21,937 |
|
Total Other Financial Instruments |
|
|
|
$ |
— |
|
|
$ |
21,937 |
|
|
$ |
— |
|
|
$ |
21,937 |
|
(c) |
|
For a complete listing of investments and their
industries, see the Schedules of Investments. |
(d) |
|
Reflects the unrealized appreciation (depreciation)
of the instruments. |
The Fund recognizes
transfers between the levels as of the beginning of the period.
For the year ended
April 30, 2018, the Fund did not have any transfers between any levels within the fair value hierarchy. (See
Note 2)
See notes to financial
statements.
116
Schedules of Investments — IQ Leaders GTAA Tracker
ETF
April 30, 2018
|
|
|
|
Shares
|
|
Value
|
|
|
|
|
|
|
|
|
|
|
|
| |
Investment Companies — 99.9%
|
|
|
|
|
|
|
|
|
|
|
| |
Aggregate Bond Funds — 22.8%
|
|
|
|
|
|
|
|
|
|
|
iShares Core U.S. Aggregate Bond ETF |
|
|
|
|
61,994 |
|
|
$ |
6,571,364 |
|
SPDR Portfolio Aggregate Bond ETF |
|
|
|
|
10,183 |
|
|
|
283,597 |
|
Vanguard Total Bond Market ETF |
|
|
|
|
56,026 |
|
|
|
4,428,855 |
|
Total Aggregate Bond Funds |
|
|
|
|
|
|
|
|
11,283,816 |
|
| |
Convertible Bond Fund — 9.0%
|
|
|
|
|
|
|
|
|
|
|
SPDR Bloomberg Barclays Convertible Securities ETF(a) |
|
|
|
|
86,605 |
|
|
|
4,454,961 |
|
| |
Emerging Equity Funds — 6.1%
|
|
|
|
|
|
|
|
|
|
|
iShares Core MSCI Emerging Markets ETF |
|
|
|
|
22,592 |
|
|
|
1,284,355 |
|
Vanguard FTSE Emerging Markets ETF |
|
|
|
|
38,507 |
|
|
|
1,759,000 |
|
Total Emerging Equity Funds |
|
|
|
|
|
|
|
|
3,043,355 |
|
| |
High Yield Corporate Bond
Funds — 4.0%
|
|
|
|
|
|
|
|
|
|
|
iShares iBoxx $ High Yield Corporate Bond ETF(a)(b) |
|
|
|
|
14,170 |
|
|
|
1,214,369 |
|
SPDR Bloomberg Barclays High Yield Bond ETF(a) |
|
|
|
|
21,407 |
|
|
|
767,869 |
|
Total High Yield Corporate Bond Funds |
|
|
|
|
|
|
|
|
1,982,238 |
|
| |
International Equity Core
Funds — 28.2%
|
|
|
|
|
|
|
|
|
|
|
iShares Core MSCI EAFE ETF |
|
|
|
|
92,700 |
|
|
|
6,177,528 |
|
Vanguard FTSE Developed Markets ETF(a) |
|
|
|
|
173,547 |
|
|
|
7,776,641 |
|
Total International Equity Core Funds |
|
|
|
|
|
|
|
|
13,954,169 |
|
| |
U.S. Large Cap Core Funds — 25.1%
|
|
|
|
|
|
|
|
|
|
|
Consumer Discretionary Select Sector SPDR Fund |
|
|
|
|
20,679 |
|
|
|
2,144,412 |
|
Consumer Staples Select Sector SPDR Fund |
|
|
|
|
5,224 |
|
|
|
263,551 |
|
Energy Select Sector SPDR Fund |
|
|
|
|
3,774 |
|
|
|
278,559 |
|
Financial Select Sector SPDR Fund |
|
|
|
|
78,354 |
|
|
|
2,150,817 |
|
Health Care Select Sector
SPDR Fund |
|
|
|
|
5,421 |
|
|
|
445,932 |
|
Industrial Select Sector SPDR Fund |
|
|
|
|
38,693 |
|
|
|
2,794,409 |
|
Materials Select Sector SPDR Fund |
|
|
|
|
2,016 |
|
|
|
114,932 |
|
Technology Select Sector SPDR Fund |
|
|
|
|
6,879 |
|
|
|
450,299 |
|
Utilities Select Sector SPDR Fund(a) |
|
|
|
|
16,069 |
|
|
|
828,518 |
|
Vanguard Consumer Discretionary ETF(a) |
|
|
|
|
2,739 |
|
|
|
442,842 |
|
Vanguard Consumer Staples ETF |
|
|
|
|
849 |
|
|
|
111,278 |
|
Vanguard Energy ETF(a) |
|
|
|
|
617 |
|
|
|
62,515 |
|
Vanguard Financials ETF(a) |
|
|
|
|
8,014 |
|
|
|
554,729 |
|
Vanguard Health Care ETF(a) |
|
|
|
|
1,325 |
|
|
|
205,282 |
|
Vanguard Industrials ETF(a) |
|
|
|
|
5,764 |
|
|
|
780,330 |
|
Vanguard Information Technology ETF |
|
|
|
|
2,357 |
|
|
|
402,953 |
|
Vanguard Materials ETF(a) |
|
|
|
|
502 |
|
|
|
65,019 |
|
Vanguard Utilities ETF |
|
|
|
|
2,597 |
|
|
|
297,538 |
|
Total U.S. Large Cap Core Funds |
|
|
|
|
|
|
|
|
12,393,915 |
|
|
|
|
|
|
|
|
|
|
|
|
|
|
|
|
Shares
|
|
Value
|
| |
Investment Companies (continued)
|
|
|
|
|
|
|
|
|
|
|
| |
U.S. Medium Term Treasury Bond Fund — 4.7%
|
|
|
|
|
|
|
|
|
|
|
iShares 7-10 Year Treasury Bond ETF(a) |
|
|
|
|
22,716 |
|
|
$ |
2,310,217 |
|
| |
Total Investment Companies
|
|
|
|
|
|
|
|
|
|
|
(Cost $48,983,202) |
|
|
|
|
|
|
|
|
49,422,671 |
|
| |
Short-Term Investment — 0.2%
|
|
|
|
|
|
|
|
|
|
|
| |
Money Market Fund — 0.2%
|
|
|
|
|
|
|
|
|
|
|
Morgan Stanley Institutional Liquidity Funds Treasury Portfolio — Institutional Class,
1.58%(c)
|
|
|
|
|
|
|
|
|
|
|
(Cost $86,391) |
|
|
|
|
86,391 |
|
|
|
86,391 |
|
| |
Investment of Cash Collateral For Securities Loaned — 15.6%
|
|
|
|
|
|
|
|
|
|
|
| |
Money Market Fund — 15.6%
|
|
|
|
|
|
|
|
|
|
|
Dreyfus Government Cash Management Fund, Institutional Shares, 1.61%(c)
|
|
|
|
|
|
|
|
|
|
|
(Cost $7,739,673) |
|
|
|
|
7,739,673 |
|
|
|
7,739,673 |
|
| |
Total Investments — 115.7%
|
|
|
|
|
|
|
|
|
|
|
(Cost $56,809,266) |
|
|
|
|
|
|
|
|
57,248,735 |
|
| |
Other Assets and Liabilities,
Net — (15.7)% |
|
|
|
|
|
|
|
|
(7,775,958 |
) |
| |
Net Assets — 100.0% |
|
|
|
|
|
|
|
$ |
49,472,777 |
|
(a) |
|
All or a portion of the security was on loan. In
addition, “Other Assets and Liabilities, Net” may include pending sales that are also on loan. The aggregate market value of securities on
loan was $8,117,227; total market value of collateral held by the Fund was $8,331,285. Market value of the collateral held includes non-cash U.S.
Treasury securities having a value of $591,612. |
(b) |
|
All or a portion of these securities have been
segregated as collateral for swap contracts. The total value of securities segregated amounted to $243,388. |
(c) |
|
Reflects the 1-day yield at April 30,
2018. |
See notes to financial
statements.
117
Schedules of Investments —
IQ Leaders GTAA Tracker ETF (continued)
April 30, 2018
Total Return Swap contracts outstanding at April 30,
2018:
Total Return Benchmark
| |
Counterparty
| |
Annual
Financing
Rate
Received
(Paid) %
| |
Expiration
Date
| |
Payment
Frequency
Received/
(Paid)
| |
Notional
Amount
Long
(Short)
| |
Value/
Unrealized
Appreciation/
(Depreciation)(d)
|
| Consumer Discretionary Select Sector SPDR Fund | |
Morgan Stanley | |
| 2.20 | | |
10/03/2019 | |
Monthly | |
$ | 120,396 | | |
$ | — | |
| Consumer Staples Select Sector SPDR Fund | |
Morgan Stanley | |
| 2.20 | | |
10/03/2019 | |
Monthly | |
| 14,782 | | |
| — | |
| Energy Select Sector SPDR Fund | |
Morgan Stanley | |
| 2.20 | | |
10/03/2019 | |
Monthly | |
| 15,648 | | |
| — | |
| Financial Select Sector SPDR Fund | |
Morgan Stanley | |
| 2.20 | | |
10/03/2019 | |
Monthly | |
| 120,725 | | |
| — | |
| Health Care Select Sector SPDR Fund | |
Morgan Stanley | |
| 2.20 | | |
10/03/2019 | |
Monthly | |
| 25,007 | | |
| — | |
| Industrial Select Sector SPDR Fund | |
Morgan Stanley | |
| 2.20 | | |
10/03/2019 | |
Monthly | |
| 156,862 | | |
| — | |
iShares 7-10 Year Treasury
Bond ETF | |
| |
| 2.20 | | |
10/03/2019 | |
Monthly | |
| 129,668 | | |
| — | |
| iShares Core MSCI EAFE ETF | |
Morgan Stanley | |
| 2.20 | | |
10/03/2019 | |
Monthly | |
| 346,728 | | |
| — | |
| iShares Core MSCI Emerging Markets ETF | |
Morgan Stanley | |
| 2.20 | | |
10/03/2019 | |
Monthly | |
| 72,086 | | |
| — | |
| iShares Core U.S. Aggregate Bond ETF | |
Morgan Stanley | |
| 2.20 | | |
10/03/2019 | |
Monthly | |
| 368,774 | | |
| — | |
| iShares iBoxx $ High Yield Corporate Bond ETF | |
Morgan Stanley | |
| 2.20 | | |
10/03/2019 | |
Monthly | |
| 68,132 | | |
| — | |
| iShares iBoxx $ Investment Grade Corporate Bond ETF | |
Morgan Stanley | |
| 1.25 | | |
10/03/2019 | |
Monthly | |
| (243,345 | ) | |
| — | |
| iShares Russell 2000 ETF | |
Morgan Stanley | |
| 1.30 | | |
10/03/2019 | |
Monthly | |
| (1,950,384 | ) | |
| — | |
| Materials Select Sector SPDR Fund | |
Morgan Stanley | |
| 2.20 | | |
10/03/2019 | |
Monthly | |
| 6,442 | | |
| — | |
| SPDR Bloomberg Barclays Convertible Securities ETF | |
Morgan Stanley | |
| 2.20 | | |
10/03/2019 | |
Monthly | |
| 250,050 | | |
| — | |
| SPDR Bloomberg Barclays High Yield Bond ETF | |
Morgan Stanley | |
| 2.20 | | |
10/03/2019 | |
Monthly | |
| 43,080 | | |
| — | |
SPDR Portfolio Aggregate
Bond ETF | |
Morgan Stanley | |
| 2.20 | | |
10/03/2019 | |
Monthly | |
| 15,902 | | |
| — | |
| Technology Select Sector SPDR Fund | |
Morgan Stanley | |
| 2.20 | | |
10/03/2019 | |
Monthly | |
| 25,268 | | |
| — | |
| Utilities Select Sector SPDR Fund | |
| |
| 2.20 | | |
10/03/2019 | |
Monthly | |
| 46,507 | | |
| — | |
| Vanguard Consumer Discretionary ETF | |
Morgan Stanley | |
| 2.20 | | |
10/03/2019 | |
Monthly | |
| 24,899 | | |
| — | |
| Vanguard Consumer Staples ETF | |
Morgan Stanley | |
| 2.20 | | |
10/03/2019 | |
Monthly | |
| 6,291 | | |
| — | |
| Vanguard Energy ETF | |
| |
| 2.20 | | |
10/03/2019 | |
Monthly | |
| 3,040 | | |
| — | |
| Vanguard Financials ETF | |
Morgan Stanley | |
| 2.20 | | |
10/03/2019 | |
Monthly | |
| 31,149 | | |
| — | |
| Vanguard FTSE Developed Markets ETF | |
Morgan Stanley | |
| 2.20 | | |
10/03/2019 | |
Monthly | |
| 436,449 | | |
| — | |
| Vanguard FTSE Emerging Markets ETF | |
Morgan Stanley | |
| 2.20 | | |
10/03/2019 | |
Monthly | |
| 98,714 | | |
| — | |
| Vanguard Health Care ETF | |
Morgan Stanley | |
| 2.20 | | |
10/03/2019 | |
Monthly | |
| 11,465 | | |
| — | |
| Vanguard Industrials ETF | |
Morgan Stanley | |
| 2.20 | | |
10/03/2019 | |
Monthly | |
| 43,728 | | |
| — | |
| Vanguard Information Technology ETF | |
Morgan Stanley | |
| 2.20 | | |
10/03/2019 | |
Monthly | |
| 22,567 | | |
| — | |
| Vanguard Materials ETF | |
Morgan Stanley | |
| 2.20 | | |
10/03/2019 | |
Monthly | |
| 3,627 | | |
| — | |
| Vanguard Real Estate ETF | |
Morgan Stanley | |
| 1.15 | | |
10/03/2019 | |
Monthly | |
| (624,014 | ) | |
| — | |
| Vanguard Total Bond Market ETF | |
Morgan Stanley | |
| 2.20 | | |
10/03/2019 | |
Monthly | |
| 248,533 | | |
| — | |
| Vanguard Utilities ETF | |
| |
| 2.20 | | |
10/03/2019 | |
Monthly | |
| 16,384 | | |
| — | |
| | |
| |
| | | |
| |
| |
| | | |
$ | — | |
The total value
of securities segregated as collateral for swap contracts with counterparty Morgan Stanley amounted to $243,388
at April 30, 2018. The Fund either receives fees from, or pays to the counterparty, the total return of the
benchmark and the agreed-upon financing rate.
(d) |
|
Reflects the value at reset date of April 30,
2018. |
See notes to financial
statements.
118
Schedules of Investments —
IQ Leaders GTAA Tracker ETF (continued)
April 30, 2018
The
following is a summary of the inputs used to value the Fund’s investments as of
April 30, 2018. For more information on the valuation techniques, and their aggregation
into the levels used in the table below, please refer to Note 2.
Asset Valuation Inputs
Description
|
|
|
|
Level 1
|
|
Level 2
|
|
Level 3
|
|
Total
|
Investments in Securities:(e)
|
|
|
|
|
|
|
|
|
|
|
|
|
|
|
|
|
|
|
Investment Companies |
|
|
|
$ |
49,422,671 |
|
|
$ |
— |
|
|
$ |
— |
|
|
$ |
49,422,671 |
|
Short-Term Investment:
|
|
|
|
|
|
|
|
|
|
|
|
|
|
|
|
|
|
|
Money Market Fund |
|
|
|
|
86,391 |
|
|
|
— |
|
|
|
— |
|
|
|
86,391 |
|
Investment of Cash Collateral for Securities Loaned:
|
|
|
|
|
|
|
|
|
|
|
|
|
|
|
|
|
|
|
Money Market Fund |
|
|
|
|
7,739,673 |
|
|
|
— |
|
|
|
— |
|
|
|
7,739,673 |
|
Total Investments in Securities |
|
|
|
|
57,248,735 |
|
|
|
— |
|
|
|
— |
|
|
|
57,248,735 |
|
Other Financial Instruments:(f)
|
|
|
|
|
|
|
|
|
|
|
|
|
|
|
|
|
|
|
Swap Contracts |
|
|
|
|
— |
|
|
|
— |
|
|
|
— |
|
|
|
— |
|
Total Investments in Securities and Other Financial Instruments |
|
|
|
$ |
57,248,735 |
|
|
$ |
— |
|
|
$ |
— |
|
|
$ |
57,248,735 |
|
| |
|
|
|
|
|
|
|
|
|
|
| Liability Valuation Inputs
|
|
|
|
|
|
|
|
|
|
|
| |
|
|
|
|
|
|
|
|
|
|
Description
|
|
|
|
Level 1
|
|
Level 2
|
|
Level 3
|
|
Total
|
Other Financial Instruments:(f)
|
|
|
|
|
|
|
|
|
|
|
|
|
|
|
|
|
|
|
Swap Contracts |
|
|
|
$ |
— |
|
|
$ |
— |
|
|
$ |
— |
|
|
$ |
— |
|
Total Other Financial Instruments |
|
|
|
$ |
— |
|
|
$ |
— |
|
|
$ |
— |
|
|
$ |
— |
|
(e) |
|
For a complete listing of investments and their
industries, see the Schedules of Investments. |
(f) |
|
Reflects the unrealized appreciation (depreciation)
of the instruments. |
The
Fund recognizes transfers between the levels as of the beginning of the period.
For
the year ended April 30, 2018, the Fund did not have any transfers between any levels
within the fair value hierarchy. (See Note 2)
See notes to financial
statements.
119
Schedules of Investments — IQ Enhanced Core Bond
U.S. ETF
April 30, 2018
|
|
|
|
Shares
|
|
Value
|
|
|
|
|
|
|
|
|
|
|
|
| |
Investment Companies — 99.8%
|
|
|
|
|
|
|
|
|
|
|
| |
Investment Grade Corporate Bond Funds — 36.7%
|
|
|
|
|
|
|
|
|
|
|
iShares iBoxx $ Investment Grade Corporate Bond ETF |
|
|
|
|
74,823 |
|
|
$ |
8,621,106 |
|
iShares U.S. Credit Bond ETF |
|
|
|
|
3,771 |
|
|
|
405,797 |
|
Vanguard Intermediate-Term Corporate Bond ETF |
|
|
|
|
116,114 |
|
|
|
9,715,259 |
|
Total Investment Grade Corporate Bond Funds |
|
|
|
|
|
|
|
|
18,742,162 |
|
| |
Mortgage Backed Securities Funds — 28.6%
|
|
|
|
|
|
|
|
|
|
|
iShares MBS ETF(a) |
|
|
|
|
51,573 |
|
|
|
5,353,793 |
|
SPDR Bloomberg Barclays Mortgage Backed Bond ETF |
|
|
|
|
94,676 |
|
|
|
2,397,197 |
|
Vanguard Mortgage-Backed Securities ETF |
|
|
|
|
134,466 |
|
|
|
6,887,348 |
|
Total Mortgage Backed Securities Funds |
|
|
|
|
|
|
|
|
14,638,338 |
|
| |
U.S. Intermediate Term Treasury Bond Funds — 3.6%
|
|
|
|
|
|
|
|
|
|
|
Schwab Intermediate-Term U.S. Treasury ETF(a) |
|
|
|
|
18,905 |
|
|
|
983,438 |
|
Vanguard Intermediate-Term Treasury ETF |
|
|
|
|
13,531 |
|
|
|
843,116 |
|
Total U.S. Intermediate Term Treasury Bond Funds |
|
|
|
|
|
|
|
|
1,826,554 |
|
| |
U.S. Long Term Treasury Bond Funds — 30.1%
|
|
|
|
|
|
|
|
|
|
|
iShares 10-20 Year Treasury Bond ETF(a) |
|
|
|
|
1,740 |
|
|
|
226,113 |
|
iShares 20+ Year Treasury Bond ETF |
|
|
|
|
20,957 |
|
|
|
2,495,979 |
|
SPDR Portfolio Long Term Treasury ETF |
|
|
|
|
198,344 |
|
|
|
6,805,182 |
|
Vanguard Long-Term Treasury ETF |
|
|
|
|
79,543 |
|
|
|
5,832,093 |
|
Total U.S. Long Term Treasury Bond Funds |
|
|
|
|
|
|
|
|
15,359,367 |
|
|
|
|
|
|
|
|
|
|
|
|
|
|
|
|
Shares
|
|
Value
|
| |
Investment Companies (continued)
|
|
|
|
|
|
|
|
|
|
|
| |
U.S. Medium Term Treasury Bond Funds — 0.8%
|
|
|
|
|
|
|
|
|
|
|
iShares 3-7 Year Treasury Bond ETF |
|
|
|
|
2,629 |
|
|
$ |
314,218 |
|
iShares 7-10 Year Treasury Bond ETF |
|
|
|
|
780 |
|
|
|
79,326 |
|
Total U.S. Medium Term Treasury Bond Funds |
|
|
|
|
|
|
|
|
393,544 |
|
| |
Total Investment Companies
|
|
|
|
|
|
|
|
|
|
|
(Cost $52,480,850) |
|
|
|
|
|
|
|
|
50,959,965 |
|
| |
Short-Term Investment — 0.2%
|
|
|
|
|
|
|
|
|
|
|
| |
Money Market Fund — 0.2%
|
|
|
|
|
|
|
|
|
|
|
Morgan Stanley Institutional Liquidity Funds Treasury Portfolio — Institutional Class,
1.58%(b)
|
|
|
|
|
|
|
|
|
|
|
(Cost $126,884) |
|
|
|
|
126,884 |
|
|
|
126,884 |
|
| |
Investment of Cash Collateral For Securities Loaned — 1.0%
|
|
|
|
|
|
|
|
|
|
|
| |
Money Market Fund — 1.0%
|
|
|
|
|
|
|
|
|
|
|
Dreyfus Government Cash Management Fund, Institutional Shares, 1.61%(b)
|
|
|
|
|
|
|
|
|
|
|
(Cost $528,755) |
|
|
|
|
528,755 |
|
|
|
528,755 |
|
| |
Total Investments — 101.0%
|
|
|
|
|
|
|
|
|
|
|
(Cost $53,136,489) |
|
|
|
|
|
|
|
|
51,615,604 |
|
| |
Other Assets and Liabilities,
Net — (1.0)% |
|
|
|
|
|
|
|
|
(533,747 |
) |
| |
Net Assets — 100.0% |
|
|
|
|
|
|
|
$ |
51,081,857 |
|
(a) |
|
All or a portion of the security was on loan. In
addition, “Other Assets and Liabilities, Net” may include pending sales that are also on loan. The aggregate market value of securities on
loan was $518,694; total market value of collateral held by the Fund was $528,755. |
(b) |
|
Reflects the 1-day yield at April 30,
2018. |
The
following is a summary of the inputs used to value the Fund’s investments as of
April 30, 2018. For more information on the valuation techniques, and their aggregation
into the levels used in the table below, please refer to Note 2.
Asset Valuation Inputs
Description
|
|
|
|
Level 1
|
|
Level 2
|
|
Level 3
|
|
Total
|
Investments in Securities:(c)
|
|
|
|
|
|
|
|
|
|
|
|
|
|
|
|
|
|
|
Investment Companies |
|
|
|
$ |
50,959,965 |
|
|
$ |
— |
|
|
$ |
— |
|
|
$ |
50,959,965 |
|
Short-Term Investment:
|
|
|
|
|
|
|
|
|
|
|
|
|
|
|
|
|
|
|
Money Market Fund |
|
|
|
|
126,884 |
|
|
|
— |
|
|
|
— |
|
|
|
126,884 |
|
Investment of Cash Collateral for Securities Loaned:
|
|
|
|
|
|
|
|
|
|
|
|
|
|
|
|
|
|
|
Money Market Fund |
|
|
|
|
528,755 |
|
|
|
— |
|
|
|
— |
|
|
|
528,755 |
|
Total Investments in Securities |
|
|
|
$ |
51,615,604 |
|
|
$ |
— |
|
|
$ |
— |
|
|
$ |
51,615,604 |
|
(c) |
|
For a complete listing of investments and their
industries, see the Schedules of Investments. |
The
Fund recognizes transfers between the levels as of the beginning of the period.
For
the year ended April 30, 2018, the Fund did not have any transfers between any levels
within the fair value hierarchy. (See Note 2)
See notes to financial
statements.
120
Schedules of Investments — IQ Enhanced Core Plus
Bond U.S. ETF
April 30, 2018
|
|
|
|
Shares
|
|
Value
|
|
|
|
|
|
|
|
|
|
|
|
Investment Companies — 99.8%
|
|
|
|
|
|
|
|
|
|
|
| |
High Yield Corporate Bond
Funds — 22.2%
|
|
|
|
|
|
|
|
|
|
|
iShares iBoxx $ High Yield Corporate Bond ETF(a) |
|
|
|
|
390,040 |
|
|
$ |
33,426,428 |
|
SPDR Bloomberg Barclays High Yield Bond ETF(a) |
|
|
|
|
1,141,385 |
|
|
|
40,941,480 |
|
Total High Yield Corporate Bond Funds |
|
|
|
|
|
|
|
|
74,367,908 |
|
| |
Investment Grade Corporate Bond Funds — 38.0%
|
|
|
|
|
|
|
|
|
|
|
iShares iBoxx $ Investment Grade Corporate Bond ETF |
|
|
|
|
506,369 |
|
|
|
58,343,836 |
|
iShares U.S. Credit Bond ETF |
|
|
|
|
25,521 |
|
|
|
2,746,315 |
|
Vanguard Intermediate-Term Corporate Bond ETF |
|
|
|
|
785,816 |
|
|
|
65,749,225 |
|
Total Investment Grade Corporate Bond Funds |
|
|
|
|
|
|
|
|
126,839,376 |
|
| |
Mortgage Backed Securities Funds — 24.1%
|
|
|
|
|
|
|
|
|
|
|
iShares MBS ETF |
|
|
|
|
283,442 |
|
|
|
29,424,114 |
|
SPDR Bloomberg Barclays Mortgage Backed Bond ETF |
|
|
|
|
520,339 |
|
|
|
13,174,984 |
|
Vanguard Mortgage-Backed Securities ETF |
|
|
|
|
739,018 |
|
|
|
37,852,502 |
|
Total Mortgage Backed Securities Funds |
|
|
|
|
|
|
|
|
80,451,600 |
|
| |
U.S. Long Term Treasury Bond Funds — 15.5%
|
|
|
|
|
|
|
|
|
|
|
iShares 10-20 Year Treasury Bond ETF(a) |
|
|
|
|
5,869 |
|
|
|
762,676 |
|
iShares 20+ Year Treasury Bond ETF |
|
|
|
|
70,685 |
|
|
|
8,418,583 |
|
SPDR Portfolio Long Term
Treasury ETF |
|
|
|
|
669,005 |
|
|
|
22,953,562 |
|
|
|
|
|
|
|
|
|
|
|
|
|
|
|
|
Shares
|
|
Value
|
| |
Investment Companies (continued)
|
|
|
|
|
|
|
|
|
|
|
| |
U.S. Long Term Treasury Bond Funds (continued)
|
|
|
|
|
|
|
|
|
|
|
Vanguard Long-Term Treasury ETF(a) |
|
|
|
|
268,296 |
|
|
$ |
19,671,463 |
|
Total U.S. Long Term Treasury Bond Funds |
|
|
|
|
|
|
|
|
51,806,284 |
|
| |
Total Investment Companies
|
|
|
|
|
|
|
|
|
|
|
(Cost $341,229,263) |
|
|
|
|
|
|
|
|
333,465,168 |
|
| |
Short-Term Investment — 0.2%
|
|
|
|
|
|
|
|
|
|
|
| |
Money Market Fund — 0.2%
|
|
|
|
|
|
|
|
|
|
|
Morgan Stanley Institutional Liquidity Funds Treasury Portfolio — Institutional Class,
1.58%(b)
|
|
|
|
|
|
|
|
|
|
|
(Cost $496,976) |
|
|
|
|
496,976 |
|
|
|
496,976 |
|
| |
Investment of Cash Collateral For Securities Loaned — 22.0%
|
|
|
|
|
|
|
|
|
|
|
| |
Money Market Fund — 22.0%
|
|
|
|
|
|
|
|
|
|
|
Dreyfus Government Cash Management Fund, Institutional Shares, 1.61%(b)
|
|
|
|
|
|
|
|
|
|
|
(Cost $73,354,896) |
|
|
|
|
73,354,896 |
|
|
|
73,354,896 |
|
| |
Total Investments — 122.0%
|
|
|
|
|
|
|
|
|
|
|
(Cost $415,081,135) |
|
|
|
|
|
|
|
|
407,317,040 |
|
| |
Other Assets and Liabilities,
Net — (22.0)% |
|
|
|
|
|
|
|
|
(73,327,392 |
) |
| |
Net Assets — 100.0% |
|
|
|
|
|
|
|
$ |
333,989,648 |
|
(a) |
|
All or a portion of the security was on loan. In
addition, “Other Assets and Liabilities, Net” may include pending sales that are also on loan. The aggregate market value of securities on
loan was $74,895,524; total market value of collateral held by the Fund was $76,692,065. Market value of the collateral held includes non-cash U.S.
Treasury securities collateral having a value of $3,337,169. |
(b) |
|
Reflects the 1-day yield at April 30,
2018. |
The
following is a summary of the inputs used to value the Fund’s investments as of
April 30, 2018. For more information on the valuation techniques, and their aggregation
into the levels used in the table below, please refer to Note 2.
Asset Valuation Inputs
| |
|
|
|
|
|
|
|
|
|
|
Description
|
|
|
|
Level 1
|
|
Level 2
|
|
Level 3
|
|
Total
|
Investments in Securities:(c)
|
|
|
|
|
|
|
|
|
|
|
|
|
|
|
|
|
|
|
|
Investment Companies |
|
|
|
$ |
333,465,168 |
|
|
$ |
— |
|
|
$ |
— |
|
|
$ |
333,465,168 |
|
Short-Term Investment:
|
|
|
|
|
|
|
|
|
|
|
|
|
|
|
|
|
|
|
Money Market Fund |
|
|
|
|
496,976 |
|
|
|
— |
|
|
|
— |
|
|
|
496,976 |
|
Investment of Cash Collateral for Securities Loaned:
|
|
|
|
|
|
|
|
|
|
|
|
|
|
|
|
|
|
|
Money Market Fund |
|
|
|
|
73,354,896 |
|
|
|
— |
|
|
|
— |
|
|
|
73,354,896 |
|
Total Investments in Securities |
|
|
|
$ |
407,317,040 |
|
|
$ |
— |
|
|
$ |
— |
|
|
$ |
407,317,040 |
|
(c) |
|
For a complete listing of investments and their
industries, see the Schedules of Investments. |
The
Fund recognizes transfers between the levels as of the beginning of the period.
For
the year ended April 30, 2018, the Fund did not have any transfers between any levels
within the fair value hierarchy. (See Note 2)
See notes to financial
statements.
121
Schedules of Investments —
IQ Enhanced Core Plus Bond U.S. ETF (continued)
April 30, 2018
A summary of the Fund’s transactions with affiliated funds during the year April
30, 2018 is as follows:
Affiliated Holdings
| |
|
|
|
Shares at
04/30/2017
|
|
Value
($) at
04/30/2017
|
|
Purchases
Cost
($)
|
|
Sales
Proceeds
($)
|
|
Net
Realized
Gain/(Loss)
($)
|
|
Net
Change in
Unrealized
Appreciation/
(Depreciation)
($)
|
|
Income
Distributions
($)
|
|
Capital
Gain
Distributions
($)
|
|
Shares at
04/30/2018
|
|
Value
($) at
04/30/2018
|
| SPDR |
|
|
|
|
|
|
|
|
|
|
|
|
|
|
|
|
|
|
|
|
|
|
|
|
|
|
|
|
|
|
|
|
|
|
|
|
|
|
|
|
|
|
| Bloomberg |
|
|
|
|
|
|
|
|
|
|
|
|
|
|
|
|
|
|
|
|
|
|
|
|
|
|
|
|
|
|
|
|
|
|
|
|
|
|
|
|
|
|
| Barclays |
|
|
|
|
|
|
|
|
|
|
|
|
|
|
|
|
|
|
|
|
|
|
|
|
|
|
|
|
|
|
|
|
|
|
|
|
|
|
|
|
|
|
| Mortgage |
|
|
|
|
|
|
|
|
|
|
|
|
|
|
|
|
|
|
|
|
|
|
|
|
|
|
|
|
|
|
|
|
|
|
|
|
|
|
|
|
|
|
| Backed Bond |
|
|
|
|
|
|
|
|
|
|
|
|
|
|
|
|
|
|
|
|
|
|
|
|
|
|
|
|
|
|
|
|
|
|
|
|
|
|
|
|
|
|
| ETF |
|
|
|
|
402,831 |
|
|
|
10,610,568 |
|
|
|
39,065,014 |
|
|
|
36,007,770 |
|
|
|
(511,437 |
) |
|
|
18,609 |
|
|
|
263,724 |
|
|
|
— |
|
|
|
520,339 |
|
|
|
13,174,984 |
|
| |
|
|
|
|
402,831 |
|
|
|
10,610,568 |
|
|
|
39,065,014 |
|
|
|
36,007,770 |
|
|
|
(511,437 |
) |
|
|
18,609 |
|
|
|
263,724 |
|
|
|
— |
|
|
|
520,339 |
|
|
|
13,174,984 |
|
For more information on the determination,
please refer to Note 6.
See notes to financial
statements.
122
Schedules of Investments —
IQ S&P High Yield Low Volatility Bond ETF
April
30, 2018
|
|
|
|
Principal
Amount
|
|
Value
|
|
|
|
|
|
|
|
|
|
|
|
Long-Term Bonds 97.3%
|
|
|
|
|
|
|
|
|
|
|
Corporate Bonds — 87.1%
|
|
|
|
|
|
|
|
|
|
|
| |
Consumer Discretionary — 10.0%
|
|
|
|
|
|
|
|
|
|
|
Allison Transmission, Inc.
|
|
|
|
|
|
|
|
|
|
|
5.000%, due 10/1/24‡ |
|
|
|
$ |
325,000 |
|
|
$ |
319,312 |
|
Boyd Gaming Corp.
|
|
|
|
|
|
|
|
|
|
|
6.375%, due 4/1/26 |
|
|
|
|
230,000 |
|
|
|
240,637 |
|
Dana, Inc.
|
|
|
|
|
|
|
|
|
|
|
5.500%, due 12/15/24 |
|
|
|
|
120,000 |
|
|
|
121,800 |
|
ESH Hospitality, Inc.
|
|
|
|
|
|
|
|
|
|
|
5.250%, due 5/1/25‡ |
|
|
|
|
365,000 |
|
|
|
355,875 |
|
Goodyear Tire & Rubber Co. (The)
|
|
|
|
|
|
|
|
|
|
|
4.875%, due 3/15/27 |
|
|
|
|
190,000 |
|
|
|
177,650 |
|
5.000%, due 5/31/26 |
|
|
|
|
250,000 |
|
|
|
238,125 |
|
5.125%, due 11/15/23 |
|
|
|
|
295,000 |
|
|
|
293,525 |
|
Hanesbrands, Inc.
|
|
|
|
|
|
|
|
|
|
|
4.625%, due 5/15/24‡ |
|
|
|
|
290,000 |
|
|
|
280,575 |
|
4.875%, due 5/15/26‡ |
|
|
|
|
255,000 |
|
|
|
245,437 |
|
Hilton Domestic Operating Co., Inc.
|
|
|
|
|
|
|
|
|
|
|
4.250%, due 9/1/24 |
|
|
|
|
300,000 |
|
|
|
286,500 |
|
5.125%, due 5/1/26‡ |
|
|
|
|
425,000 |
|
|
|
424,469 |
|
Hilton Worldwide Finance LLC / Hilton Worldwide Finance Corp.
|
|
|
|
|
|
|
|
|
|
|
4.625%, due 4/1/25 |
|
|
|
|
250,000 |
|
|
|
241,875 |
|
4.875%, due 4/1/27 |
|
|
|
|
150,000 |
|
|
|
144,750 |
|
International Game Technology PLC
|
|
|
|
|
|
|
|
|
|
|
6.250%, due 2/15/22‡ |
|
|
|
|
700,000 |
|
|
|
733,250 |
|
6.500%, due 2/15/25‡ |
|
|
|
|
220,000 |
|
|
|
234,850 |
|
KFC Holding Co./Pizza Hut Holdings LLC/Taco Bell of America LLC
|
|
|
|
|
|
|
|
|
|
|
4.750%, due 6/1/27‡ |
|
|
|
|
225,000 |
|
|
|
216,000 |
|
5.000%, due 6/1/24‡ |
|
|
|
|
340,000 |
|
|
|
338,725 |
|
5.250%, due 6/1/26‡ |
|
|
|
|
275,000 |
|
|
|
276,375 |
|
L
Brands, Inc.
|
|
|
|
|
|
|
|
|
|
|
5.625%, due 2/15/22 |
|
|
|
|
350,000 |
|
|
|
363,125 |
|
5.625%, due 10/15/23 |
|
|
|
|
100,000 |
|
|
|
103,750 |
|
6.625%, due 4/1/21 |
|
|
|
|
210,000 |
|
|
|
222,600 |
|
MGM Growth Properties Operating Partnership LP / MGP Finance Co-Issuer, Inc.
|
|
|
|
|
|
|
|
|
|
|
4.500%, due 9/1/26 |
|
|
|
|
130,000 |
|
|
|
122,687 |
|
5.625%, due 5/1/24 |
|
|
|
|
315,000 |
|
|
|
321,300 |
|
MGM Resorts International
|
|
|
|
|
|
|
|
|
|
|
4.625%, due 9/1/26 |
|
|
|
|
95,000 |
|
|
|
89,894 |
|
5.250%, due 3/31/20 |
|
|
|
|
150,000 |
|
|
|
153,750 |
|
6.000%, due 3/15/23 |
|
|
|
|
575,000 |
|
|
|
599,437 |
|
6.625%, due 12/15/21 |
|
|
|
|
350,000 |
|
|
|
373,625 |
|
6.750%, due 10/1/20 |
|
|
|
|
325,000 |
|
|
|
344,500 |
|
7.750%, due 3/15/22 |
|
|
|
|
150,000 |
|
|
|
166,312 |
|
Navistar International Corp.
|
|
|
|
|
|
|
|
|
|
|
6.625%, due 11/1/25‡ |
|
|
|
|
325,000 |
|
|
|
337,188 |
|
Penske Automotive Group, Inc.
|
|
|
|
|
|
|
|
|
|
|
5.750%, due 10/1/22 |
|
|
|
|
175,000 |
|
|
|
179,594 |
|
QVC, Inc.
|
|
|
|
|
|
|
|
|
|
|
4.375%, due 3/15/23 |
|
|
|
|
140,000 |
|
|
|
139,455 |
|
4.450%, due 2/15/25 |
|
|
|
|
115,000 |
|
|
|
112,169 |
|
4.850%, due 4/1/24 |
|
|
|
|
225,000 |
|
|
|
226,556 |
|
5.125%, due 7/2/22 |
|
|
|
|
80,000 |
|
|
|
82,139 |
|
Scientific Games International, Inc.
|
|
|
|
|
|
|
|
|
|
|
5.000%, due 10/15/25‡ |
|
|
|
|
350,000 |
|
|
|
338,188 |
|
Six Flags Entertainment Corp.
|
|
|
|
|
|
|
|
|
|
|
4.875%, due 7/31/24‡ |
|
|
|
|
300,000 |
|
|
|
292,500 |
|
5.500%, due 4/15/27‡ |
|
|
|
|
150,000 |
|
|
|
148,875 |
|
|
|
|
|
|
|
|
|
|
|
|
|
|
|
|
Shares
|
|
Value
|
Corporate Bonds (continued)
|
|
|
|
|
|
|
|
|
|
|
| |
Consumer Discretionary (continued)
|
|
|
|
|
|
|
|
|
|
|
Wynn Las Vegas LLC / Wynn Las Vegas Capital Corp.
|
|
|
|
|
|
|
|
|
|
|
4.250%, due 5/30/23‡ |
|
|
|
$ |
115,000 |
|
|
$ |
110,688 |
|
5.250%, due 5/15/27‡ |
|
|
|
|
225,000 |
|
|
|
216,844 |
|
5.500%, due 3/1/25‡ |
|
|
|
|
540,000 |
|
|
|
537,300 |
|
|
|
|
|
|
|
|
|
|
10,752,206 |
|
| |
Consumer Staples — 1.2%
|
|
|
|
|
|
|
|
|
|
|
B&G Foods, Inc.
|
|
|
|
|
|
|
|
|
|
|
4.625%, due 6/1/21 |
|
|
|
|
200,000 |
|
|
|
197,500 |
|
First Quality Finance Co., Inc.
|
|
|
|
|
|
|
|
|
|
|
4.625%, due 5/15/21‡ |
|
|
|
|
175,000 |
|
|
|
172,812 |
|
Lamb Weston Holdings, Inc.
|
|
|
|
|
|
|
|
|
|
|
4.625%, due 11/1/24‡ |
|
|
|
|
250,000 |
|
|
|
247,813 |
|
4.875%, due 11/1/26‡ |
|
|
|
|
215,000 |
|
|
|
212,850 |
|
Spectrum Brands, Inc.
|
|
|
|
|
|
|
|
|
|
|
5.750%, due 7/15/25 |
|
|
|
|
280,000 |
|
|
|
278,950 |
|
Tempur Sealy International, Inc.
|
|
|
|
|
|
|
|
|
|
|
5.625%, due 10/15/23 |
|
|
|
|
115,000 |
|
|
|
115,575 |
|
|
|
|
|
|
|
|
|
|
1,225,500 |
|
| |
Energy — 11.6%
|
|
|
|
|
|
|
|
|
|
|
Antero Midstream Partners LP / Antero Midstream Finance Corp.
|
|
|
|
|
|
|
|
|
|
|
5.375%, due 9/15/24 |
|
|
|
|
175,000 |
|
|
|
174,562 |
|
Antero Resources Corp.
|
|
|
|
|
|
|
|
|
|
|
5.000%, due 3/1/25 |
|
|
|
|
175,000 |
|
|
|
175,219 |
|
5.125%, due 12/1/22 |
|
|
|
|
300,000 |
|
|
|
302,250 |
|
5.375%, due 11/1/21 |
|
|
|
|
275,000 |
|
|
|
278,437 |
|
5.625%, due 6/1/23 |
|
|
|
|
200,000 |
|
|
|
204,250 |
|
Cheniere Corpus Christi Holdings LLC
|
|
|
|
|
|
|
|
|
|
|
5.125%, due 6/30/27 |
|
|
|
|
425,000 |
|
|
|
413,312 |
|
5.875%, due 3/31/25 |
|
|
|
|
490,000 |
|
|
|
503,475 |
|
7.000%, due 6/30/24 |
|
|
|
|
330,000 |
|
|
|
360,525 |
|
Cheniere Energy Partners LP
|
|
|
|
|
|
|
|
|
|
|
5.250%, due 10/1/25‡ |
|
|
|
|
425,000 |
|
|
|
414,375 |
|
Continental Resources, Inc.
|
|
|
|
|
|
|
|
|
|
|
3.800%, due 6/1/24 |
|
|
|
|
300,000 |
|
|
|
291,000 |
|
4.375%, due 1/15/28‡ |
|
|
|
|
350,000 |
|
|
|
344,750 |
|
4.500%, due 4/15/23 |
|
|
|
|
350,000 |
|
|
|
354,375 |
|
4.900%, due 6/1/44 |
|
|
|
|
200,000 |
|
|
|
195,000 |
|
5.000%, due 9/15/22 |
|
|
|
|
600,000 |
|
|
|
609,000 |
|
Endeavor Energy Resources LP / EER Finance, Inc.
|
|
|
|
|
|
|
|
|
|
|
5.500%, due 1/30/26‡ |
|
|
|
|
300,000 |
|
|
|
300,750 |
|
Energy Transfer Equity LP
|
|
|
|
|
|
|
|
|
|
|
4.250%, due 3/15/23 |
|
|
|
|
350,000 |
|
|
|
338,625 |
|
5.500%, due 6/1/27 |
|
|
|
|
275,000 |
|
|
|
273,625 |
|
5.875%, due 1/15/24 |
|
|
|
|
340,000 |
|
|
|
346,800 |
|
7.500%, due 10/15/20 |
|
|
|
|
320,000 |
|
|
|
342,400 |
|
Hess Infrastructure Partners LP / Hess Infrastructure Partners Finance Corp.
|
|
|
|
|
|
|
|
|
|
|
5.625%, due 2/15/26‡ |
|
|
|
|
225,000 |
|
|
|
227,250 |
|
Hilcorp Energy I LP / Hilcorp Finance Co.
|
|
|
|
|
|
|
|
|
|
|
5.000%, due 12/1/24‡ |
|
|
|
|
150,000 |
|
|
|
146,250 |
|
Ladder Capital Finance Holdings LLLP / Ladder Capital Finance Corp.
|
|
|
|
|
|
|
|
|
|
|
5.250%, due 3/15/22‡ |
|
|
|
|
125,000 |
|
|
|
125,312 |
|
See notes to financial
statements.
123
Schedules of Investments —
IQ S&P High Yield Low Volatility Bond ETF (continued)
April 30, 2018
|
|
|
|
Principal
Amount
|
|
Value
|
|
|
|
|
|
|
|
|
|
|
|
Corporate Bonds (continued)
|
|
|
|
|
|
|
|
|
|
|
| |
Energy (continued)
|
|
|
|
|
|
|
|
|
|
|
Murphy Oil Corp.
|
|
|
|
|
|
|
|
|
|
|
6.875%, due 8/15/24 |
|
|
|
$ |
325,000 |
|
|
$ |
344,094 |
|
Newfield Exploration Co.
|
|
|
|
|
|
|
|
|
|
|
5.375%, due 1/1/26 |
|
|
|
|
175,000 |
|
|
|
181,125 |
|
5.625%, due 7/1/24 |
|
|
|
|
365,000 |
|
|
|
386,900 |
|
NGPL PipeCo LLC
|
|
|
|
|
|
|
|
|
|
|
4.375%, due 8/15/22‡ |
|
|
|
|
200,000 |
|
|
|
200,000 |
|
4.875%, due 8/15/27‡ |
|
|
|
|
175,000 |
|
|
|
169,750 |
|
Parsley Energy LLC / Parsley Finance Corp.
|
|
|
|
|
|
|
|
|
|
|
5.250%, due 8/15/25‡ |
|
|
|
|
120,000 |
|
|
|
120,000 |
|
5.375%, due 1/15/25‡ |
|
|
|
|
185,000 |
|
|
|
185,462 |
|
5.625%, due 10/15/27‡ |
|
|
|
|
200,000 |
|
|
|
202,500 |
|
PDC Energy, Inc.
|
|
|
|
|
|
|
|
|
|
|
5.750%, due 5/15/26‡ |
|
|
|
|
175,000 |
|
|
|
176,312 |
|
Radian Group, Inc.
|
|
|
|
|
|
|
|
|
|
|
4.500%, due 10/1/24 |
|
|
|
|
125,000 |
|
|
|
120,000 |
|
Range Resources Corp.
|
|
|
|
|
|
|
|
|
|
|
5.750%, due 6/1/21 |
|
|
|
|
150,000 |
|
|
|
153,375 |
|
RSP Permian, Inc.
|
|
|
|
|
|
|
|
|
|
|
5.250%, due 1/15/25 |
|
|
|
|
125,000 |
|
|
|
128,750 |
|
Sable Permian Resources Land LLC / AEPB Finance Corp.
|
|
|
|
|
|
|
|
|
|
|
13.000%, due 11/30/20‡ |
|
|
|
|
150,000 |
|
|
|
170,625 |
|
Springleaf Finance Corp.
|
|
|
|
|
|
|
|
|
|
|
7.750%, due 10/1/21 |
|
|
|
|
200,000 |
|
|
|
217,750 |
|
8.250%, due 12/15/20 |
|
|
|
|
275,000 |
|
|
|
302,844 |
|
Sunoco LP / Sunoco Finance Corp.
|
|
|
|
|
|
|
|
|
|
|
4.875%, due 1/15/23‡ |
|
|
|
|
300,000 |
|
|
|
294,000 |
|
Tallgrass Energy Partners LP / Tallgrass Energy Finance Corp.
|
|
|
|
|
|
|
|
|
|
|
5.500%, due 9/15/24‡ |
|
|
|
|
200,000 |
|
|
|
202,500 |
|
5.500%, due 1/15/28‡ |
|
|
|
|
250,000 |
|
|
|
249,375 |
|
Targa Resources Partners LP / Targa Resources Partners Finance Corp.
|
|
|
|
|
|
|
|
|
|
|
4.125%, due 11/15/19 |
|
|
|
|
425,000 |
|
|
|
426,063 |
|
5.375%, due 2/1/27 |
|
|
|
|
150,000 |
|
|
|
143,625 |
|
6.750%, due 3/15/24 |
|
|
|
|
125,000 |
|
|
|
130,938 |
|
Whiting Petroleum Corp.
|
|
|
|
|
|
|
|
|
|
|
5.750%, due 3/15/21 |
|
|
|
|
250,000 |
|
|
|
255,938 |
|
Williams Cos., Inc. (The)
|
|
|
|
|
|
|
|
|
|
|
4.550%, due 6/24/24 |
|
|
|
|
345,000 |
|
|
|
343,706 |
|
5.750%, due 6/24/44 |
|
|
|
|
205,000 |
|
|
|
213,713 |
|
WPX Energy, Inc.
|
|
|
|
|
|
|
|
|
|
|
5.250%, due 9/15/24 |
|
|
|
|
175,000 |
|
|
|
176,313 |
|
8.250%, due 8/1/23 |
|
|
|
|
150,000 |
|
|
|
170,250 |
|
|
|
|
|
|
|
|
|
|
12,387,450 |
|
Financials — 5.0%
|
|
|
|
|
|
|
|
|
|
|
Aircastle Ltd.
|
|
|
|
|
|
|
|
|
|
|
4.125%, due 5/1/24 |
|
|
|
|
225,000 |
|
|
|
220,219 |
|
5.000%, due 4/1/23 |
|
|
|
|
80,000 |
|
|
|
82,100 |
|
5.125%, due 3/15/21 |
|
|
|
|
160,000 |
|
|
|
163,600 |
|
5.500%, due 2/15/22 |
|
|
|
|
80,000 |
|
|
|
83,100 |
|
Ally Financial, Inc.
|
|
|
|
|
|
|
|
|
|
|
3.500%, due 1/27/19 |
|
|
|
|
225,000 |
|
|
|
225,281 |
|
3.750%, due 11/18/19 |
|
|
|
|
300,000 |
|
|
|
300,375 |
|
4.125%, due 3/30/20 |
|
|
|
|
200,000 |
|
|
|
201,000 |
|
4.125%, due 2/13/22 |
|
|
|
|
30,000 |
|
|
|
29,850 |
|
4.250%, due 4/15/21 |
|
|
|
|
175,000 |
|
|
|
175,875 |
|
4.625%, due 3/30/25 |
|
|
|
|
255,000 |
|
|
|
253,087 |
|
5.125%, due 9/30/24 |
|
|
|
|
250,000 |
|
|
|
256,875 |
|
8.000%, due 11/1/31 |
|
|
|
|
550,000 |
|
|
|
668,250 |
|
|
|
|
|
|
|
|
|
|
|
|
|
|
|
|
Shares
|
|
Value
|
Corporate Bonds (continued)
|
|
|
|
|
|
|
|
|
|
|
| |
Financials (continued)
|
|
|
|
|
|
|
|
|
|
|
CIT Group, Inc.
|
|
|
|
|
|
|
|
|
|
|
3.875%, due 2/19/19 |
|
|
|
$ |
145,000 |
|
|
$ |
145,544 |
|
5.000%, due 8/15/22 |
|
|
|
|
271,000 |
|
|
|
277,098 |
|
5.000%, due 8/1/23 |
|
|
|
|
225,000 |
|
|
|
229,500 |
|
5.250%, due 3/7/25 |
|
|
|
|
200,000 |
|
|
|
204,250 |
|
MSCI, Inc.
|
|
|
|
|
|
|
|
|
|
|
4.750%, due 8/1/26‡ |
|
|
|
|
225,000 |
|
|
|
222,469 |
|
5.250%, due 11/15/24‡ |
|
|
|
|
180,000 |
|
|
|
184,050 |
|
5.750%, due 8/15/25‡ |
|
|
|
|
200,000 |
|
|
|
208,500 |
|
Navient Corp.
|
|
|
|
|
|
|
|
|
|
|
5.000%, due 10/26/20 |
|
|
|
|
125,000 |
|
|
|
125,781 |
|
5.875%, due 3/25/21 |
|
|
|
|
175,000 |
|
|
|
179,375 |
|
Series MTN, 4.875%, due 6/17/19 |
|
|
|
|
320,000 |
|
|
|
322,800 |
|
Series MTN, 8.000%, due 3/25/20 |
|
|
|
|
425,000 |
|
|
|
452,625 |
|
Springleaf Finance Corp.
|
|
|
|
|
|
|
|
|
|
|
5.250%, due 12/15/19 |
|
|
|
|
175,000 |
|
|
|
179,156 |
|
|
|
|
|
|
|
|
|
|
5,390,760 |
|
| |
Health Care — 10.9%
|
|
|
|
|
|
|
|
|
|
|
Acadia Healthcare Co., Inc.
|
|
|
|
|
|
|
|
|
|
|
5.625%, due 2/15/23 |
|
|
|
|
175,000 |
|
|
|
176,312 |
|
Centene Corp.
|
|
|
|
|
|
|
|
|
|
|
4.750%, due 5/15/22 |
|
|
|
|
335,000 |
|
|
|
340,025 |
|
4.750%, due 1/15/25 |
|
|
|
|
380,000 |
|
|
|
369,550 |
|
5.625%, due 2/15/21 |
|
|
|
|
400,000 |
|
|
|
410,000 |
|
6.125%, due 2/15/24 |
|
|
|
|
155,000 |
|
|
|
162,362 |
|
DaVita, Inc.
|
|
|
|
|
|
|
|
|
|
|
5.125%, due 7/15/24 |
|
|
|
|
495,000 |
|
|
|
477,675 |
|
5.750%, due 8/15/22 |
|
|
|
|
350,000 |
|
|
|
357,437 |
|
Encompass Health Corp.
|
|
|
|
|
|
|
|
|
|
|
5.750%, due 11/1/24 |
|
|
|
|
320,000 |
|
|
|
324,800 |
|
Envision Healthcare Corp.
|
|
|
|
|
|
|
|
|
|
|
5.125%, due 7/1/22‡ |
|
|
|
|
200,000 |
|
|
|
197,500 |
|
5.625%, due 7/15/22 |
|
|
|
|
290,000 |
|
|
|
290,725 |
|
6.250%, due 12/1/24‡ |
|
|
|
|
150,000 |
|
|
|
155,625 |
|
HCA Healthcare, Inc.
|
|
|
|
|
|
|
|
|
|
|
6.250%, due 2/15/21 |
|
|
|
|
110,000 |
|
|
|
115,637 |
|
HCA, Inc.
|
|
|
|
|
|
|
|
|
|
|
3.750%, due 3/15/19 |
|
|
|
|
50,000 |
|
|
|
50,125 |
|
4.250%, due 10/15/19 |
|
|
|
|
35,000 |
|
|
|
35,262 |
|
4.500%, due 2/15/27 |
|
|
|
|
215,000 |
|
|
|
205,862 |
|
4.750%, due 5/1/23 |
|
|
|
|
195,000 |
|
|
|
197,194 |
|
5.000%, due 3/15/24 |
|
|
|
|
300,000 |
|
|
|
303,375 |
|
5.250%, due 4/15/25 |
|
|
|
|
105,000 |
|
|
|
106,312 |
|
5.250%, due 6/15/26 |
|
|
|
|
125,000 |
|
|
|
125,469 |
|
5.375%, due 2/1/25 |
|
|
|
|
380,000 |
|
|
|
379,050 |
|
5.500%, due 6/15/47 |
|
|
|
|
175,000 |
|
|
|
165,375 |
|
5.875%, due 3/15/22 |
|
|
|
|
125,000 |
|
|
|
131,719 |
|
5.875%, due 5/1/23 |
|
|
|
|
125,000 |
|
|
|
130,312 |
|
5.875%, due 2/15/26 |
|
|
|
|
225,000 |
|
|
|
228,094 |
|
6.500%, due 2/15/20 |
|
|
|
|
480,000 |
|
|
|
502,200 |
|
7.500%, due 2/15/22 |
|
|
|
|
495,000 |
|
|
|
544,500 |
|
Hologic, Inc.
|
|
|
|
|
|
|
|
|
|
|
4.375%, due 10/15/25‡ |
|
|
|
|
275,000 |
|
|
|
264,687 |
|
IQVIA, Inc.
|
|
|
|
|
|
|
|
|
|
|
4.875%, due 5/15/23‡ |
|
|
|
|
225,000 |
|
|
|
227,813 |
|
5.000%, due 10/15/26‡ |
|
|
|
|
280,000 |
|
|
|
276,500 |
|
Kindred Healthcare, Inc.
|
|
|
|
|
|
|
|
|
|
|
8.000%, due 1/15/20 |
|
|
|
|
210,000 |
|
|
|
224,963 |
|
LifePoint Health, Inc.
|
|
|
|
|
|
|
|
|
|
|
5.500%, due 12/1/21 |
|
|
|
|
300,000 |
|
|
|
300,750 |
|
See notes to financial
statements.
124
Schedules of Investments —
IQ S&P High Yield Low Volatility Bond ETF (continued)
April 30, 2018
|
|
|
|
Principal
Amount
|
|
Value
|
|
|
|
|
|
|
|
|
|
|
|
Corporate Bonds (continued)
|
|
|
|
|
|
|
|
|
|
|
| |
Health Care (continued)
|
|
|
|
|
|
|
|
|
|
|
Service Corp. International
|
|
|
|
|
|
|
|
|
|
|
4.625%, due 12/15/27 |
|
|
|
$ |
150,000 |
|
|
$ |
146,813 |
|
5.375%, due 5/15/24 |
|
|
|
|
205,000 |
|
|
|
209,869 |
|
Teleflex, Inc.
|
|
|
|
|
|
|
|
|
|
|
4.625%, due 11/15/27 |
|
|
|
|
200,000 |
|
|
|
192,000 |
|
Tenet Healthcare Corp.
|
|
|
|
|
|
|
|
|
|
|
4.375%, due 10/1/21 |
|
|
|
|
285,000 |
|
|
|
281,438 |
|
4.500%, due 4/1/21 |
|
|
|
|
375,000 |
|
|
|
372,656 |
|
4.625%, due 7/15/24‡ |
|
|
|
|
550,000 |
|
|
|
532,125 |
|
4.750%, due 6/1/20 |
|
|
|
|
75,000 |
|
|
|
75,563 |
|
5.125%, due 5/1/25‡ |
|
|
|
|
400,000 |
|
|
|
388,000 |
|
6.000%, due 10/1/20 |
|
|
|
|
400,000 |
|
|
|
413,000 |
|
Valeant Pharmaceuticals International, Inc.
|
|
|
|
|
|
|
|
|
|
|
5.500%, due 11/1/25‡ |
|
|
|
|
525,000 |
|
|
|
521,063 |
|
6.500%, due 3/15/22‡ |
|
|
|
|
400,000 |
|
|
|
415,000 |
|
WellCare Health Plans, Inc.
|
|
|
|
|
|
|
|
|
|
|
5.250%, due 4/1/25 |
|
|
|
|
375,000 |
|
|
|
377,813 |
|
|
|
|
|
|
|
|
|
|
11,702,550 |
|
| |
Industrials — 9.4%
|
|
|
|
|
|
|
|
|
|
|
ADT Corp. (The)
|
|
|
|
|
|
|
|
|
|
|
3.500%, due 7/15/22 |
|
|
|
|
245,000 |
|
|
|
229,075 |
|
4.125%, due 6/15/23 |
|
|
|
|
260,000 |
|
|
|
243,750 |
|
6.250%, due 10/15/21 |
|
|
|
|
205,000 |
|
|
|
214,481 |
|
AECOM
|
|
|
|
|
|
|
|
|
|
|
5.125%, due 3/15/27 |
|
|
|
|
300,000 |
|
|
|
288,375 |
|
5.875%, due 10/15/24 |
|
|
|
|
200,000 |
|
|
|
208,250 |
|
Aramark Services, Inc.
|
|
|
|
|
|
|
|
|
|
|
4.750%, due 6/1/26 |
|
|
|
|
165,000 |
|
|
|
160,050 |
|
5.000%, due 4/1/25‡ |
|
|
|
|
200,000 |
|
|
|
201,250 |
|
5.000%, due 2/1/28‡ |
|
|
|
|
300,000 |
|
|
|
292,500 |
|
5.125%, due 1/15/24 |
|
|
|
|
305,000 |
|
|
|
310,337 |
|
Beacon Roofing Supply, Inc.
|
|
|
|
|
|
|
|
|
|
|
4.875%, due 11/1/25‡ |
|
|
|
|
350,000 |
|
|
|
330,750 |
|
Griffon Corp.
|
|
|
|
|
|
|
|
|
|
|
5.250%, due 3/1/22 |
|
|
|
|
300,000 |
|
|
|
298,875 |
|
HD
Supply, Inc.
|
|
|
|
|
|
|
|
|
|
|
5.750%, due 4/15/24‡ |
|
|
|
|
255,000 |
|
|
|
267,750 |
|
Iron Mountain, Inc.
|
|
|
|
|
|
|
|
|
|
|
4.375%, due 6/1/21‡ |
|
|
|
|
155,000 |
|
|
|
154,806 |
|
4.875%, due 9/15/27‡ |
|
|
|
|
325,000 |
|
|
|
305,906 |
|
6.000%, due 8/15/23 |
|
|
|
|
85,000 |
|
|
|
87,550 |
|
KB
Home
|
|
|
|
|
|
|
|
|
|
|
7.000%, due 12/15/21 |
|
|
|
|
150,000 |
|
|
|
159,375 |
|
KLX, Inc.
|
|
|
|
|
|
|
|
|
|
|
5.875%, due 12/1/22‡ |
|
|
|
|
350,000 |
|
|
|
365,313 |
|
Lennar Corp.
|
|
|
|
|
|
|
|
|
|
|
4.125%, due 1/15/22 |
|
|
|
|
105,000 |
|
|
|
103,950 |
|
4.500%, due 6/15/19 |
|
|
|
|
175,000 |
|
|
|
176,750 |
|
4.500%, due 11/15/19 |
|
|
|
|
125,000 |
|
|
|
126,094 |
|
4.500%, due 4/30/24 |
|
|
|
|
75,000 |
|
|
|
73,125 |
|
4.750%, due 4/1/21 |
|
|
|
|
180,000 |
|
|
|
182,475 |
|
4.750%, due 11/15/22 |
|
|
|
|
125,000 |
|
|
|
125,625 |
|
4.750%, due 5/30/25 |
|
|
|
|
290,000 |
|
|
|
282,025 |
|
4.750%, due 11/29/27‡ |
|
|
|
|
225,000 |
|
|
|
212,063 |
|
5.875%, due 11/15/24‡ |
|
|
|
|
125,000 |
|
|
|
129,063 |
|
PulteGroup, Inc.
|
|
|
|
|
|
|
|
|
|
|
4.250%, due 3/1/21 |
|
|
|
|
180,000 |
|
|
|
180,450 |
|
5.000%, due 1/15/27 |
|
|
|
|
150,000 |
|
|
|
145,875 |
|
5.500%, due 3/1/26 |
|
|
|
|
200,000 |
|
|
|
203,750 |
|
|
|
|
|
|
|
|
|
|
|
|
|
|
|
|
Shares
|
|
Value
|
Corporate Bonds (continued)
|
|
|
|
|
|
|
|
|
|
|
| |
Industrials (continued)
|
|
|
|
|
|
|
|
|
|
|
Sabre GLBL, Inc.
|
|
|
|
|
|
|
|
|
|
|
5.250%, due 11/15/23‡ |
|
|
|
$ |
75,000 |
|
|
$ |
75,844 |
|
5.375%, due 4/15/23‡ |
|
|
|
|
210,000 |
|
|
|
211,575 |
|
Standard Industries, Inc.
|
|
|
|
|
|
|
|
|
|
|
4.750%, due 1/15/28‡ |
|
|
|
|
275,000 |
|
|
|
255,750 |
|
5.000%, due 2/15/27‡ |
|
|
|
|
140,000 |
|
|
|
134,400 |
|
5.375%, due 11/15/24‡ |
|
|
|
|
455,000 |
|
|
|
458,412 |
|
5.500%, due 2/15/23‡ |
|
|
|
|
100,000 |
|
|
|
103,250 |
|
6.000%, due 10/15/25‡ |
|
|
|
|
279,000 |
|
|
|
289,462 |
|
Summit Materials LLC / Summit Materials Finance Corp.
|
|
|
|
|
|
|
|
|
|
|
6.125%, due 7/15/23 |
|
|
|
|
200,000 |
|
|
|
204,500 |
|
Toll Brothers Finance Corp.
|
|
|
|
|
|
|
|
|
|
|
4.875%, due 3/15/27 |
|
|
|
|
100,000 |
|
|
|
97,250 |
|
TransDigm, Inc.
|
|
|
|
|
|
|
|
|
|
|
6.000%, due 7/15/22 |
|
|
|
|
325,000 |
|
|
|
329,469 |
|
TRI Pointe Group, Inc. / TRI Pointe Homes, Inc.
|
|
|
|
|
|
|
|
|
|
|
4.375%, due 6/15/19 |
|
|
|
|
130,000 |
|
|
|
130,325 |
|
United Rentals North America, Inc.
|
|
|
|
|
|
|
|
|
|
|
4.625%, due 10/15/25 |
|
|
|
|
225,000 |
|
|
|
218,531 |
|
4.875%, due 1/15/28 |
|
|
|
|
475,000 |
|
|
|
448,875 |
|
5.500%, due 7/15/25 |
|
|
|
|
275,000 |
|
|
|
281,875 |
|
5.500%, due 5/15/27 |
|
|
|
|
340,000 |
|
|
|
338,300 |
|
5.750%, due 11/15/24 |
|
|
|
|
190,000 |
|
|
|
196,650 |
|
5.875%, due 9/15/26 |
|
|
|
|
250,000 |
|
|
|
260,625 |
|
|
|
|
|
|
|
|
|
|
10,094,731 |
|
| |
Information Technology — 7.2%
|
|
|
|
|
|
|
|
|
|
|
CDK Global, Inc.
|
|
|
|
|
|
|
|
|
|
|
4.875%, due 6/1/27 |
|
|
|
|
175,000 |
|
|
|
169,312 |
|
5.000%, due 10/15/24 |
|
|
|
|
115,000 |
|
|
|
116,725 |
|
CDW LLC / CDW Finance Corp.
|
|
|
|
|
|
|
|
|
|
|
5.000%, due 9/1/23 |
|
|
|
|
200,000 |
|
|
|
204,000 |
|
5.000%, due 9/1/25 |
|
|
|
|
125,000 |
|
|
|
124,375 |
|
5.500%, due 12/1/24 |
|
|
|
|
160,000 |
|
|
|
165,600 |
|
CommScope Technologies LLC
|
|
|
|
|
|
|
|
|
|
|
5.000%, due 3/15/27‡ |
|
|
|
|
205,000 |
|
|
|
196,287 |
|
6.000%, due 6/15/25‡ |
|
|
|
|
510,000 |
|
|
|
525,300 |
|
CommScope, Inc.
|
|
|
|
|
|
|
|
|
|
|
5.000%, due 6/15/21‡ |
|
|
|
|
125,000 |
|
|
|
126,250 |
|
5.500%, due 6/15/24‡ |
|
|
|
|
180,000 |
|
|
|
183,600 |
|
Dell International LLC / EMC Corp.
|
|
|
|
|
|
|
|
|
|
|
5.875%, due 6/15/21‡ |
|
|
|
|
425,000 |
|
|
|
436,687 |
|
7.125%, due 6/15/24‡ |
|
|
|
|
455,000 |
|
|
|
484,575 |
|
EMC Corp.
|
|
|
|
|
|
|
|
|
|
|
2.650%, due 6/1/20 |
|
|
|
|
535,000 |
|
|
|
518,950 |
|
3.375%, due 6/1/23 |
|
|
|
|
305,000 |
|
|
|
283,650 |
|
First Data Corp.
|
|
|
|
|
|
|
|
|
|
|
5.000%, due 1/15/24‡ |
|
|
|
|
525,000 |
|
|
|
528,937 |
|
5.375%, due 8/15/23‡ |
|
|
|
|
435,000 |
|
|
|
441,525 |
|
5.750%, due 1/15/24‡ |
|
|
|
|
615,000 |
|
|
|
623,456 |
|
NCR Corp.
|
|
|
|
|
|
|
|
|
|
|
4.625%, due 2/15/21 |
|
|
|
|
175,000 |
|
|
|
174,563 |
|
5.000%, due 7/15/22 |
|
|
|
|
100,000 |
|
|
|
99,500 |
|
6.375%, due 12/15/23 |
|
|
|
|
255,000 |
|
|
|
263,925 |
|
Nuance Communications, Inc.
|
|
|
|
|
|
|
|
|
|
|
5.625%, due 12/15/26 |
|
|
|
|
130,000 |
|
|
|
129,025 |
|
Sensata Technologies BV
|
|
|
|
|
|
|
|
|
|
|
4.875%, due 10/15/23‡ |
|
|
|
|
150,000 |
|
|
|
151,313 |
|
See notes to financial
statements.
125
Schedules of Investments —
IQ S&P High Yield Low Volatility Bond ETF (continued)
April 30, 2018
|
|
|
|
Principal
Amount
|
|
Value
|
|
|
|
|
|
|
|
|
|
|
|
Corporate Bonds (continued)
|
|
|
|
|
|
|
|
|
|
|
| |
Information Technology (continued)
|
|
|
|
|
|
|
|
|
|
|
Sensata Technologies UK Financing Co. PLC
|
|
|
|
|
|
|
|
|
|
|
6.250%, due 2/15/26‡ |
|
|
|
$ |
265,000 |
|
|
$ |
276,263 |
|
Symantec Corp.
|
|
|
|
|
|
|
|
|
|
|
5.000%, due 4/15/25‡ |
|
|
|
|
300,000 |
|
|
|
300,178 |
|
VeriSign, Inc.
|
|
|
|
|
|
|
|
|
|
|
4.625%, due 5/1/23 |
|
|
|
|
260,000 |
|
|
|
261,950 |
|
4.750%, due 7/15/27 |
|
|
|
|
175,000 |
|
|
|
168,000 |
|
5.250%, due 4/1/25 |
|
|
|
|
120,000 |
|
|
|
123,150 |
|
Western Digital Corp.
|
|
|
|
|
|
|
|
|
|
|
4.750%, due 2/15/26 |
|
|
|
|
650,000 |
|
|
|
640,250 |
|
|
|
|
|
|
|
|
|
|
7,717,346 |
|
| |
Materials — 9.1%
|
|
|
|
|
|
|
|
|
|
|
Alcoa Nederland Holding BV
|
|
|
|
|
|
|
|
|
|
|
6.750%, due 9/30/24‡ |
|
|
|
|
230,000 |
|
|
|
246,387 |
|
7.000%, due 9/30/26‡ |
|
|
|
|
140,000 |
|
|
|
152,512 |
|
Arconic, Inc.
|
|
|
|
|
|
|
|
|
|
|
5.125%, due 10/1/24 |
|
|
|
|
395,000 |
|
|
|
400,925 |
|
5.400%, due 4/15/21 |
|
|
|
|
325,000 |
|
|
|
333,937 |
|
6.150%, due 8/15/20 |
|
|
|
|
275,000 |
|
|
|
288,750 |
|
Ashland LLC
|
|
|
|
|
|
|
|
|
|
|
4.750%, due 8/15/22 |
|
|
|
|
305,000 |
|
|
|
308,050 |
|
Ball Corp.
|
|
|
|
|
|
|
|
|
|
|
4.000%, due 11/15/23 |
|
|
|
|
270,000 |
|
|
|
264,600 |
|
4.375%, due 12/15/20 |
|
|
|
|
315,000 |
|
|
|
320,906 |
|
4.875%, due 3/15/26 |
|
|
|
|
250,000 |
|
|
|
250,000 |
|
5.250%, due 7/1/25 |
|
|
|
|
270,000 |
|
|
|
278,100 |
|
Berry Global, Inc.
|
|
|
|
|
|
|
|
|
|
|
4.500%, due 2/15/26‡ |
|
|
|
|
125,000 |
|
|
|
119,375 |
|
5.125%, due 7/15/23 |
|
|
|
|
205,000 |
|
|
|
207,050 |
|
5.500%, due 5/15/22 |
|
|
|
|
125,000 |
|
|
|
128,125 |
|
Blue Cube Spinco, Inc.
|
|
|
|
|
|
|
|
|
|
|
9.750%, due 10/15/23 |
|
|
|
|
200,000 |
|
|
|
229,500 |
|
10.000%, due 10/15/25 |
|
|
|
|
150,000 |
|
|
|
175,500 |
|
BWAY Holding Co.
|
|
|
|
|
|
|
|
|
|
|
5.500%, due 4/15/24‡ |
|
|
|
|
425,000 |
|
|
|
427,656 |
|
CF
Industries, Inc.
|
|
|
|
|
|
|
|
|
|
|
3.450%, due 6/1/23 |
|
|
|
|
220,000 |
|
|
|
208,450 |
|
5.150%, due 3/15/34 |
|
|
|
|
185,000 |
|
|
|
169,044 |
|
Chemours Co. (The)
|
|
|
|
|
|
|
|
|
|
|
5.375%, due 5/15/27 |
|
|
|
|
150,000 |
|
|
|
148,500 |
|
6.625%, due 5/15/23 |
|
|
|
|
250,000 |
|
|
|
262,812 |
|
7.000%, due 5/15/25 |
|
|
|
|
220,000 |
|
|
|
237,600 |
|
Crown Americas LLC / Crown Americas Capital Corp. VI
|
|
|
|
|
|
|
|
|
|
|
4.750%, due 2/1/26‡ |
|
|
|
|
450,000 |
|
|
|
434,250 |
|
Freeport-McMoRan, Inc.
|
|
|
|
|
|
|
|
|
|
|
3.100%, due 3/15/20 |
|
|
|
|
275,000 |
|
|
|
270,875 |
|
3.550%, due 3/1/22 |
|
|
|
|
525,000 |
|
|
|
507,938 |
|
3.875%, due 3/15/23 |
|
|
|
|
500,000 |
|
|
|
479,375 |
|
4.000%, due 11/14/21 |
|
|
|
|
175,000 |
|
|
|
174,125 |
|
4.550%, due 11/14/24 |
|
|
|
|
325,000 |
|
|
|
313,219 |
|
6.875%, due 2/15/23 |
|
|
|
|
200,000 |
|
|
|
214,000 |
|
Olin Corp.
|
|
|
|
|
|
|
|
|
|
|
5.000%, due 2/1/30 |
|
|
|
|
175,000 |
|
|
|
166,688 |
|
5.125%, due 9/15/27 |
|
|
|
|
150,000 |
|
|
|
147,000 |
|
Owens-Brockway Glass Container, Inc.
|
|
|
|
|
|
|
|
|
|
|
5.000%, due 1/15/22‡ |
|
|
|
|
134,000 |
|
|
|
136,010 |
|
5.875%, due 8/15/23‡ |
|
|
|
|
215,000 |
|
|
|
220,644 |
|
|
|
|
|
|
|
|
|
|
|
|
|
|
|
|
Shares
|
|
Value
|
Corporate Bonds (continued)
|
|
|
|
|
|
|
|
|
|
|
| |
Materials (continued)
|
|
|
|
|
|
|
|
|
|
|
Peabody Energy Corp.
|
|
|
|
|
|
|
|
|
|
|
6.000%, due 3/31/22‡ |
|
|
|
$ |
150,000 |
|
|
$ |
154,125 |
|
6.375%, due 3/31/25‡ |
|
|
|
|
150,000 |
|
|
|
156,375 |
|
Reynolds Group Issuer, Inc. / Reynolds Group Issuer LLC / Reynolds Group Issuer Lu
|
|
|
|
|
|
|
|
|
|
|
5.125%, due 7/15/23‡ |
|
|
|
|
430,000 |
|
|
|
432,150 |
|
Sealed Air Corp.
|
|
|
|
|
|
|
|
|
|
|
4.875%, due 12/1/22‡ |
|
|
|
|
135,000 |
|
|
|
136,688 |
|
5.125%, due 12/1/24‡ |
|
|
|
|
160,000 |
|
|
|
163,200 |
|
Steel Dynamics, Inc.
|
|
|
|
|
|
|
|
|
|
|
5.125%, due 10/1/21 |
|
|
|
|
200,000 |
|
|
|
203,750 |
|
5.500%, due 10/1/24 |
|
|
|
|
65,000 |
|
|
|
67,275 |
|
WR
Grace & Co.-Conn.
|
|
|
|
|
|
|
|
|
|
|
5.125%, due 10/1/21‡ |
|
|
|
|
170,000 |
|
|
|
174,675 |
|
|
|
|
|
|
|
|
|
|
9,710,141 |
|
Media — 9.4%
|
|
|
|
|
|
|
|
|
|
|
Altice US Finance I Corp.
|
|
|
|
|
|
|
|
|
|
|
5.375%, due 7/15/23‡ |
|
|
|
|
300,000 |
|
|
|
301,500 |
|
5.500%, due 5/15/26‡ |
|
|
|
|
445,000 |
|
|
|
433,319 |
|
AMC Networks, Inc.
|
|
|
|
|
|
|
|
|
|
|
4.750%, due 8/1/25 |
|
|
|
|
200,000 |
|
|
|
190,000 |
|
5.000%, due 4/1/24 |
|
|
|
|
300,000 |
|
|
|
294,000 |
|
CCO Holdings LLC / CCO Holdings Capital Corp.
|
|
|
|
|
|
|
|
|
|
|
4.000%, due 3/1/23‡ |
|
|
|
|
150,000 |
|
|
|
144,750 |
|
5.000%, due 2/1/28‡ |
|
|
|
|
100,000 |
|
|
|
92,000 |
|
5.125%, due 2/15/23 |
|
|
|
|
400,000 |
|
|
|
401,500 |
|
5.125%, due 5/1/23‡ |
|
|
|
|
310,000 |
|
|
|
310,775 |
|
5.250%, due 9/30/22 |
|
|
|
|
300,000 |
|
|
|
304,500 |
|
5.375%, due 5/1/25‡ |
|
|
|
|
50,000 |
|
|
|
49,187 |
|
5.500%, due 5/1/26‡ |
|
|
|
|
300,000 |
|
|
|
291,000 |
|
5.750%, due 9/1/23 |
|
|
|
|
135,000 |
|
|
|
136,687 |
|
5.750%, due 1/15/24 |
|
|
|
|
75,000 |
|
|
|
75,562 |
|
5.750%, due 2/15/26‡ |
|
|
|
|
700,000 |
|
|
|
694,750 |
|
5.875%, due 4/1/24‡ |
|
|
|
|
300,000 |
|
|
|
304,500 |
|
5.875%, due 5/1/27‡ |
|
|
|
|
240,000 |
|
|
|
235,200 |
|
Cequel Communications Holdings I LLC / Cequel Capital Corp.
|
|
|
|
|
|
|
|
|
|
|
5.125%, due 12/15/21‡ |
|
|
|
|
250,000 |
|
|
|
250,000 |
|
Cinemark USA, Inc.
|
|
|
|
|
|
|
|
|
|
|
4.875%, due 6/1/23 |
|
|
|
|
200,000 |
|
|
|
198,000 |
|
CSC Holdings LLC
|
|
|
|
|
|
|
|
|
|
|
6.750%, due 11/15/21 |
|
|
|
|
330,000 |
|
|
|
346,912 |
|
Lamar Media Corp.
|
|
|
|
|
|
|
|
|
|
|
5.375%, due 1/15/24 |
|
|
|
|
160,000 |
|
|
|
163,600 |
|
Live Nation Entertainment, Inc.
|
|
|
|
|
|
|
|
|
|
|
4.875%, due 11/1/24‡ |
|
|
|
|
175,000 |
|
|
|
171,281 |
|
Netflix, Inc.
|
|
|
|
|
|
|
|
|
|
|
4.375%, due 11/15/26 |
|
|
|
|
340,000 |
|
|
|
317,050 |
|
4.875%, due 4/15/28‡ |
|
|
|
|
425,000 |
|
|
|
400,563 |
|
5.375%, due 2/1/21 |
|
|
|
|
150,000 |
|
|
|
154,500 |
|
5.500%, due 2/15/22 |
|
|
|
|
210,000 |
|
|
|
217,875 |
|
5.875%, due 2/15/25 |
|
|
|
|
250,000 |
|
|
|
256,875 |
|
Nielsen Co. Luxembourg SARL (The)
|
|
|
|
|
|
|
|
|
|
|
5.000%, due 2/1/25‡ |
|
|
|
|
170,000 |
|
|
|
167,238 |
|
5.500%, due 10/1/21‡ |
|
|
|
|
250,000 |
|
|
|
253,438 |
|
Outfront Media Capital LLC / Outfront Media Capital Corp.
|
|
|
|
|
|
|
|
|
|
|
5.250%, due 2/15/22 |
|
|
|
|
180,000 |
|
|
|
182,700 |
|
5.625%, due 2/15/24 |
|
|
|
|
135,000 |
|
|
|
136,350 |
|
5.875%, due 3/15/25 |
|
|
|
|
75,000 |
|
|
|
76,500 |
|
See notes to financial
statements.
126
Schedules
of Investments — IQ S&P High Yield Low Volatility Bond ETF (continued)
April
30, 2018
|
|
|
|
Principal
Amount
|
|
Value
|
|
|
|
|
|
|
|
|
|
|
|
Corporate Bonds (continued)
|
|
|
|
|
|
|
|
|
|
|
| |
Media (continued)
|
|
|
|
|
|
|
|
|
|
|
Sirius XM Radio, Inc.
|
|
|
|
|
|
|
|
|
|
|
3.875%, due 8/1/22‡ |
|
|
|
$ |
200,000 |
|
|
$ |
194,250 |
|
4.625%, due 5/15/23‡ |
|
|
|
|
110,000 |
|
|
|
108,488 |
|
5.000%, due 8/1/27‡ |
|
|
|
|
475,000 |
|
|
|
452,438 |
|
5.375%, due 4/15/25‡ |
|
|
|
|
375,000 |
|
|
|
373,125 |
|
5.375%, due 7/15/26‡ |
|
|
|
|
225,000 |
|
|
|
220,500 |
|
6.000%, due 7/15/24‡ |
|
|
|
|
510,000 |
|
|
|
524,663 |
|
TEGNA, Inc.
|
|
|
|
|
|
|
|
|
|
|
5.125%, due 7/15/20 |
|
|
|
|
175,000 |
|
|
|
177,187 |
|
6.375%, due 10/15/23 |
|
|
|
|
175,000 |
|
|
|
181,125 |
|
Tribune Media Co.
|
|
|
|
|
|
|
|
|
|
|
5.875%, due 7/15/22 |
|
|
|
|
300,000 |
|
|
|
304,875 |
|
|
|
|
|
|
|
|
|
|
10,088,763 |
|
| |
Real Estate — 1.0%
|
|
|
|
|
|
|
|
|
|
|
Howard Hughes Corp. (The)
|
|
|
|
|
|
|
|
|
|
|
5.375%, due 3/15/25‡ |
|
|
|
|
300,000 |
|
|
|
299,054 |
|
Realogy Group LLC / Realogy
Co-Issuer Corp.
|
|
|
|
|
|
|
|
|
|
|
4.500%, due 4/15/19‡ |
|
|
|
|
75,000 |
|
|
|
75,750 |
|
5.250%, due 12/1/21‡ |
|
|
|
|
160,000 |
|
|
|
162,400 |
|
Starwood Property Trust, Inc.
|
|
|
|
|
|
|
|
|
|
|
3.625%, due 2/1/21‡ |
|
|
|
|
125,000 |
|
|
|
122,969 |
|
4.750%, due 3/15/25‡ |
|
|
|
|
125,000 |
|
|
|
120,625 |
|
5.000%, due 12/15/21 |
|
|
|
|
225,000 |
|
|
|
227,812 |
|
|
|
|
|
|
|
|
|
|
1,008,610 |
|
| |
Telecommunication Services — 8.3%
|
|
|
|
|
|
|
|
|
|
|
CyrusOne LP / CyrusOne Finance Corp.
|
|
|
|
|
|
|
|
|
|
|
5.000%, due 3/15/24 |
|
|
|
|
300,000 |
|
|
|
300,750 |
|
5.375%, due 3/15/27 |
|
|
|
|
125,000 |
|
|
|
125,000 |
|
Equinix, Inc.
|
|
|
|
|
|
|
|
|
|
|
5.375%, due 1/1/22 |
|
|
|
|
250,000 |
|
|
|
258,125 |
|
5.375%, due 4/1/23 |
|
|
|
|
250,000 |
|
|
|
256,875 |
|
5.375%, due 5/15/27 |
|
|
|
|
415,000 |
|
|
|
422,262 |
|
5.750%, due 1/1/25 |
|
|
|
|
80,000 |
|
|
|
83,200 |
|
5.875%, due 1/15/26 |
|
|
|
|
265,000 |
|
|
|
274,937 |
|
Hughes Satellite Systems Corp.
|
|
|
|
|
|
|
|
|
|
|
5.250%, due 8/1/26 |
|
|
|
|
225,000 |
|
|
|
219,937 |
|
Level 3 Financing, Inc.
|
|
|
|
|
|
|
|
|
|
|
5.125%, due 5/1/23 |
|
|
|
|
210,000 |
|
|
|
207,900 |
|
5.375%, due 8/15/22 |
|
|
|
|
100,000 |
|
|
|
100,500 |
|
5.625%, due 2/1/23 |
|
|
|
|
300,000 |
|
|
|
304,125 |
|
SBA Communications Corp.
|
|
|
|
|
|
|
|
|
|
|
4.000%, due 10/1/22‡ |
|
|
|
|
250,000 |
|
|
|
238,125 |
|
4.875%, due 7/15/22 |
|
|
|
|
195,000 |
|
|
|
195,487 |
|
4.875%, due 9/1/24 |
|
|
|
|
285,000 |
|
|
|
273,600 |
|
Sprint Capital Corp.
|
|
|
|
|
|
|
|
|
|
|
6.900%, due 5/1/19 |
|
|
|
|
560,000 |
|
|
|
575,400 |
|
Sprint Communications, Inc.
|
|
|
|
|
|
|
|
|
|
|
7.000%, due 3/1/20‡ |
|
|
|
|
290,000 |
|
|
|
305,950 |
|
7.000%, due 8/15/20 |
|
|
|
|
400,000 |
|
|
|
422,000 |
|
T-Mobile USA, Inc.
|
|
|
|
|
|
|
|
|
|
|
4.000%, due 4/15/22 |
|
|
|
|
325,000 |
|
|
|
324,188 |
|
4.500%, due 2/1/26 |
|
|
|
|
250,000 |
|
|
|
240,625 |
|
4.750%, due 2/1/28 |
|
|
|
|
375,000 |
|
|
|
360,938 |
|
5.125%, due 4/15/25 |
|
|
|
|
100,000 |
|
|
|
100,500 |
|
5.375%, due 4/15/27 |
|
|
|
|
350,000 |
|
|
|
353,063 |
|
6.000%, due 3/1/23 |
|
|
|
|
300,000 |
|
|
|
311,250 |
|
6.000%, due 4/15/24 |
|
|
|
|
500,000 |
|
|
|
523,750 |
|
6.375%, due 3/1/25 |
|
|
|
|
290,000 |
|
|
|
303,050 |
|
|
|
|
|
|
|
|
|
|
|
|
|
|
|
|
Shares
|
|
Value
|
Corporate Bonds (continued)
|
|
|
|
|
|
|
|
|
|
|
| |
Telecommunication Services (continued)
|
|
|
|
|
|
|
|
|
|
|
T-Mobile USA, Inc. (continued)
|
|
|
|
|
|
|
|
|
|
|
6.500%, due 1/15/24 |
|
|
|
$ |
250,000 |
|
|
$ |
261,875 |
|
6.500%, due 1/15/26 |
|
|
|
|
375,000 |
|
|
|
398,438 |
|
Zayo Group LLC / Zayo Capital, Inc.
|
|
|
|
|
|
|
|
|
|
|
5.750%, due 1/15/27‡ |
|
|
|
|
475,000 |
|
|
|
470,250 |
|
6.000%, due 4/1/23 |
|
|
|
|
365,000 |
|
|
|
375,494 |
|
6.375%, due 5/15/25 |
|
|
|
|
295,000 |
|
|
|
305,325 |
|
|
|
|
|
|
|
|
|
|
8,892,919 |
|
| |
Transportation — 0.5%
|
|
|
|
|
|
|
|
|
|
|
American Airlines Group, Inc.
|
|
|
|
|
|
|
|
|
|
|
4.625%, due 3/1/20‡ |
|
|
|
|
200,000 |
|
|
|
201,241 |
|
5.500%, due 10/1/19‡ |
|
|
|
|
210,000 |
|
|
|
214,465 |
|
XPO Logistics, Inc.
|
|
|
|
|
|
|
|
|
|
|
6.125%, due 9/1/23‡ |
|
|
|
|
150,000 |
|
|
|
155,062 |
|
|
|
|
|
|
|
|
|
|
570,768 |
|
| |
Utilities — 3.5%
|
|
|
|
|
|
|
|
|
|
|
AES Corp.
|
|
|
|
|
|
|
|
|
|
|
4.500%, due 3/15/23 |
|
|
|
|
200,000 |
|
|
|
201,000 |
|
4.875%, due 5/15/23 |
|
|
|
|
265,000 |
|
|
|
266,656 |
|
5.125%, due 9/1/27 |
|
|
|
|
100,000 |
|
|
|
101,250 |
|
5.500%, due 4/15/25 |
|
|
|
|
129,000 |
|
|
|
132,225 |
|
6.000%, due 5/15/26 |
|
|
|
|
200,000 |
|
|
|
209,000 |
|
Calpine Corp. |
|
|
|
|
|
|
|
|
|
|
5.875%, due 1/15/24‡ |
|
|
|
|
200,000 |
|
|
|
200,750 |
|
6.000%, due 1/15/22‡ |
|
|
|
|
200,000 |
|
|
|
204,500 |
|
NextEra Energy Operating Partners LP
|
|
|
|
|
|
|
|
|
|
|
4.250%, due 9/15/24‡ |
|
|
|
|
150,000 |
|
|
|
144,750 |
|
4.500%, due 9/15/27‡ |
|
|
|
|
150,000 |
|
|
|
140,250 |
|
NRG Energy, Inc.
|
|
|
|
|
|
|
|
|
|
|
5.750%, due 1/15/28‡ |
|
|
|
|
200,000 |
|
|
|
197,500 |
|
6.250%, due 7/15/22 |
|
|
|
|
400,000 |
|
|
|
411,000 |
|
6.250%, due 5/1/24 |
|
|
|
|
200,000 |
|
|
|
206,750 |
|
TerraForm Power Operating LLC
|
|
|
|
|
|
|
|
|
|
|
4.250%, due 1/31/23‡ |
|
|
|
|
125,000 |
|
|
|
119,375 |
|
5.000%, due 1/31/28‡ |
|
|
|
|
225,000 |
|
|
|
210,375 |
|
Vistra Energy Corp.
|
|
|
|
|
|
|
|
|
|
|
5.875%, due 6/1/23 |
|
|
|
|
125,000 |
|
|
|
127,812 |
|
7.625%, due 11/1/24 |
|
|
|
|
350,000 |
|
|
|
376,250 |
|
8.000%, due 1/15/25‡ |
|
|
|
|
200,000 |
|
|
|
216,750 |
|
8.125%, due 1/30/26‡ |
|
|
|
|
275,000 |
|
|
|
301,813 |
|
|
|
|
|
|
|
|
|
|
3,768,006 |
|
| |
Total Corporate Bonds
|
|
|
|
|
|
|
|
|
|
|
(Cost 95,717,885) |
|
|
|
|
|
|
|
|
93,309,750 |
|
| |
Foreign Bonds — 10.2%
|
|
|
|
|
|
|
|
|
|
|
| |
Consumer Discretionary — 2.9%
|
|
|
|
|
|
|
|
|
|
|
1011778 BC ULC / New Red Finance, Inc., (Canada)
|
|
|
|
|
|
|
|
|
|
|
4.250%, due 5/15/24‡ |
|
|
|
|
445,000 |
|
|
|
424,975 |
|
4.625%, due 1/15/22‡ |
|
|
|
|
379,000 |
|
|
|
379,948 |
|
5.000%, due 10/15/25‡ |
|
|
|
|
800,000 |
|
|
|
772,000 |
|
Fiat Chrysler Automobiles NV, (United Kingdom)
|
|
|
|
|
|
|
|
|
|
|
4.500%, due 4/15/20 |
|
|
|
|
400,000 |
|
|
|
405,000 |
|
5.250%, due 4/15/23 |
|
|
|
|
475,000 |
|
|
|
493,406 |
|
See notes to financial
statements.
127
Schedules of Investments —
IQ S&P High Yield Low Volatility Bond ETF (continued)
April 30, 2018
|
|
|
|
Principal
Amount
|
|
Value
|
|
|
|
|
|
|
|
|
|
|
|
Foreign Bonds (continued)
|
|
|
|
|
|
|
|
|
|
|
| |
Consumer Discretionary (continued)
|
|
|
|
|
|
|
|
|
|
|
Jaguar Land Rover Automotive PLC, (United Kingdom)
|
|
|
|
|
|
|
|
|
|
|
3.500%, due 3/15/20‡ |
|
|
|
$ |
75,000 |
|
|
$ |
74,531 |
|
4.125%, due 12/15/18‡ |
|
|
|
|
335,000 |
|
|
|
336,675 |
|
4.250%, due 11/15/19‡ |
|
|
|
|
65,000 |
|
|
|
65,325 |
|
4.500%, due 10/1/27‡ |
|
|
|
|
150,000 |
|
|
|
135,563 |
|
|
|
|
|
|
|
|
|
|
3,087,423 |
|
| |
Industrials — 0.7%
|
|
|
|
|
|
|
|
|
|
|
Ashtead Capital, Inc., (United Kingdom)
|
|
|
|
|
|
|
|
|
|
|
4.125%, due 8/15/25‡ |
|
|
|
|
475,000 |
|
|
|
448,875 |
|
Brookfield Residential Properties, Inc. / Brookfield Residential US Corp., (Canada)
|
|
|
|
|
|
|
|
|
|
|
6.125%, due 7/1/22‡ |
|
|
|
|
125,000 |
|
|
|
127,187 |
|
CNH Industrial NV, (United Kingdom)
|
|
|
|
|
|
|
|
|
|
|
4.500%, due 8/15/23 |
|
|
|
|
100,000 |
|
|
|
101,625 |
|
Series MTN, 3.850%, due 11/15/27 |
|
|
|
|
150,000 |
|
|
|
143,250 |
|
|
|
|
|
|
|
|
|
|
820,937 |
|
| |
Information Technology — 0.9%
|
|
|
|
|
|
|
|
|
|
|
Nokia OYJ, (Finland)
|
|
|
|
|
|
|
|
|
|
|
3.375%, due 6/12/22 |
|
|
|
|
75,000 |
|
|
|
72,562 |
|
4.375%, due 6/12/27 |
|
|
|
|
150,000 |
|
|
|
139,151 |
|
5.375%, due 5/15/19 |
|
|
|
|
28,000 |
|
|
|
28,595 |
|
Open Text Corp., (Canada)
|
|
|
|
|
|
|
|
|
|
|
5.625%, due 1/15/23‡ |
|
|
|
|
200,000 |
|
|
|
207,750 |
|
5.875%, due 6/1/26‡ |
|
|
|
|
265,000 |
|
|
|
274,938 |
|
Telefonaktiebolaget LM Ericsson, (Sweden)
|
|
|
|
|
|
|
|
|
|
|
4.125%, due 5/15/22 |
|
|
|
|
250,000 |
|
|
|
247,626 |
|
|
|
|
|
|
|
|
|
|
970,622 |
|
| |
Materials — 3.3%
|
|
|
|
|
|
|
|
|
|
|
ArcelorMittal, (Luxembourg)
|
|
|
|
|
|
|
|
|
|
|
6.125%, due 6/1/25 |
|
|
|
|
105,000 |
|
|
|
113,662 |
|
7.250%, due 10/15/39 |
|
|
|
|
325,000 |
|
|
|
383,906 |
|
Ardagh Packaging Finance PLC / Ardagh Holdings USA, Inc., (Ireland)
|
|
|
|
|
|
|
|
|
|
|
4.250%, due 9/15/22‡ |
|
|
|
|
200,000 |
|
|
|
198,750 |
|
4.625%, due 5/15/23‡ |
|
|
|
|
280,000 |
|
|
|
280,700 |
|
6.000%, due 2/15/25‡ |
|
|
|
|
500,000 |
|
|
|
506,250 |
|
7.250%, due 5/15/24‡ |
|
|
|
|
450,000 |
|
|
|
475,875 |
|
FMG Resources August 2006 Pty Ltd., (Australia)
|
|
|
|
|
|
|
|
|
|
|
4.750%, due 5/15/22‡ |
|
|
|
|
175,000 |
|
|
|
173,687 |
|
5.125%, due 3/15/23‡ |
|
|
|
|
150,000 |
|
|
|
149,743 |
|
5.125%, due 5/15/24‡ |
|
|
|
|
260,000 |
|
|
|
257,075 |
|
NOVA Chemicals Corp., (Canada)
|
|
|
|
|
|
|
|
|
|
|
4.875%, due 6/1/24‡ |
|
|
|
|
50,000 |
|
|
|
48,313 |
|
5.000%, due 5/1/25‡ |
|
|
|
|
125,000 |
|
|
|
120,469 |
|
5.250%, due 8/1/23‡ |
|
|
|
|
105,000 |
|
|
|
105,262 |
|
5.250%, due 6/1/27‡ |
|
|
|
|
550,000 |
|
|
|
528,000 |
|
Teck Resources Ltd., (Canada)
|
|
|
|
|
|
|
|
|
|
|
8.500%, due 6/1/24‡ |
|
|
|
|
175,000 |
|
|
|
194,688 |
|
|
|
|
|
|
|
|
|
|
3,536,380 |
|
|
|
|
|
|
|
|
|
|
|
|
|
|
|
|
Shares
|
|
Value
|
Foreign Bonds (continued)
|
|
|
|
|
|
|
|
|
|
|
| |
Media — 0.8%
|
|
|
|
|
|
|
|
|
|
|
Telenet Finance Luxembourg Notes SARL, (Belgium)
|
|
|
|
|
|
|
|
|
|
|
5.500%, due 3/1/28‡ |
|
|
|
$ |
400,000 |
|
|
$ |
380,000 |
|
Videotron Ltd., (Canada)
|
|
|
|
|
|
|
|
|
|
|
5.125%, due 4/15/27‡ |
|
|
|
|
175,000 |
|
|
|
171,500 |
|
5.375%, due 6/15/24‡ |
|
|
|
|
160,000 |
|
|
|
164,400 |
|
Virgin Media Secured Finance PLC, (United Kingdom)
|
|
|
|
|
|
|
|
|
|
|
5.250%, due 1/15/26‡ |
|
|
|
|
60,000 |
|
|
|
57,075 |
|
5.500%, due 1/15/25‡ |
|
|
|
|
60,000 |
|
|
|
58,800 |
|
|
|
|
|
|
|
|
|
|
831,775 |
|
| |
Telecommunication Services — 1.6%
|
|
|
|
|
|
|
|
|
|
|
Millicom International Cellular SA, (Colombia)
|
|
|
|
|
|
|
|
|
|
|
5.125%, due 1/15/28‡ |
|
|
|
|
150,000 |
|
|
|
141,375 |
|
6.000%, due 3/15/25‡ |
|
|
|
|
125,000 |
|
|
|
128,750 |
|
Telecom Italia Capital SA, (Italy)
|
|
|
|
|
|
|
|
|
|
|
6.000%, due 9/30/34 |
|
|
|
|
260,000 |
|
|
|
270,075 |
|
7.200%, due 7/18/36 |
|
|
|
|
275,000 |
|
|
|
315,906 |
|
7.721%, due 6/4/38 |
|
|
|
|
325,000 |
|
|
|
391,219 |
|
Telecom Italia SpA, (Italy)
|
|
|
|
|
|
|
|
|
|
|
5.303%, due 5/30/24‡ |
|
|
|
|
465,000 |
|
|
|
473,138 |
|
|
|
|
|
|
|
|
|
|
1,720,463 |
|
| |
Total Foreign Bonds
|
|
|
|
|
|
|
|
|
|
|
(Cost 11,242,705) |
|
|
|
|
|
|
|
|
10,967,600 |
|
| |
Short-Term Investment — 1.4%
|
|
|
|
|
|
|
|
|
|
|
| |
Money Market Fund — 1.4%
|
|
|
|
Shares
|
|
|
|
|
BlackRock Liquidity Funds Treasury Trust Fund Portfolio, Institutional Class, 1.57%(a)
|
|
|
|
|
|
|
|
|
|
|
(Cost 1,521,327) |
|
|
|
|
1,521,327 |
|
|
|
1,521,327 |
|
| |
Total Investments — 98.7%
|
|
|
|
|
|
|
|
|
|
|
(Cost 108,481,917) |
|
|
|
|
|
|
|
|
105,798,677 |
|
| |
Other Assets and Liabilities,
Net — 1.3% |
|
|
|
|
|
|
|
|
1,393,789 |
|
| |
Net Assets — 100.0% |
|
|
|
|
|
|
|
$ |
107,192,466 |
|
‡ |
|
May be sold to institutional investors only under
Rule 144A or securities offered pursuant to section 4 (a) (2) of the Securities Act of 1933, as amended. |
(a) |
|
Reflects the 1-day yield at April 30,
2018. |
See notes to financial
statements.
128
Schedules of Investments —
IQ S&P High Yield Low Volatility Bond ETF (continued)
April 30, 2018
The
following is a summary of the inputs used to value the Fund’s investments as of
April 30, 2018. For more information on the valuation techniques, and their aggregation
into the levels used in the table below, please refer to Note 2.
Asset Valuation Inputs
Description
|
|
|
|
Level 1
|
|
Level 2
|
|
Level 3
|
|
Total
|
Investments in Securities:(b)
|
|
|
|
|
|
|
|
|
|
|
|
|
|
|
|
|
|
|
Corporate Bonds |
|
|
|
$ |
— |
|
|
$ |
93,309,750 |
|
|
$ |
— |
|
|
$ |
93,309,750 |
|
Foreign Bonds |
|
|
|
|
— |
|
|
|
10,967,600 |
|
|
|
— |
|
|
|
10,967,600 |
|
Short-Term Investment:
|
|
|
|
|
|
|
|
|
|
|
|
|
|
|
|
|
|
|
Money Market Fund |
|
|
|
|
1,521,327 |
|
|
|
— |
|
|
|
— |
|
|
|
1,521,327 |
|
Total Investments in Securities |
|
|
|
$ |
1,521,327 |
|
|
$ |
104,277,350 |
|
|
$ |
— |
|
|
$ |
105,798,677 |
|
(b) |
|
For a complete listing of investments and their
industries, see the Schedules of Investments. |
The
Fund recognizes transfers between the levels as of the beginning of the period.
For
the year ended April 30, 2018, the Fund did not have any transfers between any levels
within the fair value hierarchy. (See Note 2)
See notes to financial
statements.
129
Schedules of Investments — IQ Chaikin U.S. Small
Cap ETF
April 30, 2018
|
|
|
|
Shares
|
|
Value
|
|
|
|
|
|
|
|
|
|
|
|
Common Stocks — 100.0%
|
|
|
|
|
|
|
|
|
|
|
| |
Basic Materials — 7.1%
|
|
|
|
|
|
|
|
|
|
|
AdvanSix, Inc.* |
|
|
|
|
61,604 |
|
|
$ |
2,206,655 |
|
Clearwater Paper Corp.* |
|
|
|
|
54,798 |
|
|
|
1,295,973 |
|
Commercial Metals Co. |
|
|
|
|
104,721 |
|
|
|
2,200,188 |
|
Encore Wire Corp. |
|
|
|
|
37,788 |
|
|
|
1,989,538 |
|
Global Brass & Copper
Holdings, Inc. |
|
|
|
|
64,054 |
|
|
|
1,921,620 |
|
Koppers Holdings, Inc.* |
|
|
|
|
52,131 |
|
|
|
2,283,338 |
|
Kraton Corp.* |
|
|
|
|
44,909 |
|
|
|
2,050,994 |
|
Lydall, Inc.* |
|
|
|
|
44,406 |
|
|
|
1,980,508 |
|
Mueller Industries, Inc. |
|
|
|
|
81,903 |
|
|
|
2,226,123 |
|
Nexeo Solutions, Inc.* |
|
|
|
|
200,242 |
|
|
|
2,040,466 |
|
Peabody Energy Corp. |
|
|
|
|
58,701 |
|
|
|
2,163,132 |
|
Renewable Energy Group, Inc.*(a) |
|
|
|
|
167,390 |
|
|
|
2,159,331 |
|
Stepan Co. |
|
|
|
|
25,758 |
|
|
|
1,811,303 |
|
SunCoke Energy, Inc.* |
|
|
|
|
199,125 |
|
|
|
2,287,946 |
|
Trinseo SA |
|
|
|
|
28,934 |
|
|
|
2,110,735 |
|
Universal Forest Products, Inc. |
|
|
|
|
66,027 |
|
|
|
2,104,941 |
|
Total Basic Materials |
|
|
|
|
|
|
|
|
32,832,791 |
|
| |
Consumer Goods — 9.4%
|
|
|
|
|
|
|
|
|
|
|
ACCO Brands Corp. |
|
|
|
|
170,724 |
|
|
|
2,057,224 |
|
AV
Homes, Inc.*(a) |
|
|
|
|
115,504 |
|
|
|
1,923,142 |
|
Avon Products, Inc.* |
|
|
|
|
754,433 |
|
|
|
1,908,715 |
|
Beazer Homes USA, Inc.* |
|
|
|
|
134,332 |
|
|
|
1,971,994 |
|
Caleres, Inc. |
|
|
|
|
63,768 |
|
|
|
2,087,127 |
|
Fossil Group, Inc.*(a) |
|
|
|
|
168,708 |
|
|
|
2,522,185 |
|
HNI Corp. |
|
|
|
|
59,368 |
|
|
|
1,982,298 |
|
M/I Homes, Inc.* |
|
|
|
|
67,271 |
|
|
|
2,050,420 |
|
MDC Holdings, Inc. |
|
|
|
|
76,740 |
|
|
|
2,226,227 |
|
Meritage Homes Corp.* |
|
|
|
|
47,350 |
|
|
|
2,107,075 |
|
Perry Ellis International, Inc.* |
|
|
|
|
83,046 |
|
|
|
2,155,044 |
|
REV Group, Inc. |
|
|
|
|
103,208 |
|
|
|
1,862,904 |
|
SpartanNash Co. |
|
|
|
|
124,497 |
|
|
|
2,263,355 |
|
Stoneridge, Inc.* |
|
|
|
|
77,630 |
|
|
|
2,043,998 |
|
Taylor Morrison Home Corp.,
Class A* |
|
|
|
|
92,036 |
|
|
|
2,186,775 |
|
Tenneco, Inc. |
|
|
|
|
39,048 |
|
|
|
1,745,055 |
|
Tower International, Inc. |
|
|
|
|
77,210 |
|
|
|
2,277,695 |
|
Unifi, Inc.* |
|
|
|
|
59,106 |
|
|
|
1,750,129 |
|
Vista Outdoor, Inc.* |
|
|
|
|
131,286 |
|
|
|
2,199,040 |
|
William Lyon Homes, Class A* |
|
|
|
|
77,941 |
|
|
|
2,093,495 |
|
Winnebago Industries, Inc.(a) |
|
|
|
|
56,984 |
|
|
|
2,159,694 |
|
Total Consumer Goods |
|
|
|
|
|
|
|
|
43,573,591 |
|
| |
Consumer Services — 10.5%
|
|
|
|
|
|
|
|
|
|
|
Asbury Automotive Group, Inc.* |
|
|
|
|
31,742 |
|
|
|
2,128,301 |
|
Barnes & Noble Education, Inc.* |
|
|
|
|
310,971 |
|
|
|
2,235,881 |
|
Bloomin’ Brands, Inc. |
|
|
|
|
88,245 |
|
|
|
2,087,877 |
|
Bojangles’, Inc.*(a) |
|
|
|
|
154,700 |
|
|
|
2,281,825 |
|
Brinker International, Inc. |
|
|
|
|
59,352 |
|
|
|
2,587,154 |
|
Career Education Corp.* |
|
|
|
|
163,059 |
|
|
|
2,114,875 |
|
Chico’s FAS, Inc. |
|
|
|
|
237,012 |
|
|
|
2,353,529 |
|
Citi Trends, Inc. |
|
|
|
|
69,317 |
|
|
|
2,123,180 |
|
Del Frisco’s Restaurant Group, Inc.* |
|
|
|
|
140,498 |
|
|
|
2,233,918 |
|
Finish Line, Inc. (The), Class A |
|
|
|
|
158,242 |
|
|
|
2,147,344 |
|
Group 1 Automotive, Inc.(a) |
|
|
|
|
32,791 |
|
|
|
2,142,892 |
|
Hawaiian Holdings, Inc. |
|
|
|
|
55,364 |
|
|
|
2,280,997 |
|
J.
Jill, Inc.* |
|
|
|
|
484,749 |
|
|
|
2,477,067 |
|
Liberty Expedia Holdings, Inc., Class A* |
|
|
|
|
54,547 |
|
|
|
2,225,518 |
|
Liberty TripAdvisor Holdings, Inc., Class A* |
|
|
|
|
199,311 |
|
|
|
1,833,661 |
|
|
|
|
|
|
|
|
|
|
|
|
|
|
|
|
Shares
|
|
Value
|
Common Stocks (continued)
|
|
|
|
|
|
|
|
|
|
|
| |
Consumer Services (continued)
|
|
|
|
|
|
|
|
|
|
|
Lithia Motors, Inc., Class A |
|
|
|
|
21,315 |
|
|
$ |
2,043,256 |
|
Marcus Corp. (The) |
|
|
|
|
70,596 |
|
|
|
2,103,761 |
|
New Media Investment Group, Inc. |
|
|
|
|
125,005 |
|
|
|
2,072,583 |
|
Office Depot, Inc. |
|
|
|
|
996,554 |
|
|
|
2,282,109 |
|
Penn National Gaming, Inc.* |
|
|
|
|
81,591 |
|
|
|
2,473,023 |
|
Regis Corp.* |
|
|
|
|
141,612 |
|
|
|
2,211,979 |
|
Sally Beauty Holdings, Inc.*(a) |
|
|
|
|
130,249 |
|
|
|
2,252,005 |
|
Total Consumer Services |
|
|
|
|
|
|
|
|
48,692,735 |
|
| |
Financials — 27.2%
|
|
|
|
|
|
|
|
|
|
|
Access National Corp. |
|
|
|
|
75,100 |
|
|
|
2,088,531 |
|
American Equity Investment Life Holding Co. |
|
|
|
|
72,977 |
|
|
|
2,203,905 |
|
American National Insurance Co. |
|
|
|
|
18,319 |
|
|
|
2,210,554 |
|
Ashford Hospitality Trust, Inc. |
|
|
|
|
331,670 |
|
|
|
2,281,889 |
|
Avis Budget Group, Inc.* |
|
|
|
|
45,743 |
|
|
|
2,260,162 |
|
Bancorp, Inc. (The)* |
|
|
|
|
198,388 |
|
|
|
2,053,316 |
|
BancorpSouth Bank |
|
|
|
|
67,377 |
|
|
|
2,226,810 |
|
Banner Corp. |
|
|
|
|
38,612 |
|
|
|
2,216,329 |
|
Berkshire Hills Bancorp, Inc. |
|
|
|
|
56,458 |
|
|
|
2,142,581 |
|
BGC Partners, Inc., Class A |
|
|
|
|
159,300 |
|
|
|
2,128,248 |
|
Camden National Corp. |
|
|
|
|
48,148 |
|
|
|
2,133,438 |
|
CenterState Bank Corp. |
|
|
|
|
80,761 |
|
|
|
2,340,454 |
|
Community Trust Bancorp, Inc. |
|
|
|
|
47,402 |
|
|
|
2,275,296 |
|
Customers Bancorp, Inc.* |
|
|
|
|
73,502 |
|
|
|
2,118,328 |
|
Employers Holdings, Inc. |
|
|
|
|
52,969 |
|
|
|
2,166,432 |
|
ePlus, Inc.* |
|
|
|
|
27,575 |
|
|
|
2,201,864 |
|
Evercore, Inc., Class A |
|
|
|
|
24,571 |
|
|
|
2,487,814 |
|
FBL Financial Group, Inc., Class A |
|
|
|
|
30,895 |
|
|
|
2,402,086 |
|
Federated Investors, Inc., Class B |
|
|
|
|
64,149 |
|
|
|
1,698,024 |
|
Fidelity Southern Corp. |
|
|
|
|
92,873 |
|
|
|
2,111,003 |
|
First BanCorp* |
|
|
|
|
355,912 |
|
|
|
2,569,685 |
|
First Busey Corp. |
|
|
|
|
72,093 |
|
|
|
2,137,557 |
|
First Defiance Financial Corp. |
|
|
|
|
37,379 |
|
|
|
2,230,031 |
|
First Foundation, Inc.* |
|
|
|
|
115,566 |
|
|
|
2,067,476 |
|
First Interstate BancSystem, Inc., Class A |
|
|
|
|
54,174 |
|
|
|
2,194,047 |
|
FirstCash, Inc. |
|
|
|
|
26,370 |
|
|
|
2,286,279 |
|
Great Southern Bancorp, Inc. |
|
|
|
|
42,895 |
|
|
|
2,267,001 |
|
Great Western Bancorp, Inc. |
|
|
|
|
53,206 |
|
|
|
2,188,895 |
|
Greenlight Capital Re Ltd., Class A* |
|
|
|
|
133,495 |
|
|
|
2,069,172 |
|
Hanmi Financial Corp. |
|
|
|
|
69,678 |
|
|
|
1,923,113 |
|
Health Insurance Innovations, Inc., Class A* |
|
|
|
|
74,138 |
|
|
|
2,112,933 |
|
Heartland Financial USA, Inc. |
|
|
|
|
40,388 |
|
|
|
2,166,816 |
|
Hilltop Holdings, Inc. |
|
|
|
|
91,330 |
|
|
|
2,047,619 |
|
Hope Bancorp, Inc. |
|
|
|
|
117,789 |
|
|
|
2,036,572 |
|
Horace Mann Educators Corp. |
|
|
|
|
50,119 |
|
|
|
2,240,319 |
|
Houlihan Lokey, Inc. |
|
|
|
|
48,040 |
|
|
|
2,137,780 |
|
Kemper Corp.(a) |
|
|
|
|
37,589 |
|
|
|
2,537,257 |
|
Maiden Holdings Ltd.(a) |
|
|
|
|
329,629 |
|
|
|
2,521,662 |
|
Meta Financial Group, Inc.(a) |
|
|
|
|
19,621 |
|
|
|
2,180,874 |
|
MidWestOne Financial Group, Inc. |
|
|
|
|
64,361 |
|
|
|
2,076,929 |
|
National General Holdings Corp. |
|
|
|
|
88,136 |
|
|
|
2,271,265 |
|
Opus Bank |
|
|
|
|
76,521 |
|
|
|
2,157,892 |
|
Peapack Gladstone Financial Corp. |
|
|
|
|
64,169 |
|
|
|
2,120,144 |
|
PennyMac Financial Services, Inc., Class A* |
|
|
|
|
94,596 |
|
|
|
1,948,678 |
|
Peoples Bancorp, Inc. |
|
|
|
|
60,440 |
|
|
|
2,167,378 |
|
Piper Jaffray Cos. |
|
|
|
|
25,799 |
|
|
|
1,807,220 |
|
QCR Holdings, Inc. |
|
|
|
|
47,772 |
|
|
|
2,161,683 |
|
Renasant Corp. |
|
|
|
|
50,343 |
|
|
|
2,277,014 |
|
See notes to financial
statements.
130
Schedules of Investments —
IQ Chaikin U.S. Small Cap ETF (continued)
April 30, 2018
|
|
|
|
Shares
|
|
Value
|
|
|
|
|
|
|
|
|
|
|
|
Common Stocks (continued)
|
|
|
|
|
|
|
|
|
|
|
| |
Financials (continued)
|
|
|
|
|
|
|
|
|
|
|
RMR Group, Inc. (The), Class A |
|
|
|
|
30,630 |
|
|
$ |
2,278,872 |
|
Selective Insurance Group, Inc. |
|
|
|
|
35,298 |
|
|
|
2,089,642 |
|
State Bank Financial Corp. |
|
|
|
|
71,396 |
|
|
|
2,249,688 |
|
TCF Financial Corp. |
|
|
|
|
93,932 |
|
|
|
2,332,331 |
|
Towne Bank/Portsmouth VA |
|
|
|
|
74,916 |
|
|
|
2,239,988 |
|
TriState Capital Holdings, Inc.* |
|
|
|
|
92,154 |
|
|
|
2,303,850 |
|
United Fire Group, Inc. |
|
|
|
|
44,768 |
|
|
|
2,251,383 |
|
United Insurance Holdings Corp. |
|
|
|
|
111,943 |
|
|
|
2,111,245 |
|
Universal Insurance Holdings, Inc. |
|
|
|
|
67,166 |
|
|
|
2,179,537 |
|
Walker & Dunlop, Inc. |
|
|
|
|
36,058 |
|
|
|
2,059,272 |
|
Total Financials |
|
|
|
|
|
|
|
|
126,746,163 |
|
| |
Health Care — 3.8%
|
|
|
|
|
|
|
|
|
|
|
Aceto Corp. |
|
|
|
|
281,920 |
|
|
|
710,439 |
|
Analogic Corp. |
|
|
|
|
22,342 |
|
|
|
1,856,620 |
|
BioTime, Inc.*(a) |
|
|
|
|
796,502 |
|
|
|
1,720,444 |
|
Enanta Pharmaceuticals, Inc.* |
|
|
|
|
26,481 |
|
|
|
2,464,057 |
|
Lantheus Holdings, Inc.* |
|
|
|
|
134,754 |
|
|
|
2,398,621 |
|
LifePoint Health, Inc.*(a) |
|
|
|
|
45,587 |
|
|
|
2,183,617 |
|
Magellan Health, Inc.* |
|
|
|
|
20,006 |
|
|
|
1,677,503 |
|
Syneos Health, Inc.*(a) |
|
|
|
|
60,355 |
|
|
|
2,299,526 |
|
Triple-S Management Corp.,
Class B* |
|
|
|
|
81,966 |
|
|
|
2,323,736 |
|
Total Health Care |
|
|
|
|
|
|
|
|
17,634,563 |
|
| |
Industrials — 31.0%
|
|
|
|
|
|
|
|
|
|
|
AAR Corp. |
|
|
|
|
48,574 |
|
|
|
2,103,254 |
|
ABM Industries, Inc. |
|
|
|
|
63,996 |
|
|
|
1,992,195 |
|
Anixter International, Inc.* |
|
|
|
|
28,285 |
|
|
|
1,665,986 |
|
ArcBest Corp. |
|
|
|
|
66,851 |
|
|
|
2,145,917 |
|
Argan, Inc. |
|
|
|
|
49,886 |
|
|
|
1,995,440 |
|
ASGN, Inc.* |
|
|
|
|
26,167 |
|
|
|
2,109,845 |
|
Atkore International Group, Inc.* |
|
|
|
|
107,939 |
|
|
|
1,918,076 |
|
Atlas Air Worldwide Holdings, Inc.* |
|
|
|
|
35,444 |
|
|
|
2,247,150 |
|
Barrett Business Services, Inc. |
|
|
|
|
25,852 |
|
|
|
2,262,567 |
|
Beacon Roofing Supply, Inc.* |
|
|
|
|
40,373 |
|
|
|
1,976,258 |
|
Benchmark Electronics, Inc. |
|
|
|
|
71,779 |
|
|
|
1,887,788 |
|
Blue Bird Corp.* |
|
|
|
|
90,405 |
|
|
|
2,147,119 |
|
Builders FirstSource, Inc.* |
|
|
|
|
107,993 |
|
|
|
1,968,712 |
|
CBIZ, Inc.* |
|
|
|
|
117,402 |
|
|
|
2,183,677 |
|
Convergys Corp. |
|
|
|
|
94,721 |
|
|
|
2,212,683 |
|
Covenant Transportation Group, Inc., Class A* |
|
|
|
|
71,827 |
|
|
|
1,993,199 |
|
CRA International, Inc. |
|
|
|
|
40,975 |
|
|
|
2,313,858 |
|
Donnelley Financial
Solutions, Inc.*(a) |
|
|
|
|
124,787 |
|
|
|
2,296,081 |
|
Ducommun, Inc.* |
|
|
|
|
70,526 |
|
|
|
2,051,601 |
|
Engility Holdings, Inc.* |
|
|
|
|
87,811 |
|
|
|
2,232,156 |
|
Essendant, Inc. |
|
|
|
|
274,691 |
|
|
|
2,043,701 |
|
Forward Air Corp. |
|
|
|
|
40,533 |
|
|
|
2,188,377 |
|
Foundation Building Materials, Inc.* |
|
|
|
|
143,702 |
|
|
|
2,019,013 |
|
FTI Consulting, Inc.* |
|
|
|
|
44,259 |
|
|
|
2,584,726 |
|
GMS, Inc.* |
|
|
|
|
70,111 |
|
|
|
2,184,659 |
|
GP
Strategies Corp.* |
|
|
|
|
94,596 |
|
|
|
1,972,327 |
|
Griffon Corp. |
|
|
|
|
117,402 |
|
|
|
2,336,300 |
|
Hawkins, Inc. |
|
|
|
|
60,956 |
|
|
|
1,981,070 |
|
Heidrick & Struggles International, Inc. |
|
|
|
|
68,563 |
|
|
|
2,581,397 |
|
Heritage-Crystal Clean, Inc.* |
|
|
|
|
90,980 |
|
|
|
1,924,227 |
|
Hub Group, Inc., Class A* |
|
|
|
|
51,197 |
|
|
|
2,250,108 |
|
Hyster-Yale Materials Handling, Inc. |
|
|
|
|
30,639 |
|
|
|
2,181,497 |
|
|
|
|
|
|
|
|
|
|
|
|
|
|
|
|
Shares
|
|
Value
|
Common Stocks (continued)
|
|
|
|
|
|
|
|
|
|
|
| |
Industrials (continued)
|
|
|
|
|
|
|
|
|
|
|
ICF International, Inc. |
|
|
|
|
36,657 |
|
|
$ |
2,459,685 |
|
Integer Holdings Corp.* |
|
|
|
|
37,888 |
|
|
|
2,080,051 |
|
Kelly Services, Inc., Class A |
|
|
|
|
73,781 |
|
|
|
2,158,832 |
|
Kforce, Inc. |
|
|
|
|
79,209 |
|
|
|
2,102,999 |
|
Korn/Ferry International |
|
|
|
|
41,531 |
|
|
|
2,220,247 |
|
LSC Communications, Inc. |
|
|
|
|
122,785 |
|
|
|
2,146,282 |
|
ManTech International Corp./VA, Class A |
|
|
|
|
38,626 |
|
|
|
2,282,410 |
|
NCI Building Systems, Inc.* |
|
|
|
|
121,050 |
|
|
|
2,118,375 |
|
Patrick Industries, Inc.* |
|
|
|
|
34,642 |
|
|
|
1,971,130 |
|
Perficient, Inc.* |
|
|
|
|
93,481 |
|
|
|
2,311,785 |
|
Primoris Services Corp. |
|
|
|
|
85,772 |
|
|
|
2,194,905 |
|
Providence Service Corp. (The)* |
|
|
|
|
30,989 |
|
|
|
2,351,445 |
|
Quad/Graphics, Inc. |
|
|
|
|
84,520 |
|
|
|
2,088,489 |
|
Quanex Building Products Corp. |
|
|
|
|
123,137 |
|
|
|
2,111,800 |
|
Resources Connection, Inc. |
|
|
|
|
132,259 |
|
|
|
2,069,853 |
|
RPX Corp. |
|
|
|
|
200,429 |
|
|
|
2,170,646 |
|
Rush Enterprises, Inc., Class A* |
|
|
|
|
50,426 |
|
|
|
2,058,894 |
|
Saia, Inc.* |
|
|
|
|
28,511 |
|
|
|
1,883,152 |
|
SP
Plus Corp.* |
|
|
|
|
60,185 |
|
|
|
2,115,503 |
|
Spartan Motors, Inc. |
|
|
|
|
124,569 |
|
|
|
2,223,557 |
|
SPX Corp.* |
|
|
|
|
65,966 |
|
|
|
2,087,164 |
|
SPX FLOW, Inc.* |
|
|
|
|
43,557 |
|
|
|
1,960,065 |
|
Sykes Enterprises, Inc.* |
|
|
|
|
74,036 |
|
|
|
2,129,275 |
|
Tredegar Corp. |
|
|
|
|
119,364 |
|
|
|
2,100,806 |
|
TrueBlue, Inc.* |
|
|
|
|
82,725 |
|
|
|
2,204,621 |
|
TTM Technologies, Inc.* |
|
|
|
|
140,130 |
|
|
|
1,953,412 |
|
US
Concrete, Inc.*(a) |
|
|
|
|
35,473 |
|
|
|
2,073,397 |
|
Vectrus, Inc.* |
|
|
|
|
57,535 |
|
|
|
2,071,260 |
|
Veritiv Corp.*(a) |
|
|
|
|
54,658 |
|
|
|
2,079,737 |
|
Viad Corp. |
|
|
|
|
40,850 |
|
|
|
2,073,138 |
|
VSE Corp. |
|
|
|
|
41,427 |
|
|
|
2,124,791 |
|
Wabash National Corp. |
|
|
|
|
102,960 |
|
|
|
2,065,378 |
|
Wesco Aircraft Holdings, Inc.* |
|
|
|
|
209,033 |
|
|
|
2,111,233 |
|
WESCO International, Inc.* |
|
|
|
|
34,530 |
|
|
|
2,056,262 |
|
World Fuel Services Corp. |
|
|
|
|
87,275 |
|
|
|
1,873,794 |
|
YRC Worldwide, Inc.* |
|
|
|
|
242,649 |
|
|
|
2,018,840 |
|
Total Industrials |
|
|
|
|
|
|
|
|
144,054,177 |
|
| |
Oil & Gas — 2.0%
|
|
|
|
|
|
|
|
|
|
|
C&J Energy Services, Inc.*(a) |
|
|
|
|
82,982 |
|
|
|
2,477,842 |
|
Exterran Corp.* |
|
|
|
|
80,247 |
|
|
|
2,350,435 |
|
PBF Energy, Inc., Class A |
|
|
|
|
63,203 |
|
|
|
2,422,571 |
|
TETRA Technologies, Inc.* |
|
|
|
|
571,357 |
|
|
|
2,245,433 |
|
Total Oil & Gas |
|
|
|
|
|
|
|
|
9,496,281 |
|
| |
Technology — 8.1%
|
|
|
|
|
|
|
|
|
|
|
Advanced Energy Industries, Inc.* |
|
|
|
|
33,530 |
|
|
|
1,996,711 |
|
Alpha & Omega Semiconductor Ltd.* |
|
|
|
|
138,679 |
|
|
|
2,102,374 |
|
Amkor Technology, Inc.* |
|
|
|
|
211,509 |
|
|
|
1,751,295 |
|
CACI International, Inc., Class A* |
|
|
|
|
14,157 |
|
|
|
2,138,415 |
|
FormFactor, Inc.* |
|
|
|
|
156,966 |
|
|
|
1,801,185 |
|
HealthStream, Inc. |
|
|
|
|
86,290 |
|
|
|
2,001,065 |
|
Imperva, Inc.* |
|
|
|
|
49,482 |
|
|
|
2,214,319 |
|
Insight Enterprises, Inc.* |
|
|
|
|
61,340 |
|
|
|
2,174,503 |
|
MicroStrategy, Inc., Class A* |
|
|
|
|
16,611 |
|
|
|
2,117,238 |
|
MobileIron, Inc.* |
|
|
|
|
432,847 |
|
|
|
2,012,739 |
|
Presidio, Inc.*(a) |
|
|
|
|
136,994 |
|
|
|
2,098,748 |
|
ScanSource, Inc.* |
|
|
|
|
60,270 |
|
|
|
2,067,261 |
|
Super Micro Computer, Inc.* |
|
|
|
|
126,035 |
|
|
|
2,230,819 |
|
Ultra Clean Holdings, Inc.*(a) |
|
|
|
|
111,303 |
|
|
|
1,948,916 |
|
See notes to financial
statements.
131
Schedules of Investments —
IQ Chaikin U.S. Small Cap ETF (continued)
April 30, 2018
|
|
|
|
Shares
|
|
Value
|
|
|
|
|
|
|
|
|
|
|
|
Common Stocks (continued)
|
|
|
|
|
|
|
|
|
|
|
| |
Technology (continued)
|
|
|
|
|
|
|
|
|
|
|
Unisys Corp.*(a) |
|
|
|
|
199,311 |
|
|
$ |
2,232,283 |
|
VASCO Data Security International, Inc.* |
|
|
|
|
165,451 |
|
|
|
2,564,490 |
|
Verint Systems, Inc.* |
|
|
|
|
50,296 |
|
|
|
2,117,462 |
|
Zynga, Inc., Class A* |
|
|
|
|
585,407 |
|
|
|
2,019,654 |
|
Total Technology |
|
|
|
|
|
|
|
|
37,589,477 |
|
| |
Telecommunications — 0.4%
|
|
|
|
|
|
|
|
|
|
|
Telephone & Data Systems, Inc. |
|
|
|
|
76,439 |
|
|
|
2,089,078 |
|
| |
Utilities — 0.5%
|
|
|
|
|
|
|
|
|
|
|
SJW Group |
|
|
|
|
40,649 |
|
|
|
2,457,232 |
|
| |
Total Common Stocks
|
|
|
|
|
|
|
|
|
|
|
(Cost 461,645,173) |
|
|
|
|
|
|
|
|
465,166,088 |
|
| |
Short-Term Investment — 0.0%(b)
|
|
|
|
|
|
|
|
|
|
|
| |
Money Market Fund — 0.0%(b)
|
|
|
|
|
|
|
|
|
|
|
Morgan Stanley Institutional Liquidity Funds Treasury Portfolio — Institutional Class,
1.58%(c)
|
|
|
|
|
|
|
|
|
|
|
(Cost 213,988) |
|
|
|
|
213,988 |
|
|
|
213,988 |
|
| |
|
|
|
|
Shares
|
|
Value
|
|
|
|
|
|
|
|
|
|
|
|
Investment of Cash Collateral For Securities Loaned — 0.9%
|
|
|
|
|
|
|
|
|
|
|
| |
Money Market Fund — 0.9%
|
|
|
|
|
|
|
|
|
|
|
Dreyfus Government Cash Management Fund, Institutional Shares, 1.61%(c)
|
|
|
|
|
|
|
|
|
|
|
(Cost 4,391,432) |
|
|
|
|
4,391,432 |
|
|
$ |
4,391,432 |
|
| |
Total Investments — 100.9%
|
|
|
|
|
|
|
|
|
|
|
(Cost 466,250,593) |
|
|
|
|
|
|
|
|
469,771,508 |
|
| |
Other Assets and Liabilities,
Net — (0.9)% |
|
|
|
|
|
|
|
|
(4,424,942 |
) |
| |
Net Assets — 100.0% |
|
|
|
|
|
|
|
|
S465,346,566 |
|
* |
|
Non-income producing securities. |
(a) |
|
All or a portion of the security was on loan. In
addition, “Other Assets and Liabilities, Net” may include pending sales that are also on loan. The aggregate market value of securities on
loan was $20,440,510; total market value of collateral held by the Fund was $21,053,266. Market value of the collateral held includes non-cash U.S.
Treasury securities collateral having a value of $16,661,834. |
(c) |
|
Reflects the 1-day yield at April 30, 2018.
|
The
following is a summary of the inputs used to value the Fund’s investments as of
April 30, 2018. For more information on the valuation techniques, and their aggregation
into the levels used in the table below, please refer to Note 2.
Asset Valuation Inputs
Description
|
|
|
|
Level 1
|
|
Level 2
|
|
Level 3
|
|
Total
|
Investments in Securities:(d)
|
|
|
|
|
|
|
|
|
|
|
|
|
|
|
|
|
|
|
Common Stocks |
|
|
|
$ |
465,166,088 |
|
|
$ |
— |
|
|
$ |
— |
|
|
$ |
465,166,088 |
|
Short-Term Investment:
|
|
|
|
|
|
|
|
|
|
|
|
|
|
|
|
|
|
|
Money Market Fund |
|
|
|
|
213,988 |
|
|
|
— |
|
|
|
— |
|
|
|
213,988 |
|
Investment of Cash Collateral for Securities Loaned:
|
|
|
|
|
|
|
|
|
|
|
|
|
|
|
|
|
|
|
Money Market Fund |
|
|
|
|
4,391,432 |
|
|
|
— |
|
|
|
— |
|
|
|
4,391,432 |
|
Total Investments in Securities |
|
|
|
$ |
469,771,508 |
|
|
$ |
— |
|
|
$ |
— |
|
|
$ |
469,771,508 |
|
(d) |
|
For a complete listing of investments and their
industries, see the Schedules of Investments. |
The
Fund recognizes transfers between the levels as of the beginning of the period.
For
the period ended April 30, 2018, the Fund did not have any transfers between any levels
within the fair value hierarchy. (See Note 2)
See notes to financial
statements.
132
Schedules of Investments — IQ Chaikin U.S. Large
Cap ETF
April 30, 2018
|
|
|
|
Shares
|
|
Value
|
|
|
|
|
|
|
|
|
|
|
|
Common Stocks — 100.0%
|
|
|
|
|
|
|
|
|
|
|
| |
Basic Materials — 1.5%
|
|
|
|
|
|
|
|
|
|
|
LyondellBasell Industries NV,
Class A |
|
|
|
|
45,646 |
|
|
$ |
4,826,152 |
|
| |
Consumer Goods — 7.3%
|
|
|
|
|
|
|
|
|
|
|
Altria Group, Inc. |
|
|
|
|
78,313 |
|
|
|
4,394,142 |
|
Archer-Daniels-Midland Co. |
|
|
|
|
110,899 |
|
|
|
5,032,597 |
|
Ford Motor Co. |
|
|
|
|
439,012 |
|
|
|
4,934,495 |
|
Molson Coors Brewing Co., Class B |
|
|
|
|
64,048 |
|
|
|
4,562,779 |
|
Stanley Black & Decker, Inc. |
|
|
|
|
31,191 |
|
|
|
4,416,334 |
|
Total Consumer Goods |
|
|
|
|
|
|
|
|
23,340,347 |
|
| |
Consumer Services — 4.7%
|
|
|
|
|
|
|
|
|
|
|
AmerisourceBergen Corp. |
|
|
|
|
56,602 |
|
|
|
5,127,009 |
|
Booking Holdings, Inc.* |
|
|
|
|
2,288 |
|
|
|
4,983,264 |
|
Ross Stores, Inc. |
|
|
|
|
61,805 |
|
|
|
4,996,934 |
|
Total Consumer Services |
|
|
|
|
|
|
|
|
15,107,207 |
|
| |
Financials — 40.7%
|
|
|
|
|
|
|
|
|
|
|
Aflac, Inc. |
|
|
|
|
109,346 |
|
|
|
4,982,897 |
|
Allstate Corp. (The) |
|
|
|
|
50,906 |
|
|
|
4,979,625 |
|
American International Group, Inc. |
|
|
|
|
88,397 |
|
|
|
4,950,232 |
|
Ameriprise Financial, Inc. |
|
|
|
|
32,285 |
|
|
|
4,526,680 |
|
Bank of America Corp. |
|
|
|
|
161,070 |
|
|
|
4,819,214 |
|
Bank of New York Mellon
Corp. (The) |
|
|
|
|
93,751 |
|
|
|
5,110,367 |
|
Berkshire Hathaway, Inc., Class B* |
|
|
|
|
24,244 |
|
|
|
4,696,790 |
|
Capital One Financial Corp. |
|
|
|
|
50,792 |
|
|
|
4,602,771 |
|
Chubb Ltd. |
|
|
|
|
34,771 |
|
|
|
4,717,382 |
|
Citigroup, Inc. |
|
|
|
|
69,628 |
|
|
|
4,753,504 |
|
Citizens Financial Group, Inc. |
|
|
|
|
114,323 |
|
|
|
4,743,261 |
|
Goldman Sachs Group, Inc. (The) |
|
|
|
|
19,229 |
|
|
|
4,582,848 |
|
Hartford Financial Services Group, Inc. (The) |
|
|
|
|
93,033 |
|
|
|
5,008,897 |
|
KeyCorp |
|
|
|
|
246,728 |
|
|
|
4,914,822 |
|
Lincoln National Corp. |
|
|
|
|
66,069 |
|
|
|
4,667,114 |
|
Loews Corp. |
|
|
|
|
96,840 |
|
|
|
5,080,226 |
|
MetLife, Inc. |
|
|
|
|
104,516 |
|
|
|
4,982,278 |
|
Moody’s Corp. |
|
|
|
|
29,806 |
|
|
|
4,834,533 |
|
Morgan Stanley |
|
|
|
|
89,465 |
|
|
|
4,618,183 |
|
Northern Trust Corp. |
|
|
|
|
46,806 |
|
|
|
4,996,540 |
|
Principal Financial Group, Inc. |
|
|
|
|
80,881 |
|
|
|
4,789,773 |
|
Progressive Corp. (The) |
|
|
|
|
78,868 |
|
|
|
4,754,952 |
|
Prudential Financial, Inc. |
|
|
|
|
46,354 |
|
|
|
4,928,357 |
|
Regions Financial Corp. |
|
|
|
|
259,965 |
|
|
|
4,861,346 |
|
State Street Corp. |
|
|
|
|
48,048 |
|
|
|
4,794,229 |
|
SunTrust Banks, Inc. |
|
|
|
|
71,298 |
|
|
|
4,762,706 |
|
Wells Fargo & Co. |
|
|
|
|
93,050 |
|
|
|
4,834,878 |
|
Total Financials |
|
|
|
|
|
|
|
|
130,294,405 |
|
| |
Health Care — 9.3%
|
|
|
|
|
|
|
|
|
|
|
Anthem, Inc. |
|
|
|
|
21,675 |
|
|
|
5,115,083 |
|
Biogen, Inc.* |
|
|
|
|
17,934 |
|
|
|
4,906,742 |
|
Cigna Corp. |
|
|
|
|
28,732 |
|
|
|
4,936,732 |
|
|
|
|
|
|
|
|
|
|
|
|
|
|
|
|
Shares
|
|
Value
|
Common Stocks (continued)
|
|
|
|
|
|
|
|
|
|
|
| |
Health Care (continued)
|
|
|
|
|
|
|
|
|
|
|
HCA Healthcare, Inc. |
|
|
|
|
48,802 |
|
|
$ |
4,672,304 |
|
Laboratory Corp. of America Holdings* |
|
|
|
|
29,207 |
|
|
|
4,987,095 |
|
Pfizer, Inc. |
|
|
|
|
135,811 |
|
|
|
4,972,041 |
|
Total Health Care |
|
|
|
|
|
|
|
|
29,589,997 |
|
| |
Industrials — 13.4%
|
|
|
|
|
|
|
|
|
|
|
Accenture PLC, Class A |
|
|
|
|
31,935 |
|
|
|
4,828,572 |
|
Cummins, Inc. |
|
|
|
|
29,942 |
|
|
|
4,786,528 |
|
FedEx Corp. |
|
|
|
|
20,261 |
|
|
|
5,008,519 |
|
Fidelity National Information Services, Inc. |
|
|
|
|
50,228 |
|
|
|
4,770,153 |
|
Fiserv, Inc.* |
|
|
|
|
67,643 |
|
|
|
4,793,183 |
|
General Dynamics Corp. |
|
|
|
|
21,507 |
|
|
|
4,329,574 |
|
Ingersoll-Rand PLC |
|
|
|
|
55,934 |
|
|
|
4,692,304 |
|
Lockheed Martin Corp. |
|
|
|
|
14,021 |
|
|
|
4,498,498 |
|
Norfolk Southern Corp. |
|
|
|
|
35,598 |
|
|
|
5,107,245 |
|
Total Industrials |
|
|
|
|
|
|
|
|
42,814,576 |
|
| |
Oil & Gas — 8.7%
|
|
|
|
|
|
|
|
|
|
|
Andeavor |
|
|
|
|
46,831 |
|
|
|
6,477,664 |
|
Chevron Corp. |
|
|
|
|
41,469 |
|
|
|
5,188,187 |
|
Marathon Petroleum Corp. |
|
|
|
|
65,242 |
|
|
|
4,887,278 |
|
Phillips 66 |
|
|
|
|
49,669 |
|
|
|
5,528,656 |
|
Valero Energy Corp. |
|
|
|
|
51,536 |
|
|
|
5,716,889 |
|
Total Oil & Gas |
|
|
|
|
|
|
|
|
27,798,674 |
|
| |
Technology — 9.9%
|
|
|
|
|
|
|
|
|
|
|
Applied Materials, Inc. |
|
|
|
|
85,761 |
|
|
|
4,259,749 |
|
Cognizant Technology Solutions Corp., Class A |
|
|
|
|
59,380 |
|
|
|
4,858,472 |
|
DXC Technology Co. |
|
|
|
|
46,621 |
|
|
|
4,804,760 |
|
Hewlett Packard Enterprise Co. |
|
|
|
|
270,756 |
|
|
|
4,616,390 |
|
HP, Inc. |
|
|
|
|
218,394 |
|
|
|
4,693,287 |
|
Lam Research Corp. |
|
|
|
|
23,471 |
|
|
|
4,343,543 |
|
Micron Technology, Inc.* |
|
|
|
|
90,744 |
|
|
|
4,172,409 |
|
Total Technology |
|
|
|
|
|
|
|
|
31,748,610 |
|
| |
Telecommunications — 1.4%
|
|
|
|
|
|
|
|
|
|
|
AT&T, Inc. |
|
|
|
|
136,245 |
|
|
|
4,455,211 |
|
| |
Utilities — 3.1%
|
|
|
|
|
|
|
|
|
|
|
Exelon Corp. |
|
|
|
|
123,602 |
|
|
|
4,904,528 |
|
PG&E Corp. |
|
|
|
|
108,213 |
|
|
|
4,988,619 |
|
Total Utilities |
|
|
|
|
|
|
|
|
9,893,147 |
|
| |
Total Investments — 100.0%
|
|
|
|
|
|
|
|
|
|
|
(Cost $317,065,663) |
|
|
|
|
|
|
|
|
319,868,326 |
|
| |
Other Assets and Liabilities,
Net — 0.0%(a) |
|
|
|
|
|
|
|
|
131,753 |
|
| |
Net Assets — 100.0% |
|
|
|
|
|
|
|
$ |
320,000,079 |
|
* |
|
Non-income producing securities. |
See notes to financial
statements.
133
Schedules of Investments —
IQ Chaikin U.S. Large Cap ETF (continued)
April 30, 2018
The
following is a summary of the inputs used to value the Fund’s investments as of
April 30, 2018. For more information on the valuation techniques, and their aggregation
into the levels used in the table below, please refer to Note 2.
Asset Valuation Inputs
Description
|
|
|
|
Level 1
|
|
Level 2
|
|
Level 3
|
|
Total
|
Investments in Securities:(b)
|
|
|
|
|
|
|
|
|
|
|
|
|
|
|
|
|
|
|
Common Stocks |
|
|
|
$ |
319,868,326 |
|
|
$ |
— |
|
|
$ |
— |
|
|
$ |
319,868,326 |
|
Total Investments in Securities |
|
|
|
$ |
319,868,326 |
|
|
$ |
— |
|
|
$ |
— |
|
|
$ |
319,868,326 |
|
(b) |
|
For a complete listing of investments and their
industries, see the Schedules of Investments. |
The
Fund recognizes transfers between the levels as of the beginning of the period.
For
the period ended April 30, 2018, the Fund did not have any transfers between any levels
within the fair value hierarchy. (See Note 2)
See notes to financial
statements.
134
Statements
of Assets and Liabilities
April
30, 2018
|
|
|
|
IQ
Hedge
Multi-Strategy
Tracker ETF
|
|
IQ
Hedge
Macro
Tracker ETF
|
|
IQ Hedge
Market
Neutral
Tracker ETF
|
|
IQ
Hedge
Long/Short
Tracker ETF
|
|
IQ
Hedge
Event-Driven
Tracker ETF
|
Assets
|
|
|
|
|
|
|
|
|
|
|
|
|
|
|
|
|
|
|
|
|
|
|
Investments, at value (including securities on loan)(a) |
|
|
|
$ |
1,266,498,691 |
|
|
$ |
8,496,201 |
|
|
$ |
14,716,639 |
|
|
$ |
9,824,590 |
|
|
$ |
4,161,029 |
|
Cash |
|
|
|
|
8,662 |
|
|
|
84 |
|
|
|
243 |
|
|
|
168 |
|
|
|
— |
|
Due
from broker |
|
|
|
|
989,095 |
|
|
|
9,135 |
|
|
|
8,145 |
|
|
|
10,386 |
|
|
|
1,081 |
|
Securities lending income receivable |
|
|
|
|
141,279 |
|
|
|
2,255 |
|
|
|
1,792 |
|
|
|
792 |
|
|
|
809 |
|
Dividend receivable |
|
|
|
|
11,949 |
|
|
|
78 |
|
|
|
120 |
|
|
|
13 |
|
|
|
8 |
|
Total Assets |
|
|
|
|
1,267,649,676 |
|
|
|
8,507,753 |
|
|
|
14,726,939 |
|
|
|
9,835,949 |
|
|
|
4,162,927 |
|
| |
|
|
|
|
|
|
|
|
|
|
|
|
|
|
|
|
|
|
|
|
|
|
Liabilities
|
|
|
|
|
|
|
|
|
|
|
|
|
|
|
|
|
|
|
|
|
|
|
Collateral for investments on loan |
|
|
|
|
140,959,766 |
|
|
|
1,906,306 |
|
|
|
1,911,647 |
|
|
|
1,040,224 |
|
|
|
1,021,562 |
|
Due
to broker |
|
|
|
|
1,910,936 |
|
|
|
9,604 |
|
|
|
16,921 |
|
|
|
25,998 |
|
|
|
364 |
|
Advisory fees payable |
|
|
|
|
489,063 |
|
|
|
4,062 |
|
|
|
7,900 |
|
|
|
5,417 |
|
|
|
1,937 |
|
Trustee fees payable |
|
|
|
|
4,992 |
|
|
|
31 |
|
|
|
57 |
|
|
|
39 |
|
|
|
14 |
|
Accrued expenses and other liabilities |
|
|
|
|
6,791 |
|
|
|
91 |
|
|
|
123 |
|
|
|
101 |
|
|
|
74 |
|
Total Liabilities |
|
|
|
|
143,371,548 |
|
|
|
1,920,094 |
|
|
|
1,936,648 |
|
|
|
1,071,779 |
|
|
|
1,023,951 |
|
Net
Assets |
|
|
|
$ |
1,124,278,128 |
|
|
$ |
6,587,659 |
|
|
$ |
12,790,291 |
|
|
$ |
8,764,170 |
|
|
$ |
3,138,976 |
|
| |
|
|
|
|
|
|
|
|
|
|
|
|
|
|
|
|
|
|
|
|
|
|
Composition of Net Assets
|
|
|
|
|
|
|
|
|
|
|
|
|
|
|
|
|
|
|
|
|
|
|
Paid-in capital |
|
|
|
$ |
1,147,362,529 |
|
|
$ |
12,437,402 |
|
|
$ |
13,097,439 |
|
|
$ |
8,811,166 |
|
|
$ |
3,097,540 |
|
Undistributed (accumulated) net investment income (loss) |
|
|
|
|
10,278,887 |
|
|
|
24,981 |
|
|
|
2,372 |
|
|
|
80,533 |
|
|
|
45,908 |
|
Undistributed (accumulated) net realized gain (loss) |
|
|
|
|
(63,824,201 |
) |
|
|
(6,042,032 |
) |
|
|
(462,534 |
) |
|
|
(233,466 |
) |
|
|
(50,979 |
) |
Net
unrealized appreciation (depreciation) |
|
|
|
|
30,460,913 |
|
|
|
167,308 |
|
|
|
153,014 |
|
|
|
105,937 |
|
|
|
46,507 |
|
Net
Assets |
|
|
|
$ |
1,124,278,128 |
|
|
$ |
6,587,659 |
|
|
$ |
12,790,291 |
|
|
$ |
8,764,170 |
|
|
$ |
3,138,976 |
|
| |
|
|
|
|
|
|
|
|
|
|
|
|
|
|
|
|
|
|
|
|
|
|
NET ASSET VALUE PER SHARE
|
|
|
|
|
|
|
|
|
|
|
|
|
|
|
|
|
|
|
|
|
|
|
Shares Outstanding (no par value, unlimited shares authorized) |
|
|
|
|
37,000,000 |
|
|
|
250,000 |
|
|
|
500,000 |
|
|
|
400,001 |
|
|
|
150,001 |
|
Net
Asset Value Per Share |
|
|
|
$ |
30.39 |
|
|
$ |
26.35 |
|
|
$ |
25.58 |
|
|
$ |
21.91 |
|
|
$ |
20.93 |
|
Investments, at cost |
|
|
|
$ |
1,236,037,778 |
|
|
$ |
8,328,893 |
|
|
$ |
14,563,625 |
|
|
$ |
9,718,653 |
|
|
$ |
4,114,522 |
|
| |
| (a) Market value of securities on loan |
|
|
|
$ |
173,134,325 |
|
|
$ |
2,096,159 |
|
|
$ |
1,865,262 |
|
|
$ |
1,017,227 |
|
|
$ |
1,013,117 |
|
See notes to financial
statements.
135
Statements
of Assets and Liabilities (continued)
April
30, 2018
|
|
|
|
IQ Global
Resources
ETF
|
|
IQ Merger
Arbitrage
ETF
|
|
IQ Real
Return ETF
|
|
IQ Global
Agribusiness
Small
Cap ETF
|
|
IQ U.S. Real
Estate
Small Cap
ETF
|
Assets
|
|
|
|
|
|
|
|
|
|
|
|
|
|
|
|
|
|
|
|
|
|
|
Investments, at value (including securities on loan)(a) |
|
|
|
$ |
242,090,693 |
|
|
$ |
553,551,788 |
|
|
$ |
47,398,185 |
|
|
$ |
12,082,604 |
|
|
$ |
86,136,151 |
|
Cash |
|
|
|
|
— |
|
|
|
632,416 |
|
|
|
— |
|
|
|
— |
|
|
|
— |
|
Foreign currency(b) |
|
|
|
|
6,575 |
|
|
|
— |
|
|
|
— |
|
|
|
— |
|
|
|
— |
|
Cash deposited at broker for Swap collateral |
|
|
|
|
1,150,028 |
|
|
|
— |
|
|
|
— |
|
|
|
— |
|
|
|
— |
|
Dividend receivable |
|
|
|
|
510,463 |
|
|
|
318,346 |
|
|
|
179 |
|
|
|
56,995 |
|
|
|
161,109 |
|
Due from broker |
|
|
|
|
141,096 |
|
|
|
1,468,765 |
|
|
|
— |
|
|
|
— |
|
|
|
— |
|
Reclaims receivable |
|
|
|
|
101,035 |
|
|
|
14,252 |
|
|
|
— |
|
|
|
290 |
|
|
|
— |
|
Securities lending income receivable |
|
|
|
|
3,431 |
|
|
|
4,054 |
|
|
|
7,619 |
|
|
|
711 |
|
|
|
3,511 |
|
Receivable for investments sold |
|
|
|
|
— |
|
|
|
38,836 |
|
|
|
— |
|
|
|
— |
|
|
|
1,208,888 |
|
Total Assets |
|
|
|
|
244,003,321 |
|
|
|
556,028,457 |
|
|
|
47,405,983 |
|
|
|
12,140,600 |
|
|
|
87,509,659 |
|
| |
|
|
|
|
|
|
|
|
|
|
|
|
|
|
|
|
|
|
|
|
|
|
Liabilities
|
|
|
|
|
|
|
|
|
|
|
|
|
|
|
|
|
|
|
|
|
|
|
Collateral for investments on loan |
|
|
|
|
4,839,696 |
|
|
|
26,324,770 |
|
|
|
2,070,277 |
|
|
|
246,668 |
|
|
|
3,865,903 |
|
Due to broker |
|
|
|
|
299,134 |
|
|
|
3,980,418 |
|
|
|
— |
|
|
|
— |
|
|
|
— |
|
Advisory fees payable |
|
|
|
|
149,620 |
|
|
|
317,192 |
|
|
|
15,763 |
|
|
|
7,278 |
|
|
|
46,984 |
|
Trustee fees payable |
|
|
|
|
1,064 |
|
|
|
2,241 |
|
|
|
138 |
|
|
|
56 |
|
|
|
386 |
|
Cash due to custodian |
|
|
|
|
38 |
|
|
|
— |
|
|
|
— |
|
|
|
— |
|
|
|
— |
|
Payable for investments purchased |
|
|
|
|
— |
|
|
|
— |
|
|
|
— |
|
|
|
13,757 |
|
|
|
295,799 |
|
Payable for capital shares repurchased |
|
|
|
|
— |
|
|
|
— |
|
|
|
— |
|
|
|
— |
|
|
|
1,210,955 |
|
Foreign currency due to custodian |
|
|
|
|
— |
|
|
|
15,248 |
|
|
|
— |
|
|
|
— |
|
|
|
— |
|
Accrued expenses and other liabilities |
|
|
|
|
1,294 |
|
|
|
2,708 |
|
|
|
373 |
|
|
|
116 |
|
|
|
477 |
|
Total Liabilities |
|
|
|
|
5,290,846 |
|
|
|
30,642,577 |
|
|
|
2,086,551 |
|
|
|
267,875 |
|
|
|
5,420,504 |
|
Net Assets |
|
|
|
$ |
238,712,475 |
|
|
$ |
525,385,880 |
|
|
$ |
45,319,432 |
|
|
$ |
11,872,725 |
|
|
$ |
82,089,155 |
|
| |
|
|
|
|
|
|
|
|
|
|
|
|
|
|
|
|
|
|
|
|
|
|
Composition of Net Assets
|
|
|
|
|
|
|
|
|
|
|
|
|
|
|
|
|
|
|
|
|
|
|
Paid-in capital |
|
|
|
$ |
275,023,217 |
|
|
$ |
535,330,288 |
|
|
$ |
46,735,862 |
|
|
$ |
18,431,405 |
|
|
$ |
95,431,644 |
|
Undistributed (accumulated) net investment income (loss) |
|
|
|
|
(69,350 |
) |
|
|
(120,110 |
) |
|
|
172,756 |
|
|
|
44,699 |
|
|
|
94,696 |
|
Undistributed (accumulated) net realized gain (loss) |
|
|
|
|
(44,582,270 |
) |
|
|
(6,960,789 |
) |
|
|
(1,482,281 |
) |
|
|
(8,654,189 |
) |
|
|
(4,029,296 |
) |
Net unrealized appreciation (depreciation) |
|
|
|
|
8,340,878 |
|
|
|
(2,863,509 |
) |
|
|
(106,905 |
) |
|
|
2,050,810 |
|
|
|
(9,407,889 |
) |
Net Assets |
|
|
|
$ |
238,712,475 |
|
|
$ |
525,385,880 |
|
|
$ |
45,319,432 |
|
|
$ |
11,872,725 |
|
|
$ |
82,089,155 |
|
| |
|
|
|
|
|
|
|
|
|
|
|
|
|
|
|
|
|
|
|
|
|
|
NET ASSET VALUE PER SHARE
|
|
|
|
|
|
|
|
|
|
|
|
|
|
|
|
|
|
|
|
|
|
|
Shares Outstanding (no par value, unlimited shares authorized) |
|
|
|
|
8,600,000 |
|
|
|
17,100,000 |
|
|
|
1,650,000 |
|
|
|
350,000 |
|
|
|
3,400,000 |
|
Net Asset Value Per Share |
|
|
|
$ |
27.76 |
|
|
$ |
30.72 |
|
|
$ |
27.47 |
|
|
$ |
33.92 |
|
|
$ |
24.14 |
|
Investments, at cost |
|
|
|
$ |
233,747,804 |
|
|
$ |
556,404,810 |
|
|
$ |
47,505,090 |
|
|
$ |
10,030,378 |
|
|
$ |
95,544,040 |
|
| |
(a) Market value of securities on loan |
|
|
|
$ |
20,754,674 |
|
|
$ |
49,063,687 |
|
|
$ |
7,265,170 |
|
|
$ |
740,685 |
|
|
$ |
22,892,721 |
|
(b) Cost of foreign currency |
|
|
|
$ |
6,803 |
|
|
$ |
(11,475 |
) |
|
$ |
— |
|
|
$ |
— |
|
|
$ |
— |
|
See notes to financial
statements.
136
Statements of Assets and Liabilities
(continued)
April
30, 2018
|
|
|
|
IQ 50 Percent
Hedged FTSE
International ETF
|
|
IQ 50 Percent
Hedged FTSE
Europe ETF
|
|
IQ 50 Percent
Hedged FTSE
Japan ETF
|
|
IQ Leaders
GTAA
Tracker
ETF
|
|
IQ Enhanced
Core
Bond U.S.
ETF
|
Assets
|
|
|
|
|
|
|
|
|
|
|
|
|
|
|
|
|
|
|
|
|
|
|
Investments, at value (including securities on loan)(a) |
|
|
|
$ |
584,684,750 |
|
|
$ |
173,590,370 |
|
|
$ |
34,344,034 |
|
|
$ |
57,248,735 |
|
|
$ |
51,615,604 |
|
Foreign currency(b) |
|
|
|
|
331,237 |
|
|
|
227,953 |
|
|
|
3,520 |
|
|
|
— |
|
|
|
— |
|
Cash deposited at broker for Forward foreign currency contracts collateral |
|
|
|
|
20,000 |
|
|
|
— |
|
|
|
— |
|
|
|
— |
|
|
|
— |
|
Unrealized appreciation on Forward foreign currency contracts |
|
|
|
|
6,337,696 |
|
|
|
1,867,569 |
|
|
|
523,038 |
|
|
|
— |
|
|
|
— |
|
Dividend receivable |
|
|
|
|
2,355,785 |
|
|
|
489,852 |
|
|
|
293,957 |
|
|
|
107 |
|
|
|
754 |
|
Reclaims receivable |
|
|
|
|
556,855 |
|
|
|
319,689 |
|
|
|
3,720 |
|
|
|
— |
|
|
|
— |
|
Securities lending income receivable |
|
|
|
|
5,063 |
|
|
|
1,640 |
|
|
|
390 |
|
|
|
6,556 |
|
|
|
3,198 |
|
Receivable for investments sold |
|
|
|
|
— |
|
|
|
— |
|
|
|
6,012 |
|
|
|
— |
|
|
|
— |
|
Due from broker |
|
|
|
|
— |
|
|
|
— |
|
|
|
— |
|
|
|
23,462 |
|
|
|
— |
|
Total Assets |
|
|
|
|
594,291,386 |
|
|
|
176,497,073 |
|
|
|
35,174,671 |
|
|
|
57,278,860 |
|
|
|
51,619,556 |
|
| |
|
|
|
|
|
|
|
|
|
|
|
|
|
|
|
|
|
|
|
|
|
|
Liabilities
|
|
|
|
|
|
|
|
|
|
|
|
|
|
|
|
|
|
|
|
|
|
|
Collateral for investments on loan |
|
|
|
|
9,366,228 |
|
|
|
4,501,909 |
|
|
|
36,157 |
|
|
|
7,739,673 |
|
|
|
528,755 |
|
Payable for investments purchased |
|
|
|
|
6,081,351 |
|
|
|
3,149,861 |
|
|
|
— |
|
|
|
— |
|
|
|
— |
|
Unrealized depreciation on Forward foreign currency contracts |
|
|
|
|
233,191 |
|
|
|
67,332 |
|
|
|
21,937 |
|
|
|
— |
|
|
|
— |
|
Advisory fees payable |
|
|
|
|
87,769 |
|
|
|
39,031 |
|
|
|
8,292 |
|
|
|
18,358 |
|
|
|
8,401 |
|
Trustee fees payable |
|
|
|
|
2,539 |
|
|
|
725 |
|
|
|
155 |
|
|
|
216 |
|
|
|
226 |
|
Due to broker |
|
|
|
|
— |
|
|
|
— |
|
|
|
— |
|
|
|
47,522 |
|
|
|
— |
|
Cash due to custodian |
|
|
|
|
— |
|
|
|
— |
|
|
|
361,412 |
|
|
|
— |
|
|
|
— |
|
Accrued expenses and other liabilities |
|
|
|
|
3,274 |
|
|
|
1,004 |
|
|
|
235 |
|
|
|
314 |
|
|
|
317 |
|
Total Liabilities |
|
|
|
|
15,774,352 |
|
|
|
7,759,862 |
|
|
|
428,188 |
|
|
|
7,806,083 |
|
|
|
537,699 |
|
Net Assets |
|
|
|
$ |
578,517,034 |
|
|
$ |
168,737,211 |
|
|
$ |
34,746,483 |
|
|
$ |
49,472,777 |
|
|
$ |
51,081,857 |
|
| |
|
|
|
|
|
|
|
|
|
|
|
|
|
|
|
|
|
|
|
|
|
|
Composition of Net Assets
|
|
|
|
|
|
|
|
|
|
|
|
|
|
|
|
|
|
|
|
|
|
|
Paid-in capital |
|
|
|
$ |
555,523,121 |
|
|
$ |
156,984,309 |
|
|
$ |
30,215,359 |
|
|
$ |
49,949,230 |
|
|
$ |
56,858,127 |
|
Undistributed (accumulated) net investment income (loss) |
|
|
|
|
3,645,338 |
|
|
|
1,142,504 |
|
|
|
94,474 |
|
|
|
202,093 |
|
|
|
— |
|
Undistributed (accumulated) net realized gain (loss) |
|
|
|
|
(14,520,711 |
) |
|
|
(6,986,775 |
) |
|
|
(2,466,295 |
) |
|
|
(1,118,015 |
) |
|
|
(4,255,385 |
) |
Net unrealized appreciation (depreciation) |
|
|
|
|
33,869,286 |
|
|
|
17,597,173 |
|
|
|
6,902,945 |
|
|
|
439,469 |
|
|
|
(1,520,885 |
) |
Net Assets |
|
|
|
$ |
578,517,034 |
|
|
$ |
168,737,211 |
|
|
$ |
34,746,483 |
|
|
$ |
49,472,777 |
|
|
$ |
51,081,857 |
|
| |
|
|
|
|
|
|
|
|
|
|
|
|
|
|
|
|
|
|
|
|
|
|
NET ASSET VALUE PER SHARE
|
|
|
|
|
|
|
|
|
|
|
|
|
|
|
|
|
|
|
|
|
|
|
Shares Outstanding (no par value, unlimited shares authorized) |
|
|
|
|
26,750,001 |
|
|
|
8,300,001 |
|
|
|
1,550,001 |
|
|
|
2,050,001 |
|
|
|
2,750,001 |
|
Net Asset Value Per Share |
|
|
|
$ |
21.63 |
|
|
$ |
20.33 |
|
|
$ |
22.42 |
|
|
$ |
24.13 |
|
|
$ |
18.58 |
|
Investments, at cost |
|
|
|
$ |
556,863,367 |
|
|
$ |
157,781,737 |
|
|
$ |
27,933,854 |
|
|
$ |
56,809,266 |
|
|
$ |
53,136,489 |
|
| |
(a) Market value of securities on loan |
|
|
|
$ |
11,269,536 |
|
|
$ |
4,262,780 |
|
|
$ |
246,157 |
|
|
$ |
8,117,227 |
|
|
$ |
518,694 |
|
| (b) Cost of foreign currency |
|
|
|
$ |
332,453 |
|
|
$ |
229,323 |
|
|
$ |
3,522 |
|
|
$ |
— |
|
|
$ |
— |
|
See notes to financial
statements.
137
Statements of Assets and Liabilities
(continued)
April
30, 2018
|
|
|
|
IQ Enhanced
Core Plus
Bond
U.S. ETF
|
|
IQ S&P High Yield
Low
Volatility
Bond ETF
|
|
IQ Chaikin
U.S. Small
Cap
ETF
|
|
IQ Chaikin
U.S. Large
Cap
ETF
|
Assets
|
|
|
|
|
|
|
|
|
|
|
|
|
|
|
|
|
|
|
Investments, at value (including securities on loan)(a) |
|
|
|
$ |
394,142,056 |
|
|
$ |
105,798,677 |
|
|
$ |
469,771,508 |
|
|
$ |
319,868,326 |
|
Investments in affiliates, at value |
|
|
|
|
13,174,984 |
|
|
|
— |
|
|
|
— |
|
|
|
— |
|
Receivable for investments sold |
|
|
|
|
954,212 |
|
|
|
7,878,041 |
|
|
|
1,786,362 |
|
|
|
1,264,415 |
|
Securities lending income receivable |
|
|
|
|
84,235 |
|
|
|
— |
|
|
|
3,492 |
|
|
|
— |
|
Dividend receivable |
|
|
|
|
1,511 |
|
|
|
— |
|
|
|
54,988 |
|
|
|
281,522 |
|
Interest receivable |
|
|
|
|
— |
|
|
|
1,446,954 |
|
|
|
341 |
|
|
|
— |
|
Total Assets |
|
|
|
|
408,356,998 |
|
|
|
115,123,672 |
|
|
|
471,616,691 |
|
|
|
321,414,263 |
|
| |
|
|
|
|
|
|
|
|
|
|
|
|
|
|
|
|
|
|
Liabilities
|
|
|
|
|
|
|
|
|
|
|
|
|
|
|
|
|
|
|
Collateral for investments on loan |
|
|
|
|
73,354,896 |
|
|
|
— |
|
|
|
4,391,432 |
|
|
|
— |
|
Payable for capital shares repurchased |
|
|
|
|
954,221 |
|
|
|
— |
|
|
|
— |
|
|
|
1,264,822 |
|
Advisory fees payable |
|
|
|
|
55,087 |
|
|
|
34,529 |
|
|
|
129,018 |
|
|
|
61,574 |
|
Trustee fees payable |
|
|
|
|
1,344 |
|
|
|
477 |
|
|
|
1,988 |
|
|
|
2,079 |
|
Payable for investments purchased |
|
|
|
|
— |
|
|
|
7,895,564 |
|
|
|
1,747,340 |
|
|
|
— |
|
Cash due to custodian |
|
|
|
|
— |
|
|
|
— |
|
|
|
— |
|
|
|
85,112 |
|
Accrued expenses and other liabilities |
|
|
|
|
1,802 |
|
|
|
636 |
|
|
|
347 |
|
|
|
597 |
|
Total Liabilities |
|
|
|
|
74,367,350 |
|
|
|
7,931,206 |
|
|
|
6,270,125 |
|
|
|
1,414,184 |
|
Net Assets |
|
|
|
$ |
333,989,648 |
|
|
$ |
107,192,466 |
|
|
$ |
465,346,566 |
|
|
$ |
320,000,079 |
|
| |
|
|
|
|
|
|
|
|
|
|
|
|
|
|
|
|
|
|
Composition of Net Assets
|
|
|
|
|
|
|
|
|
|
|
|
|
|
|
|
|
|
|
Paid-in capital |
|
|
|
$ |
352,918,510 |
|
|
$ |
110,819,269 |
|
|
$ |
469,755,887 |
|
|
$ |
322,292,341 |
|
Undistributed (accumulated) net investment income (loss) |
|
|
|
|
14,785 |
|
|
|
368,463 |
|
|
|
144,782 |
|
|
|
245,918 |
|
Undistributed (accumulated) net realized gain (loss) |
|
|
|
|
(11,179,552 |
) |
|
|
(1,312,026 |
) |
|
|
(8,075,018 |
) |
|
|
(5,340,843 |
) |
Net unrealized appreciation (depreciation) |
|
|
|
|
(7,764,095 |
) |
|
|
(2,683,240 |
) |
|
|
3,520,915 |
|
|
|
2,802,663 |
|
Net Assets |
|
|
|
$ |
333,989,648 |
|
|
$ |
107,192,466 |
|
|
$ |
465,346,566 |
|
|
$ |
320,000,079 |
|
| |
|
|
|
|
|
|
|
|
|
|
|
|
|
|
|
|
|
|
NET ASSET VALUE PER SHARE
|
|
|
|
|
|
|
|
|
|
|
|
|
|
|
|
|
|
|
Shares Outstanding (no par value, unlimited shares authorized) |
|
|
|
|
17,500,001 |
|
|
|
4,400,001 |
|
|
|
17,150,001 |
|
|
|
12,650,001 |
|
Net Asset Value Per Share |
|
|
|
$ |
19.09 |
|
|
$ |
24.36 |
|
|
$ |
27.13 |
|
|
$ |
25.30 |
|
Investments, at cost |
|
|
|
$ |
401,756,963 |
|
|
$ |
108,481,917 |
|
|
$ |
466,250,593 |
|
|
$ |
317,065,663 |
|
Investments in affiliates, at cost |
|
|
|
$ |
13,324,172 |
|
|
$ |
— |
|
|
$ |
— |
|
|
$ |
— |
|
| |
| (a) Market value of securities on loan |
|
|
|
$ |
74,895,524 |
|
|
$ |
— |
|
|
$ |
20,440,510 |
|
|
$ |
— |
|
See notes to financial
statements.
138
Statements
of Operations
For the
year ended April 30, 2018
|
|
|
|
IQ Hedge
Multi-Strategy
Tracker
ETF
|
|
IQ Hedge
Macro
Tracker
ETF
|
|
IQ Hedge
Market Neutral
Tracker
ETF
|
|
IQ Hedge
Long/Short
Tracker
ETF
|
|
IQ Hedge
Event-Driven
Tracker
ETF
|
Investment Income
|
|
|
|
|
|
|
|
|
|
|
|
|
|
|
|
|
|
|
|
|
|
|
Dividend income |
|
|
|
$ |
25,636,733 |
|
|
$ |
126,197 |
|
|
$ |
261,213 |
|
|
$ |
140,257 |
|
|
$ |
103,243 |
|
Income from affiliates |
|
|
|
|
608,524 |
|
|
|
— |
|
|
|
— |
|
|
|
— |
|
|
|
— |
|
Securities lending income, net of borrower rebates |
|
|
|
|
1,404,240 |
|
|
|
19,564 |
|
|
|
17,477 |
|
|
|
4,161 |
|
|
|
3,696 |
|
Total investment income |
|
|
|
|
27,649,497 |
|
|
|
145,761 |
|
|
|
278,690 |
|
|
|
144,418 |
|
|
|
106,939 |
|
| |
|
|
|
|
|
|
|
|
|
|
|
|
|
|
|
|
|
|
|
|
|
|
Expenses
|
|
|
|
|
|
|
|
|
|
|
|
|
|
|
|
|
|
|
|
|
|
|
Advisory fees |
|
|
|
|
8,236,099 |
|
|
|
49,193 |
|
|
|
88,285 |
|
|
|
40,958 |
|
|
|
23,621 |
|
Trustee fees |
|
|
|
|
46,350 |
|
|
|
259 |
|
|
|
497 |
|
|
|
225 |
|
|
|
132 |
|
Legal fees |
|
|
|
|
6,614 |
|
|
|
— |
|
|
|
63 |
|
|
|
84 |
|
|
|
10 |
|
Compliance fees |
|
|
|
|
4,200 |
|
|
|
26 |
|
|
|
44 |
|
|
|
18 |
|
|
|
12 |
|
Miscellaneous |
|
|
|
|
2,224 |
|
|
|
1 |
|
|
|
58 |
|
|
|
58 |
|
|
|
58 |
|
Total expenses |
|
|
|
|
8,295,487 |
|
|
|
49,479 |
|
|
|
88,947 |
|
|
|
41,343 |
|
|
|
23,833 |
|
Waiver/Reimbursement |
|
|
|
|
(1,227,888 |
) |
|
|
— |
|
|
|
— |
|
|
|
— |
|
|
|
— |
|
Net
expenses |
|
|
|
|
7,067,599 |
|
|
|
49,479 |
|
|
|
88,947 |
|
|
|
41,343 |
|
|
|
23,833 |
|
Net
investment income |
|
|
|
|
20,581,898 |
|
|
|
96,282 |
|
|
|
189,743 |
|
|
|
103,075 |
|
|
|
83,106 |
|
| |
|
|
|
|
|
|
|
|
|
|
|
|
|
|
|
|
|
|
|
|
|
|
Realized and Unrealized Gain (Loss) on Investments and Swap Transactions
|
|
|
|
|
|
|
|
|
|
|
|
|
|
|
|
|
|
|
|
|
|
|
Net
realized gain (loss) from:
|
|
|
|
|
|
|
|
|
|
|
|
|
|
|
|
|
|
|
|
|
|
|
Investment securities |
|
|
|
|
13,707,707 |
|
|
|
8,995 |
|
|
|
59,267 |
|
|
|
(101,676 |
) |
|
|
23,288 |
|
Investment in affiliates |
|
|
|
|
933,272 |
|
|
|
— |
|
|
|
— |
|
|
|
— |
|
|
|
— |
|
In-Kind redemptions |
|
|
|
|
5,434,479 |
|
|
|
— |
|
|
|
— |
|
|
|
116,654 |
|
|
|
— |
|
Affiliates in-kind redemptions |
|
|
|
|
255,687 |
|
|
|
— |
|
|
|
— |
|
|
|
— |
|
|
|
— |
|
Swap transactions |
|
|
|
|
(11,177,056 |
) |
|
|
(80,149 |
) |
|
|
(112,528 |
) |
|
|
746 |
|
|
|
884 |
|
Distributions by other investment companies |
|
|
|
|
110,285 |
|
|
|
237 |
|
|
|
— |
|
|
|
638 |
|
|
|
— |
|
Net
realized gain (loss) |
|
|
|
|
9,264,374 |
|
|
|
(70,917 |
) |
|
|
(53,261 |
) |
|
|
16,362 |
|
|
|
24,172 |
|
Net
change in net unrealized appreciation
(depreciation) on:
|
|
|
|
|
|
|
|
|
|
|
|
|
|
|
|
|
|
|
|
|
|
|
Investment securities |
|
|
|
|
15,923,607 |
|
|
|
197,348 |
|
|
|
13,566 |
|
|
|
56,690 |
|
|
|
13,877 |
|
Investment in affiliates |
|
|
|
|
(460,203 |
) |
|
|
— |
|
|
|
— |
|
|
|
— |
|
|
|
— |
|
Net
change in net unrealized appreciation (depreciation) |
|
|
|
|
15,463,404 |
|
|
|
197,348 |
|
|
|
13,566 |
|
|
|
56,690 |
|
|
|
13,877 |
|
Net
realized and unrealized gain (loss) |
|
|
|
|
24,727,778 |
|
|
|
126,431 |
|
|
|
(39,695 |
) |
|
|
73,052 |
|
|
|
38,049 |
|
Net Increase in Net Assets Resulting from Operations |
|
|
|
$ |
45,309,676 |
|
|
$ |
222,713 |
|
|
$ |
150,048 |
|
|
$ |
176,127 |
|
|
$ |
121,155 |
|
See notes to financial
statements.
139
Statements of Operations (continued)
For
the year ended April 30, 2018
|
|
|
|
IQ Global
Resources
ETF
|
|
IQ Merger
Arbitrage
ETF
|
|
IQ Real
Return ETF
|
|
IQ Global
Agribusiness
Small
Cap ETF
|
|
IQ U.S. Real
Estate
Small Cap
ETF
|
Investment Income
|
|
|
|
|
|
|
|
|
|
|
|
|
|
|
|
|
|
|
|
|
|
|
Dividend income* |
|
|
|
$ |
6,641,417 |
|
|
$ |
3,487,442 |
|
|
$ |
360,070 |
|
|
$ |
180,637 |
|
|
$ |
4,332,666 |
|
Securities lending income, net of borrower rebates |
|
|
|
|
40,864 |
|
|
|
158,660 |
|
|
|
115,641 |
|
|
|
11,813 |
|
|
|
48,505 |
|
Total investment income |
|
|
|
|
6,682,281 |
|
|
|
3,646,102 |
|
|
|
475,711 |
|
|
|
192,450 |
|
|
|
4,381,171 |
|
| |
|
|
|
|
|
|
|
|
|
|
|
|
|
|
|
|
|
|
|
|
|
|
Expenses
|
|
|
|
|
|
|
|
|
|
|
|
|
|
|
|
|
|
|
|
|
|
|
Advisory fees |
|
|
|
|
1,535,568 |
|
|
|
2,500,004 |
|
|
|
143,848 |
|
|
|
93,547 |
|
|
|
744,675 |
|
Trustee fees |
|
|
|
|
8,769 |
|
|
|
13,260 |
|
|
|
1,227 |
|
|
|
540 |
|
|
|
4,337 |
|
Legal fees |
|
|
|
|
1,806 |
|
|
|
4,893 |
|
|
|
216 |
|
|
|
52 |
|
|
|
757 |
|
Compliance fees |
|
|
|
|
766 |
|
|
|
1,095 |
|
|
|
110 |
|
|
|
49 |
|
|
|
411 |
|
Miscellaneous |
|
|
|
|
58 |
|
|
|
58 |
|
|
|
212 |
|
|
|
188 |
|
|
|
58 |
|
Total expenses |
|
|
|
|
1,546,967 |
|
|
|
2,519,310 |
|
|
|
145,613 |
|
|
|
94,376 |
|
|
|
750,238 |
|
Net
investment income |
|
|
|
|
5,135,314 |
|
|
|
1,126,792 |
|
|
|
330,098 |
|
|
|
98,074 |
|
|
|
3,630,933 |
|
| |
|
|
|
|
|
|
|
|
|
|
|
|
|
|
|
|
|
|
|
|
|
|
Realized and Unrealized Gain (Loss) on Investments, Swap transactions and Forward foreign currency contracts and
translation
|
|
|
|
|
|
|
|
|
|
|
|
|
|
|
|
|
|
|
|
|
|
|
Net
realized gain (loss) from:
|
|
|
|
|
|
|
|
|
|
|
|
|
|
|
|
|
|
|
|
|
|
|
Investment securities |
|
|
|
|
1,085,801 |
|
|
|
(5,429,056 |
) |
|
|
627,057 |
|
|
|
(139,416 |
) |
|
|
936,891 |
|
In-Kind redemptions |
|
|
|
|
1,901,242 |
|
|
|
18,986,171 |
|
|
|
— |
|
|
|
434,587 |
|
|
|
1,847,132 |
|
Swap transactions |
|
|
|
|
(4,277,493 |
) |
|
|
(6,400,405 |
) |
|
|
— |
|
|
|
— |
|
|
|
— |
|
Distributions by other investment companies |
|
|
|
|
— |
|
|
|
— |
|
|
|
1,839 |
|
|
|
— |
|
|
|
— |
|
Foreign currency transactions |
|
|
|
|
(424,236 |
) |
|
|
(212,766 |
) |
|
|
— |
|
|
|
(2,281 |
) |
|
|
— |
|
Net
realized gain (loss) |
|
|
|
|
(1,714,686 |
) |
|
|
6,943,944 |
|
|
|
628,896 |
|
|
|
292,890 |
|
|
|
2,784,023 |
|
Net
change in net unrealized appreciation (depreciation) on:
|
|
|
|
|
|
|
|
|
|
|
|
|
|
|
|
|
|
|
|
|
|
|
Investment securities |
|
|
|
|
9,686,630 |
|
|
|
(7,226,523 |
) |
|
|
(487,900 |
) |
|
|
110,159 |
|
|
|
(13,108,294 |
) |
Foreign currency translations |
|
|
|
|
(860 |
) |
|
|
3,805 |
|
|
|
— |
|
|
|
(900 |
) |
|
|
— |
|
Net
change in net unrealized appreciation (depreciation) |
|
|
|
|
9,685,770 |
|
|
|
(7,222,718 |
) |
|
|
(487,900 |
) |
|
|
109,259 |
|
|
|
(13,108,294 |
) |
Net
realized and unrealized gain (loss) |
|
|
|
|
7,971,084 |
|
|
|
(278,774 |
) |
|
|
140,996 |
|
|
|
402,149 |
|
|
|
(10,324,271 |
) |
| |
|
|
|
|
|
|
|
|
|
|
|
|
|
|
|
|
|
|
|
|
|
|
Net Increase (Decrease) in Net Assets Resulting from Operations |
|
|
|
$ |
13,106,398 |
|
|
$ |
848,018 |
|
|
$ |
471,094 |
|
|
$ |
500,223 |
|
|
$ |
(6,693,338 |
) |
* Net of foreign taxes withheld of: |
|
|
|
$ |
430,507 |
|
|
$ |
58,974 |
|
|
$ |
— |
|
|
$ |
14,768 |
|
|
$ |
— |
|
See notes to financial
statements.
140
Statements of Operations (continued)
For
the year ended April 30, 2018
|
|
|
|
IQ 50 Percent
Hedged FTSE
International ETF
|
|
IQ 50 Percent
Hedged FTSE
Europe
ETF
|
|
IQ 50 Percent
Hedged FTSE
Japan
ETF
|
|
IQ Leaders
GTAA
Tracker
ETF
|
|
IQ Enhanced
Core
Bond U.S.
ETF
|
Investment Income
|
|
|
|
|
|
|
|
|
|
|
|
|
|
|
|
|
|
|
|
|
|
|
Dividend income* |
|
|
|
$ |
12,260,420 |
|
|
$ |
4,531,217 |
|
|
$ |
627,328 |
|
|
$ |
1,105,031 |
|
|
$ |
1,657,455 |
|
Securities lending income, net of borrower rebates |
|
|
|
|
28,243 |
|
|
|
13,983 |
|
|
|
3,956 |
|
|
|
60,883 |
|
|
|
51,602 |
|
Total investment income |
|
|
|
|
12,288,663 |
|
|
|
4,545,200 |
|
|
|
631,284 |
|
|
|
1,165,914 |
|
|
|
1,709,057 |
|
| |
|
|
|
|
|
|
|
|
|
|
|
|
|
|
|
|
|
|
|
|
|
|
Expenses
|
|
|
|
|
|
|
|
|
|
|
|
|
|
|
|
|
|
|
|
|
|
|
Advisory fees |
|
|
|
|
1,390,851 |
|
|
|
681,595 |
|
|
|
146,656 |
|
|
|
182,009 |
|
|
|
169,167 |
|
Trustee fees |
|
|
|
|
15,660 |
|
|
|
5,513 |
|
|
|
1,328 |
|
|
|
1,675 |
|
|
|
2,807 |
|
Legal fees |
|
|
|
|
5,733 |
|
|
|
1,929 |
|
|
|
299 |
|
|
|
371 |
|
|
|
290 |
|
Compliance fees |
|
|
|
|
1,299 |
|
|
|
484 |
|
|
|
119 |
|
|
|
147 |
|
|
|
268 |
|
Miscellaneous |
|
|
|
|
742 |
|
|
|
286 |
|
|
|
58 |
|
|
|
53 |
|
|
|
58 |
|
Total expenses |
|
|
|
|
1,414,285 |
|
|
|
689,807 |
|
|
|
148,460 |
|
|
|
184,255 |
|
|
|
172,590 |
|
Waiver/Reimbursement |
|
|
|
|
(541,043 |
) |
|
|
(200,854 |
) |
|
|
(41,880 |
) |
|
|
— |
|
|
|
(33,834 |
) |
Net expenses |
|
|
|
|
873,242 |
|
|
|
488,953 |
|
|
|
106,580 |
|
|
|
184,255 |
|
|
|
138,756 |
|
Net investment income |
|
|
|
|
11,415,421 |
|
|
|
4,056,247 |
|
|
|
524,704 |
|
|
|
981,659 |
|
|
|
1,570,301 |
|
| |
|
|
|
|
|
|
|
|
|
|
|
|
|
|
|
|
|
|
|
|
|
|
Realized and Unrealized Gain (Loss) on Investments, Swap transactions and Forward foreign currency contracts and
translation
|
|
|
|
|
|
|
|
|
|
|
|
|
|
|
|
|
|
|
|
|
|
|
Net realized gain (loss) from:
|
|
|
|
|
|
|
|
|
|
|
|
|
|
|
|
|
|
|
|
|
|
|
Investment securities |
|
|
|
|
(1,709,384 |
) |
|
|
(767,056 |
) |
|
|
(45,421 |
) |
|
|
(543,422 |
) |
|
|
(1,686,839 |
) |
In-Kind redemptions |
|
|
|
|
23,998,052 |
|
|
|
— |
|
|
|
352,818 |
|
|
|
3,706,661 |
|
|
|
(294,390 |
) |
Swap transactions |
|
|
|
|
— |
|
|
|
— |
|
|
|
— |
|
|
|
112,014 |
|
|
|
— |
|
Distributions by other investment companies |
|
|
|
|
— |
|
|
|
— |
|
|
|
— |
|
|
|
2,112 |
|
|
|
— |
|
Forward foreign currency contracts |
|
|
|
|
(13,372,224 |
) |
|
|
(6,308,067 |
) |
|
|
(622,845 |
) |
|
|
— |
|
|
|
— |
|
Foreign currency transactions |
|
|
|
|
(128,116 |
) |
|
|
(21,009 |
) |
|
|
(4,136 |
) |
|
|
— |
|
|
|
— |
|
Net realized gain (loss) |
|
|
|
|
8,788,328 |
|
|
|
(7,096,132 |
) |
|
|
(319,584 |
) |
|
|
3,277,365 |
|
|
|
(1,981,229 |
) |
Net change in net unrealized appreciation (depreciation) on:
|
|
|
|
|
|
|
|
|
|
|
|
|
|
|
|
|
|
|
|
|
|
|
Investment securities |
|
|
|
|
9,836,539 |
|
|
|
13,468,927 |
|
|
|
4,783,854 |
|
|
|
(1,384,243 |
) |
|
|
(1,002,008 |
) |
Forward foreign currency contracts |
|
|
|
|
7,096,109 |
|
|
|
2,618,890 |
|
|
|
484,921 |
|
|
|
— |
|
|
|
— |
|
Foreign currency translations |
|
|
|
|
(61,487 |
) |
|
|
(17,689 |
) |
|
|
(7,755 |
) |
|
|
— |
|
|
|
— |
|
Net change in net unrealized appreciation (depreciation) |
|
|
|
|
16,871,161 |
|
|
|
16,070,128 |
|
|
|
5,261,020 |
|
|
|
(1,384,243 |
) |
|
|
(1,002,008 |
) |
Net realized and unrealized gain (loss) |
|
|
|
|
25,659,489 |
|
|
|
8,973,996 |
|
|
|
4,941,436 |
|
|
|
1,893,122 |
|
|
|
(2,983,237 |
) |
| |
|
|
|
|
|
|
|
|
|
|
|
|
|
|
|
|
|
|
|
|
|
|
Net Increase (Decrease) in Net Assets Resulting from Operations |
|
|
|
$ |
37,074,910 |
|
|
$ |
13,030,243 |
|
|
$ |
5,466,140 |
|
|
$ |
2,874,781 |
|
|
$ |
(1,412,936 |
) |
* Net of foreign taxes withheld of: |
|
|
|
$ |
1,124,144 |
|
|
$ |
453,737 |
|
|
$ |
69,748 |
|
|
$ |
— |
|
|
$ |
— |
|
See notes to financial
statements.
141
Statements of Operations (continued)
For
the year ended April 30, 2018
|
|
|
|
IQ Enhanced
Core Plus
Bond
U.S. ETF
|
|
IQ S&P High Yield
Low
Volatility
Bond ETF
|
|
IQ Chaikin
U.S. Small
Cap
ETF**
|
|
IQ Chaikin
U.S. Large
Cap
ETF***
|
Investment Income
|
|
|
|
|
|
|
|
|
|
|
|
|
|
|
|
|
|
|
Dividend income* |
|
|
|
$ |
9,239,477 |
|
|
$ |
— |
|
|
$ |
2,355,645 |
|
|
$ |
1,342,028 |
|
Income from affiliates |
|
|
|
|
263,724 |
|
|
|
— |
|
|
|
— |
|
|
|
— |
|
Interest income |
|
|
|
|
— |
|
|
|
4,141,009 |
|
|
|
— |
|
|
|
— |
|
Securities lending income, net of borrower rebates |
|
|
|
|
392,786 |
|
|
|
— |
|
|
|
157,912 |
|
|
|
— |
|
Total investment income |
|
|
|
|
9,895,987 |
|
|
|
4,141,009 |
|
|
|
2,513,557 |
|
|
|
1,342,028 |
|
| |
|
|
|
|
|
|
|
|
|
|
|
|
|
|
|
|
|
|
Expenses
|
|
|
|
|
|
|
|
|
|
|
|
|
|
|
|
|
|
|
Advisory fees |
|
|
|
|
750,579 |
|
|
|
378,950 |
|
|
|
914,759 |
|
|
|
182,375 |
|
Trustee fees |
|
|
|
|
11,561 |
|
|
|
3,484 |
|
|
|
9,546 |
|
|
|
4,495 |
|
Legal fees |
|
|
|
|
3,352 |
|
|
|
1,318 |
|
|
|
3,744 |
|
|
|
885 |
|
Compliance fees |
|
|
|
|
1,063 |
|
|
|
323 |
|
|
|
900 |
|
|
|
240 |
|
Miscellaneous |
|
|
|
|
58 |
|
|
|
31 |
|
|
|
57 |
|
|
|
57 |
|
Total expenses |
|
|
|
|
766,613 |
|
|
|
384,106 |
|
|
|
929,006 |
|
|
|
188,052 |
|
Waiver/Reimbursement |
|
|
|
|
(150,120 |
) |
|
|
(5,124 |
) |
|
|
(14,037 |
) |
|
|
(8,175 |
) |
Net expenses |
|
|
|
|
616,493 |
|
|
|
378,982 |
|
|
|
914,969 |
|
|
|
179,877 |
|
Net investment income |
|
|
|
|
9,279,494 |
|
|
|
3,762,027 |
|
|
|
1,598,588 |
|
|
|
1,162,151 |
|
| |
|
|
|
|
|
|
|
|
|
|
|
|
|
|
|
|
|
|
Realized and Unrealized Gain (Loss) on Investments
|
|
|
|
|
|
|
|
|
|
|
|
|
|
|
|
|
|
|
Net realized gain (loss) from:
|
|
|
|
|
|
|
|
|
|
|
|
|
|
|
|
|
|
|
Investment securities |
|
|
|
|
(6,283,511 |
) |
|
|
(1,289,536 |
) |
|
|
(8,093,406 |
) |
|
|
(5,340,843 |
) |
Investment in affiliates |
|
|
|
|
(498,810 |
) |
|
|
— |
|
|
|
— |
|
|
|
— |
|
In-Kind redemptions |
|
|
|
|
(811,623 |
) |
|
|
34,477 |
|
|
|
13,132,348 |
|
|
|
128,249 |
|
Affiliates in-kind redemptions |
|
|
|
|
(12,627 |
) |
|
|
— |
|
|
|
— |
|
|
|
— |
|
Net realized gain (loss) |
|
|
|
|
(7,606,571 |
) |
|
|
(1,255,059 |
) |
|
|
5,038,942 |
|
|
|
(5,212,594 |
) |
Net change in net unrealized appreciation (depreciation) on:
|
|
|
|
|
|
|
|
|
|
|
|
|
|
|
|
|
|
|
Investment securities |
|
|
|
|
(8,205,632 |
) |
|
|
(2,962,912 |
) |
|
|
3,520,915 |
|
|
|
2,802,663 |
|
Investment in affiliates |
|
|
|
|
18,609 |
|
|
|
— |
|
|
|
— |
|
|
|
— |
|
Net change in net unrealized appreciation (depreciation) |
|
|
|
|
(8,187,023 |
) |
|
|
(2,962,912 |
) |
|
|
3,520,915 |
|
|
|
2,802,663 |
|
Net realized and unrealized gain (loss) |
|
|
|
|
(15,793,594 |
) |
|
|
(4,217,971 |
) |
|
|
8,559,857 |
|
|
|
(2,409,931 |
) |
| |
|
|
|
|
|
|
|
|
|
|
|
|
|
|
|
|
|
|
Net Increase (Decrease) in Net Assets Resulting from Operations |
|
|
|
$ |
(6,514,100 |
) |
|
$ |
(455,944 |
) |
|
$ |
10,158,445 |
|
|
$ |
(1,247,780 |
) |
* Net of foreign taxes withheld of: |
|
|
|
$ |
— |
|
|
$ |
— |
|
|
$ |
— |
|
|
$ |
5,303 |
|
** |
|
Commencement of operations May 16, 2017 |
*** |
|
Commencement of operations December
13, 2017 |
See notes to financial
statements.
142
Statements of Changes in Net
Assets
|
|
|
|
IQ Hedge Multi-Strategy Tracker
ETF
|
|
IQ Hedge Macro Tracker ETF
|
|
|
|
|
|
For the Year
Ended April 30,
|
|
For the Year
Ended April 30,
|
|
|
|
|
|
2018
|
|
2017
|
|
2018
|
|
2017
|
Increase (Decrease) in Net Assets from Operations
|
|
|
|
|
|
|
|
|
|
|
|
|
|
|
|
|
|
|
Net
investment income |
|
|
|
$ |
20,581,898 |
|
|
$ |
19,447,581 |
|
|
$ |
96,282 |
|
|
$ |
156,346 |
|
Net
realized gain (loss) |
|
|
|
|
9,264,374 |
|
|
|
(8,854,800 |
) |
|
|
(70,917 |
) |
|
|
(153,982 |
) |
Net
change in net unrealized appreciation (depreciation) |
|
|
|
|
15,463,404 |
|
|
|
(6,724,170 |
) |
|
|
197,348 |
|
|
|
319,738 |
|
Net
increase in net assets resulting from operations |
|
|
|
|
45,309,676 |
|
|
|
3,868,611 |
|
|
|
222,713 |
|
|
|
322,102 |
|
| |
|
|
|
|
|
|
|
|
|
|
|
|
|
|
|
|
|
|
Dividends and Distributions to Shareholders from:
|
|
|
|
|
|
|
|
|
|
|
|
|
|
|
|
|
|
|
Net
investment income |
|
|
|
|
— |
|
|
|
(21,554 |
) |
|
|
— |
|
|
|
— |
|
| |
|
|
|
|
|
|
|
|
|
|
|
|
|
|
|
|
|
|
Capital Share Transactions
|
|
|
|
|
|
|
|
|
|
|
|
|
|
|
|
|
|
|
Proceeds from shares created |
|
|
|
|
125,582,960 |
|
|
|
152,639,051 |
|
|
|
— |
|
|
|
1,231,323 |
|
Cost of shares redeemed |
|
|
|
|
(109,193,905 |
) |
|
|
(168,026,883 |
) |
|
|
— |
|
|
|
(9,982,845 |
) |
Net
increase (decrease) from capital share transactions |
|
|
|
|
16,389,055 |
|
|
|
(15,387,832 |
) |
|
|
— |
|
|
|
(8,751,522 |
) |
Total increase (decrease) in net assets |
|
|
|
|
61,698,731 |
|
|
|
(11,540,775 |
) |
|
|
222,713 |
|
|
|
(8,429,420 |
) |
| |
|
|
|
|
|
|
|
|
|
|
|
|
|
|
|
|
|
|
Net Assets
|
|
|
|
|
|
|
|
|
|
|
|
|
|
|
|
|
|
|
Beginning of year |
|
|
|
|
1,062,579,397 |
|
|
|
1,074,120,172 |
|
|
|
6,364,946 |
|
|
|
14,794,366 |
|
End
of year |
|
|
|
$ |
1,124,278,128 |
|
|
$ |
1,062,579,397 |
|
|
$ |
6,587,659 |
|
|
$ |
6,364,946 |
|
Including undistributed (accumulated) net investment income (loss) as follows: |
|
|
|
$ |
10,278,887 |
|
|
$ |
(2,362,666 |
) |
|
$ |
24,981 |
|
|
$ |
136 |
|
| |
|
|
|
|
|
|
|
|
|
|
|
|
|
|
|
|
|
|
Changes in Shares Outstanding
|
|
|
|
|
|
|
|
|
|
|
|
|
|
|
|
|
|
|
Shares outstanding, beginning of year |
|
|
|
|
36,450,000 |
|
|
|
37,000,000 |
|
|
|
250,000 |
|
|
|
600,000 |
|
Shares created |
|
|
|
|
4,150,000 |
|
|
|
5,250,000 |
|
|
|
— |
|
|
|
50,000 |
|
Shares redeemed |
|
|
|
|
(3,600,000 |
) |
|
|
(5,800,000 |
) |
|
|
— |
|
|
|
(400,000 |
) |
Shares outstanding, end of year |
|
|
|
|
37,000,000 |
|
|
|
36,450,000 |
|
|
|
250,000 |
|
|
|
250,000 |
|
See notes to financial
statements.
143
Statements of Changes in Net Assets
(continued)
|
|
|
|
IQ Hedge Market Neutral Tracker
ETF
|
|
IQ Hedge Long/Short Tracker ETF
|
|
|
|
|
|
For the Year
Ended April 30,
|
|
For the Year
Ended April 30,
|
|
|
|
|
|
2018
|
|
2017
|
|
2018
|
|
2017
|
Increase (Decrease) in Net Assets from Operations
|
|
|
|
|
|
|
|
|
|
|
|
|
|
|
|
|
|
|
Net
investment income |
|
|
|
$ |
189,743 |
|
|
$ |
189,055 |
|
|
$ |
103,075 |
|
|
$ |
35,618 |
|
Net
realized gain (loss) |
|
|
|
|
(53,261 |
) |
|
|
45,583 |
|
|
|
16,362 |
|
|
|
87,214 |
|
Net
change in net unrealized appreciation (depreciation) |
|
|
|
|
13,566 |
|
|
|
(191,762 |
) |
|
|
56,690 |
|
|
|
50,947 |
|
Net
increase in net assets resulting from operations |
|
|
|
|
150,048 |
|
|
|
42,876 |
|
|
|
176,127 |
|
|
|
173,779 |
|
| |
|
|
|
|
|
|
|
|
|
|
|
|
|
|
|
|
|
|
Dividends and Distributions to Shareholders from:
|
|
|
|
|
|
|
|
|
|
|
|
|
|
|
|
|
|
|
Net
investment income |
|
|
|
|
— |
|
|
|
(173,905 |
) |
|
|
(16,706 |
) |
|
|
(5,839 |
) |
| |
|
|
|
|
|
|
|
|
|
|
|
|
|
|
|
|
|
|
Capital Share Transactions
|
|
|
|
|
|
|
|
|
|
|
|
|
|
|
|
|
|
|
Proceeds from shares created |
|
|
|
|
1,276,132 |
|
|
|
1,287,101 |
|
|
|
5,621,040 |
|
|
|
4,982,047 |
|
Cost of shares redeemed |
|
|
|
|
— |
|
|
|
(5,086,305 |
) |
|
|
(1,088,637 |
) |
|
|
(2,965,571 |
) |
Net
increase from capital share transactions |
|
|
|
|
1,276,132 |
|
|
|
(3,799,204 |
) |
|
|
4,532,403 |
|
|
|
2,016,476 |
|
Total increase in net assets |
|
|
|
|
1,426,180 |
|
|
|
(3,930,233 |
) |
|
|
4,691,824 |
|
|
|
2,184,416 |
|
| |
|
|
|
|
|
|
|
|
|
|
|
|
|
|
|
|
|
|
Net Assets
|
|
|
|
|
|
|
|
|
|
|
|
|
|
|
|
|
|
|
Beginning of year |
|
|
|
|
11,364,111 |
|
|
|
15,294,344 |
|
|
|
4,072,346 |
|
|
|
1,887,930 |
|
End
of year |
|
|
|
$ |
12,790,291 |
|
|
$ |
11,364,111 |
|
|
$ |
8,764,170 |
|
|
$ |
4,072,346 |
|
Including undistributed (accumulated) net investment income (loss) as follows: |
|
|
|
$ |
2,372 |
|
|
$ |
(142,935 |
) |
|
$ |
80,533 |
|
|
$ |
(10,481 |
) |
| |
|
|
|
|
|
|
|
|
|
|
|
|
|
|
|
|
|
|
Changes in Shares Outstanding
|
|
|
|
|
|
|
|
|
|
|
|
|
|
|
|
|
|
|
Shares outstanding, beginning of year |
|
|
|
|
450,000 |
|
|
|
600,000 |
|
|
|
200,001 |
|
|
|
100,001 |
|
Shares created |
|
|
|
|
50,000 |
|
|
|
50,000 |
|
|
|
250,000 |
|
|
|
250,000 |
|
Shares redeemed |
|
|
|
|
— |
|
|
|
(200,000 |
) |
|
|
(50,000 |
) |
|
|
(150,000 |
) |
Shares outstanding, end of year |
|
|
|
|
500,000 |
|
|
|
450,000 |
|
|
|
400,001 |
|
|
|
200,001 |
|
See notes to financial
statements.
144
Statements of Changes in Net Assets
(continued)
|
|
|
|
IQ Hedge Event-Driven Tracker
ETF
|
|
IQ Global Resources ETF
|
|
|
|
|
|
For the Year
Ended April 30,
|
|
For the Year
Ended April 30,
|
|
|
|
|
|
2018
|
|
2017
|
|
2018
|
|
2017
|
Increase (Decrease) in Net Assets from Operations
|
|
|
|
|
|
|
|
|
|
|
|
|
|
|
|
|
|
|
Net
investment income |
|
|
|
$ |
83,106 |
|
|
$ |
99,540 |
|
|
$ |
5,135,314 |
|
|
$ |
1,850,992 |
|
Net
realized gain (loss) |
|
|
|
|
24,172 |
|
|
|
(3,754 |
) |
|
|
(1,714,686 |
) |
|
|
10,673,002 |
|
Net
change in net unrealized appreciation (depreciation) |
|
|
|
|
13,877 |
|
|
|
115,772 |
|
|
|
9,685,770 |
|
|
|
(7,331,845 |
) |
Net
increase in net assets resulting from operations |
|
|
|
|
121,155 |
|
|
|
211,558 |
|
|
|
13,106,398 |
|
|
|
5,192,149 |
|
| |
|
|
|
|
|
|
|
|
|
|
|
|
|
|
|
|
|
|
Dividends and Distributions to Shareholders from:
|
|
|
|
|
|
|
|
|
|
|
|
|
|
|
|
|
|
|
Net
investment income |
|
|
|
|
(70,341 |
) |
|
|
(114,315 |
) |
|
|
— |
|
|
|
(676,550 |
) |
| |
|
|
|
|
|
|
|
|
|
|
|
|
|
|
|
|
|
|
Capital Share Transactions
|
|
|
|
|
|
|
|
|
|
|
|
|
|
|
|
|
|
|
Proceeds from shares created |
|
|
|
|
— |
|
|
|
5,065,335 |
|
|
|
59,545,258 |
|
|
|
179,178,063 |
|
Cost of shares redeemed |
|
|
|
|
— |
|
|
|
(4,014,533 |
) |
|
|
(13,389,404 |
) |
|
|
(72,167,934 |
) |
Net
increase from capital share transactions |
|
|
|
|
— |
|
|
|
1,050,802 |
|
|
|
46,155,854 |
|
|
|
107,010,129 |
|
Total increase in net assets |
|
|
|
|
50,814 |
|
|
|
1,148,045 |
|
|
|
59,262,252 |
|
|
|
111,525,728 |
|
| |
|
|
|
|
|
|
|
|
|
|
|
|
|
|
|
|
|
|
Net Assets
|
|
|
|
|
|
|
|
|
|
|
|
|
|
|
|
|
|
|
Beginning of year |
|
|
|
|
3,088,162 |
|
|
|
1,940,117 |
|
|
|
179,450,223 |
|
|
|
67,924,495 |
|
End
of year |
|
|
|
$ |
3,138,976 |
|
|
$ |
3,088,162 |
|
|
$ |
238,712,475 |
|
|
$ |
179,450,223 |
|
Including undistributed (accumulated) net investment income (loss) as follows: |
|
|
|
$ |
45,908 |
|
|
$ |
32,303 |
|
|
$ |
(69,350 |
) |
|
$ |
(3,146,506 |
) |
| |
|
|
|
|
|
|
|
|
|
|
|
|
|
|
|
|
|
|
Changes in Shares Outstanding
|
|
|
|
|
|
|
|
|
|
|
|
|
|
|
|
|
|
|
Shares outstanding, beginning of year |
|
|
|
|
150,001 |
|
|
|
100,001 |
|
|
|
6,950,000 |
|
|
|
2,750,000 |
|
Shares created |
|
|
|
|
— |
|
|
|
250,000 |
|
|
|
2,150,000 |
|
|
|
7,000,000 |
|
Shares redeemed |
|
|
|
|
— |
|
|
|
(200,000 |
) |
|
|
(500,000 |
) |
|
|
(2,800,000 |
) |
Shares outstanding, end of year |
|
|
|
|
150,001 |
|
|
|
150,001 |
|
|
|
8,600,000 |
|
|
|
6,950,000 |
|
See notes to financial
statements.
145
Statements of Changes in Net Assets
(continued)
|
|
|
|
IQ Merger
Arbitrage ETF
|
|
IQ Real Return
ETF
|
|
|
|
|
|
For the Year
Ended April 30,
|
|
For the Year
Ended April 30,
|
|
|
|
|
|
2018
|
|
2017
|
|
2018
|
|
2017
|
Increase (Decrease) in Net Assets from Operations
|
|
|
|
|
|
|
|
|
|
|
|
|
|
|
|
|
|
|
Net
investment income |
|
|
|
$ |
1,126,792 |
|
|
$ |
1,218,468 |
|
|
$ |
330,098 |
|
|
$ |
221,269 |
|
Net
realized gain (loss) |
|
|
|
|
6,943,944 |
|
|
|
4,484,432 |
|
|
|
628,896 |
|
|
|
148,068 |
|
Net
change in net unrealized appreciation (depreciation) |
|
|
|
|
(7,222,718 |
) |
|
|
3,944,491 |
|
|
|
(487,900 |
) |
|
|
128,231 |
|
Net
increase in net assets resulting from operations |
|
|
|
|
848,018 |
|
|
|
9,647,391 |
|
|
|
471,094 |
|
|
|
497,568 |
|
| |
|
|
|
|
|
|
|
|
|
|
|
|
|
|
|
|
|
|
Dividends and Distributions to Shareholders from:
|
|
|
|
|
|
|
|
|
|
|
|
|
|
|
|
|
|
|
Net
investment income |
|
|
|
|
— |
|
|
|
(291,365 |
) |
|
|
(308,837 |
) |
|
|
— |
|
| |
|
|
|
|
|
|
|
|
|
|
|
|
|
|
|
|
|
|
Capital Share Transactions
|
|
|
|
|
|
|
|
|
|
|
|
|
|
|
|
|
|
|
Proceeds from shares created |
|
|
|
|
590,741,873 |
|
|
|
80,811,670 |
|
|
|
16,549,415 |
|
|
|
4,053,675 |
|
Cost of shares redeemed |
|
|
|
|
(255,037,093 |
) |
|
|
(40,701,519 |
) |
|
|
— |
|
|
|
(2,670,680 |
) |
Net
increase from capital share transactions |
|
|
|
|
335,704,780 |
|
|
|
40,110,151 |
|
|
|
16,549,415 |
|
|
|
1,382,995 |
|
Total increase in net assets |
|
|
|
|
336,552,798 |
|
|
|
49,466,177 |
|
|
|
16,711,672 |
|
|
|
1,880,563 |
|
| |
|
|
|
|
|
|
|
|
|
|
|
|
|
|
|
|
|
|
Net Assets
|
|
|
|
|
|
|
|
|
|
|
|
|
|
|
|
|
|
|
Beginning of year |
|
|
|
|
188,833,082 |
|
|
|
139,366,905 |
|
|
|
28,607,760 |
|
|
|
26,727,197 |
|
End
of year |
|
|
|
$ |
525,385,880 |
|
|
$ |
188,833,082 |
|
|
$ |
45,319,432 |
|
|
$ |
28,607,760 |
|
Including undistributed (accumulated) net investment income (loss) as follows: |
|
|
|
$ |
(120,110 |
) |
|
$ |
(1,871,841 |
) |
|
$ |
172,756 |
|
|
$ |
143,363 |
|
| |
|
|
|
|
|
|
|
|
|
|
|
|
|
|
|
|
|
|
Changes in Shares Outstanding
|
|
|
|
|
|
|
|
|
|
|
|
|
|
|
|
|
|
|
Shares outstanding, beginning of year |
|
|
|
|
6,250,000 |
|
|
|
4,900,000 |
|
|
|
1,050,000 |
|
|
|
1,000,000 |
|
Shares created |
|
|
|
|
19,150,000 |
|
|
|
2,750,000 |
|
|
|
600,000 |
|
|
|
150,000 |
|
Shares redeemed |
|
|
|
|
(8,300,000 |
) |
|
|
(1,400,000 |
) |
|
|
— |
|
|
|
(100,000 |
) |
Shares outstanding, end of year |
|
|
|
|
17,100,000 |
|
|
|
6,250,000 |
|
|
|
1,650,000 |
|
|
|
1,050,000 |
|
See notes to financial
statements.
146
Statements of Changes in Net Assets
(continued)
|
|
|
|
IQ Global Agribusiness Small Cap
ETF
|
|
IQ U.S. Real Estate Small Cap
ETF
|
|
|
|
|
For the Year
Ended April 30,
|
|
For the Year
Ended April 30,
|
|
|
|
|
2018
|
|
2017
|
|
2018
|
|
2017
|
Increase (Decrease) in Net Assets from Operations
|
|
|
|
|
|
|
|
|
|
|
|
|
|
|
|
|
|
|
Net
investment income |
|
|
|
$ |
98,074 |
|
|
$ |
131,225 |
|
|
$ |
3,630,933 |
|
|
$ |
2,319,500 |
|
Net
realized gain (loss) |
|
|
|
|
292,890 |
|
|
|
(759,651 |
) |
|
|
2,784,023 |
|
|
|
1,582,019 |
|
Net
change in net unrealized appreciation (depreciation) |
|
|
|
|
109,259 |
|
|
|
2,016,323 |
|
|
|
(13,108,294 |
) |
|
|
6,491,993 |
|
Net
increase (decrease) in net assets resulting from operations |
|
|
|
|
500,223 |
|
|
|
1,387,897 |
|
|
|
(6,693,338 |
) |
|
|
10,393,512 |
|
| |
|
|
|
|
|
|
|
|
|
|
|
|
|
|
|
|
|
|
Dividends and Distributions to Shareholders from:
|
|
|
|
|
|
|
|
|
|
|
|
|
|
|
|
|
|
|
Net
investment income |
|
|
|
|
(109,575 |
) |
|
|
(171,392 |
) |
|
|
(3,563,539 |
) |
|
|
(2,277,082 |
) |
Return of Capital |
|
|
|
|
— |
|
|
|
— |
|
|
|
(2,075,765 |
) |
|
|
(2,848,754 |
) |
Total dividends and distributions to shareholders |
|
|
|
|
(109,575 |
) |
|
|
(171,392 |
) |
|
|
(5,639,304 |
) |
|
|
(5,125,836 |
) |
| |
|
|
|
|
|
|
|
|
|
|
|
|
|
|
|
|
|
|
Capital Share Transactions
|
|
|
|
|
|
|
|
|
|
|
|
|
|
|
|
|
|
|
Proceeds from shares created |
|
|
|
|
— |
|
|
|
1,549,035 |
|
|
|
6,779,681 |
|
|
|
52,855,659 |
|
Cost of shares redeemed |
|
|
|
|
(1,713,338 |
) |
|
|
(1,617,334 |
) |
|
|
(26,358,606 |
) |
|
|
(20,785,531 |
) |
Net
increase (decrease) from capital share transactions |
|
|
|
|
(1,713,338 |
) |
|
|
(68,299 |
) |
|
|
(19,578,925 |
) |
|
|
32,070,128 |
|
Total increase (decrease) in net assets |
|
|
|
|
(1,322,690 |
) |
|
|
1,148,206 |
|
|
|
(31,911,567 |
) |
|
|
37,337,804 |
|
| |
|
|
|
|
|
|
|
|
|
|
|
|
|
|
|
|
|
|
Net Assets
|
|
|
|
|
|
|
|
|
|
|
|
|
|
|
|
|
|
|
Beginning of year |
|
|
|
|
13,195,415 |
|
|
|
12,047,209 |
|
|
|
114,000,722 |
|
|
|
76,662,918 |
|
End
of year |
|
|
|
$ |
11,872,725 |
|
|
$ |
13,195,415 |
|
|
$ |
82,089,155 |
|
|
$ |
114,000,722 |
|
Including undistributed (accumulated) net investment income (loss) as follows: |
|
|
|
$ |
44,699 |
|
|
$ |
57,527 |
|
|
$ |
94,696 |
|
|
$ |
116,201 |
|
| |
|
|
|
|
|
|
|
|
|
|
|
|
|
|
|
|
|
|
Changes in Shares Outstanding
|
|
|
|
|
|
|
|
|
|
|
|
|
|
|
|
|
|
|
Shares outstanding, beginning of year |
|
|
|
|
400,000 |
|
|
|
400,000 |
|
|
|
4,200,000 |
|
|
|
3,050,000 |
|
Shares created |
|
|
|
|
— |
|
|
|
50,000 |
|
|
|
250,000 |
|
|
|
1,950,000 |
|
Shares redeemed |
|
|
|
|
(50,000 |
) |
|
|
(50,000 |
) |
|
|
(1,050,000 |
) |
|
|
(800,000 |
) |
Shares outstanding, end of year |
|
|
|
|
350,000 |
|
|
|
400,000 |
|
|
|
3,400,000 |
|
|
|
4,200,000 |
|
See notes to financial
statements.
147
Statements of Changes in Net Assets
(continued)
|
|
|
|
IQ 50 Percent Hedged
FTSE
International ETF
|
|
IQ 50 Percent Hedged
FTSE Europe
ETF
|
|
|
|
|
|
For the Year
Ended April 30,
|
|
For the Year
Ended April 30,
|
|
|
|
|
|
2018
|
|
2017
|
|
2018
|
|
2017
|
Increase (Decrease) in Net Assets from Operations
|
|
|
|
|
|
|
|
|
|
|
|
|
|
|
|
|
|
|
Net
investment income |
|
|
|
$ |
11,415,421 |
|
|
$ |
3,928,527 |
|
|
$ |
4,056,247 |
|
|
$ |
1,473,587 |
|
Net
realized gain (loss) |
|
|
|
|
8,788,328 |
|
|
|
3,835,699 |
|
|
|
(7,096,132 |
) |
|
|
(675,055 |
) |
Net
change in net unrealized appreciation |
|
|
|
|
16,871,161 |
|
|
|
17,633,261 |
|
|
|
16,070,128 |
|
|
|
3,138,322 |
|
Net
increase in net assets resulting from operations |
|
|
|
|
37,074,910 |
|
|
|
25,397,487 |
|
|
|
13,030,243 |
|
|
|
3,936,854 |
|
| |
|
|
|
|
|
|
|
|
|
|
|
|
|
|
|
|
|
|
Dividends and Distributions to Shareholders from:
|
|
|
|
|
|
|
|
|
|
|
|
|
|
|
|
|
|
|
Net
investment income |
|
|
|
|
(8,781,886 |
) |
|
|
(3,525,841 |
) |
|
|
(3,305,273 |
) |
|
|
(1,674,374 |
) |
Net
realized gains |
|
|
|
|
(61,824 |
) |
|
|
(1,799,252 |
) |
|
|
— |
|
|
|
(1,256,080 |
) |
Total dividends and distributions
to shareholders |
|
|
|
|
(8,843,710 |
) |
|
|
(5,325,093 |
) |
|
|
(3,305,273 |
) |
|
|
(2,930,454 |
) |
| |
|
|
|
|
|
|
|
|
|
|
|
|
|
|
|
|
|
|
Capital Share Transactions
|
|
|
|
|
|
|
|
|
|
|
|
|
|
|
|
|
|
|
Proceeds from shares created |
|
|
|
|
465,488,096 |
|
|
|
117,132,459 |
|
|
|
77,166,966 |
|
|
|
100,469,196 |
|
Cost of shares redeemed |
|
|
|
|
(123,797,011 |
) |
|
|
(4,620,407 |
) |
|
|
— |
|
|
|
(66,353,843 |
) |
Net
increase from capital share transactions |
|
|
|
|
341,691,085 |
|
|
|
112,512,052 |
|
|
|
77,166,966 |
|
|
|
34,115,353 |
|
Total increase in net assets |
|
|
|
|
369,922,285 |
|
|
|
132,584,446 |
|
|
|
86,891,936 |
|
|
|
35,121,753 |
|
| |
|
|
|
|
|
|
|
|
|
|
|
|
|
|
|
|
|
|
Net Assets
|
|
|
|
|
|
|
|
|
|
|
|
|
|
|
|
|
|
|
Beginning of year |
|
|
|
|
208,594,749 |
|
|
|
76,010,303 |
|
|
|
81,845,275 |
|
|
|
46,723,522 |
|
End
of year |
|
|
|
$ |
578,517,034 |
|
|
$ |
208,594,749 |
|
|
$ |
168,737,211 |
|
|
$ |
81,845,275 |
|
Including undistributed (accumulated) net investment income (loss) as follows: |
|
|
|
$ |
3,645,338 |
|
|
$ |
862,280 |
|
|
$ |
1,142,504 |
|
|
$ |
411,167 |
|
| |
|
|
|
|
|
|
|
|
|
|
|
|
|
|
|
|
|
|
Changes in Shares Outstanding
|
|
|
|
|
|
|
|
|
|
|
|
|
|
|
|
|
|
|
Shares outstanding, beginning of year |
|
|
|
|
10,600,001 |
|
|
|
4,300,001 |
|
|
|
4,350,001 |
|
|
|
2,650,001 |
|
Shares created |
|
|
|
|
22,150,000 |
|
|
|
6,550,000 |
|
|
|
3,950,000 |
|
|
|
5,650,000 |
|
Shares redeemed |
|
|
|
|
(6,000,000 |
) |
|
|
(250,000 |
) |
|
|
— |
|
|
|
(3,950,000 |
) |
Shares outstanding, end of year |
|
|
|
|
26,750,001 |
|
|
|
10,600,001 |
|
|
|
8,300,001 |
|
|
|
4,350,001 |
|
See notes to financial
statements.
148
Statements of Changes in Net Assets
(continued)
|
|
|
|
IQ 50 Percent Hedged FTSE Japan
ETF
|
|
IQ Leaders GTAA Tracker ETF
|
|
|
|
|
|
For the Year
Ended April 30,
|
|
For the Year
Ended April 30,
|
|
|
|
|
|
2018
|
|
2017
|
|
2018
|
|
2017
|
Increase (Decrease) in Net Assets from Operations
|
|
|
|
|
|
|
|
|
|
|
|
|
|
|
|
|
|
|
Net
investment income |
|
|
|
$ |
524,704 |
|
|
$ |
396,073 |
|
|
$ |
981,659 |
|
|
$ |
635,808 |
|
Net
realized gain (loss) |
|
|
|
|
(319,584 |
) |
|
|
(445,913 |
) |
|
|
3,277,365 |
|
|
|
967,789 |
|
Net
change in net unrealized appreciation (depreciation) |
|
|
|
|
5,261,020 |
|
|
|
3,278,665 |
|
|
|
(1,384,243 |
) |
|
|
1,766,086 |
|
Net
increase (decrease) in net assets resulting from operations |
|
|
|
|
5,466,140 |
|
|
|
3,228,825 |
|
|
|
2,874,781 |
|
|
|
3,369,683 |
|
| |
|
|
|
|
|
|
|
|
|
|
|
|
|
|
|
|
|
|
Dividends and Distributions to Shareholders from:
|
|
|
|
|
|
|
|
|
|
|
|
|
|
|
|
|
|
|
Net
investment income |
|
|
|
|
(544,769 |
) |
|
|
(614,409 |
) |
|
|
(1,005,870 |
) |
|
|
(576,860 |
) |
| |
|
|
|
|
|
|
|
|
|
|
|
|
|
|
|
|
|
|
Capital Share Transactions
|
|
|
|
|
|
|
|
|
|
|
|
|
|
|
|
|
|
|
Proceeds from shares created |
|
|
|
|
3,191,034 |
|
|
|
— |
|
|
|
45,790,546 |
|
|
|
50,067,774 |
|
Cost of shares redeemed |
|
|
|
|
(1,105,653 |
) |
|
|
— |
|
|
|
(32,426,450 |
) |
|
|
(20,716,891 |
) |
Net
increase (decrease) from capital share transactions |
|
|
|
|
2,085,381 |
|
|
|
— |
|
|
|
13,364,096 |
|
|
|
29,350,883 |
|
Total increase (decrease) in net assets |
|
|
|
|
7,006,752 |
|
|
|
2,614,416 |
|
|
|
15,233,007 |
|
|
|
32,143,706 |
|
| |
|
|
|
|
|
|
|
|
|
|
|
|
|
|
|
|
|
|
Net Assets
|
|
|
|
|
|
|
|
|
|
|
|
|
|
|
|
|
|
|
Beginning of year |
|
|
|
|
27,739,731 |
|
|
|
25,125,315 |
|
|
|
34,239,770 |
|
|
|
2,096,064 |
|
End
of year |
|
|
|
$ |
34,746,483 |
|
|
$ |
27,739,731 |
|
|
$ |
49,472,777 |
|
|
$ |
34,239,770 |
|
Including undistributed (accumulated) net investment income (loss) as follows: |
|
|
|
$ |
94,474 |
|
|
$ |
110,861 |
|
|
$ |
202,093 |
|
|
$ |
96,009 |
|
| |
|
|
|
|
|
|
|
|
|
|
|
|
|
|
|
|
|
|
Changes in Shares Outstanding
|
|
|
|
|
|
|
|
|
|
|
|
|
|
|
|
|
|
|
Shares outstanding, beginning of year |
|
|
|
|
1,450,001 |
|
|
|
1,450,001 |
|
|
|
1,500,001 |
|
|
|
100,001 |
|
Shares created |
|
|
|
|
150,000 |
|
|
|
— |
|
|
|
1,900,000 |
|
|
|
2,350,000 |
|
Shares redeemed |
|
|
|
|
(50,000 |
) |
|
|
— |
|
|
|
(1,350,000 |
) |
|
|
(950,000 |
) |
Shares outstanding, end of year |
|
|
|
|
1,550,001 |
|
|
|
1,450,001 |
|
|
|
2,050,001 |
|
|
|
1,500,001 |
|
See notes to financial
statements.
149
Statements of Changes in Net Assets
(continued)
|
|
|
|
IQ Enhanced Core
Bond U.S.
ETF
|
|
IQ Enhanced Core Plus
Bond U.S.
ETF
|
|
|
|
|
|
For the Year Ended
April 30,
2018
|
|
For the Period
May 10, 2016* to
April 30, 2017
|
|
For the Year Ended
April 30,
2018
|
|
For the Period
May 10, 2016* to
April 30, 2017
|
Increase (Decrease) in Net Assets from Operations
|
|
|
|
|
|
|
|
|
|
|
|
|
|
|
|
|
|
|
Net
investment income |
|
|
|
$ |
1,570,301 |
|
|
$ |
1,470,393 |
|
|
$ |
9,279,494 |
|
|
$ |
5,236,037 |
|
Net
realized gain (loss) |
|
|
|
|
(1,981,229 |
) |
|
|
(2,452,013 |
) |
|
|
(7,606,571 |
) |
|
|
(4,343,168 |
) |
Net
change in net unrealized appreciation (depreciation) |
|
|
|
|
(1,002,008 |
) |
|
|
(518,877 |
) |
|
|
(8,187,023 |
) |
|
|
422,928 |
|
Net
increase (decrease) in net assets resulting from operations |
|
|
|
|
(1,412,936 |
) |
|
|
(1,500,497 |
) |
|
|
(6,514,100 |
) |
|
|
1,315,797 |
|
| |
|
|
|
|
|
|
|
|
|
|
|
|
|
|
|
|
|
|
Dividends and Distributions to Shareholders from:
|
|
|
|
|
|
|
|
|
|
|
|
|
|
|
|
|
|
|
Net
investment income |
|
|
|
|
(1,575,071 |
) |
|
|
(1,478,105 |
) |
|
|
(9,263,899 |
) |
|
|
(5,319,018 |
) |
| |
|
|
|
|
|
|
|
|
|
|
|
|
|
|
|
|
|
|
Capital Share Transactions
|
|
|
|
|
|
|
|
|
|
|
|
|
|
|
|
|
|
|
Proceeds from shares created |
|
|
|
|
7,640,257 |
|
|
|
110,679,288 |
|
|
|
221,440,893 |
|
|
|
334,275,090 |
|
Cost of shares redeemed |
|
|
|
|
(27,802,367 |
) |
|
|
(33,468,712 |
) |
|
|
(102,460,425 |
) |
|
|
(99,484,690 |
) |
Net
increase (decrease) from capital share transactions |
|
|
|
|
(20,162,110 |
) |
|
|
77,210,576 |
|
|
|
118,980,468 |
|
|
|
234,790,400 |
|
Total increase (decrease) in net assets |
|
|
|
|
(23,150,117 |
) |
|
|
74,231,974 |
|
|
|
103,202,469 |
|
|
|
230,787,179 |
|
| |
|
|
|
|
|
|
|
|
|
|
|
|
|
|
|
|
|
|
Net Assets
|
|
|
|
|
|
|
|
|
|
|
|
|
|
|
|
|
|
|
Beginning of period |
|
|
|
|
74,231,974 |
|
|
|
— |
|
|
|
230,787,179 |
|
|
|
— |
|
End
of period |
|
|
|
$ |
51,081,857 |
|
|
$ |
74,231,974 |
|
|
$ |
333,989,648 |
|
|
$ |
230,787,179 |
|
Including undistributed (accumulated) net investment income (loss) as follows: |
|
|
|
$ |
— |
|
|
$ |
— |
|
|
$ |
14,785 |
|
|
$ |
— |
|
| |
|
|
|
|
|
|
|
|
|
|
|
|
|
|
|
|
|
|
Changes in Shares Outstanding
|
|
|
|
|
|
|
|
|
|
|
|
|
|
|
|
|
|
|
Shares outstanding, beginning of period |
|
|
|
|
3,800,001 |
|
|
|
— |
|
|
|
11,550,001 |
|
|
|
— |
|
Shares created |
|
|
|
|
400,000 |
|
|
|
5,500,001 |
|
|
|
11,200,000 |
|
|
|
16,550,001 |
|
Shares redeemed |
|
|
|
|
(1,450,000 |
) |
|
|
(1,700,000 |
) |
|
|
(5,250,000 |
) |
|
|
(5,000,000 |
) |
Shares outstanding, end of period |
|
|
|
|
2,750,001 |
|
|
|
3,800,001 |
|
|
|
17,500,001 |
|
|
|
11,550,001 |
|
* |
|
Commencement of operations. |
See notes to financial
statements.
150
Statements of Changes in Net Assets
(continued)
|
|
|
|
IQ S&P High Yield
Low
Volatility
Bond ETF
|
|
IQ Chaikin
U.S. Small Cap
ETF
|
|
IQ Chaikin U.S.
Large Cap
ETF
|
|
|
|
|
|
For the Year
Ended
April 30, 2018
|
|
For the Period
February 15,
2017* to
April 30, 2017
|
|
For the Period
May 16, 2017*
to
April 30, 2018
|
|
For the Period
December 13,
2017* to
April 30, 2018
|
Increase (Decrease) in Net Assets from Operations
|
|
|
|
|
|
|
|
|
|
|
|
|
|
|
|
|
|
|
Net investment income |
|
|
|
$ |
3,762,027 |
|
|
$ |
322,796 |
|
|
$ |
1,598,588 |
|
|
$ |
1,162,151 |
|
Net realized gain (loss) |
|
|
|
|
(1,255,059 |
) |
|
|
(13,904 |
) |
|
|
5,038,942 |
|
|
|
(5,212,594 |
) |
Net change in net unrealized appreciation (depreciation) |
|
|
|
|
(2,962,912 |
) |
|
|
279,672 |
|
|
|
3,520,915 |
|
|
|
2,802,663 |
|
Net increase (decrease) in net assets resulting from operations |
|
|
|
|
(455,944 |
) |
|
|
588,564 |
|
|
|
10,158,445 |
|
|
|
(1,247,780 |
) |
| |
|
|
|
|
|
|
|
|
|
|
|
|
|
|
|
|
|
|
Dividends and Distributions to Shareholders from:
|
|
|
|
|
|
|
|
|
|
|
|
|
|
|
|
|
|
|
Net investment income |
|
|
|
|
(3,536,709 |
) |
|
|
(181,476 |
) |
|
|
(1,436,366 |
) |
|
|
(916,233 |
) |
| |
|
|
|
|
|
|
|
|
|
|
|
|
|
|
|
|
|
|
Capital Share Transactions
|
|
|
|
|
|
|
|
|
|
|
|
|
|
|
|
|
|
|
Proceeds from shares created |
|
|
|
|
64,577,677 |
|
|
|
51,257,753 |
|
|
|
514,484,818 |
|
|
|
324,739,089 |
|
Cost of shares redeemed |
|
|
|
|
(2,537,164 |
) |
|
|
(2,520,235 |
) |
|
|
(57,860,331 |
) |
|
|
(2,574,997 |
) |
Net increase from capital share transactions |
|
|
|
|
62,040,513 |
|
|
|
48,737,518 |
|
|
|
456,624,487 |
|
|
|
322,164,092 |
|
Total increase in net assets |
|
|
|
|
58,047,860 |
|
|
|
49,144,606 |
|
|
|
465,346,566 |
|
|
|
320,000,079 |
|
| |
|
|
|
|
|
|
|
|
|
|
|
|
|
|
|
|
|
|
Net Assets
|
|
|
|
|
|
|
|
|
|
|
|
|
|
|
|
|
|
|
Beginning of period |
|
|
|
|
49,144,606 |
|
|
|
— |
|
|
|
— |
|
|
|
— |
|
End of period |
|
|
|
$ |
107,192,466 |
|
|
$ |
49,144,606 |
|
|
$ |
465,346,566 |
|
|
$ |
320,000,079 |
|
Including undistributed (accumulated) net investment income (loss) as follows: |
|
|
|
$ |
368,463 |
|
|
$ |
141,320 |
|
|
$ |
144,782 |
|
|
$ |
245,918 |
|
| |
|
|
|
|
|
|
|
|
|
|
|
|
|
|
|
|
|
|
Changes in Shares Outstanding
|
|
|
|
|
|
|
|
|
|
|
|
|
|
|
|
|
|
|
Shares outstanding, beginning of period |
|
|
|
|
1,950,001 |
|
|
|
— |
|
|
|
— |
|
|
|
— |
|
Shares created |
|
|
|
|
2,550,000 |
|
|
|
2,050,001 |
|
|
|
19,250,001 |
|
|
|
12,750,001 |
|
Shares redeemed |
|
|
|
|
(100,000 |
) |
|
|
(100,000 |
) |
|
|
(2,100,000 |
) |
|
|
(100,000 |
) |
Shares outstanding, end of period |
|
|
|
|
4,400,001 |
|
|
|
1,950,001 |
|
|
|
17,150,001 |
|
|
|
12,650,001 |
|
* |
|
Commencement of operations. |
See notes to financial
statements.
151
Financial
Highlights
Selected
Data for a Share of Capital Stock Outstanding
|
|
|
|
IQ Hedge Multi-Strategy Tracker
ETF
|
|
|
|
|
For the Year
Ended April 30,
|
|
|
|
|
2018
|
|
2017
|
|
2016
|
|
2015
|
|
2014
|
Net asset value, beginning of year |
|
|
|
$ |
29.15 |
|
|
$ |
29.03 |
|
|
$ |
30.01 |
|
|
$ |
29.26 |
|
|
$ |
28.41 |
|
| |
|
|
|
|
|
|
|
|
|
|
|
|
|
|
|
|
|
|
|
|
|
|
Income from Investment Operations
|
|
|
|
|
|
|
|
|
|
|
|
|
|
|
|
|
|
|
|
|
|
|
Net investment income(a)* |
|
|
|
|
0.56 |
|
|
|
0.50 |
|
|
|
0.43 |
|
|
|
0.38 |
|
|
|
0.33 |
|
Net realized and unrealized gain (loss) |
|
|
|
|
0.68 |
|
|
|
(0.38 |
) |
|
|
(1.30 |
) |
|
|
0.74 |
|
|
|
0.88 |
|
Distributions of net realized gains from investments in other investment companies |
|
|
|
|
0.00 |
(b) |
|
|
0.00 |
(b) |
|
|
0.03 |
|
|
|
0.02 |
|
|
|
0.01 |
|
Net increase (decrease) in net assets resulting from investment operations |
|
|
|
|
1.24 |
|
|
|
0.12 |
|
|
|
(0.84 |
) |
|
|
1.14 |
|
|
|
1.22 |
|
| |
|
|
|
|
|
|
|
|
|
|
|
|
|
|
|
|
|
|
|
|
|
|
Distributions from:
|
|
|
|
|
|
|
|
|
|
|
|
|
|
|
|
|
|
|
|
|
|
|
Net investment income |
|
|
|
|
— |
|
|
|
(0.00 |
)(c) |
|
|
(0.14 |
) |
|
|
(0.39 |
) |
|
|
(0.37 |
) |
Net asset value, end of year |
|
|
|
$ |
30.39 |
|
|
$ |
29.15 |
|
|
$ |
29.03 |
|
|
$ |
30.01 |
|
|
$ |
29.26 |
|
Market price, end of year |
|
|
|
$ |
30.38 |
|
|
$ |
29.15 |
|
|
$ |
29.06 |
|
|
$ |
30.00 |
|
|
|
|
|
| |
|
|
|
|
|
|
|
|
|
|
|
|
|
|
|
|
|
|
|
|
|
|
Total Return
|
|
|
|
|
|
|
|
|
|
|
|
|
|
|
|
|
|
|
|
|
|
|
Total investment return based on net asset value(d) |
|
|
|
|
4.24 |
% |
|
|
0.42 |
% |
|
|
(2.80 |
)% |
|
|
3.93 |
%(e) |
|
|
4.30 |
%(e) |
Total investment return based on Market price(f) |
|
|
|
|
4.22 |
% |
|
|
0.31 |
% |
|
|
(2.67 |
)% |
|
|
3.79 |
% |
|
|
|
|
| |
|
|
|
|
|
|
|
|
|
|
|
|
|
|
|
|
|
|
|
|
|
|
Ratios/Supplemental Data
|
|
|
|
|
|
|
|
|
|
|
|
|
|
|
|
|
|
|
|
|
|
|
Net assets, end of year (000’s omitted) |
|
|
|
$ |
1,124,278 |
|
|
$ |
1,062,579 |
|
|
$ |
1,074,120 |
|
|
$ |
1,000,840 |
|
|
$ |
722,844 |
|
Ratio to average net assets of:
|
|
|
|
|
|
|
|
|
|
|
|
|
|
|
|
|
|
|
|
|
|
|
Expenses net of waivers/reimbursements(g) |
|
|
|
|
0.64 |
% |
|
|
0.76 |
% |
|
|
0.76 |
% |
|
|
0.76 |
% |
|
|
0.75 |
% |
Expenses excluding waivers/reimbursements(g) |
|
|
|
|
0.76 |
% |
|
|
0.76 |
% |
|
|
0.76 |
% |
|
|
0.76 |
% |
|
|
0.75 |
% |
Net investment income (loss)* |
|
|
|
|
1.87 |
% |
|
|
1.72 |
% |
|
|
1.48 |
% |
|
|
1.27 |
% |
|
|
1.16 |
% |
Portfolio turnover rate(h) |
|
|
|
|
164 |
% |
|
|
285 |
% |
|
|
312 |
% |
|
|
81 |
% |
|
|
119 |
% |
* |
|
Recognition of net investment income by the Fund is
affected by the timing of the declaration of dividends by the investment companies in which the Fund invests. |
(a) |
|
Based on average shares outstanding. |
(b) |
|
Less than $0.005 per share. |
(c) |
|
Greater than $(0.005) per share. |
(d) |
|
Total investment return is calculated assuming an
initial investment made at the net asset value at the beginning of the period, reinvestment of all dividends and distributions, if any, at net asset
value during the period, and redemption on the last day of the period. Total return calculated for a period less than one year is not
annualized. |
(e) |
|
Includes adjustments in accordance with accounting
principles generally accepted in the United States of America and as such, the net asset values for financial reporting purposes and the returns based
upon those net asset values may differ from the net asset values and returns for shareholder transactions. |
(f) |
|
The market price returns are calculated using the
mean between the last bid and ask prices. Prior to May 31, 2016, the closing price listed on the NYSE Arca was used. |
(g) |
|
Excludes expenses incurred by the underlying
investments in other funds. |
(h) |
|
Portfolio turnover rate is not annualized and
excludes the value of portfolio securities received or delivered as in-kind creations or redemptions in connection with the Fund’s capital share
transactions. |
See notes to financial
statements.
152
Financial Highlights (continued)
Selected
Data for a Share of Capital Stock Outstanding
|
|
|
|
IQ Hedge Macro Tracker ETF
|
|
|
|
|
For the Year
Ended April 30,
|
|
|
|
|
2018
|
|
2017
|
|
2016
|
|
2015
|
|
2014
|
Net asset value, beginning of year |
|
|
|
$ |
25.46 |
|
|
$ |
24.66 |
|
|
$ |
25.69 |
|
|
$ |
26.50 |
|
|
$ |
26.90 |
|
| |
|
|
|
|
|
|
|
|
|
|
|
|
|
|
|
|
|
|
|
|
|
|
Income from Investment Operations
|
|
|
|
|
|
|
|
|
|
|
|
|
|
|
|
|
|
|
|
|
|
|
Net investment income(a)* |
|
|
|
|
0.39 |
|
|
|
0.37 |
|
|
|
0.46 |
|
|
|
0.32 |
|
|
|
0.36 |
|
Net realized and unrealized gain (loss) |
|
|
|
|
0.50 |
|
|
|
0.43 |
|
|
|
(1.27 |
) |
|
|
(0.79 |
) |
|
|
(0.62 |
) |
Distributions of net realized gains from investments in other investment companies |
|
|
|
|
0.00 |
(b) |
|
|
0.00 |
(b) |
|
|
0.05 |
|
|
|
0.00 |
(b) |
|
|
0.02 |
|
Net increase (decrease) in net assets resulting from investment operations |
|
|
|
|
0.89 |
|
|
|
0.80 |
|
|
|
(0.76 |
) |
|
|
(0.47 |
) |
|
|
(0.24 |
) |
| |
|
|
|
|
|
|
|
|
|
|
|
|
|
|
|
|
|
|
|
|
|
|
Distributions from:
|
|
|
|
|
|
|
|
|
|
|
|
|
|
|
|
|
|
|
|
|
|
|
Net investment income |
|
|
|
|
— |
|
|
|
— |
|
|
|
(0.27 |
) |
|
|
(0.34 |
) |
|
|
(0.16 |
) |
Net asset value, end of year |
|
|
|
$ |
26.35 |
|
|
$ |
25.46 |
|
|
$ |
24.66 |
|
|
$ |
25.69 |
|
|
$ |
26.50 |
|
Market price, end of year |
|
|
|
$ |
26.34 |
|
|
$ |
25.44 |
|
|
$ |
24.80 |
|
|
$ |
25.74 |
|
|
|
|
|
| |
|
|
|
|
|
|
|
|
|
|
|
|
|
|
|
|
|
|
|
|
|
|
Total Return
|
|
|
|
|
|
|
|
|
|
|
|
|
|
|
|
|
|
|
|
|
|
|
Total investment return based on net asset value(c) |
|
|
|
|
3.50 |
% |
|
|
3.25 |
% |
|
|
(2.97 |
)% |
|
|
(1.77 |
)% |
|
|
(0.90 |
)% |
Total investment return based on Market price(d) |
|
|
|
|
3.54 |
% |
|
|
2.58 |
% |
|
|
(2.60 |
)% |
|
|
(1.47 |
)% |
|
|
|
|
| |
|
|
|
|
|
|
|
|
|
|
|
|
|
|
|
|
|
|
|
|
|
|
Ratios/Supplemental Data
|
|
|
|
|
|
|
|
|
|
|
|
|
|
|
|
|
|
|
|
|
|
|
Net assets, end of year (000’s omitted) |
|
|
|
$ |
6,588 |
|
|
$ |
6,365 |
|
|
$ |
14,794 |
|
|
$ |
21,837 |
|
|
$ |
26,504 |
|
Ratio to average net assets of:
|
|
|
|
|
|
|
|
|
|
|
|
|
|
|
|
|
|
|
|
|
|
|
Expenses(e) |
|
|
|
|
0.75 |
% |
|
|
0.76 |
% |
|
|
0.76 |
% |
|
|
0.75 |
% |
|
|
0.75 |
% |
Net investment income (loss)* |
|
|
|
|
1.47 |
% |
|
|
1.50 |
% |
|
|
1.86 |
% |
|
|
1.23 |
% |
|
|
1.37 |
% |
Portfolio turnover rate(f) |
|
|
|
|
152 |
% |
|
|
68 |
% |
|
|
99 |
% |
|
|
101 |
% |
|
|
58 |
% |
* |
|
Recognition of net investment income by the Fund is
affected by the timing of the declaration of dividends by the investment companies in which the Fund invests. |
(a) |
|
Based on average shares outstanding. |
(b) |
|
Less than $0.005 per share. |
(c) |
|
Total investment return is calculated assuming an
initial investment made at the net asset value at the beginning of the period, reinvestment of all dividends and distributions, if any, at net asset
value during the period, and redemption on the last day of the period. Total return calculated for a period less than one year is not
annualized. |
(d) |
|
The market price returns are calculated using the
mean between the last bid and ask prices. Prior to May 31, 2016, the closing price listed on the NYSE Arca was used. |
(e) |
|
Excludes expenses incurred by the underlying
investments in other funds. |
(f) |
|
Portfolio turnover rate is not annualized and
excludes the value of portfolio securities received or delivered as in-kind creations or redemptions in connection with the Fund’s capital share
transactions. |
See notes to financial
statements.
153
Financial Highlights (continued)
Selected
Data for a Share of Capital Stock Outstanding
|
|
|
|
IQ Hedge Market Neutral Tracker
ETF
|
|
|
|
|
|
For the Year
Ended April 30,
|
|
|
|
|
|
2018
|
|
2017
|
|
2016
|
|
2015
|
|
2014
|
Net asset value, beginning of year |
|
|
|
$ |
25.25 |
|
|
$ |
25.49 |
|
|
$ |
25.53 |
|
|
$ |
25.77 |
|
|
$ |
25.69 |
|
| |
|
|
|
|
|
|
|
|
|
|
|
|
|
|
|
|
|
|
|
|
|
|
Income from Investment Operations
|
|
|
|
|
|
|
|
|
|
|
|
|
|
|
|
|
|
|
|
|
|
|
Net investment income(a)* |
|
|
|
|
0.41 |
|
|
|
0.36 |
|
|
|
0.27 |
|
|
|
0.16 |
|
|
|
0.16 |
|
Net realized and unrealized gain (loss) |
|
|
|
|
(0.08 |
) |
|
|
(0.25 |
) |
|
|
(0.33 |
) |
|
|
(0.09 |
) |
|
|
0.12 |
|
Distributions of net realized gains from investments in other investment companies |
|
|
|
|
— |
|
|
|
0.00 |
(b) |
|
|
0.02 |
|
|
|
0.03 |
|
|
|
0.02 |
|
Net increase (decrease) in net assets resulting from investment operations |
|
|
|
|
0.33 |
|
|
|
0.11 |
|
|
|
(0.04 |
) |
|
|
0.10 |
|
|
|
0.30 |
|
| |
|
|
|
|
|
|
|
|
|
|
|
|
|
|
|
|
|
|
|
|
|
|
Distributions from:
|
|
|
|
|
|
|
|
|
|
|
|
|
|
|
|
|
|
|
|
|
|
|
Net investment income |
|
|
|
|
— |
|
|
|
(0.35 |
) |
|
|
— |
|
|
|
(0.34 |
) |
|
|
(0.22 |
) |
Net asset value, end of year |
|
|
|
$ |
25.58 |
|
|
$ |
25.25 |
|
|
$ |
25.49 |
|
|
$ |
25.53 |
|
|
$ |
25.77 |
|
Market price, end of year |
|
|
|
$ |
25.58 |
|
|
$ |
25.25 |
|
|
$ |
25.43 |
|
|
$ |
25.50 |
|
|
|
|
|
| |
|
|
|
|
|
|
|
|
|
|
|
|
|
|
|
|
|
|
|
|
|
|
Total Return
|
|
|
|
|
|
|
|
|
|
|
|
|
|
|
|
|
|
|
|
|
|
|
Total investment return based on net asset value(c) |
|
|
|
|
1.29 |
% |
|
|
0.44 |
% |
|
|
(0.15 |
)% |
|
|
0.40 |
% |
|
|
1.17 |
% |
Total investment return based on Market price(d) |
|
|
|
|
1.31 |
% |
|
|
0.67 |
% |
|
|
0.27 |
% |
|
|
0.43 |
% |
|
|
|
|
| |
|
|
|
|
|
|
|
|
|
|
|
|
|
|
|
|
|
|
|
|
|
|
Ratios/Supplemental Data
|
|
|
|
|
|
|
|
|
|
|
|
|
|
|
|
|
|
|
|
|
|
|
Net assets, end of year (000’s omitted) |
|
|
|
$ |
12,790 |
|
|
$ |
11,364 |
|
|
$ |
15,294 |
|
|
$ |
12,766 |
|
|
$ |
16,748 |
|
Ratio to average net assets of:
|
|
|
|
|
|
|
|
|
|
|
|
|
|
|
|
|
|
|
|
|
|
|
Expenses(e) |
|
|
|
|
0.76 |
% |
|
|
0.76 |
% |
|
|
0.76 |
% |
|
|
0.76 |
% |
|
|
0.75 |
% |
Net investment income (loss)* |
|
|
|
|
1.61 |
% |
|
|
1.40 |
% |
|
|
1.09 |
% |
|
|
0.64 |
% |
|
|
0.64 |
% |
Portfolio turnover rate(f) |
|
|
|
|
165 |
% |
|
|
99 |
% |
|
|
135 |
% |
|
|
101 |
% |
|
|
51 |
% |
* |
|
Recognition of net investment income by the Fund is
affected by the timing of the declaration of dividends by the investment companies in which the Fund invests. |
(a) |
|
Based on average shares outstanding. |
(b) |
|
Less than $0.005 per share. |
(c) |
|
Total investment return is calculated assuming an
initial investment made at the net asset value at the beginning of the period, reinvestment of all dividends and distributions, if any, at net asset
value during the period, and redemption on the last day of the period. Total return calculated for a period less than one year is not
annualized. |
(d) |
|
The market price returns are calculated using the
mean between the last bid and ask prices. Prior to May 31, 2016, the closing price listed on the NYSE Arca was used. |
(e) |
|
Excludes expenses incurred by the underlying
investments in other funds. |
(f) |
|
Portfolio turnover rate is not annualized and
excludes the value of portfolio securities received or delivered as in-kind creations or redemptions in connection with the Fund’s capital share
transactions. |
See notes to financial
statements.
154
Financial Highlights (continued)
Selected
Data for a Share of Capital Stock Outstanding
| |
|
|
|
IQ Hedge Long/Short Tracker
ETF
|
|
|
|
|
For the Year
Ended April 30,
|
|
For the Period
March 24, 2015(a)
to
April 30, 2015
|
|
|
|
|
2018
|
|
2017
|
|
2016
|
|
|
|
|
Net asset value, beginning of period |
|
|
|
$ |
20.36 |
|
|
$ |
18.88 |
|
|
$ |
19.93 |
|
|
$ |
20.00 |
|
| |
|
|
|
|
|
|
|
|
|
|
|
|
|
|
|
|
|
|
Income from Investment Operations
|
|
|
|
|
|
|
|
|
|
|
|
|
|
|
|
|
|
|
Net investment income(b)* |
|
|
|
|
0.41 |
|
|
|
0.35 |
|
|
|
0.41 |
|
|
|
0.04 |
|
Net realized and unrealized gain (loss) |
|
|
|
|
1.22 |
|
|
|
1.19 |
|
|
|
(1.10 |
) |
|
|
(0.11 |
) |
Distributions of net realized gains from investments in other investment companies |
|
|
|
|
0.00 |
(c) |
|
|
0.00 |
(c) |
|
|
— |
|
|
|
— |
|
Net increase (decrease) in net assets resulting from investment operations |
|
|
|
|
1.63 |
|
|
|
1.54 |
|
|
|
(0.69 |
) |
|
|
(0.07 |
) |
| |
|
|
|
|
|
|
|
|
|
|
|
|
|
|
|
|
|
|
Distributions from:
|
|
|
|
|
|
|
|
|
|
|
|
|
|
|
|
|
|
|
Net investment income |
|
|
|
|
(0.08 |
) |
|
|
(0.06 |
) |
|
|
(0.36 |
) |
|
|
— |
|
Net asset value, end of period |
|
|
|
$ |
21.91 |
|
|
$ |
20.36 |
|
|
$ |
18.88 |
|
|
$ |
19.93 |
|
Market price, end of period |
|
|
|
$ |
21.93 |
|
|
$ |
20.34 |
|
|
$ |
18.72 |
|
|
$ |
20.79 |
|
| |
|
|
|
|
|
|
|
|
|
|
|
|
|
|
|
|
|
|
Total Return
|
|
|
|
|
|
|
|
|
|
|
|
|
|
|
|
|
|
|
Total investment return based on net asset value(d) |
|
|
|
|
8.02 |
% |
|
|
8.18 |
% |
|
|
(3.46 |
)% |
|
|
(0.35 |
)% |
Total investment return based on Market price(e) |
|
|
|
|
8.23 |
% |
|
|
8.98 |
% |
|
|
(8.23 |
)% |
|
|
3.95 |
%(h) |
| |
|
|
|
|
|
|
|
|
|
|
|
|
|
|
|
|
|
|
Ratios/Supplemental Data
|
|
|
|
|
|
|
|
|
|
|
|
|
|
|
|
|
|
|
Net assets, end of period (000’s omitted) |
|
|
|
$ |
8,764 |
|
|
$ |
4,072 |
|
|
$ |
1,888 |
|
|
$ |
1,993 |
|
Ratio to average net assets of:
|
|
|
|
|
|
|
|
|
|
|
|
|
|
|
|
|
|
|
Expenses(f) |
|
|
|
|
0.76 |
% |
|
|
0.77 |
% |
|
|
0.76 |
% |
|
|
0.75 |
%(i) |
Net investment income* |
|
|
|
|
1.89 |
% |
|
|
1.78 |
% |
|
|
2.15 |
% |
|
|
1.73 |
%(i) |
Portfolio turnover rate(g) |
|
|
|
|
77 |
% |
|
|
147 |
% |
|
|
94 |
% |
|
|
4 |
% |
* |
|
Recognition of net investment income by the Fund is
affected by the timing of the declaration of dividends by the investment companies in which the Fund invests. |
(a) |
|
Commencement of operations. |
(b) |
|
Based on average shares outstanding. |
(c) |
|
Less than $0.005 per share. |
(d) |
|
Total investment return is calculated assuming an
initial investment made at the net asset value at the beginning of the period, reinvestment of all dividends and distributions, if any, at net asset
value during the period, and redemption on the last day of the period. Total return calculated for a period less than one year is not
annualized. |
(e) |
|
The market price returns are calculated using the
mean between the last bid and ask prices. Prior to May 31, 2016, the closing price listed on the NYSE Arca was used. |
(f) |
|
Excludes expenses incurred by the underlying
investments in other funds. |
(g) |
|
Portfolio turnover rate is not annualized and
excludes the value of portfolio securities received or delivered as in-kind creations or redemptions in connection with the Fund’s capital share
transactions. |
(h) |
|
Since the Shares of the Fund did not trade in the
secondary market until the day after the Fund’s inception, for the period from the inception to the first day of the secondary market trading, the
NAV is used as a proxy for the secondary market trading price to calculate the market returns. |
See notes to financial
statements.
155
Financial Highlights (continued)
Selected
Data for a Share of Capital Stock Outstanding
|
|
|
|
IQ Hedge Event-Driven Tracker
ETF
|
|
|
|
|
For the Year
Ended April 30,
|
|
For the Period
March 24, 2015(a)
to April 30, 2015
|
|
|
|
|
2018
|
|
2017
|
|
2016
|
|
|
Net asset value, beginning of period |
|
|
|
$ |
20.59 |
|
|
$ |
19.40 |
|
|
$ |
20.01 |
|
|
$ |
19.95 |
|
| |
|
|
|
|
|
|
|
|
|
|
|
|
|
|
|
|
|
|
Income from Investment Operations
|
|
|
|
|
|
|
|
|
|
|
|
|
|
|
|
|
|
|
Net investment income(b)* |
|
|
|
|
0.55 |
|
|
|
0.56 |
|
|
|
0.54 |
|
|
|
0.02 |
|
Net realized and unrealized gain (loss) |
|
|
|
|
0.26 |
|
|
|
1.09 |
|
|
|
(1.03 |
) |
|
|
0.03 |
|
Distributions of net realized gains from investments in other investment companies |
|
|
|
|
— |
|
|
|
0.00 |
(c) |
|
|
0.23 |
|
|
|
0.01 |
|
Net increase (decrease) in net assets resulting from investment operations |
|
|
|
|
0.81 |
|
|
|
1.65 |
|
|
|
(0.26 |
) |
|
|
0.06 |
|
| |
|
|
|
|
|
|
|
|
|
|
|
|
|
|
|
|
|
|
Distributions from:
|
|
|
|
|
|
|
|
|
|
|
|
|
|
|
|
|
|
|
Net investment income |
|
|
|
|
(0.47 |
) |
|
|
(0.46 |
) |
|
|
(0.35 |
) |
|
|
— |
|
Net asset value, end of period |
|
|
|
$ |
20.93 |
|
|
$ |
20.59 |
|
|
$ |
19.40 |
|
|
$ |
20.01 |
|
Market price, end of period |
|
|
|
$ |
20.93 |
|
|
$ |
20.59 |
|
|
$ |
19.43 |
|
|
$ |
20.00 |
|
| |
|
|
|
|
|
|
|
|
|
|
|
|
|
|
|
|
|
|
Total Return
|
|
|
|
|
|
|
|
|
|
|
|
|
|
|
|
|
|
|
Total investment return based on net asset value(d) |
|
|
|
|
3.93 |
% |
|
|
8.58 |
% |
|
|
(1.26 |
)% |
|
|
0.30 |
% |
Total investment return based on Market price(e) |
|
|
|
|
3.94 |
% |
|
|
8.44 |
% |
|
|
(1.04 |
)% |
|
|
0.25 |
%(f) |
| |
|
|
|
|
|
|
|
|
|
|
|
|
|
|
|
|
|
|
Ratios/Supplemental Data
|
|
|
|
|
|
|
|
|
|
|
|
|
|
|
|
|
|
|
Net assets, end of period (000’s omitted) |
|
|
|
$ |
3,139 |
|
|
$ |
3,088 |
|
|
$ |
1,940 |
|
|
$ |
2,001 |
|
Ratio to average net assets of:
|
|
|
|
|
|
|
|
|
|
|
|
|
|
|
|
|
|
|
Expenses(g) |
|
|
|
|
0.76 |
% |
|
|
0.76 |
% |
|
|
0.79 |
% |
|
|
0.75 |
%(h) |
Net investment income (loss)* |
|
|
|
|
2.64 |
% |
|
|
2.80 |
% |
|
|
2.81 |
% |
|
|
1.31 |
%(h) |
Portfolio turnover rate(i) |
|
|
|
|
41 |
% |
|
|
68 |
% |
|
|
16 |
% |
|
|
6 |
% |
* |
|
Recognition of net investment income by the Fund is
affected by the timing of the declaration of dividends by the investment companies in which the Fund invests. |
| (a) |
|
Commencement of operations. |
| |
|
|
| (b) |
|
Based on average shares outstanding. |
| |
|
|
| (c) |
|
Less than $0.005 per share. |
| |
|
|
(d) |
|
Total investment return is calculated assuming an
initial investment made at the net asset value at the beginning of the period, reinvestment of all dividends and distributions, if any, at net asset
value during the period, and redemption on the last day of the period. Total return calculated for a period less than one year is not
annualized. |
(e) |
|
The market price returns are calculated using the
mean between the last bid and ask prices. Prior to May 31, 2016, the closing price listed on the NYSE Arca was used. |
(f) |
|
Since the Shares of the Funds did not trade in the
secondary market until the day after the Fund’s inception, for the period from the inception to the first day of the secondary market trading, the
NAV is used as a proxy for the secondary market trading price to calculate the market returns. |
(g) |
|
Excludes expenses incurred by the underlying
investments in other funds. |
(i) |
|
Portfolio turnover rate is not annualized and
excludes the value of portfolio securities received or delivered as in-kind creations or redemptions in connection with the Fund’s capital share
transactions. |
See notes to financial
statements.
156
Financial Highlights (continued)
Selected
Data for a Share of Capital Stock Outstanding
|
|
|
|
IQ Global Resources ETF
|
|
|
|
|
For the Year
Ended April 30,
|
|
|
|
|
2018
|
|
2017
|
|
2016
|
|
2015
|
|
2014
|
Net asset value, beginning of year |
|
|
|
$ |
25.82 |
|
|
$ |
24.70 |
|
|
$ |
27.18 |
|
|
$ |
29.21 |
|
|
$ |
28.50 |
|
| |
|
|
|
|
|
|
|
|
|
|
|
|
|
|
|
|
|
|
|
|
|
|
Income from Investment Operations
|
|
|
|
|
|
|
|
|
|
|
|
|
|
|
|
|
|
|
|
|
|
|
Net investment income(a)* |
|
|
|
|
0.68 |
|
|
|
0.33 |
|
|
|
0.56 |
|
|
|
0.37 |
|
|
|
0.41 |
|
Net realized and unrealized gain (loss) |
|
|
|
|
1.26 |
|
|
|
0.89 |
|
|
|
(2.48 |
) |
|
|
(2.05 |
) |
|
|
0.61 |
|
Net increase (decrease) in net assets resulting from investment operations |
|
|
|
|
1.94 |
|
|
|
1.22 |
|
|
|
(1.92 |
) |
|
|
(1.68 |
) |
|
|
1.02 |
|
| |
|
|
|
|
|
|
|
|
|
|
|
|
|
|
|
|
|
|
|
|
|
|
Distributions from:
|
|
|
|
|
|
|
|
|
|
|
|
|
|
|
|
|
|
|
|
|
|
|
Net investment income |
|
|
|
|
— |
|
|
|
(0.10 |
) |
|
|
(0.56 |
) |
|
|
(0.35 |
) |
|
|
(0.31 |
) |
Net asset value, end of year |
|
|
|
$ |
27.76 |
|
|
$ |
25.82 |
|
|
$ |
24.70 |
|
|
$ |
27.18 |
|
|
$ |
29.21 |
|
Market price, end of year |
|
|
|
$ |
27.65 |
|
|
$ |
25.95 |
|
|
$ |
24.78 |
|
|
$ |
27.18 |
|
|
|
|
|
| |
|
|
|
|
|
|
|
|
|
|
|
|
|
|
|
|
|
|
|
|
|
|
Total Return
|
|
|
|
|
|
|
|
|
|
|
|
|
|
|
|
|
|
|
|
|
|
|
Total investment return based on net asset value(b) |
|
|
|
|
7.50 |
% |
|
|
4.94 |
% |
|
|
(6.71 |
)%(c) |
|
|
(5.75 |
)%(c) |
|
|
3.61 |
%(c) |
Total investment return based on Market price(d) |
|
|
|
|
6.55 |
% |
|
|
5.13 |
% |
|
|
(6.41 |
)% |
|
|
(5.97 |
)% |
|
|
|
|
| |
|
|
|
|
|
|
|
|
|
|
|
|
|
|
|
|
|
|
|
|
|
|
Ratios/Supplemental Data
|
|
|
|
|
|
|
|
|
|
|
|
|
|
|
|
|
|
|
|
|
|
|
Net assets, end of year (000’s omitted) |
|
|
|
$ |
238,712 |
|
|
$ |
179,450 |
|
|
$ |
67,924 |
|
|
$ |
66,587 |
|
|
$ |
84,719 |
|
Ratio to average net assets of:
|
|
|
|
|
|
|
|
|
|
|
|
|
|
|
|
|
|
|
|
|
|
|
Expenses(e) |
|
|
|
|
0.76 |
% |
|
|
0.75 |
% |
|
|
0.76 |
% |
|
|
0.75 |
% |
|
|
0.75 |
% |
Net investment income (loss)* |
|
|
|
|
2.51 |
% |
|
|
1.29 |
% |
|
|
2.39 |
% |
|
|
1.32 |
% |
|
|
1.45 |
% |
Portfolio turnover rate(f) |
|
|
|
|
235 |
% |
|
|
199 |
% |
|
|
325 |
% |
|
|
182 |
% |
|
|
116 |
% |
* |
|
Recognition of net investment income by the Fund is
affected by the timing of the declaration of dividends by the investment companies in which the Fund invests. |
(a) |
|
Based on average shares outstanding. |
(b) |
|
Total investment return is calculated assuming an
initial investment made at the net asset value at the beginning of the period, reinvestment of all dividends and distributions, if any, at net asset
value during the period, and redemption on the last day of the period. Total return calculated for a period less than one year is not
annualized. |
(c) |
|
Includes adjustments in accordance with accounting
principles generally accepted in the United States of America and as such, the net asset values for financial reporting purposes and the returns based
upon those net asset values may differ from the net asset values and returns for shareholder transactions. |
(d) |
|
The market price returns are calculated using the
mean between the last bid and ask prices. Prior to May 31, 2016, the closing price listed on the NYSE Arca was used. |
(e) |
|
Excludes expenses incurred by the underlying
investments in other funds. |
(f) |
|
Portfolio turnover rate is not annualized and
excludes the value of portfolio securities received or delivered as in-kind creations or redemptions in connection with the Fund’s capital share
transactions. |
See notes to financial
statements.
157
Financial Highlights (continued)
Selected
Data for a Share of Capital Stock Outstanding
|
|
|
|
IQ Merger Arbitrage ETF
|
|
|
|
|
For the Year
Ended April 30,
|
|
|
|
|
2018
|
|
2017
|
|
2016
|
|
2015
|
|
2014
|
Net asset value, beginning of year |
|
|
|
$ |
30.21 |
|
|
$ |
28.44 |
|
|
$ |
28.92 |
|
|
$ |
27.09 |
|
|
$ |
25.60 |
|
| |
|
|
|
|
|
|
|
|
|
|
|
|
|
|
|
|
|
|
|
|
|
|
Income from Investment Operations
|
|
|
|
|
|
|
|
|
|
|
|
|
|
|
|
|
|
|
|
|
|
|
Net investment income*(a) |
|
|
|
|
0.10 |
|
|
|
0.24 |
(b) |
|
|
0.02 |
|
|
|
0.04 |
|
|
|
0.03 |
|
Net realized and unrealized gain (loss) |
|
|
|
|
0.41 |
** |
|
|
1.59 |
|
|
|
(0.25 |
) |
|
|
1.79 |
|
|
|
1.72 |
|
Net increase (decrease) in net assets resulting from investment operations |
|
|
|
|
0.51 |
|
|
|
1.83 |
|
|
|
(0.23 |
) |
|
|
1.83 |
|
|
|
1.75 |
|
| |
|
|
|
|
|
|
|
|
|
|
|
|
|
|
|
|
|
|
|
|
|
|
Distributions from:
|
|
|
|
|
|
|
|
|
|
|
|
|
|
|
|
|
|
|
|
|
|
|
Net investment income |
|
|
|
|
— |
|
|
|
(0.06 |
) |
|
|
(0.25 |
) |
|
|
— |
|
|
|
(0.26 |
) |
Net asset value, end of year |
|
|
|
$ |
30.72 |
|
|
$ |
30.21 |
|
|
$ |
28.44 |
|
|
$ |
28.92 |
|
|
$ |
27.09 |
|
Market price, end of year |
|
|
|
$ |
30.75 |
|
|
$ |
30.27 |
|
|
$ |
28.51 |
|
|
$ |
28.97 |
|
|
|
|
|
| |
|
|
|
|
|
|
|
|
|
|
|
|
|
|
|
|
|
|
|
|
|
|
Total Return
|
|
|
|
|
|
|
|
|
|
|
|
|
|
|
|
|
|
|
|
|
|
|
Total investment return based on net asset value(c) |
|
|
|
|
1.69 |
% |
|
|
6.45 |
% |
|
|
(0.79 |
)% |
|
|
6.76 |
% |
|
|
6.88 |
% |
Total investment return based on Market price(d) |
|
|
|
|
1.59 |
% |
|
|
6.39 |
% |
|
|
(0.73 |
)% |
|
|
6.31 |
% |
|
|
|
|
| |
|
|
|
|
|
|
|
|
|
|
|
|
|
|
|
|
|
|
|
|
|
|
Ratios/Supplemental Data
|
|
|
|
|
|
|
|
|
|
|
|
|
|
|
|
|
|
|
|
|
|
|
Net assets, end of year (000’s omitted) |
|
|
|
$ |
525,386 |
|
|
$ |
188,833 |
|
|
$ |
139,367 |
|
|
$ |
121,447 |
|
|
$ |
33,862 |
|
Ratio to average net assets of:
|
|
|
|
|
|
|
|
|
|
|
|
|
|
|
|
|
|
|
|
|
|
|
Expenses(e) |
|
|
|
|
0.76 |
% |
|
|
0.76 |
% |
|
|
0.76 |
% |
|
|
0.76 |
% |
|
|
0.75 |
% |
Net investment income (loss)* |
|
|
|
|
0.34 |
% |
|
|
0.82 |
%(b) |
|
|
0.09 |
% |
|
|
0.14 |
% |
|
|
0.13 |
% |
Portfolio turnover rate(f) |
|
|
|
|
329 |
% |
|
|
268 |
% |
|
|
272 |
% |
|
|
447 |
% |
|
|
353 |
% |
* |
|
Recognition of net investment income by the Fund is
affected by the timing of the declaration of dividends by the investment companies in which the Fund invests. |
** |
|
Calculation of the net realized and
unrealized gain (loss) per share does not correlate with the Fund’s net realized and unrealized
gain (loss) presented on the Statements of Changes in Net Assets due to the timing of creation of Fund shares in
relation to fluctuating market values. |
(a) |
|
Based on average shares outstanding. |
(b) |
|
Net investment income per share and ratio of net
investment income to average net assets include a special cash dividend received of $0.14 per share owned of Calsonic Kansei Corp. on February 17,
2017. Net investment income per share and the net investment income to average net assets excluding the special dividend are $0.10 and 0.34%
respectively. |
(c) |
|
Total investment return is calculated assuming an
initial investment made at the net asset value at the beginning of the period, reinvestment of all dividends and distributions, if any, at net asset
value during the period, and redemption on the last day of the period. Total return calculated for a period less than one year is not
annualized. |
(d) |
|
The market price returns are calculated using the
mean between the last bid and ask prices. Prior to May 31, 2016, the closing price listed on the NYSE Arca was used. |
(e) |
|
Excludes expenses incurred by the underlying
investments in other funds. |
(f) |
|
Portfolio turnover rate is not annualized and
excludes the value of portfolio securities received or delivered as in-kind creations or redemptions in connection with the Fund’s capital share
transactions. |
See notes to financial
statements.
158
Financial Highlights (continued)
Selected
Data for a Share of Capital Stock Outstanding
|
|
|
|
IQ Real Return ETF
|
|
|
|
|
For the Year
Ended April 30,
|
|
|
|
|
2018
|
|
2017
|
|
2016
|
|
2015
|
|
2014
|
Net asset value, beginning of year |
|
|
|
$ |
27.25 |
|
|
$ |
26.73 |
|
|
$ |
26.70 |
|
|
$ |
26.33 |
|
|
$ |
26.50 |
|
| |
|
|
|
|
|
|
|
|
|
|
|
|
|
|
|
|
|
|
|
|
|
|
Income from Investment Operations
|
|
|
|
|
|
|
|
|
|
|
|
|
|
|
|
|
|
|
|
|
|
|
Net investment income(a)* |
|
|
|
|
0.30 |
|
|
|
0.22 |
|
|
|
0.09 |
|
|
|
0.05 |
|
|
|
0.09 |
|
Net realized and unrealized gain (loss) |
|
|
|
|
0.21 |
|
|
|
0.30 |
|
|
|
(0.06 |
) |
|
|
0.35 |
|
|
|
(0.23 |
) |
Distributions of net realized gains from investments in other investment companies |
|
|
|
|
0.00 |
(b) |
|
|
0.00 |
(b) |
|
|
— |
|
|
|
— |
|
|
|
— |
|
Net increase (decrease) in net assets resulting from investment operations |
|
|
|
|
0.51 |
|
|
|
0.52 |
|
|
|
0.03 |
|
|
|
0.40 |
|
|
|
(0.14 |
) |
| |
|
|
|
|
|
|
|
|
|
|
|
|
|
|
|
|
|
|
|
|
|
|
Distributions from:
|
|
|
|
|
|
|
|
|
|
|
|
|
|
|
|
|
|
|
|
|
|
|
Net investment income |
|
|
|
|
(0.29 |
) |
|
|
— |
|
|
|
(0.00 |
)(c) |
|
|
(0.03 |
) |
|
|
(0.03 |
) |
Net asset value, end of year |
|
|
|
$ |
27.47 |
|
|
$ |
27.25 |
|
|
$ |
26.73 |
|
|
$ |
26.70 |
|
|
$ |
26.33 |
|
Market price, end of year |
|
|
|
$ |
27.47 |
|
|
$ |
27.27 |
|
|
$ |
26.72 |
|
|
$ |
26.81 |
|
|
|
|
|
| |
|
|
|
|
|
|
|
|
|
|
|
|
|
|
|
|
|
|
|
|
|
|
Total Return
|
|
|
|
|
|
|
|
|
|
|
|
|
|
|
|
|
|
|
|
|
|
|
Total investment return based on net asset value(d) |
|
|
|
|
1.89 |
% |
|
|
1.94 |
% |
|
|
0.11 |
% |
|
|
1.50 |
% |
|
|
(0.54 |
)% |
Total investment return based on Market price(e) |
|
|
|
|
1.81 |
% |
|
|
2.06 |
% |
|
|
(0.32 |
)% |
|
|
1.96 |
% |
|
|
|
|
| |
|
|
|
|
|
|
|
|
|
|
|
|
|
|
|
|
|
|
|
|
|
|
Ratios/Supplemental Data
|
|
|
|
|
|
|
|
|
|
|
|
|
|
|
|
|
|
|
|
|
|
|
Net assets, end of year (000’s omitted) |
|
|
|
$ |
45,319 |
|
|
$ |
28,608 |
|
|
$ |
26,727 |
|
|
$ |
28,031 |
|
|
$ |
26,329 |
|
Ratio to average net assets of:
|
|
|
|
|
|
|
|
|
|
|
|
|
|
|
|
|
|
|
|
|
|
|
Expenses(f) |
|
|
|
|
0.49 |
% |
|
|
0.49 |
% |
|
|
0.49 |
% |
|
|
0.48 |
% |
|
|
0.48 |
% |
Net investment income (loss)* |
|
|
|
|
1.10 |
% |
|
|
0.82 |
% |
|
|
0.33 |
% |
|
|
0.18 |
% |
|
|
0.36 |
% |
Portfolio turnover rate(g) |
|
|
|
|
101 |
% |
|
|
71 |
% |
|
|
109 |
% |
|
|
91 |
% |
|
|
45 |
% |
* |
|
Recognition of net investment income by the Fund is
affected by the timing of the declaration of dividends by the investment companies in which the Fund invests. |
(a) |
|
Based on average shares
outstanding. |
(b) |
|
Less than $0.005 per share. |
(c) |
|
Greater than $(0.005) per share. |
(d) |
|
Total investment return is calculated assuming an
initial investment made at the net asset value at the beginning of the period, reinvestment of all dividends and distributions, if any, at net asset
value during the period, and redemption on the last day of the period. Total return calculated for a period less than one year is not
annualized. |
(e) |
|
The market price returns are calculated using the
mean between the last bid and ask prices. Prior to May 31, 2016, the closing price listed on the NYSE Arca was used. |
(f) |
|
Excludes expenses incurred by the underlying
investments in other funds. |
(g) |
|
Portfolio turnover rate is not annualized and
excludes the value of portfolio securities received or delivered as in-kind creations or redemptions in connection with the Fund’s capital share
transactions. |
See notes to financial
statements.
159
Financial Highlights (continued)
Selected
Data for a Share of Capital Stock Outstanding
|
|
|
|
IQ Global Agribusiness Small Cap
ETF
|
|
|
|
|
For the Year
Ended April 30,
|
|
|
|
|
2018
|
|
2017
|
|
2016
|
|
2015
|
|
2014
|
Net asset value, beginning of year |
|
|
|
$ |
32.99 |
|
|
$ |
30.12 |
|
|
$ |
27.26 |
|
|
$ |
26.92 |
|
|
$ |
26.41 |
|
| |
|
|
|
|
|
|
|
|
|
|
|
|
|
|
|
|
|
|
|
|
|
|
Income from Investment Operations
|
|
|
|
|
|
|
|
|
|
|
|
|
|
|
|
|
|
|
|
|
|
|
Net investment income(a)* |
|
|
|
|
0.27 |
|
|
|
0.31 |
|
|
|
0.41 |
|
|
|
0.31 |
|
|
|
0.35 |
|
Net realized and unrealized gain (loss) |
|
|
|
|
0.97 |
|
|
|
2.94 |
|
|
|
2.82 |
|
|
|
0.44 |
|
|
|
0.58 |
|
Net increase (decrease) in net assets resulting from investment operations |
|
|
|
|
1.24 |
|
|
|
3.25 |
|
|
|
3.23 |
|
|
|
0.75 |
|
|
|
0.93 |
|
| |
|
|
|
|
|
|
|
|
|
|
|
|
|
|
|
|
|
|
|
|
|
|
Distributions from:
|
|
|
|
|
|
|
|
|
|
|
|
|
|
|
|
|
|
|
|
|
|
|
Net investment income |
|
|
|
|
(0.31 |
) |
|
|
(0.38 |
) |
|
|
(0.37 |
) |
|
|
(0.41 |
) |
|
|
(0.42 |
) |
Net asset value, end of year |
|
|
|
$ |
33.92 |
|
|
$ |
32.99 |
|
|
$ |
30.12 |
|
|
$ |
27.26 |
|
|
$ |
26.92 |
|
Market price, end of year |
|
|
|
$ |
33.84 |
|
|
$ |
33.05 |
|
|
$ |
29.52 |
|
|
$ |
27.27 |
|
|
|
|
|
| |
|
|
|
|
|
|
|
|
|
|
|
|
|
|
|
|
|
|
|
|
|
|
Total Return
|
|
|
|
|
|
|
|
|
|
|
|
|
|
|
|
|
|
|
|
|
|
|
Total investment return based on net asset value(b) |
|
|
|
|
3.75 |
% |
|
|
10.86 |
% |
|
|
11.93 |
% |
|
|
2.92 |
% |
|
|
3.50 |
% |
Total investment return based on Market price(c) |
|
|
|
|
3.30 |
% |
|
|
13.32 |
% |
|
|
9.66 |
% |
|
|
3.15 |
% |
|
|
|
|
| |
|
|
|
|
|
|
|
|
|
|
|
|
|
|
|
|
|
|
|
|
|
|
Ratios/Supplemental Data
|
|
|
|
|
|
|
|
|
|
|
|
|
|
|
|
|
|
|
|
|
|
|
Net assets, end of year (000’s omitted) |
|
|
|
$ |
11,873 |
|
|
$ |
13,195 |
|
|
$ |
12,047 |
|
|
$ |
13,630 |
|
|
$ |
25,572 |
|
Ratio to average net assets of:
|
|
|
|
|
|
|
|
|
|
|
|
|
|
|
|
|
|
|
|
|
|
|
Expenses(d) |
|
|
|
|
0.76 |
% |
|
|
0.76 |
% |
|
|
0.76 |
% |
|
|
0.76 |
% |
|
|
0.75 |
% |
Net investment income (loss)* |
|
|
|
|
0.79 |
% |
|
|
0.99 |
% |
|
|
1.48 |
% |
|
|
1.16 |
% |
|
|
1.29 |
% |
Portfolio turnover rate(e) |
|
|
|
|
11 |
% |
|
|
35 |
% |
|
|
31 |
% |
|
|
33 |
% |
|
|
25 |
% |
* |
|
Recognition of net investment income by the Fund is
affected by the timing of the declaration of dividends by the investment companies in which the Fund invests. |
(a) |
|
Based on average shares outstanding. |
(b) |
|
Total investment return is calculated assuming an
initial investment made at the net asset value at the beginning of the period, reinvestment of all dividends and distributions, if any, at net asset
value during the period, and redemption on the last day of the period. Total return calculated for a period less than one year is not
annualized. |
(c) |
|
The market price returns are calculated using the
mean between the last bid and ask prices. Prior to May 31, 2016, the closing price listed on the NYSE Arca was used. |
(d) |
|
Excludes expenses incurred by the underlying
investments in other funds. |
(e) |
|
Portfolio turnover rate is not annualized and
excludes the value of portfolio securities received or delivered as in-kind creations or redemptions in connection with the Fund’s capital share
transactions. |
See notes to financial
statements.
160
Financial Highlights (continued)
Selected
Data for a Share of Capital Stock Outstanding
|
|
|
|
IQ U.S. Real Estate Small Cap
ETF
|
|
|
|
|
For the Year
Ended April 30,
|
|
|
|
|
2018
|
|
2017
|
|
2016
|
|
2015
|
|
2014
|
Net asset value, beginning of year |
|
|
|
$ |
27.14 |
|
|
$ |
25.14 |
|
|
$ |
26.77 |
|
|
$ |
25.44 |
|
|
$ |
27.07 |
|
| |
|
|
|
|
|
|
|
|
|
|
|
|
|
|
|
|
|
|
|
|
|
|
Income from Investment Operations
|
|
|
|
|
|
|
|
|
|
|
|
|
|
|
|
|
|
|
|
|
|
|
Net investment income(a)* |
|
|
|
|
0.88 |
|
|
|
0.71 |
|
|
|
0.90 |
|
|
|
1.07 |
|
|
|
1.22 |
|
Net realized and unrealized gain (loss) |
|
|
|
|
(2.53 |
) |
|
|
2.88 |
|
|
|
(1.09 |
) |
|
|
1.57 |
|
|
|
(0.96 |
) |
Distributions of net realized gains from investments in other investment companies |
|
|
|
|
— |
|
|
|
0.00 |
(b) |
|
|
— |
|
|
|
— |
|
|
|
— |
|
Net increase (decrease) in net assets resulting from investment operations |
|
|
|
|
(1.65 |
) |
|
|
3.59 |
|
|
|
(0.19 |
) |
|
|
2.64 |
|
|
|
0.26 |
|
| |
|
|
|
|
|
|
|
|
|
|
|
|
|
|
|
|
|
|
|
|
|
|
Distributions from:
|
|
|
|
|
|
|
|
|
|
|
|
|
|
|
|
|
|
|
|
|
|
|
Net investment income |
|
|
|
|
(0.85 |
) |
|
|
(0.71 |
) |
|
|
(0.88 |
) |
|
|
(1.04 |
) |
|
|
(1.24 |
) |
Return of capital |
|
|
|
|
(0.50 |
) |
|
|
(0.88 |
) |
|
|
(0.56 |
) |
|
|
(0.27 |
) |
|
|
(0.65 |
) |
Total distributions from net investment income and return of capital |
|
|
|
|
(1.35 |
) |
|
|
(1.59 |
) |
|
|
(1.44 |
) |
|
|
(1.31 |
) |
|
|
(1.89 |
) |
Net asset value, end of year |
|
|
|
$ |
24.14 |
|
|
$ |
27.14 |
|
|
$ |
25.14 |
|
|
$ |
26.77 |
|
|
$ |
25.44 |
|
Market price, end of year |
|
|
|
$ |
24.12 |
|
|
$ |
27.15 |
|
|
$ |
25.10 |
|
|
$ |
26.82 |
|
|
|
|
|
| |
|
|
|
|
|
|
|
|
|
|
|
|
|
|
|
|
|
|
|
|
|
|
Total Return
|
|
|
|
|
|
|
|
|
|
|
|
|
|
|
|
|
|
|
|
|
|
|
Total investment return based on net asset value(c) |
|
|
|
|
(6.37 |
)% |
|
|
14.60 |
% |
|
|
(0.51 |
)% |
|
|
10.44 |
% |
|
|
1.65 |
% |
Total investment return based on Market price(d) |
|
|
|
|
(6.49 |
)% |
|
|
14.79 |
% |
|
|
(0.83 |
)% |
|
|
10.51 |
% |
|
|
|
|
| |
|
|
|
|
|
|
|
|
|
|
|
|
|
|
|
|
|
|
|
|
|
|
Ratios/Supplemental Data
|
|
|
|
|
|
|
|
|
|
|
|
|
|
|
|
|
|
|
|
|
|
|
Net assets, end of year (000’s omitted) |
|
|
|
$ |
82,089 |
|
|
$ |
114,001 |
|
|
$ |
76,663 |
|
|
$ |
95,048 |
|
|
$ |
52,146 |
|
Ratio to average net assets of:
|
|
|
|
|
|
|
|
|
|
|
|
|
|
|
|
|
|
|
|
|
|
|
Expenses(e) |
|
|
|
|
0.70 |
% |
|
|
0.70 |
% |
|
|
0.70 |
% |
|
|
0.69 |
% |
|
|
0.69 |
% |
Net investment income (loss)* |
|
|
|
|
3.36 |
% |
|
|
2.64 |
% |
|
|
3.62 |
% |
|
|
3.97 |
% |
|
|
4.91 |
% |
Portfolio turnover rate(f) |
|
|
|
|
27 |
% |
|
|
28 |
% |
|
|
28 |
% |
|
|
17 |
% |
|
|
35 |
% |
* |
|
Recognition of net investment income by the Fund is
affected by the timing of the declaration of dividends by the investment companies in which the Fund invests. |
(a) |
|
Based on average shares outstanding. |
(b) |
|
Less than $0.005 per share. |
(c) |
|
Total investment return is calculated assuming an
initial investment made at the net asset value at the beginning of the period, reinvestment of all dividends and distributions, if any, at net asset
value during the period, and redemption on the last day of the period. Total return calculated for a period less than one year is not
annualized. |
(d) |
|
The market price returns are calculated using the
mean between the last bid and ask prices. Prior to May 31, 2016, the closing price listed on the NYSE Arca was used. |
(e) |
|
Excludes expenses incurred by the underlying
investments in other funds. |
(f) |
|
Portfolio turnover rate is not annualized and
excludes the value of portfolio securities received or delivered as in-kind creations or redemptions in connection with the Fund’s capital share
transactions. |
See notes to financial
statements.
161
Financial Highlights (continued)
Selected
Data for a Share of Capital Stock Outstanding
|
|
|
|
IQ 50 Percent Hedged FTSE International ETF
|
|
|
|
|
For the Year Ended April 30,
|
|
For the Period
July 22, 2015(a)
to April 30, 2016
|
|
|
|
|
2018
|
|
2017
|
|
|
Net asset value, beginning of period |
|
|
|
$ |
19.68 |
|
|
$ |
17.68 |
|
|
$ |
19.94 |
|
| |
|
|
|
|
|
|
|
|
|
|
|
|
|
|
Income from Investment Operations
|
|
|
|
|
|
|
|
|
|
|
|
|
|
|
| Net investment income(b)* |
|
|
|
|
0.60 |
|
|
|
0.46 |
|
|
|
0.37 |
|
Net realized and unrealized gain (loss) |
|
|
|
|
1.89 |
|
|
|
2.18 |
|
|
|
(2.42 |
) |
Net increase (decrease) in net assets resulting from investment operations |
|
|
|
|
2.49 |
|
|
|
2.64 |
|
|
|
(2.05 |
) |
| |
|
|
|
|
|
|
|
|
|
|
|
|
|
|
Distributions from:
|
|
|
|
|
|
|
|
|
|
|
|
|
|
|
Net investment income |
|
|
|
|
(0.54 |
) |
|
|
(0.44 |
) |
|
|
(0.21 |
) |
Net realized gain |
|
|
|
|
0.00 |
(c) |
|
|
(0.20 |
) |
|
|
— |
|
Total distributions from net investment income and realized gains |
|
|
|
|
(0.54 |
) |
|
|
(0.64 |
) |
|
|
(0.21 |
) |
Net asset value, end of period |
|
|
|
$ |
21.63 |
|
|
$ |
19.68 |
|
|
$ |
17.68 |
|
Market price, end of period |
|
|
|
$ |
21.60 |
|
|
$ |
19.75 |
|
|
$ |
17.59 |
|
| |
|
|
|
|
|
|
|
|
|
|
|
|
|
|
Total Return
|
|
|
|
|
|
|
|
|
|
|
|
|
|
|
Total investment return based on net asset value(d) |
|
|
|
|
12.84 |
% |
|
|
15.29 |
% |
|
|
(10.33 |
)% |
Total investment return based on Market price(e) |
|
|
|
|
12.28 |
% |
|
|
16.28 |
% |
|
|
(10.77 |
)%(f) |
| |
|
|
|
|
|
|
|
|
|
|
|
|
|
|
Ratios/Supplemental Data
|
|
|
|
|
|
|
|
|
|
|
|
|
|
|
| Net assets, end of period (000’s omitted) |
|
|
|
$ |
578,517 |
|
|
$ |
208,595 |
|
|
$ |
76,010 |
|
Ratio to average net assets of:
|
|
|
|
|
|
|
|
|
|
|
|
|
|
|
Expenses net of waivers/reimbursements(g) |
|
|
|
|
0.22 |
% |
|
|
0.36 |
% |
|
|
0.36 |
%(h) |
Expenses excluding waivers/reimbursements(g) |
|
|
|
|
0.36 |
% |
|
|
0.36 |
% |
|
|
0.36 |
%(h) |
Net investment income (loss)* |
|
|
|
|
2.87 |
% |
|
|
2.55 |
% |
|
|
2.71 |
%(h) |
Portfolio turnover rate(i) |
|
|
|
|
10 |
% |
|
|
8 |
% |
|
|
7 |
% |
* |
|
Recognition of net investment income by the Fund is
affected by the timing of the declaration of dividends by the investment companies in which the Fund invests. |
(a) |
|
Commencement of operations. |
(b) |
|
Based on average shares outstanding. |
(c) |
|
Less than $0.005 per share. |
(d) |
|
Total investment return is calculated assuming an
initial investment made at the net asset value at the beginning of the period, reinvestment of all dividends and distributions, if any, at net asset
value during the period, and redemption on the last day of the period. Total return calculated for a period less than one year is not
annualized. |
(e) |
|
The market price returns are calculated using the
mean between the last bid and ask prices. Prior to May 31, 2016, the closing price listed on the NYSE Arca was used. |
(f) |
|
Since the Shares of the Funds did not trade in the
secondary market until the day after the Fund’s inception, for the period from the inception to the first day of the secondary market trading, the
NAV is used as a proxy for the secondary market trading price to calculate the market returns. |
(g) |
|
Excludes expenses incurred by the underlying
investments in other funds. |
(i) |
|
Portfolio turnover rate is not annualized and
excludes the value of portfolio securities received or delivered as in-kind creations or redemptions in connection with the Fund’s capital share
transactions. |
See notes to financial
statements.
162
Financial Highlights (continued)
Selected
Data for a Share of Capital Stock Outstanding
|
|
|
|
IQ 50 Percent Hedged FTSE Europe
ETF
|
|
|
|
|
For the Year
Ended April 30,
|
|
For the Period
July 22, 2015(a)
to
April 30, 2016
|
|
|
|
|
2018
|
|
2017
|
|
|
Net asset value, beginning of period |
|
|
|
$ |
18.82 |
|
|
$ |
17.63 |
|
|
$ |
19.90 |
|
| |
|
|
|
|
|
|
|
|
|
|
|
|
|
|
Income from Investment Operations
|
|
|
|
|
|
|
|
|
|
|
|
|
|
|
Net investment income(b)* |
|
|
|
|
0.53 |
|
|
|
0.62 |
|
|
|
0.36 |
|
Net realized and unrealized gain (loss) |
|
|
|
|
1.43 |
|
|
|
1.96 |
|
|
|
(2.41 |
) |
Net increase (decrease) in net assets resulting from investment operations |
|
|
|
|
1.96 |
|
|
|
2.58 |
|
|
|
(2.05 |
) |
| |
|
|
|
|
|
|
|
|
|
|
|
|
|
|
Distributions from:
|
|
|
|
|
|
|
|
|
|
|
|
|
|
|
Net investment income |
|
|
|
|
(0.45 |
) |
|
|
(0.63 |
) |
|
|
(0.22 |
) |
Net realized gain |
|
|
|
|
— |
|
|
|
(0.76 |
) |
|
|
— |
|
Total distributions from net investment income and realized gains |
|
|
|
|
(0.45 |
) |
|
|
(1.39 |
) |
|
|
(0.22 |
) |
Net asset value, end of period |
|
|
|
$ |
20.33 |
|
|
$ |
18.82 |
|
|
$ |
17.63 |
|
Market price, end of period |
|
|
|
$ |
20.24 |
|
|
$ |
18.90 |
|
|
$ |
17.82 |
|
| |
|
|
|
|
|
|
|
|
|
|
|
|
|
|
Total Return
|
|
|
|
|
|
|
|
|
|
|
|
|
|
|
Total investment return based on net asset value(c) |
|
|
|
|
10.58 |
% |
|
|
15.48 |
% |
|
|
(10.33 |
)% |
Total investment return based on Market price(d) |
|
|
|
|
9.59 |
% |
|
|
14.78 |
% |
|
|
(9.38 |
)%(e) |
| |
|
|
|
|
|
|
|
|
|
|
|
|
|
|
Ratios/Supplemental Data
|
|
|
|
|
|
|
|
|
|
|
|
|
|
|
Net assets, end of period (000’s omitted) |
|
|
|
$ |
168,737 |
|
|
$ |
81,845 |
|
|
$ |
46,724 |
|
Ratio to average net assets of:
|
|
|
|
|
|
|
|
|
|
|
|
|
|
|
Expenses net of waivers/reimbursements(f) |
|
|
|
|
0.32 |
% |
|
|
0.46 |
% |
|
|
0.46 |
%(g) |
Expenses excluding waivers/reimbursements(f) |
|
|
|
|
0.46 |
% |
|
|
0.46 |
% |
|
|
0.46 |
%(g) |
Net investment income (loss)* |
|
|
|
|
2.68 |
% |
|
|
3.52 |
% |
|
|
2.65 |
%(g) |
Portfolio turnover rate(h) |
|
|
|
|
10 |
% |
|
|
14 |
% |
|
|
10 |
% |
* |
|
Recognition of net investment income by the Fund is
affected by the timing of the declaration of dividends by the investment companies in which the Fund invests. |
(a) |
|
Commencement of operations. |
(b) |
|
Based on average shares outstanding. |
(c) |
|
Total investment return is calculated assuming an
initial investment made at the net asset value at the beginning of the period, reinvestment of all dividends and distributions, if any, at net asset
value during the period, and redemption on the last day of the period. Total return calculated for a period less than one year is not
annualized. |
(d) |
|
The market price returns are calculated using the
mean between the last bid and ask prices. Prior to May 31, 2016, the closing price listed on the NYSE Arca was used. |
(e) |
|
Since the Shares of the Funds did not trade in the
secondary market until the day after the Fund’s inception, for the period from the inception to the first day of the secondary market trading, the
NAV is used as a proxy for the secondary market trading price to calculate the market returns. |
(f) |
|
Excludes expenses incurred by the underlying
investments in other funds. |
(h) |
|
Portfolio turnover rate is not annualized and
excludes the value of portfolio securities received or delivered as in-kind creations or redemptions in connection with the Fund’s capital share
transactions. |
See notes to financial
statements.
163
Financial Highlights (continued)
Selected
Data for a Share of Capital Stock Outstanding
|
|
|
|
IQ 50 Percent Hedged FTSE Japan
ETF
|
|
|
|
|
For the Year
Ended April 30,
|
|
For the Period
July 22, 2015(a)
to
April 30, 2016
|
|
|
|
|
2018
|
|
2017
|
|
|
Net asset value, beginning of period |
|
|
|
$ |
19.13 |
|
|
$ |
17.33 |
|
|
$ |
20.16 |
|
Income from Investment Operations
|
|
|
|
|
|
|
|
|
|
|
|
|
|
|
| |
|
|
|
|
|
|
|
|
|
|
|
|
|
|
Net investment income(b)* |
|
|
|
|
0.34 |
|
|
|
0.27 |
|
|
|
0.27 |
|
Net realized and unrealized gain (loss) |
|
|
|
|
3.30 |
|
|
|
1.95 |
|
|
|
(3.10 |
) |
Net increase (decrease) in net assets resulting from investment operations |
|
|
|
|
3.64 |
|
|
|
2.22 |
|
|
|
(2.83 |
) |
| |
|
|
|
|
|
|
|
|
|
|
|
|
|
|
Distributions from:
|
|
|
|
|
|
|
|
|
|
|
|
|
|
|
Net investment income |
|
|
|
|
(0.35 |
) |
|
|
(0.42 |
) |
|
|
— |
|
Net asset value, end of period |
|
|
|
$ |
22.42 |
|
|
$ |
19.13 |
|
|
$ |
17.33 |
|
Market price, end of period |
|
|
|
$ |
22.30 |
|
|
$ |
19.16 |
|
|
$ |
17.83 |
|
| |
|
|
|
|
|
|
|
|
|
|
|
|
|
|
Total Return
|
|
|
|
|
|
|
|
|
|
|
|
|
|
|
Total investment return based on net asset value(c) |
|
|
|
|
19.11 |
% |
|
|
13.18 |
% |
|
|
(14.05 |
)% |
Total investment return based on Market price(d) |
|
|
|
|
18.29 |
% |
|
|
10.17 |
% |
|
|
(11.56 |
)%(e) |
| |
|
|
|
|
|
|
|
|
|
|
|
|
|
|
Ratios/Supplemental Data
|
|
|
|
|
|
|
|
|
|
|
|
|
|
|
Net assets, end of period (000’s omitted) |
|
|
|
$ |
34,746 |
|
|
$ |
27,740 |
|
|
$ |
25,125 |
|
Ratio to average net assets of:
|
|
|
|
|
|
|
|
|
|
|
|
|
|
|
Expenses net of waivers/reimbursements(f) |
|
|
|
|
0.33 |
% |
|
|
0.46 |
% |
|
|
0.46 |
%(g) |
Expenses excluding waivers/reimbursements(f) |
|
|
|
|
0.46 |
% |
|
|
— |
% |
|
|
— |
%(g) |
Net investment income (loss)* |
|
|
|
|
1.61 |
% |
|
|
1.53 |
% |
|
|
1.85 |
%(g) |
Portfolio turnover rate(h) |
|
|
|
|
6 |
% |
|
|
15 |
% |
|
|
11 |
% |
* |
|
Recognition of net investment income by the Fund is
affected by the timing of the declaration of dividends by the investment companies in which the Fund invests. |
(a) |
|
Commencement of operations. |
(b) |
|
Based on average shares outstanding. |
(c) |
|
Total investment return is calculated assuming an
initial investment made at the net asset value at the beginning of the period, reinvestment of all dividends and distributions, if any, at net asset
value during the period, and redemption on the last day of the period. Total return calculated for a period less than one year is not
annualized. |
(d) |
|
The market price returns are calculated using the
mean between the last bid and ask prices. Prior to May 31, 2016, the closing price listed on the NYSE Arca was used. |
(e) |
|
Since the Shares of the Funds did not trade in the
secondary market until the day after the Fund’s inception, for the period from the inception to the first day of the secondary market trading, the
NAV is used as a proxy for the secondary market trading price to calculate the market returns. |
(f) |
|
Excludes expenses incurred by the underlying
investments in other funds. |
(h) |
|
Portfolio turnover rate is not annualized and
excludes the value of portfolio securities received or delivered as in-kind creations or redemptions in connection with the Fund’s capital share
transactions. |
See notes to financial
statements.
164
Financial Highlights (continued)
Selected
Data for a Share of Capital Stock Outstanding
|
|
|
|
IQ Leaders GTAA Tracker
ETF
|
|
|
|
|
For the Year
Ended April 30,
|
|
For the Period
September 30, 2015(a)
to
April 30, 2016
|
|
|
|
|
2018
|
|
2017
|
|
|
Net asset value, beginning of period |
|
|
|
$ |
22.83 |
|
|
$ |
20.96 |
|
|
$ |
20.00 |
|
| |
|
|
|
|
|
|
|
|
|
|
|
|
|
|
Income from Investment Operations
|
|
|
|
|
|
|
|
|
|
|
|
|
|
|
Net investment income(b)* |
|
|
|
|
0.58 |
|
|
|
0.48 |
|
|
|
0.26 |
|
Net realized and unrealized gain (loss) |
|
|
|
|
1.32 |
|
|
|
1.80 |
|
|
|
0.78 |
|
Distributions of net realized gains from investments in other investment companies |
|
|
|
|
0.00 |
(c) |
|
|
0.00 |
(c) |
|
|
0.06 |
|
Net increase (decrease) in net assets resulting from investment operations |
|
|
|
|
1.90 |
|
|
|
2.28 |
|
|
|
1.10 |
|
| |
|
|
|
|
|
|
|
|
|
|
|
|
|
|
Distributions from:
|
|
|
|
|
|
|
|
|
|
|
|
|
|
|
Net investment income |
|
|
|
|
(0.60 |
) |
|
|
(0.41 |
) |
|
|
(0.14 |
) |
Net asset value, end of period |
|
|
|
$ |
24.13 |
|
|
$ |
22.83 |
|
|
$ |
20.96 |
|
Market price, end of period |
|
|
|
$ |
24.14 |
|
|
$ |
22.84 |
|
|
$ |
20.21 |
|
| |
|
|
|
|
|
|
|
|
|
|
|
|
|
|
Total Return
|
|
|
|
|
|
|
|
|
|
|
|
|
|
|
Total investment return based on net asset value(d) |
|
|
|
|
8.43 |
% |
|
|
10.99 |
% |
|
|
5.50 |
% |
Total investment return based on Market price(e) |
|
|
|
|
8.40 |
% |
|
|
15.18 |
% |
|
|
1.72 |
%(f) |
| |
|
|
|
|
|
|
|
|
|
|
|
|
|
|
Ratios/Supplemental Data
|
|
|
|
|
|
|
|
|
|
|
|
|
|
|
Net assets, end of period (000’s omitted) |
|
|
|
$ |
49,473 |
|
|
$ |
34,240 |
|
|
$ |
2,096 |
|
Ratio to average net assets of:
|
|
|
|
|
|
|
|
|
|
|
|
|
|
|
Expenses(g) |
|
|
|
|
0.46 |
% |
|
|
0.46 |
% |
|
|
0.46 |
%(h) |
Net investment income (loss)* |
|
|
|
|
2.43 |
% |
|
|
2.23 |
% |
|
|
2.18 |
%(h) |
Portfolio turnover rate(i) |
|
|
|
|
145 |
% |
|
|
105 |
% |
|
|
116 |
% |
* |
|
Recognition of net investment income by the Fund is
affected by the timing of the declaration of dividends by the investment companies in which the Fund invests. |
(a) |
|
Commencement of operations. |
(b) |
|
Based on average shares outstanding. |
(c) |
|
Less than $0.005 per share. |
(d) |
|
Total investment return is calculated assuming an
initial investment made at the net asset value at the beginning of the period, reinvestment of all dividends and distributions, if any, at net asset
value during the period, and redemption on the last day of the period. Total return calculated for a period less than one year is not
annualized. |
(e) |
|
The market price returns are calculated using the
mean between the last bid and ask prices. Prior to May 31, 2016, the closing price listed on the NYSE Arca was used. |
(f) |
|
Since the Shares of the Funds did not trade in the
secondary market until the day after the Fund’s inception, for the period from the inception to the first day of the secondary market trading, the
NAV is used as a proxy for the secondary market trading price to calculate the market returns. |
(g) |
|
Excludes expenses incurred by the underlying
investments in other funds. |
(i) |
|
Portfolio turnover rate is not annualized and
excludes the value of portfolio securities received or delivered as in-kind creations or redemptions in connection with the Fund’s capital share
transactions. |
See notes to financial
statements.
165
Financial Highlights (continued)
Selected
Data for a Share of Capital Stock Outstanding
|
|
|
|
IQ Enhanced Core Bond U.S. ETF
|
|
|
|
|
For the
Year Ended
April
30, 2018
|
|
For the Period
May 10, 2016(a)
to
April 30, 2017
|
Net asset value, beginning of period |
|
|
|
$ |
19.53 |
|
|
$ |
20.00 |
|
| |
|
|
|
|
|
|
|
|
|
|
Income from Investment Operations
|
|
|
|
|
|
|
|
|
|
|
Net investment income(b)* |
|
|
|
|
0.45 |
|
|
|
0.41 |
|
Net realized and unrealized gain (loss) |
|
|
|
|
(0.95 |
) |
|
|
(0.49 |
) |
Distributions of net realized gains from investments in other investment companies |
|
|
|
|
— |
|
|
|
0.01 |
|
Net increase (decrease) in net assets resulting from investment operations |
|
|
|
|
(0.50 |
) |
|
|
(0.07 |
) |
| |
|
|
|
|
|
|
|
|
|
|
Distributions from:
|
|
|
|
|
|
|
|
|
|
|
Net investment income |
|
|
|
|
(0.45 |
) |
|
|
(0.40 |
) |
Net asset value, end of period |
|
|
|
$ |
18.58 |
|
|
$ |
19.53 |
|
Market price, end of period |
|
|
|
$ |
18.57 |
|
|
$ |
19.54 |
|
| |
|
|
|
|
|
|
|
|
|
|
Total Return
|
|
|
|
|
|
|
|
|
|
|
Total investment return based on net asset value(c) |
|
|
|
|
(2.66 |
)% |
|
|
(0.31 |
)% |
Total investment return based on Market price(d) |
|
|
|
|
(2.71 |
)% |
|
|
(0.29 |
)%(e) |
| |
|
|
|
|
|
|
|
|
|
|
Ratios/Supplemental Data
|
|
|
|
|
|
|
|
|
|
|
Net assets, end of period (000’s omitted) |
|
|
|
$ |
51,082 |
|
|
$ |
74,232 |
|
Ratio to average net assets of:
|
|
|
|
|
|
|
|
|
|
|
Expenses net of waivers/reimbursements(f) |
|
|
|
|
0.21 |
% |
|
|
0.20 |
%(g) |
Expenses excluding waivers/reimbursements(f) |
|
|
|
|
0.26 |
% |
|
|
0.25 |
%(g) |
Net investment income (loss)* |
|
|
|
|
2.32 |
% |
|
|
2.14 |
%(g) |
Portfolio turnover rate(h) |
|
|
|
|
264 |
% |
|
|
265 |
% |
* |
|
Recognition of net investment income by the Fund is
affected by the timing of the declaration of dividends by the investment companies in which the Fund invests. |
(a) |
|
Commencement of operations. |
(b) |
|
Based on average shares outstanding. |
(c) |
|
Total investment return is calculated assuming an
initial investment made at the net asset value at the beginning of the period, reinvestment of all dividends and distributions, if any, at net asset
value during the period, and redemption on the last day of the period. Total return calculated for a period less than one year is not
annualized. |
(d) |
|
The market price returns are calculated using the
mean between the last bid and ask prices. |
(e) |
|
Since the Shares of the Funds did not trade in the
secondary market until the day after the Fund’s inception, for the period from the inception to the first day of the secondary market trading, the
NAV is used as a proxy for the secondary market trading price to calculate the market returns. |
(f) |
|
Excludes expenses incurred by the underlying
investments in other funds. |
(h) |
|
Portfolio turnover rate is not annualized and
excludes the value of portfolio securities received or delivered as in-kind creations or redemptions in connection with the Fund’s capital share
transactions. |
See notes to financial
statements.
166
Financial Highlights (continued)
Selected
Data for a Share of Capital Stock Outstanding
|
|
|
|
IQ Enhanced Core Plus Bond U.S.
ETF
|
|
|
|
|
For the
Year Ended
April
30, 2018
|
|
For the Period
May 10, 2016(a)
to
April 30, 2017
|
Net asset value, beginning of period |
|
|
|
$ |
19.98 |
|
|
$ |
20.00 |
|
| |
|
|
|
|
|
|
|
|
|
|
Income from Investment Operations
|
|
|
|
|
|
|
|
|
|
|
Net investment income(b)* |
|
|
|
|
0.61 |
|
|
|
0.53 |
|
Net realized and unrealized gain (loss) |
|
|
|
|
(0.88 |
) |
|
|
(0.03 |
) |
Distributions of net realized gains from investments in other investment companies |
|
|
|
|
— |
|
|
|
0.01 |
|
Net increase (decrease) in net assets resulting from investment operations |
|
|
|
|
(0.27 |
) |
|
|
0.51 |
|
| |
|
|
|
|
|
|
|
|
|
|
Distributions from:
|
|
|
|
|
|
|
|
|
|
|
Net investment income |
|
|
|
|
(0.62 |
) |
|
|
(0.53 |
) |
Net asset value, end of period |
|
|
|
$ |
19.09 |
|
|
$ |
19.98 |
|
Market price, end of period |
|
|
|
$ |
19.07 |
|
|
$ |
19.99 |
|
| |
|
|
|
|
|
|
|
|
|
|
Total Return
|
|
|
|
|
|
|
|
|
|
|
Total investment return based on net asset value(c) |
|
|
|
|
(1.44 |
)% |
|
|
2.57 |
% |
Total investment return based on Market price(d) |
|
|
|
|
(1.56 |
)% |
|
|
2.61 |
%(e) |
| |
|
|
|
|
|
|
|
|
|
|
Ratios/Supplemental Data
|
|
|
|
|
|
|
|
|
|
|
Net assets, end of period (000’s omitted) |
|
|
|
$ |
333,990 |
|
|
$ |
230,787 |
|
Ratio to average net assets of:
|
|
|
|
|
|
|
|
|
|
|
Expenses net of waivers/reimbursements(f) |
|
|
|
|
0.21 |
% |
|
|
0.20 |
%(g) |
Expenses excluding waivers/reimbursements(f) |
|
|
|
|
0.26 |
% |
|
|
0.25 |
%(g) |
Net investment income (loss)* |
|
|
|
|
3.09 |
% |
|
|
2.73 |
%(g) |
Portfolio turnover rate(h) |
|
|
|
|
269 |
% |
|
|
147 |
% |
* |
|
Recognition of net investment income by the Fund is
affected by the timing of the declaration of dividends by the investment companies in which the Fund invests. |
(a) |
|
Commencement of operations. |
(b) |
|
Based on average shares outstanding. |
(c) |
|
Total investment return is calculated assuming an
initial investment made at the net asset value at the beginning of the period, reinvestment of all dividends and distributions, if any, at net asset
value during the period, and redemption on the last day of the period. Total return calculated for a period less than one year is not
annualized. |
(d) |
|
The market price returns are calculated using the
mean between the last bid and ask prices. |
(e) |
|
Since the Shares of the Funds did not trade in the
secondary market until the day after the Fund’s inception, for the period from the inception to the first day of the secondary market trading, the
NAV is used as a proxy for the secondary market trading price to calculate the market returns. |
(f) |
|
Excludes expenses incurred by the underlying
investments in other funds. |
(h) |
|
Portfolio turnover rate is not annualized and
excludes the value of portfolio securities received or delivered as in-kind creations or redemptions in connection with the Fund’s capital share
transactions. |
See notes to financial
statements.
167
Financial Highlights (continued)
Selected
Data for a Share of Capital Stock Outstanding
|
|
|
|
IQ S&P High Yield Low Volatility Bond
ETF
|
|
|
|
|
For the
Year Ended
April
30, 2018
|
|
For the Period
February 15, 2017(a)
to
April 30, 2017
|
Net asset value, beginning of period |
|
|
|
$ |
25.20 |
|
|
$ |
25.00 |
|
| |
|
|
|
|
|
|
|
|
|
|
Income from Investment Operations
|
|
|
|
|
|
|
|
|
|
|
Net investment income(b)* |
|
|
|
|
0.99 |
|
|
|
0.20 |
|
Net realized and unrealized gain (loss) |
|
|
|
|
(0.88 |
) |
|
|
0.10 |
|
Net increase (decrease) in net assets resulting from investment operations |
|
|
|
|
0.11 |
|
|
|
0.30 |
|
| |
|
|
|
|
|
|
|
|
|
|
Distributions from:
|
|
|
|
|
|
|
|
|
|
|
Net investment income |
|
|
|
|
(0.95 |
) |
|
|
(0.10 |
) |
Net asset value, end of period |
|
|
|
$ |
24.36 |
|
|
$ |
25.20 |
|
Market price, end of period |
|
|
|
$ |
24.32 |
|
|
$ |
25.34 |
|
| |
|
|
|
|
|
|
|
|
|
|
Total Return
|
|
|
|
|
|
|
|
|
|
|
Total investment return based on net asset value(c) |
|
|
|
|
0.39 |
% |
|
|
1.40 |
% |
Total investment return based on Market price(d) |
|
|
|
|
(0.36 |
)% |
|
|
1.93 |
%(e) |
| |
|
|
|
|
|
|
|
|
|
|
Ratios/Supplemental Data
|
|
|
|
|
|
|
|
|
|
|
Net assets, end of period (000’s omitted) |
|
|
|
$ |
107,192 |
|
|
$ |
49,145 |
|
Ratio to average net assets of:
|
|
|
|
|
|
|
|
|
|
|
Expenses net of waivers/reimbursements(f) |
|
|
|
|
0.40 |
% |
|
|
0.40 |
%(g) |
Expenses excluding waivers/reimbursements(f) |
|
|
|
|
0.41 |
% |
|
|
0.41 |
%(g) |
Net investment income (loss)* |
|
|
|
|
3.97 |
% |
|
|
4.05 |
%(g) |
Portfolio turnover rate(h) |
|
|
|
|
75 |
% |
|
|
15 |
% |
* |
|
Recognition of net investment income by the Fund is
affected by the timing of the declaration of dividends by the investment companies in which the Fund invests. |
(a) |
|
Commencement of operations. |
(b) |
|
Based on average shares outstanding. |
(c) |
|
Total investment return is calculated assuming an
initial investment made at the net asset value at the beginning of the period, reinvestment of all dividends and distributions, if any, at net asset
value during the period, and redemption on the last day of the period. Total return calculated for a period less than one year is not
annualized. |
(d) |
|
The market price returns are calculated using the
mean between the last bid and ask prices. |
(e) |
|
Since the Shares of the Funds did not trade in the
secondary market until the day after the Fund’s inception, for the period from the inception to the first day of the secondary market trading, the
NAV is used as a proxy for the secondary market trading price to calculate the market returns. |
(f) |
|
Excludes expenses incurred by the underlying
investments in other funds. |
(h) |
|
Portfolio turnover rate is not annualized and
excludes the value of portfolio securities received or delivered as in-kind creations or redemptions in connection with the Fund’s capital share
transactions. |
See notes to financial
statements.
168
Financial Highlights (continued)
Selected
Data for a Share of Capital Stock Outstanding
|
|
|
|
IQ Chaikin U.S. Small Cap ETF
|
|
|
|
|
For the Period
May 16, 2017(a)
to
April 30, 2018
|
Net asset value, beginning of period |
|
|
|
|
$ 25.16 |
|
| |
|
|
|
|
|
|
Income from Investment Operations
|
|
|
|
|
|
|
Net investment income(b)* |
|
|
|
|
0.16 |
|
Net realized and unrealized gain (loss) |
|
|
|
|
1.93 |
|
Net increase (decrease) in net assets resulting from investment operations |
|
|
|
|
2.09 |
|
| |
|
|
|
|
|
|
Distributions from:
|
|
|
|
|
|
|
Net investment income |
|
|
|
|
(0.12 |
) |
Net asset value, end of period |
|
|
|
|
$ 27.13 |
|
Market price, end of period |
|
|
|
|
$ 27.14 |
|
| |
|
|
|
|
|
|
Total Return
|
|
|
|
|
|
|
Total investment return based on net asset value(c) |
|
|
|
|
8.33 |
% |
Total investment return based on Market price(d) |
|
|
|
|
8.36 |
%(e) |
| |
|
|
|
|
|
|
Ratios/Supplemental Data
|
|
|
|
|
|
|
Net assets, end of period (000’s omitted) |
|
|
|
|
$465,347 |
|
Ratio to average net assets of:
|
|
|
|
|
|
|
Expenses net of waivers/reimbursements(f) |
|
|
|
|
0.35 |
%(g) |
Expenses excluding waivers/reimbursements(f) |
|
|
|
|
0.36 |
%(g) |
Net investment income (loss)* |
|
|
|
|
0.61 |
%(g) |
Portfolio turnover rate(h) |
|
|
|
|
106 |
% |
* |
|
Recognition of net investment income by the Fund is
affected by the timing of the declaration of dividends by the investment companies in which the Fund invests. |
(a) |
|
Commencement of operations. |
(b) |
|
Based on average shares outstanding. |
(c) |
|
Total investment return is calculated assuming an
initial investment made at the net asset value at the beginning of the period, reinvestment of all dividends and distributions, if any, at net asset
value during the period, and redemption on the last day of the period. Total return calculated for a period less than one year is not
annualized. |
(d) |
|
The market price returns are calculated using the
mean between the last bid and ask prices. |
(e) |
|
Since the Shares of the Funds did not trade in the
secondary market until the day after the Fund’s inception, for the period from the inception to the first day of the secondary market trading, the
NAV is used as a proxy for the secondary market trading price to calculate the market returns. |
(f) |
|
Excludes expenses incurred by the underlying
investments in other funds. |
(h) |
|
Portfolio turnover rate is not annualized and
excludes the value of portfolio securities received or delivered as in-kind creations or redemptions in connection with the Fund’s capital share
transactions. |
See notes to financial
statements.
169
Financial Highlights (continued)
Selected
Data for a Share of Capital Stock Outstanding
|
|
|
|
IQ Chaikin U.S. Large Cap ETF
|
|
|
|
|
For the Period
December 13, 2017(a)
to
April 30, 2018
|
Net asset value, beginning of period |
|
|
|
|
$ 25.05 |
|
| |
|
|
|
|
|
|
Income from Investment Operations
|
|
|
|
|
|
|
Net investment income(b)* |
|
|
|
|
0.15 |
|
Net realized and unrealized gain (loss) |
|
|
|
|
0.18 |
** |
Net increase (decrease) in net assets resulting from investment operations |
|
|
|
|
0.33 |
|
| |
|
|
|
|
|
|
Distributions from:
|
|
|
|
|
|
|
Net investment income |
|
|
|
|
(0.08 |
) |
Net asset value, end of period |
|
|
|
|
$ 25.30 |
|
Market price, end of period |
|
|
|
|
$ 25.30 |
|
| |
|
|
|
|
|
|
Total Return
|
|
|
|
|
|
|
Total investment return based on net asset value(c) |
|
|
|
|
1.31 |
% |
Total investment return based on Market price(d) |
|
|
|
|
1.32 |
%(e) |
| |
|
|
|
|
|
|
Ratios/Supplemental Data
|
|
|
|
|
|
|
Net assets, end of period (000’s omitted) |
|
|
|
|
$320,000 |
|
Ratio to average net assets of:
|
|
|
|
|
|
|
Expenses net of waivers/reimbursements(f) |
|
|
|
|
0.25 |
%(g) |
Expenses excluding waivers/reimbursements(f) |
|
|
|
|
0.26 |
%(g) |
Net investment income (loss)* |
|
|
|
|
1.59 |
%(g) |
Portfolio turnover rate(h) |
|
|
|
|
94 |
% |
* |
|
Recognition of net investment income by the Fund is
affected by the timing of the declaration of dividends by the investment companies in which the Fund invests. |
** |
|
Calculation of the net realized and unrealized
gain (loss) per share does not correlate with the Fund’s net realized and unrealized gain
(loss) presented on the Statements of Changes in Net Assets due to the timing of creation of Fund shares in relation to fluctuating
market values. |
(a) |
|
Commencement of operations. |
(b) |
|
Based on average shares outstanding. |
(c) |
|
Total investment return is calculated assuming an
initial investment made at the net asset value at the beginning of the period, reinvestment of all dividends and distributions, if any, at net asset
value during the period, and redemption on the last day of the period. Total return calculated for a period less than one year is not
annualized. |
(d) |
|
The market price returns are calculated using the
mean between the last bid and ask prices. |
(e) |
|
Since the Shares of the Funds did not trade in the
secondary market until the day after the Fund’s inception, for the period from the inception to the first day of the secondary market trading, the
NAV is used as a proxy for the secondary market trading price to calculate the market returns. |
(f) |
|
Excludes expenses incurred by the underlying
investments in other funds. |
(h) |
|
Portfolio turnover rate is not annualized and
excludes the value of portfolio securities received or delivered as in-kind creations or redemptions in connection with the Fund’s capital share
transactions. |
See notes to financial
statements.
170
Notes
to Financial Statements
April
30, 2018
1. ORGANIZATION
IndexIQ ETF Trust (the “Trust”) was
organized as a Delaware statutory trust on July 1, 2008 and is registered with the Securities and Exchange Commission (“SEC”) as an open-end,
management investment company, as defined by the Investment Company Act of 1940, as amended (the “1940 Act”). The Trust is currently
comprised of nineteen operational funds (collectively, the “Funds” and each individually, a “Fund”). The Funds are exchange-traded
funds (“ETFs”), whose shares are listed on a stock exchange and traded like equity securities at market prices.
Investors may find the financial statements
of any issuer whose securities represent a significant amount of the Fund’s assets
on the Securities and Exchange Commission’s website (www.sec.gov).
Funds
|
|
|
|
Diversification Policy
|
|
Commencement of
Operations
Date
|
IQ
Hedge Multi-Strategy Tracker ETF* |
|
|
|
Diversified |
|
March 25, 2009 |
IQ
Hedge Macro Tracker ETF* |
|
|
|
Diversified |
|
June
9, 2009 |
IQ
Hedge Market Neutral Tracker ETF* |
|
|
|
Diversified |
|
October 4, 2012 |
IQ
Hedge Long/Short Tracker ETF* |
|
|
|
Diversified |
|
March 24, 2015 |
IQ
Hedge Event-Driven Tracker ETF* |
|
|
|
Diversified |
|
March 24, 2015 |
IQ
Global Resources ETF |
|
|
|
Non-diversified |
|
October 27, 2009 |
IQ
Merger Arbitrage ETF |
|
|
|
Non-diversified |
|
November 17, 2009 |
IQ
Real Return ETF* |
|
|
|
Non-Diversified |
|
October 27, 2009 |
IQ
Global Agribusiness Small Cap ETF |
|
|
|
Non-diversified |
|
March 22, 2011 |
IQ
U.S. Real Estate Small Cap ETF |
|
|
|
Non-diversified |
|
June
14, 2011 |
IQ
50 Percent Hedged FTSE International ETF |
|
|
|
Non-diversified |
|
July
22, 2015 |
IQ
50 Percent Hedged FTSE Europe ETF |
|
|
|
Non-diversified |
|
July
22, 2015 |
IQ
50 Percent Hedged FTSE Japan ETF |
|
|
|
Non-diversified |
|
July
22, 2015 |
IQ
Leaders GTAA Tracker ETF* |
|
|
|
Diversified |
|
September 30, 2015 |
IQ
Enhanced Core Bond U.S. ETF* |
|
|
|
Non-diversified |
|
May
10, 2016 |
IQ
Enhanced Core Plus Bond U.S. ETF* |
|
|
|
Non-diversified |
|
May
10, 2016 |
IQ
S&P High Yield Low Volatility Bond ETF |
|
|
|
Non-diversified |
|
February 15, 2017 |
IQ
Chaikin U.S. Small Cap ETF |
|
|
|
Diversified |
|
May
16, 2017 |
IQ
Chaikin U.S. Large Cap ETF |
|
|
|
Diversified |
|
December 13, 2017 |
* |
|
Funds are “funds of funds”,
meaning that they see to achieve their investment objective by investing primarily in underlying funds, including ETFs, exchange-traded notes
(“ETNs”), and other exchange-traded vehicles issuing equity securities organized in the U.S., such as exchange traded commodity pools
(“ETVs”), and may include exchange-traded notes (“ETNs”) (such ETFs, ETVs and ETNs are referred to collectively as
“exchange-traded products” or “ETPs”). |
Each Fund’s investment objective is to seek daily
investment results, before fees and expenses that correspond to the performance of a particular index (the “Underlying Index”).
The underlying indices for the Funds are listed below:
Fund
|
|
|
|
Underlying Index
|
IQ Hedge Multi-Strategy Tracker ETF |
|
|
|
IQ
Hedge Multi-Strategy Index |
IQ Hedge Macro Tracker ETF |
|
|
|
IQ
Hedge Macro Index |
IQ Hedge Market Neutral Tracker ETF |
|
|
|
IQ
Hedge Market Neutral Index |
IQ Hedge Long/Short Tracker ETF |
|
|
|
IQ
Hedge Long/Short Index |
IQ Hedge Event-Driven Tracker ETF |
|
|
|
IQ
Hedge Event-Driven Index |
IQ Global Resources ETF |
|
|
|
IQ
Global Resources Index |
IQ Merger Arbitrage ETF |
|
|
|
IQ
Merger Arbitrage Index |
IQ Real Return ETF |
|
|
|
IQ
Real Return Index |
IQ Global Agribusiness Small Cap ETF |
|
|
|
IQ
Global Agribusiness Small Cap Index |
IQ U.S. Real Estate Small Cap ETF |
|
|
|
IQ
U.S. Real Estate Small Cap Index |
IQ 50 Percent Hedged FTSE International ETF |
|
|
|
FTSE
Developed ex North America 50% Hedged to USD Index |
IQ 50 Percent Hedged FTSE Europe ETF |
|
|
|
FTSE
Developed Europe 50% Hedged to USD Index |
IQ 50 Percent Hedged FTSE Japan ETF |
|
|
|
FTSE
Japan 50% Hedged to USD Index |
IQ Leaders GTAA Tracker ETF |
|
|
|
IQ
Leaders GTAA Index |
IQ Enhanced Core Bond U.S. ETF |
|
|
|
IQ
Enhanced Core Bond U.S. Index |
IQ Enhanced Core Plus Bond U.S. ETF |
|
|
|
IQ
Enhanced Core Plus Bond U.S. Index |
IQ S&P High Yield Low Volatility Bond ETF |
|
|
|
S&P U.S. High Yield Low Volatility Corporate Bond Index |
IQ Chaikin U.S. Small Cap ETF |
|
|
|
NASDAQ Chaikin Power U.S. Small Cap Index |
IQ Chaikin U.S. Large Cap ETF |
|
|
|
NASDAQ Chaikin Power U.S. Large Cap Index |
171
Notes to Financial Statements
(continued)
April
30, 2018
2. SIGNIFICANT ACCOUNTING POLICIES
Each Fund is an investment company and accordingly follows
the investment company accounting and reporting guidance of the Financial Account Standards Board (FASB)
Accounting Standard Codification Topic 946 Financial Services — Investment Companies. Each Fund prepares its financial statements in accordance
with generally accepted accounting principles (“GAAP”) in the United States of America and follows the significant accounting policies
described below.
Use of Estimates
Management makes certain estimates and assumptions that
affect the reported amounts of assets and liabilities and disclosure of contingent assets and liabilities at the date of the financial statements and
reported amounts of increases and decreases in the net assets from operations during the reporting period. Actual results could differ from those
estimates.
Indemnification
In the normal course of business, the Funds may enter into
contracts that contain a variety of representations and warranties and which provide general indemnifications for certain liabilities. Under the
Trust’s organizational documents, its officers and trustees are indemnified against certain liabilities that may arise out of performance of their
duties to the Trust. The Funds’ maximum exposure under these arrangements is unknown, as this would involve future claims that may be made against
the Funds that have not yet occurred. Based on experience, management is of the view that the risk of loss in connection with these potential
indemnification obligations is remote. However, there can be no assurance that material liabilities related to such obligations will not arise in the
future, which could adversely impact the Funds.
Investment Valuation
Each Fund issues and redeems shares on a continuous basis at
Net Asset Value (“NAV”) only in large blocks of shares called “Creation Units.” A Creation Unit consists of 50,000 shares. The
NAV is determined as of the close of trading (generally, 4:00 PM Eastern Time) on each day the New York Stock Exchange (“NYSE”)
is open for trading. The NAV of the shares of each Fund will be equal to each Fund’s total assets minus
each Fund’s total liabilities divided by the total number of shares outstanding. The NAV that is published will be rounded to the
nearest cent; however, for purposes of determining the price of Creation Units, the NAV will be calculated to five decimal places. The
consideration for purchase of a Creation Unit of shares of each Fund consist of in-kind deposits, however, the Funds reserve the
rights to permit cash payments.
In calculating NAV, each Fund’s
exchange-traded Equity Securities are valued at market value, which will generally be determined using the last reported official closing or last
trading price on the exchange or market on which the security is primarily traded at the time of valuation. Price information on exchange-traded funds
is taken from the exchange where the security is primarily traded.
Securities listed on the NASDAQ Stock Market, Inc. are
generally valued at the NASDAQ official closing price. The primary exchanges for a Fund’s foreign equity securities may close for trading at
various times prior to the close of regular trading on the NYSE, and the value of such securities used in computing each Fund’s NAV
are generally determined as of such time. Securities not listed on a national or foreign stock exchange may be valued on the basis of prices furnished
by approved pricing services or at the closing bid price on the over-the-counter market.
Debt Securities are generally valued using last available
bid prices or current market quotations provided by dealers or prices (including evaluated prices) supplied by approved independent third-party pricing
services. Pricing services may use matrix pricing or valuation models that utilize certain inputs and assumptions to derive values. Pricing services
generally value fixed-income securities assuming orderly transactions of an institutional round lot size, but a fund may hold or transact
in such securities in smaller odd lot sizes. Odd lots often trade at different prices that may be above or below the price at which the pricing service
has valued the security.
Generally, trading in money market instruments and
certain fixed-income securities is substantially completed each day at various times prior to the close of business on the NYSE. The values of such
securities used in computing the NAV of a fund are determined as of such times. Short-term Debt Instruments having a remaining
maturity of 60 days or less are generally valued at amortized cost, which approximates market value.
172
Notes to Financial Statements
(continued)
April
30, 2018
A swap on an exchange-listed security or securities are
valued based on the last reported sale price of the swap’s underlying security or securities on the exchange where the security or securities is
primarily traded, or if no sale price is available, at the mid-price of the security or securities underlying the swap on the exchange where the
security is primarily traded. A swap on an index is valued based on the publicly available index price. The index price, in turn, is determined by the
applicable index calculation agent, which generally values the securities underlying the index at the last reported sale price.
Futures contracts generally are valued at the settlement or
closing price determined by the applicable exchange. Exchange-traded option contracts, including options, futures and swaps, will be valued at their
most recent sale price. If no such sales are reported, these contracts will be valued at their last traded price.
Over-the counter (“OTC”) traded Financial
Instruments, including OTC-traded options, forwards and currency-related derivatives, are normally valued on the basis of quotes obtained from a third
party broker-dealer who makes markets in such securities or on the basis of quotes obtained from an independent third-party pricing
service.
Investment company securities (other than ETFs) are valued
at NAV.
Foreign securities and instruments are valued in their local
currency following the methodologies described above. Foreign securities, instruments and currencies will be translated to U.S. dollars, based on
foreign currency exchange rate quotations supplied by the London Stock Exchange.
Foreign Currency Translation — Assets and liabilities
denominated in foreign currencies are translated into U.S. dollars using the current exchange rates at the close of each business day. The effect of
changes in foreign currency exchange rates on investments is included within net realized and unrealized gain (loss) on investments. Changes in the
value of other assets and liabilities as a result of fluctuations in foreign exchange rates are included on the Statements of Operations
within net change in unrealized appreciation/depreciation on foreign currency translations. Transactions denominated in foreign currencies are
translated into U.S. dollars on the date the transaction occurred, the effects of which are included within net realized gain (loss) on foreign
currency transactions.
If market quotations are not readily available, or if
it is determined that a quotation of a security does not represent fair value, then the security is valued at fair value as determined in good faith by
IndexIQ Advisors LLC (the “Advisor”) using procedures adopted by the Board of Trustees (the “Board”). The
circumstances in which a security may be fair valued include, among others: the occurrence of events that are significant to a particular issuer, such
as mergers, restructurings or defaults; the occurrence of events that are significant to an entire market, such as natural disasters in a particular
region or government actions; trading restrictions on securities; thinly traded securities; and market events such as trading halts and early market
closings. Due to the inherent uncertainty of valuations, fair values may differ significantly from the values that would have been used had an active
market existed. Fair valuation could result in a different NAV than a NAV determined by using market quotes.
A fund may automatically sweep uninvested cash
balances into a money market fund, the Morgan Stanley Institutional Liquidity Funds Treasury Portfolio — Institutional Class and the
BlackRock Liquidity Funds Treasury Trust Fund Portfolio, Institutional Class. The Morgan Stanley Institutional Liquidity Funds Treasury
Portfolio and BlackRock Liquidity Funds Treasury Trust Fund Portfolio seeks preservation of capital, daily liquidity and maximum current income.
The Morgan Stanley Institutional Liquidity Funds Treasury Portfolio and BlackRock Liquidity Funds Treasury Trust Fund Portfolio
have no redemption restriction and are valued at the daily NAV.
Under normal conditions, each Fund invests cash collateral
from securities lending activities into the Dreyfus Government Cash Management Fund — Institutional Shares. The Dreyfus Government Cash
Management Fund’s investment objective is to maximize current income to the extent consistent with the preservation of capital and
the maintenance of liquidity. Dreyfus Government Cash Management Fund has no redemption restrictions and is valued at the daily
NAV.
173
Notes to Financial Statements
(continued)
April
30, 2018
Fair Value Measurement
Accounting Standards Codification (“ASC”) Topic
820, Fair Value Measurements and Disclosures defines fair value, establishes a framework for measuring fair value in accordance with GAAP, and
requires disclosure about fair value measurements. It also provides guidance on determining when there has been a significant decrease in the volume
and level of activity for an asset or liability, when a transaction is not orderly, and how that information must be incorporated into fair value
measurement. Under ASC 820, various inputs are used in determining the value of the Funds’ investments. These inputs are summarized in the
following hierarchy:
• |
|
Level 1 — Unadjusted quoted prices in active markets for
identical assets or liabilities that the Funds have the ability to access. |
• |
|
Level 2 — Observable inputs other than quoted prices included
in Level 1 that are observable for the asset or liability, either directly or indirectly. These inputs may include quoted prices for the identical
instrument on an inactive market, prices for similar securities, interest rates, prepayment speeds, credit risk, yield curves, default rates and
similar data. |
• |
|
Level 3 — Unobservable inputs for the asset or liability, to
the extent relevant observable inputs are not available; representing the Funds’ own assumptions about the assumptions a market participant would
use in valuing the asset or liability, and would be based on the best information available. |
A financial instrument’s level within the fair value
hierarchy is based on the lowest level of any input that is significant to the fair value measurement. The inputs or methodology used for valuing
instruments are not necessarily an indication of the risk associated with investing in those instruments.
The availability of observable inputs can vary from security
to security and is affected by a wide variety of factors, including, for example, the type of security, whether the security is new and not yet
established in the marketplace, the liquidity of markets, and other characteristics particular to the security. To the extent that valuation is based
on models or inputs that are less observable or unobservable in the market, the determination of fair value requires more judgment. Accordingly, the
degree of judgment exercised in determining fair value is greatest for instruments categorized in Level 3. With respect to the valuation of Level 3
securities, the Advisor may employ a market-based valuation approach which may use related or comparable securities, recent
transactions, market multiples, book values, and other relevant information to determine fair value. The Advisor may also use an income-based valuation
approach in which anticipated future cash flows of the financial instrument are discounted to calculate fair value. The Advisor representatives meet
regularly to review and discuss the appropriateness of such fair values using more current information such as, recent security news, recent market
transactions, updated corporate action information and/or other macro or security specific events.
All other securities and investments for which market values
are not readily available, including restricted securities, and those securities for which it is inappropriate to determine prices in accordance with
the aforementioned procedures, are valued at fair value as determined in good faith under procedures adopted by the Board, although the actual
calculations may be done by others. Factors considered in making this determination may include, but are not limited to, information obtained by
contacting the issuer, analysts, or the appropriate stock exchange (for exchange-traded securities), analysis of the issuer’s financial statements
or other available documents and, if necessary, available information concerning other securities in similar circumstances.
The inputs or methodology used for valuing securities are
not necessarily an indication of the risk associated with investing in those securities. The hierarchy classification of inputs used to value each
Fund’s investments at April 30, 2018 is disclosed at the end of each Fund’s Schedule of Investments.
Tax Information, Dividends and Distributions to
Shareholders and Uncertain Tax Positions
Each Fund is treated as a separate entity for federal income
tax purposes. Each Fund’s policy is to comply with the requirements of the Internal Revenue Code of 1986, as amended (the “Internal Revenue
Code”), applicable to regulated investment companies and to distribute all of the taxable income to the shareholders of the Funds within
the allowable time limits. Distributions to Shareholders are recorded on the ex-dividend date. In addition,
174
Notes to Financial Statements
(continued)
April
30, 2018
the Funds may determine to distribute at least annually
amounts representing the full dividend yield net of expenses on the underlying investment securities, as if the Funds owned the underlying investment
securities for the entire dividend period in which case some portion of each distribution may result in a return of capital. The amount of dividends
and distributions from net investment income and net realized capital gains are determined in accordance with Federal income tax regulations which may
differ from GAAP. These “book/tax” differences are either considered temporary or permanent in nature. To the extent these differences are
permanent in nature, such amounts are reclassified within the components of net assets based on their Federal tax basis treatment; temporary
differences do not require reclassification. Dividends and distributions, which exceed earnings and profit for tax purposes are reported as a tax
return of capital. Therefore, no federal, state and local income tax provisions are required.
Management evaluates each Fund’s tax positions to
determine if the tax positions taken meet the minimum recognition threshold in connection with accounting for uncertainties in income tax positions
taken or expected to be taken for the purposes of measuring and recognizing tax liabilities in the financial statements. Recognition of tax benefits of
an uncertain tax position is required only when the position is “more likely than not” to be sustained assuming examination by taxing
authorities. Management has analyzed each Fund’s tax positions taken on federal, state and local income tax returns for all open tax years (for up
to three tax years), and has concluded that no provisions for federal, state and local income tax are required in each Fund’s financial
statements. Each Fund’s federal, state and local income and federal excise tax returns for tax years for which the applicable statutes of
limitations have not expired are subject to examination by the Internal Revenue Service and state and local departments of
revenue.
The Funds have concluded that there is no tax liability
resulting from uncertain income tax positions taken or expected to be taken.
Foreign Taxes
The Funds may be subject to foreign taxes on income and
other transaction-based taxes imposed by certain countries in which they invest. A portion of the taxes on gains on investments or currency
purchases/repatriation may be recoverable. The Funds will accrue such taxes and recoveries as applicable, based upon their current interpretation of
tax rules and regulations that exist in the markets in which they invest.
The Funds may be subject to taxation on realized capital
gains, repatriation proceeds and other transaction-based taxes imposed by certain countries in which they invest. The Funds will accrue the
unrecoverable portion of such taxes as applicable based upon their current interpretation of tax rules and regulations that exist in the market in
which they invests. Capital gains taxes relating to positions still held are reflected as a liability on the Statements of Assets and
Liabilities, as well as an adjustment to the Funds’ net unrealized appreciation/depreciation. Taxes related to capital gains realized during the
year ended April 30, 2018, if any, are reflected as part of net realized gain (loss) on the Statements of Operations. Changes in
tax liabilities related to capital gains taxes on unrealized investment gains, if any, are reflected as part of the change in net unrealized
appreciation/depreciation on investments on the Statements of Operations. Transaction-based charges are generally assessed as a
percentage of the transaction amount.
Cash Equivalents
Cash equivalents consist of highly liquid investments, with
maturities of three months or less when acquired, and are disclosed as Short-Term Investments in the Schedules of Investments.
Security Transactions
Security transactions are recorded as of the trade date.
Realized gains and losses on sales of investment securities are calculated using the identified cost method.
Investment Income and
Expenses
Dividend income is recognized on the ex-date. Interest
income is accrued daily. An amortized cost method of valuation may be used with respect to debt obligations with sixty days or less remaining to
maturity unless the Advisor determines in good faith that such method does not represent fair value. Distributions of realized
capital
175
Notes to Financial Statements
(continued)
April
30, 2018
gains by underlying funds are recorded as realized
capital gains on the ex-date. Expenses of the Trust arising in connection with a specific Fund are allocated to that Fund. Other Trust expenses which
cannot be directly attributed to a Fund are apportioned among the Funds in the Trust based upon the relative net assets or other appropriate measures.
The Funds distribute substantially all their net investment income to shareholders in the form of dividends. Net investment income is distributed
monthly and capital gains are typically distributed at least annually. Dividends may be declared and paid more frequently to comply with the
distribution requirements of the Internal Revenue Code. The expenses of the investment companies in which a Fund invests are not included in the
amounts shown as expenses on the Statements of Operations or in the expense ratios included in the financial highlights.
Discounts and premiums on securities purchased, other
than Short-Term Investments, for the Funds are accreted and amortized, respectively, on the effective interest rate method over the life of the
respective securities. Discounts and premiums on Short-Term Investments are accreted and amortized, respectively, on the straight-line method. The
straight-line method approximates the effective interest method for Short-Term Investments. Income from payment-in-kind securities is accreted daily
based on the effective interest method.
Securities Lending
The Bank of New York Mellon (“BNY
Mellon”) serves as the Funds’ securities lending agent. The Funds may lend portfolio securities to certain creditworthy
borrowers, including the Funds’ securities lending agent. It is the Funds’ policy that, at origination, all loans are secured by collateral
of at least 102% of the value of U.S. securities loaned and 105% of the value of foreign securities loaned. Collateral in the form of cash and/or high
grade debt obligations, is maintained at all times. Cash collateral can be invested in certain money market mutual funds which also have exposure to
the fluctuations of the market. Each Fund receives compensation for lending its securities from fees paid by the borrowers of securities, net of fee
rebates paid to the borrower plus reasonable administrative and custody fees. The dividend and interest income earned on the securities loaned is
accounted for in the same manner as other dividend and interest income. The borrower pays to the Funds an amount equal to any dividends or interest
received on loaned securities. Lending portfolio securities could result in a loss or delay in recovering the Funds’ securities if the borrower
defaults.
A Fund’s security lending activities are governed by a
Securities Lending Authorization Agreement (“Lending Agreement”) between each Fund and the lending agent. The Lending Agreement
authorizes the lending agent to lend qualifying U.S. and foreign securities held by a fund to approved borrowers (each a
“Borrower”). To mitigate borrower risk, a fund typically receives from a Borrower, collateral in the form of U.S. dollar cash
and/or securities issued or guaranteed by the U.S. Government or its agencies in excess of the market value of the securities loaned. Under the
provisions of the Lending Agreement, each Fund shall have, as to the collateral, all of the rights and remedies of a secured party under
applicable law. The lending agent is permitted to invest the cash collateral it receives from a Borrower into a money market fund which is subject to
market fluctuation. Therefore, a fund is exposed to risk of loss if the value of invested cash collateral is insufficient to satisfy the
fund’s obligation to return the full amount owed to such Borrower.
In accordance with the securities lending agreement between
the Funds and the BNY Mellon, the Funds will be indemnified by the BNY Mellon in the event of default of a third party
Borrower.
176
Notes to Financial Statements
(continued)
April
30, 2018
The securities lending income earned by each Fund is
disclosed on the Statements of Operations. The value of loaned securities and related collateral are shown on a gross basis in the Schedules of
Investments and Statements of Assets and Liabilities. As of April 30, 2018, the cash collateral consisted of an institutional money market fund and
non-cash collateral consisted of U.S. Treasury Bills, Notes, Bonds, STRIPs and U.S. Treasury Inflation Indexed Notes and Bonds with the following
maturities:
|
|
|
|
Money Market
Mutual
Fund
|
|
U.S. Government Securities
|
|
Fund
|
|
|
|
Overnight and
Continuous
|
|
<30 Days
|
|
Between 30 & 90 Days
|
|
>90 Days
|
|
Total
|
IQ Hedge Multi-Strategy Tracker ETF |
|
|
|
$ |
140,959,766 |
|
|
$ |
3,746,383 |
|
|
$ |
3,068,258 |
|
|
$ |
29,743,184 |
|
|
$ |
36,557,825 |
|
IQ Hedge Macro Tracker ETF |
|
|
|
|
1,906,306 |
|
|
|
38,633 |
|
|
|
31,726 |
|
|
|
170,023 |
|
|
|
240,382 |
|
IQ Hedge Market Neutral Tracker ETF |
|
|
|
|
1,911,647 |
|
|
|
— |
|
|
|
— |
|
|
|
— |
|
|
|
— |
|
IQ Hedge Long/Short Tracker ETF |
|
|
|
|
1,040,224 |
|
|
|
— |
|
|
|
— |
|
|
|
— |
|
|
|
— |
|
IQ Hedge Event-Driven Tracker ETF |
|
|
|
|
1,021,562 |
|
|
|
1,056 |
|
|
|
165 |
|
|
|
15,104 |
|
|
|
16,325 |
|
IQ Global Resources ETF |
|
|
|
|
4,839,696 |
|
|
|
981,635 |
|
|
|
96,949 |
|
|
|
15,653,049 |
|
|
|
16,731,633 |
|
IQ Merger Arbitrage ETF |
|
|
|
|
26,324,770 |
|
|
|
— |
|
|
|
88,022 |
|
|
|
23,500,673 |
|
|
|
23,588,695 |
|
IQ Real Return ETF |
|
|
|
|
2,070,277 |
|
|
|
5,219 |
|
|
|
60,454 |
|
|
|
5,326,454 |
|
|
|
5,392,127 |
|
IQ Global Agribusiness Small Cap ETF |
|
|
|
|
246,668 |
|
|
|
— |
|
|
|
2,544 |
|
|
|
535,947 |
|
|
|
538,491 |
|
IQ U.S. Real Estate Small Cap ETF |
|
|
|
|
3,865,903 |
|
|
|
795,645 |
|
|
|
138,636 |
|
|
|
18,698,798 |
|
|
|
19,633,079 |
|
IQ 50 Percent Hedged FTSE International ETF |
|
|
|
|
9,366,228 |
|
|
|
— |
|
|
|
317 |
|
|
|
2,519,469 |
|
|
|
2,519,786 |
|
IQ 50 Percent Hedged FTSE Europe ETF |
|
|
|
|
4,501,909 |
|
|
|
— |
|
|
|
— |
|
|
|
— |
|
|
|
— |
|
IQ 50 Percent Hedged FTSE Japan ETF |
|
|
|
|
36,157 |
|
|
|
— |
|
|
|
468 |
|
|
|
223,430 |
|
|
|
223,898 |
|
IQ Leaders GTAA Tracker ETF |
|
|
|
|
7,739,673 |
|
|
|
9,792 |
|
|
|
9,690 |
|
|
|
572,130 |
|
|
|
591,612 |
|
IQ Enhanced Core Bond U.S. ETF |
|
|
|
|
528,755 |
|
|
|
— |
|
|
|
— |
|
|
|
— |
|
|
|
— |
|
IQ Enhanced Core Plus Bond U.S. ETF |
|
|
|
|
73,354,896 |
|
|
|
133,515 |
|
|
|
31,824 |
|
|
|
3,171,830 |
|
|
|
3,337,169 |
|
IQ Chaikin U.S. Small Cap ETF |
|
|
|
|
4,391,432 |
|
|
|
7,695 |
|
|
|
244,833 |
|
|
|
16,409,306 |
|
|
|
16,661,834 |
|
The collateral amount presented is in excess of the
securities on loan.
Master Netting Arrangements
In order to better define its contractual rights and to
secure rights that will help a fund mitigate its counterparty risk, a fund may enter into an International Swaps and
Derivatives Association, Inc. Master Agreement (“ISDA Master Agreement”) or similar agreement with its counterparties. An ISDA Master
Agreement is a bilateral agreement between a fund and a counterparty that governs OTC derivatives, including
forward foreign currency contracts, and typically contains, among other things, collateral posting terms, netting and
rights of offset provisions in the event of a default and/or termination event. Generally, the amount of collateral due from or to counterparty must
exceed a minimum transfer amount threshold before a transfer is required to be made. To the extent amounts due to a fund from its
derivatives counterparties are not fully collateralized, contractually or otherwise, the fund bears the risk of loss from counterparty
non-performance.
For financial reporting purposes, the Funds do not offset
assets and liabilities subject to master netting arrangements or similar arrangements on the Statements of Assets and Liabilities.
Therefore, all qualifying transactions are presented on a gross basis on the Statements of Assets and Liabilities.
Total Return Swap contracts are valued at the unrealized
appreciation/depreciation on Total Return Swap contracts of the instrument. Securities segregated as
collateral for swap contracts are footnoted within each Fund’s Schedule of Investments and the cash collateral is noted at the end of each
Fund’s swap table.
177
Notes to Financial Statements
(continued)
April
30, 2018
At April 30, 2018, the unrealized
appreciation/depreciation on Total Return Swap contracts for the following Funds were zero,
reflecting a reset date at period end based on the contractual agreement with Bank of America Merrill Lynch (“Merrill Lynch”)
and Morgan Stanley Capital Service LLC (“Morgan Stanley”), each Fund’s counterparty.
|
|
IQ Hedge Multi-Strategy Tracker ETF
IQ Hedge Macro Tracker
ETF
IQ Hedge Market Neutral Tracker ETF
IQ Hedge Long/Short Tracker ETF
IQ Hedge Event-Driven Tracker ETF
IQ Global Resources ETF
IQ Merger Arbitrage ETF
IQ Leaders GTAA Tracker ETF |
As of April 30, 2018, the impact of netting of assets and
liabilities and offsetting of collateral pledged or received based on contractual netting provisions in the Lending Agreement with BNY
Mellon are detailed in the following table:
|
|
|
|
Assets
|
|
Liabilities
|
Fund
|
|
|
|
Gross Amounts
Presented in
Statements of
Assets and
Liabilities
|
|
Collateral
Received1
|
|
Net
Amount
|
|
Gross Amounts
Presented in
Statements of
Assets and
Liabilities
|
|
Collateral
Pledged
|
|
Net
Amount
|
IQ Hedge Multi-Strategy Tracker ETF |
|
|
|
$ |
173,134,325 |
|
|
$ |
(173,134,325 |
) |
|
$ |
— |
|
|
$ |
— |
|
|
$ |
— |
|
|
$ |
— |
|
IQ Hedge Macro Tracker ETF |
|
|
|
|
2,096,159 |
|
|
|
(2,096,159 |
) |
|
|
— |
|
|
|
— |
|
|
|
— |
|
|
|
— |
|
IQ Hedge Market Neutral Tracker ETF |
|
|
|
|
1,865,262 |
|
|
|
(1,865,262 |
) |
|
|
— |
|
|
|
— |
|
|
|
— |
|
|
|
— |
|
IQ Hedge Long/Short Tracker ETF |
|
|
|
|
1,017,227 |
|
|
|
(1,017,227 |
) |
|
|
— |
|
|
|
— |
|
|
|
— |
|
|
|
— |
|
IQ Hedge Event-Driven Tracker ETF |
|
|
|
|
1,013,117 |
|
|
|
(1,013,117 |
) |
|
|
— |
|
|
|
— |
|
|
|
— |
|
|
|
— |
|
IQ Global Resources ETF |
|
|
|
|
20,754,674 |
|
|
|
(20,754,674 |
) |
|
|
— |
|
|
|
— |
|
|
|
— |
|
|
|
— |
|
IQ Merger Arbitrage ETF |
|
|
|
|
49,063,687 |
|
|
|
(49,063,687 |
) |
|
|
— |
|
|
|
— |
|
|
|
— |
|
|
|
— |
|
IQ Real Return ETF |
|
|
|
|
7,265,170 |
|
|
|
(7,265,170 |
) |
|
|
— |
|
|
|
— |
|
|
|
— |
|
|
|
— |
|
IQ Global Agribusiness Small Cap ETF |
|
|
|
|
740,685 |
|
|
|
(740,685 |
) |
|
|
— |
|
|
|
— |
|
|
|
— |
|
|
|
— |
|
IQ U.S. Real Estate Small Cap ETF |
|
|
|
|
22,892,721 |
|
|
|
(22,892,721 |
) |
|
|
— |
|
|
|
— |
|
|
|
— |
|
|
|
— |
|
IQ 50 Percent Hedged FTSE International ETF |
|
|
|
|
11,269,536 |
|
|
|
(11,269,536 |
) |
|
|
— |
|
|
|
— |
|
|
|
— |
|
|
|
— |
|
IQ 50 Percent Hedged FTSE Europe ETF |
|
|
|
|
4,262,780 |
|
|
|
(4,262,780 |
) |
|
|
— |
|
|
|
— |
|
|
|
— |
|
|
|
— |
|
IQ 50 Percent Hedged FTSE Japan ETF |
|
|
|
|
246,157 |
|
|
|
(246,157 |
) |
|
|
— |
|
|
|
— |
|
|
|
— |
|
|
|
— |
|
IQ Leaders GTAA Tracker ETF |
|
|
|
|
8,117,227 |
|
|
|
(8,117,227 |
) |
|
|
— |
|
|
|
— |
|
|
|
— |
|
|
|
— |
|
IQ Enhanced Core Bond U.S. ETF |
|
|
|
|
518,694 |
|
|
|
(518,694 |
) |
|
|
— |
|
|
|
— |
|
|
|
— |
|
|
|
— |
|
IQ Enhanced Core Plus Bond U.S. ETF |
|
|
|
|
74,895,524 |
|
|
|
(74,895,524 |
) |
|
|
— |
|
|
|
— |
|
|
|
— |
|
|
|
— |
|
IQ S&P High Yield Low Volatility Bond ETF |
|
|
|
|
— |
|
|
|
— |
|
|
|
— |
|
|
|
— |
|
|
|
— |
|
|
|
— |
|
IQ Chaikin U.S. Small Cap ETF |
|
|
|
|
20,440,510 |
|
|
|
(20,440,510 |
) |
|
|
— |
|
|
|
— |
|
|
|
— |
|
|
|
— |
|
IQ Chaikin U.S. Large Cap ETF |
|
|
|
|
— |
|
|
|
— |
|
|
|
— |
|
|
|
— |
|
|
|
— |
|
|
|
— |
|
1 |
|
The amount of collateral presented is limited such
that the net amount cannot be less than zero. |
178
Notes to Financial Statements
(continued)
April
30, 2018
At April 30, 2018, each Fund’s OTC
derivative assets, which may be offset against each Fund’s OTC derivative liabilities and collateral received from the counterparty,
are as follows:
Fund
|
|
|
|
Gross Amounts
of Assets
Presented in
Statements of
Assets and
Liabilities
|
|
Financial
Instruments
and
Derivatives
Available
for Offset
|
|
Net Amount
of Derivatives
Assets
|
|
Gross Amounts
of Liabilities
Presented in
Statements of
Assets and
Liabilities
|
|
Financial
Instruments
and
Derivatives
Available
for Offset
|
|
Net Amount
of Derivatives
Liabilities
|
IQ 50 Percent Hedged FTSE International ETF
|
|
|
|
|
|
|
|
|
|
|
|
|
|
|
|
|
|
|
|
|
|
|
|
|
|
|
Morgan Stanley |
|
|
|
$ |
6,337,696 |
|
|
$ |
(233,191 |
) |
|
$ |
6,104,505 |
|
|
$ |
233,191 |
|
|
$ |
(233,191 |
) |
|
$ |
— |
|
IQ 50 Percent Hedged FTSE Europe ETF
|
|
|
|
|
|
|
|
|
|
|
|
|
|
|
|
|
|
|
|
|
|
|
|
|
|
|
Morgan Stanley |
|
|
|
|
1,867,569 |
|
|
|
(67,332 |
) |
|
|
1,800,237 |
|
|
|
67,332 |
|
|
|
(67,332 |
) |
|
|
— |
|
IQ 50 Percent Hedged FTSE Japan ETF
|
|
|
|
|
|
|
|
|
|
|
|
|
|
|
|
|
|
|
|
|
|
|
|
|
|
|
Merrill Lynch |
|
|
|
|
523,038 |
|
|
|
(21,937 |
) |
|
|
501,101 |
|
|
|
21,937 |
|
|
|
(21,937 |
) |
|
|
— |
|
Investment Income and Expenses
Dividend income is recognized on the ex-date. Interest
income is accrued daily. An amortized cost method of valuation may be used with respect to debt obligations with sixty days or less remaining to
maturity unless the Advisor determines in good faith that such method does not represent fair value. Distributions of realized capital gains by
underlying funds are recorded as realized capital gains on the ex-date. Expenses of the Trust arising in connection with a specific Fund are allocated
to that Fund. Other Trust expenses which cannot be directly attributed to a Fund are apportioned among the Funds in the Trust based upon the relative
net assets or other appropriate measures. The Funds distribute substantially all their net investment income to shareholders in the form of dividends.
Net investment income and net capital gains are typically distributed to shareholders at least annually; the IQ U.S. Real Estate Small Cap ETF
distributes income quarterly. Distributions received from the IQ U.S. Real Estate Small Cap ETF investments in U.S. real estate investment
trusts (“REITs”) may be characterized as ordinary income, net capital gain or a return of capital. A return of capital is recorded
by the Funds as a reduction to the cost basis of the REIT. IQ Enhanced Core Bond U.S. ETF, IQ Enhanced Core Plus Bond U.S. ETF and IQ S&P High
Yield Low Volatility Bond ETF distribute income monthly. Dividends may be declared and paid more frequently to comply with the distribution
requirements of the Internal Revenue Code. The expenses of the investment companies in which the Funds invest are not included in
the amounts shown as expenses on the Statements of Operations or in the expense ratios included in the Financial Highlights
..
3. INVESTMENT MANAGEMENT AND OTHER
AGREEMENTS
Investment Advisory Agreement
The Advisor serves as the investment advisor to each
series of the Trust and is an indirect wholly-owned subsidiary of New York Life Investment Management Holdings LLC. Under an
Investment Advisory Agreement (“Advisory Agreement”) between the Advisor and the Trust on behalf of each
Fund, the Advisor provides a continuous investment program for each Fund’s assets in accordance with its investment objectives, policies and
limitations, and oversees the day-to-day operations of each Fund (including arranging for sub-advisory services) subject to the
supervision of the Board of Trustees.
The Advisor also: (i) supervises all non-advisory
operations of the Fund; (ii) provides personnel to perform such executive, administrative and clerical services as are reasonably necessary to provide
effective administration of the Fund; (iii) arranges for (a) the preparation of all required tax returns, (b) the preparation and submission of
reports to existing shareholders, (c) the periodic updating of prospectuses and statements of additional information and (d) the preparation of reports
to be filed with the SEC and other regulatory authorities; (iv) maintains the records of the Fund; and (v) provides office space and all necessary
office equipment and services.
The Advisory Agreement will continue in effect
with respect to the Fund from year to year provided such continuance is specifically approved at least annually by a majority of the Independent
Trustees of the Trust (“Independent Trustees”).
179
Notes to Financial Statements
(continued)
April
30, 2018
Pursuant to the Advisory Agreement, the Funds pay the
Advisor an advisory fee, based on the average daily net assets of each Fund, at the following annual rates:
Fund
|
|
|
|
Rate
|
IQ Hedge Multi-Strategy Tracker ETF |
|
|
|
0.75% |
IQ Hedge Macro Tracker ETF |
|
|
|
0.75% |
IQ Hedge Market Neutral Tracker ETF |
|
|
|
0.75% |
IQ Hedge Long/Short Tracker ETF |
|
|
|
0.75% |
IQ Hedge Event-Driven Tracker ETF |
|
|
|
0.75% |
IQ Global Resources ETF |
|
|
|
0.75% |
IQ Merger Arbitrage ETF |
|
|
|
0.75% |
IQ Real Return ETF |
|
|
|
0.48% |
IQ Global Agribusiness Small Cap ETF |
|
|
|
0.75% |
IQ U.S. Real Estate Small Cap ETF |
|
|
|
0.69% |
IQ 50 Percent Hedged FTSE International ETF |
|
|
|
0.35% |
IQ 50 Percent Hedged FTSE Europe ETF |
|
|
|
0.45% |
IQ 50 Percent Hedged FTSE Japan ETF |
|
|
|
0.45% |
IQ Leaders GTAA Tracker ETF |
|
|
|
0.45% |
IQ Enhanced Core Bond U.S. ETF |
|
|
|
0.25% |
IQ Enhanced Core Plus Bond U.S. ETF |
|
|
|
0.25% |
IQ S&P High Yield Low Volatility Bond ETF |
|
|
|
0.40% |
IQ Chaikin U.S. Small Cap ETF |
|
|
|
0.35% |
IQ Chaikin U.S. Large Cap ETF |
|
|
|
0.25% |
Such fee is accrued daily and paid monthly.
The Advisor has agreed to pay all expenses of the Funds,
except brokerage and other transaction expenses; extraordinary legal fees or expenses, such as those for litigation or arbitration; compensation and
expenses of the Independent Trustees, counsel to the Independent Trustees, and extraordinary expenses; compensation of the Chief Compliance Officer;
distribution fees and expenses paid by the Funds under any distribution plan adopted pursuant to Rule 12b-1 under the 1940 Act; and the advisory fee
payable to the Advisor hereunder.
For the IQ Hedge Multi-Strategy Tracker ETF, effective
November 1, 2017, the Advisor has entered into an Fee Waiver Agreement with the Fund under which it has contractually agreed, until
August 31, 2019, to waive a portion of its management fee equal to 0.22% of the average daily
net assets of the Fund.
For the IQ Enhanced Core Bond U.S. ETF and the IQ Enhanced
Core Plus Bond U.S. ETF, the Advisor has entered into a Fee Waiver Agreement with the Funds under which it has contractually agreed, until August 31,
2018, to waive a portion of its management fee equal to 0.05% of the average daily net assets of each Fund.
For the IQ S&P High Yield Low Volatility Bond ETF the
Advisor has entered into an Expense Limitation Agreement with the Fund under which it has contractually agreed, until August 31,
2018, to waive a portion of its management fee and/or reimburse expenses of the Fund to not more than 0.40% of the average daily
net assets of the Fund.
For the IQ 50 Percent Hedged FTSE International ETF, IQ 50
Percent Hedged FTSE Europe ETF, and IQ 50 Percent Hedged FTSE Japan ETF, effective August 31, 2017, the Advisor has entered into an Expense
Limitation Agreement with the Funds under which it has contractually agreed, until August 31, 2018, to waive a portion of its management fee and/or
reimburse expenses of each Fund to not more than 0.20%, 0.30% and 0.30%, respectively, of the average daily net assets of each respective
Fund.
For the IQ Chaikin U.S. Small Cap ETF and IQ
Chaikin U.S. Large Cap ETF, the Advisor has entered into an Expense Limitation Agreement with the Funds under which it has contractually
agreed, until August 31, 2018, to waive a portion of its management fee and/or reimburse expenses of each Fund to not more than 0.35% and 0.25%,
respectively of the average daily net assets of each respective Fund.
180
Notes to Financial Statements
(continued)
April
30, 2018
Investment Sub-Advisory Agreement
MacKay Shields LLC (“MacKay Shields” or the
(“Sub-Advisor”)), a registered investment adviser and an indirect, wholly-owned subsidiary of New York Life, serves as Sub-Advisor to the IQ
S&P High Yield Low Volatility Bond ETF and is responsible for the day-to-day portfolio management of the Fund. Pursuant to the terms of the
Subadvisory Agreement (“Subadvisory Agreement”) between the Advisor and the Sub-advisor, the Advisor pays for the services of
the Sub-Advisor.
Distribution (12b-1 Fees)
ALPS Distributors, Inc. serves as the Funds’
distributor (the “Distributor”) pursuant to a Distribution Services Agreement. The Board has adopted a Distribution and Service Plan pursuant
to Rule 12b-1 under the 1940 Act (“Rule 12b-1 Plan”). In accordance with the Rule 12b-1 Plan, the Funds are authorized to pay an amount up to
0.10% of each Fund’s average daily net assets each year for certain distribution-related activities. As authorized by the Board, no Rule 12b-1
fees are currently paid by the Funds and there are no plans to impose these fees. However, in the event Rule 12b-1 fees are charged in the future, they
will be paid out of each respective Fund’s assets. The Advisor and its affiliates may, out of their own resources, pay amounts to third
parties for distribution or marketing services on behalf of the Funds.
As described in Note 4 below, the Distributor has entered
into Participant Agreements with certain broker-dealers and others that allow those parties to be Authorized Participants and to subscribe for and
redeem shares of the Funds. Also as described in Note 4 below, such Authorized Participants may from time to time hold, of record or beneficially, a
substantial percentage of the Funds’ shares outstanding, act as executing or clearing broker for investment transactions on behalf of the Funds
and/or serve as counterparty to derivative transactions with each Fund.
Administrator, Custodian and Transfer
Agent
BNY Mellon (in each capacity, the
“Administrator,” “Custodian” or “Transfer Agent”) serves as the Funds’ Administrator, Custodian and Transfer Agent
pursuant to the Fund Administration and Accounting Agreement. Under the terms of this agreement, the Advisor pays the Funds’ Administrative,
Custody and Transfer Agency fees. BNY Mellon is a subsidiary of BNY Mellon Corporation, a financial holding
company.
4. CAPITAL SHARE TRANSACTIONS
Shares are created and redeemed on a continuous basis at NAV
only in groups of 50,000 shares called Creation Units. Except when aggregated in Creation Units, shares are not redeemable. Transactions
in shares of the Funds are disclosed in detail on the Statements of Changes in Net Assets. Only “Authorized Participants” may
purchase or redeem shares directly from the Funds. An Authorized Participant is either (i) a broker-dealer or other participant in the clearing process
through the Continuous Net Settlement System of National Securities Clearing Corporation or (ii) a Depository Trust Company (“DTC”)
participant and, in each case, must have executed a Participant Agreement with the Distributor. Most retail investors will not qualify as Authorized
Participants or have the resources to create and redeem whole Creation Units. Therefore, they will be unable to purchase or redeem
the shares directly from the Funds. Rather, most retail investors will purchase shares in the secondary market with the assistance of a broker and will
be subject to customary brokerage commissions or fees. Securities received or delivered in connection with in-kind creates and redeems are valued as of
the close of business on the effective date of the creation or redemption.
181
Notes to Financial Statements
(continued)
April
30, 2018
5. FEDERAL INCOME TAX
At April 30, 2018, the cost and unrealized
appreciation/depreciation of investments, including applicable derivative contracts and other financial instruments, as determined on a federal income
tax basis, were as follows:
Fund
|
|
|
|
Cost
|
|
Gross
Unrealized
Appreciation
|
|
Gross
Unrealized
Depreciation
|
|
Net Unrealized
Appreciation/
(Depreciation)
|
IQ Hedge Multi-Strategy Tracker ETF |
|
|
|
$ |
1,238,557,846 |
|
|
$ |
33,303,948 |
|
|
|
($5,363,103 |
) |
|
$ |
27,940,845 |
|
IQ Hedge Macro Tracker ETF |
|
|
|
|
8,330,208 |
|
|
|
213,415 |
|
|
|
(47,422 |
) |
|
|
165,993 |
|
IQ Hedge Market Neutral Tracker ETF |
|
|
|
|
14,572,268 |
|
|
|
187,910 |
|
|
|
(43,539 |
) |
|
|
144,371 |
|
IQ Hedge Long/Short Tracker ETF |
|
|
|
|
9,751,204 |
|
|
|
211,980 |
|
|
|
(138,594 |
) |
|
|
73,386 |
|
IQ Hedge Event-Driven Tracker ETF |
|
|
|
|
4,116,484 |
|
|
|
77,370 |
|
|
|
(32,825 |
) |
|
|
44,545 |
|
IQ Global Resources ETF |
|
|
|
|
238,932,833 |
|
|
|
10,547,814 |
|
|
|
(7,389,954 |
) |
|
|
3,157,860 |
|
IQ Merger Arbitrage ETF |
|
|
|
|
557,170,193 |
|
|
|
7,244,881 |
|
|
|
(10,863,286 |
) |
|
|
(3,618,405 |
) |
IQ Real Return ETF |
|
|
|
|
47,508,556 |
|
|
|
91,259 |
|
|
|
(201,630 |
) |
|
|
(110,371 |
) |
IQ Global Agribusiness Small Cap ETF |
|
|
|
|
10,033,093 |
|
|
|
3,249,305 |
|
|
|
(1,199,794 |
) |
|
|
2,049,511 |
|
IQ U.S. Real Estate Small Cap ETF |
|
|
|
|
95,971,852 |
|
|
|
5,262,259 |
|
|
|
(15,097,960 |
) |
|
|
(9,835,701 |
) |
IQ 50 Percent Hedged FTSE International ETF |
|
|
|
|
558,618,792 |
|
|
|
48,692,326 |
|
|
|
(22,495,536 |
) |
|
|
26,196,790 |
|
IQ 50 Percent Hedged FTSE Europe ETF |
|
|
|
|
158,396,142 |
|
|
|
21,074,013 |
|
|
|
(5,837,823 |
) |
|
|
15,236,190 |
|
IQ 50 Percent Hedged FTSE Japan ETF |
|
|
|
|
28,434,885 |
|
|
|
6,806,408 |
|
|
|
(897,259 |
) |
|
|
5,909,149 |
|
IQ Leaders GTAA Tracker ETF |
|
|
|
|
56,884,046 |
|
|
|
991,463 |
|
|
|
(626,774 |
) |
|
|
364,689 |
|
IQ Enhanced Core Bond U.S. ETF |
|
|
|
|
54,175,061 |
|
|
|
— |
|
|
|
(2,559,457 |
) |
|
|
(2,559,457 |
) |
IQ Enhanced Core Plus Bond U.S. ETF |
|
|
|
|
417,841,627 |
|
|
|
— |
|
|
|
(10,524,587 |
) |
|
|
(10,524,587 |
) |
IQ S&P High Yield Low Volatility Bond ETF |
|
|
|
|
108,535,268 |
|
|
|
1,821 |
|
|
|
(2,738,412 |
) |
|
|
(2,736,591 |
) |
IQ Chaikin U.S. Small Cap ETF |
|
|
|
|
466,673,315 |
|
|
|
23,310,595 |
|
|
|
(20,212,402 |
) |
|
|
3,098,193 |
|
IQ Chaikin U.S. Large Cap ETF |
|
|
|
|
317,065,663 |
|
|
|
10,342,129 |
|
|
|
(7,539,466 |
) |
|
|
2,802,663 |
|
The differences between book and tax basis cost of
investments and net unrealized appreciation/depreciation are primarily attributable to wash sale loss deferrals, non-REIT return of capital
adjustments, pass through investments and the realization for tax purposes of unrealized gains on investments in passive foreign investment
companies held at April 30, 2018.
182
Notes to Financial Statements
(continued)
April
30, 2018
At April 30, 2018, the components of undistributed or
accumulated earnings/losses on a tax-basis were as follows:
Fund
|
|
|
|
Ordinary
Income
(Loss)1
|
|
Net Capital Gain
(Losses)2
|
|
Net Unrealized
Appreciation/
Depreciation
|
|
Total
Earnings/
(Losses)
|
IQ Hedge Multi-Strategy Tracker ETF |
|
|
|
$ |
10,247,100 |
|
|
$ |
(61,272,346 |
) |
|
$ |
27,940,845 |
|
|
$ |
(23,084,401 |
) |
IQ Hedge Macro Tracker ETF |
|
|
|
|
17,396 |
|
|
|
(6,033,131 |
) |
|
|
165,992 |
|
|
|
(5,849,743 |
) |
IQ Hedge Market Neutral Tracker ETF |
|
|
|
|
— |
|
|
|
(451,519 |
) |
|
|
144,371 |
|
|
|
(307,148 |
) |
IQ Hedge Long/Short Tracker ETF |
|
|
|
|
80,048 |
|
|
|
(200,430 |
) |
|
|
73,386 |
|
|
|
(46,996 |
) |
IQ Hedge Event-Driven Tracker ETF |
|
|
|
|
45,908 |
|
|
|
(49,018 |
) |
|
|
44,546 |
|
|
|
41,436 |
|
IQ Global Resources ETF |
|
|
|
|
(53,070 |
) |
|
|
(39,413,523 |
) |
|
|
3,155,849 |
|
|
|
(36,310,742 |
) |
IQ Merger Arbitrage ETF |
|
|
|
|
(45,213 |
) |
|
|
(6,270,303 |
) |
|
|
(3,628,892 |
) |
|
|
(9,944,408 |
) |
IQ Real Return ETF |
|
|
|
|
172,756 |
|
|
|
(1,478,815 |
) |
|
|
(110,371 |
) |
|
|
(1,416,430 |
) |
IQ Global Agribusiness Small Cap ETF |
|
|
|
|
47,383 |
|
|
|
(8,654,158 |
) |
|
|
2,048,095 |
|
|
|
(6,558,680 |
) |
IQ U.S. Real Estate Small Cap ETF |
|
|
|
|
— |
|
|
|
(3,506,788 |
) |
|
|
(9,835,701 |
) |
|
|
(13,342,489 |
) |
IQ 50 Percent Hedged FTSE International ETF |
|
|
|
|
4,572,887 |
|
|
|
(7,719,162 |
) |
|
|
26,140,188 |
|
|
|
22,993,913 |
|
IQ 50 Percent Hedged FTSE Europe ETF |
|
|
|
|
1,283,491 |
|
|
|
(4,755,084 |
) |
|
|
15,224,495 |
|
|
|
11,752,902 |
|
IQ 50 Percent Hedged FTSE Japan ETF |
|
|
|
|
344,436 |
|
|
|
(1,714,124 |
) |
|
|
5,900,812 |
|
|
|
4,531,124 |
|
IQ Leaders GTAA Tracker ETF |
|
|
|
|
202,092 |
|
|
|
(1,043,234 |
) |
|
|
364,689 |
|
|
|
(476,453 |
) |
IQ Enhanced Core Bond U.S. ETF |
|
|
|
|
— |
|
|
|
(3,216,813 |
) |
|
|
(2,559,457 |
) |
|
|
(5,776,270 |
) |
IQ Enhanced Core Plus Bond U.S. ETF |
|
|
|
|
14,785 |
|
|
|
(8,419,060 |
) |
|
|
(10,524,587 |
) |
|
|
(18,928,862 |
) |
IQ S&P High Yield Low Volatility Bond ETF |
|
|
|
|
368,463 |
|
|
|
(1,258,675 |
) |
|
|
(2,736,591 |
) |
|
|
(3,626,803 |
) |
IQ Chaikin U.S. Small Cap ETF |
|
|
|
|
87,868 |
|
|
|
(7,595,382 |
) |
|
|
3,098,193 |
|
|
|
(4,409,321 |
) |
IQ Chaikin U.S. Large Cap ETF |
|
|
|
|
245,918 |
|
|
|
(5,340,843 |
) |
|
|
2,802,663 |
|
|
|
(2,292,262 |
) |
| 1 |
|
Includes late year ordinary loss, if any. |
| 2 |
|
Amount includes the deferral of post October losses, if
any. |
The differences between book and tax basis components of net
assets are primarily attributable to wash sale loss deferrals and other book and tax differences including foreign currency contracts, swap contracts,
post-October and late year losses.
183
Notes to Financial Statements
(continued)
April
30, 2018
At April 30, 2018, the effect of permanent book/tax
reclassifications resulted in increases (decreases) to the components of net assets were as follows:
Fund
|
|
|
|
Undistributed
Net
Investment
Income/(Accumulated
Net Investment Loss)
|
|
Accumulated
Net Realized
Gain/(Loss) on
Investments
|
|
Paid-in
Capital
|
IQ Hedge Multi-Strategy Tracker ETF |
|
|
|
$ |
(7,940,345 |
) |
|
$ |
3,198,805 |
|
|
$ |
4,741,540 |
|
IQ Hedge Macro Tracker ETF |
|
|
|
|
(71,437 |
) |
|
|
131,218 |
|
|
|
(59,781 |
) |
IQ Hedge Market Neutral Tracker ETF |
|
|
|
|
(44,436 |
) |
|
|
96,700 |
|
|
|
(52,264 |
) |
IQ Hedge Long/Short Tracker ETF |
|
|
|
|
4,645 |
|
|
|
(121,079 |
) |
|
|
116,434 |
|
IQ Hedge Event-Driven Tracker ETF |
|
|
|
|
840 |
|
|
|
(840 |
) |
|
|
— |
|
IQ Global Resources ETF |
|
|
|
|
(2,058,158 |
) |
|
|
2,799,881 |
|
|
|
(741,723 |
) |
IQ Merger Arbitrage ETF |
|
|
|
|
624,939 |
|
|
|
(13,553,554 |
) |
|
|
12,928,615 |
|
IQ Real Return ETF |
|
|
|
|
8,132 |
|
|
|
(8,717 |
) |
|
|
585 |
|
IQ Global Agribusiness Small Cap ETF |
|
|
|
|
(1,327 |
) |
|
|
(432,721 |
) |
|
|
434,048 |
|
IQ U.S. Real Estate Small Cap ETF |
|
|
|
|
1,986,866 |
|
|
|
(1,888,207 |
) |
|
|
(98,659 |
) |
IQ 50 Percent Hedged FTSE International ETF |
|
|
|
|
149,523 |
|
|
|
(23,700,266 |
) |
|
|
23,550,743 |
|
IQ 50 Percent Hedged FTSE Europe ETF |
|
|
|
|
(19,637 |
) |
|
|
19,637 |
|
|
|
— |
|
IQ 50 Percent Hedged FTSE Japan ETF |
|
|
|
|
3,678 |
|
|
|
(302,742 |
) |
|
|
299,064 |
|
IQ Leaders GTAA Tracker ETF |
|
|
|
|
130,295 |
|
|
|
(3,831,136 |
) |
|
|
3,700,841 |
|
IQ Enhanced Core Bond U.S. ETF |
|
|
|
|
4,770 |
|
|
|
313,081 |
|
|
|
(317,851 |
) |
IQ Enhanced Core Plus Bond U.S. ETF |
|
|
|
|
(810 |
) |
|
|
919,126 |
|
|
|
(918,316 |
) |
IQ S&P High Yield Low Volatility Bond ETF |
|
|
|
|
1,825 |
|
|
|
(38,627 |
) |
|
|
36,802 |
|
IQ Chaikin U.S. Small Cap ETF |
|
|
|
|
(17,440 |
) |
|
|
(13,113,960 |
) |
|
|
13,131,400 |
|
IQ Chaikin U.S. Large Cap ETF |
|
|
|
|
— |
|
|
|
(128,249 |
) |
|
|
128,249 |
|
For financial reporting purposes, capital accounts are
adjusted to reflect the tax character of permanent book/tax differences. Reclassifications are primarily due to the tax treatment of foreign currency
gains and losses, investments in passive foreign investment companies, publicly traded partnerships, grantors trusts, real estate investment trusts,
regulated investment companies, swaps, and redemptions in-kind.
184
Notes to Financial Statements
(continued)
April
30, 2018
The tax character of distributions paid during the years
ended April 30, 2018 and 2017 were as follows:
|
|
|
|
2018
|
|
2017
|
|
Fund
|
|
|
|
Ordinary
Income
|
|
Long-Term
Capital
Gains
|
|
Tax Return
of
Capital
|
|
Ordinary
Income
|
|
Long-Term
Capital
Gains
|
|
Tax Return
of
Capital
|
IQ Hedge Multi-Strategy Tracker ETF |
|
|
|
$ |
— |
|
|
|
— |
|
|
$ |
— |
|
|
$ |
21,554 |
|
|
$ |
— |
|
|
$ |
— |
|
IQ Hedge Macro Tracker ETF |
|
|
|
|
— |
|
|
|
— |
|
|
|
— |
|
|
|
— |
|
|
|
— |
|
|
|
— |
|
IQ Hedge Market Neutral Tracker ETF |
|
|
|
|
— |
|
|
|
— |
|
|
|
— |
|
|
|
173,905 |
|
|
|
— |
|
|
|
— |
|
IQ Hedge Long/Short Tracker ETF |
|
|
|
|
16,706 |
|
|
|
— |
|
|
|
— |
|
|
|
5,839 |
|
|
|
— |
|
|
|
— |
|
IQ Hedge Event-Driven Tracker ETF |
|
|
|
|
70,341 |
|
|
|
— |
|
|
|
— |
|
|
|
114,315 |
|
|
|
— |
|
|
|
— |
|
IQ Global Resources ETF |
|
|
|
|
— |
|
|
|
— |
|
|
|
— |
|
|
|
676,550 |
|
|
|
— |
|
|
|
— |
|
IQ Merger Arbitrage ETF |
|
|
|
|
— |
|
|
|
— |
|
|
|
— |
|
|
|
291,365 |
|
|
|
— |
|
|
|
— |
|
IQ Real Return ETF |
|
|
|
|
308,837 |
|
|
|
— |
|
|
|
— |
|
|
|
— |
|
|
|
— |
|
|
|
— |
|
IQ Global Agribusiness Small Cap ETF |
|
|
|
|
109,575 |
|
|
|
— |
|
|
|
— |
|
|
|
171,392 |
|
|
|
— |
|
|
|
— |
|
IQ U.S. Real Estate Small Cap ETF |
|
|
|
|
3,563,539 |
|
|
|
— |
|
|
|
2,075,765 |
|
|
|
2,277,082 |
|
|
|
— |
|
|
|
2,848,754 |
|
IQ 50 Percent Hedged FTSE International ETF |
|
|
|
|
8,843,710 |
|
|
|
— |
|
|
|
— |
|
|
|
4,089,859 |
|
|
|
1,235,234 |
|
|
|
— |
|
IQ 50 Percent Hedged FTSE Europe ETF |
|
|
|
|
3,305,273 |
|
|
|
— |
|
|
|
— |
|
|
|
2,199,652 |
|
|
|
730,802 |
|
|
|
— |
|
IQ 50 Percent Hedged FTSE Japan ETF |
|
|
|
|
544,769 |
|
|
|
— |
|
|
|
— |
|
|
|
614,409 |
|
|
|
— |
|
|
|
— |
|
IQ Leaders GTAA Tracker ETF |
|
|
|
|
1,005,870 |
|
|
|
— |
|
|
|
— |
|
|
|
576,860 |
|
|
|
— |
|
|
|
— |
|
IQ Enhanced Core Bond U.S. ETF |
|
|
|
|
1,575,071 |
|
|
|
— |
|
|
|
— |
|
|
|
1,478,105 |
|
|
|
— |
|
|
|
— |
|
IQ Enhanced Core Plus Bond U.S. ETF |
|
|
|
|
9,263,899 |
|
|
|
— |
|
|
|
— |
|
|
|
5,319,018 |
|
|
|
— |
|
|
|
— |
|
IQ S&P High Yield Low Volatility Bond ETF |
|
|
|
|
3,536,709 |
|
|
|
— |
|
|
|
— |
|
|
|
181,476 |
|
|
|
— |
|
|
|
— |
|
IQ Chaikin U.S. Small Cap ETF |
|
|
|
|
1,436,366 |
|
|
|
— |
|
|
|
— |
|
|
|
— |
|
|
|
— |
|
|
|
— |
|
IQ Chaikin U.S. Large Cap ETF |
|
|
|
|
916,233 |
|
|
|
— |
|
|
|
— |
|
|
|
— |
|
|
|
— |
|
|
|
— |
|
185
Notes to Financial Statements
(continued)
April
30, 2018
Capital losses incurred after October 31 (“Post-October
Losses”) and certain late year ordinary income losses within the taxable year can be deemed to arise on the first business day of the Funds’
next taxable year. For the year ended April 30, 2018, the Funds incurred and elected to defer to May 1, 2018 post-October losses and late year ordinary
losses of:
Fund
|
|
|
|
Late Year
Ordinary
Losses
|
|
Short-Term
Post October
Losses
|
|
Long-Term
Post October
Losses
|
IQ Hedge Multi-Strategy Tracker ETF |
|
|
|
$ |
— |
|
|
$ |
— |
|
|
$ |
— |
|
IQ Hedge Macro Tracker ETF |
|
|
|
|
— |
|
|
|
— |
|
|
|
— |
|
IQ Hedge Market Neutral Tracker ETF |
|
|
|
|
— |
|
|
|
— |
|
|
|
— |
|
IQ Hedge Long/Short Tracker ETF |
|
|
|
|
— |
|
|
|
— |
|
|
|
— |
|
IQ Hedge Event-Driven Tracker ETF |
|
|
|
|
— |
|
|
|
— |
|
|
|
— |
|
IQ Global Resources ETF |
|
|
|
|
53,070 |
|
|
|
— |
|
|
|
— |
|
IQ Merger Arbitrage ETF |
|
|
|
|
45,213 |
|
|
|
— |
|
|
|
— |
|
IQ Real Return ETF |
|
|
|
|
— |
|
|
|
— |
|
|
|
— |
|
IQ Global Agribusiness Small Cap ETF |
|
|
|
|
— |
|
|
|
— |
|
|
|
— |
|
IQ U.S. Real Estate Small Cap ETF |
|
|
|
|
— |
|
|
|
— |
|
|
|
— |
|
IQ 50 Percent Hedged FTSE International ETF |
|
|
|
|
— |
|
|
|
— |
|
|
|
— |
|
IQ 50 Percent Hedged FTSE Europe ETF |
|
|
|
|
— |
|
|
|
— |
|
|
|
— |
|
IQ 50 Percent Hedged FTSE Japan ETF |
|
|
|
|
— |
|
|
|
— |
|
|
|
— |
|
IQ Leaders GTAA Tracker ETF |
|
|
|
|
— |
|
|
|
— |
|
|
|
— |
|
IQ Enhanced Core Bond U.S. ETF |
|
|
|
|
— |
|
|
|
— |
|
|
|
— |
|
IQ Enhanced Core Plus Bond U.S. ETF |
|
|
|
|
— |
|
|
|
— |
|
|
|
— |
|
IQ S&P High Yield Low Volatility Bond ETF |
|
|
|
|
— |
|
|
|
— |
|
|
|
— |
|
IQ Chaikin U.S. Small Cap ETF |
|
|
|
|
— |
|
|
|
— |
|
|
|
— |
|
IQ Chaikin U.S. Large Cap ETF |
|
|
|
|
— |
|
|
|
— |
|
|
|
— |
|
On December 22, 2010, the Regulated Investment Company
(“RIC”) Modernization Act of 2010 (the “Act”) was enacted. The Act modernizes several of the federal income and excise tax
provisions related to RICs, and, with certain exceptions, are effective for taxable years beginning after December 22, 2010. Among the changes made are
changes to the capital loss carryforward rules allowing for RICs to carry forward capital losses indefinitely and to retain the character of capital
loss carryforwards as short-term or long-term. Rules in effect previously limited the carryforward period to eight years and all carryforwards were
considered short-term in character. Capital loss carryforwards generated in taxable years beginning after the effective date of the Act must be fully
used before capital loss carryforwards generated in taxable years prior to the effective date of the Act; therefore, under certain circumstances,
capital loss carryforwards available as of the report date, if any, may expire unused.
186
Notes to Financial Statements
(continued)
April
30, 2018
At April 30, 2018, the Funds listed below had net capital
loss carryforwards for Federal income tax purposes which are available for offset against future taxable net capital gains. The amounts were determined
after adjustments for certain differences between financial reporting and tax purposes, such as wash sale losses. Accordingly, no capital gain
distributions are expected to be paid to shareholders of these Funds until future net capital gains have been realized in excess of the available
capital loss carryforwards. There is no assurance that any Fund will be able to utilize all of its capital loss carryforwards before they expire. These
loss carryforwards expire in amounts and fiscal years as follows:
Fund
|
|
|
|
Short-Term
Expiring
April
30, 2019
|
|
Expired
Current
Year
|
|
Utilized on
Current
Year
|
|
Short-Term
With
No
Expiration
|
|
Long-Term
With
No
Expiration
|
IQ Hedge Multi-Strategy Tracker ETF |
|
|
|
$ |
5,603,304 |
|
|
$ |
841,667 |
|
|
$ |
8,515,017 |
|
|
$ |
55,669,042 |
|
|
$ |
— |
|
IQ Hedge Macro Tracker ETF |
|
|
|
|
531,209 |
|
|
|
80,017 |
|
|
|
— |
|
|
|
4,282,128 |
|
|
|
1,219,794 |
|
IQ Hedge Market Neutral Tracker ETF |
|
|
|
|
— |
|
|
|
— |
|
|
|
53,283 |
|
|
|
434,184 |
|
|
|
17,335 |
|
IQ Hedge Long/Short Tracker ETF |
|
|
|
|
— |
|
|
|
— |
|
|
|
— |
|
|
|
124,930 |
|
|
|
75,500 |
|
IQ Hedge Event-Driven Tracker ETF |
|
|
|
|
— |
|
|
|
— |
|
|
|
25,293 |
|
|
|
34,427 |
|
|
|
14,591 |
|
IQ Global Resources ETF |
|
|
|
|
— |
|
|
|
— |
|
|
|
5,732,096 |
|
|
|
20,217,464 |
|
|
|
19,196,059 |
|
IQ Merger Arbitrage ETF |
|
|
|
|
— |
|
|
|
— |
|
|
|
— |
|
|
|
6,270,303 |
|
|
|
— |
|
IQ Real Return ETF |
|
|
|
|
— |
|
|
|
— |
|
|
|
602,374 |
|
|
|
720,246 |
|
|
|
758,569 |
|
IQ Global Agribusiness Small Cap ETF |
|
|
|
|
— |
|
|
|
— |
|
|
|
— |
|
|
|
2,842,226 |
|
|
|
5,811,932 |
|
IQ U.S. Real Estate Small Cap ETF |
|
|
|
|
— |
|
|
|
— |
|
|
|
627,930 |
|
|
|
1,324,564 |
|
|
|
2,182,224 |
|
IQ 50 Percent Hedged FTSE International ETF |
|
|
|
|
— |
|
|
|
— |
|
|
|
— |
|
|
|
3,094,612 |
|
|
|
4,624,550 |
|
IQ 50 Percent Hedged FTSE Europe ETF |
|
|
|
|
— |
|
|
|
— |
|
|
|
— |
|
|
|
1,708,335 |
|
|
|
3,046,749 |
|
IQ 50 Percent Hedged FTSE Japan ETF |
|
|
|
|
— |
|
|
|
— |
|
|
|
— |
|
|
|
837,573 |
|
|
|
876,551 |
|
IQ Leaders GTAA Tracker ETF |
|
|
|
|
— |
|
|
|
— |
|
|
|
— |
|
|
|
938,698 |
|
|
|
104,536 |
|
IQ Enhanced Core Bond U.S. ETF |
|
|
|
|
— |
|
|
|
— |
|
|
|
— |
|
|
|
2,830,081 |
|
|
|
386,732 |
|
IQ Enhanced Core Plus Bond U.S. ETF |
|
|
|
|
— |
|
|
|
— |
|
|
|
— |
|
|
|
7,652,615 |
|
|
|
766,445 |
|
IQ S&P High Yield Low Volatility Bond ETF |
|
|
|
|
— |
|
|
|
— |
|
|
|
— |
|
|
|
1,209,568 |
|
|
|
49,107 |
|
IQ Chaikin U.S. Small Cap ETF |
|
|
|
|
— |
|
|
|
— |
|
|
|
— |
|
|
|
7,595,382 |
|
|
|
— |
|
IQ Chaikin U.S. Large Cap ETF |
|
|
|
|
— |
|
|
|
— |
|
|
|
— |
|
|
|
5,340,843 |
|
|
|
— |
|
6. OTHER AFFILIATED PARTIES AND
TRANSACTIONS
If a Fund owns more than 5% of the outstanding voting shares
of another issuer, the issuer may be considered an affiliate. At April 30, 2018, affiliated transactions if any are listed at the end of each
Fund’s respective Schedule of Investments.
The Advisor is an affiliate and subsidiary of New York Life
Investment Management LLC (“NYLIM”) and of New York Life Insurance & Annuity Corporation (“NYLife”). As of April 30, 2018,
NYLIM and NYLife were not known to own beneficially greater than 5% of the shares of any Fund except as set forth below. NYLIM and NYLife
own shares of the Funds on their own behalf or on behalf of funds or accounts managed by NYLIM or NYLife.
New York Life Insurance & Annuity
Corporation
Fund
|
|
|
|
% Ownership
|
IQ Hedge Long/Short Tracker ETF |
|
|
|
|
20.0 |
% |
IQ Hedge Event-Driven Tracker ETF |
|
|
|
|
53.3 |
% |
IQ 50 Percent Hedged FTSE Europe ETF |
|
|
|
|
16.5 |
% |
IQ 50 Percent Hedged FTSE Japan ETF |
|
|
|
|
85.6 |
% |
IQ Leaders GTAA Tracker ETF |
|
|
|
|
69.4 |
% |
IQ S&P High Yield Low Volatility Bond ETF |
|
|
|
|
45.3 |
% |
IQ Chaikin U.S. Small Cap ETF |
|
|
|
|
9.4 |
% |
187
Notes to Financial Statements
(continued)
April
30, 2018
New York Life Investment Management
LLC
Fund
|
|
|
|
% Ownership
|
IQ Global Resources ETF |
|
|
|
|
54.2 |
% |
IQ 50 Percent Hedged FTSE International ETF |
|
|
|
|
84.3 |
% |
IQ 50 Percent Hedged FTSE Europe ETF |
|
|
|
|
77.2 |
% |
IQ Enhanced Core Bond U.S. ETF |
|
|
|
|
53.7 |
% |
IQ Enhanced Core Plus Bond U.S. ETF |
|
|
|
|
40.5 |
% |
IQ S&P High Yield Low Volatility Bond ETF |
|
|
|
|
40.3 |
% |
IQ Chaikin U.S. Small Cap ETF |
|
|
|
|
54.3 |
% |
IQ Chaikin U.S. Large Cap ETF |
|
|
|
|
93.7 |
% |
7. INVESTMENT TRANSACTIONS
Purchases and sales of investments (excluding short-term
investments) for the year ended April 30, 2018 are as follows:
Fund
|
|
|
|
Purchases
|
|
Sales
|
|
Purchases
In-Kind
|
|
Sales
In-Kind
|
IQ Hedge Multi-Strategy Tracker ETF |
|
|
|
|
1,805,022,304 |
|
|
|
1,798,111,535 |
|
|
|
125,288,526 |
|
|
|
109,093,429 |
|
IQ Hedge Macro Tracker ETF |
|
|
|
|
9,947,692 |
|
|
|
9,951,072 |
|
|
|
— |
|
|
|
— |
|
IQ Hedge Market Neutral Tracker ETF |
|
|
|
|
19,513,909 |
|
|
|
19,437,543 |
|
|
|
1,272,445 |
|
|
|
— |
|
IQ Hedge Long/Short Tracker ETF |
|
|
|
|
4,361,540 |
|
|
|
4,420,921 |
|
|
|
5,621,340 |
|
|
|
930,277 |
|
IQ Hedge Event-Driven Tracker ETF |
|
|
|
|
1,281,051 |
|
|
|
1,273,924 |
|
|
|
— |
|
|
|
— |
|
IQ Global Resources ETF |
|
|
|
|
436,960,951 |
|
|
|
438,288,381 |
|
|
|
53,982,021 |
|
|
|
12,155,389 |
|
IQ Merger Arbitrage ETF |
|
|
|
|
968,913,517 |
|
|
|
1,018,487,654 |
|
|
|
525,278,851 |
|
|
|
210,431,882 |
|
IQ Real Return ETF |
|
|
|
|
30,676,805 |
|
|
|
30,671,960 |
|
|
|
16,545,793 |
|
|
|
— |
|
IQ Global Agribusiness Small Cap ETF |
|
|
|
|
1,370,722 |
|
|
|
1,401,722 |
|
|
|
— |
|
|
|
1,700,433 |
|
IQ U.S. Real Estate Small Cap ETF |
|
|
|
|
28,798,309 |
|
|
|
28,369,941 |
|
|
|
6,772,633 |
|
|
|
26,358,003 |
|
IQ 50 Percent Hedged FTSE International ETF |
|
|
|
|
58,590,205 |
|
|
|
39,696,522 |
|
|
|
433,543,965 |
|
|
|
117,794,263 |
|
IQ 50 Percent Hedged FTSE Europe ETF |
|
|
|
|
14,969,249 |
|
|
|
18,022,270 |
|
|
|
77,113,910 |
|
|
|
— |
|
IQ 50 Percent Hedged FTSE Japan ETF |
|
|
|
|
1,901,429 |
|
|
|
2,448,504 |
|
|
|
3,190,029 |
|
|
|
1,100,621 |
|
IQ Leaders GTAA Tracker ETF |
|
|
|
|
58,607,538 |
|
|
|
58,337,020 |
|
|
|
45,563,405 |
|
|
|
32,372,453 |
|
IQ Enhanced Core Bond U.S. ETF |
|
|
|
|
177,964,051 |
|
|
|
178,053,356 |
|
|
|
7,639,885 |
|
|
|
27,803,436 |
|
IQ Enhanced Core Plus Bond U.S. ETF |
|
|
|
|
806,277,726 |
|
|
|
806,717,196 |
|
|
|
221,409,943 |
|
|
|
102,468,243 |
|
IQ S&P High Yield Low Volatility Bond ETF |
|
|
|
|
104,850,985 |
|
|
|
69,185,861 |
|
|
|
28,140,754 |
|
|
|
2,594,145 |
|
IQ Chaikin U.S. Small Cap ETF |
|
|
|
|
274,950,148 |
|
|
|
274,132,709 |
|
|
|
513,716,625 |
|
|
|
57,877,122 |
|
IQ Chaikin U.S. Large Cap ETF |
|
|
|
|
162,511,071 |
|
|
|
162,218,954 |
|
|
|
324,559,736 |
|
|
|
2,573,596 |
|
8. DERIVATIVE FINANCIAL
INSTRUMENTS
Swap Transactions
A swap agreement is an agreement between two parties
pursuant to which the parties exchange payments at specified dates on the basis of a specified notional amount, with the payments calculated by
reference to specified securities, indexes, reference rates, currencies or other instruments. Most swap agreements provide that when the period payment
dates for both parties are the same, the payments are made on a net basis (i.e., the two payment streams are netted out, with only the net amount paid
by one party to the other). The Funds’ obligations or rights under a swap agreement entered into on a net basis will generally be equal only to
the net amount to be paid or received under the agreement, based on the relative values of the positions held by each counterparty. Swap agreements are
not entered into or traded on exchanges and there is no central clearing or guaranty function for Total Return
Swaps. Swaps could result in losses if interest rate or foreign currency exchange rates or credit quality changes are not correctly
anticipated by the Funds or if the reference index, security or investments do not perform as expected.
The value of a Total Return
Swap agreement is recorded as either an asset or a liability on the Statements of Assets and Liabilities at the beginning of the
measurement period. Segregated securities are designated on the Schedules of Investments and cash deposited is recorded on the Statements of Assets and
Liabilities. Daily changes in valuation of Total Return Swaps, if any, are recorded as unrealized
appreciation or depreciation on
188
Notes to Financial Statements
(continued)
April
30, 2018
the Statements of Assets and Liabilities. The change in
the value of swaps, including accruals of periodic amounts of interest to be paid or received on swaps, is reported as a change in net
unrealized appreciation/depreciation on the Statements of Operations. A realized gain or loss is recorded upon payment or receipt of a
periodic payment or payment made upon termination of a swap agreement.
When the Funds have an unrealized loss on a swap agreement,
the Funds have instructed the Custodian to pledge cash or liquid securities as collateral with a value at least equal to the amount of
the unrealized loss. Collateral pledges are monitored and subsequently adjusted with the fluctuations of the swap value.
Some of the Funds intend to use
Total Return Swaps in several ways to replicate the performance of the Index. Risks may arise as a result of
the failure of the counterparty to the swap contract to comply with the terms of the swap contract. Therefore, the Funds consider the
creditworthiness of the counterparty to a swap contract in evaluating potential credit risk. Additionally, risks may arise from unanticipated movements
in interest rates or in the value of the underlying instruments.
Pursuant to documentation governing the Funds’ swap
transactions with Merrill Lynch and Morgan Stanley, Merrill Lynch and Morgan Stanley have the right to terminate the swaps
early in the event that the net assets of the given Fund decline below specific levels set forth in the documentation (“net asset contingent
features”). In the event of early termination, Merrill Lynch and Morgan Stanley may require the Funds to pay or receive a settlement amount
in connection with the terminated swap transaction. The Funds utilized swaps to affect both long and short exposure to several asset classes and market
segments, including, among others, real estate, domestic equity, international equity, emerging markets equities, investment grade corporate bonds,
high yield corporate bonds, convertible bonds, preferred securities, emerging market-debt, developed markets currencies, broad commodity indices,
precious metals, equity market volatility, and U.S. Treasury bonds. As of April 30, 2018, the Funds have not triggered the conditions under such
documentation that will give the counterparty the right to call for an early termination. As of such date, the settlement values of these contracts
were approximately equal to the fair value of such contracts.
Futures Contracts
Certain Funds may invest in futures contracts
(“futures”) in order to replicate exposures to their respective underlying index components. Investments in futures may increase or leverage
exposure to a particular market risk, thereby increasing price volatility of derivative instruments a Fund holds. No price is paid or received by
the Funds upon the purchase of a futures.
Upon entering into a futures, the Funds are required
to deposit with the broker, cash or securities in an amount equal to a certain percentage of the contract amount, which is referred to as the initial
margin deposit. Subsequent payments, referred to as variation margin, are made or received by the Funds periodically and are based on changes in the
market value of open futures. Changes in the market value of open futures are recorded as change in net unrealized
appreciation/depreciation on the Statements of Operations. Realized gains or losses, representing the difference between the value of the
contract at the time it was opened and the value at the time it was closed, are reported on the Statements of Operations at the closing
or expiration of the futures. Securities deposited as initial margin are designated in the Schedules of Investments and cash deposited is
recorded on the Statements of Assets and Liabilities. A receivable from and/or a payable to brokers for the daily variation margin is also recorded on
the Statements of Assets and Liabilities.
At April 30, 2018, there are no open futures
contracts.
Forward Foreign Currency
Contracts
Certain Funds may enter into forward foreign currency
transactions to seek a closer correlation between the Funds’ overall currency exposures and the currency exposures of the Underlying Index as a
part of its principal investment strategy.
The Funds may enter into forward
foreign currency contracts for hedging purposes, to seek to protect against anticipated changes in future foreign currency exchange rates. A
forward foreign currency contract involves an obligation to purchase or sell a specific currency at a future date, which
may be any fixed number of days from
189
Notes to Financial Statements
(continued)
April
30, 2018
the date of the contract agreed upon by the parties, at a price set at the time of
the contract. These contracts are traded in the interbank market between currency traders (usually large commercial banks) and their customers. A
forward foreign currency contract generally has no deposit requirement, and no commissions are generally charged at any stage for
trades.
Upon entering into a forward foreign
currency contract a fund is required to segregate permissible liquid assets, or engage in other measures approved by the SEC to
“cover” the Fund’s obligations relating to its transactions in derivatives. Fluctuations in the value of open forward foreign
currency contracts are recorded for book purposes as unrealized gains or losses on forward foreign currency contracts by the Funds. Realized
gains and losses on forward foreign currency contracts include net gains or losses recognized by the Funds on contracts which have matured or
were sold.
At April 30, 2018, open forward
foreign currency contracts, if any, are listed at the end of each Fund’s respective Schedule of Investments. The unrealized
appreciation/depreciation, as applicable, is included on the Statements of Assets and Liabilities.
Total Return Swaps reflect a reset date as of April 30,
2018, therefore, there is no unrealized appreciation/depreciation reflected on the Statements of Assets and Liabilities.
At April 30, 2018, the fair value of derivative instruments
reflected on the Statements of Assets and Liabilities were as follows:
Asset Derivatives
|
|
|
|
Currency Risk
|
IQ 50 Percent Hedged FTSE International ETF
|
|
|
|
|
|
|
Unrealized appreciation on forward foreign currency contracts |
|
|
|
$ |
6,337,696 |
|
IQ 50 Percent Hedged FTSE Europe ETF
|
|
|
|
|
|
|
Unrealized appreciation on forward foreign currency contracts |
|
|
|
|
1,867,569 |
|
IQ 50 Percent Hedged FTSE Japan ETF
|
|
|
|
|
|
|
Unrealized appreciation on forward foreign currency contracts |
|
|
|
|
523,038 |
|
Liability Derivatives
|
|
|
|
Currency Risk
|
IQ 50 Percent Hedged FTSE International ETF
|
|
|
|
|
|
|
Unrealized depreciation on forward foreign currency contracts |
|
|
|
$ |
(233,191 |
) |
IQ 50 Percent Hedged FTSE Europe ETF
|
|
|
|
|
|
|
Unrealized depreciation on forward foreign currency contracts |
|
|
|
|
(67,332 |
) |
IQ 50 Percent Hedged FTSE Japan ETF
|
|
|
|
|
|
|
Unrealized depreciation on forward foreign currency contracts |
|
|
|
|
(21,937 |
) |
190
Notes to Financial Statements
(continued)
April
30, 2018
Transactions in derivative instruments reflected on the
Statements of Operations during the year ended April 30, 2018 as follows:
Fund
|
|
|
|
Currency Risk
|
|
Equity Risk
|
IQ Hedge Multi-Strategy Tracker ETF
|
|
|
|
|
|
|
|
|
|
|
Realized gain (loss)
|
|
|
|
|
|
|
|
|
|
|
Swap transactions |
|
|
|
|
|
|
|
$ |
(11,177,056 |
) |
IQ Hedge Macro Tracker ETF
|
|
|
|
|
|
|
|
|
|
|
Realized gain (loss)
|
|
|
|
|
|
|
|
|
|
|
Swap transactions |
|
|
|
|
|
|
|
$ |
(80,149 |
) |
IQ Hedge Market Neutral Tracker ETF
|
|
|
|
|
|
|
|
|
|
|
Realized gain (loss)
|
|
|
|
|
|
|
|
|
|
|
Swap transactions |
|
|
|
|
|
|
|
$ |
(112,528 |
) |
IQ Hedge Long/Short Tracker ETF
|
|
|
|
|
|
|
|
|
|
|
Realized gain (loss)
|
|
|
|
|
|
|
|
|
|
|
Swap transactions |
|
|
|
|
|
|
|
$ |
746 |
|
IQ Hedge Event-Driven Tracker ETF
|
|
|
|
|
|
|
|
|
|
|
Realized gain (loss)
|
|
|
|
|
|
|
|
|
|
|
Swap transactions |
|
|
|
|
|
|
|
$ |
884 |
|
IQ Global Resources ETF
|
|
|
|
|
|
|
|
|
|
|
Realized gain (loss)
|
|
|
|
|
|
|
|
|
|
|
Swap transactions |
|
|
|
|
|
|
|
$ |
(4,277,493 |
) |
IQ Merger Arbitrage ETF
|
|
|
|
|
|
|
|
|
|
|
Realized gain (loss)
|
|
|
|
|
|
|
|
|
|
|
Swap transactions |
|
|
|
|
|
|
|
$ |
(6,400,405 |
) |
IQ 50 Percent Hedged FTSE International ETF
|
|
|
|
|
|
|
|
|
|
|
Realized gain (loss)
|
|
|
|
|
|
|
|
|
|
|
Forward foreign currency contracts |
|
|
|
$ |
(13,372,224 |
) |
|
|
|
|
Change in unrealized appreciation (depreciation)
|
|
|
|
|
|
|
|
|
|
|
Forward foreign currency contracts |
|
|
|
$ |
7,096,109 |
|
|
|
|
|
IQ 50 Percent Hedged FTSE Europe ETF
|
|
|
|
|
|
|
|
|
|
|
Realized gain (loss)
|
|
|
|
|
|
|
|
|
|
|
Forward foreign currency contracts |
|
|
|
$ |
(6,308,067 |
) |
|
|
|
|
Change in unrealized appreciation (depreciation)
|
|
|
|
|
|
|
|
|
|
|
Forward foreign currency contracts |
|
|
|
$ |
2,618,890 |
|
|
|
|
|
IQ 50 Percent Hedged FTSE Japan ETF
|
|
|
|
|
|
|
|
|
|
|
Realized gain (loss)
|
|
|
|
|
|
|
|
|
|
|
Forward foreign currency contracts |
|
|
|
$ |
(622,845 |
) |
|
|
|
|
Change in unrealized appreciation (depreciation)
|
|
|
|
|
|
|
|
|
|
|
Forward foreign currency contracts |
|
|
|
$ |
484,921 |
|
|
|
|
|
IQ Leaders GTAA Tracker ETF
|
|
|
|
|
|
|
|
|
|
|
Realized gain (loss)
|
|
|
|
|
|
|
|
|
|
|
Swap transactions |
|
|
|
|
|
|
|
$ |
112,014 |
|
|
191
Notes to Financial Statements
(continued)
April
30, 2018
For the year ended April 30, 2018,
the monthly average notional value of the derivatives held by the Funds were as follows:
| |
|
Average
Notional Value
|
| |
|
IQ
Hedge
Multi-Strategy
Tracker ETF
|
|
IQ
Hedge
Macro
Tracker ETF
|
|
IQ
Hedge
Market Neutral
Tracker ETF
|
|
IQ
Hedge
Long/Short
Tracker ETF
|
|
IQ
Hedge
Event-Driven
Tracker ETF
|
|
IQ
Global
Resources
ETF
|
|
IQ
Merger
Arbitrage
ETF
|
|
IQ
50 Percent
Hedged FTSE
International ETF
|
|
IQ
50 Percent
Hedged FTSE
Europe ETF
|
|
IQ
50 Percent
Hedged FTSE
Japan ETF
|
|
IQ
Leaders
GTAA
Tracker ETF
|
| Asset
Derivatives |
|
|
|
|
|
|
|
|
|
|
|
|
|
|
|
|
|
|
|
|
|
|
|
|
|
|
|
|
|
|
|
|
|
|
|
|
|
|
|
|
|
|
|
|
| Swap contracts |
|
$ |
177,122,105 |
|
|
$ |
859,274 |
|
|
$ |
1,585,694 |
|
|
$ |
670,789 |
|
|
$ |
103,149 |
|
|
$ |
— |
|
|
$ |
— |
|
|
$ |
— |
|
|
$ |
— |
|
|
$ |
— |
|
|
$ |
6,316,789 |
|
| Forward foreign currency contracts |
|
|
— |
|
|
|
— |
|
|
|
— |
|
|
|
— |
|
|
|
— |
|
|
|
— |
|
|
|
— |
|
|
|
602,597,904 |
|
|
|
226,462,694 |
|
|
|
48,767,260 |
|
|
|
— |
|
| Liability Derivatives |
|
|
|
|
|
|
|
|
|
|
|
|
|
|
|
|
|
|
|
|
|
|
|
|
|
|
|
|
|
|
|
|
|
|
|
|
|
|
|
|
|
|
|
|
| Swap contracts |
|
$ |
(176,982,653 |
) |
|
$ |
(862,582 |
) |
|
$ |
(1,591,937 |
) |
|
$ |
(670,342 |
) |
|
$ |
(103,011 |
) |
|
$ |
(41,305,656 |
) |
|
$ |
(89,655,005 |
) |
|
$ |
— |
|
|
$ |
— |
|
|
$ |
— |
|
|
$ |
(6,284,539 |
) |
| Forward foreign currency contracts |
|
|
— |
|
|
|
— |
|
|
|
— |
|
|
|
— |
|
|
|
— |
|
|
|
— |
|
|
|
— |
|
|
|
(603,228,604 |
) |
|
|
(226,848,468 |
) |
|
|
(48,780,424 |
) |
|
|
— |
|
9. RISKS INVOLVED WITH INVESTING IN THE
FUNDS
The Funds are subject to the principal
risks described below, some or all of these risks may adversely affect a Fund’s NAV, trading price, yield, total return and
ability to meet its investment objective. As with any investment, an investment in a Fund could result in a loss or the
performance of a Fund could be inferior to that of other investments.
Currency Risk
Certain Funds will invest in securities
denominated in currencies other than U.S. dollars (foreign currencies) and much of the income received by the Fund will be in
foreign currencies, but the Underlying Index and the Fund’s NAV will be calculated in U.S. dollars. Furthermore a
fund may convert cash in U.S. dollars to foreign currencies to purchase securities. Both the Fund’s ability to
track the Underlying Index and Fund returns in general may be adversely impacted by changes in currency exchange rates, which can occur quickly and
without warning.
Currency Hedging Risk1
Certain Funds use various strategies to attempt to reduce
the impact of changes in the value of a foreign currency against the U.S. dollar. These strategies may not be successful. Currency exchange rates can
be very volatile and can change quickly and unpredictably. Therefore, the value of an investment in a fund may also go up or down quickly
and unpredictably and investors may lose money.
Fund of Funds Risk2
Certain Funds’ investment performance, because they are
funds of funds, depend on the investment performance of the underlying ETFs in which they invest. An investment in any such Fund is subject to the
risks associated with the underlying ETFs that comprise its Underlying Index. Such a fund will indirectly pay a proportional share of the
asset-based fees, if any, of the underlying ETFs in which it invests.
Exchange Traded Vehicle
Risk2
Unlike an investment in a mutual fund, the value of the
Funds’ investments in ETFs, ETVs and ETNs is based on stock market prices and the Funds could lose money due to stock
market developments, the failure of an active trading market to develop, or exchange trading halts or de-listings. Federal law prohibits the Funds from
acquiring investment company shares, including shares of ETFs, in excess of specific thresholds unless exempted by rule, regulation or exemptive order.
These prohibitions may prevent the Funds from allocating their investments to ETFs in an optimal manner.
192
Notes to Financial Statements
(continued)
April
30, 2018
Index Risk
The Funds’ Underlying Indexes and the Funds rebalance
only on a monthly, quarterly or annual basis, which may cause the performance of the Underlying Indexes and the Funds to deviate from that of the
market exposure that they are trying to achieve.
Industry Concentration Risk
A fund will not invest 25% or more of the
value of the Fund’s total assets in the securities of one or more issuers conducting their principal business activities in the same industry or
group of industries; except that, to the extent that the Underlying Index is concentrated in a particular industry, the Fund also will be concentrated
in that industry. The risk of concentrating fund investments in a limited number of issuers conducting business in the same industry or
group of industries will subject the Fund to a greater risk of loss as a result of adverse economic, business or other developments than if its
investments were diversified across different industry sectors.
Tracking Error Risk
Each Fund’s performance may not match its Underlying
Index during any period of time. Although each Fund attempts to track the performance of its Underlying Index, a Fund may not be able to duplicate its
exact composition or return for any number of reasons, including but not limited to risk that the strategies used by the Advisor to match the
performance of the Underlying Indexes may fail to produce the intended results, liquidity risk and new fund risk, as well as the incurring of Fund
expenses, which the Underlying Index does not incur.
Counterparty Risk
Many of the protections afforded to participants on some
organized exchanges, such as the performance guarantee of an exchange clearing house, are not available in connection with OTC
derivatives transactions. In those instances, an Underlying ETP will be subject to the risk that its direct counterparty will not perform its
obligations under the transactions and that the Underlying ETP will sustain losses.
Foreign Securities Risk
Certain Funds invest directly or indirectly (through
underlying ETFs) in the securities of non-U.S. issuers, which involves risks beyond those associated with investments in U.S. securities. These
additional risks include greater market volatility, the availability of less reliable financial information, higher transactional and custody costs,
taxation by foreign governments, decreased market liquidity and political instability.
Total Return Swap Risk3
Total Return Swaps give the
Funds the right to receive the appreciation in the value of a specified security, index or other instrument in return for a fee paid to the
counterparty, which will typically be an agreed upon interest rate. Total Return Swaps can also be used to replicate an
exposure to a short position in an asset class where the Funds have the right to receive the depreciation in value of a specified security, index or
other instrument (“inverse swaps”). If the underlying asset in a Total Return Swap declines in
value (or increases in value, if an inverse swap) over the term of the swap, the Funds may also be required to pay the dollar value of that decline (or
increase, if an inverse swap) to the counterparty. Therefore, swaps are subject to credit risk or the risk of default or non-performance by the
counterparty.
Small Capitalization Companies
Risk4
Certain Funds invest primarily in the stocks of small
capitalization companies, which may be more volatile than those of larger companies. Stock prices of small capitalization companies are also more
vulnerable than those of large capitalization companies to adverse business and economic developments, and the stocks of small capitalization companies
may be thinly traded, making it difficult to buy and sell them.
High Yield Securities
Risk5
High yield securities generally offer a higher current yield
than the yield available from higher grade issues, but typically involve greater risk. Securities rated below investment grade are commonly referred to
as “junk bonds.”
193
Notes to Financial Statements
(continued)
April
30, 2018
Market Risk
The market price of investments owned by the
fund may go up or down, sometimes rapidly or unpredictably.
Investments may decline in value due to factors affecting
fixed income securities markets generally or particular segments of the market.
Long/Short Risk
There is no guarantee that the returns on the
fund’s long or short, if any, positions will produce positive returns, and the fund could lose money if either or both
positions produce negative returns. In addition, the fund may gain enhanced long exposure to certain securities (i.e., obtain investment
exposure that exceeds the amount directly invested in those assets, a form of leverage) and, as a result, suffer losses that exceed the amount invested
in those assets.
Equity Securities Risk
The prices of equity securities are particularly subject
to the risk of changing change in response to many factors including the historical and prospective earnings of the issuer, the value of its assets,
general economic, stock market, industry and company conditions and the risk inherent in the portfolio manager’s ability to anticipate such
changes that can adversely affect the value of the fund’s holdings. Opportunity for greater gain often comes with greater risk of
loss. conditions, interest rates, investor perceptions and market liquidity.
Passive Management Risk
Unlike many investment companies, the funds
seek to track its Underlying Index and are not “actively” managed. Therefore, a fund would not necessarily sell a security
because the security’s issuer was in financial trouble unless that security is removed from (or was no longer useful in tracking a component of)
the Underlying Index.
Income Risk5
The Fund’s income may decline when interest rates fall.
This decline can occur because the fund may subsequently invest in lower-yielding bonds when bonds in its portfolio mature, bonds in the
Underlying Index are substituted or the fund otherwise needs to purchase additional bonds.
Call Risk5
During periods of falling interest rates, an issuer of a
callable bond held by the fund may “call” or repay the security before its stated maturity, and the fund may have
to reinvest the proceeds at lower interest rates, resulting in a decline in the fund’s income.
Credit Risk5
Debt issuers and other counterparties may not honor their
obligations or may have their debt downgraded by ratings agencies. The financial condition of an issuer of a debt security or other instrument may
cause such issuer to default, become unable to pay interest or principal due or otherwise fail to honor its obligations or cause such issuer to be
perceived (whether by market participants, rating agencies, pricing services or otherwise) as being in such situations.
Interest Rate Risk5
An increase in interest rates may cause the value of debt
securities held by a Fund to decline. Interest rates in the United States are near historic lows, which may increase a
Fund’s exposure to risks associated with rising interest rates. Interest rates may rise significantly and/or rapidly. Rising
interest rates or lack of market participants may lead to decreased liquidity and increased volatility in the bond markets, making it more difficult
for a fund to sell its bond holdings at a time when the fund might wish to sell.
194
Notes to Financial Statements
(continued)
April
30, 2018
New Fund Risk6
The Funds are new funds.
As new funds, there can be no assurance that they will grow to or maintain an economically viable size, in which case
they may experience greater tracking error to each Fund’s Underlying Index than they otherwise would at
higher asset levels or it could ultimately liquidate.
1 |
|
Applies to IQ 50 Percent Hedged FTSE International
ETF, IQ 50 Percent Hedged FTSE Europe ETF, and IQ 50 Percent Hedged FTSE Japan ETF. |
2 |
|
Applies to IQ Hedge Multi-Strategy Tracker ETF, IQ
Hedge Macro Tracker ETF, IQ Hedge Market Neutral Tracker ETF, IQ Hedge Long/Short Tracker ETF, IQ Hedge Event-Driven Tracker ETF, IQ Real Return ETF,
IQ Leaders GTAA Tracker, IQ Enhanced Core Bond U.S. ETF and IQ Enhanced Core Plus Bond U.S. ETF. |
3 |
|
Applies to IQ Hedge Multi-Strategy Tracker
ETF, IQ Hedge Macro Tracker ETF, IQ Hedge Market Neutral Tracker ETF, IQ Hedge Long/Short Tracker ETF, IQ Hedge Event-Driven Tracker ETF, IQ Global
Resources ETF, IQ Merger Arbitrage ETF and IQ Leaders GTAA Tracker ETF. |
4 |
|
Applies to IQ Global Agribusiness Small Cap
ETF, IQ U.S. Real Estate Small Cap ETF, and IQ Chaikin U.S. Small Cap ETF. |
5 |
|
Applies to IQ Enhanced Core Bond U.S. ETF,
IQ Enhanced Core Plus Bond U.S. ETF, and IQ S&P High Yield Low Volatility Bond ETF. |
6 |
|
Applies to IQ Chaikin U.S. Small Cap ETF and IQ
Chaikin U.S. Large Cap ETF. |
10. SUBSEQUENT EVENTS
In the preparation of the financial
statements, the Funds’ management has evaluated events and transactions for potential recognition or disclosure through the date the financial
statements were issued.
On June 4, 2018, the IQ 50 Percent Hedged FTSE Europe ETF
had a redemption of 6,400,000 shares, approximately 92% of the total shares of the Fund outstanding. The Advisor believes this redemption is primarily
attributable to the sale of Fund shares by NYLIM. As of June 7, 2018, NYLIM owned beneficially less than 5% of the shares of the Fund. Other than the
redemption, management has determined that there were no other material events that would require disclosure in the preparation of these financial
statements.
195
Report of Independent Registered
Public Accounting Firm
April
30, 2018
To the Board of Trustees of IndexIQ ETF Trust and
Shareholders of each of the nineteen funds indicated in the table below
Opinions on the Financial
Statements
We have audited the accompanying statements of assets and
liabilities, including the schedules of investments, of each of the funds indicated in the table below (nineteen of the funds constituting IndexIQ ETF
Trust, hereafter collectively referred to as the “Funds”) as of April 30, 2018, the related statements of operations and the statements of
changes in net assets for each of the periods indicated in the table below, including the related notes, and the financial highlights for each of the
periods indicated in the table below (collectively referred to as the “financial statements”). In our opinion, the financial statements
present fairly, in all material respects, the financial position of each of the Funds as of April 30, 2018, the results of each of their operations and
the changes in each of their net assets for each of the periods indicated in the table below and each of the financial highlights for each of the
periods indicated in the table below in conformity with accounting principles generally accepted in the United States of America. The financial
statements of IQ Hedge Multi-Strategy Tracker ETF, IQ Hedge Macro Tracker ETF, IQ Hedge Market Neutral Tracker ETF, IQ Global Resources ETF, IQ Merger
Arbitrage ETF, IQ Real Return ETF, IQ Global Agribusiness Small Cap ETF, and IQ U.S. Real Estate Small Cap ETF as of and for the year ended April 30,
2014 and the financial highlights for each of the periods ended April 30, 2014 (not presented herein, other than the financial highlights) were audited
by other auditors whose report dated June 27, 2014 expressed an unqualified opinion on those financial statements and financial
highlights.
Individual Fund Comprising the
IndexIQ ETF Trust
|
|
Statement
of
Operations
|
|
Statements of
Changes in Net
Assets
|
|
Financial Highlights
|
IQ Hedge Multi-Strategy Tracker ETF
IQ Hedge Macro Tracker ETF
IQ Hedge Market Neutral Tracker
ETF
IQ Global Resources ETF
IQ Merger Arbitrage ETF
IQ Real Return ETF
IQ Global Agribusiness Small Cap ETF
IQ U.S. Real Estate
Small Cap ETF |
|
For the year ended April 30, 2018 |
|
For the years ended April 30, 2018 and 2017 |
|
For the years ended April 30, 2018, 2017, 2016 and 2015 |
IQ Hedge Long/Short Tracker ETF
IQ Hedge Event-Driven Tracker ETF |
|
For the year ended April 30, 2018 |
|
For the years ended April 30, 2018 and 2017 |
|
For the years ended April 30, 2018, 2017 and 2016, and the period from March 24, 2015 (commencement of
operations) to April 30, 2015 |
IQ 50 Percent Hedged FTSE International ETF
IQ 50 Percent Hedged FTSE Europe ETF
IQ 50 Percent Hedged
FTSE Japan ETF |
|
For the year ended April 30, 2018 |
|
For the years ended April 30, 2018 and 2017 |
|
For the years ended April 30, 2018 and 2017, and the period from July 22, 2015 (commencement
of operations) to April 30, 2016 |
196
Report of Independent Registered
Public Accounting Firm (continued)
April
30, 2018
Individual Fund Comprising the
IndexIQ ETF Trust
|
|
|
|
Statement
of
Operations
|
|
Statements of
Changes in Net
Assets
|
|
Financial Highlights
|
IQ Leaders GTAA Tracker ETF |
|
|
|
For the year ended April 30, 2018 |
|
For the years ended April 30, 2018 and 2017 |
|
For the years ended April 30, 2018 and 2017, and the period from September 30, 2015 (commencement of
operations) to April 30, 2016 |
IQ Enhanced Core Bond U.S. ETF
IQ Enhanced Core Plus Bond U.S. ETF |
|
|
|
For the year ended April 30, 2018 |
|
For the year ended April 30, 2018 and the period from May 10, 2016 (commencement of operations) to April 30, 2017
|
IQ S&P High Yield Low Volatility Bond ETF |
|
|
|
For the year ended April 30, 2018 |
|
For the year ended April 30, 2018 and the period from February 15, 2017 (commencement of operations) to April 30, 2017
|
IQ Chaikin U.S. Small Cap ETF |
|
|
|
For the period from May 16, 2017 (commencement of operations) to April 30, 2018
|
IQ Chaikin U.S. Large Cap ETF |
|
|
|
For the period from December 13, 2017 (commencement of operations) to April 30, 2018
|
Basis for Opinions
These financial statements are the responsibility of the
Funds’ management. Our responsibility is to express an opinion on the Funds’ financial statements based on our audits. We are a public
accounting firm registered with the Public Company Accounting Oversight Board (United States) (“PCAOB”) and are required to be independent
with respect to the Funds in accordance with the U.S. federal securities laws and the applicable rules and regulations of the Securities and Exchange
Commission and the PCAOB.
We conducted our audits of these financial statements in
accordance with the standards of the PCAOB. Those standards require that we plan and perform the audit to obtain reasonable assurance about whether the
financial statements are free of material misstatement, whether due to error or fraud.
Our audits included performing procedures to assess the
risks of material misstatement of the financial statements, whether due to error or fraud, and performing procedures that respond to those risks. Such
procedures included examining, on a test basis, evidence regarding the amounts and disclosures in the financial statements. Our audits also included
evaluating the accounting principles used and significant estimates made by management, as well as evaluating the overall presentation of the financial
statements. Our procedures included confirmation of securities owned as of April 30, 2018 by correspondence with the custodian, transfer agent and
brokers; when replies were not received from brokers, we performed other auditing procedures. We believe that our audits provide a reasonable basis for
our opinions.
PricewaterhouseCoopersLLP
New York, New York
June
28, 2018
We have served as the auditor of one or more investment
companies in the IndexIQ Complex since 2015.
197
Supplemental Information (unaudited)
April
30, 2018
Federal Tax Status of Dividends Declared During the Tax
Year
Qualified Dividend Income — Certain dividends
paid by the fund may be subject to a maximum tax rate of 15%, as provided for by the Jobs and Growth Tax Relief Reconciliation Act of 2003. The
percentage of ordinary income distributions for the fiscal year ended April 30, 2018 taxed at a maximum rate of 15% is as follows:
IQ Hedge Multi-Strategy Tracker ETF |
|
|
|
|
0.00 |
% |
IQ Hedge Macro Tracker ETF |
|
|
|
|
0.00 |
% |
IQ Hedge Market Neutral Tracker ETF |
|
|
|
|
0.00 |
% |
IQ Hedge Long/Short Tracker ETF |
|
|
|
|
65.52 |
% |
IQ Hedge Event-Driven Tracker ETF |
|
|
|
|
21.50 |
% |
IIQ Global Resources ETF |
|
|
|
|
0.00 |
% |
IQ Merger Arbitrage ETF |
|
|
|
|
0.00 |
% |
IQ Real Return ETF |
|
|
|
|
7.61 |
% |
IQ Global Agribusiness Small Cap ETF |
|
|
|
|
100.00 |
% |
IQ U.S. Real Estate Small Cap ETF |
|
|
|
|
1.87 |
% |
IQ 50 Percent Hedged FTSE International ETF |
|
|
|
|
81.86 |
% |
IQ 50 Percent Hedged FTSE Europe ETF |
|
|
|
|
83.21 |
% |
IQ 50 Percent Hedged FTSE Japan ETF |
|
|
|
|
89.71 |
% |
IQ Leaders GTAA Tracker ETF |
|
|
|
|
20.63 |
% |
IQ Enhanced Core Bond U.S. ETF |
|
|
|
|
0.00 |
% |
IQ Enhanced Core Plus Bond U.S. ETF |
|
|
|
|
0.00 |
% |
IQ S&P High Yield Low Volatility Bond ETF |
|
|
|
|
0.00 |
% |
IQ Chaikin U.S. Small Cap ETF |
|
|
|
|
100.00 |
% |
IQ Chaikin U.S. Large Cap ETF |
|
|
|
|
67.22 |
% |
Dividends Received Deduction — For corporate
shareholders, the percentage of ordinary income distributions for the year ended April 30, 2018 that qualifies for the dividends received deduction is
as follows:
IQ Hedge Multi-Strategy Tracker ETF |
|
|
|
|
0.00 |
% |
IQ Hedge Macro Tracker ETF. |
|
|
|
|
0.00 |
% |
IQ Hedge Market Neutral Tracker ETF |
|
|
|
|
0.00 |
% |
IQ Hedge Long/Short Tracker ETF |
|
|
|
|
32.82 |
% |
IQ Hedge Event-Driven Tracker ETF |
|
|
|
|
12.96 |
% |
IQ Global Resources ETF |
|
|
|
|
0.00 |
% |
IQ Merger Arbitrage ETF |
|
|
|
|
0.00 |
% |
IQ Real Return ETF |
|
|
|
|
7.00 |
% |
IQ Global Agribusiness Small Cap ETF |
|
|
|
|
13.40 |
% |
IQ U.S. Real Estate Small Cap ETF. |
|
|
|
|
0.00 |
% |
IQ 50 Percent Hedged FTSE International ETF |
|
|
|
|
0.00 |
% |
IQ 50 Percent Hedged FTSE Europe ETF. |
|
|
|
|
0.00 |
% |
IQ 50 Percent Hedged FTSE Japan ETF |
|
|
|
|
0.00 |
% |
IQ Leaders GTAA Tracker ETF |
|
|
|
|
4.63 |
% |
IQ Enhanced Core Bond U.S. ETF. |
|
|
|
|
0.00 |
% |
IQ Enhanced Core Plus Bond U.S. ETF. |
|
|
|
|
0.00 |
% |
IQ S&P High Yield Low Volatility Bond ETF |
|
|
|
|
0.00 |
% |
IQ Chaikin U.S. Small Cap ETF |
|
|
|
|
100.00 |
% |
IQ Chaikin U.S. Large Cap ETF |
|
|
|
|
83.75 |
% |
198
Supplemental Information (unaudited)
(continued)
April
30, 2018
Foreign Taxes Paid — The following Funds elect
under the Internal Revenue Code Section 853 to pass through foreign taxes paid to its shareholders. The total amount of foreign taxes passed through to
shareholders on a per share basis for the year ended April 30, 2018, are as follows:
Fund
|
|
|
|
Foreign Taxes
Per Shares
|
|
Foreign Income
Per
Shares
|
IQ Hedge Multi-Strategy Tracker ETF |
|
|
|
|
— |
|
|
|
— |
|
IQ Hedge Macro Tracker ETF |
|
|
|
|
— |
|
|
|
— |
|
IQ Hedge Market Neutral Tracker ETF |
|
|
|
|
— |
|
|
|
— |
|
IQ Hedge Long/Short Tracker ETF |
|
|
|
|
— |
|
|
|
— |
|
IQ Hedge Event-Driven Tracker ETF |
|
|
|
|
— |
|
|
|
— |
|
IQ Global Resources ETF |
|
|
|
|
— |
|
|
|
— |
|
IQ Merger Arbitrage ETF. |
|
|
|
|
— |
|
|
|
— |
|
IQ Real Return ETF |
|
|
|
|
— |
|
|
|
— |
|
IQ Global Agribusiness Small Cap ETF |
|
|
|
|
0.0353 |
|
|
|
0.5053 |
|
IQ U.S. Real Estate Small Cap ETF |
|
|
|
|
— |
|
|
|
— |
|
IQ 50 Percent Hedged FTSE International ETF |
|
|
|
|
0.0374 |
|
|
|
0.5002 |
|
IQ 50 Percent Hedged FTSE Europe ETF . |
|
|
|
|
0.0447 |
|
|
|
0.6004 |
|
IQ 50 Percent Hedged FTSE Japan ETF |
|
|
|
|
0.0445 |
|
|
|
0.4496 |
|
IQ Leaders GTAA Tracker ETF .. . . . |
|
|
|
|
— |
|
|
|
— |
|
IQ Enhanced Core Bond U.S. ETF |
|
|
|
|
— |
|
|
|
— |
|
IQ Enhanced Core Plus Bond U.S. ETF |
|
|
|
|
— |
|
|
|
— |
|
IQ S&P High Yield Low Volatility Bond ETF |
|
|
|
|
— |
|
|
|
— |
|
IQ Chaikin Small Cap ETF |
|
|
|
|
— |
|
|
|
— |
|
IQ Chaikin Large Cap ETF |
|
|
|
|
— |
|
|
|
— |
|
In January 2019, you will be advised on IRS Form 1099 DIV as
to the Federal tax status of the distributions received by you in calendar year 2018.
199
Board Review of Investment
Advisory Agreement and Sub-Advisory Agreement (unaudited)
April
30, 2018
The Board (the members of which are referred to as
“Trustees”) met in person on March 29, 2018, to consider the approval of an amendment to the Advisory Agreement between the Trust, on
behalf of its series, and the Advisor to apply such Advisory Agreement to the IQ 500 ETF and IQ 500 International ETF (together, the
“IQ 500 Funds”). The Trustees also considered the continuation, for an additional year, of the Advisory Agreement with respect
to the existing series of the Trust for which the Advisory Agreement applies (together with the “IQ 500 Funds”, the
“Funds”). In addition, the Board considered the continuation of the Sub-Advisory Agreement between the Advisor and MacKay Shields LLC
(“MacKay”) with respect to the IQ S&P High Yield Low Volatility Bond ETF (“HYLV”).
In accordance with Section 15(c) of the Investment
Company Act of 1940, as amended (“1940 Act”), the Board requested, reviewed and considered materials furnished by the Advisor relevant
to the Board’s consideration of whether to approve the amendment to the Advisory Agreement to apply such agreement to the IQ 500 Funds,
as well as the continuation of the Advisory Agreement with respect to the existing Funds, and from MacKay and the Advisor relevant to the
Board’s consideration of whether to approve the continuation of the Sub-Advisory Agreement only as it relates to HYLV. In
connection with considering approval of the amendment to and continuation of the Advisory Agreement and Sub-Advisory Agreement, the Trustees who
are not “interested persons” of the Trust, as that term is defined in the 1940 Act (the “Independent Trustees”), met in
executive session with counsel to the Trust and counsel to the Independent Trustees, who provided assistance and advice. The consideration of
both the amendment to, and the continuation of each of the Advisory Agreement and the Sub-Advisory was conducted by both the full Board
and the Independent Trustees, who also voted separately.
During their review and consideration, the Board and the
Independent Trustees focused on and analyzed the factors they deemed relevant, including: (1) the nature, extent and quality of the services
provided by the Advisor, both for the Trust’s existing Funds and the proposed IQ 500 Funds, and by MacKay with respect to HYLV and
the fees to be charged by the Advisor and MacKay; (2) information concerning the business and operations, compliance program and portfolio
management team of each of the Advisor and MacKay; (3) the expense levels of each Fund; (4) the investment performance of the existing Funds;
(5) the costs of the services to be provided and profits to be realized by the Advisor and MacKay and their affiliates from the relationship
with the Trust, including expense limitation agreements and fee waiver agreements between the Advisor and certain Funds; (6) the extent
to which economies of scale would be realized as the Funds grow; (7) any benefits derived or to be derived by the Advisor or MacKay from its
respective relationships with the Trust; and (8) potential conflicts of interest. The Board considered that the Funds were passively managed
exchange-traded funds (“ETFs”) and that several of the Funds were designed to track indexes created by an affiliate of the
Advisor.
In reviewing such factors, the Board relied on certain
information, including (1) a copy of the amendment to the Advisory Agreement and of the Advisory Agreement, itself; (2) a copy of the
Sub-Advisory Agreement; (3) information about applicable expense limitation and fee waiver agreements; (4) information describing the
Advisor and MacKay and the services provided thereby; (5) information regarding the respective compliance program and portfolio
management teams of the Advisor and MacKay; (6) copies of the Form ADV for each of the Advisor and MacKay; (7) memoranda and guidance from legal
counsel to the Independent Trustees on the fiduciary responsibilities of trustees, including Independent Trustees, in considering advisory and
distribution agreements under the 1940 Act; and (8) materials provided by each of the Advisor and MacKay in response to a 15(c) request
for information from legal counsel to the Independent Trustees. In addition, the Board was provided data comparing the advisory fees and
operating expenses (including acquired fund fees and expenses, as applicable) of the Funds with expenses and performance of other registered
investment companies with similar investment objectives and policies. The Trustees also considered their personal experiences as Trustees and
participants in the ETF and mutual fund industry, as applicable.
In particular, the Trustees including the Independent
Trustees, considered and discussed the following with respect to the Funds:
1. |
|
The nature, extent and quality of the facilities and
services provided by the Advisor and MacKay. The Board reviewed the services that the Advisor and MacKay provide to the respective Funds,
noting that they had continually reviewed and overseen such services throughout the past year. The Board noted the responsibilities that
the Advisor and MacKay would have as the Funds’ investment adviser and sub-advisor, |
200
Board Review of Investment
Advisory Agreement and Sub-Advisory Agreement (unaudited)
(continued)
April
30, 2018
|
|
respectively, including overall supervisory
responsibility for the general management and investment of each Fund’s securities portfolio, monitoring Fund compliance with regulatory
requirements and Fund objectives and policies, daily monitoring of the portfolio, overseeing Fund service providers, obtaining licenses for use
of indexes tracked by the Funds, providing officers for the Funds, ongoing reporting to the Board, and the implementation of Board
directives as they relate to the Funds. For the IQ 500 Funds, the Board considered the services rendered in respect of the existing Funds in
assessing services expected to be provided to the IQ 500 Funds. |
|
|
The Board reviewed the Advisor’s and MacKay’s
experience, resources, and strengths in managing other mutual funds and ETFs, including the Advisor’s management of the existing Funds of
the Trust and the funds of the IndexIQ Trust and IndexIQ Active ETF Trust. The Board also considered the experience of MacKay’s team
in managing strategies and asset classes similar to the Funds, and their tenure in managing the portfolio of HYLV. The Board also noted and
discussed with the Advisor the resources and additional support and personnel from its parent New York Life Investment Management (NYLIM), which
resources enhance and support the work of the Advisor’s officers and staff. The Board also considered the tenure and experience of
the personnel at the Advisor providing management and administrative services to the Funds, and noted that the Advisor had hired additional
experienced personnel to the management and product development teams during the past year. In addition, the Board considered the ongoing
expansion of compliance and distribution/sales personnel that support the Funds and the funds of the IndexIQ Trust and the IndexIQ Active
ETF Trust. |
|
|
Based on their consideration and review of the foregoing
information, the Board concluded that each Fund, including each of the IQ 500 Funds, was likely to continue to benefit from the nature, quality,
and extent of these services, as well as the Advisor’s and MacKay’s ability to render such services based on its personnel,
experience, operations, and resources. |
2. |
|
Comparison of services provided and fees charged by the
Advisor and MacKay and other investment advisers to similar clients, and the cost of the services provided and profits realized by the Advisor
and MacKay from its relationship with the Funds. The Board then compared both the services rendered and the fees paid with respect to
the Funds and those proposed to be paid in respect of the IQ 500 Funds pursuant to the Advisory Agreement to
contracts of other registered investment advisers providing services to similar ETFs. The Board also considered that the Advisor is responsible for
payment of the sub-advisory fee to MacKay pursuant to the Sub-Advisory Agreement, and that HYLV shareholders do not directly pay the sub-advisory
fee. |
|
|
In particular, the Board compared each Fund’s advisory fee
and expense ratio (including acquired fund fees and expenses, as applicable) to other investment companies considered to be in each such
Fund’s peer group. The Advisor presented information on how peer groups were selected for the Funds, which generally are
differentiated from broad Morningstar categorization based on distinguishing characteristics of many Funds’ core strategies, several of
which are unique indexes designed by an affiliate of the Advisor. |
|
|
The Board noted that certain Funds had peer groups of limited
size and, in certain cases, with substantial differences in portfolio management and operational costs. The Board considered unique
characteristics of certain Funds relative to peer groups, particularly where such Funds had fee or total expense rates that diverged from
the median levels of the applicable peer group. The Board also discussed price pressure in the general ETF marketplace and the impact of market
pressures on the price levels for relatively unique investment strategies such as those implemented by several of the Funds. The Board noted the
recent imposition of a fee waiver agreement for the IQ Hedge Multi-Strategy Tracker ETF and reduction of the advisory fee for the IQ
Chaiken U.S. Large Cap ETF. |
|
|
Additionally, the Trustees considered that the Advisor had put
in place expense limitation or fee waiver agreements whereby the Advisor reimburses expenses and/or waives fees to limit the impact above
set thresholds of certain expenses on shareholders of certain Funds, including the IQ 500 Funds. The Board noted that such expense
limitation and fee waiver agreements were reflected, where applicable, in the peer group analysis provided by the Advisor. |
201
Board Review of Investment
Advisory Agreement and Sub-Advisory Agreement (unaudited)
(continued)
April
30, 2018
|
|
After comparing each Fund’s fees with those of other
investment companies in the Fund’s peer group, and in light of the nature, quality, and extent of services provided by the Advisor and
MacKay (and those proposed to be provided in respect of the IQ 500 Funds) and the costs incurred by the Advisor and MacKay in rendering
those services, the Board concluded that the level of fees paid (or proposed to be paid) to the Advisor and Sub-Advisor with respect to each
Fund and MacKay with respect to HYLV is fair and reasonable. |
3. |
|
The Advisor’s and MacKay’s profitability and the
extent to which economies of scale would be realized as the Funds grow and whether fee levels would reflect such economies of scale. The
Board discussed with the Advisor the costs and profitability of the Advisor in connection with its serving as investment adviser to each
Fund, including operational costs. The Board also discussed additional resources that have been made available to the Advisor following its
acquisition by NYLIM, including the investment of financial and human resources by NYLIM into the Advisor and additional support to market
and distribute the Funds. |
|
|
The Board considered information regarding the strategy of the
Advisor to grow assets in the Funds during the calendar year. The Board reviewed the net asset levels of the Funds and the impact of both
high and low asset levels on such Funds. The Board also considered the impact of future asset growth on the services required and fees paid
to MacKay, noting again that such fees were paid by the Advisor out of its management fees. The Board considered whether the
continued operation of certain Funds that had not attracted significant assets under management would be profitable to the Advisor under the unitary
fee arrangement of the Advisory Agreement and determined to continue to review the asset levels of the Funds in relation to the Advisor’s
profitability. The Board also noted the existence of Expense Limitation Agreements and Fee Waiver Agreements applicable to certain of the Funds,
and their respective impacts on costs to shareholders and profitability of the Advisor. |
|
|
The Board noted that the IQ 500 Funds had not yet commenced
operations, and therefore no direct historical profitability data was available for consideration for such Funds. |
|
|
The Board concluded that the fees paid to the Advisor and
MacKay were reasonable when considering the relative asset levels and profitability of the Funds to the Advisor and MacKay. |
4. |
|
Investment performance of the Funds. The Board
considered the investment performance of the existing Funds, including tracking error. In particular, the Board considered the investment
performance of the Funds relative to their stated objectives and the success of the Advisor and MacKay in reaching such objectives. The Board
considered each Fund’s investment performance compared to the underlying index that each Fund seeks to track and includes in its prospectus
and shareholder reports. The Board also considered each Fund’s investment performance compared to the respective Fund’s peer
group. The Board considered that the IQ 500 Funds had not yet commenced operations, and therefore had no performance or operational history to
consider. |
|
|
The Board concluded that the investment performance of the
Funds, particularly in the context of tracking error as against each Fund’s underlying index and in succeeding in satisfying their
stated investment objective, supported the approval of the Advisory Agreement and Sub-Advisory Agreement. |
The Board agreed that it had been furnished with
sufficient information, both at the meeting and in its ongoing oversight of the Funds, to make an informed business decision with
respect to the Advisory Agreement for the Funds (including the IQ 500 Funds) and, with respect to HYLV, the Sub-Advisory Agreement. Based
on the foregoing and such other matters as were deemed relevant, and while no single factor was determinative in the decision, the Independent
Trustees concluded that the terms of the Advisory Agreement with the Advisor and the Sub-Advisory Agreement between the Advisor and
MacKay were reasonable and fair to the Funds and to recommend to the Board the approval of the Advisory Agreement and Sub-Advisory Agreement. As
a result, all of the Board members, including the Independent Trustees, determined that the amendment of the Advisory Agreement to apply
such agreement to the IQ 500 Funds and the continuation of the Advisory Agreement with the Advisor and continuation of the Sub-Advisory
Agreement with MacKay was in the best interests of each applicable Fund and its shareholders. The Board and the Independent Trustees,
voting separately, approved the amendment to the Advisory Agreement and the continuation of the Advisory Agreement and Sub-Advisory Agreement
for an additional one-year period.
202
Board of Trustees and Officers
(unaudited)
April
30, 2018
Name and
Year of
Birth1
|
|
|
|
Position(s)
Held
with
Trust
|
|
Term of
Office and
Length of
Time Served2
|
|
Principal Occupation(s)
During Past 5 Years
|
|
Number of
Portfolios
in Fund
Complex
Overseen
by Trustee3
|
|
Other
Directorships
Held by
Trustee
During Past
5 Years
|
|
|
|
|
|
|
|
|
|
|
|
|
|
|
|
|
|
|
|
|
|
|
|
Reena Aggarwal,
1957 |
|
|
|
Chair
Trustee |
|
Since January 2018
Since August 2008 |
|
Vice Provost of Faculty (2016 to present), Georgetown University, Robert E. McDonough Professor (2003 to present) and Professor of
Finance, McDonough School of Business, Georgetown University (2000 to present); Director, Georgetown Center for Financial Markets and Policy (2010 to
present); Co-Chair of Board, Social Innovations and Public Service Fund, Georgetown University(2012 to 2014). |
|
22 |
|
Chair of Board, IndexIQ Trust, IndexIQ Active ETF Trust (2018 to present); Trustee, IndexIQ Trust, IndexIQ Active ETF Trust (2008 to
present); FBR &Co. (investment banking) (2011 to 2017); Cohen & Steers (asset management) (2017 to present); Director, Brightwood Capital
Advisors, L.P. (private equity investment)(2013 to present) |
Michael A. Pignataro,
1959 |
|
|
|
Trustee |
|
Since April 2015 |
|
Director, Credit Suisse Asset Management (2001 to 2012); and Chief Financial Officer, Credit Suisse Funds (1996 to
2013). |
|
22 |
|
Trustee, IndexIQ Trust, IndexIQ Active ETF Trust (2015 to present); The New Ireland Fund, Inc. (closed-end fund) (2015 to
present) |
Paul
D. Schaeffer,
1951 |
|
|
|
Trustee |
|
Since April 2015 |
|
President, AlphaHut (dba Aspiring Solution Partners) (financial services consulting) (2013 to present); Executive Advisor, Aquiline
Capital Partners LLC (private equity investment)(2014 to present); and Managing Director, Forward Management LLC (asset management) (2010 to
2013). |
|
22 |
|
Trustee, IndexIQ Trust, IndexIQ Active ETF Trust (2015 to present); Context Capital Funds (mutual fund trust)(2 Portfolios) (2014 to
present); Pop Tech! (conference operator) (2012 to present) |
Interested Trustee
|
|
|
|
|
|
|
|
|
|
|
|
|
|
|
|
|
|
|
|
|
|
|
Kirk C. Lehneis,
19744 |
|
|
|
Trustee, President and Principal Executive Officer |
|
Since January 2018 |
|
Chief Operating Officer and Senior Managing Director (since 2016), New York Life Investment Management LLC; Chairman of the Board (since September
2017), NYLIFE Distributors LLC; Chairman of the Board, NYLIM Service Company LLC (since September 2017); President, MainStay DefinedTerm Municipal
Opportunities Fund, MainStay Funds, MainStay Funds Trust, and MainStay VP Funds Trust (since September 2017); Chief Executive Officer, IndexIQ Advisors
LLC (since January 2018); Trustee, President and Principal Executive Officer, IndexIQ Trust, IndexIQ ETF Trust and IndexIQ Active ETF Trust (since
January 2018). |
|
22 |
|
Trustee, Index IQ Trust, Index IQ Active ETF Trust (2018 to present) |
203
Board of Trustees and Officers
(unaudited) (continued)
April
30, 2018
Other Officers
Name and
Year of
Birth1
|
|
|
|
Position(s)
Held
with
Trust
|
|
Term of Office
and
Length of
Time Served2
|
|
Principal Occupation(s)
During Past 5 Years
|
|
|
|
|
|
|
|
|
|
|
|
|
|
|
|
Kevin M. Bopp,
1969 |
|
|
|
Chief Compliance Officer |
|
Since January 2017 |
|
Chief Compliance Officer, IndexIQ, IndexIQ Trust, IndexIQ ETF Trust and IndexIQ Active ETF Trust (since January 2017); Chief
Compliance Officer (since January 2016), Director and Associate General Counsel (2011 to 2014) and Vice President and Assistant General Counsel (2010
to 2011), New York Life Investment Management LLC; Vice President and Chief Compliance Officer, and MainStay VP Funds Trust (2010 to 2014), MainStay
Defined Term Municipal Opportunities Fund (2011 to 2014). MainStay VP Funds Trust, MainStay Defined Term Municipal Opportunities Fund (since 2014);
Assistant Secretary, MainStay Funds, MainStay Funds Trust. |
Matthew V. Curtin,
1982 |
|
|
|
Secretary and Chief Legal Officer |
|
Since June 2015 |
|
Secretary and Chief Legal Officer, IndexIQ, IndexIQ Trust, IndexIQ ETF Trust and IndexIQ Active ETF Trust (since June 2015), Chief
Compliance Officer, IndexIQ, IndexIQ ETF Trust and IndexIQ Active ETF Trust (June 2015 to January 2017); Associate General Counsel, New York Life
Insurance Company (since February 2015); Associate, Dechert LLP (2007 to 2015). |
Jon
H. Zimmerman,
1982 |
|
|
|
Executive Vice President |
|
Since April 2018 |
|
Chief Operating Officer, Index IQ Trust, IndexIQ Active ETF Trust and IndexIQ ETF Trust (2018 to present); Director, New York Life
Investment Management LLC (2015-present); Vice President, Morgan Stanley (2007 to 2015) |
Adefolahan Oyefeso,
1974 |
|
|
|
Treasurer, Principal Financial Officer and Principal Accounting Office |
|
Since April 2018 |
|
Vice President of Operations & Finance, IndexIQ Advisors LLC (January/2015 to present); Director of the Fund
Administration Client Service Department at The Bank of New York Mellon 2007 to 2015. |
1 |
|
The address of each Trustee or officer is c/o
IndexIQ, 51 Madison Avenue, 4th Floor, New York, NY 10010. |
2 |
|
Trustees and Officers serve until their successors
are duly elected and qualified. |
3 |
|
The Funds are part of a “fund complex”.
The fund complex includes all open-end funds (including all of their portfolios) advised by the Advisor. As of the date of this SAI, the fund complex
consists of the Trust’s funds, the Active ETF Trust and the one fund of the Index IQ Trust advised by the Advisor. |
4 |
|
Mr. Lehneis is an “interested person” of
the Trust (as that term is defined in the 1940 Act) because of his affiliations with the Advisor. |
Availability of Additional Information About the
Trustees
The Statement of Additional Information
includes additional information about the Trustees and is available, free of charge by
visiting nylinvestments.com/etfs, or by calling (888) 474-7725.
204

IndexIQ
ETF Trust ANNUAL REPORT | APRIL 30, 2018 IQ Hedge Multi-Strategy Tracker ETF (QAI) IQ
Hedge Macro Tracker ETF (MCRO) IQ Hedge Market Neutral Tracker ETF (QMN) IQ Hedge Long/Short
Tracker ETF (QLS) IQ Hedge Event-Driven Tracker ETF (QED) IQ Global Resources ETF (GRES)
IQ Merger Arbitrage ETF (MNA) IQ Real Return ETF (CPI) IQ Global Agribusiness Small Cap
ETF (CROP) IQ U.S. Real Estate Small Cap ETF (ROOF) IQ 50 Percent Hedged FTSE International
ETF (HFXI) IQ 50 Percent Hedged FTSE Europe ETF (HFXE) IQ 50 Percent Hedged FTSE Japan
ETF (HFXJ) IQ Leaders GTAA Tracker ETF (QGTA) IQ Enhanced Core Bond U.S. ETF (AGGE) IQ
Enhanced Core Plus Bond U.S. ETF (AGGP) IQ S&P High Yield Low Volatility Bond ETF (HYLV)
IQ Chaikin U.S. Small Cap ETF (CSML) IQ Chaikin U.S. Large Cap ETF (CLRG) Investment
Advisor IndexIQ Advisors LLC 51 Madison Avenue, 4th floor New York, NY 10010 Distributor
ALPS Distributors, Inc. 1290 Broadway, Suite 1100 Denver, CO 80203 Custodian/Fund Administrator/Transfer
Agent The Bank of New York Mellon 101 Barclay Street New York, NY 10286 Legal Counsel
Chapman and Cutler, LLP 1270 Avenue of the Americas New York, NY 10020 Independent Registered
Public Accounting Firm PricewaterhouseCoopers LLP 300 Madison Avenue New York, NY 10017
1740844 ME11-06/18
Item 2. Code of Ethics.
| (a) | The registrant, as of the end of the period covered by this report, has adopted a code of ethics
that applies to the registrant’s principal executive officer, principal financial officer, principal accounting officer or
controller, or persons performing similar functions, regardless of whether these individuals are employed by the registrant or
a third party. |
| (c) | There have been no amendments, during the period covered by this report, to a provision of the
code of ethics that applies to the registrant’s principal executive officer, principal financial officer, principal accounting
officer or controller, or persons performing similar functions, regardless of whether these individuals are employed by the registrant
or a third party, and that relates to any element of the code of ethics description. |
| (d) | The registrant has not granted any waivers, including an implicit waiver, from a provision of the
code of ethics that applies to the registrant’s principal executive officer, principal financial officer, principal accounting
officer or controller, or persons performing similar functions, regardless of whether these individuals are employed by the registrant
or a third party, that relates to one or more of the items set forth in paragraph (b) of this item’s instructions. |
Item 3. Audit Committee Financial Expert.
The Registrant’s Board of Trustees has
two audit committee financial experts serving on its audit committee, an “independent” Trustee, Reena Aggarwal and
Michael Pignataro. Under applicable securities laws, a person who is determined to be an audit committee financial expert will
not be deemed an “expert” for any purpose, including without limitation for the purposes of Section 11 of the Securities
Act of 1933, as a result of being designated or identified as an audit committee financial expert. The designation or identification
of a person as an audit committee financial expert does not impose on such person any duties, obligations, or liabilities that
are greater than the duties, obligations, and liabilities imposed on such person as a member of the audit committee and Board of
Trustees in the absence of such designation or identification.
Item 4. Principal Accountant Fees and Services.
Audit Fees
| (a) | The aggregate fees billed for each of the last two fiscal years for professional services rendered
by the principal accountant for the audit of the registrant's annual financial statements or services that are normally provided
by the accountant in connection with statutory and regulatory filings or engagements for those fiscal years are $392,409 for 2018
and $390,590 for 2017. |
Audit-Related Fees
| (b) | The aggregate fees billed in each of the last two fiscal years for assurance and related services
by the principal accountant that are reasonably related to the performance of the audit of the registrant's financial statements
and are not reported under paragraph (a) of this Item are $0 for 2018 and $0 for 2017. |
Tax Fees
| (c) | The aggregate fees billed in each of the last two fiscal years for professional services rendered
by the principal accountant for tax compliance, tax advice, and tax planning are $0 for 2018 and $0 for 2017. |
All Other Fees
| (d) | The aggregate fees billed in each of the last two fiscal years for products and services provided
by the principal accountant, other than the services reported in paragraphs (a) through (c) of this Item are $0 for 2018 and $0
for 2017. |
| (e)(1) | Per Rule 2-01(c)(7)(A), the Audit Committee pre-approves all of the Audit, Audit-Related, Tax and
Other Fees of the Registrant. |
| (e)(2) | With respect to the services described in paragraphs (b) through (d) of this Item 4, no amount
was approved by the Audit Committee pursuant to paragraph (c)(7)(i)(C) of Rule 2-01 of Regulation S-X. |
| (g) | The aggregate non-audit fees billed by the principal accountant for services rendered to the registrant's
investment adviser (not including any subadvisor whose role is primarily portfolio management and is subcontracted with or overseen
by another investment adviser), and any entity controlling, controlled by, or under common control with the adviser that provides
ongoing services to the registrant were (i) approximately $6,800,000 for the fiscal year ended April 30, 2018, and (ii) $5,600,000
for the fiscal year ended April 30, 2017. |
| (h) | The registrant’s Audit Committee has determined that the non-audit services rendered by the
principal accountant for the fiscal year ended April 30, 2018 to the registrant’s investment adviser and any entity controlling,
controlled by, or under common control with the registrant’s investment adviser that provides ongoing services to the registrant
that were not required to be pre-approved by the Audit Committee because they did not relate directly to the operations and financial
reporting of the registrant were compatible with maintaining the respective independence of the principal accountant during the
relevant time period. |
Item 5. Audit Committee of Listed
Registrants.
| (a) | The Fund has a designated Audit Committee in accordance with Section 3(a)(58)(A) of the Securities
and Exchange Act of 1934 (the “Exchange Act”) and the members of such committee are Reena Aggarwal, Michael Pignataro,
and Paul Schaeffer. |
Item 6. Investments.
| (a) | Schedule of Investments in securities of unaffiliated issuers as of the close of the reporting
period is included as part of the report to shareholders filed under Item 1 of this form. |
Item 7. Disclosure of Proxy
Voting Policies and Procedures for Closed-End Management Investment Companies.
Not applicable.
Item 8. Portfolio Managers of Closed-End Management Investment
Companies.
Not applicable.
Item 9. Purchases of Equity
Securities by Closed-End Management Investment Company and Affiliated Purchasers.
Not applicable.
Item 10. Submission of Matters to a Vote of Security Holders.
There have been no material changes to the
procedures by which the shareholders may recommend nominees to the registrant’s board of trustees, where those changes were
implemented after the registrant last provided disclosure in response to the requirements of Item 407(c)(2)(iv) of Regulation S-K
(17 CFR 229.407) (as required by Item 22(b)(15) of Schedule 14A (17 CFR 240.14a-101)), or this Item.
Item 11. Controls and Procedures.
| (a) | The registrant’s principal executive and principal financial officers, or persons performing
similar functions, have concluded that the registrant’s disclosure controls and procedures (as defined in Rule 30a-3(c) under
the Investment Company Act of 1940, as amended (the “1940 Act”) (17 CFR 270.30a-3(c))) are effective, as of a date
within 90 days of the filing date of the report that includes the disclosure required by this paragraph, based on their evaluation
of these controls and procedures required by Rule 30a-3(b) under the 1940 Act (17 CFR 270.30a-3(b)) and Rules 13a-15(b) or 15d-15(b)
under the Securities Exchange Act of 1934, as amended (17 CFR 240.13a-15(b) or 240.15d-15(b)). |
| (b) | There were no changes in the registrant’s internal control over financial reporting (as defined
in Rule 30a-3(d) under the 1940 Act (17 CFR 270.30a-3(d))) that occurred during the registrant’s last fiscal quarter that
has materially affected, or is reasonably likely to materially affect, the registrant’s internal control over financial reporting. |
Item 12. Disclosure of Securities
Lending Activities for Closed-End Management Investment Companies.
Not applicable.
Item 13. Exhibits.
| (a)(1) | Code of ethics that is the subject of disclosure required by Item 2 is attached hereto. |
| (a)(2) | Certifications pursuant to Rule 30a-2(a) under the 1940 Act and Section 302 of the Sarbanes-Oxley
Act of 2002 are attached hereto. |
| (b) | Certifications pursuant to Rule 30a-2(b) under the 1940 Act and Section 906 of the Sarbanes-Oxley
Act of 2002 are attached hereto. |
SIGNATURES
Pursuant to the requirements of the Securities
Exchange Act of 1934 and the Investment Company Act of 1940, the registrant has duly caused this report to be signed on its behalf
by the undersigned, thereunto duly authorized.
| (Registrant) |
IndexIQ
ETF Trust |
| By (Signature and Title)* |
/s/ Kirk C. Lehneis |
| |
Kirk C. Lehneis |
| |
(Principal Executive Officer) |
Pursuant to the requirements of the Securities
Exchange Act of 1934 and the Investment Company Act of 1940, this report has been signed below by the following persons on behalf
of the registrant and in the capacities and on the dates indicated.
| By (Signature and Title)* |
/s/ Kirk C. Lehneis |
| |
Kirk C. Lehneis |
| |
(Principal Executive Officer) |
| By (Signature and Title)* |
/s/ Adefolahan O. Oyefeso |
| |
Adefolahan O. Oyefeso |
| |
(Principal Financial Officer) |
* Print the name and title of each signing officer under
his or her signature.
EX-99.CODE ETH
2
e78923ex99codeeth.htm
CODE OF ETHICS
EX-99.CODE ETH
CODE OF ETHICS FOR SENIOR OFFICERS
Preamble
Section 406 of the Sarbanes-Oxley Act
of 2002 directs that rules be adopted disclosing whether a company has a code of ethics for senior financial officers. The U.S.
Securities and Exchange Commission (the “SEC”) has adopted rules requiring annual disclosure of an investment company’s
code of ethics applicable to the company’s principal executive as well as principal financial officers, if such a code has
been adopted. In response, IndexIQ Trust (the “Trust”) has adopted this Code of Ethics (the “Code”).
Statement of Policy
It is the obligation
of the senior officers of the Trust to provide full, fair, timely and comprehensible disclosure--financial and otherwise--to Trust
shareholders, regulatory authorities and the general public. In fulfilling that obligation, senior officers must act ethically,
honestly and diligently. This Code is intended to enunciate guidelines to be followed by persons who serve the Trust in senior
officer positions. No Code of Ethics can address every situation that a senior officer might face; however, as a guiding principle,
senior officers should strive to implement the spirit as well as the letter of applicable laws, rules and regulations, and to provide
the type of clear and complete disclosure and information Trusts shareholders have a right to expect.
The purpose of this
Code of Ethics is to promote high standards of ethical conduct by Covered Persons (as defined below) in their capacities as officers
of the Trust, to instruct them as to what is considered to be inappropriate and unacceptable conduct or activities for officers
and to prohibit such conduct or activities. This Code supplements other policies that the Trust and the Advisor has adopted or
may adopt in the future with which Trust officers are also required to comply (e.g., code of ethics relating to personal trading
and conduct).
Covered Persons
This Code of Ethics
applies to those persons appointed by the Trust’s Board of Trustees as Chief Executive Officer, President, Principal Financial
Officer and Treasurer, or persons performing similar functions.
Promotion of Honest and Ethical Conduct
In serving as an
officer of the Trust, each Covered Person must maintain high standards of honesty and ethical conduct and must encourage his colleagues
who provide services to the Trust, whether directly or indirectly, to do the same.
Each Covered Person
understands that as an officer of the Trust, he has a duty to act in the best interests of the Trust and their shareholders. The
interests of the Covered Person’s personal interests should not be allowed to compromise the Covered Person from fulfilling
his duties as an officer of the Trust.
If a Covered Person
believes that his personal interests are likely to materially compromise his objectivity or his ability to perform the duties of
his role as an officer of the Trust, he should consult with the Trust’s chief legal officer or outside counsel. Under appropriate
circumstances, a Covered Person should also consider whether to present the matter to the Trustees of the Trust or a committee
thereof.
No Covered Person
shall suggest that any person providing, or soliciting to be retained to provide, services to a Trust give a gift or an economic
benefit of any kind to him in connection with the person’s retention or the provision of services.
Promotion of Full, Fair, Accurate,
Timely and Understandable Disclosure
No Covered
Person shall create or further the creation of false or misleading information in any SEC filing or report to Trust’s
shareholders. No Covered Person shall conceal or fail to disclose information within the Covered Person’s possession
legally required to be disclosed or necessary to make the disclosure made not misleading. If a Covered Person shall become
aware that information filed with the SEC or made available to the public contains any false or misleading information or
omits to disclose necessary information, he shall promptly report it to Trust’s counsel, who shall advise such Covered
Person whether corrective action is necessary or appropriate.
Each Covered Person,
consistent with his responsibilities, shall exercise appropriate supervision over, and shall assist, Trust service providers in
developing financial information and other disclosure that complies with relevant law and presents information in a clear, comprehensible
and complete manner. Each Covered Person shall use his best efforts within his area of expertise to assure that Trust reports reveal,
rather than conceal, the Trust’s financial condition.
Each Covered Person
shall seek to obtain additional resources if he believes that available resources are inadequate to enable the Trust to provide
full, fair and accurate financial information and other disclosure to regulators and Trust shareholders.
Each Covered Person
shall inquire of other Trust officers and service providers, as appropriate, to assure that information provided is accurate and
complete and presented in an understandable format using comprehensible language.
Each Covered Person
shall diligently perform his services to the Trust, so that information can be gathered and assessed early enough to facilitate
timely filings and issuance of reports and required certifications.
Promotion of Compliance with Applicable
Government Laws, Rules and Regulations
Each Covered Person
shall become and remain knowledgeable concerning the laws and regulations relating to the Trust and its operations and shall act
with competence and due care in serving as an officer of the Trust. Each Covered Person with specific responsibility for financial
statement disclosure will become and remain knowledgeable concerning relevant auditing standards, generally accepted accounting
principles, FASB pronouncements and other accounting and tax literature and developments.
Each Covered Person
shall devote sufficient time to fulfilling his responsibilities to the Trust.
Each Covered Person shall cooperate
with the Trust’s independent auditors, regulatory agencies and internal auditors in their review or inspection of the Trust
and their operations.
No Covered Person
shall knowingly violate any law or regulation relating to the Trust or their operations or seek to illegally circumvent any such
law or regulation.
No Covered Person
shall engage in any conduct involving dishonesty, fraud, deceit or misrepresentation involving the Trust or their operations.
Promoting Prompt Internal Reporting
of Violations
Each Covered Person
shall promptly report his own violations of this Code and violations by other Covered Persons of which he is aware to the Chairman
of the Audit Committee.
Any requests for
a waiver from or an amendment to this Code shall be made to the Chairman of the Audit Committee. All waivers and amendments shall
be disclosed as required by law.
Sanctions
Failure to comply
with this Code will subject the violator to appropriate sanctions, which will vary based on the nature and severity of the violation.
Such sanctions may include censure, suspension or termination of position as an officer of the Trust. Sanctions shall be imposed
by the Audit Committee, subject to review by the entire Board of Trustees.
Each Covered Person
shall be required to certify annually whether he has complied with this Code.
No Rights Created
This Code of Ethics
is a statement of certain fundamental principles, policies and procedures that govern the Trust’s senior officers in the
conduct of the Trust’s business. It is not intended to and does not create any rights in any employee, investor, supplier,
competitor, shareholder or any other person or entity.
Recordkeeping
The Trust will maintain
and preserve for a period of not less than six (6) years from the date such action is taken, the first two (2) years in an easily
accessible place, a copy of the information or materials supplied to the Board (1) that provided the basis for any amendment or
waiver to this Code and (2) relating to any violation of the Code and sanctions imposed for such violation, together with a written
record of the approval or action taken by the Board.
Amendments
The Trustees will
make and approve such changes to this Code of Ethics as they deem necessary or appropriate to effectuate the purposes of this Code.
Dated: May 12, 2008
CODE OF ETHICS FOR SENIOR OFFICERS
I HEREBY CERTIFY THAT:
| (1) | I have read and I understand the Code of Ethics for Senior Officers adopted by IndexIQ Trust (the
“Code of Ethics”); |
| (2) | I recognize that I am subject to the Code of Ethics; |
| (3) | I have complied with the requirements of the Code of Ethics during the period year ended ___________;
and |
| (4) | I have reported all violations of the Code of Ethics required to be reported pursuant to the requirements
of the Code during the period ended ____________. |
Set forth below exceptions to items
(3) and (4), if any:
Name: _________________
Date: __________________