| • | A Fund may change its investment objective, benchmark or strategies and may liquidate at a time that is disadvantageous to shareholders. |
| • | Investors may be adversely affected by redemption or creation orders that are subject to postponement, suspension or rejection under certain circumstances. |
| • | The NAV per Share may not correspond to the market price per Share. |
| • | Investors may be adversely affected by an overstatement or understatement of a Fund’s NAV due to the valuation method employed or errors in the NAV calculation. |
| • | Purchases of a Fund’s creation units may be suspended if the Fund issues all of its currently remaining registered shares – this may have a negative impact on the trading price and liquidity of Fund shares |
| • | Regulatory and exchange position limits or accountability levels may restrict the creation of Creation Units and have a negative impact on operation of the Trust. |
| • | The number of underlying components included in a Fund’s benchmark may impact volatility, which could adversely affect an investment in the Shares. |
| • | The liquidity of the Shares may also be affected by the withdrawal from participation of Authorized Participants, which could adversely affect the market price of the Shares. |
| • | Shareholders that are not Authorized Participants may only purchase or sell their Shares in secondary trading markets, and the conditions associated with trading in secondary markets may adversely affect investors’ investment in the Shares. |
| • | The applicable Exchange may halt trading in the Shares of a Fund which would adversely impact investors’ ability to sell Shares. |
| • | Shareholders do not have the protections associated with ownership of shares in an investment company registered under the 1940 Act. |
| • | Shareholders do not have the rights enjoyed by investors in certain other vehicles and may be adversely affected by a lack of statutory rights and by limited voting and distribution rights. |
| • | The value of the Shares will be adversely affected if the Funds are required to indemnify Wilmington Trust Company (the “Trustee”) and/or the Sponsor. |
| • | Although the Shares of the Funds are limited liability investments, certain circumstances such as bankruptcy of a Fund will increase a shareholder’s liability. |
| • | Failure of the FCMs to segregate assets may increase losses in the Funds. |
| • | A court could potentially conclude that the assets and liabilities of one Fund are not segregated from those of another Fund and may thereby potentially expose assets in a Fund to the liabilities of another Fund. |
| • | The discontinuance of LIBOR could cause or contribute to market volatility and could affect the market value and/or liquidity of the Funds’ investments. |
| • | Due to the increased use of technologies, intentional and unintentional cyber-attacks pose operational and information security risks. |
| • | Trading on exchanges outside the United States is generally not subject to U.S. regulation and may result in different or diminished investor protections. |
| • | Competing claims of intellectual property rights may affect the Funds and an investment in the Shares. |
| • | Shareholders’ tax liability may exceed cash distributions on the Shares. |
| • | The U.S. Internal Revenue Service (“IRS”) could adjust or reallocate items of income, gain, deduction, loss and credit with respect to the Shares if the IRS does not accept the assumptions or conventions utilized by the Fund. |
| • | Shareholders will receive partner information tax returns on Schedule K-1, which could increase the complexity of tax returns. |
| • | Shareholders of each Fund may recognize significant amounts of ordinary income and short-term capital gain. |
| • | A Fund could be treated as a corporation for federal income tax purposes, which may substantially reduce the value of Shares. |
25
| • | Changes in U.S. federal income tax law could affect an investment in the Shares. |
| • | The Funds and the Sponsor are subject to extensive legal and regulatory requirements. Regulatory changes or actions, including the implementation of new legislation, may alter the operations and profitability of the Funds. |
| • | Investors cannot be assured of the Sponsor’s continued services, the discontinuance of which may be detrimental to the Funds. |
These risk factors should be read in connection with the other information included in this Annual Report on Form
10-K,
including Management’s Discussion and Analysis of Financial Condition and Results of Operations and the Funds’ Financial Statements and the related Notes to the Funds’ Financial Statements. For purposes of this section: | • | The term “Matching VIX Fund” refers to ProShares VIX Short-Term Futures ETF and ProShares VIX Mid-Term Futures ETF; |
| • | The term “Geared VIX Fund” refers to ProShares Ultra VIX Short-Term Futures ETF and ProShares Short VIX Short-Term Futures ETF; |
| • | The term “VIX Fund” refers to each Geared VIX Fund and each Matching VIX Fund; |
| • | The term “Geared Fund” refers to ProShares UltraShort Bloomberg Crude Oil, ProShares UltraShort Bloomberg Natural Gas, ProShares UltraShort Gold, ProShares UltraShort Silver, ProShares Short Euro, ProShares UltraShort Australian Dollar, ProShares UltraShort Euro, ProShares UltraShort Yen, ProShares Ultra Bloomberg Crude Oil, ProShares Ultra Bloomberg Natural Gas, ProShares Ultra Gold, ProShares Ultra Silver, ProShares Ultra Euro and ProShares Ultra Yen, and each Geared VIX Fund; |
| • | The term “Natural Gas Fund” refers to ProShares UltraShort Bloomberg Natural Gas and ProShares Ultra Bloomberg Natural Gas ; |
| • | The term “Oil Fund” refers to ProShares UltraShort Bloomberg Crude Oil and ProShares Ultra Bloomberg Crude Oil; |
| • | The term “Precious Metal Fund” refers to ProShares UltraShort Gold, ProShares UltraShort Silver, ProShares Ultra Gold and ProShares Ultra Silver; and |
| • | The term “Currency Fund” refers to ProShares Short Euro, ProShares UltraShort Australian Dollar, ProShares UltraShort Euro, ProShares UltraShort Yen, ProShares Ultra Euro and ProShares Ultra Yen. |
26
Risks Specific to the Geared Funds
In addition to the risks described elsewhere in this “Risk Factors” section, the following risks apply to the Geared Funds.
Due to the compounding of daily returns, the Geared Funds’ returns over periods longer than a single day will likely differ in amount and possibly even direction from the Geared Fund multiple times the benchmark return for the period.
Each of the Geared Funds is “geared” in the sense that each has an investment objective to correspond, before fees and expenses, to the , , , , 1.5x, 2x), of the performance of a benchmark on a given day. Each Geared Fund seeks investment results for a single day only, as measured from its NAV calculation time to its next NAV calculation time, and not for any other period. The return of a Geared Fund for a period longer than a single day is the result of its return for each day compounded over the period and usually will differ from ,
one-half
inverse (e.g.
-0.5x),
inverse (e.g.
-1x),
an inverse multiple (e.g.
-2x),
or a multiple (e.g.
one-half
inverse (e.g.
-0.5x),
the inverse (-1x),
one and one-half
times (1.5x), two times the inverse (-2x)
or two times (2x) the return of the Geared Fund’s benchmark for the period. A Geared Fund will lose money if its benchmark’s performance is flat over time, and it is possible for a Geared Fund to lose money over time regardless of the performance of an underlying benchmark, as a result of daily rebalancing, the benchmark’s volatility and compounding. Longer holding periods, higher benchmark volatility, inverse exposure and greater leverage each affect the impact of compounding on a Geared Fund’s returns. Daily compounding of a Geared Fund’s investment returns can dramatically and adversely affect its longer-term performance during periods of high volatility. Volatility may be at least as important to a Geared Fund’s return for a period as the return of the Geared Fund’s underlying benchmark. A Geared Fund will lose money if the Index’s performance is flat over time, and it is possible for a Geared Fund to lose money over time regardless of the performance of the Index, as a result of daily rebalancing, the Index’s volatility, compounding and other factors. Longer holding periods, higher index volatility, inverse exposure and greater leverage each affect the impact of compounding on a Geared Fund’s returns. Daily compounding of a Geared Fund’s investment returns can dramatically and adversely affect performance, especially during periods of high volatility. Volatility has a negative impact on Geared Fund performance and the volatility of the Index may be at least as important to a Geared Fund’s return for a period as the return of the Index.
Each Ultra or UltraShort Fund uses leverage and should produce daily returns that are more volatile than that of its benchmark. For example, the daily return of an Ultra Fund with a 2x multiple should be approximately two times as volatile on a daily basis as the return of a fund with an objective of matching the same benchmark. The daily return of an Ultra Fund with a 1.5x multiple should be approximately one and
one-half
times as volatile on a daily basis as the return of a fund with an objective of matching the same benchmark. The daily return of a Short Fund is designed to return either one-half
the inverse (-0.5x)
or the inverse (-1x)
of the return, that would be expected of a fund with an objective of matching the same benchmark. The Geared Funds are not appropriate for all investors and present different risks than other funds. The daily return of an UltraShort Fund is designed to return two times the inverse (-2x)
of the return, respectively, that would be expected of a fund with an objective of matching the same benchmark. The Geared Funds that use leverage are riskier than similarly benchmarked exchange-traded funds that do not use leverage. An investor should only consider an investment in a Geared Fund if he or she understands the consequences of seeking daily leveraged, daily inverse or daily inverse leveraged investment results. Daily objective geared funds, if used properly and in conjunction with the investor’s view on the future direction and volatility of the markets, can be useful tools for investors who want to manage their exposure to various markets and market segments and who are willing to monitor and/or periodically rebalance their portfolios. Shareholders who invest in the Geared Funds should actively manage and monitor their investments, as frequently as daily. The hypothetical examples below illustrate how daily geared fund returns can behave for periods longer than a single day. Each involves a hypothetical fund XYZ that seeks to double the daily performance of benchmark XYZ. On each day, fund XYZ performs in line with its objective (two times (2x) the benchmark’s daily performance before fees and expenses). Notice that, in the first example (showing an overall benchmark loss for the period), over the entire
seven-day
period, the fund’s total return is more than two times the loss of the period return of the benchmark. For the seven-day
period, benchmark XYZ lost 3.26% while fund XYZ lost 7.01% (versus -6.52%
or 2 x -3.26%).
Benchmark XYZ |
Fund XYZ |
|||||||||||||||
Level |
Daily Performance |
Daily Performance |
Net Asset Value |
|||||||||||||
| Start |
100.00 | $ | 100.00 | |||||||||||||
| Day 1 |
97.00 | -3.00 | % | -6.00 | % | 94.00 | ||||||||||
| Day 2 |
99.91 | 3.00 | % | 6.00 | % | 99.64 | ||||||||||
| Day 3 |
96.91 | -3.00 | % | -6.00 | % | 93.66 | ||||||||||
| Day 4 |
99.82 | 3.00 | % | 6.00 | % | 99.28 | ||||||||||
| Day 5 |
96.83 | -3.00 | % | -6.00 | % | 93.32 | ||||||||||
| Day 6 |
99.73 | 3.00 | % | 6.00 | % | 98.92 | ||||||||||
| Day 7 |
96.74 | -3.00 | % | -6.00 | % | 92.99 | ||||||||||
| |
|
|
|
|||||||||||||
| Total Return |
-3.26 |
% |
-7.01 |
% |
||||||||||||
| |
|
|
|
|||||||||||||
27
Similarly, in another example (showing an overall benchmark gain for the period), over the entire
seven-day
period, the fund’s total return is considerably less than double that of the period return of the benchmark. For the seven-day
period, benchmark XYZ gained 2.72% while fund XYZ gained 4.86% (versus 5.44% (or 2 x 2.72%)). Benchmark XYZ |
Fund XYZ |
|||||||||||||||
Level |
Daily Performance |
Daily Performance |
Net Asset Value |
|||||||||||||
| Start |
100.00 | $ | 100.00 | |||||||||||||
| Day 1 |
103.00 | 3.00 | % | 6.00 | % | 106.00 | ||||||||||
| Day 2 |
99.91 | -3.00 | % | -6.00 | % | 99.64 | ||||||||||
| Day 3 |
102.91 | 3.00 | % | 6.00 | % | 105.62 | ||||||||||
| Day 4 |
99.82 | -3.00 | % | -6.00 | % | 99.28 | ||||||||||
| Day 5 |
102.81 | 3.00 | % | 6.00 | % | 105.24 | ||||||||||
| Day 6 |
99.73 | -3.00 | % | -6.00 | % | 98.92 | ||||||||||
| Day 7 |
102.72 | 3.00 | % | 6.00 | % | 104.86 | ||||||||||
| |
|
|
|
|||||||||||||
| Total Return |
2.72 |
% |
4.86 |
% |
||||||||||||
| |
|
|
|
|||||||||||||
These effects are caused by the compounding, which exists in all investments, but has a more significant impact in geared funds. In general, during periods of higher benchmark volatility, compounding will cause an Ultra Fund’s results for periods longer than a single day to be less than two times (2x) (or less than one and
one-half
times (1.5x) with respect to the ProShares Ultra VIX Short-Term Futures ETF) the return of the benchmark. Compounding will cause a Short Fund’s results for periods longer than a single day to be less than the inverse (-1x)
(or less than one-half
the inverse (-0.5x)
with respect to the ProShares Short VIX Short-Term Futures ETF) of the return of the benchmark. Additionally, compounding will cause an UltraShort Fund’s results for periods longer than a single day to be less than two times the inverse (-2x)
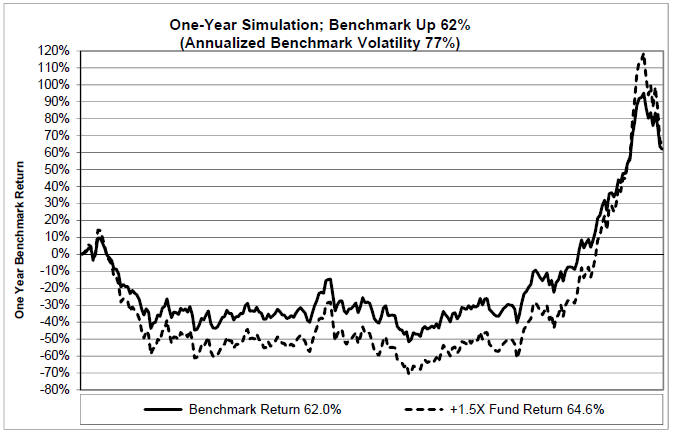
of the return of the benchmark, respectively. This effect becomes more pronounced as volatility increases. Conversely, in periods of lower benchmark volatility (particularly when combined with higher benchmark returns), an Ultra Fund’s returns over longer periods can be higher than two times (2x) (or higher than one and one-half
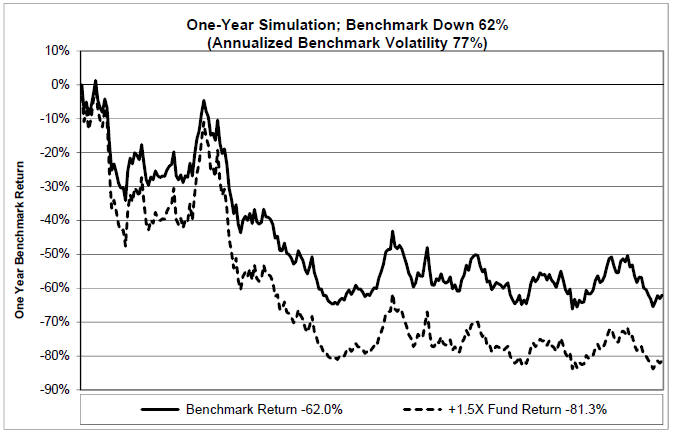
times (1.5x) with respect to the ProShares Ultra VIX Short-Term Futures ETF) the return of the benchmark. Actual results for a particular period, before fees and expenses, are also dependent on the magnitude of the benchmark return in addition to the benchmark volatility. Similar effects exist for the Short Funds and UltraShort Funds and the significance of these effects may be even greater with such inverse or inverse leveraged funds. The graphs that follow illustrate this point. Each of the graphs shows a simulated hypothetical
one-year
performance of a benchmark compared with the performance of a geared fund that perfectly achieves its geared daily investment objective. The graphs demonstrate that, for periods greater than a single day, a geared fund is likely to underperform or overperform (but not match) the benchmark performance (or the inverse of the benchmark performance) times the multiple stated as the daily fund objective. Investors should understand the consequences of holding daily rebalanced funds for periods longer than a single day and should actively manage and monitor their investments, as frequently as daily. A one-year
period is used solely for illustrative purposes. Deviations from the benchmark return (or the inverse of the benchmark return) times the fund multiple can occur over periods as short as two days (each day as measured from NAV to NAV) and may also occur in periods shorter than a single day (when measured intraday as opposed to NAV to NAV). See “Intraday Price Performance Risk” below for additional details. To isolate the impact of daily leveraged, inverse or inverse leveraged exposure, these graphs assume: a) no fund expenses or transaction costs; b) borrowing/lending rates (to obtain required inverse, inverse leveraged or leveraged exposure) and cash reinvestment rates of zero percent; and c) the fund consistently maintaining perfect exposure (-0.5x,
-1x,
-2x,
1.5x, or 2x) as of the fund’s NAV time each day. If these assumptions were different, the fund’s performance would be different than that shown. If fund expenses, transaction costs and financing expenses greater than zero percent were included, the fund’s performance would also be different than that shown. Each of the graphs also assumes a volatility rate of 73%, which is an approximate average of the five-year historical volatility rate of the most volatile benchmark referenced herein (the S&P 500 VIX Short-Term Futures Index). A benchmark’s volatility rate is a statistical measure of the magnitude of fluctuations in its returns. 28
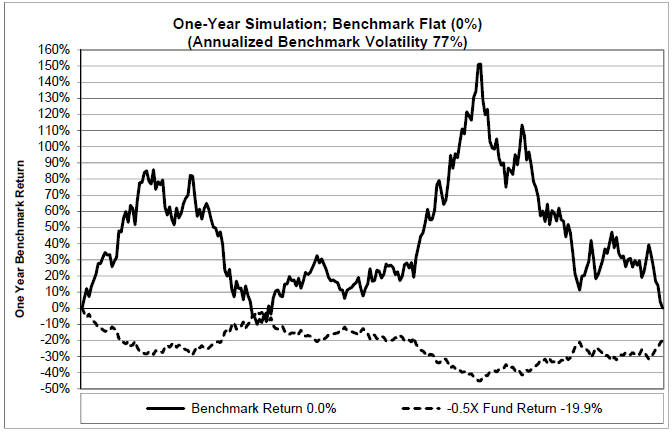
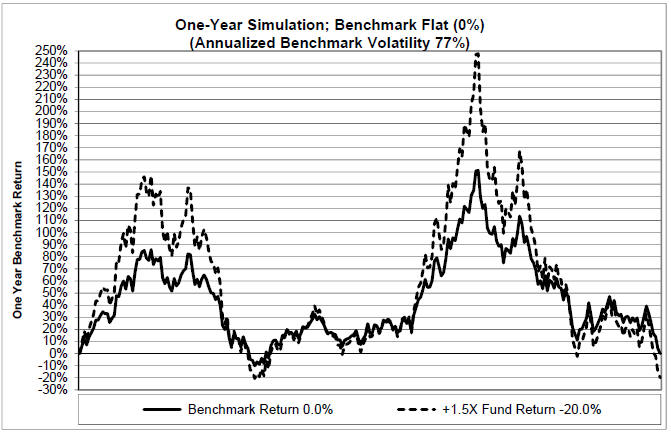
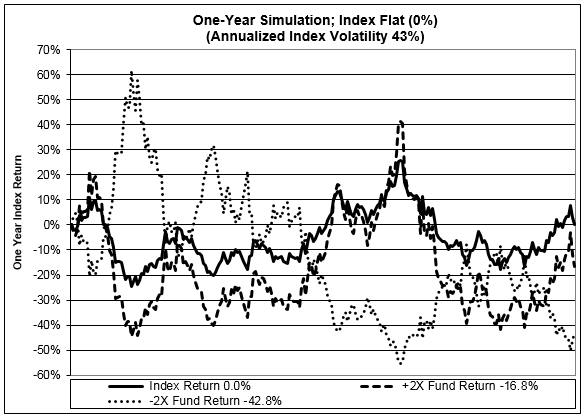
The graph above shows a scenario where the index, which exhibits volatility, is flat or trendless over the year (i.e., begins and ends the year at 0%), but the Short Fund
day-to-day
(-0.5x)
is down. 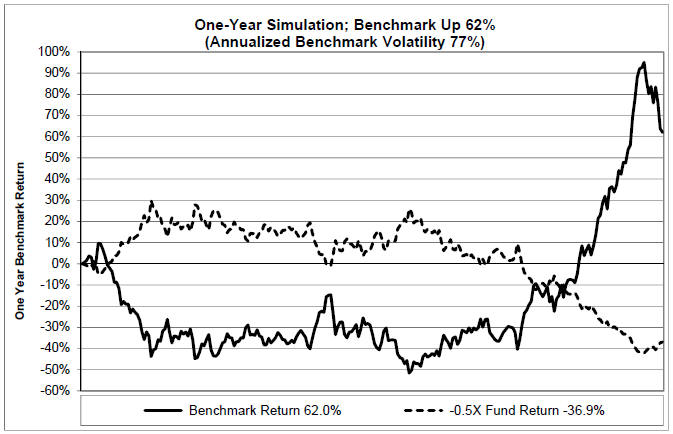
29
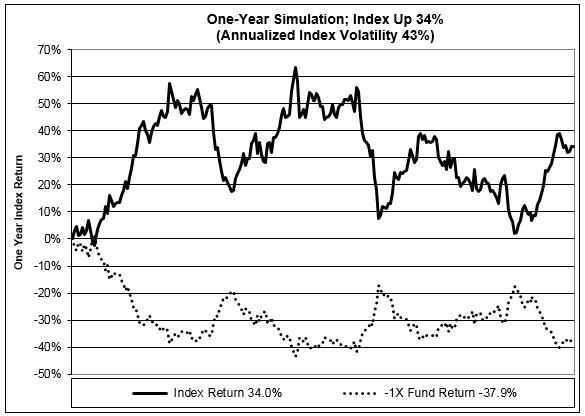
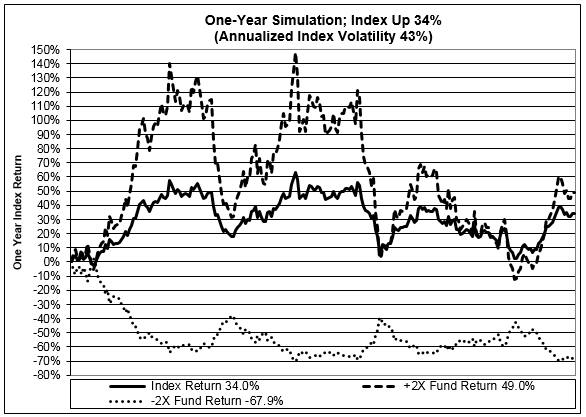
The graph above shows a scenario where the benchmark, which exhibits volatility, is up over the year, but the Short Fund
day-to-day
(-0.5x)
is down more than one-half
the inverse of the benchmark. 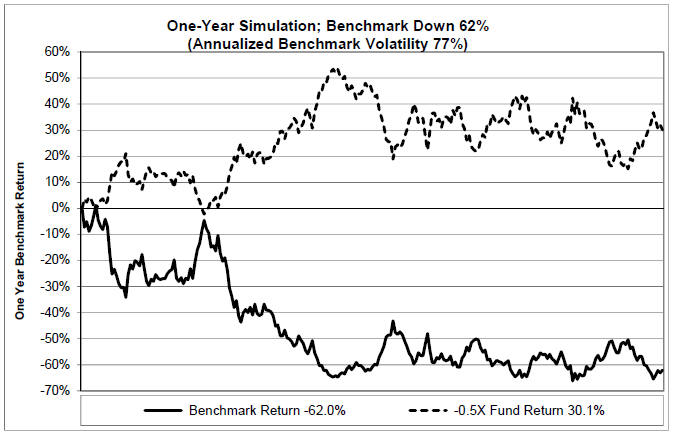
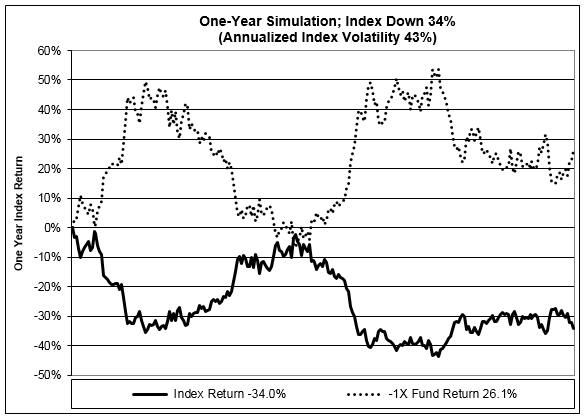
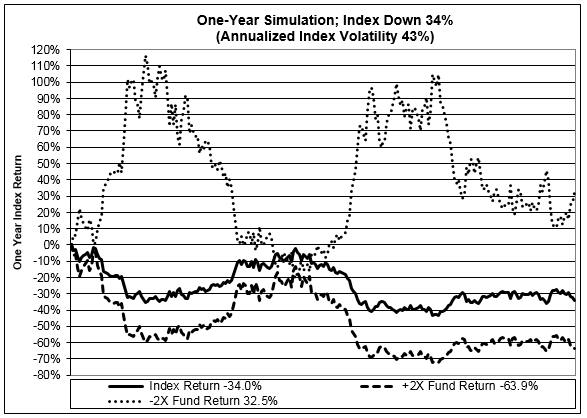
The graph above shows a scenario where the benchmark, which exhibits volatility, is down over the year, but the Short Fund
day-to-day
(-0.5x)
is up less than one-half
the inverse of the benchmark. 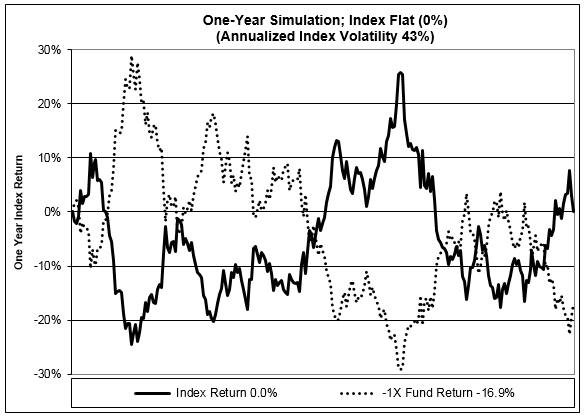
30