UNITED STATES
SECURITIES AND EXCHANGE COMMISSION
WASHINGTON, D.C. 20549
FORM N-CSR
CERTIFIED SHAREHOLDER REPORT OF REGISTERED
MANAGEMENT INVESTMENT COMPANIES
Investment Company Act file number 811-22137
Oppenheimer Master Loan Fund, LLC
(Exact name of registrant as specified in charter)
6803 South Tucson Way, Centennial, Colorado 80112-3924
(Address of principal executive offices) (Zip code)
Cynthia Lo Bessette
OFI Global Asset Management, Inc.
225 Liberty Street, New York, New York 10281-1008
(Name and address of agent for service)
Registrant’s telephone number, including area code: (303) 768-3200
Date of fiscal year end: September 30
Date of reporting period: 9/30/2018
Item 1. Reports to Stockholders.
| Annual Report
|
|
9/30/2018
|
| |||
|
|
||||||
|
|
|
|||||

An Important Update
On October 18, 2018, Massachusetts Mutual Life Insurance Company, an indirect corporate parent of OppenheimerFunds, Inc. and its subsidiaries OFI Global Asset Management, Inc., OFI SteelPath, Inc. and OFI Advisors, LLC, announced that it has entered into an agreement whereby Invesco Ltd., a global investment management company, will acquire OppenheimerFunds, Inc. As of the date of this report, the transaction is expected to close in the second quarter of 2019, pending necessary regulatory and other third-party approvals. This is subject to change.
PORTFOLIO MANAGERS: David Lukkes, CFA and Joseph Welsh, CFA
AVERAGE ANNUAL TOTAL RETURNS AT 9/30/18
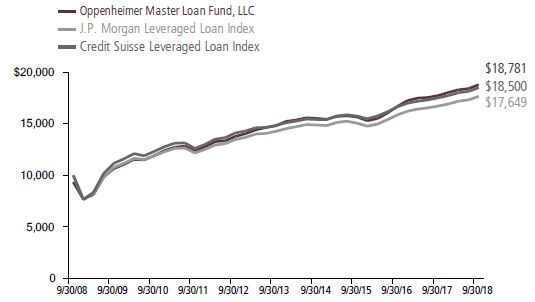
| Oppenheimer Master Loan Fund, LLC
|
J.P. Morgan Leveraged Loan Index
|
Credit Suisse Leveraged Loan Index
| ||||
| 1-Year | 5.91% | 5.65% | 5.58% | |||
| 5-Year | 4.88 | 4.52 | 4.35 | |||
| 10-Year | 6.51 | 6.34 | 5.85 | |||
Performance data quoted represents past performance, which does not guarantee future results. The investment return and principal value of an investment in the Fund will fluctuate so that an investor’s shares, when redeemed, may be worth more or less than their original cost. Current performance may be lower or higher than the performance quoted. Returns do not consider capital gains or income taxes on an individual’s investment. Fund returns include changes in share price and reinvested distributions. See Fund prospectuses and summary prospectuses for more information on share classes and sales charges.
The Fund’s performance is compared to the performance of the J.P. Morgan Leveraged Loan Index and the Credit Suisse Leveraged Loan Index. The J.P. Morgan Leveraged Loan Index tracks the performance of U.S. dollar denominated senior floating rate bank loans. The Credit Suisse Leveraged Loan Index is a composite index of U.S. dollar denominated senior loan returns representing an unleveraged investment in senior loans that is broadly based across the spectrum of senior floating rate loans and includes reinvestment of income (to represent
3 OPPENHEIMER MASTER LOAN FUND, LLC
real assets). The indices are unmanaged and cannot be purchased directly by investors. While index comparisons may be useful to provide a benchmark for the Fund’s performance, it must be noted that the Fund’s investments are not limited to the investments comprising the indices. Index performance includes reinvestment of income, but does not reflect transaction costs, fees, expenses or taxes. Index performance is shown for illustrative purposes only as a benchmark for the Fund’s performance, and does not predict or depict performance of the Fund. The Fund’s performance reflects the effects of the Fund’s business and operating expenses.
The views in the Fund Performance Discussion represent the opinions of this Fund’s portfolio manager(s) and are not intended as investment advice or to predict or depict the performance of any investment. These views are as of the close of business on September 30, 2018, and are subject to change based on subsequent developments. The Fund’s portfolio and strategies are subject to change.
Shares of Oppenheimer Master Loan Fund, LLC are issued solely in private placement transactions that do not involve any “public offering” within the meaning of Section 4(a)(2) of the Securities Act of 1933 (the “Securities Act”), as amended. Investments in the Fund may only be made by certain “accredited investors” within the meaning of Regulation D under the Securities Act, including other investment companies. This report does not constitute an offer to sell, or the solicitation of an offer to buy, any “security” within the meaning of the Securities Act.
Shares of Oppenheimer funds are not deposits or obligations of any bank, are not guaranteed by any bank, are not insured by the FDIC or any other agency, and involve investment risks, including the possible loss of the principal amount invested.
4 OPPENHEIMER MASTER LOAN FUND, LLC
MARKET OVERVIEW
COMPARISON OF CHANGE IN VALUE OF $10,000 HYPOTHETICAL INVESTMENTS IN:
5 OPPENHEIMER MASTER LOAN FUND, LLC
6 OPPENHEIMER MASTER LOAN FUND, LLC
7 OPPENHEIMER MASTER LOAN FUND, LLC
Fund Expenses. As a shareholder of the Fund, you incur two types of costs: (1) transaction costs, which may include sales charges (loads) on purchase payments and/or contingent deferred sales charges on redemptions; and (2) ongoing costs, including management fees; distribution and service fees; and other Fund expenses. These examples are intended to help you understand your ongoing costs (in dollars) of investing in the Fund and to compare these costs with the ongoing costs of investing in other mutual funds.
The examples are based on an investment of $1,000.00 invested at the beginning of the period and held for the entire 6-month period ended September 30, 2018.
Actual Expenses. The first section of the table provides information about actual account values and actual expenses. You may use the information in this section, together with the amount you invested, to estimate the expense that you paid over the period. Simply divide your account value by $1,000.00 (for example, an $8,600.00 account value divided by $1,000.00 = 8.60), then multiply the result by the number in the first section under the heading entitled “Expenses Paid During 6 Months Ended September 30, 2018” to estimate the expenses you paid on your account during this period.
Hypothetical Example for Comparison Purposes. The second section of the table provides information about hypothetical account values and hypothetical expenses based on the Fund’s actual expense ratio, and an assumed rate of return of 5% per year before expenses, which is not the Fund’s actual return. The hypothetical account values and expenses may not be used to estimate the actual ending account balance or expenses you paid for the period. You may use this information to compare the ongoing costs of investing in the Fund and other funds. To do so, compare this 5% hypothetical example with the 5% hypothetical examples that appear in the shareholder reports of the other funds.
Please note that the expenses shown in the table are meant to highlight your ongoing costs only and do not reflect any transactional costs, such as front-end or contingent deferred sales charges (loads). Therefore, the “hypothetical” section of the table is useful in comparing ongoing costs only, and will not help you determine the relative total costs of owning different funds. In addition, if these transactional costs were included, your costs would have been higher.
8 OPPENHEIMER MASTER LOAN FUND, LLC
| Actual | Beginning Account Value April 1, 2018 |
Ending Account Value September 30, 2018 |
Expenses Paid During 6 Months Ended September 30, 2018 | |||||||
| $ | 1,000.00 |
$ |
1,026.90 |
|
1.83 | |||||
| Hypothetical (5% return before expenses) |
||||||||||
| 1,000.00 |
|
1,023.26 |
|
1.83 | ||||||
Expenses are equal to the Fund’s annualized expense ratio, multiplied by the average account value over the period, multiplied by 183/365 (to reflect the one-half year period). The annualized expense ratio, excluding indirect expenses from affiliated funds, based on the 6-month period ended September 30, 2018 is as follows:
| Expense Ratio |
|
0.36% |
The expense ratio reflects voluntary and/or contractual waivers and/or reimbursements of expenses by the Fund’s Manager. Some of these undertakings may be modified or terminated at any time, as indicated in the Fund’s prospectus. The “Financial Highlights” table in the Fund’s financial statements, included in this report, also shows the gross expense ratio, without such waivers or reimbursements and reduction to custodian expenses, if applicable.
9 OPPENHEIMER MASTER LOAN FUND, LLC
STATEMENT OF INVESTMENTS September 30, 2018
| Principal Amount | Value | |||||||
| Corporate Loans—95.2% | ||||||||
| Consumer Discretionary—29.8% | ||||||||
| Auto Components—0.1% | ||||||||
| Tower Automotive Holdings USA LLC, Sr. Sec. Credit Facilities 1st Lien Term Loan, Tranche B, 4.875%,[LIBOR12+275], 3/7/241 | $ | 1,692,185 | $ | 1,702,761 | ||||
| Automobiles—0.8% | ||||||||
| Federal-Mogul Holdings LLC, Sr. Sec. Credit Facilities 1st Lien Term Loan, Tranche C, 5.81%-5.84%,[LIBOR12+375], 4/15/211 | 10,014,807 | 10,039,844 | ||||||
| Distributors—2.3% | ||||||||
| Albertson’s LLC, Sr. Sec. Credit Facilities 1st Lien Term Loan: | ||||||||
| Tranche B4, 4.826%,[LIBOR12+275], 8/25/211 | 726,803 | 728,391 | ||||||
| Tranche B6, 5.311%,[LIBOR4+300], 6/22/231 | 1,973,057 | 1,975,730 | ||||||
| Alphabet Holdings Co., Inc., Sr. Sec. Credit Facilities 1st Lien Term Loan, 5.742%,[LIBOR4+350], 9/26/241 | 3,427,266 | 3,313,309 | ||||||
| Ascena Retail Group, Inc., Sr. Sec. Credit Facilities 1st Lien Term Loan, Tranche B, 6.75%,[LIBOR12+450], 8/21/221 | 1,876,226 | 1,820,333 | ||||||
| Bass Pro Group LLC, Sr. Sec. Credit Facilities 1st Lien Term Loan, Tranche B, 7.242%,[LIBOR12+500], 9/25/241 | 5,448,792 | 5,510,091 | ||||||
| Belk, Inc., Sr. Sec. Credit Facilities 1st Lien Term Loan, Tranche B, 6.813%,[LIBOR4+475], 12/12/221 | 1,245,965 | 1,093,727 | ||||||
| JC Penney Corp., Inc., Sr. Sec. Credit Facilities 1st Lien Term Loan, Tranche B, 6.567%,[LIBOR4+425], 6/23/231 | 1,427,956 | 1,315,121 | ||||||
| Jo-Ann Stores LLC, Sr. Sec. Credit Facilities 1st Lien Term Loan, Tranche B, 7.509%,[LIBOR4+500], 10/20/231 | 498,707 | 501,824 | ||||||
| Michaels Stores, Inc., Sr. Sec. Credit Facilities 1st Lien Term Loan, Tranche B, 4.564%-4.742%,[LIBOR12+250], 1/30/231 | 1,460,078 | 1,453,391 | ||||||
| Party City Holding, Inc., Sr. Sec. Credit Facilities 1st Lien Term Loan, 5.00%,[LIBOR12+275], 8/19/221 | 770,038 | 776,499 | ||||||
| Petco Animal Supplies, Inc., Sr. Sec. Credit Facilities 1st Lien Term Loan, Tranche B1, 5.592%,[LIBOR4+300], 1/26/231 | 4,034,429 | 3,282,533 | ||||||
| PetSmart, Inc., Sr. Sec. Credit Facilities 1st Lien Term Loan, Tranche B, 5.09%,[LIBOR12+300], 3/11/221 | 7,945,387 | 6,954,915 | ||||||
| SUPERVALU, Inc., Sr. Sec. Credit Facilities 1st Lien Term Loan, Tranche B, 5.742%,[LIBOR12+350], 6/8/241 | 2,314,202 | 2,320,474 | ||||||
| 31,046,338 | ||||||||
| Diversified Consumer Services—0.8% | ||||||||
| 4L Technologies, Inc., Sr. Sec. Credit Facilities 1st Lien Term Loan, Tranche B, 6.148%-6.742%,[LIBOR12+450], 5/8/201 | 5,436,956 | 5,337,269 | ||||||
| IQOR US, Inc., Sr. Sec. Credit Facilities 1st Lien Term Loan, Tranche B, 7.337%,[LIBOR4+500], 4/1/211 | 5,208,325 | 4,895,826 | ||||||
| IQOR US, Inc., Sr. Sec. Credit Facilities 2nd Lien Term Loan, 11.087%,[LIBOR4+875], 4/1/221 | 760,036 | 608,789 | ||||||
| 10,841,884 | ||||||||
10 OPPENHEIMER MASTER LOAN FUND, LLC
| Principal Amount | Value | |||||||
| Hotels, Restaurants & Leisure—7.0% | ||||||||
| 24 Hour Fitness Worldwide, Inc., Sr. Sec. Credit Facilities 1st Lien Term Loan, Tranche B, 5.742%,[LIBOR12+350], 5/30/251 | $ | 2,643,375 | $ | 2,664,853 | ||||
| Boyd Gaming Corp., Sr. Sec. Credit Facilities 1st Lien Term Loan, Tranche B, 4.207%,[LIBOR52+250], 9/15/231 | 2,502,257 | 2,518,322 | ||||||
| Caesars Growth Properties Holdings LLC, Sr. Sec. Credit Facilities 1st Lien Term Loan, 4.826%,[LIBOR4+275], 12/23/241 | 19,217,169 | 19,344,002 | ||||||
| CDS US Intermediate Holdings, Inc., Sr. Sec. Credit Facilities 1st Lien Term Loan, Tranche B, 5.826%-6.09%,[LIBOR4+375], 7/8/221 | 1,376,515 | 1,356,900 | ||||||
| CEOC LLC, Sr. Sec. Credit Facilities 1st Lien Exit Term Loan, Tranche B, 4.076%,[LIBOR12+200], 10/7/241 | 3,477,330 | 3,480,059 | ||||||
| Churchill Downs, Inc., Sr. Sec. Credit Facilities 1st Lien Term Loan, Tranche B, 4.08%,[LIBOR12+200], 12/27/241 | 1,354,763 | 1,359,423 | ||||||
| CityCenter Holdings LLC, Sr. Sec. Credit Facilities 1st Lien Term Loan, Tranche B, 4.492%,[LIBOR12+225], 4/18/241 | 4,546,505 | 4,557,507 | ||||||
| Delta 2 Lux Sarl, Sr. Sec. Credit Facilities 1st Lien Term Loan, Tranche B3, 4.742%,[LIBOR12+250], 2/1/241 | 6,413,031 | 6,370,961 | ||||||
| Eldorado Resorts, Inc., Sr. Sec. Credit Facilities 1st Lien Term Loan, Tranche B, 4.375%-4.438%,[LIBOR4+225], 4/17/241 | 3,240,617 | 3,260,207 | ||||||
| Everi Payments, Inc., Sr. Sec. Credit Facilities 1st Lien Term Loan, Tranche B, 5.242%,[LIBOR12+300], 5/9/241 | 3,993,380 | 4,021,833 | ||||||
| Fitness & Sports Clubs LLC, Sr. Sec. Credit Facilities 1st Lien Term Loan, Tranche B, 5.326%-5.753%,[LIBOR4+325], 4/18/251 | 334,163 | 335,290 | ||||||
| Four Seasons Hotels Ltd., Sr. Sec. Credit Facilities 1st Lien Term Loan, 4.242%,[LIBOR12+200], 11/30/231 | 1,188,825 | 1,191,244 | ||||||
| Gateway Casinos & Entertainment Ltd., Sr. Sec. Credit Facilities 1st Lien Term Loan, Tranche B, 5.386%,[LIBOR4+300], 12/1/231 | 842,888 | 848,552 | ||||||
| GVC Holdings plc, Sr. Sec. Credit Facilities 1st Lien Term Loan, Tranche B2, 4.576%,[LIBOR4+275], 3/29/241 | 2,601,925 | 2,616,015 | ||||||
| LTI Holdings, Inc., Sr. Sec. Credit Facilities 1st Lien Term Loan, 5.742%,[LIBOR12+350], 9/6/251 | 1,990,000 | 2,000,368 | ||||||
| Penn National Gaming, Inc., Sr. Sec. Credit Facilities 1st Lien Term Loan, Tranche B, 4.742%,[LIBOR12+250], 1/19/241 | 450,450 | 453,337 | ||||||
| Scientific Games International, Inc., Sr. Sec. Credit Facilities 1st Lien Term Loan, Tranche B5, 4.449%-5.044%,[LIBOR6+275], 8/14/241 | 8,099,406 | 8,096,248 | ||||||
| Stars Group Holdings BV, Sr. Sec. Credit Facilities 1st Lien Term Loan, Tranche B, 5.896%,[LIBOR4+350], 7/10/251 | 10,398,938 | 10,508,802 | ||||||
| Station Casinos LLC, Sr. Sec. Credit Facilities 1st Lien Term Loan, Tranche B, 4.75%,[LIBOR12+250], 6/8/231 | 5,704,866 | 5,735,016 | ||||||
| Town Sports International LLC, Sr. Sec. Credit Facilities 1st Lien Term Loan, Tranche B, 5.742%,[LIBOR12+350], 11/15/201 | 2,149,678 | 2,125,505 | ||||||
| Weight Watchers International, Inc., Sr. Sec. Credit Facilities 1st Lien Term Loan, Tranche B, 6.86%-7.09%,[LIBOR12+475], 11/29/241 | 10,037,352 | 10,171,200 | ||||||
11 OPPENHEIMER MASTER LOAN FUND, LLC
STATEMENT OF INVESTMENTS Continued
| Principal Amount | Value | |||||||
| Hotels, Restaurants & Leisure (Continued) | ||||||||
| Wyndham Hotels & Resorts, Inc., Sr. Sec. Credit Facilities 1st Lien Term Loan, Tranche B, 3.992%,[LIBOR4+200], 5/30/251 | $ | 1,255,000 | $ | 1,259,970 | ||||
| 94,275,614 | ||||||||
| Household Durables—2.5% | ||||||||
| ABG Intermediate Holdings 2 LLC, Sr. Sec. Credit Facilities 1st Lien Term Loan, 5.576%,[LIBOR4+350], 9/27/241 | 1,155,512 | 1,161,000 | ||||||
| American Greetings Corp., Sr. Sec. Credit Facilities 1st Lien Term Loan, Tranche B, 6.742%,[LIBOR12+450], 4/6/241 | 2,329,163 | 2,341,542 | ||||||
| Anastasia Parent LLC, Sr. Sec. Credit Facilities 1st Lien Term Loan, Tranche B, 6.092%,[LIBOR12+375], 8/11/251 | 1,175,000 | 1,168,878 | ||||||
| Coty, Inc., Sr. Sec. Credit Facilities 1st Lien Term Loan, Tranche B, 4.333%,[LIBOR4+225], 4/7/251 | 4,513,688 | 4,477,036 | ||||||
| HLF Financing Sarl, Sr. Sec. Credit Facilities 1st Lien Term Loan, Tranche B, 5.326%,[LIBOR12+325], 8/9/251 | 1,670,000 | 1,687,042 | ||||||
| International Textile Group, Inc., Sr. Sec. Credit Facilities 1st Lien Term Loan, 7.081%,[LIBOR4+500], 5/1/241 | 1,709,250 | 1,715,660 | ||||||
| Lifetime Brands, Inc., Sr. Sec. Credit Facilities 1st Lien Term Loan, Tranche B, 5.742%,[LIBOR12+350], 2/28/251 | 815,900 | 818,707 | ||||||
| Revlon Consumer Products Corp., Sr. Sec. Credit Facilities 1st Lien Term Loan, Tranche B, 5.886%,[LIBOR12+350], 9/7/231 | 6,373,006 | 4,880,926 | ||||||
| Rodan & Fields LLC, Sr. Sec. Credit Facilities 1st Lien Term Loan, Tranche B, 6.063%,[LIBOR12+400], 6/16/251 | 3,510,000 | 3,548,768 | ||||||
| Serta Simmons Bedding LLC, Sr. Sec. Credit Facilities 1st Lien Term Loan, Tranche B, 5.571%-5.581%,[LIBOR4+350], 11/8/231 | 11,244,149 | 10,211,149 | ||||||
| SIWF Holdings, Inc., Sr. Sec. Credit Facilities 1st Lien Term Loan, 6.314%,[LIBOR12+425], 6/15/251 | 2,079,788 | 2,100,586 | ||||||
| 34,111,294 | ||||||||
| Media—16.0% | ||||||||
| Acosta, Inc., Sr. Sec. Credit Facilities 1st Lien Term Loan, Tranche B, 5.492%,[LIBOR4+325], 9/26/211 | 389,960 | 292,226 | ||||||
| Advantage Sales & Marketing, Inc., Sr. Sec. Credit Facilities 1st Lien Term Loan, Tranche B, 5.492%,[LIBOR4+325], 7/23/211 | 883,101 | 819,959 | ||||||
| Altice Financing SA, Sr. Sec. Credit Facilities 1st Lien Term Loan: | ||||||||
| Tranche B, 4.814%,[LIBOR4+275], 7/15/251 | 3,767,313 | 3,703,268 | ||||||
| Tranche B13, 6.083%,[LIBOR4+400], 8/14/261 | 4,230,000 | 4,205,826 | ||||||
| Camelot Finance LP, Sr. Sec. Credit Facilities 1st Lien Term Loan, Tranche B, 5.492%,[LIBOR12+325], 10/3/231 | 1,850,387 | 1,854,245 | ||||||
| CBS Radio, Inc., Sr. Sec. Credit Facilities 1st Lien Term Loan, Tranche B1, 4.831%,[LIBOR4+275], 11/18/241 | 3,442,657 | 3,420,211 | ||||||
| Checkout Holdings, Inc., Sr. Sec. Credit Facilities 1st Lien Term Loan, Tranche B, 5.577%,[LIBOR12+350], 4/9/211 | 7,854,713 | 3,308,837 | ||||||
| Clear Channel Communications, Inc., Extended Sr. Sec. Credit Facilities 1st Lien Term Loan, Tranche D, 8.827%,[LIBOR4+675], 1/30/191,2 | 40,961,428 | 30,877,953 | ||||||
12 OPPENHEIMER MASTER LOAN FUND, LLC
| Principal Amount | Value | |||||||
| Media (Continued) | ||||||||
| Clear Channel Communications, Inc., Sr. Sec. Credit Facilities 1st Lien Term Loan, Tranche E, 9.577%,[LIBOR4+750], 7/30/191,2 | $ | 4,206,170 | $ | 3,162,514 | ||||
| CSC Holdings LLC, Sr. Sec. Credit Facilities 1st Lien Term Loan: | ||||||||
| Tranche B, 4.314%,[LIBOR12+225], 7/17/251 | 4,879,616 | 4,887,741 | ||||||
| Tranche B, 4.564%,[LIBOR4+250], 1/25/261 | 618,450 | 621,672 | ||||||
| Deluxe Entertainment Services Group, Inc., Sr. Sec. Credit Facilities 1st Lien Term Loan, Tranche B, 7.842%,[LIBOR4+550], 2/28/201 | 3,932,383 | 3,617,793 | ||||||
| Endemol, Sr. Sec. Credit Facilities 1st Lien Term Loan, 8.087%,[LIBOR4+575], 8/13/211 | 65 | 65 | ||||||
| Getty Images, Inc., Sr. Sec. Credit Facilities 1st Lien Term Loan, Tranche B, 5.742%,[LIBOR4+350], 10/18/191 | 1,856,979 | 1,846,645 | ||||||
| Harland Clarke Holdings Corp., Sr. Sec. Credit Facilities 1st Lien Term Loan, Tranche B7, 7.084%,[LIBOR4+475], 11/3/231 | 4,575,753 | 4,407,022 | ||||||
| Intelsat Jackson Holdings SA, Sr. Sec. Credit Facilities 1st Lien Term Loan: | ||||||||
| Tranche B3, 5.827%,[LIBOR4+375], 11/27/231 | 5,020,000 | 5,045,778 | ||||||
| Tranche B4, 6.577%,[LIBOR4+450], 1/2/241 | 905,000 | 953,648 | ||||||
| ION Media Networks, Inc., Sr. Sec. Credit Facilities 1st Lien Term Loan, Tranche B, 5.05%,[LIBOR6+275], 12/18/201 | 5,510,654 | 5,543,938 | ||||||
| Liberty Cablevision of Puerto Rico LLC, Sr. Sec. Credit Facilities 1st Lien Term Loan, 5.839%,[LIBOR4+350], 1/7/221 | 4,979,094 | 4,904,433 | ||||||
| MacDonald Dettwiler & Associates Ltd., Sr. Sec. Credit Facilities 1st Lien Term Loan, Tranche B, 5.148%,[LIBOR4+250], 10/4/241 | 3,320,965 | 3,273,907 | ||||||
| MediArena Acquisition BV, Sr. Sec. Credit Facilities 1st Lien Term Loan, 8.087%,[LIBOR4+575], 8/13/211 | 4,985,698 | 5,001,278 | ||||||
| Meredith Corp., Sr. Sec. Credit Facilities 1st Lien Term Loan, Tranche B, 5.242%,[LIBOR6+300], 1/31/251 | 2,362,226 | 2,379,293 | ||||||
| Metro-Goldwyn-Mayer, Inc., Sr. Sec. Credit Facilities 2st Lien Term Loan, Tranche B, 6.75%,[LIBOR4+450], 7/3/261 | 1,790,000 | 1,796,721 | ||||||
| Mission Broadcasting, Inc., Sr. Sec. Credit Facilities 1st Lien Term Loan, Tranche B, 4.582%,[LIBOR12+250], 1/17/241 | 1,138,895 | 1,145,301 | ||||||
| Monarchy Enterprises Holdings BV, Sr. Sec. Credit Facilities 1st Lien Term Loan, 8.577%,[LIBOR4+650], 10/13/221,3 | 11,700,000 | 11,641,500 | ||||||
| NEP/NCP Holdco, Inc., Sr. Sec. Credit Facilities 1st Lien Term Loan, Tranche B, 5.492%,[LIBOR12+325], 7/21/221 | 4,847,737 | 4,858,838 | ||||||
| Nexstar Broadcasting, Inc., Sr. Sec. Credit Facilities 1st Lien Term Loan, Tranche B, 4.582%,[LIBOR12+250], 1/17/241 | 8,120,600 | 8,166,278 | ||||||
| Radiate Holdco LLC, Sr. Sec. Credit Facilities 1st Lien Term Loan, 5.242%,[LIBOR12+300], 2/1/241 | 8,601,796 | 8,599,560 | ||||||
| Red Ventures LLC, Sr. Sec. Credit Facilities 1st Lien Term Loan, Tranche B, 6.242%,[LIBOR4+400], 11/8/241 | 4,096,858 | 4,150,629 | ||||||
| Sable International Finance Ltd., Sr. Sec. Credit Facilities 1st Lien Term Loan, Tranche B4, 5.492%,[LIBOR12+325], 1/30/261 | 3,120,000 | 3,136,895 | ||||||
| SFR Group SA, Sr. Sec. Credit Facilities 1st Lien Term Loan: | ||||||||
| Tranche B, 4.825%,[LIBOR4+275], 7/31/251 | 1,410,321 | 1,380,352 | ||||||
| Tranche B12, 5.751%,[LIBOR4+300], 1/31/261 | 6,240,989 | 6,180,264 | ||||||
13 OPPENHEIMER MASTER LOAN FUND, LLC
STATEMENT OF INVESTMENTS Continued
| Principal Amount | Value | |||||||
| Media (Continued) | ||||||||
| Sinclair Television Group, Inc., Sr. Sec. Credit Facilities 1st Lien Term Loan, Tranche B2, 4.25%,[LIBOR12+225], 1/3/241 | $ | 7,159,381 | $ | 7,192,207 | ||||
| SpeedCast International Ltd., Sr. Sec. Credit Facilities 1st Lien Term Loan: | ||||||||
| Tranche B, 4.886%,[LIBOR4+250], 5/3/251 | 2,204,475 | 2,190,697 | ||||||
| Tranche B, 5.065%,[LIBOR4+275], 5/15/251 | 620,000 | 616,125 | ||||||
| Technicolor SA, Sr. Sec. Credit Facilities 1st Lien Term Loan, Tranche B, 5.063%,[LIBOR4+275], 12/6/231 | 2,107,900 | 2,018,314 | ||||||
| Telenet Financing USD LLC, Sr. Sec. Credit Facilities 1st Lien Term Loan, Tranche B, 4.313%,[LIBOR12+225], 8/15/261 | 4,955,000 | 4,940,680 | ||||||
| Tribune Media Co., Sr. Sec. Credit Facilities 1st Lien Term Loan, Tranche B, 5.076%,[LIBOR12+300], 1/26/241 | 6,059,832 | 6,086,344 | ||||||
| Unitymedia Finance LLC, Sr. Sec. Credit Facilities 1st Lien Term Loan, Tranche D, 4.313%,[LIBOR4+225], 1/15/261 | 1,395,000 | 1,397,706 | ||||||
| Univision Communications, Inc., Sr. Sec. Credit Facilities 1st Lien Term Loan, Tranche C5, 4.992%,[LIBOR12+275], 3/15/241 | 14,304,972 | 13,938,407 | ||||||
| UPC Financing Partnership, Sr. Sec. Credit Facilities 1st Lien Term Loan, Tranche AR, 4.563%,[LIBOR4+250], 1/15/261 | 5,732,096 | 5,734,618 | ||||||
| Virgin Media Bristol LLC, Sr. Sec. Credit Facilities 1st Lien Term Loan, Tranche K, 4.563%,[LIBOR12+250], 1/15/261 | 7,565,000 | 7,586,069 | ||||||
| WideOpenWest Finance LLC, Sr. Sec. Credit Facilities 1st Lien Term Loan, Tranche B, 5.31%,[LIBOR12+325], 8/18/231 | 7,170,063 | 7,049,068 | ||||||
| William Morris Endeavor Entertainment LLC, Sr. Sec. Credit Facilities 1st Lien Term Loan, Tranche B1, 5.00%,[LIBOR6+275], 5/18/251 | 1,969,349 | 1,968,739 | ||||||
| WMG Acquisition Corp., Sr. Sec. Credit Facilities 1st Lien Term Loan, 4.367%,[LIBOR12+212.5], 11/1/231 | 2,849,912 | 2,850,311 | ||||||
| Ziggo Secured Finance Partnership, Sr. Sec. Credit Facilities 1st Lien Term Loan, Tranche E, 4.563%,[LIBOR12+250], 4/15/251 | 7,800,000 | 7,668,375 | ||||||
| 216,422,250 | ||||||||
| Multiline Retail—0.3% | ||||||||
| Neiman Marcus Group Ltd. LLC, Sr. Sec. Credit Facilities 1st Lien Term Loan, 5.33%,[LIBOR12+325], 10/25/201 | 4,806,242 | 4,475,284 | ||||||
| Consumer Staples—3.4% | ||||||||
| Beverages—3.4% | ||||||||
| 1011778 BC ULC, Sr. Sec. Credit Facilities 1st Lien Term Loan, Tranche B, 4.492%,[LIBOR12+225], 2/16/241 | 7,891,809 | 7,905,619 | ||||||
| Dole Food Co., Inc., Sr. Sec. Credit Facilities 1st Lien Term Loan, Tranche B, 4.815%-6.75%,[LIBOR12+275], 4/6/241 | 4,242,877 | 4,248,562 | ||||||
| Golden Nugget, Inc., Sr. Sec. Credit Facilities 1st Lien Term Loan, 4.817%-4.992%,[LIBOR12+275], 10/4/231 | 9,366,025 | 9,412,855 | ||||||
| Hearthside Group Holdings LLC, Sr. Sec. Credit Facilities 1st Lien Term Loan, 5.242%,[LIBOR12+300], 5/17/251 | 4,408,950 | 4,400,287 | ||||||
| Hostess Brands LLC, Sr. Sec. Credit Facilities 1st Lien Term Loan, 4.492%,[LIBOR12+225], 8/3/221 | 2,554,505 | 2,559,691 | ||||||
| IRB Holding Corp., Sr. Sec. Credit Facilities 1st Lien Term Loan, 5.293%-5.321%,[LIBOR12+325], 2/5/251 | 1,815,875 | 1,820,424 | ||||||
14 OPPENHEIMER MASTER LOAN FUND, LLC
| Principal Amount | Value | |||||||
| Beverages (Continued) | ||||||||
| JBS USA LUX SA, Sr. Sec. Credit Facilities 1st Lien Term Loan, Tranche B, 4.886%,[LIBOR4+250], 10/30/221 | $ | 1,676,490 | $ | 1,682,659 | ||||
| KFC Holding Co., Sr. Sec. Credit Facilities 1st Lien Term Loan, Tranche B, 3.829%,[LIBOR12+175], 4/3/251 | 1,245,438 | 1,248,558 | ||||||
| Mastronardi Produce Ltd., Sr. Sec. Credit Facilities 1st Lien Term Loan, Tranche B, 5.332%,[LIBOR12+325], 5/1/251 | 678,300 | 684,235 | ||||||
| Nomad Foods Europe Midco Ltd., Sr. Sec. Credit Facilities 1st Lien Term Loan, 4.313%,[LIBOR12+225], 5/15/241 | 3,975,760 | 3,968,922 | ||||||
| NPC International, Inc., Sr. Sec. Credit Facilities 1st Lien Term Loan, 5.756%,[LIBOR12+350], 4/19/241 | 1,095,824 | 1,102,125 | ||||||
| Sigma US Corp., Sr. Sec. Credit Facilities 1st Lien Term Loan, Tranche B, 5.081%,[LIBOR4+325], 7/2/251 | 4,345,000 | 4,354,689 | ||||||
| Sunshine Investments BV, Sr. Sec. Credit Facilities 1st Lien Term Loan, Tranche B3, 5.564%,[LIBOR4+325], 3/28/251 | 1,585,000 | 1,585,000 | ||||||
| Tacala Investment Corp., Sr. Sec. Credit Facilities 1st Lien Term Loan, 5.492%,[LIBOR4+325], 1/31/251 | 1,134,300 | 1,141,389 | ||||||
| 46,115,015 | ||||||||
| Energy—4.7% | ||||||||
| Energy Equipment & Services—4.2% | ||||||||
| AL Midcoast Holdings LLC, Sr. Sec. Credit Facilities 1st Lien Term Loan, Tranche B, 7.826%,[LIBOR4+550], 8/1/251 | 2,425,000 | 2,434,858 | ||||||
| Ascent Resources - Marcellus LLC, Sr. Sec. Credit Facilities 1st Lien Term Loan, 8.58%,[LIBOR12+650], 3/30/231 | 843,555 | 847,419 | ||||||
| BCP Renaissance Parent LLC, Sr. Sec. Credit Facilities 1st Lien Term Loan, Tranche B, 5.842%,[LIBOR4+350], 10/31/241 | 4,530,000 | 4,564,292 | ||||||
| Bison Midstream Holdings LLC, Sr. Sec. Credit Facilities 1st Lien Term Loan, Tranche B, 6.086%,[LIBOR12+400], 5/21/251 | 2,523,675 | 2,515,788 | ||||||
| California Resources Corp., Sr. Sec. Credit Facilities 1st Lien Term Loan, 12.44%,[LIBOR12+1,037.5], 12/31/211 | 1,815,000 | 2,019,187 | ||||||
| California Resources Corp., Sr. Sec. Credit Facilities 1st Lien Term Loan, 6.831%,[LIBOR12+475], 12/31/221 | 1,925,000 | 1,962,691 | ||||||
| Drillship Kithira Owners, Inc., Sr. Sec. Credit Facilities 1st Lien Exit Term Loan, 8.00%, 9/20/24 | 4,359,511 | 4,592,200 | ||||||
| Eastern Power LLC, Sr. Sec. Credit Facilities 1st Lien Term Loan, Tranche B, 5.826%,[LIBOR12+375], 10/2/231 | 4,533,976 | 4,533,206 | ||||||
| Fieldwood Energy LLC, Sr. Sec. Credit Facilities 1st Lien Term Loan, 7.492%,[LIBOR12+525], 4/11/221 | 5,363,091 | 5,407,336 | ||||||
| Floatel International Ltd., Sr. Sec. Credit Facilities 1st Lien Term Loan, Tranche B, 7.334%,[LIBOR4+500], 6/27/201 | 1,051,015 | 1,036,564 | ||||||
| GIP III Stetson I LP, Sr. Sec. Credit Facilities 1st Lien Term Loan, Tranche B, 6.598%,[LIBOR4+425], 7/18/251 | 2,035,000 | 2,049,632 | ||||||
| Gulf Finance LLC, Sr. Sec. Credit Facilities 1st Lien Term Loan, Tranche B, 7.64%,[LIBOR4+525], 8/25/231 | 294,804 | 248,794 | ||||||
| HFOTCO LLC, Sr. Sec. Credit Facilities 1st Lien Term Loan, Tranche B, 5.00%,[LIBOR4+275], 6/26/251 | 1,341,638 | 1,346,669 | ||||||
| HGIM Corp., Sr. Sec. Credit Facilities 1st Lien Term Loan, Tranche B, 10.00%,[PRIME4+500], 7/2/231 | 960,901 | 968,506 | ||||||
| Larchmont Resources LLC, Sr. Sec. Credit Facilities 1st Lien Term Loan, Tranche A, 11.321%,[LIBOR4+1,032], 8/7/201,3 | 123,400 | 122,166 | ||||||
15 OPPENHEIMER MASTER LOAN FUND, LLC
STATEMENT OF INVESTMENTS Continued
| Principal Amount | Value | |||||||
| Energy Equipment & Services (Continued) | ||||||||
| Limetree Bay Terminals LLC, Sr. Sec. Credit Facilities 1st Lien Term Loan, 6.242%,[LIBOR12+400], 2/15/241 | $ | 3,147,080 | $ | 3,084,154 | ||||
| Lucid Energy Group II Borrower LLC, Sr. Sec. Credit Facilities 1st Lien Term Loan, 5.079%,[LIBOR12+300], 2/17/251 | 949,040 | 937,771 | ||||||
| McDermott Technology Americas, Inc., Sr. Sec. Credit Facilities 1st Lien Term Loan, Tranche B, 7.242%,[LIBOR12+500], 5/12/251 | 3,171,082 | 3,217,983 | ||||||
| Northriver Midstream Finance LP, Sr. Sec. Credit Facilities 1st Lien Term Loan, Tranche B, 5.567%,[LIBOR4+325], 9/21/251 | 2,274,000 | 2,286,086 | ||||||
| Seadrill Operating LP, Sr. Sec. Credit Facilities 1st Lien Term Loan, Tranche B, 8.386%,[LIBOR4+600], 2/21/211 | 6,501,280 | 6,182,717 | ||||||
| Sheridan Production Partners II-A LP, Sr. Sec. Credit Facilities 1st Lien Term Loan, Tranche B, 4.56%-5.82%,[LIBOR4+350], 12/16/201 | 513,374 | 468,882 | ||||||
| Sheridan Production Partners II-M LP, Sr. Sec. Credit Facilities 1st Lien Term Loan, Tranche B, 4.56%-5.82%,[LIBOR4+350], 12/16/201 | 189,940 | 173,479 | ||||||
| Traverse Midstream Partners LLC, Sr. Sec. Credit Facilities 1st Lien Term Loan, 6.34%,[LIBOR4+400], 9/27/241 | 2,388,393 | 2,409,542 | ||||||
| Ultra Resources, Inc., Sr. Sec. Credit Facilities 1st Lien Exit Term Loan, 5.079%,[LIBOR4+300], 4/12/241 | 3,580,000 | 3,236,177 | ||||||
| 56,646,099 | ||||||||
| Oil, Gas & Consumable Fuels—0.5% | ||||||||
| Sheridan Investment Partners II LP, Sr. Sec. Credit Facilities 1st Lien Term Loan, Tranche B, 5.82%,[LIBOR4+350], 12/16/201 | 3,355,750 | 3,064,924 | ||||||
| Sheridan Investment Partners II-A LLC, Sr. Sec. Credit Facilities 1st Lien Term Loan, Tranche B, 4.56%,[LIBOR4+350], 12/16/201 | 330,487 | 301,845 | ||||||
| Southcross Energy Partners LP, Sr. Sec. Credit Facilities 1st Lien Term Loan, Tranche B, 6.636%,[LIBOR4+425], 8/4/211 | 3,933,607 | 3,645,962 | ||||||
| 7,012,731 | ||||||||
| Financials—6.5% | ||||||||
| Capital Markets—0.8% | ||||||||
| Aretec Group, Inc., Sr. Sec. Credit Facilities 1st Lien Exit Term Loan, 8.25%,[LIBOR12+425], 11/23/201 | 3,011,044 | 3,016,690 | ||||||
| Aretec Group, Inc., Sr. Sec. Credit Facilities 2nd Lien Term Loan, 9.576%,[LIBOR12+450], 5/23/211,5 | 8,124,702 | 8,175,481 | ||||||
| 11,192,171 | ||||||||
| Commercial Banks—4.7% | ||||||||
| Acrisure LLC, Sr. Sec. Credit Facilities 1st Lien Term Loan, Tranche B, 6.086%-6.609%,[LIBOR4+375], 11/22/231 | 5,799,137 | 5,826,429 | ||||||
| Advisor Group, Inc., Sr. Sec. Credit Facilities 1st Lien Term Loan, 6.085%,[LIBOR12+375], 8/9/251 | 635,000 | 640,556 | ||||||
| Alliant Holdings Intermediate LLC, Sr. Sec. Credit Facilities 1st Lien Term Loan, Tranche B, 5.067%,[LIBOR12+300], 5/9/251 | 3,734,990 | 3,751,051 | ||||||
| AmWINS Group, Inc., Sr. Sec. Credit Facilities 1st Lien Term Loan, 4.83%-4.992%,[LIBOR12+275], 1/25/241 | 3,123,057 | 3,139,000 | ||||||
16 OPPENHEIMER MASTER LOAN FUND, LLC
| Principal Amount | Value | |||||||
| Commercial Banks (Continued) | ||||||||
| Aretec Group, Inc., Sr. Sec. Credit Facilities 1st Lien Term Loan, 6.593%,[LIBOR4+425], 10/1/251 | $ | 6,665,000 | $ | 6,731,650 | ||||
| DTZ US Borrower LLC, Sr. Sec. Credit Facilities 1st Lien Term Loan, Tranche B, 5.492%,[LIBOR12+325], 8/21/251 | 3,980,000 | 4,002,387 | ||||||
| GGP Nimbus LP, Sr. Sec. Credit Facilities 1st Lien Term Loan, Tranche B, 4.742%,[LIBOR12+250], 8/27/251 | 5,310,000 | 5,292,849 | ||||||
| HUB International Ltd., Sr. Sec. Credit Facilities 1st Lien Term Loan, Tranche B, 5.335%,[LIBOR4+300], 4/25/251 | 5,132,138 | 5,148,766 | ||||||
| Hyperion Insurance Group Ltd., Sr. Sec. Credit Facilities 1st Lien Term Loan, Tranche B, 5.75%,[LIBOR12+350], 12/20/241 | 2,654,264 | 2,674,729 | ||||||
| iStar, Inc., Sr. Sec. Credit Facilities 1st Lien Term Loan: | ||||||||
| Tranche B, 4.832%,[LIBOR4+300], 10/1/211 | 1,246,010 | 1,247,960 | ||||||
| Tranche B, 4.83%,[LIBOR4+300], 6/28/231 | 1,239,780 | 1,241,722 | ||||||
| Jane Street Group LLC, Sr. Sec. Credit Facilities 1st Lien Term Loan, Tranche B, 5.374%-5.992%,[LIBOR12+300], 8/25/221 | 849,449 | 854,367 | ||||||
| Mayfield Agency Borrower, Inc., Sr. Sec. Credit Facilities 1st Lien Term Loan, 6.742%,[LIBOR4+450], 2/28/251 | 1,705,725 | 1,718,518 | ||||||
| NFP Corp., Sr. Sec. Credit Facilities 1st Lien Term Loan, Tranche B, 5.242%,[LIBOR12+300], 1/8/241 | 4,286,709 | 4,291,531 | ||||||
| Uniti Group, Inc., Sr. Sec. Credit Facilities 1st Lien Term Loan, 5.242%,[LIBOR12+300], 10/24/221 | 10,413,259 | 9,979,807 | ||||||
| USI, Inc., Sr. Sec. Credit Facilities 1st Lien Term Loan, Tranche B, 5.386%,[LIBOR4+300], 5/16/241 | 6,347,628 | 6,357,943 | ||||||
| 62,899,265 | ||||||||
| Consumer Finance—0.2% | ||||||||
| PGX Holdings, Inc., Sr. Sec. Credit Facilities 1st Lien Term Loan, 7.50%,[LIBOR12+525], 9/29/201 | 2,284,809 | 2,237,685 | ||||||
| PGX Holdings, Inc., Sr. Sec. Credit Facilities 2nd Lien Term Loan, 11.09%,[LIBOR12+900], 9/29/211,3 | 764,742 | 730,328 | ||||||
| 2,968,013 | ||||||||
| Insurance—0.8% | ||||||||
| AssuredPartners, Inc., Sr. Sec. Credit Facilities 1st Lien Term Loan, Tranche B, 5.327%,[LIBOR12+325], 10/22/241 | 4,472,525 | 4,489,297 | ||||||
| Sedgwick Claims Management Services, Inc., Sr. Sec. Credit Facilities 1st Lien Term Loan, 4.992%,[LIBOR4+275], 3/1/211 | 5,789,766 | 5,799,290 | ||||||
| 10,288,587 | ||||||||
| Health Care—8.5% | ||||||||
| Health Care Equipment & Supplies—8.5% | ||||||||
| 21st Century Oncology, Inc., Sr. Sec. Credit Facilities 1st Lien Exit Term Loan, Tranche B, 8.465%,[LIBOR4+612.5], 1/16/231 | 1,060,806 | 1,003,257 | ||||||
| Acadia Healthcare Co., Inc., Sr. Sec. Credit Facilities 1st Lien Term Loan: | ||||||||
| Tranche B, 4.742%,[LIBOR12+250], 2/11/221 | 258,531 | 260,653 | ||||||
| Tranche B4, 4.576%,[LIBOR12+250], 2/16/231 | 1,825,548 | 1,840,527 | ||||||
| Air Medical Group Holdings, Inc., Sr. Sec. Credit Facilities 1st Lien Term Loan, Tranche B, 5.321%,[LIBOR12+325], 4/28/221 | 236,772 | 233,432 | ||||||
| Akorn, Inc., Sr. Sec. Credit Facilities 1st Lien Term Loan, Tranche B, 7.00%,[LIBOR12+425], 4/16/211 | 1,049,862 | 1,019,678 | ||||||
17 OPPENHEIMER MASTER LOAN FUND, LLC
STATEMENT OF INVESTMENTS Continued
| Principal Amount | Value | |||||||
| Health Care Equipment & Supplies (Continued) | ||||||||
| Alliance HealthCare Services, Inc., Sr. Sec. Credit Facilities 1st Lien Term Loan, 6.742%,[LIBOR4+450], 10/24/231 | $ | 1,834,938 | $ | 1,852,140 | ||||
| Amneal Pharmaceuticals LLC, Sr. Sec. Credit Facilities 1st Lien Term Loan, Tranche B, 5.625%,[LIBOR4+300], 5/4/251 | 4,438,182 | 4,485,338 | ||||||
| Ardent Health Partners LLC, Sr. Sec. Credit Facilities 1st Lien Term Loan, Tranche B, 6.742%,[LIBOR12+450], 6/30/251 | 3,586,013 | 3,627,843 | ||||||
| ASP AMC Merger Sub, Inc., Sr. Sec. Credit Facilities 1st Lien Term Loan, 5.886%,[LIBOR4+350], 4/22/241 | 156,675 | 143,235 | ||||||
| Bausch Health Cos., Inc., Sr. Sec. Credit Facilities 1st Lien Term Loan, Tranche B, 5.081%,[LIBOR4+300], 6/2/251 | 3,264,905 | 3,285,164 | ||||||
| Carestream Health, Inc., Sr. Sec. Credit Facilities 1st Lien Term Loan, Tranche B, 6.242%,[LIBOR4+400], 6/7/191 | 986,883 | 987,702 | ||||||
| Change Healthcare Holdings LLC, Sr. Sec. Credit Facilities 1st Lien Term Loan, Tranche B, 4.826%,[LIBOR12+275], 3/1/241 | 11,124,750 | 11,174,311 | ||||||
| CHS/Community Health Systems, Inc., Sr. Sec. Credit Facilities 1st Lien Term Loan, Tranche H, 5.563%,[LIBOR4+300], 1/27/211 | 5,127,824 | 5,072,366 | ||||||
| Concentra, Inc., Sr. Sec. Credit Facilities 1st Lien Term Loan, 4.84%,[LIBOR4+275], 6/1/221 | 1,140,000 | 1,149,262 | ||||||
| CVS Holdings I LP, Sr. Sec. Credit Facilities 1st Lien Term Loan, 5.25%,[LIBOR4+300], 2/6/251 | 3,164,100 | 3,170,697 | ||||||
| DJO Finance LLC, Sr. Sec. Credit Facilities 1st Lien Term Loan, Tranche B, 5.326%-5.587%,[LIBOR12+325], 6/8/201 | 5,603,239 | 5,610,832 | ||||||
| Endo International plc, Sr. Sec. Credit Facilities 1st Lien Term Loan, Tranche B, 6.375%,[LIBOR12+425], 4/29/241 | 4,299,941 | 4,374,383 | ||||||
| Enterprise Merger Sub, Inc., Sr. Sec. Credit Facilities 1st Lien Term Loan, 6.084%,[LIBOR4+375], 9/28/251 | 8,895,000 | 8,851,904 | ||||||
| Envision Healthcare Corp., Sr. Sec. Credit Facilities 1st Lien Term Loan, Tranche B2, 5.25%,[LIBOR12+300], 12/1/231 | 1,183,590 | 1,185,389 | ||||||
| Equian Buyer Corp., Sr. Sec. Credit Facilities 1st Lien Term Loan, Tranche B, 5.331%,[LIBOR12+325], 5/20/241 | 189,520 | 190,675 | ||||||
| Gentiva Health Services, Inc., Sr. Sec. Credit Facilities 1st Lien Term Loan, 6.00%,[LIBOR4+375], 7/2/251 | 6,680,879 | 6,768,566 | ||||||
| Heartland Dental LLC, Sr. Sec. Credit Facilities 1st Lien Term Loan, 5.992%,[LIBOR12+375], 4/30/251 | 1,053,817 | 1,055,571 | ||||||
| Heartland Dental LLC, Sr. Sec. Credit Facilities 1st Lien Term Loan Delayed Draw, 1.875%, 4/30/254 | 158,792 | 159,056 | ||||||
| Jaguar Holding Co. II, Sr. Sec. Credit Facilities 1st Lien Term Loan, 4.742%,[LIBOR4+250], 8/18/221 | 3,723,368 | 3,730,778 | ||||||
| Kinetic Concepts, Inc., Sr. Sec. Credit Facilities 1st Lien Term Loan, Tranche B, 5.636%,[LIBOR4+325], 2/2/241 | 1,698,500 | 1,710,356 | ||||||
| LifeCare Holdings LLC, Sr. Sec. Credit Facilities 1st Lien Exit Term Loan, Tranche A, 10.386%,[LIBOR4+525], 11/30/181 | 1,578,706 | 1,065,627 | ||||||
| LifeScan Global Corp., Sr. Sec. Credit Facilities 1st Lien Term Loan, 8.312%,[LIBOR4+600], 6/8/241 | 3,375,000 | 3,346,532 | ||||||
| Mallinckrodt International Finance SA, Sr. Sec. Credit Facilities 1st Lien Term Loan: |
|
|||||||
| Tranche B, 5.136%,[LIBOR4+275], 9/24/241 | 1,244,775 | 1,240,325 | ||||||
| Tranche B, 5.517%,[LIBOR4+300], 2/24/251 | 3,736,225 | 3,743,828 | ||||||
| MPH Acquisition Holdings LLC, Sr. Sec. Credit Facilities 1st Lien Term Loan, Tranche B, 5.136%,[LIBOR4+300], 6/7/231 | 4,843,172 | 4,858,864 | ||||||
18 OPPENHEIMER MASTER LOAN FUND, LLC
| Principal Amount | Value | |||||||
| Health Care Equipment & Supplies (Continued) | ||||||||
| National Mentor Holdings, Inc., Sr. Sec. Credit Facilities 1st Lien Term Loan, Tranche B, 5.386%,[LIBOR4+300], 1/31/211 | $ | 3,763,128 | $ | 3,778,651 | ||||
| New Trident Holdcorp, Inc., Sr. Sec. Credit Facilities 1st Lien Term Loan, Tranche B, 8.076%,[LIBOR4+575], 7/31/191,5 | 1,084,612 | 515,191 | ||||||
| One Call Corp., Sr. Sec. Credit Facilities 1st Lien Term Loan, Tranche B, 7.313%,[LIBOR12+525], 11/27/221 | 3,040,054 | 2,892,231 | ||||||
| Ortho-Clinical Diagnostics SA, Sr. Sec. Credit Facilities 1st Lien Term Loan, Tranche B, 5.316%,[LIBOR4+325], 6/30/251 | 4,606,884 | 4,628,767 | ||||||
| PAREXEL International Corp., Sr. Sec. Credit Facilities 1st Lien Term Loan, Tranche B, 4.992%,[LIBOR4+300], 9/27/241 | 1,098,005 | 1,092,514 | ||||||
| Select Medical Corp., Sr. Sec. Credit Facilities 1st Lien Term Loan, Tranche B, 4.82%-6.75%,[PRIME4+175], 3/1/211 | 2,282,633 | 2,301,179 | ||||||
| Surgery Center Holdings, Inc., Sr. Sec. Credit Facilities 1st Lien Term Loan, 5.33%,[LIBOR4+325], 9/2/241 | 2,792,124 | 2,796,480 | ||||||
| Team Health Holdings, Inc., Sr. Sec. Credit Facilities 1st Lien Term Loan, Tranche B, 4.826%,[LIBOR12+275], 2/6/241 | 4,890,878 | 4,765,550 | ||||||
| US Anesthesia Partners, Inc., Sr. Sec. Credit Facilities 1st Lien Term Loan, 5.242%,[LIBOR12+300], 6/23/241 | 183,606 | 184,868 | ||||||
| VVC Holdings Corp., Sr. Sec. Credit Facilities 1st Lien Term Loan, 6.317%,[LIBOR12+425], 7/9/251 | 3,335,000 | 3,297,481 | ||||||
| Wink Holdco, Inc., Sr. Sec. Credit Facilities 1st Lien Term Loan, 5.242%,[LIBOR4+300], 12/2/241 | 1,523,488 | 1,520,631 | ||||||
| 114,971,834 | ||||||||
| Industrials—15.2% | ||||||||
| Aerospace & Defense—0.4% | ||||||||
| Doncasters US Finance LLC, Sr. Sec. Credit Facilities 1st Lien Term Loan, Tranche B, 5.834%,[LIBOR4+350], 4/9/201 | 1,363,022 | 1,268,292 | ||||||
| Genuine Financial Holdings LLC, Sr. Sec. Credit Facilities 1st Lien Term Loan, 6.136%,[LIBOR4+375], 7/11/251 | 3,340,000 | 3,366,102 | ||||||
| 4,634,394 | ||||||||
| Commercial Services & Supplies—8.4% | ||||||||
| Access CIG LLC, Sr. Sec. Credit Facilities 1st Lien Term Loan, 5.992%,[LIBOR12+375], 2/27/251 | 1,363,822 | 1,373,198 | ||||||
| Access CIG LLC, Sr. Sec. Credit Facilities 1st Lien Term Loan, Delayed Draw, 3.75%, 2/27/254 | 171,325 | 172,503 | ||||||
| AI Aqua Merger Sub, Inc., Sr. Sec. Credit Facilities 1st Lien Term Loan, Tranche B1, 5.492%,[LIBOR12+325], 12/13/231 | 2,822,323 | 2,826,740 | ||||||
| Allied Universal Holdco LLC, Sr. Sec. Credit Facilities 1st Lien Term Loan, 6.136%,[LIBOR4+375], 7/28/221 | 9,766,876 | 9,638,686 | ||||||
| Asurion LLC, Sr. Sec. Credit Facilities 1st Lien Term Loan: | ||||||||
| Tranche B4, 5.242%,[LIBOR12+300], 8/4/221 | 9,229,981 | 9,316,512 | ||||||
| Tranche B6, 5.076%,[LIBOR12+300], 11/3/231 | 4,929,231 | 4,971,598 | ||||||
| Tranche B7, 5.242%,[LIBOR12+300], 11/3/241 | 997,500 | 1,005,684 | ||||||
| Asurion LLC, Sr. Sec. Credit Facilities 2st Lien Term Loan, 8.576%,[LIBOR12+650], 8/4/251 | 2,575,000 | 2,651,452 | ||||||
| ATS Consolidated, Inc., Sr. Sec. Credit Facilities 1st Lien Term Loan, Tranche B, 5.992%,[LIBOR12+375], 2/28/251 | 3,866,585 | 3,890,751 | ||||||
19 OPPENHEIMER MASTER LOAN FUND, LLC
STATEMENT OF INVESTMENTS Continued
| Principal Amount | Value | |||||||
| Commercial Services & Supplies (Continued) | ||||||||
| Belron Finance US LLC, Sr. Sec. Credit Facilities 1st Lien Term Loan, Tranche B, 4.843%,[LIBOR4+250], 11/7/241 | $ | 2,783,963 | $ | 2,803,102 | ||||
| Blackhawk Network Holdings, Inc., Sr. Sec. Credit Facilities 1st Lien Term Loan, 5.386%,[LIBOR4+300], 6/15/251 | 3,795,488 | 3,823,631 | ||||||
| Boing US Holdco, Inc., Sr. Sec. Credit Facilities 1st Lien Term Loan, 5.593%,[LIBOR4+325], 10/3/241 | 2,732,768 | 2,749,848 | ||||||
| Casmar Australia Pty Ltd., Sr. Sec. Credit Facilities 1st Lien Term Loan, Tranche B, 6.742%,[LIBOR4+450], 12/8/231 | 2,210,625 | 2,094,567 | ||||||
| Ceridian HCM Holding, Inc., Sr. Sec. Credit Facilities 1st Lien Term Loan, Tranche B, 5.326%,[LIBOR12+325], 4/30/251 | 3,235,000 | 3,246,128 | ||||||
| Ceva Logistics Finance BV, Sr. Sec. Credit Facilities 1st Lien Term Loan, Tranche B, 6.098%,[LIBOR4+375], 8/4/251 | 2,440,000 | 2,455,762 | ||||||
| Crossmark Holdings, Inc., Sr. Sec. Credit Facilities 1st Lien Term Loan, 5.834%,[LIBOR4+350], 12/20/191 | 5,037,319 | 2,946,832 | ||||||
| Engility Corp., Sr. Sec. Credit Facilities 1st Lien Term Loan, Tranche B2, 4.992%,[LIBOR12+275], 8/14/231 | 2,456,699 | 2,467,447 | ||||||
| First Advantage, Sr. Sec. Credit Facilities 1st Lien Term Loan, Tranche B, 7.592%,[LIBOR4+525], 6/30/221 | 1,652,589 | 1,654,655 | ||||||
| First American Payment Systems LP, Sr. Sec. Credit Facilities 1st Lien Term Loan, 6.83%,[LIBOR12+475], 1/5/241 | 1,642,333 | 1,654,651 | ||||||
| Frontdoor, Inc., Sr. Sec. Credit Facilities 1st Lien Term Loan, Tranche B, 5.098%,[LIBOR12+250], 8/16/251 | 389,000 | 392,163 | ||||||
| IG Investments Holdings LLC, Sr. Sec. Credit Facilities 1st Lien Term Loan, 5.742%-5.886%,[LIBOR12+350], 5/23/251 | 1,092,263 | 1,103,185 | ||||||
| Inmar, Inc., Sr. Sec. Credit Facilities 1st Lien Term Loan, 5.742%,[LIBOR6+350], 5/1/241 | 5,243,625 | 5,266,566 | ||||||
| KUEHG Corp., Sr. Sec. Credit Facilities 1st Lien Term Loan, 6.136%,[LIBOR4+375], 2/21/251 | 4,245,228 | 4,274,414 | ||||||
| Laureate Education, Inc., Sr. Sec. Credit Facilities 1st Lien Term Loan, Tranche B, 5.742%,[LIBOR12+350], 4/26/241 | 3,728,370 | 3,750,348 | ||||||
| Learning Care Group US No. 2, Inc., Sr. Sec. Credit Facilities 1st Lien Term Loan, Tranche B, 5.327%-5.492%,[LIBOR4+325], 3/13/251 | 527,350 | 529,328 | ||||||
| Livingston International, Inc., Sr. Sec. Credit Facilities 1st Lien Term Loan, 8.136%,[LIBOR4+575], 3/20/201 | 1,226,653 | 1,228,193 | ||||||
| Livingston International, Inc., Sr. Sec. Credit Facilities 2nd Lien Term Loan, 10.636%,[LIBOR4+825], 4/17/201 | 551,135 | 523,579 | ||||||
| LS Deco LLC, Sr. Sec. Credit Facilities 1st Lien Term Loan, Tranche B, 5.886%,[LIBOR4+350], 5/21/221 | 1,886,978 | 1,905,263 | ||||||
| Monitronics International, Inc., Sr. Sec. Credit Facilities 1st Lien Term Loan, Tranche B2, 7.886%,[LIBOR4+550], 9/30/221 | 3,262,373 | 3,190,601 | ||||||
| Sarbacane Bidco, Inc., Sr. Sec. Credit Facilities 1st Lien Term Loan, 5.25%,[LIBOR4+300], 1/29/251 | 542,275 | 543,520 | ||||||
| Savage Enterprises LLC, Sr. Sec. Credit Facilities 1st Lien Term Loan, Tranche B, 5.577%,[LIBOR12+450], 8/1/251 | 4,157,375 | 4,220,588 | ||||||
| Securus Technologies Holdings LLC, Sr. Sec. Credit Facilities 1st Lien Term Loan, 5.832%-6.742%,[LIBOR4+450], 11/1/241 | 3,829,855 | 3,840,036 | ||||||
| SMG US Midco 2, Inc., Sr. Sec. Credit Facilities 1st Lien Term Loan, 5.242%,[LIBOR6+325], 1/23/251 | 452,725 | 455,697 | ||||||
20 OPPENHEIMER MASTER LOAN FUND, LLC
| Principal Amount | Value | |||||||
| Commercial Services & Supplies (Continued) | ||||||||
| Staples, Inc., Sr. Sec. Credit Facilities 1st Lien Term Loan, 6.343%,[LIBOR4+400], 9/12/241 | $ | 10,719,000 | $ | 10,736,901 | ||||
| Travelport Finance Luxembourg Sarl, Sr. Sec. Credit Facilities 1st Lien Term Loan, Tranche B, 4.814%,[LIBOR4+275], 3/17/251 | 8,200,830 | 8,213,665 | ||||||
| Trident LS Merger Sub Corp., Sr. Sec. Credit Facilities 1st Lien Term Loan, 5.492%,[LIBOR4+325], 5/1/251 | 1,581,388 | 1,592,758 | ||||||
| USIC Holdings, Inc., Sr. Sec. Credit Facilities 1st Lien Term Loan, 5.492%,[LIBOR12+325], 12/8/231 | 676,669 | 681,886 | ||||||
| 114,192,438 | ||||||||
| Industrial Conglomerates—2.9% | ||||||||
| Apex Tool Group LLC, Sr. Sec. Credit Facilities 1st Lien Term Loan, Tranche B, 5.992%,[LIBOR12+375], 2/1/221 | 3,173,418 | 3,188,714 | ||||||
| Energy Acquisition Co., Inc., Sr. Sec. Credit Facilities 1st Lien Term Loan, 6.571%,[LIBOR4+425], 6/22/251 | 1,990,013 | 2,007,425 | ||||||
| Gardner Denver, Inc., Sr. Sec. Credit Facilities 1st Lien Term Loan, Tranche B, 4.992%,[LIBOR12+275], 7/30/241 | 1,483,702 | 1,493,398 | ||||||
| GrafTech Finance, Inc., Sr. Sec. Credit Facilities 1st Lien Term Loan, Tranche B, 5.742%,[LIBOR12+350], 2/12/251 | 2,414,438 | 2,434,055 | ||||||
| Harsco Corp., Sr. Sec. Credit Facilities 1st Lien Term Loan, 4.50%,[LIBOR12+225], 12/6/241 | 1,570,991 | 1,581,297 | ||||||
| MACOM Technology Solutions Holdings, Inc., Sr. Sec. Credit Facilities 1st Lien Term Loan, Tranche B, 4.492%,[LIBOR12+225], 5/17/241 | 2,418,035 | 2,366,954 | ||||||
| Robertshaw US Holdings Corp., Sr. Sec. Credit Facilities 1st Lien Term Loan, 5.75%,[LIBOR12+350], 2/28/251 | 1,412,900 | 1,404,952 | ||||||
| Titan Acquisition Ltd., Sr. Sec. Credit Facilities 1st Lien Term Loan, 5.242%,[LIBOR12+300], 3/28/251 | 3,358,125 | 3,269,454 | ||||||
| TransDigm, Inc., Sr. Sec. Credit Facilities 1st Lien Term Loan: | ||||||||
| Tranche E, 4.576%,[LIBOR12+250], 5/30/251 | 3,553,484 | 3,567,663 | ||||||
| Tranche F, 4.742%,[LIBOR12+250], 6/9/231 | 5,014,039 | 5,038,081 | ||||||
| Tranche G, 4.576%,[LIBOR4+250], 8/22/241 | 1,541,353 | 1,547,749 | ||||||
| Vectra Co., Sr. Sec. Credit Facilities 1st Lien Term Loan, 5.492%,[LIBOR12+325], 3/8/251 | 2,089,763 | 2,092,385 | ||||||
| Vertiv Intermediate Holding II Corp., Sr. Sec. Credit Facilities 1st Lien Term Loan, Tranche B, 6.082%,[LIBOR12+400], 11/30/231 | 5,266,853 | 5,296,479 | ||||||
| Wencor Group, Sr. Sec. Credit Facilities 1st Lien Term Loan, 5.886%,[LIBOR4+350], 6/19/211 | 977,935 | 954,709 | ||||||
| WP CPP Holdings LLC, Sr. Sec. Credit Facilities 1st Lien Term Loan, 6.28%,[LIBOR4+375], 4/30/251 | 2,380,000 | 2,398,350 | ||||||
| Zodiac Pool Solutions LLC, Sr. Sec. Credit Facilities 1st Lien Term Loan, Tranche B, 4.492%,[LIBOR4+225], 7/2/251 | 443,888 | 446,475 | ||||||
| 39,088,140 | ||||||||
| Professional Services—0.3% | ||||||||
| AVSC Holding Corp., Sr. Sec. Credit Facilities 1st Lien Term Loan, Tranche B, 5.35%-5.636%,[LIBOR4+375], 3/3/251 | 4,063,555 | 4,042,607 | ||||||
21 OPPENHEIMER MASTER LOAN FUND, LLC
STATEMENT OF INVESTMENTS Continued
| Principal Amount | Value | |||||||
| Road & Rail—1.4% | ||||||||
| American Airlines, Inc., Sr. Sec. Credit Facilities 1st Lien Term Loan, Tranche B, 3.98%,[LIBOR12+175], 6/27/251 | $ | 1,695,000 | $ | 1,665,490 | ||||
| Arctic LNG Carriers Ltd., Sr. Sec. Credit Facilities 1st Lien Term Loan, Tranche B, 6.742%,[LIBOR12+450], 5/18/231 | 2,814,824 | 2,829,785 | ||||||
| Daseke Cos., Inc., Sr. Sec. Credit Facilities 1st Lien Term Loan, 7.242%,[LIBOR12+500], 2/27/241 | 298,496 | 301,109 | ||||||
| Kenan Advantage Group, Inc. (The), Sr. Sec. Credit Facilities 1st Lien Term Loan: | ||||||||
| Tranche B1, 5.242%,[LIBOR12+300], 7/29/221 | 1,413,022 | 1,416,025 | ||||||
| Tranche B2, 5.242%,[LIBOR12+300], 7/29/221 | 157,661 | 157,996 | ||||||
| Western Express, Inc., Sr. Sec. Credit Facilities 2nd Lien Term Loan, 10.563%,[LIBOR4+825], 2/23/221,3 | 12,017,200 | 12,654,112 | ||||||
| 19,024,517 | ||||||||
| Transportation Infrastructure—1.8% | ||||||||
| American Axle & Manufacturing, Inc., Sr. Sec. Credit Facilities 1st Lien Term Loan, Tranche B, 4.32%,[LIBOR12+225], 4/6/241 | 3,449,619 | 3,455,225 | ||||||
| Dayco Products LLC, Sr. Sec. Credit Facilities 1st Lien Term Loan, Tranche B, 6.563%,[LIBOR4+500], 5/19/231 | 2,007,921 | 2,026,745 | ||||||
| Mavis Tire Express Services Corp., Sr. Sec. Credit Facilities 1st Lien Term Loan, 5.336%,[LIBOR4+325], 3/20/251 | 1,863,427 | 1,859,934 | ||||||
| Mavis Tire Express Services Corp., Sr. Sec. Credit Facilities 1st Lien Term Loan, 5.336%,[LIBOR12+325], 3/20/251 | 16,431 | 16,400 | ||||||
| Mavis Tire Express Services Corp., Sr. Sec. Credit Facilities 1st Lien Term Loan, Delayed Draw, 1.00%, 3/20/254 | 283,047 | 282,516 | ||||||
| Navistar, Inc., Sr. Sec. Credit Facilities 1st Lien Term Loan, Tranche B, 5.58%-5.64%,[LIBOR12+350], 11/6/241 | 3,574,332 | 3,600,389 | ||||||
| Superior Industries International, Inc., Sr. Sec. Credit Facilities 1st Lien Term Loan, Tranche B, 6.242%,[LIBOR12+400], 5/22/241 | 3,020,648 | 3,050,855 | ||||||
| Tenneco, Inc., Sr. Sec. Credit Facilities 1st Lien Term Loan, Tranche B, 4.589%,[LIBOR4+275], 6/14/251 | 3,715,000 | 3,724,306 | ||||||
| TI Group Automotive Systems LLC, Sr. Sec. Credit Facilities 1st Lien Term Loan, Tranche B, 4.742%,[LIBOR12+275], 6/30/221 | 6,634,484 | 6,665,168 | ||||||
| 24,681,538 | ||||||||
| Information Technology—10.8% | ||||||||
| Internet Software & Services—10.3% | ||||||||
| Almonde, Inc., Sr. Sec. Credit Facilities 1st Lien Term Loan, Tranche B, 5.576%,[LIBOR4+350], 6/13/241 | 7,748,022 | 7,762,549 | ||||||
| Avaya, Inc., Sr. Sec. Credit Facilities 1st Lien Exit Term Loan, Tranche B, 6.313%,[LIBOR12+425], 12/15/241 | 15,833,353 | 15,992,953 | ||||||
| Banff Merger Sub, Inc., Sr. Sec. Credit Facilities 1st Lien Term Loan, Tranche B, 6.307%,[LIBOR4+425], 10/2/251 | 6,595,000 | 6,666,918 | ||||||
| Blackboard, Inc., Sr. Sec. Credit Facilities 1st Lien Term Loan, Tranche B4, 7.333%,[LIBOR4+500], 6/30/211 | 4,029,482 | 3,893,487 | ||||||
| BMC Software Finance, Inc., Sr. Sec. Credit Facilities 1st Lien Term Loan, Tranche B2, 5.492%,[LIBOR12+325], 9/10/221 | 5,801,103 | 5,865,147 | ||||||
| Colorado Buyer, Inc., Sr. Sec. Credit Facilities 1st Lien Term Loan, 5.09%,[LIBOR4+300], 5/1/241 | 2,542,134 | 2,549,290 | ||||||
22 OPPENHEIMER MASTER LOAN FUND, LLC
| Principal Amount | Value | |||||||
| Internet Software & Services (Continued) | ||||||||
| EagleView Technology Corp., Sr. Sec. Credit Facilities 1st Lien Term Loan, Tranche B, 6.092%,[LIBOR12+350], 8/14/251 | $ | 785,000 | $ | 786,798 | ||||
| Ensono LP, Sr. Sec. Credit Facilities 1st Lien Term Loan, 7.315%,[LIBOR4+525], 6/27/251 | 2,119,688 | 2,143,534 | ||||||
| Epicor Software Corp., Sr. Sec. Credit Facilities 1st Lien Term Loan, Tranche B, 5.50%,[LIBOR12+325], 6/1/221 | 2,279,912 | 2,292,497 | ||||||
| Greeneden US Holdings II LLC, Sr. Sec. Credit Facilities 1st Lien Term Loan, Tranche B3, 5.576%,[LIBOR4+350], 12/1/231 | 2,360,829 | 2,376,174 | ||||||
| Infor US, Inc., Sr. Sec. Credit Facilities 1st Lien Term Loan, Tranche B, 5.136%,[LIBOR4+275], 2/1/221 | 6,924,537 | 6,951,577 | ||||||
| Informatica LLC, Sr. Sec. Credit Facilities 1st Lien Term Loan, Tranche B, 5.492%,[LIBOR4+325], 8/5/221 | 3,479,229 | 3,510,751 | ||||||
| Internap Corp., Sr. Sec. Credit Facilities 1st Lien Term Loan, 7.82%,[LIBOR12+575], 4/6/221 | 2,007,925 | 2,023,818 | ||||||
| Ivanti Software, Inc., Sr. Sec. Credit Facilities 1st Lien Term Loan, Tranche B, 6.33%,[LIBOR12+425], 1/20/241 | 1,808,331 | 1,825,655 | ||||||
| Kronos, Inc., Sr. Sec. Credit Facilities 1st Lien Term Loan, Tranche B, 5.343%,[LIBOR12+300], 11/1/231 | 213,925 | 215,249 | ||||||
| MA FinanceCo LLC, Sr. Sec. Credit Facilities 1st Lien Term Loan: | ||||||||
| Tranche B, 4.742%,[LIBOR12+275], 6/21/241 | 1,070,127 | 1,068,570 | ||||||
| Tranche B2, 4.492%,[LIBOR4+250], 11/19/211 | 850,725 | 848,279 | ||||||
| MaxLinear, Inc., Sr. Sec. Credit Facilities 1st Lien Term Loan, Tranche B, 4.563%,[LIBOR12+250], 5/13/241 | 1,046,082 | 1,047,390 | ||||||
| McAfee LLC, Sr. Sec. Credit Facilities 1st Lien Term Loan, Tranche B, 6.742%,[LIBOR12+450], 9/30/241 | 5,866,854 | 5,922,384 | ||||||
| Mitchell International, Inc., Sr. Sec. Credit Facilities 1st Lien Term Loan, Tranche B, 5.492%,[LIBOR12+325], 11/29/241 | 1,682,311 | 1,682,159 | ||||||
| Parker Private Merger Sub, Inc., Sr. Sec. Credit Facilities 1st Lien Term Loan, Tranche B, 6.312%,[LIBOR4+375], 9/14/251 | 1,549,000 | 1,560,617 | ||||||
| Plantronics, Inc., Sr. Sec. Credit Facilities 1st Lien Term Loan, 4.742%,[LIBOR12+250], 7/2/251 | 1,405,000 | 1,411,589 | ||||||
| Premiere Global Services, Inc., Sr. Sec. Credit Facilities 1st Lien Term Loan, 8.843%,[LIBOR6+650], 12/8/211 | 1,058,959 | 1,025,205 | ||||||
| Project Deep Blue Holdings LLC, Sr. Sec. Credit Facilities 1st Lien Term Loan, 5.314%,[LIBOR4+325], 2/12/251 | 912,713 | 915,848 | ||||||
| Quest Software US Holdings, Inc., Sr. Sec. Credit Facilities 1st Lien Term Loan, 6.572%,[LIBOR4+425], 5/16/251 | 3,340,000 | 3,372,348 | ||||||
| Riverbed Technology, Inc., Sr. Sec. Credit Facilities 1st Lien Term Loan, Tranche B, 5.33%,[LIBOR12+325], 4/24/221 | 6,302,169 | 6,301,790 | ||||||
| Seattle SpinCo, Inc., Sr. Sec. Credit Facilities 1st Lien Term Loan, Tranche B, 4.742%,[LIBOR12+275], 6/21/241 | 7,223,168 | 7,212,658 | ||||||
| Shutterfly, Inc.,Sr. Sec. Credit Facilities 1st Lien Term Loan, Tranche B2, 5.00%,[LIBOR12+275], 8/17/241 | 2,214,450 | 2,226,906 | ||||||
| SolarWinds Holdings, Inc., Sr. Sec. Credit Facilities 1st Lien Term Loan, 5.242%,[LIBOR12+300], 2/5/241 | 2,014,775 | 2,028,909 | ||||||
| Solera LLC, Sr. Sec. Credit Facilities 1st Lien Term Loan, Tranche B, 4.992%,[LIBOR12+275], 3/3/231 | 2,674,352 | 2,683,138 | ||||||
| Sophia LP, Sr. Sec. Credit Facilities 1st Lien Term Loan, Tranche B, 5.636%,[LIBOR4+325], 9/30/221 | 1,147,520 | 1,153,861 | ||||||
23 OPPENHEIMER MASTER LOAN FUND, LLC
STATEMENT OF INVESTMENTS Continued
| Principal Amount | Value | |||||||
| Internet Software & Services (Continued) | ||||||||
| SS&C Technologies Holdings Europe Sarl, Sr. Sec. Credit Facilities 1st Lien Term Loan, Tranche B4, 4.492%,[LIBOR4+250], 4/16/251 | $ | 3,150,673 | $ | 3,157,573 | ||||
| SS&C Technologies, Inc., Sr. Sec. Credit Facilities 1st Lien Term Loan, Tranche B1, 4.326%,[LIBOR4+250], 4/16/251 | 8,116,415 | 8,134,190 | ||||||
| Sungard Availability Services Capital, Inc., Extended Sr. Sec. Credit Facilities 1st Lien Term Loan, Tranche B, 9.081%,[LIBOR12+700], 9/30/211 | 835,000 | 776,550 | ||||||
| Sybil Software LLC, Sr. Sec. Credit Facilities 1st Lien Term Loan, Tranche B, 4.886%,[LIBOR4+250], 9/29/231 | 354,497 | 357,046 | ||||||
| Tempo Acquisition LLC, Sr. Sec. Credit Facilities 1st Lien Term Loan, Tranche B, 5.076%-5.242%,[LIBOR12+300], 5/1/241 | 6,428,069 | 6,460,788 | ||||||
| TTM Technologies, Inc., Sr. Sec. Credit Facilities 1st Lien Term Loan, 4.581%,[LIBOR4+250], 9/28/241 | 3,306,161 | 3,322,692 | ||||||
| Veritas US, Inc., Sr. Sec. Credit Facilities 1st Lien Term Loan, Tranche B1, 6.576%-6.886%,[LIBOR12+450], 1/27/231 | 7,489,597 | 7,314,079 | ||||||
| Vertafore, Inc., Sr. Sec. Credit Facilities 1st Lien Term Loan, Tranche B, 5.623%,[LIBOR4+325], 7/2/251 | 632,000 | 635,441 | ||||||
| Xperi Corp., Sr. Sec. Credit Facilities 1st Lien Term Loan, Tranche B, 4.742%,[LIBOR12+250], 12/1/231 | 3,676,183 | 3,648,612 | ||||||
| 139,125,019 | ||||||||
| IT Services—0.5% | ||||||||
| Pi US Mergerco, Inc., Sr. Sec. Credit Facilities 1st Lien Term Loan, Tranche B, 5.742%,[LIBOR12+350], 1/3/251 | 7,311,392 | 7,304,556 | ||||||
| Materials—8.0% | ||||||||
| Chemicals—2.5% | ||||||||
| Alpha 3 BV, Sr. Sec. Credit Facilities 1st Lien Term Loan, Tranche B1, 5.386%,[LIBOR4+300], 1/31/241 | 3,370,257 | 3,394,692 | ||||||
| Consolidated Energy Finance SA, Sr. Sec. Credit Facilities 1st Lien Term Loan, Tranche B, 4.571%,[LIBOR12+250], 5/7/251 | 2,119,688 | 2,117,038 | ||||||
| Cyanco Intermediate Corp., Sr. Sec. Credit Facilities 1st Lien Term Loan, 5.576%,[LIBOR4+350], 3/17/251 | 1,826,236 | 1,841,367 | ||||||
| Emerald Performance Materials LLC, Sr. Sec. Credit Facilities 1st Lien Term Loan, 5.742%,[LIBOR12+350], 7/30/211 | 3,078,626 | 3,104,286 | ||||||
| Encapsys LLC, Sr. Sec. Credit Facilities 1st Lien Term Loan, Tranche B, 5.492%,[LIBOR4+325], 11/7/241 | 1,432,800 | 1,442,350 | ||||||
| Ferro Corp., Sr. Sec. Credit Facilities 1st Lien Term Loan, Tranche B, 4.636%,[LIBOR4+225], 2/14/241 | 1,349,519 | 1,355,848 | ||||||
| LUX HOLDCO III, Sr. Sec. Credit Facilities 1st Lien Term Loan, 5.077%,[LIBOR4+300], 3/28/251 | 721,375 | 726,789 | ||||||
| MacDermid, Inc., Sr. Sec. Credit Facilities 1st Lien Term Loan: | ||||||||
| Tranche B6, 5.242%,[LIBOR12+300], 6/7/231 | 1,434,868 | 1,445,859 | ||||||
| Tranche B7, 4.742%,[LIBOR4+275], 6/7/201 | 1,441,312 | 1,449,160 | ||||||
| New Arclin US Holding Corp., Sr. Sec. Credit Facilities 1st Lien Term Loan, 5.886%,[LIBOR4+350], 2/14/241 | 1,773,216 | 1,791,320 | ||||||
| OCI Partners LP, Sr. Sec. Credit Facilities 1st Lien Term Loan, Tranche B, 6.386%,[LIBOR4+425], 3/13/251 | 2,075,248 | 2,109,002 | ||||||
24 OPPENHEIMER MASTER LOAN FUND, LLC
| Principal Amount | Value | |||||||
| Chemicals (Continued) | ||||||||
| Polar US Borrower LLC, Sr. Sec. Credit Facilities 1st Lien Term Loan, 7.089%,[LIBOR4+475], 8/21/251 | $ | 860,000 | $ | 865,375 | ||||
| PQ Corp., Sr. Sec. Credit Facilities 1st Lien Term Loan, 4.742%,[LIBOR4+250], 2/8/251 | 875,639 | 877,693 | ||||||
| Road Infrastructure Investment LLC, Sr. Sec. Credit Facilities 1st Lien Term Loan, Tranche B, 5.742%,[LIBOR12+350], 6/13/231 | 1,440,600 | 1,413,589 | ||||||
| Starfruit US Holdco LLC, Sr. Sec. Credit Facilities 1st Lien Term Loan, Tranche B, 5.839%,[LIBOR12+325], 9/20/251 | 3,080,000 | 3,096,678 | ||||||
| Tronox Blocked Borrower LLC, Sr. Sec. Credit Facilities 1st Lien Term Loan, Tranche B, 5.242%,[LIBOR4+300], 9/23/241 | 2,140,385 | 2,150,863 | ||||||
| Tronox Finance LLC, Sr. Sec. Credit Facilities 1st Lien Term Loan, Tranche B, 5.242%,[LIBOR4+300], 9/23/241 | 4,942,725 | 4,966,919 | ||||||
| 34,148,828 | ||||||||
| Construction Materials—1.3% | ||||||||
| Continental Building Products Operating Co. LLC, Sr. Sec. Credit Facilities 1st Lien Term Loan, 4.326%,[LIBOR12+225], 8/18/231 | 2,064,191 | 2,072,901 | ||||||
| Pisces Midco, Inc., Sr. Sec. Credit Facilities 1st Lien Term Loan, Tranche B, 6.087%,[LIBOR4+300], 4/12/251 | 3,351,600 | 3,385,116 | ||||||
| Quikrete Holdings, Inc., Sr. Sec. Credit Facilities 1st Lien Term Loan, 4.992%,[LIBOR12+275], 11/15/231 | 8,225,769 | 8,254,066 | ||||||
| Realogy Group LLC, Sr. Sec. Credit Facilities 1st Lien Term Loan, Tranche B, 4.317%,[LIBOR12+225], 2/8/251 | 1,509,722 | 1,515,950 | ||||||
| VC GB Holdings, Inc., Sr. Sec. Credit Facilities 1st Lien Term Loan, 5.242%,[LIBOR12+325], 2/28/241 | 2,133,593 | 2,144,261 | ||||||
| 17,372,294 | ||||||||
| Containers & Packaging—1.7% | ||||||||
| Ball Metalpack Finco LLC, Sr. Sec. Credit Facilities 1st Lien Term Loan, Tranche B, 6.742%,[LIBOR12+450], 7/31/251 | 907,725 | 918,504 | ||||||
| BWAY Corp., Sr. Sec. Credit Facilities 1st Lien Term Loan, 5.581%,[LIBOR12+325], 4/3/241 | 6,349,874 | 6,352,351 | ||||||
| Flex Acquisition Co., Inc., Sr. Sec. Credit Facilities 1st Lien Term Loan, 5.576%,[LIBOR4+325], 6/29/251 | 4,180,000 | 4,195,152 | ||||||
| Plastipak Holdings, Inc., Sr. Sec. Credit Facilities 1st Lien Term Loan, Tranche B, 4.75%,[LIBOR12+250], 10/14/241 | 2,433,634 | 2,437,625 | ||||||
| Pro Mach Group, Inc., Sr. Sec. Credit Facilities 1st Lien Term Loan, Tranche B, 5.071%,[LIBOR4+300], 3/7/251 | 1,766,125 | 1,763,644 | ||||||
| Reynolds Group Holdings, Inc., Sr. Sec. Credit Facilities 1st Lien Term Loan, 4.992%,[LIBOR12+300], 2/5/231 | 3,748,105 | 3,769,188 | ||||||
| SIG Combibloc US Acquisition, Inc., Sr. Sec. Credit Facilities 1st Lien Term Loan, Tranche B, 4.826%,[LIBOR12+275], 3/11/221 | 3,268,833 | 3,277,904 | ||||||
| 22,714,368 | ||||||||
| Metals & Mining—2.5% | ||||||||
| Covia Holdings Corp., Sr. Sec. Credit Facilities 1st Lien Term Loan, 5.816%,[LIBOR4+375], 6/1/251 | 3,745,613 | 3,552,077 | ||||||
25 OPPENHEIMER MASTER LOAN FUND, LLC
STATEMENT OF INVESTMENTS Continued
| Principal Amount | Value | |||||||
| Metals & Mining (Continued) | ||||||||
| Murray Energy Corp., Sr. Sec. Credit Facilities 1st Lien Term Loan: | ||||||||
| Tranche B2, 9.326%,[LIBOR12+725], 10/17/221 | $ | 23,037,990 | $ | 21,184,699 | ||||
| Tranche B3, 9.992%,[LIBOR12+775], 10/17/221 | 6,975,479 | 6,413,081 | ||||||
| Peabody Energy Corp., Sr. Sec. Credit Facilities 1st Lien Term Loan, Tranche B, 4.992%,[LIBOR12+275], 3/31/251 | 1,707,369 | 1,713,414 | ||||||
| TMS International Corp., Sr. Sec. Credit Facilities 1st Lien Term Loan, Tranche B, 4.992%,[LIBOR4+275], 8/14/241 | 579,691 | 581,140 | ||||||
| 33,444,411 | ||||||||
| Telecommunication Services—5.9% | ||||||||
| Diversified Telecommunication Services—5.9% | ||||||||
| CenturyLink, Inc., Sr. Sec. Credit Facilities 1st Lien Term Loan, Tranche B, 4.826%,[LIBOR4+275], 1/31/251 | 18,698,700 | 18,591,182 | ||||||
| Cincinnati Bell, Inc., Sr. Sec. Credit Facilities 1st Lien Term Loan, Tranche B, 5.326%,[LIBOR4+375], 10/2/241 | 3,685,000 | 3,697,658 | ||||||
| Consolidated Communications, Inc., Sr. Sec. Credit Facilities 1st Lien Term Loan, Tranche B, 5.08%,[LIBOR12+300], 10/5/231 | 5,029,924 | 4,967,427 | ||||||
| Digicel International Finance Ltd, Sr. Sec. Credit Facilities 1st Lien Term Loan, Tranche B, 5.33%,[LIBOR4+325], 5/27/241 | 4,663,397 | 4,437,525 | ||||||
| Frontier Communications Corp., Sr. Sec. Credit Facilities 1st Lien Term Loan, Tranche B, 6.00%,[LIBOR12+375], 6/15/241 | 6,247,783 | 6,142,352 | ||||||
| Fusion Connect, Inc., Sr. Sec. Credit Facilities 1st Lien Term Loan, 9.841%,[LIBOR4+750], 5/4/231 | 5,436,188 | 5,177,969 | ||||||
| Global Tel*Link Corp., Sr. Sec. Credit Facilities 1st Lien Term Loan, 6.386%,[LIBOR4+400], 5/23/201 | 4,250,433 | 4,282,843 | ||||||
| GTT Communications, Inc., Sr. Sec. Credit Facilities 1st Lien Term Loan, Tranche B, 5.094%,[LIBOR12+275], 5/31/251 | 852,863 | 847,118 | ||||||
| IPC Corp., Sr. Sec. Credit Facilities 1st Lien Term Loan, Tranche B, 6.85%,[LIBOR4+450], 8/6/211 | 3,913,281 | 3,822,806 | ||||||
| IPC Corp., Sr. Sec. Credit Facilities 2nd Lien Term Loan, 11.85%,[LIBOR4+950], 2/4/221 | 2,123,972 | 1,869,095 | ||||||
| NeuStar, Inc., Sr. Sec. Credit Facilities 1st Lien Term Loan, Tranche B4, 5.742%,[LIBOR12+350], 8/8/241 | 2,364,030 | 2,371,631 | ||||||
| Sprint Communications, Inc., Sr. Sec. Credit Facilities 1st Lien Term Loan, Tranche B, 4.75%,[LIBOR12+250], 2/2/241 | 13,495,115 | 13,545,722 | ||||||
| TDC AS, Sr. Sec. Credit Facilities 1st Lien Term Loan, Tranche B, 5.592%,[LIBOR12+350], 6/4/251 | 4,498,725 | 4,550,460 | ||||||
| Windstream Services LLC, Sr. Sec. Credit Facilities 1st Lien Term Loan, Tranche B6, 6.06%,[LIBOR12+400], 3/29/211 | 6,106,592 | 5,854,695 | ||||||
| 80,158,483 | ||||||||
| Utilities—2.4% | ||||||||
| Electric Utilities—2.4% | ||||||||
| Brookfield WEC Holdings, Inc., Sr. Sec. Credit Facilities 1st Lien Term Loan, 5.992%,[LIBOR4+375], 8/1/251 | 3,175,000 | 3,218,069 | ||||||
| Calpine Construction Finance Co. LP, Sr. Sec. Credit Facilities 1st Lien Term Loan, 4.576%,[LIBOR12+250], 1/15/251 | 1,263,634 | 1,265,776 | ||||||
26 OPPENHEIMER MASTER LOAN FUND, LLC
| Principal Amount | Value | |||||||
| Electric Utilities (Continued) | ||||||||
| Calpine Corp., Sr. Sec. Credit Facilities 1st Lien Term Loan: | ||||||||
| Tranche B5, 4.89%,[LIBOR4+250], 1/15/241 | $ | 2,442,020 | $ | 2,445,329 | ||||
| Tranche B7, 4.84%,[LIBOR4+275], 5/31/231 | 583,070 | 583,898 | ||||||
| Compass Power Generation LLC, Sr. Sec. Credit Facilities 1st Lien Term Loan, Tranche B, 5.742%,[LIBOR12+350], 12/20/241 | 1,880,432 | 1,892,655 | ||||||
| EFS Cogen Holdings I LLC, Sr. Sec. Credit Facilities 1st Lien Term Loan, Tranche B, 5.64%,[LIBOR4+325], 6/28/231 | 2,820,084 | 2,813,922 | ||||||
| Frontera Generation Holdings LLC, Sr. Sec. Credit Facilities 1st Lien Term Loan, Tranche B, 6.331%,[LIBOR4+425], 5/2/251 | 3,331,650 | 3,358,720 | ||||||
| Kestrel Acquisition LLC., Sr. Sec. Credit Facilities 1st Lien Term Loan, Tranche B, 6.50%,[LIBOR12+425], 6/2/251 | 2,124,675 | 2,154,771 | ||||||
| Lightstone Holdco LLC, Sr. Sec. Credit Facilities 1st Lien Term Loan: | ||||||||
| Tranche B, 5.826%,[LIBOR12+375], 1/30/241 | 3,037,403 | 3,020,912 | ||||||
| Tranche C, 5.992%,[LIBOR12+375], 1/30/241 | 163,193 | 162,193 | ||||||
| MRP Generation Holdings LLC, Sr. Sec. Credit Facilities 1st Lien Term Loan, Tranche B, 9.386%,[LIBOR4+700], 10/18/221 | 1,097,600 | 1,075,648 | ||||||
| Sandy Creek Energy Associates LP, Sr. Sec. Credit Facilities 1st Lien Term Loan, Tranche B, 6.386%,[LIBOR4+400], 11/9/201 | 6,256,622 | 5,592,825 | ||||||
| Talen Energy Supply LLC, Sr. Sec. Credit Facilities 1st Lien Term Loan: | ||||||||
| Tranche B, 6.242%,[LIBOR12+400], 7/15/231 | 5,072,810 | 5,104,870 | ||||||
| Tranche B2, 6.242%,[LIBOR12+400], 4/15/241 | 426,953 | 429,652 | ||||||
| 33,119,240 | ||||||||
| Total Corporate Loans (Cost $1,300,081,670) | 1,288,059,817 | |||||||
| Corporate Bonds and Notes—0.7% | ||||||||
| Berry Global, Inc., 4.50% Sec. Nts., 2/15/266 | 365,000 | 347,662 | ||||||
| Erickson Air-Crane, Inc., 6.00% Sub. Nts., 11/2/202,3 | 644,070 | 1 | ||||||
| Tesla, Inc., 5.30% Sr. Unsec. Nts., 8/15/256 | 6,075,000 | 5,140,969 | ||||||
| United States Steel Corp., 6.25% Sr. Unsec. Nts., 3/15/26 | 3,500,000 | 3,478,125 | ||||||
| Total Corporate Bonds and Notes (Cost $10,138,215) | 8,966,757 | |||||||
| Shares | ||||||||
| Common Stocks—4.0% | ||||||||
| Arch Coal, Inc., Cl. A | 287,218 | 25,677,289 | ||||||
| Aretec Group, Inc.7 | 65,145 | 6,400,496 | ||||||
| Ascent Resources - Marcellus LLC, Cl. A7 | 606,015 | 1,999,850 | ||||||
| Avaya Holdings Corp.7 | 241,777 | 5,352,943 | ||||||
| Everyware Global, Inc.7 | 106,918 | 187,106 | ||||||
| Gymboree Corp. (The)7,9 | 76,198 | 938,226 | ||||||
| Gymboree Holding Corp.7,9 | 217,169 | 2,674,002 | ||||||
| Harvey Gulf International Marine LLC7 | 12,360 | 667,440 | ||||||
| J.G. Wentworth Co., Cl. A7 | 321,823 | 3,198,277 | ||||||
| Larchmont Resources LLC3,7 | 136 | 37,483 | ||||||
| Mach Gen LLC3,7 | 34,118 | 85,295 | ||||||
| Media General, Inc.3,7,8 | 781,336 | 46,880 | ||||||
| Millennium Corporate Claim Litigation Trust3,7 | 5,431 | 54 | ||||||
| Millennium Lender Claim Litigation Trust3,7 | 10,862 | 109 | ||||||
| New Millennium Holdco, Inc.7 | 111,266 | 13,519 | ||||||
| Ocean Rig UDW, Inc., Cl. A7 | 194,745 | 6,742,072 | ||||||
27 OPPENHEIMER MASTER LOAN FUND, LLC
STATEMENT OF INVESTMENTS Continued
| Shares | Value | |||||||
| Common Stocks (Continued) | ||||||||
| Quicksilver Resources, Inc.3,7 | 11,634,576 | $ | 219,358 | |||||
| Sabine Oil3,7 | 1,393 | 71,043 | ||||||
| Templar Energy, Cl. A3,7 | 154,052 | 154,052 | ||||||
| Total Common Stocks (Cost $51,462,441) | 54,465,494 | |||||||
| Units | ||||||||
| Rights, Warrants and Certificates—0.0% | ||||||||
| Ascent Resources - Marcellus LLC Wts., Strike Price $1, Exp. 12/31/493,7 | 156,901 | 4,707 | ||||||
| Sabine Oil Tranche 1 Wts., Strike Price $4.49, Exp. 8/11/263,7 | 4,421 | 28,736 | ||||||
| Sabine Oil Tranche 2 Wts., Strike Price $2.72, Exp. 8/11/263,7 | 787 | 4,329 | ||||||
| Total Rights, Warrants and Certificates (Cost $607,573) | 37,772 | |||||||
| Shares | ||||||||
| Investment Company—2.2% | ||||||||
| Oppenheimer Institutional Government Money Market Fund, Cl. E, 1.95%9,10 (Cost $29,326,497) | 29,326,497 | 29,326,497 | ||||||
| Total Investments, at Value (Cost $1,391,616,396) | 102.1% | 1,380,856,337 | ||||||
| Net Other Assets (Liabilities) | (2.1) | (27,942,573 | ) | |||||
| Net Assets | 100.0% | $ | 1,352,913,764 | |||||
Footnotes to Statement of Investments
1. Represents the current interest rate for a variable or increasing rate security, determined as [Referenced Rate + Basis-point spread].
2. This security is not accruing income because its issuer has missed or is expected to miss interest and/or principal payments. The rate shown is the contractual interest rate. See Note 4 of the accompanying Notes.
3. The value of this security was determined using significant unobservable inputs. See Note 3 of the accompanying Notes.
4. This interest rate resets periodically. Interest rate shown reflects the rate in effect at period end. The rate on this variable rate security is not based on a published reference rate and spread but is determined by the issuer or agent based on current market conditions.
5. Interest or dividend is paid-in-kind, when applicable.
6. Represents securities sold under Rule 144A, which are exempt from registration under the Securities Act of 1933, as amended. These securities have been determined to be liquid under guidelines established by the Board of Directors. These securities amount to $5,488,631 or 0.41% of the Fund’s net assets at period end.
7. Non-income producing security.
8. Security received as the result of issuer reorganization.
9. Is or was an affiliate, as defined in the Investment Company Act of 1940, as amended, at or during the reporting period, by virtue of the Fund owning at least 5% of the voting securities of the issuer or as a result of the Fund and the issuer having the same investment adviser. Transactions during the reporting period in which the issuer was an affiliate are as follows:
| Shares September 30, 2017 |
Gross Additions |
Gross Reductions |
Shares September 30, 2018 |
|||||||||||||
| Common Stock | ||||||||||||||||
| Gymboree Corp. (The) | 76,198 | — | — | 76,198 | ||||||||||||
| Gymboree Holding Corp. (formerly Gymboree Corp. (The)) | 217,169 | — | — | 217,169 | ||||||||||||
28 OPPENHEIMER MASTER LOAN FUND, LLC
Footnotes to Statement of Investments (Continued)
| Shares September 30, 2017 |
Gross Additions |
Gross Reductions |
Shares September 30, 2018 |
|||||||||||||
| Investment Company | ||||||||||||||||
| Oppenheimer Institutional Government Money Market Fund, Cl. E | 162,655,983 | 547,906,544 | 681,236,030 | 29,326,497 | ||||||||||||
| Value | Income | Realized Gain (Loss) |
Change in Unrealized Gain (Loss) |
|||||||||||||
| Common Stock | ||||||||||||||||
| Gymboree Corp. (The) | $ | 938,226 | $ | 2,086 | $ | — | $ | (1,074,087) | ||||||||
| Gymboree Holding Corp. (formerly Gymboree Corp. (The)) | 2,674,002 | 5,945 | — | (3,061,214) | ||||||||||||
| Investment Company | ||||||||||||||||
| Oppenheimer Institutional Government Money Market Fund, Cl. E | 29,326,497 | 1,237,124 | — | — | ||||||||||||
| Total | $ | 32,938,725 | $ | 1,245,155 | $ | — | $ | (4,135,301) | ||||||||
10. Rate shown is the 7-day yield at period end.
| Glossary: | ||
| Definitions | ||
| LIBOR4 | London Interbank Offered Rate-Quarterly | |
| LIBOR6 | London Interbank Offered Rate-Bi-Monthly | |
| LIBOR12 | London Interbank Offered Rate-Monthly | |
| LIBOR52 | London Interbank Offered Rate-Weekly | |
| PRIME4 | United States Prime Rate-Quarterly |
See accompanying Notes to Financial Statements.
29 OPPENHEIMER MASTER LOAN FUND, LLC
STATEMENT OF ASSETS AND LIABILITIES September 30, 2018
| Assets | ||||
| Investments, at value—see accompanying statement of investments: | ||||
| Unaffiliated companies (cost $1,355,976,763) | $ | 1,347,917,612 | ||
| Affiliated companies (cost $35,639,633) | 32,938,725 | |||
| 1,380,856,337 | ||||
| Cash | 8,104,647 | |||
| Receivables and other assets: | ||||
| Investments sold | 16,432,009 | |||
| Interest and dividends | 3,667,017 | |||
| Shares of beneficial interest sold | 24,601 | |||
| Other | 63,948 | |||
| Total assets | 1,409,148,559 | |||
| Liabilities | ||||
| Payables and other liabilities: | ||||
| Investments purchased | 55,573,874 | |||
| Shares of beneficial interest redeemed | 345,546 | |||
| Directors’ compensation | 60,924 | |||
| Shareholder communications | 3,614 | |||
| Other | 250,837 | |||
| Total liabilities | 56,234,795 | |||
| Net Assets—applicable to 77,048,276 shares of beneficial interest outstanding | $ | 1,352,913,764 | ||
| Net Asset Value, Redemption Price and Offering Price Per Share | $17.56 |
See accompanying Notes to Financial Statements.
30 OPPENHEIMER MASTER LOAN FUND, LLC
OF OPERATIONS For the Year Ended September 30, 2018
| Investment Income | ||||
| Interest | $ | 81,303,792 | ||
| Dividends: | ||||
| Unaffiliated companies | 516,197 | |||
| Affiliated companies | 1,237,124 | |||
| Other income affiliated companies | 8,031 | |||
| Other income | 590,741 | |||
|
|
|
| ||
| Total investment income | 83,655,885 | |||
| Expenses | ||||
| Management fees | 4,268,701 | |||
| Transfer and shareholder servicing agent fees | 71,145 | |||
| Shareholder communications | 15,547 | |||
| Legal, auditing and other professional fees | 451,862 | |||
| Custodian fees and expenses | 324,825 | |||
| Directors’ compensation | 44,570 | |||
| Other | 20,991 | |||
|
|
|
| ||
| Total expenses | 5,197,641 | |||
| Less waivers and reimbursements of expenses | (90,560 | ) | ||
|
|
|
| ||
| Net expenses | 5,107,081 | |||
| Net Investment Income | 78,548,804 | |||
| Realized and Unrealized Gain (Loss) | ||||
| Net realized gain on investment transactions in unaffiliated companies | 9,365,637 | |||
| Net change in unrealized appreciation/depreciation on: | ||||
| Investment transactions in: | ||||
| Unaffiliated companies | (2,679,837 | ) | ||
| Affiliated companies | (4,135,301 | ) | ||
|
|
|
| ||
| Net change in unrealized appreciation/depreciation | (6,815,138 | ) | ||
| Net Increase in Net Assets Resulting from Operations | $ | 81,099,303 | ||
|
|
|
|
See accompanying Notes to Financial Statements.
31 OPPENHEIMER MASTER LOAN FUND, LLC
STATEMENTS OF CHANGES IN NET ASSETS
| Year Ended September 30, 2018 |
Year Ended September 30, 2017 | |||||||
| Operations | ||||||||
| Net investment income | $ | 78,548,804 | $ | 85,603,736 | ||||
| Net realized gain (loss) | 9,365,637 | (1,729,811 | ) | |||||
| Net change in unrealized appreciation/depreciation | (6,815,138 | ) | 6,367,731 | |||||
|
|
|
| ||||||
| Net increase in net assets resulting from operations | 81,099,303 | 90,241,656 | ||||||
| Beneficial Interest Transactions | ||||||||
| Net increase (decrease) in net assets resulting from beneficial interest transactions: | ||||||||
| Proceeds from contributions | 34,938,290 | 214,217,992 | ||||||
| Payments for withdrawals | (321,874,525 | ) | (152,387,750 | ) | ||||
|
|
|
| ||||||
| (286,936,235 | ) | 61,830,242 | ||||||
| Net Assets | ||||||||
| Total increase (decrease) | (205,836,932 | ) | 152,071,898 | |||||
| Beginning of period | 1,558,750,696 | 1,406,678,798 | ||||||
|
|
|
| ||||||
| End of period | $ | 1,352,913,764 | $ | 1,558,750,696 | ||||
|
|
|
| ||||||
See accompanying Notes to Financial Statements.
32 OPPENHEIMER MASTER LOAN FUND, LLC
| Year Ended September 30, |
Year Ended September 30, |
Year Ended September 30, |
Year Ended September 30, |
Year Ended September 30, | ||||||||||||||||
| Per Share Operating Data | ||||||||||||||||||||
| Net asset value, beginning of period | $16.58 | $15.61 | $14.64 | $14.51 | $13.84 | |||||||||||||||
| Income (loss) from investment operations: | ||||||||||||||||||||
| Net investment income1 | 0.94 | 0.92 | 0.84 | 0.74 | 0.74 | |||||||||||||||
| Net realized and unrealized gain (loss) | 0.04 | 0.05 | 0.13 | (0.61) | (0.07) | |||||||||||||||
|
|
|
| ||||||||||||||||||
| Total from investment operations | 0.98 | 0.97 | 0.97 | 0.13 | 0.67 | |||||||||||||||
| Net asset value, end of period | $17.56 | $16.58 | $15.61 | $14.64 | $14.51 | |||||||||||||||
|
|
|
| ||||||||||||||||||
| Total Return, at Net Asset Value2 | 5.91% | 6.21% | 6.63% | 0.90% | 4.84% | |||||||||||||||
| Ratios/Supplemental Data | ||||||||||||||||||||
| Net assets, end of period (in thousands) | $1,352,914 | $1,558,751 | $1,406,679 | $1,271,836 | $1,501,073 | |||||||||||||||
| Average net assets (in thousands) | $1,422,464 | $1,521,122 | $1,205,754 | $1,321,015 | $1,398,916 | |||||||||||||||
| Ratios to average net assets:3 | ||||||||||||||||||||
| Net investment income | 5.52% | 5.63% | 5.70% | 5.06% | 5.15% | |||||||||||||||
| Total expenses4 | 0.37% | 0.36% | 0.36% | 0.35% | 0.34% | |||||||||||||||
| Expenses after payments, waivers and/or reimbursements and reduction to custodian expenses | 0.36% | 0.35% | 0.36%5 | 0.35%5 | 0.33% | |||||||||||||||
| Portfolio turnover rate | 66% | 80% | 74% | 57% | 73% | |||||||||||||||
1. Per share amounts calculated based on the average shares outstanding during the period.
2. Assumes an initial investment on the business day before the first day of the fiscal period, with all dividends and distributions reinvested in additional shares on the reinvestment date, and redemption at the net asset value calculated on the last business day of the fiscal period. Sales charges are not reflected in the total returns. Total returns are not annualized for periods less than one full year. Returns do not reflect the deduction of taxes that a shareholder would pay on fund distributions or the redemption of fund shares.
3. Annualized for periods less than one full year.
4. Total expenses including indirect expenses from affiliated fund fees and expenses were as follows:
| Year Ended September 30, 2018 | 0.38 | % | ||||||
| Year Ended September 30, 2017 | 0.37 | % | ||||||
| Year Ended September 30, 2016 | 0.36 | % | ||||||
| Year Ended September 30, 2015 | 0.35 | % | ||||||
| Year Ended September 30, 2014 | 0.35 | % |
5. Waiver was less than 0.005%.
See accompanying Notes to Financial Statements.
33 OPPENHEIMER MASTER LOAN FUND, LLC
NOTES TO FINANCIAL STATEMENTS September 30, 2018
1. Organization
Oppenheimer Master Loan Fund, LLC (the “Fund”) is organized as a Delaware limited liability company and registered under the Investment Company Act of 1940 (“1940 Act”), as amended, as a diversified open-end, management investment company. The Fund’s investment objective is to seek income. The Fund’s investment adviser is OFI Global Asset Management, Inc. (“OFI Global” or the “Manager”), a wholly-owned subsidiary of OppenheimerFunds, Inc. (“OFI” or the “Sub-Adviser”). The Manager has entered into a sub-advisory agreement with OFI.
Shares of the Fund are issued solely in private placement transactions that do not involve any “public offering” within the meaning of Section 4(a)(2) of the Securities Act of 1933, as amended (the “Securities Act”). Investments in the Fund may only be made by certain “accredited investors” within the meaning of Regulation D under the Securities Act, including other investment companies. The Fund currently offers one class of shares.
For federal income tax purposes, the Fund qualifies as a partnership, and each investor in the Fund is treated as the owner of its proportionate share of the net assets, income, expenses, and realized and unrealized gains and losses of the Fund. Accordingly, as a “pass-through” entity, the Fund pays no dividends or capital gain distributions.
The following is a summary of significant accounting policies followed in the Fund’s preparation of financial statements in accordance with accounting principles generally accepted in the United States (“U.S. GAAP”).
2. Significant Accounting Policies
Security Valuation. All investments in securities are recorded at their estimated fair value, as described in Note 3.
Investment Income. Dividend income is recorded on the ex-dividend date or upon ex-dividend notification in the case of certain foreign dividends where the ex-dividend date may have passed. Non-cash dividends included in dividend income, if any, are recorded at the fair value of the securities received. Withholding taxes on foreign dividends, if any, and capital gains taxes on foreign investments, if any, have been provided for in accordance with the Fund’s understanding of the applicable tax rules and regulations. Interest income, if any, is recognized on an accrual basis. Discount and premium, which are included in interest income on the Statement of Operations, are amortized or accreted daily.
Custodian Fees. “Custodian fees and expenses” in the Statement of Operations may include interest expense incurred by the Fund on any cash overdrafts of its custodian account during the period. Such cash overdrafts may result from the effects of failed trades in portfolio securities and from cash outflows resulting from unanticipated shareholder redemption activity. The Fund pays interest to its custodian on such cash overdrafts, to the extent they are not offset by positive cash balances maintained by the Fund, at a rate equal to the Federal Funds Rate plus 0.50%. The “Reduction to custodian expenses” line item, if applicable, represents earnings on cash balances maintained by the Fund during the period. Such interest
34 OPPENHEIMER MASTER LOAN FUND, LLC
2. Significant Accounting Policies (Continued)
expense and other custodian fees may be paid with these earnings.
Security Transactions. Security transactions are recorded on the trade date. Realized gains and losses on securities sold are determined on the basis of identified cost.
Indemnifications. The Fund’s organizational documents provide current and former Directors and officers with a limited indemnification against liabilities arising in connection with the performance of their duties to the Fund. In the normal course of business, the Fund may also enter into contracts that provide general indemnifications. The Fund’s maximum exposure under these arrangements is unknown as this would be dependent on future claims that may be made against the Fund. The risk of material loss from such claims is considered remote.
Federal Taxes. The Fund, as an entity, will not be subject to U.S. federal income tax. The Fund will be treated for U.S. federal income tax purposes as a partnership, and not as an association taxable as a corporation. Therefore, a tax provision is not required. Each shareholder is required for U.S. federal income tax purposes to take into account, in its taxable year with which (or within which a taxable year of the Fund ends), its distributive share of all items of Fund income, gains, losses, and deductions for such taxable year of the Fund. A shareholder must take such items into account even if the Fund does not distribute cash or other property to such shareholder during its taxable year.
Although the Fund is treated as a partnership for Federal tax purposes, it is intended that the Fund’s assets, income and distributions will be managed in such a way that investment in the Fund would not cause an investor that is a regulated investment company under Subchapter M of the Code (“RIC”) to fail that qualification.
The Fund has analyzed its tax positions for the fiscal year ended September 30, 2018, including open tax years, and does not believe there are any uncertain tax positions requiring recognition in the Fund’s financial statements.
Use of Estimates. The preparation of financial statements in conformity with U.S. GAAP requires management to make estimates and assumptions that affect the reported amounts of assets and liabilities and disclosure of contingent assets and liabilities at the date of the financial statements and the reported amounts of increases and decreases in net assets from operations during the reporting period. Actual results could differ from those estimates.
New Accounting Pronouncement. In March 2017, Financial Accounting Standards Board (“FASB”) issued Accounting Standards Update (“ASU”), ASU 2017-08. This provides guidance related to the amortization period for certain purchased callable debt securities held at a premium. The ASU is effective for annual periods beginning after December 15, 2018, and interim periods within those annual periods. The Manager is evaluating the impacts of these changes on the financial statements.
35 OPPENHEIMER MASTER LOAN FUND, LLC
NOTES TO FINANCIAL STATEMENTS Continued
3. Securities Valuation
The Fund calculates the net asset value of its shares as of 4:00 P.M. Eastern Time, on each day the New York Stock Exchange (the “Exchange”) is open for trading, except in the case of a scheduled early closing of the Exchange, in which case the Fund will calculate net asset value of the shares as of the scheduled early closing time of the Exchange.
The Fund’s Board has adopted procedures for the valuation of the Fund’s securities and has delegated the day-to-day responsibility for valuation determinations under those procedures to the Manager. The Manager has established a Valuation Committee which is responsible for determining a fair valuation for any security for which market quotations are not readily available. The Valuation Committee’s fair valuation determinations are subject to review, approval and ratification by the Fund’s Board at least quarterly or more frequently, if necessary.
Valuation Methods and Inputs
Securities are valued primarily using unadjusted quoted market prices, when available, as supplied by third party pricing services or broker-dealers.
The following methodologies are used to determine the market value or the fair value of the types of securities described below:
Equity securities traded on a securities exchange (including exchange-traded derivatives other than futures and futures options) are valued based on the official closing price on the principal exchange on which the security is traded, as identified by the Manager, prior to the time when the Fund’s assets are valued. If the official closing price is unavailable, the security is valued at the last sale price on the principal exchange on which it is traded, or if no sales occurred, the security is valued at the mean between the quoted bid and asked prices. Over-the-counter equity securities are valued at the last published sale price, or if no sales occurred, at the mean between the quoted bid and asked prices. Events occurring after the close of trading on foreign exchanges may result in adjustments to the valuation of foreign securities to more accurately reflect their fair value as of the time when the Fund’s assets are valued.
Shares of a registered investment company that are not traded on an exchange are valued at that investment company’s net asset value per share.
Corporate and government debt securities (of U.S. or foreign issuers) and municipal debt securities, short-term notes, mortgage-backed securities, collateralized mortgage obligations, and asset-backed securities are valued at the mean between the bid and asked prices utilizing evaluated prices obtained from third party pricing services or broker-dealers who may use matrix pricing methods to determine the evaluated prices. Pricing services generally price debt securities assuming orderly transactions of an institutional “round lot” size, but some trades may occur in smaller, “odd lot” sizes, sometimes at lower prices than institutional round lot trades. Standard inputs generally considered by third-party pricing vendors include reported trade data, broker-dealer price quotations, benchmark yields, issuer spreads on comparable securities, the credit quality, yield, maturity, as well as other appropriate factors.
Loans are valued at the mean between the bid and asked prices utilizing evaluated prices obtained from third party pricing services or broker-dealers. Standard inputs generally considered by third-party pricing vendors include information obtained from market
36 OPPENHEIMER MASTER LOAN FUND, LLC
3. Securities Valuation (Continued)
participants regarding broker-dealer price quotations.
Securities for which market quotations are not readily available, or when a significant event has occurred that would materially affect the value of the security, are fair valued either (i) by a standardized fair valuation methodology applicable to the security type or the significant event as previously approved by the Valuation Committee and the Fund’s Board or (ii) as determined in good faith by the Manager’s Valuation Committee. The Valuation Committee considers all relevant facts that are reasonably available, through either public information or information available to the Manager, when determining the fair value of a security. Those standardized fair valuation methodologies include, but are not limited to, valuing securities at the last sale price or initially at cost and subsequently adjusting the value based on: changes in company specific fundamentals, changes in an appropriate securities index, or changes in the value of similar securities which may be further adjusted for any discounts related to security-specific resale restrictions. When possible, such methodologies use observable market inputs such as unadjusted quoted prices of similar securities, observable interest rates, currency rates and yield curves. The methodologies used for valuing securities are not necessarily an indication of the risks associated with investing in those securities nor can it be assured that the Fund can obtain the fair value assigned to a security if it were to sell the security.
To assess the continuing appropriateness of security valuations, the Manager regularly compares prior day prices and sale prices to the current day prices and challenges those prices exceeding certain tolerance levels with the third party pricing service or broker source. For those securities valued by fair valuations, whether through a standardized fair valuation methodology or a fair valuation determination, the Valuation Committee reviews and affirms the reasonableness of the valuations based on such methodologies and fair valuation determinations on a regular basis after considering all relevant information that is reasonably available.
Classifications
Each investment asset or liability of the Fund is assigned a level at measurement date based on the significance and source of the inputs to its valuation. Various data inputs may be used in determining the value of each of the Fund’s investments as of the reporting period end.
These data inputs are categorized in the following hierarchy under applicable financial accounting standards:
1) Level 1-unadjusted quoted prices in active markets for identical assets or liabilities (including securities actively traded on a securities exchange)
2) Level 2-inputs other than unadjusted quoted prices that are observable for the asset or liability (such as unadjusted quoted prices for similar assets and market corroborated inputs such as interest rates, prepayment speeds, credit risks, etc.)
3) Level 3-significant unobservable inputs (including the Manager’s own judgments about assumptions that market participants would use in pricing the asset or liability).
The inputs used for valuing securities are not necessarily an indication of the risks associated
37 OPPENHEIMER MASTER LOAN FUND, LLC
NOTES TO FINANCIAL STATEMENTS Continued
3. Securities Valuation (Continued)
with investing in those securities.
The Fund classifies each of its investments in investment companies which are publicly offered as Level 1. Investment companies that are not publicly offered, if any, are classified as Level 2 in the fair value hierarchy.
The table below categorizes amounts that are included in the Fund’s Statement of Assets and Liabilities at period end based on valuation input level:
| Level 1— Unadjusted Quoted Prices |
Level 2— Other Significant Observable Inputs |
Level 3— Significant Unobservable Inputs |
Value | |||||||||||||
| Assets Table | ||||||||||||||||
| Investments, at Value: | ||||||||||||||||
| Corporate Loans | $ | — | $ | 1,262,911,711 | $ | 25,148,106 | $ | 1,288,059,817 | ||||||||
| Corporate Bonds and Notes | — | 8,966,756 | 1 | 8,966,757 | ||||||||||||
| Common Stocks | 37,772,304 | 16,078,916 | 614,274 | 54,465,494 | ||||||||||||
| Rights, Warrants and Certificates | — | — | 37,772 | 37,772 | ||||||||||||
| Investment Company | 29,326,497 | — | — | 29,326,497 | ||||||||||||
| Total Assets | $ | 67,098,801 | $ | 1,287,957,383 | $ | 25,800,153 | $ | 1,380,856,337 | ||||||||
Forward currency exchange contracts and futures contracts, if any, are reported at their unrealized appreciation/depreciation at measurement date, which represents the change in the contract’s value from trade date. All additional assets and liabilities included in the above table are reported at their market value at measurement date.
The table below shows the transfers between Level 2 and Level 3. The Fund’s policy is to recognize transfers in and transfers out as of the beginning of the reporting period.
|
Transfers into Level 2* |
Transfers out of Level 2** |
Transfers into Level 3** |
Transfers out of Level 3* |
|||||||||||||
| Assets Table | ||||||||||||||||
| Investments, at Value: | ||||||||||||||||
| Corporate Loans | $ | – | $ | (111,534) | $ | 111,534 | $ | – | ||||||||
| Common Stocks | 923,281 | (664,992) | 664,992 | (923,281) | ||||||||||||
| Rights, Warrants and Certificates | – | (34,367) | 34,367 | – | ||||||||||||
| Total Assets | $ | 923,281 | $ | (810,893) | $ | 810,893 | $ | (923,281) | ||||||||
* Transferred from Level 3 to Level 2 due to the availability of market data for this security.
** Transferred from Level 2 to Level 3 because of the lack of observable market data due to a decrease in market activity for these securities.
The following is a reconciliation of assets in which significant unobservable inputs (level 3) were used in determining fair value:
38 OPPENHEIMER MASTER LOAN FUND, LLC
3. Securities Valuation (Continued)
| Value as of September 30, 2017 |
Realized gain (loss) |
Change in unrealized appreciation/ depreciation |
Accretion/ (amortization) of premium/ discounta |
|||||||||||||
| Assets Table | ||||||||||||||||
| Investments, at Value: | ||||||||||||||||
| Corporate Loans | $ | 31,533,762 | $ | 38,108 | $ | 473,095 | $ | 15,138 | ||||||||
| Corporate Bonds and Notes | 1 | — | — | — | ||||||||||||
| Common Stocks | 3,642,133 | 3,952,650 | (2,743,433) | — | ||||||||||||
| Rights, Warrants and Certificates | — | — | (12,285) | — | ||||||||||||
| Total Assets | $ | 35,175,896 | $ | 3,990,758 | $ | (2,282,623) | $ | 15,138 | ||||||||
a. Included in net investment income.
| Purchases | Sales | Transfers into Level 3 |
Transfers out of Level 3 |
Value as of September 30, 2018 |
||||||||||||||||
| Assets Table | ||||||||||||||||||||
| Investments, at Value: | ||||||||||||||||||||
| Corporate Loans | $ | 292,356 | $ | (7,315,887) | $ | 111,534 | $ | — | $ | 25,148,106 | ||||||||||
| Corporate Bonds and Notes | — | — | — | — | 1 | |||||||||||||||
| Common Stocks | — | (3,978,787) | 664,992 | (923,281) | 614,274 | |||||||||||||||
| Rights, Warrants and Certificates | 15,690 | — | 34,367 | — | 37,772 | |||||||||||||||
| Total Assets | $ | 308,046 | $ | (11,294,674) | $ | 810,893 | $ | (923,281) | $ | 25,800,153 | ||||||||||
The total change in unrealized appreciation/depreciation included in the Statement of Operations attributable to Level 3 investments still held at period end:
| Change in unrealized appreciation/ depreciation |
||||
| Assets Table | ||||
| Investments, at Value: | ||||
| Corporate Loans | $ | 436,671 | ||
| Common Stocks | (317,114) | |||
| Rights, Warrants and Certificates | (12,285) | |||
| Total Assets | $ | 107,272 | ||
The following table summarizes the valuation techniques and significant unobservable inputs used in determining fair value measurements for those investments classified as Level 3 at period end:
39 OPPENHEIMER MASTER LOAN FUND, LLC
NOTES TO FINANCIAL STATEMENTS Continued
3. Securities Valuation (Continued)
| Value as of September 30, 2018 |
Valuation Technique |
Unobservable Input |
Range of Unobservable Inputs |
Unobservable Input Used |
||||||||||||||||
| Assets Table | ||||||||||||||||||||
| Investments, at Value: | ||||||||||||||||||||
| Corporate Loans | $ | 12,371,828 | Broker quote | N/A | N/A | N/A (a) | ||||||||||||||
| Corporate Loans | 122,166 | Pricing service | N/A | N/A | N/A (a) | |||||||||||||||
| Corporate Loans | 12,654,112 | |
Discounted Cash Flow Model |
|
|
Illiquidity Discount |
|
N/A | 3.69% (b) | |||||||||||
| Implied Rating | N/A | BB+ | ||||||||||||||||||
| |
Yield to Maturity |
|
N/A | 5.19% | ||||||||||||||||
| Corporate Bonds and Notes | 1 | |
Estimated Recovery Proceeds |
|
Nominal Value | N/A | |
0.0001% of Par (c) |
| |||||||||||
| Common Stocks | 347,873 | Pricing service | N/A | N/A | N/A (a) | |||||||||||||||
| Common Stocks | 163 | |
Estimated Recovery Proceeds |
|
Nominal Value | N/A | $0.01/share (c) | |||||||||||||
| Common Stocks | 219,358 | |
Estimated Recovery Proceeds |
|
|
Market Value of Original Loan |
|
N/A | |
$0.0189/share (d) |
| |||||||||
| Common Stocks | 46,880 | |
Estimated Recovery Proceeds |
|
|
Auction Proceeds |
|
N/A | $0.06/share (e) | |||||||||||
| Rights, Warrants and Certificates | 37,772 | Pricing service | N/A | N/A | N/A (a) | |||||||||||||||
|
|
|
|
||||||||||||||||||
| Total | $ | 25,800,153 | ||||||||||||||||||
|
|
|
|
||||||||||||||||||
(a) Securities classified as Level 3 whose unadjusted values were provided by a pricing service or broker-dealer for which such inputs are unobservable. The Manager periodically reviews pricing vendor and broker methodologies and inputs to confirm they are determined using unobservable inputs and have been appropriately classified. Such securities’ fair valuations could change significantly based on changes in unobservable inputs used by the pricing service or broker.
(b) The Fund fair values certain corporate loans using a discounted cash flow model which incorporates the Company’s EBITDA and leverage to determine an implied rating. The yield to maturity on other issues with similar leverage and rating is used as a basis for the discount rate, with an additional illiquidity discount applied. The illiquidity discount was determined based on the implied discount rate at origination. The Manager periodically reviews the financial statements and monitors such investments for additional market information or the occurrence of a significant event which would warrant a re-evaluation of the security’s fair valuation. Such security’s fair valuation could increase (decrease) significantly based on a decrease (increase) in the illiquidity discount. Such security’s fair valuation could also increase (decrease) based on an increase (decrease) in the implied rating or a decrease (increase) in the yield to maturity on other issues.
(c) The Fund fair values certain securities held at a nominal value to reflect the low probability of receipt of future payments to be received. The Manager monitors such investments for additional market information or the occurrence of a significant event which would warrant a re-evaluation of the security’s fair valuation.
(d) The Fund fair values certain common stocks received from a restructuring at the estimated amount of future recovery proceeds. This estimate is based on the market value of the original loan held prior to the restructuring (as determined by a pricing service) less the cash distributions received following restructuring. The Manager monitors such investments for additional market information or the occurrence of a significant event which would warrant a
40 OPPENHEIMER MASTER LOAN FUND, LLC
3. Securities Valuation (Continued)
re-evaluation of the security’s fair valuation. A significant increase (decrease) in the market value of the original loan position will result in a significant increase (decrease) to the fair value of the investment.
(e) The Fund fair values certain common stocks received following a merger at the estimated amount of future recovery proceeds from the sale of assets as disclosed within the Company’s financial statements. The Manager monitors such investments for additional market information or the occurrence of a significant event which would warrant a re-evaluation of the security’s fair valuation. A significant increase (decrease) in the auction proceeds will result in a significant increase (decrease) to the fair value of the investment.
4. Investments and Risks
Investments in Affiliated Funds. The Fund is permitted to invest in other mutual funds advised by the Manager (“Affiliated Funds”). Affiliated Funds are open-end management investment companies registered under the 1940 Act, as amended. The Manager is the investment adviser of, and the Sub-Adviser provides investment and related advisory services to, the Affiliated Funds. When applicable, the Fund’s investments in Affiliated Funds are included in the Statement of Investments. Shares of Affiliated Funds are valued at their net asset value per share. As a shareholder, the Fund is subject to its proportional share of the Affiliated Funds’ expenses, including their management fee. The Manager will waive fees and/ or reimburse Fund expenses in an amount equal to the indirect management fees incurred through the Fund’s investment in the Affiliated Funds.
Each of the Affiliated Funds in which the Fund invests has its own investment risks, and those risks can affect the value of the Fund’s investments and therefore the value of the Fund’s shares. To the extent that the Fund invests more of its assets in one Affiliated Fund than in another, the Fund will have greater exposure to the risks of that Affiliated Fund.
Investments in Money Market Instruments. The Fund is permitted to invest its free cash balances in money market instruments to provide liquidity or for defensive purposes. The Fund may invest in money market instruments by investing in Class E shares of Oppenheimer Institutional Government Money Market Fund (“IGMMF”), which is an Affiliated Fund. IGMMF is regulated as a money market fund under the 1940 Act, as amended. The Fund may also invest in money market instruments directly or in other affiliated or unaffiliated money market funds.
Loans. Under normal market conditions, the Fund will invest at least 80% of its net assets in loans made to U.S. and foreign borrowers that are corporations, partnerships or other business entities. The Fund will do so directly as an original lender or by assignment or indirectly through participation agreements or certain derivative instruments. While many of these loans will be collateralized, the Fund can also invest in uncollateralized loans. Loans are often issued in connection with recapitalizations, acquisitions, leveraged buyouts, and refinancing of borrowers. The loans often pay interest at rates that float above (or are adjusted periodically based on) a benchmark that reflects current interest rates although the Fund can also invest in loans with fixed interest rates.
When investing in loans, the Fund generally will have a contractual relationship only with
41 OPPENHEIMER MASTER LOAN FUND, LLC
NOTES TO FINANCIAL STATEMENTS Continued
4. Investments and Risks (Continued)
the lender, not with the relevant borrower. As a result, the Fund generally will have the right to receive payments of principal, interest, and any fees to which it is entitled only from the lender selling the participation and only upon receipt by the lender of the payments from the relevant borrower. The Fund may not directly benefit from the collateral supporting the debt obligation in which it has purchased the participation. As a result, the Fund will assume the credit risk of both the borrower and the institution selling the participation to the Fund.
At period end, securities with an aggregate market value of $1,288,059,817, representing 95.2% of the Fund’s net assets were comprised of loans.
Securities on a When-Issued or Delayed Delivery Basis. The Fund purchases and sells interests in Senior Loans and other portfolio securities on a “when issued” basis, and may purchase or sell securities on a “delayed delivery” basis. “When-issued” or “delayed delivery” refers to securities whose terms and indenture are available and for which a market exists, but which are not available for immediate delivery. Delivery and payment for securities that have been purchased by the Fund on a when-issued basis normally takes place within six months and possibly as long as two years or more after the trade date. During this period, such securities do not earn interest, are subject to market fluctuation and may increase or decrease in value prior to their delivery. The purchase of securities on a when-issued basis may increase the volatility of the Fund’s net asset value to the extent the Fund executes such transactions while remaining substantially fully invested. When the Fund engages in when-issued or delayed delivery transactions, it relies on the buyer or seller, as the case may be, to complete the transaction. Their failure to do so may cause the Fund to lose the opportunity to obtain or dispose of the security at a price and yield it considers advantageous. The Fund may also sell securities that it purchased on a when-issued basis or forward commitment prior to settlement of the original purchase.
Equity Security Risk. Stocks and other equity securities fluctuate in price. The value of the Fund’s portfolio may be affected by changes in the equity markets generally. Equity markets may experience significant short-term volatility and may fall sharply at times. Different markets may behave differently from each other and U.S. equity markets may move in the opposite direction from one or more foreign stock markets. Adverse events in any part of the equity or fixed-income markets may have unexpected negative effects on other market segments.
The prices of individual equity securities generally do not all move in the same direction at the same time and a variety of factors can affect the price of a particular company’s securities. These factors may include, but are not limited to, poor earnings reports, a loss of customers, litigation against the company, general unfavorable performance of the company’s sector or industry, or changes in government regulations affecting the company or its industry.
Credit Risk. Loans and debt securities are subject to credit risk. Credit risk relates to the ability of the borrower under a loan or issuer of a debt to meet interest or principal payments or both as they become due. The Fund may acquire securities that have missed an interest payment, and is not obligated to dispose of securities whose issuers subsequently miss an
42 OPPENHEIMER MASTER LOAN FUND, LLC
4. Investments and Risks (Continued)
interest and/or principal payment.
Information concerning securities not accruing income at period end is as follows:
| Cost |
$ | 41,616,106 | ||
| Market Value |
$ | 34,040,468 | ||
| Market Value as % of Net Assets |
2.52% |
Shareholder Concentration. At period end, 100% of the shares of the Fund were owned by the Manager, other funds advised or sub-advised by the Manager or an affiliate of the Manager.
5. Market Risk Factors
The Fund’s investments in securities and/or financial derivatives may expose the Fund to various market risk factors:
Commodity Risk. Commodity risk relates to the change in value of commodities or commodity indexes as they relate to increases or decreases in the commodities market. Commodities are physical assets that have tangible properties. Examples of these types of assets are crude oil, heating oil, metals, livestock, and agricultural products.
Credit Risk. Credit risk relates to the ability of the issuer of debt to meet interest and principal payments, or both, as they come due. In general, lower-grade, higher-yield debt securities are subject to credit risk to a greater extent than lower-yield, higher-quality securities.
Equity Risk. Equity risk relates to the change in value of equity securities as they relate to increases or decreases in the general market.
Foreign Exchange Rate Risk. Foreign exchange rate risk relates to the change in the U.S. dollar value of a security held that is denominated in a foreign currency. The U.S. dollar value of a foreign currency denominated security will decrease as the dollar appreciates against the currency, while the U.S. dollar value will increase as the dollar depreciates against the currency.
Interest Rate Risk. Interest rate risk refers to the fluctuations in value of fixed-income securities resulting from the inverse relationship between price and yield. For example, an increase in general interest rates will tend to reduce the market value of already issued fixed-income investments, and a decline in general interest rates will tend to increase their value. In addition, debt securities with longer maturities, which tend to have higher yields, are subject to potentially greater fluctuations in value from changes in interest rates than obligations with shorter maturities.
Volatility Risk. Volatility risk refers to the magnitude of the movement, but not the direction of the movement, in a financial instrument’s price over a defined time period. Large increases or decreases in a financial instrument’s price over a relative time period typically indicate greater volatility risk, while small increases or decreases in its price typically indicate lower volatility risk.
43 OPPENHEIMER MASTER LOAN FUND, LLC
NOTES TO FINANCIAL STATEMENTS Continued
6. Shares of Beneficial Interest
The Fund has authorized an unlimited number of $0.001 par value shares of beneficial interest. Transactions in shares of beneficial interest were as follows:
| Year Ended September 30, 2018 | Year Ended September 30, 2017 | |||||||||||||||
| Shares | Amount | Shares | Amount | |||||||||||||
| Contributions | 2,054,263 | $ | 34,938,290 | 13,281,509 | $ | 214,217,992 | ||||||||||
| Withdrawals | (19,004,662 | ) | (321,874,525 | ) | (9,401,916 | ) | (152,387,750 | ) | ||||||||
| Net increase (decrease) | (16,950,399 | ) | $ | (286,936,235 | ) | 3,879,593 | $ | 61,830,242 | ||||||||
7. Purchases and Sales of Securities
The aggregate cost of purchases and proceeds from sales of securities, other than short-term obligations and investments in IGMMF, for the reporting period were as follows:
| Purchases | Sales | |||||||
| Investment securities | $909,195,321 | $1,011,265,774 | ||||||
8. Fees and Other Transactions with Affiliates
Management Fees. Under the investment advisory agreement, the Fund pays the Manager a management fee based on the daily net assets of the Fund at an annual rate of 0.30%.
Sub-Adviser Fees. The Manager has retained the Sub-Adviser to provide the day-to-day portfolio management of the Fund. Under the Sub-Advisory Agreement, the Manager pays the Sub-Adviser an annual fee in monthly installments, equal to a percentage of the investment management fee collected by the Manager from the Fund, which shall be calculated after any investment management fee waivers. The fee paid to the Sub-Adviser is paid by the Manager, not by the Fund.
Transfer Agent Fees. OFI Global (the “Transfer Agent”) serves as the transfer and shareholder servicing agent for the Fund. The Fund pays the Transfer Agent a fee based on annual net assets, which shall be calculated after any applicable fee waivers. Fees incurred and average net assets with respect to these services are detailed in the Statement of Operations and Financial Highlights, respectively.
Sub-Transfer Agent Fees. The Transfer Agent has retained Shareholder Services, Inc., a wholly-owned subsidiary of OFI (the “Sub-Transfer Agent”), to provide the day-to-day transfer agent and shareholder servicing of the Fund. Under the Sub-Transfer Agency Agreement, the Transfer Agent pays the Sub-Transfer Agent an annual fee in monthly installments, equal to a percentage of the transfer agent fee collected by the Transfer Agent from the Fund, which shall be calculated after any applicable fee waivers. The fee paid to the Sub-Transfer Agent is paid by the Transfer Agent, not by the Fund.
Directors’ Compensation. The Fund’s Board of Directors (“Board”) has adopted a compensation deferral plan for Independent Directors that enables Directors to elect to defer receipt of all or a portion of the annual compensation they are entitled to receive from the
44 OPPENHEIMER MASTER LOAN FUND, LLC
8. Fees and Other Transactions with Affiliates (Continued)
Fund. For purposes of determining the amount owed to the Directors under the plan, deferred amounts are treated as though equal dollar amounts had been invested in shares of the Fund or in other Oppenheimer funds selected by the Directors. The Fund purchases shares of the funds selected for deferral by the Directors in amounts equal to his or her deemed investment, resulting in a Fund asset equal to the deferred compensation liability. Such assets are included as a component of “Other” within the asset section of the Statement of Assets and Liabilities. Deferral of Directors’ fees under the plan will not affect the net assets of the Fund and will not materially affect the Fund’s assets, liabilities or net investment income per share. Amounts will be deferred until distributed in accordance with the compensation deferral plan.
Waivers and Reimbursements of Expenses. The Manager will waive fees and/or reimburse Fund expenses in an amount equal to the indirect management fees incurred through the Fund’s investment in IGMMF. During the reporting period, the Manager waived fees and/or reimbursed the Fund $90,560 for IGMMF management fees. This fee waiver and/ or expense reimbursement may not be amended or withdrawn for one year from the date of the Fund’s prospectus, unless approved by the Board.
9. Borrowing and Other Financing
Loan Commitments. Pursuant to the terms of certain credit agreements, the Fund has unfunded loan commitments of $613,164 at period end. The Fund generally will maintain with its custodian, liquid investments having an aggregate value at least equal to the par value of unfunded loan commitments. At period end, these investments have a market value of $614,075 and have been included as Corporate Loans in the Statement of Investments.
10. Subsequent Event
On October 18, 2018, Massachusetts Mutual Life Insurance Company (“MassMutual”), an indirect corporate parent of the Sub-Adviser and the Manager announced that it has entered into a definitive agreement, whereby Invesco Ltd. (“Invesco”), a global investment management company, will acquire the Sub-Adviser. As of the time of the announcement, the transaction is expected to close in the second quarter of 2019, pending necessary regulatory and other third-party approvals. This is subject to change.
45 OPPENHEIMER MASTER LOAN FUND, LLC
REPORT OF INDEPENDENT REGISTERED PUBLIC ACCOUNTING FIRM
To the Shareholders and Board of Directors
Oppenheimer Master Loan Fund, LLC:
Opinion on the Financial Statements
We have audited the accompanying statement of assets and liabilities of Oppenheimer Master Loan Fund, LLC (the “Fund”), including the statement of investments, as of September 30, 2018, the related statement of operations for the year then ended, the statements of changes in net assets for each of the years in the two year period then ended, and the related notes (collectively, the “financial statements”) and the financial highlights for each of the years in the five year period then ended. In our opinion, the financial statements and financial highlights present fairly, in all material respects, the financial position of the Fund as of September 30, 2018, the results of its operations for the year then ended, the changes in its net assets for each of the years in the two year period then ended, and the financial highlights for each of the years in the five year period then ended, in conformity with U.S. generally accepted accounting principles.
Basis for Opinion
These financial statements and financial highlights are the responsibility of the Fund’s management. Our responsibility is to express an opinion on these financial statements and financial highlights based on our audits. We are a public accounting firm registered with the Public Company Accounting Oversight Board (United States) (“PCAOB”) and are required to be independent with respect to the Fund in accordance with the U.S. federal securities laws and the applicable rules and regulations of the Securities and Exchange Commission and the PCAOB.
We conducted our audits in accordance with the standards of the PCAOB. Those standards require that we plan and perform the audit to obtain reasonable assurance about whether the financial statements and financial highlights are free of material misstatement, whether due to error or fraud. Our audits included performing procedures to assess the risks of material misstatement of the financial statements and financial highlights, whether due to error or fraud, and performing procedures that respond to those risks. Such procedures included examining, on a test basis, evidence regarding the amounts and disclosures in the financial statements and financial highlights. Such procedures also included confirmation of securities owned as of September 30, 2018, by correspondence with the custodian, brokers and the transfer agent, or by other appropriate auditing procedures. Our audits also included evaluating the accounting principles used and significant estimates made by management, as well as evaluating the overall presentation of the financial statements and financial highlights. We believe that our audits provide a reasonable basis for our opinion.
KPMG LLP
We have not been able to determine the specific year that we began serving as the auditor of one or more Oppenheimer Funds investment companies, however we are aware that we have served as the auditor of one or more Oppenheimer Funds investment companies since at least 1969.
Denver, Colorado
November 21, 2018
46 OPPENHEIMER MASTER LOAN FUND, LLC
BOARD APPROVAL OF THE FUND’S INVESTMENT ADVISORY
AND SUB-ADVISORY AGREEMENTS Unaudited
The Fund has entered into an investment advisory agreement with OFI Global Asset Management, Inc. (“OFI Global” or the “Adviser”), a wholly-owned subsidiary of OppenheimerFunds, Inc. (“OFI” or the “Sub-Adviser”) (“OFI Global” and “OFI” together the “Managers”) and OFI Global has entered into a sub-advisory agreement with OFI whereby OFI provides investment sub-advisory services to the Fund (collectively, the “Agreements”). Each year, the Board of Directors (the “Board”), including a majority of the independent Trustees, is required to determine whether to approve the terms of the Agreements and the renewal thereof. The Investment Company Act of 1940, as amended, requires that the Board request and evaluate, and that the Managers provide, such information as may be reasonably necessary to evaluate the terms of the Agreements. The Board employs an independent consultant to prepare a report that provides information, including comparative information that the Board requests for that purpose. In addition to in-person meetings focused on this evaluation, the Board receives information throughout the year regarding Fund services, fees, expenses and performance.
The Managers and the independent consultant provided information to the Board on the following factors: (i) the nature, quality and extent of the Managers’ services, (ii) the comparative investment performance of the Fund and the Managers, (iii) the fees and expenses of the Fund, including comparative fee and expense information, (iv) the profitability of the Managers and their affiliates, including an analysis of the cost of providing services, (v) whether economies of scale are realized as the Fund grows and whether fee levels reflect these economies of scale for Fund investors and (vi) other benefits to the Managers from their relationship with the Fund. The Board was aware that there are alternatives to retaining the Managers.
Outlined below is a summary of the principal information considered by the Board as well as the Board’s conclusions.
Nature, Quality and Extent of Services. The Board considered information about the nature, quality and extent of the services provided to the Fund and information regarding the Managers’ key personnel who provide such services. The Managers’ duties include providing the Fund with the services of the Sub-Adviser’s portfolio managers and investment team, who provide research, analysis and other advisory services in regard to the Fund’s investments; and securities trading services. OFI Global is responsible for oversight of third-party service providers; monitoring compliance with applicable Fund policies and procedures and adherence to the Fund’s investment restrictions; risk management; and oversight of the Sub-Adviser. OFI Global is also responsible for providing certain administrative services to the Fund. Those services include providing and supervising all administrative and clerical personnel who are necessary in order to provide effective corporate administration for the Fund; compiling and maintaining records with respect to the Fund’s operations; preparing and filing reports required by the U.S. Securities and Exchange Commission; preparing periodic reports regarding the operations of the Fund for its shareholders; preparing proxy materials for shareholder meetings; and preparing the registration statements required by federal and state securities laws for the sale of the Fund’s shares. OFI Global also provides the Fund with office space, facilities and equipment.
47 OPPENHEIMER MASTER LOAN FUND, LLC
BOARD APPROVAL OF THE FUND’S INVESTMENT ADVISORY
AND SUB-ADVISORY AGREEMENTS Unaudited / Continued
The Board also considered the quality of the services provided and the quality of the Managers’ resources that are available to the Fund. The Board took account of the fact that the Sub-Adviser has over fifty years of experience as an investment adviser and that its assets under management rank it among the top mutual fund managers in the United States. The Board evaluated the Managers’ advisory, administrative, accounting, legal, compliance and risk management services, among other services, and information the Board has received regarding the experience and professional qualifications of the Managers’ key personnel and the size and functions of their staff. In its evaluation of the quality of the portfolio management services provided, the Board considered the experience of Joseph Welsh and David Lukkes, the portfolio managers for the Fund, and the Sub-Adviser’s investment team and analysts. The Board members also considered the totality of their experiences with the Managers as directors or trustees of the Fund and other funds advised by the Managers. The Board considered information regarding the quality of services provided by affiliates of the Managers, which the Board members have become knowledgeable about through their experiences with the Managers and in connection with the review or renewal of the Fund’s service agreements or service providers. The Board concluded, in light of the Managers’ experience, reputation, personnel, operations and resources that the Fund benefits from the services provided under the Agreements.
Investment Performance of the Managers and the Fund. Throughout the year, the Managers provided information on the investment performance of the Fund, the Adviser and the Sub-Adviser, including comparative performance information. The Board reviewed information, prepared by the Managers and by the independent consultant, comparing the Fund’s historical performance to its benchmark and to the performance of other bank loan funds. The Board considered that the Fund outperformed its category median for all periods.
Fees and Expenses of the Fund. The Board reviewed the fees paid to the Adviser and the other expenses borne by the Fund. The Board noted that the Adviser, not the Fund, pays the Sub-Adviser’s fee under the sub-advisory agreement. The independent consultant provided comparative data in regard to the fees and expenses of the Fund and other bank loan funds with comparable asset levels and distribution features. The Board considered that the Fund’s contractual management fee and its total expenses were lower than their respective peer group medians and category medians. The Board further considered that the Adviser has voluntarily agreed to waive fees and/or reimburse Fund expenses in an amount equal to the management fees incurred indirectly through the Fund’s investment in funds managed by the Adviser or its affiliates.
Economies of Scale and Profits Realized by the Managers. The Board considered information regarding the Managers’ costs in serving as the Fund’s investment adviser and sub-adviser, including the costs associated with the personnel and systems necessary to manage the Fund, and information regarding the Managers’ profitability from their relationship with the Fund. The Board also considered that the Managers must be able to pay and retain experienced professional personnel at competitive rates to provide quality services to the Fund. The Board reviewed whether the Managers may realize economies of scale in managing and supporting the Fund and whether those economies of scale benefit the Fund’s
48 OPPENHEIMER MASTER LOAN FUND, LLC
shareholders at the current level of Fund assets in relation to its management fee. The Board noted that the Fund does not have management fee breakpoints at this time.
Other Benefits to the Managers. In addition to considering the profits realized by the Managers, the Board considered information that was provided regarding the direct and indirect benefits the Managers receive as a result of their relationship with the Fund, including compensation paid to the Managers’ affiliates.
Conclusions. These factors were also considered by the independent Directors meeting separately from the full Board, assisted by experienced counsel to the Fund and to the independent Directors. Fund counsel and the independent Directors’ counsel are independent of the Managers within the meaning and intent of the Securities and Exchange Commission Rules.
Based on its review of the information it received and its evaluations described above, the Board, including a majority of the independent Directors, decided to continue the Agreements through August 31, 2019. In arriving at its decision, the Board did not identify any factor or factors as being more important than others, but considered all of the above information, and considered the terms and conditions of the Agreements, including the management fees, in light of all the surrounding circumstances.
49 OPPENHEIMER MASTER LOAN FUND, LLC
PORTFOLIO PROXY VOTING POLICIES AND GUIDELINES;
UPDATES TO STATEMENT OF INVESTMENTS Unaudited
The Fund has adopted Portfolio Proxy Voting Policies and Guidelines under which the Fund votes proxies relating to securities (“portfolio proxies”) held by the Fund. A description of the Fund’s Portfolio Proxy Voting Policies and Guidelines is available (i) without charge, upon request, by calling the Fund toll-free at 1.800.CALL OPP (225.5677), (ii) on the Fund’s website at www.oppenheimerfunds.com, and (iii) on the SEC’s website at www.sec.gov. In addition, the Fund is required to file Form N-PX, with its complete proxy voting record for the 12 months ended June 30th, no later than August 31st of each year. The Fund’s voting record is available (i) without charge, upon request, by calling the Fund toll-free at 1.800.CALL OPP (225.5677), and (ii) in the Form N-PX filing on the SEC’s website at www.sec.gov.
The Fund files its complete schedule of portfolio holdings with the SEC for the first quarter and the third quarter of each fiscal year on Form N-Q. The Fund’s Form N-Q filings are available on the SEC’s website at www.sec.gov. Those forms may be reviewed and copied at the SEC’s Public Reference Room in Washington, D.C. Information on the operation of the Public Reference Room may be obtained by calling 1-800-SEC-0330.
Householding—Delivery of Shareholder Documents
This is to inform you about OppenheimerFunds’ “householding” policy. If more than one member of your household maintains an account in a particular fund, OppenheimerFunds will mail only one copy of the fund’s prospectus (or, if available, the fund’s summary prospectus), annual and semiannual report and privacy policy. The consolidation of these mailings, called householding, benefits your fund through reduced mailing expense, and benefits you by reducing the volume of mail you receive from OppenheimerFunds. Householding does not affect the delivery of your account statements.
Please note that we will continue to household these mailings for as long as you remain an OppenheimerFunds shareholder, unless you request otherwise. If you prefer to receive multiple copies of these materials, please call us at 1.800.CALL-OPP (225-5677). You may also notify us in writing or via email. We will begin sending you individual copies of the prospectus (or, if available, the summary prospectus), reports and privacy policy within 30 days of receiving your request to stop householding.
50 OPPENHEIMER MASTER LOAN FUND, LLC
DIRECTORS AND OFFICERS Unaudited
| Name, Position(s) Held with the Fund, Length of Service, Year of Birth | Principal Occupation(s) During the Past 5 Years; Other Trusteeships/Directorships Held. | |
| INDEPENDENT DIRECTORS | The address of each Director in the chart below is 6803 S. Tucson Way, Centennial, Colorado 80112-3924. Each Director serves for an indefinite term, or until his or her resignation, retirement, death or removal. Each of the Trustees in the chart below oversees 58 portfolios in the OppenheimerFunds complex. | |
| Robert J. Malone, Chairman of the Board of Directors (since 2016), Director (since 2007) Year of Birth: 1944 |
Chairman - Colorado Market of MidFirst Bank (since January 2015); Chairman of the Board (2012-2016) and Director (August 2005-January 2016) of Jones International University (educational organization); Trustee of the Gallagher Family Foundation (non-profit organization) (2000-2016); Chairman, Chief Executive Officer and Director of Steele Street Bank Trust (commercial banking) (August 2003-January 2015); Director of Opera Colorado Foundation (non-profit organization) (2008-2012); Director of Colorado UpLIFT (charitable organization) (1986-2010); Director of Jones Knowledge, Inc. (2006-2010); Former Chairman of U.S. Bank-Colorado (subsidiary of U.S. Bancorp and formerly Colorado National Bank) (July 1996-April 1999); Director of Commercial Assets, Inc. (real estate investment trust) (1993-2000); Director of U.S. Exploration, Inc. (oil and gas exploration) (1997-February 2004); Chairman of the Board (1991-1994) and Trustee (1985-1994) of Regis University; and Chairman of the Board (1990-1991) and Member (1984-1999) of Young Presidents Organization. Mr. Malone has served on the Boards of certain Oppenheimer funds since 2002, during which time he has become familiar with the Fund’s (and other Oppenheimer funds’) financial, accounting, regulatory and investment matters and has contributed to the Board’s deliberations. | |
| Andrew J. Donohue, Director (since 2017) Year of Birth: 1950 |
Director, Mutual Fund Directors Forum (since February 2018); Of Counsel, Shearman & Sterling LLP (since September 2017); Chief of Staff of the U.S. Securities and Exchange Commission (regulator) (June 2015-February 2017); Managing Director and Investment Company General Counsel of Goldman Sachs (investment bank) (November 2012-May 2015); Partner at Morgan Lewis & Bockius, LLP (law firm) (March 2011-October 2012); Director of the Division of Investment Management of U.S. Securities and Exchange Commission (regulator) (May 2006-November 2010); Global General Counsel of Merrill Lynch Investment Managers (investment firm) (May 2003-May 2006); General Counsel (October 1991-November 2001) and Executive Vice President (January 1993-November 2001) of OppenheimerFunds, Inc. (investment firm) (June 1991-November 2001). Mr. Donohue has served on the Boards of certain Oppenheimer funds since 2017, during which time he has become familiar with the Fund’s (and other Oppenheimer funds’) financial, accounting, regulatory and investment matters and has contributed to the Board’s deliberations. | |
| Richard F. Grabish, Director (since 2008) Year of Birth: 1948 |
Formerly Senior Vice President and Assistant Director of Sales and Marketing (March 1997-December 2007), Director (March 1987-December 2007) and Manager of Private Client Services (June 1985-June 2005) of A.G. Edwards & Sons, Inc. (broker/dealer and investment firm); Chairman and Chief Executive Officer of A.G. Edwards Trust Company, FSB (March 2001-December 2007); President and Vice Chairman of A.G. Edwards Trust Company, FSB (investment adviser) (April 1987-March 2001); President of A.G. Edwards Trust Company, FSB (investment adviser) (June 2005-December 2007). Mr. Grabish has served on the Boards of certain Oppenheimer funds since 2001, during which time he has become familiar with the Fund’s (and other Oppenheimer funds’) financial, accounting, regulatory and investment matters and has contributed to the Board’s deliberations. | |
51 OPPENHEIMER MASTER LOAN FUND, LLC
DIRECTORS AND OFFICERS Unaudited / Continued
| Beverly L. Hamilton, Director (since 2007) Year of Birth: 1946 |
Trustee of Monterey Institute for International Studies (educational organization) (2000-2014); Board Member of Middlebury College (educational organization) (December 2005-June 2011); Director of the Board (1991-2016), Vice Chairman of the Board (2006-2009) and Chairman of the Board (2010-2013) of American Funds’ Emerging Markets Growth Fund, Inc. (mutual fund); Director of The California Endowment (philanthropic organization) (April 2002-April 2008); Director (February 2002-2005) and Chairman of Trustees (2006-2007) of the Community Hospital of Monterey Peninsula; President of ARCO Investment Management Company (February 1991-April 2000); Member of the investment committees of The Rockefeller Foundation (2001-2006) and The University of Michigan (since 2000); Advisor at Credit Suisse First Boston’s Sprout venture capital unit (venture capital fund) (1994-January 2005); Trustee of MassMutual Institutional Funds (investment company) (1996-June 2004); Trustee of MML Series Investment Fund (investment company) (April 1989-June 2004); Member of the investment committee of Hartford Hospital (2000-2003); and Advisor to Unilever (Holland) pension fund (2000-2003). Ms. Hamilton has served on the Boards of certain Oppenheimer funds since 2002, during which time she has become familiar with the Fund’s (and other Oppenheimer funds’) financial, accounting, regulatory and investment matters and has contributed to the Board’s deliberations. | |
| Victoria J. Herget, Director (since 2012) Year of Birth: 1951 |
Board Chair (2008-2015) and Director (2004-Present) of United Educators (insurance company); Trustee (since 2000) and Chair (2010-2017) of Newberry Library (independent research library); Trustee, Mather LifeWays (senior living organization) (since 2001); Independent Director of the First American Funds (mutual fund family) (2003-2011); former Managing Director (1993-2001), Principal (1985-1993), Vice President (1978-1985) and Assistant Vice President (1973-1978) of Zurich Scudder Investments (investment adviser) (and its predecessor firms); Trustee (1992-2007), Chair of the Board of Trustees (1999- 2007), Investment Committee Chair (1994-1999) and Investment Committee member (2007-2010) of Wellesley College; Trustee, BoardSource (non-profit organization) (2006-2009) and Chicago City Day School (K-8 School) (1994- 2005). Ms. Herget has served on the Boards of certain Oppenheimer funds since 2012, during which time she has become familiar with the Fund’s (and other Oppenheimer funds’) financial, accounting, regulatory and investment matters and has contributed to the Board’s deliberations. | |
| Karen L. Stuckey, Director (since 2012) Year of Birth: 1953 |
Member (since May 2015) of Desert Mountain Community Foundation Advisory Board (non-profit organization); Partner (1990-2012) of PricewaterhouseCoopers LLP (professional services firm) (held various positions 1975-1990); Trustee (1992-2006); member of Executive, Nominating and Audit Committees and Chair of Finance Committee (1992-2006), and Emeritus Trustee (since 2006) of Lehigh University; member, Women’s Investment Management Forum (professional organization) (since inception) and Trustee of Jennies School for Little Children (non-profit) (2011-2014). Ms. Stuckey has served on the Boards of certain Oppenheimer funds since 2012, during which time she has become familiar with the Fund’s (and other Oppenheimer funds’) financial, accounting, regulatory and investment matters and has contributed to the Board’s deliberations. | |
52 OPPENHEIMER MASTER LOAN FUND, LLC
| James D. Vaughn, Director (since 2012) Year of Birth: 1945 |
Retired; former managing partner (1994-2001) of Denver office of Deloitte & Touche LLP, (held various positions in Denver and New York offices from 1969- 1993); Trustee and Chairman of the Audit Committee of Schroder Funds (2003- 2012); Board member and Chairman of Audit Committee of AMG National Trust Bank (since 2005); Trustee and Investment Committee member, University of South Dakota Foundation (since 1996); Board member, Audit Committee Member and past Board Chair, Junior Achievement (since 1993); former Board member, Mile High United Way, Boys and Girls Clubs, Boy Scouts, Colorado Business Committee for the Arts, Economic Club of Colorado and Metro Denver Network. Mr. Vaughn has served on the Boards of certain Oppenheimer funds since 2012, during which time he has become familiar with the Fund’s (and other Oppenheimer funds’) financial, accounting, regulatory and investment matters and has contributed to the Board’s deliberations.
| |
|
INTERESTED DIRECTOR AND OFFICER |
Mr. Steinmetz is an “Interested Director” because he is affiliated with the Manager and the Sub-Adviser by virtue of his positions as Chairman and director of the Sub-Adviser and officer and director of the Manager. Both as a Director and as an officer, Mr. Steinmetz serves for an indefinite term, or until his resignation, retirement, death or removal. Mr. Steinmetz’s address is 225 Liberty Street, New York, New York 10281-1008. Mr. Steinmetz is an officer of 105 portfolios in the OppenheimerFunds complex. | |
| Arthur P. Steinmetz, Director (since 2015), President and Principal Executive Officer (since 2014) Year of Birth: 1958 |
Chairman of OppenheimerFunds, Inc. (since January 2015); CEO and Chairman of OFI Global Asset Management, Inc. (since July 2014), President of OFI Global Asset Management, Inc. (since May 2013), a Director of OFI Global Asset Management, Inc. (since January 2013), Director of OppenheimerFunds, Inc. (since July 2014), President, Management Director and CEO of Oppenheimer Acquisition Corp. (OppenheimerFunds, Inc.‘s parent holding company) (since July 2014), and President and Director of OFI SteelPath, Inc. (since January 2013). Chief Investment Officer of the OppenheimerFunds advisory entities (January 2013-December 2013); Executive Vice President of OFI Global Asset Management, Inc. (January 2013-May 2013); Chief Investment Officer of OppenheimerFunds, Inc. (October 2010-December 2012); Chief Investment Officer, Fixed-Income, of OppenheimerFunds, Inc. (April 2009-October 2010); Executive Vice President of OppenheimerFunds, Inc. (October 2009-December 2012); Director of Fixed Income of OppenheimerFunds, Inc. (January 2009-April 2009); and a Senior Vice President of OppenheimerFunds, Inc. (March 1993-September 2009).
| |
|
OTHER OFFICERS OF THE FUND |
The addresses of the Officers in the chart below are as follows: for Messrs. Mss. Lo Bessette, Foxson and Picciotto, 225 Liberty Street, New York, New York 10281-1008, for Messrs. Lukkes, Welsh, Petersen , 6803 S. Tucson Way, Centennial, Colorado 80112-3924. Each Officer serves for an indefinite term or until his or her resignation, retirement, death or removal. | |
| David Lukkes, Vice President (since 2015) Year of Birth: 1971 |
Senior Portfolio Manager of the Sub-Adviser (Since January 2015). Vice President of the Sub-Adviser (Since 2013) Senior Research Analyst of the Sub-Advisor (from September 2008 to January 2015). Assistant Vice President of the Sub-Adviser (from January 2012 to May 2013). A portfolio manager and officer of other portfolios in the OppenheimerFunds complex. | |
| Joseph Welsh, Vice President (since 2007) Year of Birth: 1964 |
Head of High Yield Corporate Debt Team (since April 2009), Senior Vice President of the Sub-Adviser (since May 2009). Vice President of the Sub-Adviser (December 2000-April 2009). A portfolio manager and officer of other portfolios in the OppenheimerFunds complex. | |
53 OPPENHEIMER MASTER LOAN FUND, LLC
DIRECTORS AND OFFICERS Unaudited / Continued
| Cynthia Lo Bessette, Secretary and Chief Legal Officer (since 2016) Year of Birth: 1969 |
Executive Vice President, General Counsel and Secretary of OFI Global Asset Management, Inc. (since February 2016); Senior Vice President and Deputy General Counsel of OFI Global Asset Management, Inc. (March 2015-February 2016); Chief Legal Officer of OppenheimerFunds, Inc. and OppenheimerFunds Distributor, Inc. (since February 2016); Vice President, General Counsel and Secretary of Oppenheimer Acquisition Corp. (since February 2016); General Counsel of OFI SteelPath, Inc., OFI Advisors, LLC and Index Management Solutions, LLC (since February 2016); Chief Legal Officer of OFI Global Institutional, Inc., HarbourView Asset Management Corporation, OFI Global Trust Company, Oppenheimer Real Asset Management, Inc., OFI Private Investments Inc., Shareholder Services, Inc. and Trinity Investment Management Corporation (since February 2016); Corporate Counsel (February 2012-March 2015) and Deputy Chief Legal Officer (April 2013-March 2015) of Jennison Associates LLC; Assistant General Counsel (April 2008-September 2009) and Deputy General Counsel (October 2009-February 2012) of Lord Abbett & Co. LLC. | |
| Jennifer Foxson, Vice President and Chief Business Officer (since 2014) Year of Birth: 1969 |
Senior Vice President of OppenheimerFunds Distributor, Inc. (since June 2014); Vice President of OppenheimerFunds Distributor, Inc. (April 2006-June 2014); Vice President of OppenheimerFunds, Inc. (January 1998-March 2006); Assistant Vice President of OppenheimerFunds, Inc. (October 1991-December 1998). | |
| Mary Ann Picciotto, Chief Compliance Officer and Chief Anti-Money Laundering Officer (since 2014) Year of Birth: 1973 |
Senior Vice President and Chief Compliance Officer of OFI Global Asset Management, Inc. (since March 2014); Chief Compliance Officer of OppenheimerFunds, Inc., OFI SteelPath, Inc., OFI Global Institutional, Inc., Oppenheimer Real Asset Management, Inc., OFI Private Investments Inc., Harborview Asset Management Corporation, Trinity Investment Management Corporation, and Shareholder Services, Inc. (since March 2014); Managing Director of Morgan Stanley Investment Management Inc. and certain of its various affiliated entities; Chief Compliance Officer of various Morgan Stanley Funds (May 2010-January 2014); Chief Compliance Officer of Morgan Stanley Investment Management Inc. (April 2007-January 2014). | |
| Brian S. Petersen, Treasurer and Principal Financial & Accounting Officer (since 2016) Year of Birth: 1970 |
Senior Vice President of OFI Global Asset Management, Inc. (since January 2017); Vice President of OFI Global Asset Management, Inc. (January 2013-January 2017); Vice President of OppenheimerFunds, Inc. (February 2007-December 2012); Assistant Vice President of OppenheimerFunds, Inc. (August 2002-2007). | |
The Fund’s Statement of Additional Information contains additional information about the Fund’s Directors and Officers and is available without charge upon request by calling 1.800.CALL OPP (225.5677).
54 OPPENHEIMER MASTER LOAN FUND, LLC
OPPENHEIMER MASTER LOAN FUND, LLC
| Manager | OFI Global Asset Management, Inc. | |
| Sub-Adviser | OppenheimerFunds, Inc. | |
| Distributor | OppenheimerFunds Distributor, Inc. | |
| Transfer and Shareholder Servicing Agent | OFI Global Asset Management, Inc. | |
| Sub-Transfer Agent | Shareholder Services, Inc. | |
| DBA OppenheimerFunds Services | ||
| Independent Registered Public Accounting Firm | KPMG LLP | |
| Legal Counsel | Ropes & Gray LLP | |
© 2018 OppenheimerFunds, Inc. All rights reserved.
55 OPPENHEIMER MASTER LOAN FUND, LLC

|
| Visit us at oppenheimerfunds.com for 24-hr access to account information and transactions or call us at 800.CALL OPP (800.225.5677) for 24-hr automated information and automated transactions. Representatives also available Mon–Fri 8am-8pm ET. | ||||
Visit Us
oppenheimerfunds.com
Call Us
800 225 5677
Follow Us

|
Oppenheimer funds are distributed by OppenheimerFunds Distributor, Inc. 225 Liberty Street, New York, NY 10281-1008 © 2018 OppenheimerFunds Distributor, Inc. All rights reserved.
RA1241.001.0918 November 21, 2018 |
Item 2. Code of Ethics.
The registrant has adopted a code of ethics that applies to the registrant’s principal executive officer, principal financial officer, principal accounting officer or controller or persons performing similar functions.
Item 3. Audit Committee Financial Expert.
The Board of Directors of the registrant has determined that Karen L. Stuckey, the Chairwoman of the Board’s Audit Committee, is the audit committee financial expert and that Ms. Stuckey is “independent” for purposes of this Item 3.
Item 4. Principal Accountant Fees and Services.
| (a) | Audit Fees |
The principal accountant for the audit of the registrant’s annual financial statements billed $60,700 in fiscal 2018 and $59,400 in fiscal 2017.
| (b) | Audit-Related Fees |
The principal accountant for the audit of the registrant’s annual financial statements billed $3,500 in fiscal 2018 and $3,500 in fiscal 2017.
The principal accountant for the audit of the registrant’s annual financial statements billed $297,836 in fiscal 2018 and $386,986 in fiscal 2017 to the registrant’s investment adviser or any entity controlling, controlled by, or under common control with the adviser that provides ongoing services to the registrant.
Such services include: Internal control reviews, GIPS attestation procedures, CP Conduit fees, incremental and additional audit services.
| (c) | Tax Fees |
The principal accountant for the audit of the registrant’s annual financial statements billed no such fees in fiscal 2018 and no such fees in fiscal 2017.
The principal accountant for the audit of the registrant’s annual financial statements billed $534,826 in fiscal 2018 and $286,402 in fiscal 2017 to the registrant’s investment adviser or any entity controlling, controlled by, or under common control with the adviser that provides ongoing services to the registrant.
Such services include: tax compliance, tax planning and tax advice. Tax compliance generally involves preparation of original and amended tax returns, claims for a refund and tax payment-planning services. Tax planning and tax advice includes assistance with tax audits and appeals, tax advice related to mergers and acquisitions and requests for rulings or technical advice from taxing authorities.
| (d) | All Other Fees |
The principal accountant for the audit of the registrant’s annual financial statements billed no such fees in fiscal 2018 and no such fees in fiscal 2017.
The principal accountant for the audit of the registrant’s annual financial statements billed no such fees in fiscal 2018 and no such fees in fiscal 2017 to the registrant’s investment adviser or any entity controlling, controlled by, or under common control with the adviser that provides ongoing services to the registrant.
Such fees would include the cost to the principal accountant of attending audit committee meetings and consultations regarding the registrant’s retirement plan with respect to its Directors.
| (e) | (1) During its regularly scheduled periodic meetings, the registrant’s audit committee will pre-approve all audit, audit-related, tax and other services to be provided by the principal accountants of the registrant. |
The audit committee has delegated pre-approval authority to its Chairman for any subsequent new engagements that arise between regularly scheduled meeting dates provided that any fees such pre-approved are presented to the audit committee at its next regularly scheduled meeting.
Under applicable laws, pre-approval of non-audit services may be waived provided that: 1) the aggregate amount of all such services provided constitutes no more than five percent of the total amount of fees paid by the registrant to its principal accountant during the fiscal year in which services are provided 2) such services were not recognized by the registrant at the time of engagement as non-audit services and 3) such services are promptly brought to the attention of the audit committee of the registrant and approved prior to the completion of the audit.
(2) 0%
| (f) | Not applicable as less than 50%. |
| (g) | The principal accountant for the audit of the registrant’s annual financial statements billed $836,162 in fiscal 2018 and $676,888 in fiscal 2017 to the registrant and the registrant’s investment adviser or any entity controlling, controlled by, or under common control with the adviser that provides ongoing services to the registrant related to non-audit fees. Those billings did not include any prohibited non-audit services as defined by the Securities Exchange Act of 1934. |
| (h) | The registrant’s audit committee of the board of Directors has considered whether the provision of non-audit services that were rendered to the registrant’s investment adviser, and any entity controlling, controlled by, or under common control with the investment adviser that provides ongoing services to the registrant that were not pre-approved pursuant to paragraph (c)(7)(ii) of Rule 2-01 of Regulation S-X is compatible with maintaining the principal accountant’s independence. No such services were rendered. |
Item 5. Audit Committee of Listed Registrants
Not applicable.
Item 6. Schedule of Investments.
a) Not applicable. The complete schedule of investments is included in Item 1 of this Form N-CSR.
b) Not applicable.
Item 7. Disclosure of Proxy Voting Policies and Procedures for Closed-End Management Investment Companies.
Not applicable.
Item 8. Portfolio Managers of Closed-End Management Investment Companies.
Not applicable.
Item 9. Purchases of Equity Securities by Closed-End Management Investment Company and Affiliated Purchasers.
Not applicable.
Item 10. Submission of Matters to a Vote of Security Holders.
The Fund’s Governance Committee Provisions with Respect to Nominations of Directors/Trustees to the Respective Boards
None
Item 11. Controls and Procedures.
Based on their evaluation of the registrant’s disclosure controls and procedures (as defined in rule 30a-3(c) under the Investment Company Act of 1940 (17 CFR 270.30a-3(c)) as of 9/30/2018, the registrant’s principal executive officer and principal financial officer found the registrant’s disclosure controls and procedures to provide reasonable assurances that information required to be disclosed by the registrant in the reports that it files under the Securities Exchange Act of 1934 (a) is accumulated and communicated to registrant’s management, including its principal executive officer and principal financial officer, to allow timely decisions regarding required disclosure, and (b) is recorded, processed, summarized and reported, within the time periods specified in the rules and forms adopted by the U.S. Securities and Exchange Commission.
There have been no changes in the registrant’s internal controls over financial reporting that occurred during the registrant’s second fiscal quarter of the period covered by this report that have materially affected, or are reasonably likely to materially affect, the registrant’s internal control over financial reporting.
Item 12. Disclosure of Securities Lending Activities for Closed-End Management Investment Companies.
Not applicable.
Item 13. Exhibits.
| (a) | (1) Exhibit attached hereto. |
| (2) Exhibits attached hereto. |
SIGNATURES
Pursuant to the requirements of the Securities Exchange Act of 1934 and the Investment Company Act of 1940, the registrant has duly caused this report to be signed on its behalf by the undersigned, thereunto duly authorized.
Oppenheimer Master Loan Fund, LLC
| By: | /s/ Arthur P. Steinmetz | |
| Arthur P. Steinmetz | ||
| Principal Executive Officer | ||
| Date: | 11/16/2018 | |
Pursuant to the requirements of the Securities Exchange Act of 1934 and the Investment Company Act of 1940, this report has been signed below by the following persons on behalf of the registrant and in the capacities and on the dates indicated.
| By: | /s/ Arthur P. Steinmetz | |
| Arthur P. Steinmetz | ||
| Principal Executive Officer | ||
| Date: | 11/16/2018 | |
| By: | /s/ Brian S. Petersen | |
| Brian S. Petersen | ||
| Principal Financial Officer | ||
| Date: | 11/16/2018 | |