false2020Q2000141344712/3100014134472020-01-012020-06-28xbrli:shares00014134472020-07-24iso4217:USD00014134472020-03-302020-06-2800014134472019-04-012019-06-3000014134472019-01-012019-06-30iso4217:USDxbrli:shares00014134472020-06-2800014134472019-12-3100014134472018-12-3100014134472019-06-300001413447us-gaap:CommonStockMember2019-12-310001413447us-gaap:AdditionalPaidInCapitalMember2019-12-310001413447us-gaap:TreasuryStockMember2019-12-310001413447us-gaap:AccumulatedOtherComprehensiveIncomeMember2019-12-310001413447us-gaap:RetainedEarningsMember2019-12-310001413447us-gaap:ParentMember2019-12-310001413447us-gaap:NoncontrollingInterestMember2019-12-310001413447us-gaap:RetainedEarningsMember2020-01-012020-03-290001413447us-gaap:ParentMember2020-01-012020-03-290001413447us-gaap:NoncontrollingInterestMember2020-01-012020-03-2900014134472020-01-012020-03-290001413447us-gaap:AccumulatedOtherComprehensiveIncomeMember2020-01-012020-03-290001413447us-gaap:AdditionalPaidInCapitalMember2020-01-012020-03-290001413447us-gaap:TreasuryStockMember2020-01-012020-03-2900014134472020-03-290001413447us-gaap:CommonStockMember2020-03-290001413447us-gaap:AdditionalPaidInCapitalMember2020-03-290001413447us-gaap:TreasuryStockMember2020-03-290001413447us-gaap:AccumulatedOtherComprehensiveIncomeMember2020-03-290001413447us-gaap:RetainedEarningsMember2020-03-290001413447us-gaap:ParentMember2020-03-290001413447us-gaap:NoncontrollingInterestMember2020-03-290001413447us-gaap:RetainedEarningsMember2020-03-302020-06-280001413447us-gaap:ParentMember2020-03-302020-06-280001413447us-gaap:NoncontrollingInterestMember2020-03-302020-06-280001413447us-gaap:AccumulatedOtherComprehensiveIncomeMember2020-03-302020-06-280001413447us-gaap:AdditionalPaidInCapitalMember2020-03-302020-06-280001413447us-gaap:TreasuryStockMember2020-03-302020-06-280001413447us-gaap:CommonStockMember2020-06-280001413447us-gaap:AdditionalPaidInCapitalMember2020-06-280001413447us-gaap:TreasuryStockMember2020-06-280001413447us-gaap:AccumulatedOtherComprehensiveIncomeMember2020-06-280001413447us-gaap:RetainedEarningsMember2020-06-280001413447us-gaap:ParentMember2020-06-280001413447us-gaap:NoncontrollingInterestMember2020-06-280001413447us-gaap:CommonStockMember2018-12-310001413447us-gaap:AdditionalPaidInCapitalMember2018-12-310001413447us-gaap:TreasuryStockMember2018-12-310001413447us-gaap:AccumulatedOtherComprehensiveIncomeMember2018-12-310001413447us-gaap:RetainedEarningsMember2018-12-310001413447us-gaap:ParentMember2018-12-310001413447us-gaap:NoncontrollingInterestMember2018-12-310001413447us-gaap:RetainedEarningsMember2019-01-012019-03-310001413447us-gaap:ParentMember2019-01-012019-03-310001413447us-gaap:NoncontrollingInterestMember2019-01-012019-03-3100014134472019-01-012019-03-310001413447us-gaap:AccumulatedOtherComprehensiveIncomeMember2019-01-012019-03-310001413447us-gaap:AdditionalPaidInCapitalMember2019-01-012019-03-310001413447us-gaap:TreasuryStockMember2019-01-012019-03-3100014134472019-03-310001413447us-gaap:CommonStockMember2019-03-310001413447us-gaap:AdditionalPaidInCapitalMember2019-03-310001413447us-gaap:TreasuryStockMember2019-03-310001413447us-gaap:AccumulatedOtherComprehensiveIncomeMember2019-03-310001413447us-gaap:RetainedEarningsMember2019-03-310001413447us-gaap:ParentMember2019-03-310001413447us-gaap:NoncontrollingInterestMember2019-03-310001413447us-gaap:RetainedEarningsMember2019-04-012019-06-300001413447us-gaap:ParentMember2019-04-012019-06-300001413447us-gaap:NoncontrollingInterestMember2019-04-012019-06-300001413447us-gaap:AccumulatedOtherComprehensiveIncomeMember2019-04-012019-06-300001413447us-gaap:AdditionalPaidInCapitalMember2019-04-012019-06-300001413447us-gaap:TreasuryStockMember2019-04-012019-06-300001413447us-gaap:CommonStockMember2019-06-300001413447us-gaap:AdditionalPaidInCapitalMember2019-06-300001413447us-gaap:TreasuryStockMember2019-06-300001413447us-gaap:AccumulatedOtherComprehensiveIncomeMember2019-06-300001413447us-gaap:RetainedEarningsMember2019-06-300001413447us-gaap:ParentMember2019-06-300001413447us-gaap:NoncontrollingInterestMember2019-06-30nxpi:business0001413447nxpi:VoiceAndAudioSolutionsMemberus-gaap:DisposalGroupDisposedOfBySaleNotDiscontinuedOperationsMember2020-02-030001413447nxpi:VoiceAndAudioSolutionsMemberus-gaap:DisposalGroupDisposedOfBySaleNotDiscontinuedOperationsMember2020-02-032020-02-030001413447nxpi:MarvellWiFiConnectivityBusinessUnitMember2019-12-062019-12-060001413447nxpi:MarvellWiFiConnectivityBusinessUnitMember2019-12-060001413447nxpi:MarvellWiFiConnectivityBusinessUnitMemberus-gaap:CustomerRelationshipsMember2019-12-060001413447nxpi:MarvellWiFiConnectivityBusinessUnitMemberus-gaap:CustomerRelationshipsMember2019-12-062019-12-060001413447nxpi:MarvellWiFiConnectivityBusinessUnitMemberus-gaap:TechnologyBasedIntangibleAssetsMember2019-12-060001413447nxpi:MarvellWiFiConnectivityBusinessUnitMemberus-gaap:TechnologyBasedIntangibleAssetsMember2019-12-062019-12-060001413447nxpi:MarvellWiFiConnectivityBusinessUnitMemberus-gaap:InProcessResearchAndDevelopmentMember2019-12-060001413447nxpi:WeEnMemberus-gaap:DisposalGroupDisposedOfBySaleNotDiscontinuedOperationsMember2019-03-272019-03-270001413447nxpi:DistributorsMember2020-03-302020-06-280001413447nxpi:DistributorsMember2019-04-012019-06-300001413447nxpi:DistributorsMember2020-01-012020-06-280001413447nxpi:DistributorsMember2019-01-012019-06-300001413447nxpi:OriginalEquipmentManufacturersAndElectronicManufacturingServicesMember2020-03-302020-06-280001413447nxpi:OriginalEquipmentManufacturersAndElectronicManufacturingServicesMember2019-04-012019-06-300001413447nxpi:OriginalEquipmentManufacturersAndElectronicManufacturingServicesMember2020-01-012020-06-280001413447nxpi:OriginalEquipmentManufacturersAndElectronicManufacturingServicesMember2019-01-012019-06-300001413447nxpi:OtherMember2020-03-302020-06-280001413447nxpi:OtherMember2019-04-012019-06-300001413447nxpi:OtherMember2020-01-012020-06-280001413447nxpi:OtherMember2019-01-012019-06-300001413447us-gaap:ComputerSoftwareIntangibleAssetMember2020-03-302020-06-280001413447us-gaap:ComputerSoftwareIntangibleAssetMember2019-04-012019-06-300001413447us-gaap:ComputerSoftwareIntangibleAssetMember2020-01-012020-06-280001413447us-gaap:ComputerSoftwareIntangibleAssetMember2019-01-012019-06-300001413447us-gaap:OtherIntangibleAssetsMember2020-03-302020-06-280001413447us-gaap:OtherIntangibleAssetsMember2019-04-012019-06-300001413447us-gaap:OtherIntangibleAssetsMember2020-01-012020-06-280001413447us-gaap:OtherIntangibleAssetsMember2019-01-012019-06-300001413447nxpi:ManufacturingServiceArrangementsAndTransitionalServiceArrangementsMember2020-03-302020-06-280001413447nxpi:ManufacturingServiceArrangementsAndTransitionalServiceArrangementsMember2019-04-012019-06-300001413447nxpi:ManufacturingServiceArrangementsAndTransitionalServiceArrangementsMember2020-01-012020-06-280001413447nxpi:ManufacturingServiceArrangementsAndTransitionalServiceArrangementsMember2019-01-012019-06-300001413447srt:MaximumMemberus-gaap:EmployeeStockMember2020-03-302020-06-280001413447srt:MaximumMemberus-gaap:EmployeeStockMember2019-04-012019-06-300001413447srt:MaximumMemberus-gaap:EmployeeStockMember2020-01-012020-06-280001413447srt:MaximumMemberus-gaap:EmployeeStockMember2019-01-012019-06-300001413447srt:MaximumMembernxpi:RestrictedStockUnitsPerformanceShareUnitsAndEquityRightsMember2020-03-302020-06-280001413447srt:MaximumMembernxpi:RestrictedStockUnitsPerformanceShareUnitsAndEquityRightsMember2019-04-012019-06-300001413447srt:MaximumMembernxpi:RestrictedStockUnitsPerformanceShareUnitsAndEquityRightsMember2020-01-012020-06-280001413447srt:MaximumMembernxpi:RestrictedStockUnitsPerformanceShareUnitsAndEquityRightsMember2019-01-012019-06-300001413447srt:MaximumMemberus-gaap:WarrantMember2019-04-012019-06-300001413447srt:MaximumMemberus-gaap:WarrantMember2020-03-302020-06-280001413447nxpi:SSMCMember2020-06-280001413447nxpi:SSMCMember2019-12-31xbrli:pure0001413447nxpi:TSMCMember2020-06-280001413447nxpi:SSMCMember2020-01-012020-06-280001413447nxpi:SSMCMember2019-01-012019-12-310001413447us-gaap:AccumulatedTranslationAdjustmentMember2019-12-310001413447us-gaap:AccumulatedNetGainLossFromDesignatedOrQualifyingCashFlowHedgesMember2019-12-310001413447us-gaap:AccumulatedDefinedBenefitPlansAdjustmentNetUnamortizedGainLossMember2019-12-310001413447us-gaap:AccumulatedTranslationAdjustmentMember2020-01-012020-06-280001413447us-gaap:AccumulatedNetGainLossFromDesignatedOrQualifyingCashFlowHedgesMember2020-01-012020-06-280001413447us-gaap:AccumulatedDefinedBenefitPlansAdjustmentNetUnamortizedGainLossMember2020-01-012020-06-280001413447us-gaap:AccumulatedTranslationAdjustmentMember2020-06-280001413447us-gaap:AccumulatedNetGainLossFromDesignatedOrQualifyingCashFlowHedgesMember2020-06-280001413447us-gaap:AccumulatedDefinedBenefitPlansAdjustmentNetUnamortizedGainLossMember2020-06-280001413447us-gaap:EmployeeSeveranceMember2020-01-012020-06-280001413447us-gaap:EmployeeSeveranceMember2019-01-012019-06-300001413447us-gaap:CostOfSalesMember2020-03-302020-06-280001413447us-gaap:CostOfSalesMember2019-04-012019-06-300001413447us-gaap:CostOfSalesMember2020-01-012020-06-280001413447us-gaap:CostOfSalesMember2019-01-012019-06-300001413447us-gaap:ResearchAndDevelopmentExpenseMember2020-03-302020-06-280001413447us-gaap:ResearchAndDevelopmentExpenseMember2019-04-012019-06-300001413447us-gaap:ResearchAndDevelopmentExpenseMember2020-01-012020-06-280001413447us-gaap:ResearchAndDevelopmentExpenseMember2019-01-012019-06-300001413447us-gaap:SellingGeneralAndAdministrativeExpensesMember2020-03-302020-06-280001413447us-gaap:SellingGeneralAndAdministrativeExpensesMember2019-04-012019-06-300001413447us-gaap:SellingGeneralAndAdministrativeExpensesMember2020-01-012020-06-280001413447us-gaap:SellingGeneralAndAdministrativeExpensesMember2019-01-012019-06-300001413447us-gaap:InProcessResearchAndDevelopmentMember2020-06-280001413447us-gaap:InProcessResearchAndDevelopmentMember2019-12-310001413447us-gaap:MarketingRelatedIntangibleAssetsMember2020-06-280001413447us-gaap:MarketingRelatedIntangibleAssetsMember2019-12-310001413447us-gaap:CustomerRelationshipsMember2020-06-280001413447us-gaap:CustomerRelationshipsMember2019-12-310001413447us-gaap:TechnologyBasedIntangibleAssetsMember2020-06-280001413447us-gaap:TechnologyBasedIntangibleAssetsMember2019-12-310001413447us-gaap:OtherIntangibleAssetsMember2020-06-2800014134472019-01-012019-12-310001413447nxpi:FixedRate27SeniorUnsecuredNotesMaturingMay2025Memberus-gaap:UnsecuredDebtMember2020-05-010001413447nxpi:FixedRate315SeniorUnsecuredNotesMaturingMay2027Memberus-gaap:UnsecuredDebtMember2020-05-010001413447nxpi:FixedRate34SeniorUnsecuredNotesMaturingMay2030Memberus-gaap:UnsecuredDebtMember2020-05-010001413447nxpi:FixedRate4.125SeniorUnsecuredNotesMaturingJune2021Memberus-gaap:UnsecuredDebtMember2020-06-280001413447nxpi:FixedRate4.125SeniorUnsecuredNotesMaturingJune2021Memberus-gaap:UnsecuredDebtMember2019-12-310001413447nxpi:FixedRate4.625SeniorUnsecuredNotesMaturingJune2022Memberus-gaap:UnsecuredDebtMember2020-06-280001413447nxpi:FixedRate4.625SeniorUnsecuredNotesMaturingJune2022Memberus-gaap:UnsecuredDebtMember2019-12-310001413447nxpi:FixedRate3.875SeniorUnsecuredNotesMaturingSeptember2022Memberus-gaap:UnsecuredDebtMember2020-06-280001413447nxpi:FixedRate3.875SeniorUnsecuredNotesMaturingSeptember2022Memberus-gaap:UnsecuredDebtMember2019-12-310001413447nxpi:FixedRate4.625SeniorUnsecuredNotesMaturingJune2023Memberus-gaap:UnsecuredDebtMember2020-06-280001413447nxpi:FixedRate4.625SeniorUnsecuredNotesMaturingJune2023Memberus-gaap:UnsecuredDebtMember2019-12-310001413447nxpi:FixedRate4.875SeniorUnsecuredNotesMaturingMarch2024Memberus-gaap:UnsecuredDebtMember2020-06-280001413447nxpi:FixedRate4.875SeniorUnsecuredNotesMaturingMarch2024Memberus-gaap:UnsecuredDebtMember2019-12-310001413447nxpi:FixedRate27SeniorUnsecuredNotesMaturingMay2025Memberus-gaap:UnsecuredDebtMember2020-06-280001413447nxpi:FixedRate5.350SeniorUnsecuredNotesMaturingMarch2026Memberus-gaap:UnsecuredDebtMember2020-06-280001413447nxpi:FixedRate5.350SeniorUnsecuredNotesMaturingMarch2026Memberus-gaap:UnsecuredDebtMember2019-12-310001413447nxpi:FixedRate3.875SeniorUnsecuredNotesMaturingJune2026Memberus-gaap:UnsecuredDebtMember2020-06-280001413447nxpi:FixedRate3.875SeniorUnsecuredNotesMaturingJune2026Memberus-gaap:UnsecuredDebtMember2019-12-310001413447nxpi:FixedRate315SeniorUnsecuredNotesMaturingMay2027Memberus-gaap:UnsecuredDebtMember2020-06-280001413447nxpi:FixedRate5.550SeniorUnsecuredNotesMaturingDecember2028Memberus-gaap:UnsecuredDebtMember2020-06-280001413447nxpi:FixedRate5.550SeniorUnsecuredNotesMaturingDecember2028Memberus-gaap:UnsecuredDebtMember2019-12-310001413447nxpi:FixedRate4.3SeniorUnsecuredNotesMaturingJune2029Memberus-gaap:UnsecuredDebtMember2020-06-280001413447nxpi:FixedRate4.3SeniorUnsecuredNotesMaturingJune2029Memberus-gaap:UnsecuredDebtMember2019-12-310001413447nxpi:FixedRate34SeniorUnsecuredNotesMaturingMay2030Memberus-gaap:UnsecuredDebtMember2020-06-280001413447nxpi:FloatingRateRevolvingCreditFacilityMaturingDecember2020Memberus-gaap:RevolvingCreditFacilityMember2020-06-280001413447nxpi:FloatingRateRevolvingCreditFacilityMaturingDecember2020Memberus-gaap:RevolvingCreditFacilityMember2019-12-310001413447srt:MinimumMember2020-01-012020-06-280001413447srt:MaximumMember2020-01-012020-06-280001413447us-gaap:LandMembersrt:MinimumMember2020-01-012020-06-280001413447srt:MaximumMemberus-gaap:LandMember2020-01-012020-06-280001413447us-gaap:AccountingStandardsUpdate201602Member2019-01-012019-01-010001413447nxpi:NexperiaMember2020-06-280001413447us-gaap:EstimateOfFairValueFairValueDisclosureMemberus-gaap:FairValueInputsLevel1Memberus-gaap:MoneyMarketFundsMember2020-06-280001413447us-gaap:EstimateOfFairValueFairValueDisclosureMemberus-gaap:FairValueInputsLevel1Memberus-gaap:MoneyMarketFundsMember2019-12-310001413447us-gaap:EstimateOfFairValueFairValueDisclosureMemberus-gaap:FairValueInputsLevel1Member2020-06-280001413447us-gaap:EstimateOfFairValueFairValueDisclosureMemberus-gaap:FairValueInputsLevel1Member2019-12-310001413447us-gaap:FairValueInputsLevel2Memberus-gaap:EstimateOfFairValueFairValueDisclosureMember2020-06-280001413447us-gaap:FairValueInputsLevel2Memberus-gaap:EstimateOfFairValueFairValueDisclosureMember2019-12-310001413447srt:MinimumMember2020-06-280001413447srt:MaximumMember2020-06-28nxpi:individual
UNITED STATES
SECURITIES AND EXCHANGE COMMISSION
Washington, D.C. 20549
FORM 10-Q
(Mark One)
☒ QUARTERLY REPORT PURSUANT TO SECTION 13 OR 15(d) OF THE SECURITIES EXCHANGE ACT OF 1934
For the quarterly period ended June 28, 2020
or
☐ TRANSITION REPORT PURSUANT TO SECTION 13 OR 15(d) OF THE SECURITIES EXCHANGE ACT OF 1934
For the transition period from to .
Commission File Number: 001-34841
NXP Semiconductors N.V.
(Exact name of registrant as specified in its charter)
| | | | | | | | |
Netherlands | | 98-1144352 |
(State or other jurisdiction of incorporation or organization) | | (I.R.S. employer identification number) |
| | |
60 High Tech Campus | | 5656 AG |
Eindhoven | | |
Netherlands | | |
(Address of principal executive offices) | | (Zip code) |
| | | | | | | | | | | |
| +31 | 40 | 2729999 |
(Registrant’s telephone number, including area code) | | | |
Securities registered pursuant to Section 12(b) of the Act:
| | | | | | | | |
Title of each class | Trading symbol(s) | Name of each exchange on which registered |
Common shares, EUR 0.20 par value | NXPI | The Nasdaq Global Select Market |
Indicate by check mark whether the Registrant (1) has filed all reports required to be filed by Section 13 or 15(d) of the Securities Exchange Act of 1934 during the preceding 12 months (or for such shorter period that the Registrant was required to file such reports), and (2) has been subject to such filing requirements for the past 90 days.
Yes ☒ No ☐
Indicate by check mark whether the Registrant has submitted electronically every Interactive Data File required to be submitted pursuant to Rule 405 of Regulation S-T (§232.405 of this chapter) during the preceding 12 months (or for such shorter period that the Registrant was required to submit such files).
Yes ☒ No ☐
Indicate by check mark whether the Registrant is a large accelerated filer, an accelerated filer, a non-accelerated filer, a smaller reporting company, or an emerging growth company. See the definitions of “large accelerated filer,” “accelerated filer,” “smaller reporting company,” and “emerging growth company” in Rule 12b-2 of the Exchange Act.
| | | | | | | | | | | |
Large accelerated filer | ☒ | Accelerated filer | ☐ |
Non-accelerated filer | ☐ | Smaller reporting company | ☐ |
| | Emerging growth company | ☐ |
If an emerging growth company, indicate by check mark if the Registrant has elected not to use the extended transition period for complying with any new or revised financial accounting standards provided pursuant to Section 13(a) of the Exchange Act. ☐
Indicate by check mark whether the Registrant is a shell company (as defined in Rule 12b-2 of the Exchange Act).
Yes ☐ No ☒
As of July 24, 2020, there were 279,224,213 shares of our common stock, €0.20 par value per share, issued and outstanding.
NXP Semiconductors N.V.
Form 10-Q
For the Fiscal Quarter Ended June 28, 2020
TABLE OF CONTENTS
PART I — FINANCIAL INFORMATION
Item 1. Financial Statements
CONDENSED CONSOLIDATED STATEMENTS OF OPERATIONS (Unaudited)
($ in millions, unless otherwise stated)
| | | | | | | | | | | | | | | | | | | | | | | |
| For the three months ended | | | | For the six months ended | | |
| June 28, 2020 | | June 30, 2019 | | June 28, 2020 | | June 30, 2019 |
| Revenue | 1,817 | | | 2,217 | | | 3,838 | | | 4,311 | |
| Cost of revenue | (957) | | | (1,066) | | | (1,981) | | | (2,088) | |
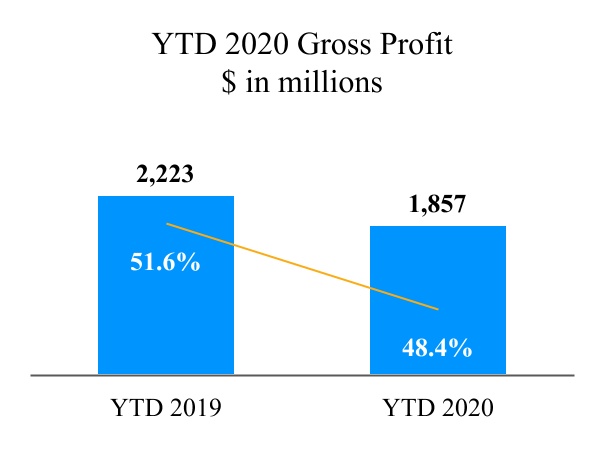
| Gross profit | 860 | | | 1,151 | | | 1,857 | | | 2,223 | |
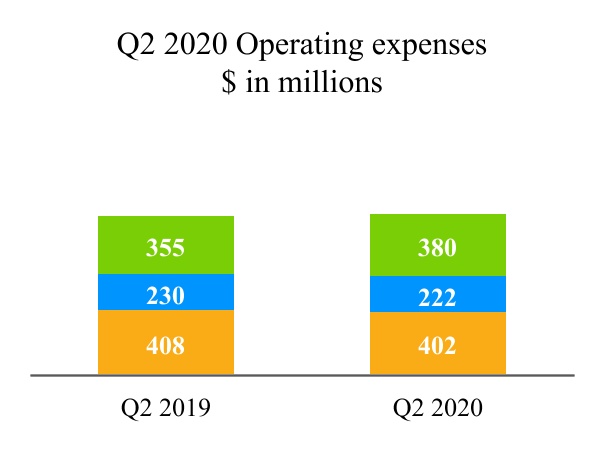
| Research and development | (402) | | | (408) | | | (827) | | | (823) | |
| Selling, general and administrative | (222) | | | (230) | | | (455) | | | (478) | |
| Amortization of acquisition-related intangible assets | (380) | | | (355) | | | (761) | | | (712) | |
| Total operating expenses | (1,004) | | | (993) | | | (2,043) | | | (2,013) | |
| Other income (expense) | (1) | | | (1) | | | 109 | | | 1 | |
| Operating income (loss) | (145) | | | 157 | | | (77) | | | 211 | |
| Financial income (expense): | | | | | | | |
| Extinguishment of debt | — | | | (10) | | | — | | | (10) | |
| Other financial income (expense) | (96) | | | (79) | | | (174) | | | (162) | |
| Income (loss) before income taxes | (241) | | | 68 | | | (251) | | | 39 | |
| Benefit (provision) for income taxes | 33 | | | (21) | | | 31 | | | (12) | |
| Results relating to equity-accounted investees | (1) | | | (1) | | | (2) | | | 3 | |
| Net income (loss) | (209) | | | 46 | | | (222) | | | 30 | |
| Less: Net income (loss) attributable to non-controlling interests | 5 | | | 5 | | | 13 | | | 10 | |
| Net income (loss) attributable to stockholders | (214) | | | 41 | | | (235) | | | 20 | |
| | | | | | | |
| Earnings per share data: | | | | | | | |
| Net income (loss) per common share attributable to stockholders in $ | | | | | | | |
| Basic | (0.77) | | | 0.15 | | | (0.84) | | | 0.07 | |
| Diluted | (0.77) | | | 0.14 | | | (0.84) | | | 0.07 | |
| | | | | | | |
| Weighted average number of shares of common stock outstanding during the period (in thousands): | | | | | | | |
| Basic | 279,142 | | | 281,241 | | | 279,533 | | | 284,217 | |
| Diluted | 279,142 | | | 285,088 | | | 279,533 | | | 286,858 | |
See accompanying notes to the Condensed Consolidated Financial Statements
CONDENSED CONSOLIDATED STATEMENTS OF COMPREHENSIVE INCOME
(Unaudited)
($ in millions, unless otherwise stated)
| | | | | | | | | | | | | | | | | | | | | | | |
| For the three months ended | | | | For the six months ended | | |
| June 28, 2020 | | June 30, 2019 | | June 28, 2020 | | June 30, 2019 |
| Net income (loss) | (209) | | | 46 | | | (222) | | | 30 | |
| Other comprehensive income (loss), net of tax: | | | | | | | |
| Change in fair value cash flow hedges | 11 | | | 5 | | | 1 | | | 5 | |
| Change in foreign currency translation adjustment | 26 | | | 6 | | | (23) | | | (6) | |
| Change in net actuarial gain (loss) | (1) | | | (2) | | | (3) | | | (4) | |
| | | | | | | |
| Total other comprehensive income (loss) | 36 | | | 9 | | | (25) | | | (5) | |
| Total comprehensive income (loss) | (173) | | | 55 | | | (247) | | | 25 | |
| Less: Comprehensive income (loss) attributable to non-controlling interests | 5 | | | 5 | | | 13 | | | 10 | |
| Total comprehensive income (loss) attributable to stockholders | (178) | | | 50 | | | (260) | | | 15 | |
See accompanying notes to the Condensed Consolidated Financial Statements
CONDENSED CONSOLIDATED BALANCE SHEETS (Unaudited)
($ in millions, unless otherwise stated)
| | | | | | | | | | | | | | |
| | June 28, 2020 | | December 31, 2019 |
| ASSETS | | | | |
| Current assets: | | | | |
| Cash and cash equivalents | 3,266 | | | 1,045 | |
| Accounts receivable, net | 481 | | | 667 | |
| Assets held for sale | — | | | 50 | |
| Inventories, net | 1,228 | | | 1,192 | |
| Other current assets | 240 | | | 313 | |
| Total current assets | | 5,215 | | | 3,267 | |
| Non-current assets: | | | | |
| Other non-current assets | 760 | | | 732 | |
| Property, plant and equipment, net of accumulated depreciation of $3,977 and $3,742 | 2,312 | | | 2,448 | |
| Identified intangible assets, net of accumulated amortization of $6,457 and $5,764 | 2,824 | | | 3,620 | |
| Goodwill | 9,946 | | | 9,949 | |
| Total non-current assets | 15,842 | | | 16,749 | |
| Total assets | | 21,057 | | | 20,016 | |
| | | | |
| LIABILITIES AND EQUITY | | | | |
| Current liabilities: | | | | |
| Accounts payable | 729 | | | 944 | |
| | | | |
| Restructuring liabilities-current | 25 | | | 32 | |
| Other current liabilities | 889 | | | 815 | |
| Short-term debt | 1,349 | | | — | |
| Total current liabilities | | 2,992 | | | 1,791 | |
| Non-current liabilities: | | | | |
| Long-term debt | 8,004 | | | 7,365 | |
| | | | |
| Deferred tax liabilities | 136 | | | 282 | |
| Other non-current liabilities | 870 | | | 923 | |
| Total non-current liabilities | | 9,010 | | | 8,570 | |
| Total liabilities | | 12,002 | | | 10,361 | |
| Equity: | | | | |
| Non-controlling interests | 193 | | | 214 | |
| | | | |
| Stockholders’ equity: | | | |
| Common stock, par value €0.20 per share: | 64 | | | 64 | |
| Capital in excess of par value | 15,228 | | | 15,184 | |
| Treasury shares, at cost: | | | |
| 36,306,688 shares (2019: 34,082,242 shares) | (3,325) | | | (3,037) | |
| Accumulated other comprehensive income (loss) | 50 | | | 75 | |
| Accumulated deficit | (3,155) | | | (2,845) | |
| Total stockholders’ equity | 8,862 | | | 9,441 | |
| Total equity | | 9,055 | | | 9,655 | |
| Total liabilities and equity | | 21,057 | | | 20,016 | |
See accompanying notes to the Condensed Consolidated Financial Statements
CONDENSED CONSOLIDATED STATEMENTS OF CASH FLOWS (Unaudited)
($ in millions, unless otherwise stated)
| | | | | | | | | | | | | | |
| | For the six months ended | | |
| | June 28, 2020 | | June 30, 2019 |
| Cash flows from operating activities: | | | | |
| Net income (loss) | | (222) | | | 30 | |
| Adjustments to reconcile net income (loss) to net cash provided by (used for) operating activities: | | | | |
| Depreciation and amortization | | 1,083 | | | 1,008 | |
| Share-based compensation | | 212 | | | 173 | |
| Amortization of discount (premium) on debt, net | | (1) | | | 22 | |
| Amortization of debt issuance costs | | 4 | | | 6 | |
| Net (gain) loss on sale of assets | | (110) | | | 1 | |
| (Gain) loss on extinguishment of debt | | — | | | 10 | |
| Results relating to equity-accounted investees | | 2 | | | (3) | |
| Deferred tax expense (benefit) | | (156) | | | (93) | |
| Changes in operating assets and liabilities: | | | | |
| (Increase) decrease in receivables and other current assets | | 251 | | | (11) | |
| (Increase) decrease in inventories | | (35) | | | 122 | |
| Increase (decrease) in accounts payable and other liabilities | | (96) | | | (468) | |
| Decrease (increase) in other non-current assets | | (7) | | | 6 | |
| Exchange differences | | 1 | | | 7 | |
| Other items | | — | | | 3 | |
| Net cash provided by (used for) operating activities | | 926 | | | 813 | |
| Cash flows from investing activities: | | | | |
| Purchase of identified intangible assets | | (73) | | | (51) | |
| Capital expenditures on property, plant and equipment | | (218) | | | (250) | |
| Proceeds from disposals of property, plant and equipment | | 1 | | | — | |
| Purchase of interests in businesses, net of cash acquired | | (21) | | | — | |
| Proceeds from sale of interests in businesses | | 161 | | | 37 | |
| Purchase of investments | | — | | | (17) | |
| Proceeds from sale of investments | | — | | | 1 | |
| | | | |
| Net cash provided by (used for) investing activities | | (150) | | | (280) | |
| Cash flows from financing activities: | | | | |
| Repurchase of long-term debt | | — | | | (553) | |
| | | | |
| Proceeds from the issuance of long-term debt | | 2,000 | | | 1,750 | |
| Cash paid for debt issuance costs | | (15) | | | (23) | |
| | | | |
| Dividends paid to non-controlling interests | | — | | | — | |
| Dividends paid to common stockholders | | (210) | | | (144) | |
| Proceeds from issuance of common stock through stock plans | | 37 | | | 37 | |
| Purchase of treasury shares and restricted stock unit withholdings | | (358) | | | (1,360) | |
| Net cash provided by (used for) financing activities | | 1,454 | | | (293) | |
| Effect of changes in exchange rates on cash positions | | (9) | | | 1 | |
| Increase (decrease) in cash and cash equivalents | | 2,221 | | | 241 | |
| Cash and cash equivalents at beginning of period | | 1,045 | | | 2,789 | |
| Cash and cash equivalents at end of period | | 3,266 | | | 3,030 | |
| | | | | | | | | | | | | | |
| Supplemental disclosures to the condensed consolidated cash flows | | | | |
| Net cash paid during the period for: | | | | |
| Interest | | 157 | | | 103 | |
| Income taxes | | 64 | | | 275 | |
| Net gain (loss) on sale of assets: | | | | |
| Cash proceeds from the sale of assets | | 161 | | | 37 | |
| Book value of these assets | | (51) | | | (34) | |
| Non-cash investing activities: | | | | |
| Non-cash capital expenditures | | 54 | | | 178 | |
See accompanying notes to the Condensed Consolidated Financial Statements
CONDENSED CONSOLIDATED STATEMENTS OF CHANGES IN EQUITY (Unaudited)
($ in millions, unless otherwise stated)
| | | | | | | | | | | | | | | | | | | | | | | | | | | | | | | | | | | | | | | | | | | | | | | | | | | | | | | | |
| | Outstanding
number of
shares (in
thousands) | | Common
stock | | Capital in
excess of
par value | | Treasury
shares at
cost | | Accumulated
other
comprehensive
income (loss) | | Accumulated
deficit | | Total
stock-
holders’
equity | | Non-
controlling
interests | | Total
equity |
| Balance as of December 31, 2019 | | 281,437 | | | 64 | | | 15,184 | | | (3,037) | | | 75 | | | (2,845) | | | 9,441 | | | 214 | | | 9,655 | |
| Net income (loss) | | | | | | | | | | | | (21) | | | (21) | | | 8 | | | (13) | |
| Other comprehensive income | | | | | | | | | | (61) | | | | | (61) | | | | | (61) | |
| Share-based compensation plans | | | | | | 108 | | | | | | | | | 108 | | | | | 108 | |
| Shares issued pursuant to stock awards | | 497 | | | | | | | 47 | | | | | (18) | | | 29 | | | | | 29 | |
| Treasury shares and restricted stock unit withholdings | | (2,933) | | | | | | | (355) | | | | | | | (355) | | | | | (355) | |
| Expiration of stock purchase warrants | | | | | | (56) | | | | | | | 56 | | | — | | | | | — | |
Dividends common stock ($0.375 per share) | | | | | | | | | | | | (105) | | | (105) | | | | | (105) | |
| Balance as of March 29, 2020 | | 279,001 | | | 64 | | | 15,236 | | | (3,345) | | | 14 | | | (2,933) | | | 9,036 | | | 222 | | | 9,258 | |
| Net income (loss) | | | | | | | | | | | | (214) | | | (214) | | | 5 | | | (209) | |
| Other comprehensive income | | | | | | | | | | 36 | | | | | 36 | | | | | 36 | |
| Share-based compensation plans | | | | | | 104 | | | | | | | | | 104 | | | | | 104 | |
| Shares issued pursuant to stock awards | | 252 | | | | | | | 23 | | | | | (15) | | | 8 | | | | | 8 | |
| Treasury shares and restricted stock unit withholdings | | (40) | | | | | | | (3) | | | | | | | (3) | | | | | (3) | |
| | | | | | | | | | | | | | | | | | |
| | | | | | | | | | | | | | | | | | |
| Expiration of stock purchase warrants | | | | | | (112) | | | | | | | 112 | | | — | | | | | — | |
| Dividends non-controlling interests | | | | | | | | | | | | | | | | (34) | | | (34) | |
Dividends common stock ($0.375 per share) | | | | | | | | | | | | (105) | | | (105) | | | | | (105) | |
| Balance as of June 28, 2020 | | 279,213 | | | 64 | | | 15,228 | | | (3,325) | | | 50 | | | (3,155) | | | 8,862 | | | 193 | | | 9,055 | |
| | | | | | | | | | | | | | | | | | |
| | | | | | | | | | | | | | | | | | |
| | | | | | | | | | | | | | | | | | |
| | | | | | | | | | | | | | | | | | |
| | | | | | | | | | | | | | | | | | |
| | | | | | | | | | | | | | | | | | |
| | | | | | | | | | | | | | | | | | |
| | | | | | | | | | | | | | | | | | |
| | | | | | | | | | | | | | | | | | |
| | | | | | | | | | | | | | | | | | | | | | | | | | | | | | | | | | | | | | | | | | | | | | | | | | | | | | | | |
| | Outstanding number of shares (in thousands) | | Common stock | | Capital in excess of par value | | Treasury shares at cost | | Accumulated other comprehensive income (loss) | | Accumulated deficit | | Total stock- holders’ equity | | Non- controlling interests | | Total equity |
| Balance as of December 31, 2018 | | 292,790 | | | 67 | | | 15,460 | | | (3,238) | | | 123 | | | (1,907) | | | 10,505 | | | 185 | | | 10,690 | |
| Net income (loss) | | | | | | | | | | | | (21) | | | (21) | | | 5 | | | (16) | |
| Other comprehensive income | | | | | | | | | | (14) | | | | | (14) | | | | | (14) | |
| Share-based compensation plans | | | | | | 87 | | | | | | | | | 87 | | | | | 87 | |
| Shares issued pursuant to stock awards | | 867 | | | | | | | 83 | | | | | (51) | | | 32 | | | | | 32 | |
Treasury shares and restricted stock unit withholdings | | (8,482) | | | | | | | (715) | | | | | | | (715) | | | | | (715) | |
| Shareholder tax on repurchased shares | | | | | | | | | | | | (62) | | | (62) | | | | | (62) | |
Dividends common stock ($0.25 per share) | | | | | | | | | | | | (71) | | | (71) | | | | | (71) | |
| Balance as of March 31, 2019 | | 285,175 | | | 67 | | | 15,547 | | | (3,870) | | | 109 | | | (2,112) | | | 9,741 | | | 190 | | | 9,931 | |
| Net income (loss) | | | | | | | | | | | | 41 | | | 41 | | | 5 | | | 46 | |
| Other comprehensive income | | | | | | | | | | 9 | | | | | 9 | | | | | 9 | |
| Share-based compensation plans | | | | | | 88 | | | | | | | | | 88 | | | | | 88 | |
| Shares issued pursuant to stock awards | | 194 | | | | | | | 18 | | | | | (12) | | | 6 | | | | | 6 | |
Treasury shares and restricted stock unit withholdings | | (6,616) | | | | | | | (645) | | | | | | | (645) | | | | | (645) | |
| Shareholder tax on repurchased shares | | | | | | | | | | | | 155 | | | 155 | | | | | 155 | |
Dividends common stock ($0.25 per share) | | | | | | | | | | | | (70) | | | (70) | | | | | (70) | |
| Balance as of June 30, 2019 | | 278,753 | | | 67 | | | 15,635 | | | (4,497) | | | 118 | | | (1,998) | | | 9,325 | | | 195 | | | 9,520 | |
| | | | | | | | | | | | | | | | | | |
| | | | | | | | | | | | | | | | | | |
| | | | | | | | | | | | | | | | | | |
| | | | | | | | | | | | | | | | | | |
| | | | | | | | | | | | | | | | | | |
| | | | | | | | | | | | | | | | | | |
| | | | | | | | | | | | | | | | | | |
| | | | | | | | | | | | | | | | | | |
See accompanying notes to the Condensed Consolidated Financial Statements
NXP SEMICONDUCTORS N.V.
NOTES TO THE UNAUDITED CONDENSED CONSOLIDATED FINANCIAL STATEMENTS
All amounts in millions of $ unless otherwise stated
1 Basis of Presentation and Overview
We prepared our interim condensed consolidated financial statements that accompany these notes in conformity with U.S. generally accepted accounting principles, consistent in all material respects with those applied in our Annual Report on Form 10‑K for the year ended December 31, 2019.
We have made estimates and judgments affecting the amounts reported in our condensed consolidated financial statements and the accompanying notes. The actual results that we experience may differ materially from our estimates. The interim financial information is unaudited, but reflects all normal adjustments that are, in our opinion, necessary to provide a fair statement of results for the interim periods presented. This interim information should be read in conjunction with the consolidated financial statements in our Annual Report on Form 10-K for the year ended December 31, 2019.
On May 27, 2020, NXP announced that at its Annual General Meeting of Shareholders, shareholders approved the appointment of Kurt Sievers as President and Chief Executive Officer, effective immediately. Mr. Sievers succeeded Richard “Rick” Clemmer, who previously led NXP for 11 years. Mr. Clemmer will remain a strategic advisor to NXP.
2 Significant Accounting Policies and Recent Accounting Pronouncements
Significant Accounting Policies
Except for the changes below, no material changes have been made to the Company's significant accounting policies disclosed in Note 2 Significant Accounting Policies in our Annual Report on Form 10-K for the year ended December 31, 2019. The accounting policy information below is to aid in the understanding of the financial information disclosed.
New accounting standards not yet adopted
In August 2018, the FASB issued ASU 2018-14, Compensation - Retirement Benefits - Defined Benefit Plans - General (Subtopic 715-20): Disclosure Framework - Changes to the Disclosure Requirements for Defined Benefit Plans. ASU 2018-14 removes disclosures that no longer are considered cost beneficial, clarifies the specific requirements of disclosures, and adds disclosure requirements identified as relevant. ASU 2018-14 should be applied on a retrospective basis to all periods presented and is effective for annual reporting periods ending after December 15, 2020, with early adoption permitted. The Company does not expect the adoption of this guidance to have a material impact on our financial statement disclosures.
Accounting standards recently adopted
In June 2016, the FASB issued ASU No. 2016-13, Financial Instruments-Credit Losses (Topic 326): Measurement of Credit Losses on Financial Instruments. The standard changes the accounting for recognizing impairments of financial assets. Under the new guidance, credit losses for certain types of financial instruments are estimated based on expected losses. The new guidance also modifies the impairment models for available-for-sale debt securities and for purchased financial assets with credit deterioration since their origination. The new accounting guidance generally requires the modified retrospective transition method, with the cumulative effect of applying the new accounting guidance recognized as an adjustment to opening retained earnings in the year of adoption, except for certain financial assets where the prospective transition method is required, such as available-for-sale debt securities for which an other-than-temporary impairment has been recorded. The ASUs became effective for us on January 1, 2020. The adoption of this guidance did not have a material impact on the Company's consolidated financial statements and related disclosures.
In January 2017, the FASB issued ASU 2017-04, Intangibles - Goodwill and Other (Topic 350): Simplifying the Test for Goodwill Impairment. ASU 2017-04 simplifies the subsequent measurement of goodwill by eliminating Step 2 from the goodwill impairment test. Instead, the one step quantitative impairment test calculates goodwill impairment as the excess of the carrying value of a reporting unit over its fair value, up to the carrying value of the goodwill. The ASU should be applied on a prospective basis. ASU 2017-04 became effective for us on January 1, 2020. The adoption of this update did not have a material impact on the Company's consolidated financial statements and related disclosures.
In August 2018, the FASB issued ASU 2018-13, Fair Value measurement (Topic 820): Disclosure Framework - Changes to the Disclosure Requirements for Fair Value Measurement. ASU 2018-13 removes certain disclosure requirements, including the amount of and reasons for transfers between Level 1 and Level 2 of the fair value hierarchy, the policy for timing of transfers between levels, and the valuation processes for Level 3 fair value measurements. ASU 2018-13 also adds disclosure requirements, including changes in unrealized gains and losses for the period included in other comprehensive income for recurring Level 3 fair value measurements, and the range and weighted average of significant unobservable inputs used to develop Level 3 fair value measurements. The amendments on changes in unrealized gains and losses, and the range and weighted average of significant unobservable inputs used to develop Level 3 fair value measurements, should be applied prospectively for only the most recent interim or annual period presented in the initial fiscal year of adoption. All other amendments should be applied retrospectively to all periods presented upon their effective date. ASU 2018-13 became effective for us on January 1, 2020. The adoption of this update did not have a material impact on the Company's consolidated financial statements and related disclosures.
In August 2018, the FASB issued ASU 2018-15, Intangibles - Goodwill and Other - Internal-Use Software (Subtopic 350-40): Customer’s Accounting for Implementation Costs Incurred in a Cloud Computing Arrangement That Is a Service Contract. ASU 2018-15 requires a
customer in a hosting arrangement that is a service contract to follow the guidance in Subtopic 350-40 to determine which implementation costs to capitalize as an asset related to the service contract and which costs to expense. Therefore, a customer in a hosting arrangement that is a service contract determines which project stage an implementation activity relates to. Costs for implementation activities in the application development stage are capitalized depending on the nature of the costs, while costs incurred during the preliminary project and post-implementation stages are expensed as the activities are performed. ASU 2018-15 also requires the customer to expense the capitalized implementation costs over the term of the hosting arrangement, and to apply the existing impairment guidance in Subtopic 350-40 to the capitalized implementation costs as if the costs were long-lived assets. ASU 2018-15 can be applied either retrospectively or prospectively and is effective for annual reporting periods beginning after December 15, 2019, and interim periods therein, with early adoption permitted. ASU 2018-15 became effective for us on January 1, 2020. We have elected to apply the standard prospectively. The adoption of this update did not have a material impact on the Company's consolidated financial statements and related disclosures.
No other new accounting pronouncements were issued or became effective in the period that had, or are expected to have, a material impact on our Consolidated Financial Statements.
3 Acquisitions and Divestments
2020
There were no material acquisitions during the first six months of 2020. On February 3, 2020, we completed the sale of the Company's Voice and Audio Solutions (VAS) assets, pursuant to the definitive agreement dated August 16, 2019 and which was previously classified as held for sale, with Shenzhen Goodix Technology Co., Ltd. ("Goodix") from China, for a net cash amount of $161 million inclusive of final working capital adjustments. This resulted in a gain of $110 million recorded in Other income (expense) on the Consolidated Statements of Operations.
2019
On December 6, 2019, we completed the acquisition of Marvell’s Wireless WiFi Connectivity Business Unit, Bluetooth technology portfolio and related assets for total consideration of $1.7 billion, net of closing adjustments. The acquisition complements NXP’s processing, security and connectivity offerings in the Industrial & IoT, as well as in the Automotive and Communication Infrastructure markets.
The fair values of the assets acquired and liabilities assumed in the acquisition, by major class, were recognized as follows:
| | | | | |
| Tangible fixed assets | 2 | |
| Inventory | 50 | |
| Identified intangible assets | 514 | |
| Goodwill | 1,138 | |
| Deferred tax assets | 1 | |
| Net assets acquired | 1,705 | |
Our valuation procedures related to the acquired assets and assumed liabilities was completed during the second quarter of 2020.
Goodwill arising from the acquisition is attributed to the anticipated growth from new product sales, sales to new customers, the assembled workforce and synergies expected from the combination. Substantially all of the goodwill recognized is expected to be deductible for income tax purposes.
The identified intangible assets assumed were recognized as follows:
| | | | | | | | | | | |
| Fair Value | | Weighted Average Estimated Useful Life (in Years) |
| Customer relationships (included in customer-related) | 20 | | | 6 |
| Developed technology (included in technology-based) | 324 | | | 4.4 |
In-process research and development (1) | 170 | | | N/A |
| Total identified intangible assets | 514 | | | |
1)Acquired in-process research and development (“IPR&D”) is an intangible asset classified as an indefinite lived asset until the completion or abandonment of the associated research and development effort. IPR&D will be amortized over an estimated useful life to be determined at the date the associated research and development effort is completed, or expensed immediately when, and if, the project is abandoned. Acquired IPR&D is not amortized during the period that it is considered indefinite lived, but rather is subject to annual testing for impairment or when there are indicators for impairment.
Variations of the income approach were applied to estimate the fair values of the intangible assets acquired. Developed technology and IPR&D were valued using the multi-period excess earnings method which reflects the present values of the projected cash flows that are expected to be generated by the existing technology and IPR&D less charges representing the contribution of other assets to those cash flows. Customer relationships were valued using the distributor method which uses market-based data to support the selection of profitability related to the customer relationship function.
Acquisition-related transaction costs ($5 million) such as legal, accounting and other related expenses were recorded as a component of selling, general and administrative expense in our consolidated statement of operations.
On March 27, 2019, we sold our remaining equity interest in WeEn, receiving net cash proceeds of $37 million.
4 Supplemental Financial Information
Statement of Operations Information:
Disaggregation of revenue
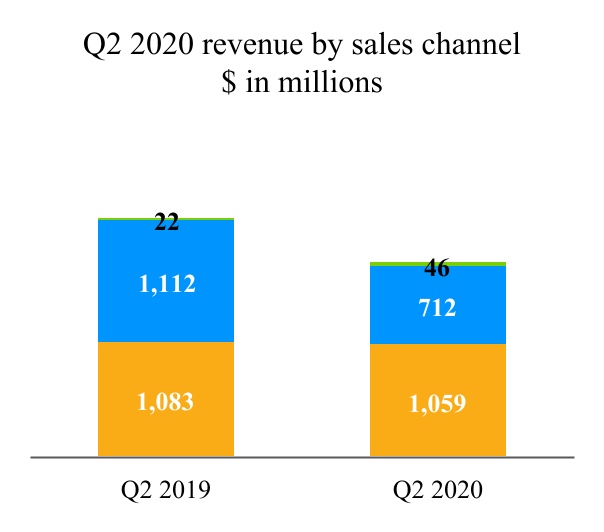
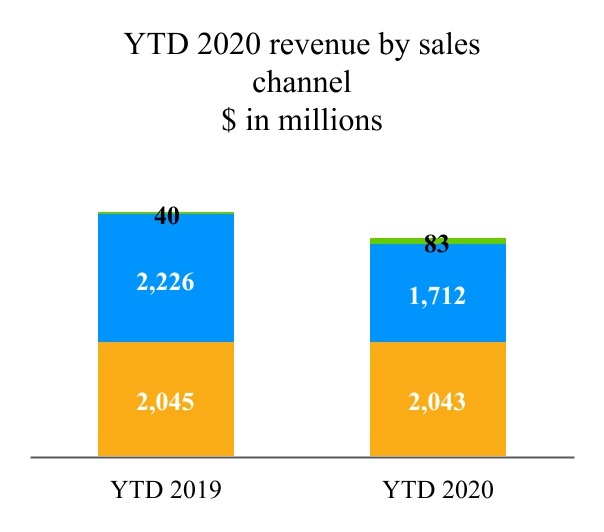
The following table presents revenue disaggregated by sales channel:
| | | | | | | | | | | | | | | | | | | | | | | |
| For the three months ended | | | | For the six months ended | | |
| June 28, 2020 | | June 30, 2019 | | June 28, 2020 | | June 30, 2019 |
| Distributors | 1,059 | | | 1,083 | | | 2,043 | | | 2,045 | |
| Original Equipment Manufacturers and Electronic Manufacturing Services | 712 | | | 1,112 | | | 1,712 | | | 2,226 | |
Other | 46 | | | 22 | | | 83 | | | 40 | |
| Total | 1,817 | | | 2,217 | | | 3,838 | | | 4,311 | |
Depreciation, amortization and impairment
| | | | | | | | | | | | | | | | | | | | | | | |
| For the three months ended | | | | For the six months ended | | |
| June 28, 2020 | | June 30, 2019 | | June 28, 2020 | | June 30, 2019 |
| Depreciation of property, plant and equipment | 136 | | | 128 | | | 269 | | | 252 | |
| Amortization of internal use software | 1 | | | 2 | | | 3 | | | 4 | |
| Amortization of other identified intangible assets | 406 | | | 376 | | | 811 | | | 752 | |
| Total - Depreciation, amortization and impairment | 543 | | | 506 | | | 1,083 | | | 1,008 | |
Other income (expense)
Income derived from manufacturing service arrangements (“MSA”) and transitional service arrangements (“TSA”) that are put in place when we divest a business or activity, is included in other income (expense). These arrangements are short-term in nature and are expected to decrease as the divested business or activity becomes more established.
The following table presents the split of other income (expense):
| | | | | | | | | | | | | | | | | | | | | | | |
| For the three months ended | | | | For the six months ended | | |
| June 28, 2020 | | June 30, 2019 | | June 28, 2020 | | June 30, 2019 |
| | | | | | | |
| | | | | | | |
| Result from MSA and TSA arrangements | (1) | | | — | | | (1) | | | 2 | |
| Other, net | — | | (1) | | | 110 | | (1) | |
| Total - Other income (expense) | (1) | | (1) | | | 109 | | 1 | |
Financial income and expense
| | | | | | | | | | | | | | | | | | | | | | | |
| For the three months ended | | | | For the six months ended | | |
| June 28, 2020 | | June 30, 2019 | | June 28, 2020 | | June 30, 2019 |
| Interest income | 4 | | | 12 | | | 8 | | | 25 | |
| Interest expense | (94) | | | (89) | | | (176) | | | (176) | |
| Total interest expense, net | (90) | | | (77) | | | (168) | | | (151) | |
| Extinguishment of debt | — | | | (10) | | | — | | | (10) | |
| Foreign exchange rate results | (5) | | | (1) | | | (1) | | | (7) | |
| | | | | | | |
| Miscellaneous financing costs/income and other, net | (1) | | | (1) | | | (5) | | | (4) | |
| Total other financial income/ (expense) | (6) | | | (12) | | | (6) | | | (21) | |
| Total - Financial income and expenses | (96) | | | (89) | | | (174) | | | (172) | |
Earnings per share
The computation of earnings per share (EPS) is presented in the following table:
| | | | | | | | | | | | | | | | | | | | | | | |
| For the three months ended | | | | For the six months ended | | |
| June 28, 2020 | | June 30, 2019 | | June 28, 2020 | | June 30, 2019 |
| Net income (loss) | (209) | | | 46 | | | (222) | | | 30 | |
| Less: net income (loss) attributable to non-controlling interests | 5 | | | 5 | | | 13 | | | 10 | |
| Net income (loss) attributable to stockholders | (214) | | | 41 | | | (235) | | | 20 | |
| | | | | | | |
| Weighted average number of shares outstanding (after deduction of treasury shares) during the year (in thousands) | 279,142 | | | 281,241 | | | 279,533 | | | 284,217 | |
| Plus incremental shares from assumed conversion of: | | | | | | | |
Options 1) | — | | | 767 | | | — | | | 771 | |
Restricted Share Units, Performance Share Units and Equity Rights 2) | — | | | 3,080 | | | — | | | 1,870 | |
Warrants 3) | — | | | — | | | — | | | — | |
| Dilutive potential common shares | — | | | 3,847 | | | — | | | 2,641 | |
| | | | | | | |
| Adjusted weighted average number of shares outstanding (after deduction of treasury shares) during the year (in thousands) | 279,142 | | | 285,088 | | | 279,533 | | | 286,858 | |
| | | | | | | |
| EPS attributable to stockholders in $: | | | | | | | |
| Basic net income (loss) | (0.77) | | | 0.15 | | | (0.84) | | | 0.07 | |
| Diluted net income (loss) | (0.77) | | | 0.14 | | | (0.84) | | | 0.07 | |
1) Stock options to purchase up to 0.9 million shares of NXP’s common stock that were outstanding in Q2 2020 (Q2 2019: 0.1 million shares) and stock options to purchase up to 0.9 million shares of NXP's common stock that were outstanding YTD 2020 (YTD 2019: 0.1 million shares) were anti-dilutive and were not included in the computation of diluted EPS because the exercise price was greater than the average fair market value of the common stock or the number of shares assumed to be repurchased using the proceeds of unrecognized compensation expense and exercise prices was greater than the weighted average number of shares underlying outstanding stock options.
2) Unvested RSUs, PSUs and equity rights of 7.7 million shares that were outstanding in Q2 2020 (Q2 2019: 0.3 million shares) and unvested RSUs, PSUs and equity rights of 7.7 million shares that were outstanding YTD 2020 (YTD 2019: 0.3 million shares) were anti-dilutive and were not included in the computation of diluted EPS because the number of shares assumed to be repurchased using the proceeds of unrecognized compensation expense was greater than the weighted average number of outstanding unvested RSUs, PSUs and equity rights or the performance goal has not been met yet.
3) Warrants to purchase up to 11.3 million shares of NXP's common stock at a price of $131.84 per share were outstanding in Q2 2019, no warrants were outstanding at the end of Q2 2020. At the end of Q2 2019, the warrants were not included in the computation of diluted EPS because the warrants exercise price was greater than the average fair market value of the common shares.
Balance Sheet Information
Cash and cash equivalents
At June 28, 2020 and December 31, 2019, our cash balance was $3,266 million and $1,045 million, respectively, of which $250 million and $188 million was held by SSMC, our consolidated joint venture company with TSMC. Under the terms of our joint venture agreement with TSMC, a portion of this cash can be distributed by way of a dividend to us, but 38.8% of the dividend will be paid to our joint venture partner. During the first six months of 2020, $90 million has been declared by SSMC, distributed subsequent to the end of the second quarter of 2020, with 38.8% being paid to our joint venture partner. In 2019, no dividend was declared by SSMC.
Inventories
The portion of finished goods stored at customer locations under consignment amounted to $36 million as of June 28, 2020 (December 31, 2019: $41 million).
Inventories are summarized as follows:
| | | | | | | | | | | |
| June 28, 2020 | | December 31, 2019 |
| Raw materials | 71 | | | 52 | |
| Work in process | 933 | | | 894 | |
| Finished goods | 224 | | | 246 | |
| 1,228 | | | 1,192 | |
The amounts recorded above are net of allowance for obsolescence of $129 million as of June 28, 2020 (December 31, 2019: $114 million).
Accumulated other comprehensive income (loss)
Total comprehensive income (loss) represents net income (loss) plus the results of certain equity changes not reflected in the condensed consolidated statements of operations. The after-tax components of accumulated other comprehensive income (loss) and their corresponding changes are shown below:
| | | | | | | | | | | | | | | | | | | | | | | |
| Currency
translation
differences | | Change in fair
value
cash flow hedges | | Net actuarial
gain/(losses) | | Accumulated
Other
Comprehensive
Income (loss) |
| As of December 31, 2019 | 203 | | | 2 | | | (130) | | | 75 | |
Other comprehensive income (loss) before
reclassifications | (23) | | | (7) | | | 6 | | | (24) | |
Amounts reclassified out of accumulated other
comprehensive income (loss) | — | | | 8 | | | — | | | 8 | |
| Tax effects | — | | | — | | | (9) | | | (9) | |
| Other comprehensive income (loss) | (23) | | | 1 | | | (3) | | | (25) | |
| As of June 28, 2020 | 180 | | | 3 | | | (133) | | | 50 | |
Cash dividends
The following dividends were declared during the first two quarters of 2020 and 2019 under NXP’s quarterly dividend program:
| | | | | | | | | | | | | | | | | | | | | | | |
| Fiscal year 2020 | | | | Fiscal year 2019 | | |
| Dividend per share | | Amount | | Dividend per share | | Amount |
| First quarter | 0.375 | | 105 | | 0.25 | | 71 | |
| Second quarter | 0.375 | | 105 | | 0.25 | | 70 | |
| 0.750 | | 210 | | 0.50 | | 141 | |
| | | | | | | |
| | | | | | | |
| | | | | | | |
| | | | | | | |
The dividend declared in the second quarter (not yet paid) is classified in the condensed consolidated balance sheet in other current liabilities as of June 28, 2020 and subsequently paid on July 6, 2020.
5 Restructuring
At each reporting date, we evaluate our restructuring liabilities, which consist primarily of termination benefits, to ensure that our accruals are still appropriate.
The following table presents the changes in restructuring liabilities in 2020:
| | | | | | | | | | | | | | | | | | | | | | | | | | | | | | | | | | | |
| As of January 1, 2020 | | Additions | | Utilized | | Released | | Other
changes | | As of June 28, 2020 |
| Restructuring liabilities | 32 | | | 17 | | | (24) | | | — | | | — | | | 25 | |
The restructuring charges consist of personnel lay-off costs of $19 million for the six month period ended June 28, 2020 (June 30, 2019: $30 million).
These restructuring charges recorded in operating income, for the periods indicated, are included in the following line items in the statement of operations:
| | | | | | | | | | | | | | | | | | | | | | | |
| For the three months ended | | | | For the six months ended | | |
| June 28, 2020 | | June 30, 2019 | | June 28, 2020 | | June 30, 2019 |
| Cost of revenue | — | | | — | | | 3 | | | 4 | |
| Research and development | 6 | | | 5 | | | 10 | | | 16 | |
| Selling, general and administrative | 2 | | | — | | | 6 | | | 10 | |
| | | | | | | |
| Net restructuring charges | 8 | | | 5 | | | 19 | | | 30 | |
6 Income Taxes
Benefit/provision for income taxes:
| | | | | | | | | | | | | | | | | | | | | | | |
| For the three months ended | | | | For the six months ended | | |
| June 28, 2020 | | June 30, 2019 | | June 28, 2020 | | June 30, 2019 |
| Tax expense (benefit) | (33) | | | 21 | | | (31) | | | 12 | |
| Effective tax rate | 13.7 | % | | 30.9 | % | | 12.4 | % | | 30.8 | % |
Our effective tax rate reflects the impact of tax incentives, non-deductible expenses, change in valuation allowance, a portion of our earnings being taxed in foreign jurisdictions at rates different than the Netherlands statutory tax rate and the mix of income and losses in various jurisdictions. Our effective tax rate for the first six months of 2020 was a benefit of 12.4% on a pre-tax loss compared with an expense of 30.8% on a pre-tax income for the first six months of 2019. The movements in our effective tax rate, apart from being in an expense position in 2019 and a benefit in 2020, relate mainly to the net effect of the decrease in the valuation allowance when compared to the same period in 2019 as there were no Netherlands related interest expense that was impacted by the interest limitation rules ($13 million) offset by the increase in non deductible goodwill ($10 million), both linked to the divestiture of the VAS business, as well as a decrease of tax incentives ($14 million) mainly driven by a lower qualifying income in 2020 and our related adjustments for changes in estimates of prior positions ($5 million) expense for the first six months of 2020 compared to a $9 million benefit for the first six months of 2019).
The Company benefits from income tax incentives in certain jurisdictions which provide that we pay reduced income taxes in those jurisdictions for a fixed period of time that varies depending on the jurisdiction. The predominant income tax holiday is expected to expire at the end of 2026. The impact of this tax holiday decreased for the second quarter of 2020 by $2 million and decreased by $2 million for the second quarter 2019 (YTD 2020: a decrease of $5 million and YTD 2019: a decrease of $4 million). The benefit of this tax holiday on net income per share (diluted) was $0.01 for the second quarter of 2020 (YTD 2020: $0.02) and $0.01 for the second quarter of 2019 (YTD 2019: $0.02).
7 Identified Intangible Assets
Identified intangible assets as of June 28, 2020 and December 31, 2019, respectively, were composed of the following:
| | | | | | | | | | | | | | | | | | | | | | | |
| June 28, 2020 | | | | December 31, 2019 | | |
| Gross carrying
amount | | Accumulated
amortization | | Gross carrying
amount | | Accumulated
amortization |
In-process R&D (IPR&D) 1) | 252 | | | — | | | 272 | | | — | |
| Marketing-related | 82 | | | (75) | | | 81 | | | (67) | |
| Customer-related | 966 | | | (365) | | | 968 | | | (340) | |
| Technology-based | 7,981 | | | (6,017) | | | 8,063 | | | (5,357) | |
| Identified intangible assets | 9,281 | | | (6,457) | | | 9,384 | | | (5,764) | |
| | | | | | | |
| (1) IPR&D is not subject to amortization until completion or abandonment of the associated research and development effort. | | | | | | | |
The estimated amortization expense for these identified intangible assets for each of the five succeeding years is:
| | | | | |
| 2020 (remaining) | 589 | |
| 2021 | 670 | |
| 2022 | 570 | |
| 2023 | 341 | |
| 2024 | 175 | |
| Thereafter | 479 | |
All intangible assets, excluding IPR&D and goodwill, are subject to amortization and have no assumed residual value.
The expected weighted average remaining life of identified intangibles is 3 years as of June 28, 2020 (December 31, 2019: 3 years).
8 Debt
On May 1, 2020, NXP B.V., together with NXP Funding LLC and NXP USA, Inc., issued $500 million of 2.7% senior unsecured notes due May 1, 2025, $500 million of 3.15% senior unsecured notes due May 1, 2027 and $1 billion of 3.4% senior unsecured notes due May 1, 2030.
The following table summarizes the outstanding debt as of June 28, 2020 and December 31, 2019:
| | | | | | | | | | | | | | | | | | | | | | | | | | | | | |
| | | June 28, 2020 | | | | December 31, 2019 | | |
| Maturities | | Amount | | Effective
rate | | Amount | | Effective
rate |
Fixed-rate 4.125% senior unsecured notes | Jun, 2021 | | 1,350 | | | 4.125 | | | 1,350 | | | 4.125 | |
Fixed-rate 4.625% senior unsecured notes | Jun, 2022 | | 400 | | | 4.625 | | | 400 | | | 4.625 | |
Fixed-rate 3.875% senior unsecured notes | Sep, 2022 | | 1,000 | | | 3.875 | | | 1,000 | | | 3.875 | |
Fixed-rate 4.625% senior unsecured notes | Jun, 2023 | | 900 | | | 4.625 | | | 900 | | | 4.625 | |
Fixed-rate 4.875% senior unsecured notes | Mar, 2024 | | 1,000 | | | 4.875 | | | 1,000 | | | 4.875 | |
Fixed-rate 2.7% senior unsecured notes | May, 2025 | | 500 | | | 2.700 | | | — | | | — | |
Fixed-rate 5.35% senior unsecured notes | Mar, 2026 | | 500 | | | 5.350 | | | 500 | | | 5.350 | |
Fixed-rate 3.875% senior unsecured notes | Jun, 2026 | | 750 | | | 3.875 | | | 750 | | | 3.875 | |
Fixed-rate 3.15% senior unsecured notes | May, 2027 | | 500 | | | 3.150 | | | — | | | — | |
Fixed-rate 5.55% senior unsecured notes | Dec, 2028 | | 500 | | | 5.550 | | | 500 | | | 5.550 | |
Fixed-rate 4.3% senior unsecured notes | Jun, 2029 | | 1,000 | | | 4.300 | | | 1,000 | | | 4.300 | |
Fixed-rate 3.4% senior unsecured notes | May, 2030 | | 1,000 | | | 3.400 | | | — | | | — | |
| Floating-rate revolving credit facility (RCF) | Jun, 2024 | | — | | | — | | | — | | | — | |
| Total principal | | | 9,400 | | | | | 7,400 | | | |
| | | | | | | | | |
Unamortized discounts, premiums and debt
issuance costs | | | (47) | | | | | (35) | | | |
Total debt, including unamortized discounts,
premiums, debt issuance costs and fair value
adjustments | | | 9,353 | | | | | 7,365 | | | |
| Less: current portion of long-term debt | | | 1,349 | | | | | — | | | |
| Long-term debt | | | 8,004 | | | | | 7,365 | | | |
9 Leases
Operating and finance lease assets relate to buildings (corporate offices, research and development and manufacturing facilities and datacenters), land, machinery and installations and other equipment (vehicles and certain office equipment). These leases, except for land leases, have remaining lease terms of 1 to 30 years (land leases 48 to 90 years), some of which may include options to extend the leases for up to 5 years, and some of which may include options to terminate the leases within 1 year. As of June 28, 2020, assets recorded under finance leases were $82 million and accumulated depreciation associated with finance leases was $11 million. Finance lease liabilities amount to $25 million as of June 28, 2020 ($25 million as of December 31, 2019).
The components of operating lease expense were as follows:
| | | | | | | | | | | | | | | | | | | | | | | |
| For the three months ended | | | | For the six months ended | | |
| June 28, 2020 | | June 30, 2019 | | June 28, 2020 | | June 30, 2019 |
| Operating lease cost | 16 | | | 13 | | | 32 | | | 26 | |
| | | | | | | |
| | | | | | | |
| | | | | | | |
| | | | | | | |
| | | | | | | |
Other information related to operating leases was as follows:
| | | | | | | | | | | | | | | | | | | | | | | |
| For the three months ended | | | | For the six months ended | | |
| June 28, 2020 | | June 30, 2019 | | June 28, 2020 | | June 30, 2019 |
| Right-of-use assets obtained in exchange for lease obligations: | | | | | | | |
Operating leases 1) | 14 | | | 10 | | | 19 | | | 198 | |
| | | | | | | |
1) $188 million recorded on January 1, 2019 in accordance with the adoption of ASC 842. | | | | | | | |
| Weighted average remaining lease term: | | | | | | | |
| Operating leases | | | | | 6 years | | 5 years |
| | | | | | | |
| Weighted average discount rate: | | | | | | | |
| Operating leases | | | | | 3 | % | | 3 | % |
| | | | | | | |
Future minimum lease payments as of June 28, 2020 were as follows:
| | | | | | | |
| As of | | |
| June 28, 2020 | | |
| Operating leases | | |
| 2020 (remaining) | 32 | | | |
| 2021 | 54 | | | |
| 2022 | 41 | | | |
| 2023 | 33 | | | |
| 2024 | 23 | | | |
| Thereafter | 59 | | | |
| Total future minimum lease payments | 242 | | | |
| Less: imputed interest | (20) | | | |
| Total | 222 | | | |
Lease liabilities related to leases are split between current and non-current:
| | | | | | | | | | | | | | | |
| Operating leases | | | | | | |
| As of | | | | | | |
| June 28, 2020 | | | | December 31, 2019 | | |
| | | | | | | |
| Other current liabilities | 59 | | | | | 62 | | | |
| Other non-current liabilities | 163 | | | | | 176 | | | |
| Total | 222 | | | | | 238 | | | |
Operating lease right-of-use assets are $216 million as of June 28, 2020 (December 31, 2019: $226 million) and are included in other non-current assets in the condensed consolidated balance sheet.
10 Related-Party Transactions
The Company's related parties are the members of the board of directors of NXP, the executive officers of NXP and equity-accounted investees. As of the divestment of the SP business on February 7, 2017, the newly formed Nexperia has become a related party.
We have a number of strategic alliances and joint ventures. We have relationships with certain of our alliance partners in the ordinary course of business whereby we enter into various sale and purchase transactions, generally on terms comparable to transactions with third parties. However, in certain instances upon divestment of former businesses where we enter into supply arrangements with the former owned business, sales are conducted at cost.
The following table presents the amounts related to revenue and other income and purchase of goods and services incurred in transactions with these related parties:
| | | | | | | | | | | | | | | | | | | | | | | |
| For the three months ended | | | | For the six months ended | | |
| June 28, 2020 | | June 30, 2019 | | June 28, 2020 | | June 30, 2019 |
| Revenue and other income | 18 | | | 21 | | | 36 | | | 44 | |
| Purchase of goods and services | 14 | | | 16 | | | 26 | | | 35 | |
The following table presents the amounts related to receivable and payable balances with these related parties:
| | | | | | | | | | | |
| June 28, 2020 | | December 31, 2019 |
| Receivables | 7 | | | 21 | |
| Payables | 10 | | | 9 | |
As part of the divestment of the SP business, we entered into a lease commitment and related services to Nexperia, which is $59 million as of June 28, 2020, and committed $50 million to an investment fund affiliated with Nexperia’s owners. The lease commitments are reflected in our recorded lease liabilities in other current and non-current liabilities.
11 Fair Value Measurements
The following table summarizes the estimated fair value of our financial instruments which are measured at fair value on a recurring basis:
| | | | | | | | | | | | | | | | | |
| | | Estimated fair value | | |
| Fair value
hierarchy | | June 28, 2020 | | December 31, 2019 |
| Assets: | | | | | |
| Money market funds | 1 | | 2,007 | | | 6 | |
| Marketable equity | 1 | | 12 | | | 1 | |
| Derivative instruments-assets | 2 | | 6 | | | 10 | |
| | | | | |
| Liabilities: | | | | | |
| | | | | |
| | | | | |
| | | | | |
| Derivative instruments-liabilities | 2 | | (6) | | | (1) | |
The following methods and assumptions were used to estimate the fair value of financial instruments:
Assets and liabilities measured at fair value on a recurring basis
Investments in money market funds (as part of our cash and cash equivalents) and marketable equity securities have fair value measurements which are all based on quoted prices in active markets for identical assets or liabilities. For derivatives the fair value is based upon significant other observable inputs depending on the nature of the derivative.
Assets and liabilities recorded at fair value on a non-recurring basis
We measure and record our non-marketable equity securities, equity method investments and non-financial assets, such as intangible assets and property, plant and equipment, at fair value when an impairment charge is required.
Assets and liabilities not recorded at fair value on a recurring basis
Financial instruments not recorded at fair value on a recurring basis include non-marketable equity securities and equity method investments that have not been remeasured or impaired in the current period and debt.
As of June 28, 2020, the estimated fair value of debt, including the current portion, was $10.3 billion ($7.9 billion as of December 31, 2019). The fair value is estimated on the basis of broker-dealer quotes, which are Level 2 inputs. Accrued interest is included under accrued liabilities and not within the carrying amount or estimated fair value of debt.
12 Litigation
We are regularly involved as plaintiffs or defendants in claims and litigation relating to a variety of matters such as contractual disputes, personal injury claims, employee grievances and intellectual property litigation. In addition, our acquisitions, divestments and financial transactions sometimes result in, or are followed by, claims or litigation. Some of these claims may possibly be recovered from insurance reimbursements. Although the ultimate disposition of asserted claims cannot be predicted with certainty, it is our belief that the outcome of any such claims, either individually or on a combined basis, will not have a material adverse effect on our consolidated financial position. However, such outcomes may be material to our condensed consolidated statement of operations for a particular period. The Company records an accrual for any claim that arises whenever it considers that it is probable that it is exposed to a loss contingency and the amount of the loss contingency can be reasonably estimated. Legal fees are expensed when incurred.
Based on the most current information available to it and based on its best estimate, the Company also reevaluates at least on a quarterly basis the claims that have arisen to determine whether any new accruals need to be made or whether any accruals made need to be adjusted. Based on the procedures described above, the Company has an aggregate amount of $18 million accrued for potential and current legal proceedings pending as of June 28, 2020, compared to $44 million accrued at December 31, 2019. The accruals are included in “Other current liabilities” and “Other non-current liabilities”. As of June 28, 2020, the Company’s balance related to insurance reimbursements was $8 million (December 31, 2019: $25 million) and is included in “Other current assets” and “Other non-current assets”.
The Company also estimates the aggregate range of reasonably possible losses in excess of the amount accrued based on currently available information for those cases for which such estimate can be made. The estimated aggregate range requires significant judgment, given the varying stages of the proceedings (including the fact that many of them are currently in preliminary stages), the existence of multiple defendants (including the Company) in such claims whose share of liability has yet to be determined, the numerous yet-unresolved issues in many of the claims, and the attendant uncertainty of the various potential outcomes of such claims. Accordingly, the Company’s estimate will change from time to time, and actual losses may be more than the current estimate. As at June 28, 2020, the Company believes that for all litigation pending its potential aggregate exposure to loss in excess of the amount accrued (without reduction for any amounts that may possibly be recovered under insurance programs) could range between $0 and $23 million. Based upon our past experience with these matters, the Company would expect to receive insurance reimbursement on certain of these claims that would offset the potential maximum exposure of up to $15 million.
In addition, the Company is currently assisting Motorola in the defense of personal injury lawsuits due to indemnity obligations included in the agreement that separated Freescale from Motorola in 2004. The multi-plaintiff Motorola lawsuits are pending in Cook County, Illinois. These claims allege a link between working in semiconductor manufacturing clean room facilities and birth defects in 18 individuals. The Motorola suits allege exposures between 1981 and 2005. Each claim seeks an unspecified amount of damages for the alleged injuries; however, legal counsel representing the plaintiffs has indicated they will seek substantial compensatory and punitive damages from Motorola for the entire inventory of claims which, if proven and recovered, the Company considers to be material. In the Motorola suits, a portion of any indemnity due to Motorola will be reimbursed to NXP if Motorola receives an indemnification payment from its insurance coverage. Motorola has potential insurance coverage for many of the years indicated above, but with differing types and levels of coverage, self-insurance retention amounts and deductibles. We are in discussions with Motorola and their insurers regarding the availability of applicable insurance coverage for each of the individual cases. Motorola and NXP have denied liability for these alleged injuries based on numerous defenses.
Item 2. Management’s Discussion and Analysis of Financial Condition and Results of Operations
This interim Management’s Discussion and Analysis ("MD&A") should be read in conjunction with our consolidated financial statements and notes and the MD&A in our Annual Report on Form 10-K for the year ended December 31, 2019. This discussion contains forward-looking statements that involve a number of risks and uncertainties, including any statements that refer to projections of our future financial performance, our anticipated growth and trends in our businesses, uncertain events or assumptions, and other characterizations of future events or circumstances, including our response to the current global pandemic and the potential impact the pandemic will have on our operations, liquidity, customers, facilities and supply chain. Such statements are based on our current expectations and could be affected by the uncertainties and risk factors described throughout this filing, including the risk factor set forth in Part II, Item 1A of this Quarterly Report on Form 10-Q specifically related to the coronavirus outbreak and measures taken in response thereto, and in “Risk Factors” in Part I, Item 1A of our Annual Report on Form 10-K. Our actual results may differ materially from those contained in any forward-looking statements. We undertake no obligation to update any forward-looking statement to reflect subsequent events or circumstances.
Our MD&A is provided in addition to the accompanying consolidated financial statements and notes to assist readers in understanding our results of operations, financial condition and cash flows. MD&A is organized as follows:
•Overview - Overall analysis of financial and other highlights to provide context for the MD&A
•Results of Operations - An analysis of our financial results
•Liquidity and Capital Resources - An analysis of changes in our balance sheets and cash flows
•Contractual Obligations - An update on contractual obligations as of December 31, 2019
•Off-balance Sheet Arrangements - An update on off-balance sheet arrangements as of December 31, 2019
Overview
| | | | | | | | | | | | | | | | | | | | | | | | | | | |
| ($ in millions, unless otherwise stated) | Q2 2020 | | Q2 2019 | | YTD 2020 | | YTD 2019 | | | | |
| | | | | | | | | | | |
| Revenue | 1,817 | | 2,217 | | | 3,838 | | | 4,311 | | | | | |
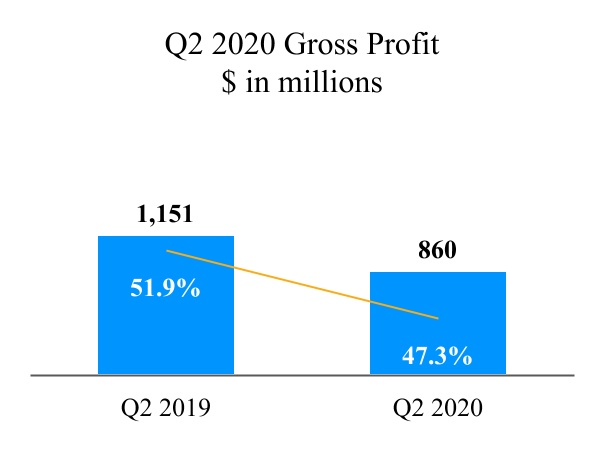
| Gross profit | 860 | | 1,151 | | | 1,857 | | | 2,223 | | | | | |
| Operating income (loss) | (145) | | | 157 | | | (77) | | | 211 | | | | | |
| Cash flow from operating activities | 414 | | 517 | | 926 | | 813 | | | | | |
| Total debt | 9,353 | | 8,538 | | 9,353 | | 8,538 | | | | | |
| Net debt | 6,087 | | 5,508 | | | 6,087 | | | 5,508 | | | | | |
| Diluted weighted average number of shares outstanding | 279,142 | | | 285,088 | | | 279,533 | | | 286,858 | | | | | |
| Diluted net income per share | (0.77) | | 0.14 | | | (0.84) | | | 0.07 | | | | | |
| Dividends per common share | 0.375 | | 0.25 | | | 0.75 | | | 0.50 | | | | | |
Q2 2020 compared to Q2 2019
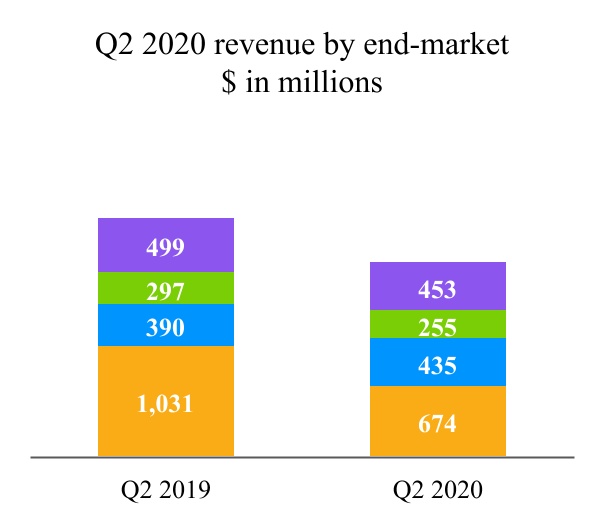
Revenue for the three months ended June 28, 2020 was down 18.0% from the three months ended June 30, 2019 against a very challenging economic backdrop, due to the COVID-19 pandemic. Revenues decreased by 34.6% in our largest end market, Automotive, 14.1% in the Mobile end market, and 9.2% in the Communications & Infrastructure end market, which were slightly offset by an increase of 11.5% in our Industrial and IOT end market. When aggregating all end markets, the decrease in revenue was mostly related to lower sales to Original Equipment Manufacturers, across all regions, but in particular in EMEA, Americas and Japan.
Our gross profit percentage for the second quarter of 2020 decreased from 51.9% in the second quarter of 2019 to 47.3%, essentially due to lower revenue and the absorption of excess manufacturing fixed costs as a result of abnormal under-loading in our front-end factories due to the COVID-19 crisis.
Notwithstanding the challenging operating environment we currently face, we continue to execute on our strategy within our target markets and focus on driving profitability.
We continue to generate strong operating cash flows, with $414 million in cash flows from operations for the second quarter of 2020. We returned $108 million to our shareholders during the second quarter of 2020. Our cash position at the end of the second quarter of 2020 was $3,266 million. This includes the net proceeds of the $2 billion of senior unsecured debt issued by NXP on May 1, 2020. On May 28, 2020, the NXP Board of Directors approved a cash dividend of $0.375 per common share for the second quarter of 2020.
YTD 2020 compared to YTD 2019
Revenue for the six months ended June 28, 2020 was down 11.0% from the six months ended June 30, 2019 against a very challenging economic backdrop, due to the COVID-19 pandemic. Revenues decreased by 19.3% in our largest end market, Automotive, 6.7% in the Mobile end market, and 9.6% in the Communications & Infrastructure end market, which were slightly offset by an increase of 7.0% in our Industrial and IOT end market. When aggregating all end markets, the decrease in revenue was mostly related to lower sales to Original Equipment Manufacturers, across regions EMEA, Americas, Japan, and Greater China (including Asia Pacific).
Our gross profit percentage for the six months ended June 28, 2020 decreased from 51.6% for the six months ended June 30, 2019 to 48.4%, primarily due to lower revenue and the absorption of excess manufacturing fixed costs as a result of abnormal under-loading in our front-end factories due to the COVID-19 crisis and the purchase accounting effect on inventory ($17 million) due to the Marvell acquisition.
On February 3, 2020, we completed the sale of the Company's Voice and Audio Solutions (VAS) assets, receiving proceeds of $161 million resulting in a gain of $110 million.
Cash flow from operation for the first six months of 2020 was $926 million, remaining strong in a challenging environment. Total shareholder return for the first six months of 2020 was $568 million. Our cash position remains solid, with the net proceeds of the $2 billion in newly issued debt adding to our cash and cash equivalents.
Update on the impact of COVID-19
Our global communities continue to face unprecedented challenges posed by the COVID-19 pandemic, but NXP continues to respond actively by addressing the COVID-19 situation and its impact globally with global crisis response teams, working to mitigate the potential impacts to our people and our business.
With our strong business model and with demonstrated financial discipline, which is a keystone of our culture, we continue to believe that we will emerge from this time well positioned for long-term growth. That being said, we cannot reasonably estimate the duration and severity of this global pandemic or its ultimate impact on the global economy and our business and results.
The impact of COVID-19 and measures to prevent its spread are affecting how we operate in a number of ways. In response, we have implemented measures to focus on the safety of our employees, while at the same time seeking to mitigate the impact on our financial position and operations. These measures include, but are not limited to, the following:
Our People
Our top priority during the COVID-19 pandemic remains and always will be protecting the health and safety of our employees. As governments throughout the world evaluate and adjust their responses, we continue working to ensure that we comply with regulatory requirements balanced with maintaining business continuity for essential operations in our factories. We have significantly reduced the number of people working in our offices, helping to protect our employees who work in our labs and factories and who are essential to keeping our business running.
Facilities and Supply Chain
From an operational perspective all our manufacturing facilities continue to operate around the world in accordance with guidance issued by local and national government authorities, and we are not experiencing any major supply chain issues. We have been extremely fortunate that the virus has not significantly impacted our broad employee base.
Liquidity and Capital Resources
Thanks to our financial strength, we expect to be able to maintain adequate liquidity as we manage through the current environment. As we operate our business in this uncertain environment, our priorities will remain the health and safety of our people, providing our essential products to consumers around the world, and remained focused on having our business deliver long-term growth. Over the years, NXP has created a business that generates significant cash, thanks to its large and diverse revenue stream. We therefore believe we have sufficient liquidity to satisfy our cash needs. However, we will continue to monitor, evaluate and take action, as necessary, to preserve adequate liquidity and ensure that our business can continue to operate during these uncertain times.
In May we had a well-received debt issuance, obtaining $2 billion in funds that will be used in part to finance or refinance eligible green products and in part to build cash and short-term investment reserves to opportunistically repay other outstanding debt or for certain corporate expenditures. In addition, as we have demonstrated as one of our strengths in the past, we continue to successfully constrain discretionary spending across the organization, re-prioritizing our capital projects, while simultaneously maintaining critical investments in areas that will assure NXP’s long-term success.
Customer Demand and Near-Term Business Outlook
For the second quarter, our revenue was modestly better than the mid-point of our original guidance. Our automotive end-market was significantly impacted by the effects of the COVID-19 pandemic on the global macro-economic environment, though we did experience better than anticipated sequential trends in our other end-markets. We are encouraged by the early positive trends we experienced in China and sales out of our distribution channel improved sequentially. We expect improved sales trends through the second half of this year, as a result of company specific program ramps and the ongoing stabilization of our end-markets. However, we want to balance our enthusiasm as it is too early to make a broad statement regarding a complete return to normalized demand or the specifics of the shape of the recovery. We note that several of ultimate end-customers of our products, especially the automotive OEMs in Europe, North America and Japan are not running at full capacity yet. Our best course of action remains to be focused on the aspects of our business we can directly control. For example, in order to maintain appropriate levels of inventory, we plan to continue to run our internal front-end factories at a much lower utilization rate, below our normal capacity, going into the third quarter.
In summary, we still find ourselves navigating a challenging and fluid environment, but we continue to have ample financial liquidity and strength to weather the current environment and maintain the critical investments in areas that will assure NXP’s long-term success in its chosen strategy.
Results of operations
The following table presents operating income for each of the three and six month periods ended June 28, 2020 and June 30, 2019, respectively:
| | | | | | | | | | | | | | | | | | | | | | | | | | | |
| ($ in millions, unless otherwise stated) | Q2 2020 | | Q2 2019 | | YTD 2020 | | YTD 2019 | | | | |
| | | | | | | | | | | |
| Revenue | 1,817 | | 2,217 | | | 3,838 | | 4,311 | | | | | |
| % nominal growth | (18.0) | | | (3.2) | | | (11.0) | | | (5.4) | | | | | |
| Gross profit | 860 | | 1,151 | | | 1,857 | | 2,223 | | | | | |
| Research and development | (402) | | (408) | | | (827) | | (823) | | | | | |
| Selling, general and administrative | (222) | | (230) | | | (455) | | (478) | | | | | |
| Amortization of acquisition-related intangible assets | (380) | | (355) | | | (761) | | (712) | | | | | |
| Other income (expense) | (1) | | (1) | | | 109 | | 1 | | | | | |
| Operating income (loss) | (145) | | | 157 | | | (77) | | | 211 | | | | | |
Revenue
Q2 2020 compared to Q2 2019
Revenue for the three months ended June 28, 2020 was $1,817 million compared to $2,217 for the three months ended June 30, 2019, a decrease of $400 million or 18%. The decrease is essentially related to lower sales in our Automotive end market, followed by our Communication & Infrastructure and Mobile end markets, which were in particular impacted by COVID-19 pandemic; offset by an increase in Industrial IoT end market.
YTD 2020 compared to YTD 2019
Revenue for the six months ended June 28, 2020 was $3,838 million compared to $4,311 million for the six months ended June 30, 2019, a decrease of $473 million or 11%. The decrease is attributed to the impact of the COVID-19 pandemic in our primary end-markets, including YTD over YTD decreases in our Automotive, Communication & Infrastructure, and Mobile end markets.
Revenue by end-market was as follows:
| | | | | | | | | | | | | | | | | | | | | | | | | | | | | | | | | | | |
| ($ in millions, unless otherwise stated) | Q2 2020 | | Q2 2019 | | Change | | YTD 2020 | | YTD 2019 | | Change |
| Automotive | 674 | | | 1,031 | | | (34.6) | % | | 1,668 | | | 2,067 | | | (19.3) | % |
| Industrial & IoT | 435 | | | 390 | | | 11.5 | % | | 811 | | | 758 | | | 7.0 | % |
| Mobile | 255 | | | 297 | | | (14.1) | % | | 502 | | | 538 | | | (6.7) | % |
| Communication Infrastructure & Other | 453 | | | 499 | | | (9.2) | % | | 857 | | | 948 | | | (9.6) | % |
| Revenue | 1,817 | | | 2,217 | | | (18.0) | % | | 3,838 | | | 4,311 | | | (11.0) | % |
Revenue by sales channel was as follows:
| | | | | | | | | | | | | | | | | | | | | | | | | | | | | | | | | | | |
| ($ in millions, unless otherwise stated) | Q2 2020 | | Q2 2019 | | Change | | YTD 2020 | | YTD 2019 | | Change |
| Distributors | 1,059 | | | 1,083 | | | (2.2) | % | | 2,043 | | | 2,045 | | | (0.1) | % |
| OEM/EMS | 712 | | | 1,112 | | | (36.0) | % | | 1,712 | | | 2,226 | | | (23.1) | % |
| Other | 46 | | | 22 | | | 109.1 | % | | 83 | | | 40 | | | 107.5 | % |
| Revenue | 1,817 | | | 2,217 | | | (18.0) | % | | 3,838 | | | 4,311 | | | (11.0) | % |
Revenue by geographic region, which is based on the customer’s shipped-to location (except for intellectual property license revenue which is attributable to the Netherlands or the USA) was as follows:
| | | | | | | | | | | | | | | | | | | | | | | | | | | | | | | | | | | |
| ($ in millions, unless otherwise stated) | Q2 2020 | | Q2 2019 | | Change | | YTD 2020 | | YTD 2019 | | Change |
| Greater China (including Asia Pacific) | 1,165 | | | 1,247 | | | (6.6) | % | | 2,233 | | | 2,345 | | | (4.8) | % |
| EMEA (Europe, the Middle East and Africa) | 265 | | | 429 | | | (38.2) | % | | 706 | | | 870 | | | (18.9) | % |
| Americas | 167 | | | 271 | | | (38.4) | % | | 421 | | | 539 | | | (21.9) | % |
| Japan | 146 | | | 191 | | | (23.6) | % | | 316 | | | 398 | | | (20.6) | % |
| South Korea | 74 | | | 79 | | | (6.3) | % | | 162 | | | 159 | | | 1.9 | % |
| Revenue | 1,817 | | | 2,217 | | | (18.0) | % | | 3,838 | | | 4,311 | | | (11.0) | % |
| | | | | |
| n | Automotive |
| n | Industrial IoT |
| n | Mobile |
| n | Comm Infra & Other |
| | | | | |
| n | Distributors |
| n | OEM/EMS |
| n | Other |
Q2 2020 compared to Q2 2019
Revenue associated with the Automotive market declined $357 million year-on-year. The decline was due to the COVID-19 pandemic, which impacted automotive supply chains and resulted in many auto OEMs outside of China shutting car production sites, especially in North America and within the European Union. During the second quarter revenue, we experienced year on year declines across all product lines, both in our core and growth areas due to the previously mentioned auto OEM factory closures.
Revenue derived from the Industrial and IoT market increased $45 million year-on-year due to the contribution of revenue associated with the recently acquired Marvell wireless connectivity assets for connected IoT solutions. Additionally, we saw an increase in demand for smart power, general purpose microcontroller and application processors, primarily in the distribution channel due to the increase in mass market demand resulting from improvements in Greater China recovery from COVID-19.
Within the Mobile end-market, revenue decreased $42 million year-on-year. The decrease was predominantly associated with the divestment of the Voice and Audio Solutions, which closed early in the first quarter of 2020. During the second quarter, NXP experienced continued customer adoption of secure mobile wallet solutions and decreased demand for embedded power solutions, both of which are primarily serviced through our global distribution channels.
Revenue in the Communication Infrastructure and Other end-market declined $46 million year-on-year. The decline was related to reduced demand for High-Performance Radio Frequency (HPRF) power amplifiers used in 4G cellular base stations as a result of strong customer network densification programs in the year ago period. This was modestly offset by a combination of year-on-year increased demand for network communication processors by OEM customers and new revenue contribution related to the acquisition of the Marvell wireless connectivity assets used in access solutions.
YTD 2020 compared to YTD 2019
Revenue associated with the Automotive market declined $399 million year-to-date. The decline was due to the COVID-19 pandemic, which impacted automotive supply chains and resulted in many auto OEMs outside of China shutting car production sites. The year on year declines were most notable in our core auto products which are more susceptible to variances in auto production rates, including our mainstream auto processors, advanced analog, and sensor products. The declines were partially offset by the increase in sales of connectivity solutions, stemming from the Marvell connectivity acquisition, for automotive applications, as well as early ramps of battery management solutions for electric vehicles.
Revenue derived from the Industrial and IoT market increased $53 million year-to-year date due to to a contribution of revenue from the recently acquired Marvell wireless connectivity assets for connected IoT solutions. Additionally, the increase in demand for smart power, general-purpose microcontrollers and high performance analog products, primarily in the distribution channel in Greater China supported the year to date revenue trends.
Within the Mobile end-market, revenue decreased $36 million year-to-date. The decrease was predominantly associated with the divestment of the Voice and Audio Solutions which closed early in the first quarter of 2020. During the first half, NXP experienced continued customer adoption of secure mobile wallet solutions and increased demand for embedded power solutions, both of which are primarily serviced through our global distribution channels.
Revenue in the Communication Infrastructure and Other end-market declined $91 million year-to-date. The decline was related to reduced demand for High-Performance Radio Frequency (HPRF) power amplifiers used in 4G cellular base stations, as well as lower demand for network communication processors by OEM customers in Europe and Greater China (including Asia Pacific). These declines were partially offset by a combination of demand for the company’s secure card solutions and new revenue contribution related to the acquisition of the Marvell wireless connectivity assets used in access solutions.
Gross profit
Q2 2020 compared to Q2 2019
Gross profit for the three months ended June 28, 2020 was $860 million, or 47.3% of revenue, compared to $1,151 million, or 51.9% of revenue for the three months ended June 30, 2019. The decrease of $291 million was essentially driven by lower revenue and the absorption of excess manufacturing fixed costs as a result of abnormal under-loading in our front-end factories due to the COVID-19 crisis.
YTD 2020 compared to YTD 2019
Gross profit for the six months ended June 28, 2020 was $1,857 million, or 48.4% of revenue, compared to $2,223 million, or 51.6% of revenue for the six months ended June 30, 2019. The decrease of $366 million was primarily driven by lower revenue and the absorption of excess manufacturing fixed costs as a result of abnormal under-loading in our front-end factories due to the COVID-19 crisis as well as the purchase accounting effect on inventory ($17 million) resulting from the Marvell acquisition.
Operating expenses
Q2 2020 compared to Q2 2019
Operating expenses for the three months ended June 28, 2020 totaled $1,004 million, or 55.3% of revenue, compared to $993 million, or 44.8% of revenue, for the three months ended June 30, 2019.
YTD 2020 compared to YTD 2019
Operating expenses for the six months ended June 28, 2020 totaled $2,043 million, or 53.2% of revenue, compared to $2,013 million, or 46.7% of revenue, for the six months ended June 30, 2019.
The following table below presents the composition of operating expenses by line item in the statement of operations:
| | | | | | | | | | | | | | | | | | | | | | | | | | | |
| ($ in millions, unless otherwise stated) | Q2 2020 | | Q2 2019 | | YTD 2020 | | YTD 2019 | | | | |
| Research and development | 402 | | | 408 | | | 827 | | | 823 | | | | | |
| Selling, general and administrative | 222 | | | 230 | | | 455 | | | 478 | | | | | |
| Amortization of acquisition-related intangible assets | 380 | | | 355 | | | 761 | | | 712 | | | | | |
| Total operating expenses | 1,004 | | | 993 | | | 2,043 | | | 2,013 | | | | | |
Q2 2020 compared to Q2 2019
The increase in operating expenses was a result of the following items:
Research and development (R&D) costs primarily consist of engineer salaries and wages (including share based compensation and other variable compensation), engineering related costs (including outside services, fixed-asset, IP and other licenses related costs), shared service center costs and other pre-production related expenses. R&D costs for the three months ended June 28, 2020 decreased by $6 million, or 1.5%, when compared to the three months ended June 30, 2019 driven by:
- lower personnel-related costs, including variable compensation costs;
- lower engineering material costs;
- lower cost related to the sale of the Voice and Audio Solutions (VAS), which was divested on February 3, 2020; and
+ higher cost related to Marvell activities, which were acquired in the last month of the fourth quarter of 2019.
Selling, general and administrative (SG&A) costs primarily consist of personnel salaries and wages (including share based compensation and other variable compensation), communication and IT related costs, fixed-asset related costs and sales and marketing costs (including travel expenses). SG&A costs for the three months ended June 28, 2020 decreased by $8 million, or 3.5%, when compared to the three months ended June 30, 2019 mainly due to:
- lower personnel-related costs, including variable compensation costs;
- lower travel costs;
- lower merger-related costs; and
+ higher share-based compensation expenses primarily as a result of the CEO transition.
Amortization of acquisition-related intangible assets increased by $25 million, or 7.0%, when compared to the three months ended June 30, 2019 driven by:
+ the start of amortization of intangible assets related to the Marvell acquisition; and
- certain intangibles became fully amortized during 2019.
YTD 2020 compared to YTD 2019
The increase in operating expenses was a result of the following items:
Research and development (R&D) costs primarily consist of engineer salaries and wages (including share based compensation and other variable compensation), engineering related costs (including outside services, fixed-asset, IP and other licenses related costs), shared service center costs and other pre-production related expenses. R&D costs for the six months ended June 28, 2020 increased by $4 million, or 0.5%, when compared to the six months ended June 30, 2019 driven by:
+ higher cost related to Marvell activities, which were acquired in the last month of the fourth quarter of 2019;
- lower cost related to the sale of the Voice and Audio Solutions (VAS), which was divested on February 3, 2020; and
- lower personnel-related costs, including variable compensation costs.
Selling, general and administrative (SG&A) costs primarily consist of personnel salaries and wages (including share based compensation and other variable compensation), communication and IT related costs, fixed-asset related costs and sales and marketing costs (including travel expenses). SG&A costs for the six months ended June 28, 2020 decreased by $23 million, or 4.8%, when compared to the six months ended June 30, 2019 mainly due to:
- lower personnel-related costs, including variable compensation costs;
- lower travel costs;
- lower merger-related costs; and
+ higher share-based compensation expenses as a result of the CEO transition.
Amortization of acquisition-related intangible assets increased by $49 million, or 6.9%, when compared to the six months ended June 30, 2019 driven by:
+ the start of amortization of intangible assets related to the Marvell acquisition; and
- certain intangibles became fully amortized during 2019.
Other income (expense)
Income and expenses derived from manufacturing service arrangements (“MSA”) and transitional service arrangements (“TSA”) that are put into place when we divest a business or activity, are included in other income (expense). These arrangements are short-term in nature and are expected to decrease as the divested business or activity becomes more established.
The following table presents the split of other income (expense) for each of the three and six month periods ended June 28, 2020 and June 30, 2019:
| | | | | | | | | | | | | | | | | | | | | | | |
| ($ in millions) | Q2 2020 | | Q2 2019 | | YTD 2020 | | YTD 2019 |
| Income from MSA and TSA arrangements | 15 | | | 23 | | | 31 | | | 49 | |
Expenses from MSA and TSA arrangements | (16) | | | (23) | | | (32) | | | (47) | |
| Result from MSA and TSA arrangements | (1) | | | — | | | (1) | | | 2 | |
| Other, net | — | | | (1) | | | 110 | | | (1) | |
| Total | (1) | | | (1) | | | 109 | | | 1 | |
Q2 2020 compared to Q2 2019
Other income (expense) reflects an expense of $1 million for both three month periods ended June 28, 2020 and June 30, 2019.
YTD 2020 compared to YTD 2019
Other income (expense) reflects income of $109 million for the six month period ended June 28, 2020, compared to income of $1 million for the six month period ended June 30, 2019. Included in 2020 is the net gain on the sale of the Voice and Audio Solutions (VAS) assets of $110 million.
Financial income (expense)
The following table presents the details of financial income and expenses:
| | | | | | | | | | | | | | | | | | | | | | | | | | | |
| ($ in millions, unless otherwise stated) | Q2 2020 | | Q2 2019 | | YTD 2020 | | YTD 2019 | | | | |
| | | | | | | | | | | |
| Interest income | 4 | | | 12 | | | 8 | | | 25 | | | | | |
| Interest expense | (94) | | | (89) | | | (176) | | | (176) | | | | | |
| Total interest expense, net | (90) | | | (77) | | | (168) | | | (151) | | | | | |
| Foreign exchange rate results | (5) | | | (1) | | | (1) | | | (7) | | | | | |
| Extinguishment of debt | — | | | (10) | | | — | | | (10) | | | | | |
| Miscellaneous financing costs/income and other, net | (1) | | | (1) | | | (5) | | | (4) | | | | | |
| Total other financial income (expense) | (6) | | | (12) | | | (6) | | | (21) | | | | | |
| Total | (96) | | | (89) | | | (174) | | | (172) | | | | | |
Q2 2020 compared to Q2 2019
Financial income (expense) was an expense of $96 million in the second quarter of 2020 compared to an expense of $89 million in the second quarter of 2019. The change in financial income (expense) is primarily attributable to a decrease in interest income ($8 million) as a result of lower interest rates, an increase in interest expense ($5 million) as a result of newly issued debt and more unfavorable foreign exchange rate results ($4 million) in Q2 2020. This is partially offset by debt extinguishment cost ($10 million) that were paid in the second quarter of 2019.
YTD 2020 compared to YTD 2019
Financial income (expense) was an expense of $174 million in the first six months of 2020 compared to an expense of $172 million in the first six months of 2019. The change in financial income (expense) is primarily attributable to a decrease in interest income ($17 million) as a result of a lower average cash level and lower interest rates. This is partially offset by less unfavorable foreign exchange rate results ($6 million) in the first six months of 2020 and debt extinguishment cost ($10 million) that were paid in the second quarter of 2019.
Benefit (provision) for income taxes
Q2 2020 compared to Q2 2019
Our effective tax rate reflects the impact of tax incentives, non-deductible expenses, change in valuation allowance, a portion of our earnings being taxed in foreign jurisdictions at rates different than the Netherlands statutory tax rate, and the mix of income and losses in various jurisdictions. Our effective tax rate for the second quarter of 2020 was a benefit of 13.7% compared with an expense of 30.9% for the second quarter of 2019. The movement in our effective tax rate, apart from being in an expense position in 2019 and a benefit in 2020, reflects mainly the decrease in tax incentives ($11 million) primarily driven by a lower qualifying income in second quarter of 2020 and our related adjustments for changes in estimates of prior positions ($7 million expense for the second quarter 2020 compared to a $10 million benefit for the second quarter 2019).
YTD 2020 compared to YTD 2019
Our effective tax rate reflects the impact of tax incentives, non-deductible expenses, change in valuation allowance, a portion of our earnings being taxed in foreign jurisdictions at rates different than the Netherlands statutory tax rate and the mix of income and losses in various jurisdictions. Our effective tax rate for the first six months of 2020 was a benefit of 12.4% on a pre-tax loss compared with an expense of 30.8% on a pre-tax income for the first six months of 2019. The movements in our effective tax rate, apart from being in an expense position in 2019 and a benefit in 2020, relate mainly to the net effect of the decrease in the valuation allowance when compared to the same period in 2019 as there were no Netherlands related interest expense that was impacted by the interest limitation rules ($13 million) offset by the increase in non deductible goodwill ($10 million), both linked to the divestiture of the VAS business, as well as a decrease of tax incentives ($14 million) mainly driven by a lower qualifying income in 2020 and our related adjustments for changes in estimates of prior positions ($5 million) expense for the first six months of 2020 compared to a $9 million benefit for the first six months of 2019).
Net income (loss)
The following table presents the composition of net income for the periods reported:
| | | | | | | | | | | | | | | | | | | | | | | | | | | |
| ($ in millions, unless otherwise stated) | Q2 2020 | | Q2 2019 | | YTD 2020 | | YTD 2019 | | | | |
| | | | | | | | | | | |
| Operating income (loss) | (145) | | | 157 | | | (77) | | | 211 | | | | | |
| Financial income (expense): | (96) | | | (89) | | | (174) | | | (172) | | | | | |
| Benefit (provision) for income taxes | 33 | | | (21) | | | 31 | | | (12) | | | | | |
| Results relating to equity-accounted investees | (1) | | | (1) | | | (2) | | | 3 | | | | | |
| Net income (loss) | (209) | | | 46 | | | (222) | | | 30 | | | | | |
Liquidity and Capital Resources
We derive our liquidity and capital resources primarily from our cash flows from operations. We continue to generate strong positive operating cash flows. At the end of the second quarter of 2020, our cash balance was $3,266 million, an increase of $2,221 million compared to December 31, 2019. Taking into account the available amount of the Unsecured Revolving Credit Facility of $1,500 million, we had access to $4,766 million of liquidity as of June 28, 2020.
We currently use cash to fund operations, meet working capital requirements, for capital expenditures and for potential common stock repurchases, dividends and strategic investments. Based on past performance and current expectations, we believe that our current available sources of funds (including cash and cash equivalents, RCF Agreement, plus anticipated cash generated from operations) will be adequate to finance our operations, working capital requirements, capital expenditures and potential dividends for at least the next twelve months. Our capital expenditures were $218 million in the first six months of 2020, compared to $250 million in the first six months of 2019. During the six month period ended June 28, 2020, we repurchased $358 million, or 3 million shares of our common stock pursuant to our share buyback program at a weighted average price of $120.57 per share.
Our total debt amounted to $9,353 million as of Q2 2020, an increase of $2 billion compared to December 31, 2019 ($7,365 million). On May 1, 2020, NXP issued 2.7% senior notes due in 2025 ($500 million), 3.15% senior notes due in 2027 ($500 million) and 3.4% senior notes due in 2030 ($1 billion). The net proceeds of the 3.4% Senior Notes due 2030 ("2030 Notes") will be used to finance or refinance eligible green projects. Pending allocation of these net proceeds to finance or refinance eligible green projects, the net proceeds of the 2030 Notes, together with the net proceeds of the 2.7% Senior Notes due 2025 and 3.15% Senior Notes due 2027, will temporarily be held as cash and other short-term securities or temporarily used for the repayment of indebtedness, which may include the refinancing of the $1,350 million aggregate principal amount of outstanding 4.125% Senior Notes due 2021, and other corporate expenditures.
At June 28, 2020, our cash balance was $3,266 million of which $250 million was held by SSMC, our consolidated joint venture company with TSMC. Under the terms of our joint venture agreement with TSMC, a portion of this cash can be distributed by way of a dividend to us, but 38.8% of the dividend will be paid to our joint venture partner. During the first six months of 2020, $90 million has been declared by SSMC, distributed subsequent to the end of the second quarter of 2020, with 38.8% being paid to our joint venture partner. In 2019, no dividend was declared by SSMC.
Cash flows
Our cash and cash equivalents during the first six months of 2020 increased by $2,230 million (excluding the effect of changes in exchange rates on our cash position of $(9) million) as follows:
| | | | | | | | | | | |
| ($ in millions, unless otherwise stated) | YTD 2020 | | YTD 2019 |
| | | |
| Net cash provided by (used for) operating activities | 926 | | | 813 | |
| Net cash (used for) provided by investing activities | (150) | | | (280) | |
| Net cash provided by (used for) financing activities | 1,454 | | | (293) | |
| Increase (decrease) in cash and cash equivalents | 2,230 | | | 240 | |
Cash Flow from Operating Activities
For the first six months of 2020 our operating activities provided $926 million in cash. This was primarily the result of net loss of ($222) million, adjustments to reconcile the net loss of $1,034 million and changes in operating assets and liabilities of $113 million. Adjustments to net loss includes offsetting non-cash items, such as depreciation and amortization of $1,083 million, share-based compensation of $212 million, amortization of the discount (premium) on debt and debt issuance costs of $3 million, a gain on sale of assets of assets of ($110) million, results relating to equity-accounted investees of $2 million and changes in deferred taxes of ($156) million.
The change in operating assets and liabilities (working capital accounts) was attributable to the following:
The $251 million decrease in receivables and other current assets was primarily driven by the linearity in revenue and the related timing of cash collections in the first six months of 2020 compared with the same period in 2019.
The $35 million increase in inventories was primarily related to management's efforts to align inventory on hand with the current demand forecasts in the first six months of 2020 compared with the same period in 2019.
The $96 million decrease in accounts payable and other liabilities for the six months ended June 28, 2020 was primarily related to a decrease of $215 million in trade accounts payable and a $32 million decrease related to the accruals for employee related compensation and restructuring, partially offset by a net increase in income and social tax payables of $83 million, a net increase of $7 million in interest payable and $61 million of other movements including the non-cash adjustment for capital expenditures.
For the first six months of 2019 our operating activities provided $813 million in cash. This was primarily the result of net income of $30 million, adjustments to reconcile the net income of $1,124 million and changes in operating assets and liabilities of ($351) million. Net loss includes offsetting non-cash items, such as depreciation and amortization of $1,008 million, share-based compensation of $173 million,
amortization of the discount on debt and debt issuance costs of $28 million, results relating to equity-accounted investees of ($3) million and changes in deferred taxes of ($93) million.
Cash Flow from Investing Activities
Net cash used for investing activities amounted to $150 million for the first six months of 2020 and principally consisted of the cash outflows for purchases of interests in businesses (net of cash) of $21 million, capital expenditures of $218 million and $73 million for the purchase of identified intangible assets, partly offset by proceeds of $161 million from the sale of businesses (net of cash), related to the the sale of our Voice and Audio Solutions assets.
Net cash used for investing activities amounted to $280 million for the first six months of 2019 and principally consisted of the cash outflows for capital expenditures of $250 million and $51 million for the purchase of identified intangible assets, and cash used for purchase of investments of $17 million, partly offset by proceeds of $37 million from the sale of businesses (net of cash) and $1 million proceeds from sale of investments.
Cash Flow from Financing Activities
Net cash provided by financing activities was $1,454 million for the first six months of 2020 compared to net cash used for financing activities of $293 million for the first six months of 2019, detailed in the table below:
| | | | | | | | | | | |
| ($ in millions) | YTD 2020 | | YTD 2019 |
| | | |
| Repurchase of long-term debt | — | | | (553) | |
| | | |
| Proceeds from the issuance of long-term debt | 2,000 | | | 1,750 | |
| Cash paid for debt issuance costs | (15) | | | (23) | |
| Dividends paid to common stockholders | (210) | | | (144) | |
| Cash proceeds from exercise of stock options and savings from ESPP | 37 | | | 37 | |
| Purchase of treasury shares | (358) | | | (1,360) | |
| | | |
| | | |
Contractual Obligations
During the first six months of 2020, our contractual obligations increased by $100 million resulting from normal business operations.
Off-balance Sheet Arrangements
At the end of the second quarter of 2020, we had no off-balance sheet arrangements other than commitments resulting from normal business operations. None of these arrangements has or is likely to have a material effect on our financial condition, results of operations or cash flows.
Item 3. Quantitative and Qualitative Disclosures About Market Risk
There have been no material changes to the Company’s market risk during the first three months of 2020. For a discussion of the Company’s exposure to market risk, refer to the Company’s market risk disclosures set forth in Part II, Item 7A, “Quantitative and Qualitative Disclosures About Market Risk” in our Annual Report on Form 10-K for the year ended December 31, 2019.
Item 4. Controls and Procedures
Evaluation of Disclosure Controls and Procedures
Our management, with the participation of the Chief Executive Officer and Chief Financial Officer (Certifying Officers), evaluated the effectiveness of the Company's disclosure controls and procedures (as defined in Rules 13a-15(e) or 15d-15(e) promulgated under the Securities Exchange Act of 1934, as amended) on June 28, 2020. Based on that evaluation, the Certifying Officers concluded the Company's disclosure controls and procedures were effective as of June 28, 2020.
Changes in Internal Control Over Financial Reporting
There were no changes in the Company's internal control over financial reporting during the three month period ended June 28, 2020, which were identified in connection with management's evaluation required by paragraph (d) of Rules 13a-15 and 15d-15 under the Exchange Act that have materially affected, or are reasonably likely to materially affect, our internal control over financial reporting.
PART II — OTHER INFORMATION
Item 1. Legal Proceedings
Not applicable.
Item 1A. Risk Factors
The extent to which the coronavirus (COVID-19) outbreak and measures taken in response thereto could materially adversely affect our financial condition and results of operations will depend on future developments, which are highly uncertain and are difficult to predict.
The novel strain of the coronavirus identified in China in late 2019 has globally spread throughout other areas such as Asia, Europe, the Middle East, and North America and has resulted in authorities implementing numerous measures to try to contain the virus, such as travel bans and restrictions, quarantines, shelter in place orders, and shutdowns. These measures have impacted and may further impact our workforce and operations, the operations of our customers, and those of our respective vendors and suppliers. We have significant manufacturing operations in China, Malaysia, Thailand, Singapore, Taiwan, The Netherlands and the U.S., and each of these countries has been affected by the outbreak and taken measures to try to contain it. There is considerable uncertainty regarding such measures and potential future measures, and restrictions on our access to our manufacturing facilities or on our support operations or workforce, or similar limitations for our vendors and suppliers, and restrictions or disruptions of transportation, such as reduced availability of air transport, port closures, and increased border controls or closures, could limit our capacity to meet customer demand and have a material adverse effect on our financial condition and results of operations.
The outbreak has significantly increased economic and demand uncertainty. The current outbreak has caused, and the continued spread of COVID-19 may exacerbate an economic slowdown, and it is possible that it could lead to a global recession. Risks related to a slowdown or recession are described in our risk factor titled “Significantly increased volatility and instability and unfavorable economic conditions may adversely affect our business” under “Risk Factors” in our Annual Report on Form 10-K for the year ended December 31, 2019.
The spread of COVID-19 has caused us to modify our business practices (including employee travel, employee work locations, and cancellation of physical participation in meetings, events and conferences), and we may take further actions as may be required by government authorities or that we determine are in the best interests of our employees, customers, partners, and suppliers. There is no certainty that such measures will be sufficient to mitigate the risks posed by the virus, and our ability to perform critical functions could be harmed.
The degree to which COVID-19 impacts our results will depend on future developments, which are highly uncertain and cannot be predicted, including, but not limited to, the duration and spread of the outbreak, its severity, the actions to contain the virus or treat its impact, and how quickly and to what extent normal economic and operating conditions can resume. Even after the COVID-19 outbreak has subsided, we may experience material adverse impacts to our business as a result of the global economic impact and any recession that has occurred or may occur in the future. To the extent the COVID-19 pandemic adversely affects our business, results of operations, financial condition and cash flows, it may also heighten many of the other risks described in the “Risk Factors” section of our Annual Report on Form 10-K for the year ended December 31, 2019. There are no comparable recent events that provide guidance as to the effect the spread of COVID-19 as a global pandemic may have, and, as a result, the ultimate impact of the outbreak on our operations and financial results is highly uncertain and subject to change.
For a description of other applicable risk factors, please refer to Part I, Item 1A: “Risk Factors” of our Annual Report on Form 10-K for the year ended December 31, 2019.
Item 2. Unregistered Sales of Equity Securities and Use of Proceeds
Purchases of Equity Securities by the Issuer and Affiliated Purchasers
In November 2019, the board of directors of NXP (the “Board”), as authorized by the 2019 annual general meeting of shareholders, authorized the repurchase of $2 billion of shares. In addition, the Board approved the purchase of shares from participants in the Company's equity programs who trade shares as trade for tax. This authorization will remain in effect until terminated by the Board. Under Dutch tax law, the repurchase of a company’s shares by an entity domiciled in the Netherlands results in a taxable event. The tax on the repurchased shares is attributed to the shareholders, with NXP making the payment on the shareholders’ behalf. As such, the tax on the repurchased shares is accounted for within stockholders’ equity.
The following share repurchase activity occurred under these programs during the three months ended June 28, 2020:
| | | | | | | | | | | | | | | | | | | | | | | | | | | | | |
Period |
Total Number
of Shares
Purchased | | Average Price
Paid per Share | | Number of Shares Purchased as Part of Publicly Announced Buy Back Programs | | Maximum Number of
Shares That May
Yet Be Purchased
Under the Buy Back Program | | Number of Shares Purchased as Trade for Tax (1) |
| March 30, 2020 – May 3, 2020 | 28,695 | | | $96.30 | | — | | | 17,246,947 | | | 28,695 | |
| May 4, 2020 – May 31, 2020 | 11,290 | | | $99.10 | | — | | | 17,127,623 | | | 11,290 | |
| June 1, 2020 – June 28, 2020 | 90 | | | $113.26 | | — | | | 15,219,181 | | | 90 | |
Total | 40,075 | | | | | — | | | | | 40,075 | |
(1) Reflects shares surrendered by participants to satisfy tax withholding obligations in connection with the Company's equity programs.
Item 5. Other Information
Not applicable.
Item 6. Exhibits
| | | | | | | | | | | |
Exhibit Number | | Exhibit Description | |
| 3.1* | | | |
4.1 | | | |
4.2 | | Registration Rights Agreement, dated May 1, 2020, among the Issuers, the Company and Goldman Sachs & Co. LLC, BofA Securities, Inc., Deutsche Bank Securities Inc., Citigroup Global Markets Inc. and Morgan Stanley & Co. LLC, as Initial Purchasers (incorporated by reference to Exhibit 4.2 to the Company’s Current Report on Form 8-K of NXP Semiconductors N.V., filed on May 1, 2020) | |
4.3 | | | |
4.4 | | | |
4.5 | | | |
| 10.1 | | Purchase Agreement, dated April 29, 2020, among the Issuers, the Company and Goldman Sachs & Co. LLC, BofA Securities, Inc., Deutsche Bank Securities Inc., Citigroup Global Markets Inc. and Morgan Stanley & Co. LLC, as Initial Purchasers. (incorporated by reference to Exhibit 1.1 to the Company’s Current Report on Form 8-K of NXP Semiconductors N.V., filed on May 1, 2020) | |
31.1* | | | |
31.2* | | | |
32.1* | | | |
| 101 | | The following materials from the Company’s Quarterly Report on Form 10-Q for the quarter ended June 28, 2020, formatted in iXBRL (Inline eXtensible Business Reporting Language): (i) Condensed Consolidated Statements of Operations for the three and six months ended June 28, 2020 and June 30, 2019; (ii) Condensed Consolidated Statements of Comprehensive Income for the three and six months ended June 28, 2020 and June 30, 2019; (iii) Condensed Consolidated Balance Sheets as of June 28, 2020 and December 31, 2019; (iv) Condensed Consolidated Statements of Cash Flows for the six months ended June 28, 2020 and June 30, 2019; (v) Condensed Consolidated Statements of Changes in Equity for the three and six months ended June 28, 2020 and June 30, 2019; and (vi) Notes to the Unaudited Condensed Consolidated Financial Statements. | |
| 104 | | Cover Page Interactive Data File (formatted as Inline XBRL and contained in Exhibit 101). | |
| | | | | |
| * | Filed or furnished herewith. |
SIGNATURE
Pursuant to the requirements of the Securities Exchange Act of 1934, the registrant has duly caused this report to be signed on its behalf by the undersigned, thereunto duly authorized.
Date: July 28, 2020
| | | | | |
| NXP Semiconductors N.V. | |
| |
| /s/ P. Kelly |
| Name: P. Kelly, CFO | |
| |
Exhibit 31.1
CERTIFICATION
I, Kurt Sievers, certify that:
1.I have reviewed this quarterly report on Form 10-Q of NXP Semiconductors N.V.;
2.Based on my knowledge, this report does not contain any untrue statement of a material fact or omit to state a material fact necessary to make the statements made, in light of the circumstances under which such statements were made, not misleading with respect to the period covered by this report;
3.Based on my knowledge, the financial statements, and other financial information included in this report, fairly present in all material respects the financial condition, results of operations and cash flows of the Registrant as of, and for, the periods presented in this report;
4.The Registrant’s other certifying officer and I are responsible for establishing and maintaining disclosure controls and procedures (as defined in Exchange Act Rules 13a-15(e) and 15d-15(e)) and internal control over financial reporting (as defined in Exchange Act Rules 13a-15(f) and 15d-15(f)) for the Registrant and have:
a)Designed such disclosure controls and procedures, or caused such disclosure controls and procedures to be designed under our supervision, to ensure that material information relating to the Registrant, including its consolidated subsidiaries, is made known to us by others within those entities, particularly during the period in which this report is being prepared;
b)Designed such internal control over financial reporting, or caused such internal control over financial reporting to be designed under our supervision, to provide reasonable assurance regarding the reliability of financial reporting and the preparation of financial statements for external purposes in accordance with generally accepted accounting principles;
c)Evaluated the effectiveness of the Registrant’s disclosure controls and procedures and presented in this report our conclusions about the effectiveness of the disclosure controls and procedures, as of the end of the period covered by this report based on such evaluation; and
d)Disclosed in this report any change in the Registrant’s internal control over financial reporting that occurred during the Registrant’s most recent fiscal quarter (the Registrant’s fourth fiscal quarter in the case of an annual report) that has materially affected, or is reasonably likely to materially affect, the Registrant’s internal control over financial reporting; and
5.The Registrant’s other certifying officer and I have disclosed, based on our most recent evaluation of internal control over financial reporting, to the Registrant’s auditors and the audit committee of the Registrant’s board of directors (or persons performing the equivalent functions):
a)All significant deficiencies and material weaknesses in the design or operation of internal control over financial reporting which are reasonably likely to adversely affect the Registrant’s ability to record, process, summarize, and report financial information; and
b)Any fraud, whether or not material, that involves management or other employees who have a significant role in the Registrant’s internal control over financial reporting.
Date: July 28, 2020
| | | | | | | | |
| By: | | /s/ Kurt Sievers |
| | Kurt Sievers |
| | President & Chief Executive Officer |
Exhibit 31.2
CERTIFICATION
I, Peter Kelly, certify that:
1.I have reviewed this quarterly report on Form 10-Q of NXP Semiconductors N.V.;
2.Based on my knowledge, this report does not contain any untrue statement of a material fact or omit to state a material fact necessary to make the statements made, in light of the circumstances under which such statements were made, not misleading with respect to the period covered by this report;
3.Based on my knowledge, the financial statements, and other financial information included in this report, fairly present in all material respects the financial condition, results of operations and cash flows of the Registrant as of, and for, the periods presented in this report;
4.The Registrant’s other certifying officer and I are responsible for establishing and maintaining disclosure controls and procedures (as defined in Exchange Act Rules 13a-15(e) and 15d-15(e)) and internal control over financial reporting (as defined in Exchange Act Rules 13a-15(f) and 15d-15(f)) for the Registrant and have:
a)Designed such disclosure controls and procedures, or caused such disclosure controls and procedures to be designed under our supervision, to ensure that material information relating to the Registrant, including its consolidated subsidiaries, is made known to us by others within those entities, particularly during the period in which this report is being prepared;
b)Designed such internal control over financial reporting, or caused such internal control over financial reporting to be designed under our supervision, to provide reasonable assurance regarding the reliability of financial reporting and the preparation of financial statements for external purposes in accordance with generally accepted accounting principles;
c)Evaluated the effectiveness of the Registrant’s disclosure controls and procedures and presented in this report our conclusions about the effectiveness of the disclosure controls and procedures, as of the end of the period covered by this report based on such evaluation; and
d)Disclosed in this report any change in the Registrant’s internal control over financial reporting that occurred during the Registrant’s most recent fiscal quarter (the Registrant’s fourth fiscal quarter in the case of an annual report) that has materially affected, or is reasonably likely to materially affect, the Registrant’s internal control over financial reporting; and
5.The Registrant’s other certifying officer and I have disclosed, based on our most recent evaluation of internal control over financial reporting, to the Registrant’s auditors and the audit committee of the Registrant’s board of directors (or persons performing the equivalent functions):
a)All significant deficiencies and material weaknesses in the design or operation of internal control over financial reporting which are reasonably likely to adversely affect the Registrant’s ability to record, process, summarize, and report financial information; and
b)Any fraud, whether or not material, that involves management or other employees who have a significant role in the Registrant’s internal control over financial reporting.
Date: July 28, 2020
| | | | | | | | |
| By: | | /s/ Peter Kelly |
| | Peter Kelly |
| | Chief Financial Officer |
Exhibit 32.1
CERTIFICATIONS OF CHIEF EXECUTIVE OFFICER AND CHIEF FINANCIAL OFFICER
PURSUANT TO
18 U.S.C. SECTION 1350,
AS ADOPTED PURSUANT TO
SECTION 906 OF THE SARBANES-OXLEY ACT OF 2002
I, Kurt Sievers, certify, as of the date hereof, pursuant to 18 U.S.C. Section 1350, as adopted pursuant to Section 906 of the Sarbanes-Oxley Act of 2002, that the Quarterly Report of NXP Semiconductors N.V. on Form 10-Q for the period ended June 28, 2020 fully complies with the requirements of Section 13(a) or 15(d) of the Securities Exchange Act of 1934 and that information contained in such Form 10-Q fairly presents in all material respects the financial condition and results of operations of NXP Semiconductors N.V. at the dates and for the periods indicated.
Date: July 28, 2020
| | | | | | | | |
| By: | | /s/ Kurt Sievers |
| | Kurt Sievers |
| | President & Chief Executive Officer |
I, Peter Kelly, certify, as of the date hereof, pursuant to 18 U.S.C. Section 1350, as adopted pursuant to Section 906 of the Sarbanes-Oxley Act of 2002, that the Quarterly Report of NXP Semiconductors N.V. on Form 10-Q for the period ended June 28, 2020 fully complies with the requirements of Section 13(a) or 15(d) of the Securities Exchange Act of 1934 and that information contained in such Form 10-Q fairly presents in all material respects the financial condition and results of operations of NXP Semiconductors N.V. at the dates and for the periods indicated.
Date: July 28, 2020
| | | | | | | | |
| By: | | /s/ Peter Kelly |
| | Peter Kelly |
| | Chief Financial Officer |