UNITED STATES
SECURITIES AND EXCHANGE COMMISSION
Washington, D.C. 20549
FORM 10-Q |
x | QUARTERLY REPORT PURSUANT TO SECTION 13 OR 15(d) OF THE SECURITIES EXCHANGE ACT OF 1934 |
For the quarterly period ended March 31, 2018
Commission File Number: 001-36771
LendingClub Corporation (Exact name of registrant as specified in its charter) |
Delaware | 51-0605731 |
(State or other jurisdiction of incorporation or organization) | (I.R.S. Employer Identification No.) |
71 Stevenson Street, Suite 1000, San Francisco, CA 94105 | |
(Address of principal executive offices and zip code) | |
Registrant’s telephone number, including area code: (415) 632-5600
Indicate by check mark whether the registrant (1) has filed all reports required to be filed by Section 13 or 15(d) of the Securities Exchange Act of 1934 during the preceding 12 months (or for such shorter period that the registrant was required to file such reports), and (2) has been subject to such filing requirements for the past 90 days. Yes x No ¨
Indicate by check mark whether the registrant has submitted electronically and posted on its corporate Web site, if any, every Interactive Data File required to be submitted and posted pursuant to Rule 405 of Regulation S-T (§232.405 of this chapter) during the preceding 12 months (or for such shorter period that the registrant was required to submit and post such files). Yes x No ¨
Indicate by check mark whether the registrant is a large accelerated filer, an accelerated filer, a non-accelerated filer, a smaller reporting company, or an emerging growth company. See the definitions of “large accelerated filer,” “accelerated filer”, “smaller reporting company”, and “emerging growth company” in Rule 12b-2 of the Exchange Act. (Check one):
Large accelerated filer | x | Accelerated filer | ¨ | |
Non-accelerated filer | ¨ (Do not check if a smaller reporting company) | Smaller reporting company | ¨ | |
Emerging growth company | ¨ | |||
If an emerging growth company, indicate by check mark if the registrant has elected not to use the extended transition period for complying with any new or revised financial accounting standards provided pursuant to Section 13(a) of the Exchange Act | ¨ | |||
Indicate by check mark whether the registrant is a shell company (as defined in Rule 12b-2 of the Exchange Act). Yes ¨ No x
As of April 30, 2018, there were 419,662,805 shares of the registrant’s common stock outstanding.
LENDINGCLUB CORPORATION
TABLE OF CONTENTS
LENDINGCLUB CORPORATION
Except as the context requires otherwise, as used herein, “LendingClub,” “Company,” “we,” “us,” and “our,” refer to LendingClub Corporation, a Delaware corporation, and, where appropriate, its consolidated subsidiaries and consolidated variable interest entities (VIEs):
• | LendingClub Asset Management, LLC (LCAM), a wholly-owned registered investment advisor with the Securities and Exchange Commission (SEC) that acts as the general partner for certain private funds and as advisor to separately managed accounts and funds of which LCAM’s wholly-owned subsidiaries are the general partners. |
• | Springstone Financial, LLC (Springstone), a wholly-owned Delaware limited liability company that facilitates the origination of education and patient finance loans by third-party issuing banks. |
• | LC Trust I (the Trust), an independent Delaware business trust that acquires loans from LendingClub and holds them for the sole benefit of certain investors that have purchased trust certificates issued by the Trust and that are related to specific underlying loans for the benefit of the investor. |
• | Various entities established to facilitate LendingClub-sponsored asset-backed securities transactions, including those that provide certain accredited investors and qualified institutional buyers the opportunity to invest in a pool of unsecured personal whole loans in a certificated form (CLUB Certificates). |
• | Various wholly-owned Delaware limited liability companies established to enter into warehouse credit agreements with certain lenders for secured revolving credit facilities. |
Forward-Looking Statements
This report contains forward-looking statements within the meaning of Section 27A of the Securities Act of 1933 and Section 21E of the Securities Exchange Act of 1934. Forward-looking statements in this Quarterly Report on Form 10-Q (Report) include, without limitation, statements regarding borrowers, credit scoring, our strategy, future operations, expected losses, future financial position, future revenue, projected costs, prospects, plans, objectives of management and expected market growth. You can identify these forward-looking statements by words such as “anticipate,” “appear,” “believe,” “continue,” “could,” “estimate,” “expect,” “intend,” “may,” “plan,” “predict,” “project,” “target,” “will,” or similar expressions.
These forward-looking statements include, among other things, statements about:
• | the ability of borrowers to repay loans and the plans of borrowers; |
• | our ability to maintain investor confidence in the operation of our platform; |
• | the likelihood of investors to continue to, directly or indirectly, invest through our platform; |
• | our ability to secure new or additional sources of investor commitments for our platform; |
• | expected rates of return for investors; |
• | the effectiveness of our platform’s credit scoring models; |
• | the use of our own capital to purchase loans; |
• | maintaining liquidity and capital availability to support purchase of loans, contractual commitments and obligations (including repurchase obligations or other commitments to purchase loans), regulatory obligations to fund loans, and general strategic directives (such as with respect to product testing or supporting our asset-backed securities initiatives), and to support marketplace equilibrium across our platform; |
• | the impact of holding loans on our balance sheet; |
• | transaction fees or other revenue we expect to recognize after loans are issued by the issuing banks who originate loans facilitated through our platform; |
• | interest income on our loans invested in by the Company and the negative fair value adjustments on associated loans; |
• | our financial condition and performance, including the impact that management’s estimates have on our financial performance and the relationship between the interim period and full year results; |
• | capital expenditures; |
• | interest rate risk and credit performance associated with the outstanding principal balance of loans and other securities and their impact to investor returns and demand for our products; |
1
LENDINGCLUB CORPORATION
• | the impact of new accounting standards; |
• | the impact of pending litigation and regulatory inquiries; |
• | our compliance with applicable local, state and Federal laws, regulations and regulatory developments or court decisions affecting our business; |
• | investor, borrower, platform and loan performance-related factors that may affect our revenue; |
• | the potential adoption rates and returns related to new products and services; |
• | the potential impact of macro-economic developments that could impact the credit performance of our loans, notes, certificates and secured borrowings, and influence borrower and investor behavior; |
• | our ability to develop and maintain effective internal controls; |
• | our ability to recruit and retain quality employees to support current operations and future growth; |
• | our ability to manage and repay our indebtedness; and |
• | other risk factors listed from time to time in reports we file with the SEC. |
We caution you that the foregoing list may not contain all of the forward-looking statements in this Report. We may not actually achieve the plans, intentions or expectations disclosed in forward-looking statements, and you should not place undue reliance on forward-looking statements. We have included important factors in the cautionary statements included in this Report and the “Risk Factors” section of our Annual Report on Form 10-K for the year ended December 31, 2017, that could, among other things, cause actual results or events to differ materially from forward-looking statements contained in this Report. Forward-looking statements do not reflect the potential impact of any future acquisitions, mergers, dispositions, joint ventures or investments we may make.
You should read this Report carefully and completely and with the understanding that actual future results may be materially different from what we expect. We do not assume any obligation to update or revise any forward-looking statements, whether as a result of new information, future events or otherwise, other than as required by law.
2
PART I. FINANCIAL INFORMATION
Item 1. Financial Statements
LENDINGCLUB CORPORATION
Condensed Consolidated Balance Sheets
(In Thousands, Except Share and Per Share Amounts)
(Unaudited)
March 31, 2018 | December 31, 2017 | ||||||
Assets | |||||||
Cash and cash equivalents | $ | 405,078 | $ | 401,719 | |||
Restricted cash (1) | 226,818 | 242,570 | |||||
Securities available for sale | 128,424 | 117,573 | |||||
Loans held for investment at fair value (1) | 2,635,413 | 2,932,325 | |||||
Loans held for investment by the Company at fair value (1) | 317,458 | 361,230 | |||||
Loans held for sale by the Company at fair value (1) | 248,344 | 235,825 | |||||
Accrued interest receivable (1) | 27,012 | 33,822 | |||||
Property, equipment and software, net | 107,177 | 101,933 | |||||
Intangible assets, net | 20,888 | 21,923 | |||||
Goodwill | 35,633 | 35,633 | |||||
Other assets (1) | 106,870 | 156,278 | |||||
Total assets | $ | 4,259,115 | $ | 4,640,831 | |||
Liabilities and Equity | |||||||
Accounts payable | $ | 3,389 | $ | 9,401 | |||
Accrued interest payable (1) | 25,510 | 32,992 | |||||
Accrued expenses and other liabilities (1) | 196,517 | 228,380 | |||||
Payable to investors | 108,247 | 143,310 | |||||
Notes, certificates and secured borrowings at fair value (1) | 2,655,417 | 2,954,768 | |||||
Payable to securitization note and residual certificate holders (includes $1,354 and $1,479 at fair value, respectively) (1) | 280,915 | 312,123 | |||||
Payable to revolving credit facilities (1) | 74,000 | 32,100 | |||||
Total liabilities | 3,343,995 | 3,713,074 | |||||
Equity | |||||||
Common stock, $0.01 par value; 900,000,000 shares authorized; 421,890,329 and 419,756,546 shares issued, respectively; 419,607,629 and 417,473,846 shares outstanding, respectively | 4,219 | 4,198 | |||||
Additional paid-in capital | 1,346,770 | 1,327,206 | |||||
Accumulated deficit | (420,600 | ) | (389,419 | ) | |||
Treasury stock, at cost; 2,282,700 shares | (19,485 | ) | (19,485 | ) | |||
Accumulated other comprehensive income (loss) | 45 | (5 | ) | ||||
Total LendingClub stockholders’ equity | 910,949 | 922,495 | |||||
Noncontrolling interests | 4,171 | 5,262 | |||||
Total equity | 915,120 | 927,757 | |||||
Total liabilities and equity | $ | 4,259,115 | $ | 4,640,831 | |||
(1) | Includes amounts in consolidated variable interest entities (VIEs) presented separately in the table below. |
3
The following table presents the assets and liabilities of consolidated variable interest entities (VIEs), which are included in the Condensed Consolidated Balance Sheets above. The assets in the table below may only be used to settle obligations of consolidated VIEs and are in excess of those obligations. Additionally, the assets and liabilities in the table below include third-party assets and liabilities of consolidated VIEs only and exclude intercompany balances that eliminate in consolidation. See “Notes to Condensed Consolidated Financial Statements – Note 7. Securitizations and Variable Interest Entities” for additional information.
March 31, 2018 | December 31, 2017 | ||||||
Assets of consolidated VIEs, included in total assets above | |||||||
Restricted cash | $ | 45,998 | $ | 34,370 | |||
Loans held for investment at fair value | 1,043,223 | 1,202,260 | |||||
Loans held for investment by the Company at fair value | 307,173 | 350,699 | |||||
Loans held for sale by the Company at fair value | 86,156 | 60,812 | |||||
Accrued interest receivable | 12,387 | 15,602 | |||||
Other assets | 3,410 | 6,324 | |||||
Total assets of consolidated variable interest entities | $ | 1,498,347 | $ | 1,670,067 | |||
Liabilities of consolidated VIEs, included in total liabilities above | |||||||
Accrued interest payable | $ | 11,196 | $ | 14,789 | |||
Accrued expenses and other liabilities | 836 | 52 | |||||
Notes, certificates and secured borrowings at fair value | 1,050,091 | 1,210,349 | |||||
Payable to securitization note and residual certificate holders | 280,915 | 312,123 | |||||
Payable to revolving credit facilities | 49,000 | 32,100 | |||||
Total liabilities of consolidated variable interest entities | $ | 1,392,038 | $ | 1,569,413 | |||
See Notes to Condensed Consolidated Financial Statements.
4
LENDINGCLUB CORPORATION
Condensed Consolidated Statements of Operations
(In Thousands, Except Share and Per Share Amounts)
(Unaudited)
Three Months Ended March 31, | |||||||
2018 | 2017 | ||||||
Net revenue: | |||||||
Transaction fees | $ | 111,182 | $ | 98,692 | |||
Investor fees | 27,895 | 21,180 | |||||
Gain on sales of loans (1) | 12,671 | 1,892 | |||||
Other revenue (1) | 1,457 | 1,746 | |||||
Net interest income and fair value adjustments: | |||||||
Interest income | 138,018 | 160,996 | |||||
Interest expense | (110,843 | ) | (158,607 | ) | |||
Net fair value adjustments (1) | (28,713 | ) | (1,417 | ) | |||
Net interest income and fair value adjustments (1) | (1,538 | ) | 972 | ||||
Total net revenue | 151,667 | 124,482 | |||||
Operating expenses: | |||||||
Sales and marketing | 57,517 | 54,583 | |||||
Origination and servicing | 22,645 | 20,449 | |||||
Engineering and product development | 36,837 | 35,760 | |||||
Other general and administrative | 52,309 | 43,574 | |||||
Regulatory litigation expense | 13,500 | — | |||||
Total operating expenses | 182,808 | 154,366 | |||||
Loss before income tax expense | (31,141 | ) | (29,884 | ) | |||
Income tax expense (benefit) | 39 | (40 | ) | ||||
Consolidated net loss | (31,180 | ) | (29,844 | ) | |||
Less: Income attributable to noncontrolling interests | 1 | — | |||||
LendingClub net loss | $ | (31,181 | ) | $ | (29,844 | ) | |
Net loss per share attributable to LendingClub: | |||||||
Basic | $ | (0.07 | ) | $ | (0.07 | ) | |
Diluted | $ | (0.07 | ) | $ | (0.07 | ) | |
Weighted-average common shares - Basic | 418,299,301 | 400,308,521 | |||||
Weighted-average common shares - Diluted | 418,299,301 | 400,308,521 | |||||
(1) | Prior period amounts have been reclassified to conform to the current period presentation. See “Notes to Condensed Consolidated Financial Statements – Note 1. Basis of Presentation” for additional information. |
See Notes to Condensed Consolidated Financial Statements.
5
LENDINGCLUB CORPORATION
Condensed Consolidated Statements of Comprehensive Income (Loss)
(In Thousands)
(Unaudited)
Three Months Ended March 31, | |||||||
2018 | 2017 | ||||||
LendingClub net income (loss) | $ | (31,181 | ) | $ | (29,844 | ) | |
Other comprehensive income (loss), before tax: | |||||||
Net unrealized gain on securities available for sale | 22 | 236 | |||||
Other comprehensive income (loss), before tax | 22 | 236 | |||||
Income tax effect | (19 | ) | 95 | ||||
Other comprehensive income (loss), net of tax | 41 | 141 | |||||
Less: Other comprehensive income (loss) attributable to noncontrolling interests | (9 | ) | — | ||||
LendingClub other comprehensive income (loss), net of tax | 50 | 141 | |||||
LendingClub comprehensive income (loss) | (31,131 | ) | (29,703 | ) | |||
Comprehensive income (loss) attributable to noncontrolling interests | (9 | ) | — | ||||
Total comprehensive income (loss) | $ | (31,140 | ) | $ | (29,703 | ) | |
See Notes to Condensed Consolidated Financial Statements.
6
LENDINGCLUB CORPORATION
Condensed Consolidated Statements of Changes in Equity
(In Thousands, Except Share Data)
(Unaudited)
LendingClub Corporation Stockholders | |||||||||||||||||||||||||||||||||||||
Common Stock | Additional Paid-in Capital | Treasury Stock | Accumulated Other Comprehensive Income (Loss) | Accumulated Deficit | Total LendingClub Stockholders’ Equity | Non-controlling interest | Total Equity | ||||||||||||||||||||||||||||||
Shares | Amount | Shares | Amount | ||||||||||||||||||||||||||||||||||
Balance at December 31, 2017 | 417,473,846 | $ | 4,198 | $ | 1,327,206 | 2,282,700 | $ | (19,485 | ) | $ | (5 | ) | $ | (389,419 | ) | $ | 922,495 | $ | 5,262 | $ | 927,757 | ||||||||||||||||
Stock-based compensation and related tax effects | — | — | 20,024 | — | — | — | — | 20,024 | — | 20,024 | |||||||||||||||||||||||||||
Stock option exercises and other | 2,133,783 | 21 | (460 | ) | — | — | — | — | (439 | ) | — | (439 | ) | ||||||||||||||||||||||||
Net unrealized gain on available for sale securities, net of tax | — | — | — | — | — | 50 | — | 50 | (8 | ) | 42 | ||||||||||||||||||||||||||
Dividends paid and return of capital to noncontrolling interests | — | — | — | — | — | — | — | — | (1,084 | ) | (1,084 | ) | |||||||||||||||||||||||||
Net loss | — | — | — | — | — | — | (31,181 | ) | (31,181 | ) | 1 | (31,180 | ) | ||||||||||||||||||||||||
Balance at March 31, 2018 | 419,607,629 | $ | 4,219 | $ | 1,346,770 | 2,282,700 | $ | (19,485 | ) | $ | 45 | $ | (420,600 | ) | $ | 910,949 | $ | 4,171 | $ | 915,120 | |||||||||||||||||
LendingClub Corporation Stockholders | |||||||||||||||||||||||||||||||||||||
Common Stock | Additional Paid-in Capital | Treasury Stock | Accumulated Other Comprehensive Loss | Accumulated Deficit | Total LendingClub Stockholders’ Equity | Non-controlling interest | Total Equity | ||||||||||||||||||||||||||||||
Shares | Amount | Shares | Amount | ||||||||||||||||||||||||||||||||||
Balance at December 31, 2016 | 397,979,772 | $ | 4,003 | $ | 1,226,206 | 2,282,700 | $ | (19,485 | ) | $ | (767 | ) | $ | (234,187 | ) | $ | 975,770 | $ | — | $ | 975,770 | ||||||||||||||||
Stock-based compensation and related tax effects | — | — | 23,453 | — | — | — | (1,397 | ) | 22,056 | — | 22,056 | ||||||||||||||||||||||||||
Stock option exercises and other | 4,864,441 | 48 | 4,251 | — | — | — | — | 4,299 | — | 4,299 | |||||||||||||||||||||||||||
Net unrealized gain on available for sale securities, net of tax | — | — | — | — | — | 141 | — | 141 | — | 141 | |||||||||||||||||||||||||||
Net loss | — | — | — | — | — | — | (29,844 | ) | (29,844 | ) | — | (29,844 | ) | ||||||||||||||||||||||||
Balance at March 31, 2017 | 402,844,213 | $ | 4,051 | $ | 1,253,910 | 2,282,700 | $ | (19,485 | ) | $ | (626 | ) | $ | (265,428 | ) | $ | 972,422 | $ | — | $ | 972,422 | ||||||||||||||||
See Notes to Condensed Consolidated Financial Statements.
7
LENDINGCLUB CORPORATION
Condensed Consolidated Statements of Cash Flows
(In Thousands)
(Unaudited)
Three Months Ended March 31, | |||||||
2018 | 2017 | ||||||
Cash Flows from Operating Activities: | |||||||
Consolidated net loss | $ | (31,180 | ) | $ | (29,844 | ) | |
Adjustments to reconcile consolidated net loss to net cash provided by (used for) operating activities: | |||||||
Net fair value adjustments | 28,713 | 1,417 | |||||
Change in fair value of loan servicing liabilities | (358 | ) | (809 | ) | |||
Change in fair value of loan servicing assets | 5,606 | 4,047 | |||||
Stock-based compensation, net | 17,801 | 19,498 | |||||
Depreciation and amortization | 11,701 | 10,254 | |||||
(Gain) Loss on sales of loans | (13,116 | ) | (5,043 | ) | |||
Other, net | 1,582 | 352 | |||||
Purchase of loans held for sale | (1,597,816 | ) | (1,176,154 | ) | |||
Principal payments received on loans held for sale | 58,943 | 892 | |||||
Proceeds from sales of whole loans | 1,348,092 | 1,172,161 | |||||
Purchase of loans held for sale by consolidated VIE | (270,770 | ) | — | ||||
Proceeds from sale of securities by consolidated VIE, net of underwriting fees and costs | 437,969 | — | |||||
Net change in operating assets and liabilities: | |||||||
Accrued interest receivable, net | 5,961 | 4,655 | |||||
Other assets | 57,461 | (6,452 | ) | ||||
Due from related parties | (96 | ) | 71 | ||||
Accounts payable | (6,058 | ) | (3,833 | ) | |||
Accrued interest payable | (7,482 | ) | (5,152 | ) | |||
Accrued expenses and other liabilities | (33,254 | ) | (3,178 | ) | |||
Net cash provided by (used for) operating activities | 13,699 | (17,118 | ) | ||||
Cash Flows from Investing Activities: | |||||||
Purchases of loans | (293,460 | ) | (524,412 | ) | |||
Principal payments received on loans | 504,618 | 640,006 | |||||
Proceeds from recoveries and sales of charged-off loans | 17,658 | 10,889 | |||||
Proceeds from sales of whole loans | — | 2,118 | |||||
Purchases of securities available for sale | (32,346 | ) | (26,430 | ) | |||
Proceeds from sales, maturities, redemptions and paydowns of securities available for sale | 40,476 | 66,817 | |||||
Proceeds from paydowns of asset-backed securities related to Company- sponsored securitizations and CLUB Certificate transactions | 6,339 | — | |||||
Purchases of property, equipment and software, net | (13,607 | ) | (7,908 | ) | |||
Net cash provided by investing activities | 229,678 | 161,080 | |||||
8
LENDINGCLUB CORPORATION
Condensed Consolidated Statements of Cash Flows
(In Thousands)
(Unaudited)
Three Months Ended March 31, | |||||||
2018 | 2017 | ||||||
Cash Flows from Financing Activities: | |||||||
Change in payable to investors | (35,222 | ) | (29,753 | ) | |||
Proceeds from issuance of notes and certificates | 292,461 | 523,305 | |||||
Repayments of secured borrowings | (47,545 | ) | — | ||||
Principal payments on and retirements of notes and certificates | (456,157 | ) | (641,103 | ) | |||
Payments on notes and certificates from recoveries/sales of related charged-off loans | (17,459 | ) | (10,790 | ) | |||
Principal payments on securitization notes | (31,729 | ) | — | ||||
Proceeds from revolving credit facilities | 274,900 | — | |||||
Principal payments on revolving credit facilities | (233,000 | ) | — | ||||
Payment for debt issuance costs | (1,119 | ) | — | ||||
Proceeds from stock option exercises and other | 185 | 4,308 | |||||
Return of capital to noncontrolling interests in consolidated VIE | (1,055 | ) | — | ||||
Dividends paid to noncontrolling interests in consolidated VIE | (30 | ) | — | ||||
Net cash used for financing activities | (255,770 | ) | (154,033 | ) | |||
Net Decrease in Cash, Cash Equivalents and Restricted Cash | (12,393 | ) | (10,071 | ) | |||
Cash, Cash Equivalents and Restricted Cash, Beginning of Period | 644,289 | 693,412 | |||||
Cash, Cash Equivalents and Restricted Cash, End of Period | $ | 631,896 | $ | 683,341 | |||
Supplemental Cash Flow Information: | |||||||
Cash paid for interest | $ | 116,273 | $ | 163,692 | |||
Non-cash investing activity: | |||||||
Accruals for property, equipment and software | $ | 956 | $ | 905 | |||
Beneficial interests retained from securitization and CLUB Certificate transactions | $ | 26,639 | $ | — | |||
The following presents cash, cash equivalents and restricted cash by category within the Condensed Consolidated Balance Sheets:
March 31, 2018 | December 31, 2017 | ||||||
Cash and cash equivalents | $ | 405,078 | $ | 401,719 | |||
Restricted cash | 226,818 | 242,570 | |||||
Total cash, cash equivalents and restricted cash | $ | 631,896 | $ | 644,289 | |||
See Notes to Condensed Consolidated Financial Statements.
9
LENDINGCLUB CORPORATION
Notes to Condensed Consolidated Financial Statements
(Tabular Amounts in Thousands, Except Share and Per Share Amounts, Ratios, or as Noted)
(Unaudited)
1. Basis of Presentation
LendingClub Corporation (LendingClub) operates an online lending marketplace platform that connects borrowers and investors. LendingClub Asset Management, LLC (LCAM), is a registered investment advisor with the Securities and Exchange Commission (SEC) and wholly-owned subsidiary of LendingClub that acts as the general partner for certain private funds. Additionally, LCAM is an advisor to separately managed accounts (SMAs) and funds of which LCAM’s wholly-owned subsidiaries are the general partners. Springstone Financial, LLC (Springstone), is a wholly-owned subsidiary of LendingClub that facilitates the origination of education and patient finance loans by third-party issuing banks. LC Trust I (the Trust) is an independent Delaware business trust that acquires loans from LendingClub and holds them for the sole benefit of certain investors that have purchased trust certificates issued by the Trust that are related to specific underlying loans for the benefit of the investor. Various wholly-owned subsidiaries of LendingClub have been established to enter into warehouse credit agreements with certain lenders for secured revolving credit facilities. Additionally, LendingClub has established various entities in connection with its role as the sponsor of asset-backed securities transactions, which include providing accredited investors and qualified institutional buyers the opportunity to invest in a pool of unsecured personal whole loans in a certificated form (CLUB Certificates).
The accompanying unaudited condensed consolidated financial statements include LendingClub, its subsidiaries (collectively referred to as the Company, we, or us) and consolidated variable interest entities (VIEs). Noncontrolling interests are reported as a separate component of consolidated equity from the equity attributable to LendingClub’s stockholders for all periods presented. All intercompany balances and transactions have been eliminated. These condensed consolidated financial statements have been prepared in conformity with accounting principles generally accepted in the United States of America (GAAP) for interim financial information and contain all adjustments, consisting of only normal recurring adjustments, necessary for the fair statement of the results and financial position for the periods presented. These accounting principles require management to make certain estimates and assumptions that affect the amounts in the accompanying financial statements. Actual results may differ from those estimates, and results reported in the interim periods are not necessarily indicative of the results for the full year or any other interim period.
In the fourth quarter of 2017, the Company separately reported “Gain (Loss) on sales of loans” and “Net fair value adjustments” from “Other revenue (expense)” in the Company’s Consolidated Statements of Operations. “Net fair value adjustments” was also revised to include other-than-temporary impairment charges on subordinated residual certificates held as a result of Company-sponsored securitization transactions, which were previously included in “Other revenue.” These changes had no impact on “Total net revenue.” Prior period amounts have been reclassified to conform to the current period presentation.
The accompanying interim condensed consolidated financial statements and these related notes should be read in conjunction with the consolidated financial statements and related notes included in the Company’s Annual Report on Form 10-K for the year ended December 31, 2017 (Annual Report) filed on February 22, 2018.
2. Summary of Significant Accounting Policies
The Company’s significant accounting policies are discussed in “Part II – Item 8 – Financial Statements and Supplementary Data – Note 2. Summary of Significant Accounting Policies” in the Annual Report. There have been no significant changes to these significant accounting policies for the three month period ended March 31, 2018, except as noted below.
10
LENDINGCLUB CORPORATION
Notes to Condensed Consolidated Financial Statements
(Tabular Amounts in Thousands, Except Share and Per Share Amounts, Ratios, or as Noted)
(Unaudited)
Accrued Interest
Accrued interest income on loans is calculated based on the contractual interest rate of the loan and recorded as interest income as earned. Loans are placed on non-accrual status upon reaching 90 days past due. When a loan is placed on non-accrual status, the Company stops accruing interest and reverses all accrued but unpaid interest as of such date. Accrued interest payable on notes, certificates and secured borrowings is also reduced when the corresponding loan is placed on non-accrual status, due to the payment dependent structure of the notes, certificates and secured borrowings.
Revenue Recognition
Transaction Fees: Transaction fees are considered revenue from contracts with customers. The Company receives transaction fees for the performance obligation of providing loan application processing and loan facilitation services for the issuing banks and education and patient service providers. Transaction fee contracts contain a single performance obligation, which consists of a series of distinct services that are substantially the same with the same pattern of transfer to customers.
Transaction fees are based on the initial principal amount of the loans facilitated by the Company and paid by the issuing banks and education and patient service providers each time a loan is issued by the issuing banks. Transaction fees to which the Company expects to be entitled are variable consideration because loan volume originated over the contractual term is not known at the contracts inception. The transaction fee is determined each time a loan is issued based on that loan’s initial principal amount. The Company pays WebBank a loan trailing fee as consideration payable to customers (the issuing banks and education and patient service providers). The loan trailing fee liability is recorded in “Accrued Expense and Other Liabilities” on the Company’s Condensed Consolidated Balance Sheets. See “Loan Trailing Fee Liability” in “Part II – Item 8. Financial Statements and Supplementary Data – Notes to Consolidated Financial Statements – Note 2. Summary of Significant Accounting Policies” in the Company’s Annual Report for further discussion. Additionally, the Company assumes the issuing bank’s obligation under Utah law to refund the pro-rated amount of the transaction fee in excess of 5% in the event the borrower prepays the loan in full before maturity. Additionally, the Company may provide refunds to borrowers when the borrower cancels the loan under certain conditions. The Company estimates refunds based on historical information. Transaction fees are reduced by estimated trailing fees and refunds.
Because the contract contains a single performance obligation, the entire transaction fee is allocated to the single performance obligation, which is satisfied at the time a loan facilitated by the Company is issued by the issuing banks. Because revenue is recognized at the same time that payments are received, there are no associated contract assets, contract liabilities, or accounts receivable.
The Company pays sales incentives to certain employees to promote the platform and certain programs. These costs do not qualify as deferred contract costs and are expensed as incurred because they are not incremental costs of obtaining a contract with a customer.
Investor Fees: Note investors, certain certificate holders and whole loan purchasers typically pay LendingClub a servicing fee on each payment received from a borrower or on the investors’ month-end principal balance of loans serviced. The servicing fee compensates the Company for managing payments from borrowers and payments to investors and maintaining investors’ platform accounts. The Company records servicing fees when received as a component of “Investor fees” in the Consolidated Statements of Operations. Servicing fees can be, and have been, modified or waived at management’s discretion. Investor fees also include the change in fair value of loan servicing assets and liabilities.
11
LENDINGCLUB CORPORATION
Notes to Condensed Consolidated Financial Statements
(Tabular Amounts in Thousands, Except Share and Per Share Amounts, Ratios, or as Noted)
(Unaudited)
Investor fees related to investment funds and separately managed accounts (SMAs) are revenue from contracts with customers. The Company receives the fees in exchange for the performance obligation of providing a series of distinct investment management services that are satisfied over time. The fees are payable monthly in arrears based on the month-end capital account or asset balance, but the fees can be, and have been, modified or waived at the discretion of LCAM. Investor fees related to funds and SMAs are recognized at the end of each month.
Other Revenue: Other revenue primarily consists of referral fee revenue. Referral fees are revenue from contracts with customers. The Company refers prospective borrowers to third-party consumer loan providers after the prospective borrower applies for a loan through LendingClub’s platform but is denied credit. Referral contracts contain a single performance obligation, which consists of a series of distinct referral services that are satisfied over time. The Company recognizes referral fees for each distinct instance of referral service when the Company is entitled to receive payment, either at the time the referral is made or when the prospective borrower enters into a successful loan agreement with the third-party consumer loan provider, pursuant to the terms of the applicable referral agreement.
Adoption of New Accounting Standards
The Company adopted the following accounting standards during the three month period ended March 31, 2018:
Financial Accounting Standards Board (FASB) Accounting Standards Update (ASU) 2014-09, Revenue from Contracts with Customers (Topic 606): Under the standard, revenue is recognized when a customer obtains control of promised goods or services in an amount that reflects the consideration the entity expects to receive in exchange for those goods or services. The Company adopted Topic 606 on January 1, 2018 using the modified retrospective method for all contracts not completed as of the date of adoption. For contracts that were modified before the effective date, the Company reflected the aggregate effect of all modifications when identifying performance obligations and allocating transaction price in accordance with practical expedient ASC 606-10-65-1-(f)-4. Results for reporting periods beginning after January 1, 2018 are presented under Topic 606, while comparative information has not been restated and continues to be reported under the accounting standards in effect for those periods.
The adoption of Topic 606 did not change (1) the timing and pattern of revenue recognition for revenue streams in the scope of Topic 606, which includes transaction fees, management fees, and referral revenue, (2) the presentation of revenue as gross versus net, or (3) the amount of contract assets, contract liabilities, and deferred contract costs. Therefore, the adoption of Topic 606 had no impact on the Company’s financial position, results of operations, equity or cash flows as of the adoption date or for the three-month period ended March 31, 2018. The Company has included the disclosures required by Topic 606 in “Note 3. Revenue from Contracts with Customers.”
ASU 2016-01 Financial Instruments – Overall (Subtopic: 825-10): Recognition and Measurement of Financial Assets and Financial Liabilities, which amends the accounting for equity investments, changes disclosure requirements related to instruments at amortized cost and fair value, and clarifies how entities should evaluate deferred tax assets for securities classified as available for sale. The guidance also requires an entity to present separately in other comprehensive income the portion of the total change in fair value of a liability resulting from a change in the instrument-specific credit risk when the entity has elected to measure the liability under the fair value option. The Company adopted ASU 2016-01 on January 1, 2018. The adoption did not impact the Company’s financial position, results of operations, or cash flows. The Company has included the disclosures required by ASU 2016-01 in “Note 8. Fair Value of Assets and Liabilities.”
ASU 2016-15 Statement of Cash Flows (Topic 230): Classification of Certain Cash Receipts and Cash Payments to address diversity in practice in how certain cash receipts and payments are presented and classified in the statements of cash flows. The guidance also clarifies how the predominance principle should be applied when cash receipts and cash payments have aspects of more than one class of cash flows. The Company adopted ASU 2016-15 on
12
LENDINGCLUB CORPORATION
Notes to Condensed Consolidated Financial Statements
(Tabular Amounts in Thousands, Except Share and Per Share Amounts, Ratios, or as Noted)
(Unaudited)
January 1, 2018 and applied it retrospectively to all periods presented in the Consolidated Statements of Cash Flows. The adoption did not impact the Condensed Consolidated Statements of Cash Flows.
ASU 2016-18, Statement of Cash Flows (Topic 230): Restricted Cash, addresses the diversity in the classification and presentation of changes in restricted cash in the statements of cash flows, by requiring entities to combine the changes in cash and cash equivalents and restricted cash in one line. As a result, entities will no longer present transfers between cash and cash equivalents and restricted cash in the statements of cash flows. The Company adopted ASU 2016-18 on January 1, 2018 and applied it retrospectively to all periods presented in the Consolidated Statements of Cash Flows. For the three months ended March 31, 2018 and 2017, the impact of the adoption resulted in a decrease in net cash provided by investing activities of $15.8 million and $28.9 million, respectively, due to reclassifying the changes in Restricted Cash to the beginning and ending Cash, Cash Equivalents and Restricted Cash balances within the Condensed Consolidated Statements of Cash Flows.
ASU 2017-09 Compensation – Stock Compensation (Topic 718): Scope of Modification Accounting, clarifies when to account for a change to the terms or conditions of a share-based payment award as a modification. The Company prospectively adopted ASU 2017-09 on January 1, 2018. The adoption did not have an impact on the Company’s financial position, results of operations, cash flows or related disclosures.
ASU 2018-02, Income Statement – Reporting Comprehensive Income (Topic 220): Reclassification of Certain Tax Effects from Accumulated Other Comprehensive Income, which allows companies the option to reclassify stranded tax effects caused by the newly-enacted Tax Cuts and Jobs Act from accumulated other comprehensive income to retained earnings. The ASU will be effective January 1, 2019 with early adoption permitted. The Company early adopted ASU 2018-02 on January 1, 2018. The adoption did not have a material impact on the Company’s financial position, results of operations, cash flows or related disclosures.
New Accounting Standards Not Yet Adopted
Updates to the new accounting standards not yet adopted as disclosed in the Company’s Annual Report and recently issued are as follows:
In June 2016, the FASB amended guidance related to impairment of financial instruments as part of ASU 2016-13 Financial Instruments – Credit Losses (Topic 326): Measurement of Credit Losses on Financial Instruments, which will be effective January 1, 2020. The guidance replaces the incurred loss impairment methodology with an expected credit loss model for which a company recognizes an allowance based on the estimate of expected credit loss. The Company accounts for its loans at fair value through net income, which is outside the scope of Topic 326. For available for sale debt securities, the guidance will require recognition of expected credit losses by recognizing an allowance for credit losses when the fair value of the security is below amortized cost and the recognition of this allowance is limited to the difference between the security’s amortized cost basis and fair value. The Company is evaluating the impact this ASU will have on its financial position, results of operations, and cash flows.
In February 2016, the FASB issued ASU 2016-02, Leases (Topic 842), which requires lessees to record on their balance sheets a lease liability for the obligation to make lease payments and a right-of-use (ROU) asset for the right to use the underlying asset for the lease term. Lessees may elect to not recognize lease liabilities and ROU assets for leases with terms of 12 months or less. The lease liability is measured at the present value of the lease payments over the lease term. The ROU asset will be based on the liability, adjusted for lease prepayments, lease incentives, and the lessee’s initial direct costs. For operating leases, lease expense will generally be recognized on a straight-line basis over the lease term. Lessor accounting activities are largely unchanged from existing lease accounting. The new standard is effective January 1, 2019 and requires modified retrospective transition approach, with early adoption permitted. The Company expects to adopt the new standard in the first quarter of 2019. The Company has dedicated internal resources, engaged a professional services firm, and is currently in the project planning phase of
13
LENDINGCLUB CORPORATION
Notes to Condensed Consolidated Financial Statements
(Tabular Amounts in Thousands, Except Share and Per Share Amounts, Ratios, or as Noted)
(Unaudited)
the implementation. The Company is evaluating the impact of this guidance on its financial position, results of operations, cash flows and related disclosures.
3. Revenue from Contracts with Customers
The Company’s revenue from contracts with customers includes transaction fees, investor fees related to the funds and SMAs, and referral fees. Management fees related to the funds and SMAs are presented as a component of “Investor fees” and referral fees are presented as a component of “Other revenue” in the Condensed Consolidated Statements of Operations. The following table presents the Company’s revenue from contracts with customers, disaggregated by revenue source:
Three Months Ended March 31, 2018 | Timing of Revenue Recognition | |||||||||||
Services Transferred at a Point of Time | Services Transferred Over Time | |||||||||||
Transaction fees | $ | 111,182 | $ | — | $ | 111,182 | ||||||
Investor fees - Funds and SMAs | 41 | — | 41 | |||||||||
Referral fees | 836 | — | 836 | |||||||||
Total Revenue from Contracts with Customers | $ | 112,059 | $ | — | $ | 112,059 | ||||||
Revenues are recognized when control of the promised services is transferred to the Company’s customers, in an amount that reflects the consideration the Company expects to be entitled to in exchange for those services. For additional detail on the Company’s accounting policy regarding revenue recognition, see “Note 2. Summary of Significant Accounting Policies” above.
The Company recognizes transaction fees at the time it receives such fees, therefore, no accounts receivable is recorded for transaction fees. Management fees and referral fees are received after the Company satisfies its performance obligation. As of March 31, 2018, accounts receivable from these fees were $0.3 million. The Company had no bad-debt expense for the three month period ended March 31, 2018. The Company had no contract assets, contract liabilities, or deferred contract costs recorded as of March 31, 2018. Additionally, the Company did not recognize any revenue from performance obligations related to prior periods (for example, due to changes in transaction price) for the three month period ended March 31, 2018.
4. Net Loss Per Share
The following table details the computation of the Company’s basic and diluted net loss per share:
Three Months Ended March 31, | ||||||||
2018 | 2017 | |||||||
LendingClub net loss | $ | (31,181 | ) | $ | (29,844 | ) | ||
Weighted average common shares - Basic | 418,299,301 | 400,308,521 | ||||||
Weighted average common shares - Diluted | 418,299,301 | 400,308,521 | ||||||
Net loss per share attributable to LendingClub: | ||||||||
Basic | $ | (0.07 | ) | $ | (0.07 | ) | ||
Diluted | $ | (0.07 | ) | $ | (0.07 | ) | ||
14
LENDINGCLUB CORPORATION
Notes to Condensed Consolidated Financial Statements
(Tabular Amounts in Thousands, Except Share and Per Share Amounts, Ratios, or as Noted)
(Unaudited)
5. Securities Available for Sale
The amortized cost, gross unrealized gains and losses, and fair value of securities available for sale as of March 31, 2018 and December 31, 2017, were as follows:
March 31, 2018 | Amortized Cost | Gross Unrealized Gains | Gross Unrealized Losses | Fair Value | |||||||||||
Asset-backed senior securities related to Company-sponsored securitizations (1) | $ | 45,875 | $ | 54 | $ | (48 | ) | $ | 45,881 | ||||||
Certificates of deposit | 20,303 | — | — | 20,303 | |||||||||||
Asset-backed subordinated residual certificates related to Company-sponsored securitizations and CLUB Certificate transactions (1) | 20,070 | 125 | (66 | ) | 20,129 | ||||||||||
Corporate debt securities | 19,853 | 2 | (15 | ) | 19,840 | ||||||||||
Asset-backed securities | 14,588 | — | (2 | ) | 14,586 | ||||||||||
Commercial paper | 7,685 | — | — | 7,685 | |||||||||||
Total securities available for sale | $ | 128,374 | $ | 181 | $ | (131 | ) | $ | 128,424 | ||||||
December 31, 2017 | Amortized Cost | Gross Unrealized Gains | Gross Unrealized Losses | Fair Value | |||||||||||
Asset-backed senior securities related to Company-sponsored securitizations (1) | $ | 36,953 | $ | 73 | $ | (6 | ) | $ | 37,020 | ||||||
Certificates of deposit | 24,758 | — | — | 24,758 | |||||||||||
Corporate debt securities | 16,268 | 1 | (11 | ) | 16,258 | ||||||||||
Asset-backed securities | 14,843 | 1 | (1 | ) | 14,843 | ||||||||||
Commercial paper | 14,665 | — | — | 14,665 | |||||||||||
Asset-backed subordinated residual certificates related to Company-sponsored securitizations and CLUB Certificate transactions (1) | 10,058 | 11 | (40 | ) | 10,029 | ||||||||||
Total securities available for sale | $ | 117,545 | $ | 86 | $ | (58 | ) | $ | 117,573 | ||||||
(1) | As of March 31, 2018 and December 31, 2017, approximately $64.2 million and $45.3 million, respectively, of the asset-backed securities related to Company-sponsored securitizations and CLUB Certificate transactions are subject to restrictions on transfer pursuant to the Company's obligations as a “sponsor” under the U.S. Risk Retention Rules (as more fully described in “Part II. Other Information – Item 1A. Risk Factors – Risk retention rules and recent developments in our business may increase our compliance costs, impair our liquidity and otherwise adversely affect our operating results” in the Company’s Annual Report). |
The senior securities and the subordinated residual certificates related to the securitization and CLUB Certificate transactions are accounted for as securities available for sale, as described in “Note 7. Securitizations and Variable Interest Entities.” The senior securities and subordinated residual certificates are included in asset-backed securities related to Company-sponsored securitizations and CLUB Certificate transactions in the table above. The senior securities are valued using prices obtained from third-party pricing services (Level 2 of the fair value hierarchy), as described in the Company’s Annual Report (“Note 2. Summary of Significant Accounting Policies”). The subordinated residual certificates and CLUB Certificates retained interests are valued using discounted cash flow models that incorporate contractual payment terms and estimated discount rates, credit losses, and prepayment rates
15
LENDINGCLUB CORPORATION
Notes to Condensed Consolidated Financial Statements
(Tabular Amounts in Thousands, Except Share and Per Share Amounts, Ratios, or as Noted)
(Unaudited)
(Level 3 of the fair value hierarchy). The fair value of the subordinated residual certificates and retained CLUB Certificates was $20.1 million and $10.0 million at March 31, 2018 and December 31, 2017, respectively.
A summary of securities available for sale with unrealized losses as of March 31, 2018 and December 31, 2017, aggregated by period of continuous unrealized loss, is as follows:
Less than 12 months | 12 months or longer | Total | |||||||||||||||||||||
March 31, 2018 | Fair Value | Unrealized Losses | Fair Value | Unrealized Losses | Fair Value | Unrealized Losses | |||||||||||||||||
Asset-backed securities related to Company-sponsored securitizations and CLUB Certificate transactions | $ | 42,018 | $ | (114 | ) | $ | — | $ | — | $ | 42,018 | $ | (114 | ) | |||||||||
Corporate debt securities | 15,377 | (15 | ) | — | — | 15,377 | (15 | ) | |||||||||||||||
Asset-backed securities | 1,748 | (2 | ) | — | — | 1,748 | (2 | ) | |||||||||||||||
Total securities with unrealized losses (1) | $ | 59,143 | $ | (131 | ) | $ | — | $ | — | $ | 59,143 | $ | (131 | ) | |||||||||
Less than 12 months | 12 months or longer | Total | |||||||||||||||||||||
December 31, 2017 | Fair Value | Unrealized Losses | Fair Value | Unrealized Losses | Fair Value | Unrealized Losses | |||||||||||||||||
Asset-backed securities related to Company-sponsored securitizations and CLUB Certificate transactions | $ | 26,534 | $ | (46 | ) | $ | — | $ | — | $ | 26,534 | $ | (46 | ) | |||||||||
Corporate debt securities | 14,368 | (11 | ) | — | — | 14,368 | (11 | ) | |||||||||||||||
Asset-backed securities | 4,401 | (1 | ) | — | — | 4,401 | (1 | ) | |||||||||||||||
Total securities with unrealized losses (1) | $ | 45,303 | $ | (58 | ) | $ | — | $ | — | $ | 45,303 | $ | (58 | ) | |||||||||
(1) | The number of investment positions with unrealized losses at March 31, 2018 and December 31, 2017 totaled 30 and 24, respectively. |
During the first quarter of 2018, the Company recognized $1.3 million in other-than-temporary impairment charges on its subordinated residual certificates held as a result of its Company-sponsored securitization transactions. There were no credit losses recognized into earnings for other-than-temporarily impaired securities held by the Company during the first quarter of 2018 for which a portion of the impairment was previously recognized in other comprehensive income. During the first quarter of 2017, the Company recognized no other-than-temporary impairment charges.
16
LENDINGCLUB CORPORATION
Notes to Condensed Consolidated Financial Statements
(Tabular Amounts in Thousands, Except Share and Per Share Amounts, Ratios, or as Noted)
(Unaudited)
The contractual maturities of securities available for sale at March 31, 2018, were as follows:
Within 1 year | After 1 year through 5 years | Total | |||||||
Certificates of deposit | $ | 20,303 | $ | — | $ | 20,303 | |||
Corporate debt securities | 19,840 | — | 19,840 | ||||||
Asset-backed securities | 12,086 | 2,500 | 14,586 | ||||||
Commercial paper | 7,685 | — | 7,685 | ||||||
Fair value | $ | 59,914 | $ | 2,500 | $ | 62,414 | |||
Asset-backed securities related to Company-sponsored securitizations and CLUB Certificate transactions | 66,010 | ||||||||
Total fair value | $ | 59,914 | $ | 2,500 | $ | 128,424 | |||
Total amortized cost | $ | 59,929 | $ | 2,500 | $ | 128,374 | |||
During the first quarter of 2018, the Company and the Company’s Consumer Loan Underlying Bond Depositor LLC (Depositor) sold $440.6 million in asset-backed securities related to Company-sponsored securitizations and CLUB Certificate transactions. There were no realized gains or losses related to such sales. For further information, see “Note 7. Securitizations and Variable Interest Entities.” There were no other sales of securities available for sale during the first quarter of 2018 or 2017.
6. Loans Held For Investment, Loans Held For Sale, Notes, Certificates and Secured Borrowings and Loan Servicing Rights
Loans Held For Investment, Loans Held For Sale, Notes, Certificates and Secured Borrowings
The Company sells loans and issues notes and the Trust issues certificates as a means to allow investors to invest in the corresponding loans. At March 31, 2018 and December 31, 2017, loans held for investment, notes, certificates and secured borrowings measured at fair value on a recurring basis were as follows:
Loans Held For Investment | Notes, Certificates and Secured Borrowings | ||||||||||||||
March 31, 2018 | December 31, 2017 | March 31, 2018 | December 31, 2017 | ||||||||||||
Aggregate principal balance outstanding | $ | 2,829,765 | $ | 3,141,391 | $ | 2,847,040 | $ | 3,161,080 | |||||||
Net fair value adjustments | (194,352 | ) | (209,066 | ) | (191,623 | ) | (206,312 | ) | |||||||
Fair value | $ | 2,635,413 | $ | 2,932,325 | $ | 2,655,417 | $ | 2,954,768 | |||||||
At March 31, 2018, $187.0 million of the aggregate principal balance outstanding and a fair value of $175.4 million included in “Loans held for investment” were pledged as collateral for secured borrowings. At December 31, 2017, $242.7 million of the aggregate principal balance outstanding and a fair value of $228.1 million included in “Loans held for investment” were pledged as collateral for secured borrowings. See “Note 14. Secured Borrowings” for additional information.
17
LENDINGCLUB CORPORATION
Notes to Condensed Consolidated Financial Statements
(Tabular Amounts in Thousands, Except Share and Per Share Amounts, Ratios, or as Noted)
(Unaudited)
At March 31, 2018 and December 31, 2017, loans invested in by the Company for which there were no associated notes, certificates or secured borrowings were as follows:
Loans Invested in by the Company | |||||||||||||||||||||||
Loans Held For Investment | Loans Held For Sale | Total | |||||||||||||||||||||
March 31, 2018 | December 31, 2017 | March 31, 2018 | December 31, 2017 | March 31, 2018 | December 31, 2017 | ||||||||||||||||||
Aggregate principal balance outstanding | $ | 339,615 | $ | 371,379 | $ | 258,477 | $ | 242,273 | $ | 598,092 | $ | 613,652 | |||||||||||
Net fair value adjustments | (22,157 | ) | (10,149 | ) | (10,133 | ) | (6,448 | ) | (32,290 | ) | (16,597 | ) | |||||||||||
Fair value | $ | 317,458 | $ | 361,230 | $ | 248,344 | $ | 235,825 | $ | 565,802 | $ | 597,055 | |||||||||||
The net change in fair value recorded in earnings on loans invested in by the Company was $(28.5) million during the first quarter of 2018. This change was offset by $25.2 million in net interest income earned on loans held by the Company during the first quarter of 2018.
The Company used its own capital to purchase $793.2 million in loans during the first quarter of 2018 and sold $742.7 million in loans during the first quarter of 2018, of which $191.6 million were securitized or contributed to CLUB Certificates and $551.1 million was sold to whole loan investors. The aggregate principal balance outstanding of loans invested in by the Company was $598.1 million at March 31, 2018, of which $258.5 million was held for sale primarily to support upcoming securitization and CLUB Certificate initiatives as well as sales to whole loan investors. See “Note 8. Fair Value of Assets and Liabilities” for a fair value rollforward of loans invested in by the Company for the three months ended March 31, 2018 and 2017.
At March 31, 2018 and December 31, 2017, $328.2 million and $359.4 million of the aggregate principal balance outstanding included in “Loans held for investment by the Company at fair value” were pledged as collateral for payables to securitization note and residual certificate holders, respectively. Additionally, $89.5 million and $62.1 million of the aggregate principal balance outstanding included in “Loans held for sale by the Company at fair value” at March 31, 2018 and December 31, 2017, respectively, were pledged as collateral for the Company’s revolving warehouse credit facilities. See “Note 13. Debt” for additional information related to these debt obligations.
The Company continues to evaluate the impact of natural disasters that occurred in 2017 on loans held by LendingClub and investors. Temporary relief measures on payment obligations have been provided to borrowers who reside in the affected areas. At March 31, 2018 and December 31, 2017, $12.1 million and $14.0 million of loans issued prior to the natural disasters and invested in by the Company were to borrowers who reside in the affected areas, respectively. The Company continues to monitor performance of these loans.
18
LENDINGCLUB CORPORATION
Notes to Condensed Consolidated Financial Statements
(Tabular Amounts in Thousands, Except Share and Per Share Amounts, Ratios, or as Noted)
(Unaudited)
Loans that were 90 days or more past due (including non-accrual loans) were as follows:
March 31, 2018 | December 31, 2017 | ||||||||||
> 90 days past due and non-accrual loans(1) | > 90 days past due | Non-accrual loans(1) | |||||||||
Loans held for investment and loans held for sale: | |||||||||||
Outstanding principal balance | $ | 27,477 | $ | 36,588 | $ | 3,289 | |||||
Net fair value adjustments | (22,558 | ) | (30,071 | ) | (2,675 | ) | |||||
Fair value | $ | 4,919 | $ | 6,517 | $ | 614 | |||||
Number of loans (not in thousands) | 2,852 | 3,779 | 591 | ||||||||
Loans invested in by the Company: | |||||||||||
Outstanding principal balance | $ | 2,124 | $ | 1,015 | $ | 122 | |||||
Net fair value adjustments | (1,749 | ) | (861 | ) | (107 | ) | |||||
Fair value | $ | 375 | $ | 154 | $ | 15 | |||||
Number of loans (not in thousands) | 317 | 257 | 34 | ||||||||
(1) | Beginning in the first quarter of 2018, loans are placed on non-accrual status upon reaching 90 days past due. Prior to the first quarter of 2018, loans were placed on non-accrual status upon reaching 120 days past due. The effect of this change in estimate is immaterial. See “Note 2. Summary of Significant Accounting Policies” for additional information on the Company’s “Accrued Interest” accounting policy. |
Loan Servicing Rights
Loans underlying loan servicing rights had a total outstanding principal balance of $8.6 billion and $8.2 billion as of March 31, 2018 and December 31, 2017, respectively.
19
LENDINGCLUB CORPORATION
Notes to Condensed Consolidated Financial Statements
(Tabular Amounts in Thousands, Except Share and Per Share Amounts, Ratios, or as Noted)
(Unaudited)
7. Securitizations and Variable Interest Entities
VIE Assets and Liabilities
The Company has segregated its involvement with VIEs between those VIEs which are consolidated and those VIEs which are not consolidated. The following tables provide the classifications of assets and liabilities on the Company’s Condensed Consolidated Balance Sheets for its transactions with VIEs at March 31, 2018 and December 31, 2017:
March 31, 2018 | Consolidated VIEs | Unconsolidated VIEs | Total | ||||||||
Assets | |||||||||||
Restricted cash | $ | 45,998 | $ | — | $ | 45,998 | |||||
Securities available for sale | — | 66,010 | 66,010 | ||||||||
Loans held for investment at fair value | 1,043,223 | — | 1,043,223 | ||||||||
Loans held for investment by the Company at fair value | 307,173 | — | 307,173 | ||||||||
Loans held for sale by Company at fair value | 86,156 | — | 86,156 | ||||||||
Accrued interest receivable | 12,387 | 789 | 13,176 | ||||||||
Other assets | 3,410 | 17,492 | 20,902 | ||||||||
Total assets | $ | 1,498,347 | $ | 84,291 | $ | 1,582,638 | |||||
Liabilities | |||||||||||
Accrued interest payable | $ | 11,196 | $ | — | $ | 11,196 | |||||
Accrued expenses and other liabilities | 836 | — | 836 | ||||||||
Notes, certificates and secured borrowings at fair value | 1,050,091 | — | 1,050,091 | ||||||||
Payable to securitization note and residual certificate holders | 280,915 | — | 280,915 | ||||||||
Payable to revolving credit facilities | 49,000 | — | 49,000 | ||||||||
Total liabilities | 1,392,038 | — | 1,392,038 | ||||||||
Total net assets | $ | 106,309 | $ | 84,291 | $ | 190,600 | |||||
20
LENDINGCLUB CORPORATION
Notes to Condensed Consolidated Financial Statements
(Tabular Amounts in Thousands, Except Share and Per Share Amounts, Ratios, or as Noted)
(Unaudited)
December 31, 2017 | Consolidated VIEs | Unconsolidated VIEs | Total | ||||||||
Assets | |||||||||||
Restricted cash | $ | 34,370 | $ | — | $ | 34,370 | |||||
Securities available for sale | — | 47,049 | 47,049 | ||||||||
Loans held for investment at fair value | 1,202,260 | — | 1,202,260 | ||||||||
Loans held for investment by the Company at fair value | 350,699 | — | 350,699 | ||||||||
Loans held for sale by Company at fair value | 60,812 | — | 60,812 | ||||||||
Accrued interest receivable | 15,602 | 407 | 16,009 | ||||||||
Other assets | 6,324 | 15,779 | 22,103 | ||||||||
Total assets | $ | 1,670,067 | $ | 63,235 | $ | 1,733,302 | |||||
Liabilities | |||||||||||
Accrued interest payable | $ | 14,789 | $ | — | $ | 14,789 | |||||
Accrued expenses and other liabilities | 52 | 300 | 352 | ||||||||
Notes, certificates and secured borrowings at fair value | 1,210,349 | — | 1,210,349 | ||||||||
Payable to securitization note and residual certificate holders | 312,123 | — | 312,123 | ||||||||
Payable to revolving credit facilities | 32,100 | — | 32,100 | ||||||||
Total liabilities | 1,569,413 | 300 | 1,569,713 | ||||||||
Total net assets | $ | 100,654 | $ | 62,935 | $ | 163,589 | |||||
Consolidated VIEs
Trust Certificates
The Company established the Trust for the purpose of acquiring and holding loans for the sole benefit of certain investors that have purchased trust certificates issued by the Trust based on its power to direct the activities that most significantly impact the economic outcomes of the Trust through involvement in the design and ongoing activities and significant variable interest held in the Trust. The Company consolidates the loans held and the certificates issued by the Trust as it is the primary beneficiary of the Trust. As the primary beneficiary of the Trust, the Company is obligated the ensure that the Trust meets minimum capital requirements with respect to funding the administrative activities and maintaining the operations of the Trust.
Consolidated Securitizations
The Company established LendingClub Operated Aggregator Note (LOAN) NP I, LLC, Depositor, Consumer Loan Underlying Bond Credit Trust 2017-P2, LLC (Credit Trust) and Consumer Loan Underlying Bond Grantor Trust 2017-P2, LLC (Grantor Trust) for the purpose of maintaining at least 5% ongoing interest to comply with regulatory credit risk retention rules in connection with securitizations of personal whole loans. The Company consolidates LOAN, Depositor, Credit Trust and Grantor Trust in its condensed consolidated financial statements as it holds a controlling financial interest and is the primary beneficiary. The Company is the primary beneficiary of LOAN, Depositor, Credit Trust and Grantor Trust based on its power to direct the activities that most significantly impact the economic outcomes of the securitizations through its role as sponsor and servicer and significant variable interests through its interests in these VIEs.
Warehouse Credit Facilities
The Company established LendingClub Warehouse I LLC (Warehouse I) and LendingClub Warehouse II LLC (Warehouse II) for the purpose of purchasing non-revolving personal whole loans from LendingClub, financing the
21
LENDINGCLUB CORPORATION
Notes to Condensed Consolidated Financial Statements
(Tabular Amounts in Thousands, Except Share and Per Share Amounts, Ratios, or as Noted)
(Unaudited)
purchase or acquisition of such assets through facility agreements and warehousing the assets for securitization or loan sales. The Company consolidates Warehouse I and Warehouse II in its condensed consolidated financial statements as it is the primary beneficiary. The Company is the primary beneficiary of Warehouse I and Warehouse II based on its power to direct the activities that most significantly impact the economic outcomes of the VIEs through role in the design and ongoing activities and significant variable interests held in the VIEs.
The following table presents a summary of financial assets and liabilities from the Company’s involvement with consolidated VIEs at March 31, 2018 and December 31, 2017:
March 31, 2018 | Assets | Liabilities | Net Assets | ||||||||
Trust Certificates | $ | 1,063,936 | $ | (1,061,014 | ) | $ | 2,922 | ||||
Securitizations | 330,530 | (281,310 | ) | 49,220 | |||||||
Warehouse Credit Facilities | 103,881 | (49,714 | ) | 54,167 | |||||||
Total consolidated VIEs | $ | 1,498,347 | $ | (1,392,038 | ) | $ | 106,309 | ||||
December 31, 2017 | Assets | Liabilities | Net Assets | ||||||||
Trust Certificates | $ | 1,226,957 | $ | (1,224,473 | ) | $ | 2,484 | ||||
Securitizations | 375,607 | (312,832 | ) | 62,775 | |||||||
Warehouse Credit Facility | 67,503 | (32,108 | ) | 35,395 | |||||||
Total consolidated VIEs | $ | 1,670,067 | $ | (1,569,413 | ) | $ | 100,654 | ||||
The creditors of the VIEs above have no recourse to the general credit of the Company as the primary beneficiary of the VIEs and the liabilities of the VIEs can only be settled by the respective VIE’s assets.
Unconsolidated VIEs
The Company’s transactions with unconsolidated VIEs include securitizations of personal whole loans and sales of personal whole loans to investment funds sponsored by LCAM. The Company has various forms of involvement with VIEs, including servicing of loans, holding senior or subordinated interests, and serving as the investment manager for sponsored investment funds. The Company considers continued involvement in an unconsolidated VIE insignificant when it relates to third-party sponsored VIEs for which it was not the transferor, unless it is servicer and has other significant forms of involvement, or if it was the sponsor only or sponsor and servicer but does not have any other forms of significant involvement. In these instances, the Company’s involvement with the VIE is in the role as an agent and without significant participation in the economics of the VIE.
Unconsolidated Securitizations
The Company sponsors securitizations of unsecured personal whole loans through issuances of fixed-rate asset-backed securities, which are collateralized by loans transferred to a VIE. Securitizations typically involve the transfer of unsecured personal whole loans to these VIEs with the transfer accounted for as a sale. In addition, the Company enters into separate servicing agreements with the VIEs and holds at least 5% of the beneficial interests issued by the VIEs. In certain instances, the Company may service unsecured personal loan securitizations structured by third parties whose loans were transferred to the VIE by a party other than the Company. In the case of certain securitization transactions, the Company has also agreed to repurchase or substitute loans for which a borrower fails to make the first payment due under a loan. The Company has determined that the variable interests it holds with respect to the securitizations are not potentially significant to the VIE, and as such, the Company is not the primary beneficiary.
22
LENDINGCLUB CORPORATION
Notes to Condensed Consolidated Financial Statements
(Tabular Amounts in Thousands, Except Share and Per Share Amounts, Ratios, or as Noted)
(Unaudited)
CLUB Certificates
The Company sponsors the sale of unsecured personal whole loans through issuance of pass-through securities called CLUB Certificates, which are collateralized by loans transferred to a VIE. In the fourth quarter of 2017, the Company introduced the CLUB Certificate, which is an instrument that trades in the over-the-counter market with a CUSIP. For each CLUB Certificate transaction, Consumer Loan Underlying Bond Certificate Issuer Trust I (Master Trust) establishes a series of the Master Trust (Series Trust). The CLUB Certificate transaction typically involves the transfer of unsecured personal whole loans to a Series Trust with the transfer accounted for as a sale. In addition, the Company enters into a servicing agreement with each applicable Series Trust and holds at least 5% of the beneficial interests issued by the Series Trust. The Company has determined that the variable interests it holds with respect to CLUB Certificates are not potentially significant to the VIE and as such, the Company is not the primary beneficiary.
Investment Fund
The Company has an equity investment in a holding company (Investment Fund) to a family of funds that purchases loans and interest in loans from the Company. The Company’s investment is deemed to be a variable interest in the Investment Fund because the limited partnership interest shares in the expected returns and losses of the Investment Fund. However, the Company is not the primary beneficiary of the Investment Fund because the Company does not have the power to direct the activities that most significantly affect the Investment Fund’s economic performance. As a result, the Company does not consolidate the operations of the Investment Fund in its condensed consolidated financial statements.
The following tables summarize unconsolidated VIEs with which the Company has significant continuing involvement, but is not the primary beneficiary at March 31, 2018 and December 31, 2017:
March 31, 2018 | Carrying Value | ||||||||||||||||||||||
Total VIE Assets | Securities Available for Sale | Accrued Interest Receivable | Other Assets | Accrued Expenses and Other Liabilities | Net Assets | ||||||||||||||||||
Securitizations | $ | 1,087,108 | $ | 56,232 | $ | 738 | $ | 6,865 | $ | — | $ | 63,835 | |||||||||||
CLUB Certificates | 192,565 | 9,778 | 51 | 1,678 | — | 11,507 | |||||||||||||||||
Investment Fund | 36,249 | — | — | 8,949 | — | 8,949 | |||||||||||||||||
Total unconsolidated VIEs | $ | 1,315,922 | $ | 66,010 | $ | 789 | $ | 17,492 | $ | — | $ | 84,291 | |||||||||||
March 31, 2018 | Maximum Exposure to Loss | ||||||||||||||||||
Securities Available for Sale | Accrued Interest Receivable | Other Assets | Accrued Expenses and Other Liabilities | Total Exposure | |||||||||||||||
Securitizations | $ | 56,232 | $ | 738 | $ | 6,865 | $ | — | $ | 63,835 | |||||||||
CLUB Certificates | 9,778 | 51 | 1,678 | — | 11,507 | ||||||||||||||
Investment Fund | — | — | 8,949 | — | 8,949 | ||||||||||||||
Total unconsolidated VIEs | $ | 66,010 | $ | 789 | $ | 17,492 | $ | — | $ | 84,291 | |||||||||
23
LENDINGCLUB CORPORATION
Notes to Condensed Consolidated Financial Statements
(Tabular Amounts in Thousands, Except Share and Per Share Amounts, Ratios, or as Noted)
(Unaudited)
December 31, 2017 | Carrying Value | ||||||||||||||||||||||
Total VIE Assets | Securities Available for Sale | Accrued Interest Receivable | Other Assets | Accrued Expenses and Other Liabilities | Net Assets | ||||||||||||||||||
Securitizations | $ | 863,589 | $ | 45,256 | $ | 391 | $ | 5,446 | $ | (300 | ) | $ | 50,793 | ||||||||||
CLUB Certificates | 36,833 | 1,793 | 16 | 315 | — | 2,124 | |||||||||||||||||
Investment Fund | 40,494 | — | — | 10,018 | — | 10,018 | |||||||||||||||||
Total unconsolidated VIEs | $ | 940,916 | $ | 47,049 | $ | 407 | $ | 15,779 | $ | (300 | ) | $ | 62,935 | ||||||||||
December 31, 2017 | Maximum Exposure to Loss | ||||||||||||||||||
Securities Available for Sale | Accrued Interest Receivable | Other Assets | Accrued Expenses and Other Liabilities | Total Exposure | |||||||||||||||
Securitizations | $ | 45,256 | $ | 391 | $ | 5,446 | $ | 300 | $ | 51,393 | |||||||||
CLUB Certificates | 1,793 | 16 | 315 | — | 2,124 | ||||||||||||||
Investment Fund | — | — | 10,018 | — | 10,018 | ||||||||||||||
Total unconsolidated VIEs | $ | 47,049 | $ | 407 | $ | 15,779 | $ | 300 | $ | 63,535 | |||||||||
“Total VIE Assets” represents the remaining principal balance of loans held by unconsolidated VIEs with respect to securitizations and CLUB Certificates, and the net assets held by the investment fund using the most current information available. “Securities Available for Sale,” “Accrued Interest Receivable,” “Other Assets” and “Accrued Expenses and Other Liabilities” are the balances in the Company’s Condensed Consolidated Balance Sheets related to its involvement with the unconsolidated VIEs. “Other Assets” includes the Company’s servicing assets associated with loans transferred as part of securitizations and CLUB Certificates and the Company’s equity investment with respect to the Investment Fund. “Total Exposure” refers to the Company’s maximum exposure to loss from its involvement with unconsolidated VIEs. It represents estimated loss that would be incurred under severe, hypothetical circumstances, for which the Company believes the possibility is extremely remote, such as where the value of interests and any associated collateral declines to zero. Accordingly, this required disclosure is not an indication of expected losses.
Personal Whole Loan Securitizations
The Company securitizes certain prime and near-prime unsecured personal whole loans through asset-backed securitization transactions. The loans are facilitated through the Company’s lending marketplace with the Company and third-party whole loan investors contributing loans. In connection with the securitizations, the Company established VIEs to purchase the loans from the Company and third-party whole loan investors and simultaneously transferred the loans to a securitization trust with the transfer accounted for as a sale of financial assets. The assets are transferred into a trust such that the assets are legally isolated from the creditors of the Company and are not available to satisfy its obligations. These assets can only be used to settle obligations of the securitization trust or other securitization vehicles.
During the three months ended March 31, 2018, securitization trusts issued senior securities and subordinated residual certificates and Master Trust issued CLUB Certificates by the respective VIEs as consideration for the transferred loans. The VIEs sold 95% of the senior securities to third-party investors and then distributed the cash and the subordinated residual certificates to the Company and third-party whole loan investors.
24
LENDINGCLUB CORPORATION
Notes to Condensed Consolidated Financial Statements
(Tabular Amounts in Thousands, Except Share and Per Share Amounts, Ratios, or as Noted)
(Unaudited)
To comply with regulatory credit risk retention rules, the Company retained at least 5% of each of the senior securities, subordinated residual certificates and CLUB Certificates. Additionally, the Company’s continued involvement includes loan servicing responsibilities for which it receives servicing fees over the life of the underlying loans.
The senior securities, subordinated residual certificates and CLUB Certificates are accounted for as securities available for sale. See “Part II – Item 8 –Financial Statements and Supplementary Data – Note 2. Summary of Significant Accounting Policies” and “Note 8. Fair Value of Assets and Liabilities” in the Annual Report for additional information.
The following table summarizes activity related to the unconsolidated personal whole loan securitizations and personal whole loan CLUB Certificates with the transfers accounted for as a sale on the Company’s condensed consolidated financial statements for the three months ended March 31, 2018:
Three Months Ended March 31, | 2018 | ||||||
Personal Whole Loan Securitizations | Personal Whole Loan CLUB Certificates | ||||||
Principal derecognized from loans securitized or sold | $ | 355,248 | $ | 161,875 | |||
Net gains (losses) recognized from loans securitized or sold | $ | 3,097 | $ | 1,457 | |||
Fair value of senior securities and subordinated certificates retained upon settlement (1) | $ | 18,493 | $ | 8,102 | |||
Cash proceeds from loans securitized or sold | $ | 283,272 | $ | 154,839 | |||
Cash proceeds from servicing and other administrative fees on loans securitized or sold | $ | 2,350 | $ | 135 | |||
Cash proceeds for interest received on senior securities and subordinated certificates | $ | 296 | $ | 82 | |||
(1) | For personal whole loan securitizations, the Company retained senior securities of $15.1 million and subordinated certificates of $3.4 million. |
There were no activities related to Company-sponsored securitizations or CLUB Certificate transactions during the three months ended March 31, 2017.
Off-Balance Sheet Loans
Off-balance sheet loans primarily relate to Company-sponsored securitization transactions and CLUB Certificate transactions for which the Company has some form of continuing involvement, including as servicer. Delinquent loans are comprised of loans 31 days or more past due, including non-accrual loans. For loans securitized, where servicing is the only form of continuing involvement, the Company would only experience a loss if it was required to repurchase a delinquent loan due to a breach in representations and warranties associated with our loan sale or servicing contracts.
As of March 31, 2018, the aggregate unpaid principal balance of the off-balance sheet loans pursuant to Company-sponsored securitization transactions and CLUB Certificate transactions was $1.3 billion, of which $34.2 million was 31 days or more past due. As of December 31, 2017, the aggregate unpaid principal balance of the off-balance sheet loans pursuant to Company-sponsored securitization transactions and CLUB Certificate transactions was $900.4 million, of which $26.5 million was 31 days or more past due.
25
LENDINGCLUB CORPORATION
Notes to Condensed Consolidated Financial Statements
(Tabular Amounts in Thousands, Except Share and Per Share Amounts, Ratios, or as Noted)
(Unaudited)
Retained Interests from Unconsolidated VIEs
The Company and other investors in the subordinated residual certificates have rights to cash flows after the investors holding the senior securities issued by the securitization trusts have first received their contractual cash flows. The investors and the securitization trusts have no recourse to the Company’s assets, and holders of the securities issued by the securitization trusts can look only to the assets of the securitization trusts that issued their securities for payment. The beneficial interests held by the Company and the Company’s majority-owned affiliate (MOA) are subject principally to the credit and prepayment risk stemming from the underlying personal whole loans. The Company holds a portion of each issuance of CLUB Certificates. Accordingly, the Company has exposure to the loans underlying this pass-through security.
The following tables provide adverse changes to the fair value sensitivity of the senior securities, subordinated residual certificates and CLUB Certificates to changes in key assumptions at March 31, 2018 and December 31, 2017:
March 31, 2018 | |||||||||||
Asset-Backed Securities Related to Company-Sponsored Securitizations and CLUB Certificate Transactions | |||||||||||
Senior Securities | Subordinated Residual Certificates | CLUB Certificates | |||||||||
Fair value of interests held | $ | 45,881 | $ | 10,351 | $ | 9,778 | |||||
Expected weighted-average life (in years) | 0.7 | 1.6 | 1.3 | ||||||||
Discount rates | |||||||||||
100 basis point increase | $ | (442 | ) | $ | (127 | ) | $ | (119 | ) | ||
200 basis point increase | $ | (875 | ) | $ | (250 | ) | $ | (236 | ) | ||
Expected credit loss rates on underlying loans | |||||||||||
10% adverse change | $ | — | $ | (1,454 | ) | $ | (171 | ) | |||
20% adverse change | $ | — | $ | (2,875 | ) | $ | (308 | ) | |||
Expected prepayment rates | |||||||||||
10% adverse change | $ | — | $ | (507 | ) | $ | (77 | ) | |||
20% adverse change | $ | — | $ | (988 | ) | $ | (120 | ) | |||
26
LENDINGCLUB CORPORATION
Notes to Condensed Consolidated Financial Statements
(Tabular Amounts in Thousands, Except Share and Per Share Amounts, Ratios, or as Noted)
(Unaudited)
December 31, 2017 | |||||||||||
Asset-Backed Securities Related to Company-Sponsored Securitizations and CLUB Certificate Transactions | |||||||||||
Senior Securities | Subordinated Residual Certificates | CLUB Certificates | |||||||||
Fair value of interests held | $ | 37,020 | $ | 8,236 | $ | 1,793 | |||||
Expected weighted-average life (in years) | 1.0 | 1.5 | 1.4 | ||||||||
Discount rates | |||||||||||
100 basis point increase | $ | (326 | ) | $ | (105 | ) | $ | (41 | ) | ||
200 basis point increase | $ | (644 | ) | $ | (208 | ) | $ | (76 | ) | ||
Expected credit loss rates on underlying loans | |||||||||||
10% adverse change | $ | (1 | ) | $ | (1,060 | ) | $ | (15 | ) | ||
20% adverse change | $ | (2 | ) | $ | (2,118 | ) | $ | (25 | ) | ||
Expected prepayment rates | |||||||||||
10% adverse change | $ | (1 | ) | $ | (265 | ) | $ | (21 | ) | ||
20% adverse change | $ | (3 | ) | $ | (513 | ) | $ | (42 | ) | ||
8. Fair Value of Assets and Liabilities
For a description of the fair value hierarchy and the Company’s fair value methodologies, see “Part II – Item 8 –Financial Statements and Supplementary Data – Note 2. Summary of Significant Accounting Policies” in the Annual Report on Form 10-K. The Company records certain assets and liabilities at fair value as listed in the following tables.
Financial Instruments, Assets and Liabilities Recorded at Fair Value
The following tables present the fair value hierarchy for assets and liabilities measured at fair value at March 31, 2018 and December 31, 2017:
March 31, 2018 | Level 1 Inputs | Level 2 Inputs | Level 3 Inputs | Balance at Fair Value | |||||||||||
Assets: | |||||||||||||||
Loans held for investment | $ | — | $ | — | $ | 2,635,413 | $ | 2,635,413 | |||||||
Loans held for investment by the Company | — | — | 317,458 | 317,458 | |||||||||||
Loans held for sale by the Company | — | — | 248,344 | 248,344 | |||||||||||
Securities available for sale: | |||||||||||||||
Asset-backed senior securities related to Company-sponsored securitizations | — | 45,881 | — | 45,881 | |||||||||||
Certificates of deposit | — | 20,303 | — | 20,303 | |||||||||||
Corporate debt securities | — | 19,840 | — | 19,840 | |||||||||||
Asset-backed securities | — | 14,586 | — | 14,586 | |||||||||||
Commercial paper | — | 7,685 | — | 7,685 | |||||||||||
Asset-backed subordinated residual certificates related to Company-sponsored securitizations and CLUB Certificate transactions | — | — | 20,129 | 20,129 | |||||||||||
Total securities available for sale | — | 108,295 | 20,129 | 128,424 | |||||||||||
Servicing assets | — | — | 40,884 | 40,884 | |||||||||||
Total assets | $ | — | $ | 108,295 | $ | 3,262,228 | $ | 3,370,523 | |||||||
Liabilities: | |||||||||||||||
Notes, certificates and secured borrowings | $ | — | $ | — | $ | 2,655,417 | $ | 2,655,417 | |||||||
Payable to securitization residual certificate holders | — | — | 1,354 | 1,354 | |||||||||||
Servicing liabilities | — | — | 475 | 475 | |||||||||||
Loan trailing fee liability | — | — | 8,824 | 8,824 | |||||||||||
Total liabilities | $ | — | $ | — | $ | 2,666,070 | $ | 2,666,070 | |||||||
27
LENDINGCLUB CORPORATION
Notes to Condensed Consolidated Financial Statements
(Tabular Amounts in Thousands, Except Share and Per Share Amounts, Ratios, or as Noted)
(Unaudited)
December 31, 2017 | Level 1 Inputs | Level 2 Inputs | Level 3 Inputs | Balance at Fair Value | |||||||||||
Assets: | |||||||||||||||
Loans held for investment | $ | — | $ | — | $ | 2,932,325 | $ | 2,932,325 | |||||||
Loans held for investment by the Company | — | — | 361,230 | 361,230 | |||||||||||
Loans held for sale by the Company | — | — | 235,825 | 235,825 | |||||||||||
Securities available for sale: | |||||||||||||||
Asset-backed senior securities related to Company-sponsored securitizations | — | 37,020 | — | 37,020 | |||||||||||
Certificates of deposit | — | 24,758 | — | 24,758 | |||||||||||
Corporate debt securities | — | 16,258 | — | 16,258 | |||||||||||
Asset-backed securities | — | 14,843 | — | 14,843 | |||||||||||
Commercial paper | — | 14,665 | — | 14,665 | |||||||||||
Asset-backed subordinated residual certificates related to Company-sponsored securitizations and CLUB Certificate transactions | — | — | 10,029 | 10,029 | |||||||||||
Total securities available for sale | — | 107,544 | 10,029 | 117,573 | |||||||||||
Servicing assets | — | — | 33,676 | 33,676 | |||||||||||
Total assets | $ | — | $ | 107,544 | $ | 3,573,085 | $ | 3,680,629 | |||||||
Liabilities: | |||||||||||||||
Notes, certificates and secured borrowings | $ | — | $ | — | $ | 2,954,768 | $ | 2,954,768 | |||||||
Payable to securitization residual certificate holders | — | — | 1,479 | 1,479 | |||||||||||
Servicing liabilities | — | — | 833 | 833 | |||||||||||
Loan trailing fee liability | — | — | 8,432 | 8,432 | |||||||||||
Total liabilities | $ | — | $ | — | $ | 2,965,512 | $ | 2,965,512 | |||||||
The Company has elected the fair value option for notes, certificates, and secured borrowings, payable to securitization residual certificate holders, and loan trailing fee liability. Beginning January 1, 2018, changes in the fair value of these financial liabilities caused by a change in the instrument-specific credit risk are reported in other comprehensive income (OCI). For the quarter ended March 31, 2018, the amount reported in OCI is zero because these financial liabilities are either payable only upon receipt of cash flows from underlying loans or secured by cash collateral. See “Adoption of New Accounting Standards” in “Note 2. Summary of Significant Accounting Policies” for further discussion.
Financial instruments are categorized in the valuation hierarchy based on the significance of unobservable factors in the overall fair value measurement. Since the Company’s loans held for investment and related notes, certificates, and secured borrowings, loans held for sale, loan servicing rights, asset-backed securities related to consolidated VIEs, and loan trailing fee liability do not trade in an active market with readily observable prices, the Company uses significant unobservable inputs to measure the fair value of these assets and liabilities. These fair value estimates may also include observable, actively quoted components derived from external sources. As a result, changes in fair value for assets and liabilities within the Level 2 or Level 3 categories may include changes in fair
28
LENDINGCLUB CORPORATION
Notes to Condensed Consolidated Financial Statements
(Tabular Amounts in Thousands, Except Share and Per Share Amounts, Ratios, or as Noted)
(Unaudited)
value that were attributable to observable and unobservable inputs, respectively. The Company did not transfer any assets or liabilities in or out of Level 3 during the first quarter of 2018 or the year ended December 31, 2017.
29
LENDINGCLUB CORPORATION
Notes to Condensed Consolidated Financial Statements
(Tabular Amounts in Thousands, Except Share and Per Share Amounts, Ratios, or as Noted)
(Unaudited)
Significant Unobservable Inputs
The Company primarily uses a model to estimate the fair value of Level 3 instruments based on the present value of estimated future cash flows. This model uses inputs that are inherently judgmental and reflect our best estimates of the assumptions a market participant would use to calculate fair value. The following tables present quantitative information about the significant unobservable inputs used for the Company’s Level 3 fair value measurements at March 31, 2018 and December 31, 2017:
March 31, 2018 | ||||||||||||||||||||||||
Loans Held for Investment, Loans Held for Sale, Notes, Certificates and Secured Borrowings (1) | Asset-Backed Securities Related to Consolidated VIE | |||||||||||||||||||||||
Minimum | Maximum | Weighted Average | Minimum | Maximum | Weighted Average | |||||||||||||||||||
Discount rates | 2.7 | % | 16.7 | % | 8.9 | % | 3.2 | % | 15.0 | % | 7.4 | % | ||||||||||||
Net cumulative expected loss rates (2)(4) | 0.4 | % | 42.1 | % | 13.8 | % | 5.2 | % | 38.7 | % | 13.3 | % | ||||||||||||
Cumulative expected prepayment rates (2)(4) | 11.3 | % | 52.3 | % | 31.3 | % | 25.7 | % | 34.2 | % | 30.3 | % | ||||||||||||
March 31, 2018 | ||||||||||||||||||||||||
Servicing Assets/Liabilities | Loan Trailing Fee Liability | |||||||||||||||||||||||
Minimum | Maximum | Weighted Average | Minimum | Maximum | Weighted Average | |||||||||||||||||||
Discount rates | 3.4 | % | 16.5 | % | 8.9 | % | 3.4 | % | 16.5 | % | 9.2 | % | ||||||||||||
Net cumulative expected loss rates (2) | 0.4 | % | 42.1 | % | 12.3 | % | 0.8 | % | 42.1 | % | 13.1 | % | ||||||||||||
Cumulative expected prepayment rates (2) | 11.3 | % | 52.3 | % | 32.0 | % | 11.3 | % | 52.3 | % | 31.6 | % | ||||||||||||
Total market servicing rates (% per annum on outstanding principal balance) (3) | 0.66 | % | 0.90 | % | 0.66 | % | N/A | N/A | N/A | |||||||||||||||
December 31, 2017 | ||||||||||||||||||||||||
Loans Held for Investment, Loans Held for Sale, Notes, Certificates and Secured Borrowings (1) | Asset-Backed Securities Related to Consolidated VIE | |||||||||||||||||||||||
Minimum | Maximum | Weighted Average | Minimum | Maximum | Weighted Average | |||||||||||||||||||
Discount rates | 1.7 | % | 17.2 | % | 8.5 | % | 5.8 | % | 15.0 | % | 9.5 | % | ||||||||||||
Net cumulative expected loss rates (2) (4) | 0.4 | % | 41.8 | % | 13.8 | % | 10.9 | % | 37.2 | % | 19.7 | % | ||||||||||||
Cumulative expected prepayment rates (2) (4) | 11.3 | % | 51.0 | % | 31.6 | % | 28.3 | % | 33.7 | % | 30.5 | % | ||||||||||||
December 31, 2017 | ||||||||||||||||||||||||
Servicing Assets/Liabilities | Loan Trailing Fee Liability | |||||||||||||||||||||||
Minimum | Maximum | Weighted Average | Minimum | Maximum | Weighted Average | |||||||||||||||||||
Discount rates | 1.9 | % | 17.1 | % | 8.8 | % | 1.9 | % | 17.1 | % | 8.9 | % | ||||||||||||
Net cumulative expected loss rates (2) | 0.4 | % | 41.8 | % | 12.4 | % | 0.8 | % | 41.8 | % | 13.2 | % | ||||||||||||
Cumulative expected prepayment rates (2) | 11.3 | % | 51.0 | % | 31.7 | % | 11.3 | % | 51.0 | % | 31.4 | % | ||||||||||||
Total market servicing rates (% per annum on outstanding principal balance) (3) | 0.66 | % | 0.90 | % | 0.66 | % | N/A | N/A | N/A | |||||||||||||||
N/A Not applicable
(1) | Loans held for investment and loans held for sale include loans invested in by the Company. |
(2) | Expressed as a percentage of the original principal balance of the loan, note or certificate, except for asset-backed securities. |
30
LENDINGCLUB CORPORATION
Notes to Condensed Consolidated Financial Statements
(Tabular Amounts in Thousands, Except Share and Per Share Amounts, Ratios, or as Noted)
(Unaudited)
(3) | Includes collection fees estimated to be paid to a hypothetical third-party servicer. |
(4) | For asset-backed securities, expressed as a percentage of the outstanding collateral balance. |
At March 31, 2018 and December 31, 2017, the discounted cash flow methodology used to estimate the note, certificate and secured borrowings’ fair values used the same projected net cash flows as their related loans. As demonstrated by the following tables, the fair value adjustments for loans held for investment and loans held for sale were largely offset by the fair value adjustments of the notes, certificates and secured borrowings due to the payment dependent design of the notes, certificates and secured borrowings and because the principal balances of the loans were close to the combined principal balances of the notes, certificates and secured borrowings.
31
LENDINGCLUB CORPORATION
Notes to Condensed Consolidated Financial Statements
(Tabular Amounts in Thousands, Except Share and Per Share Amounts, Ratios, or as Noted)
(Unaudited)
The following tables present additional information about Level 3 loans held for investment, loans held for sale, and notes, certificates and secured borrowings measured at fair value on a recurring basis for the first quarters of 2018 and 2017:
Loans Held For Investment | Loans Held For Sale | Notes, Certificates and Secured Borrowings | |||||||||||||||||||||||||||||||||||
Outstanding Principal Balance | Valuation Adjustment | Fair Value | Outstanding Principal Balance | Valuation Adjustment | Fair Value | Outstanding Principal Balance | Valuation Adjustment | Fair Value | |||||||||||||||||||||||||||||
Balance at December 31, 2017 | $ | 3,141,391 | $ | (209,066 | ) | $ | 2,932,325 | $ | — | $ | — | $ | — | $ | 3,161,080 | $ | (206,312 | ) | $ | 2,954,768 | |||||||||||||||||
Purchases | 292,114 | 9 | 292,123 | 1,133,277 | (1,772 | ) | 1,131,505 | — | — | — | |||||||||||||||||||||||||||
Issuances | — | — | — | — | — | — | 292,461 | — | 292,461 | ||||||||||||||||||||||||||||
Sales | — | — | — | (1,133,277 | ) | 835 | (1,132,442 | ) | — | — | — | ||||||||||||||||||||||||||
Principal payments and retirements | (500,949 | ) | — | (500,949 | ) | — | — | — | (503,710 | ) | 8 | (503,702 | ) | ||||||||||||||||||||||||
Charge-offs | (102,791 | ) | 102,791 | — | — | — | — | (102,791 | ) | 102,791 | — | ||||||||||||||||||||||||||
Recoveries | — | (17,459 | ) | (17,459 | ) | — | — | — | — | (17,459 | ) | (17,459 | ) | ||||||||||||||||||||||||
Change in fair value recorded in earnings | — | (70,627 | ) | (70,627 | ) | — | 937 | 937 | — | (70,651 | ) | (70,651 | ) | ||||||||||||||||||||||||
Balance at March 31, 2018 | $ | 2,829,765 | $ | (194,352 | ) | $ | 2,635,413 | $ | — | $ | — | $ | — | $ | 2,847,040 | $ | (191,623 | ) | $ | 2,655,417 | |||||||||||||||||
Loans Held For Investment | Loans Held For Sale | Notes and Certificates | |||||||||||||||||||||||||||||||||||
Outstanding Principal Balance | Valuation Adjustment | Fair Value | Outstanding Principal Balance | Valuation Adjustment | Fair Value | Outstanding Principal Balance | Valuation Adjustment | Fair Value | |||||||||||||||||||||||||||||
Balance at December 31, 2016 | $ | 4,547,138 | $ | (252,017 | ) | $ | 4,295,121 | $ | — | $ | — | $ | — | $ | 4,572,912 | $ | (252,017 | ) | $ | 4,320,895 | |||||||||||||||||
Purchases | 523,235 | 2 | 523,237 | 1,170,207 | — | 1,170,207 | — | — | — | ||||||||||||||||||||||||||||
Issuances | — | — | — | — | — | — | 523,305 | — | 523,305 | ||||||||||||||||||||||||||||
Sales | — | — | — | (1,170,207 | ) | — | (1,170,207 | ) | — | — | — | ||||||||||||||||||||||||||
Principal payments and retirements | (638,235 | ) | — | (638,235 | ) | — | — | — | (641,105 | ) | 2 | (641,103 | ) | ||||||||||||||||||||||||
Charge-offs | (136,810 | ) | 136,810 | — | — | — | — | (136,810 | ) | 136,810 | — | ||||||||||||||||||||||||||
Recoveries | — | (10,790 | ) | (10,790 | ) | — | — | — | — | (10,790 | ) | (10,790 | ) | ||||||||||||||||||||||||
Change in fair value recorded in earnings | — | (157,950 | ) | (157,950 | ) | — | — | — | — | (157,950 | ) | (157,950 | ) | ||||||||||||||||||||||||
Balance at March 31, 2017 | $ | 4,295,328 | $ | (283,945 | ) | $ | 4,011,383 | $ | — | $ | — | $ | — | $ | 4,318,302 | $ | (283,945 | ) | $ | 4,034,357 | |||||||||||||||||
32
LENDINGCLUB CORPORATION
Notes to Condensed Consolidated Financial Statements
(Tabular Amounts in Thousands, Except Share and Per Share Amounts, Ratios, or as Noted)
(Unaudited)
The following tables present additional information about Level 3 loans invested in by the Company measured at fair value on a recurring basis for the first quarters of 2018 and 2017:
Loans Held For Investment by the Company | Loans Held For Sale by the Company | Total Loans Invested in by the Company | |||||||||||||||||||||||||||||||||||
Outstanding Principal Balance | Valuation Adjustment | Fair Value | Outstanding Principal Balance | Valuation Adjustment | Fair Value | Outstanding Principal Balance | Valuation Adjustment | Fair Value | |||||||||||||||||||||||||||||
Balance at December 31, 2017 | $ | 371,379 | $ | (10,149 | ) | $ | 361,230 | $ | 242,273 | $ | (6,448 | ) | $ | 235,825 | $ | 613,652 | $ | (16,597 | ) | $ | 597,055 | ||||||||||||||||
Purchases | 1,496 | (160 | ) | 1,336 | 791,675 | (280 | ) | 791,395 | 793,171 | (440 | ) | 792,731 | |||||||||||||||||||||||||
Transfers (to) from loans held for investment (from) to loans held for sale | 106 | — | 106 | (106 | ) | — | (106 | ) | — | — | — | ||||||||||||||||||||||||||
Sales | — | — | — | (742,732 | ) | 10,048 | (732,684 | ) | (742,732 | ) | 10,048 | (732,684 | ) | ||||||||||||||||||||||||
Principal payments and retirements | (32,194 | ) | — | (32,194 | ) | (30,418 | ) | — | (30,418 | ) | (62,612 | ) | — | (62,612 | ) | ||||||||||||||||||||||
Charge-offs | (1,172 | ) | 1,172 | — | (2,215 | ) | 2,215 | — | (3,387 | ) | 3,387 | — | |||||||||||||||||||||||||
Recoveries | — | (199 | ) | (199 | ) | — | (12 | ) | (12 | ) | — | (211 | ) | (211 | ) | ||||||||||||||||||||||
Change in fair value recorded in earnings | — | (12,821 | ) | (12,821 | ) | — | (15,656 | ) | (15,656 | ) | — | (28,477 | ) | (28,477 | ) | ||||||||||||||||||||||
Balance at March 31, 2018 | $ | 339,615 | $ | (22,157 | ) | $ | 317,458 | $ | 258,477 | $ | (10,133 | ) | $ | 248,344 | $ | 598,092 | $ | (32,290 | ) | $ | 565,802 | ||||||||||||||||
Loans Held For Investment by the Company | Loans Held For Sale by the Company | Total Loans Invested in by the Company | |||||||||||||||||||||||||||||||||||
Outstanding Principal Balance | Valuation Adjustment | Fair Value | Outstanding Principal Balance | Valuation Adjustment | Fair Value | Outstanding Principal Balance | Valuation Adjustment | Fair Value | |||||||||||||||||||||||||||||
Balance at December 31, 2016 | $ | 18,515 | $ | (1,652 | ) | $ | 16,863 | $ | 9,345 | $ | (297 | ) | $ | 9,048 | $ | 27,860 | $ | (1,949 | ) | $ | 25,911 | ||||||||||||||||
Purchases | 1,181 | (6 | ) | 1,175 | 5,948 | (1 | ) | 5,947 | 7,129 | (7 | ) | 7,122 | |||||||||||||||||||||||||
Sales | — | — | — | (4,229 | ) | 157 | (4,072 | ) | (4,229 | ) | 157 | (4,072 | ) | ||||||||||||||||||||||||
Principal payments and retirements | (1,484 | ) | — | (1,484 | ) | (1,180 | ) | — | (1,180 | ) | (2,664 | ) | — | (2,664 | ) | ||||||||||||||||||||||
Charge-offs | (1,288 | ) | 1,288 | — | (160 | ) | 160 | — | (1,448 | ) | 1,448 | — | |||||||||||||||||||||||||
Recoveries | — | (99 | ) | (99 | ) | — | — | — | — | (99 | ) | (99 | ) | ||||||||||||||||||||||||
Change in fair value recorded in earnings | — | (1,083 | ) | (1,083 | ) | — | (334 | ) | (334 | ) | — | (1,417 | ) | (1,417 | ) | ||||||||||||||||||||||
Balance at March 31, 2017 | $ | 16,924 | $ | (1,552 | ) | $ | 15,372 | $ | 9,724 | $ | (315 | ) | $ | 9,409 | $ | 26,648 | $ | (1,867 | ) | $ | 24,781 | ||||||||||||||||
33
LENDINGCLUB CORPORATION
Notes to Condensed Consolidated Financial Statements
(Tabular Amounts in Thousands, Except Share and Per Share Amounts, Ratios, or as Noted)
(Unaudited)
The following tables present additional information about Level 3 servicing assets and liabilities measured at fair value on a recurring basis for the first quarters of 2018 and 2017:
Three Months Ended March 31, 2018 | Three Months Ended March 31, 2017 | |||||||||||||||
Servicing Assets | Servicing Liabilities | Servicing Assets | Servicing Liabilities | |||||||||||||
Fair value at beginning of period | $ | 33,676 | $ | 833 | $ | 21,398 | $ | 2,846 | ||||||||
Issuances (1) | 11,980 | — | 5,317 | 274 | ||||||||||||
Change in fair value, included in investor fees | (5,606 | ) | (358 | ) | (4,047 | ) | (809 | ) | ||||||||
Other net changes included in deferred revenue | 834 | — | (308 | ) | — | |||||||||||
Fair value at end of period | $ | 40,884 | $ | 475 | $ | 22,360 | $ | 2,311 | ||||||||
(1) | Represents the gains or losses on sales of the related loans, recorded in other revenue. |
The following table presents additional information about Level 3 loan trailing fee liability measured at fair value on a recurring basis for the first quarters of 2018 and 2017:
Three Months Ended March 31, | |||||||
2018 | 2017 | ||||||
Fair value at beginning of period | $ | 8,432 | $ | 4,913 | |||
Issuances | 1,775 | 1,663 | |||||
Cash payment of loan trailing fee | (1,554 | ) | (826 | ) | |||
Change in fair value, included in origination and servicing | 171 | 64 | |||||
Fair value at end of period | $ | 8,824 | $ | 5,814 | |||
Significant Recurring Level 3 Fair Value Asset and Liability Input Sensitivity
Fair valuation adjustments are recorded through earnings related to Level 3 instruments for the first quarters of 2018 and 2017. Certain unobservable inputs may (in isolation) have either a directionally consistent or opposite impact on the fair value of the financial instrument for a given change in that input. When multiple inputs are used within the valuation techniques for loans, notes, certificates and secured borrowings, servicing assets and liabilities, and loan trailing fee liability, a change in one input in a certain direction may be offset by an opposite change from another input.
A specific loan that is projected to have larger future default losses than previously estimated has lower expected future cash flows over its remaining life, which reduces its estimated fair value. Conversely, a specific loan that is projected to have smaller future default losses than previously estimated has increased expected future cash flows over its remaining life, which increases its estimated fair value.
34
LENDINGCLUB CORPORATION
Notes to Condensed Consolidated Financial Statements
(Tabular Amounts in Thousands, Except Share and Per Share Amounts, Ratios, or as Noted)
(Unaudited)
The fair value sensitivity of loans invested in by the Company to adverse changes in key assumptions as of March 31, 2018 and December 31, 2017 are as follows:
March 31, 2018 | December 31, 2017 | ||||||
Fair value of loans invested in by the Company | $ | 565,802 | $ | 597,055 | |||
Expected weighted-average life (in years) | 1.5 | 1.5 | |||||
Discount rates | |||||||
100 basis point increase | $ | (6,708 | ) | $ | (7,449 | ) | |
200 basis point increase | $ | (13,258 | ) | $ | (14,715 | ) | |
Expected credit loss rates on underlying loans | |||||||
10% adverse change | $ | (9,249 | ) | $ | (10,090 | ) | |
20% adverse change | $ | (18,356 | ) | $ | (18,935 | ) | |
Expected prepayment rates | |||||||
10% adverse change | $ | (2,355 | ) | $ | (3,548 | ) | |
20% adverse change | $ | (4,616 | ) | $ | (5,894 | ) | |
The Company’s selection of the most representative market servicing rates for servicing assets and servicing liabilities is inherently judgmental. The Company reviews third-party servicing rates for its loans, loans in similar credit sectors, and market servicing benchmarking analyses provided by third-party valuation firms, when available. The table below shows the impact on the estimated fair value of servicing assets and liabilities, calculated using different market servicing rate assumptions as of March 31, 2018 and December 31, 2017:
March 31, 2018 | December 31, 2017 | ||||||||||||||
Servicing Assets | Servicing Liabilities | Servicing Assets | Servicing Liabilities | ||||||||||||
Weighted-average market servicing rate assumptions | 0.66 | % | 0.66 | % | 0.66 | % | 0.66 | % | |||||||
Change in fair value from: | |||||||||||||||
Servicing rate increase by 0.10% | $ | (8,340 | ) | $ | 154 | $ | (7,749 | ) | $ | 233 | |||||
Servicing rate decrease by 0.10% | $ | 8,343 | $ | (151 | ) | $ | 7,760 | $ | (222 | ) | |||||
35
LENDINGCLUB CORPORATION
Notes to Condensed Consolidated Financial Statements
(Tabular Amounts in Thousands, Except Share and Per Share Amounts, Ratios, or as Noted)
(Unaudited)
Financial Instruments, Assets, and Liabilities Not Recorded at Fair Value
The following tables present the fair value hierarchy for financial instruments, assets, and liabilities not recorded at fair value at March 31, 2018 and December 31, 2017:
March 31, 2018 | Carrying Amount | Level 1 Inputs | Level 2 Inputs | Level 3 Inputs | Balance at Fair Value | ||||||||||||||
Assets: | |||||||||||||||||||
Cash and cash equivalents (1) | $ | 405,078 | $ | — | $ | 405,078 | $ | — | $ | 405,078 | |||||||||
Restricted cash | 226,818 | — | 226,818 | — | 226,818 | ||||||||||||||
Servicer reserve receivable | 5,895 | — | 5,895 | — | 5,895 | ||||||||||||||
Deposits | 855 | — | 855 | — | 855 | ||||||||||||||
Total assets | $ | 638,646 | $ | — | $ | 638,646 | $ | — | $ | 638,646 | |||||||||
Liabilities: | |||||||||||||||||||
Accrued expenses and other liabilities | $ | 14,014 | $ | — | $ | — | $ | 14,014 | $ | 14,014 | |||||||||
Accounts payable | 3,389 | — | 3,389 | — | 3,389 | ||||||||||||||
Payables to investors | 108,247 | — | 108,247 | — | 108,247 | ||||||||||||||
Payable to securitization note holders | 279,561 | — | 279,561 | — | 279,561 | ||||||||||||||
Payable to revolving credit facilities | 74,000 | — | — | 74,000 | 74,000 | ||||||||||||||
Total liabilities | $ | 479,211 | $ | — | $ | 391,197 | $ | 88,014 | $ | 479,211 | |||||||||
(1) | Carrying amount approximates fair value due to the short maturity of these financial instruments. |
December 31, 2017 | Carrying Amount | Level 1 Inputs | Level 2 Inputs | Level 3 Inputs | Balance at Fair Value | ||||||||||||||
Assets: | |||||||||||||||||||
Cash and cash equivalents (1) | $ | 401,719 | $ | — | $ | 401,719 | $ | — | $ | 401,719 | |||||||||
Restricted cash | 242,570 | — | 242,570 | — | 242,570 | ||||||||||||||
Servicer reserve receivable | 13,685 | — | 13,685 | — | 13,685 | ||||||||||||||
Deposits | 855 | — | 855 | — | 855 | ||||||||||||||
Total assets | $ | 658,829 | $ | — | $ | 658,829 | $ | — | $ | 658,829 | |||||||||
Liabilities: | |||||||||||||||||||
Accrued expenses and other liabilities | $ | 13,856 | $ | — | $ | — | $ | 13,856 | $ | 13,856 | |||||||||
Accounts payable | 11,151 | — | 11,151 | — | 11,151 | ||||||||||||||
Payables to investors | 143,310 | — | 143,310 | — | 143,310 | ||||||||||||||
Payable to securitization note holders | 310,644 | — | 310,644 | — | 310,644 | ||||||||||||||
Payable to revolving credit facilities | 32,100 | — | — | 32,100 | 32,100 | ||||||||||||||
Total liabilities | $ | 511,061 | $ | — | $ | 465,105 | $ | 45,956 | $ | 511,061 | |||||||||
(1) | Carrying amount approximates fair value due to the short maturity of these financial instruments. |
36
LENDINGCLUB CORPORATION
Notes to Condensed Consolidated Financial Statements
(Tabular Amounts in Thousands, Except Share and Per Share Amounts, Ratios, or as Noted)
(Unaudited)
9. Property, Equipment and Software, Net
Property, equipment and software, net, consist of the following:
March 31, 2018 | December 31, 2017 | ||||||
Internally developed software (1) | $ | 112,169 | $ | 107,370 | |||
Leasehold improvements | 27,190 | 26,949 | |||||
Computer equipment | 21,391 | 20,324 | |||||
Purchased software | 8,151 | 8,284 | |||||
Furniture and fixtures | 7,613 | 7,567 | |||||
Construction in progress | 2,296 | 1,202 | |||||
Total property, equipment and software | 178,810 | 171,696 | |||||
Accumulated depreciation and amortization | (71,633 | ) | (69,763 | ) | |||
Total property, equipment and software, net | $ | 107,177 | $ | 101,933 | |||
(1) | Includes $12.4 million and $10.7 million in development in progress as of March 31, 2018 and December 31, 2017, respectively. |
Depreciation and amortization expense on property, equipment and software was $10.3 million and $9.1 million for the first quarters of 2018 and 2017, respectively.
10. Other Assets
Other assets consist of the following:
March 31, 2018 | December 31, 2017 | ||||||
Loan servicing assets, at fair value | $ | 40,884 | $ | 33,676 | |||
Prepaid expenses | 21,457 | 23,427 | |||||
Accounts receivable | 10,353 | 10,005 | |||||
Insurance reimbursements receivable | 9,550 | 52,119 | |||||
Other investments | 9,199 | 10,268 | |||||
Servicer reserve receivable | 5,895 | 13,685 | |||||
Deferred financing costs | 3,749 | 2,952 | |||||
Receivable from investors | 2,024 | 2,318 | |||||
Other | 3,759 | 7,828 | |||||
Total other assets | $ | 106,870 | $ | 156,278 | |||
11. Intangible Assets and Goodwill
Intangible Assets
Intangible assets net of accumulated amortization was $20.9 million and $21.9 million at March 31, 2018 and December 31, 2017, respectively. Amortization expense associated with intangible assets for the first quarters of 2018 and 2017 was $1.0 million and $1.2 million, respectively.
37
LENDINGCLUB CORPORATION
Notes to Condensed Consolidated Financial Statements
(Tabular Amounts in Thousands, Except Share and Per Share Amounts, Ratios, or as Noted)
(Unaudited)
Goodwill
Goodwill was $35.6 million at March 31, 2018 and December 31, 2017, respectively. The Company has one reporting unit for goodwill impairment testing purposes, the patient and education finance (PEF) reporting unit. There were no goodwill impairment expenses recorded for the first quarters of 2018 and 2017 related to the PEF reporting unit. The Company’s annual goodwill impairment testing date is April 1.
12. Accrued Expenses and Other Liabilities
Accrued expenses and other liabilities consist of the following:
March 31, 2018 | December 31, 2017 | ||||||
Contingent liabilities | $ | 101,889 | $ | 129,887 | |||
Accrued expenses | 30,667 | 21,317 | |||||
Accrued compensation | 16,438 | 30,549 | |||||
Transaction fee refund reserve | 15,088 | 14,528 | |||||
Deferred rent | 14,831 | 14,734 | |||||
Loan trailing fee liability, at fair value | 8,824 | 8,432 | |||||
Deferred revenue | 4,315 | 3,415 | |||||
Payable to issuing banks | 1,015 | 1,894 | |||||
Loan servicing liabilities, at fair value | 475 | 833 | |||||
Other | 2,975 | 2,791 | |||||
Total accrued expenses and other liabilities | $ | 196,517 | $ | 228,380 | |||
13. Debt
Revolving Credit Facilities
Warehouse Credit Facility I
On October 10, 2017, the Company’s wholly-owned subsidiary, Warehouse I, entered into a warehouse credit agreement (Warehouse Credit Agreement I) with certain lenders for an aggregate $250.0 million secured revolving credit facility (Warehouse Credit Facility I). In connection with the Warehouse Credit Agreement I, Warehouse I entered into a security agreement with a large commercial bank as administrative agent and a national banking association as collateral trustee and paying agent. Proceeds under the Warehouse Credit Facility I may only be used to purchase certain unsecured consumer loans and related rights and documents from the Company and to pay fees and expenses related to the Warehouse Credit Facility I. The creditors of the Warehouse Credit Facility I have no recourse to the general credit of the Company.
Proceeds of loans made under the Warehouse Credit Facility I may be borrowed, repaid and reborrowed until the earliest of October 10, 2019 or another event that constitutes a “Commitment Termination Date” under the Warehouse Credit Agreement I. Repayment of any outstanding proceeds is due on October 10, 2019, but may be prepaid without penalty.
Borrowings under the Warehouse Credit Facility I bear interest at an annual benchmark rate based on LIBOR rate plus a spread of 2.00% to 7.25%, or at an alternative commercial paper rate (which is the per annum rate equivalent to the weighted-average of the per annum rates at which all commercial paper notes issued by such lenders to fund
38
LENDINGCLUB CORPORATION
Notes to Condensed Consolidated Financial Statements
(Tabular Amounts in Thousands, Except Share and Per Share Amounts, Ratios, or as Noted)
(Unaudited)
advances or maintain its loan were sold, as defined in the credit agreement). Benchmark rate borrowings may be prepaid at any time without penalty. Interest is payable monthly. Additionally, the Company was required to pay an upfront commitment fee to the lenders of 0.75% of the initial $250.0 million available under the revolving loan facility and a monthly unused commitment fee of 0.50% per annum on the average undrawn portion available under the revolving loan facility.
The Warehouse Credit Facility I and credit and security agreements contain certain covenants applicable to the Company, including restrictions on the Company’s ability to pay dividends, incur indebtedness, pledge assets, merge or consolidate, make investments, and enter into certain affiliate transactions. The Warehouse Credit Facility I also requires the Company to maintain a maximum total net leverage ratio (defined as the ratio of net debt to Adjusted EBITDA, on a consolidated basis for the four most recent Fiscal Quarter periods) of 3.25:1.00 initially, and which decreases over the term of the Warehouse Credit Facility I to 3.00:1.00 on and after June 30, 2018 (on a consolidated basis). As of March 31, 2018 and December 31, 2017, the Company was in compliance with the total net leverage ratio requirements, calculated as defined in the Warehouse Credit Facility I.
As of March 31, 2018 and December 31, 2017, the Company had $12.0 million and $32.1 million, respectively, in debt outstanding under the Warehouse Credit Facility I secured by aggregate outstanding principal balance of $35.6 million and $62.1 million, respectively, included in “Loans held for sale by the Company at fair value” and restricted cash of $5.8 million and $4.1 million, respectively, included in the Condensed Consolidated Balance Sheets. The Company incurred $2.4 million of capitalized debt issuance costs, which will be recognized as interest expense through October 10, 2019.
Warehouse Credit Facility II
On January 23, 2018, LendingClub Warehouse II LLC (Warehouse II), a wholly-owned subsidiary of the Company, entered into a warehouse credit agreement (Warehouse Credit Agreement II) with certain lenders for an aggregate $200.0 million secured revolving credit facility (Warehouse Credit Facility II). In connection with Warehouse Credit Agreement II, Warehouse II entered into a security agreement with a large commercial bank as administrative agent and a national banking association as collateral trustee and paying agent. Proceeds under Warehouse Credit Facility II may only be used to purchase certain unsecured consumer loans and related rights and documents from the Company and to pay fees and expenses related to the Warehouse Credit Facility II. The creditors of the Warehouse Credit Facility II have no recourse to the general credit of the Company.
Proceeds of loans made under the Warehouse Credit Facility II may be borrowed, repaid and reborrowed until the earliest of March 23, 2020 or another event that constitutes a “Commitment Termination Date” under the Warehouse Credit Agreement II. Repayment of any outstanding proceeds is due on March 23, 2020, but may be prepaid without penalty.
Borrowings under the Warehouse Credit Facility II bear interest at an annual benchmark rate based on LIBOR rate plus 1.00% plus used fee of 2.50%, or at an alternative commercial paper rate (which is the per annum rate equivalent to the weighted-average of the per annum rates at which all commercial paper notes issued by such lenders to fund advances or maintain its loan were sold, as defined in the credit agreement). Benchmark rate borrowings may be prepaid at any time without penalty. Interest is payable monthly. Additionally, the Company was required to pay an upfront commitment fee to the lenders of 0.485% of the initial $200.0 million available under the revolving loan facility and an unused commitment fee of up to 0.75% per annum based on utilization of the revolving loan facility.
The Warehouse Credit Facility II and credit and security agreements contain certain covenants applicable to the Company, including restrictions on the Company’s ability to pay dividends, incur indebtedness, pledge assets, merge or consolidate, make investments, and enter into certain affiliate transactions. The Warehouse Credit
39
LENDINGCLUB CORPORATION
Notes to Condensed Consolidated Financial Statements
(Tabular Amounts in Thousands, Except Share and Per Share Amounts, Ratios, or as Noted)
(Unaudited)
Facility II also requires the Company to maintain a maximum total net leverage ratio (defined as the ratio of net debt to Adjusted EBITDA, on a consolidated basis for the four most recent Fiscal Quarter periods) of 3.25:1.00 initially, and which decreases over the term of the Warehouse Credit Facility II to 3.00:1.00 on and after June 30, 2018 (on a consolidated basis). As of March 31, 2018, the Company was in compliance with the total net leverage ratio requirements, calculated as defined in the Warehouse Credit Facility II.
As of March 31, 2018, the Company had $37.0 million in debt outstanding under the Warehouse Credit Facility II secured by aggregate outstanding principal balance of $53.9 million included in “Loans held for sale by the Company at fair value” and restricted cash of $8.4 million included in the Condensed Consolidated Balance Sheets. The Company incurred $1.1 million of capitalized debt issuance costs, which will be recognized as interest expense through March 23, 2020.
Credit Facility
On December 17, 2015, the Company entered into a credit and guaranty agreement with several lenders for an aggregate $120.0 million unsecured revolving credit facility (Credit Facility). In connection with the credit agreement, the Company entered into a pledge and security agreement with Morgan Stanley Senior Funding, Inc., as collateral agent.
Proceeds of loans made under the Credit Facility may be borrowed, repaid and reborrowed until December 17, 2020. Repayment of any outstanding proceeds are payable on December 17, 2020, but may be prepaid without penalty.
Borrowings under the Credit Facility bear interest, at the Company’s option, at an annual rate based on LIBOR rate plus a spread of 1.75% to 2.00%, which is fixed for a Company-selected interest period of one, two, three, six or 12 months, or at an alternative base rate (which is tied to either the prime rate, federal funds effective rate, or the adjusted eurocurrency rate, as defined in the credit agreement). Base rate borrowings may be prepaid at any time without penalty, however pre-payment of LIBOR-based borrowings before the end of the selected interest period may result in the Company incurring expense to compensate the lenders for their funding costs through the end of the interest period. Interest is payable quarterly. Additionally, the Company is required to pay a quarterly commitment fee to the lenders of between 0.25% and 0.375% per annum, depending on the Company’s total net leverage ratio, on the average undrawn portion available under the revolving loan facility.
The Credit Facility and pledge and security agreement contain certain covenants applicable to the Company, including restrictions on the Company’s ability to pay dividends, incur indebtedness, pledge our assets, merge or consolidate, make investments, and enter into certain affiliate transactions. The Credit Facility also requires the Company to maintain a maximum total net leverage ratio (defined as the ratio of net debt to Adjusted EBITDA, on a consolidated basis for the four most recent Fiscal Quarter periods) of 4.00:1.00 initially, and which decreases over the term of the Credit Facility to 3.00:1.00 on and after June 30, 2018 (on a consolidated basis). As of March 31, 2018 and December 31, 2017, the Company was in compliance with the total net leverage ratio requirements, calculated as defined in the Credit Facility.
The Company had $25.0 million in debt outstanding under the Credit Facility as of March 31, 2018. The Company had no debt outstanding under the Credit Facility as of December 31, 2017. In 2015, the Company incurred $1.3 million of capitalized debt issuance costs, which is being recorded as interest expense through December 17, 2020.
40
LENDINGCLUB CORPORATION
Notes to Condensed Consolidated Financial Statements
(Tabular Amounts in Thousands, Except Share and Per Share Amounts, Ratios, or as Noted)
(Unaudited)
Payable to Securitization Note and Residual Certificate Holders
On December 6, 2017, the Company sponsored an asset-backed securities securitization transaction consisting of approximately $368.0 million in unsecured personal whole loans facilitated through the Company’s platform. In connection with this securitization, the Company’s Depositor purchased the loans and simultaneously transferred the loans to a securitization trust, which held the transferred loans and issued notes and residual certificates.
The Depositor sold 95% of the notes to third party-investors for $310.5 million in net proceeds and then distributed cash and 4.1% of residual certificates to original whole loan investors. The securitization trust used to effect the transaction is a VIE that the Company consolidates because the Company is the primary beneficiary of the VIE.
The notes and residual certificates held by third-party investors are classified as debt in the Company’s Condensed Consolidated Balance Sheets. The notes are carried at amortized cost. The associated debt issuance costs of $2.9 million are deferred and amortized into interest expense over the weighted-average contractual life of the notes. The Company has elected the fair value option for the residual certificates. The notes and residual certificates held by third-party investors, as well as unamortized debt issuance costs, are included in “Payable to securitization note and residual certificate holders” in the Condensed Consolidated Balance Sheets, and totaled $280.9 million and $312.1 million as of March 31, 2018 and December 31, 2017, respectively. These liabilities are secured by aggregate outstanding principal balance of $328.2 million and $359.4 million included in “Loans held for investment by the Company at fair value” and restricted cash of $10.7 million and $18.7 million included in the Condensed Consolidated Balance Sheets as of March 31, 2018 and December 31, 2017, respectively.
14. Secured Borrowings
In October 2017, LCAM initiated the full wind down of six funds by redeeming the certificates issued to the funds and transferring the loan participations underlying the redeemed certificates to third party investors. The loan participation for two of the funds transferred did not meet the definition of participating interests because the Company provided a credit support agreement under which the investor has a recourse to the Company for credit losses in excess of certain minimum loss coverage hurdle. The transfer of the loan participations in these two funds was accounted for as secured borrowings and the underlying whole loans were not derecognized from the Company’s Condensed Consolidated Balance Sheets. The Company has elected the fair value option for the secured borrowings.
As of March 31, 2018, the fair value of the secured borrowings was $179.3 million secured by aggregate outstanding principal balance of $187.0 million included in “Loans held for investment by the Company at fair value” in the Condensed Consolidated Balance Sheets as of March 31, 2018. As of December 31, 2017, the fair value of the secured borrowings was $232.4 million secured by aggregate outstanding principal balance of $242.7 million included in “Loans held for investment by the Company at fair value” in the Condensed Consolidated Balance Sheets as of December 31, 2017. Changes in the fair value of the secured borrowings are partially offset by the associated loan participations, and the net effect is changes in fair value of the credit support agreement through earnings. As of March 31, 2018, the fair value of this credit support agreement was $2.7 million. As of December 31, 2017, the fair value of this credit support agreement was $2.8 million. The fair value of the credit support agreement is equal to the present value of the probability-weighted estimate of expected payments over a range of charge-off scenarios. See “Note 6. Loans Held For Investment, Loans Held For Sale, Notes, Certificates and Secured Borrowings and Loan Servicing Rights” for additional information.
15. Employee Incentive Plans
The Company’s equity incentive plans provide for granting stock options and restricted stock units (RSUs) to employees, consultants, officers and directors.
41
LENDINGCLUB CORPORATION
Notes to Condensed Consolidated Financial Statements
(Tabular Amounts in Thousands, Except Share and Per Share Amounts, Ratios, or as Noted)
(Unaudited)
Stock-based compensation expense was as follows for the periods presented:
Three Months Ended March 31, | |||||||
2018 | 2017 | ||||||
Stock options | $ | 2,567 | $ | 4,345 | |||
RSUs | 14,793 | 14,634 | |||||
ESPP | 441 | 385 | |||||
Stock issued related to acquisition | — | 134 | |||||
Total stock-based compensation expense | $ | 17,801 | $ | 19,498 | |||
The following table presents the Company’s stock-based compensation expense recorded in the Condensed Consolidated Statements of Operations:
Three Months Ended March 31, | |||||||
2018 | 2017 | ||||||
Sales and marketing | $ | 1,860 | $ | 2,299 | |||
Origination and servicing | 1,072 | 1,416 | |||||
Engineering and product development | 5,279 | 6,588 | |||||
Other general and administrative | 9,590 | 9,195 | |||||
Total stock-based compensation expense | $ | 17,801 | $ | 19,498 | |||
The Company capitalized $2.2 million and $2.5 million of stock-based compensation expense associated with developing software for internal use during the first quarters of 2018 and 2017, respectively.
Performance-based Restricted Stock Units
During the first quarter of 2018, the Company granted its chief executive officer and chief financial officer performance-based restricted stock units (PBRSUs). PBRSUs are equity awards that may be earned based on achieving certain pre-established performance metrics over a specific performance period. Depending on the probability of achieving the pre-established performance targets, the PBRSUs issued could range from 0% to 200% of the target amount. PBRSUs granted under the Company’s equity incentive plans generally have a one-year performance period with one-half of the grant vesting over one-year following the completion of the performance period and the remaining one-half vesting over two-years following the completion of the performance period. Over the performance period, the number of PBRSUs that may be earned and the related stock-based compensation expense that is recognized is adjusted upward or downward based upon the probability of achieving the pre-established performance targets against the performance metrics.
16. Income Taxes
The Company continues to recognize a full valuation allowance against net deferred tax assets. This determination was based on the assessment of the available positive and negative evidence to estimate if sufficient future taxable income will be generated to utilize the existing deferred tax assets.
42
LENDINGCLUB CORPORATION
Notes to Condensed Consolidated Financial Statements
(Tabular Amounts in Thousands, Except Share and Per Share Amounts, Ratios, or as Noted)
(Unaudited)
17. Commitments and Contingencies
Operating Lease Commitments
Total facilities rental expense for the first quarters of 2018 and 2017 was $4.3 million and $3.8 million, respectively. Sublease rental income for the first quarter of 2018 was $0.1 million. The Company had no sublease rental income for the first quarter of 2017. Minimum lease payments for the first quarters of 2018 and 2017 were $4.0 million and $3.6 million, respectively. As of March 31, 2018, the Company pledged $0.8 million of cash and $5.5 million in letters of credit as security deposits in connection with its lease agreements.
The Company’s future minimum payments under non-cancelable operating leases in excess of one year and anticipated sublease income as of March 31, 2018, were as follows:
Operating Leases | Subleases | Net | |||||||
2018 | $ | 12,372 | $ | (233 | ) | $ | 12,139 | ||
2019 | 16,626 | (39 | ) | 16,587 | |||||
2020 | 17,557 | — | 17,557 | ||||||
2021 | 17,844 | — | 17,844 | ||||||
2022 | 13,519 | — | 13,519 | ||||||
Thereafter | 32,645 | — | 32,645 | ||||||
Total | $ | 110,563 | $ | (272 | ) | $ | 110,291 | ||
Loan Purchase Obligation
Under the Company’s loan account program with WebBank, which serves as the Company’s primary issuing bank, WebBank retains ownership of the loans it originates that are facilitated through the Company’s lending marketplace for two business days after origination. As part of this arrangement, the Company is committed to purchase the loans at par plus accrued interest, at the conclusion of the two business days. As of March 31, 2018 and December 31, 2017, the Company was committed to purchase loans with an outstanding principal balance of $53.2 million and $54.2 million at par, respectively.
Loan Repurchase Obligations
The Company is generally required to repurchase loans, notes or certificates in events of verified identity theft. The Company may also repurchase certain loans, notes or certificates in connection with certain customer accommodations. In connection with certain whole loan and CLUB Certificate sales, as well as to facilitate access to securitization markets, the Company has agreed to repurchase loans if representations and warranties made with respect to such loans are breached, and such breach has a material adverse effect on the loans. In the case of certain securitization transactions, the Company has also agreed to repurchase or substitute loans for which a borrower fails to make the first payment due under a loan. The Company believes such provisions are customary and consistent with institutional loan and securitization market standards.
In addition to and distinct from the repurchase obligations described in the preceding paragraph, the Company performs certain administrative functions for a variety of retail and institutional investors, including executing, without discretion, loan investments as directed by the investor. To the extent loans do not meet the investor’s investment criteria at the time of issuance, or are transferred to the investor as a result of a system error by the Company, the Company repurchases such loans, notes or certificates at par.
43
LENDINGCLUB CORPORATION
Notes to Condensed Consolidated Financial Statements
(Tabular Amounts in Thousands, Except Share and Per Share Amounts, Ratios, or as Noted)
(Unaudited)
As a result of the loan repurchase obligations described above, the Company repurchased $1.6 million and $0.9 million in loans, notes and certificates during the first quarters of 2018 and 2017, respectively.
Purchase Commitments
As required by applicable regulations, the Company must make firm offers of credit as a result of pre-approval direct mail it sends out, where the consumers continue to meet the credit worthiness criteria which were used to screen them. If such loans are accepted by the applicants but not otherwise funded by investors on the platform, the Company is required to provide funding for the loans. The Company was not required to purchase any such loans during the first quarter of 2018. Additionally, loans in the process of being facilitated through the Company’s platform and originated by the Company’s issuing bank partner at March 31, 2018, were substantially funded in April 2018. As of the date of this report, no loans remained without investor commitments and the Company was not required to purchase any of these loans.
In addition, if neither Springstone nor the Company can arrange for other investors to invest in or purchase loans that Springstone facilitates and that are originated by an issuing bank partner but do not meet the credit criteria for
purchase by the issuing bank partner (Pool B loans), Springstone and the Company are contractually committed to purchase these loans. As of March 31, 2018 and December 31, 2017, the Company had a $9.0 million deposit in a bank account to secure potential future purchases of these loans, if necessary. The funds are recorded as restricted cash on the Company’s Condensed Consolidated Balance Sheets. During the first quarter of 2018, the Company was not required to purchase Pool B loans. Pool B loans are held on the Company’s Condensed Consolidated Balance Sheets and have an outstanding principal balance and fair value of $17.3 million and $15.5 million as of March 31, 2018, respectively, and $20.1 million and $18.2 million as of December 31, 2017, respectively. The Company believes it will be required to purchase additional Pool B loans during 2018 as it seeks to arrange for other investors to invest in or purchase these loans.
Credit Support Agreement
The Company is subject to a credit support agreement with Cirrix Capital (Investment Fund). The credit support agreement requires the Company to pledge and restrict cash in support of its contingent obligation to reimburse the Investment Fund for net credit losses on loans underlying the Investment Fund’s certificates that are in excess of a specified, aggregate net loss threshold. On April 14, 2017, the credit support agreement was terminated effective December 31, 2016. However, the Company remains subject to the credit support agreement for credit losses on loans underlying the Investment Fund’s certificates that were issued on or prior to December 31, 2016. The Company pledged and restricted cash in the amount of $2.2 million and $2.2 million as of March 31, 2018 and December 31, 2017, respectively, to support this contingent obligation. The Company’s maximum exposure to loss under this credit support agreement was limited to $6.0 million as of March 31, 2018 and December 31, 2017, for which no liability has been accrued as of March 31, 2018 or December 31, 2017.
Legal
The Company is subject to various claims brought in a litigation or regulatory context. The Company is defending against, and is in the process of settling certain significant class action and derivative lawsuits filed in 2016; continues to address federal regulatory actions relating to and arising from the internal board review described more fully in “Management’s Discussion and Analysis of Financial Condition and Results of Operations – Board Review” contained in Part II, Item 7 of the Company’s Annual Report on Form 10-K for the year ended December 31, 2016 (the Board Review); continues to address federal and state regulatory examinations and actions relating to the Company’s business practices and licensing; and is a party to a number of routine litigation matters arising in the ordinary course of business. The majority of these claims and proceedings relate to or arise from alleged state or
44
LENDINGCLUB CORPORATION
Notes to Condensed Consolidated Financial Statements
(Tabular Amounts in Thousands, Except Share and Per Share Amounts, Ratios, or as Noted)
(Unaudited)
federal law and regulatory violations, or are alleged commercial disputes and alleged consumer complaints. The Company accrues for costs related to contingencies when a loss from such claims is probable and the amount of loss can be reasonably estimated. In determining whether a loss from a claim is probable and if it is possible to estimate the loss, the Company reviews and evaluates its litigation and regulatory matters on at least a quarterly basis in light of potentially relevant factual and legal developments. If the Company determines an unfavorable outcome is not probable or the amount of loss cannot be reasonably estimated, the Company does not accrue for a potential litigation loss. In those situations, the Company discloses an estimate of the probable losses or a range of possible losses, if such estimates can be made. Except as otherwise specifically noted below, at this time, the Company does not believe that it is possible to estimate the reasonably possible losses or a range of reasonably possible losses related to the matters described below.
Settlement of Class Action Filed In 2016
During the year ended December 31, 2016, several putative class action lawsuits alleging violations of federal securities laws were filed in California Superior Court, naming as defendants the Company, current and former directors, certain officers, and the underwriters in the December 2014 initial public offering (the IPO). All of these actions were consolidated into a single action (Consolidated State Court Action), entitled In re LendingClub Corporation Shareholder Litigation, No. CIV537300. In August 2016, plaintiffs filed an amended complaint alleging violations of Sections 11, 12(a)(2) and 15 of the Securities Act of 1933 (Securities Act) based on allegedly false and misleading statements in the IPO registration statement and prospectus. Following multiple demurrers, which were granted in part and denied in part, the Plaintiffs filed a Second Amended Consolidated Complaint, which became the operative pleading. In April 2017 the plaintiffs filed their motion for class certification, which the Company opposed. The motion was granted in part in a June 2017 Order. The Court set the trial date for October 2018.
In May 2016, two related putative securities class actions (entitled Evellard v. LendingClub Corporation, et al., No. 16-CV-2627-WHA, and Wertz v. LendingClub Corporation, et al., No. 16-CV-2670-WHA) were filed in the United States District Court for the Northern District of California, naming as defendants the Company and certain of its officers and directors; these matters were subsequently consolidated into a single action. The Company moved to dismiss the amended complaint filed in the fourth quarter of 2016. The Court held a hearing on this motion in the first quarter of 2017 and ultimately granted in part and denied in part the motion. The plaintiffs thereafter amended their complaint consistent with the May 2017 Order and the parties began discovery. In September 2017 the plaintiffs filed their motion for class certification, which the Company opposed. The motion was granted in an October 2017 Order. In that Order, the Court also granted a motion by the plaintiffs in the Consolidated State Court Action to intervene in the federal action. Following court-ordered mediation in November 2017 and January 2018, the Company agreed to a preliminary settlement in which the Company would pay a total of $125.0 million in exchange for a dismissal of both the federal and state securities class actions with prejudice. Of that amount, $47.75 million will be paid from insurance. The Court issued an order granting preliminary approval of the settlement on March 16, 2018 and has set a hearing for final approval of the settlement for July 19, 2018. To satisfy the payment obligations, insurance carriers directly paid $38.2 million to a settlement administrator in March 2018 and an additional $9.6 million in April 2018. The Company paid $14.75 million to the settlement administrator in April 2018 and expects to pay the remaining $62.5 million in July 2018. In the event the settlement is approved, these matters will be dismissed with prejudice and settlement proceeds will be distributed to members of the impacted class. In the event that this or any other settlement is not approved, the matter will continue to proceed to trial and the Company will continue to vigorously defend against the claims.
The Company was self-insured for the deductible amount under its director and officers’ liability insurance policy for these matters. The Company exceeded the deductible in 2016 and was reimbursed by insurance carriers for costs related to the litigations and investigations prior to the settlement. As a result of such reimbursed costs and the amount to be paid in the settlement, the policy limits under available insurance policies have been exhausted.
45
LENDINGCLUB CORPORATION
Notes to Condensed Consolidated Financial Statements
(Tabular Amounts in Thousands, Except Share and Per Share Amounts, Ratios, or as Noted)
(Unaudited)
Derivative Lawsuits.
In May 2016 and August 2016, respectively, two putative shareholder derivative actions were filed (Avila v. Laplanche, et al., No. CIV538758 and Dua v. Laplanche, et al., CGC-16-553731) against certain of the Company’s current and former officers and directors and naming the Company as a nominal defendant. Both actions were voluntarily dismissed without prejudice. On December 14, 2016, a new putative shareholder derivative action was filed in the Delaware Court of Chancery (Steinberg, et al. v. Morris, et al., C.A. No. 12984-CB), against certain of the Company’s current and former officers and directors and naming the Company as a nominal defendant. In addition, on August 18, 2017, another putative shareholder derivative action was filed in the Delaware Court of Chancery (Fink et. al. v. Laplanche, et. al., Case No. 2017-0600). These matters arise from claims that the Board allegedly breached its fiduciary duty by failing to provide adequate oversight over the Company’s practices and procedures, and purports to plead derivative claims under Delaware law and federal securities law. The court ultimately consolidated the cases, selecting the Steinberg plaintiffs as lead plaintiffs, and designating the Steinberg complaint as the operative complaint. On November 6, 2017, a new putative shareholder derivative action was filed in the Northern District of California (Sawyer v. Sanborn, et al., No. 3:17-cv-06447), against certain of the Company’s current and former officers and directors and naming the Company as a nominal defendant. This action is based on allegations similar to those in the securities class action litigation, as described above. The plaintiffs in the Steinberg action will be permitted to join with the plaintiffs in the Sawyer action for the purposes of settlement. The court in the Sawyer action concurrently ordered all parties (including the intervening Steinberg plaintiffs) to participate in a mediation on May 15, 2018. It is not possible for the Company to predict the outcome of either the derivative litigation or the upcoming mediation.
Regulatory Investigations Following the Board Review
On May 9, 2016, following the announcement of the Board Review, the Company received a grand jury subpoena from the U.S. Department of Justice (DOJ). The Company also received formal requests for information from the SEC. The DOJ and the SEC are investigating matters related to the subject of the Company’s Board Review and statements made in the Company’s public filings.
The Company continues cooperating with the DOJ and SEC in their ongoing investigations, including with respect to the potential settlement of these matters and other governmental or regulatory authorities or agencies. No assurance can be given that settlement with the DOJ or SEC can be reached or as to the timing or outcome of these matters. However, to the extent that the Company continues to incur expenses to defend or respond to these investigations, insurance policy coverage limits under the Company’s 2016 policies have been exhausted, as described above, so that the Company will likely have no insurance available to offset any additional costs.
FTC Lawsuit
In 2016, the Company received a formal request for information from the Federal Trade Commission (the FTC). The FTC commenced an investigation concerning certain of the Company’s policies and practices and related legal compliance.
On April 25, 2018, the FTC filed a lawsuit in the Northern District of California (FTC v. LendingClub Corporation, No. 3:18-cv-02454) alleging causes of action for violations of the FTC Act, including deception in connection with disclosures related to the Company’s origination fees and certainty of loan approval, unfairness in making unauthorized charges to borrowers’ bank accounts and violation of the Gramm-Leach-Bliley Act regarding the Company’s practices in delivering its privacy notice. While the Company is not able to predict with certainty the timing, outcome, or consequence of this litigation, it believes that it has been in compliance with all applicable federal and state laws related to this matter and will vigorously defend the lawsuit.
46
LENDINGCLUB CORPORATION
Notes to Condensed Consolidated Financial Statements
(Tabular Amounts in Thousands, Except Share and Per Share Amounts, Ratios, or as Noted)
(Unaudited)
In addition, while the Company believes that the facts underlying these regulatory matters are well known and understood, as these matters are resolved the Company is subject to further claims.
Regulatory Action by the State of Massachusetts
The Massachusetts Division of Banks (Massachusetts DOB) had been examining the activities of the Company and its subsidiary, Springstone Financial, including whether: (i) Springstone Financial lacked a valid small loan company license; and (ii) whether the Company should have obtained a servicing license. The Company has resolved these matters with the Massachusetts DOB, resulting in a payment of an amount that is not material to the Company.
Regulatory Examinations and Actions Relating to the Company’s Business Practices and Licensing
The Company has been subject to periodic inquiries and enforcement actions brought by federal and state regulatory agencies relating to the Company’s business practices, the required licenses to operate its business and its manner of operating in accordance with the requirements of its licenses. In the past, the Company has successfully resolved inquiries in a manner that was not material to its results of financial operations in any period and that did not materially limit the Company’s ability to conduct its business. At the state level, the Company is currently in discussions with the Colorado Department of Law (the CDL) concerning the licenses required for the Company’s servicing operations and the structure of its offerings in the State of Colorado. No assurance can be given as to the timing or outcome of the CDL inquiry or any other matters.
In addition, the Company has also responded to inquiries from the California Department of Business Oversight and the New York Department of Financial Services regarding the operation of the Company’s business and the overall “FinTech” industry, but to date has received no indication that these inquiries will lead to any enforcement or other actions.
Putative Class Actions
In December 2017, a putative class action lawsuit was filed against the Company in the State of Nevada (Moses v. Lending Club, 2:17-cv-03071-JAD-PAL) alleging violations of the federal Fair Credit Reporting Act. The complaint alleges that the Company improperly accessed the credit report of the plaintiff, who had formerly had a loan serviced by the Company. The complaint further alleges, on information and belief, that the Company improperly accessed credit reports of other similarly situated individuals. The lawsuit is in its early stages and the Company denies the allegations of the complaint and will vigorously defend against the allegations.
Certain Financial Considerations Relating to Litigation and Investigations
The Company had $101.9 million and $129.9 million in accrued contingent liabilities and $9.6 million and $52.1 million in insurance reimbursements receivable associated with the matters discussed above at March 31, 2018 and December 31, 2017, respectively. The decrease in accrued contingent liabilities and insurance reimbursements receivable as of March 31, 2018 compared to December 31, 2017 was primarily a result of insurance reimbursement payments of $38.2 million in the first quarter of 2018 made by insurance carriers to the plaintiffs in the class action litigation settlement described above, partially offset by $13.5 million in accrued contingent liabilities in the first quarter of 2018 related to ongoing governmental and regulatory investigations. Class action settlement and regulatory litigation expense for the three months ended March 31, 2018 and December 31, 2017 was $13.5 million and $77.25 million, respectively. In addition to the foregoing, the Company is subject to, and may continue to be subject to, legal proceedings and regulatory actions in the ordinary course of business. No assurance can be given as to the timing or outcome of any of these matters.
47
LENDINGCLUB CORPORATION
Notes to Condensed Consolidated Financial Statements
(Tabular Amounts in Thousands, Except Share and Per Share Amounts, Ratios, or as Noted)
(Unaudited)
18. Segment Reporting
The Company defines operating segments to be components of the Company for which discrete financial information is evaluated regularly by the Company’s executive management committee as chief operating decision maker (CODM). For purposes of allocating resources and evaluating financial performance, the Company’s CODM reviews financial information by loan product types of personal, education and patient finance, small business, and auto. These product types are individually reviewed as operating segments but are aggregated to represent one reportable segment because the education and patient finance, small business, and auto loan product types are immaterial both individually and in the aggregate.
Substantially all of the Company’s revenue is generated in the United States. No individual borrower or investor accounted for 10% or more of consolidated net revenue for any of the periods presented.
19. Related Party Transactions
Related party transactions must be reviewed and approved by the Audit Committee of the Company’s board of directors when not conducted in the ordinary course of business subject to the standard terms of the Company’s lending marketplace or certificate investment program. Any material amendment or modification to an existing related party transaction is also subject to the review and approval of the Audit Committee. Related party transactions may include any transaction between entities under common control or with a related person that has occurred since the beginning of the Company’s latest fiscal year or is currently proposed. The Company has defined related persons as members of the board of directors, executive officers, principal owners of the Company’s outstanding stock and any immediate family members of each such related person, as well as any other person or entity with significant influence over the Company’s management or operations.
Several of the Company’s executive officers and directors (including immediate family members) have made deposits and withdrawals to their investor accounts and purchased loans, notes and certificates or have investments in private funds managed by LCAM. The Company believes all such transactions by related persons were made in the ordinary course of business and were transacted on terms and conditions that were not more favorable than those obtained by similarly situated third-party investors.
On April 1, 2016, the Company closed its $10.0 million investment in the Investment Fund, a holding company that participates in a family of funds with other unrelated third parties and purchases whole loans and interests in loans from the Company. As of March 31, 2018, the Company had an ownership interest of approximately 25% in the Investment Fund. Mr. John Mack, one of the Company’s board members, had no remaining ownership interest in the Investment Fund as of March 31, 2018. At March 31, 2018, the Company’s investment was $8.9 million and the Company had a distribution receivable due from the Investment Fund of $1.25 million, which are recognized in “Other assets” on the Company’s Condensed Consolidated Balance Sheets.
During the first quarter of 2018, this Investment Fund purchased no whole loans or interests in whole loans. During the first quarter of 2018, the Company earned $67 thousand in investor fees from this family of funds, and paid interest of $1.1 million on interests in whole loans to the family of funds. The Company believes that the investor fees charged were on terms and conditions that were not more favorable than those obtained by other third-party investors.
20. Subsequent Events
The Company has evaluated the impact of events that have occurred subsequent to March 31, 2018, through the date the condensed consolidated financial statements were filed with the SEC. Based on this evaluation, other than
48
LENDINGCLUB CORPORATION
Notes to Condensed Consolidated Financial Statements
(Tabular Amounts in Thousands, Except Share and Per Share Amounts, Ratios, or as Noted)
(Unaudited)
as recorded or disclosed within these condensed consolidated financial statements and related notes, the Company has determined none of these events were required to be recognized or disclosed.
49
LENDINGCLUB CORPORATION
Management’s Discussion and Analysis of Financial Condition and Results of Operations
(Tabular Amounts in Thousands, Except Share and Per Share Data and Ratios, or as Noted)
Item 2. Management’s Discussion and Analysis of Financial Condition and Results of Operations
The following discussion and analysis of our financial condition and results of operations should be read in conjunction with the condensed consolidated financial statements and related notes that appear in this Quarterly Report on Form 10-Q (Report). In addition to historical condensed consolidated financial information, the following discussion contains forward-looking statements that reflect our plans, estimates and beliefs. Our actual results could differ materially from those discussed in the forward-looking statements. Factors that could cause or contribute to these differences include those discussed below and elsewhere in this Report, particularly in “Part II – Other Information – Item 1A – Risk Factors” in this Report and “Part I – Item 1A – Risk Factors” in the Company’s Annual Report on Form 10-K for the year ended December 31, 2017 (Annual Report). The forward-looking statements included in this Quarterly Report on Form 10-Q are made only as of the date hereof.
Overview
LendingClub operates America’s largest online lending marketplace platform that connects borrowers and investors. We believe a technology-powered lending marketplace is a more efficient mechanism to allocate capital between borrowers and investors than the traditional banking system. Qualified consumers and small business owners borrow through LendingClub to generally lower the cost of their credit and enjoy a better experience than that provided by most traditional banks. The capital to invest in the loans enabled through our lending marketplace comes directly from a wide range of investors, including retail investors, money managers, high-net-worth individuals and family offices, banks and finance companies, insurance companies, hedge funds, foundations, pension plans and university endowments.
Loans facilitated through our lending marketplace are funded by the issuance of notes to our retail investors, the issuance of certificates or the sale of whole loans to institutional investors or invested in directly by the Company. To expand the Company’s investor base in 2017, the Company developed the capability to support the securitization of loans. The Company uses its own capital to purchase loans to facilitate this newly developed securitization capability, including sponsoring securitization transactions and facilitating CLUB Certificates transactions. The Company continues to execute securitizations in the first quarter of 2018 and we will continue to fund the purchase of loans for future securitizations and related risk retention requirements and for whole loan sales. Additionally, at our discretion we use our capital to fund the purchase of loans to support marketplace equilibrium when a matching third-party investor is not available at time of origination, test new product offerings or make accommodations to customers. In situations where we use our own capital to invest in loans, we earn interest income and record fair value adjustments for changes in actual and expected credit and prepayment performance.
We generate revenue primarily from transaction fees from our lending marketplace’s role in marketing to customers, accepting and decisioning applications for our bank partners to enable loan originations, investor fees that include servicing fees from investors for various services, including servicing and collection efforts and matching available loan assets with capital and management fees from investment funds and other managed accounts, gains on sales of whole loans sold, interest income earned net of interest expenses and fair value gains/losses from loans invested in by the Company and held on our balance sheet.
The transaction fees we receive from issuing banks in connection with our lending marketplace’s role in facilitating loan originations generally range from 0% to 6% of the initial principal amount of the loan. Alternatively, for education and patient finance loans, we collect fees from issuing banks and from the related education and patient service providers.
Investor fees paid to us vary based on investment channel. Note investors generally pay us a fee equal to 1% of payment amounts received from the borrower. Whole loan purchasers pay a monthly fee of up to 1.3% per annum, which is generally based on the month-end principal balance of loans serviced by us. Certificate holders generally
50
LENDINGCLUB CORPORATION
Management’s Discussion and Analysis of Financial Condition and Results of Operations
(Tabular Amounts in Thousands, Except Share and Per Share Data and Ratios, or as Noted)
pay a monthly fee of up to 1.2% per annum of the month-end balance of assets under management or the month-end balance of unpaid principal of the underlying Certificate. Investor fees may also vary based on the delinquency status of the loan.
Since beginning operations in 2007, our lending marketplace has facilitated $35.9 billion in loan originations. These loans were facilitated through the following investment channels: (i) the issuance of member payment dependent notes, (ii) the sale of trust certificates, (iii) the sale of whole loans (or interests backed by whole loans) either directly to qualified investors or indirectly through asset-backed securitization transactions, or (iv) invested in by the Company.
Current Economic and Business Environment
LendingClub monitors a variety of economic, credit and competitive indicators in connection with operating its online lending marketplace platform. Our online lending marketplace platform seeks to adapt to changing marketplace conditions, including evaluation of market and loan performance data to propose changes to credit policies or interest rates for the related issuing bank’s approval.
In the first quarter of 2018, our marketplace facilitated $2.3 billion of loan originations, of which $223 million were invested in through member payment dependent notes, $68 million were invested in through trust certificates, $1.2 billion were invested in through whole loan sales, and $793 million were invested in by the Company to support securitizations, loan sales and maintain marketplace equilibrium. Of the $793 million in loans invested in by the Company during the first quarter of 2018, $214.1 million, or 9% of the originations were owned by the Company as of March 31, 2018 compared to $871 million of loans invested in by the Company during the fourth quarter of 2017, of which $272.1 million, or 11%, were owned as of December 31, 2017. Loans held by the Company at quarter end are available loan inventory for future securitizations and loan sales.
During the second half of 2017 and continuing in the first quarter of 2018, market interest rates have risen which has increased certain of our investors’ cost of funding and expectations regarding return on investment. In the second quarter of 2018, interest rates will be increased on certain prime loans. In addition, the credit performance in certain higher risk prime loans has underperformed expectations. As a result, we have seen reduced demand for higher risk and longer duration prime loans. In the second quarter of 2018, a number of credit actions will be taken to reduce credit exposure on higher risk prime loans. In order to support marketplace equilibrium, we use our own capital to purchase loans or may offer loans at a discount as we evaluate changes to interest rates and credit policies.
For all loans invested in by the Company, we earn interest income that is offset by negative fair value adjustments for the passage of time and negative or positive adjustments for credit and prepayment performance. In addition, we earn a transaction fee when the loans are originated and any gains relating to servicing asset recognition or losses relating to discounts from the loans that are sold.
Factors That Can Affect Revenue
As an operator of a lending marketplace, we work to match supply of loans and demand from investors while also growing the overall volume of originations and correspondingly revenue at a pace commensurate with proper planning, compliance, risk management, user experience, and operational controls that work to optimize the quality of the customer experience, customer satisfaction and long term growth. In addition, we utilize our balance sheet to support our securitization and other structured financing initiatives, manage marketplace equilibrium, hold loans for testing new or existing loan products and repurchasing loans that did not meet an investor’s criteria. In some instances, we may subsequently sell those loans, recognizing a gain or loss on their sale.
51
LENDINGCLUB CORPORATION
Management’s Discussion and Analysis of Financial Condition and Results of Operations
(Tabular Amounts in Thousands, Except Share and Per Share Data and Ratios, or as Noted)
The interplay of the volume, timing and quality of loan applications, investment appetite, the impact of our holding certain loans on balance sheet, investor confidence in our data, controls and processes and available investment capital from investors, platform loan processing and originations, liquidity of securitization market, and the subsequent performance of loans (including credit performance and prepayment timing), which directly impacts our servicing fees and loan fair values, can affect our revenue in any particular period. These drivers collectively affect transaction fees, investor fees earned by us related to these transactions, interest income, fair value adjustments and other revenue related to loans held on balance sheet, including the performance of such loans. As these drivers can be affected by a variety of factors, both in and out of our control, revenues may fluctuate from period to period. Factors that can affect these drivers and ultimately revenue and its timing include:
• | market confidence in our data, controls, and processes, |
• | announcements and terms of resolution of governmental inquiries or private litigation, |
• | the mix of borrower products and corresponding transaction fees, |
• | availability or the timing of the deployment of investment capital by investors, |
• | the availability and amount of new capital from pooled investment vehicles and managed accounts that typically deploy their capital at the start of a period, |
• | the amount of purchase limitations we can impose on larger investors as a way to maintain investor balance and fairness, |
• | the attractiveness of alternative opportunities for borrowers or investors, through changes in interest rates, transaction fees, terms, or risk profile, |
• | the responsiveness of applicants to our marketing efforts, |
• | expenditures on marketing initiatives in a period, |
• | the sufficiency of operational staff to process any manual portion of the loan applications in a timely manner, |
• | the responsiveness of borrowers to satisfy additional income or employment verification requirements related to their application, |
• | borrower withdrawal rates, |
• | the percentage distribution of loans between the whole and fractional loan platforms, |
• | platform system performance, |
• | seasonality in demand for our platform and services, which is generally lower in the first and fourth quarters, |
• | determination to hold loans for purposes of subsequently distributing the loans through sale or securitization or other structured financing initiative, |
• | changes in the credit performance of our loans or market interest rates, |
• | the success of our models to predict borrower risk levels and attractiveness to investors, and |
• | other factors. |
At any point in time we have loan applications in various stages from initial application through issuance, as well as loans held on our balance sheet. Depending upon the timing and impact of the factors described above, loans may not be issued by the issuing banks who originate loans facilitated through our program in the same period in which the corresponding application was originally made, resulting in a portion of that subsequent period’s revenue being earned from loan applications that were initiated in the immediately prior period. Loans may also be held on balance sheet before being subsequently sold. Consistent with our revenue recognition accounting policy under GAAP, we do not recognize the transaction fee revenue associated with a loan until the loan is issued by the issuing bank and the proceeds are delivered to the borrower. Our transaction fees are generally paid by the issuing bank, or in the case of patient finance loans, by the participating medical service provider, and are accordingly independent of who is investing in a loan or how a loan is invested in.
52
LENDINGCLUB CORPORATION
Management’s Discussion and Analysis of Financial Condition and Results of Operations
(Tabular Amounts in Thousands, Except Share and Per Share Data and Ratios, or as Noted)
Key Operating and Financial Metrics
We regularly review several metrics to evaluate our business, measure our performance, identify trends, formulate financial projections and make strategic decisions. The following presents our key operating and financial metrics:
Three Months Ended | |||||||||||
March 31, 2018 | December 31, 2017 | March 31, 2017 | |||||||||
Loan originations | $ | 2,306,003 | $ | 2,438,267 | $ | 1,958,749 | |||||
Customer acquisition cost as a percent of loan originations (1) | 2.49 | % | 2.47 | % | 2.79 | % | |||||
Net revenue | $ | 151,667 | $ | 156,455 | $ | 124,482 | |||||
Consolidated net loss | $ | (31,180 | ) | $ | (92,098 | ) | $ | (29,844 | ) | ||
Contribution (2) | $ | 74,436 | $ | 75,351 | $ | 53,165 | |||||
Contribution margin (2) | 49.1 | % | 48.2 | % | 42.7 | % | |||||
Adjusted EBITDA (2) | $ | 15,333 | $ | 19,048 | $ | 161 | |||||
Adjusted EBITDA margin (2) | 10.1 | % | 12.2 | % | 0.1 | % | |||||
(1) | Represents sales and marketing expense as a percent of loan origination principal balances during each period presented. |
(2) | Contribution, Contribution Margin, Adjusted EBITDA and Adjusted EBITDA Margin are non-GAAP financial measures. For more information regarding these measures and a reconciliation of these measures to the most comparable GAAP measures, see “Non-GAAP Financial Measures” below. |
Loan Originations
We believe the volume of loans facilitated through our platform and originated by our issuing banks is a key indicator of the adoption rate of our lending marketplace, growth of our brand, scale of our business, strength of our network effect, economic competitiveness of our products and future growth.
Loan origination volume and weighted-average transactions fees (as a percent of origination balance) by its major loan products are as follows:
Three Months Ended | |||||||||||||||||
March 31, 2018 | December 31, 2017 | March 31, 2017 | |||||||||||||||
(in millions, except percentages) | Origination Volume | Weighted- Average Transaction Fee | Origination Volume | Weighted- Average Transaction Fee | Origination Volume | Weighted- Average Transaction Fee | |||||||||||
Personal loans - standard program | $ | 1,741.8 | 4.8 | % | $ | 1,817.4 | 4.9 | % | $ | 1,438.0 | 5.0 | % | |||||
Personal loans - custom program | 346.5 | 5.2 | 406.7 | 5.7 | 300.9 | 5.6 | |||||||||||
Total personal loans | 2,088.3 | 4.9 | 2,224.1 | 5.0 | 1,738.9 | 5.2 | |||||||||||
Other loans | 217.7 | 4.4 | 214.2 | 4.1 | 219.8 | 4.5 | |||||||||||
Total | $ | 2,306.0 | 4.8 | % | $ | 2,438.3 | 5.0 | % | $ | 1,958.7 | 5.0 | % | |||||
The weighted-average transaction fee for our standard program remained relatively flat in the first quarter of 2018 compared to the fourth quarter of 2017. The decline in the weighted-average transaction fee for our custom loan program in the first quarter of 2018 compared to the fourth quarter of 2017 was driven by growth in origination volume of loans with lower transaction fees.
53
LENDINGCLUB CORPORATION
Management’s Discussion and Analysis of Financial Condition and Results of Operations
(Tabular Amounts in Thousands, Except Share and Per Share Data and Ratios, or as Noted)
Personal loan origination volume for our standard loan program by loan grade were as follows:
Three Months Ended | |||||||||||||||||
(in millions) | March 31, 2018 | December 31, 2017 | March 31, 2017 | ||||||||||||||
Personal loan originations by loan grade – standard loan program: | Amount | % of Total | Amount | % of Total | Amount | % of Total | |||||||||||
A | $ | 414.6 | 24 | % | $ | 364.7 | 20 | % | $ | 210.3 | 15 | % | |||||
B | 524.5 | 30 | % | 555.3 | 30 | % | 380.3 | 26 | % | ||||||||
C | 474.8 | 27 | % | 504.4 | 28 | % | 522.5 | 36 | % | ||||||||
D | 248.0 | 14 | % | 278.3 | 15 | % | 194.2 | 14 | % | ||||||||
E | 63.3 | 4 | % | 79.6 | 5 | % | 87.6 | 6 | % | ||||||||
F | 14.0 | 1 | % | 24.6 | 1 | % | 32.6 | 2 | % | ||||||||
G | 2.6 | — | % | 10.5 | 1 | % | 10.5 | 1 | % | ||||||||
Total personal loan originations – standard loan program | $ | 1,741.8 | 100 | % | $ | 1,817.4 | 100 | % | $ | 1,438.0 | 100 | % | |||||
During 2017 and into the first quarter of 2018, the Company saw a shift in the mix of personal loan origination volume from higher risk grades, particularly grades C through G, to lower risk A and B grades. Credit and pricing policy changes the Company made beginning in 2016 through early 2018 resulted in this shift in concentration. These changes broadly focused on tightening credit in our riskiest populations to shift overall platform mix towards higher credit quality borrowers.
Loans Serviced On Our Platform
The following table provides the outstanding principal balance of loans serviced at the end of the periods indicated, by the method in which the loans were financed (in millions):
March 31, 2018 | December 31, 2017 | |||||||
Notes | $ | 1,518 | $ | 1,608 | ||||
Certificates | 1,125 | 1,291 | ||||||
Secured borrowings | 187 | 243 | ||||||
Whole loans sold | 8,571 | 8,178 | ||||||
Total excluding loans invested in by the Company | $ | 11,401 | $ | 11,320 | ||||
Loans invested in by the Company | 581 | 593 | ||||||
Total loans serviced | $ | 11,982 | $ | 11,913 | ||||
54
LENDINGCLUB CORPORATION
Management’s Discussion and Analysis of Financial Condition and Results of Operations
(Tabular Amounts in Thousands, Except Share and Per Share Data and Ratios, or as Noted)
Results of Operations
The following table sets forth the condensed consolidated statements of operations data for each of the periods presented:
Three Months Ended | Change (%) | ||||||||||||||||
March 31, 2018 | December 31, 2017 | March 31, 2017 | Q1 2018 vs Q1 2017 | Q1 2018 vs Q4 2017 | |||||||||||||
Net revenue: | |||||||||||||||||
Transaction fees | $ | 111,182 | $ | 120,697 | $ | 98,692 | 13 | % | (8 | )% | |||||||
Investor fees | 27,895 | 24,313 | 21,180 | 32 | % | 15 | % | ||||||||||
Gain on sales of loans (1) | 12,671 | 10,353 | 1,892 | N/M | 22 | % | |||||||||||
Other revenue (1) | 1,457 | 1,366 | 1,746 | (17 | )% | 7 | % | ||||||||||
Net interest income and fair value adjustments: | |||||||||||||||||
Interest income | 138,018 | 141,471 | 160,996 | (14 | )% | (2 | )% | ||||||||||
Interest expense | (110,843 | ) | (122,796 | ) | (158,607 | ) | (30 | )% | (10 | )% | |||||||
Net fair value adjustments (1) | (28,713 | ) | (18,949 | ) | (1,417 | ) | N/M | 52 | % | ||||||||
Net interest income and fair value adjustments (1) | (1,538 | ) | (274 | ) | 972 | N/M | N/M | ||||||||||
Total net revenue | 151,667 | 156,455 | 124,482 | 22 | % | (3 | )% | ||||||||||
Operating expenses: (2) | |||||||||||||||||
Sales and marketing | 57,517 | 60,130 | 54,583 | 5 | % | (4 | )% | ||||||||||
Origination and servicing | 22,645 | 23,847 | 20,449 | 11 | % | (5 | )% | ||||||||||
Engineering and product development | 36,837 | 37,926 | 35,760 | 3 | % | (3 | )% | ||||||||||
Other general and administrative | 52,309 | 48,689 | 43,574 | 20 | % | 7 | % | ||||||||||
Class action settlement and regulatory litigation expense | 13,500 | 77,250 | — | N/M | (83 | )% | |||||||||||
Total operating expenses | 182,808 | 247,842 | 154,366 | 18 | % | (26 | )% | ||||||||||
Loss before income tax expense | (31,141 | ) | (91,387 | ) | (29,884 | ) | 4 | % | (66 | )% | |||||||
Income tax expense (benefit) | 39 | 711 | (40 | ) | 198 | % | (95 | )% | |||||||||
Consolidated net loss | $ | (31,180 | ) | $ | (92,098 | ) | $ | (29,844 | ) | 4 | % | (66 | )% | ||||
Less: Income (Loss) attributable to noncontrolling interests | 1 | (91 | ) | — | N/M | (101 | )% | ||||||||||
LendingClub net loss | $ | (31,181 | ) | $ | (92,007 | ) | $ | (29,844 | ) | 4 | % | (66 | )% | ||||
N/M – Not meaningful (1) Prior period amounts have been reclassified to conform to the current period presentation. See “Part I – Financial Information – Item 1 – Financial Statements – Notes to Condensed Consolidated Financial Statements – Note 1. Basis of Presentation” for additional information. | |||||||||||||||||
55
LENDINGCLUB CORPORATION
Management’s Discussion and Analysis of Financial Condition and Results of Operations
(Tabular Amounts in Thousands, Except Share and Per Share Data and Ratios, or as Noted)
(2) Includes stock-based compensation expense as follows: | |||||||||||||||||
Three Months Ended | Change (%) | ||||||||||||||||
March 31, 2018 | December 31, 2017 | March 31, 2017 | Q1 2018 vs Q1 2017 | Q1 2018 vs Q4 2017 | |||||||||||||
Sales and marketing | $ | 1,860 | $ | 1,797 | $ | 2,299 | (19 | )% | 4 | % | |||||||
Origination and servicing | 1,072 | 985 | 1,416 | (24 | )% | 9 | % | ||||||||||
Engineering and product development | 5,279 | 5,046 | 6,588 | (20 | )% | 5 | % | ||||||||||
Other general and administrative | 9,590 | 8,463 | 9,195 | 4 | % | 13 | % | ||||||||||
Total stock-based compensation expense | $ | 17,801 | $ | 16,291 | $ | 19,498 | (9 | )% | 9 | % | |||||||
Total Net Revenue
Three Months Ended | Change (%) | ||||||||||||||||
March 31, 2018 | December 31, 2017 | March 31, 2017 | Q1 2018 vs Q1 2017 | Q1 2018 vs Q4 2017 | |||||||||||||
Net revenue: | |||||||||||||||||
Transaction fees | $ | 111,182 | $ | 120,697 | $ | 98,692 | 13 | % | (8 | )% | |||||||
Investor fees | 27,895 | 24,313 | 21,180 | 32 | % | 15 | % | ||||||||||
Gain on sales of loans (1) | 12,671 | 10,353 | 1,892 | N/M | 22 | % | |||||||||||
Other revenue (1) | 1,457 | 1,366 | 1,746 | (17 | )% | 7 | % | ||||||||||
Net interest income and fair value adjustments: | |||||||||||||||||
Interest income | 138,018 | 141,471 | 160,996 | (14 | )% | (2 | )% | ||||||||||
Interest expense | (110,843 | ) | (122,796 | ) | (158,607 | ) | (30 | )% | (10 | )% | |||||||
Net fair value adjustments (1) | (28,713 | ) | (18,949 | ) | (1,417 | ) | N/M | 52 | % | ||||||||
Net interest income and fair value adjustments (1) | (1,538 | ) | (274 | ) | 972 | N/M | N/M | ||||||||||
Total net revenue | $ | 151,667 | $ | 156,455 | $ | 124,482 | 22 | % | (3 | )% | |||||||
N/M – Not meaningful
(1) | Prior period amounts have been reclassified to conform to the current period presentation. See “Part I – Financial Information – Item 1 – Financial Statements – Notes to Condensed Consolidated Financial Statements – Note 1. Basis of Presentation” for additional information. |
The analysis below is presented for the following periods: First quarter of 2018 compared to the first quarter of 2017 (Quarter Over Quarter) and first quarter of 2018 compared to the fourth quarter of 2017 (Sequential).
Transaction Fees
Transaction fees are fees paid by issuing banks or education and patient service providers to us for the work we perform through our marketplace’s role in facilitating the origination of loans by our issuing bank partners. The amount of these fees is based upon the terms of the loan, including grade, rate, term and other factors. As of March 31, 2018, these fees generally ranged from 0% to 6% of the initial principal amount of a loan. In addition, for education and patient finance loans, we also collect fees earned from issuing banks and education and patient
56
LENDINGCLUB CORPORATION
Management’s Discussion and Analysis of Financial Condition and Results of Operations
(Tabular Amounts in Thousands, Except Share and Per Share Data and Ratios, or as Noted)
service providers. With respect to loans for which WebBank acts as the issuing bank, we record transaction fee revenue net of program fees paid to WebBank.
Transaction fees were $111.2 million and $98.7 million for the first quarters of 2018 and 2017, respectively, an increase of 13%. The increase was primarily due to higher origination volume, partially offset by a lower weighted-average transaction fee in the first quarter of 2018 compared to the first quarter of 2017.
Transaction fees were $111.2 million and $120.7 million for the first quarter of 2018 and fourth quarter of 2017, respectively, a decrease of 8%. The decrease was primarily due to lower origination volume in the first quarter of 2018 compared to the fourth quarter of 2017.
In April 2018, we recognized approximately $5.7 million in transaction fee revenue associated with the issuance of loans in which the loan application process had commenced prior to the end of the first quarter of 2018. In April 2017, we recognized approximately $5.7 million in transaction fee revenue associated with the issuance of loans in which the loan application process had commenced prior to the end of the first quarter of 2017.
Investor Fees
The table below illustrates the composition of investor fees by investment channel for each period presented:
Three Months Ended | Change (%) | ||||||||||||||||
March 31, 2018 | December 31, 2017 | March 31, 2017 | Q1 2018 vs Q1 2017 | Q1 2018 vs Q4 2017 | |||||||||||||
Investor fees – whole loans sold | $ | 19,235 | $ | 15,331 | $ | 12,210 | 58 | % | 25 | % | |||||||
Investor fees – notes, certificates, secured borrowings, and self-directed accounts | 8,619 | 8,923 | 7,812 | 10 | % | (3 | )% | ||||||||||
Investor fees – Funds and separately managed accounts (1) | 41 | 59 | 1,158 | (96 | )% | (31 | )% | ||||||||||
Total investor fees | $ | 27,895 | $ | 24,313 | $ | 21,180 | 32 | % | 15 | % | |||||||
(1) | Funds are the private funds for which LCAM or its subsidiaries act as general partner. |
For each investment channel, the Company receives fees to compensate us for the costs we incur in servicing the related loan, including managing payments from borrowers, collections, payments to investors, maintaining investors’ account portfolios, and providing information and issuing monthly statements. The amount of investor fee revenue earned is predominantly affected by the various servicing rates paid by whole loan, note, self-directed investors, and certain certificate investors, the outstanding principal balance of whole loans and loans underlying notes, certificates, and secured borrowings serviced, and the amount of principal and interest collected from borrowers and remitted to whole loan, note, self-directed, and certain certificate investors. Additionally, the investor fees earned from the funds and separately managed accounts compensate us for the management and advisory services we provide related to the investment portfolios of these investors.
Investor fee revenue related to whole loans sold also includes the change in fair value of our servicing assets and liabilities associated with the loans. Servicing rights are recorded as either an asset or liability depending on the degree to which the contractual loan servicing fee is above or below, respectively, an estimated market rate loan servicing fee. The change in fair value of servicing rights does not affect the contractual fees that we collect monthly from the whole loan investors.
57
LENDINGCLUB CORPORATION
Management’s Discussion and Analysis of Financial Condition and Results of Operations
(Tabular Amounts in Thousands, Except Share and Per Share Data and Ratios, or as Noted)
Investor fees – whole loans sold: Investor fee revenue related to the servicing of whole loans sold was $19.2 million and $12.2 million for the first quarters of 2018 and 2017, respectively, an increase of 58%. The increase in revenue was due to a higher balance of whole loans serviced and an increase in contractual servicing fees, an increase in collection fees and charged-off loan sales in the first quarter of 2018 compared to the first quarter of 2017, partially offset by an increase in the change in fair value of servicing rights of $(2.0) million in the first quarter of 2018. Investor fee revenue related to the servicing of whole loans sold was $19.2 million and $15.3 million for the first quarter of 2018 and fourth quarter of 2017, respectively, an increase of 25%. The increase in revenue was due to a higher balance of whole loans serviced and the impact to the fair value of the servicing asset due to an increase in collection fees and charged-off loan sales in the first quarter of 2018 compared to the fourth quarter of 2017.
Investor fees – notes, certificates, secured borrowings, and self-directed: Investor fee revenue related to the servicing of loans underlying notes, certificates, secured borrowings, and self-directed accounts was $8.6 million and $7.8 million for the first quarters of 2018 and 2017, respectively, an increase of 10%. The increase in revenue was due to an increase in collection fees and charged-off loan sales in the first quarter of 2018 compared to the first quarter of 2017, partially offset by a decrease in self-directed fees. Investor fee revenue related to the servicing of loans underlying notes, certificates, secured borrowings, and self-directed accounts was $8.6 million and $8.9 million for the first quarter of 2018 and fourth quarter of 2017, respectively.
Investor fees – Funds and separately managed accounts: Investor fee revenue related to the funds and separately managed accounts was $41 thousand and $1.2 million for the first quarters of 2018 and 2017, respectively, a decrease of 96%. This decrease was primarily due to a decrease in the average assets underlying the funds as a result of the redemption requests and fund dissolutions discussed in the Company’s Annual Report. Investor fee revenue related to the funds and separately managed accounts was $41 thousand and $59 thousand for the first quarter of 2018 and fourth quarter of 2017, respectively.
Gain (Loss) on Sales of Loans
In connection with loan sales, in addition to investor fees earned with respect to the corresponding loan, we recognize a gain or loss on the sale of that loan based on the level to which the contractual loan servicing fee is above or below an estimated market rate loan servicing fee. Additionally, we recognize a gain or loss on sale of loans contributed to Company-sponsored securitization transactions and CLUB Certificate transactions related to program fees, net of transaction costs.
Gain on sales of loans was $12.7 million and $1.9 million for the first quarters of 2018 and 2017, respectively. This increase for the first quarter of 2018 compared to the same period in 2017 was primarily due to net gains on sales of loans related to the Company’s self-sponsored securitization transactions and CLUB Certificate program, an increase in the volume of loans sold and an increase in the contractual servicing fee, which resulted in a gain during the first quarter of 2018 compared to the first quarter of 2017. Additionally, the increase in the gain on sales of loans was a result of a $3.2 million reimbursement to an investor pursuant to a credit support agreement in the first quarter of 2017.
Gain on sales of loans was $12.7 million and $10.4 million for the first quarter of 2018 and fourth quarter of 2017, respectively. This increase for the first quarter of 2018 compared to the fourth quarter of 2017 was primarily due to net gains on sales of loans related to the Company’s self-sponsored securitization transaction and CLUB Certificate program and an increase in the volume of loans sold.
58
LENDINGCLUB CORPORATION
Management’s Discussion and Analysis of Financial Condition and Results of Operations
(Tabular Amounts in Thousands, Except Share and Per Share Data and Ratios, or as Noted)
Other Revenue
Other revenue primarily consists of referral fee revenue that relates to fees earned from third-party companies when customers referred by us complete specified actions with such third-party companies, and commission for facilitating the transfer of whole loans and related certificate redemption between third-party investors.
The table below illustrates the composition of other revenue for each period presented:
Three Months Ended | Change (%) | |||||||||||||||||
March 31, 2018 | December 31, 2017 | March 31, 2017 | Q1 2018 vs Q1 2017 | Q1 2018 vs Q4 2017 | ||||||||||||||
Referral fee revenue | 836 | 897 | 1,406 | (41 | )% | (7 | )% | |||||||||||
Other | 621 | 469 | 340 | 83 | % | 32 | % | |||||||||||
Other revenue (1) | $ | 1,457 | $ | 1,366 | $ | 1,746 | (17 | )% | 7 | % | ||||||||
N/M – Not meaningful
(1) | Prior period amounts have been reclassified to conform to the current period presentation. See “Part I – Financial Information – Item 1 – Financial Statements – Notes to Condensed Consolidated Financial Statements – Note 1. Basis of Presentation” for additional information. |
Net Interest Income and Fair Value Adjustments
Net Interest Income and Fair Value Adjustments on Loans Invested in by the Company: In the third quarter of 2017, the Company began to invest in loans to support structured programs including securitizations and whole loan sale initiatives. We assume principal and interest rate risk on loans we invest in using our own capital. We may issue debt to finance the purchase of these loans with the associated interest expense reducing net interest income. Fair value adjustments on loans invested in by the Company are generally negative due to interest cash flow receipts and if there are expected increases and any acceleration in the timing of expected charge-offs. As we expand the use of our own capital to invest in loans for strategic business purposes, we expect the net negative fair value adjustments on loans to increase. However, we anticipate these fair value adjustments will generally be offset by the interest income earned from holding such loans.
The following table summarizes net interest income and fair value adjustments on loans invested in by the Company, available-for-sale securities and cash and cash equivalents:
Three Months Ended | Change (%) | |||||||||||||||
March 31, 2018 | December 31, 2017 | March 31, 2017 | Q1 2018 vs Q1 2017 | Q1 2018 vs Q4 2017 | ||||||||||||
Interest income | $ | 32,682 | $ | 21,250 | $ | 2,389 | N/M | 54 | % | |||||||
Interest expense | (5,507 | ) | (2,575 | ) | — | N/M | 114 | % | ||||||||
Net fair value adjustments | (28,713 | ) | (18,949 | ) | (1,417 | ) | N/M | 52 | % | |||||||
Net interest income and fair value adjustments | $ | (1,538 | ) | $ | (274 | ) | $ | 972 | N/M | N/M | ||||||
N/M – Not meaningful
Interest income associated with loans invested in by the Company was $32.7 million and $2.4 million for the first quarters of 2018 and 2017, respectively. The increase in interest income was primarily due to the increase in the average outstanding balances of loans invested in by the Company during the first quarter of 2018 to support
59
LENDINGCLUB CORPORATION
Management’s Discussion and Analysis of Financial Condition and Results of Operations
(Tabular Amounts in Thousands, Except Share and Per Share Data and Ratios, or as Noted)
Company-sponsored securitization transactions and whole loan sales. Interest income was $32.7 million and $21.3 million for the first quarter of 2018 and fourth quarter of 2017, respectively, an increase of 54%. The increase in interest income was primarily due to the increase in the average outstanding balances of loans invested in by the Company during the first quarter of 2018 to support Company-sponsored securitization transactions and whole loan sales. Interest income also includes interest earned on cash and cash equivalents and our securities available for sale portfolio.
Interest expense associated with loans invested in by the Company was $5.5 million for the first quarter of 2018. There was no interest expense for the first quarter of 2017. Interest expense in the first quarter of 2018 resulted from the use of securitization notes and revolving credit facilities to finance loans held for investment and held for sale by the Company, respectively. Interest expense was $5.5 million and $2.6 million for the first quarter of 2018 and fourth quarter of 2017, respectively, an increase of 114% due to the increase in average outstanding balances of securitization notes.
Net fair value adjustments were $(28.7) million and $(1.4) million for the first quarters of 2018 and 2017, respectively. The increase in net fair value adjustments was primarily due to negative fair value adjustments on loans invested in by the Company, as well as $1.3 million in other-than-temporary impairment charges during the first quarter of 2018 on subordinated residual certificates held as a result of Company-sponsored securitization transactions. Net fair value adjustments were $(28.7) million and $(18.9) million for the first quarter of 2018 and fourth quarter of 2017, respectively, an increase of 52%. The increase in net fair value adjustments was primarily due to negative adjustments on loans invested in by the Company during the first quarter of 2018 due to increases in the estimated yields required by investors to purchase our loans and an increase in expected credit losses.
Net Interest Income and Fair Value Adjustments on Loans, Notes, Certificates and Secured Borrowings: We do not assume principal or interest rate risk on loans facilitated through our lending marketplace that are funded by notes, certificates and certain secured borrowings because loan balances, interest rates and maturities are matched and offset by an equal balance of notes, certificates or secured borrowings with the exact same interest rates and maturities. The changes in fair value of loans, notes, certificates and secured borrowings are shown on our Condensed Consolidated Statements of Operations on a net basis. Due to the payment dependent feature of the notes, certificates and secured borrowings, fair value adjustments on loans funded with notes, certificates and secured borrowings result in no net effect on our earnings.
60
LENDINGCLUB CORPORATION
Management’s Discussion and Analysis of Financial Condition and Results of Operations
(Tabular Amounts in Thousands, Except Share and Per Share Data and Ratios, or as Noted)
The following table provides additional detail related to net interest income:
Three Months Ended | Change (%) | |||||||||||||||||
March 31, 2018 | December 31, 2017 | March 31, 2017 | Q1 2018 vs Q1 2017 | Q1 2018 vs Q4 2017 | ||||||||||||||
Interest income: | ||||||||||||||||||
Loans held for investment at fair value | $ | 105,336 | $ | 120,221 | $ | 158,607 | (34 | )% | (12 | )% | ||||||||
Loans held for investment and held for sale by the Company at fair value | 30,708 | 19,556 | 881 | N/M | 57 | % | ||||||||||||
Securities available for sale | 1,225 | 1,016 | 940 | 30 | % | 21 | % | |||||||||||
Cash and cash equivalents | 749 | 678 | 568 | 32 | % | 10 | % | |||||||||||
Total interest income | 138,018 | 141,471 | 160,996 | (14 | )% | (2 | )% | |||||||||||
Interest expense: | ||||||||||||||||||
Revolving credit facilities | (3,175 | ) | (1,900 | ) | — | N/M | 67 | % | ||||||||||
Securitization notes | (2,332 | ) | (675 | ) | — | N/M | N/M | |||||||||||
Notes, certificates and secured borrowings | (105,336 | ) | (120,221 | ) | (158,607 | ) | (34 | %) | (12 | )% | ||||||||
Total interest expense | (110,843 | ) | (122,796 | ) | (158,607 | ) | (30 | %) | (10 | )% | ||||||||
Net interest income | $ | 27,175 | $ | 18,675 | $ | 2,389 | N/M | 46 | % | |||||||||
Average outstanding balances: | ||||||||||||||||||
Loans held for investment | $ | 2,988,625 | $ | 3,365,259 | $ | 4,375,884 | (32 | )% | (11 | )% | ||||||||
Loans held for investment by the Company | $ | 354,695 | $ | 101,145 | $ | 17,177 | N/M | N/M | ||||||||||
Loans held for sale by the Company | $ | 327,859 | $ | 341,686 | $ | 8,122 | N/M | (4 | )% | |||||||||
Notes, certificates and secured borrowings | $ | 3,012,660 | $ | 3,411,349 | $ | 4,410,812 | (32 | )% | (12 | )% | ||||||||
Revolving credit facilities | $ | 95,025 | $ | 104,025 | $ | — | N/M | (9 | )% | |||||||||
Securitization notes | $ | 297,783 | $ | 78,031 | $ | — | N/M | N/M | ||||||||||
N/M – Not meaningful
Interest income from loans held for investment was $105.3 million and $158.6 million for the first quarters of 2018 and 2017, respectively, a decrease of 34%. The decrease in interest income was primarily due to a decrease in the average outstanding balance of loans held for investment due to a larger portion of loans originated being sold to whole loan investors and structured program transactions.
Interest income from loans held for investment was $105.3 million and $120.2 million for the first quarter of 2018 and fourth quarter of 2017, respectively, a decrease of 12%. The decrease in interest income was primarily due to a decrease in the average outstanding balance of loans held for investment due to a larger portion of loans originated being sold to whole loan investors and structured program transactions.
Interest expense for notes, certificates and secured borrowings was $105.3 million and $158.6 million for the first quarters of 2018 and 2017, respectively, a decrease of 34%. The decrease in interest expense was primarily due to a decrease in the average outstanding balances of notes, certificates and secured borrowings, driven by a larger portion of loans originated being sold to whole loan investors and structured program transactions.
61
LENDINGCLUB CORPORATION
Management’s Discussion and Analysis of Financial Condition and Results of Operations
(Tabular Amounts in Thousands, Except Share and Per Share Data and Ratios, or as Noted)
Interest expense for notes, certificates and secured borrowings was $105.3 million and $120.2 million for the first quarter of 2018 and fourth quarter of 2017, respectively, a decrease of 12%. The decrease in interest expense was primarily due to a decrease in the average outstanding balances of notes, certificates and secured borrowings, driven by a larger portion of loans originated being sold to whole loan investors and structured program transactions.
Operating Expenses
Our operating expenses consist of sales and marketing, origination and servicing, engineering and product development and other general and administrative expenses as described below.
Sales and Marketing: Sales and marketing expense consists primarily of borrower and investor acquisition efforts, including costs attributable to marketing and selling the loans facilitated through the platform we operate. This includes costs of building general brand awareness, and salaries, benefits and stock-based compensation expense related to our sales and marketing team.
Origination and Servicing: Origination and servicing expense consists of salaries, benefits and stock-based compensation expense and vendor costs attributable to activities that most directly relate to facilitating the origination of loans and servicing loans for borrowers and investors. These costs relate to the credit, collections, customer support and payment processing teams and related vendors.
Engineering and Product Development: Engineering and product development expense consists primarily of salaries, benefits and stock-based compensation expense for engineering and product management teams, and the cost of contractors who work on the development and maintenance of our platform. Engineering and product development expense also includes non-capitalized hardware and software costs and depreciation and amortization of technology assets.
Other General and Administrative: Other general and administrative expense consists primarily of salaries, benefits and stock-based compensation expense for our accounting, finance, legal, risk, compliance, human resources and facilities teams, professional services fees and facilities expense.
After announcing the findings of the internal board review, and the significant decrease in the trading price of our common stock in May 2016, we offered incentive retention awards to certain members of the executive management team and other key personnel that totaled $34.9 million that were recognized as compensation expense ratably through May 2017. In addition, we have incurred and expect to continue to incur significant legal and other expenses in connection with the inquiries and private litigation that have arisen and may continue to arise from the internal board review, and our response to ongoing governmental requests for information.
62
LENDINGCLUB CORPORATION
Management’s Discussion and Analysis of Financial Condition and Results of Operations
(Tabular Amounts in Thousands, Except Share and Per Share Data and Ratios, or as Noted)
Three Months Ended | Change (%) | ||||||||||||||||
March 31, 2018 | December 31, 2017 | March 31, 2017 | Q1 2018 vs Q1 2017 | Q1 2018 vs Q4 2017 | |||||||||||||
Sales and marketing | $ | 57,517 | $ | 60,130 | $ | 54,583 | 5 | % | (4 | )% | |||||||
Origination and servicing | 22,645 | 23,847 | 20,449 | 11 | % | (5 | )% | ||||||||||
Engineering and product development | 36,837 | 37,926 | 35,760 | 3 | % | (3 | )% | ||||||||||
Other general and administrative | 52,309 | 48,689 | 43,574 | 20 | % | 7 | % | ||||||||||
Class action settlement and regulatory litigation expense | 13,500 | 77,250 | — | — | % | (83 | )% | ||||||||||
Total operating expenses | $ | 182,808 | $ | 247,842 | $ | 154,366 | 18 | % | (26 | )% | |||||||
Sales and marketing: Sales and marketing expense was $57.5 million and $54.6 million for the first quarters of 2018 and 2017, respectively, an increase of 5%. The increase was primarily due to a $2.6 million increase in variable marketing expenses driven by higher loan origination volume. Sales and marketing expense as a percent of loan originations was 2.5% in the first quarter of 2018 compared to 2.8% in the first quarter of 2017.
On a sequential basis, sales and marketing expense was $57.5 million and $60.1 million for the first quarter of 2018 and fourth quarter of 2017, respectively, a decrease of 4%. The decrease was primarily due to a $4.2 million decrease in variable marketing expenses driven by lower loan origination volume, partially offset by a $0.7 million increase in personnel-related costs. Sales and marketing expense as a percent of loan originations was 2.5% in both the first quarter of 2018 and the fourth quarter of 2017.
Origination and servicing: Origination and servicing expense was $22.6 million and $20.4 million for the first quarters of 2018 and 2017, respectively, an increase of 11%. The increase was primarily due to a $1.8 million increase in personnel-related expenses associated with higher headcount levels and a $1.2 million increase in loan processing costs driven by increased collection efforts, both resulting from higher loan origination volume and loans serviced.
On a sequential basis, origination and servicing expense was $22.6 million and $23.8 million for the first quarter of 2018 and fourth quarter of 2017, respectively, a decrease of 5%. The decrease was primarily due to a $0.5 million decrease in loan processing costs driven by lower origination volume in the first quarter of 2018 compared to the fourth quarter of 2017.
Engineering and product development: Engineering and product development expense was $36.8 million and $35.8 million for the first quarters of 2018 and 2017, respectively, an increase of 3%. The increase was primarily driven by continued investment in technology and platform improvements that are focused on enhancing our credit decisioning capabilities, internal testing environment and cloud infrastructure, which included a $2.9 million increase in equipment, software and depreciation expense, partially offset by a $2.0 million decrease in personnel-related expenses primarily associated with retention costs incurred in the first quarter of 2017.
We capitalized $12.8 million and $11.4 million in software development costs in the first quarters of 2018 and 2017, respectively.
On a sequential basis, engineering and product development expense was $36.8 million and $37.9 million for the first quarter of 2018 and fourth quarter of 2017, respectively, a decrease of 3%. The decrease was primarily due to a $1.7 million decrease in depreciation expense associated with internally developed software, partially offset by a $0.7 million increase in personnel-related costs.
63
LENDINGCLUB CORPORATION
Management’s Discussion and Analysis of Financial Condition and Results of Operations
(Tabular Amounts in Thousands, Except Share and Per Share Data and Ratios, or as Noted)
Other general and administrative expense: Other general and administrative expense was $52.3 million and $43.6 million for the first quarters of 2018 and 2017, respectively, an increase of 20%. The increase was primarily due to a $9.6 million insurance reimbursement in the first quarter of 2017 compared to a $2.8 million insurance reimbursement in the first quarter of 2018 for certain legal expenses incurred as a result of the Company’s board review and related governmental and regulatory inquiries. Additionally, the increase was due to a $3.1 million increase in personnel-related costs in the first quarter of 2018.
On a sequential basis, other general and administrative expense was $52.3 million and $48.7 million for the first quarter of 2018 and fourth quarter of 2017, respectively, an increase of 7%. The increase was due to a $2.6 million increase in personnel-related costs in the first quarter of 2018, partially offset by a $4.2 million decrease in legal, audit, communications, and advisory fees associated with the board review, government inquiries, supporting investor due diligence activities, remediation efforts and pending and potential future litigation matters. Additionally, the increase was due to a $9.2 million insurance reimbursement in the fourth quarter of 2017 compared to a $2.8 million insurance reimbursement in the first quarter of 2018 for certain legal expenses incurred as a result of the Company’s board review and related governmental and regulatory inquiries.
Class Action Settlement and Regulatory Litigation Expense
Regulatory litigation expense for the three months ended March 31, 2018 was $13.5 million related to ongoing governmental and regulatory investigations following the Company’s 2016 Board Review. On February 19, 2018, we reached a preliminary settlement, subject to court approval, to resolve the previously disclosed class action lawsuits in federal and California state courts arising out of legacy matters as disclosed in the 2016 Board Review. Class action settlement expense for the three months ended December 31, 2017 was $77.25 million, which includes $125.0 million for the agreement between the parties, offset by $47.75 million that will be covered by insurance. See “Part I – Financial Information – Item 1 – Financial Statements – Notes to Condensed Consolidated Financial Statements – Note 17. Commitments and Contingencies” for additional information.
Goodwill Impairment
We have one reporting unit for goodwill impairment testing purposes, the patient and education finance (PEF) reporting unit. We perform a quantitative annual test for impairment on April 1. There were no goodwill impairment expenses recorded for the first quarters of 2018 and 2017 related to the PEF reporting unit.
Income Taxes
We continued to recognize a full valuation allowance against net deferred tax assets. This determination was based on the assessment of the available positive and negative evidence to estimate if sufficient future taxable income will be generated to utilize the existing deferred tax assets.
Non-GAAP Financial Measures
We use certain non-GAAP financial measures in evaluating our operating results. We believe that contribution, contribution margin, adjusted EBITDA, adjusted EBITDA margin, and investor fees before changes in fair value of servicing assets and servicing liabilities help identify trends in our core business results and allow for greater transparency with respect to key metrics used by our management in its decision making.
Our non-GAAP measures of contribution, contribution margin, adjusted EBITDA, adjusted EBITDA margin, and investor fees before changes in fair value of assets and liabilities have limitations as analytical tools and you should not consider them in isolation. These non-GAAP measures should not be viewed as substitutes for, or superior to, net income (loss) as prepared in accordance with GAAP. In evaluating these non-GAAP measures, you should be
64
LENDINGCLUB CORPORATION
Management’s Discussion and Analysis of Financial Condition and Results of Operations
(Tabular Amounts in Thousands, Except Share and Per Share Data and Ratios, or as Noted)
aware that in the future we will incur expenses similar to the adjustments in this presentation. There are a number of limitations related to the use of these non-GAAP financial measures versus their most directly comparable GAAP measures, which include the following:
• | Other companies, including companies in our industry, may calculate these measures differently, which may reduce their usefulness as a comparative measure. |
• | These measures do not consider the potentially dilutive impact of stock-based compensation. |
• | Although depreciation and amortization are non-cash charges, the assets being depreciated and amortized may have to be replaced in the future and adjusted EBITDA and adjusted EBITDA margin do not reflect cash capital expenditure requirements for such replacements or for new capital expenditure requirements. |
• | Adjusted EBITDA and adjusted EBITDA margin do not reflect tax payments that may represent a reduction in cash available to us. |
Contribution and Contribution Margin
Contribution is a non-GAAP financial measure that is calculated as net revenue less “sales and marketing” and “origination and servicing” expenses on the Company’s Statement of Operations, adjusted to exclude non-cash stock-based compensation expense within these captions and (income) loss attributable to noncontrolling interests. These costs represent the costs that are most directly related to generating such revenue. Contribution Margin is a non-GAAP financial measure calculated by dividing Contribution by total net revenue.
Contribution and Contribution Margin are measures of overall direct product profitability that our management and board of directors find useful, in understanding the relationship between costs most directly associated with revenue generating activities and the related revenue, and remaining amount available to support our costs of engineering and product development and other general and administrative expense to evaluate our operating performance and trends. While we believe Contribution and Contribution Margin are useful for the reasons above, they are not an overall measure of our profitability, as they exclude engineering and product development and other general and administrative expenses that are required to run our business. Factors that affect our Contribution and Contribution Margin include revenue mix, variable marketing expenses and origination and servicing expenses.
The following table shows the calculation of contribution and contribution margin:
Three Months Ended | |||||||||||
March 31, 2018 | December 31, 2017 | March 31, 2017 | |||||||||
Total net revenue | $ | 151,667 | $ | 156,455 | $ | 124,482 | |||||
Less: Sales and marketing expense | 57,517 | 60,130 | 54,583 | ||||||||
Less: Origination and servicing expense | 22,645 | 23,847 | 20,449 | ||||||||
Total direct expenses | $ | 80,162 | $ | 83,977 | $ | 75,032 | |||||
Add: Stock-based compensation (1) | 2,932 | 2,782 | 3,715 | ||||||||
Add: (Income) Loss attributable to noncontrolling interests | (1 | ) | 91 | — | |||||||
Contribution (2) | $ | 74,436 | $ | 75,351 | $ | 53,165 | |||||
Contribution margin (2) | 49.1 | % | 48.2 | % | 42.7 | % | |||||
(1) | Contribution excludes stock-based compensation expense included in the “Sales and marketing” and “Origination and servicing” expense categories. |
(2) | Beginning in the third quarter of 2017, contribution excludes (income) loss attributable to noncontrolling interests. Prior period amounts have been reclassified to conform to the current period presentation. |
65
LENDINGCLUB CORPORATION
Management’s Discussion and Analysis of Financial Condition and Results of Operations
(Tabular Amounts in Thousands, Except Share and Per Share Data and Ratios, or as Noted)
The following table presents a reconciliation of net loss to contribution for each of the periods indicated:
Three Months Ended | |||||||||||
March 31, 2018 | December 31, 2017 | March 31, 2017 | |||||||||
Consolidated net loss | $ | (31,180 | ) | $ | (92,098 | ) | $ | (29,844 | ) | ||
Engineering and product development expense | 36,837 | 37,926 | 35,760 | ||||||||
Other general and administrative expense | 52,309 | 48,689 | 43,574 | ||||||||
Class action settlement and regulatory litigation expense | 13,500 | 77,250 | — | ||||||||
Stock-based compensation expense (1) | 2,932 | 2,782 | 3,715 | ||||||||
Income tax expense (benefit) | 39 | 711 | (40 | ) | |||||||
(Income) Loss attributable to noncontrolling interests | (1 | ) | 91 | — | |||||||
Contribution (2) | $ | 74,436 | $ | 75,351 | $ | 53,165 | |||||
Total net revenue | $ | 151,667 | $ | 156,455 | $ | 124,482 | |||||
Contribution margin (2) | 49.1 | % | 48.2 | % | 42.7 | % | |||||
(1) | Contribution excludes stock-based compensation expense included in the “Sales and marketing” and “Origination and servicing” expense categories. |
(2) | Beginning in the third quarter of 2017, contribution excludes (income) loss attributable to noncontrolling interests. Prior period amounts have been reclassified to conform to the current period presentation. |
Adjusted EBITDA and Adjusted EBITDA Margin
Adjusted EBITDA is a non-GAAP financial measure defined as net income (loss) before (1) depreciation, impairment and amortization expense, (2) stock-based compensation expense, (3) income tax expense (benefit), (4) acquisition related expenses, (5) legal and regulatory expense related to legacy issues, (6) goodwill impairment and (7) (income) loss attributable to noncontrolling interests. Adjusted EBITDA margin is a non-GAAP financial measure calculated by dividing adjusted EBITDA by total net revenue.
We believe that adjusted EBITDA is an important measure of operating performance because it allows management, investors and our board to evaluate and compare our core operating results, including our return on capital and operating efficiencies, from period to period by removing outstanding legacy issues that will result in elevated legal costs (including ongoing regulatory and government investigations, indemnification obligations and litigation), the impact of depreciation, impairment and amortization in our asset base, share-based compensation, income tax effects and other non-operating expenses.
In the fourth quarter of 2017, the Company included a new adjustment for outstanding legacy issues that result in elevated legal costs (including ongoing regulatory and government investigations, indemnification obligations and litigation) to calculate adjusted EBITDA. We expect expenses in the future to include resolution of additional matters that arose from legacy management, including indemnification legal expenses paid by the Company for former employees and settlements of regulatory investigations and examinations. Legacy legal expenses incurred in 2017 and prior were generally offset by insurance proceeds, resulting in no net material cumulative impact to earnings. As such, prior period amounts were not reclassified for the change in how we calculate adjusted EBITDA.
Additionally, we utilize adjusted EBITDA as an operating performance measure as an input into the Company’s calculation of the annual bonus plan. In addition to its use by management, adjusted EBITDA is a measure widely used by securities analysts, investors and others to evaluate the financial performance of our company and other companies in our industry as well as in the broader financial services and technology industries.
66
LENDINGCLUB CORPORATION
Management’s Discussion and Analysis of Financial Condition and Results of Operations
(Tabular Amounts in Thousands, Except Share and Per Share Data and Ratios, or as Noted)
The following table presents a reconciliation of net loss to adjusted EBITDA for each of the periods indicated:
Three Months Ended | |||||||||||
March 31, 2018 | December 31, 2017 | March 31, 2017 | |||||||||
Consolidated net loss | $ | (31,180 | ) | $ | (92,098 | ) | $ | (29,844 | ) | ||
Acquisition and related expense | — | — | 293 | ||||||||
Depreciation and impairment expense: | |||||||||||
Engineering and product development | 9,247 | 11,487 | 7,794 | ||||||||
Other general and administrative | 1,419 | 1,281 | 1,298 | ||||||||
Amortization of intangible assets | 1,035 | 1,035 | 1,162 | ||||||||
Legal and regulatory expense related to legacy issues (1) | 16,973 | 80,250 | — | ||||||||
Stock-based compensation expense | 17,801 | 16,291 | 19,498 | ||||||||
Income tax expense (benefit) | 39 | 711 | (40 | ) | |||||||
(Income) Loss attributable to noncontrolling interests | (1 | ) | 91 | — | |||||||
Adjusted EBITDA (2) | $ | 15,333 | $ | 19,048 | $ | 161 | |||||
Total net revenue | $ | 151,667 | $ | 156,455 | $ | 124,482 | |||||
Adjusted EBITDA margin (2) | 10.1 | % | 12.2 | % | 0.1 | % | |||||
(1) | In the first quarter of 2018, legal and regulatory expense related to legacy issues includes regulatory litigation expense of $13.5 million and expense related to regulatory matters of $3.5 million, which are included in “Regulatory litigation expense” and “Other general and administrative” expense, respectively, on the Company’s Condensed Consolidated Statements of Operations. In the fourth quarter of 2017, legal and regulatory expense related to legacy issues includes class action litigation settlement expense of $77.25 million and expense related to regulatory matters of $3.0 million, which are included in “Class action litigation settlement” expense and “Other general and administrative” expense, respectively, on the Company’s Consolidated Statements of Operations. Amounts prior to the fourth quarter of 2017 have not been reclassified because legacy legal expenses incurred in 2017 and prior were generally offset by insurance proceeds, resulting in no net material cumulative impact to earnings. |
(2) | Beginning in the third quarter of 2017, adjusted EBITDA excludes (income) loss attributable to noncontrolling interests. Prior period amounts have been reclassified to conform to the current period presentation. |
Operating expenses include the following amounts of stock-based compensation for the periods presented:
Three Months Ended | |||||||||||
March 31, 2018 | December 31, 2017 | March 31, 2017 | |||||||||
Sales and marketing | $ | 1,860 | $ | 1,797 | $ | 2,299 | |||||
Origination and servicing | 1,072 | 985 | 1,416 | ||||||||
Engineering and product development | 5,279 | 5,046 | 6,588 | ||||||||
Other general and administrative | 9,590 | 8,463 | 9,195 | ||||||||
Total stock-based compensation expense | $ | 17,801 | $ | 16,291 | $ | 19,498 | |||||
Investor Fees Before Changes in Fair Value of Servicing Assets and Liabilities
Investor fee revenue, excluding fair market value accounting adjustments, is a non-GAAP financial measure that is calculated as investor fees less the change in fair value of servicing assets and liabilities. We account for servicing
67
LENDINGCLUB CORPORATION
Management’s Discussion and Analysis of Financial Condition and Results of Operations
(Tabular Amounts in Thousands, Except Share and Per Share Data and Ratios, or as Noted)
assets and liabilities at fair value with changes in fair value recorded through earnings in the period of change. We believe this is a useful non-GAAP financial measure because it reflects the amount of fees actually collected. We believe that the fair value adjustments to the servicing assets and liabilities is less useful in particular because the Company does not trade or transfer such servicing assets or liabilities.
The following table presents a reconciliation of investor fees to investor fees before change in fair value of servicing assets and liabilities:
Three Months Ended | |||||||||||
March 31, 2018 | December 31, 2017 | March 31, 2017 | |||||||||
Investor fees | $ | 27,895 | $ | 24,313 | $ | 21,180 | |||||
Change in fair value of servicing assets and liabilities | 5,249 | 6,690 | 3,238 | ||||||||
Investor fees before change in fair value of servicing assets and liabilities | $ | 33,144 | $ | 31,003 | $ | 24,418 | |||||
Investments in Quarterly Originations by Investment Channel and Investor Concentration
The following table shows the percentage of loan origination volume funded in the period and owned by each investment channel as of the end of each period presented:
March 31, 2018 | December 31, 2017 | September 30, 2017 | June 30, 2017 | March 31, 2017 | |||||||||||
Investor Type: | |||||||||||||||
Managed accounts | 20 | % | 26 | % | 24 | % | 31 | % | 33 | % | |||||
Self-directed | 10 | % | 10 | % | 10 | % | 13 | % | 15 | % | |||||
Banks | 48 | % | 36 | % | 42 | % | 44 | % | 40 | % | |||||
LendingClub inventory (1) | 9 | % | 11 | % | 9 | % | — | % | — | % | |||||
Other institutional investors | 13 | % | 17 | % | 15 | % | 12 | % | 12 | % | |||||
Total | 100 | % | 100 | % | 100 | % | 100 | % | 100 | % | |||||
(1) | Beginning in the third quarter of 2017, the Company introduced “LendingClub inventory” as a new line item presented to separately show the percentage of loan originations in the period that were owned by the Company as of the period end. The total loan activity during a period and loans owned by LendingClub at each period end is discussed in “Part I – Financial Information – Item 1 – Financial Statements – Notes to Condensed Consolidated Financial Statements – Note 6. Loans Held for Investment, Loans Held for Sale, Notes, Certificates and Secured Borrowings and Loan Servicing Rights“ and “Part I – Financial Information – Item 1 – Financial Statements – Notes to Condensed Consolidated Financial Statements – Note 8. Fair Value of Assets and Liabilities.” The LendingClub percentage considers all securitizations as sold loans for the portion of securities sold to third parties. |
Managed accounts include the private funds managed by LCAM, dedicated third-party funds and separately managed accounts. Self-directed investors include our self-directed retail investor base. Banks are deposit taking institutions or their affiliates, while other institutional investors include asset managers, insurance companies, hedge funds and other large non-bank investors.
68
LENDINGCLUB CORPORATION
Management’s Discussion and Analysis of Financial Condition and Results of Operations
(Tabular Amounts in Thousands, Except Share and Per Share Data and Ratios, or as Noted)
The following table provides the percentage of loans invested in by the ten largest external investors during each of the previous five quarters (by dollars invested):
March 31, 2018 | December 31, 2017 | September 30, 2017 | June 30, 2017 | March 31, 2017 | |||||||||||
Percentage of loans invested in by ten largest investors | 57 | % | 60 | % | 61 | % | 59 | % | 61 | % | |||||
For the quarter ended March 31, 2018, no single investor accounted for more than 14% of the loans invested in through our lending marketplace. The composition of the top ten investors may vary from period to period. In addition to these investors, private funds associated with LCAM and publicly issued member payment dependent notes accounted for approximately 1% and 10%, respectively, of investment capital provided through our lending marketplace during the period.
For the quarter ended March 31, 2017, no single investor accounted for more than 18% of the loans invested in through our lending marketplace. In addition to these investors, private funds associated with LCAM and publicly issued member payment dependent notes accounted for approximately 1% and 17%, respectively, of investment capital provided through our lending marketplace during the period.
Effectiveness of Scoring Models
Our ability to attract borrowers and investors to our lending marketplace is significantly dependent on our platform’s ability to effectively evaluate a borrower’s credit profile and likelihood of default.
Our lending marketplace platform’s credit decisioning and scoring models are evaluated on a regular basis and the additional data on loan history experience, borrower behavior, economic factors and prepayment trends that we accumulate are leveraged to continually improve the models. We believe we have the experience to effectively evaluate a borrower’s creditworthiness and likelihood of default. If our lending marketplace’s credit decisioning and scoring models ultimately prove to be ineffective or fail to appropriately account for a decline in the macroeconomic environment, investors may experience higher than expected losses and lose confidence in our business.
Our current credit model leverages a number of custom attributes developed by LendingClub. We worked with our primary issuing bank partner to modify credit and pricing policies, leveraging insights on current market conditions and recent vintage performance.
The charts provided below display the historical lifetime cumulative net charge-off rates (expressed as a percent of original loan balances) through March 31, 2018, by booking year, for all grades and 36 or 60 month terms of standard program loans for each of the years shown. For the first quarter of 2018, standard program loans accounted for approximately 76% of all loan origination volume.
69
LENDINGCLUB CORPORATION
Management’s Discussion and Analysis of Financial Condition and Results of Operations
(Tabular Amounts in Thousands, Except Share and Per Share Data and Ratios, or as Noted)
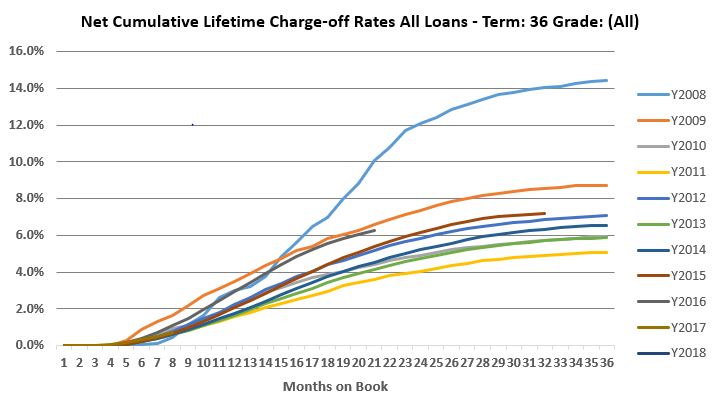
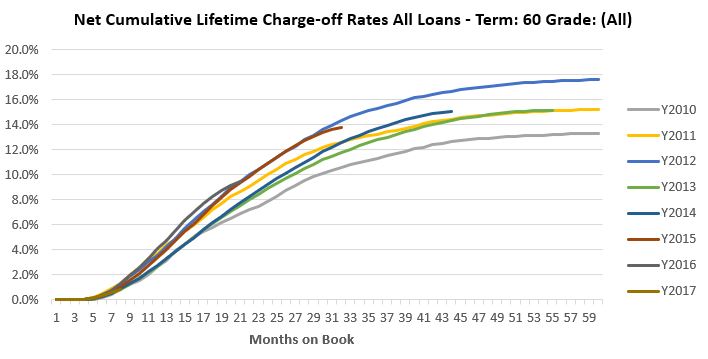
Loan Portfolio Information and Credit Metrics
We classify the loans held on our Condensed Consolidated Balance Sheets into three major loan products: standard program personal loans, custom program personal loans and other loans. The majority of the loans facilitated through our platform and retained on our balance sheet are standard program personal loans that represent loans made to prime borrowers that are publicly available to note investors, certificate investors, or loans invested in directly by us. Custom program personal loans include all other personal loans that are not eligible for our standard
70
LENDINGCLUB CORPORATION
Management’s Discussion and Analysis of Financial Condition and Results of Operations
(Tabular Amounts in Thousands, Except Share and Per Share Data and Ratios, or as Noted)
program, including loans made to near prime borrowers, and are available only to private investors. Other loans is comprised of education and patient finance loans, auto refinance loans and small business loans. The loans held on our Condensed Consolidated Balance Sheets are financed by notes issued by us, certificates issued by the Trust, revolving credit facilities, or loans invested in directly by us.
Fair Value and Delinquencies
With respect to the loans held for investment backed by notes, certificates and secured borrowings on our Condensed Consolidated Balance Sheets, the outstanding principal balance, fair value and percentage of loans that are delinquent, by loan product, are as follows:
March 31, 2018 | December 31, 2017 | ||||||||||||||
(in millions, except percentages) | Outstanding Principal Balance | Fair Value (2) | Delinquent Loans (2) | Outstanding Principal Balance | Fair Value (2) | Delinquent Loans (2) | |||||||||
Personal loans - standard program | $ | 2,762.9 | 93.2 | % | 3.2 | % | $ | 3,046.9 | 93.4 | % | 3.7 | % | |||
Personal loans - custom program | 65.6 | 91.2 | 6.9 | 92.0 | 91.0 | 7.5 | |||||||||
Other loans (1) | 1.3 | 96.2 | 3.8 | 2.5 | 95.9 | 4.0 | |||||||||
Total | $ | 2,829.8 | 93.1 | % | 3.3 | % | $ | 3,141.4 | 93.3 | % | 3.8 | % | |||
(1) Components of other loans are less than 10% of the outstanding principal balance presented individually.
(2) Expressed as a percent of outstanding principal balance.
Declines in the fair value of loans as a percent of outstanding principal balance from December 31, 2017 to March 31, 2018 were primarily due to increases in the yields required by investors to purchase our loans, notes, and certificates, an increase in expected credit losses and the passage of time for short duration loans.
With respect to loans invested in directly by the Company for which there were no associated notes, certificate or secured borrowings, the outstanding principal balance, fair value and percentage of loans that are delinquent, by loan product, are as follows:
March 31, 2018 | December 31, 2017 | ||||||||||||||
(in millions, except percentages) | Outstanding Principal Balance | Fair Value (2) | Delinquent Loans (2) | Outstanding Principal Balance | Fair Value (2) | Delinquent Loans (2) | |||||||||
Personal loans - standard program | $ | 501.4 | 94.5 | % | 1.3 | % | $ | 474.8 | 97.2 | % | 0.6 | % | |||
Personal loans - custom program | 39.1 | 94.5 | 3.3 | 85.6 | 98.6 | 0.3 | |||||||||
Other loans (1) | 57.6 | 95.9 | 1.9 | 53.3 | 96.0 | 2.2 | |||||||||
Total | $ | 598.1 | 94.6 | % | 1.5 | % | $ | 613.7 | 97.3 | % | 0.7 | % | |||
(1) Components of other loans are less than 10% of the outstanding principal balance presented individually.
(2) Expressed as a percent of outstanding principal balance.
Declines in the fair value of loans as a percent of outstanding principal balance from December 31, 2017 to March 31, 2018 were primarily due to increases in the yields required by investors to purchase our loans, an increase in expected credit losses and the passage of time for short duration loans. The increase in delinquency for Personal loans - custom program is due to the period ending balance, which is impacted by purchase and sale activity in the period.
71
LENDINGCLUB CORPORATION
Management’s Discussion and Analysis of Financial Condition and Results of Operations
(Tabular Amounts in Thousands, Except Share and Per Share Data and Ratios, or as Noted)
Net Annualized Charge-Off Rates
The following tables show annualized net charge-off rates, which is a measure of the performance of the loans held in our portfolio. In contrast to the graphs shown above, these tables show the annualized charged-off balance of loans in a specific period as a percentage of the average outstanding balance. The graphs above show net cumulative lifetime charge-offs as a function of original principal balance.
Net annualized charge-off rates are affected by the average age of the loans outstanding in the portfolio for a given quarter and the credit performance of those loans. Additionally, in any particular quarter the portfolios include loans from past vintages that were originated under prior credit underwriting parameters, and thus do not reflect the current credit underwriting models used to originate new loans.
The annualized net charge-off rates for personal loans for both standard and custom programs in total for the last five quarters are as follows:
Total Platform (1) | March 31, 2018 | December 31, 2017 | September 30, 2017 | June 30, 2017 | March 31, 2017 | |||||
Personal Loans - Standard Program: | ||||||||||
Annualized net charge-off rate | 7.8 | % | 8.3 | % | 7.6 | % | 8.1 | % | 8.5 | % |
Weighted-average age in months | 12.8 | 12.8 | 12.9 | 12.9 | 12.5 | |||||
Personal Loans - Custom Program: | ||||||||||
Annualized net charge-off rate | 15.0 | % | 14.8 | % | 13.5 | % | 14.1 | % | 15.7 | % |
Weighted-average age in months | 10.7 | 10.4 | 10.5 | 10.5 | 10.5 | |||||
(1) | Total platform comprises all loans facilitated through the lending marketplace, including whole loans sold and loans financed by notes, certificates and secured borrowings, but excluding education and patient loans, auto refinance loans, and small business loans. |
Loans Retained on Balance Sheets | March 31, 2018 | December 31, 2017 | September 30, 2017 | June 30, 2017 | March 31, 2017 | |||||
Personal Loans - Standard Program: | ||||||||||
Annualized net charge-off rate | 9.7 | % | 10.7 | % | 9.9 | % | 10.2 | % | 10.9 | % |
Weighted-average age in months | 14.9 | 14.4 | 15.2 | 14.9 | 14.4 | |||||
Personal Loans - Custom Program: | ||||||||||
Annualized net charge-off rate | 11.1 | % | 15.9 | % | 17.4 | % | 15.5 | % | 19.6 | % |
Weighted-average age in months | 17.0 | 12.3 | 17.3 | 15.7 | 12.3 | |||||
The decrease in the annualized net charge-off rates in the first quarter of 2018 compared to the fourth quarter of 2017 for both the total platform and loans retained on our Condensed Consolidated Balance Sheets reflect the effect of lower observed actual charge-offs in the first quarter of 2018. In the first quarter of 2018, we observed lower charge-offs in both the standard and custom personal loan programs. These decreases from the first quarter of 2018 compared to the fourth quarter of 2017 were driven by a combination of factors:
72
LENDINGCLUB CORPORATION
Management’s Discussion and Analysis of Financial Condition and Results of Operations
(Tabular Amounts in Thousands, Except Share and Per Share Data and Ratios, or as Noted)
• | The effect of credit tightening implemented in early 2017. As the first quarter 2017 vintages have seasoned we are seeing improved loss performance vintage-over-vintage compared to the fourth quarter 2016 cohorts as a result of the tighter credit criteria. |
• | The benefits from investments made in servicing of delinquent loans. |
• | An increase in recovery rates as sales prices of charged-off debt have increased. |
• | The composition of outstanding balance shifted toward lower risk grades in the first quarter of 2018 for loans retained on our Condensed Consolidated Balance Sheets. |
The annualized net charge-off rates for standard program loans are higher for loans retained on our Condensed Consolidated Balance Sheets compared to loans reflected at the total platform level for each quarter because of, among other reasons, a difference in grade distribution for the two portfolios. The proportion of grade A, B and C loans is approximately 60.8% of the retained loan portfolio compared to approximately 63.8% for the total platform level as of March 31, 2018. This difference in loan grade distribution results in higher net charge-off rates for the loans on the Condensed Consolidated Balance Sheets compared to the total platform, as grade A, B and C loans have lower expected and actual credit losses.
Additionally, portfolio composition within the Custom Program for loans retained on our Condensed Consolidated Balance Sheets shifted to a lower concentration of Near Prime loans, which typically experience higher charge-offs than other loans in the category. The difference in composition of loans within the Custom Program resulted in lower net charge-off rates for the loans on the Condensed Consolidated Balance Sheets in the first quarter of 2018 compared to the fourth quarter of 2017.
The average number of months that loans have been retained on our Condensed Consolidated Balance Sheets for the Custom Program increased as of March 31, 2018 from December 31, 2017 due to sale activity of recently issued Near Prime loans in the first quarter of 2018. The increase in loan age was also due to an additional seasoning of remaining loans.
Regulatory Environment
As a result of the internal board review and resignation of our former CEO, we have received inquiries from governmental entities, and we continue to cooperate fully with such governmental entities. An inquiry by the Federal Trade Commission (FTC) led to an action brought against the Company by the FTC. Responding to inquiries of this nature and defending the allegations in the FTC’s complaint, is costly and time consuming, can generate negative publicity, and could have a material and adverse effect on our business. See “Part I – Financial Information – Item 1 – Financial Statements – Note 17. Commitments and Contingencies” for further discussion regarding these inquiries.
In addition, there has been (and may continue to be) other litigation challenging lending arrangements where a bank or other third-party has made a loan and then sells and assigns it to an entity that is engaged in assisting with the origination and servicing of a loan. In January 2017, the Colorado Administrator of the Uniform Consumer Credit Code filed suit against Avant, Inc., a company that operates an online consumer loan platform. The Administrator asserts that loans to Colorado residents facilitated through Avant’s platform were required to comply with Colorado laws regarding interest rates and fees, and that those laws were not preempted by federal laws that apply to loans originated by WebBank, the federally regulated issuing bank who originates loans through Avant’s platform, as well as through our platform. Although Avant removed its case to federal court in March 2017, the United States District Court for the District of Colorado issued an order in March 2018 remanding the case to the District Court for the City and County of Denver. In March 2018, the United States District Court for the District of Colorado also issued an order dismissing a parallel case brought by WebBank that sought a declaratory judgment regarding the applicability of preemption to Colorado usury laws and permanent injunctions against the Administrator that would prevent the Administrator from enforcing Colorado usury laws against WebBank and certain parties associated with
73
LENDINGCLUB CORPORATION
Management’s Discussion and Analysis of Financial Condition and Results of Operations
(Tabular Amounts in Thousands, Except Share and Per Share Data and Ratios, or as Noted)
loans originated by it. No assurance can be given as to the timing or outcome of these matters. However, these matters could potentially impact the Company’s business, including the maximum interest rates and fees that can be charged and application of certain consumer protection statutes.
Liquidity and Capital Resources
Liquidity
The following table sets forth certain cash flow information for the periods presented:
Three Months Ended March 31, | |||||||
Condensed Cash Flow Information: | 2018 | 2017 | |||||
Cash flow provided by loan operating activities (1) | $ | (23,582 | ) | $ | (3,101 | ) | |
Cash flow provided by all other operating activities | 37,281 | (14,017 | ) | ||||
Net cash provided by (used for) operating activities | $ | 13,699 | $ | (17,118 | ) | ||
Cash flow provided by loan investing activities (2) | $ | 228,816 | $ | 128,601 | |||
Cash flow provided by all other investing activities | 862 | 32,479 | |||||
Net cash provided by investing activities | $ | 229,678 | $ | 161,080 | |||
Cash flow used for note, certificate and secured borrowings financing (2) | $ | (228,700 | ) | $ | (128,588 | ) | |
Cash flow provided by issuance of securitization notes and residual certificates and revolving credit facilities | 10,171 | — | |||||
Cash flow used for all other financing activities | (37,241 | ) | (25,445 | ) | |||
Net cash used for financing activities | $ | (255,770 | ) | $ | (154,033 | ) | |
Net decrease in cash and cash equivalents | $ | (12,393 | ) | $ | (10,071 | ) | |
(1) | Cash flow provided by loan operating activities primarily includes the purchase and sale of loans held for sale. It also includes the purchase of loans held for sale by consolidated variable interest entities (VIEs) and the sale of securities by consolidated VIEs. |
(2) | Cash flow provided by loan investing activities includes the purchase of and repayment of loans held for investment. Cash flow used for note, certificate and secured borrowings financing activities includes the issuance of notes, certificates and secured borrowings to investors and the repayment of those notes, certificates and secured borrowings. These amounts generally correspond to and offset each other. |
Our short-term liquidity needs generally relate to our working capital requirements, including the purchase of loans. These liquidity needs are generally met through cash generated from operating activities, including purchase and sale of loans held for sale, repayment of loans held for investment and draws on our credit facilities. Additionally, we can use our cash, cash equivalents and available for sale securities as sources of liquidity. Operating activities provided $13.7 million of cash in the first quarter of 2018 and used $17.1 million of cash in the first quarter of 2017. The increase in net cash from operating activities was primarily driven by higher transaction fees and a favorable change in working capital.
During the first quarters of 2018 and 2017, we purchased $1.4 billion and $1.7 billion in loans funded by the issuance of notes to our retail investors, by the issuance of certificates, or by whole loan sales to institutional investors. If we experience a reduction in available investor capital to fund loans on our marketplace, transaction fees could decline, in which case we may use more of our capital to purchase loans. We absorb credit losses while we own loans and may need to offer discounts to sell loans in bulk sales. During the first quarter of 2018, we purchased $793.2 million of loans invested in by the Company. In the first quarter, $191.6 million of loans
74
LENDINGCLUB CORPORATION
Management’s Discussion and Analysis of Financial Condition and Results of Operations
(Tabular Amounts in Thousands, Except Share and Per Share Data and Ratios, or as Noted)
purchased were securitized or contributed to CLUB Certificates and $551.1 million of loans purchased were sold to whole loan investors. The aggregate principal balance outstanding of loans invested in by the Company was $598.1 million as of March 31, 2018, of which $328.2 million were pledged as collateral for payables to securitization note and residual certificate holders. See “Part I – Financial Information – Item 1 – Financial Statements – Notes to Condensed Consolidated Financial Statements – Note 7. Securitizations and Variable Entities” for further information. Our loan funding commitments primarily include an obligation to purchase loans resulting from direct mail marketing efforts and a commitment to purchase loans from WebBank two business days after origination.
Cash and cash equivalents are primarily held in institutional money market funds, interest-bearing deposit accounts at investment grade financial institutions, certificates of deposit, and commercial paper. Cash and cash equivalents were $405.1 million and $401.7 million as of March 31, 2018 and December 31, 2017, respectively. Changes in the balance of cash and cash equivalents are generally a result of timing related to working capital requirements, purchase or sale of loans and securities available for sale, and changes in restricted cash and other investments. Future cash requirements include certain contingent liabilities. The Company is involved in litigations and ongoing regulatory and government investigations related to outstanding legacy issues. As of March 31, 2018, we have $101.9 million in accrued contingent liabilities, but actual cash payments may be higher or lower if actual outcomes of legal actions or settlements are different. See “Part I – Financial Information – Item 1 – Financial Statements – Notes to Condensed Consolidated Financial Statements – 17. Commitments and Contingencies” for further information.
We invest in securities classified as available for sale. The fair value of securities available for sale as of March 31, 2018 and December 31, 2017 was $128.4 million and $117.6 million, respectively. At March 31, 2018, securities available for sale included $62.4 million in corporate debt securities, asset-backed securities, commercial paper, certificates of deposit and other securities. These securities were rated investment grade and there were no significant unrealized losses on the securities. Additionally, we have $66.0 million in asset-backed securities related to Company-sponsored securitizations (Class A and Class B securities rated Investment Grade, subordinated securities unrated or rated below Investment Grade) and CLUB Certificates (unrated), of which $64.2 million were subject to regulatory risk retention rules. Under the risk retention rules, we are required to retain these securities and therefore the securities are not available to meet our liquidity needs. See “Part I – Financial Information – Item 1 – Financial Statements – Notes to Condensed Consolidated Financial Statements – Note 7. Securitizations and Variable Interest Entities” for further information.
We have two secured revolving warehouse credit facilities and an unsecured revolving credit facility with an aggregated credit limit of $570.0 million. As of March 31, 2018, we had $74.0 million in debt outstanding under the revolving credit facilities. Repayment of outstanding debt is not due within the next twelve months, but may be repaid without penalty. See “Part I – Financial Information – Item 1 – Financial Statements – Notes to Condensed Consolidated Financial Statements – Note 13. Debt” for further information.
We believe based on our projections and ability to reduce loan volume if needed, that our cash on hand, funds available from our lines of credit, and our cash flow from operations is expected to be sufficient to meet our liquidity needs for the next twelve months.
Capital Resources
Net capital expenditures were $13.6 million, or 9.0% of total net revenue, and $7.9 million, or 6.4% of total net revenue, for the first quarter of 2018 and 2017, respectively. Capital expenditures generally consist of internally developed software, computer equipment, and construction in progress. Capital expenditures in 2018 are expected to be approximately $55.0 million, primarily related to costs associated with the continued development and support of our lending platform. In the future, we expect our capital expenditures to increase as we continue to enhance our platform to support the growth in our business.
75
LENDINGCLUB CORPORATION
Management’s Discussion and Analysis of Financial Condition and Results of Operations
(Tabular Amounts in Thousands, Except Share and Per Share Data and Ratios, or as Noted)
Off-Balance Sheet Arrangements
As of both March 31, 2018 and December 31, 2017, a total of $5.5 million in standby letters of credit were outstanding related to certain financial covenants required for our leased facilities. To date, no amounts have been drawn against the letters of credit, which renew annually and expire at various dates through July 2026.
In the ordinary course of business, we engage in other activities that are not reflected on our Condensed Consolidated Balance Sheets, generally referred to as off-balance sheet arrangements. These activities involve transactions with unconsolidated variable interest entities. We provide additional information regarding these types of activities in “Part I – Financial Information – Item 1 – Financial Statements – Note 7. Securitizations and Variable Interest Entities.”
Contingencies
For a comprehensive discussion of contingencies as of March 31, 2018, see “Part I – Financial Information – Item 1 – Financial Statements – Note 17. Commitments and Contingencies.”
Critical Accounting Policies and Estimates
Certain of the Company’s accounting policies that involve a higher degree of judgment and complexity are discussed in “Part II – Item 7 – Management’s Discussion and Analysis of Financial Condition and Results of Operation – Critical Accounting Estimates” in the Annual Report on Form 10-K. There have been no significant changes to these critical accounting estimates during the first quarter of 2018.
76
LENDINGCLUB CORPORATION
Item 3. Quantitative and Qualitative Disclosures about Market Risk
Market risk represents the risk of loss that may impact our financial position due to adverse changes in market prices, credit performance of loans and interest rates.
Market Rate Sensitivity
We are exposed to market risk on $565.8 million of loans invested in by the Company at fair value and $66.0 million of asset-backed securities related to Company-sponsored securitizations and CLUB Certificate transactions. Changes in the fair value of these loans and securities are primarily related to changes in market discount rates, credit performance and prepayments. The fair values of loans are estimated using a discounted cash flow methodology, where the discount rate represents an estimate of the required rate of return by market participants. The discount rates for our loans may change due to expected loan performance or changes in the expected returns of similar financial instruments available in the market.
During the first quarter of 2018, we purchased a total of $793.2 million of loans through the platform using our own capital, primarily to support securitization and whole loan sale initiatives and marketplace equilibrium and to fund certain custom program loans. In the third quarter of 2017, we began to aggregate loans on balance sheet, for subsequent sale to third-party investors. The outstanding principal balance of loans in which we remained invested using our own capital as of March 31, 2018 was $598.1 million, including $328.2 million held in a consolidated securitization trust financed by $280.9 million of securitization issued notes. The loans and notes have fixed interest rates. We depend on an active liquid market and third-party investor demand for whole loan sales and successful securitization transactions. See “Item 2. Management’s Discussion and Analysis of Financial Condition and Results of Operations – Current Economic and Business Environment” and “Liquidity and Capital Resources – Liquidity” for additional discussion. We do not hold or issue financial instruments for trading purposes.
Additionally, the servicing assets and servicing liabilities are sensitive to market rate of servicing assumptions. See “Part I – Financial Information – Item 1 – Financial Statements – Note 8. Fair Value of Assets and Liabilities – Significant Recurring Level 3 Fair Value Asset and Liability Input Sensitivity” for additional discussion.
Interest Rate Sensitivity
We invest in securities classified as available for sale and loans that are subject to interest rate risk. The fair value of securities available for sale that are not related to Company-sponsored securitizations and CLUB Certificate transactions as of March 31, 2018 and December 31, 2017 was $62.4 million and $70.5 million, respectively, consisting of corporate debt securities, asset-backed securities, certificates of deposit, and commercial paper. To mitigate the risk of loss, our investment policy and strategy is focused first on the preservation of capital and supporting our liquidity requirements, and then maximizing returns. To manage this risk, we limit and monitor maturities, credit ratings, performance of loans underlying asset-backed securities and residual interests and concentrations within the investment portfolio. Changes in U.S. interest rates affect the interest earned and the market value of those securities. A hypothetical 100 basis point increase in interest rates would result in a decrease of approximately $0.8 million in the fair value of these securities available for sale as of March 31, 2018. A hypothetical 100 basis point decrease in interest rates would result in an increase of approximately $0.8 million in the fair value of these securities available for sale as of March 31, 2018. Any unrealized gains or losses resulting from such interest rate changes would only be recorded if we sold the securities prior to maturity or if the securities were not considered other-than-temporarily impaired.
We had cash and cash equivalents of $405.1 million as of March 31, 2018. These amounts were held primarily in interest-bearing deposits at investment grade financial institutions, institutional money market funds, certificates of deposit, and commercial paper, which are short-term. Cash and cash equivalents are held for working capital purposes. Due to their short-term nature, we do not believe we have material exposure to changes in the fair value of these liquid investments as a result of changes in interest rates.
77
LENDINGCLUB CORPORATION
Future funding activities, including $49.0 million of funding under the Warehouse Credit Facilities and $25.0 million of debt outstanding under the Credit Facility as of March 31, 2018, may increase our exposure to interest rate risk, as the interest rates payable on such funding are tied to short-term market rates.
Credit Performance Sensitivity
We invest in loans, asset-backed securities issued by, and residual interests in, certain VIEs related to Company-sponsored securitization transactions. The performance of these loans, securities and residual interests is dependent on the credit performance of loans facilitated by us. To manage this risk, we monitor borrower payment performance and how it may impact the valuation of our investments. The valuation of these investments is based on a discounted cash flow analysis and includes Level 3 assumptions.
Any unrealized losses on these securities and residual interests is evaluated for other-than-temporary impairment. We recorded an other-than-temporary impairment charge of $1.3 million on its subordinated residual certificates held related to its Company-sponsored securitization transactions in the first quarter of 2018. See “Part I – Financial Information – Item 1 – Financial Statements – Note 5. Securities Available for Sale” for additional information. All other unrealized gains and losses are recorded in the Condensed Consolidated Statements of Comprehensive Income (Loss).
Item 4. Controls and Procedures
Evaluation of Disclosure Controls and Procedures
The Company’s management evaluated, with the participation of the Company’s Chief Executive Officer (CEO) and Chief Financial Officer (CFO), the effectiveness of the Company’s disclosure controls and procedures (as defined in Rule 13a-15(e) under the Securities Exchange Act of 1934) as of March 31, 2018. In designing and evaluating its disclosure controls and procedures, the Company’s management recognizes that any controls and procedures, no matter how well designed and operated, can provide only reasonable assurance, not absolute assurance, of achieving the desired control objectives, and is required to apply its judgment in evaluating the cost-benefit relationship of possible controls and procedures.
Based on the evaluation, the Company’s CEO and CFO concluded that the Company’s disclosure controls and procedures as of March 31, 2018 were designed and functioned effectively to provide reasonable assurance that the information required to be disclosed by the Company in reports filed under the Securities and Exchange Act of 1934, as amended, is (i) recorded, processed, summarized, and reported within the time periods specified in the SEC’s rules and forms, and (ii) accumulated and communicated to management, including the principal executive and principal financial officers, as appropriate, to allow timely decisions regarding required disclosure.
Changes in Internal Control Over Financial Reporting
No change in the Company’s internal control over financial reporting (as defined in Rule 13a-15(f) under the Securities Exchange Act of 1934) was identified during the first quarter of 2018 that has materially affected, or is reasonably likely to materially affect, the Company’s internal control over financial reporting.
PART II. OTHER INFORMATION
Item 1. Legal Proceedings
For a discussion of legal proceedings, see “Part 1 – Financial Information – Item 1 – Financial Statements – Notes to Condensed Consolidated Financial Statements – Note 17. Commitments and Contingencies – Legal,” which is incorporated herein by reference.
78
LENDINGCLUB CORPORATION
Item 1A. Risk Factors
The risks described in “Part I – Item 1A. Risk Factors,” in our Annual Report on Form 10-K for the year ended December 31, 2017, could materially and adversely affect our business, financial condition, operating results and prospects, and the trading price of our common stock could decline. While we believe the risks and uncertainties described therein include all material risks currently known by us, it is possible that these may not be the only ones we face. Due to risks and uncertainties, known and unknown, our past financial results may not be a reliable indicator of future performance and historical trends should not be used to anticipate results or trends in future periods. The Risk Factors section of our Annual Report on Form 10-K for the year ended December 31, 2017 remains current in all material respects, with the exception of the below.
If we are unable to maintain our relationships with issuing banks, our business will suffer.
We rely on issuing banks to originate all loans and to comply with various federal, state and other laws, as discussed more fully in “Part I – Item 1 – Business – Relationships with Issuing Bank Partners,” in our Annual Report on Form 10-K for the year ended December 31, 2017.
Our agreements with WebBank are non-exclusive and do not prohibit WebBank from working with our competitors or from offering competing services. WebBank currently offers loan programs through other online lending marketplaces and other alternative lenders. WebBank could decide that working with us is not in its interest or could decide to enter into exclusive or more favorable relationships with our competitors. In addition, WebBank may not perform as expected under our agreements including potentially being unable to accommodate our projected growth in loan volume. We could in the future have disagreements or disputes with WebBank or other issuing banks, which could negatively impact or threaten our relationship.
WebBank is subject to oversight by the FDIC and the State of Utah and must comply with complex rules and regulations, licensing and examination requirements, including requirements to maintain a certain amount of regulatory capital relative to its outstanding loans. We are a service provider to WebBank, and as such, we are subject to audit by WebBank in accordance with FDIC guidance related to management of third-party vendors. We are also subject to the examination and enforcement authority of the FDIC as a bank service company covered by the Bank Service Company Act. We have indemnification obligations and exposure under our agreements with WebBank, including with respect to our compliance with certain applicable laws. If WebBank were to suspend, limit or cease its operations or our relationship with WebBank were to otherwise terminate, we would need to implement a substantially similar arrangement with another issuing bank, obtain additional state licenses or curtail our operations. Our agreement with WebBank has an initial term ending on January 31, 2020 and shall renew automatically for two successive terms of one year each, unless either party provides notice of non-renewal to the other party in accordance with the provisions of the agreement. To date, no backup issuing banks have originated any loans through our platform and we no longer have a backup origination arrangement.
We believe that our relationship with WebBank is critical to our business. However, if we need to enter into alternative arrangements with a different issuing bank to replace our existing arrangements, we may not be able to negotiate a comparable alternative arrangement. Transitioning loan originations to a new issuing bank is untested and may result in delays in the issuance of loans or, if our platform becomes inoperable, may result in our inability to facilitate loans through our platform. If we were unable to enter in an alternative arrangement with a different issuing bank, we would need to obtain a state license in each state in which we operate to enable us to originate loans, as well as comply with other state and federal laws, which would be costly and time-consuming. If we are unsuccessful in maintaining our relationships with WebBank, our ability to provide loan products could be materially impaired and our operating results would suffer.
79
LENDINGCLUB CORPORATION
We are regularly subject to litigation, and government and regulatory investigations, inquiries and requests, including matters related to our legacy management and the resignation of our former Chief Executive Officer.
We are regularly subject to claims, individual and class action lawsuits, lawsuits alleging regulatory violations such as Telephone Consumer Protection Act (TCPA) or Fair Credit Reporting Act (FCRA) violations, government and regulatory investigations, inquiries or requests, and other proceedings involving consumer protection, privacy, labor and employment, intellectual property, privacy, data protection, information security, securities, tax, commercial disputes, record retention and other matters. The number and significance of these lawsuits, investigations, inquiries and requests have increased as our business has expanded in scope and geographic reach, and our products and services have increased in complexity. We have also been subject to significant litigation and regulatory inquiries following our 2016 Board Review and the resignation of our former CEO, as discussed more fully in “Part 1 – Financial Information – Item 1 – Financial Statements – Notes to Condensed Consolidated Financial Statements – Note 17. Commitments and Contingencies – Legal” above. In particular, note that on April 25, 2018, the Federal Trade Commission (FTC) filed a lawsuit in the Northern District of California (FTC v. LendingClub Corporation, No. 3:18-cv-02454) alleging causes of action for violations of the Federal Trade Commission Act of 1914, as amended (the FTC Act), including two counts of deception in connection with disclosures related to the Company’s origination fees and disclosures of certainty of loan approval, one count of unfairness in making unauthorized charges to borrowers’ bank accounts and one count of violation of the Gramm-Leach-Bliley Act regarding the Company’s practices in delivering its privacy notice.
The scope, timing, outcome, consequences and impact of claims, lawsuits, proceedings, investigations, inquiries and requests that we are subject to cannot be predicted with certainty. Determining reserves for our pending litigation is a complex, fact-intensive process that requires significant judgment. Furthermore, resolution of such claims, lawsuits, proceedings, investigations, inquiries and requests could result in substantial fines and penalties, which may materially and adversely affect our business. These claims, lawsuits, proceedings, investigations, inquiries and requests could also: (i) result in reputational harm, criminal sanctions, consent decrees, orders preventing us from offering certain features, functionalities, products or services, (ii) limit the Company’s access to credit; (iii) impose third party monitoring obligations, (iv) result in a modification or suspension of our business practices, (v) require us to develop non-infringing or otherwise altered products or technologies, (vi) prompt ancillary claims, lawsuits, proceedings, investigations, inquiries and requests, or (vii) result in a loss of borrowers, investors and/or ecosystem partners, any of which may adversely affect our operations. Furthermore, even following the resolution of any claims, lawsuits, proceedings, investigations, inquiries and requests against the Company, a regulatory enforcement agency could take action against one or more individuals or entities, which may require us to continue to incur significant expense for indemnification for any such individual or entity until such matters may be resolved. Any of these consequences could materially and adversely affect our business.
We may incur substantial indebtedness and any failure to meet our debt obligations could adversely affect our business.
We can incur a significant amount of debt under our $120.0 million secured revolving credit facility and our $450.0 million warehouse credit facilities. As of March 31, 2017, we had $25.0 million outstanding balance under the secured revolving credit facility and $49.0 million in debt outstanding, in the aggregate, under our warehouse credit facilities. We may enter into additional financing arrangements, which could increase the aggregate amount of indebtedness we can incur.
Our ability to make payments on our debt, to repay our existing indebtedness when due, and to fund our business and operations and significant planned capital expenditures will depend on our ability to pay with available cash or generate cash in the future. This, to a certain extent, is subject to financial, competitive, legislative, regulatory and other factors that are beyond our control. In addition, if we cannot service our indebtedness, we may have to take actions such as utilizing available capital, limiting the facilitation of additional loans, selling assets, selling equity or reducing or delaying capital expenditures, strategic acquisitions, investments and alliances, any of which could impede the implementation of our business strategy, prevent us from entering into transactions that would otherwise
80
LENDINGCLUB CORPORATION
benefit our business and/or negatively affect our business. We also may not be able to refinance our indebtedness or take such other actions, if necessary, on commercially reasonable terms, or at all.
Furthermore, as stated earlier, we have and may increasingly securitize assets and offer other similar structured instruments, such as our new Club Certificate product. To support these offerings and other initiatives, we have and will likely continue to use our credit facilities to finance the purchasing and holding of loans on our balance sheet, to ultimately be used in connection with such offerings and initiatives. If, however, we are unable to consummate these types of offerings or other initiatives in accordance with our expectations, we may be required to hold loans on our balance sheet for longer than expected, or until the maturity of the loans. This may adversely impact our ability to repay our indebtedness when due and divert resources away from other projects and initiatives.
Some of our debt carries a floating rate of interest linked to various indices, including LIBOR. If a change in indices, including the discontinuation or modification of LIBOR, results in interest rate increases on our debt, debt service requirements will increase, which could adversely affect our cash flow and operating results.
If we breach representations or warranties that we made in our securitization, whole loan or CLUB Certificate transactions, or if either we suffer a direct or indirect loss in our retained interests in these transactions, our financial condition could be harmed.
As of March 31, 2018, we have sponsored fives sales of unsecured personal whole loans through asset-backed securitizations in 2017 and 2018. In connection with these securitizations, as well as our whole loan and CLUB Certificate transactions, we made certain customary representations, warranties and covenants. If there is a breach of those representations and warranties that materially and adversely affects the value of the subject loans, then we will be required to either cure the breach, repurchase the affected loans from the issuing entity, replace the affected loans with another loan or make a loss of value payment, as the case may be. Any losses that result could be material and have an adverse effect on our financial condition.
For a description of the interests we have retained in connection with complying with risk retention rules applicable to us as a sponsor of securitization transactions, see “Risk retention rules and recent developments in our business may increase our compliance costs, impair our liquidity and otherwise adversely affect our operating results.” In the event that we suffer losses on all or a portion of the interests in any securitization transaction that we have retained (whether to comply with applicable risk retention rules or otherwise), our financial condition could be harmed.
We may enter into similar transactions in the future and those transactions could likely entail similar and other substantial risks.
We are subject to ownership concentration by certain significant stockholders.
Ownership of our common stock is concentrated among certain stockholders. For example, Shanda Investment Group Limited beneficially owns shares of our common stock representing approximately 23% of LendingClub Corporation’s voting power as of March 31, 2018. We do not have any restrictions on any stockholder in favor of LendingClub Corporation other than as may be required by applicable law. Any single stockholder with a significant concentration could determine to vote shares in a manner that may be contrary to the interests of other minority stockholders, or such stockholder could sell shares in a manner that could affect our stock price. In addition, the concentration of shares may act as a deterrent to other potential investors purchasing our stock.
81
LENDINGCLUB CORPORATION
Anti-takeover provisions in our charter documents and Delaware law may delay or prevent an acquisition of our company.
Our restated Certificate of Incorporation and restated Bylaws contain provisions that can have the effect of delaying or preventing a change in control of us or changes in our management. The provisions, among other things:
• | establish a classified board of directors so that not all members of our board of directors are elected at one time; however, we have made a management proposal that the Company’s Restated Certificate of Incorporation be amended to “declassify” the board over a three-year period, which proposal will be voted on at the upcoming 2018 Annual Meeting of Stockholders; |
• | permit only our board of directors to establish the number of directors and fill vacancies on the board; |
• | provide that directors may only be removed “for cause” and only with the approval of two-thirds of our stockholders; |
• | require two-thirds vote to amend some provisions in our restated Certificate of Incorporation and restated Bylaws; |
• | authorize the issuance of “blank check” preferred stock that our board of directors could use to implement a stockholder rights plan (also known as a “poison pill”); |
• | eliminate the ability of our stockholders to call special meetings of stockholders; |
• | prohibit stockholder action by written consent, which will require that all stockholder actions must be taken at a stockholder meeting; |
• | do not provide for cumulative voting; and |
• | establish advance notice requirements for nominations for election to our board of directors or for proposing matters that can be acted upon by stockholders at annual stockholder meetings. |
Item 2. Unregistered Sales of Equity Securities and Use of Proceeds
None.
Item 3. Defaults Upon Senior Securities
None.
Item 4. Mine Safety Disclosures
None.
Item 5. Other Information
None.
82
LENDINGCLUB CORPORATION
Item 6. Exhibits
Exhibit Index
The exhibits noted in the accompanying Exhibit Index are filed or incorporated by reference as a part of this Report and such Exhibit Index is incorporated herein by reference.
Incorporated by Reference | ||||||
Exhibit Number | Exhibit Description | Form | File No. | Exhibit | Filing Date | Filed Herewith |
101.INS | XBRL Instance Document | X | ||||
101.SCH | XBRL Taxonomy Extension Schema Document | X | ||||
101.CAL | XBRL Taxonomy Extension Calculation Linkbase | X | ||||
101.DEF | XBRL Taxonomy Extension Definition Linkbase | X | ||||
101.LAB | XBRL Taxonomy Extension Label Linkbase | X | ||||
101.PRE | XBRL Taxonomy Extension Presentation Linkbase | X | ||||
* Confidential treatment has been requested for certain portions of this Exhibit. The omitted material has been filed separately with the Securities and Exchange Commission.
† Schedules have been omitted as they are not material, not applicable or not required. They will be furnished supplementally to the Securities and Exchange Commission upon request.
83
LENDINGCLUB CORPORATION
SIGNATURES
Pursuant to the requirements of Section 13 or 15(d) of the Securities Exchange Act of 1934, the registrant has duly caused this report to be signed on its behalf by the undersigned, thereunto duly authorized.
LENDINGCLUB CORPORATION | ||||
(Registrant) | ||||
Date: | May 9, 2018 | /s/ SCOTT SANBORN | ||
Scott Sanborn | ||||
Chief Executive Officer | ||||
Date: | May 9, 2018 | /s/ THOMAS W. CASEY | ||
Thomas W. Casey | ||||
Chief Financial Officer | ||||
84