Exhibit 99.1
Balance sheet growth fueled by robust loan and deposit demand
BBVA Compass Bancshares, Inc. reports earnings of $222 million for first half of 2014
• | Total loans end the quarter at $54.3 billion, up 14 percent from prior year levels |
• | Total deposits increase 11 percent to $58.1 billion, driven by a 13 percent increase in noninterest bearing deposits |
• | Key credit quality indicators continue to strengthen; nonperforming asset ratio drops to 0.81 percent from 1.61 percent, net charge-off ratio falls to 0.26 percent |
• | Bank is No.1 with customers in American Banker’s annual reputation survey |
HOUSTON, July 30, 2014 - BBVA Compass Bancshares, Inc., a Sunbelt-based bank holding company (BBVA Compass), reported today net income attributable to shareholder of $222 million for the first six months of 2014 compared to $238 million for the first six months of 2013. These results include a $0.5 million loss and a $22 million gain on the prepayment of FHLB and other borrowings for the first six months of 2014 and 2013, respectively. Return on average assets and return on average tangible equity for the first half of 2014 were 0.60 percent and 6.85 percent, respectively.
Net income attributable to shareholder for the second quarter of 2014 was $107 million compared to $128 million for the second quarter of 2013. Included in the results for the second quarter of 2013 was a $23 million gain on the prepayment of FHLB and other borrowings.
“The strong balance sheet growth BBVA Compass delivered during the first half of 2014 is a direct reflection of the benefit of our customer-centric business model, improving markets and our focus on utilizing technology as a competitive advantage to quickly adapt our products and services to meet the changing needs of our customers,” said Manolo Sánchez, chairman and CEO of BBVA Compass. “Our focus on serving our customers resulted in a 14 percent increase in total loans, driven by healthy growth in both our commercial and consumer portfolios. Deposit growth was also solid, increasing 11 percent in total while noninterest bearing deposit growth was more pronounced at 13 percent.”
Sánchez noted that strong balance sheet growth did not come at the expense of maintaining sound and disciplined risk standards as key credit quality metrics showed further improvement. Total nonperforming assets as a percentage of loans, other real estate and other repossessed assets dropped to 0.81 percent at the end of the second quarter and net charge-offs as a percentage of average loans were 26 basis points compared to 54 basis points for the first half of 2013.
Total shareholder’s equity ended the second quarter of 2014 at $11.8 billion, a 5 percent increase from second quarter 2013 levels. Sánchez said, “BBVA Compass is committed to maintaining a strong capital position and at the end of the second quarter each of our regulatory capital ratios remain significantly above ‘well-capitalized’ guidelines.”
Also in the quarter, BBVA Compass earned the top ranking with customers in American Banker’s annual reputation survey of the top 25 largest U.S. retail banks. BBVA Compass’ score jumped more than 12 points and came within two points of achieving a “top-tier” score of 80 or higher, territory no bank has seen since the survey started in 2010. BBVA Compass was the only bank to rank in the top five across all seven dimensions of reputation among customers and earned the top spot in governance, products, performance and innovation.
Contact details: | ||
Jena Moreno | Ed Bilek | |
Corporate Communications | Investor Relations | |
Tel. 713.831.5867 | Tel. 205.297.3331 | |
jena.moreno@bbvacompass.com | ed.bilek@bbvacompass.com | |
1
About BBVA Compass
BBVA Compass Bancshares, Inc. is a Sunbelt-based bank holding company whose lead subsidiary, BBVA Compass, operates 673 branches, including 342 in Texas, 89 in Alabama, 77 in Arizona, 62 in California, 45 in Florida, 38 in Colorado and 20 in New Mexico. BBVA Compass ranks among the top 25 largest U.S. commercial banks based on deposit market share and ranks among the largest banks in Alabama (2nd), Texas (4th) and Arizona (5th). BBVA Compass has been recognized as one of the leading small business lenders by the Small Business Administration and recently earned the top ranking with customers in American Banker’s 2014 annual reputation survey of the top 25 largest U.S. retail banks. Additional information about BBVA Compass can be found under the Investor Relations tab at www.bbvacompass.com, by following @BBVACompassNews on Twitter or visiting newsroom.bbvacompass.com.
About BBVA Group
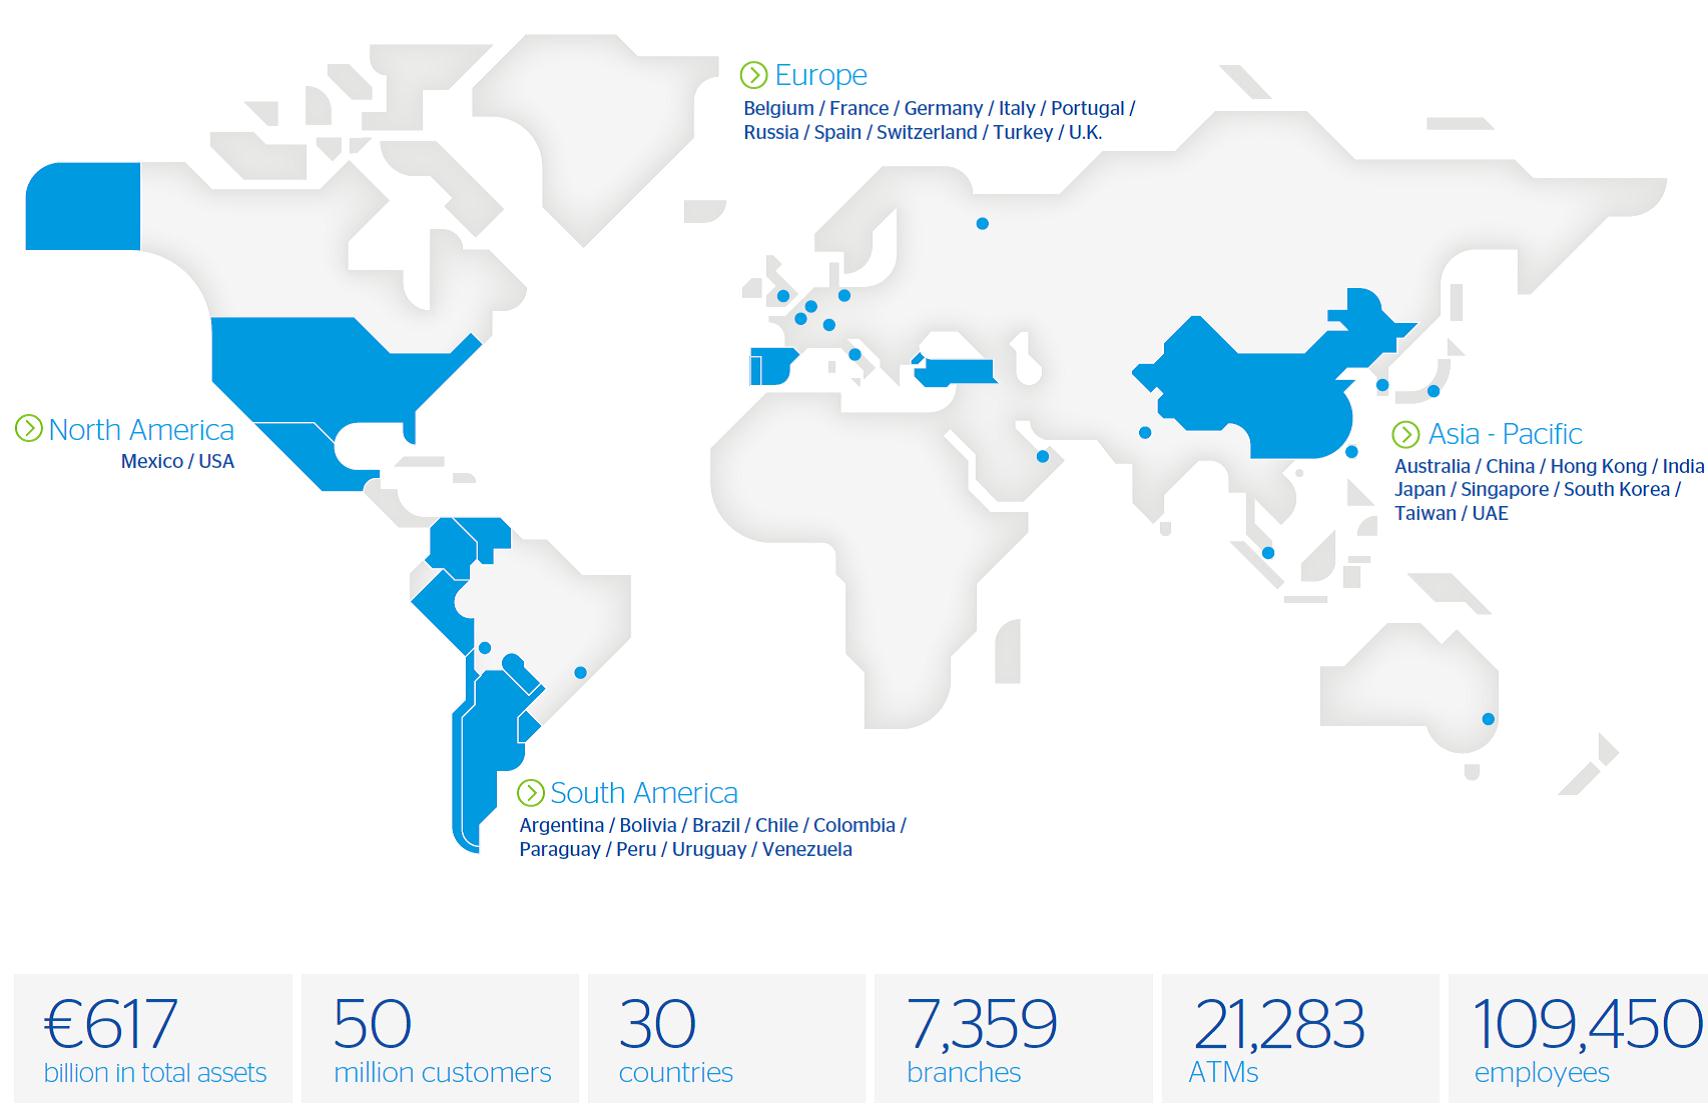
BBVA Compass Bancshares, Inc. is a wholly owned subsidiary of BBVA (NYSE: BBVA) (MAD: BBVA). BBVA is a customer-centric global financial services group founded in 1857. The Group has a solid position in Spain, is the largest financial institution in Mexico and has leading franchises in South America and the Sunbelt region of the United States. Its diversified business is geared toward high-growth markets and relies on technology as a key sustainable competitive advantage. Corporate responsibility is at the core of its business model. BBVA fosters financial education and inclusion, and supports scientific research and culture. It operates with the highest integrity, a long-term vision and applies the best practices. The Group is present in the main sustainability indexes. More information about the BBVA Group can be found at www.bbva.com.
2
Forward-Looking Statements
Certain statements in this press release may contain forward-looking statements about the Company and its industry that involve substantial risks and uncertainties. Statements other than statements of current or historical fact, including statements regarding our future financial condition, results of operations, business plans, liquidity, cash flows, projected costs, and the impact of any laws or regulations applicable to the Company, constitute forward-looking statements as defined by the Private Securities Litigation Reform Act of 1995. Words such as “anticipates,” “believes,” “estimates,” “expects,” “forecasts,” “intends,” “plans,” “projects,” “may,” “will,” “should,” and other similar expressions are intended to identify these forward-looking statements. These forward-looking statements reflect the Company’s views regarding future events and financial performance. Such statements are subject to risks, uncertainties, assumptions and other important factors, many of which may be beyond the Company’s control, that could cause actual results to differ materially from anticipated results. If the Company’s assumptions and estimates are incorrect, or if the Company becomes subject to significant limitations as the result of litigation or regulatory action, then the Company’s actual results could vary materially from those expressed or implied in these forward-looking statements. The forward-looking statements are and will be based on the Company’s then current views and assumptions regarding future events and speak only as of their dates made. The Company assumes no obligation to update any forward-looking statement, whether as a result of new information, future events, or otherwise, except as required by securities law. For further information regarding risks and uncertainties associated with the Company’s business, please refer to the “Risk Factors” section of the Company’s Annual Report on Form 10-K filed with the U.S. Securities and Exchange Commission on March 28, 2014.
3
BBVA COMPASS BANCSHARES, INC. (Unaudited) (Dollars in thousands) | ||||||||||||||||||||||
Three Months Ended June 30, | % | Six Months Ended June 30, | % | |||||||||||||||||||
2014 | 2013 | Change | 2014 | 2013 | Change | |||||||||||||||||
EARNINGS SUMMARY | ||||||||||||||||||||||
Net interest income | $ | 498,774 | $ | 510,315 | (2 | ) | $ | 994,073 | $ | 1,033,261 | (4 | ) | ||||||||||
Noninterest income [a] | 213,981 | 208,056 | 3 | 417,333 | 399,585 | 4 | ||||||||||||||||
Total revenue [a] | 712,755 | 718,371 | (1 | ) | 1,411,406 | 1,432,846 | (1 | ) | ||||||||||||||
Investment securities gain, net | 21,464 | 18,075 | 19 | 37,898 | 33,030 | 15 | ||||||||||||||||
Gain (loss) on prepayment of FHLB advances | — | 22,882 | NM | (458 | ) | 21,775 | NM | |||||||||||||||
Provision for loan losses | 45,252 | 24,237 | 87 | 82,518 | 43,852 | 88 | ||||||||||||||||
Noninterest expense | 545,262 | 554,700 | (2 | ) | 1,064,129 | 1,100,365 | (3 | ) | ||||||||||||||
Pretax income | 143,705 | 180,391 | (20 | ) | 302,199 | 343,434 | (12 | ) | ||||||||||||||
Income tax expense | 36,130 | 51,596 | (30 | ) | 79,697 | 104,103 | (23 | ) | ||||||||||||||
Net income | 107,575 | 128,795 | (16 | ) | 222,502 | 239,331 | (7 | ) | ||||||||||||||
Net income attributable to noncontrolling interests | 504 | 568 | (11 | ) | 957 | 961 | — | |||||||||||||||
Net income attributable to shareholder | $ | 107,071 | $ | 128,227 | (16 | ) | $ | 221,545 | $ | 238,370 | (7 | ) | ||||||||||
SELECTED RATIOS | ||||||||||||||||||||||
Return on average assets | 0.57 | % | 0.74 | % | 0.60 | % | 0.69 | % | ||||||||||||||
Return on average tangible equity [b] | 6.52 | 8.32 | 6.85 | 7.91 | ||||||||||||||||||
Average common equity to average assets | 15.56 | 16.22 | 15.69 | 16.09 | ||||||||||||||||||
Average loans to average total deposits | 93.70 | 89.17 | 93.89 | 88.44 | ||||||||||||||||||
Tier I capital ratio [c] | 11.27 | 12.00 | 11.27 | 12.00 | ||||||||||||||||||
Total capital ratio [c] | 13.34 | 14.32 | 13.34 | 14.32 | ||||||||||||||||||
Leverage ratio [c] | 9.68 | 9.90 | 9.68 | 9.90 | ||||||||||||||||||
[a] Excludes net gain on sales of investment securities and gain (loss) on prepayment of FHLB advances. | ||||||||||||||||||||||
[b] Excludes amortization of intangibles, net of tax, and intangible assets. | ||||||||||||||||||||||
[c] Current period regulatory capital ratios are estimated. | ||||||||||||||||||||||
NM = Not meaningful | ||||||||||||||||||||||
4
BBVA COMPASS BANCSHARES, INC. (Unaudited) (Dollars in thousands) | |||||||||||||||||||||||||||||||||
Average for Three Months | Average for Six Months | Ending Balance | |||||||||||||||||||||||||||||||
Ended June 30, | % | Ended June 30, | % | June 30, | % | ||||||||||||||||||||||||||||
2014 | 2013 | Change | 2014 | 2013 | Change | 2014 | 2013 | Change | |||||||||||||||||||||||||
BALANCE SHEET HIGHLIGHTS | |||||||||||||||||||||||||||||||||
Total loans | $ | 53,924,258 | $ | 46,791,135 | 15 | $ | 52,939,163 | $ | 46,226,975 | 15 | $ | 54,297,672 | $ | 47,591,933 | 14 | ||||||||||||||||||
Total investment securities | 10,342,192 | 10,442,926 | (1 | ) | 10,269,762 | 10,325,282 | (1 | ) | 10,420,429 | 9,918,520 | 5 | ||||||||||||||||||||||
Earning assets | 64,375,186 | 57,392,898 | 12 | 63,316,324 | 56,697,347 | 12 | 64,864,449 | 57,648,938 | 13 | ||||||||||||||||||||||||
Total assets | 76,004,941 | 69,944,558 | 9 | 74,689,351 | 69,900,139 | 7 | 75,747,100 | 69,674,976 | 9 | ||||||||||||||||||||||||
Noninterest bearing demand deposits | 16,342,035 | 14,348,060 | 14 | 15,999,415 | 14,052,643 | 14 | 16,321,003 | 14,498,028 | 13 | ||||||||||||||||||||||||
Interest bearing transaction accounts | 28,211,266 | 25,948,163 | 9 | 27,645,278 | 25,919,550 | 7 | 28,629,221 | 25,926,567 | 10 | ||||||||||||||||||||||||
Total transaction accounts | 44,553,301 | 40,296,223 | 11 | 43,644,693 | 39,972,193 | 9 | 44,950,224 | 40,424,595 | 11 | ||||||||||||||||||||||||
Total deposits | 57,549,565 | 52,473,024 | 10 | 56,386,091 | 52,266,440 | 8 | 58,118,406 | 52,260,682 | 11 | ||||||||||||||||||||||||
Shareholder's equity | 11,823,834 | 11,342,874 | 4 | 11,720,415 | 11,246,421 | 4 | 11,849,538 | 11,315,076 | 5 | ||||||||||||||||||||||||
5
BBVA COMPASS BANCSHARES, INC. (Unaudited) (Dollars in thousands) | ||||||||||||||||||||
2014 | 2013 | |||||||||||||||||||
June 30 | March 31 | December 31 | September 30 | June 30 | ||||||||||||||||
NONPERFORMING ASSETS | ||||||||||||||||||||
Nonaccrual loans | $ | 341,807 | $ | 388,597 | $ | 441,718 | $ | 543,902 | $ | 589,468 | ||||||||||
Loans 90 days or more past due [a] | 76,219 | 83,490 | 82,814 | 98,035 | 121,215 | |||||||||||||||
TDRs 90 days or more past due | 629 | 204 | 1,317 | 739 | 363 | |||||||||||||||
Total nonperforming loans [b] | 418,655 | 472,291 | 525,849 | 642,676 | 711,046 | |||||||||||||||
Other real estate owned, net (OREO) | 21,113 | 25,817 | 23,228 | 41,493 | 52,798 | |||||||||||||||
Other repossessed assets | 2,796 | 3,313 | 3,360 | $ | 3,896 | $ | 3,224 | |||||||||||||
Total nonperforming assets | $ | 442,564 | $ | 501,421 | $ | 552,437 | $ | 688,065 | $ | 767,068 | ||||||||||
TDRs accruing and past due less than 90 days | $ | 177,630 | $ | 202,075 | $ | 208,391 | $ | 225,961 | $ | 243,009 | ||||||||||
Covered loans [c] | 613,152 | 701,158 | 734,190 | 832,884 | 915,755 | |||||||||||||||
Covered nonperforming loans [c] | 59,331 | 63,664 | 62,038 | 76,301 | 99,480 | |||||||||||||||
Covered nonperforming assets [c] | 62,824 | 67,500 | 66,151 | 89,620 | 118,902 | |||||||||||||||
Total nonperforming loans as a % of loans | 0.77 | % | 0.89 | % | 1.03 | % | 1.30 | % | 1.49 | % | ||||||||||
Total nonperforming loans as a % of loans, excluding covered loans | 0.67 | 0.78 | 0.93 | 1.16 | 1.31 | |||||||||||||||
Total nonperforming assets as a % of total loans, other real estate, and other repossessed assets | 0.81 | 0.95 | 1.09 | 1.39 | 1.61 | |||||||||||||||
Total nonperforming assets as a % of total loans, other real estate, and other repossessed assets, excluding covered assets | 0.71 | 0.83 | 0.97 | 1.23 | 1.39 | |||||||||||||||
[a] Excludes loans classified as troubled debt restructuring (TDRs). | ||||||||||||||||||||
[b] Includes loans held for sale. | ||||||||||||||||||||
[c] Covered assets includes loans and OREO acquired from the FDIC subject to loss sharing agreements. | ||||||||||||||||||||
6
Three Months Ended | ||||||||||||||||||||
2014 | 2013 | |||||||||||||||||||
June 30 | March 31 | December 31 | September 30 | June 30 | ||||||||||||||||
ALLOWANCE FOR LOAN LOSSES | ||||||||||||||||||||
Balance at beginning of period | $ | 707,665 | $ | 700,719 | $ | 717,937 | $ | 723,511 | $ | 786,018 | ||||||||||
Net charge-offs (NCO) | 38,157 | 30,320 | 43,378 | 43,108 | 86,744 | |||||||||||||||
Provision for loan losses | 45,252 | 37,266 | 26,160 | 37,534 | 24,237 | |||||||||||||||
Balance at end of period | $ | 714,760 | $ | 707,665 | $ | 700,719 | $ | 717,937 | $ | 723,511 | ||||||||||
Allowance for loan losses as a % of total loans | 1.32 | % | 1.34 | % | 1.38 | % | 1.45 | % | 1.52 | % | ||||||||||
Allowance for loan losses as a % of nonperforming loans [a] | 170.73 | 149.84 | 133.25 | 111.71 | 101.75 | |||||||||||||||
Allowance for loan losses as a % of nonperforming assets [a] | 161.50 | 141.13 | 126.84 | 104.34 | 94.32 | |||||||||||||||
Annualized as a % of average loans: | ||||||||||||||||||||
NCO - QTD | 0.28 | 0.24 | 0.34 | 0.35 | 0.74 | |||||||||||||||
NCO - YTD | 0.26 | 0.24 | 0.44 | 0.47 | 0.54 | |||||||||||||||
[a] Includes loans held for sale that are on nonaccrual status. | ||||||||||||||||||||
7
BBVA COMPASS BANCSHARES, INC. (Unaudited) (Dollars in thousands) | ||||||||||||||||||||||
Three Months Ended June 30, | ||||||||||||||||||||||
2014 | 2013 | |||||||||||||||||||||
Average Balance | Income/ Expense | Yield/ Rate | Average Balance | Income/ Expense | Yield/ Rate | |||||||||||||||||
YIELD/RATE ANALYSIS | ||||||||||||||||||||||
(Taxable Equivalent Basis) | ||||||||||||||||||||||
Assets | ||||||||||||||||||||||
Earning assets: | ||||||||||||||||||||||
Loans | $ | 53,924,258 | $ | 533,572 | 3.97 | % | $ | 46,791,135 | $ | 537,394 | 4.61 | % | ||||||||||
Investment securities available for sale [a] | 8,833,591 | 50,085 | 2.27 | 8,729,716 | 45,939 | 2.11 | ||||||||||||||||
Investment securities held to maturity | 1,463,642 | 10,066 | 2.76 | 1,550,056 | 10,843 | 2.81 | ||||||||||||||||
Other earning assets | 108,736 | 622 | 2.29 | 158,837 | 839 | 2.12 | ||||||||||||||||
Total earning assets [a] | 64,330,227 | 594,345 | 3.71 | 57,229,744 | 595,015 | 4.17 | ||||||||||||||||
Allowance for loan losses | (707,222 | ) | (770,742 | ) | ||||||||||||||||||
Unrealized gain (loss) on securities available for sale | 44,959 | 163,154 | ||||||||||||||||||||
Other assets | 12,336,977 | 13,322,402 | ||||||||||||||||||||
Total assets | $ | 76,004,941 | $ | 69,944,558 | ||||||||||||||||||
Liabilities and Shareholders' Equity | ||||||||||||||||||||||
Interest bearing liabilities: | ||||||||||||||||||||||
Interest bearing demand deposits | $ | 7,244,052 | $ | 3,098 | 0.17 | $ | 6,647,469 | $ | 2,868 | 0.17 | ||||||||||||
Savings and money market accounts | 20,967,214 | 20,000 | 0.38 | 19,300,694 | 19,143 | 0.40 | ||||||||||||||||
Certificates and other time deposits | 12,876,734 | 37,748 | 1.18 | 12,052,084 | 31,699 | 1.05 | ||||||||||||||||
Foreign office deposits | 119,530 | 55 | 0.18 | 124,717 | 69 | 0.22 | ||||||||||||||||
Total interest bearing deposits | 41,207,530 | 60,901 | 0.59 | 38,124,964 | 53,779 | 0.57 | ||||||||||||||||
FHLB and other borrowings | 4,100,456 | 16,184 | 1.58 | 4,039,732 | 16,149 | 1.60 | ||||||||||||||||
Federal funds purchased and securities sold under agreement to repurchase | 876,593 | 437 | 0.20 | 1,016,816 | 551 | 0.22 | ||||||||||||||||
Other short-term borrowings | 17,282 | 96 | 2.23 | 15,629 | (24 | ) | (0.62 | ) | ||||||||||||||
Total interest bearing liabilities | 46,201,861 | 77,618 | 0.67 | 43,197,141 | 70,455 | 0.65 | ||||||||||||||||
Noninterest bearing deposits | 16,342,035 | 14,348,060 | ||||||||||||||||||||
Other noninterest bearing liabilities | 1,637,211 | 1,056,483 | ||||||||||||||||||||
Total liabilities | 64,181,107 | 58,601,684 | ||||||||||||||||||||
Shareholder's equity | 11,823,834 | 11,342,874 | ||||||||||||||||||||
Total liabilities and shareholder's equity | $ | 76,004,941 | $ | 69,944,558 | ||||||||||||||||||
Net interest income/ net interest spread | 516,727 | 3.04 | % | 524,560 | 3.52 | % | ||||||||||||||||
Net yield on earning assets | 3.22 | % | 3.68 | % | ||||||||||||||||||
Total taxable equivalent adjustment | 17,953 | 14,245 | ||||||||||||||||||||
Net interest income | $ | 498,774 | $ | 510,315 | ||||||||||||||||||
[a] Excludes adjustment for market valuation. | ||||||||||||||||||||||
8
BBVA COMPASS BANCSHARES, INC. (Unaudited) (Dollars in thousands) | ||||||||||||||||||||||
Six Months Ended June 30, | ||||||||||||||||||||||
2014 | 2013 | |||||||||||||||||||||
Average Balance | Income/ Expense | Yield/ Rate | Average Balance | Income/ Expense | Yield/ Rate | |||||||||||||||||
YIELD/RATE ANALYSIS | ||||||||||||||||||||||
(Taxable Equivalent Basis) | ||||||||||||||||||||||
Assets | ||||||||||||||||||||||
Earning assets: | ||||||||||||||||||||||
Loans | $ | 52,939,163 | $ | 1,054,164 | 4.02 | % | $ | 46,226,975 | $ | 1,085,417 | 4.73 | % | ||||||||||
Investment securities available for sale [a] | 8,743,587 | 101,079 | 2.33 | 8,626,071 | 95,088 | 2.22 | ||||||||||||||||
Investment securities held to maturity | 1,484,405 | 20,439 | 2.78 | 1,520,928 | 21,696 | 2.88 | ||||||||||||||||
Other earning assets | 107,399 | 1,188 | 2.23 | 145,090 | 1,619 | 2.25 | ||||||||||||||||
Total earning assets [a] | 63,274,554 | 1,176,870 | 3.75 | 56,519,064 | 1,203,820 | 4.30 | ||||||||||||||||
Allowance for loan losses | (704,997 | ) | (785,430 | ) | ||||||||||||||||||
Unrealized gain (loss) on securities available for sale | 41,770 | 178,283 | ||||||||||||||||||||
Other assets | 12,078,024 | 13,988,222 | ||||||||||||||||||||
Total assets | $ | 74,689,351 | $ | 69,900,139 | ||||||||||||||||||
Liabilities and Shareholders' Equity | ||||||||||||||||||||||
Interest bearing liabilities: | ||||||||||||||||||||||
Interest bearing demand deposits | $ | 7,366,899 | 6,095 | 0.17 | $ | 6,739,604 | 5,702 | 0.17 | ||||||||||||||
Savings and money market accounts | 20,278,379 | 35,666 | 0.35 | 19,179,946 | 40,485 | 0.43 | ||||||||||||||||
Certificates and other time deposits | 12,620,073 | 72,239 | 1.15 | 12,167,267 | 63,854 | 1.06 | ||||||||||||||||
Foreign office deposits | 121,325 | 117 | 0.19 | 126,980 | 149 | 0.24 | ||||||||||||||||
Total interest bearing deposits | 40,386,676 | 114,117 | 0.57 | 38,213,797 | 110,190 | 0.58 | ||||||||||||||||
FHLB and other borrowings | 4,194,210 | 32,548 | 1.57 | 4,129,882 | 31,941 | 1.56 | ||||||||||||||||
Federal funds purchased and securities sold under agreement to repurchase | 908,703 | 937 | 0.21 | 1,062,802 | 1,131 | 0.21 | ||||||||||||||||
Other short-term borrowings | 14,931 | 122 | 1.65 | 13,268 | 48 | 0.73 | ||||||||||||||||
Total interest bearing liabilities | 45,504,520 | 147,724 | 0.66 | 43,419,749 | 143,310 | 0.67 | ||||||||||||||||
Noninterest bearing deposits | 15,999,415 | 14,052,643 | ||||||||||||||||||||
Other noninterest bearing liabilities | 1,465,001 | 1,181,326 | ||||||||||||||||||||
Total liabilities | 62,968,936 | 58,653,718 | ||||||||||||||||||||
Shareholder's equity | 11,720,415 | 11,246,421 | ||||||||||||||||||||
Total liabilities and shareholder's equity | $ | 74,689,351 | $ | 69,900,139 | ||||||||||||||||||
Net interest income/ net interest spread | 1,029,146 | 3.09 | % | 1,060,510 | 3.63 | % | ||||||||||||||||
Net yield on earning assets | 3.28 | % | 3.78 | % | ||||||||||||||||||
Total taxable equivalent adjustment | 35,073 | 27,249 | ||||||||||||||||||||
Net interest income | $ | 994,073 | $ | 1,033,261 | ||||||||||||||||||
[a] Excludes adjustment for market valuation. | ||||||||||||||||||||||
9
BBVA COMPASS BANCSHARES, INC. (Unaudited) (Dollars in thousands) | |||||||||||||||||||||||||||||||
Six Months | Three Months Ended | ||||||||||||||||||||||||||||||
Ended June 30 | % | 2014 | 2013 | ||||||||||||||||||||||||||||
2014 | 2013 | Change | June 30 | March 31 | December 31 | September 30 | June 30 | ||||||||||||||||||||||||
NONINTEREST INCOME | |||||||||||||||||||||||||||||||
Service charges on deposit accounts | $ | 108,349 | $ | 110,372 | (2 | ) | $ | 54,958 | $ | 53,391 | $ | 56,812 | $ | 54,229 | $ | 54,884 | |||||||||||||||
Card and merchant processing fees | 52,777 | 50,737 | 4 | 28,473 | 24,304 | 25,320 | 26,132 | 26,113 | |||||||||||||||||||||||
Retail investment sales | 55,408 | 49,690 | 12 | 28,844 | 26,564 | 25,552 | 22,034 | 25,311 | |||||||||||||||||||||||
Asset management fees | 21,293 | 20,705 | 3 | 10,535 | 10,758 | 9,796 | 10,438 | 10,636 | |||||||||||||||||||||||
Corporate and correspondent investment sales | 16,628 | 18,943 | (12 | ) | 7,972 | 8,656 | 8,720 | 8,011 | 9,547 | ||||||||||||||||||||||
Mortgage banking income | 10,426 | 24,611 | (58 | ) | 6,150 | 4,276 | 3,178 | 7,610 | 13,141 | ||||||||||||||||||||||
Bank owned life insurance | 8,204 | 8,679 | (5 | ) | 4,237 | 3,967 | 4,846 | 4,222 | 4,274 | ||||||||||||||||||||||
Other | 144,248 | 115,848 | 25 | 72,812 | 71,436 | 56,850 | 78,309 | 64,150 | |||||||||||||||||||||||
417,333 | 399,585 | 4 | 213,981 | 203,352 | 191,074 | 210,985 | 208,056 | ||||||||||||||||||||||||
Investment securities gains, net | 37,898 | 33,030 | 15 | 21,464 | 16,434 | (1,659 | ) | — | 18,075 | ||||||||||||||||||||||
Gain (loss) on prepayment of FHLB and other borrowings | (458 | ) | 21,775 | NM | — | (458 | ) | — | — | 22,882 | |||||||||||||||||||||
Total noninterest income | $ | 454,773 | $ | 454,390 | — | $ | 235,445 | $ | 219,328 | $ | 189,415 | $ | 210,985 | $ | 249,013 | ||||||||||||||||
NONINTEREST EXPENSE | |||||||||||||||||||||||||||||||
Salaries, benefits and commissions | $ | 525,870 | $ | 499,228 | 5 | $ | 263,301 | $ | 262,569 | $ | 261,643 | $ | 244,373 | $ | 247,905 | ||||||||||||||||
FDIC indemnification expense | 61,988 | 156,642 | (60 | ) | 30,370 | 31,618 | 55,453 | 55,064 | 70,335 | ||||||||||||||||||||||
Professional services | 96,189 | 89,003 | 8 | 49,790 | 46,399 | 58,204 | 44,195 | 49,729 | |||||||||||||||||||||||
Equipment | 109,207 | 98,506 | 11 | 55,469 | 53,738 | 59,070 | 50,483 | 50,891 | |||||||||||||||||||||||
Net occupancy | 79,157 | 78,365 | 1 | 40,200 | 38,957 | 40,115 | 39,257 | 40,471 | |||||||||||||||||||||||
Marketing | 18,510 | 18,994 | (3 | ) | 9,986 | 8,524 | 9,212 | 9,146 | 9,926 | ||||||||||||||||||||||
Communications | 12,641 | 11,493 | 10 | 6,294 | 6,347 | 7,392 | 7,080 | 4,682 | |||||||||||||||||||||||
Amortization of intangibles | 26,165 | 31,502 | (17 | ) | 13,631 | 12,534 | 14,305 | 14,884 | 15,462 | ||||||||||||||||||||||
Other | 134,402 | 116,632 | 15 | 76,221 | 58,181 | 71,277 | 57,657 | 65,299 | |||||||||||||||||||||||
Total noninterest expense | $ | 1,064,129 | $ | 1,100,365 | (3 | ) | $ | 545,262 | $ | 518,867 | $ | 576,671 | $ | 522,139 | $ | 554,700 | |||||||||||||||
NM = Not meaningful | |||||||||||||||||||||||||||||||
10