Exhibit 99.1

September 2017 FLY LEASING

DISCLAIMER Forward-Looking Statements:This presentation contains certain “forward-looking statements” within the meaning of the Private Securities Litigation Reform Act of 1995. Forward-looking statements may be identified by words such as “expects,” “intends,” “anticipates,” “plans,” “believes,” “seeks,” “estimates,” “will,” or words of similar meaning and include, but are not limited to, statements regarding the outlook for FLY’s future business and financial performance. Forward-looking statements are based on management’s current expectations and assumptions, which are subject to inherent uncertainties, risks and changes in circumstances that are difficult to predict. Actual outcomes and results may differ materially due to global political, economic, business, competitive, market, regulatory and other factors and risks, including FLY’s inability to achieve its portfolio growth expectations or its failure to achieve the benefits of such growth. Further information on the factors and risks that may affect FLY’s business is included in filings FLY makes with the Securities and Exchange Commission (the “SEC”) from time to time, including its Annual Report on Form 20-F and its Reports on Form 6-K. FLY expressly disclaims any obligation to update or revise any of these forward-looking statements, whether because of future events, new information, a change in its views or expectations, or otherwise.Notes:All period end figures are as of June 30, 2017 except as otherwise noted. Share repurchase data is as of August 30, 2017.Fleet age and lease term are calculated using the weighted net book value of flight equipment held for operating lease, including maintenance rights and investment in finance lease, at period end.In addition to U.S. GAAP financials, this presentation includes certain non-GAAP financial measures. These non-GAAP financial measures are in addition to, not a substitute for or superior to, measures of financial performance prepared in accordance with U.S. GAAP. We have provided a reconciliation of those measures to the most directly comparable GAAP measures in the Appendix. For further information, please refer to the earnings press release dated August 10, 2017. Industry sources per IATA.

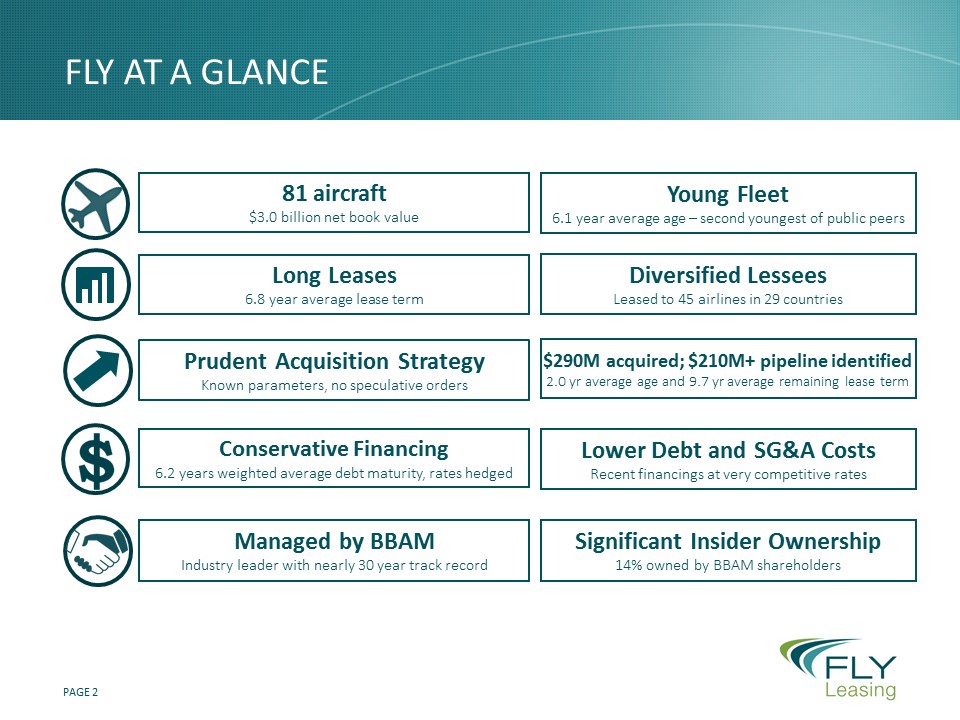
Conservative Financing6.2 years weighted average debt maturity, rates hedged 81 aircraft$3.0 billion net book value Lower Debt and SG&A CostsRecent financings at very competitive rates Managed by BBAMIndustry leader with nearly 30 year track record Significant Insider Ownership14% owned by BBAM shareholders Young Fleet6.1 year average age – second youngest of public peers FLY AT A GLANCE Prudent Acquisition StrategyKnown parameters, no speculative orders Long Leases6.8 year average lease term Diversified LesseesLeased to 45 airlines in 29 countries $290M acquired; $210M+ pipeline identified 2.0 yr average age and 9.7 yr average remaining lease term

Favorable industry fundamentals Passenger traffic growth is robust • 7.4% forecast in 2017, 7.9% actual through 1H 2017 Strong Global Air Traffic Growth Airline industry results are positive • Forecast global net profit of $31 billion in 2017 Continued Airline Profitability Strong demand for aircraft • Created by continuing strong passenger demand Healthy Demand for Aircraft Attractive markets for aircraft financing • Ample capacity and attractive rates Positive Financial Markets

Significant accomplishments in last two years Sold 71 older, less profitable aircraft since start of 2015 Selling Older and Under-Performing Aircraft Invested $1.5 billion in 25 younger aircraft since start of 2015 Reinvesting in Newer, Higher Yielding Aircraft Repurchased 30% of shares at a 31% discount to Q2 book value since Sept. 30, 2015 Repurchasing Shares at a Discount to Book Value Reduced management fees and cost of secured debt to less than 4% Actively Managing Liabilities and Costs

Meaningful TWO YEAR FLEET transformation Transformed fleet—Younger, more profitableSecond youngest fleet among public lessors Average Fleet Age (years) Average Lease Term (years) (24%) 31%

June 30, 2017 June 30, 2015 Aircraft Type # Average Age(years) % NBV # Average Age(years) % NBV A320 Family 25 8.6 20% 35 8.7 31% A330 / 340 5 6.4 8% 6 5.9 15% B737 Family 41 7.4 41% 41 7.4 45% B747 / 757 / 767 3(1) 20.9 1% 13 17.5 6% B777 2 1.8 11% - - - B787 5 2.2 19% 1 1.9 3% Total 81 6.1 100% 96 8.0 100% Significant Improvement in asset mix Only 757s remaining.

Annual growth target of $750 millionPrincipally through sale and leasebacksBBAM’s area of expertise for nearly 30 yearsBBAM’s global reach provides advantageOpportunistic secondary market purchasesEach transaction can be evaluated prior to commitment Actual aircraft cost, lessee credit, lease termsAvailability and terms of financing ACQUISITION STRATEGY

Executing on Fleet Growth Attractive Acquisition Pipeline $750 million Annual Target $459 million acquired and identified in 2017 • Additional $40+ million identified for 2018 Young, Popular Aircraft11 aircraft including two B737-8 MAXs • 2 year average age • 9.7 year remaining lease term Positive Financial Impact$51 million additional rental revenue • $16 million of pre-tax income annually Ample Capacity Over $2 billion of additional buying power

Historic Sales track record Historical Aircraft Sales 2013 2014 2015 2016 Aircraft Sold 10 8 44 27 Average Age (years) 14 13 13 14 Total Gains (in millions) $5.4 $14.8 $29.0 $24.5 2016 Sales: 27 aircraft, average age of 14 years Average remaining lease term of three years Principally older, less profitableGain of $24.5 million (4.5% premium to net book value)Additional $2.7 million gain on conversion to finance lease

Share repurchase update Repurchased 3.3 million shares for $43.4 million in 2017 as of August 30, 201710% of FLY’s shares repurchased in 2017Average price per share of $13.25 in 201731% discount to Q2 NBV per share$23 million remaining in share repurchase program

Conservative Fleet Growth and Financing • Potential for Increased EPS and NBV per Share Attractive Investment with Upside 6.1 Year Average Age • 6.8 Year Average Lease Term Young Fleet, Long Leases Ample Liquidity • Unencumbered Aircraft • Long Debt Maturities • Over $2 Billion Capacity Balance Sheet Capacity Ongoing Fleet Additions • Significant Share Repurchases • Reducing Interest Costs Focus on Growth and Efficiency Well Positioned to add value

appendices

Capital structure & liquidity summary Weighted average debt maturity of 6.2 years Represents the contractual interest rates and effect of derivative instruments and excludes the amortization of debt discounts and debt issuance costs.Represents the ratio of total debt, less unrestricted cash and cash equivalents, divided by shareholders’ equity.

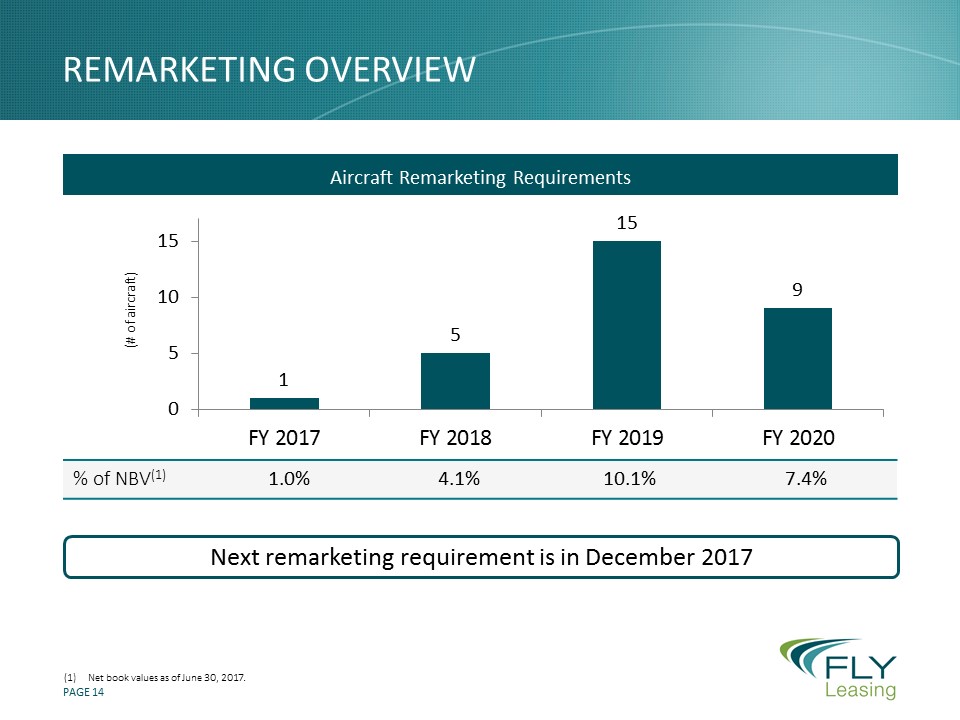
remarketing overview Aircraft Remarketing Requirements Next remarketing requirement is in December 2017 (# of aircraft) % of NBV(1) 1.0% 4.1% 10.1% 7.4% Net book values as of June 30, 2017.

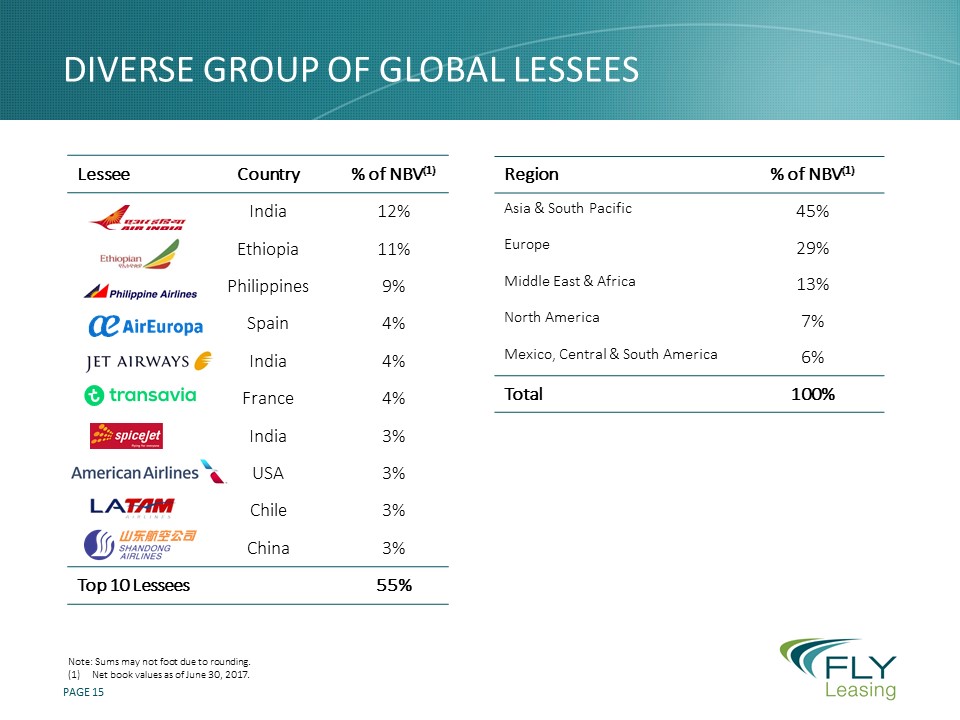
Diverse group of global lessees Note: Sums may not foot due to rounding.Net book values as of June 30, 2017. Lessee Country % of NBV(1) India 12% Ethiopia 11% Philippines 9% Spain 4% India 4% France 4% India 3% USA 3% Chile 3% China 3% Top 10 Lessees 55% Region % of NBV(1) Asia & South Pacific 45% Europe 29% Middle East & Africa 13% North America 7% Mexico, Central & South America 6% Total 100%

2013 2014 2015 2016 1H 2017 Aircraft Acquired 14 22 10 10 5 Average Age when Acquired (years) 2 3 2 3 <1 Total Acquisition Costs (in millions) $642 $952 $615 $559 $290 Historic ACQUISITION track Record Historical Aircraft Acquisitions Ample liquidity:$840 million in cash and unencumbered assets to invest in younger aircraft$178 million of remaining capacity in warehouse facility