Exhibit 99.1
|
|
|
|
|
|

NEWS
RELEASE
|
FOR IMMEDIATE RELEASE | |
|
CONTACT: |
Anna E. Torma |
|
|
(512) 433-5312 |
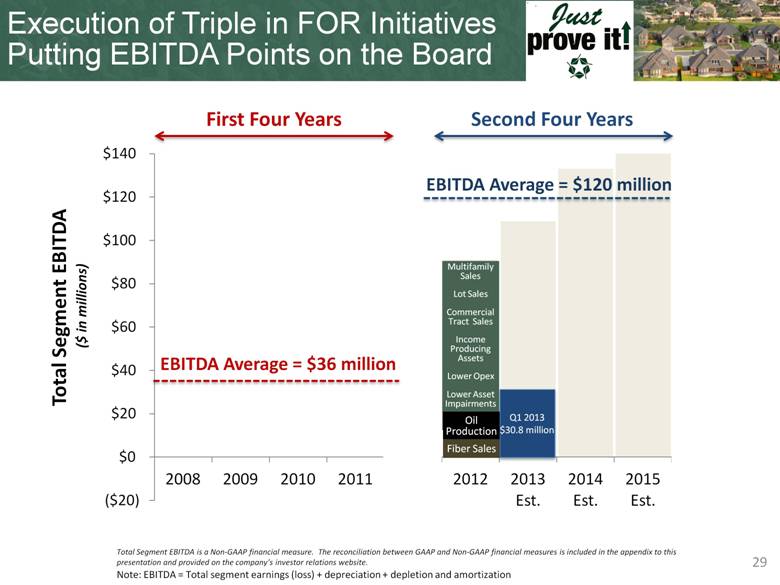
FORESTAR GROUP INC. REPORTS
FIRST QUARTER 2013 RESULTS
Accelerating Value Realization through Higher Residential Lot Sales, Increased Oil Production and Capitalizing on Multifamily Opportunities
AUSTIN, TEXAS, May 8, 2013—Forestar Group Inc. (NYSE: FOR) today reported first quarter 2013 net income of approximately $4.0 million, or $0.11 per diluted share, compared with first quarter 2012 net income of approximately $2.8 million, or $0.08 per diluted share outstanding.
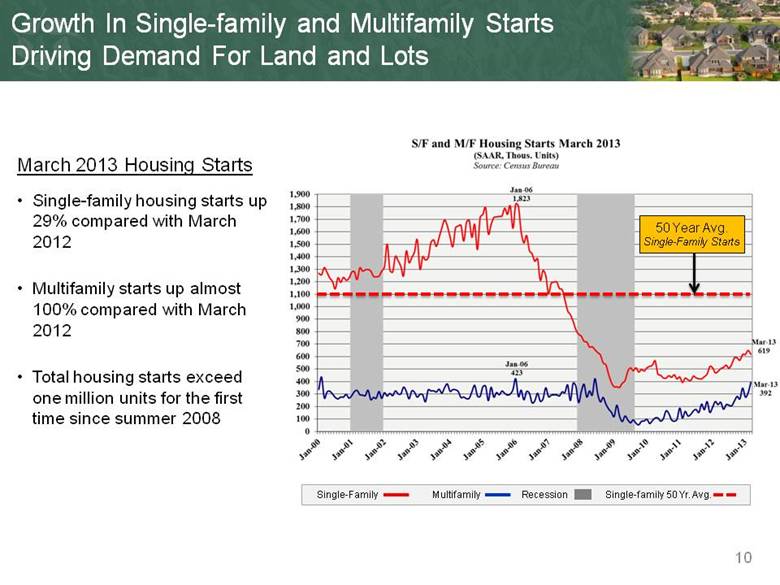
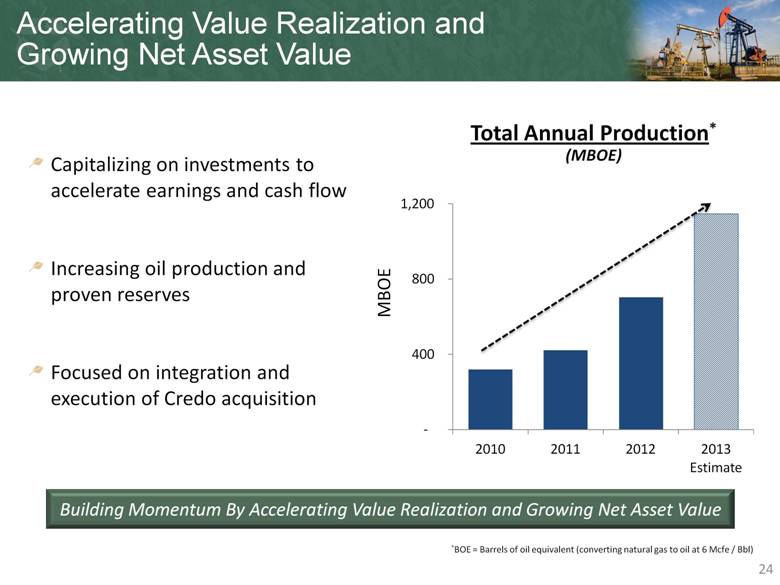
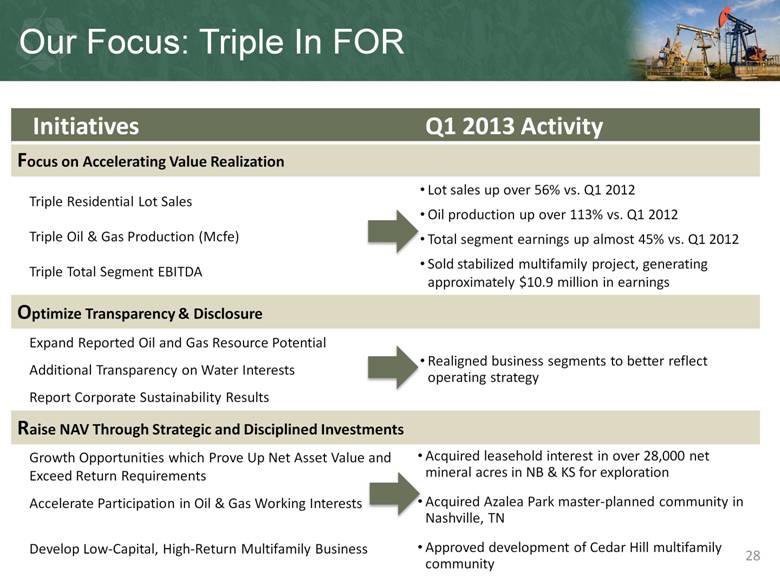
“During first quarter, increased residential lot sales activity continued to reflect positive momentum and signs of a sustainable housing recovery. Residential real estate markets in Texas continue to benefit from low finished lot inventories combined with a significant increase in housing starts. Multifamily market conditions also remain strong in our target markets, and during the quarter, we sold Promesa, a wholly-owned multifamily community we developed in Austin, for $41 million, generating earnings of $10.9 million. In addition, oil and gas revenues continued to gain momentum, with increased oil production in the Bakken and Three Forks formations in North Dakota and the Lansing-Kansas City formation in Kansas and Nebraska, principally due to our acquisition of Credo Petroleum. We are focused on executing and delivering our Triple in FOR strategic initiatives to accelerate value realization, optimize transparency and disclosure and grow net asset value through strategic and disciplined investments,” said Jim DeCosmo, president and chief executive officer of Forestar Group.
First Quarter 2013 Significant Highlights
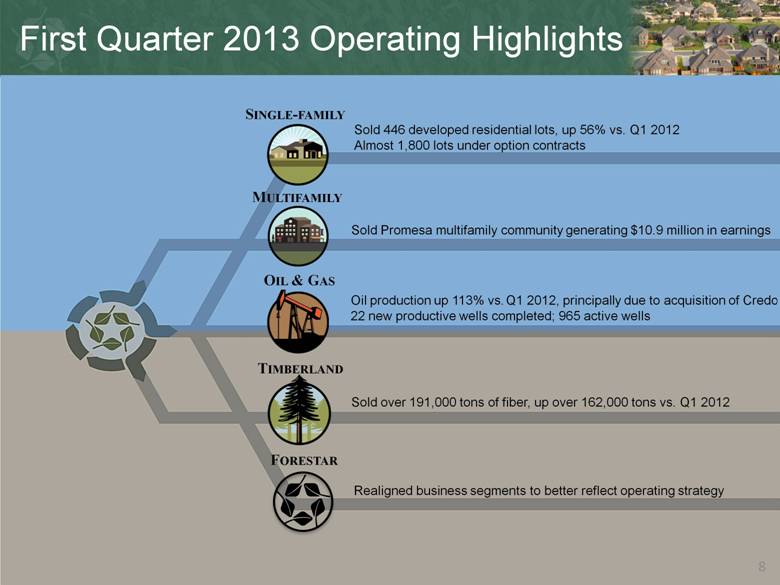
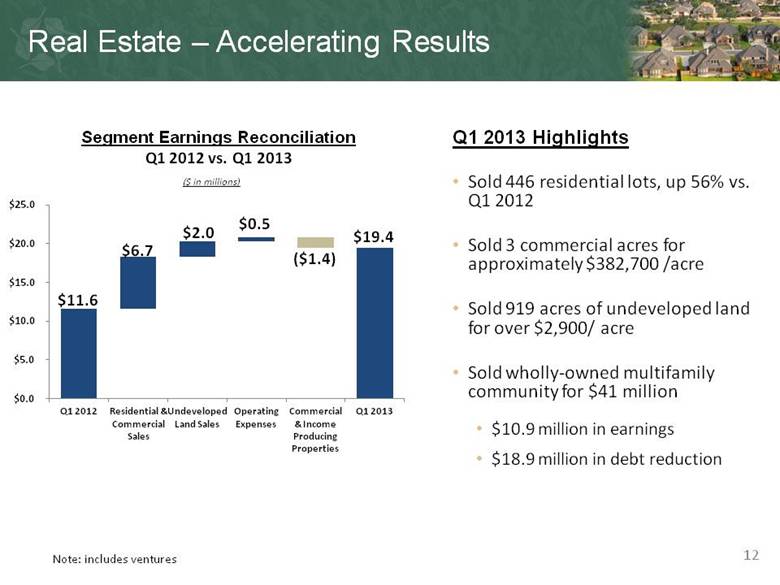
· Sold Promesa, a wholly-owned multifamily community we developed in Austin for $41 million, generating earnings of $10.9 million
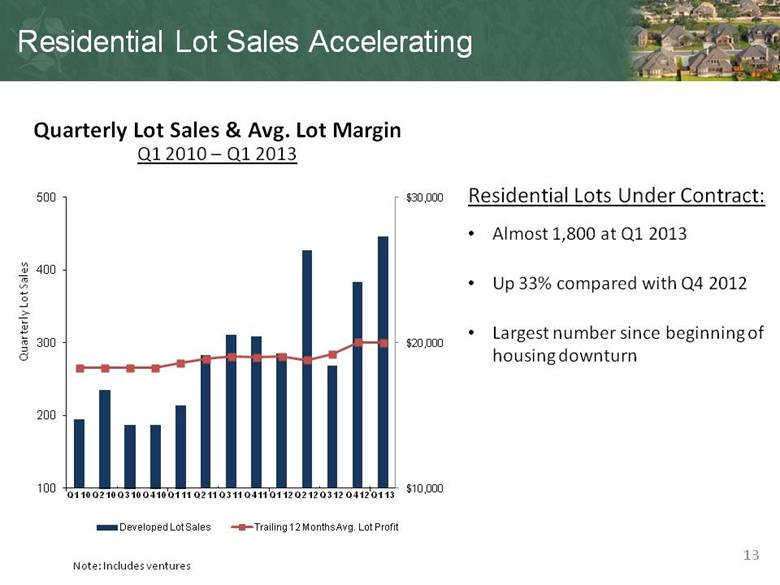
· Sold 446 developed residential lots, a 56% increase compared with first quarter 2012
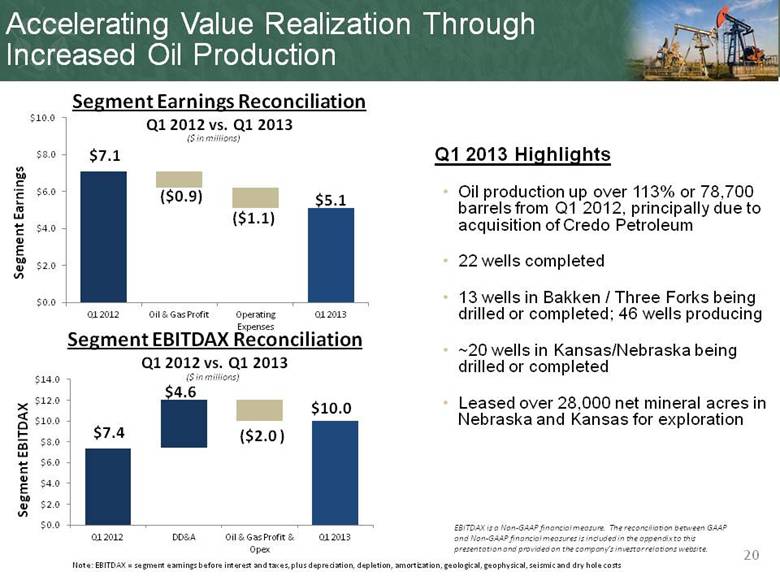
· Oil production up over 113% compared with first quarter 2012, principally due to the acquisition of Credo Petroleum
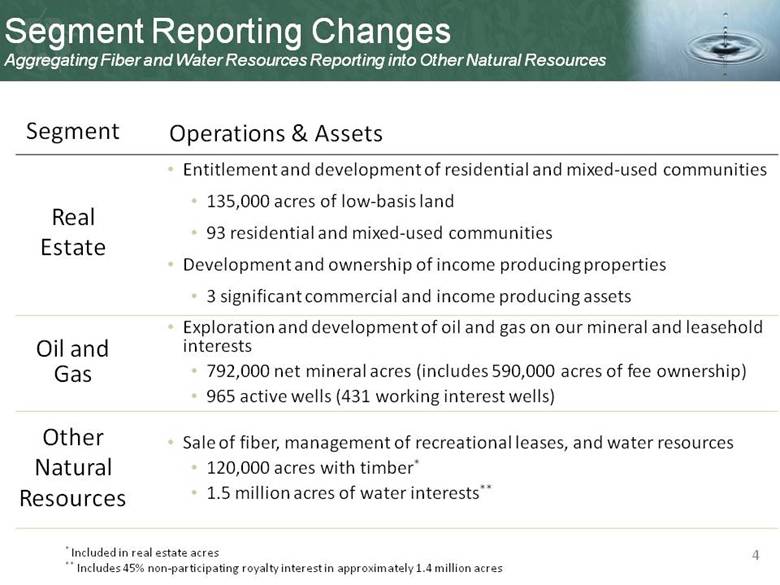
Segment Reporting Change
Forestar has realigned its reportable segments to better reflect the underlying market fundamentals and operating strategy of its core businesses. With this change, we have aggregated our fiber and water resources operating results in other natural resources. The company manages its operations through three business segments: real estate, oil and gas and other natural resources.
REAL ESTATE
First Quarter 2013 Significant Highlights
· Sold Promesa, a wholly-owned multifamily community we developed in Austin for $41.0 million, generating earnings of $10.9 million
· Sold 446 developed residential lots, a 56% increase compared with first quarter 2012 — Almost 1,800 lots under option contracts
· Sold 919 acres of undeveloped land for over $2,900 per acre
· Sold 3 commercial acres for over $382,000 per acre
Segment Financial Results:
|
($ in millions) |
|
1Q 2013 |
|
1Q 2012 |
|
4Q 2012 |
| |||
|
Segment Revenues |
|
$ |
78.7 |
|
$ |
17.9 |
|
$ |
48.4 |
|
|
Segment Earnings |
|
$ |
19.4 |
|
$ |
11.6 |
|
$ |
21.7 |
|
First quarter 2013 real estate segment earnings were higher compared with first quarter 2012 principally due to higher residential lot sales. Real estate segment earnings declined in first quarter 2013 compared with fourth quarter 2012 primarily due to lower undeveloped land sales.
OIL AND GAS
First Quarter 2013 Significant Highlights
· Oil production up over 113% compared with first quarter 2012, principally due to the acquisition of Credo Petroleum
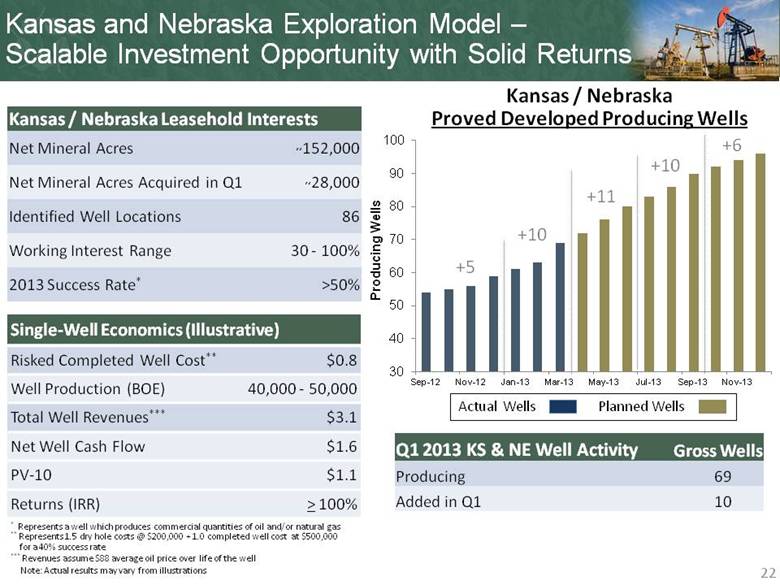
· 22 new productive oil and gas wells drilled; 965 producing wells at quarter-end, up from 534 wells in first quarter 2012, principally due to acquisition of Credo Petroleum
Segment Financial Results:
|
($ in millions) |
|
1Q 2013 |
|
1Q 2012 |
|
4Q 2012 |
| |||
|
Segment Revenues |
|
$ |
15.5 |
|
$ |
9.4 |
|
$ |
17.2 |
|
|
Segment Earnings |
|
$ |
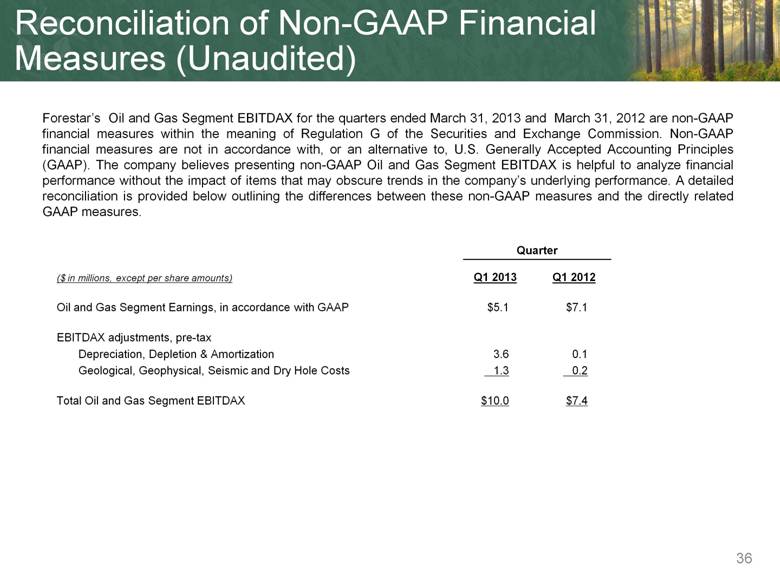
5.1 |
|
$ |
7.1 |
|
$ |
7.1 |
|
Oil and gas segment earnings decreased in first quarter 2013 compared with first quarter 2012 principally due to reduced oil volumes associated with our owned mineral interests, lower oil prices, decreased delay rental revenues and incremental personnel costs, which were partially offset by increased oil production attributable to the acquisition of Credo Petroleum. Oil and gas segment earnings decreased in first quarter 2013 compared with fourth quarter 2012 primarily due to lower oil production, which was partially offset by higher oil prices.
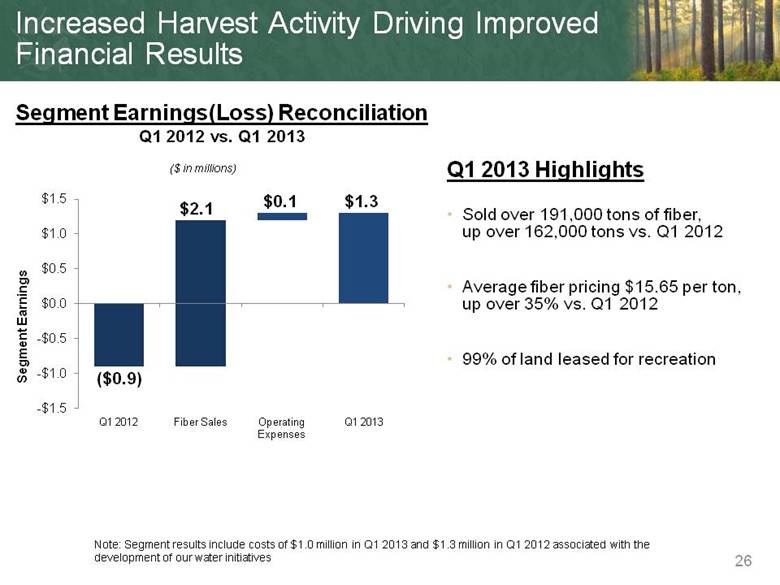
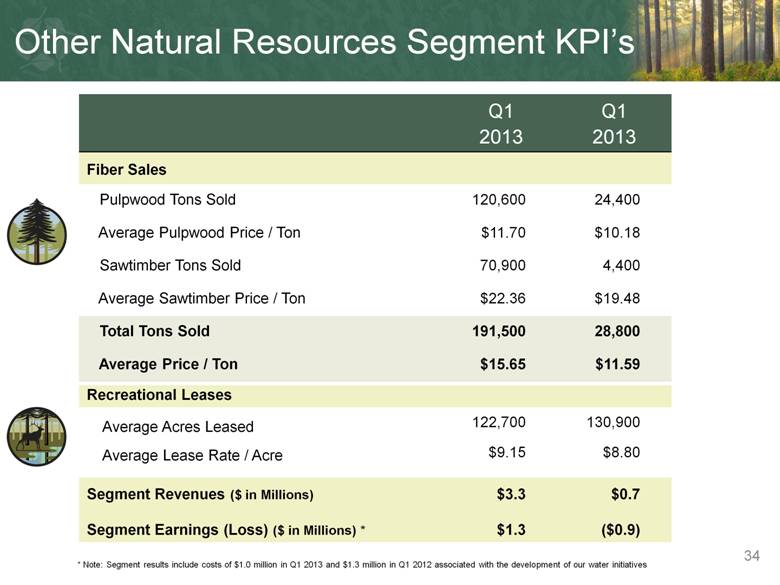
OTHER NATURAL RESOURCES
First Quarter 2013 Significant Highlights
· Sold over 191,000 tons of fiber for $15.65 per ton
· Recreational leasing remains strong
Segment Financial Results:
|
($ in millions) |
|
1Q 2013 |
|
1Q 2012 |
|
4Q 2012 |
| |||
|
Segment Revenues |
|
$ |
3.3 |
|
$ |
0.7 |
|
$ |
3.0 |
|
|
Segment Earnings (Loss) |
|
$ |
1.3 |
|
$ |
(0.9 |
) |
$ |
0.8 |
|
First quarter 2013 other natural resources segment earnings were higher compared with first quarter 2012 principally due to over 162,000 tons of additional fiber sales and a 35% increase in average pricing per ton. Other natural resources segment earnings increased in first quarter 2013 compared with fourth quarter 2012 primarily due to higher fiber sales.
OUTLOOK
“Housing markets continue to show solid signs of a sustainable recovery, with growing demand for residential lots and increased interest in residential and commercial tracts. Our backlog remains strong and we are well positioned to accelerate real estate sales during this housing recovery. Our multifamily team successfully developed, leased, and monetized our Promesa community in only 24 months, generating well above cost of capital returns for our business, reflections of the project quality, experience of our team and favorable multifamily market conditions. We continue to build a solid pipeline of multifamily development opportunities, with construction at our multifamily ventures in Austin and Denver on target to begin delivering units in 2013, and our sites in Dallas, Nashville and Charlotte should be under construction by year-end. We will continue to evaluate and acquire additional multifamily sites to further increase our pipeline of quality multifamily development opportunities.
“We continue to generate positive momentum through our oil and gas initiatives to increase exploration activity, production and reserves. During first quarter, we experienced a significant increase in North Dakota drilling activity, with approximately twelve Bakken or Three Forks wells (5% average working interest) reaching total depth during the quarter. We anticipate drilling activity in the Bakken to accelerate in the second half of 2013. In addition, exploration and drilling activity in Kansas and Nebraska also ramped up during first quarter, with 19 wells (59% average working interest) reaching total depth, ten of which have been economic. Our exploration initiatives in Kansas and Nebraska are yielding favorable success rates and strong risk-adjusted returns, and we continue to lease additional acreage in this basin. During first quarter 2013, Forestar acquired leasehold interests in over 28,000 net mineral acres in new and existing prospects in Nebraska and Kansas.
“We continue to increase our momentum toward delivering our Triple in FOR strategic initiatives, focused on accelerating value realization, increasing transparency and disclosure, growing our net asset value through strategic and disciplined investments. We are off to a great start and we are well positioned for 2013,” concluded Mr. DeCosmo.
The Company will host a conference call on May 8, 2013 at 10:00 am ET to discuss results of first quarter 2013. The meeting may be accessed through webcast or by conference call. The webcast may be accessed through Forestar’s Internet site at www.forestargroup.com. To access the conference call, listeners calling from North America should dial 1-877-280-4958 at least 15 minutes prior to the start of the meeting. Those wishing to access the call from outside North America should dial 1-857-244-7315. The password is Forestar. Replays of the call will be available for two weeks following the completion of the live call and can be accessed at 1-888-286-8010 in North America and at 1-617-801-6888 outside North America. The password for the replay is 95046996.
About Forestar Group
Forestar Group Inc. operates in three business segments: real estate, oil and gas and other natural resources. At the end of first quarter 2013, the real estate segment owns directly or through ventures almost 135,000 acres of real estate located in ten states and fourteen markets in the U.S. The real estate segment has 14 real estate projects representing approximately 25,980 acres currently in the entitlement process, and 72 entitled, developed and under development projects in eight states and twelve markets encompassing almost 14,400 acres, comprised of almost 23,600 planned residential lots and almost 2,400 commercial acres. The oil and gas segment includes approximately 792,000 net acres of oil and gas mineral interests, with approximately 590,000 acres of fee ownership located principally in Texas, Louisiana, Alabama, and Georgia and almost 202,000 net acres of leasehold interests principally located in Nebraska, Kansas, Oklahoma, North Dakota and Texas. These leasehold interests include almost 6,000 net mineral acres in the core of the prolific Bakken and Three Forks formations. The other natural resources segment includes sale of wood fiber and management of our recreational leases, and approximately 1.5 million acres of groundwater resources, including a 45% nonparticipating royalty interest in groundwater produced or withdrawn for commercial purposes from approximately 1.4 million acres in Texas, Louisiana, Georgia and Alabama and about 20,000 acres of groundwater leases in central Texas. Forestar’s address on the World Wide Web is www.forestargroup.com.
Forward Looking Statements
This release contains “forward-looking statements” within the meaning of the federal securities laws. Forward-looking statements are typically identified by words or phrases such as “will,” “anticipate,” “estimate,” “expect,” “project,” “intend,” “plan,” “believe,” “target,” “forecast,” and other words and terms of similar meaning. These statements reflect management’s current views with respect to future events and are subject to risk and uncertainties. We note that a variety of factors and uncertainties could cause our actual results to differ significantly from the results discussed in the forward-looking statements, including our ability to achieve synergies and value creation contemplated by the merger with Credo, and our ability to promptly and effectively integrate Credo’s businesses. Other factors and uncertainties that might cause such differences include, but are not limited to: general economic, market, or business conditions; changes in commodity prices; opportunities (or lack thereof) that may be presented to us and that we may pursue; fluctuations in costs and expenses including development costs; demand for new housing, including impacts from mortgage credit availability; lengthy and uncertain entitlement processes; cyclicality of our businesses; accuracy of accounting assumptions; competitive actions by other companies; changes in laws or regulations; and other factors, many of which are beyond our control. Except as required by law, we expressly disclaim any obligation to publicly revise any forward-looking statements contained in this news release to reflect the occurrence of events after the date of this news release.
FORESTAR GROUP INC.
(UNAUDITED)
Business Segments
|
|
|
First Quarter |
| ||||
|
|
|
2013 |
|
2012 |
| ||
|
|
|
(In thousands, |
| ||||
|
Revenues |
|
|
|
|
| ||
|
Real estate |
|
$ |
78,689 |
|
$ |
17,922 |
|
|
Oil and gas |
|
15,504 |
|
9,426 |
| ||
|
Other natural resources |
|
3,278 |
|
744 |
| ||
|
Total revenues |
|
$ |
97,471 |
|
$ |
28,092 |
|
|
|
|
|
|
|
| ||
|
Segment earnings |
|
|
|
|
| ||
|
Real estate |
|
$ |
19,446 |
|
$ |
11,577 |
|
|
Oil and gas |
|
5,127 |
|
7,128 |
| ||
|
Other natural resources |
|
1,252 |
|
(863 |
) | ||
|
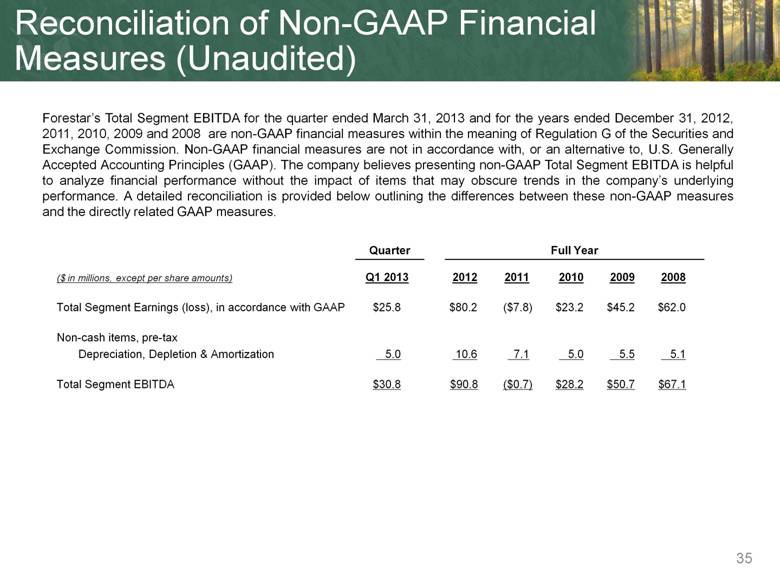
Total segment earnings |
|
25,825 |
|
17,842 |
| ||
|
Items not allocated to segments: |
|
|
|
|
| ||
|
General and administrative expense |
|
(4,958 |
) |
(4,362 |
) | ||
|
Share-based compensation expense |
|
(10,415 |
) |
(5,231 |
) | ||
|
Interest expense |
|
(4,539 |
) |
(3,891 |
) | ||
|
Other corporate non-operating income |
|
31 |
|
64 |
| ||
|
Income before taxes |
|
5,944 |
|
4,422 |
| ||
|
Income tax expense |
|
(1,993 |
) |
(1,620 |
) | ||
|
Net income attributable to Forestar Group Inc. |
|
$ |
3,951 |
|
$ |
2,802 |
|
|
|
|
|
|
|
| ||
|
Net income per common share: |
|
|
|
|
| ||
|
Basic |
|
$ |
0.11 |
|
$ |
0.08 |
|
|
Diluted |
|
$ |
0.11 |
|
$ |
0.08 |
|
|
|
|
|
|
|
| ||
|
Weighted average common shares outstanding: |
|
|
|
|
| ||
|
Basic |
|
35.3 |
|
34.9 |
| ||
|
Diluted |
|
35.7 |
|
35.2 |
| ||
|
|
|
First Quarter |
| ||||
|
Supplemental Financial Information: |
|
2013 |
|
2012 |
| ||
|
|
|
(In thousands) |
| ||||
|
|
|
|
|
|
| ||
|
Cash and cash equivalents |
|
$ |
86,653 |
|
$ |
6,801 |
|
|
|
|
|
|
|
| ||
|
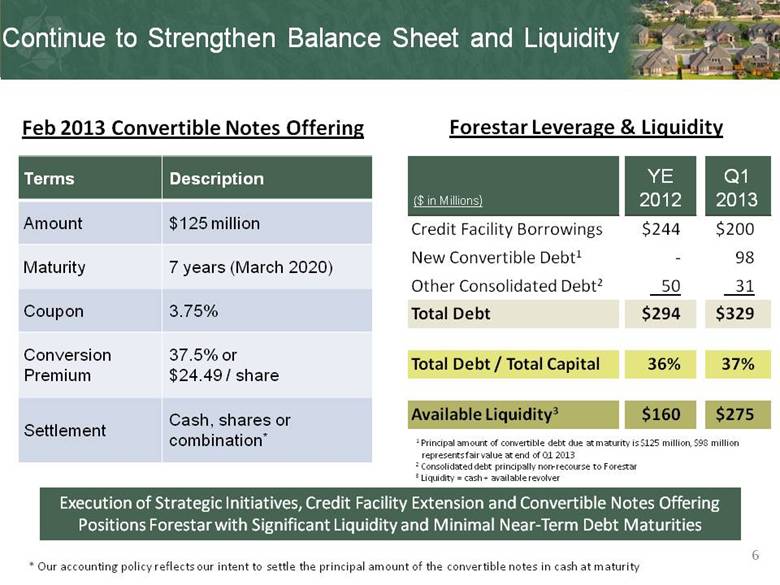
Borrowings under credit facility |
|
$ |
200,000 |
|
$ |
136,000 |
|
|
Convertible senior notes, net of discount (a) |
|
97,593 |
|
— |
| ||
|
Other debt (b) |
|
31,027 |
|
91,865 |
| ||
|
Total debt |
|
$ |
328,620 |
|
$ |
227,865 |
|
(a) Represents $125 million convertible senior notes issued February 2013, net of unamortized discount
(b) Consists principally of consolidated venture non-recourse debt.
FORESTAR GROUP INC.
REAL ESTATE SEGMENT
PERFORMANCE METRICS
|
|
|
First Quarter |
| ||||
|
REAL ESTATE |
|
2013 |
|
2012 |
| ||
|
Owned, Consolidated & Equity Method Ventures: |
|
|
|
|
| ||
|
Residential Lots Sold |
|
446 |
|
285 |
| ||
|
Revenue per Lot Sold |
|
$ |
51,900 |
|
$ |
53,000 |
|
|
Commercial Acres Sold |
|
3 |
|
— |
| ||
|
Revenue per Commercial Acre Sold |
|
$ |
382,700 |
|
— |
| |
|
Undeveloped Acres Sold |
|
919 |
|
455 |
| ||
|
Revenue per Acre Sold |
|
$ |
2,900 |
|
$ |
2,400 |
|
|
Owned & Consolidated Ventures: |
|
|
|
|
| ||
|
Residential Lots Sold |
|
355 |
|
137 |
| ||
|
Revenue per Lot Sold |
|
$ |
52,500 |
|
$ |
62,000 |
|
|
Commercial Acres Sold |
|
3 |
|
— |
| ||
|
Revenue per Commercial Acre Sold |
|
$ |
382,700 |
|
— |
| |
|
Undeveloped Acres Sold |
|
919 |
|
320 |
| ||
|
Revenue per Acre Sold |
|
$ |
2,900 |
|
$ |
2,300 |
|
|
Ventures Accounted For Using the Equity Method: |
|
|
|
|
| ||
|
Residential Lots Sold |
|
91 |
|
148 |
| ||
|
Revenue per Lot Sold |
|
$ |
49,600 |
|
$ |
44,600 |
|
|
Commercial Acres Sold |
|
— |
|
— |
| ||
|
Revenue per Commercial Acre Sold |
|
— |
|
— |
| ||
|
Undeveloped Acres Sold |
|
— |
|
135 |
| ||
|
Revenue per Acre Sold |
|
— |
|
$ |
2,600 |
| |
FIRST QUARTER 2013
REAL ESTATE PIPELINE
|
Real Estate |
|
Undeveloped |
|
In |
|
Entitled |
|
Developed & |
|
Total |
|
|
|
|
|
|
|
|
|
|
|
|
|
|
|
Undeveloped Land |
|
|
|
|
|
|
|
|
|
|
|
|
Owned |
|
87,543 |
|
|
|
|
|
|
|
|
|
|
Ventures |
|
6,901 |
|
|
|
|
|
|
|
94,444 |
|
|
|
|
|
|
|
|
|
|
|
|
|
|
|
Residential |
|
|
|
|
|
|
|
|
|
|
|
|
Owned |
|
|
|
23,272 |
|
9,005 |
|
821 |
|
|
|
|
Ventures |
|
|
|
|
|
1,898 |
|
281 |
|
35,277 |
|
|
|
|
|
|
|
|
|
|
|
|
|
|
|
Commercial |
|
|
|
|
|
|
|
|
|
|
|
|
Owned |
|
|
|
2,708 |
|
1,201 |
|
591 |
|
|
|
|
Ventures |
|
|
|
|
|
387 |
|
190 |
|
5,077 |
|
|
|
|
|
|
|
|
|
|
|
|
|
|
|
Total Acres |
|
94,444 |
|
25,980 |
|
12,491 |
|
1,883 |
|
134,798 |
|
|
|
|
|
|
|
|
|
|
|
|
|
|
|
Estimated Residential Lots |
|
|
|
|
|
20,500 |
|
3,063 |
|
23,563 |
|
* In addition, Forestar owns a 58% interest in a venture which controls approximately 16,000 acres of undeveloped land in Georgia with minimal investment. Excludes acres associated with fully developed commercial and income producing properties.
FORESTAR GROUP INC.
OIL AND GAS SEGMENT
PERFORMANCE METRICS
|
|
|
First Quarter |
| ||||
|
|
|
2013 |
|
2012 |
| ||
|
Leasing Activity from Owned Mineral Interests |
|
|
|
|
| ||
|
Acres Leased |
|
310 |
|
805 |
| ||
|
Average Bonus / Acre |
|
$ |
316 |
|
$ |
357 |
|
|
Delay Rentals Received |
|
$ |
457,500 |
|
$ |
1,114,900 |
|
|
Oil & Gas Production |
|
|
|
|
| ||
|
Royalty Interests(1) |
|
|
|
|
| ||
|
Gross Wells |
|
543 |
|
534 |
| ||
|
Oil Production (Barrels) |
|
48,200 |
|
67,700 |
| ||
|
Average Oil Price ($ / Barrel) |
|
$ |
85.93 |
|
$ |
98.10 |
|
|
Natural Gas Production (MMcf) |
|
377.2 |
|
427.9 |
| ||
|
Average Natural Gas Price ($ / Mcf) |
|
$ |
3.04 |
|
$ |
3.20 |
|
|
BOE Production(2) |
|
111,100 |
|
139,000 |
| ||
|
Average Price ($ / BOE) |
|
$ |
47.64 |
|
$ |
57.61 |
|
|
Working Interests |
|
|
|
|
| ||
|
Gross Wells |
|
431 |
|
9 |
| ||
|
Oil Production (Barrels) |
|
99,600 |
|
1,500 |
| ||
|
Average Oil Price ($ / Barrel) |
|
$ |
90.76 |
|
$ |
73.68 |
|
|
Natural Gas Production (MMcf) |
|
216.7 |
|
24.3 |
| ||
|
Average Natural Gas Price ($ / Mcf) |
|
$ |
3.67 |
|
$ |
3.75 |
|
|
BOE Production(2) |
|
135,800 |
|
5,500 |
| ||
|
Average Price ($ / BOE) |
|
$ |
72.47 |
|
$ |
36.32 |
|
|
Total Oil & Gas Interests |
|
|
|
|
| ||
|
Gross Wells(3) |
|
965 |
|
534 |
| ||
|
Oil Production (Barrels) |
|
147,900 |
|
69,200 |
| ||
|
Average Oil Price ($ / Barrel) |
|
$ |
89.19 |
|
$ |
97.57 |
|
|
Natural Gas Production (MMcf) |
|
593.9 |
|
452.2 |
| ||
|
Average Natural Gas Price ($ / Mcf) |
|
$ |
3.27 |
|
$ |
3.23 |
|
|
BOE Production(2) |
|
246,800 |
|
144,600 |
| ||
|
Average Price ($ / BOE) |
|
$ |
61.30 |
|
$ |
56.80 |
|
|
Well Activity |
|
|
|
|
| ||
|
Mineral Interests Owned (3) |
|
|
|
|
| ||
|
Net Acres Held By Production |
|
29,000 |
|
31,700 |
| ||
|
Gross Wells Drilled |
|
— |
|
4 |
| ||
|
Productive Gross Wells |
|
543 |
|
534 |
| ||
|
Mineral Interests Leased |
|
|
|
|
| ||
|
Net Acres Held By Production(4) |
|
30,000 |
|
— |
| ||
|
Gross Wells Drilled |
|
22 |
|
— |
| ||
|
Productive Gross Wells(4) |
|
422 |
|
— |
| ||
|
Total Well Activity |
|
|
|
|
| ||
|
Net Acres Held By Production |
|
59,000 |
|
31,700 |
| ||
|
Gross Wells Drilled |
|
22 |
|
4 |
| ||
|
Productive Gross Wells |
|
965 |
|
534 |
| ||
(1) Includes our share of venture activity in which we own a 50% interest. Our share of natural gas production is 70 MMcf in first quarter 2013 and 90 MMcf in first quarter 2012
(2) BOE — Barrels of oil equivalent (converting natural gas to oil at 6 Mcfe / Bbl)
(3) Includes wells operated by third-party lessees/operators. Represent wells in which we own a royalty or working interest in a producing well
(4) Excludes 8,000 net acres and 1,181 wells in which we have an overriding royalty interest
FIRST QUARTER 2013
OIL AND GAS SEGMENT
MINERAL INTERESTS
MINERAL INTERESTS OWNED (1)
Forestar’s oil and gas segment includes approximately 590,000 owned net mineral acres principally located in Texas, Louisiana, Georgia and Alabama.
|
State |
|
Unleased |
|
Leased |
|
Held by |
|
Total (2) |
|
|
Texas |
|
213,000 |
|
12,000 |
|
27,000 |
|
252,000 |
|
|
Louisiana |
|
117,000 |
|
25,000 |
|
2,000 |
|
144,000 |
|
|
Georgia |
|
152,000 |
|
— |
|
— |
|
152,000 |
|
|
Alabama |
|
40,000 |
|
— |
|
— |
|
40,000 |
|
|
California |
|
1,000 |
|
— |
|
— |
|
1,000 |
|
|
Indiana |
|
1,000 |
|
— |
|
— |
|
1,000 |
|
|
Total |
|
524,000 |
|
37,000 |
|
29,000 |
|
590,000 |
|
(1) Represents net acres and includes ventures
(2) Excludes 477 net mineral acres located in Colorado, which includes 319 leased acres and 158 acres held by production
MINERAL INTERESTS LEASED (1)
Forestar’s oil and gas segment includes approximately 202,000 net mineral acres of leasehold interests principally located in Nebraska, Kansas, Oklahoma, North Dakota and Texas, predominantly as result of our September 28, 2012 acquisition of CREDO Petroleum.
|
State |
|
Undeveloped |
|
Held by |
|
Total (2) |
|
|
Nebraska |
|
107,000 |
|
2,000 |
|
109,000 |
|
|
Kansas |
|
40,000 |
|
3,000 |
|
43,000 |
|
|
Oklahoma |
|
— |
|
17,000 |
|
17,000 |
|
|
North Dakota |
|
3,000 |
|
3,000 |
|
6,000 |
|
|
Texas |
|
6,000 |
|
2,000 |
|
8,000 |
|
|
Other |
|
16,000 |
|
3,000 |
|
19,000 |
|
|
Total |
|
172,000 |
|
30,000 |
|
202,000 |
|
(1) Represents net acres
(2) Excludes approximately 8,000 net acres of overriding royalty interests
FORESTAR GROUP INC.
OTHER NATURAL RESOURCES SEGMENT
PERFORMANCE METRICS
|
|
|
First Quarter |
| ||||
|
|
|
2013 |
|
2012 |
| ||
|
Fiber Sales * |
|
|
|
|
| ||
|
Pulpwood Tons Sold |
|
120,600 |
|
24,400 |
| ||
|
Average Pulpwood Price / Ton |
|
$ |
11.70 |
|
$ |
10.18 |
|
|
Sawtimber Tons Sold |
|
70,900 |
|
4,400 |
| ||
|
Average Sawtimber Price / Ton |
|
$ |
22.36 |
|
$ |
19.48 |
|
|
|
|
|
|
|
| ||
|
Total Tons Sold |
|
191,500 |
|
28,800 |
| ||
|
Average Price / Ton |
|
$ |
15.65 |
|
$ |
11.59 |
|
|
|
|
|
|
|
| ||
|
Recreational Activity |
|
|
|
|
| ||
|
Average Acres Leased |
|
122,700 |
|
130,900 |
| ||
|
Average Lease Rate / Acre |
|
$ |
9.15 |
|
$ |
8.80 |
|
*The majority of our fiber sales were to International Paper at market prices.
FORESTAR GROUP INC.
PROJECTS IN ENTITLEMENT
A summary of projects in the entitlement process (a) at first quarter-end 2013 follows:
|
|
|
|
|
Project |
|
|
Project |
|
County |
|
Acres (b) |
|
|
|
|
|
|
|
|
|
California |
|
|
|
|
|
|
Hidden Creek Estates |
|
Los Angeles |
|
700 |
|
|
Terrace at Hidden Hills |
|
Los Angeles |
|
30 |
|
|
|
|
|
|
|
|
|
Georgia |
|
|
|
|
|
|
Ball Ground |
|
Cherokee |
|
500 |
|
|
Crossing |
|
Coweta |
|
230 |
|
|
Fincher Road |
|
Cherokee |
|
3,890 |
|
|
Fox Hall |
|
Coweta |
|
960 |
|
|
Garland Mountain |
|
Cherokee/Bartow |
|
350 |
|
|
Martin’s Bridge |
|
Banks |
|
970 |
|
|
Mill Creek |
|
Coweta |
|
770 |
|
|
Serenity |
|
Carroll |
|
440 |
|
|
Wolf Creek |
|
Carroll/Douglas |
|
12,230 |
|
|
Yellow Creek |
|
Cherokee |
|
1,060 |
|
|
|
|
|
|
|
|
|
Texas |
|
|
|
|
|
|
Lake Houston |
|
Harris/Liberty |
|
3,700 |
|
|
San Jacinto |
|
Montgomery |
|
150 |
|
|
Total |
|
|
|
25,980 |
|
(a) A project is deemed to be in the entitlement process when customary steps necessary for the preparation of an application for governmental land-use approvals, like conducting pre-application meetings or similar discussions with governmental officials, have commenced, or an application has been filed. Projects listed may have significant steps remaining, and there is no assurance that entitlements ultimately will be received.
(b) Project acres, which are the total for the project regardless of our ownership interest, are approximate. The actual number of acres entitled may vary.
FORESTAR GROUP INC.
REAL ESTATE PROJECTS
A summary of our entitled,(a) developed & under development projects at first quarter-end 2013 follows:
|
|
|
|
|
|
|
Residential Lots (c) |
|
Commercial Acres (d) |
| ||||
|
Project |
|
County |
|
Interest |
|
Lots Sold Since |
|
Lots |
|
Acres Sold Since |
|
Acres |
|
|
California |
|
|
|
|
|
|
|
|
|
|
|
|
|
|
San Joaquin River |
|
Contra Costa/ Sacramento |
|
100 |
% |
— |
|
— |
|
— |
|
288 |
|
|
Colorado |
|
|
|
|
|
|
|
|
|
|
|
|
|
|
Buffalo Highlands |
|
Weld |
|
100 |
% |
— |
|
164 |
|
— |
|
— |
|
|
Johnstown Farms |
|
Weld |
|
100 |
% |
170 |
|
443 |
|
2 |
|
7 |
|
|
Pinery West |
|
Douglas |
|
100 |
% |
— |
|
— |
|
— |
|
111 |
|
|
Stonebraker |
|
Weld |
|
100 |
% |
— |
|
603 |
|
— |
|
— |
|
|
Tennessee |
|
|
|
|
|
|
|
|
|
|
|
|
|
|
Azalea Park |
|
Williamson |
|
100 |
% |
— |
|
173 |
|
— |
|
— |
|
|
Texas |
|
|
|
|
|
|
|
|
|
|
|
|
|
|
Arrowhead Ranch |
|
Hays |
|
100 |
% |
— |
|
259 |
|
— |
|
6 |
|
|
Bar C Ranch |
|
Tarrant |
|
100 |
% |
292 |
|
907 |
|
— |
|
— |
|
|
Barrington Kingwood |
|
Harris |
|
100 |
% |
61 |
|
119 |
|
— |
|
— |
|
|
Cibolo Canyons |
|
Bexar |
|
100 |
% |
753 |
|
722 |
|
96 |
|
54 |
|
|
Harbor Lakes |
|
Hood |
|
100 |
% |
205 |
|
244 |
|
2 |
|
19 |
|
|
Hunter’s Crossing |
|
Bastrop |
|
100 |
% |
411 |
|
79 |
|
38 |
|
71 |
|
|
La Conterra |
|
Williamson |
|
100 |
% |
127 |
|
373 |
|
— |
|
58 |
|
|
Lakes of Prosper |
|
Collin |
|
100 |
% |
5 |
|
280 |
|
— |
|
— |
|
|
Maxwell Creek |
|
Collin |
|
100 |
% |
820 |
|
179 |
|
10 |
|
— |
|
|
Oak Creek Estates |
|
Comal |
|
100 |
% |
141 |
|
506 |
|
13 |
|
— |
|
|
Stoney Creek |
|
Dallas |
|
90 |
% |
149 |
|
605 |
|
— |
|
— |
|
|
Summer Creek Ranch |
|
Tarrant |
|
100 |
% |
834 |
|
440 |
|
35 |
|
44 |
|
|
Summer Lakes |
|
Fort Bend |
|
100 |
% |
484 |
|
646 |
|
56 |
|
— |
|
|
Summer Park (g) |
|
Fort Bend |
|
100 |
% |
— |
|
210 |
|
28 |
|
62 |
|
|
The Colony |
|
Bastrop |
|
100 |
% |
441 |
|
708 |
|
22 |
|
31 |
|
|
The Preserve at Pecan Creek |
|
Denton |
|
100 |
% |
399 |
|
395 |
|
— |
|
7 |
|
|
Village Park |
|
Collin |
|
100 |
% |
516 |
|
244 |
|
3 |
|
2 |
|
|
Westside at Buttercup Creek |
|
Williamson |
|
100 |
% |
1,428 |
|
68 |
|
66 |
|
— |
|
|
Other projects (10) |
|
Various |
|
100 |
% |
2,085 |
|
171 |
|
218 |
|
36 |
|
|
Georgia |
|
|
|
|
|
|
|
|
|
|
|
|
|
|
Seven Hills |
|
Paulding |
|
100 |
% |
666 |
|
420 |
|
26 |
|
113 |
|
|
Villages of Burt Creek |
|
Dawson |
|
100 |
% |
— |
|
1,715 |
|
— |
|
57 |
|
|
Towne West |
|
Bartow |
|
100 |
% |
— |
|
2,674 |
|
— |
|
121 |
|
|
Other projects (17) |
|
Various |
|
100 |
% |
72 |
|
3,021 |
|
— |
|
705 |
|
|
Florida |
|
|
|
|
|
|
|
|
|
|
|
|
|
|
Other projects (2) |
|
Various |
|
100 |
% |
301 |
|
87 |
|
— |
|
— |
|
|
Missouri and Utah |
|
|
|
|
|
|
|
|
|
|
|
|
|
|
Other projects (2) |
|
Various |
|
100 |
% |
499 |
|
55 |
|
— |
|
— |
|
|
|
|
|
|
|
|
10,859 |
|
16,510 |
|
615 |
|
1,792 |
|
|
Projects in entities we consolidate |
|
|
|
|
|
|
|
|
|
|
|
|
|
|
Texas |
|
|
|
|
|
|
|
|
|
|
|
|
|
|
City Park |
|
Harris |
|
75 |
% |
1,218 |
|
93 |
|
50 |
|
115 |
|
|
Lantana |
|
Denton |
|
55 |
%(e) |
774 |
|
1,276 |
|
— |
|
12 |
|
|
Timber Creek |
|
Collin |
|
88 |
% |
— |
|
614 |
|
— |
|
— |
|
|
Willow Creek Farms II |
|
Walter/Fort Bend |
|
90 |
% |
40 |
|
191 |
|
— |
|
— |
|
|
Other projects (2) |
|
Various |
|
Various |
|
7 |
|
202 |
|
— |
|
129 |
|
|
Georgia |
|
|
|
|
|
|
|
|
|
|
|
|
|
|
The Georgian |
|
Paulding |
|
75 |
% |
289 |
|
1,052 |
|
— |
|
— |
|
|
|
|
|
|
|
|
2,328 |
|
3,428 |
|
50 |
|
256 |
|
|
Total owned and consolidated |
|
|
|
|
|
13,187 |
|
19,938 |
|
665 |
|
2,048 |
|
|
Projects in ventures that we account for using the equity method |
|
|
|
|
|
|
|
|
|
|
|
|
|
|
Texas |
|
|
|
|
|
|
|
|
|
|
|
|
|
|
Entrada |
|
Travis |
|
50 |
% |
— |
|
821 |
|
— |
|
— |
|
|
Fannin Farms West |
|
Tarrant |
|
50 |
% |
324 |
|
24 |
|
— |
|
12 |
|
|
Harper’s Preserve |
|
Montgomery |
|
50 |
% |
244 |
|
1,481 |
|
— |
|
72 |
|
|
Lantana |
|
Denton |
|
Various |
(e) |
1,163 |
|
62 |
|
16 |
|
42 |
|
|
Long Meadow Farms |
|
Fort Bend |
|
37 |
% |
1,025 |
|
774 |
|
119 |
|
180 |
|
|
Southern Trails |
|
Brazoria |
|
80 |
% |
603 |
|
380 |
|
— |
|
— |
|
|
Stonewall Estates |
|
Bexar |
|
50 |
% |
305 |
|
83 |
|
— |
|
— |
|
|
Other projects (1) |
|
Nueces |
|
50 |
% |
— |
|
— |
|
— |
|
15 |
|
|
Total in ventures |
|
|
|
|
|
3,664 |
|
3,625 |
|
135 |
|
321 |
|
|
Combined Total |
|
|
|
|
|
16,851 |
|
23,563 |
|
800 |
|
2,369 |
|
|
(a) |
A project is deemed entitled when all major discretionary governmental land-use approvals have been received. Some projects may require additional permits and/or non-governmental authorizations for development. |
|
(b) |
Interest owned reflects our net equity interest in the project, whether owned directly or indirectly. There are some projects that have multiple ownership structures within them. Accordingly, portions of these projects may appear as owned, consolidated and/or accounted for using the equity method. |
|
(c) |
Lots are for the total project, regardless of our ownership interest. Lots remaining represent vacant developed lots, lots under development and future planned lots and are subject to change based on business plan revisions. |
|
(d) |
Commercial acres are for the total project, regardless of our ownership interest and are net developable acres, which may be fewer than the gross acres available in the project. |
|
(e) |
The Lantana project consists of a series of 22 partnerships in which our voting interests range from 25% to 55%. We account for two of these partnerships using the equity method and we consolidate the remaining partnerships. |
|
(f) |
Excludes acres associated with commercial and income producing properties. |
|
(g) |
Formerly Waterford Park |
A summary of our significant commercial and income producing properties at first quarter-end 2013 follows:
|
|
|
|
|
|
|
Interest |
|
|
|
|
|
|
|
|
Project |
|
County |
|
Market |
|
Owned (a) |
|
Type |
|
Acres |
|
Description |
|
|
Radisson Hotel |
|
Travis |
|
Austin |
|
100 |
% |
Hotel |
|
2 |
|
413 guest rooms and suites |
|
|
Eleven |
|
Travis |
|
Austin |
|
25 |
% |
Multifamily |
|
3 |
|
257 unit luxury apartment (b) |
|
|
360° |
|
Arapahoe |
|
Denver |
|
20 |
% |
Multifamily |
|
4 |
|
304 unit luxury apartment (b) |
|
(a) Interest owned reflects our total equity interest in the project, whether owned directly or indirectly.
(b) Construction in progress