UNITED STATES
SECURITIES AND EXCHANGE COMMISSION
Washington, D.C. 20549
Form 8-K
CURRENT REPORT
PURSUANT TO SECTION 13 OR 15(d) OF THE
SECURITIES EXCHANGE ACT OF 1934
Date of Report: February 13, 2013
(Date of earliest event reported)
FORESTAR GROUP INC.
(Exact name of registrant as specified in its charter)
Delaware |
|
Commission File Number |
|
26-1336998 |
(State or other jurisdiction of |
|
001-33662 |
|
(I.R.S. Employer |
incorporation or organization) |
|
|
|
Identification No.) |
6300 Bee Cave Road, Building Two, Suite 500
Austin, Texas 78746
(Address of principal executive offices) (zip code)
(512) 433-5200
(Registrants telephone number, including area code)
Check the appropriate box below if the Form 8-K filing is intended to simultaneously satisfy the filing obligation of the registrant under any of the following provisions:
o Written communications pursuant to Rule 425 under the Securities Act (17 CFR 230.425)
o Soliciting material pursuant to Rule 14a-12 under the Exchange Act (17 CFR 240.14a-12)
o Pre-commencement communications pursuant to Rule 14d-2(b) under the Exchange Act (17 CFR 240.14d-2(b))
o Pre-commencement communications pursuant to Rule 13e-4(c) under the Exchange Act (17 CFR 240.13e-4(c))
Item 2.02. Results of Operations and Financial Condition.
On February 13, 2013, Forestar Group Inc. (the Company) issued a press release announcing the Companys results for the quarter and year ended December 31, 2012. A copy of the press release is furnished as Exhibit 99.1 of this report.
Item 7.01. Regulation FD Disclosure.
On February 14, 2013, management of the Company will participate in a conference call discussing the Companys results for the quarter and year ended December 31, 2012. Copies of the presentation materials to be used by management are furnished as Exhibit 99.2 of this report.
Item 9.01. Financial Statements and Exhibits.
(d) Exhibits.
99.1 |
|
Press release issued by the Company on February 13, 2013, announcing the Companys results for the quarter and year ended December 31, 2012. |
|
|
|
99.2 |
|
Presentation materials to be used by management in a conference call on February 14, 2013, discussing the Companys results for the quarter and year ended December 31, 2012. |
SIGNATURE
Pursuant to the requirements of the Securities and Exchange Act of 1934, the registrant has duly caused this report to be signed on its behalf by the undersigned hereunto duly authorized.
|
FORESTAR GROUP INC. | ||
|
| ||
|
| ||
Date: February 13, 2013 |
By: |
/s/ Christopher L. Nines | |
|
|
| |
|
|
Name: |
Christopher L. Nines |
|
|
Title: |
Chief Financial Officer and Treasurer |
EXHIBIT INDEX
Exhibit |
|
Description |
|
|
|
99.1 |
|
Press release issued by the Company on February 13, 2013, announcing the Companys results for the quarter and year ended December 31, 2012. |
|
|
|
99.2 |
|
Presentation materials to be used by management in a conference call on February 14, 2013, discussing the Companys results for the quarter and year ended December 31, 2012. |
Exhibit 99.1
NEWS
RELEASE
FOR IMMEDIATE RELEASE
CONTACT: Anna E. Torma
(512) 433-5312
FORESTAR GROUP INC. REPORTS FULL YEAR
AND FOURTH QUARTER 2012 RESULTS
Delivering the Greatest Value From Every Acre, Accelerating Value Realization and Growing Through Strategic Investments
AUSTIN, TEXAS, February 13, 2013Forestar Group Inc. (NYSE: FOR) today reported full year 2012 net income of approximately $12.9 million, or $0.36 per diluted share, compared with full year 2011 net income of approximately $7.2 million, or $0.20 per diluted share outstanding.
($ in millions, except per share) |
|
Full Year 2012 |
|
Full Year 2011 |
| ||
|
|
|
|
|
| ||
Net income |
|
$ |
12.9 |
|
$ |
7.2 |
|
|
|
|
|
|
| ||
Net income per share |
|
$ |
0.36 |
|
$ |
0.20 |
|
Full year 2012 results include after-tax expenses of approximately ($4.1) million, or ($0.12) per share, associated with acquisition of CREDO Petroleum Corporation, and an after-tax loss of ($2.9) million, or ($0.08) per share, associated with loss on extinguishment of debt related to amendment and extension of our term loan. Full year 2011 results include an after-tax gain of $40.2 million, or $1.12 per share, related to sale of about 57,000 acres of timberland, an after-tax loss of ($29.4) million or ($0.82) per share principally related to non-cash asset impairments associated with entering into agreements to acquire certain assets from the CL Realty and TEMCO ventures and an after-tax loss of ($2.1) million, or ($0.06) per share, associated with proposed private debt offerings. Full year 2012 net income excluding special items was $19.9 million, or $0.56 per share, compared with a net loss before special items of ($1.5) million or ($0.04) per share in 2011.
($ in millions, except per share) |
|
Full Year 2012 |
|
Full Year 2011 |
| ||
Net income per share |
|
$ |
0.36 |
|
$ |
0.20 |
|
|
|
|
|
|
| ||
Special items: |
|
|
|
|
| ||
CREDO Petroleum acquisition expenses |
|
$ |
0.12 |
|
$ |
|
|
Loss on extinguishment of debt |
|
0.08 |
|
|
| ||
Debt offering expenses |
|
|
|
0.06 |
| ||
Non-cash asset impairments |
|
|
|
0.82 |
| ||
Gain on sale of timberland |
|
|
|
(1.12 |
) | ||
Total special items |
|
$ |
0.20 |
|
$ |
(0.24 |
) |
|
|
|
|
|
| ||
Net income (loss) per share before special items* |
|
$ |
0.56 |
|
$ |
(0.04 |
) |
*These are Non-GAAP financial measures. The reconciliation between GAAP and Non-GAAP measures is provided in the tables following this press release, and on the investor relations section of the companys website.
Our 2012 results are beginning to reflect the benefit of our Triple in FOR strategic initiatives focused on accelerating value realization, optimizing transparency and disclosure, and growing our net asset value through strategic and disciplined investments, said Jim DeCosmo, president and chief executive officer of Forestar Group.
Full Year 2012 Significant Highlights (includes ventures)
Mineral Resources Oil & Gas
· Oil production increased over 144% compared with 2011
· 29 additional oil and gas wells completed; 936 total producing wells at year-end
· 8,910 net mineral acres leased to exploration and production companies
Real Estate
· Sold 1,365 developed residential lots, a 22% increase compared with 2011 almost 1,340 lots under option contracts at year-end
· Generated $18.4 million in gross profit from residential lot sales, including our share of venture activity, up 60% compared with 2011
· Acquired entire interest in 17 residential and mixed-use real estate projects from the CL Realty and TEMCO ventures for a net investment of approximately $23.5 million
· Sold approximately 9,330 acres of undeveloped land for about $19 million through our retail sales program
· Sold two stabilized multifamily communities, Broadstone Memorial and Las Brisas, generating approximately $40 million in cash flow
· Completed construction of Promesa, a 289-unit multifamily community in Austin, Texas
· Initiated development of two multifamily venture properties, with locations in Austin and Denver
Strategic Initiatives
· Completed the acquisition of CREDO Petroleum in an all cash transaction for $14.50 per share, representing an equity purchase price of $146 million
Fourth Quarter 2012 Significant Highlights
The company reported fourth quarter 2012 net income of approximately $10.0 million, or $0.28 per diluted share, compared with a fourth quarter 2011 net loss of approximately ($22.9) million, or ($0.65) per share outstanding.
($ in millions, except per share) |
|
4th Qtr 2012 |
|
4th Qtr 2011 |
| ||
|
|
|
|
|
| ||
Net income (loss) |
|
$ |
10.0 |
|
$ |
(22.9 |
) |
|
|
|
|
|
| ||
Net income (loss) per share |
|
$ |
0.28 |
|
$ |
(0.65 |
) |
Fourth quarter 2012 results include after-tax expenses of approximately ($0.4) million, or ($0.01) per share, associated with acquisition of CREDO Petroleum. Fourth quarter 2011 results include an after-tax loss of ($28.9) million, or ($0.82) per share principally related to non-cash asset impairments associated with entering into agreements to acquire the entire interest in 17 projects from the CL Realty and TEMCO ventures. Fourth quarter 2012 net income excluding special items was $10.4 million, or $0.29 per share, compared with net income excluding special items of $6.0 million, or $0.17 per share in 2011.
($ in millions, except per share) |
|
4th Qtr 2012 |
|
4th Qtr 2011 |
| ||
|
|
|
|
|
| ||
Net income (loss) per share |
|
$ |
0.28 |
|
$ |
(0.65 |
) |
|
|
|
|
|
| ||
Special items: |
|
|
|
|
| ||
CREDO Petroleum acquisition expenses |
|
0.01 |
|
|
| ||
Non-cash asset impairments |
|
|
|
0.82 |
| ||
Total special items |
|
0.01 |
|
$ |
0.82 |
| |
|
|
|
|
|
| ||
Net income per share before special items* |
|
$ |
0.29 |
|
$ |
0.17 |
|
*These are Non-GAAP financial measures. The reconciliation between GAAP and Non-GAAP measures is provided in the tables following this press release, and on the investor relations section of the companys website.
MINERAL RESOURCES
Fourth Quarter 2012 Significant Highlights
· Oil production up almost 122,000 barrels or 245% compared with fourth quarter 2011, including over 116,500 barrels of production from acquisition of CREDO Petroleum
· Leased almost 5,000 net mineral acres to exploration and production companies for almost $300 per acre
· 16 wells drilled; 936 gross producing wells, up 406 compared with fourth quarter 2011 principally due to acquisition of Credo Petroleum during third quarter 2012
Mineral Resources Segment Financial Results:
($ in millions) |
|
4Q 2012 |
|
4Q 2011 |
|
FY 2012 |
|
FY 2011 |
| ||||
|
|
|
|
|
|
|
|
|
| ||||
Segment Revenues |
|
$ |
17.2 |
|
$ |
6.8 |
|
$ |
44.2 |
|
$ |
24.6 |
|
|
|
|
|
|
|
|
|
|
| ||||
Segment Earnings |
|
$ |
5.7 |
|
$ |
3.7 |
|
$ |
21.6 |
(1) |
$ |
16.0 |
(1) |
(1)Full year 2012 and 2011 mineral resources segment results include $5.0 million and $3.8 million, respectively, in costs principally associated with development of our water resource initiatives.
Mineral resources segment earnings increased in fourth quarter and full year 2012 compared with fourth quarter and full year 2011 principally due to higher oil production primarily due to the acquisition of CREDO Petroleum and higher lease bonus revenues, which more than offset lower oil and gas pricing and increased costs.
REAL ESTATE
Fourth Quarter 2012 Significant Highlights
· Sold 384 fully developed residential lots, up 24% from fourth quarter 2011, with average lot prices up 34% compared with fourth quarter 2011
· Sold 40 commercial acres for approximately $208,300 per acre
· Sold almost 7,400 acres of undeveloped land for $1,900 per acre
· Venture completed sale of Las Brisas multifamily community near Austin, TX, generating almost $10 million in cash proceeds to Forestar
· Purchased multifamily site in Charlotte, NC for approximately $5.6 million
Real Estate Segment Financial Results:
($ in millions) |
|
4Q 2012 |
|
4Q 2011 |
|
FY 2012 |
|
FY 2011 |
| ||||
|
|
|
|
|
|
|
|
|
| ||||
Segment Revenues |
|
$ |
48.4 |
|
$ |
46.4 |
|
$ |
120.1 |
|
$ |
106.2 |
|
|
|
|
|
|
|
|
|
|
| ||||
Segment Earnings (Loss) |
|
$ |
21.6 |
|
$ |
(25.0 |
) |
$ |
53.6 |
|
$ |
(25.7 |
) |
Fourth quarter 2012 real estate segment earnings were higher compared with fourth quarter 2011 principally due to higher residential lot sales, $8.2 million in earnings associated with ventures gain on sale of Las Brisas multifamily community, and increased commercial tract sales. In addition, fourth quarter and full year 2011 real estate segment results were negatively impacted by ($44.5) million and ($45.2) million in non-cash asset impairment charges, principally related to the acquisition of certain assets from CL Realty and TEMCO ventures.
FIBER RESOURCES
Fourth Quarter 2012 Significant Highlights
· Sold over 162,000 tons of fiber - recreational leasing remains strong
Fiber Resources Segment Financial Results:
($ in millions) |
|
4Q 2012 |
|
4Q 2011 |
|
FY 2012 |
|
FY 2011 |
| ||||
|
|
|
|
|
|
|
|
|
| ||||
Segment Revenues |
|
$ |
3.0 |
|
$ |
0.9 |
|
$ |
8.3 |
|
$ |
4.8 |
|
|
|
|
|
|
|
|
|
|
| ||||
Segment Earnings |
|
$ |
2.3 |
|
$ |
0.1 |
|
$ |
5.0 |
|
$ |
1.9 |
|
Fourth quarter and full year 2012 fiber resources segment earnings increased compared with fourth quarter and full year 2011 principally due to increased fiber sales activity and higher pricing. Recreational leasing activity remained strong during fourth quarter, with almost 99% of available land leased for recreation.
OUTLOOK
We continue to build momentum through execution of our Triple in FOR strategic initiatives, focused on accelerating value realization, increasing transparency and disclosure and growing through strategic and disciplined investments. We have made great progress, but I believe Forestar is just beginning to realize its full potential, said Jim DeCosmo, president and chief executive officer of Forestar Group.
Our preliminary year-end 2012 total proven reserves are approximately 5.6 million BOE (barrels of oil equivalent), up over 87% compared with year-end 2011, driven by the acquisition of CREDO Petroleum. Our oil and gas strategic initiatives are focused on increasing exploration, production and reserves, a key driver of future earnings and cash flow. In addition, we are committed to delivering the growth and returns associated with acquisition of CREDO Petroleum. We anticipate participating in over 50 non-operating working interest oil wells in the Bakken and Three Forks formations in 2013, and we are planning to drill or participate in over 80 additional oil wells in the Lansing-Kansas City formation in Kansas and Nebraska. These three formations offer lower-risk, repeatable drilling opportunities that we expect to significantly exceed our target returns. As a result, we expect 2013 capital expenditures for drilling and participation in working interests to exceed $70 million and anticipate our share of total production in 2013 to exceed one million barrels of oil equivalent, an over 50% increase compared with 2012.
Housing markets are experiencing solid signs of a long-term sustainable recovery, with growing demand for residential lots and increased interest in residential and commercial tracts. Our backlog remains strong, and we are well positioned to increase sales, with a solid portfolio of over 50 active residential and mixed-use communities in the major markets of Texas.
We continue to build a solid pipeline of multifamily development properties, including the acquisition of a well-located multifamily development site in Charlotte, North Carolina for approximately $5.6 million during fourth quarter. We substantially completed construction of our Promesa multifamily community in 2012 and expect the project to reach stabilization and be positioned for sale during first half of 2013. In addition, we initiated construction of two multifamily projects: Eleven, in Austin and 360°, in Denver, both of which are held in ventures and remain on target for unit deliveries to begin in late 2013.
We are well positioned to recognize and responsibly deliver the greatest value from every acre and grow our business through strategic and disciplined investments. Our portfolio is comprised of the strongest assets since we became a public company at year-end 2007, and I believe has the potential to generate significant earnings and cash flow as we accelerate value realization, concluded Mr. DeCosmo.
The Company will host a conference call on February 14, 2013 at 10:00 am ET to discuss results of fourth quarter and full year 2012. The meeting may be accessed through webcast or conference call. The webcast may be accessed through Forestars Internet site at www.forestargroup.com. To access the conference call, listeners from North America should dial 1-800-510-9836 at least 15 minutes prior to the start of the call. Those wishing to access the call from outside North America should dial 1-617-614-3670. The password is Forestar. Replays of the call will be available for two weeks following the live call and can be accessed at 1-888-286-8010 in North America and at 1-617-801-6888 outside North America. The password for the replay is 31120450.
About Forestar Group
Forestar Group Inc. operates in three business segments: real estate, mineral resources and fiber resources. At the end of fourth quarter 2012, the real estate segment owns directly or through ventures almost 136,000 acres of real estate located in ten states and fourteen markets in the U.S. The real estate segment has 15 real estate projects representing approximately 26,070 acres currently in the entitlement process, and 74 entitled, developed and under development projects in seven states and eleven markets encompassing almost 14,400 acres, comprised of 23,800 planned residential lots and almost 2,400 commercial acres. The mineral resources segment includes approximately 752,000 net acres of oil and gas mineral interests, with approximately 590,000 acres of fee ownership located principally in Texas, Louisiana, Alabama, and Georgia and about 162,000 net acres of leasehold and overriding royalty interests principally located in Nebraska, Kansas, Oklahoma, North Dakota and Texas. These leasehold interests include almost 6,000 net mineral acres in the core of the prolific Bakken and Three Forks formations. In addition, the mineral resources segment owns a 45% nonparticipating royalty interest in groundwater produced or withdrawn for commercial purposes from approximately 1.4 million acres in Texas, Louisiana, Georgia and Alabama and about 20,000 acres of groundwater leases in central Texas. The fiber resources segment includes the sale of wood fiber and management of our recreational leases. Forestars address on the World Wide Web is www.forestargroup.com.
Forward Looking Statements
This release contains forward-looking statements within the meaning of the federal securities laws. Forward-looking statements are typically identified by words or phrases such as will, anticipate, estimate, expect, project, intend, plan, believe, target, forecast, and other words and terms of similar meaning. These statements reflect managements current views with respect to future events and are subject to risk and uncertainties. We note that a variety of factors and uncertainties could cause our actual results to differ significantly from the results discussed in the forward-looking statements, including our ability to achieve synergies and value creation contemplated by the merger with Credo, and our ability to promptly and effectively integrate Credos businesses. Other factors and uncertainties that might cause such differences include, but are not limited to: general economic, market, or business conditions; changes in commodity prices; opportunities (or lack thereof) that may be presented to us and that we may pursue; fluctuations in costs and expenses including development costs; demand for new housing, including impacts from mortgage credit availability; lengthy and uncertain entitlement processes; cyclicality of our businesses; accuracy of accounting assumptions; competitive actions by other companies; changes in laws or regulations; and other factors, many of which are beyond our control. Except as required by law, we expressly disclaim any obligation to publicly revise any forward-looking statements contained in this news release to reflect the occurrence of events after the date of this news release.
FORESTAR GROUP INC.
(UNAUDITED)
Business Segments
|
|
Fourth Quarter |
|
Full Year |
| ||||||||
|
|
2012 |
|
2011 |
|
2012 |
|
2011 |
| ||||
|
|
(In thousands, |
|
(In thousands, |
| ||||||||
Revenues |
|
|
|
|
|
|
|
|
| ||||
|
|
|
|
|
|
|
|
|
| ||||
Real estate |
|
$ |
48,431 |
|
$ |
46,354 |
|
$ |
120,115 |
|
$ |
106,168 |
|
Mineral resources |
|
17,167 |
|
6,800 |
|
44,220 |
|
24,584 |
| ||||
Fiber resources |
|
2,979 |
|
853 |
|
8,256 |
|
4,821 |
| ||||
Total revenues |
|
$ |
68,577 |
|
$ |
54,007 |
|
$ |
172,591 |
|
$ |
135,573 |
|
|
|
|
|
|
|
|
|
|
| ||||
Segment earnings (loss) |
|
|
|
|
|
|
|
|
| ||||
Real estate (a) |
|
$ |
21,651 |
|
$ |
(25,020 |
) |
$ |
53,582 |
|
$ |
(25,704 |
) |
Mineral resources |
|
5,662 |
|
3,731 |
|
21,581 |
|
16,023 |
| ||||
Fiber resources |
|
2,274 |
|
103 |
|
5,056 |
|
1,893 |
| ||||
Total segment earnings (loss) |
|
29,587 |
|
(21,186 |
) |
80,219 |
|
(7,788 |
) | ||||
Items not allocated to segments: |
|
|
|
|
|
|
|
|
| ||||
General and administrative expense (b) |
|
(5,694 |
) |
(4,286 |
) |
(25,176 |
) |
(20,110 |
) | ||||
Share-based compensation income (expense) |
|
(3,438 |
) |
(6,668 |
) |
(14,929 |
) |
(7,067 |
) | ||||
Gain on sale of assets |
|
|
|
|
|
16 |
|
61,784 |
| ||||
Interest expense |
|
(3,714 |
) |
(4,079 |
) |
(19,363 |
) |
(17,012 |
) | ||||
Other corporate non-operating income |
|
33 |
|
291 |
|
191 |
|
368 |
| ||||
Income (loss) before taxes |
|
16,774 |
|
(35,928 |
) |
20,958 |
|
10,175 |
| ||||
Income tax (expense) benefit |
|
(6,742 |
) |
13,048 |
|
(8,016 |
) |
(3,021 |
) | ||||
Net income (loss) attributable to Forestar Group Inc. |
|
$ |
10,032 |
|
$ |
(22,880 |
) |
$ |
12,942 |
|
$ |
7,154 |
|
|
|
|
|
|
|
|
|
|
| ||||
Net income (loss) per common share: |
|
|
|
|
|
|
|
|
| ||||
Basic |
|
$ |
0.28 |
|
$ |
(0.65 |
) |
$ |
0.37 |
|
$ |
0.20 |
|
Diluted |
|
$ |
0.28 |
|
$ |
(0.65 |
) |
$ |
0.36 |
|
$ |
0.20 |
|
Weighted average common shares outstanding (in millions): |
|
|
|
|
|
|
|
|
| ||||
Basic |
|
35.2 |
|
35.2 |
|
35.2 |
|
35.4 |
| ||||
Diluted |
|
35.6 |
|
35.2 |
|
35.5 |
|
35.8 |
|
|
|
At Year-End |
| ||||
Supplemental Financial Information: |
|
2012 |
|
2011 |
| ||
|
|
(In thousands) |
| ||||
|
|
|
|
|
| ||
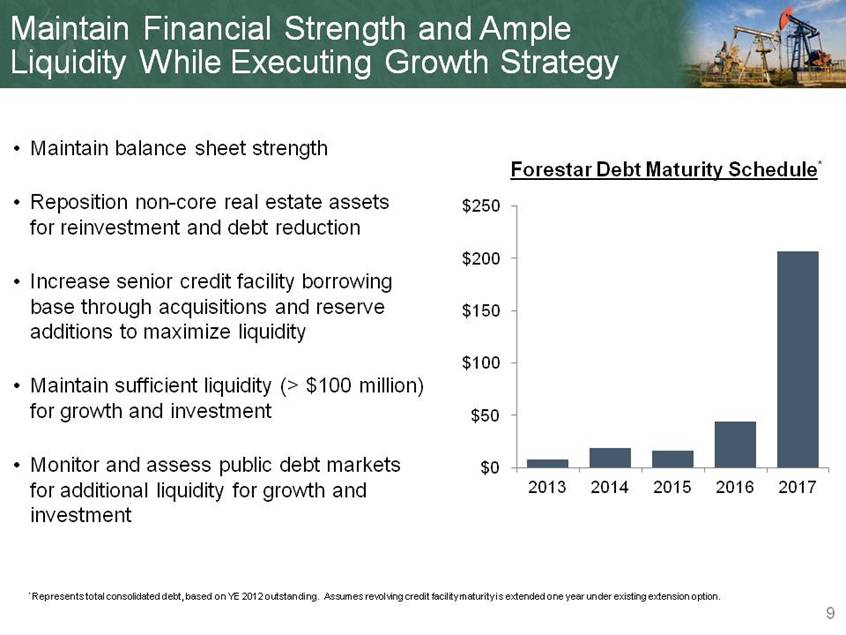
Borrowings under senior credit facility |
|
$ |
244,000 |
|
$ |
130,000 |
|
Other debt (c) |
|
50,063 |
|
91,587 |
| ||
Total debt |
|
$ |
294,063 |
|
$ |
221,587 |
|
(a) Real estate segment results include non-cash impairment charges of $44.5 million in fourth quarter 2011 and $45.2 million during full year 2011, principally related to entering into agreements to acquire 17 projects from CL Realty and TEMCO ventures.
(b) Full year 2012 general and administrative expenses include approximately $6.3 million in costs associated with the acquisition of CREDO Petroleum Corporation. Full year 2011 general and administrative expenses include $3.2 million paid to outside advisors related to private debt offerings which were withdrawn due to the deterioration in terms available to us in the capital markets.
(c) Consists principally of consolidated venture non-recourse debt.
FORESTAR GROUP INC.
MINERAL RESOURCES SEGMENT
PERFORMANCE METRICS
|
|
Fourth Quarter |
|
Full Year |
| ||||||||
|
|
2012 |
|
2011 |
|
2012 |
|
2011 |
| ||||
Leasing Activity from Owned Mineral Interests |
|
|
|
|
|
|
|
|
| ||||
Acres Leased |
|
5,000 |
|
320 |
|
8,900 |
|
8,100 |
| ||||
Average Bonus / Acre |
|
$ |
300 |
|
$ |
60 |
|
$ |
600 |
|
$ |
280 |
|
Delay Rentals Received |
|
$ |
64,000 |
|
$ |
512,900 |
|
$ |
2,218,600 |
|
$ |
992,200 |
|
Oil & Gas Production |
|
|
|
|
|
|
|
|
| ||||
Royalty Interests(1) |
|
|
|
|
|
|
|
|
| ||||
Gross Wells |
|
542 |
|
530 |
|
542 |
|
530 |
| ||||
Oil Production (Barrels) |
|
52,700 |
|
44,400 |
|
230,100 |
|
142,100 |
| ||||
Average Oil Price ($ / Barrel) |
|
$ |
80.98 |
|
$ |
101.53 |
|
$ |
86.66 |
|
$ |
96.24 |
|
Natural Gas Production (MMcf) |
|
468.4 |
|
357.6 |
|
1,703.9 |
|
1,594.6 |
| ||||
Average Natural Gas Price ($ / Mcf) |
|
$ |
2.56 |
|
$ |
3.91 |
|
$ |
2.57 |
|
$ |
3.94 |
|
BOE Production(2) |
|
130,800 |
|
104,000 |
|
514,100 |
|
407,900 |
| ||||
Average Price ($ / BOE) |
|
$ |
41.81 |
|
$ |
56.78 |
|
$ |
47.32 |
|
$ |
48.94 |
|
Working Interests |
|
|
|
|
|
|
|
|
| ||||
Gross Wells |
|
403 |
|
8 |
|
403 |
|
8 |
| ||||
Oil Production (Barrels) |
|
118,800 |
|
5,300 |
|
141,200 |
|
9,800 |
| ||||
Average Oil Price ($ / Barrel) |
|
$ |
80.08 |
|
$ |
107.72 |
|
$ |
82.54 |
|
$ |
105.48 |
|
Natural Gas Production (MMcf) |
|
221.5 |
|
15.9 |
|
285.1 |
|
27.3 |
| ||||
Average Natural Gas Price ($ / Mcf) |
|
$ |
3.59 |
|
$ |
4.53 |
|
$ |
3.49 |
|
$ |
4.65 |
|
BOE Production(2) |
|
155,700 |
|
8,000 |
|
188,700 |
|
14,300 |
| ||||
Average Price ($ / BOE) |
|
$ |
66.20 |
|
$ |
80.92 |
|
$ |
67.03 |
|
$ |
80.89 |
|
Total Oil & Gas Interests |
|
|
|
|
|
|
|
|
| ||||
Gross Wells(3) |
|
936 |
|
530 |
|
936 |
|
530 |
| ||||
Oil Production (Barrels) |
|
171,500 |
|
49,700 |
|
371,300 |
|
151,900 |
| ||||
Average Oil Price ($ / Barrel) |
|
$ |
80.36 |
|
$ |
102.19 |
|
$ |
85.09 |
|
$ |
96.84 |
|
Natural Gas Production (MMcf) |
|
689.9 |
|
373.6 |
|
1,989.0 |
|
1,622.0 |
| ||||
Average Natural Gas Price ($ / Mcf) |
|
$ |
2.89 |
|
$ |
3.93 |
|
$ |
2.71 |
|
$ |
3.95 |
|
BOE Production(2) |
|
286,500 |
|
112,000 |
|
702,800 |
|
422,200 |
| ||||
Average Price ($ / BOE) |
|
$ |
55.07 |
|
$ |
58.50 |
|
$ |
52.61 |
|
$ |
50.02 |
|
Well Activity |
|
|
|
|
|
|
|
|
| ||||
Mineral Interests Owned (4) |
|
|
|
|
|
|
|
|
| ||||
Net Acres Held By Production |
|
39,000 |
|
32,000 |
|
39,000 |
|
32,000 |
| ||||
Gross Wells Drilled |
|
|
|
20 |
|
13 |
|
36 |
| ||||
Productive Gross Wells |
|
542 |
|
530 |
|
542 |
|
530 |
| ||||
Mineral Interests Leased |
|
|
|
|
|
|
|
|
| ||||
Net Acres Held By Production |
|
37,000 |
|
|
|
37,000 |
|
|
| ||||
Gross Wells Drilled |
|
16 |
|
|
|
16 |
|
|
| ||||
Productive Gross Wells(5) |
|
394 |
|
|
|
394 |
|
|
| ||||
Total Well Activity |
|
|
|
|
|
|
|
|
| ||||
Net Acres Held By Production |
|
76,000 |
|
32,000 |
|
76,000 |
|
32,000 |
| ||||
Gross Wells Drilled |
|
16 |
|
20 |
|
29 |
|
36 |
| ||||
Productive Gross Wells |
|
936 |
|
530 |
|
936 |
|
530 |
|
(1) |
Includes our share of venture activity in which we own a 50% interest. Our share of natural gas production is 74 MMcf and 321 MMcf in fourth quarter and full year 2012 and 95 MMcf and 493 MMcf in fourth quarter and full year 2011 |
(2) |
BOE Barrels of oil equivalent (converting natural gas to oil at 6 Mcfe / Bbl) |
(3) |
Excludes 9 working interest wells for Q4 and FY 2012 and 8 working interest wells for Q4 and FY 2011 as we also own a royalty interest in these wells |
(4) |
Wells operated by third-party lessees/operators. Represent wells in which we own a royalty or working interest in a producing well |
(5) |
Excludes 1,181 wells in which Credo Petroleum has an overriding royalty interest |
FOURTH QUARTER 2012
MINERAL RESOURCES PIPELINE
MINERAL INTERESTS OWNED (1)
Forestars mineral resources segment includes approximately 590,000 owned net mineral acres principally located in Texas, Louisiana, Georgia and Alabama.
State |
|
Available |
|
Leased |
|
Held by |
|
Total (2) |
|
Texas |
|
213,000 |
|
12,000 |
|
27,000 |
|
252,000 |
|
Louisiana |
|
115,000 |
|
17,000 |
|
12,000 |
|
144,000 |
|
Georgia |
|
152,000 |
|
|
|
|
|
152,000 |
|
Alabama |
|
40,000 |
|
|
|
|
|
40,000 |
|
California |
|
1,000 |
|
|
|
|
|
1,000 |
|
Indiana |
|
1,000 |
|
|
|
|
|
1,000 |
|
Total |
|
522,000 |
|
29,000 |
|
39,000 |
|
590,000 |
|
(1) Represents net acres and includes ventures
(2) Excludes 477 net mineral acres located in Colorado, which includes 379 leased acres and 29 acres held by production
MINERAL INTERESTS LEASED (1)
Forestars mineral resources segment includes approximately 162,000 net mineral acres of leasehold and overriding royalty interests principally located in Nebraska, Kansas, Oklahoma, North Dakota and Texas predominantly as result of our September 28, 2012 acquisition of CREDO Petroleum.
State |
|
Undeveloped |
|
Held by |
|
Total (2) |
|
Nebraska |
|
77,000 |
|
2,000 |
|
79,000 |
|
Kansas |
|
40,000 |
|
3,000 |
|
43,000 |
|
Oklahoma |
|
|
|
17,000 |
|
17,000 |
|
North Dakota |
|
4,000 |
|
2,000 |
|
6,000 |
|
Texas |
|
1,000 |
|
2,000 |
|
3,000 |
|
Other(2) |
|
3,000 |
|
11,000 |
|
14,000 |
|
Total |
|
125,000 |
|
37,000 |
|
162,000 |
|
(1) Represents net acres
(2) Includes approximately 8,400 net acres of overriding royalty interests
FORESTAR GROUP INC.
REAL ESTATE SEGMENT
PERFORMANCE METRICS
|
|
Fourth Quarter |
|
Full Year |
| ||||||||
REAL ESTATE |
|
2012 |
|
2011 |
|
2012 |
|
2011 |
| ||||
Owned, Consolidated & Equity Method Ventures: |
|
|
|
|
|
|
|
|
| ||||
Residential Lots Sold |
|
384 |
|
309 |
|
1,365 |
|
1,117 |
| ||||
Revenue per Lot Sold |
|
$ |
58,100 |
|
$ |
43,300 |
|
$ |
52,000 |
|
$ |
47,400 |
|
Commercial Acres Sold |
|
40 |
|
2 |
|
95 |
|
26 |
| ||||
Revenue per Commercial Acre Sold |
|
$ |
208,300 |
|
$ |
547,200 |
|
$ |
130,800 |
|
$ |
193,700 |
|
Undeveloped Acres Sold |
|
7,370 |
|
13,200 |
|
9,330 |
|
17,150 |
| ||||
Revenue per Acre Sold |
|
$ |
1,900 |
|
$ |
2,300 |
|
$ |
2,100 |
|
$ |
2,400 |
|
Owned & Consolidated Ventures: |
|
|
|
|
|
|
|
|
| ||||
Residential Lots Sold |
|
251 |
|
109 |
|
926 |
|
567 |
| ||||
Revenue per Lot Sold |
|
$ |
57,600 |
|
$ |
62,700 |
|
$ |
52,000 |
|
$ |
56,700 |
|
Commercial Acres Sold |
|
28 |
|
|
|
83 |
|
4 |
| ||||
Revenue per Commercial Acre Sold |
|
$ |
194,500 |
|
|
|
$ |
114,800 |
|
$ |
185,300 |
| |
Undeveloped Acres Sold |
|
7,250 |
|
13,200 |
|
9,195 |
|
17,130 |
| ||||
Revenue per Acre Sold |
|
$ |
1,900 |
|
$ |
2,300 |
|
$ |
2,000 |
|
$ |
2,400 |
|
Ventures Accounted For Using the Equity Method: |
|
|
|
|
|
|
|
|
| ||||
Residential Lots Sold |
|
133 |
|
200 |
|
439 |
|
550 |
| ||||
Revenue per Lot Sold |
|
$ |
58,900 |
|
$ |
32,700 |
|
$ |
52,100 |
|
$ |
37,700 |
|
Commercial Acres Sold |
|
12 |
|
2 |
|
12 |
|
22 |
| ||||
Revenue per Commercial Acre Sold |
|
$ |
239,800 |
|
$ |
547,200 |
|
$ |
239,800 |
|
$ |
195,200 |
|
Undeveloped Acres Sold |
|
120 |
|
|
|
135 |
|
20 |
| ||||
Revenue per Acre Sold |
|
$ |
2,900 |
|
|
|
$ |
2,600 |
|
$ |
3,000 |
|
YEAR-END 2012
REAL ESTATE PIPELINE
Real Estate |
|
Undeveloped |
|
In |
|
Entitled |
|
Developed & |
|
Total |
|
|
|
|
|
|
|
|
|
|
|
|
|
Undeveloped Land |
|
|
|
|
|
|
|
|
|
|
|
Owned |
|
88,364 |
|
|
|
|
|
|
|
|
|
Ventures |
|
6,901 |
|
|
|
|
|
|
|
95,265 |
|
|
|
|
|
|
|
|
|
|
|
|
|
Residential |
|
|
|
|
|
|
|
|
|
|
|
Owned |
|
|
|
23,362 |
|
8,979 |
|
805 |
|
|
|
Ventures |
|
|
|
|
|
2,038 |
|
203 |
|
35,387 |
|
Commercial |
|
|
|
|
|
|
|
|
|
|
|
Owned |
|
|
|
2,708 |
|
1,203 |
|
592 |
|
|
|
Ventures |
|
|
|
|
|
387 |
|
190 |
|
5,080 |
|
Total Acres |
|
95,265 |
|
26,070 |
|
12,607 |
|
1,790 |
|
135,732 |
|
|
|
|
|
|
|
|
|
|
|
|
|
Estimated Residential Lots |
|
|
|
|
|
21,052 |
|
2,748 |
|
23,800 |
|
* In addition, Forestar owns a 58% interest in a venture which controls approximately 16,000 acres of undeveloped land in Georgia with minimal investment. Excludes acres associated with fully developed commercial and income producing properties.
FORESTAR GROUP INC.
FIBER RESOURCES SEGMENT
PERFORMANCE METRICS
|
|
Fourth Quarter |
|
Full Year |
| ||||||||
FIBER RESOURCES |
|
2012 |
|
2011 |
|
2012 |
|
2011 |
| ||||
Fiber Sales * |
|
|
|
|
|
|
|
|
| ||||
Pulpwood Tons Sold |
|
105,000 |
|
44,100 |
|
370,200 |
|
266,200 |
| ||||
Average Pulpwood Price / Ton |
|
$ |
10.65 |
|
$ |
9.31 |
|
$ |
9.83 |
|
$ |
8.69 |
|
Sawtimber Tons Sold |
|
57,000 |
|
5,600 |
|
123,700 |
|
56,800 |
| ||||
Average Sawtimber Price / Ton |
|
$ |
23.98 |
|
$ |
22.17 |
|
$ |
21.77 |
|
$ |
16.13 |
|
|
|
|
|
|
|
|
|
|
| ||||
Total Tons Sold |
|
162,000 |
|
49,700 |
|
493,900 |
|
323,000 |
| ||||
Average Price / Ton |
|
$ |
15.34 |
|
$ |
10.76 |
|
$ |
12.82 |
|
$ |
10.00 |
|
|
|
|
|
|
|
|
|
|
| ||||
Recreational Activity |
|
|
|
|
|
|
|
|
| ||||
Average Acres Leased |
|
128,200 |
|
139,300 |
|
129,800 |
|
174,500 |
| ||||
Average Lease Rate / Acre |
|
$ |
8.36 |
|
$ |
8.83 |
|
$ |
8.73 |
|
$ |
8.80 |
|
FORESTAR GROUP INC.
PROJECTS IN ENTITLEMENT
A summary of projects in the entitlement process (a) at year-end 2012 follows:
|
|
|
|
Project |
|
Project |
|
County |
|
Acres (b) |
|
|
|
|
|
|
|
California |
|
|
|
|
|
Hidden Creek Estates |
|
Los Angeles |
|
700 |
|
Terrace at Hidden Hills |
|
Los Angeles |
|
30 |
|
|
|
|
|
|
|
Georgia |
|
|
|
|
|
Ball Ground |
|
Cherokee |
|
500 |
|
Crossing |
|
Coweta |
|
230 |
|
Fincher Road |
|
Cherokee |
|
3,890 |
|
Fox Hall |
|
Coweta |
|
960 |
|
Garland Mountain |
|
Cherokee/Bartow |
|
350 |
|
Martins Bridge |
|
Banks |
|
970 |
|
Mill Creek |
|
Coweta |
|
770 |
|
Serenity |
|
Carroll |
|
440 |
|
Waleska |
|
Cherokee |
|
90 |
|
Wolf Creek |
|
Carroll/Douglas |
|
12,230 |
|
Yellow Creek |
|
Cherokee |
|
1,060 |
|
|
|
|
|
|
|
Texas |
|
|
|
|
|
Lake Houston |
|
Harris/Liberty |
|
3,700 |
|
San Jacinto |
|
Montgomery |
|
150 |
|
|
|
|
|
|
|
Total |
|
|
|
26,070 |
|
(a) A project is deemed to be in the entitlement process when customary steps necessary for the preparation of an application for governmental land-use approvals, like conducting pre-application meetings or similar discussions with governmental officials, have commenced, or an application has been filed. Projects listed may have significant steps remaining, and there is no assurance that entitlements ultimately will be received.
(b) Project acres, which are the total for the project regardless of our ownership interest, are approximate. The actual number of acres entitled may vary.
FORESTAR GROUP INC.
REAL ESTATE PROJECTS
A summary of our entitled,(a) developed & under development projects at year-end 2012 follows:
|
|
|
|
|
|
Residential Lots (c) |
|
Commercial Acres (d) |
| ||||
Project |
|
County |
|
Interest |
|
Lots Sold Since |
|
Lots |
|
Acres Sold Since |
|
Acres |
|
Projects we own |
|
|
|
|
|
|
|
|
|
|
|
|
|
California |
|
|
|
|
|
|
|
|
|
|
|
|
|
San Joaquin River |
|
Contra Costa/ Sacramento |
|
100% |
|
|
|
|
|
|
|
288 |
|
Colorado |
|
|
|
|
|
|
|
|
|
|
|
|
|
Buffalo Highlands |
|
Weld |
|
100% |
|
|
|
164 |
|
|
|
|
|
Johnstown Farms |
|
Weld |
|
100% |
|
170 |
|
443 |
|
2 |
|
7 |
|
Pinery West |
|
Douglas |
|
100% |
|
|
|
|
|
|
|
111 |
|
Stonebraker |
|
Weld |
|
100% |
|
|
|
603 |
|
|
|
|
|
Texas |
|
|
|
|
|
|
|
|
|
|
|
|
|
Arrowhead Ranch |
|
Hays |
|
100% |
|
|
|
259 |
|
|
|
6 |
|
Bar C Ranch |
|
Tarrant |
|
100% |
|
292 |
|
907 |
|
|
|
|
|
Barrington Kingwood |
|
Harris |
|
100% |
|
48 |
|
132 |
|
|
|
|
|
Cibolo Canyons |
|
Bexar |
|
100% |
|
732 |
|
743 |
|
96 |
|
54 |
|
Harbor Lakes |
|
Hood |
|
100% |
|
203 |
|
246 |
|
2 |
|
19 |
|
Hunters Crossing |
|
Bastrop |
|
100% |
|
397 |
|
93 |
|
38 |
|
71 |
|
Lakes of Prosper |
|
Collin |
|
100% |
|
|
|
285 |
|
|
|
|
|
La Conterra |
|
Williamson |
|
100% |
|
120 |
|
380 |
|
|
|
58 |
|
Maxwell Creek |
|
Collin |
|
100% |
|
808 |
|
191 |
|
10 |
|
|
|
Oak Creek Estates |
|
Comal |
|
100% |
|
131 |
|
516 |
|
13 |
|
|
|
Stoney Creek |
|
Dallas |
|
90% |
|
144 |
|
610 |
|
|
|
|
|
Summer Creek Ranch |
|
Tarrant |
|
100% |
|
820 |
|
454 |
|
35 |
|
44 |
|
Summer Lakes |
|
Fort Bend |
|
100% |
|
473 |
|
657 |
|
56 |
|
|
|
Summer Park (g) |
|
Fort Bend |
|
100% |
|
|
|
210 |
|
27 |
|
63 |
|
The Colony |
|
Bastrop |
|
100% |
|
438 |
|
711 |
|
22 |
|
31 |
|
The Preserve at Pecan Creek |
|
Denton |
|
100% |
|
370 |
|
424 |
|
|
|
7 |
|
Village Park |
|
Collin |
|
100% |
|
504 |
|
256 |
|
3 |
|
2 |
|
Westside at Buttercup Creek |
|
Williamson |
|
100% |
|
1,413 |
|
83 |
|
66 |
|
|
|
Other projects (11) |
|
Various |
|
100% |
|
2,493 |
|
171 |
|
227 |
|
38 |
|
Georgia |
|
|
|
|
|
|
|
|
|
|
|
|
|
Seven Hills |
|
Paulding |
|
100% |
|
653 |
|
434 |
|
26 |
|
113 |
|
Villages of Burt Creek |
|
Dawson |
|
100% |
|
|
|
1,715 |
|
|
|
57 |
|
Towne West |
|
Bartow |
|
100% |
|
|
|
2,674 |
|
|
|
121 |
|
Other projects (18) |
|
Various |
|
100% |
|
1,729 |
|
3,040 |
|
3 |
|
705 |
|
Florida |
|
|
|
|
|
|
|
|
|
|
|
|
|
Other projects (3) |
|
Various |
|
100% |
|
708 |
|
137 |
|
|
|
|
|
Missouri and Utah |
|
|
|
|
|
|
|
|
|
|
|
|
|
Other projects (2) |
|
Various |
|
100% |
|
499 |
|
55 |
|
|
|
|
|
|
|
|
|
|
|
13,145 |
|
16,593 |
|
626 |
|
1,795 |
|
Projects in entities we consolidate |
|
|
|
|
|
|
|
|
|
|
|
|
|
Texas |
|
|
|
|
|
|
|
|
|
|
|
|
|
City Park |
|
Harris |
|
75% |
|
1,210 |
|
101 |
|
50 |
|
115 |
|
Lantana |
|
Denton |
|
55%(e) |
|
957 |
|
1,291 |
|
|
|
12 |
|
Timber Creek |
|
Collin |
|
88% |
|
|
|
614 |
|
|
|
|
|
Willow Creek |
|
Walter/Fort Bend |
|
90% |
|
|
|
231 |
|
|
|
|
|
Other projects (2) |
|
Various |
|
Various |
|
7 |
|
202 |
|
|
|
129 |
|
Georgia |
|
|
|
|
|
|
|
|
|
|
|
|
|
The Georgian |
|
Paulding |
|
75% |
|
289 |
|
1,052 |
|
|
|
|
|
|
|
|
|
|
|
2,463 |
|
3,491 |
|
50 |
|
256 |
|
Total owned and consolidated |
|
|
|
|
|
15,608 |
|
20,084 |
|
676 |
|
2,051 |
|
Projects in ventures that we account for using the equity method |
|
|
|
|
|
|
|
|
|
|
|
|
|
Texas |
|
|
|
|
|
|
|
|
|
|
|
|
|
Entrada |
|
Travis |
|
50% |
|
|
|
821 |
|
|
|
|
|
Fannin Farms West |
|
Tarrant |
|
50% |
|
324 |
|
24 |
|
|
|
12 |
|
Harpers Preserve |
|
Montgomery |
|
50% |
|
202 |
|
1,523 |
|
|
|
72 |
|
Lantana |
|
Denton |
|
Various(e) |
|
1,470 |
|
62 |
|
16 |
|
42 |
|
Long Meadow Farms |
|
Fort Bend |
|
37% |
|
1,003 |
|
796 |
|
119 |
|
180 |
|
Southern Trails |
|
Brazoria |
|
80% |
|
576 |
|
407 |
|
|
|
|
|
Stonewall Estates |
|
Bexar |
|
50% |
|
305 |
|
83 |
|
|
|
|
|
Other projects (1) |
|
Nueces |
|
50% |
|
|
|
|
|
|
|
15 |
|
Total in ventures |
|
|
|
|
|
3,880 |
|
3,716 |
|
135 |
|
321 |
|
Combined Total |
|
|
|
|
|
19,488 |
|
23,800 |
|
811 |
|
2,372 |
|
(a) |
A project is deemed entitled when all major discretionary governmental land-use approvals have been received. Some projects may require additional permits and/or non-governmental authorizations for development. |
(b) |
Interest owned reflects our net equity interest in the project, whether owned directly or indirectly. There are some projects that have multiple ownership structures within them. Accordingly, portions of these projects may appear as owned, consolidated and/or accounted for using the equity method. |
(c) |
Lots are for the total project, regardless of our ownership interest. Lots remaining represent vacant developed lots, lots under development and future planned lots and are subject to change based on business plan revisions. |
(d) |
Commercial acres are for the total project, regardless of our ownership interest and are net developable acres, which may be fewer than the gross acres available in the project. |
(e) |
The Lantana project consists of a series of 26 partnerships in which our voting interests range from 25% to 55%. We account for three of these partnerships using the equity method and we consolidate the remaining partnerships. |
(f) |
Excludes acres associated with commercial and income producing properties. |
(g) |
Formerly Waterford Park |
A summary of our significant commercial and income producing properties at year-end 2012 follows:
Project |
|
County |
|
Market |
|
Interest |
|
Type |
|
Acres |
|
Description |
Radisson Hotel |
|
Travis |
|
Austin |
|
100 |
% |
Hotel |
|
2 |
|
413 guest rooms and suites |
Promesa |
|
Travis |
|
Austin |
|
100 |
% |
Multifamily |
|
16 |
|
289 unit luxury apartment |
Eleven |
|
Travis |
|
Austin |
|
25 |
% |
Multifamily |
|
3 |
|
257 unit luxury apartment (b) |
360O |
|
Arapahoe |
|
Denver |
|
20 |
% |
Multifamily |
|
4 |
|
304 unit luxury apartment (b) |
(a) |
Interest owned reflects our total equity interest in the project, whether owned directly or indirectly. |
(b) |
Construction in progress |
FORESTAR GROUP INC.
RECONCILIATION OF NON-GAAP FINANCIAL MEASURES
(Unaudited)
Forestars Net Income and Earnings Per Share (EPS) excluding special items for the fourth quarters and years ended December 31, 2012 and 2011 are non-GAAP financial measures within the meaning of Regulation G of the Securities and Exchange Commission. Non-GAAP financial measures are not in accordance with, or an alternative to, U.S. Generally Accepted Accounting Principles (GAAP). The company believes presenting non-GAAP Net Income and EPS is helpful to analyze financial performance without the impact of items that may obscure trends in the companys underlying performance. A detailed reconciliation is provided below outlining the differences between these non-GAAP measures and the directly related GAAP measures.
|
|
Fourth Quarter |
|
Full Year |
| ||||||||
($ in millions, except per share amounts) |
|
2012 |
|
2011 |
|
2012 |
|
2011 |
| ||||
|
|
|
|
|
|
|
|
|
| ||||
Net income (loss), after-tax, in accordance with GAAP |
|
$ |
10.0 |
|
$ |
(22.9 |
) |
$ |
12.9 |
|
$ |
7.2 |
|
|
|
|
|
|
|
|
|
|
| ||||
Special items, after-tax |
|
|
|
|
|
|
|
|
| ||||
Credo Petroleum acquisition expenses |
|
0.4 |
|
|
|
4.1 |
|
|
| ||||
Loss on extinguishment of debt |
|
|
|
|
|
2.9 |
|
|
| ||||
Debt offering expenses |
|
|
|
|
|
|
|
2.1 |
| ||||
Non-cash asset impairments |
|
|
|
28.9 |
|
|
|
29.4 |
| ||||
Gain on sale of timberland |
|
|
|
|
|
|
|
(40.2 |
) | ||||
Total special items, after-tax |
|
0.4 |
|
28.9 |
|
$ |
7.0 |
|
(8.7 |
) | |||
|
|
|
|
|
|
|
|
|
| ||||
Net income, after-tax, excluding special items |
|
$ |
10.4 |
|
$ |
6.0 |
|
$ |
19.9 |
|
$ |
(1.5 |
) |
|
|
|
|
|
|
|
|
|
| ||||
Net income (loss) per share, in accordance with GAAP |
|
$ |
0.28 |
|
$ |
(0.65 |
) |
$ |
0.36 |
|
$ |
0.20 |
|
|
|
|
|
|
|
|
|
|
| ||||
Special items, after-tax, per diluted share |
|
|
|
|
|
|
|
|
| ||||
Credo acquisition expenses |
|
0.01 |
|
|
|
0.12 |
|
|
| ||||
Loss on extinguishment of debt |
|
|
|
|
|
0.08 |
|
|
| ||||
Debt offering expenses |
|
|
|
|
|
|
|
0.06 |
| ||||
Non-cash asset impairments |
|
|
|
0.82 |
|
|
|
0.82 |
| ||||
Gain on sale of timberland |
|
|
|
|
|
|
|
(1.12 |
) | ||||
Total special items, after-tax |
|
0.01 |
|
$ |
0.82 |
|
$ |
0.20 |
|
$ |
(0.24 |
) | |
|
|
|
|
|
|
|
|
|
| ||||
Net income per share, excluding special items |
|
$ |
0.29 |
|
$ |
0.17 |
|
$ |
0.56 |
|
$ |
(0.04 |
) |
|
|
|
|
|
|
|
|
|
| ||||
Average basic shares outstanding |
|
35.2 |
|
35.2 |
|
35.2 |
|
35.4 |
| ||||
Average diluted shares outstanding |
|
35.6 |
|
35.2 |
|
35.5 |
|
35.8 |
|
Exhibit 99.2
|
Fourth Quarter and Full Year 2012 Financial Results February 14, 2013 Building Momentum By Accelerating Value Realization, Optimizing Transparency and Growing Net Asset Value |
|
Notice To Investors This release contains forward-looking statements within the meaning of the federal securities laws. Forward-looking statements are typically identified by words or phrases such as will, anticipate, estimate, expect, project, intend, plan, believe, target, forecast, and other words and terms of similar meaning. These statements reflect managements current views with respect to future events and are subject to risk and uncertainties. We note that a variety of factors and uncertainties could cause our actual results to differ significantly from the results discussed in the forward-looking statements, including our ability to achieve synergies and value creation contemplated by the merger with Credo, and our ability to promptly and effectively integrate Credos businesses. Other factors and uncertainties that might cause such differences include, but are not limited to: general economic, market, or business conditions; changes in commodity prices; opportunities (or lack thereof) that may be presented to us and that we may pursue; fluctuations in costs and expenses including development costs; demand for new housing, including impacts from mortgage credit availability; lengthy and uncertain entitlement processes; cyclicality of our businesses; accuracy of accounting assumptions; competitive actions by other companies; changes in laws or regulations; and other factors, many of which are beyond our control. Except as required by law, we expressly disclaim any obligation to publicly revise any forward-looking statements contained in this news release to reflect the occurrence of events after the date of this news release. This presentation includes Non-GAAP financial measures. The required reconciliation to GAAP financial measures can be found as an exhibit to this presentation and on our website at www.forestargroup.com. 2 |
|
Fourth Quarter and Full Year 2012 Financial Results Building Momentum By Accelerating Value Realization, Optimizing Transparency and Growing Net Asset Value 3 |
|
Net Income (Loss) Before Special Items Reflects Acceleration in Operating Results ($ in Millions, except per share data) Full Year 2012 Full Year 2011 Net Income, in accordance with GAAP $12.9 $7.2 Earnings Per Share $0.36 $0.20 Special items per share: Credo acquisition expenses $0.12 $ - Loss on extinguishment of debt 0.08 - Debt offering expenses - 0.06 Non-cash asset impairments - 0.82 Gain on sale of timberland - ($1.12) Total special items per share $0.20 ($0.24) Net income (loss) per share before special items* $0.56 ($0.04) Note: Year-end 2012 weighted average diluted shares outstanding were 35.5 million See footnotes on slide 42 for additional details regarding special items *These are Non-GAAP financial measures. Reconciliation between GAAP & Non-GAAP financial measures provided in tables following this presentation, and on companys investor relations website 4 |
|
Accelerating Value Realization Drives Improved Segment Operating Results ($ in Millions) Full Year 2012 Full Year 2011 Segment Earnings (Loss): Real Estate $53.6 ($25.7) Mineral Resources 21.6 16.0 Fiber Resources 5.0 1.9 Total Segment Earnings (Loss) $80.2 ($7.8) 5 Note: See footnotes on slide 43 for additional details regarding segment earnings (loss) FY 2011 real estate segment results include ($45.2) million in non-cash asset impairment charges principally related to acquisition of certain assets from CL Realty and TEMCO ventures |
|
Accelerating Value Realization and Strategic and Disciplined Investments Drives Improved Operating Results ($ in Millions) 4th Quarter 2012 4th Quarter 2011 Net Income (Loss), in accordance with GAAP $10.0 ($22.9) Earnings (Loss) Per Share $0.28 ($0.65) Special items per share: Credo acquisition expenses $0.01 - Non-cash asset impairments - $0.82 Total Special Items per share $0.01 $0.82 Net income per share before special items* $0.29 $0.17 6 *These are Non-GAAP financial measures. Reconciliation between GAAP & Non-GAAP financial measures provided in tables following this presentation, and on companys investor relations website Note: Q4 2012 weighted average diluted shares outstanding were 35.6 million See footnotes on slide 44 for additional details regarding special items |
|
Accelerating Value Realization and Strategic and Disciplined Investments Drives Improved Operating Results ($ in Millions) 4th Quarter 2012 4th Quarter 2011 Segment Earnings (Loss): Real Estate $21.6 ($25.0) Mineral Resources 5.7 3.7 Fiber Resources 2.3 0.1 Total Segment Earnings (Loss) $29.6 ($21.2) Real estate non-cash asset impairment charges - $44.5 7 Note: See footnotes on slide 45 for additional details regarding segment earnings (loss) |
|
Maintaining Financial Strength While Executing Growth Strategy * Other consolidated debt principally non-recourse to Forestar ($ in Millions) YE 2012 YE 2011 Credit Facility Borrowings $244 $130 Other Consolidated Debt* 50 92 Total Debt $294 $222 Total Debt / Total Capital 36% 30% Available Liquidity $159 $156 Forestar Leverage & Liquidity 2012 Significant Cash Transactions 8 Cash Debt Palisades West sale 25% interest +$32 $ -- Light Farms venture - sale +25 (31) MF ventures - reimbursements +11 -- Broadstone - sale +30 (26) Las Brisas - sale +10 (28)* Total +$108 ($85) Accelerating value realization from sale of stabilized income producing properties and entitled real estate has generated almost $110 million in cash and over $85 million in debt reduction * Represents unconsolidated venture debt |
|
Maintain Financial Strength and Ample Liquidity While Executing Growth Strategy Maintain balance sheet strength Reposition non-core real estate assets for reinvestment and debt reduction Increase senior credit facility borrowing base through acquisitions and reserve additions to maximize liquidity Maintain sufficient liquidity (> $100 million) for growth and investment Attractive public debt markets may offer additional liquidity for growth and investment and better match asset duration * Represents total consolidated debt, based on YE 2012 outstanding. Assumes revolving credit facility maturity is extended one year under existing extension option. $0 $50 $100 $150 $200 $250 2013 2014 2015 2016 2017 Forestar Debt Maturity Schedule* 9 |
|
Fourth Quarter & Full Year 2012 Operating Highlights Building Momentum By Accelerating Value Realization, Optimizing Transparency and Growing Net Asset Value 10 |
|
($20) $0 $20 $40 $60 $80 $100 $120 $140 2008 2009 2010 2011 2012 2013 Est. 2014 Est. 2015 Est. Total Segment EBITDA ($ in millions) EBITDA Average = $34 million Execution of Triple in FOR Initiatives Putting EBITDA Points on the Board EBITDA Average = $120 million Note: EBITDA = Total segment earnings (loss) + depreciation + depletion and amortization Total Segment EBITDA is a Non-GAAP financial measure. The reconciliation between GAAP and Non-GAAP financial measures is included in the appendix to this presentation and provided on the companys investor relations website. 11 Multifamily Sales Lot Sales Commercial Tract Sales Income Producing Assets Lower Opex Lower Asset Impairments Oil Production Fiber Sales Oil Production Lot Sales First Four Years Second Four Years |
|
Full Year 2012 Highlights Completed acquisition of CREDO Petroleum - $146MM equity purchase price Sold two stabilized multifamily communities for $97 million* Completed construction of Promesa multifamily community in Austin, TX Acquired two multifamily sites - Nashville, TN & Charlotte, NC Sold 1,365 residential lots, up 22% vs. 2011 avg. pricing up almost 10% FOR share of total residential lot gross profit up 60% vs. 2011 Almost 1,340 lots under option contracts Sold nearly 494,000 tons of fiber 99% of available land leased for recreation OIL & GAS SINGLE-FAMILY FORESTAR TIMBERLAND MULTIFAMILY Oil production up over 144% vs. 2011 29 additional oil and gas wells; 936 producing wells at year-end Over 8,900 net mineral acres leased to E&P operators for ~$600 / acre *Includes ventures 12 |
|
Fourth Quarter 2012 Highlights Provided additional transparency and disclosure at investor conference Repurchased almost 100,000 shares at an average price of $14.90 / share Venture sold Las Brisas community - $8.2 million in earnings to Forestar Completed construction of Promesa in Austin, TX Acquired multifamily site in Charlotte, NC for ~$6 million Sold 384 residential lots, up 24% vs. 2011 average pricing up 34% Sold 40 acres of commercial tracts for $208,300 acre Sold almost 7,400 acres of undeveloped land for $14 million Sold 162,000 tons of fiber Recreational leasing remains strong OIL & GAS SINGLE-FAMILY FORESTAR TIMBERLAND MULTIFAMILY Oil production up 245% or 122,000 barrels vs. Q4 2011 Leased nearly 5,000 net mineral acres to E&P companies for ~$300 / acre 16 wells drilled, up 406 gross wells from Q4 2011(Credo acquisition) 13 |
|
Mineral Resources Fourth Quarter and Full Year 2012 Highlights Building Momentum By Driving Leasing and Exploration to Increase Production and Reserves 14 |
|
$16.0 $21.6 $6.8 $2.7 ($3.9) $0.0 $5.0 $10.0 $15.0 $20.0 $25.0 $30.0 2011 Oil & Gas Production Leasing & Delay Rentals Operating Expenses 2012 Segment Earnings Increased Oil Production Driving Improved Earnings $3.7 $2.5 $1.0 ($1.5) $5.7 $0.0 $2.0 $4.0 $6.0 $8.0 $10.0 Q4 2011 Oil & Gas Production Leasing & Delay Rentals Operating Expenses Q4 2012 Segment Earnings Segment Earnings Reconciliation Q4 2011 vs. Q4 2012 Q4 2012 Highlights vs. Q4 2011: Oil production up 245% or 122,000 barrels Credo acquisition provided 116,500 barrels of oil production in Q4 2012 Nearly 5,000 net mineral acres leased to E&P operators for almost $300 / acre 16 additional wells completed FY 2012 Highlights vs. FY 2011: Oil production up 144%, or 220,000 barrels Leased 8,910 net mineral acres to E&P operators for ~$600 / acre 29 additional wells completed; 936 producing wells Investing in experienced and talented employees Segment Earnings Reconciliation FY 2011 vs. FY 2012 ($ in millions) ($ in millions) 15 |
|
Drilling & Production Growth Accelerating 16 Note: Includes Forestars share of equity method ventures 496 541 936 400 500 600 700 800 900 1,000 0 5 10 15 20 25 Q1 11 Q2 11 Q3 11 Q4 11 Q1 12 Q2 12 Q3 12 Q4 12 Total Wells Wells Drilled Gross Total Wells Gross Wells Drilled Growth in Drilling Activity & Well Count* Q1 2011 Q4 2012 * Royalty interest wells owned by third-party lessee / operator 20,000 40,000 60,000 80,000 100,000 120,000 140,000 160,000 180,000 Q1 11 Q2 11 Q3 11 Q4 11 Q1 12 Q2 12 Q3 12 Q4 12 Oil Production (Bbls) FOR Share of Quarterly Oil Production* Q1 2011 Q4 2012 Oil production from acquisition of Credo Petroleum |
|
Forestar Preliminary Oil & Gas Reserves 17 2.4 3.0 1.9 5.6* FY 2010 FY 2011 FY 2012 MMBOE Forestar Proven Reserves (MMBOE) FOR Reserves Credo Reserves 25% 36% 57% 75% 64% 43% FY 2010 FY 2011 FY 2012 Natural Gas (BOE) Oil Forestar Proven Reserves % Oil (MMBOE) Note: Based upon preliminary YE 2012 oil and gas reserves * Excludes 0.7 million BOE of Probable and Possible reserves Note: MMBOE = million barrels of oil equivalent |
|
Bakken / Three Forks Drilling Activity Accelerating Production and Reserve Growth Bakken / Three Forks Leasehold Interests Net Mineral Acres ~6,000 Average working interest 8.0% Potential Units 50 Total Potential Gross Wells 400 Avg. Well EUR* Assumption >500 Mboe Year-end 2012 Gross Wells Producing 35 Gross Wells Drilling 15 Addl Wells Planned by YE 2013 54 *EUR represents ultimate economic recoveries per well **Represents proved developed producing wells 18 18 Bakken / Three Forks Proved Developed Producing Wells 0 10 20 30 40 50 60 70 80 Feb-10 Apr-10 Jun-10 Aug-10 Oct-10 Dec-10 Feb-11 Apr-11 Jun-11 Aug-11 Oct-11 Dec-11 Feb-12 Apr-12 Jun-12 Aug-12 Oct-12 Dec-12 Feb-13 Apr-13 Jun-13 Aug-13 Oct-13 Dec-13 Producing Wells 4 7 24 43 |
|
Bakken / Three Forks Production and Type Curves 19 Cumulative Mbo Produced 0 50,000 100,000 150,000 200,000 250,000 300,000 1 2 3 4 5 6 7 8 9 10 11 12 13 14 15 16 17 18 19 20 21 22 23 24 25 26 27 28 29 30 31 32 33 34 35 36 EUR Well Level IRR (Mbo) 600 57% 500 40% 400 24% Average Type Curve Credo acquisition underwriting and returns based on 500 Mbo per well Note: Average type curve production based upon initial 35 producing wells Cumulative Well Production From 35 Proved Developed Producing Wells |
|
Kansas and Nebraska Represent Scalable Exploration Model with Solid Returns 122,000 net acres of leasehold interest Acquired leasehold interest in 21,000 net mineral acres in Q4 2012 Target formation: Lansing - Kansas City Drilling costs: ~$500,000 / well Attractive exploration success rate: ~40% Meaningful reserves: 40,000 - 50,000+ BOE / well Scalable exploration model Kansas & Nebraska Highlights Kansas & Nebraska Activity 62 Producing Wells 4 Wells Being Drilled 86 Additional Wells Planned Note: Actual results may vary from illustrations Rate of Return 0% 50% 100% 150% 200% 250% 300% 350% 400% $50 $60 $70 $80 $90 $100 $110 $120 Well Returns at Various Oil Prices Oil Price ($ / Bbl) Single Well Cost = $0.8MM 41 MBoe EUR 20 |
|
2012 Mineral Activity Note: Wells owned by third-party lessee / operator Leasing: 8,910 acres leased ~$600 / acre Seismic Agreements: 127,000 acres of 3-D seismic received to generate prospects Lease Structure Benefits: Drilling requirements Horizontal and vertical Pugh clause Working interest options Over 8,900 net mineral acres leased in Louisiana & Texas* Significant Operators Texas & Louisiana * Includes leases, seismic and exploration agreements Promoting Louisiana Exploration and Production Activity During 2012 21 Minerals Available For Lease Minerals Leased to Others Held By Production |
|
2013 Capital Investment - Drilling Program Type State Formation Operation Wells Capital Exploration & Development North Dakota Bakken / Three Forks Non-Operated 54 $43.7 Kansas & Nebraska Lansing Kansas City Operated & Non- Operated 82 14.5 Texas, Louisiana & Other Cleveland / Rodessa / Glenrose / James Lime Operated & Non-operated 18 12.9 Oklahoma Deese Sand Non-Operated 24 1.4 Total Exploration & Drilling 178 $72.5 Generating Production and Reserve Growth By Accelerating Investment in Bakken Wells ($ in millions) Note: Exploration and production investment excludes lease acquisition and geological and geophysical expenses |
|
0 20 40 60 80 100 120 2012 2013 2014 Annual Capital Investment Annual Cash Flow 23 Well Positioned For Meaningful Production and Reserve Growth Annual Oil Production 23 Forestar Oil & Gas Highlights 752,000 net mineral acres* > 936 gross wells** 394 working interest 542 royalty interest > 1 million BOE of annual production*** 2013 Drilling & Completion Capex Target = $72.5 million 0 200,000 400,000 600,000 800,000 2008 2009 2010 2011 2012 2013 Est. Oil Production (Bbls) Forestar Credo Petroleum * Includes owned mineral interests, leasehold interests and overriding royalty interests ** Excludes 1,181 wells with overriding royalty interest *** Based upon annualized Q4 2012 production for Forestar and Credo Capital Investment vs. Cash Flow Note: Capital investment and annual cash flows at well level |
|
Fiber Resources Fourth Quarter and Full Year 2012 Highlights Building Momentum Through Sustainable Harvests and Maximizing Recreational Lease Activity 24 |
|
Increased Harvest Activity Driving Improved Results $0.1 $0.2 ($0.1) $2.3 $2.1 $0.0 $0.5 $1.0 $1.5 $2.0 $2.5 $3.0 Q4 2011 Fiber Sales Rec Leases & Other Revenues Operating Expenses Q4 2012 Segment Earnings Q4 2012 Highlights Sold over 162,000 tons of fiber, up over 225% vs. Q4 2011 Average fiber pricing $15.34 per ton, up over 42% vs. Q4 2011 99% of land leased for recreation ($ in millions) Segment Earnings Reconciliation Q4 2011 vs. Q4 2012 $1.9 $0.3 ($0.3) $5.0 $3.1 $0.0 $1.0 $2.0 $3.0 $4.0 $5.0 $6.0 FY 2011 Fiber Sales Rec Leases & Other Revenues Operating Expenses FY 2012 Segment Earnings Segment Earnings Reconciliation FY 2011 vs. FY 2012 ($ in millions) FY 2012 Highlights Sold almost 494,000 tons of fiber, up over 52% vs. 2011 Average fiber pricing $12.82 per ton, up over 28% vs. 2011 Strong recreational leasing activity 25 |
|
Real Estate Fourth Quarter and Full Year 2012 Highlights Building Momentum By Accelerating Lot Sales and Growing Net Asset Value through Strategic and Disciplined Investments 26 |
|
($8.9) ($0.9) ($25.0) $44.5 $7.3 $4.6 $21.6 ($30.0) ($20.0) ($10.0) $0.0 $10.0 $20.0 $30.0 $40.0 Q4 2011 Asset Impairment Reduction Residential & Commercial Sales Income Producing Properties Undeveloped Land Sales Opex Q4 2012 Real Estate Accelerating Results Q4 2012 Highlights Sold 384 residential lots, up 24% vs. Q4 2011 Sold 40 commercial acres for approx. $208,300 /acre Sold 7,400 acres of undeveloped land for $1,900/ acre Venture sold Las Brisas multifamily community for $40.4 million - $10 million cash and $8.2 million in earnings to FOR Segment Earnings (Loss) Reconciliation Q4 2011 vs. Q4 2012 ($25.7) $45.2 $25.3 $16.0 $4.4 $2.0 ($13.6) $53.6 ($40.0) ($20.0) $0.0 $20.0 $40.0 $60.0 $80.0 FY 2011 Asset Impairment Reduction Gain on Asset Sales Residential & Commercial Sales Income Producing Properties Opex Undeveloped Land Sales FY 2012 FY 2012 Highlights Sold 1,365 residential lots, up 22% vs. 2011 FOR share of residential lot sales gross profit up 60% vs. 2011 Acquired entire interest in 17 residential and mixeduse projects from CL Realty/TEMCO ventures Sold two stabilized multifamily communities, Broadstone and Las Brisas generating $18.4 million in earnings Sold 9,330 acres of undeveloped land for $19 million through retail sales program Segment Earnings (Loss) Reconciliation FY 2011 vs. FY 2012 ($ in millions) ($ in millions) 27 Note: includes ventures |
|
2011 - 2012 Strategic and Disciplined Investments Generating Near-Term Earnings and Cash Flow 28 28 ($ in millions) Full Year 2012 Community Investment Acquisition Date Ownership Market Original Invest. Cash Flow Earnings Galo Tract Q1 2011 100% San Antonio $7.9 $1.6 $1.4 Discovery Spring Trails* Q2 2011 100% Houston 21.1 5.5 3.3 Barrington-Kingwood Q3 2011 100% Houston 9.0 3.7 1.7 Trinity Village Q1 2012 100% Georgia 0.5 - (0.1) CL Realty & TEMCO** Q1 2012 100% Texas/GA 23.5 19.8*** 5.5 Willow Creek Farms Q3 2012 90% Houston 4.5 (0.3) (0.1) Lakes of Prosper Q4 2012 100% Houston 9.0 - - Impala Q4 2012 100% Georgia 1.4 - - Total Community Development Acquisitions $76.9 $30.3 $11.7 * Represents a loan secured by the Discovery at Springs Trail projects in Houston, TX ** Includes acquisition of remaining interest in 17 real estate projects from CL Realty and TEMCO ventures *** Note: includes $11 million of tax benefits in 2012 |
|
Note: MSA performance based on Employment, Gross Metropolitan Product (GMP) and House Price Index Source: Brookings Institute- December 2012 Salt Lake City 1 - $1 Oakland 1 - $9 Strongest Quartile Weakest Quartile Los Angeles 2 - $15 Kansas City 1 - $3 Tampa 3 - $3 Atlanta 33 - $87 San Antonio 4 - $87 Projects and investment as of Q4 2012; includes ventures TEXAS 49 - $373 Texas Markets Represent Over 70% of our Investment in Real Estate Denver 5 - $24 Austin 15 - $118 Dallas/Ft. Worth 15 - $83 Gulf Coast 4 - $35 Houston 11 - $50 Nashville 1 - $12 Note: $ in millions Charlotte 1 - $6 29 |
|
30 Note: Includes ventures 804 $0 $10,000 $20,000 $30,000 $40,000 $50,000 2008 2009 2010 2011 2012 Avg. Lot Margin Forestar Lot Sales U.S. Single-Family Starts Avg. Lot Margin 1,365 Annual Lot Sales 1,117 642 1,060 500 1,000 1,500 Q4 10 Q1 11 Q2 11 Q3 11 Q4 11 Q112 Q212 Q312 Q412 Residential Lots Developed Lots Lots Under Development 2006 Peak Sales = 3,600 lots Residential Lots Under Option Contracts Q4 2010 Q4 2012 Annual Lot Sales & Avg. Lot Margin Residential Lot Sales Building Momentum |
|
Accelerating Value Realization of Stabilized Multifamily Communities 2012 Multifamily Sales Key Metrics ($ in millions) Development Cost $87 FOR Equity $31 Project Debt $55 Net Operating Income (NOI)* $5.7 Sales Price @ 5.9% cap rate $97 Forestar Cash From Sales $40 Forestar Equity 31 Net Cash Flows - Life of Projects 13 GAAP Net Income - Life of Projects $13 IRR 17% *Based upon annualized YTD Q2 2012 results Las Brisas Austin, TX Broadstone Memorial Houston, TX 31 |
|
Increasing Multifamily Pipeline Through Acquisition of Attractive Development Site in Charlotte Charlotte site acquired for ~$6 million Located just outside downtown core, close to premier South End entertainment area Close to major employers and directly across street from largest hospital Product: 200-250 unit Class A luxury multifamily project Target: late-2014 construction with units to begin leasing in Q4 2015 Market Statistics: Charlotte U.S. Unemployment Rate 8.9% 7.8% Job Growth 2.2% 0.1% Occupancy Rate 95% 95% Rent Growth 5% 3% Site Vanderbilt University 32 Charlotte, NC Multifamily Site Locator Map Charlotte Multifamily Development Rendering |
|
Building Solid Pipeline of Development Properties (Proforma) Proforma Project Cash Flows Proforma Forestar Cash Flows Project Date Sale Price Cost Cash From Sale Total Debt FOR Equity FOR Total Cash Cash Multiple* WHOLLY-OWNED Promesa - Austin 2013 $40 45 ($33) $7 12 $20 $13 $23 1.8x VENTURES Eleven - Austin 2015 55 60 (40) 15 20 24 4 12 3.0x 360 - Denver 2015 65 70 (49) 16 21 32 4 11 2.8x Total Estimate $160 175 ($122) $38 53 $76 $21 $46 2.2x ($ in millions) * Cash multiples include fees 33 Site Pipeline Ownership Units Occupancy Target Completion Target Stabilization Westmont - Nashville, TN -- 324 -- Q4 2014 Q4 2015 Charlotte, NC -- 200 - 250 -- Q4 2014 Q4 2015 Dallas, TX -- -- -- -- -- |
|
Fourth Quarter and Full Year 2012 Triple in FOR Initiatives Building Momentum By Accelerating Value Realization, Optimizing Transparency and Growing Net Asset Value 34 |
|
Our Focus: Triple In FOR Initiatives 2012 Activity Focus on Accelerating Value Realization Triple Residential Lot Sales Lot sales up over 22% vs. 2011 Oil production up over 144% vs. 2011 Total segment earnings up over $80 million vs. 2011 Sold two stabilized multifamily projects, generating approximately $40 million in cash flow Triple Oil & Gas Production (Mcfe) Triple Total Segment EBITDA Optimize Transparency & Disclosure Expand Reported Oil and Gas Resource Potential Acquisition of CREDO Petroleum expands Forestars ability to report oil and gas reserve categories Additional disclosures on Dec. 2012 investor day Excel-based financial/operational metrics on website Additional Transparency on Water Interests Report Corporate Sustainability Results Raise NAV Through Strategic and Disciplined Investments Growth Opportunities which Prove Up Net Asset Value and Exceed Return Requirements Completed acquisition of CREDO Petroleum Closed multifamily venture Eleven - Austin Closed multifamily venture 360° - Denver $3.3 million in earnings from loan secured by Discovery at Spring Trails project in Houston Accelerate Participation in Oil & Gas Working Interests Develop Low-Capital, High-Return Multifamily Business 35 |
|
Optimizing Transparency & Disclosure Initiative Accomplishments Optimize Transparency & Disclosure Quarterly conference calls and webcasts New corporate web site Q2 2012 Excel based quarterly financials and key performance metrics available for download on website Additional historical segment data available for download to assist in evaluating FOR at YE 2012 36 2008-2012 Assets State Market Ownership Total Acres Investment Basis Vacant Developed Lots Lots To Be Developed Average Lot Sales (Price/lot) Residential Real Estate Projects - Entitled, Developed & Under Development Wholly-Owned Colorado Denver 100% 800 $ 21,289,552 3 1,207 $ 22,000 Texas Austin 100% 2,037 $ 57,673,733 223 1,320 $ 45,000 Dallas/Fort Worth 100% 1,227 $ 52,143,153 637 2,846 $ 50,000 Houston 100% 291 $ 13,917,389 168 831 $ 43,000 San Antonio 100% 868 $ 51,250,254 333 970 $ 67,000 100% 4,423 $ 174,984,529 1,361 5,967 $ 52,000 Assets State County Market Ownership Acres Investment Basis Low High Undeveloped Land Georgia & Alabama Various Various 100% 95,350 $ 55,274,062 $ 1,500 - $ 2,200 Ironstob Venture* Paulding Paulding 58% 16,000 $ 1,648,052 ** $ 1,500 - $ 2,200 Total Undeveloped Land 111,350 $ 56,922,114 $ 1,500 - $ 2,200 Land in Entitlement California Los Angeles Los Angeles 100% 730 $ 14,440,030 $ 1,500 - $ 2,200 Georgia Various Atlanta 100% 23,010 $ 19,811,697 $ 1,500 - $ 2,200 Texas Various Houston 100% 3,850 $ 2,778,631 $ 1,500 - $ 2,200 Total Land in Entitlement 27,590 $ 37,030,358 $ 1,500 - $ 2,200 * Represents low -cost option to acquire approximately 16,000 acres ** Investment associated w ith approximately 1,200 acres ($ per acre) Historical Sales (2008 - 2012) Undeveloped Land Disclosure Example Wholly-Owned Residential Disclosure Example |
|
Accelerating Value Realization Through Increased Oil Production 0 250,000 500,000 750,000 1,000,000 2010 2011 2012 2013 Est Triple In FOR Avg. Oil Production (Bbls) Forestars Share of Total Oil Production 2010 2013 Est. Minerals Resources Initiatives Establish operating platform: Acquired Credo Petroleum - providing foundation for future growth and investment Improves ability to report additional reserve categories Grow production and reserves through increased working interest investments Accelerate marketing and promotion of minerals through development of prospects 37 |
|
642 1,365 2008 2009 2010 2011 2012 2013 Est. Triple in FOR Avg. Forestar Lot Sales Avg. Lot Margin Accelerating Value Realization Through Increased Residential Lot Sales U.S. Single-Family Starts Residential Lot Sales & Average Margin Community Development Initiatives Continue increasing lot sales and margin Execute opportunistic acquisitions and invest in well located communities Reposition non-core real estate assets 38 Forestar Real Estate Sales Activity (Excluding Undeveloped Land Sales) Note: Includes consolidated ventures $48 $66 $101 $0 $50 $100 $150 $200 2010 2011 2012 2013 Estimate Income Producing Residential Lots Residential Tracts Multifamily Commercial Tracts Avg. Lot Profit |
|
($20) $0 $20 $40 $60 $80 $100 $120 $140 2008 2009 2010 2011 2012 2013 Est. 2014 Est. 2015 Est. Total Segment EBITDA ($ in millions) EBITDA Average = $34 million Execution of Triple in FOR Initiatives Putting EBITDA Points on the Board EBITDA Average = $120 million Note: EBITDA = Total segment earnings (loss) + depreciation + depletion and amortization Total Segment EBITDA is a Non-GAAP financial measure. The reconciliation between GAAP and Non-GAAP financial measures is included in the appendix to this presentation and provided on the companys investor relations website. 39 Multifamily Sales Lot Sales Commercial Tract Sales Income Producing Assets Lower Opex Lower Asset Impairments Oil Production Fiber Sales Oil Production Lot Sales First Four Years Second Four Years |
|
For questions, please contact: Building Momentum By Accelerating Value Realization, Optimizing Transparency and Growing Net Asset Value 40 Anna Torma SVP Corporate Affairs Forestar Group Inc. 6300 Bee Cave Road Building Two, Suite 500 Austin, TX 78746 512-433-5312 annatorma@forestargroup.com |
|
Fourth Quarter and FY 2012 Appendix - Financial Footnotes - Segment KPIs - Oil & Gas Reserves - Reconciliation of Non-GAAP Financial Measures Building Momentum By Accelerating Value Realization, Optimizing Transparency and Growing Net Asset Value 41 |
|
Net Income (Loss) Before Special Items Reflects Acceleration in Operating Results ($ in Millions, except per share data) FY 2012 FY 2011 Net Income, in accordance with GAAP $12.9 $7.2 Earnings Per Share $0.36 $0.20 Special items per share: Credo acquisition expenses $0.12 $ - Loss on extinguishment of debt 0.08 - Debt offering expenses - 0.06 Non-cash asset impairments - 0.82 Gain on sale of timberland - ($1.12) Total special items per share $0.20 ($0.24) Net income (loss) per share before special items* $0.56 ($0.04) Note: Year-end 2012 weighted average diluted shares outstanding were 35.5 million FY 2012 results include after-tax expenses of ($4.1) million, or ($0.12) per share, associated with acquisition of CREDO Petroleum FY 2012 results include after-tax loss of ($2.9) million, or ($0.08) per share, from loss on extinguishment of debt related to amendment and extension of our term loan FY 2011 results include after-tax loss of ($2.1) million or ($0.06) per share, associated with a proposed private debt offering that we withdrew as a result of deterioration of terms available to us in the credit markets FY 2011 results include after-tax loss of ($29.4) million or ($0.82) per share principally related to non-cash asset impairments associated with entering into agreements to acquire certain assets from CL Realty and TEMCO ventures FY 2011 results include an after-tax gain of $40.2 million, or $1.12 per share, from sale of 57,000 acres of timberland *These are Non-GAAP financial measures. Reconciliation between GAAP & Non-GAAP financial measures provided in tables following this presentation, and on companys investor relations website 42 |
|
Accelerating Value Realization Drives Improved Segment Operating Results ($ in Millions) Full Year 2012 Full Year 2011 Segment Earnings (Loss): Real Estate $53.6 ($25.7) Mineral Resources 21.6 16.0 Fiber Resources 5.0 1.9 Total Segment Earnings (Loss) $80.2 ($7.8) FY 2012 real estate segment results include: $11.7 million gain associated with the sale of our 25% interest in Palisades West $10.2 million in earnings associated with sale of Broadstone Memorial in Houston $8.2 million in earnings associated with ventures sale of Las Brisas multifamily community in Austin $3.4 million gain on sale of 800 acres from Light Farms venture FY 2011 real estate segment results include ($45.2) million in non-cash asset impairment charges principally related to acquisition of certain assets from CL Realty and TEMCO ventures 43 |
|
Accelerating Value Realization and Strategic and Disciplined Investments Drives Improved Operating Results ($ in Millions) 4th Quarter 2012 4th Quarter 2011 Net Income (Loss), in accordance with GAAP $10.0 ($22.9) Earnings (Loss) Per Share $0.28 ($0.65) Special items per share: Credo acquisition expenses $0.01 - Non-cash asset impairments - $0.82 Total Special Items per share $0.01 $0.82 Net income per share before special items* $0.29 $0.17 Fourth quarter 2012 results include after-tax expenses of approximately ($0.4 million), or ($0.01) per share, associated with the acquisition of CREDO Petroleum Corporation Q4 2011 real estate segment results include ($44.5) million in non-cash asset impairment charges principally related to acquisition of entire interest in 17 real estate projects from CL Realty and TEMCO ventures 44 *These are Non-GAAP financial measures. Reconciliation between GAAP & Non-GAAP financial measures provided in tables following this presentation, and on companys investor relations website |
|
Accelerating Value Realization and Strategic and Disciplined Investments Drives Improved Operating Results ($ in Millions) 4th Quarter 2012 4th Quarter 2011 Segment Earnings (Loss): Real Estate $21.6 ($25.0) Mineral Resources 5.7 3.7 Fiber Resources 2.3 0.1 Total Segment Earnings (Loss) $29.6 ($21.2) Q4 2012 real estate segment results include $8.2 million in earnings associated with ventures sale of Las Brisas multifamily community Q4 2012 real estate segment results include sale of over 7,300 acres of timberland for approx. $14.0 million Q4 2012 mineral resources segment results include $2.0 million in earnings associated with acquisition of Credo Q4 2011 real estate segment results include ($44.5) million in non-cash asset impairment charges principally related to acquisition of certain assets from CL Realty and TEMCO ventures Q4 2011 real estate segment results include sale of 13,200 acres of timberland for about $30.4 million 45 |
|
Q4 2012 Q4 2011 FY 2012 FY 2011 Leasing Activity Net Fee Acres Leased 5,000 320 8,900 8,100 Avg. Bonus / Acre $300 $60 $600 $280 Total Oil and Gas Interests* Oil Produced (Barrels) 171,500 49,700 371,300 151,900 Average Price / Barrel $80.36 $102.19 $85.09 $96.84 Natural Gas Produced (MMCF) 689.9 373.6 1,989.0 1,622.0 Average Price / MCF $2.89 $3.93 $2.71 $3.95 Total BOE 286,500 112,000 702,800 422,200 Average Price / BOE $55.07 $58.50 $52.61 $50.02 Segment Revenues ($ in Millions) $17.2 $6.8 $44.2 $24.6 Segment Earnings ($ in Millions)** $5.7 $3.7 $21.6 $16.0 Producing Wells* (end of period) 936 530 936 530 * Includes our share of venture production: 74 MMCf & 321 MMcf in Q4 2012 and FY2012; 95 MMCf and 493 MMcf in Q4 2011 and FY 2011 ** Note: Segment results include costs associated with the development of our water initiatives: $1.7 million in Q4 2012; $1.0 million in Q4 2011; $5.0 million in FY2012 and $3.8 million in FY2011 46 46 Mineral Resources Segment KPIs |
|
Q4 2012 Q4 2011 FY 2012 FY 2011 Residential Lot Sales Lots Sold 384 309 1,365 1,117 Average Price / Lot $58,100 $43,300 $52,000 $47,400 Gross Profit / Lot $23,500 $15,200 $19,500 $17,500 Commercial Tract Sales Acres Sold 40 2 95 26 Average Price / Acre $208,300 $547,200 $130,800 $193,700 Land Sales Acres Sold 7,370 13,200 9,330 17,150 Average Price / Acre $1,900 $2,300 $2,100 $2,400 Segment Revenues ($ in Millions) $48.4 $46.4 $120.1 $106.2 Segment Earnings (Loss) ($ in Millions) $21.6 ($25.0) $53.6 ($25.7) * Full year 2012 results include $10.2 million gain on sale of Broadstone Memorial multifamily community, $8.2 million in earnings from ventures sale of Las Brisas multifamily community and $11.7 million gain from the sale of 25% interest in Palisades West ** Q4 2011 results include non cash asset impairment charges of ($44.5) million and also include the sale of 13,200 acres of land for approximately $30.4 million. Full year 2011 results include non-cash impairment charges of ($45.2) million ($3.4) million in charges principally related to environmental remediation at our San Joaquin River project near Antioch, CA. Note: Includes ventures 47 ** ** Real Estate Segment KPIs |
|
48 Q4 2012 Q4 2011 FY 2012 FY 2011 Fiber Sales Pulpwood Tons Sold 105,000 44,100 370,200 266,200 Average Pulpwood Price / Ton $10.65 $9.31 $9.83 $8.69 Sawtimber Tons Sold 57,000 5,600 123,700 56,800 Average Sawtimber Price / Ton $23.98 $22.17 $21.77 $16.13 Total Tons Sold 162,000 49,700 493,900 323,000 Average Price / Ton $15.34 $10.76 $12.82 $10.00 Recreational Leases Average Acres Leased 128,200 139,300 129,800 174,500 Average Lease Rate / Acre $8.36 $8.83 $8.73 $8.80 Segment Revenues ($ in Millions) $3.0 $0.9 $8.3 $4.8 Segment Earnings ($ in Millions) $2.3 $0.1 $5.0 $1.9 48 Fiber Resources Segment KPIs |
|
49 RECONCILIATION OF NON-GAAP FINANCIAL MEASURES (UNAUDITED) Forestars Net Income and Earnings Per Share (EPS) excluding special items for the years ended December 31, 2012 and 2011 are non-GAAP financial measures within the meaning of Regulation G of the Securities and Exchange Commission. Non-GAAP financial measures are not in accordance with, or an alternative to, U.S. Generally Accepted Accounting Principles (GAAP). The company believes presenting non-GAAP Net Income and EPS is helpful to analyze financial performance without the impact of items that may obscure trends in the companys underlying performance. A detailed reconciliation is provided below outlining the differences between these non-GAAP measures and the directly related GAAP measures. Fourth Quarter Full Year ($ in millions, except per share amounts) 2012 2011 2012 2011 Net income (loss), after-tax, in accordance with GAAP $10.0 ($22.9) $12.9 $7.2 Special items, after-tax Credo acquisition expenses 0.4 - 4.1 - Loss on extinguishment of debt - - 2.9 - Debt offering expenses - 2.1 Non-cash asset impairments - 28.9 - 29.4 Gain on sale of timberland - -40.2) Total special items, after-tax 0.4 28.9 $7.0 (8.7) Net income, after-tax, excluding special items $10.4 $6.0 $19.9 ($1.5) Net income (loss) per share, in accordance with GAAP $0.28 ($0.65) $0.36 $0.20 Special items, after-tax, per diluted share Credo acquisition expenses 0.01 0.12 Loss on extinguishment of debt 0.08 Debt offering expenses 0.06 Non-cash asset impairments 0.82 0.82 Gain on sale of timberland (1.12) Total special items, after-tax 0.01 $0.82 $0.20 ($0.24) Net income per share, excluding special items $0.29 $0.17 $0.56 ($0.04) Average basic shares outstanding 35.2 35.2 35.2 35.4 Average diluted shares outstanding 35.6 35.2 35.5 35.8 |
|
50 RECONCILIATION OF NON-GAAP FINANCIAL MEASURES (UNAUDITED) Forestars Total Segment EBITDA for the years ended December 31, 2012, 2011, 2010, 2009 and 2008 are non-GAAP financial measures within the meaning of Regulation G of the Securities and Exchange Commission. Non-GAAP financial measures are not in accordance with, or an alternative to, U.S. Generally Accepted Accounting Principles (GAAP). The company believes presenting non-GAAP Total Segment EBITDA is helpful to analyze financial performance without the impact of items that may obscure trends in the companys underlying performance. A detailed reconciliation is provided below outlining the differences between these non-GAAP measures and the directly related GAAP measures. Full Year ($ in millions, except per share amounts) 2012 2011 2010 2009 2008 Total Segment Earnings (loss), in accordance with GAAP $80.2 ($7.8) $23.2 $45.2 $62.0 Non-cash items, pre-tax Depreciation, Depletion & Amortization 10.6 7.1 5.0 5.5 5.1 Total Segment EBITDA $90.8 ($0.7) $28.2 $50.7 $67.1 |
|
For questions, please contact: Building Momentum By Accelerating Value Realization, Optimizing Transparency and Growing Net Asset Value Anna Torma SVP Corporate Affairs Forestar Group Inc. 6300 Bee Cave Road Building Two, Suite 500 Austin, TX 78746 512-433-5312 annatorma@forestargroup.com 51 |
NU22>;27=R[?00-Q8A;'6V``@J`8@
ML+<-*`)LJ`;^K`8+=EH.'H-XV(=^`,I=Z`5\P(=>>"_YX,EX^,\?!F(DC@>W
M@8LQJ&&1M(9JP`<8^P$D'N(=)L\:]D]^L(9Z`8$AT( >6J$8>LM8=
M>N-U#$AX,UH@*X55(&`0]Q>G4O6TKWIWB8D]">*#XXIMD5LO%C$$17"YDH9]
MCA Q4?=[&D:Q$DI!5.Y+20-NM`>N)C\AIN48A7"S09&?-PF%AT/S$PGFLD
M?84R2N8SS31`Q(07ZS0]M-E0%9MON:36IQN>1"?OB[+B>38@*2;ZH5V;18
M:K60Y-:$5T9!->>D\Y0N-+,]0!L5AU6>YX_UCF2O28'Q-['I2K@-`87R_WC6F.D.F++T(N\3D
M*RUE1R92@HV3HJLSNER\*B(NOJ'*=9HSV@K&0J$5J:S9F9V+L7DIT+2C'6VJ
MUF@JGG70^<"5&Y$WHHVJB`2,Y%&75W$.ZG2KZN0-6I54UYF.$#.Q$@Z>;*,/
M;.!4;/`"??A/+]@`$'!##QZ#]6S/:JC0+S3@Z$@-K57A#=BC#>@%(R@!#[A5
M84A#/I1;?M"DZD36"R#G?O"""^##6_7@_R%HW^M4:/)
#^*;K?K@#*(]W?
TBQ>U!3!%AQ0A/SA5JS
M6=@$0/^A;A*S%CH29LLG6],*NW^A'M0:A'/Y_#J+`TH)7C"P*A2Q3"Q!(!^AQ2GI`Q"
MD15[4TK:0`MD8`="XB0$0(-NX%\D!C($@"T>@H2`#2/60EK@*&,8[0``@`&$
MH@$F[=!D[5P61@>6``8P0"XRP%MJ0`=@X`8ZH@O@CRS,I8(P0"L(P]#44PDGADUZ\14Z@QXTN1W>C,5
M>__3G-7`67
L/\2LY>-N0T?:IB'69BW)!0;RKF#AS"-
MK*&H.WD.BG<#\7B:+#9+%4T6BGBA3*2B+#6+%S/=!`S"&14#J`VCU9V)S%FK
MUYQ!=5FQ9!6S=Q7C^[[50)YG`(\H8UFB(OPV(K$DJ'V=(K.695D>8M<2((`'
MX/0LH`LBJ">BXB'$40EX8``BQF)TX`9$=(I.^*]TA8$^VE\CN`$$%`(48``&
M8,4GHS$L:R=>P!