UNITED STATES
SECURITIES AND EXCHANGE COMMISSION
Washington, D.C. 20549
FORM N-CSR
CERTIFIED SHAREHOLDER REPORT OF REGISTERED
MANAGEMENT INVESTMENT COMPANIES
Investment Company Act file number: 811-22099
Gateway Trust
(Exact name of Registrant as specified in charter)
888 Boylston Street, Suite 800 Boston, Massachusetts 02199-8197
(Address of principal executive offices) (Zip code)
Susan McWhan Tobin, Esq.
Natixis Distribution, LLC
888 Boylston Street, Suite 800
Boston, Massachusetts 02199-8197
(Name and address of agent for service)
Registrant’s telephone number, including area code: (617) 449-2139
Date of fiscal year end: December 31
Date of reporting period: December 31, 2023
Item 1. Reports to Stockholders.
| (a) | The Registrant’s annual report transmitted to shareholders pursuant to Rule 30e-1 under the Investment Company Act of 1940 is as follows: |


| Gateway Fund |
| Gateway Equity Call Premium Fund |
| Mirova Global Green Bond Fund |
| Mirova Global Sustainable Equity Fund |
| Mirova International Sustainable Equity Fund |
| 1 | |
| 29 | |
| 46 | |
| 72 |

| Managers |
| Daniel M.
Ashcraft, CFA® |
| Michael T. Buckius, CFA® |
| Kenneth H. Toft,
CFA® |
| Mitchell J.
Trotta, CFA® |
| Gateway Investment Advisers, LLC |
| Symbols | |
| Class A |
GATEX |
| Class C |
GTECX |
| Class N |
GTENX |
| Class Y |
GTEYX |
Investment Goal
| Security Name |
% of Net Assets |
| 1 Apple, Inc. |
7.26% |
| 2 Microsoft Corp. |
7.22 |
| 3 Amazon.com, Inc. |
3.63 |
| 4 NVIDIA Corp. |
3.20 |
| 5 Alphabet, Inc., Class C |
3.09 |
| 6 Berkshire Hathaway, Inc., Class B
|
2.15 |
| 7 Meta Platforms, Inc., Class A |
2.04 |
| 8 Tesla, Inc. |
1.71 |
| 9 JPMorgan Chase & Co. |
1.55 |
| 10 UnitedHealth Group, Inc. |
1.55 |
| The portfolio is actively managed and holdings are subject to change. There is no guarantee the Fund continues to invest in the securities referenced. The holdings
listed exclude any temporary cash investments, are presented on an individual security basis and do
not represent holdings of the issuer. |
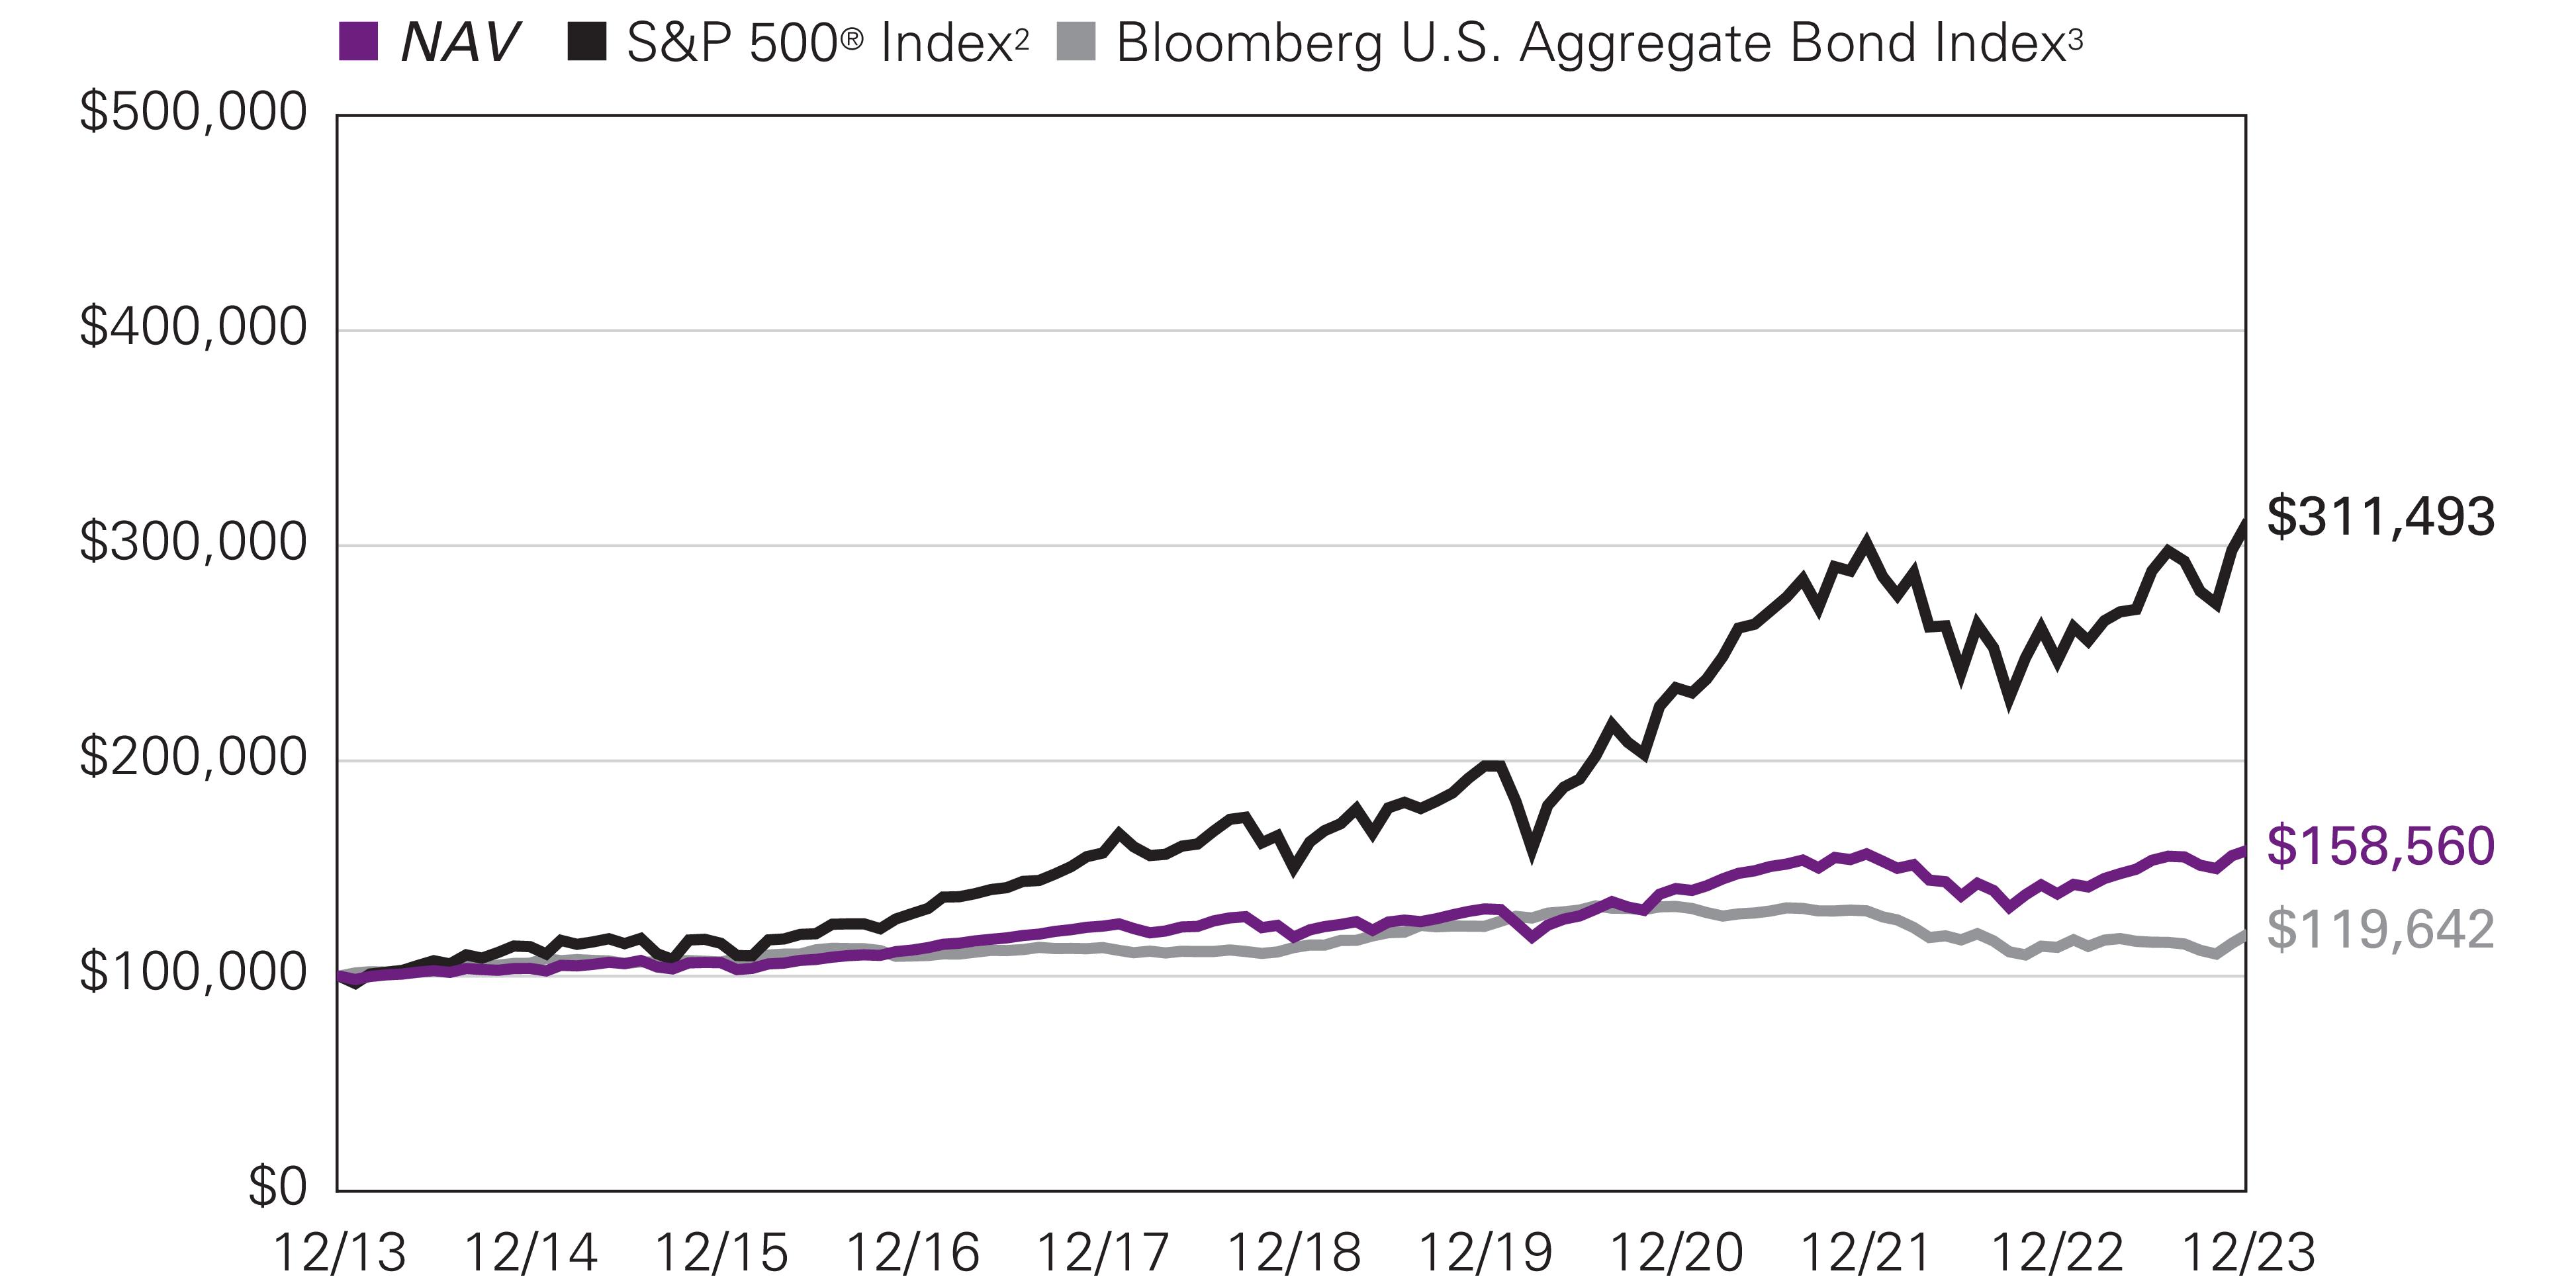
| Hypothetical Growth of $100,000 Investment in Class Y
Shares1 |
| December
31, 2013 through December 31, 2023 |
| |
1 Year |
5 Years |
10 Years |
Life of
Class N |
Expense Ratios4 | |
| |
Gross |
Net | ||||
| Class Y |
|
|
|
|
|
|
| NAV |
14.70 % |
6.07 % |
4.72 % |
— % |
0.71 % |
0.70 % |
| Class A |
|
|
|
|
|
|
| NAV |
14.43 |
5.82 |
4.47 |
— |
0.96 |
0.94 |
| With 5.75% Maximum Sales Charge |
7.85 |
4.57 |
3.85 |
— |
|
|
| Class C |
|
|
|
|
|
|
| NAV |
13.56 |
5.02 |
3.83 |
— |
1.71 |
1.70 |
| With CDSC5
|
12.56 |
5.02 |
3.83 |
— |
|
|
| Class N (Inception 5/1/17) |
|
|
|
|
|
|
| NAV |
14.75 |
6.13 |
— |
4.80 |
0.65 |
0.65 |
| Comparative Performance |
|
|
|
|
|
|
| S&P 500® Index2
|
26.29 |
15.69 |
12.03 |
12.88 |
|
|
| Bloomberg U.S. Aggregate Bond Index3
|
5.53 |
1.10 |
1.81 |
1.14 |
|
|
| 1 |
Fund performance has been increased by fee waivers and/or expense reimbursements, if any, without which performance would have been lower. |
| 2 |
S&P 500® Index is a widely recognized measure of U.S. stock market performance. It is an unmanaged index of 500 common stocks chosen for market size, liquidity,
and industry group representation, among other factors. It also measures the
performance of the large cap segment of the U.S. equities market. |
| 3 |
Bloomberg U.S. Aggregate Bond Index is a broad-based index that covers the U.S. dollar-denominated, investment-grade, fixed-rate, taxable bond market of
SEC- registered securities. The index includes bonds from the Treasury,
government-related, corporate, mortgage-backed securities, asset-backed securities, and collateralized mortgage-backed securities sectors. |
| 4 |
Expense ratios are as shown in the Fund’s prospectus in effect as of the date of this report. The expense ratios for the current reporting period can be found in
the Financial Highlights section of this report under Ratios to Average Net
Assets. Net expenses reflect contractual expense limitations set to expire on 4/30/24. When a Fund’s expenses are below the limitation, gross and net expense ratios will be the same. See Note 6 of the Notes to Financial Statements for more information about
the Fund’s expense limitations. |
| 5 |
Performance for Class C shares assumes a 1.00% contingent deferred sales charge (“CDSC”) applied when you sell shares within one year of purchase, and
includes automatic conversion to Class A shares after eight years.
|
| Managers |
| Daniel M.
Ashcraft, CFA® |
| Michael T. Buckius, CFA® |
| Kenneth H. Toft,
CFA® |
| Mitchell J.
Trotta, CFA® |
| Gateway Investment Advisers, LLC |
| Symbols | |
| Class A |
GCPAX |
| Class C |
GCPCX |
| Class N |
GCPNX |
| Class Y |
GCPYX |
Investment Goal
| Security Name |
% of Net Assets |
| 1 Apple, Inc. |
7.11% |
| 2 Microsoft Corp. |
7.06 |
| 3 Amazon.com, Inc. |
3.53 |
| 4 NVIDIA Corp. |
3.14 |
| 5 Alphabet, Inc., Class C |
2.61 |
| 6 Meta Platforms, Inc., Class A |
2.04 |
| 7 Berkshire Hathaway, Inc., Class B |
1.92 |
| 8 Tesla, Inc. |
1.77 |
| 9 Broadcom, Inc. |
1.34 |
| 10 UnitedHealth Group, Inc. |
1.33 |
| The portfolio is actively managed and holdings are subject to change. There is no guarantee the Fund continues to invest in the securities referenced. The holdings
listed exclude any temporary cash investments, are presented on an individual security basis and do
not represent holdings of the issuer. |
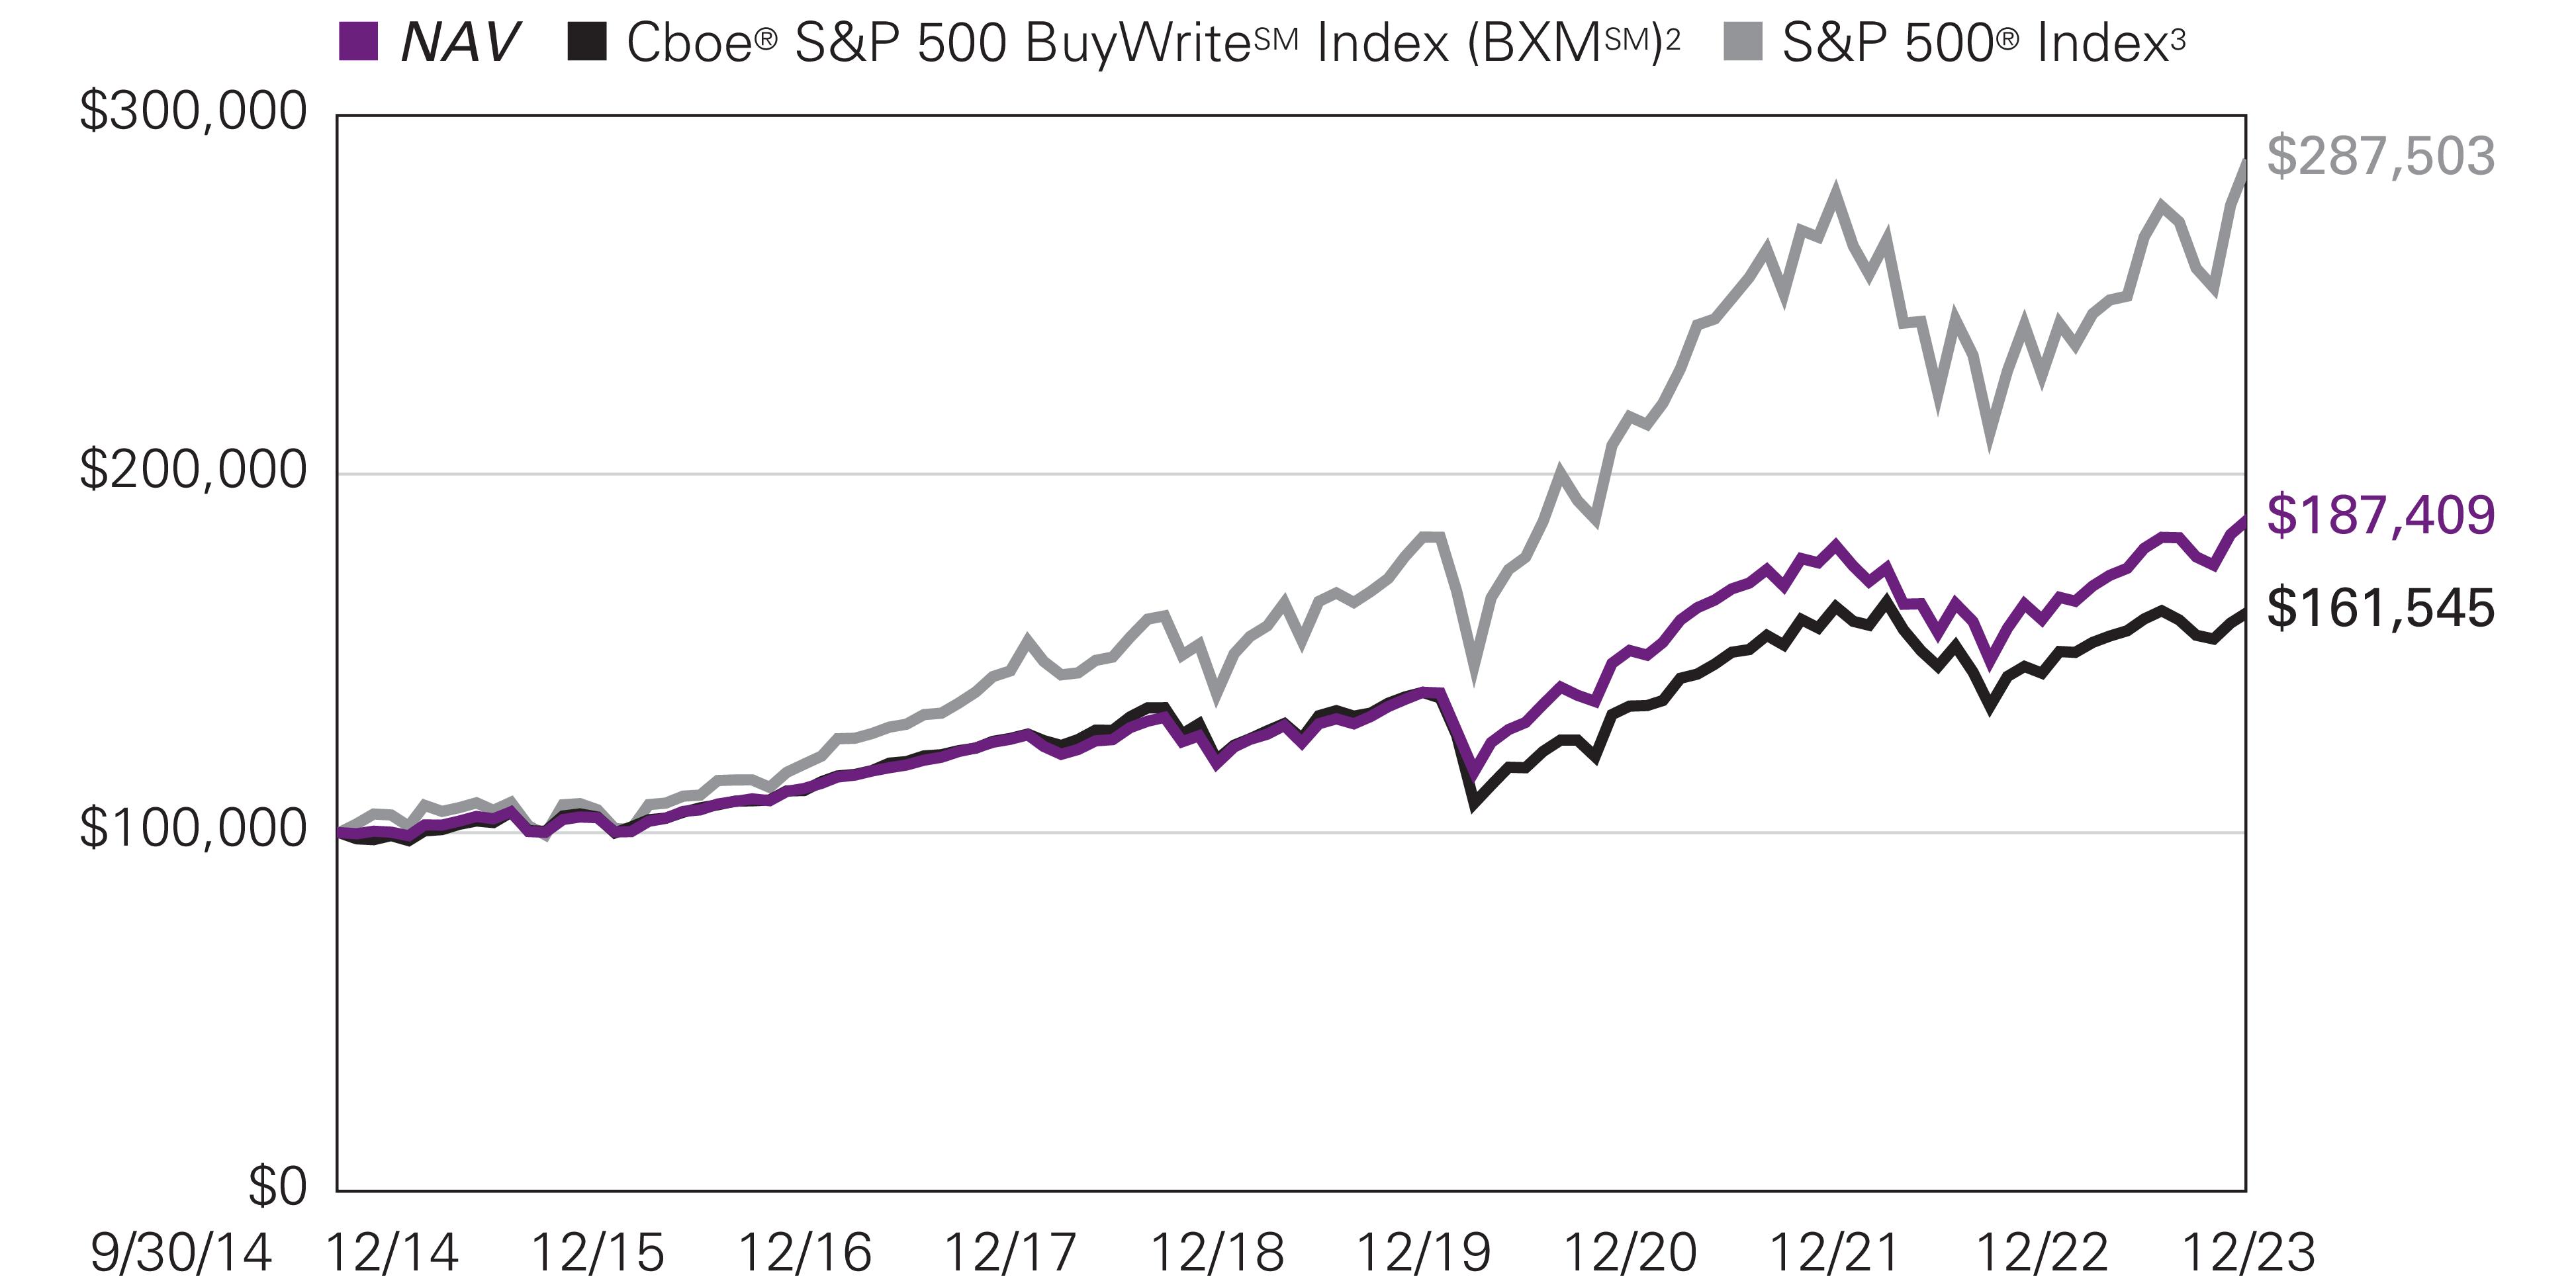
| Hypothetical Growth of $100,000 Investment in Class Y
Shares1 |
| September
30, 2014 (inception) through December 31, 2023 |
| |
1 Year |
5 Years |
Life of Class |
Expense Ratios4 | ||
| |
Class Y/A/C |
Class N |
Gross |
Net | ||
| Class Y (Inception 9/30/14) |
|
|
|
|
|
|
| NAV |
17.59 % |
9.47 % |
7.03 % |
— % |
0.91 % |
0.68 % |
| Class A (Inception 9/30/14) |
|
|
|
|
|
|
| NAV |
17.35 |
9.21 |
6.76 |
— |
1.16 |
0.93 |
| With 5.75% Maximum Sales Charge |
10.61 |
7.92 |
6.08 |
— |
|
|
| Class C (Inception 9/30/14) |
|
|
|
|
|
|
| NAV |
16.44 |
8.38 |
6.08 |
— |
1.91 |
1.68 |
| With CDSC5 |
15.44 |
8.38 |
6.08 |
— |
|
|
| Class N (Inception 5/1/17) |
|
|
|
|
|
|
| NAV |
17.74 |
9.51 |
— |
7.33 |
1.23 |
0.63 |
| Comparative Performance |
|
|
|
|
|
|
| Cboe® S&P 500 BuyWriteSM Index (BXMSM)2 |
11.82 |
6.08 |
5.32 |
4.91 |
|
|
| S&P 500® Index3 |
26.29 |
15.69 |
12.05 |
12.88 |
|
|
| 1 |
Fund performance has been increased by fee waivers and/or expense reimbursements, if any, without which performance would have been lower. |
| 2 |
Cboe® S&P 500 BuyWriteSM Index (BXMSM) is a benchmark index designed to track the performance of a hypothetical buy-write strategy on the S&P® 500 Index. The
BXM is a passive total return index based on (1) buying an S&P 500 stock index portfolio,
and (2) "writing" (or selling) the near-term S&P 500® Index (SPXSM) "covered" call option, generally on the third Friday of each month. The SPX call written will have about one month remaining to expiration, with an exercise price just above the
prevailing index level (i.e., slightly out of the money). The SPX call is held
until expiration and cash settled, at which time a new one-month, near-the-money call is written. |
| 3 |
S&P 500® Index is a widely recognized measure of U.S. stock market performance. It is an unmanaged index of 500 common stocks chosen for market size, liquidity,
and industry group representation, among other factors. It also measures the
performance of the large cap segment of the U.S. equities market. |
| 4 |
Expense ratios are as shown in the Fund’s prospectus in effect as of the date of this report. The expense ratios for the current reporting period can be found in
the Financial Highlights section of this report under Ratios to Average Net
Assets. Net expenses reflect contractual expense limitations set to expire on 4/30/24. When a Fund’s expenses are below the limitation, gross and net expense ratios will be the same. See Note 6 of the Notes to Financial Statements for more information about
the Fund’s expense limitations. |
| 5 |
Performance for Class C shares assumes a 1.00% contingent deferred sales charge (“CDSC”) applied when you sell shares within one year of purchase, and
includes automatic conversion to Class A shares after eight years.
|
| Managers |
| Marc
Briand |
| Charles
Portier |
| Bertrand
Rocher |
| Mirova US LLC |
| Symbols | |
| Class A |
MGGAX |
| Class N |
MGGNX |
| Class Y |
MGGYX |
Investment Goal
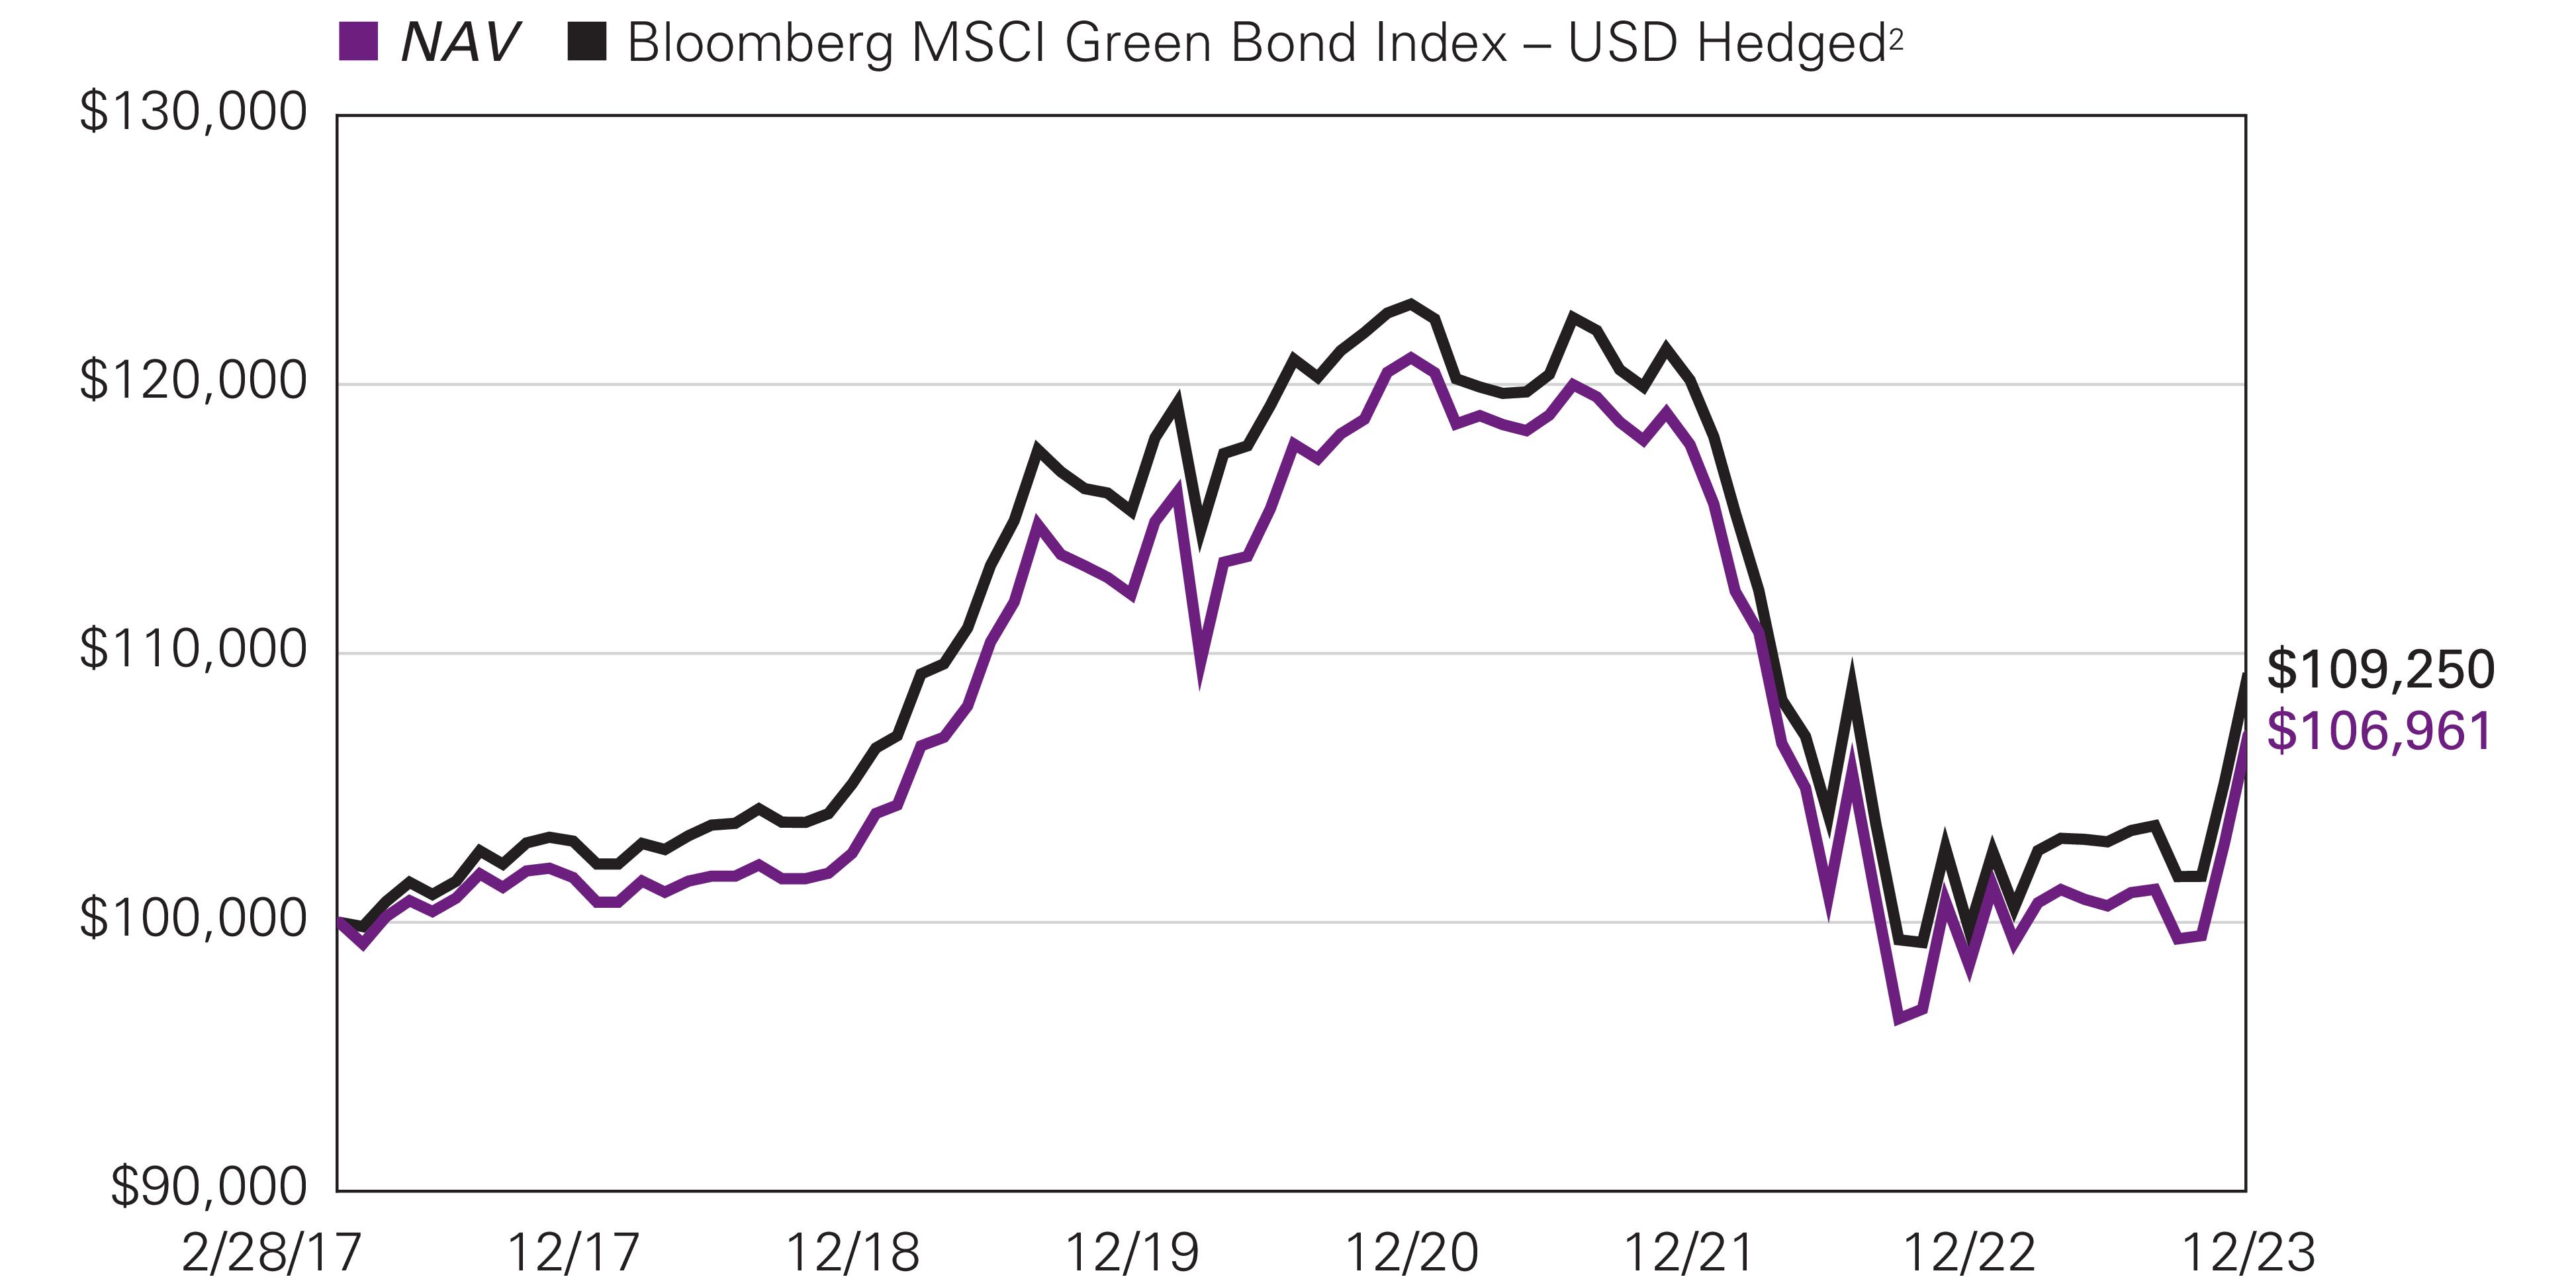
| Hypothetical Growth of $100,000 Investment in Class Y
Shares1 |
| February
28, 2017 (inception) through December 31, 2023 |
| |
1 Year |
5 Years |
Life of
Fund |
Expense Ratios3 | |
| |
Gross |
Net | |||
| Class Y (Inception 2/28/17) |
|
|
|
|
|
| NAV |
8.69 % |
0.84 % |
0.98 % |
1.09 % |
0.66 % |
| Class A (Inception 2/28/17) |
|
|
|
|
|
| NAV |
8.48 |
0.57 |
0.73 |
1.34 |
0.91 |
| With 4.25% Maximum Sales Charge |
3.92 |
-0.30 |
0.09 |
|
|
| Class N (Inception 2/28/17) |
|
|
|
|
|
| NAV |
8.73 |
0.87 |
1.03 |
0.99 |
0.61 |
| Comparative Performance |
|
|
|
|
|
| Bloomberg MSCI Global Green Bond Index - USD Hedged2 |
9.55 |
0.77 |
1.30 |
|
|
| 1 |
Fund performance has been increased by fee waivers and/or expense reimbursements, if any, without which performance would have been lower. |
| 2 |
Bloomberg MSCI Green Bond Index - USD Hedged provides a broad-based measure of global fixed-income securities issued to fund projects with direct
environmental benefits according to MSCI ESG Research’s green bond criteria. The green
bonds are primarily investment-grade, or may be classified by other sources when
bond ratings are not available. The Index may include green bonds from the corporate, securitized, Treasury, or government-related sectors. |
| 3 |
Expense ratios are as shown in the Fund’s prospectus in effect as of the date of this report. The expense ratios for the current reporting period can be found in
the Financial Highlights section of this report under Ratios to Average Net
Assets. Net expenses reflect contractual expense limitations set to expire on 4/30/24. When a Fund’s expenses are below the limitation, gross and net expense ratios will be the same. See Note 6 of the Notes to Financial Statements for more information about
the Fund’s expense limitations. |
| Managers |
| Hua Cheng,
CFA®, PhD |
| Jens Peers,
CFA® |
| Soliane
Varlet |
| Mirova US LLC |
| Symbols | |
| Class A |
ESGMX |
| Class C |
ESGCX |
| Class N |
ESGNX |
| Class Y |
ESGYX |
Investment Goal
| Security Name |
% of Net Assets |
| 1 Mastercard, Inc., Class A |
4.87% |
| 2 Microsoft Corp. |
4.66 |
| 3 Adobe, Inc. |
4.55 |
| 4 NVIDIA Corp. |
4.34 |
| 5 Novo Nordisk AS, Class B |
4.12 |
| 6 Thermo Fisher Scientific, Inc. |
4.00 |
| 7 eBay, Inc. |
3.66 |
| 8 Ecolab, Inc. |
3.65 |
| 9 Roper Technologies, Inc. |
3.60 |
| 10 Eli Lilly & Co. |
3.30 |
| The portfolio is actively managed and holdings are subject to change. There is no guarantee the Fund continues to invest in the securities referenced. The holdings
listed exclude any temporary cash investments, are presented on an individual security basis and do
not represent holdings of the issuer. |
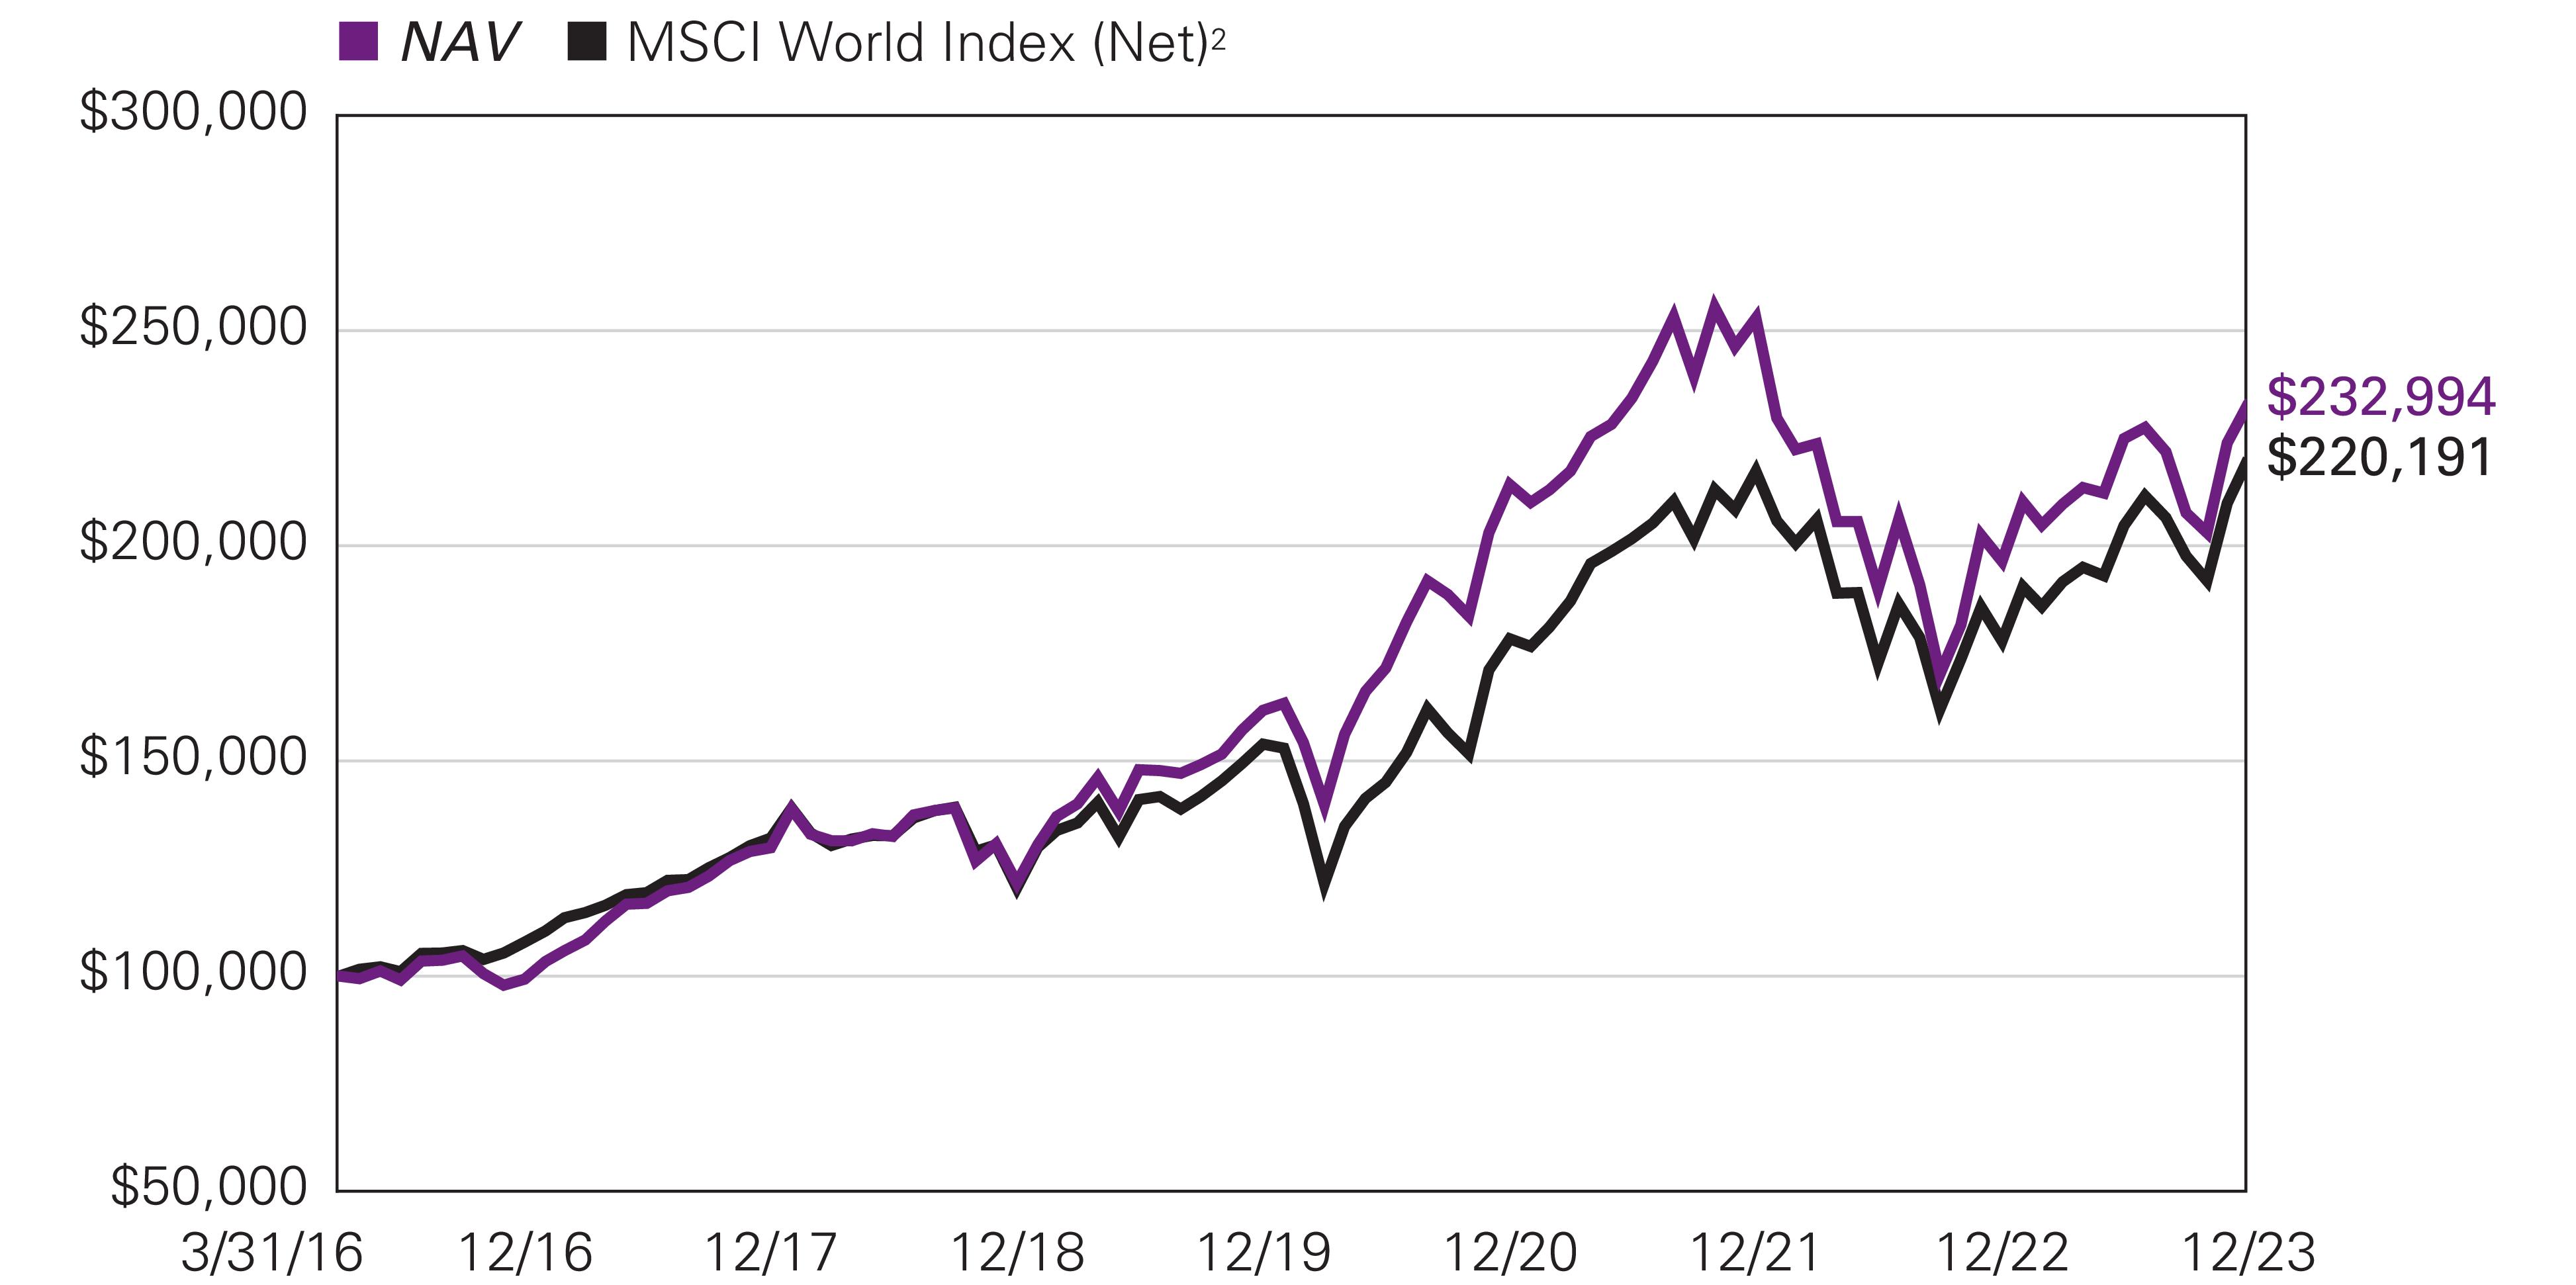
| Hypothetical Growth of $100,000 Investment in Class Y
Shares1 |
| March 31,
2016 (inception) through December 31, 2023 |
| |
1 Year |
5 Years |
Life of Class |
Expense Ratios3 | ||
| |
Class Y/A/C |
Class N |
Gross |
Net | ||
| Class Y (Inception 3/31/16) |
|
|
|
|
|
|
| NAV |
18.63 % |
13.88 % |
11.53 % |
— % |
1.01 % |
0.95 % |
| Class A (Inception 3/31/16) |
|
|
|
|
|
|
| NAV |
18.32 |
13.59 |
11.25 |
— |
1.26 |
1.20 |
| With 5.75% Maximum Sales Charge |
11.51 |
12.25 |
10.40 |
— |
|
|
| Class C (Inception 3/31/16) |
|
|
|
|
|
|
| NAV |
17.41 |
12.73 |
10.41 |
— |
2.01 |
1.95 |
| With CDSC4
|
16.41 |
12.73 |
10.41 |
— |
|
|
| Class N (Inception 5/1/17) |
|
|
|
|
|
|
| NAV |
18.70 |
13.94 |
— |
11.50 |
0.90 |
0.90 |
| Comparative Performance |
|
|
|
|
|
|
| MSCI World Index (Net)2
|
23.79 |
12.80 |
10.69 |
9.95 |
|
|
| 1 |
Fund performance has been increased by fee waivers and/or expense reimbursements, if any, without which performance would have been lower. |
| 2 |
MSCI World Index (Net) is an unmanaged index that is designed to measure the equity market performance of developed markets. It is comprised of common stocks
of companies representative of the market structure of developed market countries
in North America, Europe, and the Asia/Pacific Region. The index is calculated
without dividends, with net or with gross dividends reinvested, in both U.S. dollars and local
currencies. |
| 3 |
Expense ratios are as shown in the Fund’s prospectus in effect as of the date of this report. The expense ratios for the current reporting period can be found in
the Financial Highlights section of this report under Ratios to Average Net
Assets. Net expenses reflect contractual expense limitations set to expire on 4/30/24. When a Fund’s expenses are below the limitation, gross and net expense ratios will be the same. See Note 6 of the Notes to Financial Statements for more information about
the Fund’s expense limitations. |
| 4 |
Performance for Class C shares assumes a 1.00% contingent deferred sales charge (“CDSC”) applied when you sell shares within one year of
purchase. |
| Managers |
| Hua Cheng,
CFA®, PhD |
| Jens Peers,
CFA® |
| Soliane
Varlet |
| Mirova US LLC |
| Symbols | |
| Class A |
MRVAX |
| Class N |
MRVNX |
| Class Y |
MRVYX |
Investment Goal
| Security Name |
% of Net Assets |
| 1 ASML Holding NV |
5.09% |
| 2 Taiwan Semiconductor Manufacturing Co.
Ltd. |
4.81 |
| 3 Novo Nordisk AS, Class B |
4.58 |
| 4 KBC Group NV |
4.03 |
| 5 SAP SE |
3.97 |
| 6 Iberdrola SA |
3.92 |
| 7 Vestas Wind Systems AS |
3.88 |
| 8 L'Oreal SA |
3.86 |
| 9 Air Liquide SA |
3.70 |
| 10 Legal & General Group PLC |
3.56 |
| The portfolio is actively managed and holdings are subject to change. There is no guarantee the Fund continues to invest in the securities referenced. The holdings
listed exclude any temporary cash investments, are presented on an individual security basis and do
not represent holdings of the issuer. |
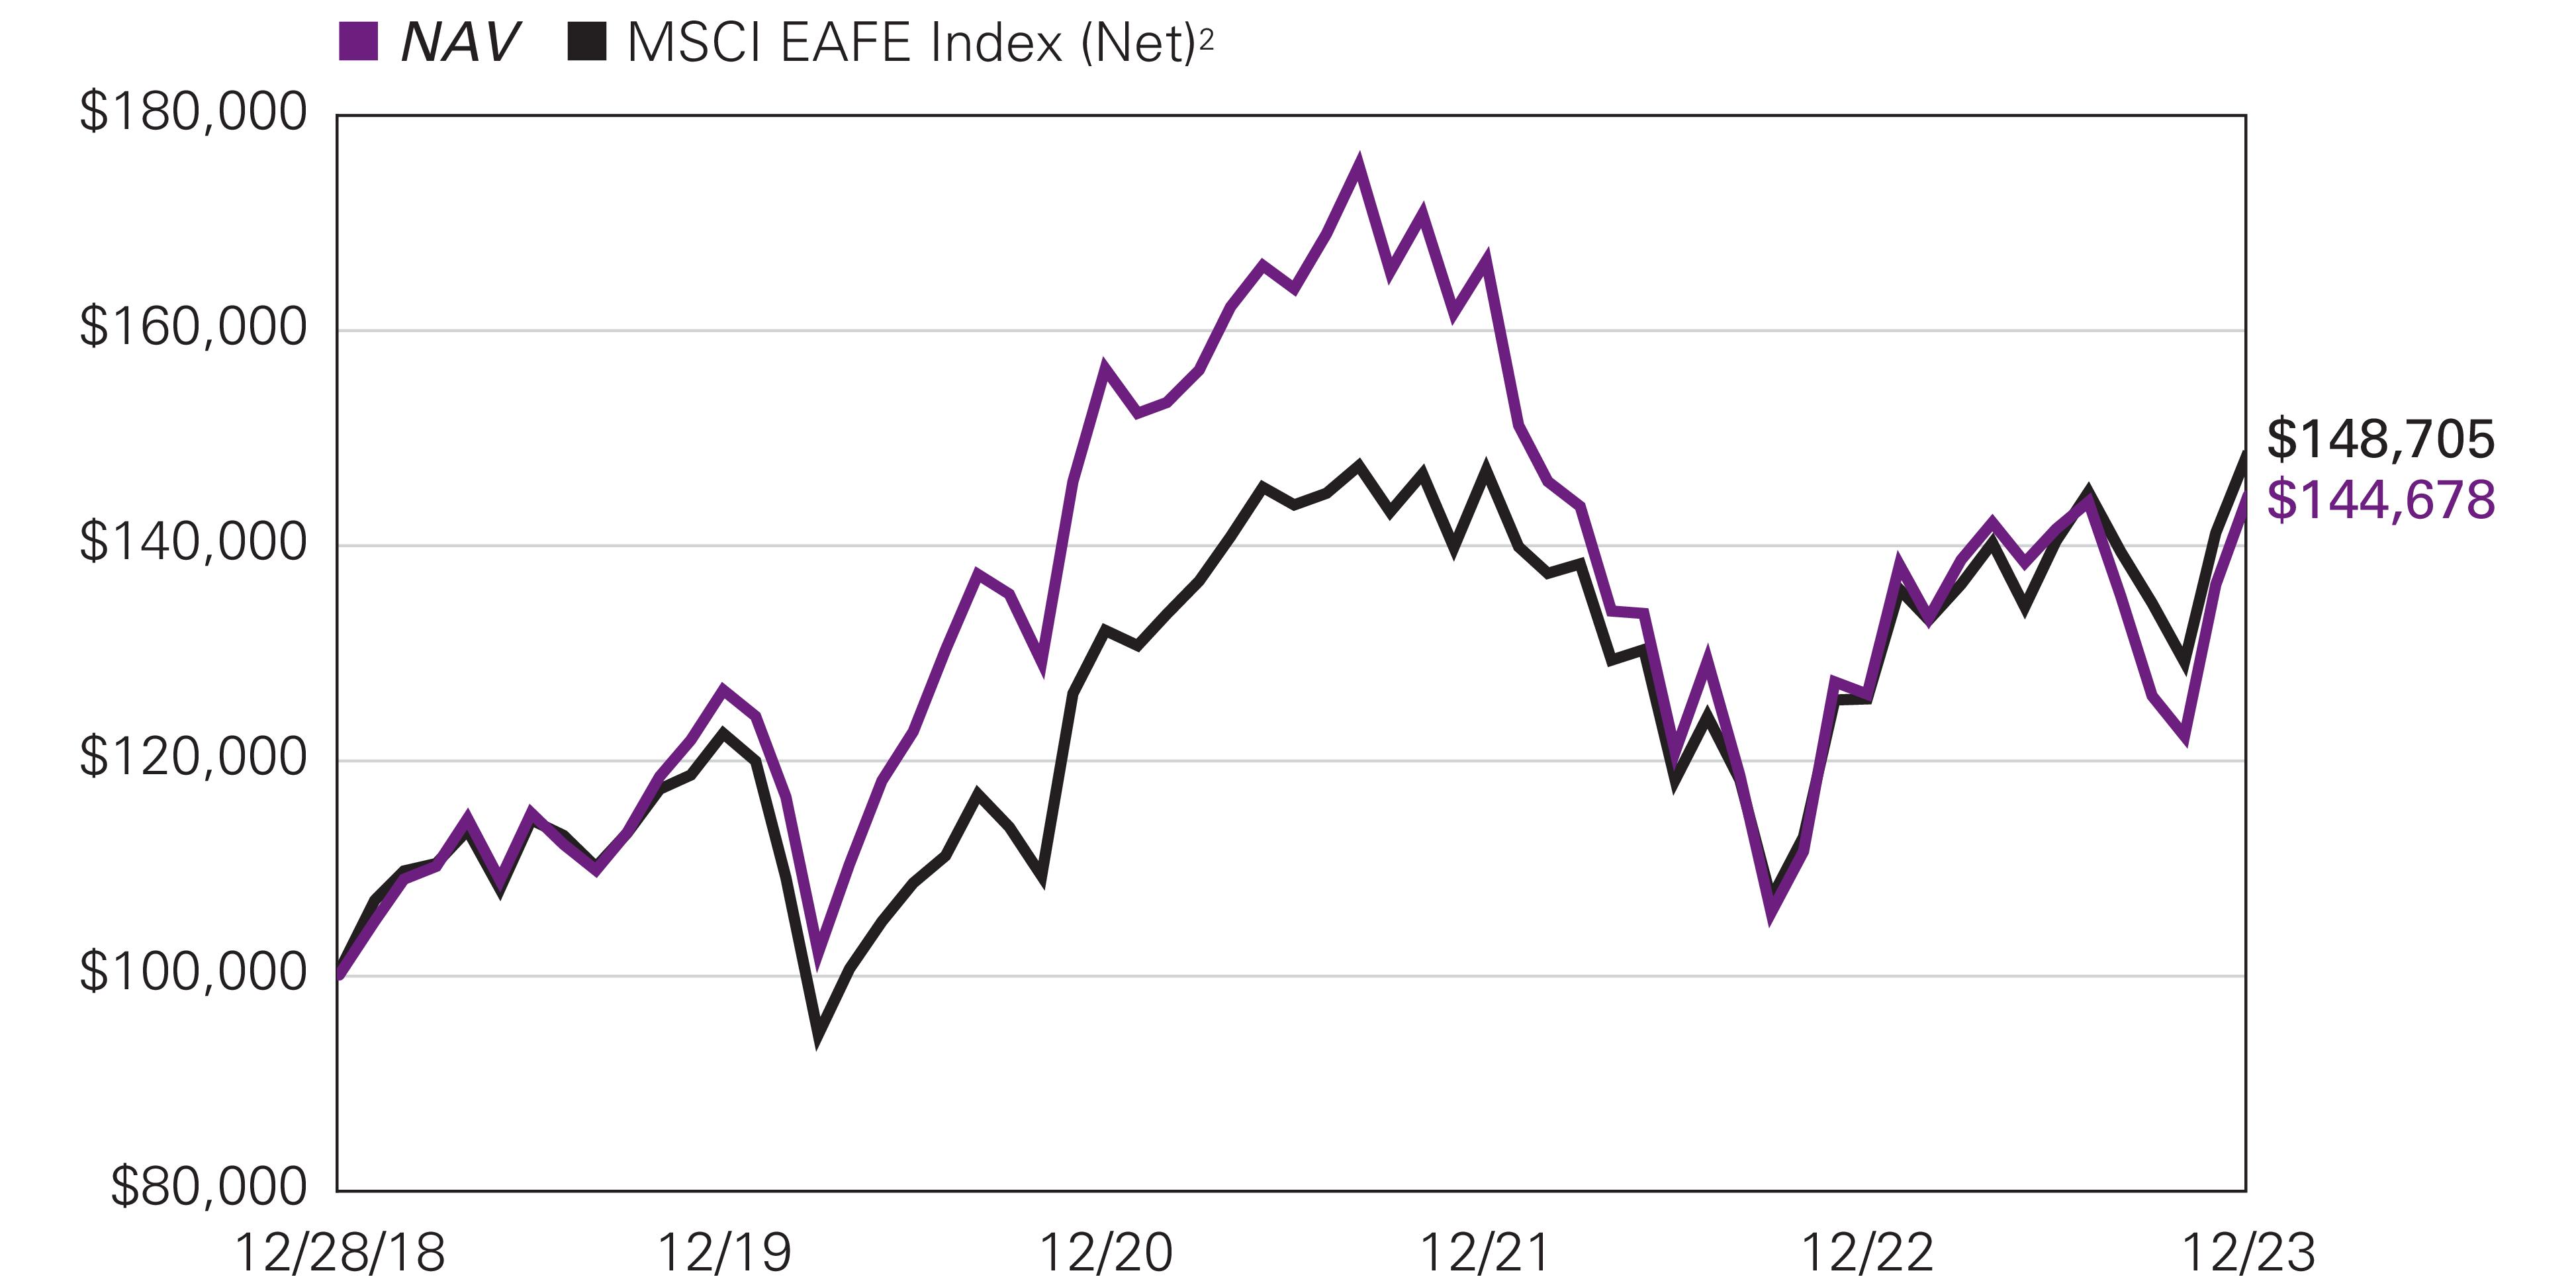
| Hypothetical Growth of $100,000 Investment in Class Y
Shares1 |
| December
28, 2018 (inception) through December 31, 2023 |
| |
1 Year |
5 Years |
Life of
Fund |
Expense Ratios3 | |
| |
Gross |
Net | |||
| Class Y (Inception 12/28/18) |
|
|
|
|
|
| NAV |
14.64 % |
7.64 % |
7.65 % |
2.05 % |
0.96 % |
| Class A (Inception 12/28/18) |
|
|
|
|
|
| NAV |
14.37 |
7.38 |
7.39 |
2.30 |
1.21 |
| With 5.75% Maximum Sales Charge |
7.78 |
6.12 |
6.13 |
|
|
| Class N (Inception 12/28/18) |
|
|
|
|
|
| NAV |
14.66 |
7.69 |
7.70 |
1.80 |
0.91 |
| Comparative Performance |
|
|
|
|
|
| MSCI EAFE Index (Net)2
|
18.24 |
8.16 |
8.23 |
|
|
| 1 |
Fund performance has been increased by fee waivers and/or expense reimbursements, if any, without which performance would have been lower. |
| 2 |
MSCI EAFE Index (Net) is a free float-adjusted market capitalization index designed to measure large and mid-cap equity performance in developed markets,
excluding the U.S. and Canada. The Index includes countries in Europe, Australasia, and the Far
East. |
| 3 |
Expense ratios are as shown in the Fund’s prospectus in effect as of the date of this report. The expense ratios for the current reporting period can be found in
the Financial Highlights section of this report under Ratios to Average Net
Assets. Net expenses reflect contractual expense limitations set to expire on 4/30/24. When a Fund’s expenses are below the limitation, gross and net expense ratios will be the same. See Note 6 of the Notes to Financial Statements for more information about
the Fund’s expense limitations. |
| Gateway Fund |
Beginning
Account Value
7/1/2023 |
Ending
Account Value
12/31/2023 |
Expenses Paid
During Period* 7/1/2023 – 12/31/2023 |
| Class A |
|
|
|
| Actual |
$1,000.00 |
$1,029.40 |
$4.81 |
| Hypothetical (5% return before expenses) |
$1,000.00 |
$1,020.47 |
$4.79 |
| Class C |
|
|
|
| Actual |
$1,000.00 |
$1,025.60 |
$8.68 |
| Hypothetical (5% return before expenses) |
$1,000.00 |
$1,016.64 |
$8.64 |
| Class N |
|
|
|
| Actual |
$1,000.00 |
$1,031.00 |
$3.33 |
| Hypothetical (5% return before expenses) |
$1,000.00 |
$1,021.93 |
$3.31 |
| Class Y |
|
|
|
| Actual |
$1,000.00 |
$1,030.70 |
$3.58 |
| Hypothetical (5% return before expenses) |
$1,000.00 |
$1,021.68 |
$3.57
|
| * |
Expenses are equal to the Fund's annualized expense ratio (after waiver/reimbursement): 0.94%, 1.70%, 0.65% and 0.70% for Class A, C,
N and Y, respectively, multiplied by the average account value over the period,
multiplied by the number of days in the most recent fiscal half–year (184), divided by 365 (to reflect the half–year period). |
| Gateway Equity Call Premium Fund |
Beginning
Account Value
7/1/2023 |
Ending
Account Value
12/31/2023 |
Expenses Paid
During Period* 7/1/2023 – 12/31/2023 |
| Class A |
|
|
|
| Actual |
$1,000.00 |
$1,044.60 |
$4.79 |
| Hypothetical (5% return before expenses) |
$1,000.00 |
$1,020.52 |
$4.74 |
| Class C |
|
|
|
| Actual |
$1,000.00 |
$1,040.20 |
$8.64 |
| Hypothetical (5% return before expenses) |
$1,000.00 |
$1,016.74 |
$8.54 |
| Class N |
|
|
|
| Actual |
$1,000.00 |
$1,046.30 |
$3.25 |
| Hypothetical (5% return before expenses) |
$1,000.00 |
$1,022.03 |
$3.21 |
| Class Y |
|
|
|
| Actual |
$1,000.00 |
$1,045.40 |
$3.51 |
| Hypothetical (5% return before expenses) |
$1,000.00 |
$1,021.78 |
$3.47
|
| * |
Expenses are equal to the Fund's annualized expense ratio (after waiver/reimbursement): 0.93%, 1.68%, 0.63% and 0.68% for Class A, C,
N and Y, respectively, multiplied by the average account value over the period,
multiplied by the number of days in the most recent fiscal half–year (184), divided by 365 (to reflect the half–year period). |
| Mirova Global Green Bond Fund |
Beginning
Account Value
7/1/2023 |
Ending
Account Value
12/31/2023 |
Expenses Paid
During Period* 7/1/2023 – 12/31/2023 |
| Class A |
|
|
|
| Actual |
$1,000.00 |
$1,062.20 |
$4.47 |
| Hypothetical (5% return before expenses) |
$1,000.00 |
$1,020.87 |
$4.38 |
| Class N |
|
|
|
| Actual |
$1,000.00 |
$1,063.50 |
$2.91 |
| Hypothetical (5% return before expenses) |
$1,000.00 |
$1,022.38 |
$2.85 |
| Class Y |
|
|
|
| Actual |
$1,000.00 |
$1,063.10 |
$3.17 |
| Hypothetical (5% return before expenses) |
$1,000.00 |
$1,022.13 |
$3.11
|
| * |
Expenses are equal to the Fund's annualized expense ratio (after waiver/reimbursement): 0.86%, 0.56% and 0.61% for Class A, N and Y,
respectively, multiplied by the average account value over the period,
multiplied by the number of days in the most recent fiscal half–year (184), divided by 365 (to reflect the half–year period). |
| Mirova Global Sustainable Equity Fund
|
Beginning
Account Value
7/1/2023 |
Ending
Account Value
12/31/2023 |
Expenses Paid
During Period* 7/1/2023 – 12/31/2023 |
| Class A |
|
|
|
| Actual |
$1,000.00 |
$1,034.30 |
$6.15 |
| Hypothetical (5% return before expenses) |
$1,000.00 |
$1,019.16 |
$6.11 |
| Class C |
|
|
|
| Actual |
$1,000.00 |
$1,030.30 |
$9.98 |
| Hypothetical (5% return before expenses) |
$1,000.00 |
$1,015.38 |
$9.91 |
| Class N |
|
|
|
| Actual |
$1,000.00 |
$1,036.50 |
$4.52 |
| Hypothetical (5% return before expenses) |
$1,000.00 |
$1,020.77 |
$4.48 |
| Class Y |
|
|
|
| Actual |
$1,000.00 |
$1,035.90 |
$4.88 |
| Hypothetical (5% return before expenses) |
$1,000.00 |
$1,020.42 |
$4.84
|
| * |
Expenses are equal to the Fund's annualized expense ratio (after waiver/reimbursement): 1.20%, 1.95%, 0.88% and 0.95% for Class A, C,
N and Y, respectively, multiplied by the average account value over the period,
multiplied by the number of days in the most recent fiscal half–year (184), divided by 365 (to reflect the half–year period). |
| Mirova International Sustainable Equity
Fund |
Beginning
Account Value
7/1/2023 |
Ending
Account Value
12/31/2023 |
Expenses Paid
During Period* 7/1/2023 – 12/31/2023 |
| Class A |
|
|
|
| Actual |
$1,000.00 |
$1,020.90 |
$6.06 |
| Hypothetical (5% return before expenses) |
$1,000.00 |
$1,019.21 |
$6.06 |
| Class N |
|
|
|
| Actual |
$1,000.00 |
$1,022.30 |
$4.59 |
| Hypothetical (5% return before expenses) |
$1,000.00 |
$1,020.67 |
$4.58 |
| Class Y |
|
|
|
| Actual |
$1,000.00 |
$1,022.00 |
$4.84 |
| Hypothetical (5% return before expenses) |
$1,000.00 |
$1,020.42 |
$4.84
|
| * |
Expenses are equal to the Fund's annualized expense ratio (after waiver/reimbursement): 1.19%, 0.90% and 0.95% for Class A, N and Y,
respectively, multiplied by the average account value over the period,
multiplied by the number of days in the most recent fiscal half–year (184), divided by 365 (to reflect the half–year period). |
| Shares |
Description |
Value (†) |
| Common Stocks — 99.8% of Net Assets | ||
| |
Aerospace & Defense — 1.3% | |
| 139,958 |
Boeing Co.(a)(b) |
$36,481,452
|
| 41,278 |
HEICO Corp.(a) |
7,383,396 |
| 506,844 |
RTX Corp.(a) |
42,645,854 |
| |
|
86,510,702 |
| |
Air Freight & Logistics — 0.5% | |
| 216,724 |
United Parcel Service, Inc., Class B(a) |
34,075,515 |
| |
Automobile Components — 0.1% | |
| 36,852 |
Autoliv, Inc.(a) |
4,060,722 |
| |
Automobiles — 2.0% | |
| 5,514 |
Ferrari NV |
1,866,103 |
| 1,177,145 |
Ford Motor Co.(a) |
14,349,398 |
| 444,275 |
Tesla, Inc.(a)(b) |
110,393,452 |
| |
|
126,608,953 |
| |
Banks — 3.5% | |
| 1,846,904 |
Bank of America Corp.(a) |
62,185,257 |
| 407,832 |
Citigroup, Inc.(a) |
20,978,878 |
| 589,207 |
JPMorgan Chase & Co.(a) |
100,224,111 |
| 879,617 |
Wells Fargo & Co.(a) |
43,294,749 |
| |
|
226,682,995 |
| |
Beverages — 1.2% | |
| 388,167 |
Monster Beverage Corp.(a)(b) |
22,362,301 |
| 324,992 |
PepsiCo, Inc.(a) |
55,196,641 |
| |
|
77,558,942 |
| |
Biotechnology — 2.0% | |
| 360,084 |
AbbVie, Inc.(a) |
55,802,217 |
| 8,614 |
Alnylam Pharmaceuticals, Inc.(b) |
1,648,806 |
| 115,006 |
Amgen, Inc.(a) |
33,124,028 |
| 45,330 |
Biogen, Inc.(a)(b) |
11,730,044 |
| 16,697 |
Exact Sciences Corp.(b) |
1,235,244 |
| 68,273 |
Vertex Pharmaceuticals, Inc.(a)(b) |
27,779,601 |
| |
|
131,319,940 |
| |
Broadline Retail — 3.7% | |
| 1,539,556 |
Amazon.com, Inc.(a)(b) |
233,920,139 |
| 77,449 |
JD.com, Inc., ADR(a) |
2,237,502 |
| 2,538 |
MercadoLibre, Inc.(a)(b) |
3,988,568 |
| |
|
240,146,209 |
| |
Building Products — 0.4% | |
| 355,197 |
Carrier Global Corp.(a) |
20,406,068 |
| 18,150 |
Lennox International, Inc.(a) |
8,122,488 |
| |
|
28,528,556 |
| |
Capital Markets — 2.5% | |
| 149,232 |
Brookfield Corp., Class A |
5,987,188 |
| 318,629 |
Charles Schwab Corp.(a) |
21,921,675 |
| 14,601 |
FactSet Research Systems, Inc.(a) |
6,965,407 |
| 216,194 |
Intercontinental Exchange, Inc.(a) |
27,765,795 |
| 91,363 |
KKR & Co., Inc.(a) |
7,569,425 |
| 432,102 |
Morgan Stanley(a) |
40,293,511 |
| 41,804 |
MSCI, Inc.(a) |
23,646,433 |
| 58,940 |
S&P Global, Inc.(a) |
25,964,249 |
| |
|
160,113,683 |
| |
Chemicals — 1.6% | |
| 57,441 |
Ashland, Inc.(a) |
4,842,851 |
| 71,767 |
Celanese Corp.(a) |
11,150,439 |
| 275,738 |
Corteva, Inc.(a) |
13,213,365 |
| 402,913 |
Dow, Inc.(a) |
22,095,749 |
| Shares |
Description |
Value (†) |
| |
Chemicals — continued | |
| 125,392 |
Eastman Chemical Co.(a) |
$11,262,709
|
| 167,820 |
LyondellBasell Industries NV, Class A(a) |
15,956,326 |
| 125,903 |
Mosaic Co.(a) |
4,498,514 |
| 47,015 |
Nutrien Ltd.(a) |
2,648,355 |
| 66,451 |
Olin Corp.(a) |
3,585,031 |
| 95,921 |
RPM International, Inc.(a) |
10,707,661 |
| |
|
99,961,000 |
| |
Commercial Services & Supplies — 1.0% | |
| 421,729 |
Copart, Inc.(a)(b) |
20,664,721 |
| 53,505 |
Waste Connections, Inc.(a) |
7,986,692 |
| 185,672 |
Waste Management, Inc.(a) |
33,253,855 |
| |
|
61,905,268 |
| |
Communications Equipment — 0.8% | |
| 1,080,379 |
Cisco Systems, Inc.(a) |
54,580,747 |
| |
Construction Materials — 0.3% | |
| 43,244 |
Martin Marietta Materials, Inc.(a) |
21,574,864 |
| |
Consumer Finance — 0.7% | |
| 232,900 |
Ally Financial, Inc.(a) |
8,132,868 |
| 180,444 |
Discover Financial Services(a) |
20,281,906 |
| 445,997 |
Synchrony Financial(a) |
17,032,625 |
| |
|
45,447,399 |
| |
Consumer Staples Distribution & Retail — 1.9% | |
| 23,645 |
Casey's General Stores, Inc.(a) |
6,496,227 |
| 77,697 |
Costco Wholesale Corp.(a) |
51,286,236 |
| 154,839 |
Target Corp.(a) |
22,052,171 |
| 68,318 |
U.S. Foods Holding Corp.(a)(b) |
3,102,320 |
| 243,492 |
Walmart, Inc.(a) |
38,386,514 |
| |
|
121,323,468 |
| |
Containers & Packaging — 0.4% | |
| 54,360 |
Avery Dennison Corp.(a) |
10,989,418 |
| 60,185 |
Crown Holdings, Inc.(a) |
5,542,437 |
| 141,364 |
WestRock Co.(a) |
5,869,433 |
| |
|
22,401,288 |
| |
Distributors — 0.2% | |
| 107,529 |
Genuine Parts Co.(a) |
14,892,766 |
| |
Diversified Consumer Services — 0.1% | |
| 67,454 |
Service Corp. International(a) |
4,617,226 |
| |
Diversified Telecommunication Services — 0.9% | |
| 1,750,022 |
AT&T, Inc.(a) |
29,365,369 |
| 750,252 |
Verizon Communications, Inc.(a) |
28,284,501 |
| |
|
57,649,870 |
| |
Electric Utilities — 1.3% | |
| 323,243 |
Alliant Energy Corp.(a) |
16,582,366 |
| 373,580 |
American Electric Power Co., Inc.(a) |
30,342,168 |
| 80,010 |
Evergy, Inc.(a) |
4,176,522 |
| 153,399 |
OGE Energy Corp.(a) |
5,358,227 |
| 440,442 |
Xcel Energy, Inc.(a) |
27,267,764 |
| |
|
83,727,047 |
| |
Electrical Equipment — 0.6% | |
| 129,959 |
Eaton Corp. PLC(a) |
31,296,726 |
| 31,715 |
Hubbell, Inc.(a) |
10,432,015 |
| |
|
41,728,741 |
| |
Electronic Equipment, Instruments & Components — 0.8% | |
| 97,069 |
CDW Corp.(a) |
22,065,725 |
| 375,436 |
Corning, Inc.(a) |
11,432,026 |
| Shares |
Description |
Value (†) |
| |
Electronic Equipment, Instruments & Components — continued | |
| 26,442 |
Teledyne Technologies, Inc.(a)(b) |
$11,800,800
|
| 33,350 |
Zebra Technologies Corp., Class A(a)(b) |
9,115,556 |
| |
|
54,414,107 |
| |
Energy Equipment & Services — 0.3% | |
| 595,515 |
Halliburton Co.(a) |
21,527,867 |
| |
Entertainment — 1.4% | |
| 81,510 |
Live Nation Entertainment, Inc.(a)(b) |
7,629,336 |
| 87,658 |
Netflix, Inc.(a)(b) |
42,678,927 |
| 410,463 |
Walt Disney Co.(a) |
37,060,704 |
| |
|
87,368,967 |
| |
Financial Services — 4.6% | |
| 388,218 |
Berkshire Hathaway, Inc., Class B(a)(b) |
138,461,832 |
| 97,940 |
Mastercard, Inc., Class A(a) |
41,772,389 |
| 300,792 |
PayPal Holdings, Inc.(a)(b) |
18,471,637 |
| 357,561 |
Visa, Inc., Class A(a) |
93,091,006 |
| 97,722 |
Voya Financial, Inc.(a) |
7,129,797 |
| |
|
298,926,661 |
| |
Food Products — 0.9% | |
| 61,781 |
Bunge Global SA(a) |
6,236,792 |
| 74,762 |
Lamb Weston Holdings, Inc.(a) |
8,081,025 |
| 575,935 |
Mondelez International, Inc., Class A(a) |
41,714,972 |
| |
|
56,032,789 |
| |
Ground Transportation — 1.0% | |
| 16,243 |
Canadian National Railway Co. |
2,040,608 |
| 88,900 |
Canadian Pacific Kansas City Ltd.(a) |
7,028,434 |
| 836,813 |
CSX Corp.(a) |
29,012,307 |
| 43,513 |
J.B. Hunt Transport Services, Inc.(a) |
8,691,287 |
| 38,632 |
Old Dominion Freight Line, Inc.(a) |
15,658,708 |
| 47,378 |
Uber Technologies, Inc.(a)(b) |
2,917,063 |
| |
|
65,348,407 |
| |
Health Care Equipment & Supplies — 2.3% | |
| 426,297 |
Abbott Laboratories(a) |
46,922,511 |
| 119,549 |
Baxter International, Inc.(a) |
4,621,764 |
| 545,077 |
Boston Scientific Corp.(a)(b) |
31,510,901 |
| 241,223 |
Edwards Lifesciences Corp.(a)(b) |
18,393,254 |
| 108,519 |
Intuitive Surgical, Inc.(a)(b) |
36,609,970 |
| 45,637 |
STERIS PLC(a) |
10,033,295 |
| |
|
148,091,695 |
| |
Health Care Providers & Services — 3.1% | |
| 354,081 |
CVS Health Corp.(a) |
27,958,236 |
| 79,403 |
Elevance Health, Inc.(a) |
37,443,279 |
| 78,255 |
HCA Healthcare, Inc.(a) |
21,182,063 |
| 16,707 |
Molina Healthcare, Inc.(a)(b) |
6,036,406 |
| 190,158 |
UnitedHealth Group, Inc.(a) |
100,112,482 |
| 46,177 |
Universal Health Services, Inc., Class B(a) |
7,039,222 |
| |
|
199,771,688 |
| |
Health Care Technology — 0.1% | |
| 35,149 |
Veeva Systems, Inc., Class A(a)(b) |
6,766,885 |
| |
Hotels, Restaurants & Leisure — 2.2% | |
| 93,375 |
Airbnb, Inc., Class A(a)(b) |
12,712,073 |
| 9,373 |
Booking Holdings, Inc.(a)(b) |
33,248,093 |
| 168,770 |
Hilton Worldwide Holdings, Inc.(a) |
30,731,329 |
| 175,041 |
McDonald's Corp.(a) |
51,901,407 |
| 105,955 |
Restaurant Brands International, Inc.(a) |
8,278,264 |
| 12,225 |
Vail Resorts, Inc.(a) |
2,609,671 |
| |
|
139,480,837 |
| Shares |
Description |
Value (†) |
| |
Household Durables — 0.4% | |
| 2,093 |
NVR, Inc.(a)(b) |
$14,651,942
|
| 129,073 |
Toll Brothers, Inc.(a) |
13,267,414 |
| |
|
27,919,356 |
| |
Household Products — 1.2% | |
| 527,557 |
Procter & Gamble Co.(a) |
77,308,203 |
| |
Industrial Conglomerates — 0.9% | |
| 145,920 |
3M Co.(a) |
15,951,974 |
| 213,732 |
Honeywell International, Inc.(a) |
44,821,738 |
| |
|
60,773,712 |
| |
Industrial REITs — 0.6% | |
| 270,782 |
Prologis, Inc.(a) |
36,095,241 |
| |
Insurance — 1.9% | |
| 406,909 |
Aflac, Inc.(a) |
33,569,993 |
| 62,253 |
American Financial Group, Inc.(a) |
7,401,259 |
| 91,119 |
Aon PLC, Class A(a) |
26,517,451 |
| 147,374 |
Arthur J Gallagher & Co.(a) |
33,141,465 |
| 74,687 |
Fidelity National Financial, Inc.(a) |
3,810,531 |
| 3,155 |
Markel Group, Inc.(a)(b) |
4,479,785 |
| 245,220 |
Unum Group(a) |
11,088,848 |
| |
|
120,009,332 |
| |
Interactive Media & Services — 6.0% | |
| 394,000 |
Alphabet, Inc., Class A(a)(b) |
55,037,860 |
| 1,412,537 |
Alphabet, Inc., Class C(a)(b) |
199,068,840 |
| 16,089 |
Baidu, Inc., ADR(b) |
1,916,039 |
| 371,720 |
Meta Platforms, Inc., Class A(a)(b) |
131,574,011 |
| |
|
387,596,750 |
| |
IT Services — 0.6% | |
| 14,418 |
EPAM Systems, Inc.(a)(b) |
4,287,048 |
| 30,916 |
Gartner, Inc.(a)(b) |
13,946,517 |
| 49,918 |
Shopify, Inc., Class A(a)(b) |
3,888,612 |
| 72,450 |
VeriSign, Inc.(a)(b) |
14,921,802 |
| |
|
37,043,979 |
| |
Life Sciences Tools & Services — 1.2% | |
| 196,969 |
Agilent Technologies, Inc.(a) |
27,384,600 |
| 17,245 |
ICON PLC, ADR(a)(b) |
4,881,542 |
| 85,252 |
Thermo Fisher Scientific, Inc.(a) |
45,250,909 |
| |
|
77,517,051 |
| |
Machinery — 1.9% | |
| 127,277 |
Caterpillar, Inc.(a) |
37,631,990 |
| 89,903 |
Cummins, Inc.(a) |
21,538,062 |
| 66,901 |
Deere & Co.(a) |
26,751,703 |
| 62,061 |
Parker-Hannifin Corp.(a) |
28,591,503 |
| 121,067 |
Pentair PLC(a) |
8,802,781 |
| |
|
123,316,039 |
| |
Media — 0.6% | |
| 851,180 |
Comcast Corp., Class A(a) |
37,324,243 |
| |
Metals & Mining — 0.5% | |
| 167,145 |
Barrick Gold Corp.(a) |
3,023,653 |
| 126,218 |
Newmont Corp.(a) |
5,224,163 |
| 78,379 |
Rio Tinto PLC, ADR(a) |
5,836,100 |
| 96,794 |
Southern Copper Corp.(a) |
8,331,060 |
| 47,801 |
Steel Dynamics, Inc.(a) |
5,645,298 |
| 336,290 |
Vale SA, ADR(a) |
5,333,559 |
| |
|
33,393,833 |
| |
Multi-Utilities — 1.0% | |
| 260,977 |
Ameren Corp.(a) |
18,879,076 |
| Shares |
Description |
Value (†) |
| |
Multi-Utilities — continued | |
| 254,019 |
Consolidated Edison, Inc.(a) |
$23,108,108
|
| 227,581 |
WEC Energy Group, Inc.(a) |
19,155,493 |
| |
|
61,142,677 |
| |
Oil, Gas & Consumable Fuels — 3.6% | |
| 17,062 |
Canadian Natural Resources Ltd. |
1,117,902 |
| 67,672 |
Cenovus Energy, Inc. |
1,126,739 |
| 45,031 |
Cheniere Energy, Inc.(a) |
7,687,242 |
| 380,120 |
Chevron Corp.(a) |
56,698,699 |
| 365,530 |
ConocoPhillips(a) |
42,427,067 |
| 51,006 |
Enbridge, Inc. |
1,837,236 |
| 729,986 |
Exxon Mobil Corp.(a) |
72,984,000 |
| 61,365 |
HF Sinclair Corp.(a) |
3,410,053 |
| 221,709 |
Occidental Petroleum Corp.(a) |
13,238,244 |
| 226,052 |
ONEOK, Inc.(a) |
15,873,372 |
| 360 |
Suncor Energy, Inc. |
11,534 |
| 115,966 |
Targa Resources Corp.(a) |
10,073,967 |
| 112,542 |
TC Energy Corp.(a) |
4,399,267 |
| |
|
230,885,322 |
| |
Passenger Airlines — 0.2% | |
| 153,012 |
Alaska Air Group, Inc.(a)(b) |
5,978,179 |
| 144,851 |
United Airlines Holdings, Inc.(a)(b) |
5,976,552 |
| |
|
11,954,731 |
| |
Personal Care Products — 0.3% | |
| 137,718 |
Estee Lauder Cos., Inc., Class A(a) |
20,141,257 |
| |
Pharmaceuticals — 4.1% | |
| 16,789 |
AstraZeneca PLC, ADR |
1,130,739 |
| 457,834 |
Bristol-Myers Squibb Co.(a) |
23,491,463 |
| 142,588 |
Eli Lilly & Co.(a) |
83,117,397 |
| 470,248 |
Johnson & Johnson(a) |
73,706,671 |
| 461,815 |
Merck & Co., Inc.(a) |
50,347,071 |
| 1,025,654 |
Pfizer, Inc.(a) |
29,528,579 |
| |
|
261,321,920 |
| |
Professional Services — 0.8% | |
| 141,064 |
Automatic Data Processing, Inc.(a) |
32,863,680 |
| 4,628 |
Booz Allen Hamilton Holding Corp. |
591,968 |
| 160,547 |
Paychex, Inc.(a) |
19,122,753 |
| 21,371 |
SS&C Technologies Holdings, Inc. |
1,305,982 |
| |
|
53,884,383 |
| |
Real Estate Management & Development — 0.0% | |
| 15,415 |
Zillow Group, Inc., Class C(b) |
891,912 |
| |
Residential REITs — 0.8% | |
| 252,006 |
American Homes 4 Rent, Class A(a) |
9,062,136 |
| 85,332 |
Camden Property Trust(a) |
8,472,614 |
| 130,016 |
Equity LifeStyle Properties, Inc.(a) |
9,171,329 |
| 346,842 |
Invitation Homes, Inc.(a) |
11,830,781 |
| 37,353 |
Sun Communities, Inc.(a) |
4,992,228 |
| 203,298 |
UDR, Inc.(a) |
7,784,280 |
| |
|
51,313,368 |
| |
Semiconductors & Semiconductor Equipment — 7.9% | |
| 326,538 |
Advanced Micro Devices, Inc.(a)(b) |
48,134,967 |
| 134,166 |
Analog Devices, Inc.(a) |
26,640,001 |
| 11,878 |
ASML Holding NV(a) |
8,990,696 |
| 75,235 |
Broadcom, Inc.(a) |
83,981,069 |
| 16,102 |
First Solar, Inc.(a)(b) |
2,774,052 |
| 772,253 |
Intel Corp.(a) |
38,805,713 |
| 83,719 |
Marvell Technology, Inc.(a) |
5,049,093 |
| 417,032 |
NVIDIA Corp.(a) |
206,522,587 |
| 236,016 |
QUALCOMM, Inc.(a) |
34,134,994 |
| Shares |
Description |
Value (†) |
| |
Semiconductors & Semiconductor Equipment — continued | |
| 6,987 |
Taiwan Semiconductor Manufacturing Co. Ltd., ADR(a) |
$726,648
|
| 106,600 |
Teradyne, Inc.(a) |
11,568,232 |
| 259,711 |
Texas Instruments, Inc.(a) |
44,270,337 |
| |
|
511,598,389 |
| |
Software — 10.9% | |
| 93,920 |
Adobe, Inc.(a)(b) |
56,032,672 |
| 10,058 |
Atlassian Corp., Class A(a)(b) |
2,392,396 |
| 109,371 |
Cadence Design Systems, Inc.(a)(b) |
29,789,379 |
| 49,654 |
Intuit, Inc.(a) |
31,035,240 |
| 1,238,323 |
Microsoft Corp.(a) |
465,658,981 |
| 350,902 |
Oracle Corp.(a) |
36,995,598 |
| 36,742 |
Palo Alto Networks, Inc.(a)(b) |
10,834,481 |
| 122,261 |
Salesforce, Inc.(a)(b) |
32,171,759 |
| 4,808 |
SAP SE, ADR |
743,269 |
| 40,910 |
ServiceNow, Inc.(a)(b) |
28,902,506 |
| 22,602 |
Workday, Inc., Class A(a)(b) |
6,239,508 |
| |
|
700,795,789 |
| |
Specialized REITs — 0.4% | |
| 184,847 |
Crown Castle, Inc.(a) |
21,292,526 |
| 127,880 |
CubeSmart(a) |
5,927,238 |
| |
|
27,219,764 |
| |
Specialty Retail — 2.1% | |
| 20,171 |
Dick's Sporting Goods, Inc.(a) |
2,964,128 |
| 218,400 |
Home Depot, Inc.(a) |
75,686,520 |
| 186,352 |
Lowe's Cos., Inc.(a) |
41,472,638 |
| 12,994 |
O'Reilly Automotive, Inc.(a)(b) |
12,345,340 |
| 161,306 |
Valvoline, Inc.(a)(b) |
6,061,879 |
| |
|
138,530,505 |
| |
Technology Hardware, Storage & Peripherals — 7.3% | |
| 2,434,526 |
Apple, Inc.(a) |
468,719,291 |
| 38,399 |
Dell Technologies, Inc., Class C(a) |
2,937,523 |
| |
|
471,656,814 |
| |
Textiles, Apparel & Luxury Goods — 0.3% | |
| 32,241 |
Lululemon Athletica, Inc.(a)(b) |
16,484,501 |
| |
Tobacco — 0.5% | |
| 671,904 |
Altria Group, Inc.(a) |
27,104,607 |
| 153,860 |
British American Tobacco PLC, ADR(a) |
4,506,560 |
| |
|
31,611,167 |
| |
Trading Companies & Distributors — 0.1% | |
| 20,598 |
Ferguson PLC(a) |
3,976,856 |
| |
Total Common Stocks (Identified Cost $2,018,204,535) |
6,434,852,898 |
| |
Total Purchased Options — 0.5% (Identified Cost $47,446,549) (see details below) |
33,444,020 |
| Principal
Amount |
Description |
Value (†) |
| Short-Term Investments — 1.6% | ||
| $103,471,055
|
Tri-Party Repurchase Agreement with Fixed Income Clearing Corporation, dated 12/29/2023
at 2.500% to be repurchased at $103,499,797 on 1/02/2024 collateralized by $113,653,400 U.S. Treasury Note, 0.375% due 11/30/2025
valued at $105,540,529 including accrued interest (Note 2 of Notes to Financial Statements) (Identified Cost $103,471,055) |
$103,471,055 |
| |
Total Investments — 101.9% (Identified Cost $2,169,122,139) |
6,571,767,973 |
| |
Other assets less liabilities — (1.9)% |
(119,473,851 ) |
| |
Net Assets — 100.0% |
$6,452,294,122 |
| Description |
Expiration
Date |
Exercise
Price |
Contracts |
Notional
Amount |
Cost |
Value (†) |
| Index Options — 0.5% | ||||||
| S&P 500® Index, Put(b) |
3/15/2024 |
4,300 |
1,902 |
$907,221,666
|
$5,368,395
|
$3,119,280
|
| S&P 500® Index, Put(b) |
3/15/2024 |
4,350 |
1,901 |
906,744,683 |
6,534,687 |
3,630,910 |
| S&P 500® Index, Put(b) |
3/15/2024 |
4,400 |
1,955 |
932,501,765 |
5,375,273 |
4,379,200 |
| S&P 500® Index, Put(b) |
3/28/2024 |
4,450 |
1,901 |
906,744,683 |
5,958,685 |
6,282,805 |
| S&P 500® Index, Put(b) |
3/28/2024 |
4,500 |
1,902 |
907,221,666 |
8,375,457 |
7,294,170 |
| S&P 500® Index, Put(b) |
4/19/2024 |
4,150 |
1,901 |
906,744,683 |
7,416,751 |
3,868,535 |
| S&P 500® Index, Put(b) |
4/19/2024 |
4,250 |
1,902 |
907,221,666 |
8,417,301 |
4,869,120 |
| Total |
|
|
|
|
$47,446,549 |
$33,444,020 |
| Description |
Expiration
Date |
Exercise
Price |
Contracts |
Notional
Amount |
Premiums
(Received) |
Value (†) |
| Index Options — (2.1%) | ||||||
| S&P 500® Index, Call |
1/31/2024 |
4,650 |
(1,480 ) |
$(705,934,840
) |
$(9,591,140
) |
$(24,101,800
) |
| S&P 500® Index, Call |
1/31/2024 |
4,700 |
(1,480 ) |
(705,934,840 ) |
(7,202,050 ) |
(18,070,800 ) |
| S&P 500® Index, Call |
2/16/2024 |
4,650 |
(1,480 ) |
(705,934,840 ) |
(13,218,620 ) |
(27,032,200 ) |
| S&P 500® Index, Call |
2/16/2024 |
4,800 |
(1,480 ) |
(705,934,840 ) |
(10,800,300 ) |
(11,662,400 ) |
| S&P 500® Index, Call |
3/15/2024 |
4,800 |
(1,481 ) |
(706,411,823 ) |
(9,119,805 ) |
(16,564,985 ) |
| S&P 500® Index, Call |
3/15/2024 |
4,850 |
(1,480 ) |
(705,934,840 ) |
(5,784,580 ) |
(12,402,400 ) |
| S&P 500® Index, Call |
3/15/2024 |
4,900 |
(1,521 ) |
(725,491,143 ) |
(8,833,208 ) |
(9,179,235 ) |
| S&P 500® Index, Call |
3/28/2024 |
4,950 |
(1,481 ) |
(706,411,823 ) |
(9,476,178 ) |
(7,930,755 ) |
| S&P 500® Index, Call |
3/28/2024 |
5,000 |
(1,481 ) |
(706,411,823 ) |
(6,704,991 ) |
(5,561,155 ) |
| Total |
|
|
|
|
$(80,730,872 ) |
$(132,505,730 ) |
| (†) |
See Note 2 of Notes to Financial Statements. |
| (a)
|
Security (or a portion thereof) has been pledged as collateral for
open derivative contracts. |
| (b)
|
Non-income producing security. |
| ADR
|
An
American Depositary Receipt is a certificate issued by a custodian bank representing
the right to receive securities of the foreign issuer described. The values of ADRs
may be significantly influenced by trading on exchanges not located in the
United States. |
| REITs
|
Real Estate Investment Trusts |
| Software |
10.9 % |
| Semiconductors & Semiconductor Equipment |
7.9 |
| Technology Hardware, Storage & Peripherals |
7.3 |
| Interactive Media & Services |
6.0 |
| Financial Services |
4.6 |
| Pharmaceuticals |
4.1 |
| Broadline Retail |
3.7 |
| Oil, Gas & Consumable Fuels |
3.6 |
| Banks |
3.5 |
| Health Care Providers & Services |
3.1 |
| Capital Markets |
2.5 |
| Health Care Equipment & Supplies |
2.3 |
| Hotels, Restaurants & Leisure |
2.2 |
| Specialty Retail |
2.1 |
| Biotechnology |
2.0 |
| Automobiles |
2.0 |
| Other Investments, less than 2% each |
32.5 |
| Short-Term Investments |
1.6 |
| Total Investments |
101.9 |
| Other assets less liabilities (including open written
options) |
(1.9 ) |
| Net Assets |
100.0 % |
| Shares |
Description |
Value (†) |
| Common Stocks — 99.5% of Net Assets | ||
| |
Aerospace & Defense — 1.5% | |
| 5,261 |
Boeing Co.(a)(b) |
$1,371,332
|
| 2,985 |
Lockheed Martin Corp.(a) |
1,352,921 |
| 16,582 |
RTX Corp.(a) |
1,395,210 |
| |
|
4,119,463 |
| |
Air Freight & Logistics — 0.4% | |
| 3,910 |
C.H. Robinson Worldwide, Inc.(a) |
337,785 |
| 5,682 |
Expeditors International of Washington, Inc.(a) |
722,750 |
| 1,830 |
GXO Logistics, Inc.(a)(b) |
111,923 |
| |
|
1,172,458 |
| |
Automobile Components — 0.1% | |
| 3,861 |
Gentex Corp.(a) |
126,100 |
| 1,060 |
Lear Corp.(a) |
149,683 |
| 1,844 |
Magna International, Inc.(a) |
108,943 |
| |
|
384,726 |
| |
Automobiles — 2.0% | |
| 43,957 |
Ford Motor Co.(a) |
535,836 |
| 19,285 |
Tesla, Inc.(a)(b) |
4,791,937 |
| |
|
5,327,773 |
| |
Banks — 3.4% | |
| 58,735 |
Bank of America Corp.(a) |
1,977,607 |
| 16,981 |
Citigroup, Inc.(a) |
873,503 |
| 4,668 |
East West Bancorp, Inc.(a) |
335,863 |
| 18,818 |
Fifth Third Bancorp(a) |
649,033 |
| 8,108 |
First Horizon Corp.(a) |
114,809 |
| 5,714 |
ICICI Bank Ltd., ADR(a) |
136,222 |
| 20,770 |
JPMorgan Chase & Co.(a) |
3,532,977 |
| 31,114 |
Wells Fargo & Co.(a) |
1,531,431 |
| |
|
9,151,445 |
| |
Beverages — 1.6% | |
| 8,858 |
Brown-Forman Corp., Class B(a) |
505,792 |
| 4,805 |
Coca-Cola Europacific Partners PLC(a) |
320,686 |
| 21,064 |
Keurig Dr Pepper, Inc.(a) |
701,852 |
| 15,984 |
PepsiCo, Inc.(a) |
2,714,722 |
| |
|
4,243,052 |
| |
Biotechnology — 2.0% | |
| 15,215 |
AbbVie, Inc.(a) |
2,357,869 |
| 1,480 |
Alnylam Pharmaceuticals, Inc.(a)(b) |
283,287 |
| 4,773 |
Amgen, Inc.(a) |
1,374,720 |
| 2,689 |
BioMarin Pharmaceutical, Inc.(a)(b) |
259,273 |
| 2,769 |
Vertex Pharmaceuticals, Inc.(a)(b) |
1,126,678 |
| |
|
5,401,827 |
| |
Broadline Retail — 3.6% | |
| 62,933 |
Amazon.com, Inc.(a)(b) |
9,562,040 |
| 71 |
MercadoLibre, Inc.(a)(b) |
111,579 |
| |
|
9,673,619 |
| |
Building Products — 0.3% | |
| 5,236 |
Fortune Brands Innovations, Inc.(a) |
398,669 |
| 726 |
Lennox International, Inc.(a) |
324,899 |
| |
|
723,568 |
| |
Capital Markets — 2.9% | |
| 16,593 |
Bank of New York Mellon Corp.(a) |
863,666 |
| 2,034 |
BlackRock, Inc.(a) |
1,651,201 |
| 7,892 |
Blackstone, Inc.(a) |
1,033,220 |
| 7,473 |
Brookfield Corp., Class A |
299,817 |
| 1,335 |
FactSet Research Systems, Inc.(a) |
636,862 |
| Shares |
Description |
Value (†) |
| |
Capital Markets — continued | |
| 5,640 |
KKR & Co., Inc.(a) |
$467,274
|
| 748 |
LPL Financial Holdings, Inc.(a) |
170,260 |
| 13,318 |
Morgan Stanley(a) |
1,241,903 |
| 1,140 |
MSCI, Inc.(a) |
644,841 |
| 7,080 |
Raymond James Financial, Inc.(a) |
789,420 |
| |
|
7,798,464 |
| |
Chemicals — 1.5% | |
| 2,994 |
Air Products & Chemicals, Inc.(a) |
819,757 |
| 4,444 |
Linde PLC(a) |
1,825,195 |
| 3,004 |
Nutrien Ltd.(a) |
169,215 |
| 5,534 |
PPG Industries, Inc.(a) |
827,610 |
| 3,228 |
RPM International, Inc.(a) |
360,342 |
| |
|
4,002,119 |
| |
Commercial Services & Supplies — 0.7% | |
| 4,847 |
Waste Connections, Inc.(a) |
723,512 |
| 7,184 |
Waste Management, Inc.(a) |
1,286,654 |
| |
|
2,010,166 |
| |
Communications Equipment — 0.8% | |
| 4,531 |
Ciena Corp.(a)(b) |
203,941 |
| 41,314 |
Cisco Systems, Inc.(a) |
2,087,183 |
| |
|
2,291,124 |
| |
Construction Materials — 0.3% | |
| 1,854 |
Martin Marietta Materials, Inc.(a) |
924,979 |
| |
Consumer Finance — 0.3% | |
| 7,234 |
Ally Financial, Inc.(a) |
252,611 |
| 15,939 |
Synchrony Financial(a) |
608,711 |
| |
|
861,322 |
| |
Consumer Staples Distribution & Retail — 2.0% | |
| 3,546 |
Costco Wholesale Corp.(a) |
2,340,644 |
| 8,111 |
Sysco Corp.(a) |
593,157 |
| 4,838 |
Target Corp.(a) |
689,028 |
| 10,706 |
Walmart, Inc.(a) |
1,687,801 |
| |
|
5,310,630 |
| |
Containers & Packaging — 0.2% | |
| 4,418 |
Crown Holdings, Inc.(a) |
406,854 |
| |
Distributors — 0.2% | |
| 4,678 |
Genuine Parts Co.(a) |
647,903 |
| |
Diversified Consumer Services — 0.1% | |
| 3,378 |
Service Corp. International(a) |
231,224 |
| |
Diversified REITs — 0.1% | |
| 2,146 |
W.P. Carey, Inc.(a) |
139,082 |
| |
Diversified Telecommunication Services — 0.6% | |
| 90,407 |
AT&T, Inc.(a) |
1,517,029 |
| |
Electric Utilities — 1.5% | |
| 20,127 |
Alliant Energy Corp.(a) |
1,032,515 |
| 19,757 |
American Electric Power Co., Inc.(a) |
1,604,663 |
| 17,236 |
NextEra Energy, Inc.(a) |
1,046,915 |
| 11,620 |
OGE Energy Corp.(a) |
405,887 |
| |
|
4,089,980 |
| |
Electrical Equipment — 0.7% | |
| 1,757 |
Acuity Brands, Inc.(a) |
359,886 |
| 8,401 |
Emerson Electric Co.(a) |
817,669 |
| 1,562 |
Hubbell, Inc.(a) |
513,789 |
| 2,698 |
Sensata Technologies Holding PLC(a) |
101,364 |
| |
|
1,792,708 |
| Shares |
Description |
Value (†) |
| |
Electronic Equipment, Instruments & Components — 0.5% | |
| 1,888 |
Arrow Electronics, Inc.(a)(b) |
$230,808
|
| 3,542 |
CDW Corp.(a) |
805,168 |
| 7,429 |
Flex Ltd.(a)(b) |
226,287 |
| |
|
1,262,263 |
| |
Energy Equipment & Services — 0.3% | |
| 19,602 |
Halliburton Co.(a) |
708,612 |
| 6,142 |
NOV, Inc.(a) |
124,560 |
| |
|
833,172 |
| |
Entertainment — 1.1% | |
| 3,225 |
Netflix, Inc.(a)(b) |
1,570,188 |
| 15,821 |
Walt Disney Co.(a) |
1,428,478 |
| |
|
2,998,666 |
| |
Financial Services — 4.3% | |
| 14,543 |
Berkshire Hathaway, Inc., Class B(a)(b) |
5,186,906 |
| 7,035 |
Mastercard, Inc., Class A(a) |
3,000,498 |
| 13,588 |
Visa, Inc., Class A(a) |
3,537,636 |
| |
|
11,725,040 |
| |
Food Products — 0.7% | |
| 14,518 |
Hormel Foods Corp.(a) |
466,173 |
| 2,045 |
Ingredion, Inc.(a) |
221,944 |
| 19,167 |
Kellanova(a) |
1,071,627 |
| 2,313 |
Post Holdings, Inc.(a)(b) |
203,683 |
| |
|
1,963,427 |
| |
Ground Transportation — 1.2% | |
| 3,371 |
Canadian National Railway Co.(a) |
423,499 |
| 3,153 |
Canadian Pacific Kansas City Ltd.(a) |
249,276 |
| 17,000 |
Uber Technologies, Inc.(a)(b) |
1,046,690 |
| 5,487 |
Union Pacific Corp.(a) |
1,347,717 |
| 492 |
XPO, Inc.(a)(b) |
43,094 |
| |
|
3,110,276 |
| |
Health Care Equipment & Supplies — 2.4% | |
| 19,310 |
Abbott Laboratories(a) |
2,125,452 |
| 4,403 |
Alcon, Inc.(a) |
343,962 |
| 1,250 |
Align Technology, Inc.(a)(b) |
342,500 |
| 4,219 |
Dexcom, Inc.(a)(b) |
523,536 |
| 1,287 |
IDEXX Laboratories, Inc.(a)(b) |
714,349 |
| 16,962 |
Medtronic PLC(a) |
1,397,330 |
| 3,269 |
ResMed, Inc.(a) |
562,333 |
| 1,858 |
Teleflex, Inc.(a) |
463,274 |
| |
|
6,472,736 |
| |
Health Care Providers & Services — 2.7% | |
| 6,890 |
Centene Corp.(a)(b) |
511,307 |
| 2,951 |
Cigna Group(a) |
883,677 |
| 1,419 |
DaVita, Inc.(a)(b) |
148,655 |
| 2,331 |
Elevance Health, Inc.(a) |
1,099,206 |
| 2,717 |
Laboratory Corp. of America Holdings(a) |
617,547 |
| 1,242 |
Molina Healthcare, Inc.(a)(b) |
448,747 |
| 6,858 |
UnitedHealth Group, Inc.(a) |
3,610,531 |
| |
|
7,319,670 |
| |
Health Care Technology — 0.1% | |
| 1,165 |
Veeva Systems, Inc., Class A(a)(b) |
224,286 |
| |
Hotels, Restaurants & Leisure — 2.1% | |
| 286 |
Booking Holdings, Inc.(a)(b) |
1,014,505 |
| 5,370 |
Hilton Worldwide Holdings, Inc.(a) |
977,823 |
| 6,165 |
McDonald's Corp.(a) |
1,827,984 |
| 5,230 |
MGM Resorts International(a)(b) |
233,677 |
| 4,424 |
Restaurant Brands International, Inc.(a) |
345,647 |
| Shares |
Description |
Value (†) |
| |
Hotels, Restaurants & Leisure — continued | |
| 9,898 |
Starbucks Corp.(a) |
$950,307
|
| 3,128 |
Trip.com Group Ltd., ADR(a)(b) |
112,639 |
| 479 |
Vail Resorts, Inc.(a) |
102,252 |
| 2,169 |
Yum China Holdings, Inc.(a) |
92,031 |
| |
|
5,656,865 |
| |
Household Durables — 0.4% | |
| 6,955 |
PulteGroup, Inc.(a) |
717,895 |
| 4,419 |
Toll Brothers, Inc.(a) |
454,229 |
| |
|
1,172,124 |
| |
Household Products — 1.3% | |
| 2,616 |
Clorox Co.(a) |
373,015 |
| 21,466 |
Procter & Gamble Co.(a) |
3,145,628 |
| |
|
3,518,643 |
| |
Industrial Conglomerates — 1.0% | |
| 10,686 |
3M Co.(a) |
1,168,193 |
| 11,236 |
General Electric Co.(a) |
1,434,051 |
| |
|
2,602,244 |
| |
Industrial REITs — 0.5% | |
| 10,052 |
Prologis, Inc.(a) |
1,339,932 |
| |
Insurance — 2.0% | |
| 6,558 |
Arch Capital Group Ltd.(a)(b) |
487,063 |
| 5,305 |
Cincinnati Financial Corp.(a) |
548,855 |
| 12,601 |
Hartford Financial Services Group, Inc.(a) |
1,012,868 |
| 20,270 |
Manulife Financial Corp.(a) |
447,967 |
| 372 |
Markel Group, Inc.(a)(b) |
528,203 |
| 9,288 |
Prudential Financial, Inc.(a) |
963,259 |
| 911 |
RenaissanceRe Holdings Ltd.(a) |
178,556 |
| 9,046 |
W.R. Berkley Corp.(a) |
639,733 |
| 2,337 |
Willis Towers Watson PLC(a) |
563,684 |
| |
|
5,370,188 |
| |
Interactive Media & Services — 5.9% | |
| 24,721 |
Alphabet, Inc., Class A(a)(b) |
3,453,277 |
| 50,182 |
Alphabet, Inc., Class C(a)(b) |
7,072,149 |
| 15,626 |
Meta Platforms, Inc., Class A(a)(b) |
5,530,979 |
| |
|
16,056,405 |
| |
IT Services — 1.1% | |
| 5,571 |
Accenture PLC, Class A(a) |
1,954,920 |
| 820 |
EPAM Systems, Inc.(a)(b) |
243,819 |
| 2,185 |
Shopify, Inc., Class A(a)(b) |
170,211 |
| 2,533 |
VeriSign, Inc.(a)(b) |
521,697 |
| |
|
2,890,647 |
| |
Leisure Products — 0.0% | |
| 590 |
Brunswick Corp.(a) |
57,082 |
| 515 |
Polaris, Inc.(a) |
48,807 |
| |
|
105,889 |
| |
Life Sciences Tools & Services — 1.4% | |
| 9,551 |
Avantor, Inc.(a)(b) |
218,049 |
| 746 |
Bio-Rad Laboratories, Inc., Class A(a)(b) |
240,876 |
| 1,206 |
ICON PLC, ADR(a)(b) |
341,382 |
| 3,338 |
Revvity, Inc.(a) |
364,877 |
| 3,867 |
Thermo Fisher Scientific, Inc.(a) |
2,052,565 |
| 1,833 |
Waters Corp.(a)(b) |
603,479 |
| |
|
3,821,228 |
| |
Machinery — 1.8% | |
| 471 |
AGCO Corp.(a) |
57,184 |
| 4,889 |
Caterpillar, Inc.(a) |
1,445,531 |
| Shares |
Description |
Value (†) |
| |
Machinery — continued | |
| 2,776 |
Cummins, Inc.(a) |
$665,046
|
| 2,621 |
Deere & Co.(a) |
1,048,059 |
| 2,776 |
IDEX Corp.(a) |
602,697 |
| 12,435 |
Otis Worldwide Corp.(a) |
1,112,560 |
| |
|
4,931,077 |
| |
Media — 0.6% | |
| 34,400 |
Comcast Corp., Class A(a) |
1,508,440 |
| 1,274 |
Liberty Broadband Corp., Class C(a)(b) |
102,672 |
| |
|
1,611,112 |
| |
Metals & Mining — 0.5% | |
| 6,051 |
Alcoa Corp.(a) |
205,734 |
| 4,852 |
Barrick Gold Corp.(a) |
87,773 |
| 3,960 |
Rio Tinto PLC, ADR(a) |
294,861 |
| 2,052 |
Southern Copper Corp.(a) |
176,616 |
| 2,587 |
Steel Dynamics, Inc.(a) |
305,525 |
| 9,883 |
Vale SA, ADR(a) |
156,744 |
| |
|
1,227,253 |
| |
Mortgage Real Estate Investment Trusts (REITs) — 0.1% | |
| 7,880 |
Annaly Capital Management, Inc.(a) |
152,636 |
| |
Multi-Utilities — 0.8% | |
| 12,577 |
Ameren Corp.(a) |
909,820 |
| 21,171 |
CMS Energy Corp.(a) |
1,229,400 |
| |
|
2,139,220 |
| |
Oil, Gas & Consumable Fuels — 3.5% | |
| 3,217 |
Canadian Natural Resources Ltd.(a) |
210,778 |
| 9,259 |
Cenovus Energy, Inc.(a) |
154,162 |
| 128 |
Cheniere Energy, Inc. |
21,851 |
| 12,833 |
Chevron Corp.(a) |
1,914,170 |
| 11,868 |
ConocoPhillips(a) |
1,377,519 |
| 9,900 |
Devon Energy Corp.(a) |
448,470 |
| 6,043 |
Enbridge, Inc.(a) |
217,669 |
| 28,818 |
Exxon Mobil Corp.(a) |
2,881,224 |
| 2,451 |
HF Sinclair Corp.(a) |
136,202 |
| 9,179 |
Occidental Petroleum Corp.(a) |
548,078 |
| 2,073 |
Ovintiv, Inc.(a) |
91,046 |
| 2,474 |
Pioneer Natural Resources Co.(a) |
556,353 |
| 7,564 |
Suncor Energy, Inc.(a) |
242,351 |
| 6,468 |
Targa Resources Corp.(a) |
561,875 |
| 5,425 |
TC Energy Corp.(a) |
212,063 |
| |
|
9,573,811 |
| |
Passenger Airlines — 0.3% | |
| 17,239 |
Delta Air Lines, Inc.(a) |
693,525 |
| |
Personal Care Products — 0.0% | |
| 2,246 |
BellRing Brands, Inc.(a)(b) |
124,496 |
| |
Pharmaceuticals — 3.8% | |
| 2,039 |
AstraZeneca PLC, ADR(a) |
137,327 |
| 5,803 |
Eli Lilly & Co.(a) |
3,382,685 |
| 1,744 |
Jazz Pharmaceuticals PLC(a)(b) |
214,512 |
| 18,922 |
Johnson & Johnson(a) |
2,965,834 |
| 20,798 |
Merck & Co., Inc.(a) |
2,267,398 |
| 43,532 |
Pfizer, Inc.(a) |
1,253,286 |
| 10,812 |
Teva Pharmaceutical Industries Ltd., ADR(a)(b) |
112,877 |
| |
|
10,333,919 |
| |
Professional Services — 0.6% | |
| 1,986 |
Booz Allen Hamilton Holding Corp.(a) |
254,029 |
| 3,378 |
Leidos Holdings, Inc.(a) |
365,635 |
| Shares |
Description |
Value (†) |
| |
Professional Services — continued | |
| 3,824 |
TransUnion(a) |
$262,747
|
| 2,855 |
Verisk Analytics, Inc.(a) |
681,945 |
| |
|
1,564,356 |
| |
Real Estate Management & Development — 0.0% | |
| 591 |
Jones Lang LaSalle, Inc.(a)(b) |
111,622 |
| |
Residential REITs — 0.8% | |
| 10,047 |
American Homes 4 Rent, Class A(a) |
361,290 |
| 1,382 |
Essex Property Trust, Inc.(a) |
342,653 |
| 22,727 |
Invitation Homes, Inc.(a) |
775,218 |
| 4,374 |
Mid-America Apartment Communities, Inc.(a) |
588,128 |
| 1,172 |
Sun Communities, Inc.(a) |
156,638 |
| |
|
2,223,927 |
| |
Retail REITs — 0.5% | |
| 9,368 |
NNN REIT, Inc.(a) |
403,761 |
| 17,416 |
Realty Income Corp.(a) |
1,000,026 |
| |
|
1,403,787 |
| |
Semiconductors & Semiconductor Equipment — 8.0% | |
| 12,659 |
Advanced Micro Devices, Inc.(a)(b) |
1,866,063 |
| 6,263 |
Analog Devices, Inc.(a) |
1,243,582 |
| 8,385 |
Applied Materials, Inc.(a) |
1,358,957 |
| 538 |
ASML Holding NV |
407,223 |
| 3,253 |
Broadcom, Inc.(a) |
3,631,161 |
| 1,550 |
Enphase Energy, Inc.(a)(b) |
204,817 |
| 4,326 |
Marvell Technology, Inc.(a) |
260,901 |
| 17,178 |
NVIDIA Corp.(a) |
8,506,889 |
| 5,891 |
ON Semiconductor Corp.(a)(b) |
492,075 |
| 10,018 |
QUALCOMM, Inc.(a) |
1,448,904 |
| 5,983 |
Teradyne, Inc.(a) |
649,275 |
| 9,883 |
Texas Instruments, Inc.(a) |
1,684,656 |
| |
|
21,754,503 |
| |
Software — 11.1% | |
| 3,404 |
Adobe, Inc.(a)(b) |
2,030,826 |
| 2,020 |
ANSYS, Inc.(a)(b) |
733,018 |
| 659 |
Atlassian Corp., Class A(a)(b) |
156,750 |
| 2,341 |
Check Point Software Technologies Ltd.(a)(b) |
357,681 |
| 7,258 |
Fortinet, Inc.(a)(b) |
424,811 |
| 2,505 |
Intuit, Inc.(a) |
1,565,700 |
| 50,801 |
Microsoft Corp.(a) |
19,103,208 |
| 12,059 |
Oracle Corp.(a) |
1,271,380 |
| 2,749 |
Palo Alto Networks, Inc.(a)(b) |
810,625 |
| 7,353 |
Salesforce, Inc.(a)(b) |
1,934,869 |
| 589 |
SAP SE, ADR(a) |
91,054 |
| 1,704 |
ServiceNow, Inc.(a)(b) |
1,203,859 |
| 1,002 |
Workday, Inc., Class A(a)(b) |
276,612 |
| 2,608 |
Zoom Video Communications, Inc., Class A(a)(b) |
187,541 |
| |
|
30,147,934 |
| |
Specialized REITs — 0.6% | |
| 4,882 |
Gaming & Leisure Properties, Inc.(a) |
240,927 |
| 1,983 |
SBA Communications Corp.(a) |
503,067 |
| 27,410 |
VICI Properties, Inc.(a) |
873,831 |
| |
|
1,617,825 |
| |
Specialty Retail — 1.8% | |
| 346 |
Burlington Stores, Inc.(a)(b) |
67,290 |
| 933 |
Dick's Sporting Goods, Inc.(a) |
137,105 |
| 5,211 |
Gap, Inc.(a) |
108,962 |
| 7,655 |
Home Depot, Inc.(a) |
2,652,840 |
| 5,464 |
Lowe's Cos., Inc.(a) |
1,216,013 |
| Shares |
Description |
Value (†) |
| |
Specialty Retail — continued | |
| 840 |
Ulta Beauty, Inc.(a)(b) |
$411,592
|
| 749 |
Williams-Sonoma, Inc.(a) |
151,133 |
| |
|
4,744,935 |
| |
Technology Hardware, Storage & Peripherals — 7.2% | |
| 99,844 |
Apple, Inc.(a) |
19,222,965 |
| 3,720 |
Dell Technologies, Inc., Class C(a) |
284,580 |
| |
|
19,507,545 |
| |
Textiles, Apparel & Luxury Goods — 0.7% | |
| 1,271 |
Lululemon Athletica, Inc.(a)(b) |
649,850 |
| 9,818 |
NIKE, Inc., Class B(a) |
1,065,940 |
| 2,457 |
Skechers USA, Inc., Class A(a)(b) |
153,169 |
| |
|
1,868,959 |
| |
Tobacco — 0.7% | |
| 6,771 |
British American Tobacco PLC, ADR(a) |
198,322 |
| 18,933 |
Philip Morris International, Inc.(a) |
1,781,217 |
| |
|
1,979,539 |
| |
Trading Companies & Distributors — 0.2% | |
| 3,216 |
Ferguson PLC(a) |
620,913 |
| |
Wireless Telecommunication Services — 0.1% | |
| 6,515 |
America Movil SAB de CV, ADR(a) |
120,658 |
| 6,410 |
Vodafone Group PLC, ADR(a) |
55,767 |
| |
|
176,425 |
| |
Total Common Stocks (Identified Cost $195,254,416) |
269,174,535 |
| Principal
Amount |
Description |
Value (†) |
| Short-Term Investments — 2.4% | ||
| $6,522,825
|
Tri-Party Repurchase Agreement with Fixed Income Clearing Corporation, dated 12/29/2023 at 2.500% to be repurchased at $6,524,637 on 1/02/2024 collateralized by $7,164,800 U.S. Treasury Note, 0.375% due 11/30/2025 valued at $6,653,358 including accrued interest (Note 2 of Notes to Financial Statements) (Identified Cost $6,522,825) |
$6,522,825 |
| |
Total Investments — 101.9% (Identified Cost $201,777,241) |
275,697,360 |
| |
Other assets less liabilities — (1.9)% |
(5,206,704 ) |
| |
Net Assets — 100.0% |
$270,490,656 |
| Description |
Expiration
Date |
Exercise
Price |
Contracts |
Notional
Amount |
Premiums
(Received) |
Value (†) |
| Index Options — (2.1%) | ||||||
| S&P 500® Index, Call |
1/31/2024 |
4,650 |
(62 ) |
$(29,572,946
) |
$(401,791
) |
$(1,009,670
) |
| S&P 500® Index, Call |
1/31/2024 |
4,700 |
(62 ) |
(29,572,946 ) |
(301,707 ) |
(757,020 ) |
| S&P 500® Index, Call |
2/16/2024 |
4,650 |
(62 ) |
(29,572,946 ) |
(553,753 ) |
(1,132,430 ) |
| S&P 500® Index, Call |
2/16/2024 |
4,800 |
(62 ) |
(29,572,946 ) |
(452,445 ) |
(488,560 ) |
| S&P 500® Index, Call |
3/15/2024 |
4,800 |
(63 ) |
(30,049,929 ) |
(387,946 ) |
(704,655 ) |
| S&P 500® Index, Call |
3/15/2024 |
4,850 |
(62 ) |
(29,572,946 ) |
(242,327 ) |
(519,560 ) |
| S&P 500® Index, Call |
3/15/2024 |
4,900 |
(62 ) |
(29,572,946 ) |
(360,065 ) |
(374,170 ) |
| S&P 500® Index, Call |
3/28/2024 |
4,950 |
(62 ) |
(29,572,946 ) |
(396,707 ) |
(332,010 ) |
| S&P 500® Index, Call |
3/28/2024 |
5,000 |
(62 ) |
(29,572,946 ) |
(280,695 ) |
(232,810 ) |
| Total |
|
|
|
|
$(3,377,436 ) |
$(5,550,885 ) |
| (†) |
See Note 2 of Notes to Financial Statements. |
| (a)
|
Security (or a portion thereof) has been pledged as collateral for
open derivative contracts. |
| (b)
|
Non-income producing security. |
| ADR
|
An
American Depositary Receipt is a certificate issued by a custodian bank representing
the right to receive securities of the foreign issuer described. The values of ADRs
may be significantly influenced by trading on exchanges not located in the
United States. |
| REITs
|
Real
Estate Investment Trusts |
| Software |
11.1 % |
| Semiconductors & Semiconductor Equipment |
8.0 |
| Technology Hardware, Storage & Peripherals |
7.2 |
| Interactive Media & Services |
5.9 |
| Financial Services |
4.3 |
| Pharmaceuticals |
3.8 |
| Broadline Retail |
3.6 |
| Oil, Gas & Consumable Fuels |
3.5 |
| Banks |
3.4 |
| Capital Markets |
2.9 |
| Health Care Providers & Services |
2.7 |
| Health Care Equipment & Supplies |
2.4 |
| Hotels, Restaurants & Leisure |
2.1 |
| Biotechnology |
2.0 |
| Insurance |
2.0 |
| Automobiles |
2.0 |
| Consumer Staples Distribution & Retail |
2.0 |
| Other Investments, less than 2% each |
30.6 |
| Short-Term Investments |
2.4 |
| Total Investments |
101.9 |
| Other assets less liabilities (including open written
options) |
(1.9 ) |
| Net Assets |
100.0 % |
| Principal
Amount(‡) |
Description |
Value (†) |
| Bonds and Notes — 91.8% of Net Assets | ||
| |
Canada — 0.1% | |
| 50,000 |
Province of Quebec, 2.600%, 7/06/2025, (CAD) |
$36,856 |
| |
Chile — 1.9% | |
| 500,000 |
Chile Government International Bonds, 1.250%, 1/29/2040, (EUR) |
384,327 |
| 500,000 |
Chile Government International Bonds, 3.500%, 1/25/2050 |
379,467 |
| |
|
763,794 |
| |
Denmark — 3.0% | |
| 500,000 |
Orsted AS, 1.500%, 11/26/2029, (EUR) |
499,224 |
| 200,000 |
Orsted AS, (fixed rate to 9/09/2027, variable rate thereafter), 1.750%, 12/09/3019, (EUR) |
193,047 |
| 500,000 |
Vestas Wind Systems Finance BV, EMTN, 1.500%, 6/15/2029, (EUR) |
505,010 |
| |
|
1,197,281 |
| |
Finland — 0.5% | |
| 200,000 |
VR-Yhtyma OYJ, 2.375%, 5/30/2029, (EUR) |
210,872 |
| |
France — 8.0% | |
| 400,000 |
Altarea SCA, 1.750%, 1/16/2030, (EUR) |
339,035 |
| 400,000 |
Banque Stellantis France SACA, EMTN, 3.875%, 1/19/2026, (EUR) |
444,616 |
| 400,000 |
Cie de Saint-Gobain SA, EMTN, 2.125%, 6/10/2028, (EUR) |
424,270 |
| 200,000 |
Covivio SA, 1.125%, 9/17/2031, (EUR) |
181,318 |
| 400,000 |
Credit Mutuel Arkea SA, EMTN, 4.250%, 12/01/2032, (EUR) |
464,032 |
| 200,000 |
Derichebourg SA, 2.250%, 7/15/2028, (EUR) |
206,237 |
| 200,000 |
Forvia SE, 2.375%, 6/15/2029, (EUR) |
200,698 |
| 100,000 |
Getlink SE, 3.500%, 10/30/2025, (EUR) |
109,147 |
| 300,000 |
ICADE, 1.500%, 9/13/2027, (EUR) |
307,969 |
| 600,000 |
Societe Du Grand Paris EPIC, EMTN, 1.700%, 5/25/2050, (EUR) |
466,595 |
| |
|
3,143,917 |
| |
Germany — 7.4% | |
| 1,000,000 |
Bundesrepublik Deutschland Bundesanleihe, Series G, Zero Coupon, 0.000%–2.788%, 8/15/2030, (EUR)(a) |
976,040 |
| 2,300,000 |
Bundesrepublik Deutschland Bundesanleihe, Series G, Zero Coupon, 1.719%–3.065%, 8/15/2050, (EUR)(a) |
1,420,263 |
| 500,000 |
EnBW Energie Baden-Wuerttemberg AG, (fixed rate to 3/30/2026, variable rate thereafter), 1.875%, 6/29/2080, (EUR) |
514,275 |
| |
|
2,910,578 |
| |
Hungary — 1.1% | |
| 500,000 |
Hungary Government International Bonds, 1.750%, 6/05/2035, (EUR) |
422,429 |
| |
Indonesia — 1.3% | |
| 500,000 |
Perusahaan Penerbit SBSN Indonesia III, 3.900%, 8/20/2024 |
496,000 |
| |
Ireland — 0.7% | |
| 300,000 |
ESB Finance DAC, EMTN, 1.000%, 7/19/2034, (EUR) |
265,726 |
| |
Italy — 7.8% | |
| 400,000 |
A2A SpA, EMTN, 1.000%, 7/16/2029, (EUR) |
390,074 |
| 600,000 |
Assicurazioni Generali SpA, EMTN, 2.124%, 10/01/2030, (EUR) |
582,837 |
| 400,000 |
Cassa Depositi e Prestiti SpA, 3.875%, 2/13/2029, (EUR) |
450,606 |
| Principal
Amount(‡) |
Description |
Value (†) |
| |
Italy — continued | |
| 300,000 |
ERG SpA, EMTN, 0.500%, 9/11/2027, (EUR) |
$298,944
|
| 400,000 |
Hera SpA, EMTN, 2.500%, 5/25/2029, (EUR) |
424,996 |
| 800,000 |
Italy Buoni Poliennali Del Tesoro, Series 34Y, 1.500%, 4/30/2045, (EUR)(b) |
559,305 |
| 300,000 |
Terna - Rete Elettrica Nazionale, EMTN, 3.875%, 7/24/2033, (EUR) |
341,071 |
| |
|
3,047,833 |
| |
Japan — 2.3% | |
| 500,000 |
Denso Corp., 1.239%, 9/16/2026 |
453,405 |
| 400,000 |
Mizuho Financial Group, Inc., EMTN, 3.490%, 9/05/2027, (EUR) |
442,921 |
| |
|
896,326 |
| |
Korea — 1.8% | |
| 400,000 |
Kookmin Bank, GMTN, 4.500%, 2/01/2029 |
383,110 |
| 300,000 |
Korea International Bonds, Zero Coupon, 0.000%, 10/15/2026, (EUR)(c) |
303,785 |
| |
|
686,895 |
| |
Lithuania — 2.3% | |
| 500,000 |
Ignitis Grupe AB, EMTN, 1.875%, 7/10/2028, (EUR) |
505,079 |
| 400,000 |
Ignitis Grupe AB, EMTN, 2.000%, 7/14/2027, (EUR) |
417,373 |
| |
|
922,452 |
| |
Mexico — 2.1% | |
| 800,000 |
Mexico Government International Bonds, 1.350%, 9/18/2027, (EUR) |
824,061 |
| |
Netherlands — 8.1% | |
| 300,000 |
Alliander NV, EMTN, 2.625%, 9/09/2027, (EUR) |
329,330 |
| 400,000 |
CTP NV, EMTN, 2.125%, 10/01/2025, (EUR) |
423,706 |
| 400,000 |
de Volksbank NV, EMTN, 0.375%, 3/03/2028, (EUR) |
383,707 |
| 600,000 |
de Volksbank NV, EMTN, (fixed rate to 10/22/2025, variable rate thereafter), 1.750%, 10/22/2030, (EUR) |
623,078 |
| 300,000 |
Enexis Holding NV, EMTN, 3.625%, 6/12/2034, (EUR) |
348,976 |
| 500,000 |
Koninklijke Philips NV, EMTN, 2.125%, 11/05/2029, (EUR) |
507,433 |
| 300,000 |
Stedin Holding NV, EMTN, 2.375%, 6/03/2030, (EUR) |
315,486 |
| 150,000 |
TenneT Holding BV, EMTN, 1.250%, 10/24/2033, (EUR) |
147,247 |
| 100,000 |
TenneT Holding BV, EMTN, 1.875%, 6/13/2036, (EUR) |
97,956 |
| |
|
3,176,919 |
| |
Norway — 0.8% | |
| 300,000 |
Statkraft AS, EMTN, 2.875%, 9/13/2029, (EUR) |
331,706 |
| |
Portugal — 2.2% | |
| 400,000 |
EDP Finance BV, EMTN, 3.875%, 3/11/2030, (EUR) |
457,244 |
| 400,000 |
Ren Finance BV, EMTN, 0.500%, 4/16/2029, (EUR) |
387,483 |
| |
|
844,727 |
| |
Singapore — 1.2% | |
| 500,000 |
Vena Energy Capital Pte. Ltd., EMTN, 3.133%, 2/26/2025 |
484,427 |
| |
Spain — 6.7% | |
| 400,000 |
Banco Bilbao Vizcaya Argentaria SA, 1.000%, 6/21/2026, (EUR) |
419,165 |
| 300,000 |
Banco Bilbao Vizcaya Argentaria SA, GMTN, 4.375%, 10/14/2029, (EUR) |
351,758 |
| 500,000 |
Bankinter SA, 0.625%, 10/06/2027, (EUR) |
501,999 |
| 400,000 |
Iberdrola Finanzas SA, EMTN, 1.375%, 3/11/2032, (EUR) |
391,521 |
| Principal
Amount(‡) |
Description |
Value (†) |
| |
Spain — continued | |
| 900,000 |
Spain Government Bonds, 1.000%, 7/30/2042, (EUR)(b) |
$664,529
|
| 300,000 |
Telefonica Europe BV, (fixed rate to 2/05/2027, variable rate thereafter), 2.502%, (EUR)(d) |
304,851 |
| |
|
2,633,823 |
| |
Supranationals — 6.0% | |
| 2,500,000 |
European Investment Bank, 2.375%, 5/24/2027 |
2,366,382 |
| |
Sweden — 3.4% | |
| 400,000 |
SKF AB, 3.125%, 9/14/2028, (EUR) |
441,368 |
| 500,000 |
Vattenfall AB, EMTN, 0.125%, 2/12/2029, (EUR) |
477,356 |
| 400,000 |
Volvo Car AB, EMTN, 2.500%, 10/07/2027, (EUR) |
417,293 |
| |
|
1,336,017 |
| |
Switzerland — 0.5% | |
| 200,000 |
ABB Finance BV, ETMN, Zero Coupon, 0.000%–0.282%, 1/19/2030, (EUR)(a) |
185,875 |
| |
United Kingdom — 10.4% | |
| 500,000 |
Anglian Water Services Financing PLC, EMTN, 1.625%, 8/10/2025, (GBP) |
602,928 |
| 500,000 |
DS Smith PLC, EMTN, 4.375%, 7/27/2027, (EUR) |
567,794 |
| 300,000 |
Severn Trent Utilities Finance PLC, EMTN, 5.250%, 4/04/2036, (GBP) |
394,593 |
| 500,000 |
SSE PLC, EMTN, 1.375%, 9/04/2027, (EUR) |
521,547 |
| 300,000 |
SSE PLC, EMTN, 2.875%, 8/01/2029, (EUR) |
327,482 |
| 1,300,000 |
U.K. Gilts, 0.875%, 7/31/2033, (GBP) |
1,297,138 |
| 500,000 |
U.K. Gilts, 1.500%, 7/31/2053, (GBP) |
355,035 |
| |
|
4,066,517 |
| |
United States — 12.2% | |
| 600,000 |
Digital Dutch Finco BV, 1.500%, 3/15/2030, (EUR) |
575,408 |
| 300,000 |
Digital Intrepid Holding BV, 0.625%, 7/15/2031, (EUR) |
259,619 |
| 200,000 |
DTE Electric Co., 3.950%, 3/01/2049 |
168,032 |
| 500,000 |
Equinix, Inc., 0.250%, 3/15/2027, (EUR) |
502,010 |
| 400,000 |
Ford Motor Co., 3.250%, 2/12/2032 |
332,681 |
| 500,000 |
General Motors Co., 5.400%, 10/15/2029 |
508,900 |
| 200,000 |
Johnson Controls International PLC, 4.250%, 5/23/2035, (EUR) |
234,070 |
| 400,000 |
Southern Power Co., 4.150%, 12/01/2025 |
393,942 |
| 300,000 |
Stellantis NV, EMTN, 4.375%, 3/14/2030, (EUR) |
349,674 |
| 200,000 |
Thermo Fisher Scientific, Inc., 4.100%, 8/15/2047 |
178,572 |
| 700,000 |
Verizon Communications, Inc., 3.875%, 2/08/2029 |
678,637 |
| 600,000 |
Wabtec Transportation Netherlands BV, 1.250%, 12/03/2027, (EUR) |
609,563 |
| |
|
4,791,108 |
| |
Total Bonds and Notes (Identified Cost $38,551,416) |
36,042,521 |
| | ||
| | ||
| Principal
Amount(‡) |
Description |
Value (†) |
| | ||
| Short-Term Investments — 1.0% | ||
| $386,876
|
Tri-Party Repurchase Agreement with Fixed Income Clearing Corporation, dated 12/29/2023 at 2.500% to be repurchased at $386,983 on 1/02/2024 collateralized by $441,300 U.S. Treasury Note, 0.500% due 4/30/2027 valued at $394,683 including accrued interest (Note 2 of Notes to Financial Statements) (Identified Cost $386,876) |
$386,876 |
| |
Total Investments — 92.8% (Identified Cost $38,938,292) |
36,429,397 |
| |
Other assets less liabilities — 7.2% |
2,834,889 |
| |
Net Assets — 100.0% |
$39,264,286 |
| (†) |
See Note 2 of Notes to Financial Statements. |
| (‡) |
Principal Amount stated in U.S. dollars unless otherwise noted. |
| (a)
|
Interest rate represents annualized yield at time of purchase; not a
coupon rate. The Fund’s investment in this security is comprised of
various lots with differing annualized yields. |
| (b)
|
All or a portion of these securities are exempt from registration
under Rule 144A of the Securities Act of 1933. These securities may
be resold in transactions exempt from registration, normally to
qualified institutional buyers. At December 31, 2023, the value of
Rule 144A holdings amounted to $1,223,834 or 3.1% of net assets. |
| (c)
|
Interest rate represents annualized yield at time of purchase; not a
coupon rate. |
| (d)
|
Perpetual bond with no specified maturity date. |
| EMTN
|
Euro
Medium Term Note |
| GMTN
|
Global Medium Term Note |
| CAD
|
Canadian Dollar |
| EUR
|
Euro |
| GBP
|
British Pound |
| Financial Futures |
Expiration
Date |
Contracts |
Notional
Amount |
Value |
Unrealized Appreciation
(Depreciation) |
| Eurex 10 Year Euro BUND Futures |
3/07/2024 |
5 |
$726,178
|
$757,420
|
$31,242
|
| Eurex 30 Year Euro BUXL Futures |
3/07/2024 |
5 |
708,736 |
782,259 |
73,523 |
| Eurex 5 Year Euro BOBL Futures |
3/07/2024 |
7 |
899,267 |
921,754 |
22,487 |
| Montreal Exchange 10 Year Canadian Bond Futures |
3/19/2024 |
10 |
892,230 |
937,172 |
44,942 |
| Total |
|
|
|
|
$172,194 |
| Financial Futures |
Expiration
Date |
Contracts |
Notional
Amount |
Value |
Unrealized Appreciation
(Depreciation) |
| CME British Pound Currency Futures |
3/18/2024 |
31 |
$2,446,375
|
$2,470,506
|
$(24,131
) |
| CME Canadian Dollar Currency Futures |
3/19/2024 |
4 |
293,664 |
302,500 |
(8,836 ) |
| CME Euro Foreign Exchange Currency Futures |
3/18/2024 |
192 |
26,357,462 |
26,580,000 |
(222,538 ) |
| Total |
|
|
|
|
$(255,505 ) |
| Government National |
19.3 % |
| Utility-Electric |
18.8 |
| Industrial |
16.5 |
| Financial |
9.3 |
| Bank |
9.1 |
| Special Purpose |
6.3 |
| Supra-National |
6.0 |
| Telephone |
2.5 |
| Other Investments, less than 2% each |
4.0 |
| Short-Term Investments |
1.0 |
| Total Investments |
92.8 |
| Other assets less liabilities (including futures contracts) |
7.2 |
| Net Assets |
100.0 % |
| Euro |
67.6 % |
| United States Dollar |
18.3 |
| British Pound |
6.8 |
| Canadian Dollar |
0.1 |
| Total Investments |
92.8 |
| Other assets less liabilities (including futures contracts) |
7.2 |
| Net Assets |
100.0 % |
| Shares |
Description |
Value (†) |
| Common Stocks — 97.5% of Net Assets | ||
| |
Belgium — 0.9% | |
| 150,684 |
KBC Group NV |
$9,779,293 |
| |
Denmark — 7.1% | |
| 410,660 |
Novo Nordisk AS, Class B |
42,557,170 |
| 970,827 |
Vestas Wind Systems AS(a) |
30,718,624 |
| |
|
73,275,794 |
| |
France — 4.1% | |
| 82,979 |
Air Liquide SA |
16,155,632 |
| 527,732 |
Credit Agricole SA |
7,502,583 |
| 91,557 |
EssilorLuxottica SA |
18,384,528 |
| |
|
42,042,743 |
| |
Germany — 5.2% | |
| 217,905 |
Mercedes-Benz Group AG, (Registered) |
15,034,967 |
| 107,388 |
SAP SE |
16,529,325 |
| 205,882 |
Symrise AG |
22,625,509 |
| |
|
54,189,801 |
| |
Hong Kong — 1.9% | |
| 2,255,811 |
AIA Group Ltd. |
19,632,050 |
| |
Japan — 4.9% | |
| 838,903 |
Sekisui House Ltd. |
18,595,298 |
| 604,995 |
Takeda Pharmaceutical Co. Ltd. |
17,350,062 |
| 441,588 |
Terumo Corp. |
14,440,374 |
| |
|
50,385,734 |
| |
Netherlands — 3.6% | |
| 13,093 |
Adyen NV(a) |
16,902,292 |
| 26,286 |
ASML Holding NV |
19,842,972 |
| |
|
36,745,264 |
| |
Spain — 3.2% | |
| 2,524,932 |
Iberdrola SA |
33,118,984 |
| |
Taiwan — 2.6% | |
| 259,640 |
Taiwan Semiconductor Manufacturing Co. Ltd., ADR |
27,002,560 |
| |
United Kingdom — 3.3% | |
| 77,573 |
AstraZeneca PLC |
10,463,810 |
| 4,369,439 |
Legal & General Group PLC |
13,963,364 |
| 191,631 |
Unilever PLC |
9,287,861 |
| |
|
33,715,035 |
| |
United States — 60.7% | |
| 78,820 |
Adobe, Inc.(a) |
47,024,012 |
| 113,808 |
AGCO Corp. |
13,817,429 |
| 89,422 |
American Water Works Co., Inc. |
11,802,810 |
| 262,642 |
Aptiv PLC(a) |
23,564,240 |
| 286,624 |
Ball Corp. |
16,486,613 |
| 114,935 |
Danaher Corp. |
26,589,063 |
| 866,202 |
eBay, Inc. |
37,783,731 |
| 190,084 |
Ecolab, Inc. |
37,703,161 |
| 85,141 |
Edwards Lifesciences Corp.(a) |
6,492,001 |
| 58,584 |
Eli Lilly & Co. |
34,149,785 |
| 56,407 |
Enphase Energy, Inc.(a) |
7,453,621 |
| 66,135 |
Estee Lauder Cos., Inc., Class A |
9,672,244 |
| 39,000 |
Intuitive Surgical, Inc.(a) |
13,157,040 |
| 118,039 |
Mastercard, Inc., Class A |
50,344,814 |
| 128,073 |
Microsoft Corp. |
48,160,571 |
| 389,193 |
NextEra Energy, Inc. |
23,639,583 |
| 90,626 |
NVIDIA Corp. |
44,879,808 |
| 36,246 |
Palo Alto Networks, Inc.(a) |
10,688,220 |
| 68,226 |
Roper Technologies, Inc. |
37,194,768 |
| Shares |
Description |
Value (†) |
| |
United States — continued | |
| 77,987 |
Thermo Fisher Scientific, Inc. |
$41,394,720
|
| 38,311 |
Veralto Corp. |
3,151,463 |
| 120,080 |
Visa, Inc., Class A |
31,262,828 |
| 88,877 |
Waste Management, Inc. |
15,917,871 |
| 69,016 |
Watts Water Technologies, Inc., Class A |
14,378,793 |
| 183,843 |
Xylem, Inc. |
21,024,286 |
| |
|
627,733,475 |
| |
Total Common Stocks (Identified Cost $926,206,078) |
1,007,620,733 |
| Principal
Amount |
|
|
| Short-Term Investments — 2.0% | ||
| $20,738,996
|
Tri-Party Repurchase Agreement with Fixed Income Clearing Corporation, dated 12/29/2023
at 2.500% to be repurchased at $20,744,757 on 1/02/2024 collateralized by $6,016,800 U.S. Treasury Note, 0.500% due 4/30/2027 valued at $5,381,216; $15,492,000 U.S. Treasury Note, 4.125% due 9/30/2027 valued at $15,772,594 including accrued interest (Note 2 of Notes to Financial Statements) (Identified Cost $20,738,996) |
20,738,996 |
| |
Total Investments — 99.5% (Identified Cost $946,945,074) |
1,028,359,729 |
| |
Other assets less liabilities — 0.5% |
5,356,297 |
| |
Net Assets — 100.0% |
$1,033,716,026 |
| (†) |
See Note 2 of Notes to Financial Statements. |
| (a)
|
Non-income producing security. |
| ADR
|
An
American Depositary Receipt is a certificate issued by a custodian bank representing
the right to receive securities of the foreign issuer described. The values of ADRs
may be significantly influenced by trading on exchanges not located in the
United States. |
| Software |
15.5 % |
| Pharmaceuticals |
10.1 |
| Financial Services |
9.6 |
| Semiconductors & Semiconductor Equipment |
9.5 |
| Chemicals |
7.5 |
| Life Sciences Tools & Services |
6.6 |
| Electric Utilities |
5.5 |
| Health Care Equipment & Supplies |
5.1 |
| Machinery |
4.7 |
| Broadline Retail |
3.7 |
| Insurance |
3.3 |
| Electrical Equipment |
3.0 |
| Automobile Components |
2.3 |
| Other Investments, less than 2% each |
11.1 |
| Short-Term Investments |
2.0 |
| Total Investments |
99.5 |
| Other assets less liabilities |
0.5 |
| Net Assets |
100.0 % |
| United States Dollar |
65.3 % |
| Euro |
17.9 |
| Danish Krone |
7.1 |
| Japanese Yen |
4.9 |
| British Pound |
2.4 |
| Hong Kong Dollar |
1.9 |
| Total Investments |
99.5 |
| Other assets less liabilities |
0.5 |
| Net Assets |
100.0 % |
| Shares |
Description |
Value (†) |
| Common Stocks — 93.5% of Net Assets | ||
| |
Australia — 1.2% | |
| 63,759 |
Stockland |
$193,358 |
| |
Belgium — 4.7% | |
| 10,054 |
KBC Group NV |
652,498 |
| 4,240 |
Umicore SA |
116,630 |
| |
|
769,128 |
| |
Denmark — 8.5% | |
| 7,158 |
Novo Nordisk AS, Class B |
741,792 |
| 19,866 |
Vestas Wind Systems AS(a) |
628,594 |
| |
|
1,370,386 |
| |
France — 13.9% | |
| 3,077 |
Air Liquide SA |
599,078 |
| 24,472 |
Credit Agricole SA |
347,910 |
| 7,289 |
Dassault Systemes SE |
356,777 |
| 1,627 |
EssilorLuxottica SA |
326,699 |
| 1,255 |
L'Oreal SA |
625,618 |
| |
|
2,256,082 |
| |
Germany — 10.2% | |
| 7,223 |
Mercedes-Benz Group AG, (Registered) |
498,371 |
| 4,180 |
SAP SE |
643,392 |
| 4,581 |
Symrise AG |
503,431 |
| |
|
1,645,194 |
| |
Hong Kong — 3.1% | |
| 57,716 |
AIA Group Ltd. |
502,295 |
| |
Ireland — 5.1% | |
| 6,567 |
Kingspan Group PLC |
567,555 |
| 6,469 |
Smurfit Kappa Group PLC |
256,435 |
| |
|
823,990 |
| |
Japan — 12.6% | |
| 3,000 |
Kao Corp. |
123,317 |
| 33,600 |
Kubota Corp. |
504,268 |
| 15,048 |
Sekisui House Ltd. |
333,557 |
| 2,000 |
Shimano, Inc. |
308,088 |
| 12,138 |
Takeda Pharmaceutical Co. Ltd. |
348,094 |
| 9,700 |
Terumo Corp. |
317,200 |
| 2,700 |
West Japan Railway Co. |
112,505 |
| |
|
2,047,029 |
| |
Netherlands — 7.5% | |
| 306 |
Adyen NV(a) |
395,028 |
| 1,092 |
ASML Holding NV |
824,337 |
| |
|
1,219,365 |
| |
Norway — 0.4% | |
| 5,931 |
Telenor ASA |
68,068 |
| |
Spain — 3.9% | |
| 48,431 |
Iberdrola SA |
635,259 |
| |
Switzerland — 2.9% | |
| 731 |
Geberit AG, (Registered) |
469,242 |
| |
Taiwan — 4.8% | |
| 7,498 |
Taiwan Semiconductor Manufacturing Co. Ltd., ADR |
779,792 |
| |
United Kingdom — 13.4% | |
| 1,151 |
AstraZeneca PLC |
155,258 |
| 6,923 |
Croda International PLC |
445,315 |
| 14,785 |
Halma PLC |
429,887 |
| 4,820 |
Johnson Matthey PLC |
104,247 |
| 22,227 |
Land Securities Group PLC |
199,474 |
| Shares |
Description |
Value (†) |
| |
United Kingdom — continued | |
| 180,535 |
Legal & General Group PLC |
$576,933
|
| 5,301 |
Unilever PLC |
256,926 |
| |
|
2,168,040 |
| |
United States — 1.3% | |
| 2,148 |
Sanofi SA |
213,453 |
| |
Total Common Stocks (Identified Cost $15,496,092) |
15,160,681 |
| Principal
Amount |
|
|
| Short-Term Investments — 4.0% | ||
| $650,074
|
Tri-Party Repurchase Agreement with Fixed Income Clearing Corporation, dated 12/29/2023 at 2.500% to be repurchased at $650,255 on 1/02/2024 collateralized by $651,300 U.S. Treasury Note, 4.125% due 9/30/2027 valued at $663,096 including accrued interest (Note 2 of Notes to Financial Statements) (Identified Cost $650,074) |
650,074 |
| |
Total Investments — 97.5% (Identified Cost $16,146,166) |
15,810,755 |
| |
Other assets less liabilities — 2.5% |
397,726 |
| |
Net Assets — 100.0% |
$16,208,481 |
| (†) |
See Note 2 of Notes to Financial Statements. |
| (a)
|
Non-income producing security. |
| ADR
|
An
American Depositary Receipt is a certificate issued by a custodian bank representing
the right to receive securities of the foreign issuer described. The values of ADRs
may be significantly influenced by trading on exchanges not located in the
United States. |
| Chemicals |
10.8 % |
| Semiconductors & Semiconductor Equipment |
9.9 |
| Pharmaceuticals |
9.0 |
| Insurance |
6.7 |
| Building Products |
6.4 |
| Personal Care Products |
6.3 |
| Software |
6.2 |
| Banks |
6.1 |
| Health Care Equipment & Supplies |
3.9 |
| Electric Utilities |
3.9 |
| Electrical Equipment |
3.9 |
| Machinery |
3.1 |
| Automobiles |
3.1 |
| Electronic Equipment, Instruments & Components |
2.7 |
| Financial Services |
2.4 |
| Diversified REITs |
2.4 |
| Household Durables |
2.1 |
| Other Investments, less than 2% each |
4.6 |
| Short-Term Investments |
4.0 |
| Total Investments |
97.5 |
| Other assets less liabilities |
2.5 |
| Net Assets |
100.0 % |
| Euro |
48.2 % |
| Japanese Yen |
12.6 |
| British Pound |
11.8 |
| United States Dollar |
8.8 |
| Danish Krone |
8.5 |
| Hong Kong Dollar |
3.1 |
| Swiss Franc |
2.9 |
| Other, less than 2% each |
1.6 |
| Total Investments |
97.5 |
| Other assets less liabilities |
2.5 |
| Net Assets |
100.0 % |
| |
Gateway Fund |
Gateway Equity Call Premium
Fund |
Mirova Global Green Bond
Fund |
| ASSETS |
|
|
|
| Investments at cost |
$2,169,122,139
|
$201,777,241
|
$38,938,292
|
| Net unrealized appreciation (depreciation) |
4,402,645,834 |
73,920,119 |
(2,508,895 ) |
| Investments at value |
6,571,767,973 |
275,697,360 |
36,429,397 |
| Cash |
15,819 |
779 |
— |
| Due from brokers (including variation margin on futures contracts) (Note 2) |
— |
— |
976,235 |
| Foreign currency at value (identified cost $0, $0 and $1,614,508, respectively) |
— |
— |
1,671,992 |
| Receivable for Fund shares sold |
8,939,812 |
229,089 |
41,852 |
| Receivable from investment adviser (Note 6) |
— |
— |
23,667 |
| Receivable for securities sold |
9,476,179 |
396,707 |
— |
| Dividends and interest receivable |
4,960,720 |
250,666 |
322,862 |
| Unrealized appreciation on futures contracts (Note 2) |
— |
— |
172,194 |
| Tax reclaims receivable |
— |
208 |
— |
| Prepaid expenses (Note 8) |
2,098 |
637 |
597 |
| TOTAL ASSETS |
6,595,162,601 |
276,575,446 |
39,638,796 |
| LIABILITIES |
|
|
|
| Options written, at value (premiums received $80,730,872, $3,377,436 and $0, respectively) (Note 2) |
132,505,730 |
5,550,885 |
— |
| Payable for Fund shares redeemed |
5,331,562 |
270,873 |
10,447 |
| Unrealized depreciation on futures contracts (Note 2) |
— |
— |
255,505 |
| Management fees payable (Note 6) |
2,966,240 |
87,782 |
— |
| Deferred Trustees’ fees (Note 6) |
1,281,249 |
62,534 |
25,929 |
| Administrative fees payable (Note 6) |
251,236 |
10,438 |
1,527 |
| Payable to distributor (Note 6d) |
48,029 |
2,244 |
307 |
| Audit and tax services fees payable |
56,411 |
55,323 |
46,643 |
| Other accounts payable and accrued expenses |
428,022 |
44,711 |
34,152 |
| TOTAL LIABILITIES |
142,868,479 |
6,084,790 |
374,510 |
| COMMITMENTS AND
CONTINGENCIES(a) |
— |
— |
— |
| NET ASSETS |
$6,452,294,122 |
$270,490,656 |
$39,264,286 |
| NET ASSETS CONSIST OF: |
|
|
|
| Paid-in capital |
$3,151,172,051
|
$219,608,132
|
$46,609,303
|
| Accumulated earnings (loss) |
3,301,122,071 |
50,882,524 |
(7,345,017 ) |
| NET ASSETS |
$6,452,294,122 |
$270,490,656 |
$39,264,286 |
| |
Gateway Fund |
Gateway Equity Call Premium
Fund |
Mirova Global Green Bond
Fund |
| COMPUTATION OF NET ASSET VALUE AND OFFERING PRICE: |
|
|
|
| Class A shares: |
|
|
|
| Net assets |
$778,972,832 |
$2,072,873 |
$5,230,253 |
| Shares of beneficial interest |
19,272,807 |
121,859 |
615,226 |
| Net asset value and redemption price per share |
$40.42 |
$17.01 |
$8.50 |
| Offering price per share (100/[100-maximum sales charge] of net asset value) (Note 1) |
$42.89 |
$18.05 |
$8.88 |
| Class C shares:
(redemption price per share is equal to net asset value less any applicable
contingent deferred sales charge) (Note 1) |
|
|
|
| Net assets |
$61,729,872 |
$1,130,033 |
$— |
| Shares of beneficial interest |
1,542,579 |
67,138 |
— |
| Net asset value and offering price per share |
$40.02 |
$16.83 |
$— |
| Class N shares: |
|
|
|
| Net assets |
$540,446,292 |
$255,137 |
$7,044,707 |
| Shares of beneficial interest |
13,381,977 |
15,026 |
823,968 |
| Net asset value, offering and redemption price per share |
$40.39 |
$16.98 |
$8.55 |
| Class Y shares: |
|
|
|
| Net assets |
$5,071,145,126 |
$267,032,613 |
$26,989,326 |
| Shares of beneficial interest |
125,586,217 |
15,714,345 |
3,161,057 |
| Net asset value, offering and redemption price per share |
$40.38 |
$16.99 |
$8.54 |
| (a) |
As disclosed in the Notes to Financial Statements, if applicable. |
| |
Mirova Global Sustainable
Equity Fund |
Mirova International
Sustainable Equity Fund |
| ASSETS |
|
|
| Investments at cost |
$946,945,074
|
$16,146,166
|
| Net unrealized appreciation (depreciation) |
81,414,655 |
(335,411 ) |
| Investments at value |
1,028,359,729 |
15,810,755 |
| Foreign currency at value (identified cost $4,556,011 and $385,650, respectively)
|
4,623,917 |
400,940 |
| Receivable for Fund shares sold |
1,210,492 |
2,062 |
| Receivable from investment adviser (Note 6) |
— |
3,376 |
| Dividends and interest receivable |
273,796 |
18,312 |
| Tax reclaims receivable |
648,238 |
67,189 |
| Prepaid expenses (Note 8) |
812 |
591 |
| TOTAL ASSETS |
1,035,116,984 |
16,303,225 |
| LIABILITIES |
|
|
| Payable for Fund shares redeemed |
489,782 |
13,177 |
| Management fees payable (Note 6) |
671,012 |
— |
| Deferred Trustees’ fees (Note 6) |
58,812 |
17,353 |
| Administrative fees payable (Note 6) |
40,359 |
615 |
| Payable to distributor (Note 6d) |
8,574 |
20 |
| Audit and tax services fees payable |
46,013 |
46,207 |
| Other accounts payable and accrued expenses |
86,406 |
17,372 |
| TOTAL LIABILITIES |
1,400,958 |
94,744 |
| COMMITMENTS AND
CONTINGENCIES(a) |
— |
— |
| NET ASSETS |
$1,033,716,026 |
$16,208,481 |
| NET ASSETS CONSIST OF: |
|
|
| Paid-in capital |
$988,713,021
|
$17,667,410
|
| Accumulated earnings (loss) |
45,003,005 |
(1,458,929 ) |
| NET ASSETS |
$1,033,716,026 |
$16,208,481 |
| COMPUTATION OF NET ASSET VALUE AND OFFERING PRICE: |
|
|
| Class A shares: |
|
|
| Net assets |
$30,524,749 |
$601,165 |
| Shares of beneficial interest |
1,701,429 |
50,735 |
| Net asset value and redemption price per share |
$17.94 |
$11.85 |
| Offering price per share (100/94.25 of net asset value) (Note 1) |
$19.03 |
$12.57 |
| Class C shares:
(redemption price per share is equal to net asset value less any applicable contingent deferred sales
charge) (Note 1) |
|
|
| Net assets |
$10,786,088 |
$— |
| Shares of beneficial interest |
634,744 |
— |
| Net asset value and offering price per share |
$16.99 |
$— |
| Class N shares: |
|
|
| Net assets |
$239,009,254 |
$10,540,208 |
| Shares of beneficial interest |
13,200,074 |
885,440 |
| Net asset value, offering and redemption price per share |
$18.11 |
$11.90 |
| Class Y shares: |
|
|
| Net assets |
$753,395,935 |
$5,067,108 |
| Shares of beneficial interest |
41,611,516 |
426,303 |
| Net asset value, offering and redemption price per share |
$18.11 |
$11.89 |
| (a) |
As disclosed in the Notes to Financial Statements, if applicable. |
| |
Gateway Fund |
Gateway Equity Call Premium
Fund |
Mirova Global Green Bond
Fund |
| INVESTMENT
INCOME |
|
|
|
| Dividends |
$100,788,894
|
$3,820,624
|
$—
|
| Interest |
3,188,626 |
151,546 |
919,422 |
| Less net foreign taxes withheld |
(222,973 ) |
(12,707 ) |
— |
| |
103,754,547 |
3,959,463 |
919,422 |
| Expenses |
|
|
|
| Management fees (Note 6) |
37,243,672 |
1,331,624 |
185,382 |
| Service and distribution fees (Note 6) |
2,725,663 |
15,473 |
12,757 |
| Administrative fees (Note 6) |
2,925,931 |
106,333 |
17,176 |
| Trustees' fees and expenses (Note 6) |
366,164 |
30,489 |
19,665 |
| Transfer agent fees and expenses (Notes 6 and 7) |
4,384,465 |
185,663 |
30,580 |
| Audit and tax services fees |
56,827 |
55,380 |
46,647 |
| Custodian fees and expenses |
212,918 |
76,954 |
11,020 |
| Interest expense (Note 10) |
— |
— |
10,346 |
| Legal fees |
232,695 |
8,153 |
1,385 |
| Registration fees |
154,959 |
75,358 |
54,939 |
| Regulatory filing fees |
13,000 |
13,000 |
13,000 |
| Shareholder reporting expenses |
304,884 |
21,402 |
12,117 |
| Miscellaneous expenses |
215,053 |
30,074 |
22,491 |
| Total expenses |
48,836,231 |
1,949,903 |
437,505 |
| Less waiver and/or expense reimbursement (Note 6) |
(2,182,135 ) |
(373,333 ) |
(176,421 ) |
| Net expenses |
46,654,096 |
1,576,570 |
261,084 |
| Net investment income |
57,100,451 |
2,382,893 |
658,338 |
| Net realized and unrealized gain (loss) on Investments, Futures contracts, Options written and Foreign currency transactions |
|
|
|
| Net realized gain (loss) on: |
|
|
|
| Investments |
284,286,874 |
(2,937,248 ) |
(594,031 ) |
| Futures contracts |
— |
— |
(1,060,036 ) |
| Options written |
(277,552,151 ) |
(9,998,985 ) |
— |
| Foreign currency transactions (Note 2c) |
3,878 |
276 |
(28,585 ) |
| Net change in unrealized appreciation (depreciation) on: |
|
|
|
| Investments |
929,634,167 |
48,948,109 |
3,652,855 |
| Futures contracts |
— |
— |
505,865 |
| Options written |
(125,271,660 ) |
(3,846,143 ) |
— |
| Foreign currency translations (Note 2c) |
420 |
71 |
14,900 |
| Net realized and unrealized gain on Investments, Futures contracts, Options written and Foreign
currency transactions |
811,101,528 |
32,166,080 |
2,490,968 |
| NET INCREASE IN NET ASSETS RESULTING FROM OPERATIONS |
$868,201,979 |
$34,548,973 |
$3,149,306 |
| |
Mirova Global Sustainable
Equity Fund |
Mirova International
Sustainable Equity Fund |
| INVESTMENT
INCOME |
|
|
| Dividends |
$14,814,492
|
$286,285
|
| Non-cash dividends (Note 2b) |
1,392,835 |
17,594 |
| Interest |
308,480 |
8,779 |
| Less net foreign taxes withheld |
(1,218,231 ) |
(10,299 ) |
| |
15,297,576 |
302,359 |
| Expenses |
|
|
| Management fees (Note 6) |
7,814,183 |
97,770 |
| Service and distribution fees (Note 6) |
184,249 |
1,574 |
| Administrative fees (Note 6) |
452,405 |
5,660 |
| Trustees' fees and expenses (Note 6) |
59,482 |
17,997 |
| Transfer agent fees and expenses (Notes 6 and 7) |
788,582 |
5,879 |
| Audit and tax services fees |
46,404 |
46,205 |
| Custodian fees and expenses |
57,407 |
12,263 |
| Interest expense (Note 10) |
625 |
— |
| Legal fees |
34,986 |
286 |
| Registration fees |
80,333 |
52,015 |
| Regulatory filing fees |
13,000 |
13,000 |
| Shareholder reporting expenses |
63,270 |
6,994 |
| Miscellaneous expenses |
45,313 |
24,475 |
| Total expenses |
9,640,239 |
284,118 |
| Less waiver and/or expense reimbursement (Note 6) |
(311,556 ) |
(170,813 ) |
| Net expenses |
9,328,683 |
113,305 |
| Net investment income |
5,968,893 |
189,054 |
| Net realized and unrealized gain (loss) on Investments and Foreign currency transactions |
|
|
| Net realized gain (loss) on: |
|
|
| Investments |
(22,006,499 ) |
(866,496 ) |
| Foreign currency transactions (Note 2c) |
35,769 |
15,374 |
| Net change in unrealized appreciation (depreciation) on: |
|
|
| Investments |
180,613,193 |
2,255,820 |
| Foreign currency translations (Note 2c) |
(65,508 ) |
14,422 |
| Net realized and unrealized gain on investments and foreign currency transactions
|
158,576,955 |
1,419,120 |
| NET INCREASE IN NET ASSETS RESULTING FROM OPERATIONS |
$164,545,848 |
$1,608,174 |
| |
Gateway
Fund |
Gateway
Equity Call Premium Fund | ||
| |
Year Ended December 31,2023 |
Year Ended December 31,2022 |
Year Ended December 31,2023 |
Year Ended December 31,2022 |
| FROM OPERATIONS: |
|
|
|
|
| Net investment income |
$57,100,451
|
$58,057,127
|
$2,382,893
|
$1,223,336
|
| Net realized gain (loss) on investments, written options and foreign currency
transactions |
6,738,601 |
653,165,363 |
(12,935,957 ) |
7,304,108 |
| Net change in unrealized appreciation (depreciation) on investments, written
options and foreign currency translations |
804,362,927 |
(1,694,070,079 ) |
45,102,037 |
(23,561,048 ) |
| Net increase (decrease) in net assets resulting from operations |
868,201,979 |
(982,847,589 ) |
34,548,973 |
(15,033,604 ) |
| FROM DISTRIBUTIONS TO SHAREHOLDERS: |
|
|
|
|
| Class A |
(5,628,870 ) |
(5,738,007 ) |
(14,160 ) |
(12,362 ) |
| Class C |
(35,832 ) |
— |
(383 ) |
(601 ) |
| Class N |
(4,248,718 ) |
(4,134,252 ) |
(2,435 ) |
(2,287 ) |
| Class Y |
(47,085,481 ) |
(48,176,662 ) |
(2,318,924 ) |
(1,235,232 ) |
| Total distributions |
(56,998,901 ) |
(58,048,921 ) |
(2,335,902 ) |
(1,250,482 ) |
| NET INCREASE (DECREASE) IN NET ASSETS FROM CAPITAL
SHARES TRANSACTIONS (Note 12)
|
(696,948,462 ) |
(805,606,549 ) |
98,867,789 |
49,826,241 |
| Net increase (decrease) in net assets |
114,254,616 |
(1,846,503,059 ) |
131,080,860 |
33,542,155 |
| NET ASSETS |
|
|
|
|
| Beginning of the year |
6,338,039,506 |
8,184,542,565 |
139,409,796 |
105,867,641 |
| End of the year |
$6,452,294,122 |
$6,338,039,506 |
$270,490,656 |
$139,409,796 |
| |
Mirova
Global Green Bond Fund |
Mirova
Global Sustainable Equity Fund | ||
| |
Year Ended December 31,2023 |
Year Ended December 31,2022 |
Year Ended December 31,2023 |
Year Ended December 31,2022 |
| FROM OPERATIONS: |
|
|
|
|
| Net investment income |
$658,338
|
$431,422
|
$5,968,893
|
$7,173,189
|
| Net realized loss on investments, futures contracts and foreign currency
transactions |
(1,682,652 ) |
(2,248,824 ) |
(21,970,730 ) |
(14,129,688 ) |
| Net change in unrealized appreciation (depreciation) on investments, futures
contracts and foreign currency translations |
4,173,620 |
(5,752,912 ) |
180,547,685 |
(261,591,166 ) |
| Net increase (decrease) in net assets resulting from operations |
3,149,306 |
(7,570,314 ) |
164,545,848 |
(268,547,665 ) |
| FROM DISTRIBUTIONS TO SHAREHOLDERS: |
|
|
|
|
| Class A |
(102,967 ) |
(308,314 ) |
(114,468 ) |
(1,656,969 ) |
| Class C |
— |
— |
(7,207 ) |
(629,720 ) |
| Class N |
(155,506 ) |
(298,746 ) |
(1,592,541 ) |
(10,372,579 ) |
| Class Y |
(592,982 ) |
(1,496,052 ) |
(4,579,840 ) |
(35,564,616 ) |
| Total distributions |
(851,455 ) |
(2,103,112 ) |
(6,294,056 ) |
(48,223,884 ) |
| NET INCREASE (DECREASE) IN NET ASSETS FROM CAPITAL
SHARES TRANSACTIONS (Note 12)
|
1,351,141 |
(1,836,354 ) |
8,031,826 |
63,521,966 |
| Net increase (decrease) in net assets |
3,648,992 |
(11,509,780 ) |
166,283,618 |
(253,249,583 ) |
| NET ASSETS |
|
|
|
|
| Beginning of the year |
35,615,294 |
47,125,074 |
867,432,408 |
1,120,681,991 |
| End of the year |
$39,264,286 |
$35,615,294 |
$1,033,716,026 |
$867,432,408 |
| |
Mirova
International Sustainable Equity Fund | |
| |
Year Ended December 31,2023 |
Year Ended December 31,2022 |
| FROM OPERATIONS: |
|
|
| Net investment income |
$189,054
|
$377,279
|
| Net realized loss on investments and foreign currency transactions |
(851,122 ) |
(67,647 ) |
| Net change in unrealized appreciation (depreciation) on investments and foreign currency
translations |
2,270,242 |
(8,262,669 ) |
| Net increase (decrease) in net assets resulting from operations |
1,608,174 |
(7,953,037 ) |
| FROM DISTRIBUTIONS TO SHAREHOLDERS: |
|
|
| Class A |
(6,318 ) |
(25,462 ) |
| Class N |
(138,982 ) |
(273,620 ) |
| Class Y |
(61,156 ) |
(29,504 ) |
| Total distributions |
(206,456 ) |
(328,586 ) |
| NET INCREASE (DECREASE) IN NET ASSETS FROM CAPITAL
SHARES TRANSACTIONS (Note 12)
|
5,848,519 |
(12,492,079 ) |
| Net increase (decrease) in net assets |
7,250,237 |
(20,773,702 ) |
| NET ASSETS |
|
|
| Beginning of the year |
8,958,244 |
29,731,946 |
| End of the year |
$16,208,481 |
$8,958,244 |
| |
Gateway
Fund—Class A | ||||
| |
Year Ended December 31,
2023 |
Year Ended December 31,
2022 |
Year Ended December 31,
2021 |
Year Ended December 31,
2020 |
Year Ended December 31,
2019 |
| Net asset value, beginning of the period |
$35.57 |
$40.70 |
$36.76 |
$34.69 |
$31.65 |
| INCOME (LOSS) FROM INVESTMENT OPERATIONS: |
|
|
|
|
|
| Net investment income(a) |
0.27 |
0.22 |
0.18 |
0.30 |
0.37 |
| Net realized and unrealized gain (loss) |
4.85 |
(5.13 ) |
3.93 |
2.08 |
3.05 |
| Total from Investment Operations |
5.12 |
(4.91 ) |
4.11 |
2.38 |
3.42 |
| LESS DISTRIBUTIONS FROM: |
|
|
|
|
|
| Net investment income |
(0.27 ) |
(0.22 ) |
(0.17 ) |
(0.31 ) |
(0.38 ) |
| Net asset value, end of the period |
$40.42 |
$35.57 |
$40.70 |
$36.76 |
$34.69 |
| Total return(b)(c) |
14.43 % |
(12.06 )% |
11.24 % |
6.92 % |
10.84 % |
| RATIOS TO AVERAGE NET ASSETS: |
|
|
|
|
|
| Net assets, end of the period (000's) |
$778,973
|
$869,122
|
$1,073,713
|
$987,702
|
$1,125,464
|
| Net expenses(d) |
0.94 %(e) |
0.93 %(f) |
0.94 %(f) |
0.94 % |
0.94 % |
| Gross expenses |
0.98 %(e) |
0.96 %(f) |
0.98 %(f) |
1.02 % |
1.01 % |
| Net investment income |
0.71 % |
0.60 % |
0.46 % |
0.88 % |
1.12 % |
| Portfolio turnover rate |
18 % |
16 % |
11 % |
22 % |
12 % |
| (a) |
Per share net investment income has been calculated using the average shares outstanding during the period. |
| (b) |
A sales charge for Class A shares is not reflected in total return calculations. |
| (c) |
Had certain expenses not been waived/reimbursed during the period, total returns would have been lower. |
| (d) |
The investment adviser agreed to waive its fees and/or reimburse a portion of the Fund’s expenses during the period. Without this waiver/reimbursement, expenses
would have been higher. |
| (e) |
Includes refund of prior year service fee of less than 0.01%. See Note 6b of Notes to Financial Statements. |
| (f) |
Includes refund of prior year service fee of 0.01%. |
| |
Gateway
Fund—Class C | ||||
| |
Year Ended December 31,
2023 |
Year Ended December 31,
2022 |
Year Ended December 31,
2021 |
Year Ended December 31,
2020 |
Year Ended December 31,
2019 |
| Net asset value, beginning of the period |
$35.26 |
$40.41 |
$36.60 |
$34.54 |
$31.50 |
| INCOME (LOSS) FROM INVESTMENT OPERATIONS: |
|
|
|
|
|
| Net investment income (loss)(a) |
(0.02 ) |
(0.06 ) |
(0.11 ) |
0.04 |
0.12 |
| Net realized and unrealized gain (loss) |
4.80 |
(5.09 ) |
3.92 |
2.07 |
3.03 |
| Total from Investment Operations |
4.78 |
(5.15 ) |
3.81 |
2.11 |
3.15 |
| LESS DISTRIBUTIONS FROM: |
|
|
|
|
|
| Net investment income |
(0.02 ) |
— |
— |
(0.05 ) |
(0.11 ) |
| Net asset value, end of the period |
$40.02 |
$35.26 |
$40.41 |
$36.60 |
$34.54 |
| Total return(b)(c) |
13.56 % |
(12.74 )% |
10.41 % |
6.13 % |
10.02 % |
| RATIOS TO AVERAGE NET ASSETS: |
|
|
|
|
|
| Net assets, end of the period (000's) |
$61,730
|
$77,355
|
$114,019
|
$142,623
|
$215,947
|
| Net expenses(d) |
1.70 % |
1.70 % |
1.70 % |
1.70 % |
1.70 % |
| Gross expenses |
1.73 % |
1.71 % |
1.73 % |
1.77 % |
1.76 % |
| Net investment income (loss) |
(0.06 )% |
(0.17 )% |
(0.30 )% |
0.12 % |
0.37 % |
| Portfolio turnover rate |
18 % |
16 % |
11 % |
22 % |
12 % |
| (a) |
Per share net investment income (loss) has been calculated using the average shares outstanding during the period. |
| (b) |
A contingent deferred sales charge for Class C shares is not reflected in total return calculations. |
| (c) |
Had certain expenses not been waived/reimbursed during the period, total returns would have been lower. |
| (d) |
The investment adviser agreed to waive its fees and/or reimburse a portion of the Fund’s expenses during the period. Without this waiver/reimbursement, expenses
would have been higher. |
| |
Gateway
Fund—Class N | ||||
| |
Year Ended December 31,
2023 |
Year Ended December 31,
2022 |
Year Ended December 31,
2021 |
Year Ended December 31,
2020 |
Year Ended December 31,
2019 |
| Net asset value, beginning of the period |
$35.55 |
$40.68 |
$36.74 |
$34.68 |
$31.63 |
| INCOME (LOSS) FROM INVESTMENT OPERATIONS: |
|
|
|
|
|
| Net investment income(a) |
0.39 |
0.33 |
0.29 |
0.40 |
0.47 |
| Net realized and unrealized gain (loss) |
4.83 |
(5.13 ) |
3.94 |
2.07 |
3.06 |
| Total from Investment Operations |
5.22 |
(4.80 ) |
4.23 |
2.47 |
3.53 |
| LESS DISTRIBUTIONS FROM: |
|
|
|
|
|
| Net investment income |
(0.38 ) |
(0.33 ) |
(0.29 ) |
(0.41 ) |
(0.48 ) |
| Net asset value, end of the period |
$40.39 |
$35.55 |
$40.68 |
$36.74 |
$34.68 |
| Total return |
14.75 %(b) |
(11.80 )% |
11.57 %(b) |
7.25 %(b) |
11.17 %(b) |
| RATIOS TO AVERAGE NET ASSETS: |
|
|
|
|
|
| Net assets, end of the period (000's) |
$540,446
|
$378,377
|
$504,299
|
$369,829
|
$369,793
|
| Net expenses |
0.65 %(c) |
0.65 % |
0.65 %(c) |
0.65 %(c) |
0.65 %(c) |
| Gross expenses |
0.66 % |
0.65 % |
0.67 % |
0.70 % |
0.69 % |
| Net investment income |
1.00 % |
0.88 % |
0.74 % |
1.17 % |
1.40 % |
| Portfolio turnover rate |
18 % |
16 % |
11 % |
22 % |
12 % |
| (a) |
Per share net investment income has been calculated using the average shares outstanding during the period. |
| (b) |
Had certain expenses not been waived/reimbursed during the period, total returns would have been lower. |
| (c) |
The investment adviser agreed to waive its fees and/or reimburse a portion of the Fund’s expenses during the period. Without this waiver/reimbursement, expenses
would have been higher. |
| |
Gateway
Fund—Class Y | ||||
| |
Year Ended December 31,
2023 |
Year Ended December 31,
2022 |
Year Ended December 31,
2021 |
Year Ended December 31,
2020 |
Year Ended December 31,
2019 |
| Net asset value, beginning of the period |
$35.54 |
$40.67 |
$36.73 |
$34.67 |
$31.63 |
| INCOME (LOSS) FROM INVESTMENT OPERATIONS: |
|
|
|
|
|
| Net investment income(a) |
0.36 |
0.31 |
0.27 |
0.38 |
0.46 |
| Net realized and unrealized gain (loss) |
4.84 |
(5.13 ) |
3.94 |
2.07 |
3.04 |
| Total from Investment Operations |
5.20 |
(4.82 ) |
4.21 |
2.45 |
3.50 |
| LESS DISTRIBUTIONS FROM: |
|
|
|
|
|
| Net investment income |
(0.36 ) |
(0.31 ) |
(0.27 ) |
(0.39 ) |
(0.46 ) |
| Net asset value, end of the period |
$40.38 |
$35.54 |
$40.67 |
$36.73 |
$34.67 |
| Total return(b) |
14.70 % |
(11.85 )% |
11.49 % |
7.19 % |
11.12 % |
| RATIOS TO AVERAGE NET ASSETS: |
|
|
|
|
|
| Net assets, end of the period (000's) |
$5,071,145
|
$5,013,186
|
$6,492,511
|
$5,624,810
|
$6,446,007
|
| Net expenses(c) |
0.70 % |
0.70 % |
0.70 % |
0.70 % |
0.70 % |
| Gross expenses |
0.73 % |
0.71 % |
0.73 % |
0.77 % |
0.76 % |
| Net investment income |
0.94 % |
0.83 % |
0.70 % |
1.12 % |
1.37 % |
| Portfolio turnover rate |
18 % |
16 % |
11 % |
22 % |
12 % |
| (a) |
Per share net investment income has been calculated using the average shares outstanding during the period. |
| (b) |
Had certain expenses not been waived/reimbursed during the period, total returns would have been lower. |
| (c) |
The investment adviser agreed to waive its fees and/or reimburse a portion of the Fund’s expenses during the period. Without this waiver/reimbursement, expenses
would have been higher. |
| |
Gateway
Equity Call Premium Fund—Class A | ||||
| |
Year Ended December 31,
2023 |
Year Ended December 31,
2022 |
Year Ended December 31,
2021 |
Year Ended December 31,
2020 |
Year Ended December 31,
2019 |
| Net asset value, beginning of the period |
$14.60 |
$16.66 |
$14.03 |
$13.07 |
$11.32 |
| INCOME (LOSS) FROM INVESTMENT OPERATIONS: |
|
|
|
|
|
| Net investment income(a) |
0.12 |
0.10 |
0.07 |
0.09 |
0.10 |
| Net realized and unrealized gain (loss) |
2.41 |
(2.06 ) |
2.62 |
0.95 |
1.76 |
| Total from Investment Operations |
2.53 |
(1.96 ) |
2.69 |
1.04 |
1.86 |
| LESS DISTRIBUTIONS FROM: |
|
|
|
|
|
| Net investment income |
(0.12 ) |
(0.10 ) |
(0.06 ) |
(0.08 ) |
(0.11 ) |
| Net asset value, end of the period |
$17.01 |
$14.60 |
$16.66 |
$14.03 |
$13.07 |
| Total return(b)(c) |
17.35 % |
(11.77 )% |
19.20 % |
8.06 % |
16.46 % |
| RATIOS TO AVERAGE NET ASSETS: |
|
|
|
|
|
| Net assets, end of the period (000's) |
$2,073
|
$1,617
|
$2,613
|
$1,456
|
$2,363
|
| Net expenses(d) |
0.93 % |
0.93 % |
1.03 %(e)(f)
|
1.20 % |
1.20 % |
| Gross expenses |
1.09 % |
1.16 % |
1.20 % |
1.43 % |
1.42 % |
| Net investment income |
0.78 % |
0.66 % |
0.43 % |
0.69 % |
0.82 % |
| Portfolio turnover rate |
32 % |
11 % |
5 % |
15 % |
17 % |
| (a) |
Per share net investment income has been calculated using the average shares outstanding during the period. |
| (b) |
A sales charge for Class A shares is not reflected in total return calculations. |
| (c) |
Had certain expenses not been waived/reimbursed during the period, total returns would have been lower. |
| (d) |
The investment adviser agreed to waive its fees and/or reimburse a portion of the Fund’s expenses during the period. Without this waiver/reimbursement, expenses
would have been higher. |
| (e) |
Effective July 1, 2021, the expense limit decreased from 1.20% to 0.93%. |
| (f) |
Includes additional voluntary waiver of advisory fee of 0.02%. |
| |
Gateway
Equity Call Premium Fund—Class C | ||||
| |
Year Ended December 31,
2023 |
Year Ended December 31,
2022 |
Year Ended December 31,
2021 |
Year Ended December 31,
2020 |
Year Ended December 31,
2019 |
| Net asset value, beginning of the period |
$14.46 |
$16.52 |
$13.96 |
$13.03 |
$11.29 |
| INCOME (LOSS) FROM INVESTMENT OPERATIONS: |
|
|
|
|
|
| Net investment income (loss)(a) |
0.00 (b) |
(0.01 ) |
(0.05 ) |
(0.01 ) |
0.01 |
| Net realized and unrealized gain (loss) |
2.38 |
(2.04 ) |
2.61 |
0.95 |
1.74 |
| Total from Investment Operations |
2.38 |
(2.05 ) |
2.56 |
0.94 |
1.75 |
| LESS DISTRIBUTIONS FROM: |
|
|
|
|
|
| Net investment income |
(0.01 ) |
(0.01 ) |
(0.00
)(b) |
(0.01 ) |
(0.01 ) |
| Net asset value, end of the period |
$16.83 |
$14.46 |
$16.52 |
$13.96 |
$13.03 |
| Total return(c)(d) |
16.44 % |
(12.36 )% |
18.28 % |
7.23 % |
15.54 % |
| RATIOS TO AVERAGE NET ASSETS: |
|
|
|
|
|
| Net assets, end of the period (000's) |
$1,130
|
$944
|
$814
|
$741
|
$727
|
| Net expenses(e) |
1.68 % |
1.68 % |
1.79 %(f)(g)
|
1.95 % |
1.95 % |
| Gross expenses |
1.84 % |
1.91 % |
1.96 % |
2.17 % |
2.17 % |
| Net investment income (loss) |
0.03 % |
(0.06 )% |
(0.33 )% |
(0.10 )% |
0.07 % |
| Portfolio turnover rate |
32 % |
11 % |
5 % |
15 % |
17 % |
| (a) |
Per share net investment income (loss) has been calculated using the average shares outstanding during the period. |
| (b) |
Amount rounds to less than $0.01 per share. |
| (c) |
A contingent deferred sales charge for Class C shares is not reflected in total return calculations. |
| (d) |
Had certain expenses not been waived/reimbursed during the period, total returns would have been lower. |
| (e) |
The investment adviser agreed to waive its fees and/or reimburse a portion of the Fund’s expenses during the period. Without this waiver/reimbursement, expenses
would have been higher. |
| (f) |
Effective July 1, 2021, the expense limit decreased from 1.95% to 1.68%. |
| (g) |
Includes additional voluntary waiver of advisory fee of 0.02%. |
| |
Gateway
Equity Call Premium Fund—Class N | ||||
| |
Year Ended December 31,
2023 |
Year Ended December 31,
2022 |
Year Ended December 31,
2021 |
Year Ended December 31,
2020 |
Year Ended December 31,
2019 |
| Net asset value, beginning of the period |
$14.57 |
$16.63 |
$14.01 |
$13.06 |
$11.32 |
| INCOME (LOSS) FROM INVESTMENT OPERATIONS: |
|
|
|
|
|
| Net investment income(a) |
0.17 |
0.14 |
0.11 |
0.12 |
0.13 |
| Net realized and unrealized gain (loss) |
2.40 |
(2.05 ) |
2.61 |
0.95 |
1.76 |
| Total from Investment Operations |
2.57 |
(1.91 ) |
2.72 |
1.07 |
1.89 |
| LESS DISTRIBUTIONS FROM: |
|
|
|
|
|
| Net investment income |
(0.16 ) |
(0.15 ) |
(0.10 ) |
(0.12 ) |
(0.15 ) |
| Net asset value, end of the period |
$16.98 |
$14.57 |
$16.63 |
$14.01 |
$13.06 |
| Total return(b) |
17.74 % |
(11.51 )% |
19.49 % |
8.36 % |
16.73 % |
| RATIOS TO AVERAGE NET ASSETS: |
|
|
|
|
|
| Net assets, end of the period (000's) |
$255
|
$219
|
$437
|
$728
|
$530
|
| Net expenses(c) |
0.63 % |
0.63 % |
0.77 %(d) |
0.90 % |
0.90 % |
| Gross expenses |
1.28 % |
1.23 % |
1.08 % |
1.29 % |
1.63 % |
| Net investment income |
1.08 % |
0.95 % |
0.70 % |
0.95 % |
1.03 % |
| Portfolio turnover rate |
32 % |
11 % |
5 % |
15 % |
17 % |
| (a) |
Per share net investment income has been calculated using the average shares outstanding during the period. |
| (b) |
Had certain expenses not been waived/reimbursed during the period, total returns would have been lower. |
| (c) |
The investment adviser agreed to waive its fees and/or reimburse a portion of the Fund’s expenses during the period. Without this waiver/reimbursement, expenses
would have been higher. |
| (d) |
Effective July 1, 2021, the expense limit decreased from 0.90% to 0.63%. |
| |
Gateway
Equity Call Premium Fund—Class Y | ||||
| |
Year Ended December 31,
2023 |
Year Ended December 31,
2022 |
Year Ended December 31,
2021 |
Year Ended December 31,
2020 |
Year Ended December 31,
2019 |
| Net asset value, beginning of the period |
$14.59 |
$16.65 |
$14.02 |
$13.07 |
$11.32 |
| INCOME (LOSS) FROM INVESTMENT OPERATIONS: |
|
|
|
|
|
| Net investment income(a) |
0.17 |
0.14 |
0.10 |
0.11 |
0.13 |
| Net realized and unrealized gain (loss) |
2.39 |
(2.06 ) |
2.63 |
0.96 |
1.76 |
| Total from Investment Operations |
2.56 |
(1.92 ) |
2.73 |
1.07 |
1.89 |
| LESS DISTRIBUTIONS FROM: |
|
|
|
|
|
| Net investment income |
(0.16 ) |
(0.14 ) |
(0.10 ) |
(0.12 ) |
(0.14 ) |
| Net asset value, end of the period |
$16.99 |
$14.59 |
$16.65 |
$14.02 |
$13.07 |
| Total return(b) |
17.59 % |
(11.48 )% |
19.43 % |
8.38 % |
16.67 % |
| RATIOS TO AVERAGE NET ASSETS: |
|
|
|
|
|
| Net assets, end of the period (000's) |
$267,033
|
$136,629
|
$102,004
|
$56,979
|
$60,794
|
| Net expenses(c) |
0.68 % |
0.68 % |
0.78 %(d)(e)
|
0.95 % |
0.95 % |
| Gross expenses |
0.84 % |
0.91 % |
0.95 % |
1.17 % |
1.17 % |
| Net investment income |
1.04 % |
0.95 % |
0.67 % |
0.90 % |
1.06 % |
| Portfolio turnover rate |
32 % |
11 % |
5 % |
15 % |
17 % |
| (a) |
Per share net investment income has been calculated using the average shares outstanding during the period. |
| (b) |
Had certain expenses not been waived/reimbursed during the period, total returns would have been lower. |
| (c) |
The investment adviser agreed to waive its fees and/or reimburse a portion of the Fund’s expenses during the period. Without this waiver/reimbursement, expenses
would have been higher. |
| (d) |
Effective July 1, 2021, the expense limit decreased from 0.95% to 0.68%. |
| (e) |
Includes additional voluntary waiver of advisory fee of 0.02%. |
| |
Mirova
Global Green Bond Fund—Class A | ||||
| |
Year Ended December 31,
2023 |
Year Ended December 31,
2022 |
Year Ended December 31,
2021 |
Year Ended December 31,
2020 |
Year Ended December 31,
2019 |
| Net asset value, beginning of the period |
$7.99 |
$10.14 |
$10.77 |
$10.36 |
$9.71 |
| INCOME (LOSS) FROM INVESTMENT OPERATIONS: |
|
|
|
|
|
| Net investment income(a) |
0.13 |
0.07 |
0.04 |
0.07 |
0.09 |
| Net realized and unrealized gain (loss) |
0.55 |
(1.75 ) |
(0.37 ) |
0.71 |
0.80 |
| Total from Investment Operations |
0.68 |
(1.68 ) |
(0.33 ) |
0.78 |
0.89 |
| LESS DISTRIBUTIONS FROM: |
|
|
|
|
|
| Net investment income |
(0.17 ) |
(0.01 ) |
(0.14 ) |
(0.18 ) |
(0.10 ) |
| Net realized capital gains |
— |
(0.46 ) |
(0.16 ) |
(0.19 ) |
(0.14 ) |
| Total Distributions |
(0.17 ) |
(0.47 ) |
(0.30 ) |
(0.37 ) |
(0.24 ) |
| Net asset value, end of the period |
$8.50 |
$7.99 |
$10.14 |
$10.77 |
$10.36 |
| Total return(b)(c) |
8.48 % |
(16.73 )% |
(3.02 )% |
7.61 % |
9.16 % |
| RATIOS TO AVERAGE NET ASSETS: |
|
|
|
|
|
| Net assets, end of the period (000's) |
$5,230
|
$5,278
|
$6,798
|
$5,674
|
$2,549
|
| Net expenses(d) |
0.93 %(e) |
0.91 %(f) |
0.96 %(g)(h)
|
0.97 %(i) |
0.96 %(j) |
| Gross expenses |
1.41 %(e) |
1.34 %(f) |
1.41 %(h) |
1.43 %(i) |
1.56 %(j) |
| Net investment income |
1.55 % |
0.83 % |
0.39 % |
0.69 % |
0.86 % |
| Portfolio turnover rate |
18 % |
60 % |
37 % |
53 % |
25 % |
| (a) |
Per share net investment income has been calculated using the average shares outstanding during the period. |
| (b) |
A sales charge for Class A shares is not reflected in total return calculations. |
| (c) |
Had certain expenses not been waived/reimbursed during the period, total returns would have been lower. |
| (d) |
The investment adviser agreed to waive its fees and/or reimburse a portion of the Fund’s expenses during the period. Without this waiver/reimbursement, expenses
would have been higher. |
| (e) |
Includes interest expense. Without this expense the ratio of net expenses would have been 0.90% and the ratio of gross expenses would have been 1.38%.
|
| (f) |
Includes interest expense. Without this expense the ratio of net expenses would have been 0.90% and the ratio of gross expenses would have been 1.33%.
|
| (g) |
Effective July 1, 2021, the expense limit decreased from 0.95% to 0.90%. |
| (h) |
Includes interest expense. Without this expense the ratio of net expenses would have been 0.92% and the ratio of gross expenses would have been 1.37%.
|
| (i) |
Includes interest expense. Without this expense the ratio of net expenses would have been 0.95% and the ratio of gross expenses would have been 1.41%.
|
| (j) |
Includes interest expense. Without this expense the ratio of net expenses would have been 0.95% and the ratio of gross expenses would have been 1.55%.
|
| |
Mirova
Global Green Bond Fund—Class N | ||||
| |
Year Ended December 31,
2023 |
Year Ended December 31,
2022 |
Year Ended December 31,
2021 |
Year Ended December 31,
2020 |
Year Ended December 31,
2019 |
| Net asset value, beginning of the period |
$8.04 |
$10.17 |
$10.80 |
$10.39 |
$9.73 |
| INCOME (LOSS) FROM INVESTMENT OPERATIONS: |
|
|
|
|
|
| Net investment income(a) |
0.15 |
0.10 |
0.07 |
0.10 |
0.12 |
| Net realized and unrealized gain (loss) |
0.55 |
(1.75 ) |
(0.36 ) |
0.71 |
0.80 |
| Total from Investment Operations |
0.70 |
(1.65 ) |
(0.29 ) |
0.81 |
0.92 |
| LESS DISTRIBUTIONS FROM: |
|
|
|
|
|
| Net investment income |
(0.19 ) |
(0.02 ) |
(0.18 ) |
(0.21 ) |
(0.12 ) |
| Net realized capital gains |
— |
(0.46 ) |
(0.16 ) |
(0.19 ) |
(0.14 ) |
| Total Distributions |
(0.19 ) |
(0.48 ) |
(0.34 ) |
(0.40 ) |
(0.26 ) |
| Net asset value, end of the period |
$8.55 |
$8.04 |
$10.17 |
$10.80 |
$10.39 |
| Total return(b) |
8.73 % |
(16.42 )% |
(2.73 )% |
7.89 % |
9.52 % |
| RATIOS TO AVERAGE NET ASSETS: |
|
|
|
|
|
| Net assets, end of the period (000's) |
$7,045
|
$5,224
|
$8,110
|
$11,781
|
$27,322
|
| Net expenses(c) |
0.62 %(d) |
0.61 %(e) |
0.67 %(f)(g)
|
0.67 %(h) |
0.66 %(i) |
| Gross expenses |
1.08 %(d) |
0.99 %(e) |
1.05 %(g) |
1.07 %(h) |
1.08 %(i) |
| Net investment income |
1.86 % |
1.11 % |
0.69 % |
0.96 % |
1.17 % |
| Portfolio turnover rate |
18 % |
60 % |
37 % |
53 % |
25 % |
| (a) |
Per share net investment income has been calculated using the average shares outstanding during the period. |
| (b) |
Had certain expenses not been waived/reimbursed during the period, total returns would have been lower. |
| (c) |
The investment adviser agreed to waive its fees and/or reimburse a portion of the Fund’s expenses during the period. Without this waiver/reimbursement, expenses
would have been higher. |
| (d) |
Includes interest expense. Without this expense the ratio of net expenses would have been 0.60% and the ratio of gross expenses would have been 1.06%.
|
| (e) |
Includes interest expense. Without this expense the ratio of net expenses would have been 0.60% and the ratio of gross expenses would have been 0.98%.
|
| (f) |
Effective July 1, 2021, the expense limit decreased from 0.65% to 0.60%. |
| (g) |
Includes interest expense. Without this expense the ratio of net expenses would have been 0.63% and the ratio of gross expenses would have been 1.02%.
|
| (h) |
Includes interest expense. Without this expense the ratio of net expenses would have been 0.65% and the ratio of gross expenses would have been 1.05%.
|
| (i) |
Includes interest expense. Without this expense the ratio of net expenses would have been 0.65% and the ratio of gross expenses would have been 1.07%.
|
| |
Mirova
Global Green Bond Fund—Class Y | ||||
| |
Year Ended December 31,
2023 |
Year Ended December 31,
2022 |
Year Ended December 31,
2021 |
Year Ended December 31,
2020 |
Year Ended December 31,
2019 |
| Net asset value, beginning of the period |
$8.03 |
$10.16 |
$10.79 |
$10.37 |
$9.72 |
| INCOME (LOSS) FROM INVESTMENT OPERATIONS: |
|
|
|
|
|
| Net investment income(a) |
0.15 |
0.10 |
0.07 |
0.10 |
0.11 |
| Net realized and unrealized gain (loss) |
0.55 |
(1.76 ) |
(0.37 ) |
0.72 |
0.80 |
| Total from Investment Operations |
0.70 |
(1.66 ) |
(0.30 ) |
0.82 |
0.91 |
| LESS DISTRIBUTIONS FROM: |
|
|
|
|
|
| Net investment income |
(0.19 ) |
(0.01 ) |
(0.17 ) |
(0.21 ) |
(0.12 ) |
| Net realized capital gains |
— |
(0.46 ) |
(0.16 ) |
(0.19 ) |
(0.14 ) |
| Total Distributions |
(0.19 ) |
(0.47 ) |
(0.33 ) |
(0.40 ) |
(0.26 ) |
| Net asset value, end of the period |
$8.54 |
$8.03 |
$10.16 |
$10.79 |
$10.37 |
| Total return(b) |
8.69 % |
(16.45 )% |
(2.69 )% |
7.85 % |
9.38 % |
| RATIOS TO AVERAGE NET ASSETS: |
|
|
|
|
|
| Net assets, end of the period (000's) |
$26,989
|
$25,113
|
$32,217
|
$22,081
|
$7,060
|
| Net expenses(c) |
0.68 %(d) |
0.66 %(e) |
0.71 %(f)(g)
|
0.72 %(h) |
0.71 %(i) |
| Gross expenses |
1.16 %(d) |
1.09 %(e) |
1.16 %(g) |
1.18 %(h) |
1.28 %(i) |
| Net investment income |
1.80 % |
1.09 % |
0.63 % |
0.94 % |
1.10 % |
| Portfolio turnover rate |
18 % |
60 % |
37 % |
53 % |
25 % |
| (a) |
Per share net investment income has been calculated using the average shares outstanding during the period. |
| (b) |
Had certain expenses not been waived/reimbursed during the period, total returns would have been lower. |
| (c) |
The investment adviser agreed to waive its fees and/or reimburse a portion of the Fund’s expenses during the period. Without this waiver/reimbursement, expenses
would have been higher. |
| (d) |
Includes interest expense. Without this expense the ratio of net expenses would have been 0.65% and the ratio of gross expenses would have been 1.13%.
|
| (e) |
Includes interest expense. Without this expense the ratio of net expenses would have been 0.65% and the ratio of gross expenses would have been 1.08%.
|
| (f) |
Effective July 1, 2021, the expense limit decreased from 0.70% to 0.65%. |
| (g) |
Includes interest expense. Without this expense the ratio of net expenses would have been 0.67% and the ratio of gross expenses would have been 1.13%.
|
| (h) |
Includes interest expense. Without this expense the ratio of net expenses would have been 0.70% and the ratio of gross expenses would have been 1.16%.
|
| (i) |
Includes interest expense. Without this expense the ratio of net expenses would have been 0.70% and the ratio of gross expenses would have been 1.27%.
|
| |
Mirova
Global Sustainable Equity Fund—Class A | ||||
| |
Year Ended December 31,
2023 |
Year Ended December 31,
2022 |
Year Ended December 31,
2021 |
Year Ended December 31,
2020 |
Year Ended December 31,
2019 |
| Net asset value, beginning of the period |
$15.22 |
$20.53 |
$19.57 |
$14.92 |
$11.45 |
| INCOME (LOSS) FROM INVESTMENT OPERATIONS: |
|
|
|
|
|
| Net investment income (loss)(a) |
0.06 |
0.08 |
(0.01 ) |
(0.02 ) |
0.03 |
| Net realized and unrealized gain (loss) |
2.73 |
(4.62 ) |
3.45 |
4.77 |
3.69 |
| Total from Investment Operations |
2.79 |
(4.54 ) |
3.44 |
4.75 |
3.72 |
| LESS DISTRIBUTIONS FROM: |
|
|
|
|
|
| Net investment income |
(0.07 ) |
(0.07 ) |
(0.00 )(b) |
(0.00 )(b) |
(0.03 ) |
| Net realized capital gains |
— |
(0.70 ) |
(2.48 ) |
(0.10 ) |
(0.22 ) |
| Total Distributions |
(0.07 ) |
(0.77 ) |
(2.48 ) |
(0.10 ) |
(0.25 ) |
| Net asset value, end of the period |
$17.94 |
$15.22 |
$20.53 |
$19.57 |
$14.92 |
| Total return(c)(d) |
18.32 % |
(22.56 )% |
17.82 % |
32.07 % |
32.63 % |
| RATIOS TO AVERAGE NET ASSETS: |
|
|
|
|
|
| Net assets, end of the period (000's) |
$30,525
|
$29,013
|
$43,117
|
$33,625
|
$12,884
|
| Net expenses(e) |
1.20 % |
1.20 %(f) |
1.21 %(g) |
1.20 % |
1.21 %(h) |
| Gross expenses |
1.24 % |
1.26 %(f) |
1.24 %(g) |
1.24 % |
1.39 %(h) |
| Net investment income (loss) |
0.37 % |
0.51 % |
(0.03 )% |
(0.14 )% |
0.21 % |
| Portfolio turnover rate |
23 % |
23 % |
40 %(i) |
11 % |
23 % |
| (a) |
Per share net investment income (loss) has been calculated using the average shares outstanding during the period. |
| (b) |
Amount rounds to less than $0.01 per share. |
| (c) |
A sales charge for Class A shares is not reflected in total return calculations. |
| (d) |
Had certain expenses not been waived/reimbursed during the period, total returns would have been lower. |
| (e) |
The investment adviser agreed to waive its fees and/or reimburse a portion of the Fund’s expenses during the period. Without this waiver/reimbursement, expenses
would have been higher. |
| (f) |
Includes interest expense. Without this expense the ratio of net expenses would have been 1.20% and the ratio of gross expenses would have been 1.25%.
|
| (g) |
Includes interest expense. Without this expense the ratio of net expenses would have been 1.20% and the ratio of gross expenses would have been 1.24%.
|
| (h) |
Includes interest expense. Without this expense the ratio of net expenses would have been 1.20% and the ratio of gross expenses would have been 1.38%.
|
| (i) |
The variation in the Fund’s turnover rate from 2020 to 2021 was primarily due to an increase in shareholder activity. |
| |
Mirova
Global Sustainable Equity Fund—Class C | ||||
| |
Year Ended December 31,
2023 |
Year Ended December 31,
2022 |
Year Ended December 31,
2021 |
Year Ended December 31,
2020 |
Year Ended December 31,
2019 |
| Net asset value, beginning of the period |
$14.48 |
$19.62 |
$18.95 |
$14.56 |
$11.24 |
| INCOME (LOSS) FROM INVESTMENT OPERATIONS: |
|
|
|
|
|
| Net investment loss(a) |
(0.06 ) |
(0.04 ) |
(0.16 ) |
(0.13 ) |
(0.07 ) |
| Net realized and unrealized gain (loss) |
2.58 |
(4.40 ) |
3.31 |
4.62 |
3.61 |
| Total from Investment Operations |
2.52 |
(4.44 ) |
3.15 |
4.49 |
3.54 |
| LESS DISTRIBUTIONS FROM: |
|
|
|
|
|
| Net investment income |
(0.01 ) |
— |
(0.00 )(b) |
(0.00 )(b) |
— |
| Net realized capital gains |
— |
(0.70 ) |
(2.48 ) |
(0.10 ) |
(0.22 ) |
| Total Distributions |
(0.01 ) |
(0.70 ) |
(2.48 ) |
(0.10 ) |
(0.22 ) |
| Net asset value, end of the period |
$16.99 |
$14.48 |
$19.62 |
$18.95 |
$14.56 |
| Total return(c)(d) |
17.41 % |
(23.11 )% |
16.85 % |
31.07 % |
31.66 % |
| RATIOS TO AVERAGE NET ASSETS: |
|
|
|
|
|
| Net assets, end of the period (000's) |
$10,786
|
$11,441
|
$17,248
|
$11,196
|
$5,406
|
| Net expenses(e) |
1.95 % |
1.95 %(f) |
1.96 %(g) |
1.95 % |
1.96 %(h) |
| Gross expenses |
1.99 % |
2.01 %(f) |
1.99 %(g) |
1.99 % |
2.14 %(h) |
| Net investment loss |
(0.38 )% |
(0.23 )% |
(0.79 )% |
(0.84 )% |
(0.52 )% |
| Portfolio turnover rate |
23 % |
23 % |
40 %(i) |
11 % |
23 % |
| (a) |
Per share net investment loss has been calculated using the average shares outstanding during the period. |
| (b) |
Amount rounds to less than $0.01 per share. |
| (c) |
A contingent deferred sales charge for Class C shares is not reflected in total return calculations. |
| (d) |
Had certain expenses not been waived/reimbursed during the period, total returns would have been lower. |
| (e) |
The investment adviser agreed to waive its fees and/or reimburse a portion of the Fund’s expenses during the period. Without this waiver/reimbursement, expenses
would have been higher. |
| (f) |
Includes interest expense. Without this expense the ratio of net expenses would have been 1.95% and the ratio of gross expenses would have been 2.00%.
|
| (g) |
Includes interest expense. Without this expense the ratio of net expenses would have been 1.95% and the ratio of gross expenses would have been 1.99%.
|
| (h) |
Includes interest expense. Without this expense the ratio of net expenses would have been 1.95% and the ratio of gross expenses would have been 2.13%.
|
| (i) |
The variation in the Fund’s turnover rate from 2020 to 2021 was primarily due to an increase in shareholder activity. |
| |
Mirova
Global Sustainable Equity Fund—Class N | ||||
| |
Year Ended December 31,
2023 |
Year Ended December 31,
2022 |
Year Ended December 31,
2021 |
Year Ended December 31,
2020 |
Year Ended December 31,
2019 |
| Net asset value, beginning of the period |
$15.36 |
$20.72 |
$19.71 |
$14.99 |
$11.49 |
| INCOME (LOSS) FROM INVESTMENT OPERATIONS: |
|
|
|
|
|
| Net investment income(a) |
0.11 |
0.13 |
0.05 |
0.01 |
0.06 |
| Net realized and unrealized gain (loss) |
2.76 |
(4.67 ) |
3.49 |
4.82 |
3.72 |
| Total from Investment Operations |
2.87 |
(4.54 ) |
3.54 |
4.83 |
3.78 |
| LESS DISTRIBUTIONS FROM: |
|
|
|
|
|
| Net investment income |
(0.12 ) |
(0.12 ) |
(0.05 ) |
(0.01 ) |
(0.06 ) |
| Net realized capital gains |
— |
(0.70 ) |
(2.48 ) |
(0.10 ) |
(0.22 ) |
| Total Distributions |
(0.12 ) |
(0.82 ) |
(2.53 ) |
(0.11 ) |
(0.28 ) |
| Net asset value, end of the period |
$18.11 |
$15.36 |
$20.72 |
$19.71 |
$14.99 |
| Total return |
18.70 % |
(22.32 )% |
18.17 % |
32.44 %(b) |
33.05 %(b) |
| RATIOS TO AVERAGE NET ASSETS: |
|
|
|
|
|
| Net assets, end of the period (000's) |
$239,009
|
$189,957
|
$219,679
|
$72,768
|
$11,000
|
| Net expenses |
0.89 % |
0.90 %(c) |
0.91 %(d)(e)
|
0.90 %(f) |
0.90 %(f)(g)
|
| Gross expenses |
0.89 % |
0.90 %(c) |
0.91 %(d)(e)
|
0.93 % |
1.08 %(g) |
| Net investment income |
0.64 % |
0.81 % |
0.24 % |
0.08 % |
0.46 % |
| Portfolio turnover rate |
23 % |
23 % |
40 %(h) |
11 % |
23 % |
| (a) |
Per share net investment income has been calculated using the average shares outstanding during the period. |
| (b) |
Had certain expenses not been waived/reimbursed during the period, total returns would have been lower. |
| (c) |
Includes interest expense. Without this expense the ratio of net expenses would have been 0.89% and the ratio of gross expenses would have been 0.89%.
|
| (d) |
Includes interest expense. Without this expense the ratio of net expenses would have been 0.90% and the ratio of gross expenses would have been 0.90%.
|
| (e) |
Includes fee/expense recovery of 0.01%. |
| (f) |
The investment adviser agreed to waive its fees and/or reimburse a portion of the Fund’s expenses during the period. Without this waiver/reimbursement, expenses
would have been higher. |
| (g) |
Includes interest expense of less than 0.01%. |
| (h) |
The variation in the Fund’s turnover rate from 2020 to 2021 was primarily due to an increase in shareholder activity. |
| |
Mirova
Global Sustainable Equity Fund—Class Y | ||||
| |
Year Ended December 31,
2023 |
Year Ended December 31,
2022 |
Year Ended December 31,
2021 |
Year Ended December 31,
2020 |
Year Ended December 31,
2019 |
| Net asset value, beginning of the period |
$15.36 |
$20.71 |
$19.71 |
$14.99 |
$11.49 |
| INCOME (LOSS) FROM INVESTMENT OPERATIONS: |
|
|
|
|
|
| Net investment income(a) |
0.11 |
0.12 |
0.05 |
0.01 |
0.07 |
| Net realized and unrealized gain (loss) |
2.75 |
(4.66 ) |
3.46 |
4.81 |
3.70 |
| Total from Investment Operations |
2.86 |
(4.54 ) |
3.51 |
4.82 |
3.77 |
| LESS DISTRIBUTIONS FROM: |
|
|
|
|
|
| Net investment income |
(0.11 ) |
(0.11 ) |
(0.03 ) |
(0.00 )(b) |
(0.05 ) |
| Net realized capital gains |
— |
(0.70 ) |
(2.48 ) |
(0.10 ) |
(0.22 ) |
| Total Distributions |
(0.11 ) |
(0.81 ) |
(2.51 ) |
(0.10 ) |
(0.27 ) |
| Net asset value, end of the period |
$18.11 |
$15.36 |
$20.71 |
$19.71 |
$14.99 |
| Total return(c) |
18.63 % |
(22.33 )% |
18.06 % |
32.42 % |
32.99 % |
| RATIOS TO AVERAGE NET ASSETS: |
|
|
|
|
|
| Net assets, end of the period (000's) |
$753,396
|
$637,021
|
$840,638
|
$760,181
|
$118,032
|
| Net expenses(d) |
0.95 % |
0.95 %(e) |
0.96 %(f) |
0.95 % |
0.96 %(g) |
| Gross expenses |
0.99 % |
1.01 %(e) |
0.99 %(f) |
0.99 % |
1.14 %(g) |
| Net investment income |
0.63 % |
0.76 % |
0.22 % |
0.06 % |
0.50 % |
| Portfolio turnover rate |
23 % |
23 % |
40 %(h) |
11 % |
23 % |
| (a) |
Per share net investment income has been calculated using the average shares outstanding during the period. |
| (b) |
Amount rounds to less than $0.01 per share. |
| (c) |
Had certain expenses not been waived/reimbursed during the period, total returns would have been lower. |
| (d) |
The investment adviser agreed to waive its fees and/or reimburse a portion of the Fund’s expenses during the period. Without this waiver/reimbursement, expenses
would have been higher. |
| (e) |
Includes interest expense. Without this expense the ratio of net expenses would have been 0.95% and the ratio of gross expenses would have been 1.00%.
|
| (f) |
Includes interest expense. Without this expense the ratio of net expenses would have been 0.95% and the ratio of gross expenses would have been 0.99%.
|
| (g) |
Includes interest expense. Without this expense the ratio of net expenses would have been 0.95% and the ratio of gross expenses would have been 1.13%.
|
| (h) |
The variation in the Fund’s turnover rate from 2020 to 2021 was primarily due to an increase in shareholder activity. |
| |
Mirova
International Sustainable Equity Fund—Class A
| ||||
| |
Year Ended December 31,
2023 |
Year Ended December 31,
2022 |
Year Ended December 31,
2021 |
Year Ended December 31,
2020 |
Year Ended December 31,
2019 |
| Net asset value, beginning of the period |
$10.47 |
$14.35 |
$13.95 |
$12.51 |
$10.03 |
| INCOME (LOSS) FROM INVESTMENT OPERATIONS: |
|
|
|
|
|
| Net investment income (loss)(a) |
0.17 |
0.11 |
0.08 |
(0.01 ) |
0.12 |
| Net realized and unrealized gain (loss) |
1.33 |
(3.62 ) |
0.78 |
2.87 |
2.48 |
| Total from Investment Operations |
1.50 |
(3.51 ) |
0.86 |
2.86 |
2.60 |
| LESS DISTRIBUTIONS FROM: |
|
|
|
|
|
| Net investment income |
(0.12 ) |
(0.37 ) |
(0.09 ) |
(0.12 ) |
(0.12 ) |
| Net realized capital gains |
— |
— |
(0.37 ) |
(1.30 ) |
— |
| Total Distributions |
(0.12 ) |
(0.37 ) |
(0.46 ) |
(1.42 ) |
(0.12 ) |
| Net asset value, end of the period |
$11.85 |
$10.47 |
$14.35 |
$13.95 |
$12.51 |
| Total return(b)(c) |
14.37 % |
(24.42 )% |
6.22 % |
23.18 % |
25.97 % |
| RATIOS TO AVERAGE NET ASSETS: |
|
|
|
|
|
| Net assets, end of the period (000's) |
$601
|
$717
|
$380
|
$76
|
$4
|
| Net expenses(d) |
1.20 % |
1.21 %(e) |
1.21 %(f) |
1.26 %(g) |
1.21 %(h) |
| Gross expenses |
2.64 % |
2.30 %(e) |
2.08 %(f) |
5.69 %(g) |
107.91 %(h) |
| Net investment income (loss) |
1.51 % |
0.99 % |
0.57 % |
(0.04 )% |
1.09 % |
| Portfolio turnover rate |
14 % |
8 % |
8 % |
11 % |
8 % |
| (a) |
Per share net investment income (loss) has been calculated using the average shares outstanding during the period. |
| (b) |
A sales charge for Class A shares is not reflected in total return calculations. |
| (c) |
Had certain expenses not been waived/reimbursed during the period, total returns would have been lower. |
| (d) |
The investment adviser agreed to waive its fees and/or reimburse a portion of the Fund’s expenses during the period. Without this waiver/reimbursement, expenses
would have been higher. |
| (e) |
Includes interest expense. Without this expense the ratio of net expenses would have been 1.20% and the ratio of gross expenses would have been 2.29%.
|
| (f) |
Includes interest expense. Without this expense the ratio of net expenses would have been 1.20% and the ratio of gross expenses would have been 2.07%.
|
| (g) |
Includes interest expense. Without this expense the ratio of net expenses would have been 1.20% and the ratio of gross expenses would have been 5.64%.
|
| (h) |
Includes interest expense. Without this expense the ratio of net expenses would have been 1.20% and the ratio of gross expenses would have been 107.90%.
|
| |
Mirova
International Sustainable Equity Fund—Class N
| ||||
| |
Year Ended December 31,
2023 |
Year Ended December 31,
2022 |
Year Ended December 31,
2021 |
Year Ended December 31,
2020 |
Year Ended December 31,
2019 |
| Net asset value, beginning of the period |
$10.52 |
$14.40 |
$13.99 |
$12.51 |
$10.03 |
| INCOME (LOSS) FROM INVESTMENT OPERATIONS: |
|
|
|
|
|
| Net investment income(a) |
0.19 |
0.23 |
0.14 |
0.07 |
0.15 |
| Net realized and unrealized gain (loss) |
1.35 |
(3.71 ) |
0.76 |
2.84 |
2.49 |
| Total from Investment Operations |
1.54 |
(3.48 ) |
0.90 |
2.91 |
2.64 |
| LESS DISTRIBUTIONS FROM: |
|
|
|
|
|
| Net investment income |
(0.16 ) |
(0.40 ) |
(0.12 ) |
(0.13 ) |
(0.16 ) |
| Net realized capital gains |
— |
— |
(0.37 ) |
(1.30 ) |
— |
| Total Distributions |
(0.16 ) |
(0.40 ) |
(0.49 ) |
(1.43 ) |
(0.16 ) |
| Net asset value, end of the period |
$11.90 |
$10.52 |
$14.40 |
$13.99 |
$12.51 |
| Total return(b) |
14.66 % |
(24.17 )% |
6.47 % |
23.60 % |
26.31 % |
| RATIOS TO AVERAGE NET ASSETS: |
|
|
|
|
|
| Net assets, end of the period (000's) |
$10,540
|
$7,433
|
$27,569
|
$16,478
|
$17,193
|
| Net expenses(c) |
0.90 % |
0.91 %(d) |
0.91 %(e) |
0.93 %(f) |
0.92 %(g) |
| Gross expenses |
2.28 % |
1.80 %(d) |
1.44 %(e) |
1.83 %(f) |
1.99 %(g) |
| Net investment income |
1.68 % |
2.01 % |
0.94 % |
0.58 % |
1.36 % |
| Portfolio turnover rate |
14 % |
8 % |
8 % |
11 % |
8 % |
| (a) |
Per share investment income has been calculated using the average shares outstanding during the period. |
| (b) |
Had certain expenses not been waived/reimbursed during the period, total returns would have been lower. |
| (c) |
The investment adviser agreed to waive its fees and/or reimburse a portion of the Fund’s expenses during the period. Without this waiver/reimbursement, expenses
would have been higher. |
| (d) |
Includes interest expense. Without this expense the ratio of net expenses would have been 0.90% and the ratio of gross expenses would have been 1.79%.
|
| (e) |
Includes interest expense. Without this expense the ratio of net expenses would have been 0.90% and the ratio of gross expenses would have been 1.43%.
|
| (f) |
Includes interest expense. Without this expense the ratio of net expenses would have been 0.90% and the ratio of gross expenses would have been 1.80%.
|
| (g) |
Includes interest expense. Without this expense the ratio of net expenses would have been 0.75% and the ratio of gross expenses would have been 1.22%.
|
| |
Mirova
International Sustainable Equity Fund—Class Y
| ||||
| |
Year Ended December 31,
2023 |
Year Ended December 31,
2022 |
Year Ended December 31,
2021 |
Year Ended December 31,
2020 |
Year Ended December 31,
2019 |
| Net asset value, beginning of the period |
$10.51 |
$14.38 |
$13.98 |
$12.50 |
$10.03 |
| INCOME (LOSS) FROM INVESTMENT OPERATIONS: |
|
|
|
|
|
| Net investment income(a) |
0.13 |
0.24 |
0.08 |
0.03 |
0.15 |
| Net realized and unrealized gain (loss) |
1.41 |
(3.72 ) |
0.80 |
2.88 |
2.48 |
| Total from Investment Operations |
1.54 |
(3.48 ) |
0.88 |
2.91 |
2.63 |
| LESS DISTRIBUTIONS FROM: |
|
|
|
|
|
| Net investment income |
(0.16 ) |
(0.39 ) |
(0.11 ) |
(0.13 ) |
(0.16 ) |
| Net realized capital gains |
— |
— |
(0.37 ) |
(1.30 ) |
— |
| Total Distributions |
(0.16 ) |
(0.39 ) |
(0.48 ) |
(1.43 ) |
(0.16 ) |
| Net asset value, end of the period |
$11.89 |
$10.51 |
$14.38 |
$13.98 |
$12.50 |
| Total return(b) |
14.64 % |
(24.18 )% |
6.39 % |
23.60 % |
26.21 % |
| RATIOS TO AVERAGE NET ASSETS: |
|
|
|
|
|
| Net assets, end of the period (000's) |
$5,067
|
$808
|
$1,783
|
$75
|
$9
|
| Net expenses(c) |
0.95 % |
0.96 %(d) |
0.96 %(e) |
1.00 %(f) |
0.96 %(g) |
| Gross expenses |
2.39 % |
2.05 %(d) |
1.83 %(e) |
6.51 %(f) |
94.13 %(g) |
| Net investment income |
1.14 % |
2.09 % |
0.52 % |
0.21 % |
1.36 % |
| Portfolio turnover rate |
14 % |
8 % |
8 % |
11 % |
8 % |
| (a) |
Per share investment income has been calculated using the average shares outstanding during the period. |
| (b) |
Had certain expenses not been waived/reimbursed during the period, total returns would have been lower. |
| (c) |
The investment adviser agreed to waive its fees and/or reimburse a portion of the Fund’s expenses during the period. Without this waiver/reimbursement, expenses
would have been higher. |
| (d) |
Includes interest expense. Without this expense the ratio of net expenses would have been 0.95% and the ratio of gross expenses would have been 2.04%.
|
| (e) |
Includes interest expense. Without this expense the ratio of net expenses would have been 0.95% and the ratio of gross expenses would have been 1.82%.
|
| (f) |
Includes interest expense. Without this expense the ratio of net expenses would have been 0.95% and the ratio of gross expenses would have been 6.46%.
|
| (g) |
Includes interest expense. Without this expense the ratio of net expenses would have been 0.95% and the ratio of gross expenses would have been 94.12%.
|
Gateway Equity Call Premium Fund
Mirova Global Sustainable Equity Fund (“Global Sustainable Equity Fund”)
Mirova International Sustainable Equity Fund (“International Sustainable Equity Fund”)
| |
2023 Distributions |
2022 Distributions | ||||
| Fund |
Ordinary Income |
Long-Term
Capital
Gains |
Total |
Ordinary Income |
Long-Term
Capital
Gains |
Total |
| Gateway Fund |
$56,998,901
|
$—
|
$56,998,901
|
$58,048,921
|
$—
|
$58,048,921
|
| Gateway Equity Call Premium Fund |
2,335,902 |
— |
2,335,902 |
1,250,482 |
— |
1,250,482 |
| Global Green Bond Fund |
851,455 |
— |
851,455 |
200,482 |
1,902,630 |
2,103,112 |
| Global Sustainable Equity Fund |
6,294,056 |
— |
6,294,056 |
24,414,403 |
23,809,481 |
48,223,884 |
| International Sustainable Equity Fund |
206,456 |
— |
206,456 |
328,586 |
— |
328,586 |
| |
Gateway Fund |
Gateway Equity
Call Premium Fund |
Global
Green
Bond Fund |
Global
Sustainable
Equity Fund |
International Sustainable
Equity Fund |
| Undistributed ordinary income |
$1,396,896 |
$43,199 |
$— |
$306,480 |
$5,081 |
| Capital loss carryforward: |
|
|
|
|
|
| Short-term: |
|
|
|
|
|
| No expiration date |
(1,117,008,869 ) |
(12,700,501 ) |
(1,113,901 ) |
(28,441,103 ) |
(329,605 ) |
| Long-term: |
|
|
|
|
|
| No expiration date |
— |
(10,316,947 ) |
(2,929,351 ) |
(5,545,087 ) |
(790,716 ) |
| Total capital loss carryforward* |
(1,117,008,869 ) |
(23,017,448 ) |
(4,043,252 ) |
(33,986,190 ) |
(1,120,321 ) |
| Late-year ordinary and post-October capital loss deferrals** |
— |
— |
(4,345 ) |
— |
— |
| Unrealized appreciation (depreciation) |
4,418,015,292 |
73,919,307 |
(3,271,491 ) |
78,741,527 |
(326,335 ) |
| Total accumulated earnings (losses) |
$3,302,403,319 |
$50,945,058 |
$(7,319,088 ) |
$45,061,817 |
$(1,441,575 ) |
| * |
Under Section 382 of the Internal Revenue Service Code, a portion of the capital loss carryforward for the International Sustainable Equity Fund is subject to certain
limitations upon availability, to offset future capital gains, if
any. |
| ** |
Under current tax law, capital losses, foreign currency losses, and losses on passive foreign investment companies and contingent payment debt instruments after
October 31 or December 31, as applicable, may be deferred and treated as occurring
on the first day of the following taxable year. Global Green Bond Fund is
deferring foreign currency losses. |
| |
Gateway Fund |
Gateway Equity
Call Premium Fund |
Global
Green
Bond Fund |
Global
Sustainable
Equity Fund |
International Sustainable
Equity Fund |
| Federal tax cost |
$2,120,309,093 |
$201,778,134 |
$39,764,163 |
$949,673,719 |
$16,151,467 |
| Gross tax appreciation |
$4,419,011,124
|
$76,184,259
|
$1,035,170
|
$152,469,584
|
$1,166,558
|
| Gross tax depreciation |
(996,264 ) |
(2,265,033 ) |
(4,324,995 ) |
(73,783,574 ) |
(1,507,270 ) |
| Net tax appreciation (depreciation) |
$4,418,014,860 |
$73,919,226 |
$(3,289,825 ) |
$78,686,010 |
$(340,712 ) |
| Gateway Fund | ||||
| Asset Valuation Inputs | ||||
| Description |
Level 1 |
Level 2 |
Level 3 |
Total |
| Common Stocks(a) |
$6,434,852,898
|
$—
|
$—
|
$6,434,852,898
|
| Purchased Options(a) |
33,444,020 |
— |
— |
33,444,020 |
| Short-Term Investments |
— |
103,471,055 |
— |
103,471,055 |
| Total |
$6,468,296,918 |
$103,471,055 |
$— |
$6,571,767,973 |
| | ||||
| Liability Valuation Inputs | ||||
| Description |
Level 1 |
Level 2 |
Level 3 |
Total |
| Written Options(a) |
$(132,505,730 ) |
$— |
$— |
$(132,505,730 ) |
| (a) |
Details of the major categories of the Fund’s investments are reflected within the Portfolio of Investments. |
| Gateway Equity Call Premium Fund | ||||
| Asset Valuation Inputs | ||||
| Description |
Level 1 |
Level 2 |
Level 3 |
Total |
| Common Stocks(a) |
$269,174,535
|
$—
|
$—
|
$269,174,535
|
| Short-Term Investments |
— |
6,522,825 |
— |
6,522,825 |
| Total Investments |
$269,174,535 |
$6,522,825 |
$— |
$275,697,360 |
| | ||||
| Liability Valuation Inputs | ||||
| Description |
Level 1 |
Level 2 |
Level 3 |
Total |
| Written Options(a) |
$(5,550,885 ) |
$— |
$— |
$(5,550,885 ) |
| (a) |
Details of the major categories of the Fund’s investments are reflected within the Portfolio of Investments. |
| Global Green Bond Fund | ||||
| Asset Valuation Inputs | ||||
| Description |
Level 1 |
Level 2 |
Level 3 |
Total |
| Bonds and Notes(a) |
$—
|
$36,042,521
|
$—
|
$36,042,521
|
| Short-Term Investments |
— |
386,876 |
— |
386,876 |
| Total Investments |
— |
36,429,397 |
— |
36,429,397 |
| Futures Contracts (unrealized appreciation) |
172,194 |
— |
— |
172,194 |
| Total |
$172,194 |
$36,429,397 |
$— |
$36,601,591 |
| | ||||
| Liability Valuation Inputs | ||||
| Description |
Level 1 |
Level 2 |
Level 3 |
Total |
| Futures Contracts (unrealized depreciation) |
$(255,505 ) |
$— |
$— |
$(255,505 ) |
| (a) |
Details of the major categories of the Fund’s investments are reflected within the Portfolio of Investments. |
| Global Sustainable Equity Fund | ||||
| Asset Valuation Inputs | ||||
| Description |
Level 1 |
Level 2 |
Level 3 |
Total |
| Common Stocks |
|
|
|
|
| Belgium |
$—
|
$9,779,293
|
$—
|
$9,779,293
|
| Denmark |
— |
73,275,794 |
— |
73,275,794 |
| France |
— |
42,042,743 |
— |
42,042,743 |
| Germany |
— |
54,189,801 |
— |
54,189,801 |
| Hong Kong |
— |
19,632,050 |
— |
19,632,050 |
| Japan |
— |
50,385,734 |
— |
50,385,734 |
| Netherlands |
— |
36,745,264 |
— |
36,745,264 |
| Spain |
— |
33,118,984 |
— |
33,118,984 |
| United Kingdom |
— |
33,715,035 |
— |
33,715,035 |
| All Other Common Stocks(a) |
654,736,035 |
— |
— |
654,736,035 |
| Total Common Stocks |
654,736,035 |
352,884,698 |
— |
1,007,620,733 |
| Short-Term Investments |
— |
20,738,996 |
— |
20,738,996 |
| Total Investments |
$654,736,035 |
$373,623,694 |
$— |
$1,028,359,729 |
| (a) |
Details of the major categories of the Fund’s investments are reflected within the Portfolio of Investments. |
| International Sustainable Equity Fund | ||||
| Asset Valuation Inputs | ||||
| Description |
Level 1 |
Level 2 |
Level 3 |
Total |
| Common Stocks |
|
|
|
|
| Australia |
$—
|
$193,358
|
$—
|
$193,358
|
| Belgium |
— |
769,128 |
— |
769,128 |
| Denmark |
— |
1,370,386 |
— |
1,370,386 |
| France |
— |
2,256,082 |
— |
2,256,082 |
| Germany |
— |
1,645,194 |
— |
1,645,194 |
| Hong Kong |
— |
502,295 |
— |
502,295 |
| Ireland |
— |
823,990 |
— |
823,990 |
| Japan |
— |
2,047,029 |
— |
2,047,029 |
| Netherlands |
— |
1,219,365 |
— |
1,219,365 |
| Norway |
— |
68,068 |
— |
68,068 |
| Spain |
— |
635,259 |
— |
635,259 |
| Switzerland |
— |
469,242 |
— |
469,242 |
| Taiwan |
779,792 |
— |
— |
779,792 |
| United Kingdom |
— |
2,168,040 |
— |
2,168,040 |
| United States |
— |
213,453 |
— |
213,453 |
| Total Common Stocks |
779,792 |
14,380,889 |
— |
15,160,681 |
| Short-Term Investments |
— |
650,074 |
— |
650,074 |
| Total Investments |
$779,792 |
$15,030,963 |
$— |
$15,810,755 |
| Assets |
Investments at value1 |
| Exchange-traded asset derivatives |
|
| Equity contracts |
$33,444,020
|
| Liabilities |
Options written at
value |
| Exchange-traded liability derivatives |
|
| Equity contracts |
$(132,505,730
) |
| 1 |
Represents purchased options, at value. |
| Net Realized Gain (Loss) on: |
Investments1 |
Options written |
| Equity contracts |
$(263,631,242
) |
$(277,552,151
) |
| Net Change in Unrealized Appreciation (Depreciation) on: |
Investments1 |
Options written |
| Equity contracts |
$17,236,331
|
$(125,271,660
) |
| 1 |
Represents realized loss and change in unrealized appreciation (depreciation), respectively, for purchased options during the period. |
| Liabilities |
Options written at
value |
| Exchange-traded liability derivatives |
|
| Equity contracts |
$(5,550,885
) |
| Net Realized Gain (Loss) on: |
Options written |
| Equity contracts |
$(9,998,985
) |
| Net Change in Unrealized Appreciation (Depreciation) on: |
Options written |
| Equity contracts |
$(3,846,143
) |
| Assets |
Unrealized appreciation
on futures contracts |
| Exchange-traded asset derivatives |
|
| Interest rate contracts |
$172,194
|
| Liabilities |
Unrealized depreciation
on futures
contracts |
| Exchange-traded liability derivatives |
|
| Foreign exchange contracts |
$(255,505
) |
| Net Realized Gain (Loss) on: |
Futures contracts |
| Interest rate contracts |
$(350,179
) |
| Foreign exchange contracts |
(709,857 ) |
| Total |
$(1,060,036 ) |
| Net Change in Unrealized Appreciation (Depreciation) on: |
Futures contracts |
| Interest rate contracts |
$167,772
|
| Foreign exchange contracts |
338,093 |
| Total |
$505,865 |
| Gateway Fund |
Call
Options
Written* |
Put Options
Purchased* |
| Average Notional Amount Outstanding |
99.03 % |
96.89 % |
| Highest Notional Amount Outstanding |
99.27 % |
99.27 % |
| Lowest Notional Amount Outstanding |
98.91 % |
83.58 % |
| Notional Amount Outstanding as of December 31, 2023 |
99.06 % |
99.06 % |
| * |
Notional amounts outstanding are determined by multiplying option contracts by the contract multiplier by the price of the option’s underlying index, the S&P
500 ® Index. |
| Gateway Equity Call Premium Fund |
Call Options
Written* |
| Average Notional Amount Outstanding |
99.01 % |
| Highest Notional Amount Outstanding |
99.18 % |
| Lowest Notional Amount Outstanding |
98.88 % |
| Notional Amount Outstanding as of December 31, 2023 |
99.06 % |
| * |
Notional amounts outstanding are determined by multiplying option contracts by the contract multiplier by the price of the option’s underlying index, the S&P
500 ® Index. |
| Global Green Bond Fund |
Futures |
| Average Notional Amount Outstanding |
88.12 % |
| Highest Notional Amount Outstanding |
94.21 % |
| Lowest Notional Amount Outstanding |
81.41 % |
| Notional Amount Outstanding as of December 31, 2023 |
83.41 % |
| Fund |
Purchases |
Sales |
| Gateway Fund |
$1,108,432,138
|
$2,282,966,480
|
| Gateway Equity Call Premium Fund |
155,343,392 |
71,036,680 |
| Global Green Bond Fund |
5,942,078 |
8,198,508 |
| Global Sustainable Equity Fund |
218,798,013 |
225,304,218 |
| International Sustainable Equity Fund |
6,406,141 |
1,584,065 |
| |
Percentage of Average Daily
Net Assets | ||
| Fund |
First $5 Billion |
Next $5 Billion |
Over $10 Billion |
| Gateway Fund |
0.60 % |
0.55 % |
0.53 % |
| Gateway Equity Call Premium Fund |
0.58 % |
0.58 % |
0.58 % |
| Fund |
Percentage of Average
Daily Net Assets |
| Global Green Bond Fund |
0.50 % |
| Global Sustainable Equity Fund |
0.80 % |
| International Sustainable Equity Fund |
0.80 % |
| |
Expense Limit as a
Percentage of Average Daily Net Assets | |||
| Fund |
Class A |
Class C |
Class N |
Class Y |
| Gateway Fund |
0.94 % |
1.70 % |
0.65 % |
0.70 % |
| Gateway Equity Call Premium Fund |
0.93 % |
1.68 % |
0.63 % |
0.68 % |
| Global Green Bond Fund |
0.90 % |
— % |
0.60 % |
0.65 % |
| Global Sustainable Equity Fund |
1.20 % |
1.95 % |
0.90 % |
0.95 % |
| International Sustainable Equity Fund |
1.20 % |
— % |
0.90 % |
0.95 % |
| |
Gross
Management
Fees |
Contractual
Waivers of
Management
Fees1 |
Net
Management
Fees |
Percentage of
Average
Daily Net Assets | |
| Fund |
Gross |
Net | |||
| Gateway Fund |
$37,243,672
|
$2,100,511
|
$35,143,161
|
0.59 % |
0.56 % |
| Gateway Equity Call Premium Fund |
1,331,624 |
372,113 |
959,511 |
0.58 % |
0.42 % |
| Global Green Bond Fund |
185,382 |
175,012 |
10,370 |
0.50 % |
0.03 % |
| Global Sustainable Equity Fund |
7,814,183 |
— |
7,814,183 |
0.80 % |
0.80 % |
| International Sustainable Equity Fund |
97,770 |
97,770 |
— |
0.80 % |
— % |
| 1 |
Waiver/expense reimbursements are subject to possible recovery until December 31, 2024. |
| |
Reimbursement1 | ||||
| |
Class A |
Class C |
Class N |
Class Y |
Total |
| Gateway Fund |
$81,624
|
$—
|
$—
|
$—
|
$81,624
|
| Global Sustainable Equity Fund |
12,415 |
4,660 |
— |
292,362 |
309,437 |
| 1 |
Waiver/expense reimbursements are subject to possible recovery until December 31, 2024. |
| |
Service Fees |
|
Distribution Fees | |
| Fund |
Class A |
Class C |
|
Class C |
| Gateway Fund |
$2,023,389
|
$175,569
|
|
$526,705
|
| Gateway Equity Call Premium Fund |
4,981 |
2,623 |
|
7,869 |
| Global Green Bond Fund |
12,757 |
— |
|
— |
| Global Sustainable Equity Fund |
73,677 |
27,643 |
|
82,929 |
| International Sustainable Equity Fund |
1,574 |
— |
|
— |
| Fund |
Administrative Fees |
| Gateway Fund |
$2,925,931
|
| Gateway Equity Call Premium Fund |
106,333 |
| Global Green Bond Fund |
17,176 |
| Global Sustainable Equity Fund |
452,405 |
| International Sustainable Equity Fund |
5,660 |
| Fund |
Sub-Transfer Agent Fees |
| Gateway Fund |
$3,920,753
|
| Gateway Equity Call Premium Fund |
166,361 |
| Global Green Bond Fund |
24,112 |
| Global Sustainable Equity Fund |
760,191 |
| International Sustainable Equity Fund |
1,841 |
| Fund |
Reimbursements of
Sub-Transfer Agent Fees |
| Gateway Fund |
$48,029
|
| Gateway Equity Call Premium Fund |
2,244 |
| Global Green Bond Fund |
307 |
| Global Sustainable Equity Fund |
8,574 |
| International Sustainable Equity Fund |
20 |
| Fund |
Commissions |
| Gateway Fund |
$38,592
|
| Gateway Equity Call Premium Fund |
471 |
| Global Sustainable Equity Fund |
3,798 |
| |
Percentage of Net Assets |
| Global Green Bond Fund |
|
| Natixis Sustainable Future 2015 Fund |
1.55 % |
| Natixis Sustainable Future 2020 Fund |
1.17 % |
| Natixis Sustainable Future 2025 Fund |
2.54 % |
| Natixis Sustainable Future 2030 Fund |
3.73 % |
| Natixis Sustainable Future 2035 Fund |
2.73 % |
| Natixis Sustainable Future 2040 Fund |
2.26 % |
| Natixis Sustainable Future 2045 Fund |
1.66 % |
| Natixis Sustainable Future 2050 Fund |
0.78 % |
| Natixis Sustainable Future 2055 Fund |
0.58 % |
| Natixis Sustainable Future 2060 Fund |
0.47 % |
| Natixis Sustainable Future 2065 Fund |
0.12 % |
| |
17.59 % |
| International Sustainable Equity Fund |
|
| Natixis Sustainable Future 2015 Fund |
1.17 % |
| Natixis Sustainable Future 2020 Fund |
1.16 % |
| Natixis Sustainable Future 2025 Fund |
3.21 % |
| Natixis Sustainable Future 2030 Fund |
6.35 % |
| Natixis Sustainable Future 2035 Fund |
7.61 % |
| Natixis Sustainable Future 2040 Fund |
9.28 % |
| Natixis Sustainable Future 2045 Fund |
9.06 % |
| Natixis Sustainable Future 2050 Fund |
9.86 % |
| Natixis Sustainable Future 2055 Fund |
8.52 % |
| Natixis Sustainable Future 2060 Fund |
6.86 % |
| Natixis Sustainable Future 2065 Fund |
1.80 % |
| |
64.88 % |
| |
Reimbursement of Transfer
Agency Expenses |
| Fund |
Class N |
| Gateway Equity Call Premium Fund |
$1,220
|
| Global Green Bond Fund |
1,409 |
| Global Sustainable Equity Fund |
2,119 |
| International Sustainable Equity Fund |
1,391 |
| |
Transfer Agent Fees and Expenses |
|||
| Fund |
Class A |
Class C |
Class N |
Class Y |
| Gateway Fund |
$606,675
|
$52,206
|
$3,757
|
$3,721,827
|
| Gateway Equity Call Premium Fund |
1,603 |
845 |
1,220 |
181,995 |
| Global Green Bond Fund |
4,797 |
— |
1,409 |
24,374 |
| Global Sustainable Equity Fund |
30,705 |
11,532 |
2,119 |
744,226 |
| International Sustainable Equity Fund |
812 |
— |
1,391 |
3,676 |
| Fund |
Number of 5%
Non-Affiliated
Account Holders |
Percentage of
Non-Affiliated
Ownership |
Percentage of
Affiliated
Ownership
(Note 6g) |
Total Percentage of
Ownership |
| Gateway Equity Call Premium Fund |
2 |
62.46 % |
— |
62.46 % |
| Global Green Bond Fund |
3 |
40.40 % |
17.59 % |
57.99 % |
| Global Sustainable Equity Fund |
1 |
29.47 % |
— |
29.47 % |
| International Sustainable Equity Fund |
1 |
25.67 % |
64.88 % |
90.55 % |
| | ||||
| |
Year
Ended December 31, 2023 |
Year
Ended December 31, 2022 | ||
| Gateway Fund |
Shares |
Amount |
Shares |
Amount |
| Class A |
|
|
|
|
| Issued from the sale of shares |
2,250,045 |
$86,681,548
|
2,990,927 |
$111,688,911
|
| Issued in connection with the reinvestment of distributions |
125,258 |
4,809,810 |
132,916 |
4,799,294 |
| Redeemed |
(7,534,909 ) |
(286,159,321 ) |
(5,070,154 ) |
(186,569,866 ) |
| Net change |
(5,159,606 ) |
$(194,667,963 ) |
(1,946,311 ) |
$(70,081,661 ) |
| Class C |
|
|
|
|
| Issued from the sale of shares |
114,571 |
$4,344,276
|
295,524 |
$11,043,487
|
| Issued in connection with the reinvestment of distributions |
895 |
32,579 |
— |
— |
| Redeemed |
(766,764 ) |
(29,081,970 ) |
(923,521 ) |
(33,943,135 ) |
| Net change |
(651,298 ) |
$(24,705,115 ) |
(627,997 ) |
$(22,899,648 ) |
| Class N |
|
|
|
|
| Issued from the sale of shares |
8,389,514 |
$319,637,421
|
4,827,293 |
$182,200,937
|
| Issued in connection with the reinvestment of distributions |
60,632 |
2,345,713 |
64,735 |
2,340,801 |
| Redeemed |
(5,712,741 ) |
(218,129,967 ) |
(6,643,828 ) |
(244,989,922 ) |
| Net change |
2,737,405 |
$103,853,167 |
(1,751,800 ) |
$(60,448,184 ) |
| Class Y |
|
|
|
|
| Issued from the sale of shares |
20,635,979 |
$787,928,953
|
33,208,989 |
$1,246,241,832
|
| Issued in connection with the reinvestment of distributions |
990,545 |
38,109,137 |
1,096,216 |
39,614,732 |
| Redeemed |
(37,090,574 ) |
(1,407,466,641 ) |
(52,875,105 ) |
(1,938,033,620 ) |
| Net change |
(15,464,050 ) |
$(581,428,551 ) |
(18,569,900 ) |
$(652,177,056 ) |
| Decrease from capital share transactions |
(18,537,549 ) |
$(696,948,462 ) |
(22,896,008 ) |
$(805,606,549 ) |
| | ||||
| |
Year
Ended December 31, 2023 |
Year
Ended December 31, 2022 | ||
| Gateway Equity Call Premium Fund |
Shares |
Amount |
Shares |
Amount |
| Class A |
|
|
|
|
| Issued from the sale of shares |
84,354 |
$1,368,426
|
21,527 |
$334,499
|
| Issued in connection with the reinvestment of distributions |
798 |
12,817 |
807 |
11,890 |
| Redeemed |
(74,070 ) |
(1,204,008 ) |
(68,414 ) |
(1,058,963 ) |
| Net change |
11,082 |
$177,235 |
(46,080 ) |
$(712,574 ) |
| Class C |
|
|
|
|
| Issued from the sale of shares |
4,953 |
$78,355
|
45,751 |
$665,059
|
| Issued in connection with the reinvestment of distributions |
26 |
383 |
41 |
601 |
| Redeemed |
(3,155 ) |
(49,339 ) |
(29,736 ) |
(422,608 ) |
| Net change |
1,824 |
$29,399 |
16,056 |
$243,052 |
| Class N |
|
|
|
|
| Issued from the sale of shares |
935 |
$15,187
|
1,231 |
$18,762
|
| Issued in connection with the reinvestment of distributions |
152 |
2,435 |
156 |
2,287 |
| Redeemed |
(1,073 ) |
(17,026 ) |
(12,648 ) |
(196,525 ) |
| Net change |
14 |
$596 |
(11,261 ) |
$(175,476 ) |
| Class Y |
|
|
|
|
| Issued from the sale of shares |
8,360,297 |
$130,743,512
|
6,302,053 |
$95,742,078
|
| Issued in connection with the reinvestment of distributions |
50,292 |
810,357 |
34,360 |
498,728 |
| Redeemed |
(2,062,972 ) |
(32,893,310 ) |
(3,097,465 ) |
(45,769,567 ) |
| Net change |
6,347,617 |
$98,660,559 |
3,238,948 |
$50,471,239 |
| Increase from capital share transactions |
6,360,537 |
$98,867,789 |
3,197,663 |
$49,826,241 |
| | ||||
| |
Year
Ended December 31, 2023 |
Year
Ended December 31, 2022 | ||
| Global Green Bond Fund |
Shares |
Amount |
Shares |
Amount |
| Class A |
|
|
|
|
| Issued from the sale of shares |
169,471 |
$1,388,780
|
224,455 |
$2,033,286
|
| Issued in connection with the reinvestment of distributions |
12,026 |
102,943 |
36,736 |
308,268 |
| Redeemed |
(226,585 ) |
(1,859,391 ) |
(271,498 ) |
(2,361,128 ) |
| Net change |
(45,088 ) |
$(367,668 ) |
(10,307 ) |
$(19,574 ) |
| Class N |
|
|
|
|
| Issued from the sale of shares |
284,123 |
$2,354,569
|
325,512 |
$2,912,104
|
| Issued in connection with the reinvestment of distributions |
18,082 |
155,506 |
35,400 |
298,746 |
| Redeemed |
(128,179 ) |
(1,053,990 ) |
(508,558 ) |
(4,731,582 ) |
| Net change |
174,026 |
$1,456,085 |
(147,646 ) |
$(1,520,732 ) |
| Class Y |
|
|
|
|
| Issued from the sale of shares |
887,228 |
$7,320,787
|
1,025,177 |
$9,141,286
|
| Issued in connection with the reinvestment of distributions |
59,917 |
514,685 |
162,421 |
1,369,017 |
| Redeemed |
(915,050 ) |
(7,572,748 ) |
(1,230,856 ) |
(10,806,351 ) |
| Net change |
32,095 |
$262,724 |
(43,258 ) |
$(296,048 ) |
| Increase (decrease) from capital share transactions |
161,033 |
$1,351,141 |
(201,211 ) |
$(1,836,354 ) |
| | ||||
| |
Year
Ended December 31, 2023 |
Year
Ended December 31, 2022 | ||
| Global Sustainable Equity Fund |
Shares |
Amount |
Shares |
Amount |
| Class A |
|
|
|
|
| Issued from the sale of shares |
319,563 |
$5,279,594
|
633,351 |
$10,228,563
|
| Issued in connection with the reinvestment of distributions |
3,686 |
64,954 |
54,978 |
948,248 |
| Redeemed |
(527,507 ) |
(8,697,376 ) |
(883,055 ) |
(13,688,073 ) |
| Net change |
(204,258 ) |
$(3,352,828 ) |
(194,726 ) |
$(2,511,262 ) |
| Class C |
|
|
|
|
| Issued from the sale of shares |
47,265 |
$745,422
|
127,671 |
$2,080,308
|
| Issued in connection with the reinvestment of distributions |
179 |
2,743 |
13,506 |
224,871 |
| Redeemed |
(202,619 ) |
(3,155,603 ) |
(230,165 ) |
(3,378,088 ) |
| Net change |
(155,175 ) |
$(2,407,438 ) |
(88,988 ) |
$(1,072,909 ) |
| Class N |
|
|
|
|
| Issued from the sale of shares |
4,330,117 |
$73,586,288
|
6,250,775 |
$105,399,673
|
| Issued in connection with the reinvestment of distributions |
85,975 |
1,543,909 |
581,695 |
10,042,156 |
| Redeemed |
(3,580,470 ) |
(59,873,794 ) |
(5,072,369 ) |
(79,685,344 ) |
| Net change |
835,622 |
$15,256,403 |
1,760,101 |
$35,756,485 |
| Class Y |
|
|
|
|
| Issued from the sale of shares |
13,419,204 |
$222,142,090
|
17,246,094 |
$287,327,840
|
| Issued in connection with the reinvestment of distributions |
208,375 |
3,736,457 |
1,489,114 |
25,731,128 |
| Redeemed |
(13,483,041 ) |
(227,342,858 ) |
(17,853,965 ) |
(281,709,316 ) |
| Net change |
144,538 |
$(1,464,311 ) |
881,243 |
$31,349,652 |
| Increase from capital share transactions |
620,727 |
$8,031,826 |
2,357,630 |
$63,521,966 |
| | ||||
| |
Year
Ended December 31, 2023 |
Year
Ended December 31, 2022 | ||
| International Sustainable Equity Fund |
Shares |
Amount |
Shares |
Amount |
| Class A |
|
|
|
|
| Issued from the sale of shares |
19,700 |
$225,337
|
68,704 |
$727,987
|
| Issued in connection with the reinvestment of distributions |
534 |
6,318 |
2,437 |
25,462 |
| Redeemed |
(38,003 ) |
(432,287 ) |
(29,117 ) |
(307,887 ) |
| Net change |
(17,769 ) |
$(200,632 ) |
42,024 |
$445,562 |
| Class N |
|
|
|
|
| Issued from the sale of shares |
267,242 |
$3,026,216
|
309,325 |
$3,440,154
|
| Issued in connection with the reinvestment of distributions |
11,672 |
138,982 |
26,059 |
273,620 |
| Redeemed |
(100,009 ) |
(1,125,587 ) |
(1,543,327 ) |
(16,210,215 ) |
| Net change |
178,905 |
$2,039,611 |
(1,207,943 ) |
$(12,496,441 ) |
| Class Y |
|
|
|
|
| Issued from the sale of shares |
369,510 |
$4,224,686
|
89,827 |
$983,179
|
| Issued in connection with the reinvestment of distributions |
1,027 |
12,197 |
2,813 |
29,504 |
| Redeemed |
(21,082 ) |
(227,343 ) |
(139,767 ) |
(1,453,883 ) |
| Net change |
349,455 |
$4,009,540 |
(47,127 ) |
$(441,200 ) |
| Increase (decrease) from capital share transactions |
510,591 |
$5,848,519 |
(1,213,046 ) |
$(12,492,079 ) |
Boston, Massachusetts
February 22, 2024
| Fund |
Qualifying Percentage |
| Gateway Fund |
100.00 % |
| Gateway Equity Call Premium Fund |
100.00 % |
| Global Sustainable Equity Fund |
97.51 % |
| Fund |
Qualifying Percentage |
| Gateway Fund |
100.00 % |
| Gateway Equity Call Premium Fund |
100.00 % |
| Global Sustainable Equity Fund |
100.00 % |
| International Sustainable Equity Fund |
100.00 % |
| Fund |
Foreign-Tax Credit Pass-Through |
Foreign Source Income |
| International Sustainable Equity Fund |
$24,008
|
$303,880
|
| Name and Year of Birth |
Position(s) Held with the Trusts, Length
of Time Served and
Term of Office1 |
Principal Occupation(s) During Past 5 Years |
Number of Portfolios in Fund Complex Overseen2and Other Directorships Held During Past 5 Years |
Experience, Qualifications, Attributes, Skills for Board Membership |
| Independent Trustees |
|
|
|
|
| Edmond J.
English (1953) |
Trustee since 2013
Contract Review
Committee Member |
Executive Chairman of Bob’s Discount Furniture (retail) |
51 Director, Burlington Stores, Inc. (retail); Director, Rue La La (e-commerce retail) |
Significant experience on the Board and on the boards of other business organizations (including retail companies and a bank); executive experience (including at a retail company) |
| Richard A.
Goglia (1951) |
Trustee since 2015
Chairperson of the
Audit Committee |
Retired |
51 Formerly, Director of Triumph Group (aerospace industry) |
Significant experience on the Board and executive experience (including his role as Vice President and treasurer of a defense company and experience at a financial services company) |
| Martin T. Meehan
(1956) |
Trustee since 2012
Chairperson of the
Governance Committee
and Contract Review Committee Member |
President, University of Massachusetts |
51 None |
Significant experience on the Board and on the boards of other business organizations; experience as President of the University of Massachusetts; government experience (including as a member of the U.S. House of Representatives); academic experience |
| Maureen B.
Mitchell (1951) |
Trustee since 2017
Chairperson of the
Contract Review
Committee |
Retired |
51 Director, Sterling Bancorp (bank) |
Significant experience on the Board; financial services industry and executive experience (including role as President of global sales and marketing at a financial services company) |
| Name and Year of Birth |
Position(s) Held with the Trusts, Length of Time Served and Term of Office1 |
Principal Occupation(s) During Past 5 Years |
Number of Portfolios in Fund Complex Overseen2and Other Directorships Held During Past 5 Years |
Experience, Qualifications, Attributes, Skills for Board Membership |
| Independent Trustees − continued | ||||
| James P.
Palermo (1955) |
Trustee since 2016
Audit Committee
Member and
Governance
Committee
Member |
Founding Partner, Breton Capital Management, LLC (private equity); formerly, Partner, STEP Partners, LLC (private equity) |
51 Director, Candidly (chemicals and biofuels) |
Significant experience on the Board; financial services industry and executive experience (including roles as Chief Executive Officer of client management and asset servicing for a banking and financial services company) |
| Erik R.
Sirri (1958) |
Chairperson of the
Board of Trustees since 2021 Trustee since 2009 Ex Officio Member of
the Audit Committee, Contract Review Committee and Governance Committee |
Retired; formerly, Professor of Finance at Babson College |
51 None |
Significant experience on the Board; experience as Director of the Division of Trading and Markets at the Securities and Exchange Commission; academic experience; training as an economist |
| Peter J.
Smail (1952) |
Trustee since 2009
Contract Review
Committee
Member |
Retired |
51 None |
Significant experience on the Board; mutual fund industry and executive experience (including roles as President and Chief Executive Officer for an investment adviser) |
| Name and Year of Birth |
Position(s) Held with the Trusts, Length of Time Served and Term of Office1 |
Principal Occupation(s) During Past 5 Years |
Number of Portfolios in Fund Complex Overseen2and Other Directorships Held During Past 5 Years |
Experience, Qualifications, Attributes, Skills for Board Membership |
| Independent Trustees − continued | ||||
| Kirk A.
Sykes (1958) |
Trustee since 2019
Audit Committee
Member and Governance Committee Member |
Managing Director of Accordia Partners, LLC (real estate development); President of Primary Corporation (real estate development); Managing Principal of Merrick Capital Partners (infrastructure finance) |
51 Advisor/Risk Management Committee, Eastern Bank (bank); Director, Apartment Investment and Management Company (real estate investment trust); formerly, Director, Ares Commercial Real Estate Corporation (real estate investment trust) |
Experience on the Board and significant experience on the boards of other business organizations (including real estate companies and banks) |
| Cynthia L.
Walker (1956) |
Trustee since 2005
for Natixis Funds
Trust I and 2007
for Gateway Trust
Audit Committee
and Governance
Committee Member |
Retired; formerly, Deputy Dean for Finance and Administration, Yale University School of Medicine |
51 None |
Significant experience on the Board; executive experience in a variety of academic organizations (including roles as dean for finance and administration) |
| Interested Trustees |
|
|
|
|
| Kevin P.
Charleston3 (1965)
One Financial Center Boston, MA 02111 |
Trustee since 2015 |
President, Chief Executive Officer and Chairman of the Board of Directors, Loomis, Sayles & Company, L.P. |
51 None |
Significant experience on the Board; continuing service as President, Chief Executive Officer and Chairman of the Board of Directors of Loomis, Sayles & Company, L.P. |
| David L.
Giunta4 (1965) |
Trustee since 2011
President and Chief
Executive Officer |
President and Chief Executive Officer, Natixis Advisors, LLC and Natixis Distribution, LLC |
51 None |
Significant experience on the Board; experience as President and Chief Executive Officer of Natixis Advisors, LLC and Natixis Distribution, LLC |
| 1 |
Each Trustee serves until retirement, resignation or removal from the Board. The current retirement age is 75. The position of Chairperson of the Board is
appointed for a three-year term. |
| 2 |
The Trustees of the Trusts serve as Trustees of a fund complex that includes all series of the Natixis Funds Trust I, Natixis Funds Trust II, Natixis Funds Trust IV,
Gateway Trust, Loomis Sayles Funds I, Loomis Sayles Funds II, Natixis ETF Trust
and Natixis ETF Trust II (collectively, the “Fund Complex”). |
| 3 |
Mr. Charleston is deemed an “interested person” of the Trusts because he holds the following positions with an affiliated person of the Trusts: President, Chief
Executive Officer and Chairman of the Board of Directors of Loomis, Sayles & Company,
L.P. |
| 4 |
Mr. Giunta is deemed an “interested person” of the Trusts because he holds the following positions with an affiliated person of the Trusts: President and Chief
Executive Officer, Natixis Advisors, LLC and Natixis Distribution, LLC. |
| Name and Year of Birth |
Position(s) Held with the Trusts |
Term of Office1 and Length
of Time Served |
Principal Occupation(s) During Past 5 Years2 |
| Officers of the Trusts |
|
|
|
| Matthew J. Block (1981) |
Treasurer, Principal Financial and Accounting Officer |
Since 2022 |
Senior Vice President, Natixis Advisors, LLC and Natixis Distribution, LLC; formerly, Vice President, Natixis Advisors, LLC and Natixis Distribution, LLC; Assistant Treasurer of the Fund Complex |
| Susan McWhan Tobin (1963) |
Secretary and Chief Legal Officer |
Since 2022 |
Executive Vice President, General Counsel and Secretary, Natixis Advisors, LLC and Natixis Distribution, LLC; formerly, Executive Vice President and Chief Compliance Officer of Natixis Investment Managers (March 2019 – May 2022) and Senior Vice President and Head of Compliance, U.S. for Natixis Investment Managers (July 2011 – March 2019) |
| Natalie R. Wagner (1979) |
Chief Compliance Officer, Assistant Secretary and Anti-Money Laundering Officer |
Since 2021 |
Senior Vice President, Natixis Advisors, LLC and Natixis Distribution, LLC; formerly, Vice President, Head of Corporate Compliance, Global Atlantic Financial Group |
| 1 |
Each officer of the Trusts serves for an indefinite term in accordance with the Trusts' current by-laws until the date his or her successor is elected and qualified,
or until he or she sooner dies, retires, is removed or becomes
disqualified. |
| 2 |
Each person listed above, except as noted, holds the same position(s) with the Fund Complex. Previous positions during the past five years with Natixis
Distribution, LLC, Natixis Advisors, LLC or Loomis, Sayles & Company, L.P. are omitted,
if not materially different from an officer’s current position with such
entity. |
Visit: im.natixis.com Call: 800-225-5478
Natixis Advisors, LLC
888 Boylston Street, Suite 800
Boston, MA 02199-8197

Exp. 3/1/2025
(b) Not Applicable.
Item 2. Code of Ethics.
The Registrant has adopted a code of ethics that applies to the Registrant’s principal executive officer, principal financial officer and persons performing similar functions. There have been no amendments or waivers of the Registrant’s code of ethics during the period.
Item 3. Audit Committee Financial Expert.
The Board of Trustees of the Registrant has established an audit committee. Mr. Richard A. Goglia, Mr. James P. Palermo, Mr. Kirk A. Sykes and Ms. Cynthia L. Walker are members of the audit committee and have been designated as “audit committee financial experts” by the Board of Trustees. Each of these individuals is also an Independent Trustee of the Registrant.
Item 4. Principal Accountant Fees and Services.
Fees billed by the Principal Accountant for services rendered to the Registrant.
The table below sets forth fees billed by the principal accountant, PricewaterhouseCoopers LLP, for the past two fiscal years for professional services rendered in connection with a) the audit of the Registrant’s annual financial statements and services provided in connection with regulatory filings; b) audit-related services (including services that are reasonably related to the performance of the audit of the Registrant’s financial statements but not reported under “Audit Fees”); c) tax compliance, tax advice and tax planning and d) all other fees billed for professional services rendered by the principal accountant to the Registrant, other than the services reported as a part of (a) through (c) of this Item.
| Audit fees | Audit-related fees1 | Tax fees2 | All other fees | |||||||||||||||||||||||||||||
| 1/1/22-12/31/22 | 1/1/23-12/31/23 | 1/1/22-12/31/22 | 1/1/23-12/31/23 | 1/1/22-12/31/22 | 1/1/23-12/31/23 | 1/1/22-12/31/22 | 1/1/23-12/31/23 | |||||||||||||||||||||||||
| Gateway Trust |
$ | 88,734 | $ | 91,396 | $ | 1,518 | $ | 1,518 | $ | 18,724 | $ | 19,286 | $ | — | $ | — | ||||||||||||||||
| 1. | Audit-related fees consist of: |
2022 & 2023 – performance of agreed-upon procedures related to the Registrant’s deferred compensation plan.
| 2. | Tax fees consist of: |
2022 & 2023 – review of the Registrant’s tax returns.
Aggregate fees billed to the Registrant for non-audit services during 2022 and 2023 were $20,242 and $20,804, respectively.
Fees billed by the Principal Accountant for services rendered to the Adviser and Control Affiliates.
The following table sets forth the fees billed by the Registrant’s principal accountant for non-audit services rendered to Gateway Investment Advisers, LLC (“Gateway”) and entities controlling, controlled by or under common control with Gateway (“Control Affiliates”) that provide ongoing services to the Registrant, for engagements that related directly to the operations and financial reporting of the Registrant for the last two fiscal years.
| Audit-related fees | Tax fees | All other fees | ||||||||||||||||||||||
| 1/1/22-12/31/22 | 1/1/23-12/31/23 | 1/1/22-12/31/22 | 1/1/23-12/31/23 | 1/1/22-12/31/22 | 1/1/23-12/31/23 | |||||||||||||||||||
| Control Affiliates |
$ | — | $ | — | $ | — | $ | — | $ | — | $ | — | ||||||||||||
The following table sets forth the aggregate fees billed by the Registrant’s principal accountant for non-audit services rendered to Gateway and Control Affiliates that provide ongoing services to the Registrant, for the last two fiscal years, including the fees disclosed in the table above.
| Aggregate Non-Audit Fees | ||||||||
| 1/1/22-12/31/22 | 1/1/23-12/31/23 | |||||||
| Control Affiliates |
$ | — | $ | 3,500 | ||||
None of the services described above were approved pursuant to paragraph (c)(7)(i)(C) of Regulation S-X.
Audit Committee Pre Approval Policies.
Annually, the Registrant’s Audit Committee reviews the audit, audit-related, tax and other non-audit services together with the projected fees, for services proposed to be rendered to the Registrant and/or other entities for which pre-approval is required during the upcoming year. Any subsequent revisions to already pre-approved services or fees (including fee increases) and requests for pre-approval of new services would be presented for consideration quarterly as needed.
If, in the opinion of management, a proposed engagement by the Registrant’s independent accountants needs to commence before the next regularly scheduled Audit Committee meeting, any member of the Audit Committee who is an independent Trustee of the Registrant is authorized to pre-approve the engagement, but only for engagements to provide audit, audit related and tax services. This approval is subject to review by the full Audit Committee at its next quarterly meeting. All other engagements require the approval of all the members of the Audit Committee.
Item 5. Audit Committee of Listed Registrants.
Not applicable.
Item 6. Schedule of Investments.
Included as part of the Report to Shareholders filed as Item 1 herewith.
Item 7. Disclosure of Proxy Voting Policies and Procedures for Closed-End Management Investment Companies.
Not applicable.
Item 8. Portfolio Managers of Closed-End Management Investment Companies.
Not applicable.
Item 9. Purchases of Equity Securities by Closed-End Management Investment Companies and Affiliated Purchasers.
Not applicable.
Item 10. Submission of Matters to a Vote of Securities Holders.
There were no material changes to the procedures by which shareholders may recommend nominees to the Registrant’s Board of Trustees.
Item 11. Controls and Procedures.
The Registrant’s principal executive officer and principal financial officer have concluded that the Registrant’s disclosure controls and procedures are sufficient to ensure that information required to be disclosed by the Registrant in this Form N-CSR was recorded, processed, summarized and reported within the time periods specified in the Securities and Exchange Commission’s rules and forms, based upon such officers’ evaluation of these controls and procedures as of a date within 90 days of the filing date of the report.
There were no changes in the Registrant’s internal control over financial reporting that occurred during the period covered by the report that have materially affected, or are reasonably likely to materially affect, the Registrant’s internal control over financial reporting.
Item 12. Disclosure of Securities Lending Activities for Closed-End Management Investment Companies.
Not applicable.
Item 13. Recovery of Erroneously Awarded Compensation.
Not applicable.
Item 14. Exhibits.
SIGNATURES
Pursuant to the requirements of the Securities Exchange Act of 1934 and the Investment Company Act of 1940, the Registrant has duly caused this report to be signed on its behalf by the undersigned, thereunto duly authorized.
| Gateway Trust | ||
| By: | /s/ David L. Giunta | |
| Name: | David L. Giunta | |
| Title: | President and Chief Executive Officer | |
| Date: | February 22, 2024 | |
Pursuant to the requirements of the Securities Exchange Act of 1934 and the Investment Company Act of 1940, this report has been signed by the following persons on behalf of the Registrant and in the capacities and on the dates indicated.
| By: | /s/ David L. Giunta | |
| Name: | David L. Giunta | |
| Title: | President and Chief Executive Officer | |
| Date: | February 22, 2024 | |
| By: | /s/ Matthew Block | |
| Name: | Matthew Block | |
| Title: | Treasurer and Principal Financial and Accounting Officer | |
| Date: | February 22, 2024 | |