Exhibit 99.1
ENERGY XXI GULF COAST ANNOUNCES THIRD QUARTER 2017
FINANCIAL AND OPERATIONAL RESULTS
HOUSTON – November 14, 2017 – Energy XXI Gulf Coast, Inc. (“EGC” or the “Company”) (NASDAQ: EXXI) today reported financial and operational results for the third quarter of 2017.
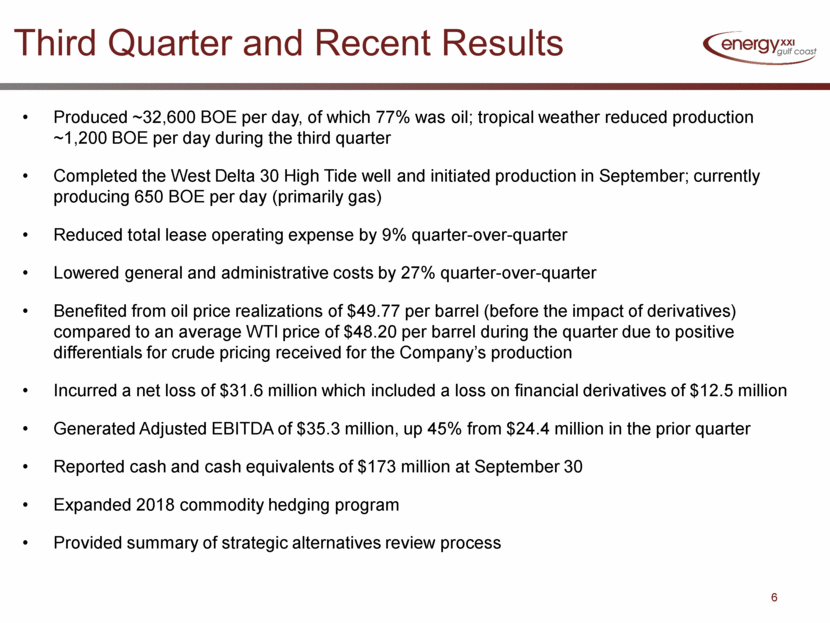
Third Quarter 2017 Highlights and Recent Key Items:
|
· |
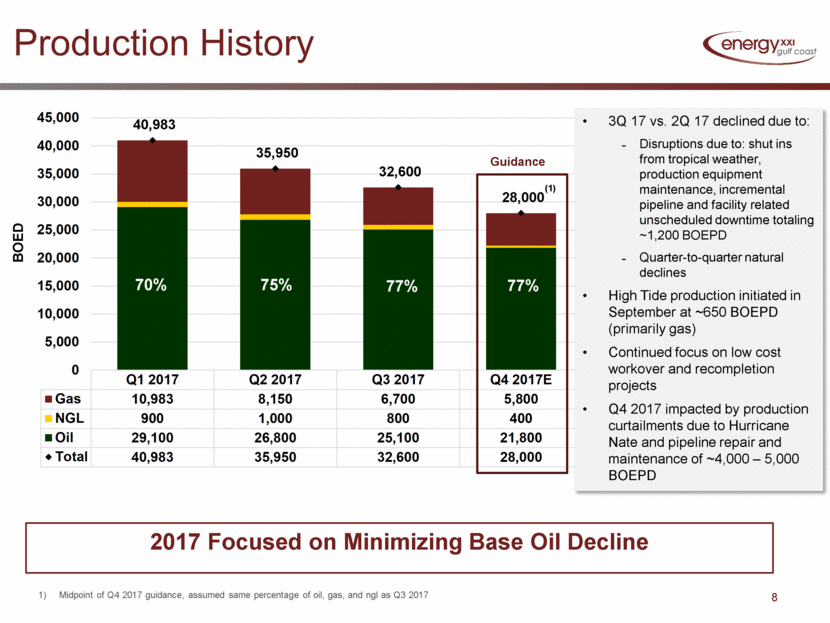
Produced an average of approximately 32,600 barrels of oil equivalent (“BOE”) per day, of which 77% was oil; tropical weather reduced production an average of approximately 1,200 BOE per day during the third quarter |
|
· |
Completed the West Delta 30 High Tide well and initiated production in September; currently producing 650 BOE per day |
|
· |
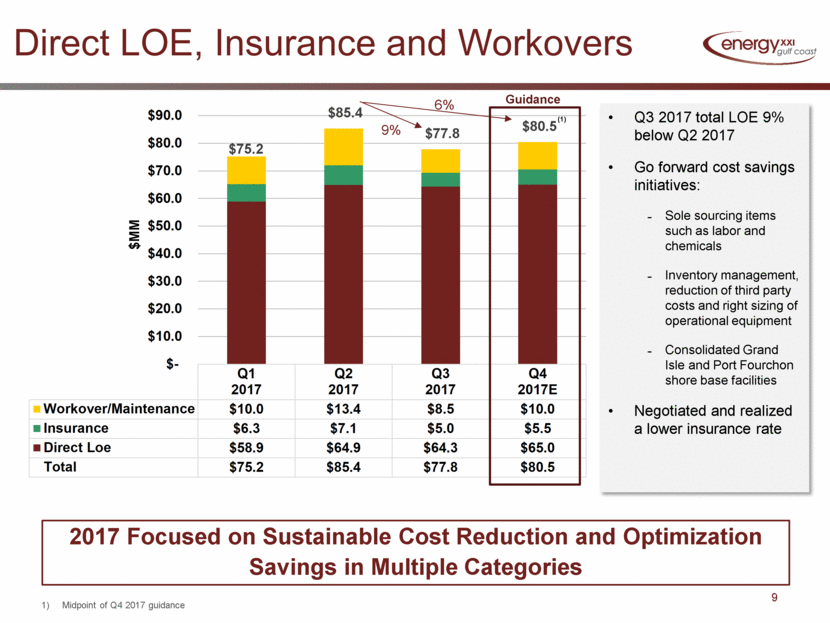
Reduced total lease operating expense (“LOE”) by 9% quarter-over-quarter |
|
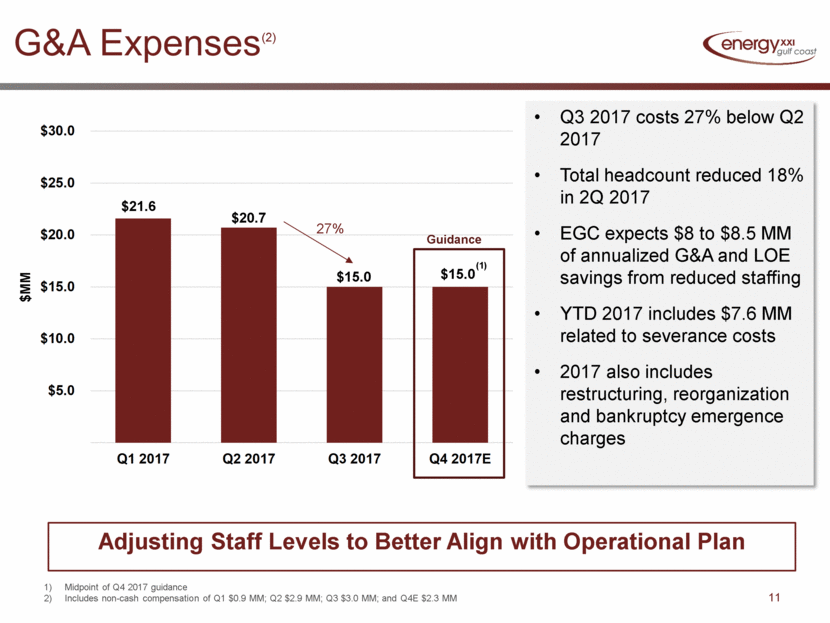
· |
Lowered general and administrative costs (“G&A”) by 27% quarter-over-quarter |
|
· |
Incurred a net loss of $31.6 million which included a loss on financial derivatives of $12.5 million ($14.4 million unrealized loss offset by $1.9 million realized gain) |
|
· |
Generated Adjusted EBITDA of $35.3 million, up 45% from $24.4 million in the prior quarter |
|
· |
Benefited from oil price realizations of $49.77 per barrel (before the impact of derivatives) compared to an average WTI price of $48.20 per barrel during the quarter due to positive differentials for crude pricing received for the Company’s production |
|
· |
Reported cash and cash equivalents of $173 million at September 30, 2017 compared to $165 million at December 31, 2016 |
|
· |
Expanded 2018 commodity hedging program |
|
· |
Provided summary of strategic alternatives review process |
For the third quarter of 2017, EGC reported a net loss of $31.6 million or $0.95 loss per diluted share. Despite reductions in total costs and expenses of $18.8 million, compared to the second quarter, third quarter 2017 financial results were negatively impacted by lower production and a loss on
derivative financial instruments. In the second quarter of 2017, the Company reported a net loss of $23.6 million, or $0.71 loss per diluted share.
Adjusted EBITDA totaled $35.3 million for the third quarter 2017, up 45% from $24.4 million in the second quarter of 2017.
Adjusted EBITDA is a Non-GAAP financial measure and is described and reconciled to net loss in the attached table under “Reconciliation of Non-GAAP Measures.”
Douglas E. Brooks, EGC’s Chief Executive Officer and President commented, “Our successful efforts to reduce LOE and G&A costs contributed to a 45% improvement in Adjusted EBITDA quarter-over-quarter. We also further enhanced our hedge position for 2018 at an average oil price of around $52.00, and successfully completed and brought online our first new well in nearly two years. The West Delta 30 High Tide well, which we operate with a 100% working interest, came in about $1 million under the authorized expenditure for the well and is currently producing 650 BOE per day. We remain confident in our inventory of approximately 50 potential well locations that are available to us in the future.”
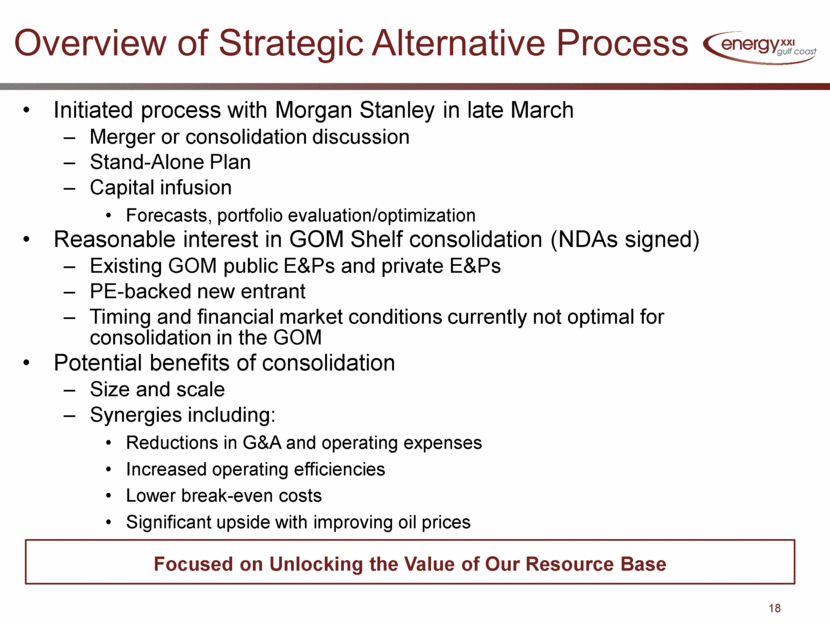
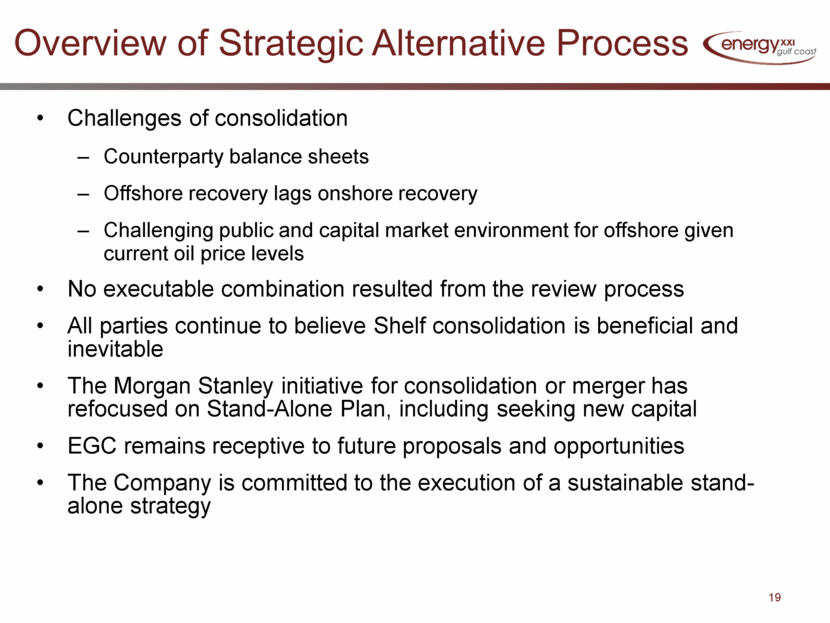
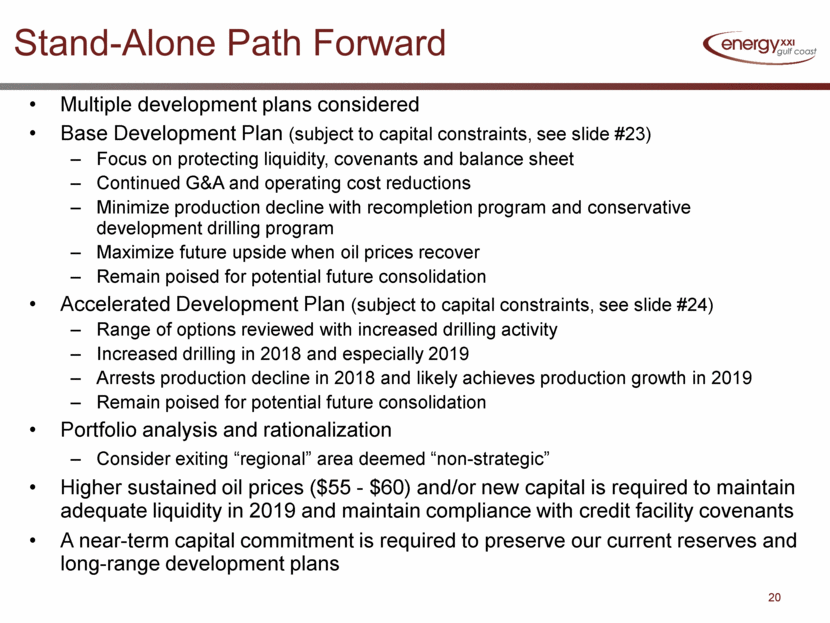
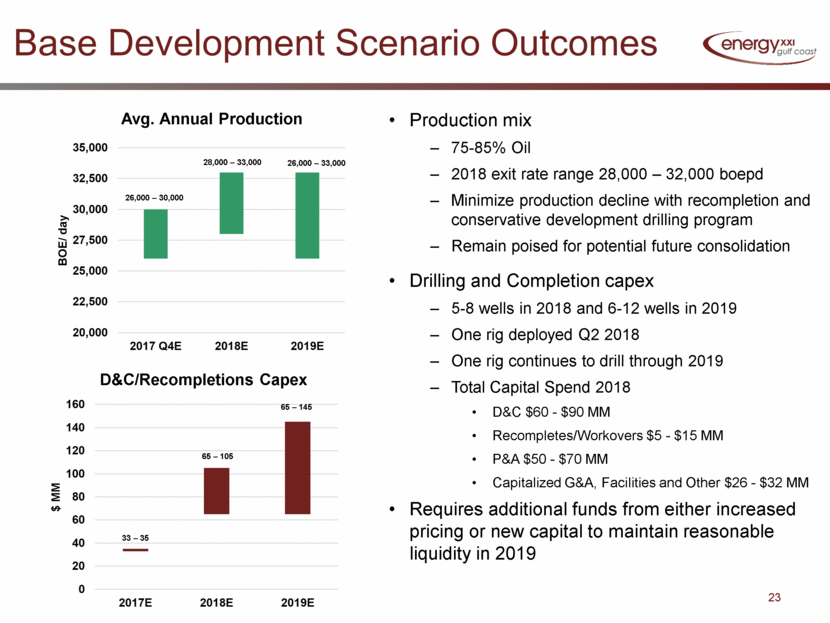
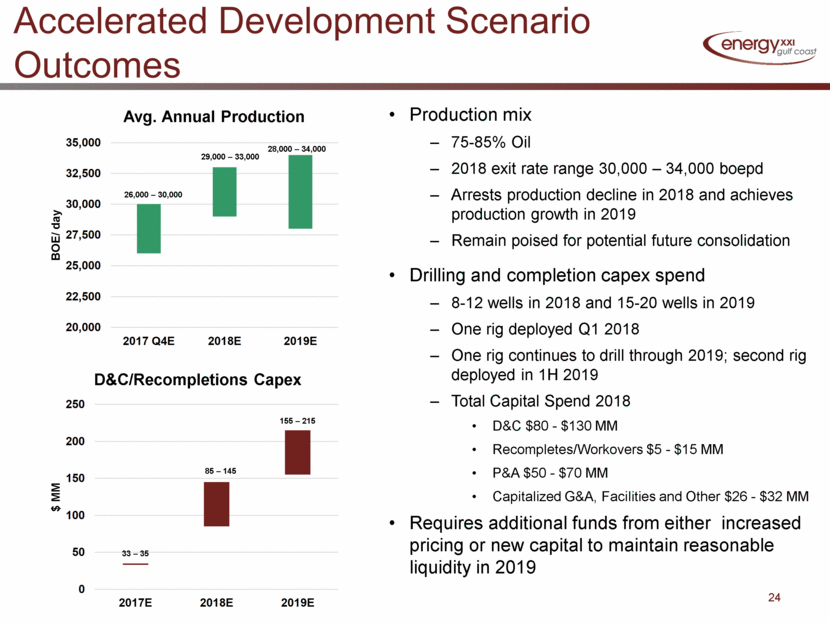
Brooks continued, “We have been working with our financial advisor on our long-term strategic plan for the past six months that focused initially on Gulf of Mexico consolidation discussions, where we felt that significant potential synergies could drive improved results for those involved. We concurrently were developing a stand-alone strategy if that were determined to be the best option. Since no executable combination has resulted from these discussions, we are now focused on our stand-alone options, which include a drilling program beginning in early 2018. This activity in 2018 and beyond may be funded internally through existing liquidity, the benefit of higher oil prices, and continued progress on reducing costs, but could also require accessing the capital markets. We will be finalizing our plan for 2018 over the next several weeks and expect to provide additional guidance early next year, but in the interim we have released a range of forward-looking scenarios that our Board has considered. In all cases we will maintain our strong financial discipline and focus on operating safely, efficiently and effectively. We will continue to drive down costs, enhance production with a recompletion and workover program, and evaluate potential dispositions of non-core properties. We believe that these activities, coupled with an efficient capital investment program, will maximize value for our shareholders and maintain our optionality to include once again considering other strategic options should the opportunity arise in the future.”
2
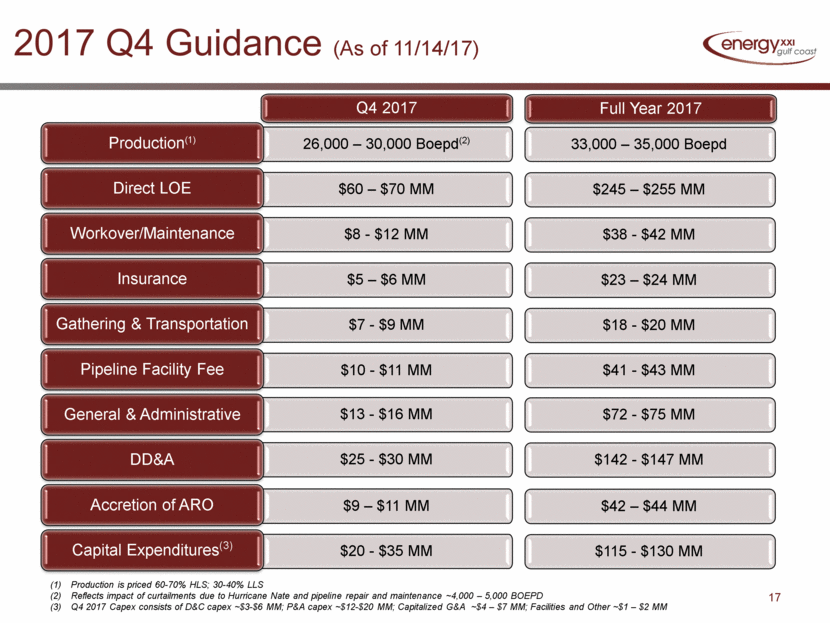
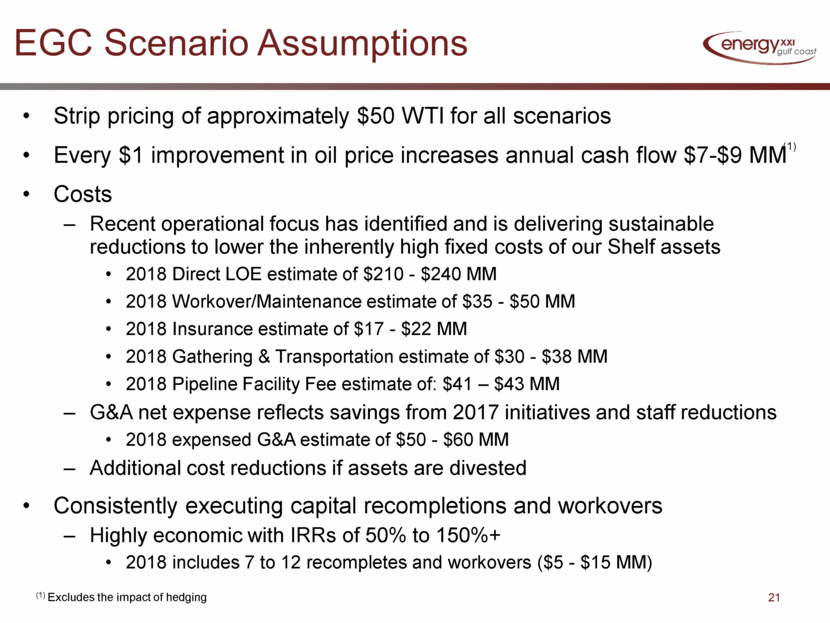
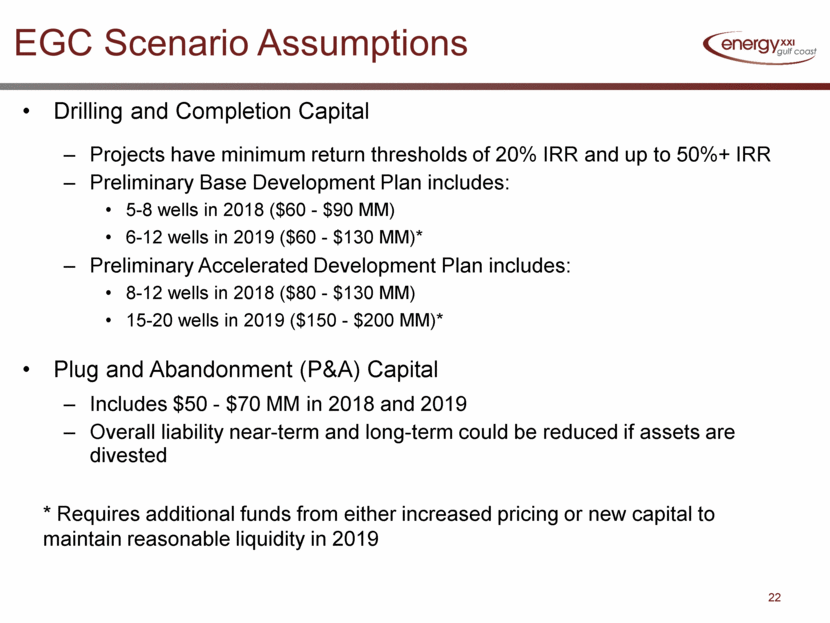
The Company posted an updated investor presentation on its web site this morning that includes additional detail on the results of the strategic review process, full production and cost guidance for the fourth quarter of 2017, and a 2018 outlook along with varying scenarios related to its stand-alone forward strategy. This presentation will be referenced in today’s conference call.
Revenue, Production and Pricing
Total revenues for the third quarter of 2017 were $117.0 million, which includes a $12.5 million loss on derivative financial instruments, while in the second quarter, revenues totaled $143.7 million, which included a $9.4 million gain on derivatives.
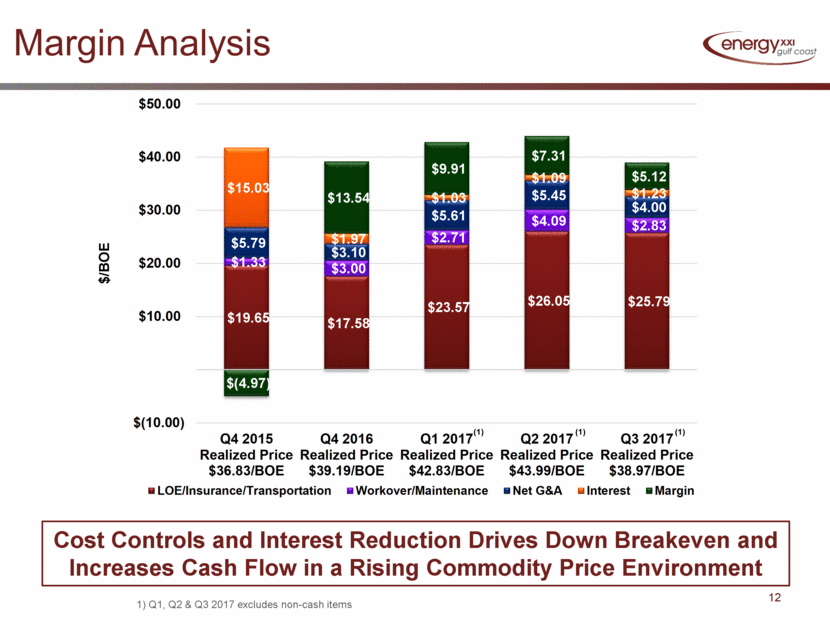
In the third quarter, the Company produced and sold approximately 32,600 net BOE per day, which was comprised of 25,100 barrels of oil per day (“BOPD”) at an average realized price of $49.77 per barrel (“BBL”) (before the effect of derivatives), 800 barrels of natural gas liquids (“NGLs”) per day at an average realized price of $32.15 per BBL, and 40.6 million cubic feet of gas (“MMCF”) per day at an average realized price of $3.28 per thousand cubic feet (“MCF”). EGC’s realized oil price (before the effect of derivatives) was about 3% higher than average WTI prices during the quarter due to the positive differentials that EGC receives on it oil sales. Tropical weather reduced production for the third quarter an average of approximately 1,200 BOE per day
In the second quarter, EGC produced and sold approximately 36,000 net BOE per day which was comprised of 26,800 BOPD at an average realized price of $48.45 per BBL (before the effect of derivatives), 1,000 barrels of NGLs per day at an average realized price of $27.37 per BBL, and 48.9 MMCF per day at an average realized price of $3.09 per MCF. When compared with the second quarter, third quarter production declined primarily due to disruptions associated with shut-ins from tropical weather, production equipment maintenance, pipeline shut-ins, facility-related unscheduled downtime and natural declines.
Third Quarter 2017 Costs and Expenses
Total LOE was $77.8 million, or $25.93 per BOE, which consisted of $64.3 million in direct lease operating expense, $8.5 million in workover and maintenance and $5.0 million in insurance expense. Total LOE for the second quarter of 2017 was $85.3 million, or $26.11 per BOE. Lease operating expense was reduced 9% quarter-over-quarter primarily due to continued implementation of cost saving measures and reduced insurance premiums.
3
Gathering and Transportation expense for the third quarter of 2017 was a credit of $2.4 million, or ($0.81) per BOE which included a net refund of $10.6 million from the Office of Natural Resources Revenue (“ONRR”) as part of a multi-year federal royalty refund claim, pipeline Facility Fee expense, which was previously included in Gathering and Transportation expense, was $10.5 million or $3.50 per BOE. In the second quarter of 2017, Gathering and Transportation expense was $2.7 million, or $0.82 per BOE which included a $4.7 million ONRR refund, while Pipeline and Facility Fee expense was $10.5 million or $3.21 per BOE.
G&A expense in the third quarter of 2017 was $15.0 million, or $5.01 per BOE compared to $20.7 million, or $6.34 per BOE in the second quarter 2017. G&A expense was reduced 27% quarter-over-quarter due to continued efforts to bring organizational costs in line with operational needs. G&A includes non-cash compensation costs of $3.0 million ($1.00 per BOE) in the third quarter compared with $2.9 million ($0.88 per BOE) in the second quarter.
Depreciation, depletion and amortization (“DD&A”) expense was $36.1 million, or $12.01 per BOE compared to $38.7 million, or $11.83 per BOE in the second quarter of 2017.
Accretion of asset retirement obligation was $9.9 million during the third quarter 2017 differing slightly from $10.1 million in the second quarter.
For the first nine months of 2017, EGC recorded no income tax expense or benefit.
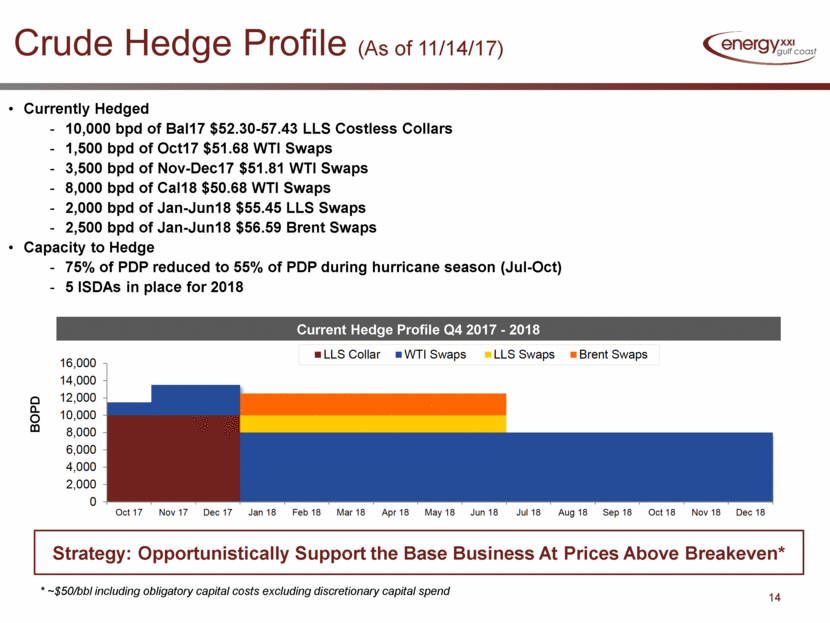
Commodity Hedging
During the third quarter, EGC entered into fixed price swap contracts benchmarked to NYMEX-WTI, to hedge a total of 8,000 BOPD of production for full year 2018 with an average fixed price swap of $50.68 and fixed price swap contracts benchmarked to LLS-Argus for 2,000 BOPD with an average fixed price of $55.45 for the period of January – June 2018. In October, the Company entered into 2,500 BOPD fixed price swap contracts benchmarked to ICE-Brent for January to June 2018 with an average fixed price of $56.59. For the remainder of calendar 2017, EGC has fixed price swap contracts benchmarked to NYMEX-WTI for 1,500 BOPD of production at an average fixed price swap of $51.68, 3,500 BOPD of production for November 2017 and December 2017 with an average fixed price swap of $51.81, in addition to costless collars covering 10,000 BOPD, with an average floor price of $52.30 and an average ceiling price of $57.43 per barrel. The Company
4
continues to evaluate additional derivative arrangements to help limit the downside risk of adverse price movements. EGC does not have any hedges in place on natural gas production.
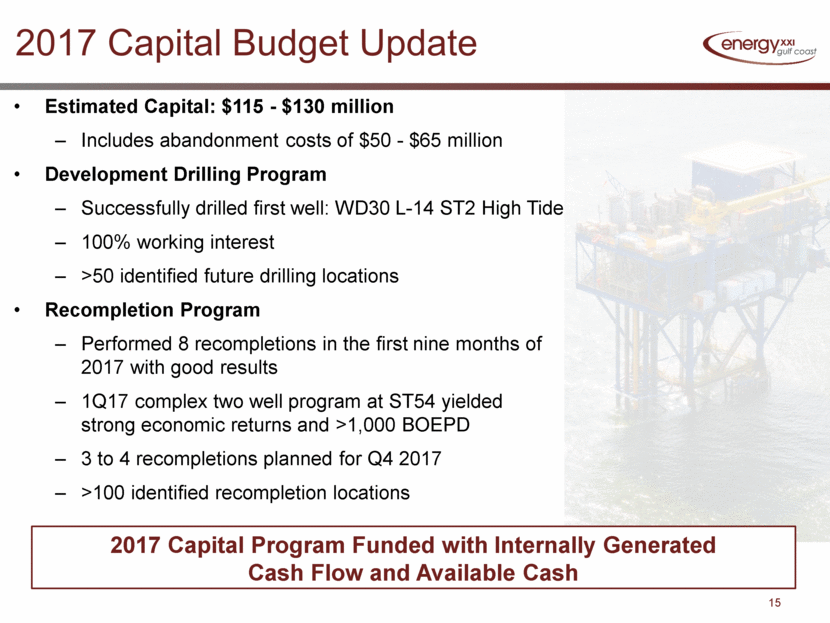
Operational Update and Capital Expenditure Program
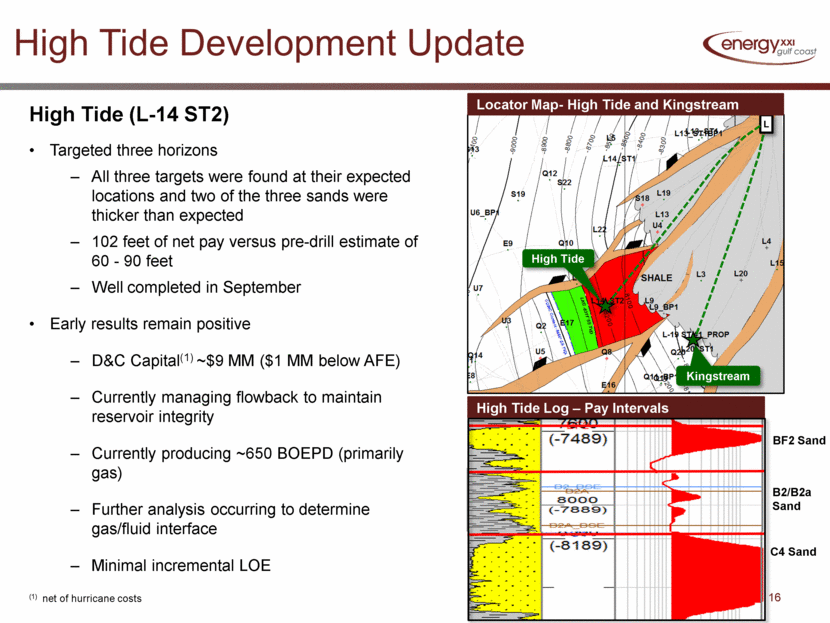
The High Tide well at West Delta 30 that was successfully drilled by the Company with a 100% working interest had first production on September 9, 2017 and is currently producing 650 BOE per day. The cost of the well came in 10% below Authorization for Expenditure (“AFE”) costs. The total drilling and completion costs, net of hurricane costs, were $9.0 million versus an AFE cost of $10.1 million.
During the quarter the Company had to evacuate personnel and shut-in production several times due to multiple storms in the Gulf of Mexico. While EGC was impacted by curtailed production during the quarter, there was no material damage to any of the Company’s platforms or facilities.
During the three months ended September 30, 2017, the Company incurred capital costs, including abandonment activities, totaling $36.5 million.
Balance Sheet and Liquidity
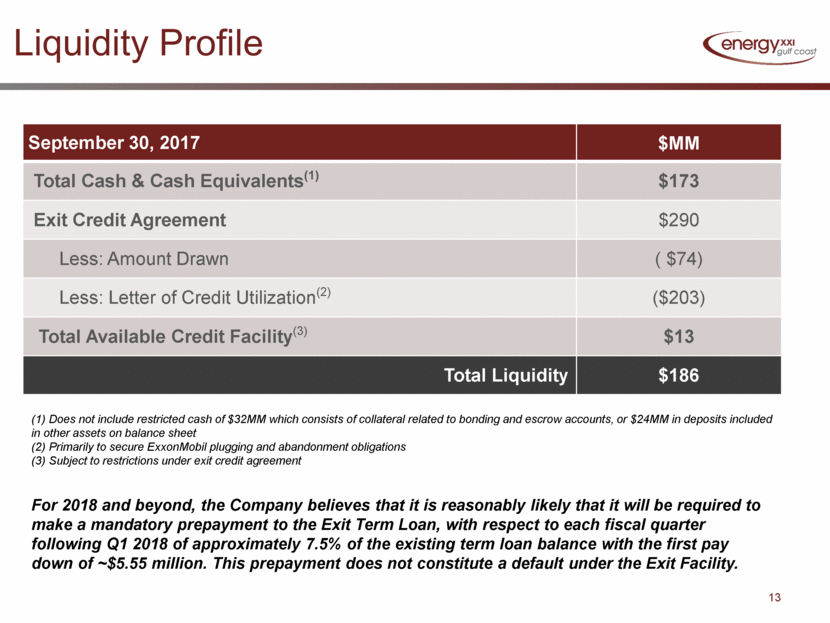
At September 30, 2017, EGC had approximately $74 million in borrowings and $202.8 million in letters of credit issued under its exit credit agreement. Liquidity totaled approximately $186 million which is comprised of cash and cash equivalents totaling $173 million and $12.5 million in borrowing capacity available under certain conditions.
Conference Call
As previously announced, the Company will hold a conference call to discuss its third quarter financial and operating results today, Tuesday, November 14, 2017, at 10:00 a.m. Central Time (11:00 a.m. Eastern Time). Interested parties may participate by dialing (877) 794‑3620. International parties may dial (631) 813‑4724. The confirmation code is 7678989. This call will also be webcast on EGC’s website at www.energyxxi.com. A replay of the call will be archived and available on the web site shortly after the live call.
5
Fresh Start Accounting
Upon emergence from the Company’s Chapter 11 restructuring, EGC elected to adopt fresh start accounting as of December 30, 2016. As a result of the application of fresh start accounting and the effects of the implementation of the plan of reorganization, the financial statements on or after December 31, 2016 are not comparable with the financial statements prior to that date. References to “Successor” refer to the reorganized EGC subsequent to the adoption of fresh start accounting. References to “Predecessor” refer to Energy XXI Ltd. prior to the adoption of fresh start accounting.
Non-GAAP Measures
Adjusted EBITDA is a supplemental non-GAAP financial measure. Adjusted EBITDA is not a measure of net income or cash flows as determined by United States Generally Accepted Accounting Principles, (“U.S. GAAP”). EGC believes that Adjusted EBITDA is useful because it allows it to more effectively evaluate its operating performance and compare the results of its operations from period to period without regard to its financing methods or capital structure. EGC excludes items such as property and inventory impairments, asset retirement obligation accretion, unrealized derivative gains and losses, non-cash share-based compensation expense, non-cash deferred rent expense and restructuring and severance expense from the calculation of Adjusted EBITDA. Adjusted EBITDA should not be considered as an alternative to, or more meaningful than, net income or cash flows from operating activities as determined in accordance with U.S. GAAP or as an indicator of its operating performance or liquidity. EGC’s computations of Adjusted EBITDA may not be comparable to other similarly titled measures of other companies.
Cautionary Note Regarding Forward-Looking Statements
This press release contains forward-looking statements within the meaning of the Private Securities Litigation Reform Act of 1995. These statements, including those relating to the intent, beliefs, plans, or expectations of EGC are based upon current expectations and are subject to a number of risks, uncertainties, and assumptions. It is not possible to predict or identify all such factors and the following list should not be considered a complete statement of all potential risks and uncertainties relating to emergence from Chapter 11, the recent change in EGC’s senior management team, or EGC’s oil and gas reserves, including, but not limited to: (i) the effects of the departure of our senior leaders and the hiring of a new CEO and CFO on our employees, suppliers, regulators and business counterparties; (ii) our ability to maintain sufficient liquidity and/or obtain adequate additional
6
financing necessary to fund our operations, capital expenditures and to execute our business plan, develop our proved undeveloped reserves within five years and to meet our other obligations; (iii) our ability to comply with covenants under our three-year secured credit facility; (iv) further or sustained declines in the prices we receive for our oil and natural gas production; and (v) other risks and uncertainties. These risks and uncertainties could cause actual results, including project plans and related expenditures and resource recoveries, to differ materially from those described in the forward-looking statements. For a more detailed discussion of risk factors, please see Part I, Item 1A, “Risk Factors” of the Transition Report on Form 10‑K for the transition period ended December 31, 2016 filed by EGC for more information. EGC assumes no obligation and expressly disclaims any duty to update the information contained herein except as required by law.
About the Company
Energy XXI Gulf Coast, Inc. is an independent oil and natural gas development and production company whose assets are primarily located in the U.S. Gulf of Mexico waters offshore Louisiana and Texas. The Company’s near-term strategy emphasizes exploitation of key assets, enhanced by its focus on financial discipline and operational excellence. To learn more, visit EGC’s website at www.energyxxi.com.
Investor Relations Contact
Al Petrie
Investor Relations Coordinator
713‑351‑3171
apetrie@energyxxi.com
7
ENERGY XXI GULF COAST, INC.
CONSOLIDATED BALANCE SHEETS
(In Thousands, except share information)
|
|
|
Successor |
|||||||
|
|
|
September 30, |
|
June 30, |
|
December 31, |
|||
|
|
|
2017 |
|
2017 |
|
2016 |
|||
|
|
|
(Unaudited) |
|
(Unaudited) |
|
|
|
||
|
ASSETS |
|
|
|
|
|
|
|
||
|
Current Assets |
|
|
|
|
|
|
|
|
|
|
Cash and cash equivalents |
|
$ |
173,364 |
|
$ |
178,855 |
|
$ |
165,368 |
|
Accounts receivable |
|
|
|
|
|
|
|
|
|
|
Oil and natural gas sales |
|
|
49,200 |
|
|
52,691 |
|
|
68,143 |
|
Joint interest billings, net |
|
|
3,249 |
|
|
2,498 |
|
|
5,600 |
|
Other |
|
|
17,762 |
|
|
8,318 |
|
|
17,944 |
|
Prepaid expenses and other current assets |
|
|
16,096 |
|
|
17,176 |
|
|
25,957 |
|
Restricted cash |
|
|
6,378 |
|
|
6,365 |
|
|
32,337 |
|
Derivative financial instruments |
|
|
— |
|
|
10,470 |
|
|
— |
|
Total Current Assets |
|
|
266,049 |
|
|
276,373 |
|
|
315,349 |
|
Property and Equipment |
|
|
|
|
|
|
|
|
|
|
Oil and natural gas properties, net - full cost method of accounting, including $219.1 million, $224.5 million and $376.1 million of unevaluated properties not being amortized at September 30, 2017, June 30, 2017 and December 31, 2016, respectively |
|
|
869,810 |
|
|
869,398 |
|
|
1,097,479 |
|
Other property and equipment, net |
|
|
13,860 |
|
|
15,107 |
|
|
18,807 |
|
Total Property and Equipment, net of accumulated depreciation, depletion, amortization and impairment |
|
|
883,670 |
|
|
884,505 |
|
|
1,116,286 |
|
Other Assets |
|
|
|
|
|
|
|
|
|
|
Restricted cash |
|
|
25,675 |
|
|
25,637 |
|
|
25,583 |
|
Other assets |
|
|
26,840 |
|
|
27,011 |
|
|
28,244 |
|
Total Other Assets |
|
|
52,515 |
|
|
52,648 |
|
|
53,827 |
|
Total Assets |
|
$ |
1,202,234 |
|
$ |
1,213,526 |
|
$ |
1,485,462 |
|
LIABILITIES AND STOCKHOLDERS’ EQUITY |
|
|
|
|
|
|
|
|
|
|
Current Liabilities |
|
|
|
|
|
|
|
|
|
|
Accounts payable |
|
$ |
86,691 |
|
$ |
80,891 |
|
$ |
101,117 |
|
Accrued liabilities |
|
|
38,652 |
|
|
34,517 |
|
|
63,660 |
|
Asset retirement obligations |
|
|
64,066 |
|
|
61,766 |
|
|
56,601 |
|
Derivative financial instruments |
|
|
3,302 |
|
|
— |
|
|
— |
|
Current maturities of long-term debt |
|
|
23 |
|
|
3,443 |
|
|
4,268 |
|
Total Current Liabilities |
|
|
192,734 |
|
|
180,617 |
|
|
225,646 |
|
Long-term debt, less current maturities |
|
|
73,946 |
|
|
73,940 |
|
|
74,229 |
|
Asset retirement obligations |
|
|
556,301 |
|
|
553,515 |
|
|
696,763 |
|
Derivative financial instruments |
|
|
574 |
|
|
— |
|
|
— |
|
Other liabilities |
|
|
18,134 |
|
|
16,347 |
|
|
14,481 |
|
Total Liabilities |
|
|
841,689 |
|
|
824,419 |
|
|
1,011,119 |
|
Commitments and Contingencies |
|
|
|
|
|
|
|
|
|
|
Stockholders’ Equity |
|
|
|
|
|
|
|
|
|
|
Preferred stock, $0.01 par value, 10,000,000 shares authorized and no shares outstanding at September 30, 2017, June 30, 2017 and December 31, 2016 |
|
|
— |
|
|
— |
|
|
— |
|
Common stock, $0.01 par value, 100,000,000 shares authorized and 33,221,427, 33,221,427 and 33,211,594 shares issued and outstanding at September 30, 2017, June 30, 2017 and December 31, 2016 respectively |
|
|
332 |
|
|
332 |
|
|
332 |
|
Additional paid-in capital |
|
|
887,026 |
|
|
884,008 |
|
|
880,286 |
|
Accumulated deficit |
|
|
(526,813) |
|
|
(495,233) |
|
|
(406,275) |
|
Total Stockholders’ Equity |
|
|
360,545 |
|
|
389,107 |
|
|
474,343 |
|
Total Liabilities and Stockholders’ Equity |
|
$ |
1,202,234 |
|
$ |
1,213,526 |
|
$ |
1,485,462 |
8
ENERGY XXI GULF COAST, INC.
CONSOLIDATED STATEMENTS OF OPERATIONS
(In Thousands, except per share information)
(Unaudited)
|
|
|
Successor |
|
|
Predecessor |
|||||
|
|
|
Three Months Ended |
|
Three Months Ended |
|
|
Three Months Ended |
|||
|
|
|
September 30, |
|
June 30, |
|
|
September 30, |
|||
|
|
|
2017 |
|
2017 |
|
|
2016 |
|||
|
Revenues |
|
|
|
|
|
|
|
|
|
|
|
Oil sales |
|
$ |
114,991 |
|
$ |
118,180 |
|
|
$ |
122,732 |
|
Natural gas liquids sales |
|
|
2,209 |
|
|
2,370 |
|
|
|
2,144 |
|
Natural gas sales |
|
|
12,261 |
|
|
13,753 |
|
|
|
17,735 |
|
(Loss) gain on derivative financial instruments |
|
|
(12,466) |
|
|
9,412 |
|
|
|
— |
|
Total Revenues |
|
|
116,995 |
|
|
143,715 |
|
|
|
142,611 |
|
Costs and Expenses |
|
|
|
|
|
|
|
|
|
|
|
Lease operating |
|
|
77,822 |
|
|
85,336 |
|
|
|
65,170 |
|
Production taxes |
|
|
471 |
|
|
482 |
|
|
|
214 |
|
Gathering and transportation |
|
|
(2,441) |
|
|
2,678 |
|
|
|
7,534 |
|
Pipeline facility fee |
|
|
10,495 |
|
|
10,494 |
|
|
|
10,165 |
|
Depreciation, depletion and amortization |
|
|
36,066 |
|
|
38,661 |
|
|
|
31,573 |
|
Accretion of asset retirement obligations |
|
|
9,892 |
|
|
10,050 |
|
|
|
19,437 |
|
Impairment of oil and natural gas properties |
|
|
(2,357) |
|
|
(848) |
|
|
|
86,820 |
|
General and administrative expense |
|
|
15,026 |
|
|
20,716 |
|
|
|
15,435 |
|
Reorganization items |
|
|
— |
|
|
(3,773) |
|
|
|
— |
|
Total Costs and Expenses |
|
|
144,974 |
|
|
163,796 |
|
|
|
236,348 |
|
Operating Loss |
|
|
(27,979) |
|
|
(20,081) |
|
|
|
(93,737) |
|
|
|
|
|
|
|
|
|
|
|
|
|
Other (Expense) Income |
|
|
|
|
|
|
|
|
|
|
|
Other income, net |
|
|
52 |
|
|
80 |
|
|
|
62 |
|
Interest expense |
|
|
(3,653) |
|
|
(3,642) |
|
|
|
(4,838) |
|
Total Other Expense , net |
|
|
(3,601) |
|
|
(3,562) |
|
|
|
(4,776) |
|
Loss Before Reorganization Items and Income Taxes |
|
|
(31,580) |
|
|
(23,643) |
|
|
|
(98,513) |
|
Reorganization items |
|
|
— |
|
|
— |
|
|
|
(32,633) |
|
Loss Before Income Taxes |
|
|
(31,580) |
|
|
(23,643) |
|
|
|
(131,146) |
|
Income Tax Benefit |
|
|
— |
|
|
— |
|
|
|
— |
|
Net Loss |
|
|
(31,580 |
|
|
(23,643) |
|
|
|
(131,146) |
|
Preferred Stock Dividends |
|
|
— |
|
|
— |
|
|
|
— |
|
Net Loss Attributable to Common Stockholders |
|
$ |
(31,580) |
|
$ |
(23,643) |
|
|
$ |
(131,146) |
|
Loss per Share |
|
|
|
|
|
|
|
|
|
|
|
Basic and Diluted |
|
$ |
(0.95) |
|
$ |
(0.71) |
|
|
$ |
(1.34) |
|
Weighted Average Number of Common Shares Outstanding |
|
|
|
|
|
|
|
|
|
|
|
Basic and Diluted |
|
|
33,241 |
|
|
33,237 |
|
|
|
97,824 |
9
ENERGY XXI GULF COAST, INC.
CONSOLIDATED STATEMENTS OF CASH FLOWS
(In Thousands)
(Unaudited)
|
|
|
Successor |
|
|
Predecessor |
|||||
|
|
|
Three Months Ended |
|
Three Months Ended |
|
|
Three Months Ended |
|||
|
|
|
September 30, |
|
June 30, |
|
|
September 30, |
|||
|
|
|
2017 |
|
2017 |
|
|
2016 |
|||
|
Cash Flows From Operating Activities |
|
|
|
|
|
|
|
|
|
|
|
Net loss |
|
$ |
(31,580) |
|
$ |
(23,643) |
|
|
$ |
(131,146) |
|
Adjustments to reconcile net loss to net cash provided by (used in) operating activities: |
|
|
|
|
|
|
|
|
|
|
|
Depreciation, depletion and amortization |
|
|
36,066 |
|
|
38,661 |
|
|
|
31,573 |
|
Impairment of oil and natural gas properties |
|
|
(2,357) |
|
|
(848) |
|
|
|
86,820 |
|
Change in fair value of derivative financial instruments |
|
|
14,346 |
|
|
(7,061) |
|
|
|
— |
|
Accretion of asset retirement obligations |
|
|
9,892 |
|
|
10,050 |
|
|
|
19,437 |
|
Amortization and write off of debt issuance costs and other |
|
|
5 |
|
|
6 |
|
|
|
876 |
|
Deferred rent |
|
|
1,930 |
|
|
2,016 |
|
|
|
1,685 |
|
Provision for loss on accounts receivable |
|
|
— |
|
|
300 |
|
|
|
— |
|
Reorganization items |
|
|
(113) |
|
|
(3,773) |
|
|
|
— |
|
Stock-based compensation |
|
|
3,019 |
|
|
2,870 |
|
|
|
109 |
|
Changes in operating assets and liabilities |
|
|
|
|
|
|
|
|
|
|
|
Accounts receivable |
|
|
(6,704) |
|
|
12,153 |
|
|
|
6,012 |
|
Prepaid expenses and other assets |
|
|
669 |
|
|
4,165 |
|
|
|
534 |
|
Restricted cash |
|
|
(51) |
|
|
718 |
|
|
|
— |
|
Settlement of asset retirement obligations |
|
|
(12,293) |
|
|
(18,175) |
|
|
|
(16,953) |
|
Accounts payable, accrued liabilities and other |
|
|
3,583 |
|
|
8,515 |
|
|
|
21,204 |
|
Net Cash Provided by Operating Activities |
|
|
16,412 |
|
|
25,954 |
|
|
|
20,151 |
|
Cash Flows from Investing Activities |
|
|
|
|
|
|
|
|
|
|
|
Capital expenditures |
|
|
(18,531) |
|
|
(5,391) |
|
|
|
(7,682) |
|
Insurance payments received |
|
|
— |
|
|
(2,010) |
|
|
|
— |
|
Transfer to restricted cash |
|
|
— |
|
|
— |
|
|
|
(48) |
|
Proceeds from the sale of other property and equipment |
|
|
47 |
|
|
10 |
|
|
|
— |
|
Other |
|
|
— |
|
|
— |
|
|
|
71 |
|
Net Cash Used in Investing Activities |
|
|
(18,484) |
|
|
(7,391) |
|
|
|
(7,659) |
|
Cash Flows from Financing Activities |
|
|
|
|
|
|
|
|
|
|
|
Payments on long-term debt |
|
|
(3,419) |
|
|
(126) |
|
|
|
— |
|
Debt issuance costs |
|
|
— |
|
|
(61) |
|
|
|
(37) |
|
Net Cash Used in Financing Activities |
|
|
(3,419) |
|
|
(187) |
|
|
|
(37) |
|
Net Increase (Decrease) in Cash and Cash Equivalents |
|
|
(5,491) |
|
|
18,376 |
|
|
|
12,455 |
|
Cash and Cash Equivalents, beginning of period |
|
|
178,855 |
|
|
160,479 |
|
|
|
203,258 |
|
Cash and Cash Equivalents, end of period |
|
$ |
173,364 |
|
$ |
178,855 |
|
|
$ |
215,713 |
10
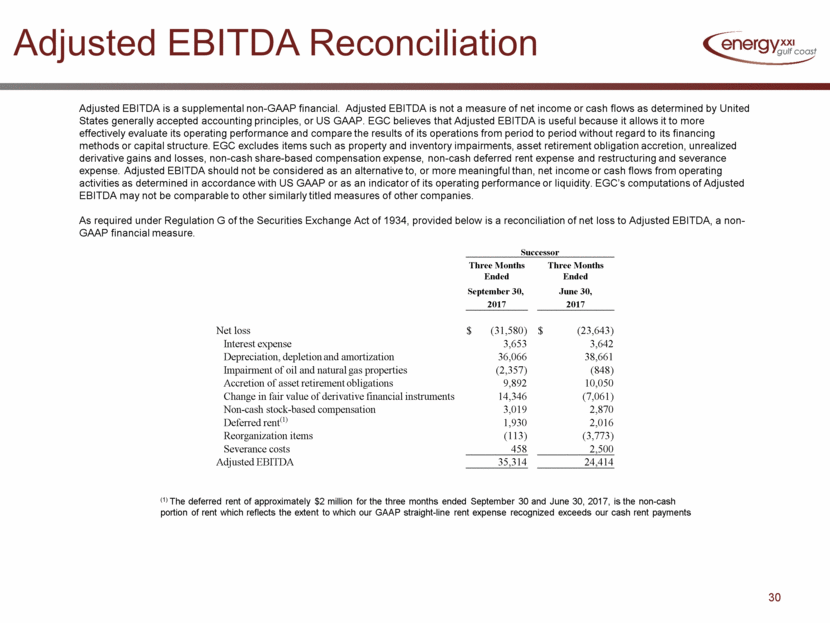
ENERGY XXI GULF COAST, INC.
RECONCILIATION OF NON-GAAP MEASURES
(In Thousands, except per share information)
(Unaudited)
As required under Regulation G of the Securities Exchange Act of 1934, provided below is a reconciliation of net loss to Adjusted EBITDA, a non-GAAP financial measure.
|
|
|
Successor |
||||
|
|
|
Three Months Ended |
|
Three Months Ended |
||
|
|
|
September 30, |
|
June 30, |
||
|
|
|
2017 |
|
2017 |
||
|
|
|
|
|
|
|
|
|
Net loss |
|
$ |
(31,580) |
|
$ |
(23,643) |
|
Interest expense |
|
|
3,653 |
|
|
3,642 |
|
Depreciation, depletion and amortization |
|
|
36,066 |
|
|
38,661 |
|
Impairment of oil and natural gas properties |
|
|
(2,357) |
|
|
(848) |
|
Accretion of asset retirement obligations |
|
|
9,892 |
|
|
10,050 |
|
Change in fair value of derivative financial instruments |
|
|
14,346 |
|
|
(7,061) |
|
Non-cash stock-based compensation |
|
|
3,019 |
|
|
2,870 |
|
Deferred rent(1) |
|
|
1,930 |
|
|
2,016 |
|
Reorganization items |
|
|
(113) |
|
|
(3,773) |
|
Severance costs |
|
|
458 |
|
|
2,500 |
|
Adjusted EBITDA |
|
|
35,314 |
|
|
24,414 |
|
(1) |
The deferred rent of approximately $2 million for the three months ended September 30 and June 30, 2017, is the non-cash portion of rent which reflects the extent to which our GAAP straight-line rent expense recognized exceeds our cash rent payments |
11
Operational Information
|
|
|
Successor |
|
|
Predecessor |
|||||
|
|
|
Quarter Ended |
|
|
Quarter Ended |
|||||
|
|
|
September 30, |
|
June 30, |
|
|
September 30, |
|||
|
Operating Highlights |
|
2017 |
|
2017 |
|
|
2016 |
|||
|
|
|
(In thousands, except per unit amounts) |
||||||||
|
Operating revenues |
|
|
|
|
|
|
|
|
|
|
|
Oil sales |
|
$ |
114,991 |
|
$ |
118,180 |
|
|
$ |
122,732 |
|
Natural gas liquids sales |
|
|
2,209 |
|
|
2,370 |
|
|
|
2,144 |
|
Natural gas sales |
|
|
12,261 |
|
|
13,753 |
|
|
|
17,735 |
|
(Loss) gain on derivative financial instruments |
|
|
(12,466) |
|
|
9,412 |
|
|
|
— |
|
Total revenues |
|
|
116,995 |
|
|
143,715 |
|
|
|
142,611 |
|
Percentage of oil revenues prior to (loss) gain on derivative financial instruments |
|
|
89% |
|
|
88% |
|
|
|
86% |
|
Operating expenses |
|
|
|
|
|
|
|
|
|
|
|
Lease operating expense |
|
|
|
|
|
|
|
|
|
|
|
Insurance expense |
|
|
5,040 |
|
|
7,101 |
|
|
|
6,309 |
|
Workover and maintenance |
|
|
8,490 |
|
|
13,370 |
|
|
|
11,010 |
|
Direct lease operating expense |
|
|
64,292 |
|
|
64,865 |
|
|
|
47,851 |
|
Total lease operating expense |
|
|
77,822 |
|
|
85,336 |
|
|
|
65,170 |
|
Production taxes |
|
|
471 |
|
|
482 |
|
|
|
214 |
|
Gathering and transportation |
|
|
(2,441) |
|
|
2,678 |
|
|
|
7,534 |
|
Pipeline facility fee |
|
|
10,495 |
|
|
10,494 |
|
|
|
10,165 |
|
Depreciation, depletion and amortization |
|
|
36,066 |
|
|
38,661 |
|
|
|
31,573 |
|
Accretion of asset retirement obligations |
|
|
9,892 |
|
|
10,050 |
|
|
|
19,437 |
|
Impairment of oil and natural gas properties |
|
|
(2,357) |
|
|
(848) |
|
|
|
86,820 |
|
General and administrative |
|
|
15,026 |
|
|
20,716 |
|
|
|
15,435 |
|
Reorganization items |
|
|
— |
|
|
(3,773) |
|
|
|
— |
|
Total operating expenses |
|
|
144,974 |
|
|
163,796 |
|
|
|
236,348 |
|
Operating loss |
|
$ |
(27,979) |
|
$ |
(20,081) |
|
|
$ |
(93,737) |
|
Sales volumes per day |
|
|
|
|
|
|
|
|
|
|
|
Oil (MBbls) |
|
|
25.1 |
|
|
26.8 |
|
|
|
30.0 |
|
Natural gas liquids (MBbls) |
|
|
0.8 |
|
|
1.0 |
|
|
|
1.3 |
|
Natural gas (MMcf) |
|
|
40.6 |
|
|
48.9 |
|
|
|
72.8 |
|
Total (MBOE) |
|
|
32.6 |
|
|
35.9 |
|
|
|
43.4 |
|
Percent of sales volumes from oil |
|
|
77% |
|
|
75% |
|
|
|
69% |
|
Average sales price |
|
|
|
|
|
|
|
|
|
|
|
Oil per Bbl |
|
$ |
49.77 |
|
$ |
48.45 |
|
|
$ |
44.52 |
|
Natural gas liquid per Bbl |
|
|
32.15 |
|
|
27.37 |
|
|
|
18.12 |
|
Natural gas per Mcf |
|
|
3.28 |
|
|
3.09 |
|
|
|
2.65 |
|
(Loss) gain on derivative financial instruments per BOE |
|
|
(4.15) |
|
|
2.88 |
|
|
|
— |
|
Total revenues per BOE |
|
|
38.97 |
|
|
43.99 |
|
|
|
35.73 |
|
Operating expenses per BOE |
|
|
|
|
|
|
|
|
|
|
|
Lease operating expense |
|
|
|
|
|
|
|
|
|
|
|
Insurance expense |
|
|
1.68 |
|
|
2.17 |
|
|
|
1.58 |
|
Workover and maintenance |
|
|
2.83 |
|
|
4.09 |
|
|
|
2.76 |
|
Direct lease operating expense |
|
|
21.42 |
|
|
19.85 |
|
|
|
11.99 |
|
Total lease operating expense per BOE |
|
|
25.93 |
|
|
26.11 |
|
|
|
16.33 |
|
Production taxes |
|
|
0.16 |
|
|
0.15 |
|
|
|
0.05 |
|
Gathering and transportation |
|
|
(0.81) |
|
|
0.82 |
|
|
|
1.89 |
|
Pipeline facility fee |
|
|
3.5 |
|
|
3.21 |
|
|
|
2.55 |
|
Depreciation, depletion and amortization |
|
|
12.01 |
|
|
11.83 |
|
|
|
7.91 |
|
Accretion of asset retirement obligations |
|
|
3.3 |
|
|
3.08 |
|
|
|
4.87 |
|
Impairment of oil and natural gas properties |
|
|
(0.79) |
|
|
(0.26) |
|
|
|
21.75 |
|
General and administrative |
|
|
5.01 |
|
|
6.34 |
|
|
|
3.87 |
|
Reorganization items |
|
|
— |
|
|
(1.15) |
|
|
|
— |
|
Total operating expenses per BOE |
|
|
48.31 |
|
|
50.13 |
|
|
|
59.22 |
|
Operating loss per BOE |
|
$ |
(9.34) |
|
$ |
(6.14) |
|
|
$ |
(23.49) |
12