0001396502falseN-2Participants in the fund’s dividend reinvestment plan do not pay brokerage charges with respect to common shares issued directly by the fund. However, whenever common shares are purchased or sold on the NYSE or otherwise on the open market, each participant will pay a pro rata portion of brokerage trading fees, currently $0.05 per share purchased or sold. Brokerage trading fees will be deducted from amounts to be invested. Shareholders participating in the Plan may buy additional common shares of the fund through the Plan at any time and will be charged a $5 transaction fee plus $0.05 per share brokerage trading fee for each order. See “Dividends and distributions” and “Dividend reinvestment plan”.The Advisor has contractually agreed to waive a portion of its management fee and/or reimburse expenses for certain funds of the John Hancock group of funds complex, including the fund (the participating portfolios). This waiver is based upon aggregate net assets of all the participating portfolios. The amount of the reimbursement is calculated daily and allocated among all the participating portfolios in proportion to the daily net assets of each fund. During the year ended October 31, 2023, this waiver amounted to 0.01% of the fund’s average daily net assets. This arrangement expires on July 31, 2025, unless renewed by mutual agreement of the fund and the Advisor based upon a determination that this is appropriate under the circumstances at that time.See "Note 4 – Fees and transactions with affiliates.”If common shares are sold to or through underwriters, the fund’s prospectus will set forth any applicable sales load and the estimated offering expenses.
0001396502
2022-11-01
2023-10-31
0001396502
2023-08-01
2023-10-31
0001396502
2023-05-01
2023-07-31
0001396502
2023-02-01
2023-04-30
0001396502
2022-02-01
2022-04-30
0001396502
2021-11-01
2022-01-31
0001396502
2022-11-01
2023-01-31
0001396502
2022-08-01
2022-10-31
0001396502
2022-05-01
2022-07-31
0001396502
2023-10-31
0001396502
cik0001396502:SmallAndMidSizedCompanyRiskMember
2022-11-01
2023-10-31
0001396502
cik0001396502:PreferredAndConvertibleSecuritiesRiskMember
2022-11-01
2023-10-31
0001396502
cik0001396502:LowerRatedAndHighYieldFixedIncomeSecuritiesRiskMember
2022-11-01
2023-10-31
0001396502
cik0001396502:LiquidityRiskMember
2022-11-01
2023-10-31
0001396502
cik0001396502:LargeCompanyRiskMember
2022-11-01
2023-10-31
0001396502
cik0001396502:InvestmentCompanySecuritiesRiskMember
2022-11-01
2023-10-31
0001396502
cik0001396502:IlliquidAndRestrictedSecuritiesRiskMember
2022-11-01
2023-10-31
0001396502
cik0001396502:HighPortfolioTurnoverRiskMember
2022-11-01
2023-10-31
0001396502
cik0001396502:ForeignSecuritiesRiskMember
2022-11-01
2023-10-31
0001396502
cik0001396502:FixedIncomeSecuritiesRiskMember
2022-11-01
2023-10-31
0001396502
cik0001396502:ExchangeTradedFundsEtfsRiskMember
2022-11-01
2023-10-31
0001396502
cik0001396502:EsgIntegrationRiskMember
2022-11-01
2023-10-31
0001396502
cik0001396502:EquitySecuritiesRiskMember
2022-11-01
2023-10-31
0001396502
cik0001396502:EconomicAndMarketEventsRiskMember
2022-11-01
2023-10-31
0001396502
cik0001396502:CybersecurityAndOperationalRiskMember
2022-11-01
2023-10-31
0001396502
cik0001396502:CreditAndCounterpartyRiskMember
2022-11-01
2023-10-31
0001396502
cik0001396502:ChangingDistributionLevelReturnOfCapitalRiskMember
2022-11-01
2023-10-31
0001396502
cik0001396502:CommonSharesMember
2022-11-01
2023-10-31
xbrli:pure
iso4217:USD
xbrli:shares
iso4217:USD
xbrli:shares
UNITED STATES
SECURITIES AND EXCHANGE COMMISSION
Washington, D.C. 20549
CERTIFIED SHAREHOLDER REPORT OF REGISTERED
MANAGEMENT INVESTMENT COMPANIES
Investment Company Act file number
811- 22056
John Hancock Tax-Advantaged Global Shareholder Yield Fund
(Exact name of registrant as specified in charter)
200 Berkeley Street, Boston, Massachusetts 02116
(Address of principal executive offices) (Zip code)
Salvatore Schiavone
Treasurer
200 Berkeley Street
Boston, Massachusetts 02116
(Name and address of agent for service)
Registrant's telephone number, including area code:
617-543-9634
Date of fiscal year end: | October 31 |
Date of reporting period: | October 31, 2023 |
ITEM 1. REPORT TO STOCKHOLDERS
Annual report
John Hancock
Tax-Advantaged Global Shareholder Yield Fund
Closed-end international equity
Ticker: HTY
October 31, 2023
Dear shareholders,
Stocks performed well for most of the 12 months ended October 31, 2023, on hopes that falling inflation would allow world central banks to wrap up their long series of interest-rate increases. Economic growth and corporate earnings came in above expectations. Mega-cap U.S. technology-related stocks were a key driver of returns for the broad global indexes, as were the European markets.
The environment grew less favorable during the last three months of the period, as investors became concerned that inflation was set to reaccelerate and central banks would be compelled to keep interest rates higher for longer. The markets were further pressured by the combination of rising oil prices, signs of slowing global growth, and increasing geopolitical tensions, including the conflict in the Gaza Strip.
In these uncertain times, your financial professional can assist with positioning your portfolio so that it’s sufficiently diversified to help meet your long-term objectives and to withstand the inevitable bouts of market volatility along the way.
On behalf of everyone at John Hancock Investment Management, I’d like to take this opportunity to welcome new shareholders and thank existing shareholders for the continued trust you’ve placed in us.
Sincerely,
Head of Wealth and Asset Management,
United States and Europe
Manulife Investment Management
President and CEO,
John Hancock Investment Management
This commentary reflects the CEO’s views, which are subject to change at any time. Investing involves risks, including the potential loss of principal. Diversification does not guarantee a profit or eliminate the risk of a loss. It is not possible to invest directly in an index. For more up-to-date information, please visit our website at jhinvestments.com.
John Hancock
Tax-Advantaged Global Shareholder Yield Fund
Table of contents
2 | |
4 | |
6 | |
8 | |
12 | |
15 | |
16 | |
21 | |
22 | |
23 | |
28 | |
33 | |
39 | |
43 | |
| | ANNUAL REPORT | JOHN HANCOCK TAX-ADVANTAGED GLOBAL SHAREHOLDER YIELD FUND | 1 |
The fund seeks to provide total return consisting of a high level of current income and gains and long-term capital appreciation. The fund will seek to achieve favorable after-tax returns for shareholders by seeking to minimize the U.S. federal income-tax consequences on income and gains generated by the fund.
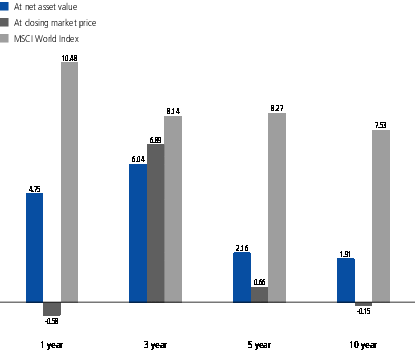
AVERAGE ANNUAL TOTAL RETURNS AS OF 10/31/2023 (%)
The MSCI World Index tracks the performance of publicly traded large- and mid-cap stocks of developed-market companies.
It is not possible to invest directly in an index. Index figures do not reflect expenses, which would result in lower returns.
The performance data contained within this material represents past performance, which does not guarantee future results.
Investment returns and principal value will fluctuate and a shareholder may sustain losses. Further, the fund’s performance at net asset value (NAV) is different from the fund’s performance at closing market price because the closing market price is subject to the dynamics of secondary market trading. Market risk may increase when shares are purchased at a premium to NAV or sold at a discount to NAV. Current month-end performance may be higher or lower than the performance cited. The fund’s most recent performance can be found at jhinvestments.com or by calling 800-852-0218.
| 2 | JOHN HANCOCK TAX-ADVANTAGED GLOBAL SHAREHOLDER YIELD FUND | ANNUAL REPORT | |
PERFORMANCE HIGHLIGHTS OVER THE LAST TWELVE MONTHS
Stocks rose on optimism that inflation was under control
Global equities delivered gains, most of which occurred during a narrow rally in growth stocks sparked by sentiment that tighter monetary conditions would manage to bring down inflation.
The fund’s stock selection and sector allocation hampered relative results
The fund had a positive absolute return but underperformed the MSCI World Index due to stock selection in the financials and communication services sectors as well as an overweight in the utilities sector.
Dividend yield showed pockets of strength
Dividend-paying stocks in the information technology, industrials, and energy sectors contributed to results.
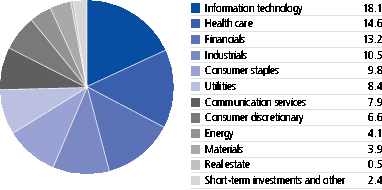
SECTOR COMPOSITION AS OF 10/31/2023 (% of net assets)
| | ANNUAL REPORT | JOHN HANCOCK TAX-ADVANTAGED GLOBAL SHAREHOLDER YIELD FUND | 3 |
Management’s discussion of fund performance
What factors affected global equity markets during the 12 months ended October 31, 2023?
Global equities looked past tighter monetary and fiscal conditions to deliver solid performance, led by strength in U.S.-based mega cap growth stocks. Market direction during the year was dictated in large part by the global inflation outlook and whether the U.S. economy could pull off a soft landing and avoid recession. Despite the efforts of central banks, inflation remained stubbornly high across the U.S. and Europe as labor markets in both regions saw robust hiring and wage gains. Investor perception that inflation was under control in the first half of 2023 sparked a steep, growth-led rally. But with high prices persisting and the U.S. Federal Reserve and other central banks indicating that interest rates would remain high for an extended period, stocks sold off to end the period.
How did the fund respond to these market conditions?
The fund posted a positive absolute return but underperformed its comparative index. Stock selection in the financials, communication services and consumer discretionary sectors, an overweight in the utilities sector and an underweight in the information technology sector had negative impacts on performance. Stock selection in the healthcare, industrials, and consumer staples sectors and an underweight to real estate, meanwhile, contributed to results. From a regional
TOP 10 HOLDINGS
AS OF 10/31/2023 (% of net assets) |
| Broadcom, Inc. | 2.7 |
| Microsoft Corp. | 2.4 |
| IBM Corp. | 2.2 |
| TotalEnergies SE | 2.1 |
| AbbVie, Inc. | 1.8 |
| Apple, Inc. | 1.8 |
| Restaurant Brands International, Inc. | 1.7 |
| Deutsche Telekom AG | 1.7 |
| Coca-Cola Europacific Partners PLC | 1.7 |
| Lazard, Ltd., Class A | 1.7 |
TOTAL | 19.8 |
| Cash and cash equivalents are not included. |
TOP 10 COUNTRIES
AS OF 10/31/2023 (% of net assets) |
| United States | 55.9 |
| United Kingdom | 9.6 |
| France | 7.4 |
| Canada | 6.7 |
| Germany | 5.9 |
| Switzerland | 3.2 |
| South Korea | 2.3 |
| Japan | 1.8 |
| Italy | 1.3 |
| Taiwan | 1.0 |
TOTAL | 95.1 |
| Cash and cash equivalents are not included. |
| 4 | JOHN HANCOCK TAX-ADVANTAGED GLOBAL SHAREHOLDER YIELD FUND | ANNUAL REPORT | |
perspective, stock selection in the United States and the United Kingdom and an overweight in Canada and underweight in Japan detracted the most from relative performance.
Which holdings affected performance?
Regional banks KeyCorp, Truist Financial Corp., and Columbia Banking System, Inc. were among the leading individual detractors. All three declined as the failures of Silicon Valley Bank and Signature Bank caused a crisis of confidence that reverberated through the entire industry. Nutrien, Ltd., a Canadian producer of crop nutrients, underperformed due to weak potash pricing and inventory destocking that weighed on earnings results and forward guidance.
Among the largest individual contributors for the period were U.S.-based information technology holdings Broadcom, Inc., Dell Technologies, Inc., and KLA Corp. Broadcom, a diversified manufacturer of semiconductors and software, outperformed on continued backlog for enterprise network upgrades. Dell Technologies outperformed due to its expected revenue growth from its AI servers. KLA, which produces equipment and tools to support and enhance semiconductor manufacturing, benefited from the stabilization of its key end markets. German insurance provider Munich Reinsurance Company was also a meaningful contributor to performance. We sold the fund’s holdings in Munich Re prior to period end.
The fund is managed by a team of portfolio managers from Epoch Investment Partners, Inc.
The views expressed in this report are exclusively those of the portfolio management team at Epoch Investment Partners, Inc., and are subject to change. They are not meant as investment advice. Please note that the holdings discussed in this report may not have been held by the fund for the entire period. Portfolio composition is subject to review in accordance with the fund’s investment strategy and may vary in the future. Current and future portfolio holdings are subject to risk.
| | ANNUAL REPORT | JOHN HANCOCK TAX-ADVANTAGED GLOBAL SHAREHOLDER YIELD FUND | 5 |
TOTAL RETURNS FOR THE PERIOD ENDED OCTOBER 31, 2023
Average annual total returns (%) | Cumulative total returns (%) |
| | 1-Year | 5-Year | 10-Year | 5-year | 10-Year |
| At Net asset value | 4.75 | 2.16 | 1.91 | 11.28 | 20.83 |
| At Market price | -0.58 | 0.66 | -0.15 | 3.37 | -1.50 |
| MSCI World Index | 10.48 | 8.27 | 7.53 | 48.75 | 106.74 |
Performance figures assume all distributions have been reinvested.
The returns reflect past results and should not be considered indicative of future performance. Investment returns and principal value will fluctuate and a shareholder may sustain losses. Further, the fund’s performance at net asset value (NAV) is different from the fund’s performance at closing market price because the closing market price is subject to the dynamics of secondary market trading. Market risk may be augmented when shares are purchased at a premium to NAV or when shares need to be sold at a discount to NAV. Current month-end performance may be higher or lower than the performance cited. The fund’s most recent performance can be found at jhinvestments.com or by calling 800-852-0218.
The performance table above and the chart on the next page do not reflect the deduction of taxes that a shareholder would pay on fund distributions or the sale of fund shares. The fund’s performance results reflect any applicable fee waivers or expense reductions, without which the expenses would increase and results would have been less favorable.
| 6 | JOHN HANCOCK TAX-ADVANTAGED GLOBAL SHAREHOLDER YIELD FUND | ANNUAL REPORT | |
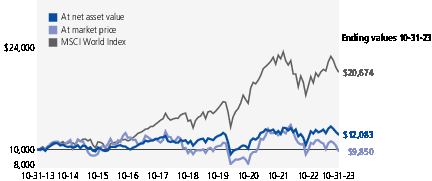
This chart shows what happened to a hypothetical $10,000 investment in John Hancock Tax-Advantaged Global Shareholder Yield Fund for the periods indicated, assuming all distributions were reinvested. For comparison, we’ve shown the same investment in the MSCI World Index.
The MSCI World Index tracks the performance of publicly traded large- and mid-cap stocks of developed-market companies.
It is not possible to invest directly in an index. Index figures do not reflect expenses, which would result in lower returns.
The returns reflect past results and should not be considered indicative of future performance.
| | ANNUAL REPORT | JOHN HANCOCK TAX-ADVANTAGED GLOBAL SHAREHOLDER YIELD FUND | 7 |
| | | | | Shares | Value |
Common stocks 97.6% | | | | | $51,892,738 |
| (Cost $55,264,114) | | | | | |
Austria 0.8% | | | | | 445,404 |
| BAWAG Group AG (A)(B) | | 10,000 | 445,404 |
Canada 6.7% | | | | | 3,548,163 |
| BCE, Inc. | | 12,900 | 478,884 |
| Enbridge, Inc. | | 14,400 | 461,465 |
| Great-West Lifeco, Inc. | | 10,700 | 296,444 |
| Nutrien, Ltd. | | 6,400 | 343,680 |
| Restaurant Brands International, Inc. | | 13,700 | 920,640 |
| Rogers Communications, Inc., Class B | | 7,800 | 288,995 |
| Royal Bank of Canada | | 4,000 | 319,481 |
| TELUS Corp. | | 27,200 | 438,574 |
France 7.4% | | | | | 3,925,165 |
| AXA SA | | 26,500 | 785,206 |
| Cie Generale des Etablissements Michelin SCA | | 13,500 | 401,064 |
| Orange SA | | 43,400 | 510,473 |
| Sanofi SA | | 8,300 | 753,692 |
| TotalEnergies SE | | 16,600 | 1,109,834 |
| Vinci SA | | 3,300 | 364,896 |
Germany 5.9% | | | | | 3,148,625 |
| Allianz SE | | 2,500 | 585,606 |
| Bayer AG | | 7,107 | 307,083 |
| Deutsche Post AG | | 15,700 | 612,983 |
| Deutsche Telekom AG | | 41,190 | 893,974 |
| Muenchener Rueckversicherungs-Gesellschaft AG | | 1,000 | 401,308 |
| Siemens AG | | 2,620 | 347,671 |
Ireland 0.9% | | | | | 479,808 |
| Medtronic PLC | | 6,800 | 479,808 |
Italy 1.3% | | | | | 685,080 |
| Snam SpA | | 149,400 | 685,080 |
Japan 1.8% | | | | | 955,044 |
| Astellas Pharma, Inc. | | 29,800 | 376,966 |
| NET One Systems Company, Ltd. | | 16,900 | 257,943 |
| Toyota Motor Corp. | | 18,300 | 320,135 |
Norway 0.8% | | | | | 444,566 |
| Orkla ASA | | 64,500 | 444,566 |
South Korea 2.3% | | | | | 1,203,947 |
| Hyundai Glovis Company, Ltd. | | 2,800 | 355,350 |
| 8 | JOHN HANCOCK TAX-ADVANTAGED GLOBAL SHAREHOLDER YIELD FUND | ANNUAL REPORT | SEE NOTES TO FINANCIAL STATEMENTS |
| | | | | Shares | Value |
South Korea (continued) | | | | | |
| Samsung Electronics Company, Ltd., GDR (A) | | 352 | $440,167 |
| SK Telecom Company, Ltd. | | 11,200 | 408,430 |
Switzerland 3.2% | | | | | 1,718,214 |
| Garmin, Ltd. | | 2,800 | 287,084 |
| Nestle SA | | 3,000 | 323,516 |
| Novartis AG | | 8,803 | 824,133 |
| Roche Holding AG | | 1,100 | 283,481 |
Taiwan 1.0% | | | | | 535,122 |
| Taiwan Semiconductor Manufacturing Company, Ltd., ADR | | 6,200 | 535,122 |
United Kingdom 9.6% | | | | | 5,072,288 |
| AstraZeneca PLC, ADR | | 11,531 | 729,105 |
| BAE Systems PLC | | 32,600 | 438,351 |
| British American Tobacco PLC | | 23,300 | 696,027 |
| Coca-Cola Europacific Partners PLC | | 15,200 | 889,352 |
| GSK PLC | | 32,320 | 576,161 |
| Imperial Brands PLC | | 19,200 | 409,040 |
| National Grid PLC | | 40,350 | 481,092 |
| Schroders PLC | | 63,800 | 287,295 |
| Unilever PLC | | 11,948 | 565,865 |
United States 55.9% | | | | | 29,731,312 |
| AbbVie, Inc. | | 6,800 | 960,024 |
| Air Products & Chemicals, Inc. | | 1,100 | 310,684 |
| American Electric Power Company, Inc. | | 7,600 | 574,104 |
| Analog Devices, Inc. | | 5,600 | 881,048 |
| Apple, Inc. | | 5,600 | 956,312 |
| AT&T, Inc. | | 30,047 | 462,724 |
| Bank of America Corp. | | 10,700 | 281,838 |
| Best Buy Company, Inc. | | 4,300 | 287,326 |
| Bristol-Myers Squibb Company | | 5,100 | 262,803 |
| Broadcom, Inc. | | 1,700 | 1,430,328 |
| Chevron Corp. | | 1,900 | 276,887 |
| Cisco Systems, Inc. | | 16,400 | 854,932 |
| Columbia Banking System, Inc. | | 16,800 | 330,456 |
| Cummins, Inc. | | 2,500 | 540,750 |
| CVS Health Corp. | | 4,000 | 276,040 |
| Dell Technologies, Inc., Class C | | 5,500 | 368,005 |
| Dow, Inc. | | 10,000 | 483,400 |
| Duke Energy Corp. | | 3,400 | 302,226 |
| Eaton Corp. PLC | | 2,800 | 582,148 |
| Eli Lilly & Company | | 800 | 443,144 |
| Emerson Electric Company | | 4,800 | 427,056 |
| Entergy Corp. | | 3,900 | 372,801 |
| SEE NOTES TO FINANCIAL STATEMENTS | ANNUAL REPORT | JOHN HANCOCK TAX-ADVANTAGED GLOBAL SHAREHOLDER YIELD FUND | 9 |
| | | | | Shares | Value |
United States (continued) | | | | | |
| Evergy, Inc. | | 8,100 | $398,034 |
| Hasbro, Inc. | | 7,700 | 347,655 |
| IBM Corp. | | 7,900 | 1,142,656 |
| Johnson & Johnson | | 1,900 | 281,846 |
| JPMorgan Chase & Co. | | 4,408 | 612,976 |
| KLA Corp. | | 1,300 | 610,610 |
| Lazard, Ltd., Class A | | 32,000 | 888,640 |
| Leggett & Platt, Inc. | | 9,900 | 231,957 |
| Linde PLC | | 900 | 343,944 |
| Lockheed Martin Corp. | | 700 | 318,248 |
| LyondellBasell Industries NV, Class A | | 6,200 | 559,488 |
| McDonald’s Corp. | | 1,100 | 288,387 |
| Merck & Company, Inc. | | 4,300 | 441,610 |
| MetLife, Inc. | | 9,534 | 572,135 |
| Microsoft Corp. | | 3,766 | 1,273,322 |
| MSC Industrial Direct Company, Inc., Class A | | 7,200 | 682,200 |
| NetApp, Inc. | | 4,700 | 342,066 |
| NextEra Energy, Inc. | | 7,300 | 425,590 |
| NiSource, Inc. | | 16,800 | 422,688 |
| Omnicom Group, Inc. | | 3,800 | 284,658 |
| Paychex, Inc. | | 2,900 | 322,045 |
| PepsiCo, Inc. | | 1,800 | 293,904 |
| Pfizer, Inc. | | 11,800 | 360,608 |
| Philip Morris International, Inc. | | 8,900 | 793,524 |
| Pinnacle West Capital Corp. | | 4,100 | 304,138 |
| Regions Financial Corp. | | 18,700 | 271,711 |
| RTX Corp. | | 4,100 | 333,699 |
| Texas Instruments, Inc. | | 3,400 | 482,834 |
| The Coca-Cola Company | | 6,300 | 355,887 |
| The Home Depot, Inc. | | 1,000 | 284,690 |
| The PNC Financial Services Group, Inc. | | 2,500 | 286,175 |
| The Williams Companies, Inc. | | 9,300 | 319,920 |
| Truist Financial Corp. | | 10,800 | 306,288 |
| U.S. Bancorp | | 10,200 | 325,176 |
| United Parcel Service, Inc., Class B | | 2,200 | 310,750 |
| UnitedHealth Group, Inc. | | 800 | 428,448 |
| Vail Resorts, Inc. | | 1,300 | 275,925 |
| Verizon Communications, Inc. | | 12,500 | 439,125 |
| VICI Properties, Inc. | | 10,300 | 287,370 |
| Walmart, Inc. | | 2,300 | 375,843 |
| WEC Energy Group, Inc. | | 5,400 | 439,506 |
|
| 10 | JOHN HANCOCK TAX-ADVANTAGED GLOBAL SHAREHOLDER YIELD FUND | ANNUAL REPORT | SEE NOTES TO FINANCIAL STATEMENTS |
| | | Yield (%) | | Shares | Value |
Short-term investments 0.6% | | | | $289,240 |
| (Cost $289,240) | | | | | |
Short-term funds 0.6% | | | | | 289,240 |
| State Street Institutional Treasury Money Market Fund, Premier Class | 5.2942(C) | | 289,240 | 289,240 |
|
Total investments (Cost $55,553,354) 98.2% | | | $52,181,978 |
Other assets and liabilities, net 1.8% | | | 981,218 |
Total net assets 100.0% | | | | | $53,163,196 |
| The percentage shown for each investment category is the total value of the category as a percentage of the net assets of the fund unless otherwise indicated. |
Security Abbreviations and Legend |
| ADR | American Depositary Receipt |
| GDR | Global Depositary Receipt |
| (A) | These securities are exempt from registration under Rule 144A of the Securities Act of 1933. Such securities may be resold, normally to qualified institutional buyers, in transactions exempt from registration. |
| (B) | Non-income producing security. |
| (C) | The rate shown is the annualized seven-day yield as of 10-31-23. |
At 10-31-23, the aggregate cost of investments for federal income tax purposes was $69,282,438. Net unrealized depreciation aggregated to $17,100,460, of which $392,231 related to gross unrealized appreciation and $17,492,691 related to gross unrealized depreciation.
| SEE NOTES TO FINANCIAL STATEMENTS | ANNUAL REPORT | JOHN HANCOCK TAX-ADVANTAGED GLOBAL SHAREHOLDER YIELD FUND | 11 |
STATEMENT OF ASSETS AND LIABILITIES
10-31-23
Assets | |
| Unaffiliated investments, at value (Cost $55,553,354) | $52,181,978 |
| Foreign currency, at value (Cost $479) | 477 |
| Dividends and interest receivable | 593,768 |
| Receivable for investments sold | 1,727,452 |
| Other assets | 60,446 |
Total assets | 54,564,121 |
Liabilities | |
| Payable for investments purchased | 1,180,655 |
| Payable to affiliates | |
| Accounting and legal services fees | 3,931 |
| Trustees’ fees | 72 |
| Other liabilities and accrued expenses | 216,267 |
Total liabilities | 1,400,925 |
Net assets | $53,163,196 |
Net assets consist of | |
| Paid-in capital | $90,668,867 |
| Total distributable earnings (loss) | (37,505,671) |
Net assets | $53,163,196 |
| |
Net asset value per share | |
| Based on 10,921,751 shares of beneficial interest outstanding - unlimited number of shares authorized with $0.01 par value | $4.87 |
| 12 | JOHN HANCOCK TAX-ADVANTAGED GLOBAL SHAREHOLDER YIELD FUND | ANNUAL REPORT | SEE NOTES TO FINANCIAL STATEMENTS |
STATEMENT OF OPERATIONS
For the year ended
10-31-23
Investment income | |
| Dividends | $4,082,595 |
| Interest | 293 |
| Less foreign taxes withheld | (216,152) |
Total investment income | 3,866,736 |
Expenses | |
| Investment management fees | 530,440 |
| Accounting and legal services fees | 12,264 |
| Transfer agent fees | 17,969 |
| Trustees’ fees | 48,869 |
| Custodian fees | 24,769 |
| Printing and postage | 27,211 |
| Professional fees | 247,794 |
| Stock exchange listing fees | 23,738 |
| Other | 9,385 |
Total expenses | 942,439 |
| Less expense reductions | (4,255) |
Net expenses | 938,184 |
Net investment income | 2,928,552 |
Realized and unrealized gain (loss) | |
Net realized gain (loss) on | |
| Unaffiliated investments and foreign currency transactions | (190,473) |
| | (190,473) |
Change in net unrealized appreciation (depreciation) of | |
| Unaffiliated investments and translation of assets and liabilities in foreign currencies | (552,599) |
| | (552,599) |
Net realized and unrealized loss | (743,072) |
Increase in net assets from operations | $2,185,480 |
| SEE NOTES TO FINANCIAL STATEMENTS | ANNUAL REPORT | JOHN HANCOCK TAX-ADVANTAGED GLOBAL SHAREHOLDER YIELD FUND | 13 |
STATEMENTS OF CHANGES IN NET ASSETS
| | Year ended
10-31-23 | Year ended
10-31-22 |
Increase (decrease) in net assets | | |
From operations | | |
| Net investment income | $2,928,552 | $3,240,675 |
| Net realized loss | (190,473) | (7,174,497) |
| Change in net unrealized appreciation (depreciation) | (552,599) | (1,803,430) |
Increase (decrease) in net assets resulting from operations | 2,185,480 | (5,737,252) |
Distributions to shareholders | | |
| From earnings | (3,040,311) | (3,212,941) |
| From tax return of capital | (3,949,610) | (3,775,778) |
Total distributions | (6,989,921) | (6,988,719) |
Fund share transactions | | |
| Issued pursuant to Dividend Reinvestment Plan | — | 24,180 |
Total decrease | (4,804,441) | (12,701,791) |
Net assets | | |
| Beginning of year | 57,967,637 | 70,669,428 |
End of year | $53,163,196 | $57,967,637 |
Share activity | | |
Shares outstanding | | |
| Beginning of year | 10,921,751 | 10,917,997 |
| Issued pursuant to Dividend Reinvestment Plan | — | 3,754 |
End of year | 10,921,751 | 10,921,751 |
| 14 | JOHN HANCOCK TAX-ADVANTAGED GLOBAL SHAREHOLDER YIELD FUND | ANNUAL REPORT | SEE NOTES TO FINANCIAL STATEMENTS |
Period ended | 10-31-23 | 10-31-22 | 10-31-21 | 10-31-20 | 10-31-19 |
Per share operating performance | | | | | |
Net asset value, beginning of period | $5.31 | $6.47 | $5.78 | $7.61 | $7.63 |
| Net investment income 1 | 0.27 | 0.30 | 0.32 | 0.36 | 0.42 |
| Net realized and unrealized gain (loss) on investments | (0.07) | (0.82) | 1.01 | (1.55) | 0.19 |
Total from investment operations | 0.20 | (0.52) | 1.33 | (1.19) | 0.61 |
Less distributions | | | | | |
| From net investment income | (0.28) | (0.29) | (0.32) | (0.35) | (0.42) |
| From tax return of capital | (0.36) | (0.35) | (0.32) | (0.29) | (0.22) |
Total distributions | (0.64) | (0.64) | (0.64) | (0.64) | (0.64) |
| Anti-dilutive impact of repurchase plan | — | — | — | — 2,3 | 0.01 3 |
Net asset value, end of period | $4.87 | $5.31 | $6.47 | $5.78 | $7.61 |
Per share market value, end of period | $4.10 | $4.71 | $6.37 | $4.75 | $6.93 |
Total return at net asset value (%) 4,5 | 4.75 | (8.16) | 23.93 | (14.79) | 9.45 |
Total return at market value (%) 4 | (0.58) | (17.26) | 48.48 | (23.10) | 10.06 |
Ratios and supplemental data | | | | | |
| Net assets, end of period (in millions) | $53 | $58 | $71 | $63 | $83 |
| Ratios (as a percentage of average net assets): | | | | | |
| Expenses before reductions | 1.60 | 1.38 | 1.42 | 1.32 | 1.35 |
| Expenses including reductions | 1.59 | 1.37 | 1.42 | 1.31 | 1.34 |
| Net investment income | 4.97 | 4.93 | 4.85 | 5.43 | 5.60 |
| Portfolio turnover (%) | 308 | 311 | 302 | 301 | 260 |
1 | Based on average daily shares outstanding. |
2 | Less than $0.005 per share. |
3 | The repurchase plan was completed at an average repurchase price of $6.97 for 24,933 shares and $6.80 for 106,001 shares for the periods ended 10-31-20 and 10-31-19, respectively. |
4 | Total return based on net asset value reflects changes in the fund’s net asset value during each period. Total return based on market value reflects changes in market value. Each figure assumes that distributions from income, capital gains and tax return of capital, if any, were reinvested. |
5 | Total returns would have been lower had certain expenses not been reduced during the applicable periods. |
| SEE NOTES TO FINANCIAL STATEMENTS | ANNUAL REPORT | JOHN HANCOCK Tax-Advantaged Global Shareholder Yield Fund | 15 |
Notes to financial statements
John Hancock Tax-Advantaged Global Shareholder Yield Fund (the fund) is a closed-end management investment company organized as a Massachusetts business trust and registered under the Investment Company Act of 1940, as amended (the 1940 Act).
Note 2
—
Significant accounting policies
The financial statements have been prepared in conformity with accounting principles generally accepted in the United States of America (US GAAP), which require management to make certain estimates and assumptions as of the date of the financial statements. Actual results could differ from those estimates and those differences could be significant. The fund qualifies as an investment company under Topic 946 of Accounting Standards Codification of US GAAP.
Events or transactions occurring after the end of the fiscal period through the date that the financial statements were issued have been evaluated in the preparation of the financial statements. The following summarizes the significant accounting policies of the fund:
Security valuation.
Investments are stated at value as of the scheduled close of regular trading on the New York Stock Exchange (NYSE), normally at 4:00 P.M., Eastern Time. In case of emergency or other disruption resulting in the NYSE not opening for trading or the NYSE closing at a time other than the regularly scheduled close, the net asset value (NAV) may be determined as of the regularly scheduled close of the NYSE pursuant to the Valuation Policies and Procedures of the Advisor, John Hancock Investment Management LLC.
In order to value the securities, the fund uses the following valuation techniques: Equity securities, including exchange-traded or closed-end funds, are typically valued at the last sale price or official closing price on the exchange or principal market where the security trades. In the event there were no sales during the day or closing prices are not available, the securities are valued using the last available bid price. Investments by the fund in open-end mutual funds are valued at their respective NAVs each business day. Foreign securities and currencies are valued in U.S. dollars based on foreign currency exchange rates supplied by an independent pricing vendor.
In certain instances, the Pricing Committee of the Advisor may determine to value equity securities using prices obtained from another exchange or market if trading on the exchange or market on which prices are typically obtained did not open for trading as scheduled, or if trading closed earlier than scheduled, and trading occurred as normal on another exchange or market.
Other portfolio securities and assets, for which reliable market quotations are not readily available, are valued at fair value as determined in good faith by the Pricing Committee following procedures established by the Advisor and adopted by the Board of Trustees. The frequency with which these fair valuation procedures are used cannot be predicted and fair value of securities may differ significantly from the value that would have been used had a ready market for such securities existed. Trading in foreign securities may be completed before the scheduled daily close of trading on the NYSE. Significant events at the issuer or market level may affect the values of securities between the time when the valuation of the securities is generally determined and the close of the NYSE. If a significant event occurs, these securities may be fair valued, as determined in good faith by the Pricing Committee, following procedures established by the Advisor and adopted by the Board of Trustees. The Advisor uses fair value adjustment factors provided by an independent pricing vendor to value certain foreign securities in order to adjust for events that may occur between the close of foreign exchanges or markets and the close of the NYSE.
The fund uses a three tier hierarchy to prioritize the pricing assumptions, referred to as inputs, used in valuation techniques to measure fair value. Level 1 includes securities valued using quoted prices in active markets for identical securities, including registered investment companies. Level 2 includes securities valued using other significant observable inputs. Observable inputs may include quoted prices for similar securities, interest rates, prepayment speeds and credit risk. Prices for securities valued using these inputs are received from independent pricing vendors and brokers and are based on an evaluation of the inputs described. Level 3 includes securities valued using significant unobservable inputs when market prices are not readily available or reliable, including the
| 16 | JOHN HANCOCK Tax-Advantaged Global Shareholder Yield Fund | ANNUAL REPORT | |
Advisor’s assumptions in determining the fair value of investments. Factors used in determining value may include market or issuer specific events or trends, changes in interest rates and credit quality. The inputs or methodology used for valuing securities are not necessarily an indication of the risks associated with investing in those securities. Changes in valuation techniques and related inputs may result in transfers into or out of an assigned level within the disclosure hierarchy.
The following is a summary of the values by input classification of the fund’s investments as of October 31, 2023, by major security category or type:
| | Total
value at
10-31-23 | Level 1
quoted
price | Level 2
significant
observable
inputs | Level 3
significant
unobservable
inputs |
Investments in securities: | | | | |
Assets | | | | |
Common stocks | | | | |
| Austria | $445,404 | — | $445,404 | — |
| Canada | 3,548,163 | $3,548,163 | — | — |
| France | 3,925,165 | — | 3,925,165 | — |
| Germany | 3,148,625 | — | 3,148,625 | — |
| Ireland | 479,808 | 479,808 | — | — |
| Italy | 685,080 | — | 685,080 | — |
| Japan | 955,044 | — | 955,044 | — |
| Norway | 444,566 | — | 444,566 | — |
| South Korea | 1,203,947 | 440,167 | 763,780 | — |
| Switzerland | 1,718,214 | 287,084 | 1,431,130 | — |
| Taiwan | 535,122 | 535,122 | — | — |
| United Kingdom | 5,072,288 | 1,618,457 | 3,453,831 | — |
| United States | 29,731,312 | 29,731,312 | — | — |
Short-term investments | 289,240 | 289,240 | — | — |
Total investments in securities | $52,181,978 | $36,929,353 | $15,252,625 | — |
Real estate investment trusts.
The fund may invest in real estate investment trusts (REITs). Distributions from REITs may be recorded as income and subsequently characterized by the REIT at the end of their fiscal year as a reduction of cost of investments and/or as a realized gain. As a result, the fund will estimate the components of distributions from these securities. Such estimates are revised when the actual components of the distributions are known.
Security transactions and related investment income.
Investment security transactions are accounted for on a trade date plus one basis for daily NAV calculations. However, for financial reporting purposes, investment transactions are reported on trade date. Interest income is accrued as earned. Dividend income is recorded on ex-date, except for dividends of certain foreign securities where the dividend may not be known until after the ex-date. In those cases, dividend income, net of withholding taxes, is recorded when the fund becomes aware of the dividends. Non-cash dividends, if any, are recorded at the fair market value of the securities received. Distributions received on securities that represent a tax return of capital and/or capital gain, if any, are recorded as a reduction of cost of investments and/or as a realized gain, if amounts are estimable. Gains and losses on securities sold are determined on the basis of identified cost and may include proceeds from litigation.
Foreign investing.
Assets, including investments, and liabilities denominated in foreign currencies are translated into U.S. dollar values each day at the prevailing exchange rate. Purchases and sales of securities, income and expenses are translated into U.S. dollars at the prevailing exchange rate on the date of the transaction. The effect
| | ANNUAL REPORT | JOHN HANCOCK Tax-Advantaged Global Shareholder Yield Fund | 17 |
of changes in foreign currency exchange rates on the value of securities is reflected as a component of the realized and unrealized gains (losses) on investments. Foreign investments are subject to a decline in the value of a foreign currency versus the U.S. dollar, which reduces the dollar value of securities denominated in that currency.
Funds that invest internationally generally carry more risk than funds that invest strictly in U.S. securities. Risks can result from differences in economic and political conditions, regulations, market practices (including higher transaction costs), accounting standards and other factors.
Foreign taxes.
The fund may be subject to withholding tax on income, capital gains or repatriations imposed by certain countries, a portion of which may be recoverable. Foreign taxes are accrued based upon the fund’s understanding of the tax rules and rates that exist in the foreign markets in which it invests. Taxes are accrued based on gains realized by the fund as a result of certain foreign security sales. In certain circumstances, estimated taxes are accrued based on unrealized appreciation of such securities. Investment income is recorded net of foreign withholding taxes.
Overdrafts.
Pursuant to the custodian agreement, the fund’s custodian may, in its discretion, advance funds to the fund to make properly authorized payments. When such payments result in an overdraft, the fund is obligated to repay the custodian for any overdraft, including any costs or expenses associated with the overdraft. The custodian may have a lien, security interest or security entitlement in any fund property that is not otherwise segregated or pledged, to the maximum extent permitted by law, to the extent of any overdraft.
Expenses.
Within the John Hancock group of funds complex, expenses that are directly attributable to an individual fund are allocated to such fund. Expenses that are not readily attributable to a specific fund are allocated among all funds in an equitable manner, taking into consideration, among other things, the nature and type of expense and the fund’s relative net assets. Expense estimates are accrued in the period to which they relate and adjustments are made when actual amounts are known.
Federal income taxes.
The fund intends to continue to qualify as a regulated investment company by complying with the applicable provisions of the Internal Revenue Code and will not be subject to federal income tax on taxable income that is distributed to shareholders. Therefore, no federal income tax provision is required.
For federal income tax purposes, as of October 31, 2023, the fund has a long-term capital loss carryforward of $20,402,462 available to offset future net realized capital gains. This carryforward does not expire.
As of October 31, 2023, the fund had no uncertain tax positions that would require financial statement recognition, derecognition or disclosure. The fund’s federal tax returns are subject to examination by the Internal Revenue Service for a period of three years.
Distribution of income and gains.
Distributions to shareholders from net investment income and net realized gains, if any, are recorded on the ex-date. The fund generally declares and pays dividends quarterly. Capital gain distributions, if any, are typically distributed annually.
The tax character of distributions for the years ended October 31, 2023 and 2022 was as follows:
| | October 31, 2023 | October 31, 2022 |
| Ordinary income | $3,040,311 | $3,212,941 |
| Return of capital | 3,949,610 | 3,775,778 |
Total | $6,989,921 | $6,988,719 |
As of October 31, 2023, there were no distributable earnings on a tax basis.
Such distributions and distributable earnings, on a tax basis, are determined in conformity with income tax regulations, which may differ from US GAAP. Distributions in excess of tax basis earnings and profits, if any, are reported in the fund’s financial statements as a return of capital.
| 18 | JOHN HANCOCK Tax-Advantaged Global Shareholder Yield Fund | ANNUAL REPORT | |
Capital accounts within the financial statements are adjusted for permanent book-tax differences. These adjustments have no impact on net assets or the results of operations. Temporary book-tax differences, if any, will reverse in a subsequent period. Book-tax differences are primarily attributable to wash sale loss deferrals.
Note 3
—
Guarantees and indemnifications
Under the fund’s organizational documents, its Officers and Trustees are indemnified against certain liabilities arising out of the performance of their duties to the fund. Additionally, in the normal course of business, the fund enters into contracts with service providers that contain general indemnification clauses. The fund’s maximum exposure under these arrangements is unknown, as this would involve future claims that may be made against the fund that have not yet occurred. The risk of material loss from such claims is considered remote.
Note 4
—
Fees and transactions with affiliates
John Hancock Investment Management LLC (the Advisor) serves as investment advisor for the fund. John Hancock Investment Management Distributors LLC (the Distributor), an affiliate of the Advisor, serves as distributor for the common shares offered through the equity shelf offering of the fund. The Advisor and the Distributor are indirect, principally owned subsidiaries of John Hancock Life Insurance Company (U.S.A.), which in turn is a subsidiary of Manulife Financial Corporation (MFC).
Management fee.
The fund has an investment management agreement with the Advisor under which the fund pays a daily management fee to the Advisor, equivalent on an annual basis to 0.90% of the fund’s average daily managed assets. The Advisor has a subadvisory agreement with Epoch Investment Partners, Inc. The fund is not responsible for payment of the subadvisory fees.
The Advisor has contractually agreed to waive a portion of its management fee and/or reimburse expenses for certain funds of the John Hancock group of funds complex, including the fund (the participating portfolios). This waiver is based upon aggregate net assets of all the participating portfolios. The amount of the reimbursement is calculated daily and allocated among all the participating portfolios in proportion to the daily net assets of each fund. During the year ended October 31, 2023, this waiver amounted to 0.01% of the fund’s average daily net assets. This arrangement expires on July 31, 2025, unless renewed by mutual agreement of the fund and the Advisor based upon a determination that this is appropriate under the circumstances at that time.
The expense reductions described above amounted to $4,255 for the year ended October 31, 2023.
Expenses waived or reimbursed in the current fiscal period are not subject to recapture in future fiscal periods.
The investment management fees, including the impact of the waivers and reimbursements as described above, incurred for the year ended October 31, 2023, were equivalent to a net annual effective rate of 0.89% of the fund’s average daily net assets.
Accounting and legal services.
Pursuant to a service agreement, the fund reimburses the Advisor for all expenses associated with providing the administrative, financial, legal, compliance, accounting and recordkeeping services to the fund, including the preparation of all tax returns, periodic reports to shareholders and regulatory reports, among other services. These accounting and legal services fees incurred, for the year ended October 31, 2023, amounted to an annual rate of 0.02% of the fund’s average daily net assets.
Distributor.
The fund will compensate the Distributor with respect to sales of the common shares offered through the equity shelf offering at a commission rate of 1.00% of the gross proceeds of the sale of common shares, a portion of which is allocated to the selling dealers. The Distributor has an agreement with a sub-placement agent in the sale of common shares. The fund is not responsible for payment of commissions to the sub placement agent.
| | ANNUAL REPORT | JOHN HANCOCK Tax-Advantaged Global Shareholder Yield Fund | 19 |
Trustee expenses.
The fund compensates each Trustee who is not an employee of the Advisor or its affiliates. These Trustees receive from the fund and the other John Hancock closed-end funds an annual retainer. In addition, Trustee out-of-pocket expenses are allocated to each fund based on its net assets relative to other funds within the John Hancock group of funds complex.
Note 5
—
Fund share transactions
In December 31, 2018, the Board of Trustees approved a share repurchase plan, which is subsequently reviewed by the Board of Trustees each year in December. Under the current share repurchase plan, the fund may purchase in the open market, between January 1, 2023 and December 31, 2023, up to 10% of its outstanding common shares as of December 31, 2022. The share repurchase plan will remain in effect between January 1, 2023 and December 31, 2023.
During the years ended October 31, 2023 and 2022, the fund had no activities under the repurchase program. Shares repurchased and corresponding dollar amounts, if any, are included on the Statements of changes in net assets. The anti-dilutive impacts of these share repurchases, if any, are included on the Financial highlights.
Transactions in common shares, if any, are presented in the Statements of changes in net assets. In 2012, 2015, 2018 and 2021, the fund filed registration statements with the Securities and Exchange Commission (SEC), registering and/or carrying forward 1,200,000, 1,500,000, 1,000,000 and 1,000,000 common shares, respectively, through equity shelf offering programs. Under these programs, the fund, subject to market conditions, may raise additional equity capital from time to time by offering new common shares at a price equal to or above the fund’s net asset value (NAV) per common share. Shares issued in shelf offering and corresponding dollar amounts, if any, are included on the Statements of changes in net assets. The premium from shares sold through these shelf offerings, if any, are included on the Financial highlights. During the years ended October 31, 2023 and 2022, the fund had no activities under the shelf offering program. Proceeds received in connection with the shelf offering are net of commissions and offering costs. Total offering costs of $207,613 have been prepaid by the fund. As of October 31, 2023, $160,763 has been deducted from proceeds of shares issued and the remaining $46,850 is included in Other assets on the Statement of assets and liabilities.
Note 6
—
Purchase and sale of securities
Purchases and sales of securities, other than short-term investments, amounted to $175,493,982 and $178,943,566, respectively, for the year ended October 31, 2023.
At its meeting held on December 12-14, 2023, the Board of Trustees approved the proposal to merge the fund into John Hancock Global Shareholder Yield Fund. The merger is subject to shareholder approval and is expected to occur in April 2024.
| 20 | JOHN HANCOCK Tax-Advantaged Global Shareholder Yield Fund | ANNUAL REPORT | |
Report of Independent Registered Public Accounting Firm
To the Board of Trustees and Shareholders of John Hancock Tax-Advantaged Global Shareholder Yield Fund
Opinion on the Financial Statements
We have audited the accompanying statement of assets and liabilities, including the fund’s investments, of John Hancock Tax-Advantaged Global Shareholder Yield Fund (the “Fund”) as of October 31, 2023, the related statement of operations for the year ended October 31, 2023, the statements of changes in net assets for each of the two years in the period ended October 31, 2023, including the related notes, and the financial highlights for each of the five years in the period ended October 31, 2023 (collectively referred to as the “financial statements”). In our opinion, the financial statements present fairly, in all material respects, the financial position of the Fund as of October 31, 2023, the results of its operations for the year then ended, the changes in its net assets for each of the two years in the period ended October 31, 2023 and the financial highlights for each of the five years in the period ended October 31, 2023 in conformity with accounting principles generally accepted in the United States of America.
These financial statements are the responsibility of the Fund’s management. Our responsibility is to express an opinion on the Fund’s financial statements based on our audits. We are a public accounting firm registered with the Public Company Accounting Oversight Board (United States) (PCAOB) and are required to be independent with respect to the Fund in accordance with the U.S. federal securities laws and the applicable rules and regulations of the Securities and Exchange Commission and the PCAOB.
We conducted our audits of these financial statements in accordance with the standards of the PCAOB. Those standards require that we plan and perform the audit to obtain reasonable assurance about whether the financial statements are free of material misstatement, whether due to error or fraud.
Our audits included performing procedures to assess the risks of material misstatement of the financial statements, whether due to error or fraud, and performing procedures that respond to those risks. Such procedures included examining, on a test basis, evidence regarding the amounts and disclosures in the financial statements. Our audits also included evaluating the accounting principles used and significant estimates made by management, as well as evaluating the overall presentation of the financial statements. Our procedures included confirmation of securities owned as of October 31, 2023 by correspondence with the custodian, transfer agent and brokers; when replies were not received from brokers, we performed other auditing procedures. We believe that our audits provide a reasonable basis for our opinion.
/s/ PricewaterhouseCoopers LLP
Boston, Massachusetts
December 15, 2023
We have served as the auditor of one or more investment companies in the John Hancock group of funds since 1988.
| | ANNUAL REPORT | JOHN HANCOCK TAX-ADVANTAGED GLOBAL SHAREHOLDER YIELD FUND | 21 |
(Unaudited)
For federal income tax purposes, the following information is furnished with respect to the distributions of the fund, if any, paid during its taxable year ended October 31, 2023.
The fund reports the maximum amount allowable of its net taxable income as eligible for the corporate dividends-received deduction.
The fund reports the maximum amount allowable of its net taxable income as qualified dividend income as provided in the Jobs and Growth Tax Relief Reconciliation Act of 2003.
The fund reports the maximum amount allowable as Section 163(j) Interest Dividends.
The fund reports the maximum amount allowable of its Section 199A dividends as defined in Proposed Treasury Regulation §1.199A-3(d).
Eligible shareholders will be mailed a 2023 Form 1099-DIV in early 2024. This will reflect the tax character of all distributions paid in calendar year 2023.
Please consult a tax advisor regarding the tax consequences of your investment in the fund.
| 22 | JOHN HANCOCK TAX-ADVANTAGED GLOBAL SHAREHOLDER YIELD FUND | ANNUAL REPORT | |
Investment objective, principal investment strategies, and principal risks
Unaudited
The Fund’s investment objective is to provide total return consisting of a high level of current income and gains and long term capital appreciation. In pursuing its investment objective of total return, the Fund will seek to emphasize high current income. In pursuing its investment objective, the Fund seeks to achieve favorable after-tax returns for its shareholders by seeking to minimize the U.S. federal income tax consequences on income and gains generated by the Fund.
Principal Investment Strategies
Under normal market conditions, the Fund invests at least 80% of its total assets in a diversified portfolio of dividend-paying securities of issuers located throughout the world. This policy is subject to the requirement that the manager believes at the time of investment that such securities are eligible to pay tax-advantaged dividends. This is a non-fundamental policy and may be changed by the Board of Trustees of the fund provided that shareholders are provided with at least 60 days prior written notice of any change as required by the rules under the 1940 Act. The Fund seeks to produce superior, risk-adjusted returns by using a disciplined, proprietary investment approach that is focused on identifying companies with strong free cash flow and that use their free cash flow to seek to maximize “shareholder yield” through dividend payments, stock repurchases and debt reduction. By assembling a diversified portfolio of securities which, in the aggregate, possess positive growth of free cash flow, high cash dividend yields, share buyback programs and net debt reductions, the Fund seeks to provide shareholders an attractive total return with less volatility than the global equity market as a whole. “Free cash flow” is the cash available for distribution to investors after all planned capital investment and taxes. The Advisor believes that free cash flow is important because it allows a company to pursue opportunities that enhance shareholder value.
The relative portions of the Fund’s portfolio invested in securities of U.S. and non-U.S. issuers are expected to vary over time. Under normal market conditions, the Fund invests at least 40% of its total assets in securities of non-U.S. issuers, unless the manager deems market conditions and/or company valuations to be less favorable to non-U.S. issuers, in which case, the fund will invest at least 30% of its net assets in non-U.S. issuers. The Fund may invest up to 20% of its total assets in securities issued by companies located in emerging markets when Epoch, the Fund’s subadvisor, believes such companies offer attractive opportunities. The Fund may not invest more than 25% of its total assets in the securities of issuers in any single industry or group of related industries. The Fund may trade securities actively and may engage in short-term trading strategies. The Fund may invest up to 15% of its net assets in illiquid securities.
The Fund invests in global equity securities across a broad range of market capitalizations. The Fund generally invests in companies with a market capitalization (i.e., total market value of a company’s shares) of $500 million or greater at the time of purchase. The equity securities Epoch finds attractive generally have valuations lower than Epoch’s estimate of their fundamental value, as reflected in price-to-cash flow, price-to-book ratios or other stock valuation measures. In selecting securities for the Fund’s portfolio, Epoch focuses on dividend-paying common stocks and to a lesser extent preferred securities that produce an attractive level of tax-advantaged income. There can be no assurance as to the portion of the fund’s dividends that will be tax-advantaged. The Fund may seek to enhance the level of dividend income it receives by engaging in dividend capture trading.
The Fund may invest in securities of other open- and closed-end investment companies, including exchange traded funds, to the extent that such investments are consistent with the Fund’s investment objective and policies and permissible under the 1940 Act. The Fund may lend its portfolio securities and invest in debt securities, including below investment-grade debt securities (also known as “junk bonds”).
| | ANNUAL REPORT | JOHN HANCOCK TAX-ADVANTAGED GLOBAL SHAREHOLDER YIELD FUND | 23 |
The Advisor may also take into consideration environmental, social, and/or governance (“ESG”) factors, alongside other relevant factors, as part of its investment selection process. The ESG characteristics utilized in the fund’s investment process may change over time and one or more characteristics may not be relevant with respect to all issuers that are eligible fund investments.
As is the case with all exchange-listed closed-end funds, shares of this fund may trade at a discount or a premium to the fund’s net asset value (NAV). An investment in the fund is subject to investment and market risks, including the possible loss of the entire principal invested.
The fund’s main risks are listed below in alphabetical order, not in order of importance.
Changing distribution level & return of capital risk.
There is no guarantee prior distribution levels will be maintained, and distributions may include a substantial tax return of capital. A return of capital is the return of all or a portion of a shareholder’s investment in the fund. For the fiscal year ended October 31, 2023, the fund’s aggregate distributions included a tax return of capital of $(0.36) per share, or 56.50% of aggregate distributions, which may increase the potential tax gain or decrease the potential tax loss of a subsequent sale of shares of the fund.
Credit and counterparty risk.
The issuer or guarantor of a fixed-income security, the counterparty to an over-the-counter derivatives contract, or a borrower of fund securities may not make timely payments or otherwise honor its obligations. A downgrade or default affecting any of the fund’s securities could affect the fund’s performance.
Cybersecurity and operational risk.
Cybersecurity breaches may allow an unauthorized party to gain access to fund assets, customer data, or proprietary information, or cause a fund or its service providers to
suffer
data corruption or lose operational functionality. Similar incidents affecting issuers of a fund’s securities may negatively impact performance. Operational risk may arise from human error, error by third parties, communication errors, or technology failures, among other causes.
Economic and market events risk.
Events in certain sectors historically have resulted, and may in the future result, in an unusually high degree of volatility in the financial markets, both domestic and foreign. These events have included, but are not limited to: bankruptcies, corporate restructurings, and other similar events; governmental efforts to limit short selling and high frequency trading; measures to address U.S. federal and state budget deficits; social, political, and economic instability in Europe; economic stimulus by the Japanese central bank; dramatic changes in energy prices and currency exchange rates; and China’s economic slowdown. Interconnected global economies and financial markets increase the possibility that conditions in one country or region might adversely impact issuers in a different country or region. Both domestic and foreign equity markets have experienced increased volatility and turmoil, with issuers that have exposure to the real estate, mortgage, and credit markets particularly affected. Financial institutions could suffer losses as interest rates rise or economic conditions deteriorate.
In addition, relatively high market volatility and reduced liquidity in credit and fixed-income markets may adversely affect many issuers worldwide. Actions taken by the U.S. Federal Reserve (Fed) or foreign central banks to stimulate or stabilize economic growth, such as interventions in markets, could cause high volatility in the equity and fixed-income markets. Reduced liquidity may result in less money being available to purchase raw materials, goods, and services from emerging markets, which may, in turn, bring down the prices of these economic staples. It may also result in emerging-market issuers having more difficulty obtaining financing, which may, in turn, cause a decline in their securities prices.
Beginning in March 2022, the Fed began increasing interest rates and has signaled the potential for further increases. As a result, risks associated with rising interest rates are currently heightened. It is difficult to accurately predict the pace at which the Fed will increase interest rates any further, or the timing, frequency or magnitude of
| 24 | JOHN HANCOCK TAX-ADVANTAGED GLOBAL SHAREHOLDER YIELD FUND | ANNUAL REPORT | |
any such increases, and the evaluation of macro-economic and other conditions could cause a change in approach in the future. Any such increases generally will cause market interest rates to rise and could cause the value of the fund’s investments, and the fund’s net asset value (NAV), to decline, potentially suddenly and significantly.
In addition, as the Fed increases the target Fed funds rate, any such rate increases, among other factors, could cause markets to experience continuing high volatility. A significant increase in interest rates may cause a decline in the market for equity securities. These events and the possible resulting market volatility may have an adverse effect on the fund.
Political turmoil within the United States and abroad may also impact the fund. Although the U.S. government has honored its credit obligations, it remains possible that the United States could default on its obligations. While it is impossible to predict the consequences of such an unprecedented event, it is likely that a default by the United States would be highly disruptive to the U.S. and global securities markets and could significantly impair the value of the fund’s investments. Similarly, political events within the United States at times have resulted, and may in the future result, in a shutdown of government services, which could negatively affect the U.S. economy, decrease the value of many fund investments, and increase uncertainty in or impair the operation of the U.S. or other securities markets. In recent years, the U.S. renegotiated many of its global trade relationships and imposed or threatened to impose significant import tariffs. These actions could lead to price volatility and overall declines in U.S. and global investment markets.
Uncertainties surrounding the sovereign debt of a number of European Union (EU) countries and the viability of the EU have disrupted and may in the future disrupt markets in the United States and around the world. If one or more countries leave the EU or the EU dissolves, the global securities markets likely will be significantly disrupted. On January 31, 2020, the United Kingdom (UK) left the EU, commonly referred to as “Brexit,” the UK ceased to be a member of the EU, and the UK and EU entered into a Trade and Cooperation Agreement. While the full impact of Brexit is unknown, Brexit has already resulted in volatility in European and global markets. There remains significant market uncertainty regarding Brexit’s ramifications, and the range and potential implications of possible political, regulatory, economic, and market outcomes are difficult to predict.
A widespread health crisis such as a global pandemic could cause substantial market volatility, exchange trading suspensions and closures, which may lead to less liquidity in certain instruments, industries, sectors or the markets generally, and may ultimately affect fund performance. For example, the coronavirus (COVID-19) pandemic has resulted and may continue to result in significant disruptions to global business activity and market volatility due to disruptions in market access, resource availability, facilities operations, imposition of tariffs, export controls and supply chain disruption, among others. While many countries have lifted some or all restrictions related to the coronavirus (COVID-19) and the United States ended the public health emergency and national emergency declarations relating to the coronavirus (COVID-19) pandemic on May 11, 2023, the continued impact of coronavirus (COVID-19) and related variants is uncertain. The impact of a health crisis and other epidemics and pandemics that may arise in the future, could affect the global economy in ways that cannot necessarily be foreseen at the present time. A health crisis may exacerbate other pre-existing political, social and economic risks. Any such impact could adversely affect the fund’s performance, resulting in losses to your investment.
Political and military events, including in Ukraine, North Korea, Russia, Venezuela, Iran, Syria, and other areas of the Middle East, and nationalist unrest in Europe and South America, also may cause market disruptions.
As a result of continued political tensions and armed conflicts, including the Russian invasion of Ukraine commencing in February of 2022, the extent and ultimate result of which are unknown at this time, the United States and the EU, along with the regulatory bodies of a number of countries, have imposed economic sanctions on certain Russian corporate entities and individuals, and certain sectors of Russia’s economy, which may result in, among other things, the continued devaluation of Russian currency, a downgrade in the country’s credit rating, and/or a decline in the value and liquidity of Russian securities, property or interests. These sanctions could also result in the immediate freeze of Russian securities and/or funds invested in prohibited assets, impairing the ability of the fund to buy, sell, receive or deliver those securities and/or assets. These sanctions or the threat of
| | ANNUAL REPORT | JOHN HANCOCK TAX-ADVANTAGED GLOBAL SHAREHOLDER YIELD FUND | 25 |
additional sanctions could also result in Russia taking counter measures or retaliatory actions, which may further impair the value and liquidity of Russian securities. The United States and other nations or international organizations may also impose additional economic sanctions or take other actions that may adversely affect Russia-exposed issuers and companies in various sectors of the Russian economy. Any or all of these potential results could lead Russia’s economy into a recession. Economic sanctions and other actions against Russian institutions, companies, and individuals resulting from the ongoing conflict may also have a substantial negative impact on other economies and securities markets both regionally and globally, as well as on companies with operations in the conflict region, the extent to which is unknown at this time. The United States and the EU have also imposed similar sanctions on Belarus for its support of Russia’s invasion of Ukraine. Additional sanctions may be imposed on Belarus and other countries that support Russia. Any such sanctions could present substantially similar risks as those resulting from the sanctions imposed on Russia, including substantial negative impacts on the regional and global economies and securities markets.
In addition, there is a risk that the prices of goods and services in the United States and many foreign economies may decline over time, known as deflation. Deflation may have an adverse effect on stock prices and creditworthiness and may make defaults on debt more likely. If a country’s economy slips into a deflationary pattern, it could last for a prolonged period and may be difficult to reverse. Further, there is a risk that the present value of assets or income from investments will be less in the future, known as inflation. Inflation rates may change frequently and drastically as a result of various factors, including unexpected shifts in the domestic or global economy, and the fund’s investments may be affected, which may reduce the fund’s performance. Further, inflation may lead to the rise in interest rates, which may negatively affect the value of debt instruments held by the fund, resulting in a negative impact on the fund’s performance. Generally, securities issued in emerging markets are subject to a greater risk of inflationary or deflationary forces, and more developed markets are better able to use monetary policy to normalize markets.
Equity securities risk. The price of equity securities may decline due to changes in a company’s financial condition or overall market conditions. Securities the manager believes are undervalued may never realize their full potential value, and in certain markets value stocks may underperform the market as a whole.
ESG integration risk. The manager considers ESG factors that it deems relevant or additive, along with other material factors and analysis, when managing the fund. The portion of the fund’s investments for which the manager considers these ESG factors may vary, and could increase or decrease over time. In certain situations, the extent to which these ESG factors may be applied according to the manager’s integrated investment process may not include U.S. Treasuries, government securities, or other asset classes. ESG factors may include, but are not limited to, matters regarding board diversity, climate change policies, and supply chain and human rights policies. Incorporating ESG criteria and making investment decisions based on certain ESG characteristics, as determined by the manager, carries the risk that the fund may perform differently, including underperforming funds that do not utilize ESG criteria or funds that utilize different ESG criteria. Integration of ESG factors into the fund’s investment process may result in a manager making different investments for the fund than for a fund with a similar investment universe and/or investment style that does not incorporate such considerations in its investment strategy or processes, and the fund’s investment performance may be affected. Because ESG factors are one of many considerations for the fund, the manager may nonetheless include companies with low ESG characteristics or exclude companies with high ESG characteristics in the fund’s investments.
Exchange-traded funds (ETFs) risk. The risks of owning shares of an ETF include the risks of owning the underlying securities the ETF holds. Lack of liquidity in an ETF could result in the ETF being more volatile than its underlying securities. An ETF’s shares could trade at a significant premium or discount to its NAV. A fund bears ETF fees and expenses indirectly.
Fixed-income securities risk. A rise in interest rates typically causes bond prices to fall. The longer the average maturity or duration of the bonds held by a fund, the more sensitive it will likely be to interest-rate fluctuations. An issuer may not make all interest payment or repay all or any of the principal borrowed. Changes in a security’s credit qualify may adversely affect fund performance. Additionally, the value of inflation-indexed securities is
| 26 | JOHN HANCOCK TAX-ADVANTAGED GLOBAL SHAREHOLDER YIELD FUND | ANNUAL REPORT | |
subject to the effects of changes in market interest rates caused by factors other than inflation (“real interest rates”). Generally, when real interest rates rise, the value of inflation-indexed securities will fall and the fund’s value may decline as a result of this exposure to these securities.
Foreign securities risk. Less information may be publicly available regarding foreign issuers, including foreign government issuers. Foreign securities may be subject to foreign taxes and may be more volatile than U.S. securities. Currency fluctuations and political and economic developments may adversely impact the value of foreign securities. The risks of investing in foreign securities are magnified in emerging markets. If applicable, depositary receipts are subject to most of the risks associated with investing in foreign securities directly because the value of a depositary receipt is dependent upon the market price of the underlying foreign equity security. Depositary receipts are also subject to liquidity risk.
High portfolio turnover risk. Trading securities actively and frequently can increase transaction costs (thus lowering performance) and taxable distributions.
Illiquid and restricted securities risk. Illiquid and restricted securities may be difficult to value and may involve greater risks than liquid securities. Illiquidity may have an adverse impact on a particular security’s market price and the fund’s ability to sell the security.
Investment company securities risk. The fund may invest in securities of other investment companies. Fund shareholders indirectly bear their proportionate share of the expenses of each such investment company. The total return on such investments will be reduced by the operating expenses and fees of such other investment companies, including advisory fees.
Large company risk. Larger companies may grow more slowly than smaller companies or be slower to respond to business developments. Large-capitalization securities may underperform the market as a whole.
Liquidity risk. The extent (if at all) to which a security may be sold or a derivative position closed without negatively impacting its market value may be impaired by reduced market activity or participation, legal restrictions, or other economic and market impediments. Widespread selling of fixed-income securities to satisfy redemptions during periods of reduced demand may adversely impact the price or salability of such securities.
Lower-rated and high-yield fixed-income securities risk. Lower-rated and high-yield fixed-income securities (junk bonds) are subject to greater credit quality risk, risk of default, and price volatility than higher-rated fixed-income securities, may be considered speculative, and can be difficult to resell.
Preferred and convertible securities risk. Preferred stock dividends are payable only if declared by the issuer’s board. Preferred stock may be subject to redemption provisions. The market values of convertible securities tend to fall as interest rates rise and rise as interest rates fall. Convertible preferred stock’s value can depend heavily upon the underlying common stock’s value.
Small and mid-sized company risk. Small and mid-sized companies are generally less established and may be more volatile than larger companies. Small and/or mid-capitalization securities may underperform the market as a whole.
| | ANNUAL REPORT | JOHN HANCOCK TAX-ADVANTAGED GLOBAL SHAREHOLDER YIELD FUND | 27 |
Unaudited
The fund is a diversified, closed-end management investment company, common shares of which were initially offered to the public in 2007.
Dividends and distributions
During the year ended October 31, 2023, distributions from net investment income totaling $0.2784 per share and tax return of capital totaling $0.3616 per share were paid to shareholders. The dates of payments and the amounts per share were as follows:
Payment Date | Income Distributions |
| December 30, 2022 | $0.1600 |
| March 31, 2023 | 0.1600 |
| June 30, 2023 | 0.1600 |
| September 29, 2023 | 0.1600 |
Total | $0.6400 |
Dividend reinvestment plan
The fund’s Dividend Reinvestment Plan (the Plan) provides that distributions of dividends and capital gains are automatically reinvested in common shares of the fund by Computershare Trust Company, N.A. (the Plan Agent). Every shareholder holding at least one full share of the fund is entitled to participate in the Plan. In addition, every shareholder who became a shareholder of the fund after June 30, 2011, and holds at least one full share of the fund will be automatically enrolled in the Plan. Shareholders may withdraw from the Plan at any time and shareholders who do not participate in the Plan will receive all distributions in cash.
If the fund declares a dividend or distribution payable either in cash or in common shares of the fund and the market price of shares on the payment date for the distribution or dividend equals or exceeds the fund’s net asset value per share (NAV), the fund will issue common shares to participants at a value equal to the higher of NAV or 95% of the market price. The number of additional shares to be credited to each participant’s account will be determined by dividing the dollar amount of the distribution or dividend by the higher of NAV or 95% of the market price. If the market price is lower than NAV, or if dividends or distributions are payable only in cash, then participants will receive shares purchased by the Plan Agent on participants’ behalf on the NYSE or otherwise on the open market. If the market price exceeds NAV before the Plan Agent has completed its purchases, the average per share purchase price may exceed NAV, resulting in fewer shares being acquired than if the fund had issued new shares.
There are no brokerage charges with respect to common shares issued directly by the fund. However, whenever shares are purchased or sold on the NYSE or otherwise on the open market, each participant will pay a pro rata portion of brokerage trading fees, currently $0.05 per share purchased or sold. Brokerage trading fees will be deducted from amounts to be invested.
The reinvestment of dividends and net capital gains distributions does not relieve participants of any income tax that may be payable on such dividends or distributions.
Shareholders participating in the Plan may buy additional shares of the fund through the Plan at any time in amounts of at least $50 per investment, up to a maximum of $10,000, with a total calendar year limit of $100,000. Shareholders will be charged a $5 transaction fee plus $0.05 per share brokerage trading fee for each order. Purchases of additional shares of the fund will be made on the open market. Shareholders who elect to utilize monthly electronic fund transfers to buy additional shares of the fund will be charged a $2 transaction fee plus $0.05 per share brokerage trading fee for each automatic purchase. Shareholders can also sell fund shares held in the Plan account at any time by contacting the Plan Agent by telephone, in writing or by visiting the Plan
| 28 | JOHN HANCOCK TAX-ADVANTAGED GLOBAL SHAREHOLDER YIELD FUND | ANNUAL REPORT | |
Agent’s website at www.computershare.com/investor. The Plan Agent will mail a check (less applicable brokerage trading fees) on settlement date. Pursuant to regulatory changes, effective September 5, 2017, the settlement date is changed from three business days after the shares have been sold to two business days after the shares have been sold. If shareholders choose to sell shares through their stockbroker, they will need to request that the Plan Agent electronically transfer those shares to their stockbroker through the Direct Registration System.
Shareholders participating in the Plan may withdraw from the Plan at any time by contacting the Plan Agent by telephone, in writing or by visiting the Plan Agent’s website at www.computershare.com/investor. Such termination will be effective immediately if the notice is received by the Plan Agent prior to any dividend or distribution record date; otherwise, such termination will be effective on the first trading day after the payment date for such dividend or distribution, with respect to any subsequent dividend or distribution. If shareholders withdraw from the Plan, their shares will be credited to their account; or, if they wish, the Plan Agent will sell their full and fractional shares and send the shareholders the proceeds, less a transaction fee of $5 and less brokerage trading fees of $0.05 per share. If a shareholder does not maintain at least one whole share of common stock in the Plan account, the Plan Agent may terminate such shareholder’s participation in the Plan after written notice. Upon termination, shareholders will be sent a check for the cash value of any fractional share in the Plan account, less any applicable broker commissions and taxes.
Shareholders who hold at least one full share of the fund may join the Plan by notifying the Plan Agent by telephone, in writing or by visiting the Plan Agent’s website at www.computershare.com/investor. If received in proper form by the Plan Agent before the record date of a dividend, the election will be effective with respect to all dividends paid after such record date. If shareholders wish to participate in the Plan and their shares are held in the name of a brokerage firm, bank or other nominee, shareholders should contact their nominee to see if it will participate in the Plan. If shareholders wish to participate in the Plan, but their brokerage firm, bank or other nominee is unable to participate on their behalf, they will need to request that their shares be re-registered in their own name, or they will not be able to participate. The Plan Agent will administer the Plan on the basis of the number of shares certified from time to time by shareholders as representing the total amount registered in their name and held for their account by their nominee.
Experience under the Plan may indicate that changes are desirable. Accordingly, the fund and the Plan Agent reserve the right to amend or terminate the Plan. Participants generally will receive written notice at least 90 days before the effective date of any amendment. In the case of termination, participants will receive written notice at least 90 days before the record date for the payment of any dividend or distribution by the fund.
All correspondence or requests for additional information about the Plan should be directed to Computershare Trust Company, N.A., at the address stated below, or by calling 800-852-0218, 201-680-6578 (For International Telephone Inquiries) and 800-952-9245 (For the Hearing Impaired (TDD)).
The following information is presented in conformance with annual reporting requirements for funds that have filed a registration statement pursuant to General Instruction A.2 of Short Form N-2. The purpose of the table below is to help you understand all fees and expenses that you, as a common shareholder, would bear directly or indirectly. In accordance with SEC requirements, the table below shows the fund’s expenses as a percentage of its average net assets as of October 31, 2023, and not as a percentage of total assets. By showing expenses as a percentage of average net assets, expenses are not expressed as a percentage of all of the assets in which the fund invests. The offering costs to be paid or reimbursed by the fund are not included in the annual expenses table below. However
, these expenses will be borne by common shareholders and may result in a reduction in the NAV of the common shares. The table and example are based on the fund’s capital structure as of October 31, 2023. Shareholder Transaction Expenses | |
| Sales load (as a percentage of offering price) 1 | — % |
| Offering expenses (as a percentage of offering price) 1 | — % |
| | ANNUAL REPORT | JOHN HANCOCK TAX-ADVANTAGED GLOBAL SHAREHOLDER YIELD FUND | 29 |
| Dividend Reinvestment Plan fees 2 | None |
Annual Expenses (Percentage of Net Assets Attributable to Common Shares) | |
| Management fees 3 | 0.90 % |
| Interest payments on borrowed funds | — % |
| Other expenses | 0.70 % |
| Total Annual Operating Expenses | 1.60 % |
| Contractual Expense Reimbursement 4 | (0.01)% |
| Total Annual Fund Operating Expenses After Expense Reimbursements | 1.59 % |
| 1 | If common s hares are sold to or through underwriters, the fund’s prospectus will set forth any applicable sales load and the estimated offering expenses. |
| 2 | Partici p ants in the fund’s dividend reinvestment plan do not pay brokerage charges with respect to common shares issued directly by the fund. However, whenever common shares are purchased or sold on the NYSE or otherwise on the open market, each participant will pay a pro rata portion of brokerage trading fees, currently $0.05 per share purchased or sold. Brokerage trading fees will be deducted from amounts to be invested. Shareholders participating in the Plan may buy additional common shares of the fund through the Plan at any time and will be charged a $5 transaction fee plus $0.05 per share brokerage trading fee for each order. See “Dividends and distributions” and “Dividend reinvestment plan ”. |
| 3 | See "Note 4 – Fees and transactions with affiliates.” |
| 4 | The Advisor has contractually agreed to waive a portion of its management fee and/or reimburse expenses for certain funds of the John Hancock group of funds complex, including the fund (the participating portfolios). This waiver is based upon aggregate net assets of all the participating portfolios. The amount of the reimbursement is calculated daily and allocated among all the participating portfolios in proportion to the daily net assets of each fund. During the year ended October 31, 2023, this waiver amounted to 0.01% of the fund’s average daily net assets. This arrangement expires on July 31, 2025, unless renewed by mutual agreement of the fund and the Advisor based upon a determination that this is appropriate under the circumstances at that time. |
Example
The following example illustrates the expenses that Common Shareholders would pay on a $1,000 investment in common shares, assuming (i) total annual expenses set forth above, including any reimbursements through their current expiration date; ; (ii) (a 5% annual return; and (iii) all distributions are reinvested at NAV:
| | 1 Year | 3 Years | 5 Years | 10 Years |
| Total Expenses | $16 | $50 | $87 | $190 |
The above table and example and the assumption in the example of a 5% annual return are required by regulations of the SEC that are applicable to all investment companies; the assumed 5% annual return is not a prediction of, and does not represent, the projected or actual performance of the fund’s common shares. For more complete descriptions of certain of the fund’s costs and expenses, see “Management of the Fund” in the fund’s prospectus. In addition, while the example assumes reinvestment of all dividends and distributions at NAV, participants in the Fund’s dividend reinvestment plan may receive Common Shares purchased or issued at a price or value different from NAV. See “Distribution Policy” and “Dividend Reinvestment Plan” in the fund’s prospectus.
The example should not be considered a representation of past or future expenses, and the fund’s actual expenses may be greater or less than those shown. Moreover, the fund’s actual rate of return may be greater or less than the hypothetical 5% return shown in the example.
Market and Net Asset Value Information
The following table, presented in conformance with annual reporting requirements for funds that have filed a registration statement pursuant to General Instruction A.2 of Short Form N-2, sets forth, for each of the periods indicated, the high and low closing market prices of the fund’s Common Shares on the NYSE, the high and low NAV per common share and the high and low premium/discount to NAV per common share. See Note 2, Investment Valuation and Fair Value Measurements in the Notes to Financial Statements for information as to how the Fund’s NAV is determined.
| 30 | JOHN HANCOCK TAX-ADVANTAGED GLOBAL SHAREHOLDER YIELD FUND | ANNUAL REPORT | |
The fund’s currently outstanding Common Shares are listed on the New York Stock Exchange (“NYSE”) under the symbol HTY and commenced trading on the NYSE in 1994.
The fund’s common shares have traded both at a premium and at a discount to its net asset value (“NAV”). The fund cannot predict whether its shares will trade in the future at a premium or discount to NAV. The provisions of the 1940 Act generally require that the public offering price of common shares (less any underwriting commissions and discounts) must equal or exceed the NAV per share of a company’s common stock (calculated within 48 hours of pricing). The fund’s issuance of common shares may have an adverse effect on prices in the secondary market for common shares by increasing the number of common shares available, which may put downward pressure on the market price for common shares. Shares of common stock of closed-end investment companies frequently trade at a discount from NAV. See “Risk Factors—General Risks—Market Discount Risk” and “—Secondary Market for the Common Shares” in the within the fund’s prospectus.
The following table sets forth for each of the periods indicated the high and low closing market prices for common shares
on
the NYSE, and the corresponding NAV per share and the premium or discount to NAV per share at which the fund’s common shares were trading as of such date. NAV is determined once daily as of the close of regular trading of the NYSE (typically 4:00 P.M., Eastern Time). See “Determination of Net Asset Value” within the fund’s prospectus for information as to the determination of the fund’s NAV.
| | Market Price | NAV per Share on
Data of Market Price
High and Low | Premium/(Discount) on
Date of Market Price
High and Low |
Fiscal Quarter Ended | High | Low | High | Low | High | Low |
| January 31, 2022 | $6.74 | $6.11 | $6.60 | $6.32 | 2.12% | -3.32% |
| April 30, 2022 | $6.85 | $6.05 | $6.40 | $6.06 | 7.03% | -0.17% |
| July 31, 2022 | $6.21 | $5.05 | $6.27 | $5.49 | -0.96% | -8.01% |
| October 31, 2022 | $5.54 | $4.36 | $5.91 | $4.95 | -6.26% | -11.92% |
| January 31, 2023 | $5.26 | $4.63 | $5.63 | $5.33 | -6.57% | -13.13% |
| April 30, 2023 | $5.50 | $4.70 | $5.70 | $5.21 | -3.51% | -9.79% |
| July 31, 2023 | $4.87 | $4.49 | $5.47 | $5.30 | -10.97% | -15.28% |
| October 31, 2023 | $4.79 | $4.04 | $5.48 | $4.80 | -12.59% | -15.83% |
The last reported sale price, NAV per share and percentage discount to NAV per share of the common shares as of October 31, 2023 were $
4.10, $
4.87 and (
15.81)%, respectively. As of October 31, 2023,
the
fund had 10,921,751 common shares outstanding and net assets of the fund were $53,163,196.
The fund does not believe that there are any material unresolved written comments, received 180 days or more before October 31, 2023, from the Staff of the SEC regarding any of the fund’s periodic or current reports under the Securities Exchange Act or the 1940 Act, or its registration statement.
Shareholder communication and assistance
If you have any questions concerning the fund, we will be pleased to assist you. If you hold shares in your own name and not with a brokerage firm, please address all notices, correspondence, questions or other communications regarding the fund to the transfer agent at:
Regular Mail:
Computershare
P.O. Box 43006
Providence, RI 02940-3078
| | ANNUAL REPORT | JOHN HANCOCK TAX-ADVANTAGED GLOBAL SHAREHOLDER YIELD FUND | 31 |
Registered or Overnight Mail:
Computershare
150 Royall Street, Suite 101
Canton, MA 02021
If your shares are held with a brokerage firm, you should contact that firm, bank or other nominee for assistance.
| 32 | JOHN HANCOCK TAX-ADVANTAGED GLOBAL SHAREHOLDER YIELD FUND | ANNUAL REPORT | |
EVALUATION OF ADVISORY AND SUBADVISORY AGREEMENTS BY THE BOARD OF TRUSTEES
This section describes the evaluation by the Board of Trustees (the Board) of John Hancock Tax-Advantaged Global Shareholder Yield Fund (the fund) of the Advisory Agreement (the Advisory Agreement) with John Hancock Investment Management LLC (the Advisor) and the Subadvisory Agreement (the Subadvisory Agreement) with Epoch Investment Partners, Inc. (the Subadvisor). The Advisory Agreement and Subadvisory Agreement are collectively referred to as the Agreements. Prior to the June 26-29 2023 meeting at which the Agreements were approved, the Board also discussed and considered information regarding the proposed continuation of the Agreements at the meeting held on May 30 - June 1, 2023. The Trustees who are not “interested persons” of the Trust as defined by the Investment Company Act of 1940, as amended (the 1940 Act) (the Independent Trustees) also met separately to evaluate and discuss the information presented, including with counsel to the Independent Trustees and a third-party consulting firm.
Approval of Advisory and Subadvisory Agreements
At meetings held on June 26-29, 2023, the Board, including the Trustees who are not parties to any Agreement or considered to be interested persons of the fund under the 1940 Act, reapproved for an annual period the continuation of the Advisory Agreement between the fund and the Advisor and the Subadvisory Agreement between the Advisor and the Subadvisor with respect to the fund.
In considering the Advisory Agreement and the Subadvisory Agreement, the Board received in advance of the meetings a variety of materials relating to the fund, the Advisor and the Subadvisor, including comparative performance, fee and expense information for a peer group of similar funds prepared by an independent third-party provider of fund data, performance information for an applicable benchmark index; and other pertinent information, such as the market premium and discount information, and, with respect to the Subadvisor, comparative performance information for comparably managed accounts, as applicable, and other information provided by the Advisor and the Subadvisor regarding the nature, extent and quality of services provided by the Advisor and the Subadvisor under their respective Agreements, as well as information regarding the Advisor’s revenues and costs of providing services to the fund and any compensation paid to affiliates of the Advisor. At the meetings at which the renewal of the Advisory Agreement and Subadvisory Agreement are considered, particular focus is given to information concerning fund performance, comparability of fees and total expenses, and profitability. However, the Board noted that the evaluation process with respect to the Advisor and the Subadvisor is an ongoing one. In this regard, the Board also took into account discussions with management and information provided to the Board (including its various committees) at prior meetings with respect to the services provided by the Advisor and the Subadvisor to the fund, including quarterly performance reports prepared by management containing reviews of investment results and prior presentations from the Subadvisor with respect to the fund. The information received and considered by the Board in connection with the May and June meetings and throughout the year was both written and oral. The Board also considered the nature, quality, and extent of non-advisory services, if any, to be provided to the fund by the Advisor’s affiliates, including distribution services. The Board considered the Advisory Agreement and the Subadvisory Agreement separately in the course of its review. In doing so, the Board noted the respective roles of the Advisor and Subadvisor in providing services to the fund.
Throughout the process, the Board asked questions of and requested additional information from management. The Board is assisted by counsel for the fund and the Independent Trustees are also separately assisted by independent legal counsel throughout the process. The Independent Trustees also received a memorandum from their independent legal counsel discussing the legal standards for their consideration of the proposed continuation of the Agreements and discussed the proposed continuation of the Agreements in private sessions with their independent legal counsel at which no representatives of management were present.
| | ANNUAL REPORT | JOHN HANCOCK TAX-ADVANTAGED GLOBAL SHAREHOLDER YIELD FUND | 33 |
Approval of Advisory Agreement
In approving the Advisory Agreement with respect to the fund, the Board, including the Independent Trustees, considered a variety of factors, including those discussed below. The Board also considered other factors (including conditions and trends prevailing generally in the economy, the securities markets, and the industry) and did not treat any single factor as determinative, and each Trustee may have attributed different weights to different factors. The Board’s conclusions may be based in part on its consideration of the advisory and subadvisory arrangements in prior years and on the Board’s ongoing regular review of fund performance and operations throughout the year.
Nature, extent, and quality of services.
Among the information received by the Board from the Advisor relating to the nature, extent, and quality of services provided to the fund, the Board reviewed information provided by the Advisor relating to its operations and personnel, descriptions of its organizational and management structure, and information regarding the Advisor’s compliance and regulatory history, including its Form ADV. The Board also noted that on a regular basis it receives and reviews information from the fund’s Chief Compliance Officer (CCO) regarding the fund’s compliance policies and procedures established pursuant to Rule 38a-1 under the 1940 Act. The Board observed that the scope of services provided by the Advisor, and of the undertakings required of the Advisor in connection with those services, including maintaining and monitoring its own and the fund’s compliance programs, risk management programs, liquidity management programs, derivatives risk management programs, and cybersecurity programs, had expanded over time as a result of regulatory, market and other developments. The Board considered that the Advisor is responsible for the management of the day-to-day operations of the fund, including, but not limited to, general supervision of and coordination of the services provided by the Subadvisor, and is also responsible for monitoring and reviewing the activities of the Subadvisor and other third-party service providers. The Board also considered the significant risks assumed by the Advisor in connection with the services provided to the fund including entrepreneurial risk in sponsoring new funds and ongoing risks including investment, operational, enterprise, litigation, regulatory and compliance risks with respect to all funds.
The Board also considered the differences between the Advisor’s services to the fund and the services it provides to other clients that are not closed-end funds, including, for example, the differences in services related to the regulatory and legal obligations of closed-end funds.
In considering the nature, extent, and quality of the services provided by the Advisor, the Trustees also took into account their knowledge of the Advisor’s management and the quality of the performance of the Advisor’s duties, through Board meetings, discussions and reports during the preceding year and through each Trustee’s experience as a Trustee of the fund and of the other funds in the John Hancock group of funds complex (the John Hancock Fund Complex).
In the course of their deliberations regarding the Advisory Agreement, the Board considered, among other things:
| (a) | the skills and competency with which the Advisor has in the past managed the fund’s affairs and its subadvisory relationship, the Advisor’s oversight and monitoring of the Subadvisor’s investment performance and compliance programs, such as the Subadvisor’s compliance with fund policies and objectives, review of brokerage matters, including with respect to trade allocation and best execution and the Advisor’s timeliness in responding to performance issues; |
| (b) | the background, qualifications and skills of the Advisor’s personnel; |
| (c) | the Advisor’s compliance policies and procedures and its responsiveness to regulatory changes and fund industry developments; |
| 34 | JOHN HANCOCK TAX-ADVANTAGED GLOBAL SHAREHOLDER YIELD FUND | ANNUAL REPORT | |
| (d) | the Advisor’s administrative capabilities, including its ability to supervise the other service providers for the fund, as well as the Advisor’s oversight of any securities lending activity, its monitoring of class action litigation and collection of class action settlements on behalf of the fund, and bringing loss recovery actions on behalf of the fund; |
| (e) | the financial condition of the Advisor and whether it has the financial wherewithal to provide a high level and quality of services to the fund; |
| (f) | the Advisor’s initiatives intended to improve various aspects of the fund’s operations and investor experience with the fund; and |
| (g) | the Advisor’s reputation and experience in serving as an investment advisor to the Trust and the benefit to shareholders of investing in funds that are part of a family of funds offering a variety of investments. |
The Board concluded that the Advisor may reasonably be expected to continue to provide a high quality of services under the Advisory Agreement with respect to the fund.
Investment performance.
In considering the fund’s performance, the Board noted that it reviews at its regularly scheduled meetings information about the fund’s performance results. In connection with the consideration of the Advisory Agreement, the Board:
| (a) | reviewed information prepared by management regarding the fund’s performance; |
| (b) | considered the comparative performance of an applicable benchmark index; |
| (c) | considered the performance of comparable funds, if any, as included in the report prepared by an independent third-party provider of fund data; |
| (d) | took into account the Advisor’s analysis of the fund’s performance; and |
| (e) | considered the fund’s share performance and premium/discount information. |
The Board noted that while it found the data provided by the independent third-party generally useful it recognized its limitations, including in particular that the data may vary depending on the end date selected and the results of the performance comparisons may vary depending on the selection of the peer group. The Board noted that, based on its net asset value, the fund outperformed its benchmark index for the one-year period and underperformed its benchmark index for the three-, five- and ten-year periods ended December 31, 2022. The Board also reviewed comparisons of the fund’s performance to the peer group, but noted the limited size of the peer group. The Board took into account management’s discussion of the factors that contributed to the fund’s performance to the benchmark index for the three-, five-, and ten-year periods including the impact of past and current market conditions on the fund’s strategy and management’s outlook for the fund. The Board concluded that the fund’s performance is being monitored and reasonably addressed, where appropriate. The Board noted that the fund’s longer term performance in part reflects that of a previous subadvisor and that the fund’s investment strategy was changed in August 2021.
Fees and expenses.
The Board reviewed comparative information prepared by an independent third-party provider of fund data, including, among other data, the fund’s contractual and net management fees (and subadvisory fees, to the extent available) and total expenses as compared to similarly situated investment companies deemed to be comparable to the fund in light of the nature, extent and quality of the management and advisory and subadvisory services provided by the Advisor and the Subadvisor. The Board considered the fund’s ranking within a smaller group of peer funds chosen by the independent third-party provider, as well as the fund’s ranking within a broader group of funds. In comparing the fund’s contractual and net management fees to those of comparable funds, the Board noted that such fees include both advisory and administrative costs. The Board noted that net management fees and net total expenses for the fund are lower than the peer group median.
| | ANNUAL REPORT | JOHN HANCOCK TAX-ADVANTAGED GLOBAL SHAREHOLDER YIELD FUND | 35 |
The Board took into account management’s discussion with respect to the overall management fee and the fees of the Subadvisor, including the amount of the advisory fee retained by the Advisor after payment of the subadvisory fees, in each case in light of the services rendered for those amounts and the risks undertaken by the Advisor. The Board also noted that the Advisor pays the subadvisory fees and that such fees are negotiated at arm’s length with respect to the Subadvisor. In addition, the Board took into account that management had agreed to implement an overall fee waiver across the complex, including the fund, which is discussed further below. The Board reviewed information provided by the Advisor concerning the investment advisory fee charged by the Advisor or one of its advisory affiliates to other clients (including other funds in the John Hancock Fund Complex) having similar investment mandates, if any. The Board considered any differences between the Advisor’s and Subadvisor’s services to the fund and the services they provide to other comparable clients or funds. The Board concluded that the advisory fee paid with respect to the fund is reasonable in light of the nature, extent and quality of the services provided to the fund under the Advisory Agreement.
Profitability/Fall out benefits.
In considering the costs of the services to be provided and the profits to be realized by the Advisor and its affiliates from the Advisor’s relationship with the fund, the Board:
| (a) | reviewed financial information of the Advisor; |
| (b) | reviewed and considered information presented by the Advisor regarding the net profitability to the Advisor and its affiliates with respect to the fund; |
| (c) | received and reviewed profitability information with respect to the John Hancock Fund Complex as a whole and with respect to the fund; |
| (d) | received information with respect to the Advisor’s allocation methodologies used in preparing the profitability data and considered that the Advisor hired an independent third-party consultant to provide an analysis of the Advisor’s allocation methodologies; |
| (e) | considered that the Advisor also provides administrative services to the fund on a cost basis pursuant to an administrative services agreement; |
| (f) | noted that the Advisor also derives reputational and other indirect benefits from providing advisory services to the fund; |
| (g) | noted that the subadvisory fees for the fund are paid by the Advisor, and are negotiated at arm’s length; |
| (h) | considered the Advisor’s ongoing costs and expenditures necessary to improve services, meet new regulatory and compliance requirements, and adapt to other challenges impacting the fund industry; and |
| (i) | considered that the Advisor should be entitled to earn a reasonable level of profits in exchange for the level of services it provides to the fund and the risks that it assumes as Advisor, including entrepreneurial, operational, reputational, litigation and regulatory risk. |
Based upon its review, the Board concluded that the level of profitability, if any, of the Advisor and its affiliates from their relationship with the fund was reasonable and not excessive.
Economies of scale.
In considering the extent to which the fund may realize any economies of scale and whether fee levels reflect these economies of scale for the benefit of the fund shareholders, the Board noted that the fund has a limited ability to increase its assets as a closed-end fund. The Board took into account management’s discussions of the current advisory fee structure, and, as noted above, the services the Advisor provides in performing its functions under the Advisory Agreement and in supervising the Subadvisor.
| 36 | JOHN HANCOCK TAX-ADVANTAGED GLOBAL SHAREHOLDER YIELD FUND | ANNUAL REPORT | |
The Board also considered potential economies of scale that may be realized by the fund as part of the John Hancock Fund Complex. Among them, the Board noted that the Advisor has contractually agreed to waive a portion of its management fee and/or reimburse expenses for certain funds of the John Hancock Fund Complex, including the fund (the participating portfolios). This waiver is based upon aggregate net assets of all the participating portfolios. The amount of the reimbursement is calculated daily and allocated among all the participating portfolios in proportion to the daily net assets of each fund. The Board also considered the Advisor’s overall operations and its ongoing investment in its business in order to expand the scale of, and improve the quality of, its operations that benefit the fund. The Board determined that the management fee structure for the fund was reasonable.
Approval of Subadvisory Agreement
In making its determination with respect to approval of the Subadvisory Agreement, the Board reviewed:
| (1) | information relating to the Subadvisor’s business, including current subadvisory services to the fund (and other funds in the John Hancock Fund Complex); |
| (2) | the historical and current performance of the fund and comparative performance information relating to an applicable benchmark index and comparable funds; |
| (3) | the subadvisory fees for the fund and to the extent available, comparable fee information prepared by an independent third party provider of fund data; and |
| (4) | information relating to the nature and scope of any material relationships and their significance to the fund’s Advisor and the Subadvisor. |
Nature, extent, and quality of services. With respect to the services provided by the Subadvisor, the Board received information provided to the Board by the Subadvisor, including the Subadvisor’s Form ADV, as well as took into account information presented throughout the past year. The Board considered the Subadvisor’s current level of staffing and its overall resources, as well as received information relating to the Subadvisor’s compensation program. The Board reviewed the Subadvisor’s history and investment experience, as well as information regarding the qualifications, background, and responsibilities of the Subadvisor’s investment and compliance personnel who provide services to the fund. The Board also considered, among other things, the Subadvisor’s compliance program and any disciplinary history. The Board also considered the Subadvisor’s risk assessment and monitoring process. The Board reviewed the Subadvisor’s regulatory history, including whether it was involved in any regulatory actions or investigations as well as material litigation, and any settlements and amelioratory actions undertaken, as appropriate. The Board noted that the Advisor conducts regular, periodic reviews of the Subadvisor and its operations, including regarding investment processes and organizational and staffing matters. The Board also noted that the fund’s CCO and his staff conduct regular, periodic compliance reviews with the Subadvisor and present reports to the Independent Trustees regarding the same, which includes evaluating the regulatory compliance systems of the Subadvisor and procedures reasonably designed to assure compliance with the federal securities laws. The Board also took into account the financial condition of the Subadvisor.
The Board considered the Subadvisor’s investment process and philosophy. The Board took into account that the Subadvisor’s responsibilities include the development and maintenance of an investment program for the fund that is consistent with the fund’s investment objective, the selection of investment securities and the placement of orders for the purchase and sale of such securities, as well as the implementation of compliance controls related to performance of these services. The Board also received information with respect to the Subadvisor’s brokerage policies and practices, including with respect to best execution and soft dollars.
Subadvisor compensation. In considering the cost of services to be provided by the Subadvisor and the profitability to the Subadvisor of its relationship with the fund, the Board noted that the fees under the Subadvisory Agreement are paid by the Advisor and not the fund.The Board also relied on the ability of the Advisor to
| | ANNUAL REPORT | JOHN HANCOCK TAX-ADVANTAGED GLOBAL SHAREHOLDER YIELD FUND | 37 |
negotiate the Subadvisory Agreement and the fees thereunder at arm’s length. As a result, the costs of the services to be provided and the profits to be realized by the Subadvisor from its relationship with the fund were not a material factor in the Board’s consideration of the Subadvisory Agreement.
The Board also received information regarding the nature and scope (including their significance to the Advisor and its affiliates and the Subadvisor) of any material relationships with respect to the Subadvisor, which include arrangements in which the Subadvisor or its affiliates provide advisory, distribution, or management services in connection with financial products sponsored by the Advisor or its affiliates, and may include other registered investment companies, a 529 education savings plan, managed separate accounts and exempt group annuity contracts sold to qualified plans. The Board also received information and took into account any other potential conflicts of interest the Advisor might have in connection with the Subadvisory Agreement.
In addition, the Board considered other potential indirect benefits that the Subadvisor and its affiliates may receive from the Subadvisor’s relationship with the fund, such as the opportunity to provide advisory services to additional funds in the John Hancock Fund Complex and reputational benefits.
Subadvisory fees. The Board considered that the fund pays an advisory fee to the Advisor and that, in turn, the Advisor pays subadvisory fees to the Subadvisor. As noted above, the Board also considered the fund’s subadvisory fees as compared to similarly situated investment companies deemed to be comparable to the fund as included in the report prepared by the independent third party provider of fund data, to the extent available. The Board noted that the limited size of the Lipper peer group was not sufficient for comparative purposes. The Board also took into account the subadvisory fees paid by the Advisor to the Subadvisor with respect to the fund and compared them to fees charged by the Subadvisor to manage other subadvised portfolios and portfolios not subject to regulation under the 1940 Act, as applicable.
Subadvisor performance. As noted above, the Board considered the fund’s performance as compared to the fund’s peer group median and the benchmark index and noted that the Board reviews information about the fund’s performance results at its regularly scheduled meetings. The Board noted the Advisor’s expertise and resources in monitoring the performance, investment style and risk-adjusted performance of the Subadvisor. The Board was mindful of the Advisor’s focus on the Subadvisor’s performance. The Board also noted the Subadvisor’s long-term performance record for similar accounts, as applicable.
The Board’s decision to approve the Subadvisory Agreement was based on a number of determinations, including the following:
| (1) | the Subadvisor has extensive experience and demonstrated skills as a manager; |
| (2) | the fund’s performance, based on net asset value, is being monitored and reasonably addressed, where appropriate; and |
| (3) | the subadvisory fees are reasonable in relation to the level and quality of services being provided under the Subadvisory Agreement. |
* * *
Based on the Board’s evaluation of all factors that the Board deemed to be material, including those factors described above, the Board, including the Independent Trustees, concluded that renewal of the Advisory Agreement and the Subadvisory Agreement would be in the best interest of the fund and its shareholders. Accordingly, the Board, and the Independent Trustees voting separately, approved the Advisory Agreement and Subadvisory Agreement for an additional one-year period.
| 38 | JOHN HANCOCK TAX-ADVANTAGED GLOBAL SHAREHOLDER YIELD FUND | ANNUAL REPORT | |
This chart provides information about the Trustees and Officers who oversee your John Hancock fund. Officers elected by the Trustees manage the day-to-day operations of the fund and execute policies formulated by the Trustees.
Independent Trustees | | |
Name, year of birth
Position(s) held with fund
Principal occupation(s) and other
directorships during past 5 years | Trustee of the Trust since 1 | Number of John
Hancock funds
overseen by
Trustee |
Hassell H. McClellan, 2 Born: 1945 | 2012 | |
Trustee and Chairperson of the Board | | |
| Director/Trustee, Virtus Funds (2008-2020); Director, The Barnes Group (2010-2021); Associate Professor, The Wallace E. Carroll School of Management, Boston College (retired 2013). Trustee (since 2005) and Chairperson of the Board (since 2017) of various trusts within the John Hancock Fund Complex. |
James R. Boyle, Born: 1959 | 2015 | |
Trustee | | |
| Board Member, United of Omaha Life Insurance Company (since 2022). Board Member, Mutual of Omaha Investor Services, Inc. (since 2022). Foresters Financial, Chief Executive Officer (2018–2022) and board member (2017–2022). Manulife Financial and John Hancock, more than 20 years, retiring in 2012 as Chief Executive Officer, John Hancock and Senior Executive Vice President, Manulife Financial. Trustee of various trusts within the John Hancock Fund Complex (2005–2014 and since 2015). |
William H. Cunningham, 3 Born: 1944 | 2007 | |
Trustee | | |
| Professor, University of Texas, Austin, Texas (since 1971); former Chancellor, University of Texas System and former President of the University of Texas, Austin, Texas; Director (since 2006), Lincoln National Corporation (insurance); Director, Southwest Airlines (since 2000). Trustee of various trusts within the John Hancock Fund Complex (since 1986). |
Noni L. Ellison, Born: 1971 | 2022 | |
Trustee | | |
| Senior Vice President, General Counsel & Corporate Secretary, Tractor Supply Company (rural lifestyle retailer) (since 2021); General Counsel, Chief Compliance Officer & Corporate Secretary, Carestream Dental, L.L.C. (2017–2021); Associate General Counsel & Assistant Corporate Secretary, W.W. Grainger, Inc. (global industrial supplier) (2015–2017); Board Member, Goodwill of North Georgia, 2018 (FY2019)–2020 (FY2021); Board Member, Howard University School of Law Board of Visitors (since 2021); Board Member, University of Chicago Law School Board of Visitors (since 2016); Board member, Children’s Healthcare of Atlanta Foundation Board (2021–2023). Trustee of various trusts within the John Hancock Fund Complex (since 2022). |
Grace K. Fey, Born: 1946 | 2012 | |
Trustee | | |
| Chief Executive Officer, Grace Fey Advisors (since 2007); Director and Executive Vice President, Frontier Capital Management Company (1988–2007); Director, Fiduciary Trust (since 2009). Trustee of various trusts within the John Hancock Fund Complex (since 2008). |
Dean C. Garfield, Born: 1968 | 2022 | |
Trustee | | |
| Vice President, Netflix, Inc. (since 2019); President & Chief Executive Officer, Information Technology Industry Council (2009–2019); NYU School of Law Board of Trustees (since 2021); Member, U.S. Department of Transportation, Advisory Committee on Automation (since 2021); President of the United States Trade Advisory Council (2010–2018); Board Member, College for Every Student (2017–2021); Board Member, The Seed School of Washington, D.C. (2012–2017); Advisory Board Member of the Block Center for Technology and Society (since 2019). Trustee of various trusts within the John Hancock Fund Complex (since 2022). |
| | ANNUAL REPORT | JOHN HANCOCK TAX-ADVANTAGED GLOBAL SHAREHOLDER YIELD FUND | 39 |
Independent Trustees (continued) | | |
Name, year of birth
Position(s) held with fund
Principal occupation(s) and other
directorships during past 5 years | Trustee of the Trust since 1 | Number of John
Hancock funds
overseen by
Trustee |
Deborah C. Jackson, Born: 1952 | 2008 | |
Trustee | | |
| President, Cambridge College, Cambridge, Massachusetts (since 2011); Board of Directors, Amwell Corporation (since 2020); Board of Directors, Massachusetts Women’s Forum (2018-2020); Board of Directors, National Association of Corporate Directors/New England (2015-2020); Chief Executive Officer, American Red Cross of Massachusetts Bay (2002–2011); Board of Directors of Eastern Bank Corporation (since 2001); Board of Directors of Eastern Bank Charitable Foundation (since 2001); Board of Directors of Boston Stock Exchange (2002–2008); Board of Directors of Harvard Pilgrim Healthcare (health benefits company) (2007–2011). Trustee of various trusts within the John Hancock Fund Complex (since 2008). |
Steven R. Pruchansky, Born: 1944 | 2007 | |
Trustee and Vice Chairperson of the Board | | |
| Managing Director, Pru Realty (since 2017); Chairman and Chief Executive Officer, Greenscapes of Southwest Florida, Inc. (2014-2020); Director and President, Greenscapes of Southwest Florida, Inc. (until 2000); Member, Board of Advisors, First American Bank (until 2010); Managing Director, Jon James, LLC (real estate) (since 2000); Partner, Right Funding, LLC (2014-2017); Director, First Signature Bank & Trust Company (until 1991); Director, Mast Realty Trust (until 1994); President, Maxwell Building Corp. (until 1991). Trustee (since 1992), Chairperson of the Board (2011–2012), and Vice Chairperson of the Board (since 2012) of various trusts within the John Hancock Fund Complex. |
Frances G. Rathke, 3 Born: 1960 | 2020 | |
Trustee | | |
| Director, Audit Committee Chair, Oatly Group AB (plant-based drink company) (since 2021); Director, Audit Committee Chair and Compensation Committee Member, Green Mountain Power Corporation (since 2016); Director, Treasurer and Finance & Audit Committee Chair, Flynn Center for Performing Arts (since 2016); Director and Audit Committee Chair, Planet Fitness (since 2016); Chief Financial Officer and Treasurer, Keurig Green Mountain, Inc. (2003-retired 2015). Trustee of various trusts within the John Hancock Fund Complex (since 2020). |
Gregory A. Russo, Born: 1949 | 2008 | |
Trustee | | |
| Director and Audit Committee Chairman (2012-2020), and Member, Audit Committee and Finance Committee (2011-2020), NCH Healthcare System, Inc. (holding company for multi-entity healthcare system); Director and Member (2012-2018), and Finance Committee Chairman (2014-2018), The Moorings, Inc. (nonprofit continuing care community); Global Vice Chairman, Risk & Regulatory Matters, KPMG LLP (KPMG) (2002–2006); Vice Chairman, Industrial Markets, KPMG (1998–2002). Trustee of various trusts within the John Hancock Fund Complex (since 2008). |
| 40 | JOHN HANCOCK TAX-ADVANTAGED GLOBAL SHAREHOLDER YIELD FUND | ANNUAL REPORT | |
Non-Independent Trustees 4 | | |
Name, year of birth
Position(s) held with fund
Principal occupation(s) and other
directorships during past 5 years | Trustee of the Trust since 1 | Number of John
Hancock funds
overseen by
Trustee |
Andrew G. Arnott, Born: 1971 | 2017 | |
Non-Independent Trustee | | |
| Global Head of Retail for Manulife (since 2022); Head of Wealth and Asset Management, United States and Europe, for John Hancock and Manulife (2018-2023); Director and Chairman, John Hancock Investment Management LLC (since 2005, including prior positions); Director and Chairman, John Hancock Variable Trust Advisers LLC (since 2006, including prior positions); Director and Chairman, John Hancock Investment Management Distributors LLC (since 2004, including prior positions); President of various trusts within the John Hancock Fund Complex (2007-2023, including prior positions). Trustee of various trusts within the John Hancock Fund Complex (since 2017). |
Paul Lorentz, Born: 1968 | 2022 | |
Non-Independent Trustee | | |
| Global Head, Manulife Wealth and Asset Management (since 2017); General Manager, Manulife, Individual Wealth Management and Insurance (2013–2017); President, Manulife Investments (2010–2016). Trustee of various trusts within the John Hancock Fund Complex (since 2022). |
Principal officers who are not Trustees | |
Name, year of birth
Position(s) held with fund
Principal occupation(s)
during past 5 years | Current
Position(s)
with the
Trust
since |
Kristie M. Feinberg, Born: 1975 | |
President | |
| Head of Wealth and Asset Management, United States and Europe, for John Hancock and Manulife (since 2023); CFO and Global Head of Strategy, Manulife Investment Management (2021-2023, including prior positions); CFO Americas & Global Head of Treasury, Invesco, Ltd., Invesco US (2019-2020, including prior positions); Senior Vice President, Corporate Treasurer and Business Controller, Oppenheimer Funds (2001-2019, including prior positions); President of various trusts within the John Hancock Fund Complex (since 2023). |
Charles A. Rizzo, Born: 1957 | |
Chief Financial Officer | |
| Vice President, John Hancock Financial Services (since 2008); Senior Vice President, John Hancock Investment Management LLC and John Hancock Variable Trust Advisers LLC (since 2008); Chief Financial Officer of various trusts within the John Hancock Fund Complex (since 2007). |
Salvatore Schiavone, Born: 1965 | |
Treasurer | |
| Assistant Vice President, John Hancock Financial Services (since 2007); Vice President, John Hancock Investment Management LLC and John Hancock Variable Trust Advisers LLC (since 2007); Treasurer of various trusts within the John Hancock Fund Complex (since 2007, including prior positions). |
| | ANNUAL REPORT | JOHN HANCOCK TAX-ADVANTAGED GLOBAL SHAREHOLDER YIELD FUND | 41 |
Principal officers who are not Trustees (continued) | |
Name, year of birth
Position(s) held with fund
Principal occupation(s)
during past 5 years | Current
Position(s)
with the
Trust
since |
Christopher (Kit) Sechler, Born: 1973 | |
Secretary and Chief Legal Officer | |
| Vice President and Deputy Chief Counsel, John Hancock Investment Management (since 2015); Assistant Vice President and Senior Counsel (2009–2015), John Hancock Investment Management; Assistant Secretary of John Hancock Investment Management LLC and John Hancock Variable Trust Advisers LLC (since 2009); Chief Legal Officer and Secretary of various trusts within the John Hancock Fund Complex (since 2009, including prior positions). |
Trevor Swanberg, Born: 1979 | |
| Chief Compliance Officer | |
| Chief Compliance Officer, John Hancock Investment Management LLC and John Hancock Variable Trust Advisers LLC (since 2020); Deputy Chief Compliance Officer, John Hancock Investment Management LLC and John Hancock Variable Trust Advisers LLC (2019–2020); Assistant Chief Compliance Officer, John Hancock Investment Management LLC and John Hancock Variable Trust Advisers LLC (2016–2019); Vice President, State Street Global Advisors (2015–2016); Chief Compliance Officer of various trusts within the John Hancock Fund Complex (since 2016, including prior positions). |
The business address for all Trustees and Officers is 200 Berkeley Street, Boston, Massachusetts 02116-5023.
A copy of the Statement of Additional Information may be obtained without charge by visiting the Fund’s website, (jhinvestments.com) or by calling 800-225-6020 (toll-free) or from the SEC’s website at www.sec.gov.
1 | Ms. Ellison and Ms. Rathke serve as Trustees for a term expiring in 2024; Mr. Arnott, Mr. Garfield, Ms. Jackson, and Mr. Pruchansky serve as Trustees for a term expiring in 2025; Mr. Boyle, Dr. Cunningham, Ms. Fey, Mr. Lorentz, Dr. McClellan and Mr. Russo serve as Trustees for a term expiring in 2026; Mr. Boyle has served as Trustee at various times prior to date listed in the table. |
2 | Member of the Audit Committee as of September 26, 2023. |
3 | Member of the Audit Committee. |
4 | The Trustee is a Non-Independent Trustee due to current or former positions with the Advisor and certain of its affiliates. |
| | |
| | |
| 42 | JOHN HANCOCK TAX-ADVANTAGED GLOBAL SHAREHOLDER YIELD FUND | ANNUAL REPORT | |
Hassell H. McClellan,
Steven R. Pruchansky,
Andrew G. Arnott
†
James R. Boyle
William H. Cunningham
*
Grace K. Fey
Noni L. Ellison
Dean C. Garfield
Deborah C. Jackson
Paul Lorentz
†
Frances G. Rathke
*
Gregory A. Russo
Christopher (Kit) Sechler
Secretary and Chief Legal Officer
John Hancock Investment Management LLC
Epoch Investment Partners, Inc. (Epoch)
William W. Priest, CFA
1
Michael A. Welhoelter, CFA
John M. Tobin, Ph.D., CFA
Kera Van Valen, CFA
John Hancock Investment Management Distributors LLC
State Street Bank and Trust Company
Computershare Shareowner Services, LLC
K&L Gates LLP
Independent registered public accounting firm
PricewaterhouseCoopers LLP
Listed New York Stock Exchange: HTY
π
Member of the Audit Committee as of September 26, 2023.
†
Non-Independent Trustee
*
Member of the Audit Committee
#
Effective June 29, 2023.
1
As of March 31, 2024, William W. Priest, CFA will no longer serve as a portfolio manager for the fund.
The fund’s proxy voting policies and procedures, as well as the fund proxy voting record for the most recent twelve-month period ended June 30, are available free of charge on the Securities and Exchange Commission (SEC) website at sec.gov or on our website.
All of the fund’s holdings as of the end of the third month of every fiscal quarter are filed with the SEC on Form N-PORT within 60 days of the end of the fiscal quarter. The fund’s Form N-PORT filings are available on our website and the SEC’s website, sec.gov.
We make this information on your fund, as well as
monthly portfolio holdings
, and other fund details available on our website at jhinvestments.com or by calling 800-852-0218.
The report is certified under the Sarbanes-Oxley Act, which requires closed-end funds and other public companies to affirm that, to the best of their knowledge, the information in their financial reports is fairly and accurately stated in all material respects.
| You can also contact us: | | |
800-852-0218 | Regular mail: | Express mail: |
jhinvestments.com | Computershare
P.O. Box 43006
Providence, RI 02940-3078 | Computershare
150 Royall St., Suite 101
Canton, MA 02021 |
| | ANNUAL REPORT | JOHN HANCOCK TAX-ADVANTAGED GLOBAL SHAREHOLDER YIELD FUND | 43 |
John Hancock family of funds
Blue Chip Growth
Classic Value
Disciplined Value
Disciplined Value Mid Cap
Equity Income
Financial Industries
Fundamental All Cap Core
Fundamental Large Cap Core
Mid Cap Growth
New Opportunities
Regional Bank
Small Cap Core
Small Cap Growth
Small Cap Value
U.S. Global Leaders Growth
U.S. Growth
INTERNATIONAL EQUITY FUNDS
Disciplined Value International
Emerging Markets
Emerging Markets Equity
Fundamental Global Franchise
Global Environmental Opportunities
Global Equity
Global Shareholder Yield
Global Thematic Opportunities
International Dynamic Growth
International Growth
International Small Company
Bond
California Municipal Bond
Emerging Markets Debt
Floating Rate Income
Government Income
High Yield
High Yield Municipal Bond
Income
Investment Grade Bond
Money Market
Municipal Opportunities
Opportunistic Fixed Income
Short Duration Bond
Short Duration Municipal Opportunities
Strategic Income Opportunities
Alternative Asset Allocation
Diversified Macro
Infrastructure
Multi-Asset Absolute Return
Real Estate Securities
Seaport Long/Short
A fund’s investment objectives, risks, charges, and expenses should be considered carefully before investing. The prospectus contains this and other important information about the fund. To obtain a prospectus, contact your financial professional, call John Hancock Investment Management at 800-225-5291, or visit our website at jhinvestments.com. Please read the prospectus carefully before investing or sending money.
John Hancock Corporate Bond ETF
John Hancock Dynamic Municipal Bond ETF
John Hancock Fundamental All Cap Core ETF
John Hancock International High Dividend ETF
John Hancock Mortgage-Backed Securities ETF
John Hancock Multifactor Developed International ETF
John Hancock Multifactor Emerging Markets ETF
John Hancock Multifactor Large Cap ETF
John Hancock Multifactor Mid Cap ETF
John Hancock Multifactor Small Cap ETF
John Hancock Preferred Income ETF
John Hancock U.S. High Dividend ETF
ASSET ALLOCATION/TARGET DATE FUNDS
Balanced
Multi-Asset High Income
Lifestyle Blend Portfolios
Lifetime Blend Portfolios
Multimanager Lifestyle Portfolios
Multimanager Lifetime Portfolios
ENVIRONMENTAL, SOCIAL, AND
GOVERNANCE FUNDS
ESG Core Bond
ESG International Equity
ESG Large Cap Core
Asset-Based Lending
Financial Opportunities
Hedged Equity & Income
Income Securities Trust
Investors Trust
Preferred Income
Preferred Income II
Preferred Income III
Premium Dividend
Tax-Advantaged Dividend Income
Tax-Advantaged Global Shareholder Yield
John Hancock ETF shares are bought and sold at market price (not NAV), and are not individually redeemed from the fund. Brokerage commissions will reduce returns.
John Hancock ETFs are distributed by Foreside Fund Services, LLC, and are subadvised by Manulife Investment Management (US) LLC or Dimensional Fund Advisors LP. Foreside is not affiliated with John Hancock Investment Management Distributors LLC, Manulife Investment Management (US) LLC or Dimensional Fund Advisors LP.
Dimensional Fund Advisors LP receives compensation from John Hancock in connection with licensing rights to the John Hancock Dimensional indexes. Dimensional Fund Advisors LP does not sponsor, endorse, or sell, and makes no representation as to the advisability of investing in, John Hancock Multifactor ETFs.
John Hancock Investment Management is a premier asset manager
with a heritage of financial stewardship dating back to 1862. Helping
our shareholders pursue their financial goals is at the core of everything
we do. It’s why we support the role of professional financial advice
and operate with the highest standards of conduct and integrity.
We serve investors globally through a unique multimanager approach:
We search the world to find proven portfolio teams with specialized
expertise for every strategy we offer, then we apply robust investment
oversight to ensure they continue to meet our uncompromising
standards and serve the best interests of our shareholders.
Our unique approach to asset management enables us to provide
a diverse set of investments backed by some of the world’s best
managers, along with strong risk-adjusted returns across asset classes.
“A trusted brand” is based on a survey of 6,651 respondents conducted by Medallia between 3/18/20 and 5/13/20.
John Hancock Investment Management LLC, 200 Berkeley Street, Boston, MA 02116-5010, 800-225-5291, jhinvestments.com
Manulife Investment Management, the Stylized M Design, and Manulife Investment Management & Stylized M Design are trademarks of The Manufacturers Life Insurance Company and are used by its affiliates under license.
12/2023
ITEM 2. CODE OF ETHICS.
As of the end of the period, October 31, 2023, the registrant has adopted a code of ethics, as defined in Item 2 of Form N-CSR, that applies to its Principal Executive Officer, Principal Financial Officer and Treasurer (respectively, the principal executive officer, the principal financial officer and the principal accounting officer, the "Covered Officers"). A copy of the code of ethics is filed as an exhibit to this Form N-CSR.
ITEM 3. AUDIT COMMITTEE FINANCIAL EXPERT.
Frances G. Rathke is the audit committee financial expert and is "independent", pursuant to general instructions on Form N-CSR Item 3.
ITEM 4. PRINCIPAL ACCOUNTANT FEES AND SERVICES.
(a) Audit Fees
The aggregate fees for John Hancock Tax-Advantaged Global Shareholder Yield Fund billed for professional services rendered by the principal accountant(s) for the audit of the registrant's annual financial statements or services that are normally provided by the accountant(s) in connection with statutory and regulatory filings or engagements amounted to $46,490 for the fiscal year ended October 31, 2023 and $45,527 for the fiscal year ended October 31, 2022. These fees were billed to the registrant and were approved by the registrant's audit committee.
(b) Audit-Related Services
The aggregate fees for John Hancock Tax-Advantaged Global Shareholder Yield Fund for audit- related fees amounted to $12 for the fiscal year ended October 31, 2023 and $5 for the fiscal year ended October 31, 2022. These fees were billed to the registrant or to the registrant's investment adviser (not including any sub-adviser whose role is primarily portfolio management and is subcontracted with or overseen by another investment adviser), and any entity controlling, controlled by, or under common control with the adviser that provides ongoing services to the registrant ("control affiliates"). The nature of the services provided was related to a software licensing fee.
(c) Tax Fees
The aggregate fees for John Hancock Tax-Advantaged Global Shareholder Yield Fund billed for professional services rendered by the principal accountant(s) for the tax compliance, tax advice and tax planning ("tax fees") amounted to $5,253 for the fiscal year ended October 31, 2023 and $4,110 for the fiscal year ended October 31, 2022. The nature of the services comprising the tax fees was the review of the registrant's tax returns and tax distribution requirements. These fees were billed to the registrant and were approved by the registrant's audit committee.
(d) All Other Fees
All other fees for John Hancock Tax-Advantaged Global Shareholder Yield Fund billed to the registrant or control affiliates for products and services provided by the principal accountant were $0 for the fiscal year ended October 31, 2023 and $163 for the fiscal year ended October 31, 2022. The nature of the services comprising all other fees is advisory services provided to the investment manager. These fees were approved by the registrant's audit committee.
(e)(1) Audit Committee Pre-Approval Policies and Procedures:
The trust's Audit Committee must pre-approve all audit and non-audit services provided by the independent registered public accounting firm (the "Auditor") relating to the operations or financial reporting of the funds. Prior to the commencement of any audit or non-audit services to a fund, the Audit Committee reviews the services to determine whether they are appropriate and permissible under applicable law.
The trust's Audit Committee has adopted policies and procedures to, among other purposes, provide a framework for the Committee's consideration of audit-related and non-audit services by the Auditor. The policies and procedures require that any audit-related and non-audit service provided by the Auditor and any non-audit service provided by the Auditor to a fund service provider that relates directly to the operations and financial reporting of a fund are subject to approval by the Audit Committee before such service is provided. Audit-related services provided by the Auditor that are expected to exceed $25,000 per instance/per fund are subject to specific pre-approval by the Audit Committee. Tax services provided by the Auditor that are expected to exceed $30,000 per instance/per fund are subject to specific pre-approval by the Audit Committee.
All audit services, as well as the audit-related and non-audit services that are expected to exceed the amounts stated above, must be approved in advance of provision of the service by formal resolution of the Audit Committee. At the regularly scheduled Audit Committee meetings, the Committee reviews a report summarizing the services, including fees, provided by the Auditor.
(e)(2) Services approved pursuant to paragraph (c)(7)(i)(C) of Rule 2-01 of Regulation S-X:
Audit-Related Fees, Tax Fees and All Other Fees:
There were no amounts that were approved by the Audit Committee pursuant to the de minimis exception under Rule 2-01 of Regulation S-X.
(f)According to the registrant's principal accountant, for the fiscal year ended October 31, 2023, the percentage of hours spent on the audit of the registrant's financial statements for the most recent fiscal year that were attributed to work performed by persons who were not full-time, permanent employees of principal accountant was less than 50%.
(g)The aggregate non-audit fees billed by the registrant's accountant(s) for services rendered to the registrant and rendered to the registrant's control affiliates for each of the last two fiscal years of the registrant were $1,354,703 for the fiscal year ended October 31, 2023 and $1,198,914 for the fiscal year ended October 31, 2022.
(h)The audit committee of the registrant has considered the non-audit services provided by the registrant's principal accountant(s) to the control affiliates and has determined that the services that were not pre-approved are compatible with maintaining the principal accountant(s)' independence.
(i)Not applicable.
(j)Not applicable.
ITEM 5. AUDIT COMMITTEE OF LISTED REGISTRANTS.
The registrant has a separately-designated standing audit committee comprised of independent trustees. The members of the audit committee are as follows:
Frances G. Rathke – Chairperson
William H. Cunningham
Hassell H. McClellan, effective September 26, 2023
ITEM 6. SCHEDULE OF INVESTMENTS.
(a)Not applicable.
(b)Not applicable.
ITEM 7. DISCLOSURE OF PROXY VOTING POLICIES AND PROCEDURES FOR CLOSED- END MANAGEMENT INVESTMENT COMPANIES.
See attached exhibit - Proxy Voting Policies and Procedures.
ITEM 8.
PORTFOLIO MANAGERS OF CLOSED-END MANAGEMENT INVESTMENT COMPANIES.
Information about the EPOCH portfolio managers Management Biographies
Below is a list of the Epoch portfolio managers who share joint responsibility for the day-to-day investment management of the Fund. It provides a brief summary of their business careers over the past five years. The information provided is as of the filing date of this N-CSR.
William W. Priest, CFA*
Founder, Executive Chairman, Co-Chief Investment Officer and Portfolio Manager, Epoch Investment Partners, Inc. since 2004
Co-managing partner and portfolio manager Began business career in 1965 Managed the Fund since 2007
*As of March 31, 2024, William W. Priest, CFA will no longer serve as Portfolio Manager of the fund.
Kera Van Valen, CFA
Managing Director, Portfolio Manager, and Senior Research Analyst
Epoch Investment Partners, Inc. since 2005
Began business career in 2001
Managed the Fund since 2014
John M. Tobin, Ph.D., CFA
Managing Director, Portfolio Manager, and Senior Research Analyst
Epoch Investment Partners, Inc. since 2012
Began business career in 1981
Managed the Fund since 2014
Michael A. Welhoelter, CFA
President, Co-CIO, Portfolio Manager, Head of Risk Management
Epoch Investment Partners, Inc. since 2005
Began business career in 1986
Managed the Fund since 2007
Other Accounts the Portfolio Managers are Managing
The table below indicates for each portfolio manager information about the accounts over which the portfolio manager has day-to-day investment responsibility. All information on the number of accounts and total assets in the table is as of October 31, 2023. For purposes of the table, "Other Pooled Investment Vehicles" may include investment partnerships and group trusts, and "Other Accounts" may include separate accounts for institutions or individuals, insurance company general or separate accounts, pension funds and other similar institutional accounts.
|
|
|
Registered Investment
|
|
Other Pooled Investment
|
|
Other Accounts
|
|
|
|
Companies
|
|
Vehicles
|
|
|
|
|
|
|
|
|
|
|
|
|
|
|
Number of
|
|
Total
|
|
Number of
|
|
|
Total
|
|
Number of
|
|
Total
|
|
|
|
|
Assets
|
|
|
|
Assets
|
|
|
Assets
|
|
|
|
Accounts
|
|
|
Accounts
|
|
|
|
Accounts
|
|
|
|
|
|
$Million
|
|
|
|
$Million
|
|
|
$Million
|
|
|
|
|
|
|
|
|
|
|
|
|
|
|
|
|
|
|
|
|
|
|
|
|
|
|
|
|
William W.
|
|
7
|
|
4,501
|
|
28
|
|
|
7,530
|
|
57
|
|
4,279
|
|
|
|
|
|
|
|
|
|
|
|
|
|
|
|
Priest, CFA
|
|
0*
|
|
0*
|
|
1*
|
|
|
47*
|
|
7*
|
|
429*
|
|
|
|
|
|
|
|
|
|
|
|
|
|
|
|
|
|
|
|
|
|
|
|
|
|
Kera Van
|
|
6
|
|
4,373
|
|
12
|
|
|
2,124
|
|
11
|
|
1,599
|
|
|
|
|
|
|
|
|
|
|
|
|
|
|
|
Valen, CFA
|
|
0*
|
|
0*
|
|
0*
|
|
|
0*
|
|
0*
|
|
0*
|
|
|
|
|
|
|
|
|
|
|
|
|
|
|
|
|
|
|
|
|
|
|
|
|
|
John M.
|
|
6
|
|
4,373
|
|
12
|
|
|
2,124
|
|
11
|
|
1,599
|
|
|
|
|
|
|
|
|
|
|
|
|
|
|
|
Tobin, Ph.D.,
|
|
|
|
|
|
|
|
|
|
|
|
|
|
|
CFA
|
|
0*
|
|
0*
|
|
0*
|
|
|
0*
|
|
0*
|
|
0*
|
|
|
|
|
|
|
|
|
|
|
|
|
|
|
|
|
|
|
|
|
|
|
|
|
|
Michael A.
|
|
8
|
|
4,694
|
|
38
|
|
|
9,826
|
|
60
|
|
4,377
|
|
Welhoelter,
|
|
0*
|
|
0*
|
|
1*
|
|
|
47*
|
|
7*
|
|
429*
|
|
CFA
|
|
|
|
|
|
|
|
Note: (*) represents the number and value of accounts, within the total accounts that are subject to a performance-based advisory fee.
POTENTIAL CONFLICTS OF INTEREST
In Epoch's view, conflicts of interest may arise in managing the Fund's portfolio investments, on the one hand, and the portfolios of Epoch's other clients and/or accounts (together "Accounts"), on the other. Set forth below is a brief description of some of the material conflicts that may arise and Epoch's policy or procedure for handling them. Although Epoch has designed such procedures to prevent and address conflicts, there is no guarantee that such procedures will detect every situation in which a conflict arises.
The management of multiple Accounts inherently means there may be competing interests for the portfolio management team's time and attention. Epoch seeks to minimize this by utilizing one investment approach (i.e., classic value investing), and by managing all Accounts on a product specific basis. Thus, all large cap value Accounts, whether they be fund accounts, institutional accounts or individual accounts are managed using the same investment discipline, strategy and proprietary investment model as the Fund.
If the portfolio management team identifies a limited investment opportunity that may be suitable for more than one Account, the Fund may not be able to take full advantage of that opportunity. However, Epoch has adopted procedures for allocating portfolio transactions across Accounts so that each Account is treated fairly. First, all orders are allocated among portfolios of the same or similar mandates at the time of trade creation/ initial order preparation. Factors affecting allocations include availability of cash to existence of client imposed trading restrictions or prohibitions, and the tax status of the account. The only changes to the allocations made at the time of the creation of the order, are if there is a partial fill for an order. Depending upon the size of the execution, Epoch may choose to allocate the executed shares through pro-rata breakdown,
or on a random basis. As with all trade allocations each Account generally receives pro rata allocations of any new issue or IPO security that is appropriate for its investment objective. Permissible reasons for excluding an account from an otherwise acceptable IPO or new issue investment include the account having FINRA restricted person status, lack of available cash to make the purchase, or a client imposed trading prohibition on IPOs or on the business of the issuer.
With respect to securities transactions for the Accounts, Epoch determines which broker to use to execute each order, consistent with its duty to seek best execution. Epoch will bunch or aggregate like orders where to do so will be beneficial to the Accounts. However, with respect to certain Accounts, Epoch may be limited by the client with respect to the selection of brokers or may be instructed to direct trades through a particular broker. In these cases, Epoch may place separate, non-simultaneous, transactions for the Fund and another Account, which may temporarily affect the market price of the security or the execution of the transaction to the detriment one or the other.
Conflicts of interest may arise when members of the portfolio management team transact personally in securities investments made or to be made for the Fund or other Accounts. To address this, Epoch has adopted a written Code of Ethics designed to prevent and detect personal trading activities that may interfere or conflict with client interests (including Fund shareholders' interests) or its current investment strategy. The Code of Ethics generally requires that most transactions in securities by Epoch's Access Persons and their spouses, whether or not such securities are purchased or sold on behalf of the Accounts, be cleared prior to execution by appropriate approving parties and compliance personnel. Securities transactions for Access Persons' personal accounts also are subject to monthly reporting requirements, and annual and quarterly certification requirements. Access Person is defined to include persons who have access to non-public information about client securities transactions, portfolio recommendations or holdings, and thus covers all of Epoch's full-time employees except those whose job functions are solely clerical. In addition, no access person, including an investment person, shall be permitted to effect a short term trade (i.e. to purchase and subsequently sell within 21 calendar days for single name single securities or 7 days for an EFT, or to sell and subsequently purchase within 21 calendar days) of securities which (i) are issued by a mutual fund which is advised or sub-advised by Epoch, or (ii) are the same (or equivalent) securities purchased or sold by or on behalf of the advisory accounts unless and until the advisory accounts have effected a transaction which is the same as the access person's contemplated transaction. Finally, orders for proprietary accounts (i.e., accounts of a Sub-Advisor's principals, affiliates or employees or their immediate family which are managed by Epoch) are subject to written trade allocation procedures designed to ensure fair treatment to client accounts.
Proxy voting for the Fund and the other Accounts' securities holdings also may pose certain conflicts. Epoch has identified the following areas of concern: (1) Where Epoch manages the assets of a publicly traded company, and also holds that company's or an affiliated company's securities in one or more Accounts; (2) Where Epoch manages the assets of a proponent of a shareholder proposal for a company whose securities are in one or more Accounts; and (3) Where Epoch had a client relationship with an individual who is a corporate director, or a candidate for a corporate directorship of a public company whose securities are in one or more client portfolios. Epoch's proxy policies provide for various methods of dealing with these and any other conflict scenarios subsequently identified, including notifying clients and seeking their consent or instructions on how to vote, and deferring to the recommendation of an independent third party where a conflict exists.
Epoch manages some Accounts under performance based fee arrangements. Epoch recognizes that this type of incentive compensation creates the risk for potential conflicts of interest. This structure may create an inherent pressure to allocate investments having a greater potential for higher returns to accounts of those clients paying the higher performance fee. To prevent conflicts of interest associated with managing accounts with different compensation structures, Epoch generally requires portfolio decisions to be made on a product specific basis. Epoch also
requires pre-allocation of all client orders based on specific fee-neutral criteria set forth above. Additionally, Epoch requires average pricing of all aggregated orders. Finally, Epoch has adopted a policy prohibiting Portfolio Managers (and all employees) from placing the investment interests of one client or a group of clients with the same investment objectives above the investment interests of any other client or group of clients with the same or similar investment objectives.
COMPENSATION
Epoch seeks to maintain a compensation program that is competitively positioned to attract, retain and motivate all employees. Epoch employees receive a base salary and an annual performance bonus, which is reviewed and determined annually by Epoch's Operating Committee with input from the employee's supervisor and Epoch's Human Resources Department. The level of compensation for each employee is based on a number of factors including individual performance, firm performance and marketplace compensation analysis and information.
A portion of senior employees' annual performance bonus is deferred, typically with a three-year vesting schedule, and invested in Epoch-managed investment vehicles Units and TD Restricted Stock Units.
Investment team members are compensated based on the performance of their strategy, their Operating Committee reviews product performance, including risk-adjusted returns over one- and three-year periods in assessing an investment professional's performance and compensation. Each portfolio manager and analyst's security selection and weighting recommendations are also reviewed on an annual basis.
A portion of deferred compensation payable to senior employees is invested into Epoch managed vehicles and a portion is in the form of TD RSU's, both of which will be subject to a three-year vesting schedule.
Share Ownership by Portfolio Managers. For purposes of these tables, "similarly managed accounts" include all accounts that are managed (i) by the same portfolio managers that are jointly and primarily responsible for the day-to-day management of the Fund; and (ii) with an investment style, objective, policies and strategies substantially similar to those that are used to manage the Fund.
|
|
|
Range of
|
|
|
Range of
|
Beneficial
|
|
|
Ownership in
|
|
|
Beneficial
|
Similarly
|
|
|
Ownership in the
|
Managed
|
|
Portfolio Manager
|
Fund
|
Accounts
|
|
|
|
|
|
William W. Priest, CFA
|
$100,001–$500,000
|
none
|
|
|
|
|
Kera Van Valen, CFA
|
none
|
$10,001–$50,000
|
|
|
|
|
John M. Tobin, Ph.D., CFA
|
none
|
$10,001–$50,000
|
|
|
|
|
Michael A. Welhoelter, CFA
|
none
|
$100,001–$500,000
|
|
|
|
ITEM 9. PURCHASES OF EQUITY SECURITIES BY CLOSED-END MANAGEMENT INVESTMENT COMPANY AND AFFILIATED PURCHASERS.
(a)Not applicable.
|
|
|
|
Total number of
|
Maximum number of
|
|
|
Total number of
|
Average price per
|
shares purchased
|
shares that may yet
|
|
|
as part of publicly
|
be purchased under
|
|
Period
|
shares purchased
|
share
|
announced plans*
|
the plans*
|
|
Nov-22
|
-
|
-
|
-
|
1,091,800
|
|
Dec-22
|
-
|
-
|
-
|
1,091,800
|
|
Jan-23
|
-
|
-
|
-
|
1,092,175
|
|
Feb-23
|
-
|
-
|
-
|
1,092,175
|
|
Mar-23
|
-
|
-
|
-
|
1,092,175
|
|
Apr-23
|
-
|
-
|
-
|
1,092,175
|
|
May-23
|
-
|
-
|
-
|
1,092,175
|
|
Jun-23
|
-
|
-
|
-
|
1,092,175
|
|
Jul-23
|
-
|
-
|
-
|
1,092,175
|
|
Aug-23
|
-
|
-
|
-
|
1,092,175
|
|
Sep-23
|
-
|
-
|
-
|
1,092,175
|
|
Oct-23
|
-
|
-
|
-
|
1,092,175
|
|
Total
|
|
|
|
|
|
|
|
|
|
|
*In December 31, 2018, the Board of Trustees approved a share repurchase plan. Under the current share repurchase plan, the Fund may purchase in the open market up to 10% of its outstanding common shares as of December 31, 2022. The current share plan will remain in effect between January 1, 2023 and December 31, 2023.
ITEM 10. SUBMISSION OF MATTERS TO A VOTE OF SECURITY HOLDERS.
(a)The registrant has adopted procedures by which shareholders may recommend nominees to the registrant's Board of Trustees. A copy of the procedures is filed as an exhibit to this Form N-CSR. See attached "John Hancock Funds – Nominating and Governance Committee Charter".
ITEM 11. CONTROLS AND PROCEDURES.
(a)Based upon their evaluation of the registrant's disclosure controls and procedures as
conducted within 90 days of the filing date of this Form N-CSR, the registrant's principal executive officer and principal financial officer have concluded that those disclosure controls and procedures provide reasonable assurance that the material information required to be disclosed by the registrant on this report is recorded, processed, summarized and reported within the time periods specified in the Securities and Exchange Commission's rules and forms.
(b)There were no changes in the registrant's internal control over financial reporting that occurred during the period covered by this report that have materially affected, or are reasonably likely to materially affect, the registrant's internal control over financial reporting.
ITEM 12. DISCLOSURE OF SECURITIES LENDING ACTIVITIES FOR CLOSED-END MANAGEMENT INVESTMENT COMPANIES.
Not applicable.
ITEM 13. EXHIBITS.
SIGNATURES
Pursuant to the requirements of the Securities Exchange Act of 1934 and the Investment Company Act of 1940, the registrant has duly caused this report to be signed on its behalf by the undersigned, thereunto duly authorized.
John Hancock Tax-Advantaged Global Shareholder Yield Fund
|
By:
|
/s/ Kristie M. Feinberg
|
|
|
------------------------------
|
|
|
Kristie M. Feinberg
|
|
|
President
|
|
Date:
|
December 15, 2023
|
Pursuant to the requirements of the Securities Exchange Act of 1934 and the Investment Company Act of 1940, this report has been signed below by the following persons on behalf of the registrant and in the capacities and on the dates indicated.
|
By:
|
/s/ Kristie M. Feinberg
|
|
|
------------------------------
|
|
|
Kristie M. Feinberg
|
|
|
President
|
|
Date:
|
December 15, 2023
|
|
By:
|
/s/ Charles A. Rizzo
|
|
|
--------------------------------
|
|
|
Charles A. Rizzo
|
|
|
Chief Financial Officer
|
|
December 15, 2023
|